

Fiscal 2025 Fourth-Quarter Earnings Conference Call August 19, 2025 .3
Forward-Looking Statements and Non-GAAP Financial Measures Forward-looking statements – Statements made in this presentation and accompanying webcast that are not statements of historical or current facts, including, but not limited to, those related to our ability to advance our business strategies and improve healthcare, our ability to transition to partners or wind down the remaining operations of Contigo Health and the potential costs and expenses associated therewith, the potential benefits of share repurchases made pursuant to the share repurchase authorization approved by our Board in 2024 (including the recently completed 2025 ASR), the payment of dividends at current levels or at all, guidance on expected future financial performance and assumptions underlying that guidance, and our expected effective income tax rate, are “forward-looking statements” within the meaning of the Private Securities Litigation Reform Act of 1995. Forward-looking statements may involve known and unknown risks, uncertainties and other factors that may cause the actual results, performance or achievements of Premier to be materially different from historical results or from any future results or projections expressed or implied by such forward-looking statements. Accordingly, readers should not place undue reliance on any forward-looking statements, the achievement of which cannot be guaranteed. In addition to statements that explicitly describe such risks and uncertainties, readers are urged to consider statements in the conditional or future tenses or that include terms such as “believes,” “belief,” “expects,” “estimates,” “intends,” “anticipates” or “plans” to be uncertain and forward-looking. Forward-looking statements may include comments as to Premier’s beliefs and expectations regarding future events and trends affecting its business and are necessarily subject to risks and uncertainties, many of which are outside Premier’s control. More information on risks and uncertainties that could affect Premier’s business, achievements, performance, financial condition and financial results is included from time to time in the “Cautionary Note Regarding Forward-Looking Statements,” “Risk Factors” and “Management’s Discussion and Analysis of Financial Condition and Results of Operations” sections of Premier’s periodic and current filings with the SEC, including the information in those sections of Premier’s Form 10-K for the year ended June 30, 2025, expected to be filed with the SEC shortly after the date of this presentation. Premier's periodic and current filings with the SEC are made available on Premier’s website at investors.premierinc.com. Forward-looking statements speak only as of the date they are made, and Premier undertakes no obligation to publicly update or revise any forward-looking statements, whether as a result of new information, future events that occur after that date, or otherwise. Non-GAAP financial measures – This presentation and accompanying webcast include certain “adjusted” and other “non-GAAP” financial measures, including free cash flow, as defined in the SEC’s Regulation G. These measures are not in accordance with, or an alternative to, GAAP. This presentation and the Appendix to this presentation include schedules that reconcile the historical non-GAAP financial measures included in this presentation to the most directly comparable GAAP financial measures. You should carefully read Premier’s earnings release and Annual Report on Form 10-K for the year ended June 30, 2025, expected to be filed shortly after this presentation, for definitions of Premier’s non-GAAP financial measures and further explanation and disclosure regarding Premier’s use of non-GAAP financial measures, and such information should be read in conjunction with this presentation. These materials are made available on the company’s website at investors.premierinc.com.

Business Review Michael J. Alkire President and Chief Executive Officer Financial Review Glenn Coleman Chief Administrative and Financial Officer
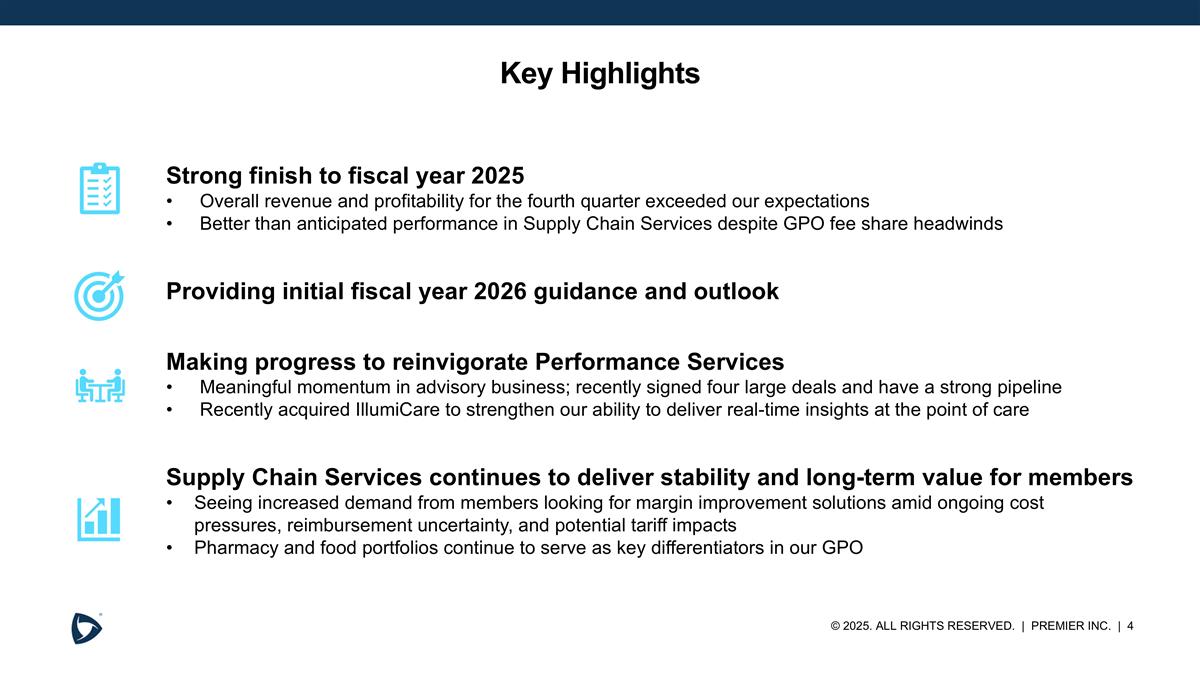
Key Highlights Strong finish to fiscal year 2025 Overall revenue and profitability for the fourth quarter exceeded our expectations Better than anticipated performance in Supply Chain Services despite GPO fee share headwinds Providing initial fiscal year 2026 guidance and outlook Making progress to reinvigorate Performance Services Meaningful momentum in advisory business; recently signed four large deals and have a strong pipeline Recently acquired IllumiCare to strengthen our ability to deliver real-time insights at the point of care Supply Chain Services continues to deliver stability and long-term value for members Seeing increased demand from members looking for margin improvement solutions amid ongoing cost pressures, reimbursement uncertainty, and potential tariff impacts Pharmacy and food portfolios continue to serve as key differentiators in our GPO
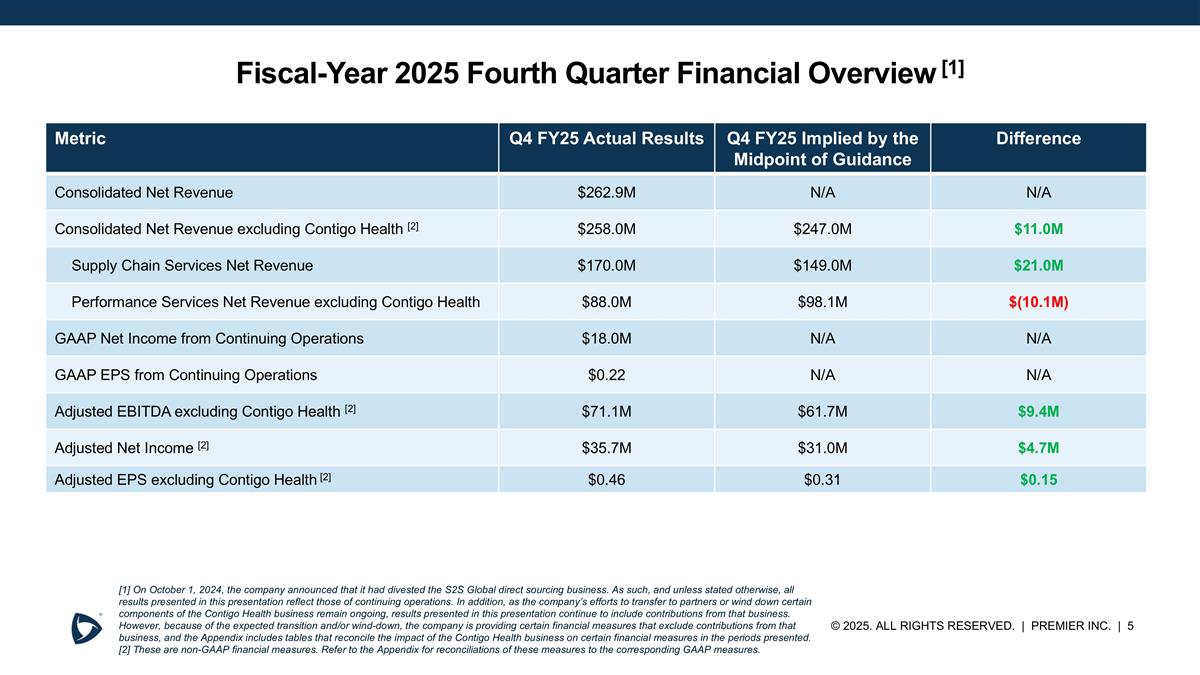
Fiscal-Year 2025 Fourth Quarter Financial Overview [1] Metric Q4 FY25 Actual Results Q4 FY25 Implied by the Midpoint of Guidance Difference Consolidated Net Revenue $262.9M N/A N/A Consolidated Net Revenue excluding Contigo Health [2] $258.0M $247.0M $11.0M Supply Chain Services Net Revenue $170.0M $149.0M $21.0M Performance Services Net Revenue excluding Contigo Health $88.0M $98.1M $(10.1M) GAAP Net Income from Continuing Operations $18.0M N/A N/A GAAP EPS from Continuing Operations $0.22 N/A N/A Adjusted EBITDA excluding Contigo Health [2] $71.1M $61.7M $9.4M Adjusted Net Income [2] $35.7M $31.0M $4.7M Adjusted EPS excluding Contigo Health [2] $0.46 $0.31 $0.15 [1] On October 1, 2024, the company announced that it had divested the S2S Global direct sourcing business. As such, and unless stated otherwise, all results presented in this presentation reflect those of continuing operations. In addition, as the company’s efforts to transfer to partners or wind down certain components of the Contigo Health business remain ongoing, results presented in this presentation continue to include contributions from that business. However, because of the expected transition and/or wind-down, the company is providing certain financial measures that exclude contributions from that business, and the Appendix includes tables that reconcile the impact of the Contigo Health business on certain financial measures in the periods presented. [2] These are non-GAAP financial measures. Refer to the Appendix for reconciliations of these measures to the corresponding GAAP measures.
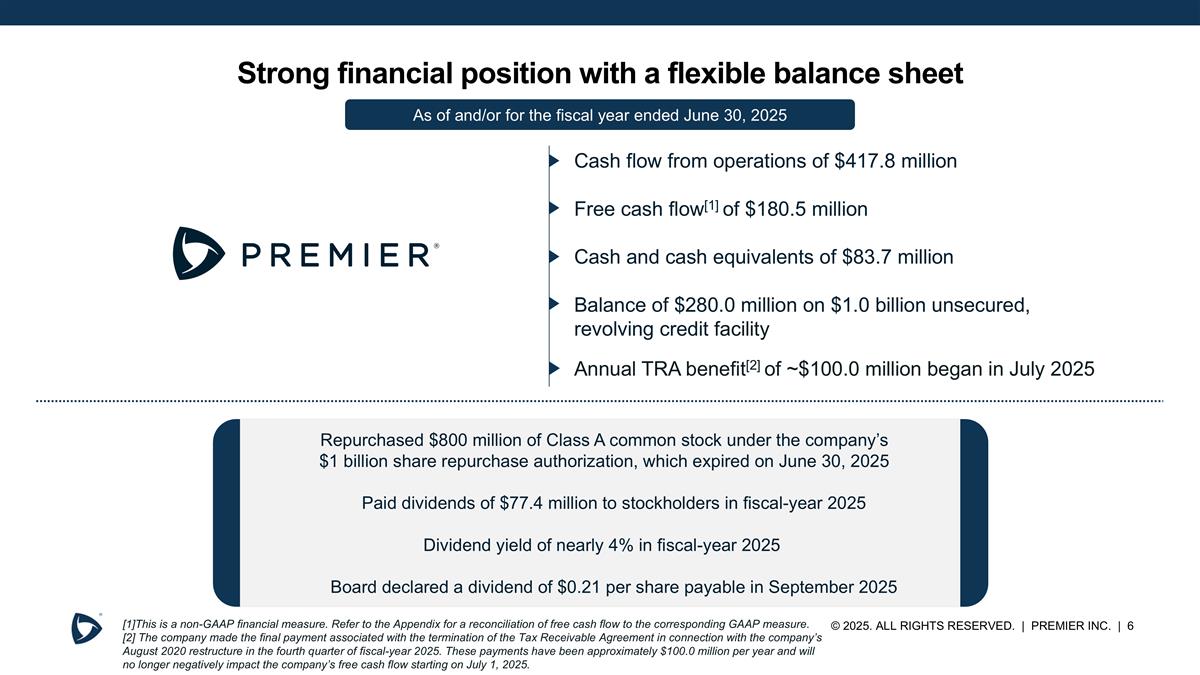
Strong financial position with a flexible balance sheet Cash flow from operations of $417.8 million Free cash flow[1] of $180.5 million Cash and cash equivalents of $83.7 million Balance of $280.0 million on $1.0 billion unsecured, revolving credit facility Annual TRA benefit[2] of ~$100.0 million began in July 2025 [1]This is a non-GAAP financial measure. Refer to the Appendix for a reconciliation of free cash flow to the corresponding GAAP measure. [2] The company made the final payment associated with the termination of the Tax Receivable Agreement in connection with the company’s August 2020 restructure in the fourth quarter of fiscal-year 2025. These payments have been approximately $100.0 million per year and will no longer negatively impact the company’s free cash flow starting on July 1, 2025. Repurchased $800 million of Class A common stock under the company’s $1 billion share repurchase authorization, which expired on June 30, 2025 Paid dividends of $77.4 million to stockholders in fiscal-year 2025 Dividend yield of nearly 4% in fiscal-year 2025 Board declared a dividend of $0.21 per share payable in September 2025 As of and/or for the fiscal year ended June 30, 2025
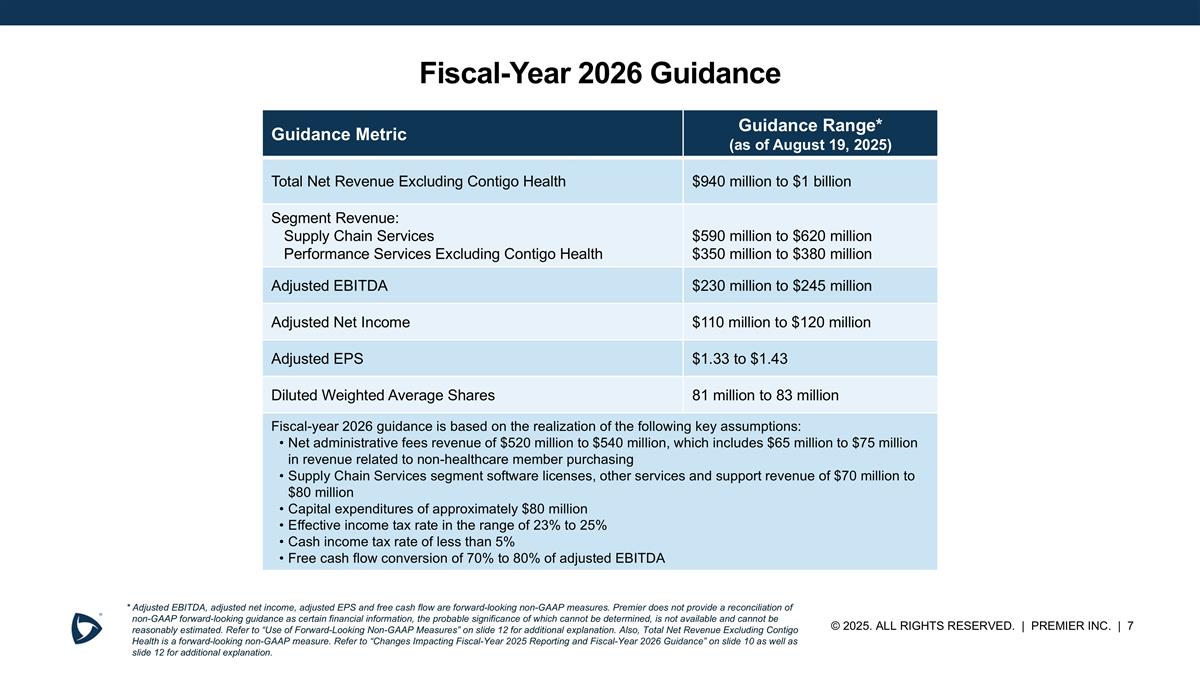
Fiscal-Year 2026 Guidance Guidance Metric Guidance Range* (as of August 19, 2025) Total Net Revenue Excluding Contigo Health $940 million to $1 billion Segment Revenue: Supply Chain Services Performance Services Excluding Contigo Health $590 million to $620 million $350 million to $380 million Adjusted EBITDA $230 million to $245 million Adjusted Net Income $110 million to $120 million Adjusted EPS $1.33 to $1.43 Diluted Weighted Average Shares 81 million to 83 million Fiscal-year 2026 guidance is based on the realization of the following key assumptions: Net administrative fees revenue of $520 million to $540 million, which includes $65 million to $75 million in revenue related to non-healthcare member purchasing Supply Chain Services segment software licenses, other services and support revenue of $70 million to $80 million Capital expenditures of approximately $80 million Effective income tax rate in the range of 23% to 25% Cash income tax rate of less than 5% Free cash flow conversion of 70% to 80% of adjusted EBITDA * Adjusted EBITDA, adjusted net income, adjusted EPS and free cash flow are forward-looking non-GAAP measures. Premier does not provide a reconciliation of non-GAAP forward-looking guidance as certain financial information, the probable significance of which cannot be determined, is not available and cannot be reasonably estimated. Refer to “Use of Forward-Looking Non-GAAP Measures” on slide 12 for additional explanation. Also, Total Net Revenue Excluding Contigo Health is a forward-looking non-GAAP measure. Refer to “Changes Impacting Fiscal-Year 2025 Reporting and Fiscal-Year 2026 Guidance” on slide 10 as well as slide 12 for additional explanation.
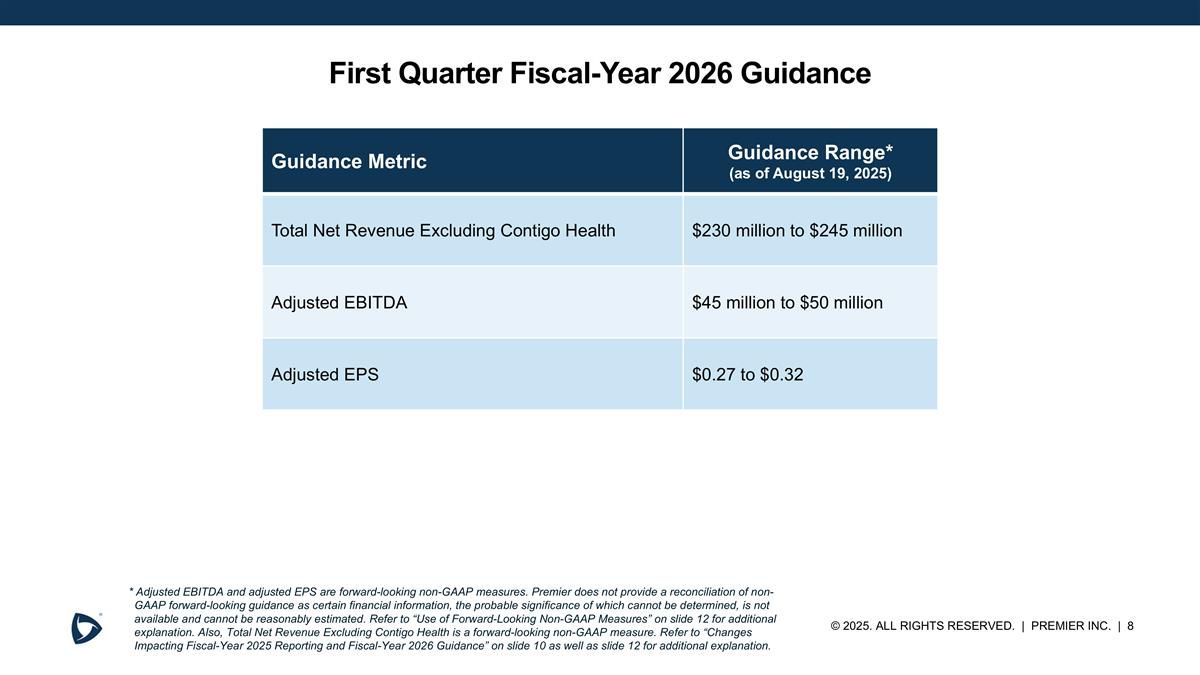
First Quarter Fiscal-Year 2026 Guidance Guidance Metric Guidance Range* (as of August 19, 2025) Total Net Revenue Excluding Contigo Health $230 million to $245 million Adjusted EBITDA $45 million to $50 million Adjusted EPS $0.27 to $0.32 * Adjusted EBITDA and adjusted EPS are forward-looking non-GAAP measures. Premier does not provide a reconciliation of non-GAAP forward-looking guidance as certain financial information, the probable significance of which cannot be determined, is not available and cannot be reasonably estimated. Refer to “Use of Forward-Looking Non-GAAP Measures” on slide 12 for additional explanation. Also, Total Net Revenue Excluding Contigo Health is a forward-looking non-GAAP measure. Refer to “Changes Impacting Fiscal-Year 2025 Reporting and Fiscal-Year 2026 Guidance” on slide 10 as well as slide 12 for additional explanation.

Appendix
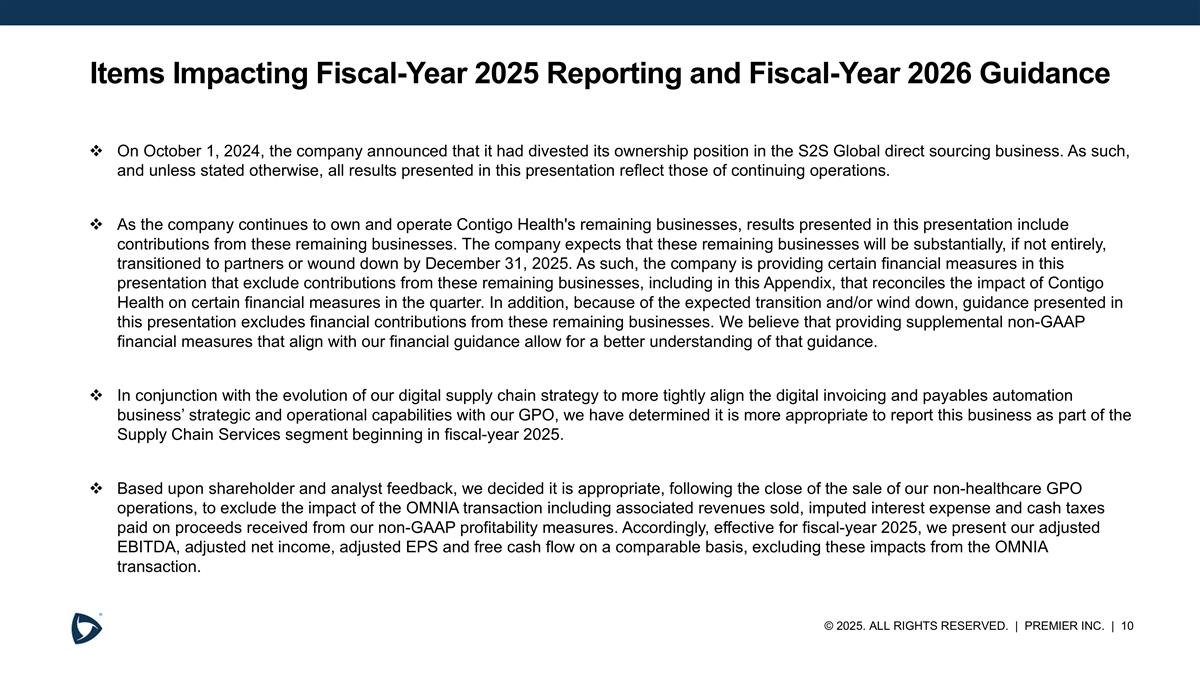
Items Impacting Fiscal-Year 2025 Reporting and Fiscal-Year 2026 Guidance On October 1, 2024, the company announced that it had divested its ownership position in the S2S Global direct sourcing business. As such, and unless stated otherwise, all results presented in this presentation reflect those of continuing operations. As the company continues to own and operate Contigo Health's remaining businesses, results presented in this presentation include contributions from these remaining businesses. The company expects that these remaining businesses will be substantially, if not entirely, transitioned to partners or wound down by December 31, 2025. As such, the company is providing certain financial measures in this presentation that exclude contributions from these remaining businesses, including in this Appendix, that reconciles the impact of Contigo Health on certain financial measures in the quarter. In addition, because of the expected transition and/or wind down, guidance presented in this presentation excludes financial contributions from these remaining businesses. We believe that providing supplemental non-GAAP financial measures that align with our financial guidance allow for a better understanding of that guidance. In conjunction with the evolution of our digital supply chain strategy to more tightly align the digital invoicing and payables automation business’ strategic and operational capabilities with our GPO, we have determined it is more appropriate to report this business as part of the Supply Chain Services segment beginning in fiscal-year 2025. Based upon shareholder and analyst feedback, we decided it is appropriate, following the close of the sale of our non-healthcare GPO operations, to exclude the impact of the OMNIA transaction including associated revenues sold, imputed interest expense and cash taxes paid on proceeds received from our non-GAAP profitability measures. Accordingly, effective for fiscal-year 2025, we present our adjusted EBITDA, adjusted net income, adjusted EPS and free cash flow on a comparable basis, excluding these impacts from the OMNIA transaction.
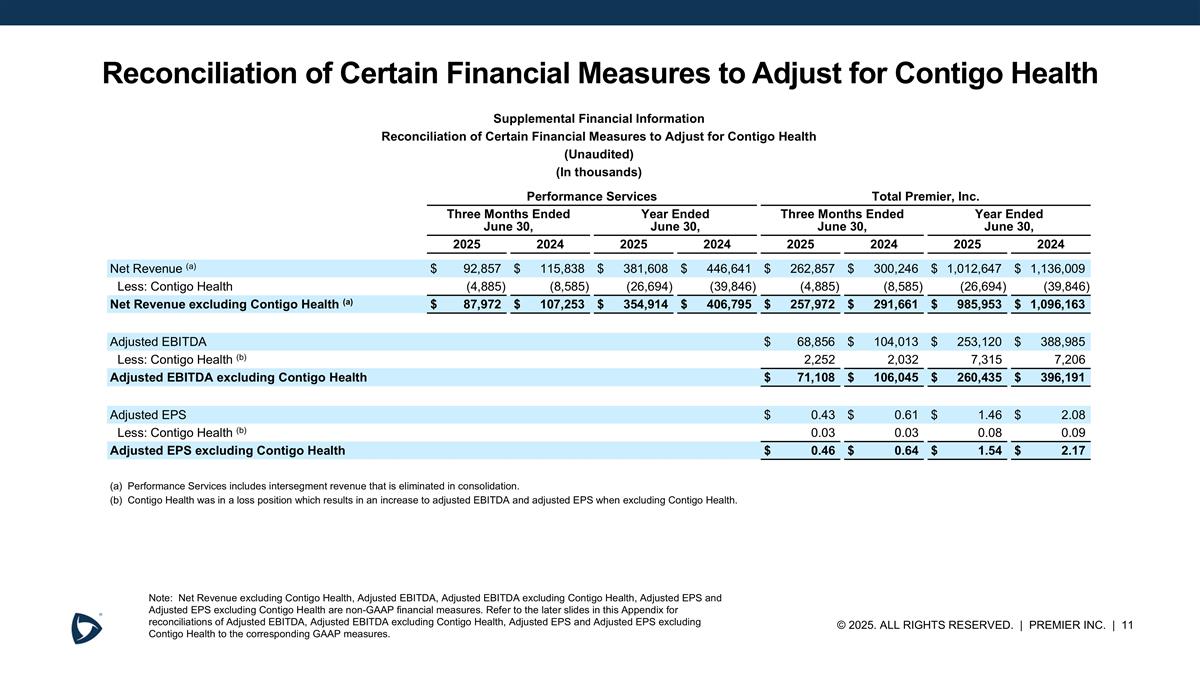
Reconciliation of Certain Financial Measures to Adjust for Contigo Health Note: Net Revenue excluding Contigo Health, Adjusted EBITDA, Adjusted EBITDA excluding Contigo Health, Adjusted EPS and Adjusted EPS excluding Contigo Health are non-GAAP financial measures. Refer to the later slides in this Appendix for reconciliations of Adjusted EBITDA, Adjusted EBITDA excluding Contigo Health, Adjusted EPS and Adjusted EPS excluding Contigo Health to the corresponding GAAP measures. Supplemental Financial Information Reconciliation of Certain Financial Measures to Adjust for Contigo Health (Unaudited) (In thousands) Performance Services Total Premier, Inc. Three Months Ended June 30, Year Ended June 30, Three Months Ended June 30, Year Ended June 30, 2025 2024 2025 2024 2025 2024 2025 2024 Net Revenue (a) $92,857 $115,838 $381,608 $446,641 $262,857 $300,246 $1,012,647 $1,136,009 Less: Contigo Health (4,885) (8,585) (26,694) (39,846) (4,885) (8,585) (26,694) (39,846) Net Revenue excluding Contigo Health (a) $87,972 $107,253 $354,914 $406,795 $257,972 $291,661 $985,953 $1,096,163 Adjusted EBITDA $68,856 $104,013 $253,120 $388,985 Less: Contigo Health (b) 2,252 2,032 7,315 7,206 Adjusted EBITDA excluding Contigo Health $71,108 $106,045 $260,435 $396,191 Adjusted EPS $0.43 $0.61 $1.46 $2.08 Less: Contigo Health (b) 0.03 0.03 0.08 0.09 Adjusted EPS excluding Contigo Health $0.46 $0.64 $1.54 $2.17 (a) Performance Services includes intersegment revenue that is eliminated in consolidation. (b) Contigo Health was in a loss position which results in an increase to adjusted EBITDA and adjusted EPS when excluding Contigo Health.
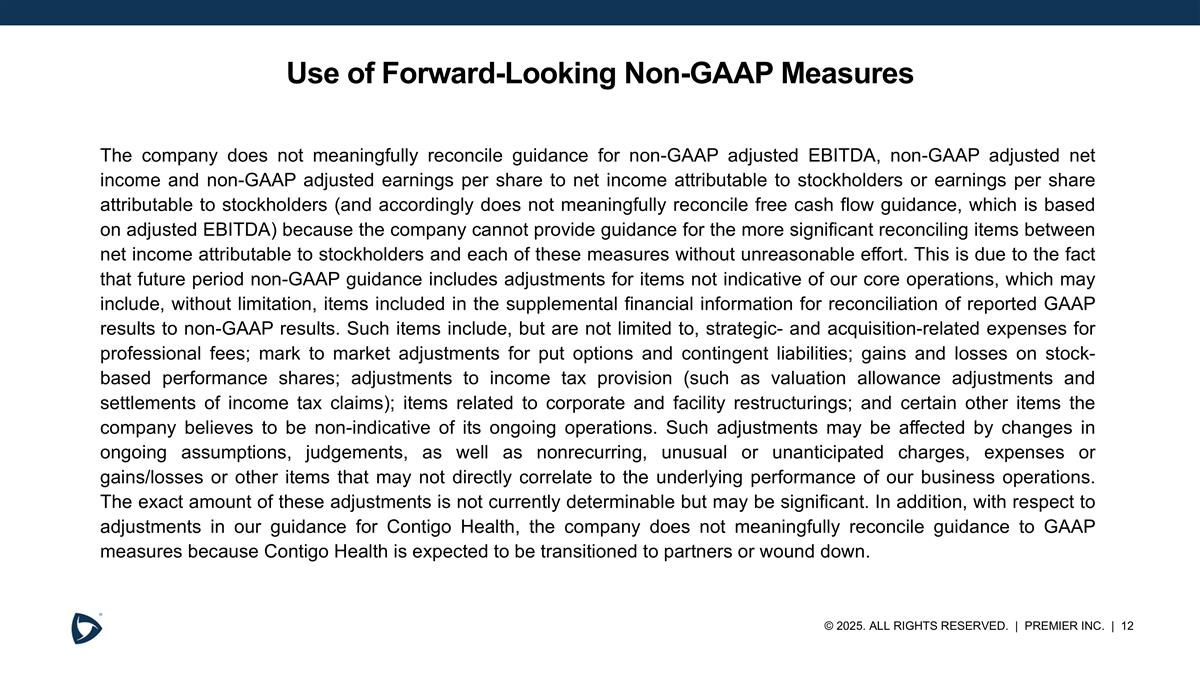
Use of Forward-Looking Non-GAAP Measures The company does not meaningfully reconcile guidance for non-GAAP adjusted EBITDA, non-GAAP adjusted net income and non-GAAP adjusted earnings per share to net income attributable to stockholders or earnings per share attributable to stockholders (and accordingly does not meaningfully reconcile free cash flow guidance, which is based on adjusted EBITDA) because the company cannot provide guidance for the more significant reconciling items between net income attributable to stockholders and each of these measures without unreasonable effort. This is due to the fact that future period non-GAAP guidance includes adjustments for items not indicative of our core operations, which may include, without limitation, items included in the supplemental financial information for reconciliation of reported GAAP results to non-GAAP results. Such items include, but are not limited to, strategic- and acquisition-related expenses for professional fees; mark to market adjustments for put options and contingent liabilities; gains and losses on stock-based performance shares; adjustments to income tax provision (such as valuation allowance adjustments and settlements of income tax claims); items related to corporate and facility restructurings; and certain other items the company believes to be non-indicative of its ongoing operations. Such adjustments may be affected by changes in ongoing assumptions, judgements, as well as nonrecurring, unusual or unanticipated charges, expenses or gains/losses or other items that may not directly correlate to the underlying performance of our business operations. The exact amount of these adjustments is not currently determinable but may be significant. In addition, with respect to adjustments in our guidance for Contigo Health, the company does not meaningfully reconcile guidance to GAAP measures because Contigo Health is expected to be transitioned to partners or wound down.
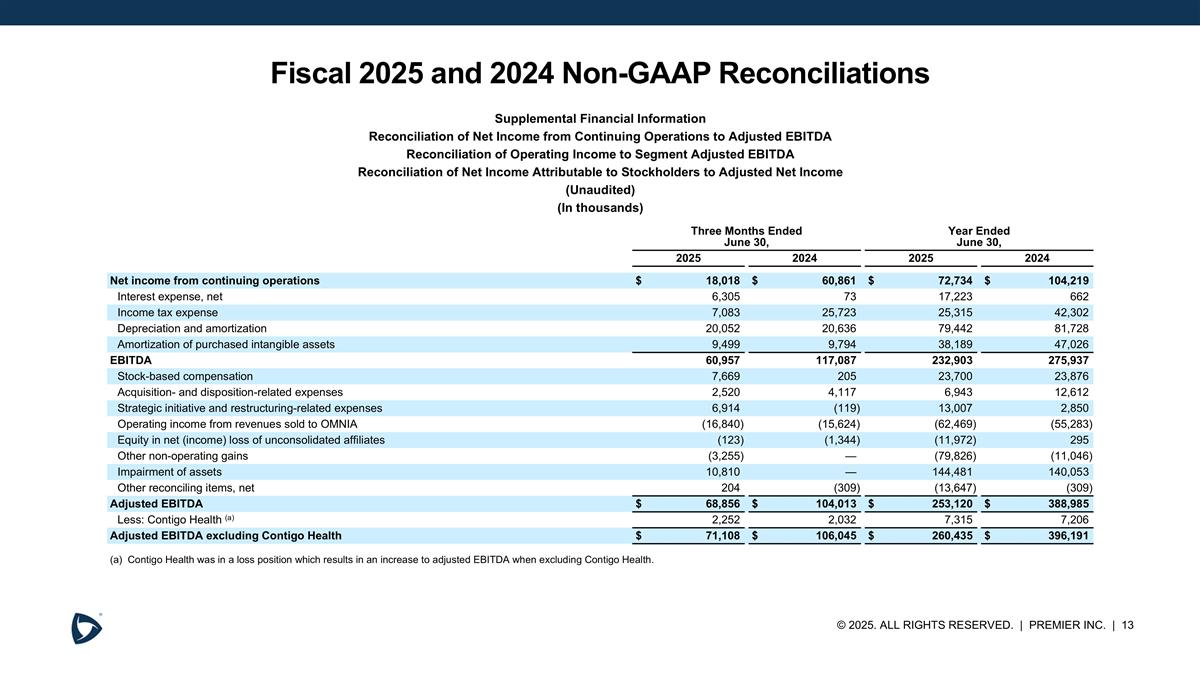
Fiscal 2025 and 2024 Non-GAAP Reconciliations Supplemental Financial Information Reconciliation of Net Income from Continuing Operations to Adjusted EBITDA Reconciliation of Operating Income to Segment Adjusted EBITDA Reconciliation of Net Income Attributable to Stockholders to Adjusted Net Income (Unaudited) (In thousands) Three Months Ended June 30, Year Ended June 30, 2025 2024 2025 2024 Net income from continuing operations $18,018 $60,861 $72,734 $104,219 Interest expense, net 6,305 73 17,223 662 Income tax expense 7,083 25,723 25,315 42,302 Depreciation and amortization 20,052 20,636 79,442 81,728 Amortization of purchased intangible assets 9,499 9,794 38,189 47,026 EBITDA 60,957 117,087 232,903 275,937 Stock-based compensation 7,669 205 23,700 23,876 Acquisition- and disposition-related expenses 2,520 4,117 6,943 12,612 Strategic initiative and restructuring-related expenses 6,914 (119) 13,007 2,850 Operating income from revenues sold to OMNIA (16,840) (15,624) (62,469) (55,283) Equity in net (income) loss of unconsolidated affiliates (123) (1,344) (11,972) 295 Other non-operating gains (3,255) — (79,826) (11,046) Impairment of assets 10,810 — 144,481 140,053 Other reconciling items, net 204 (309) (13,647) (309) Adjusted EBITDA $68,856 $104,013 $253,120 $388,985 Less: Contigo Health (a) 2,252 2,032 7,315 7,206 Adjusted EBITDA excluding Contigo Health $71,108 $106,045 $260,435 $396,191 (a) Contigo Health was in a loss position which results in an increase to adjusted EBITDA when excluding Contigo Health.
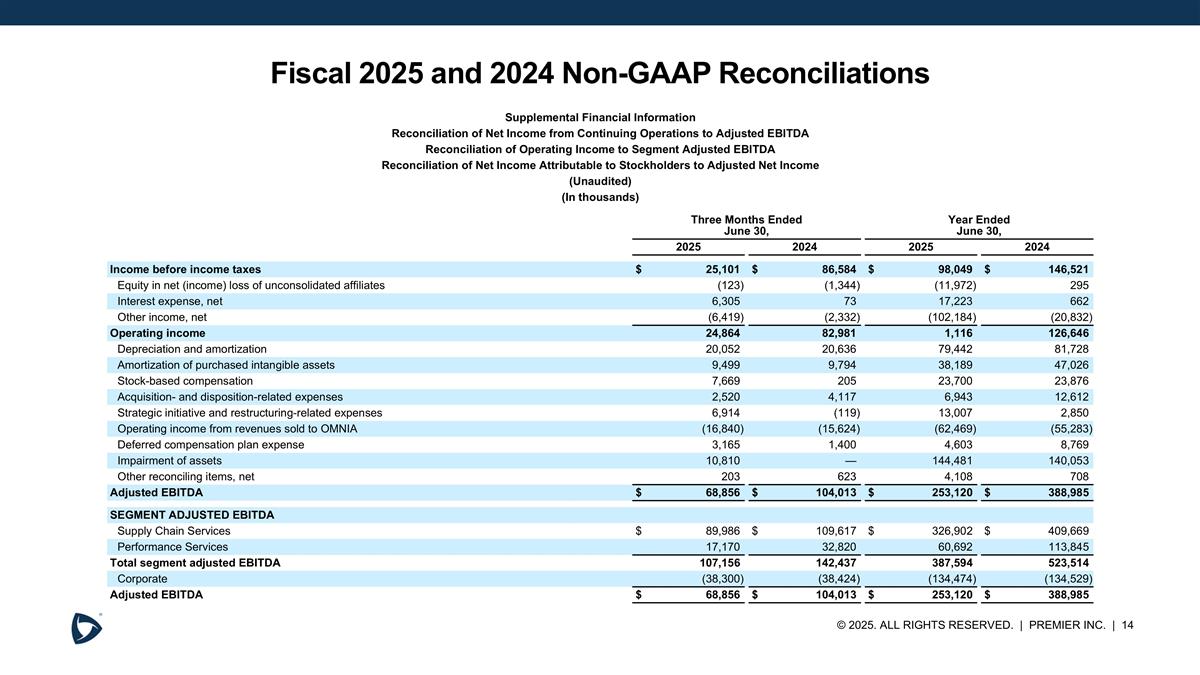
Fiscal 2025 and 2024 Non-GAAP Reconciliations Supplemental Financial Information Reconciliation of Net Income from Continuing Operations to Adjusted EBITDA Reconciliation of Operating Income to Segment Adjusted EBITDA Reconciliation of Net Income Attributable to Stockholders to Adjusted Net Income (Unaudited) (In thousands) Three Months Ended June 30, Year Ended June 30, 2025 2024 2025 2024 Income before income taxes $25,101 $86,584 $98,049 $146,521 Equity in net (income) loss of unconsolidated affiliates (123) (1,344) (11,972) 295 Interest expense, net 6,305 73 17,223 662 Other income, net (6,419) (2,332) (102,184) (20,832) Operating income 24,864 82,981 1,116 126,646 Depreciation and amortization 20,052 20,636 79,442 81,728 Amortization of purchased intangible assets 9,499 9,794 38,189 47,026 Stock-based compensation 7,669 205 23,700 23,876 Acquisition- and disposition-related expenses 2,520 4,117 6,943 12,612 Strategic initiative and restructuring-related expenses 6,914 (119) 13,007 2,850 Operating income from revenues sold to OMNIA (16,840) (15,624) (62,469) (55,283) Deferred compensation plan expense 3,165 1,400 4,603 8,769 Impairment of assets 10,810 — 144,481 140,053 Other reconciling items, net 203 623 4,108 708 Adjusted EBITDA $68,856 $104,013 $253,120 $388,985 SEGMENT ADJUSTED EBITDA Supply Chain Services $89,986 $109,617 $326,902 $409,669 Performance Services 17,170 32,820 60,692 113,845 Total segment adjusted EBITDA 107,156 142,437 387,594 523,514 Corporate (38,300) (38,424) (134,474) (134,529) Adjusted EBITDA $68,856 $104,013 $253,120 $388,985
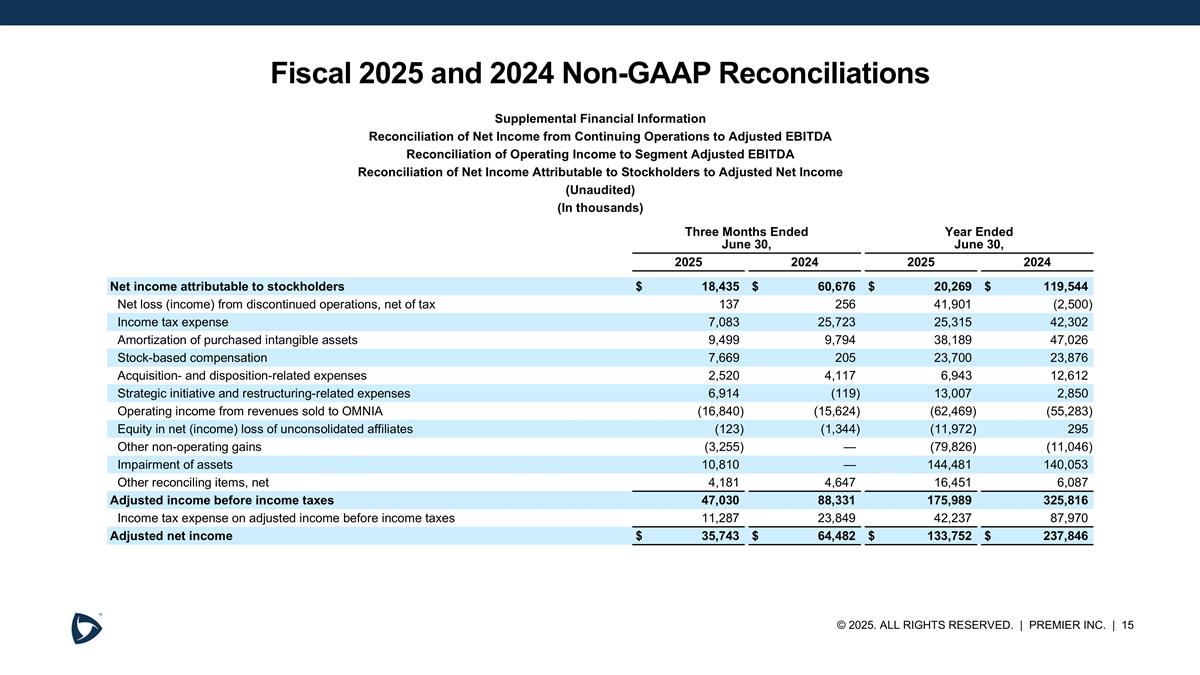
Fiscal 2025 and 2024 Non-GAAP Reconciliations Supplemental Financial Information Reconciliation of Net Income from Continuing Operations to Adjusted EBITDA Reconciliation of Operating Income to Segment Adjusted EBITDA Reconciliation of Net Income Attributable to Stockholders to Adjusted Net Income (Unaudited) (In thousands) Three Months Ended June 30, Year Ended June 30, 2025 2024 2025 2024 Net income attributable to stockholders $18,435 $60,676 $20,269 $119,544 Net loss (income) from discontinued operations, net of tax 137 256 41,901 (2,500) Income tax expense 7,083 25,723 25,315 42,302 Amortization of purchased intangible assets 9,499 9,794 38,189 47,026 Stock-based compensation 7,669 205 23,700 23,876 Acquisition- and disposition-related expenses 2,520 4,117 6,943 12,612 Strategic initiative and restructuring-related expenses 6,914 (119) 13,007 2,850 Operating income from revenues sold to OMNIA (16,840) (15,624) (62,469) (55,283) Equity in net (income) loss of unconsolidated affiliates (123) (1,344) (11,972) 295 Other non-operating gains (3,255) — (79,826) (11,046) Impairment of assets 10,810 — 144,481 140,053 Other reconciling items, net 4,181 4,647 16,451 6,087 Adjusted income before income taxes 47,030 88,331 175,989 325,816 Income tax expense on adjusted income before income taxes 11,287 23,849 42,237 87,970 Adjusted net income $35,743 $64,482 $133,752 $237,846
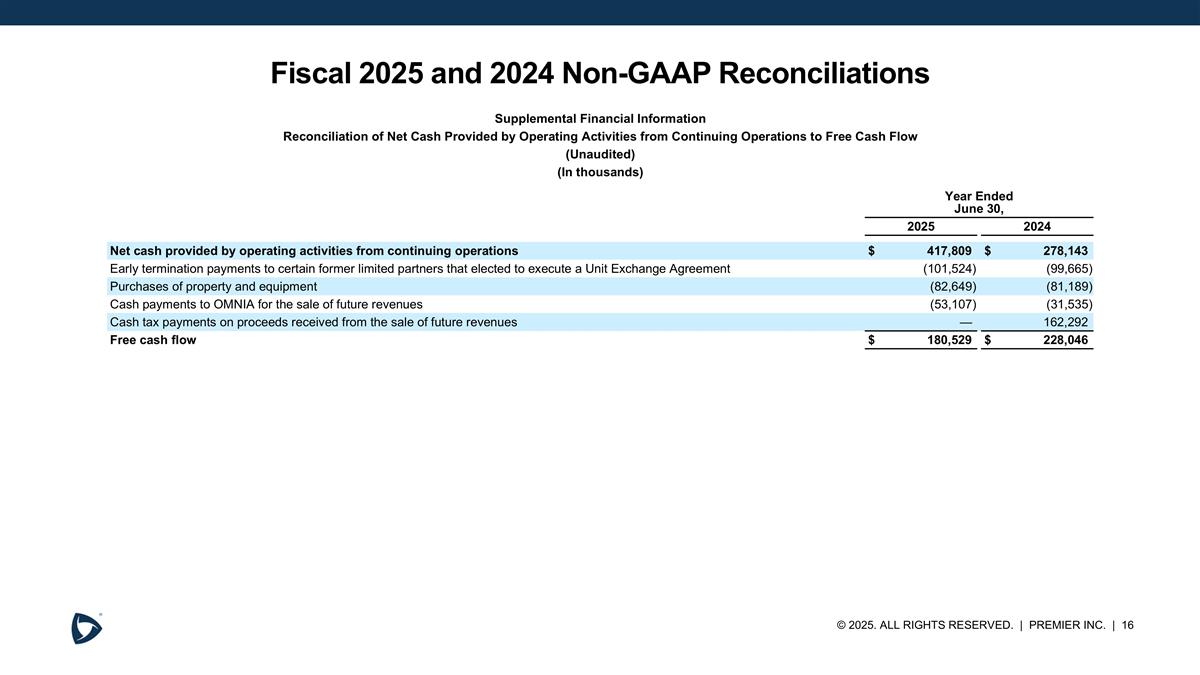
Fiscal 2025 and 2024 Non-GAAP Reconciliations Supplemental Financial Information Reconciliation of Net Cash Provided by Operating Activities from Continuing Operations to Free Cash Flow (Unaudited) (In thousands) Year Ended June 30, 2025 2024 Net cash provided by operating activities from continuing operations $417,809 $278,143 Early termination payments to certain former limited partners that elected to execute a Unit Exchange Agreement (101,524) (99,665) Purchases of property and equipment (82,649) (81,189) Cash payments to OMNIA for the sale of future revenues (53,107) (31,535) Cash tax payments on proceeds received from the sale of future revenues — 162,292 Free cash flow $180,529 $228,046
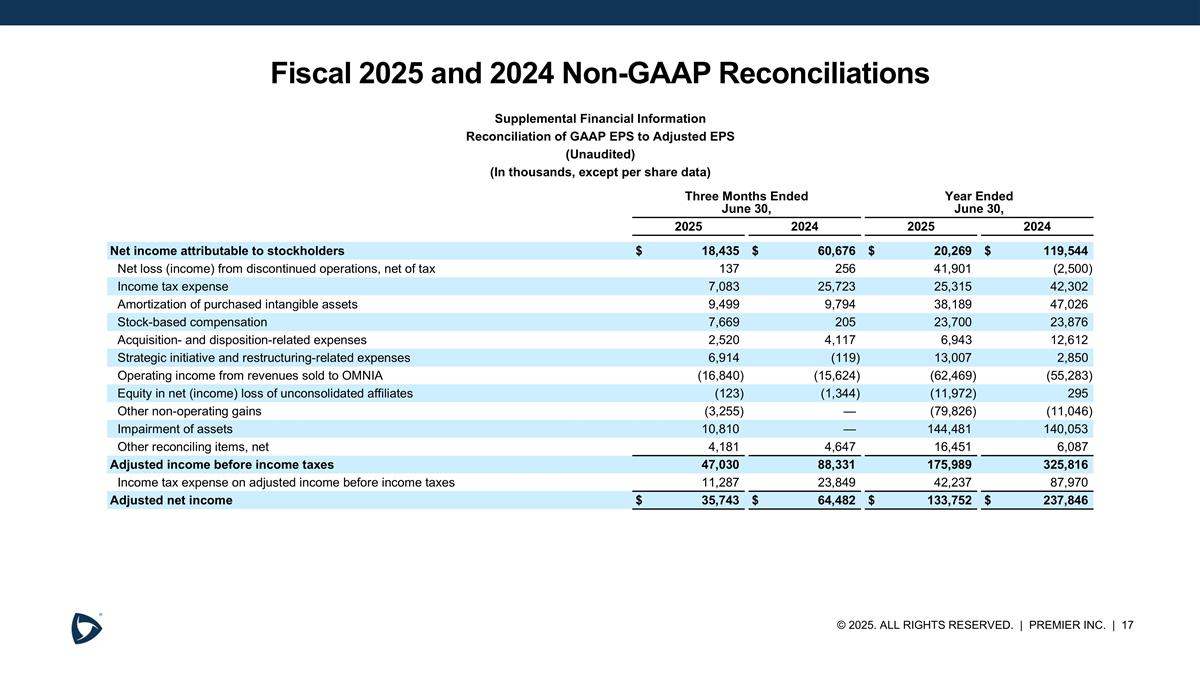
Fiscal 2025 and 2024 Non-GAAP Reconciliations Supplemental Financial Information Reconciliation of GAAP EPS to Adjusted EPS (Unaudited) (In thousands, except per share data) Three Months Ended June 30, Year Ended June 30, 2025 2024 2025 2024 Net income attributable to stockholders $18,435 $60,676 $20,269 $119,544 Net loss (income) from discontinued operations, net of tax 137 256 41,901 (2,500) Income tax expense 7,083 25,723 25,315 42,302 Amortization of purchased intangible assets 9,499 9,794 38,189 47,026 Stock-based compensation 7,669 205 23,700 23,876 Acquisition- and disposition-related expenses 2,520 4,117 6,943 12,612 Strategic initiative and restructuring-related expenses 6,914 (119) 13,007 2,850 Operating income from revenues sold to OMNIA (16,840) (15,624) (62,469) (55,283) Equity in net (income) loss of unconsolidated affiliates (123) (1,344) (11,972) 295 Other non-operating gains (3,255) — (79,826) (11,046) Impairment of assets 10,810 — 144,481 140,053 Other reconciling items, net 4,181 4,647 16,451 6,087 Adjusted income before income taxes 47,030 88,331 175,989 325,816 Income tax expense on adjusted income before income taxes 11,287 23,849 42,237 87,970 Adjusted net income $35,743 $64,482 $133,752 $237,846
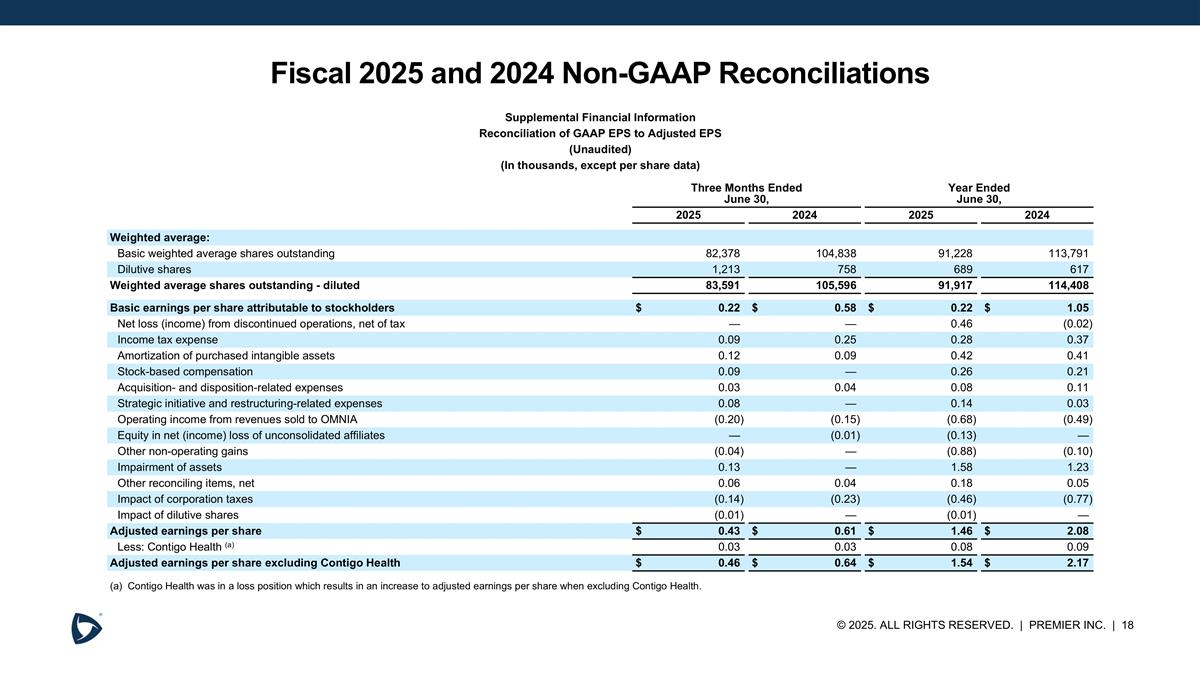
Fiscal 2025 and 2024 Non-GAAP Reconciliations Supplemental Financial Information Reconciliation of GAAP EPS to Adjusted EPS (Unaudited) (In thousands, except per share data) Three Months Ended June 30, Year Ended June 30, 2025 2024 2025 2024 Weighted average: Basic weighted average shares outstanding 82,378 104,838 91,228 113,791 Dilutive shares 1,213 758 689 617 Weighted average shares outstanding - diluted 83,591 105,596 91,917 114,408 Basic earnings per share attributable to stockholders $0.22 $0.58 $0.22 $1.05 Net loss (income) from discontinued operations, net of tax — — 0.46 (0.02) Income tax expense 0.09 0.25 0.28 0.37 Amortization of purchased intangible assets 0.12 0.09 0.42 0.41 Stock-based compensation 0.09 — 0.26 0.21 Acquisition- and disposition-related expenses 0.03 0.04 0.08 0.11 Strategic initiative and restructuring-related expenses 0.08 — 0.14 0.03 Operating income from revenues sold to OMNIA (0.20) (0.15) (0.68) (0.49) Equity in net (income) loss of unconsolidated affiliates — (0.01) (0.13) — Other non-operating gains (0.04) — (0.88) (0.10) Impairment of assets 0.13 — 1.58 1.23 Other reconciling items, net 0.06 0.04 0.18 0.05 Impact of corporation taxes (0.14) (0.23) (0.46) (0.77) Impact of dilutive shares (0.01) — (0.01) — Adjusted earnings per share $0.43 $0.61 $1.46 $2.08 Less: Contigo Health (a) 0.03 0.03 0.08 0.09 Adjusted earnings per share excluding Contigo Health $0.46 $0.64 $1.54 $2.17 (a) Contigo Health was in a loss position which results in an increase to adjusted earnings per share when excluding Contigo Health.