0
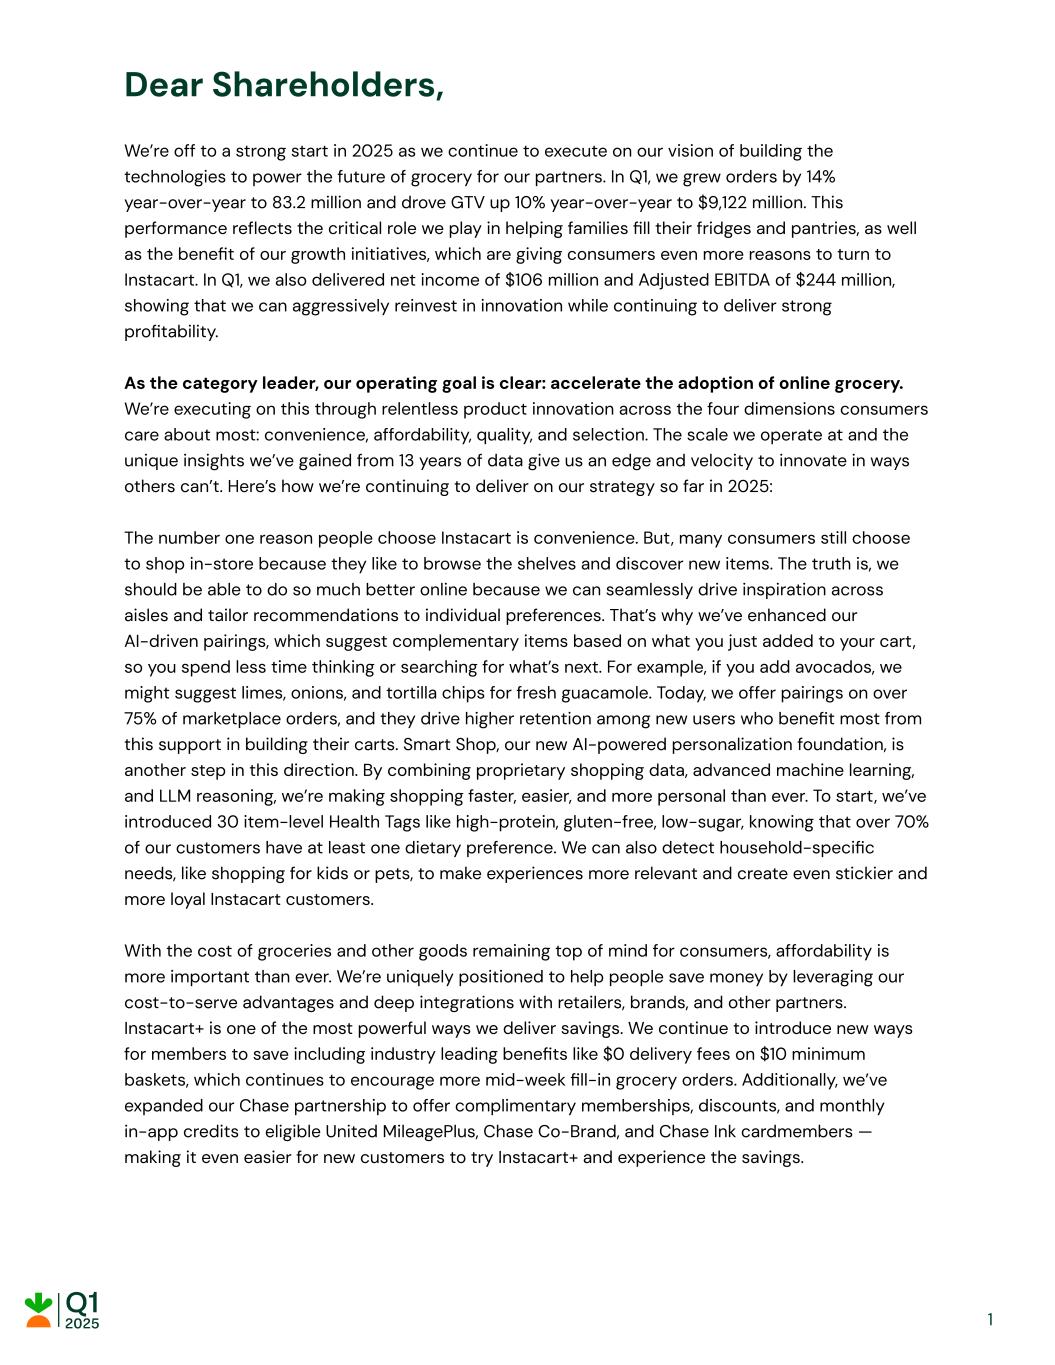
Dear Shareholders, We’re off to a strong start in 2025 as we continue to execute on our vision of building the technologies to power the future of grocery for our partners. In Q1, we grew orders by 14% year-over-year to 83.2 million and drove GTV up 10% year-over-year to $9,122 million. This performance reflects the critical role we play in helping families fill their fridges and pantries, as well as the benefit of our growth initiatives, which are giving consumers even more reasons to turn to Instacart. In Q1, we also delivered net income of $106 million and Adjusted EBITDA of $244 million, showing that we can aggressively reinvest in innovation while continuing to deliver strong profitability. As the category leader, our operating goal is clear: accelerate the adoption of online grocery. We’re executing on this through relentless product innovation across the four dimensions consumers care about most: convenience, affordability, quality, and selection. The scale we operate at and the unique insights we’ve gained from 13 years of data give us an edge and velocity to innovate in ways others can’t. Here’s how we’re continuing to deliver on our strategy so far in 2025: The number one reason people choose Instacart is convenience. But, many consumers still choose to shop in-store because they like to browse the shelves and discover new items. The truth is, we should be able to do so much better online because we can seamlessly drive inspiration across aisles and tailor recommendations to individual preferences. That’s why we’ve enhanced our AI-driven pairings, which suggest complementary items based on what you just added to your cart, so you spend less time thinking or searching for what’s next. For example, if you add avocados, we might suggest limes, onions, and tortilla chips for fresh guacamole. Today, we offer pairings on over 75% of marketplace orders, and they drive higher retention among new users who benefit most from this support in building their carts. Smart Shop, our new AI-powered personalization foundation, is another step in this direction. By combining proprietary shopping data, advanced machine learning, and LLM reasoning, we’re making shopping faster, easier, and more personal than ever. To start, we’ve introduced 30 item-level Health Tags like high-protein, gluten-free, low-sugar, knowing that over 70% of our customers have at least one dietary preference. We can also detect household-specific needs, like shopping for kids or pets, to make experiences more relevant and create even stickier and more loyal Instacart customers. With the cost of groceries and other goods remaining top of mind for consumers, affordability is more important than ever. We’re uniquely positioned to help people save money by leveraging our cost-to-serve advantages and deep integrations with retailers, brands, and other partners. Instacart+ is one of the most powerful ways we deliver savings. We continue to introduce new ways for members to save including industry leading benefits like $0 delivery fees on $10 minimum baskets, which continues to encourage more mid-week fill-in grocery orders. Additionally, we’ve expanded our Chase partnership to offer complimentary memberships, discounts, and monthly in-app credits to eligible United MileagePlus, Chase Co-Brand, and Chase Ink cardmembers — making it even easier for new customers to try Instacart+ and experience the savings. 1
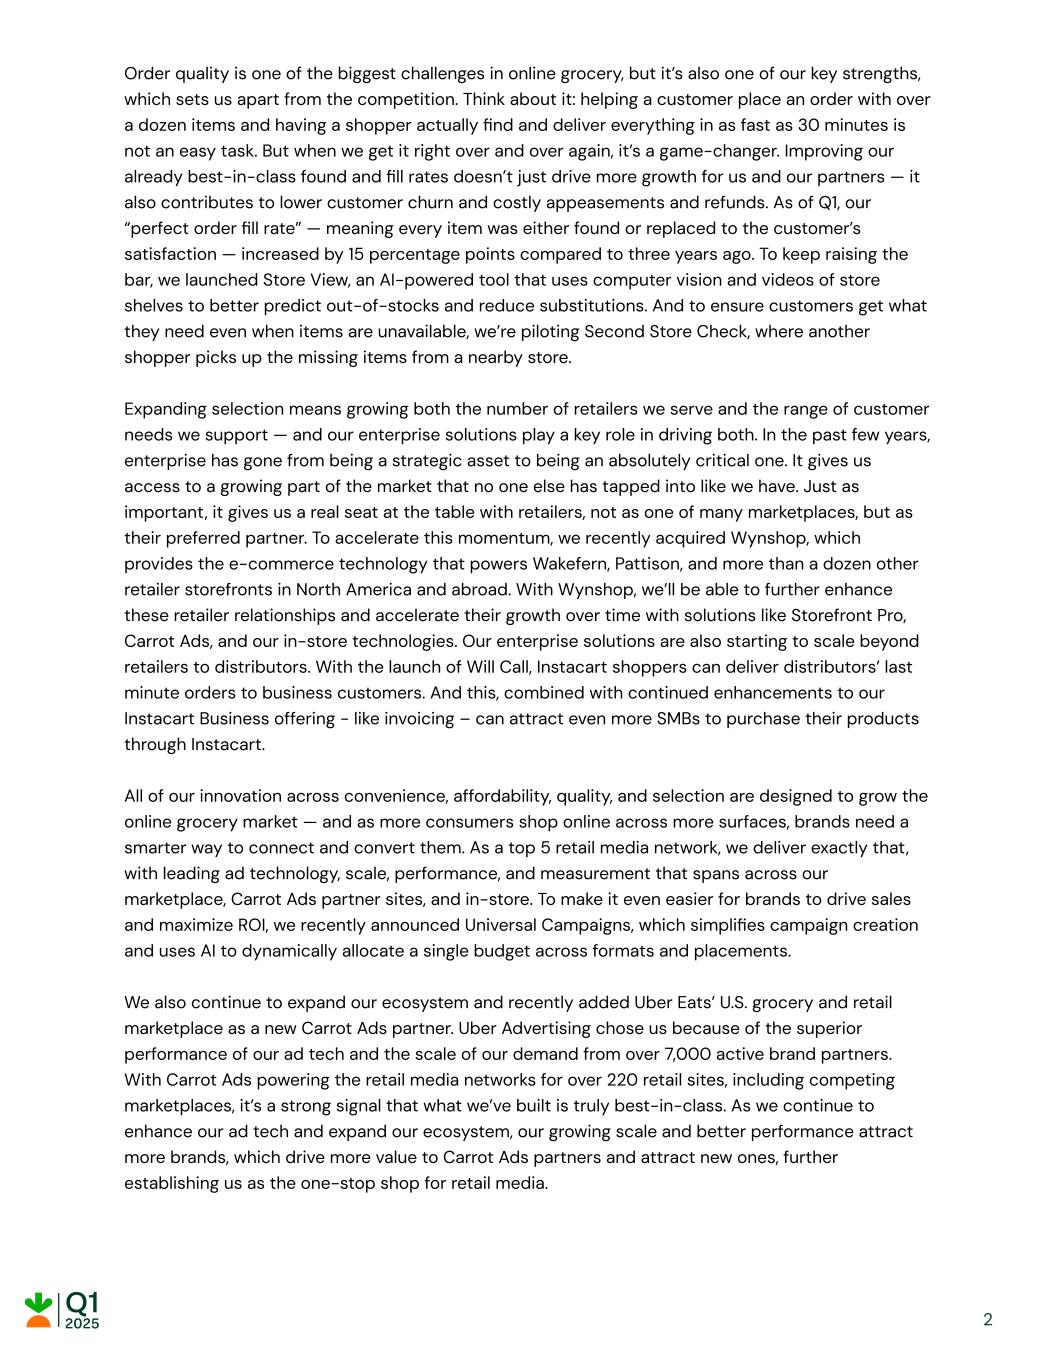
Order quality is one of the biggest challenges in online grocery, but it’s also one of our key strengths, which sets us apart from the competition. Think about it: helping a customer place an order with over a dozen items and having a shopper actually find and deliver everything in as fast as 30 minutes is not an easy task. But when we get it right over and over again, it’s a game-changer. Improving our already best-in-class found and fill rates doesn’t just drive more growth for us and our partners — it also contributes to lower customer churn and costly appeasements and refunds. As of Q1, our “perfect order fill rate” — meaning every item was either found or replaced to the customer’s satisfaction — increased by 15 percentage points compared to three years ago. To keep raising the bar, we launched Store View, an AI-powered tool that uses computer vision and videos of store shelves to better predict out-of-stocks and reduce substitutions. And to ensure customers get what they need even when items are unavailable, we’re piloting Second Store Check, where another shopper picks up the missing items from a nearby store. Expanding selection means growing both the number of retailers we serve and the range of customer needs we support — and our enterprise solutions play a key role in driving both. In the past few years, enterprise has gone from being a strategic asset to being an absolutely critical one. It gives us access to a growing part of the market that no one else has tapped into like we have. Just as important, it gives us a real seat at the table with retailers, not as one of many marketplaces, but as their preferred partner. To accelerate this momentum, we recently acquired Wynshop, which provides the e-commerce technology that powers Wakefern, Pattison, and more than a dozen other retailer storefronts in North America and abroad. With Wynshop, we’ll be able to further enhance these retailer relationships and accelerate their growth over time with solutions like Storefront Pro, Carrot Ads, and our in-store technologies. Our enterprise solutions are also starting to scale beyond retailers to distributors. With the launch of Will Call, Instacart shoppers can deliver distributors’ last minute orders to business customers. And this, combined with continued enhancements to our Instacart Business offering - like invoicing – can attract even more SMBs to purchase their products through Instacart. All of our innovation across convenience, affordability, quality, and selection are designed to grow the online grocery market — and as more consumers shop online across more surfaces, brands need a smarter way to connect and convert them. As a top 5 retail media network, we deliver exactly that, with leading ad technology, scale, performance, and measurement that spans across our marketplace, Carrot Ads partner sites, and in-store. To make it even easier for brands to drive sales and maximize ROI, we recently announced Universal Campaigns, which simplifies campaign creation and uses AI to dynamically allocate a single budget across formats and placements. We also continue to expand our ecosystem and recently added Uber Eats’ U.S. grocery and retail marketplace as a new Carrot Ads partner. Uber Advertising chose us because of the superior performance of our ad tech and the scale of our demand from over 7,000 active brand partners. With Carrot Ads powering the retail media networks for over 220 retail sites, including competing marketplaces, it’s a strong signal that what we’ve built is truly best-in-class. As we continue to enhance our ad tech and expand our ecosystem, our growing scale and better performance attract more brands, which drive more value to Carrot Ads partners and attract new ones, further establishing us as the one-stop shop for retail media. 2

Over the past 13 years, we’ve consistently shown our ability to grow even during periods of macro uncertainty and economic challenges. Groceries aren’t discretionary — they’re essential — and by helping families save time, money, and effort every day, we’re expanding the market, deepening our role in customers’ lives, and strengthening our value to our retail and brand partners. Our operating fundamentals are strong and allow us to continue aggressively reinvesting in growth while staying on track to deliver annual Adjusted EBITDA expansion in 2025. We’re confident in our strategy and ability to execute, which is why we repurchased $94 million worth of shares in Q1, and had $218 million of repurchase capacity remaining as of March 31. Fidji Simo Chief Executive Officer 3
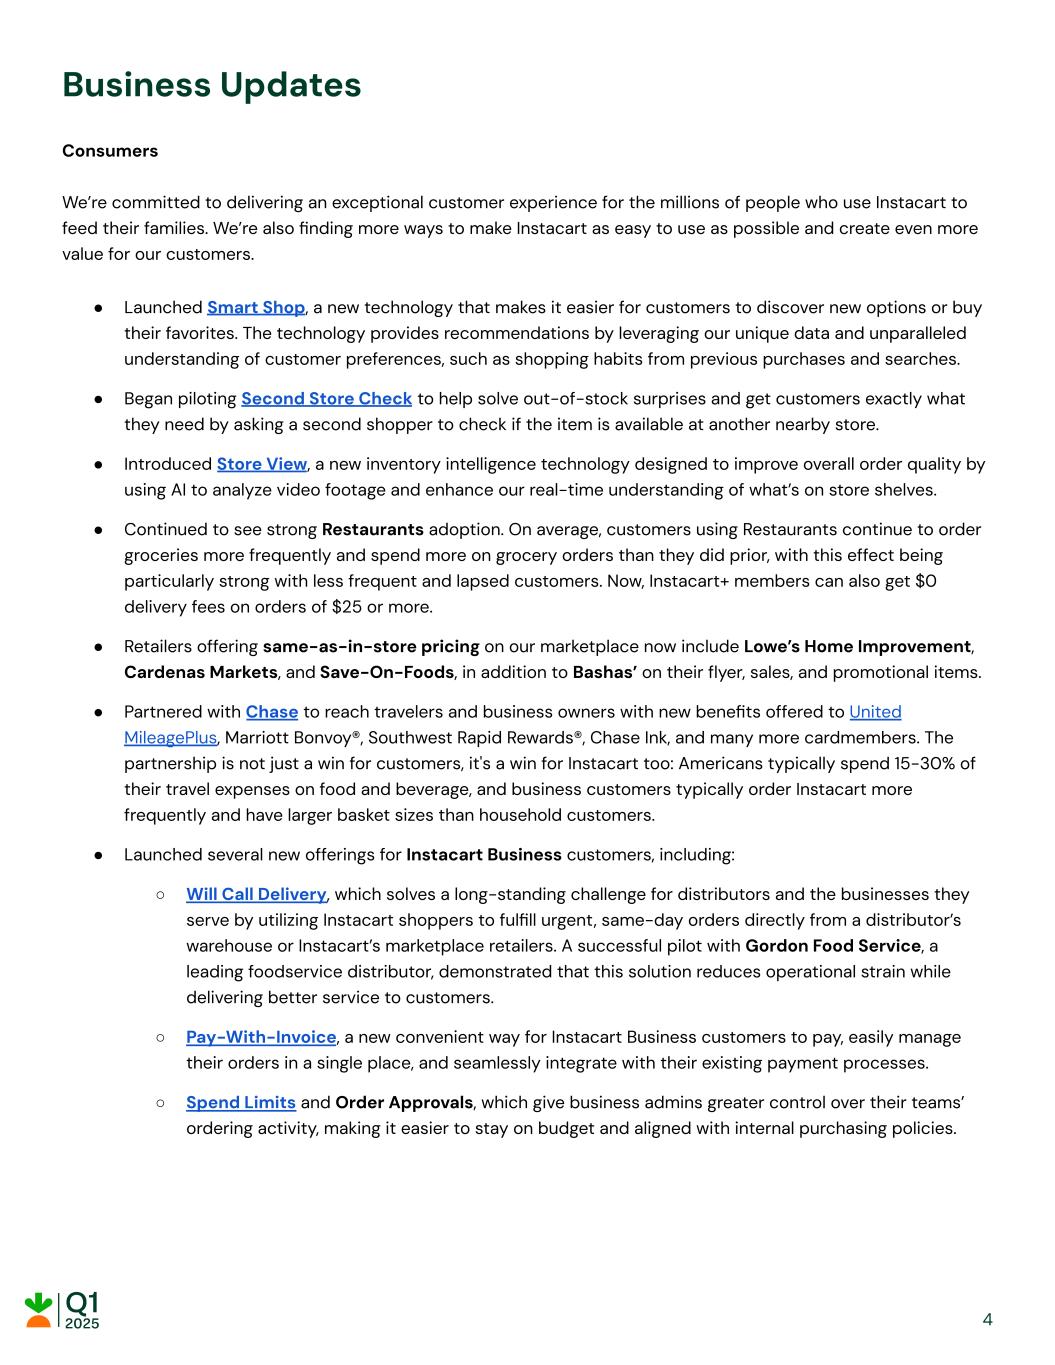
Business Updates Consumers We’re committed to delivering an exceptional customer experience for the millions of people who use Instacart to feed their families. We’re also finding more ways to make Instacart as easy to use as possible and create even more value for our customers. ● Launched Smart Shop, a new technology that makes it easier for customers to discover new options or buy their favorites. The technology provides recommendations by leveraging our unique data and unparalleled understanding of customer preferences, such as shopping habits from previous purchases and searches. ● Began piloting Second Store Check to help solve out-of-stock surprises and get customers exactly what they need by asking a second shopper to check if the item is available at another nearby store. ● Introduced Store View, a new inventory intelligence technology designed to improve overall order quality by using AI to analyze video footage and enhance our real-time understanding of what’s on store shelves. ● Continued to see strong Restaurants adoption. On average, customers using Restaurants continue to order groceries more frequently and spend more on grocery orders than they did prior, with this effect being particularly strong with less frequent and lapsed customers. Now, Instacart+ members can also get $0 delivery fees on orders of $25 or more. ● Retailers offering same-as-in-store pricing on our marketplace now include Lowe’s Home Improvement, Cardenas Markets, and Save-On-Foods, in addition to Bashas’ on their flyer, sales, and promotional items. ● Partnered with Chase to reach travelers and business owners with new benefits offered to United MileagePlus, Marriott Bonvoy®, Southwest Rapid Rewards®, Chase Ink, and many more cardmembers. The partnership is not just a win for customers, it's a win for Instacart too: Americans typically spend 15-30% of their travel expenses on food and beverage, and business customers typically order Instacart more frequently and have larger basket sizes than household customers. ● Launched several new offerings for Instacart Business customers, including: ○ Will Call Delivery, which solves a long-standing challenge for distributors and the businesses they serve by utilizing Instacart shoppers to fulfill urgent, same-day orders directly from a distributor’s warehouse or Instacart’s marketplace retailers. A successful pilot with Gordon Food Service, a leading foodservice distributor, demonstrated that this solution reduces operational strain while delivering better service to customers. ○ Pay-With-Invoice, a new convenient way for Instacart Business customers to pay, easily manage their orders in a single place, and seamlessly integrate with their existing payment processes. ○ Spend Limits and Order Approvals, which give business admins greater control over their teams’ ordering activity, making it easier to stay on budget and aligned with internal purchasing policies. 4
Retailers We’re continuing to deepen our integrations with retail partners on Instacart Marketplace and extend our enterprise and omnichannel technology and tools. ● Welcomed additional retailers to our marketplace, including: ○ Costco Business Centre (Canada) and Dierbergs Markets, a regional grocer in the Midwest. ○ 1-800-Flowers, the largest flower aggregator in North America. ○ Pet Supplies Plus, the third largest pet retailer in North America, will be coming to Instacart in the coming months making us the only marketplace to offer all five of these top pet retailers: PetSmart, PetCo, Pet Supplies Plus, Pet Valu, and Pet Supermarket. ● Launched AI-powered catalog tools to classify new products more accurately and efficiently, which has been particularly helpful for non-grocery retailers. For example, Dick’s Sporting Goods leveraged our new product creation tool to add products to our marketplace within hours instead of days, accelerating their time-to-market and reducing vendor costs for Instacart. ● Launched Morton Williams and upgraded PriceChopper NY to Storefront Pro, our premier white-label e-commerce experience, to help each retailer expand their e-commerce presence. Today, approximately 600 retail banners use Instacart’s white-label offerings. Most retailers that upgraded to Storefront Pro last year saw double-digit percentage point sales growth post-upgrade. ● Launched new fulfillment options for Costco’s owned and operated website, which is powered by Storefront Pro. Customers can now enjoy "Priority Delivery," our fastest delivery option, and “No Rush,” one of our more affordable delivery options. ● Acquired Wynshop, a provider of e-commerce solutions for leading grocers and retailers. By bringing together both organizations' expertise and deep retailer relationships, we expect to strengthen our enterprise solutions and help more retailers to enhance their online experiences and engage customers. ● Deployed additional Caper Carts at Wakefern, now live at nearly 10% of their stores, as well as at Schnucks in Missouri and Illinois. ● Launched FoodStorm, our deli, prepared food, and catering technology solution in an additional 1,300 stores, including chainwide across Ahold Delhaize USA's Food Lion banner, The Fresh Market, and Gelson’s. We also signed new FoodStorm partnerships with Geissler’s Supermarket and Lincoln Market. ● Rolled out Carrot Tags with Dierbergs Markets and McKeever’s Price Chopper further expanding the number of retailers that are live with our pick-to-light capabilities. 5
Brands With our unique data, insights, and partnerships, the Instacart Ads ecosystem has become a one-stop advertising platform, connecting brands with high-intent, incremental customers. We focus on helping brand partners reach the right customers with the right message, at the right time, and on the right channel to deliver impactful results. ● Announced AI-powered Universal Campaigns that helps brands of all sizes create one campaign with a single budget that automatically optimizes across multiple ad formats in real-time. When piloting Universal Campaigns, Rescue Dog Wines saw an increase in new-to-brand sales and 1st Phorm saw significant sales lift and solid ROAS. ● Launched Carrot Ads to power grocery and retail ads for Uber Eats’ grocery and retail marketplace in the U.S. By expanding the reach of our Instacart Ads ecosystem, we can efficiently help brands connect customers with their products to drive sales and growth. ● Launched shoppable display ads on Caper Carts, giving our more than 7,000 brand partners access to in-store advertising based on customers’ real-time location within the store and what’s in stock on the shelves. New and existing shoppable display campaigns will seamlessly extend across our marketplace and in-store without any additional work required from brand partners. ● Launched new co-marketing campaigns with Danimals and Earthbound Farm — featuring new custom promo code capabilities that drive engagement and measurable paths to purchase — and for the second year, launched a ‘Spring Cleaning’ campaign with Procter & Gamble. Other recent co-marketing campaign partners include Campari, Celsius, Dave's Killer Bread, and Liquid IV. ● Released new measurement case studies with BUILT, Little Leaf, Mission Meats, Nature Nate’s, and Rip Van highlighting the power of Instacart Ads to reach new-to-brand consumers and drive brand awareness. Shoppers We continue to see strong engagement across our experienced community of Instacart shoppers, which plays a critical role in delivering superior customer service. ● Launched a new shopping quality score, a 90-day lookback metric giving shoppers feedback on recently shopped batches so that they can continue to improve and deliver the best possible service to customers. ● Began piloting several new initiatives that create new earnings opportunities for eligible shoppers: ○ Second Store Check tasks, where, when a customer’s requested items are out-of-stock at one store, shoppers at another location may have the opportunity to shop for those items and complete the customer’s order. ○ Store View tasks, where shoppers may have the opportunity to take videos of store shelves to help us and our partners improve inventory intelligence. ○ Will Call tasks, where shoppers are provided an opportunity to collect and deliver customer orders from a distributor's warehouse. 6
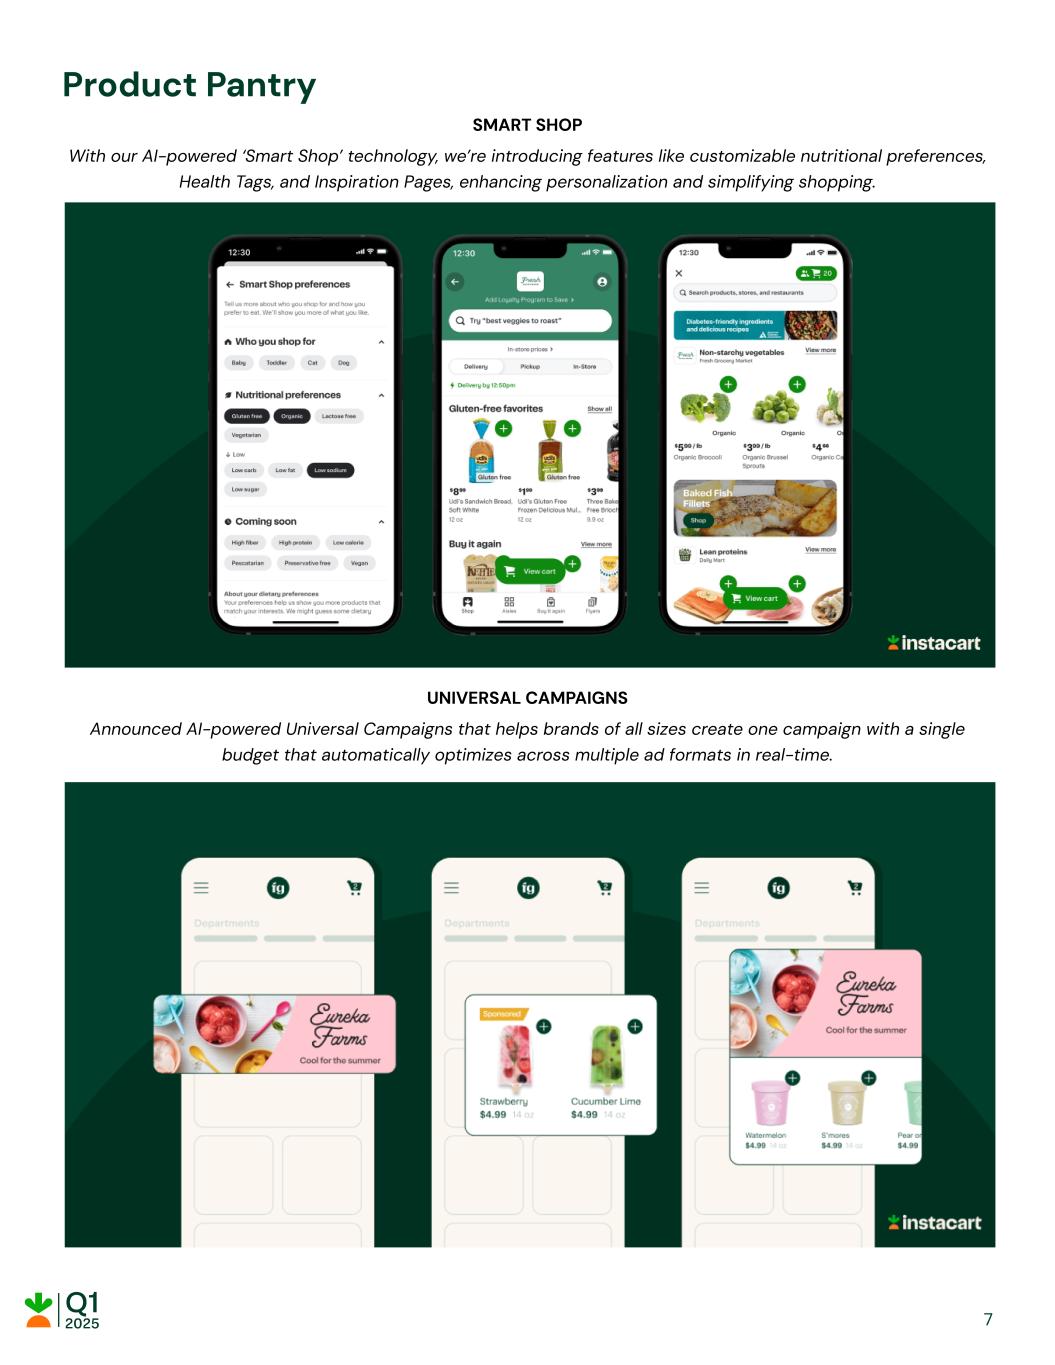
Product Pantry SMART SHOP With our AI-powered ‘Smart Shop’ technology, we’re introducing features like customizable nutritional preferences, Health Tags, and Inspiration Pages, enhancing personalization and simplifying shopping. UNIVERSAL CAMPAIGNS Announced AI-powered Universal Campaigns that helps brands of all sizes create one campaign with a single budget that automatically optimizes across multiple ad formats in real-time. 7
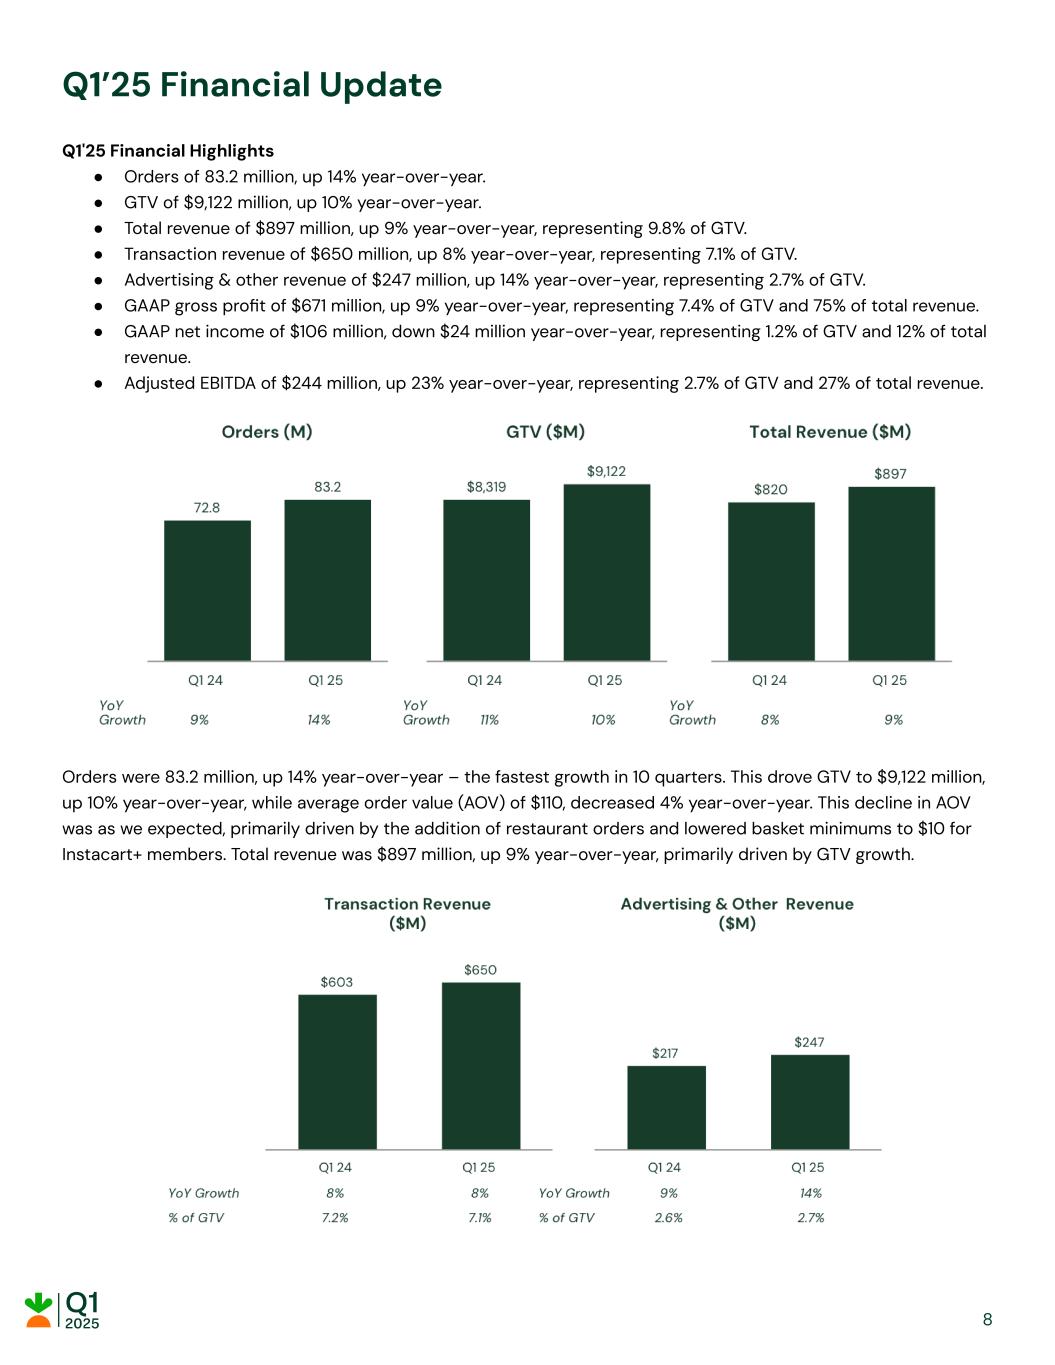
Q1’25 Financial Update Q1'25 Financial Highlights ● Orders of 83.2 million, up 14% year-over-year. ● GTV of $9,122 million, up 10% year-over-year. ● Total revenue of $897 million, up 9% year-over-year, representing 9.8% of GTV. ● Transaction revenue of $650 million, up 8% year-over-year, representing 7.1% of GTV. ● Advertising & other revenue of $247 million, up 14% year-over-year, representing 2.7% of GTV. ● GAAP gross profit of $671 million, up 9% year-over-year, representing 7.4% of GTV and 75% of total revenue. ● GAAP net income of $106 million, down $24 million year-over-year, representing 1.2% of GTV and 12% of total revenue. ● Adjusted EBITDA of $244 million, up 23% year-over-year, representing 2.7% of GTV and 27% of total revenue. Orders were 83.2 million, up 14% year-over-year – the fastest growth in 10 quarters. This drove GTV to $9,122 million, up 10% year-over-year, while average order value (AOV) of $110, decreased 4% year-over-year. This decline in AOV was as we expected, primarily driven by the addition of restaurant orders and lowered basket minimums to $10 for Instacart+ members. Total revenue was $897 million, up 9% year-over-year, primarily driven by GTV growth. 8
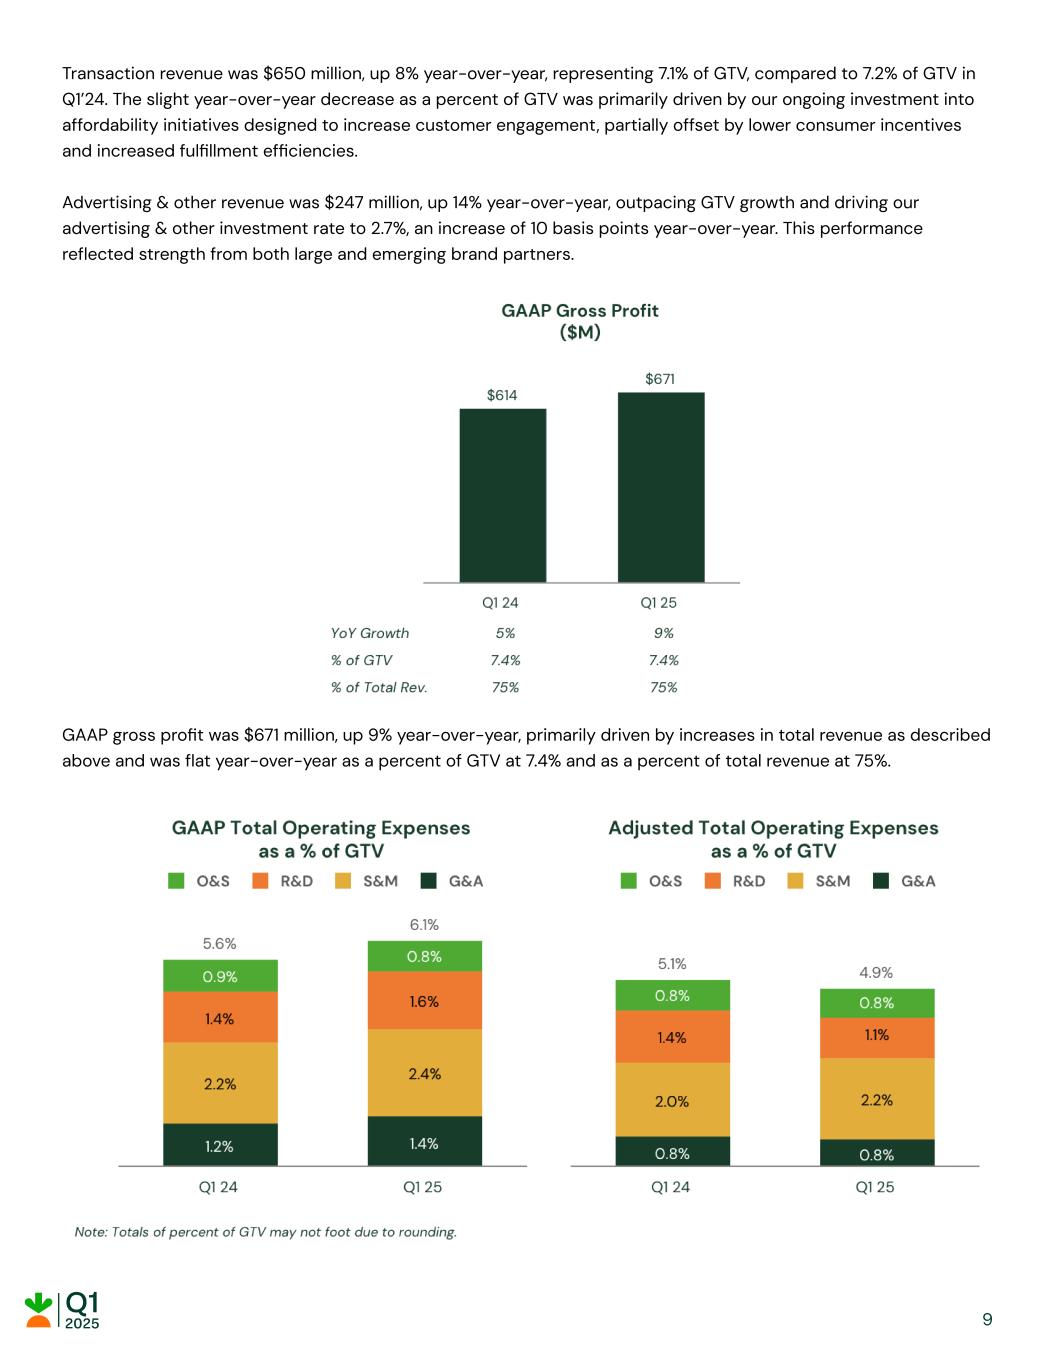
Transaction revenue was $650 million, up 8% year-over-year, representing 7.1% of GTV, compared to 7.2% of GTV in Q1’24. The slight year-over-year decrease as a percent of GTV was primarily driven by our ongoing investment into affordability initiatives designed to increase customer engagement, partially offset by lower consumer incentives and increased fulfillment efficiencies. Advertising & other revenue was $247 million, up 14% year-over-year, outpacing GTV growth and driving our advertising & other investment rate to 2.7%, an increase of 10 basis points year-over-year. This performance reflected strength from both large and emerging brand partners. GAAP gross profit was $671 million, up 9% year-over-year, primarily driven by increases in total revenue as described above and was flat year-over-year as a percent of GTV at 7.4% and as a percent of total revenue at 75%. 9
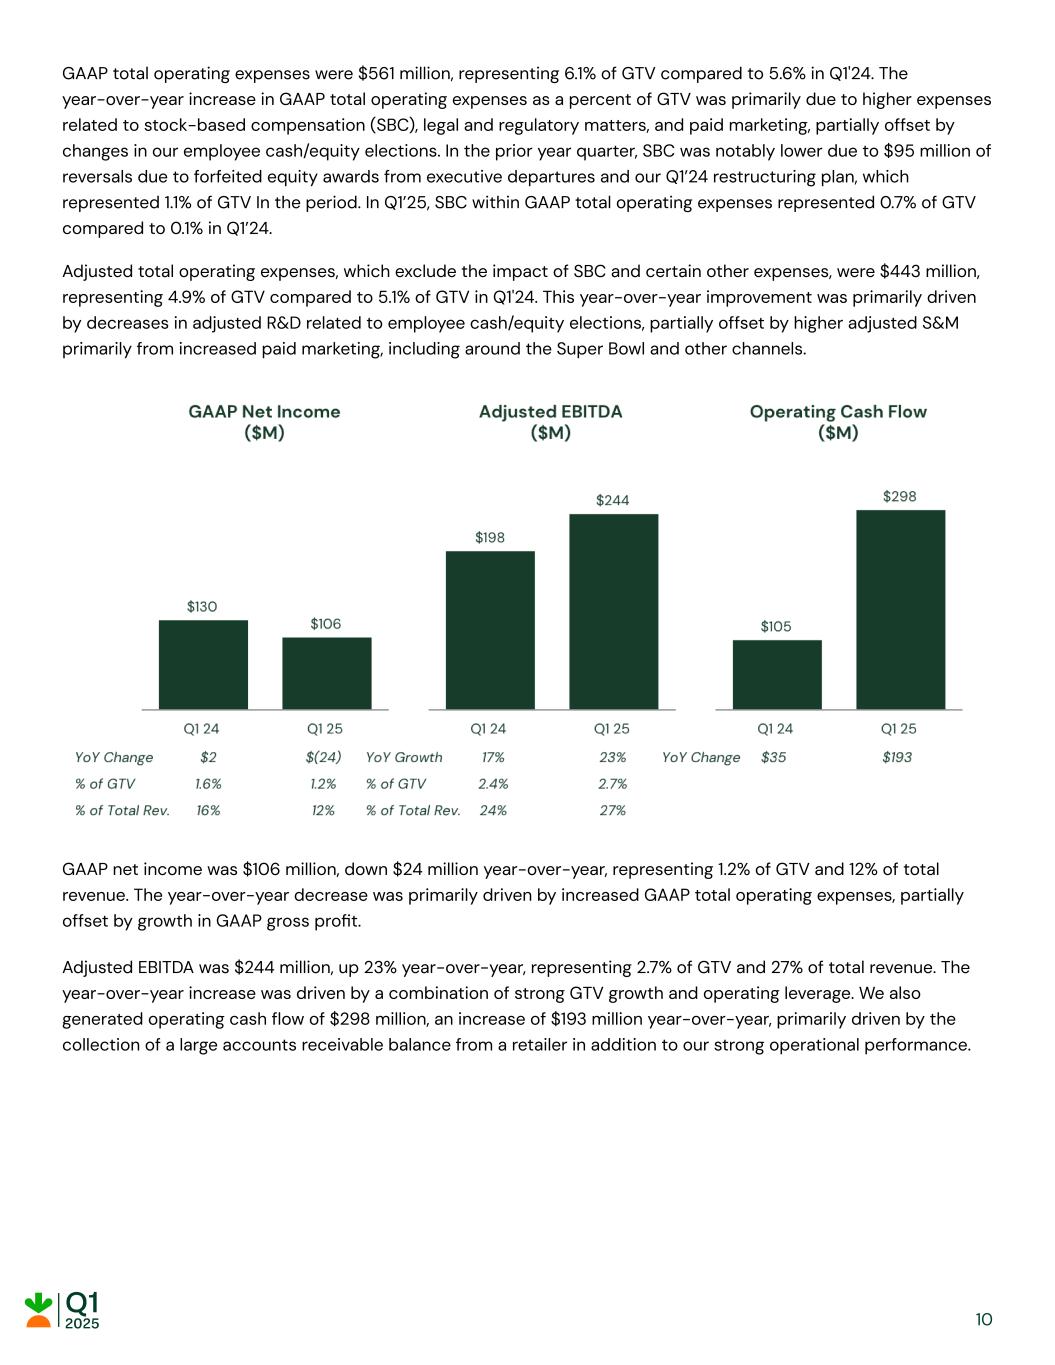
GAAP total operating expenses were $561 million, representing 6.1% of GTV compared to 5.6% in Q1'24. The year-over-year increase in GAAP total operating expenses as a percent of GTV was primarily due to higher expenses related to stock-based compensation (SBC), legal and regulatory matters, and paid marketing, partially offset by changes in our employee cash/equity elections. In the prior year quarter, SBC was notably lower due to $95 million of reversals due to forfeited equity awards from executive departures and our Q1’24 restructuring plan, which represented 1.1% of GTV In the period. In Q1’25, SBC within GAAP total operating expenses represented 0.7% of GTV compared to 0.1% in Q1’24. Adjusted total operating expenses, which exclude the impact of SBC and certain other expenses, were $443 million, representing 4.9% of GTV compared to 5.1% of GTV in Q1'24. This year-over-year improvement was primarily driven by decreases in adjusted R&D related to employee cash/equity elections, partially offset by higher adjusted S&M primarily from increased paid marketing, including around the Super Bowl and other channels. GAAP net income was $106 million, down $24 million year-over-year, representing 1.2% of GTV and 12% of total revenue. The year-over-year decrease was primarily driven by increased GAAP total operating expenses, partially offset by growth in GAAP gross profit. Adjusted EBITDA was $244 million, up 23% year-over-year, representing 2.7% of GTV and 27% of total revenue. The year-over-year increase was driven by a combination of strong GTV growth and operating leverage. We also generated operating cash flow of $298 million, an increase of $193 million year-over-year, primarily driven by the collection of a large accounts receivable balance from a retailer in addition to our strong operational performance. 10
Q2’25 Financial Outlook GTV $8,850 - $9,000 million Adjusted EBITDA $240 - $250 million This GTV outlook represents year-over-year growth between 8% to 10%. We also continue to expect that orders growth will outpace GTV growth in the period. We remain on track to expanding Adjusted EBITDA year-over-year on both an absolute and percent of GTV basis in 2025. We have not provided the forward-looking GAAP equivalent to our adjusted EBITDA or a GAAP reconciliation as a result of the uncertainty regarding, and the potential variability of, reconciling items such as stock-based compensation and related payroll tax expenses, certain legal and regulatory accruals and settlements, and reserves for sales and other indirect taxes. Accordingly, a reconciliation of this non-GAAP guidance metric to its corresponding GAAP equivalent is not available without unreasonable effort. However, it is important to note that these reconciling items could have a significant effect on future GAAP results. Live Conference Call Instacart management will host a conference call to discuss the company's results at 2:00 p.m. Pacific Time (5:00 p.m. Eastern Time) on Thursday, May 1. To access a live webcast of the conference call, please visit our Investor Relations website at https://investors.instacart.com. After the call concludes, a replay will be made available on our Investor Relations website. Forward-Looking Statements This letter and the accompanying oral presentation contain forward-looking statements within the meaning of the Private Securities Litigation Reform Act of 1995. All statements other than statements of historical fact could be deemed forward-looking, including without limitation statements regarding our financial outlook, including GTV, adjusted EBITDA, AOV, and advertising and other revenue, trends in our business and industry, impacts from macroeconomic conditions, our plans and expectations regarding products, features, and partnerships, including expansion of our capabilities, services, and solutions, the expected benefits to our business from acquisitions, the expected benefits of AI, our strategic priorities, investments, and initiatives, our ability to drive sales and growth for our partners, and the level of activity under our share repurchase program. In some cases, you can identify forward-looking statements because they contain words such as “anticipate,” “believe,” “contemplate,” “continue,” “could,” “estimate,” “expect,” “intend,” “may,” “plan,” “potential,” “predict,” “project,” “should,” “target,” “toward,” “will,” or “would,” or the negative of these words or other similar terms or expressions. The forward-looking statements contained in this letter and the accompanying oral presentation are subject to known and unknown risks, uncertainties, assumptions, and other factors that may cause actual results or outcomes to be materially different from any future results or outcomes expressed or implied by the forward-looking statements. These risks, uncertainties, assumptions, and other factors include, but are not limited to, those related to anticipated trends, growth rates, and challenges in our business, industry, and the markets in which we operate; our ability to attract and increase engagement of customers and shoppers; our ability to effectively manage the increasing scale, scope, and 11

complexity of our business; our ability to operate our business and effectively manage our growth and margins under evolving and uncertain macroeconomic conditions; our ability to achieve or maintain profitability and profitable growth; our ability to maintain and expand our relationships with retailers and advertisers; competition in our markets; our ability to expand our existing and develop new products, offerings, features, and use cases, bring them to market in a timely manner, and whether retailers, customers, brands, shoppers, or other partners launch or utilize such products, offerings, features, and use cases in the manner and timing that we expect; our ability to continue to grow across our current markets and expand into new markets; our estimated market opportunity; the impact on our business of macroeconomic and industry trends, including tariffs or other trade restrictions, inflation, elevated interest rates, supply chain challenges, cessation of or changes to government aid programs, heightened recession risk, market volatility, and geopolitical conflicts; legal and governmental proceedings; new or changes to laws and regulations and other regulatory matters and developments, particularly with respect to the classification of shoppers on our platform; the occurrence of any security incidents or disruptions of service on our platform or technology offerings; our reliance on key personnel and our ability to attract, integrate, and retain management and skilled personnel; our ability to identify, complete, and achieve anticipated benefits from acquisitions, strategic investments, collaborations, commercial arrangements, alliances, or partnerships; our ability to successfully integrate other businesses or our partners’ technologies that we acquire and realize the intended benefits of those acquisitions; the impact of weather patterns; and our reliance on third-party devices, operating systems, applications, and services that we do not control; as well as other risks described from time to time in our filings with the Securities and Exchange Commission (SEC), including in our Annual Report on Form 10-K for the year ended December 31, 2024 filed with the SEC on February 28, 2025. You should not rely on forward-looking statements as predictions of future events. We have based the forward-looking statements contained in this letter and the accompanying oral presentation primarily on information available to us as of the date of this letter and the accompanying oral presentation and our current expectations and projections about future events and trends that we believe may affect our business, financial condition, and results of operations. While we believe such information provides a reasonable basis for these statements, such information may be limited or incomplete. Our statements should not be read to indicate that we have conducted an exhaustive inquiry into, or review of, all relevant information. These statements are inherently uncertain, and investors are cautioned not to unduly rely on these statements. Moreover, we operate in a very competitive and rapidly changing environment, and new risks may emerge from time to time. It is not possible for us to predict all risks, nor can we assess the impact of all factors on our business or the extent to which any factor, or combination of factors, may cause actual results or outcomes to differ materially from those contained in any forward-looking statements we may make. Except as required by law, we undertake no obligation, and do not intend, to update these forward-looking statements. Key Business Metrics We use the following key business metrics to help us evaluate our business, identify trends affecting our performance, formulate business plans, and make strategic decisions. • Gross Transaction Value (GTV): We define GTV as the value of the products sold through Instacart, including applicable taxes, deposits and other local fees, customer tips, which go directly to shoppers, customer fees, which include flat subscription fees related to Instacart+ that are charged monthly or annually, and other fees. GTV consists of orders including those completed through Instacart Marketplace or 12
services that are part of the Instacart Enterprise Platform. We believe that GTV indicates the health of our business, including our ability to drive revenue and profits, and the value we provide to our constituents. • Orders: We define an order as a completed customer transaction to purchase goods for delivery or pickup primarily from a single retailer through Instacart during the period indicated, including those completed through Instacart Marketplace or services that are part of the Instacart Enterprise Platform. We believe that orders are an indicator of the scale and growth of our business as well as the value we bring to our constituents. Non-GAAP Financial Measures We use the following non-GAAP financial measures in conjunction with GAAP measures to assess performance, to inform the preparation of our annual operating budget and quarterly forecasts, to evaluate the effectiveness of our business strategies, and to discuss our business and financial performance with our board of directors. We believe that these non-GAAP financial measures provide useful information to investors about our business and financial performance, enhance their overall understanding of our past performance and future prospects, and allow for greater transparency with respect to metrics used by our management in their financial and operational decision making. We are presenting these non-GAAP financial measures to assist investors in seeing our business and financial performance through the eyes of management, and because we believe that these non-GAAP financial measures provide an additional tool for investors to use in comparing results of operations of our business over multiple periods with other companies in our industry. Adjusted EBITDA, Adjusted EBITDA as a Percent of GTV, and Adjusted EBITDA Margin. We define adjusted EBITDA as net income, adjusted to exclude (i) provision for income taxes, (ii) interest income, (iii) other expense, net, (iv) depreciation and amortization expense, (v) stock-based compensation expense, (vi) payroll taxes related to stock-based compensation expense, (vii) certain legal and regulatory accruals and settlements, net, (viii) reserves for sales and other indirect taxes, net, and (ix) restructuring charges. We define adjusted EBITDA margin as adjusted EBITDA as a percent of total revenue. We use adjusted EBITDA, adjusted EBITDA as a percent of GTV, and adjusted EBITDA margin because they are important measures upon which our management assesses our operating performance and the operating leverage in our business. Because adjusted EBITDA, adjusted EBITDA as a percent of GTV, and adjusted EBITDA margin facilitate internal comparisons of our historical operating performance, including as an indication of our total revenue growth and operating efficiencies when compared to GTV and total revenue over time, we use them to evaluate the effectiveness of our strategic initiatives and for business planning purposes. We also believe that adjusted EBITDA, adjusted EBITDA as a percent of GTV, and adjusted EBITDA margin, when taken collectively, may be useful to investors because they provide consistency and comparability with past financial performance, so that investors can evaluate our operating efficiencies by excluding certain items that may not be indicative of our business, results of operations, or outlook. In addition, we believe adjusted EBITDA is widely used by investors, securities analysts, rating agencies, and other parties in evaluating companies in our industry as a measure of operational performance. Adjusted EBITDA, adjusted EBITDA as a percent of GTV, and adjusted EBITDA margin should not be considered as alternatives to net income, net income as a percent of GTV, net income as a percent of total 13
revenue, or any other measure of financial performance calculated and presented in accordance with GAAP. There are a number of limitations related to the use of adjusted EBITDA, adjusted EBITDA as a percent of GTV, and adjusted EBITDA margin rather than net income, net income as a percent of GTV, and net income as a percent of total revenue, which are the most directly comparable GAAP measures. Some of these limitations are that each of adjusted EBITDA, adjusted EBITDA as a percent of GTV, and adjusted EBITDA margin: ● excludes stock-based compensation expense; ● excludes payroll taxes related to stock-based compensation expense; ● excludes depreciation and amortization expense, and although these are non-cash expenses the assets being depreciated may have to be replaced in the future, increasing our cash requirements; ● excludes restructuring charges; ● does not reflect the positive or adverse adjustments related to the reserve for sales and other indirect taxes or certain legal regulatory accruals and settlements; ● does not reflect interest income which increases cash available to us; ● does not reflect other income or expense that includes unrealized and realized gains and losses on foreign currency exchange; and ● does not reflect provision for or benefit from income taxes that reduces or increases cash available to us. Adjusted Cost of Revenue and Adjusted Cost of Revenue as a Percent of GTV. We define adjusted cost of revenue as cost of revenue excluding depreciation and amortization expense and stock-based compensation expense. Adjusted Operations and Support Expense and Adjusted Operations and Support Expense as a Percent of GTV. We define adjusted operations and support expense as operations and support expense excluding depreciation and amortization expense, stock-based compensation expense, payroll taxes related to stock-based compensation, and restructuring charges. Adjusted Research and Development Expense and Adjusted Research and Development Expense as a Percent of GTV. We define adjusted research and development expense as research and development expense excluding depreciation and amortization expense, stock-based compensation expense, payroll taxes related to stock-based compensation, and restructuring charges. Adjusted Sales and Marketing Expense and Adjusted Sales and Marketing Expense as a Percent of GTV. We define adjusted sales and marketing expense as sales and marketing expense excluding depreciation and amortization expense, stock-based compensation expense, payroll taxes related to stock-based compensation, and restructuring charges. Adjusted General and Administrative Expense and Adjusted General and Administrative Expense as a Percent of GTV. We define adjusted general and administrative expense as general and administrative expense excluding depreciation and amortization expense; stock-based compensation expense; payroll taxes related to stock-based compensation; certain legal and regulatory accruals and settlements, net; reserves for sales and other indirect taxes, net; acquisition-related expenses; and restructuring charges. 14
Adjusted Total Operating Expenses and Adjusted Total Operating Expenses as a Percent of GTV. We define adjusted total operating expenses as the sum of adjusted operations and support expense, adjusted research and development expense, adjusted sales and marketing expense, and adjusted general and administrative expense. We exclude depreciation and amortization expense and stock-based compensation expense from our non-GAAP financial measures as these are non-cash in nature. We exclude payroll taxes related to the vesting and settlement of certain equity awards; certain legal and regulatory accruals and settlements, net; reserves for sales and other indirect taxes, net; acquisition-related expenses; and restructuring charges as these are not indicative of our operating performance. Non-GAAP financial measures are not meant to be considered in isolation or as a substitute for comparable GAAP financial measures and should be read only in conjunction with our condensed consolidated financial statements prepared in accordance with GAAP. Our presentation of non-GAAP financial measures may not be comparable to similar measures used by other companies, which reduce their usefulness as comparative measures. In addition, other companies may not publish these or similar measures. Further, these measures have certain limitations in that they do not include the impact of certain expenses that are reflected in our consolidated statements of operations. We encourage investors and others to review our business, results of operations, and financial information in their entirety, not to rely on any single financial measure, and carefully consider our results under GAAP, as well as our supplemental non-GAAP information and the reconciliation between these presentations, to more fully understand our business. Please see the tables included at the end of this letter for the reconciliation of GAAP to non-GAAP results. 15
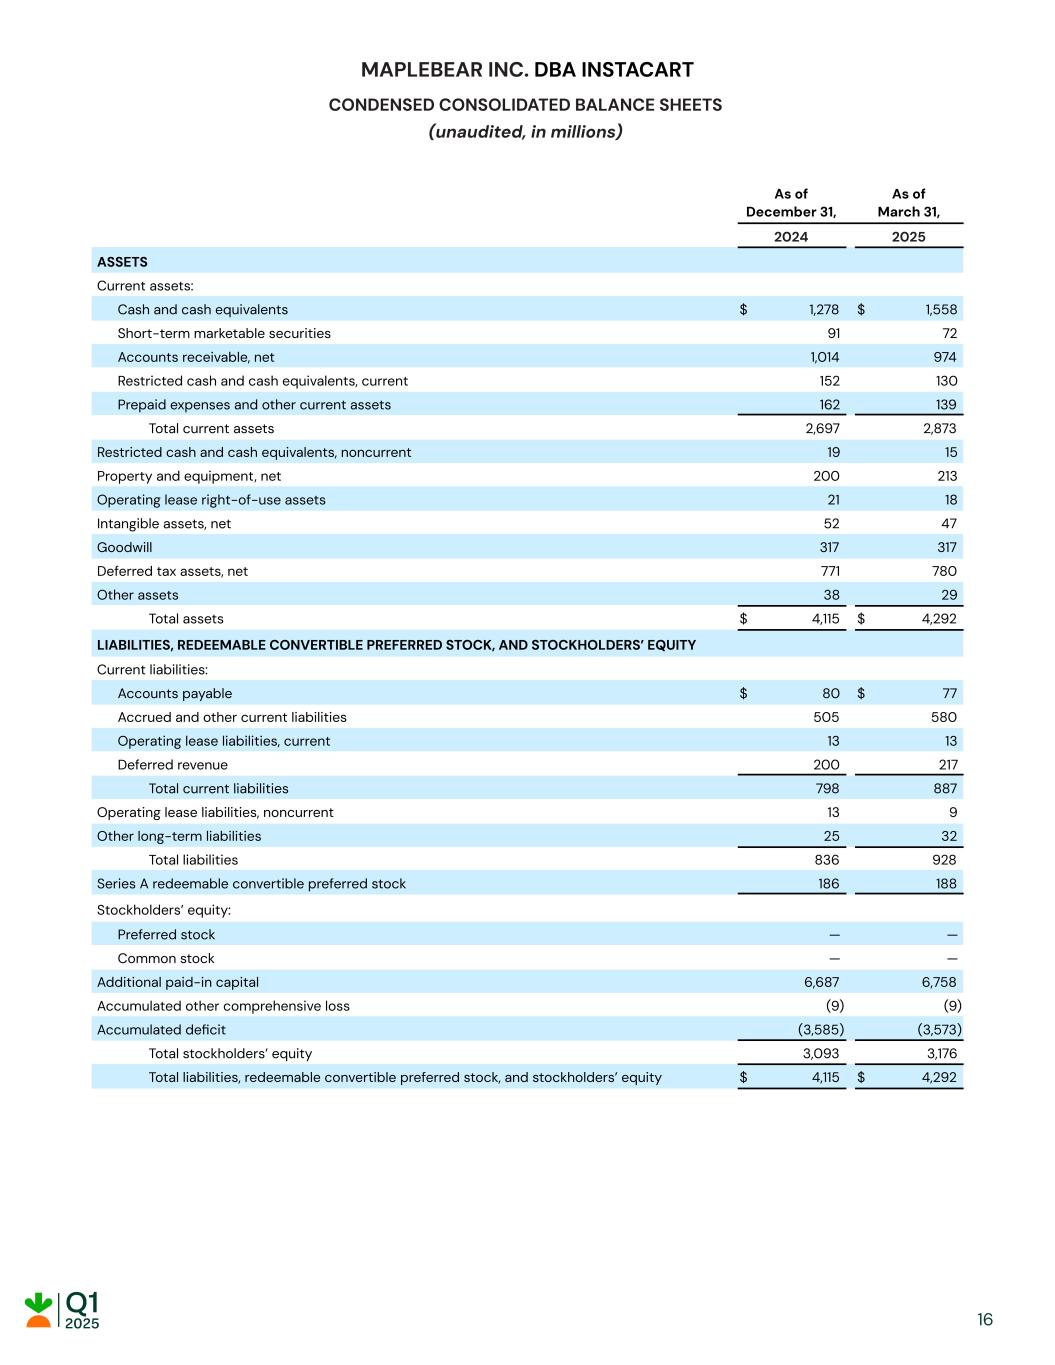
MAPLEBEAR INC. DBA INSTACART CONDENSED CONSOLIDATED BALANCE SHEETS (unaudited, in millions) As of December 31, As of March 31, 2024 2025 ASSETS Current assets: Cash and cash equivalents $ 1,278 $ 1,558 Short-term marketable securities 91 72 Accounts receivable, net 1,014 974 Restricted cash and cash equivalents, current 152 130 Prepaid expenses and other current assets 162 139 Total current assets 2,697 2,873 Restricted cash and cash equivalents, noncurrent 19 15 Property and equipment, net 200 213 Operating lease right-of-use assets 21 18 Intangible assets, net 52 47 Goodwill 317 317 Deferred tax assets, net 771 780 Other assets 38 29 Total assets $ 4,115 $ 4,292 LIABILITIES, REDEEMABLE CONVERTIBLE PREFERRED STOCK, AND STOCKHOLDERS’ EQUITY Current liabilities: Accounts payable $ 80 $ 77 Accrued and other current liabilities 505 580 Operating lease liabilities, current 13 13 Deferred revenue 200 217 Total current liabilities 798 887 Operating lease liabilities, noncurrent 13 9 Other long-term liabilities 25 32 Total liabilities 836 928 Series A redeemable convertible preferred stock 186 188 Stockholders’ equity: Preferred stock — — Common stock — — Additional paid-in capital 6,687 6,758 Accumulated other comprehensive loss (9) (9) Accumulated deficit (3,585) (3,573) Total stockholders’ equity 3,093 3,176 Total liabilities, redeemable convertible preferred stock, and stockholders’ equity $ 4,115 $ 4,292 16
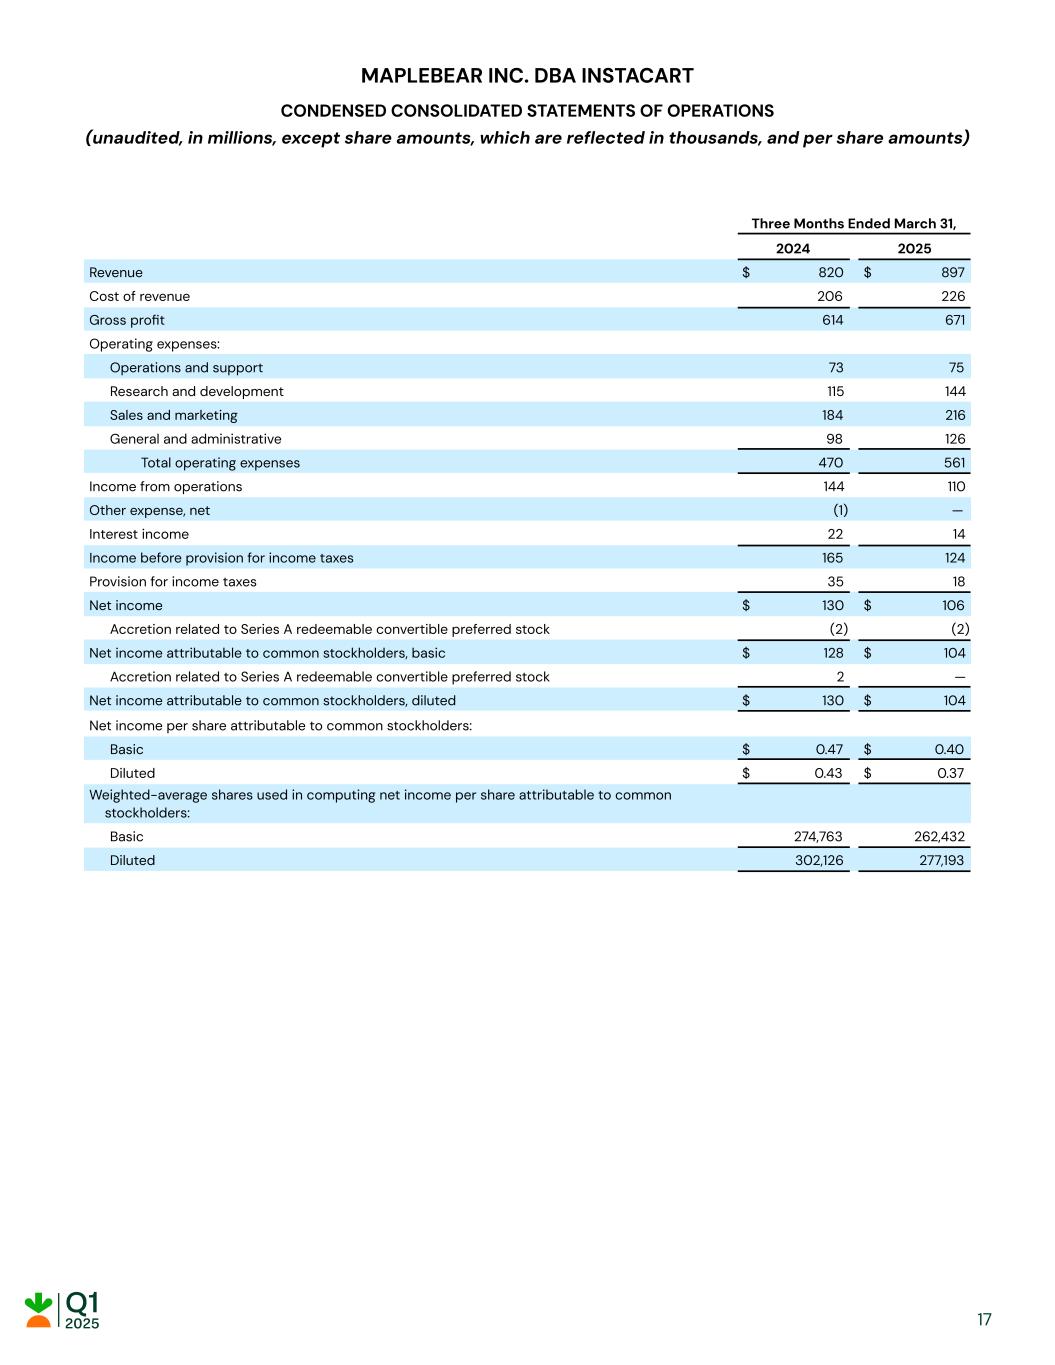
MAPLEBEAR INC. DBA INSTACART CONDENSED CONSOLIDATED STATEMENTS OF OPERATIONS (unaudited, in millions, except share amounts, which are reflected in thousands, and per share amounts) Three Months Ended March 31, 2024 2025 Revenue $ 820 $ 897 Cost of revenue 206 226 Gross profit 614 671 Operating expenses: Operations and support 73 75 Research and development 115 144 Sales and marketing 184 216 General and administrative 98 126 Total operating expenses 470 561 Income from operations 144 110 Other expense, net (1) — Interest income 22 14 Income before provision for income taxes 165 124 Provision for income taxes 35 18 Net income $ 130 $ 106 Accretion related to Series A redeemable convertible preferred stock (2) (2) Net income attributable to common stockholders, basic $ 128 $ 104 Accretion related to Series A redeemable convertible preferred stock 2 — Net income attributable to common stockholders, diluted $ 130 $ 104 Net income per share attributable to common stockholders: Basic $ 0.47 $ 0.40 Diluted $ 0.43 $ 0.37 Weighted-average shares used in computing net income per share attributable to common stockholders: Basic 274,763 262,432 Diluted 302,126 277,193 17
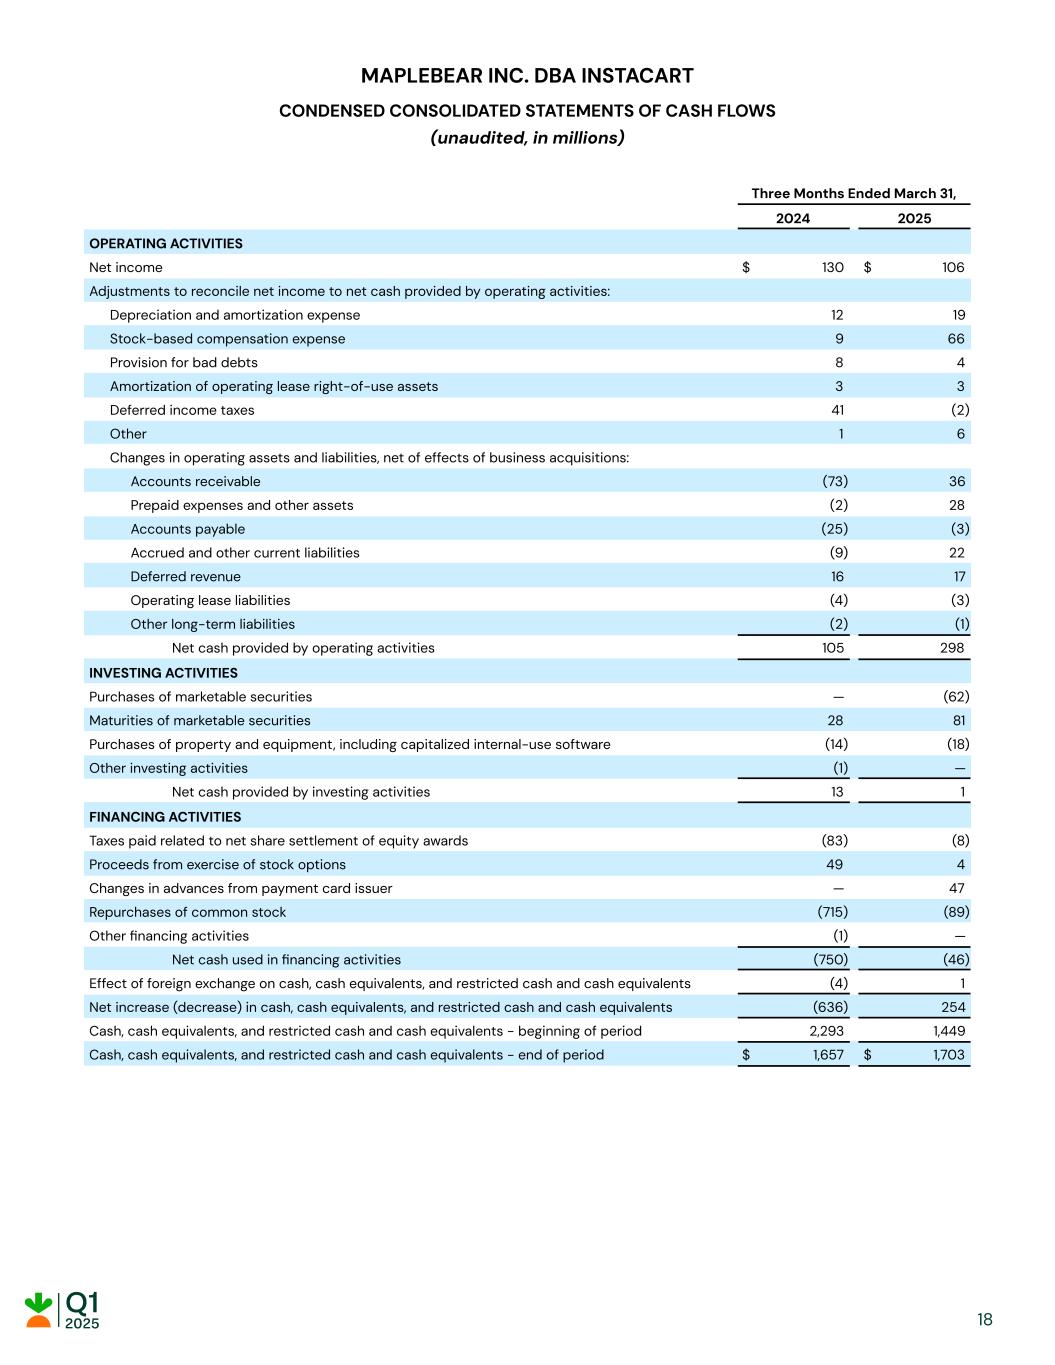
MAPLEBEAR INC. DBA INSTACART CONDENSED CONSOLIDATED STATEMENTS OF CASH FLOWS (unaudited, in millions) Three Months Ended March 31, 2024 2025 OPERATING ACTIVITIES Net income $ 130 $ 106 Adjustments to reconcile net income to net cash provided by operating activities: Depreciation and amortization expense 12 19 Stock-based compensation expense 9 66 Provision for bad debts 8 4 Amortization of operating lease right-of-use assets 3 3 Deferred income taxes 41 (2) Other 1 6 Changes in operating assets and liabilities, net of effects of business acquisitions: Accounts receivable (73) 36 Prepaid expenses and other assets (2) 28 Accounts payable (25) (3) Accrued and other current liabilities (9) 22 Deferred revenue 16 17 Operating lease liabilities (4) (3) Other long-term liabilities (2) (1) Net cash provided by operating activities 105 298 INVESTING ACTIVITIES Purchases of marketable securities — (62) Maturities of marketable securities 28 81 Purchases of property and equipment, including capitalized internal-use software (14) (18) Other investing activities (1) — Net cash provided by investing activities 13 1 FINANCING ACTIVITIES Taxes paid related to net share settlement of equity awards (83) (8) Proceeds from exercise of stock options 49 4 Changes in advances from payment card issuer — 47 Repurchases of common stock (715) (89) Other financing activities (1) — Net cash used in financing activities (750) (46) Effect of foreign exchange on cash, cash equivalents, and restricted cash and cash equivalents (4) 1 Net increase (decrease) in cash, cash equivalents, and restricted cash and cash equivalents (636) 254 Cash, cash equivalents, and restricted cash and cash equivalents - beginning of period 2,293 1,449 Cash, cash equivalents, and restricted cash and cash equivalents - end of period $ 1,657 $ 1,703 18
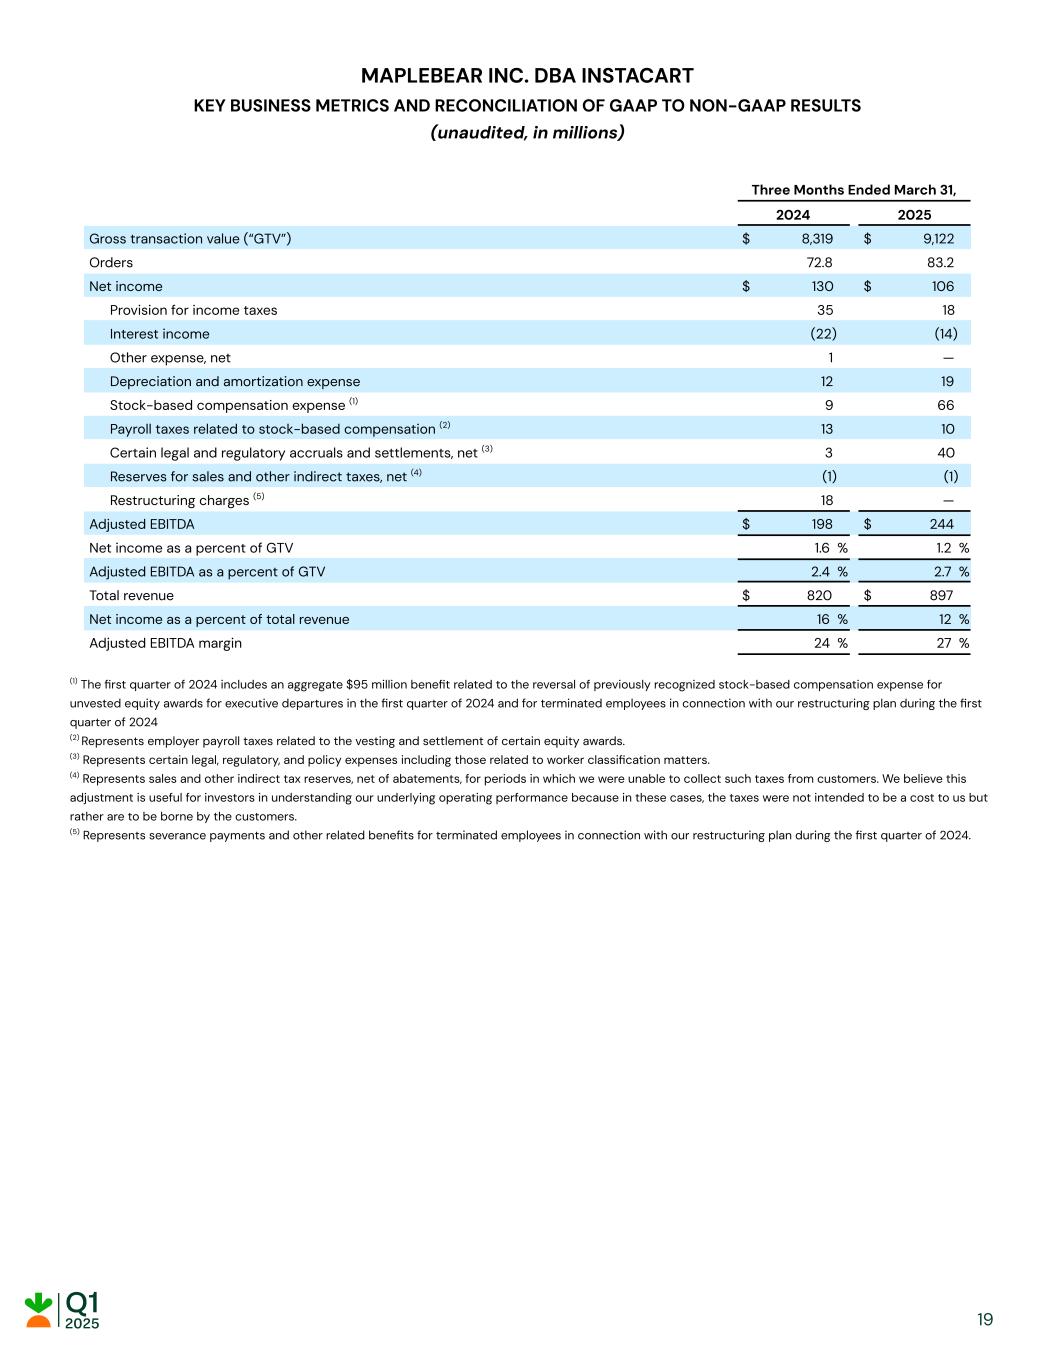
MAPLEBEAR INC. DBA INSTACART KEY BUSINESS METRICS AND RECONCILIATION OF GAAP TO NON-GAAP RESULTS (unaudited, in millions) Three Months Ended March 31, 2024 2025 Gross transaction value (“GTV”) $ 8,319 $ 9,122 Orders 72.8 83.2 Net income $ 130 $ 106 Provision for income taxes 35 18 Interest income (22) (14) Other expense, net 1 — Depreciation and amortization expense 12 19 Stock-based compensation expense (1) 9 66 Payroll taxes related to stock-based compensation (2) 13 10 Certain legal and regulatory accruals and settlements, net (3) 3 40 Reserves for sales and other indirect taxes, net (4) (1) (1) Restructuring charges (5) 18 — Adjusted EBITDA $ 198 $ 244 Net income as a percent of GTV 1.6 % 1.2 % Adjusted EBITDA as a percent of GTV 2.4 % 2.7 % Total revenue $ 820 $ 897 Net income as a percent of total revenue 16 % 12 % Adjusted EBITDA margin 24 % 27 % (1) The first quarter of 2024 includes an aggregate $95 million benefit related to the reversal of previously recognized stock-based compensation expense for unvested equity awards for executive departures in the first quarter of 2024 and for terminated employees in connection with our restructuring plan during the first quarter of 2024 (2) Represents employer payroll taxes related to the vesting and settlement of certain equity awards. (3) Represents certain legal, regulatory, and policy expenses including those related to worker classification matters. (4) Represents sales and other indirect tax reserves, net of abatements, for periods in which we were unable to collect such taxes from customers. We believe this adjustment is useful for investors in understanding our underlying operating performance because in these cases, the taxes were not intended to be a cost to us but rather are to be borne by the customers. (5) Represents severance payments and other related benefits for terminated employees in connection with our restructuring plan during the first quarter of 2024. 19
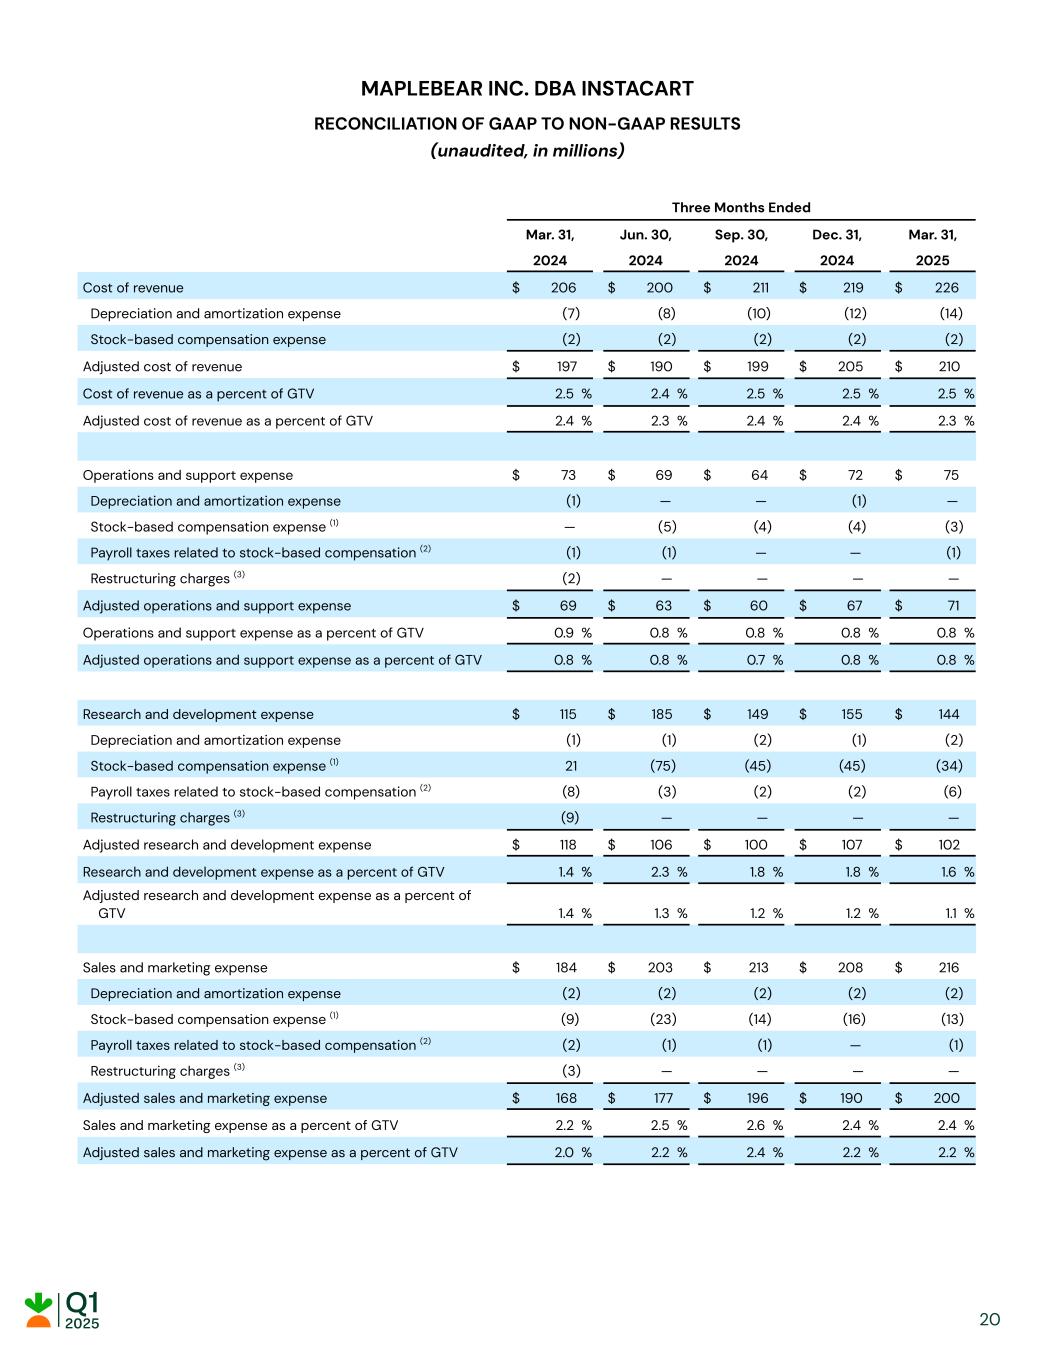
MAPLEBEAR INC. DBA INSTACART RECONCILIATION OF GAAP TO NON-GAAP RESULTS (unaudited, in millions) Three Months Ended Mar. 31, Jun. 30, Sep. 30, Dec. 31, Mar. 31, 2024 2024 2024 2024 2025 Cost of revenue $ 206 $ 200 $ 211 $ 219 $ 226 Depreciation and amortization expense (7) (8) (10) (12) (14) Stock-based compensation expense (2) (2) (2) (2) (2) Adjusted cost of revenue $ 197 $ 190 $ 199 $ 205 $ 210 Cost of revenue as a percent of GTV 2.5 % 2.4 % 2.5 % 2.5 % 2.5 % Adjusted cost of revenue as a percent of GTV 2.4 % 2.3 % 2.4 % 2.4 % 2.3 % Operations and support expense $ 73 $ 69 $ 64 $ 72 $ 75 Depreciation and amortization expense (1) — — (1) — Stock-based compensation expense (1) — (5) (4) (4) (3) Payroll taxes related to stock-based compensation (2) (1) (1) — — (1) Restructuring charges (3) (2) — — — — Adjusted operations and support expense $ 69 $ 63 $ 60 $ 67 $ 71 Operations and support expense as a percent of GTV 0.9 % 0.8 % 0.8 % 0.8 % 0.8 % Adjusted operations and support expense as a percent of GTV 0.8 % 0.8 % 0.7 % 0.8 % 0.8 % Research and development expense $ 115 $ 185 $ 149 $ 155 $ 144 Depreciation and amortization expense (1) (1) (2) (1) (2) Stock-based compensation expense (1) 21 (75) (45) (45) (34) Payroll taxes related to stock-based compensation (2) (8) (3) (2) (2) (6) Restructuring charges (3) (9) — — — — Adjusted research and development expense $ 118 $ 106 $ 100 $ 107 $ 102 Research and development expense as a percent of GTV 1.4 % 2.3 % 1.8 % 1.8 % 1.6 % Adjusted research and development expense as a percent of GTV 1.4 % 1.3 % 1.2 % 1.2 % 1.1 % Sales and marketing expense $ 184 $ 203 $ 213 $ 208 $ 216 Depreciation and amortization expense (2) (2) (2) (2) (2) Stock-based compensation expense (1) (9) (23) (14) (16) (13) Payroll taxes related to stock-based compensation (2) (2) (1) (1) — (1) Restructuring charges (3) (3) — — — — Adjusted sales and marketing expense $ 168 $ 177 $ 196 $ 190 $ 200 Sales and marketing expense as a percent of GTV 2.2 % 2.5 % 2.6 % 2.4 % 2.4 % Adjusted sales and marketing expense as a percent of GTV 2.0 % 2.2 % 2.4 % 2.2 % 2.2 % 20
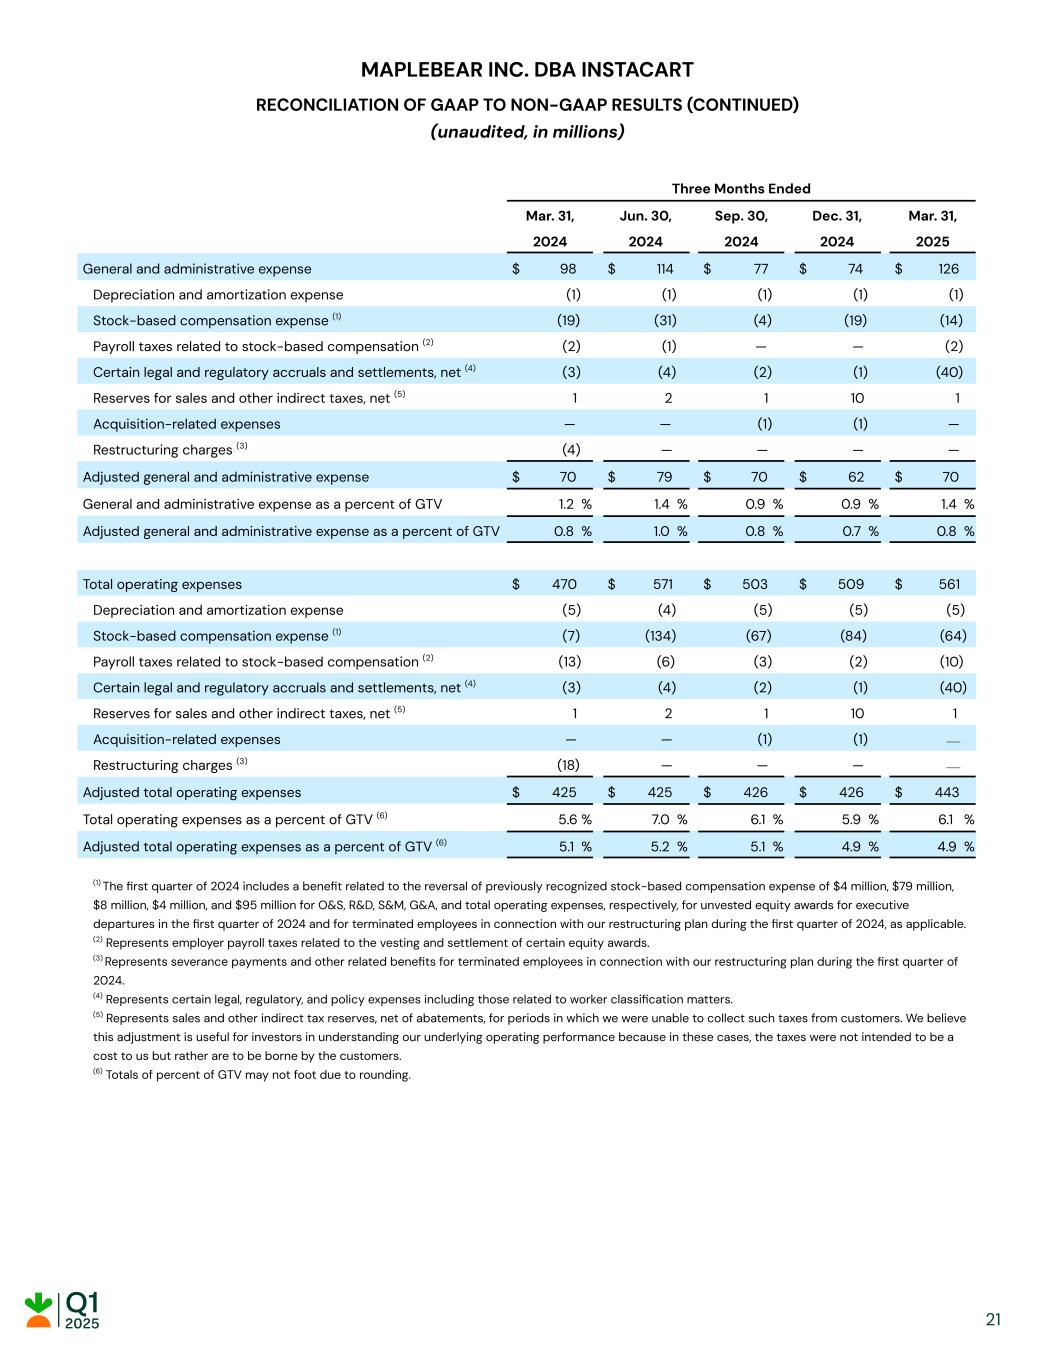
MAPLEBEAR INC. DBA INSTACART RECONCILIATION OF GAAP TO NON-GAAP RESULTS (CONTINUED) (unaudited, in millions) Three Months Ended Mar. 31, Jun. 30, Sep. 30, Dec. 31, Mar. 31, 2024 2024 2024 2024 2025 General and administrative expense $ 98 $ 114 $ 77 $ 74 $ 126 Depreciation and amortization expense (1) (1) (1) (1) (1) Stock-based compensation expense (1) (19) (31) (4) (19) (14) Payroll taxes related to stock-based compensation (2) (2) (1) — — (2) Certain legal and regulatory accruals and settlements, net (4) (3) (4) (2) (1) (40) Reserves for sales and other indirect taxes, net (5) 1 2 1 10 1 Acquisition-related expenses — — (1) (1) — Restructuring charges (3) (4) — — — — Adjusted general and administrative expense $ 70 $ 79 $ 70 $ 62 $ 70 General and administrative expense as a percent of GTV 1.2 % 1.4 % 0.9 % 0.9 % 1.4 % Adjusted general and administrative expense as a percent of GTV 0.8 % 1.0 % 0.8 % 0.7 % 0.8 % Total operating expenses $ 470 $ 571 $ 503 $ 509 $ 561 Depreciation and amortization expense (5) (4) (5) (5) (5) Stock-based compensation expense (1) (7) (134) (67) (84) (64) Payroll taxes related to stock-based compensation (2) (13) (6) (3) (2) (10) Certain legal and regulatory accruals and settlements, net (4) (3) (4) (2) (1) (40) Reserves for sales and other indirect taxes, net (5) 1 2 1 10 1 Acquisition-related expenses — — (1) (1) — Restructuring charges (3) (18) — — — — Adjusted total operating expenses $ 425 $ 425 $ 426 $ 426 $ 443 Total operating expenses as a percent of GTV (6) 5.6 % 7.0 % 6.1 % 5.9 % 6.1 % Adjusted total operating expenses as a percent of GTV (6) 5.1 % 5.2 % 5.1 % 4.9 % 4.9 % (1) The first quarter of 2024 includes a benefit related to the reversal of previously recognized stock-based compensation expense of $4 million, $79 million, $8 million, $4 million, and $95 million for O&S, R&D, S&M, G&A, and total operating expenses, respectively, for unvested equity awards for executive departures in the first quarter of 2024 and for terminated employees in connection with our restructuring plan during the first quarter of 2024, as applicable. (2) Represents employer payroll taxes related to the vesting and settlement of certain equity awards. (3) Represents severance payments and other related benefits for terminated employees in connection with our restructuring plan during the first quarter of 2024. (4) Represents certain legal, regulatory, and policy expenses including those related to worker classification matters. (5) Represents sales and other indirect tax reserves, net of abatements, for periods in which we were unable to collect such taxes from customers. We believe this adjustment is useful for investors in understanding our underlying operating performance because in these cases, the taxes were not intended to be a cost to us but rather are to be borne by the customers. (6) Totals of percent of GTV may not foot due to rounding. 21