
0
Dear Shareholders, We delivered another strong quarter, reinforcing the essential role we play in helping families save time, money, and effort putting food on the table. In Q2, we grew orders by 17% year-over-year to 82.7 million and increased GTV by 11% year-over-year to $9,081 million. We also delivered net income of $116 million and Adjusted EBITDA of $262 million. Our strategy is working: we’re accelerating online grocery adoption by creating better customer experiences, deepening retailer partnerships, and leveraging our data in innovative ways — all while expanding profitability. Our unique scale and advantages allow us to build grocery technologies with partners in ways that competitors simply can’t match, and have us well-positioned to lead as AI transforms how people make decisions and manage their daily lives. I’m incredibly excited by how our business is operating today and the momentum we’re building for the future. Delivering Smarter, Faster, and More Personalized Grocery Experiences Personalization is one of the biggest advantages of online grocery, and advancements in AI are helping us take our 13 years of proprietary data and nearly 1.5 billion lifetime orders even further. With our new AI-powered Smart Shop personalization foundation, we’ve created “virtual aisles” tailored to specific household needs like Baby, Cat, or Dog, and dietary needs like Organic and Gluten-Free. Customers have been quick to purchase items from these new surfaces, demonstrating how we’re making shopping simpler and more convenient. We also launched a new personalized replacement model that incorporates dietary needs and past preferences to deliver more accurate suggestions and further improve satisfaction rates. This enhanced model is already boosting our “perfect order fill rate” — meaning we found every item a customer requested or made a successful replacement. While continuously improving quality, we’re also delivering industry-leading speed and driving greater fulfillment efficiencies. Priority, our fastest delivery option, averages under 60 minutes, with nearly a quarter of typical priority orders completed in 30 minutes or less. Historically, we didn’t batch priority orders to maintain speed, but with even greater order density and over 50% of shoppers at or within a mile of the store when orders are placed, we now batch 25% of priority orders without compromising overall speed or quality. Recently, we also expanded priority delivery to enterprise partners like Costco and Kroger, which is already helping them drive faster growth. Priority is just one example of ways we’re continuing to drive operating efficiencies. Over the past four years, we’ve increased the average number of orders per batch by a double-digit percentage, and reduced the average time it takes our shoppers to fulfill orders by approximately 25% – driving meaningful cost savings. These critical advantages allow us to reinvest in growth and in making our service even more affordable for customers, while continuing to generate over $8 of gross profit per order in Q2. Making Online Grocery More Affordable Grocery prices continue to be top of mind for consumers, and we know that working with retailers to offer their customers affordable prices is key to helping them drive faster growth and accelerate online grocery adoption. On our platform, retailers that price items at in-store parity consistently grow faster on average than those with markups. This insight is encouraging our partners to embrace more competitive pricing strategies. Retailers like Heritage Grocers Group, Lowe’s Home Improvement, and Schnucks moved to same-as-in-store pricing earlier this year, while Pattison Food Group, a key retailer in Western Canada, recently launched on our marketplace with in-store pricing. 1
And price parity is no longer black and white as we work with retailers on more sophisticated and flexible strategies. Walmart Canada recently reduced their markup on our marketplace, and Costco’s markup was also lowered on sameday.costco.com and sameday.costco.ca. We’re also seeing strong adoption of technologies we’ve built that help retailers deliver lower prices to customers or on select items without fully committing to price parity. For example, we’ve now launched EBT SNAP, loyalty, and flyers with the majority of our top 30 retailers, including our latest loyalty integration for Club Publix members. Amongst our top 30 retailers with loyalty launched, we’re seeing nearly two-thirds of orders being loyalty-linked. This is a win for customers, because most loyalty programs provide discounts, unique savings, or other benefits, and it’s a win for retailers, because loyalty orders on average have larger basket sizes and more items per order. Powering Retailer Growth Through Our Technology Our technology gives retailers an edge they simply couldn’t build on their own. The investments we made in 2024 to unify our marketplace and enterprise Storefront tech stacks, along with leveraging AI to streamline onboarding, have allowed us to more than double the pace of our launches. In the first half of 2025 alone, we’ve launched over 40 net-new retailer sites, including retailers like Costco Business Centre in Canada, Kohl’s Food Stores, and Ray’s Food Place. This compares to over 30 launches in all of 2024 and just over a dozen launches in 2023. We’re also deepening partnerships with long-standing partners with more advanced integrations and bespoke offers. Publix, for example, recently embedded our Storefront technology directly into its app, unlocking new incremental growth opportunities beyond the Publix Delivery & Curbside app that we’ve partnered together on for years. We also worked closely with Costco to provide their tens of millions of executive members across North America a $10 monthly credit for orders over $150. Creating this custom benefit for their most valuable and dedicated customer segment is already encouraging new and existing members to place larger orders. Beyond online growth, we’re supporting retailers across their entire footprint. In Q2, we launched new deployments of our AI-powered Caper Carts at Allegiance Retail Services, new pilots with Sprouts Farmers Market and Wegmans Food Markets, and continued to expand with existing partners like Wakefern. Sprouts, in particular, has leaned into Instacart’s full ecosystem – leveraging tools like Storefront Pro, Carrot Ads, and FoodStorm, as well as launching services like Alcohol, EBT SNAP, Flyers, Pickup, and Virtual Convenience. Thanks to these deep integrations, Sprouts is seeing the strong majority of its online growth driven by Instacart, based on third-party data, and is outpacing the growth of our overall platform. Our Data Advantage Is More Valuable Than Ever The breadth and depth of our integrations across our marketplace, owned and operated e-commerce sites, and in-store make Instacart an at-scale, one-stop shop for brands to advertise. We now have over 7,500 active brand partners and continually make it easier for them to run impactful campaigns. In Q2, we introduced new tools like AI-driven, one-click recommendations to help advertisers improve performance. Brands also see value in leveraging our first-party purchase data to reach incremental, high-intent audiences beyond our platform. To support this, we expanded our off-platform partners to include Pinterest and deepened our partnership with The Trade Desk by becoming the first U.S. retail media network to integrate self-service audience building and measurement directly into their platform. 2
We’re also going beyond leveraging our audience data for ads and are now productizing our consumer insights data. We launched our new Consumer Insights Portal that provides early subscribers like Advantage Solutions, Applegate, Coca-Cola Canada Bottling, and more with real-time insights based on first-party, digital-first data across our marketplace. By productizing our data in this way, we’re offering more value to our brand partners, creating new revenue opportunities, and building a durable advantage for an AI-driven future where companies with the best data will win. Looking Ahead As I reflect on where Instacart stands today, I couldn't be prouder of all that we’ve achieved and the momentum we’re carrying into the future. In competitive and volatile macro conditions, we’ve consistently grown our business, expanded profits, and built a strong foundation for sustainable long-term growth. What sets Instacart apart as the clear category leader among digital-first players is not just our unique advantages but our commitment to innovation and building the future of grocery with our partners. We have an exceptional team operating from a position of strength and a clear strategy that's delivering results. I couldn’t be more confident that Chris Rogers is the right leader for Instacart’s next chapter. He has played a pivotal role in everything we’ve achieved over the past few years, and I’m certain that everything he brings as Instacart’s next CEO will only accelerate our momentum. As Chair of the Board — and a more than daily Instacart customer with 469 orders in the past year — I look forward to supporting him and the entire team as they continue to execute on our vision. The opportunity ahead is enormous, and we're still only just beginning. It’s been an incredible privilege for me to be on this journey with you. Fidji Simo Chief Executive Officer 3
Business Updates Consumers We’re committed to delivering an exceptional customer experience for the millions of people who use Instacart to feed their families. We’re also finding more ways to make Instacart as easy to use as possible and create even more value for our customers. ● Continued to make Instacart more affordable by growing the list of retailers offering same-as-in-store pricing on Instacart Marketplace, which now includes Pattison Food Group. We also added flyers, our digital circular, for Stater Bros and Walmart Canada stores on our platform. ● Continued to drive further adoption and habituation with Restaurants. We also launched a Stamp Card, which encourages customers to place restaurant orders multiple times within 21 days to earn a coupon. ● Launched Instacart Business features like administrative controls and tax exemption directly on Woodman’s e-commerce website, which is powered by our Storefront Pro technology. We also introduced B2C Referrals, enabling businesses to refer consumers to Instacart and earn credits toward future orders. ● Launched our Summer Like It’s 1999 Campaign, designed to drive cultural relevance and affordability for families during the summer months. Partnered with nine iconic CPG brands – like Capri Sun, Kool-Aid, and Lunchables – which are helping retailers offer 1999 pricing. ● Partnered with Peacock in a first-of-its-kind integration with Love Island USA to highlight our Instacart+ Peacock benefit and drive orders through NBC’s Virtual Concessions ad solution, where viewers can seamlessly order featured CPG snacks and beverages to their door in as fast as 60 minutes. Retailers We’re continuing to deepen our integrations with retail partners on Instacart Marketplace and extend our enterprise and omnichannel technology and tools. ● Expanded our Canadian retail presence with Instacart Marketplace launches of Costco Business Centres and Pattison Food Group banners like Price Smart, Quality Foods, Save on Foods, and Urban Fare. ● Launched over 40 net-new retailers in the first half of 2025 on Storefront or Storefront Pro, our white-label e-commerce solutions, to help retailers expand their e-commerce presence, including Costco Business Centres in Canada, Kohl's Food Stores, and Ray’s Food Place. This compares to over 30 launches in all of 2024 and just over a dozen launches in 2023. ● Worked with Publix to embed our Storefront technology directly into its app, unlocking new incremental growth opportunities beyond the Publix Delivery & Curbside app that we’ve partnered on for years. We also launched a loyalty integration to facilitate Club Publix perks for linked customers. ● Launched a new perk for Costco’s Executive Members: a $10 monthly credit on a Costco order of $150 or more, valid on a delivery order from sameday.costco.com, sameday.costco.ca, or Costco via Instacart. Early data shows that this benefit is encouraging both new and existing members to place larger orders. ● Launched Caper Carts with Allegiance Retail Services, new pilots with Sprouts and Wegmans, and continued to expand with Wakefern banners – ShopRite and Price Rite Marketplace. We also introduced a lower tray for Caper Carts to help customers with bulky purchases like cases of water, soda, or pet food. 4
● More than doubled the number of stores using FoodStorm, our catering software, to over 2,800 stores across North America since the end of 2024. This includes launches at retailers such as The Fresh Market and Ahold Delhaize USA banners The Giant Company and Martin’s Food. ● Launched Carrot Tags, our electronic shelf label software, across The Fresh Market’s entire network of stores – our fourth partner to deploy Carrot Tags chainwide – in addition to select Davis Food & Drug and Stewart’s locations. Brands With our unique data, insights, and partnerships, the Instacart Ads ecosystem is a one-stop advertising platform, connecting brands with high-intent, incremental customers at scale. ● Launched a new off-platform advertising partnership with Pinterest, enabling select brands advertising on Pinterest to leverage Instacart’s rich first-party data to reach high-intent shoppers more effectively. Soon, Pinterest ads will also be instantly shoppable, letting users purchase on Instacart in a few clicks. ● Expanded our partnership with The Trade Desk, becoming the first U.S. retail media network to integrate its grocery selection directly onto The Trade Desk platform for streamlined self-service use cases. Eligible advertisers and agencies can now build first-party custom audiences based on specific product criteria for programmatic campaigns and more easily measure business outcomes with closed-loop measurement. ● Launched our Consumer Insights Portal, a self-serve platform designed to expand access to Instacart data for customers. Early subscribers like Advantage Solutions, Applegate, and Coca-Cola Canada Bottling are leveraging this new tool to understand basket building, substitution preferences, trending search terms, and more real-time category insights based on first-party, digital-first data across Instacart Marketplace. ● Introduced our AI-driven ads recommendation engine, which proactively helps brands identify how they can improve their campaigns. This includes recommendations for campaign settings to optimize performance as well as flags for issues like products with missing images — helping to improve the Instacart consumer experience as well. ● Introduced new solutions powered by machine learning to maximize results for Display Ads. Optimized performance, which automatically matches ads with the right context and customer intent, is currently in pilot and already being utilized by over 10% of display spend. Additionally, our new sales velocity objective helps brands accelerate awareness and sales for new-to-shelf products, delivering a 6.5x lift in attributed sales for those products during early testing. ● Expanded to over 240 Carrot Ads partners who leverage our ad tech and the scale of our demand to power their retail media networks. We recently launched with Heritage Grocers Group and signed Bottlecapps, an industry leader in white-label and marketplace technology within the beer, wine, and spirits verticals. ● Released new measurement case studies with Belgian Boys, Chomps, Danone, Good Peeps, and Kettle & Fire, demonstrating the effectiveness of Instacart Ads, both on- and off-platform. ● Launched a new co-marketing campaign with Coors Light that turns shopping on the Instacart App into an opportunity for customers to win unique prizes. 5
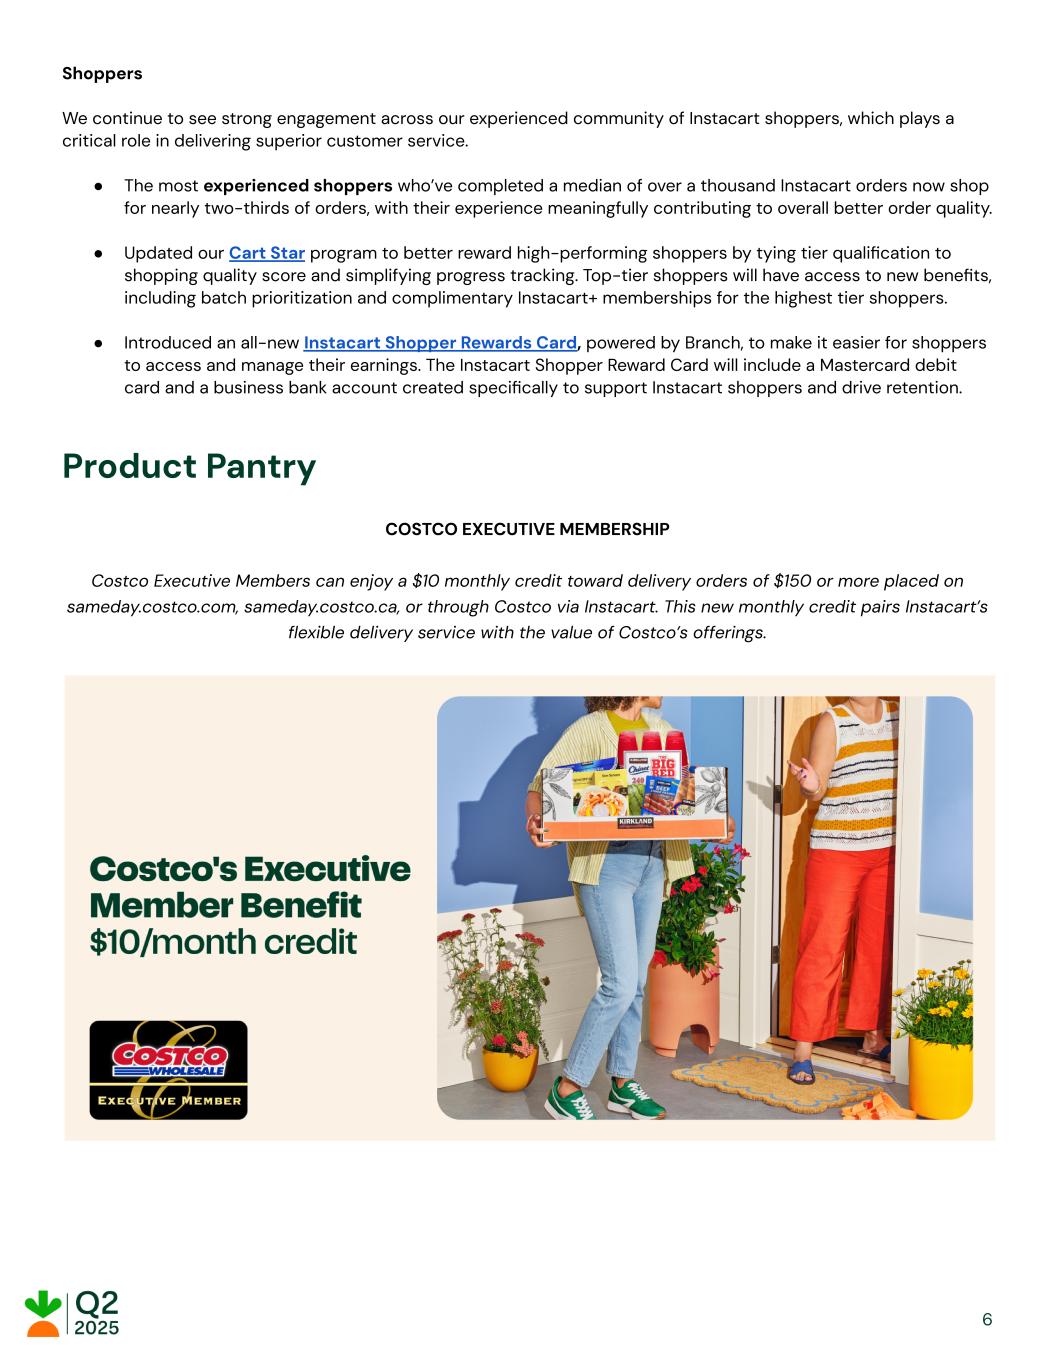
Shoppers We continue to see strong engagement across our experienced community of Instacart shoppers, which plays a critical role in delivering superior customer service. ● The most experienced shoppers who’ve completed a median of over a thousand Instacart orders now shop for nearly two-thirds of orders, with their experience meaningfully contributing to overall better order quality. ● Updated our Cart Star program to better reward high-performing shoppers by tying tier qualification to shopping quality score and simplifying progress tracking. Top-tier shoppers will have access to new benefits, including batch prioritization and complimentary Instacart+ memberships for the highest tier shoppers. ● Introduced an all-new Instacart Shopper Rewards Card, powered by Branch, to make it easier for shoppers to access and manage their earnings. The Instacart Shopper Reward Card will include a Mastercard debit card and a business bank account created specifically to support Instacart shoppers and drive retention. Product Pantry COSTCO EXECUTIVE MEMBERSHIP Costco Executive Members can enjoy a $10 monthly credit toward delivery orders of $150 or more placed on sameday.costco.com, sameday.costco.ca, or through Costco via Instacart. This new monthly credit pairs Instacart’s flexible delivery service with the value of Costco’s offerings. 6
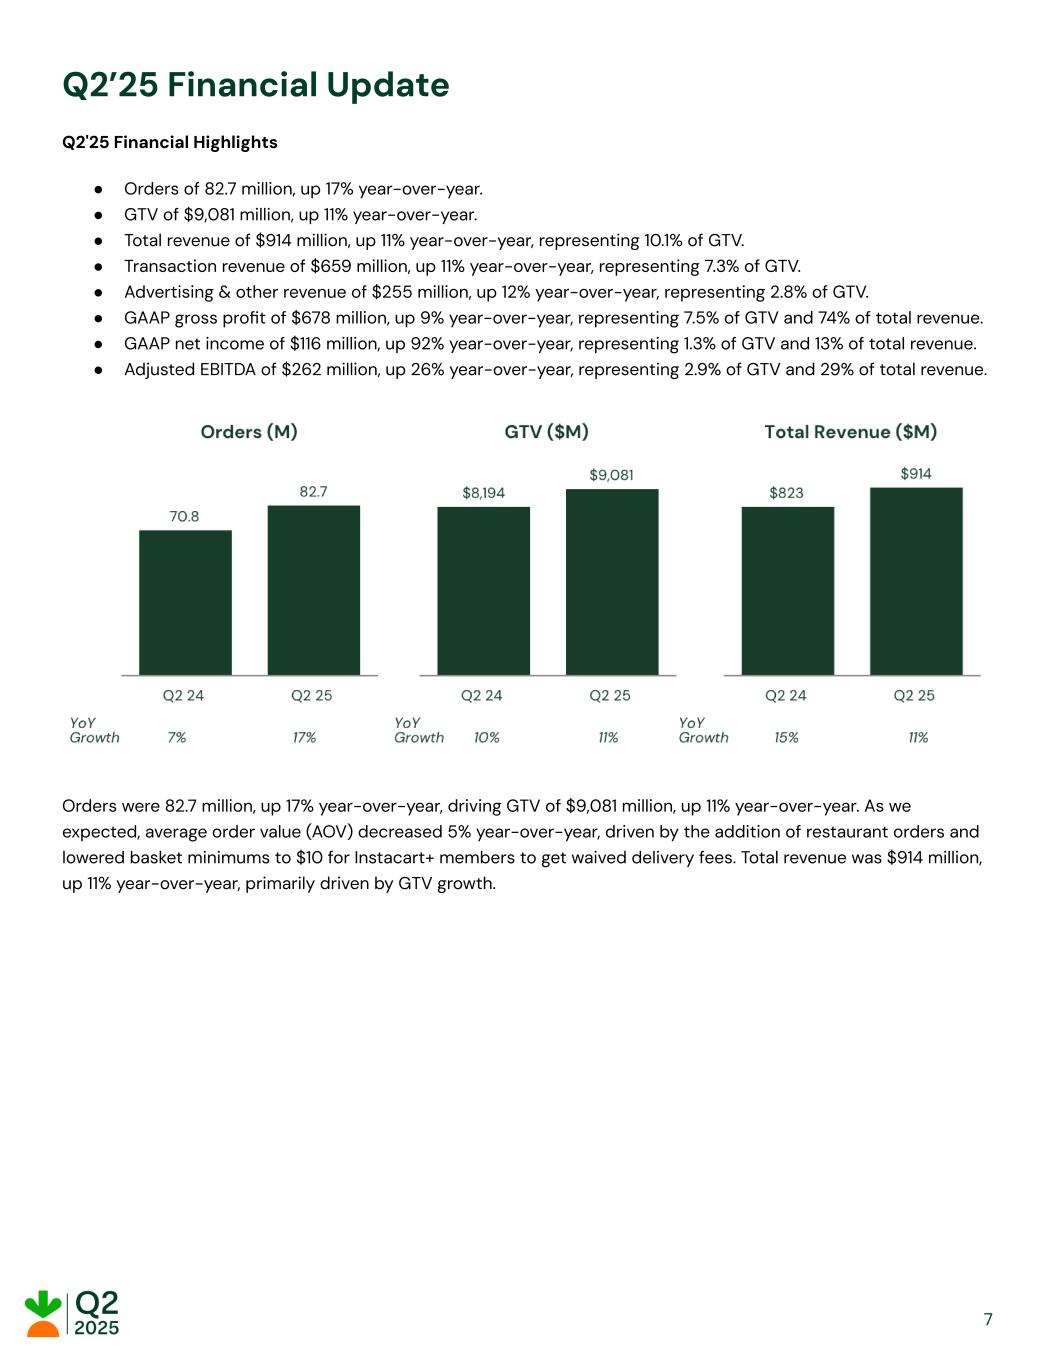
Q2’25 Financial Update Q2'25 Financial Highlights ● Orders of 82.7 million, up 17% year-over-year. ● GTV of $9,081 million, up 11% year-over-year. ● Total revenue of $914 million, up 11% year-over-year, representing 10.1% of GTV. ● Transaction revenue of $659 million, up 11% year-over-year, representing 7.3% of GTV. ● Advertising & other revenue of $255 million, up 12% year-over-year, representing 2.8% of GTV. ● GAAP gross profit of $678 million, up 9% year-over-year, representing 7.5% of GTV and 74% of total revenue. ● GAAP net income of $116 million, up 92% year-over-year, representing 1.3% of GTV and 13% of total revenue. ● Adjusted EBITDA of $262 million, up 26% year-over-year, representing 2.9% of GTV and 29% of total revenue. Orders were 82.7 million, up 17% year-over-year, driving GTV of $9,081 million, up 11% year-over-year. As we expected, average order value (AOV) decreased 5% year-over-year, driven by the addition of restaurant orders and lowered basket minimums to $10 for Instacart+ members to get waived delivery fees. Total revenue was $914 million, up 11% year-over-year, primarily driven by GTV growth. 7
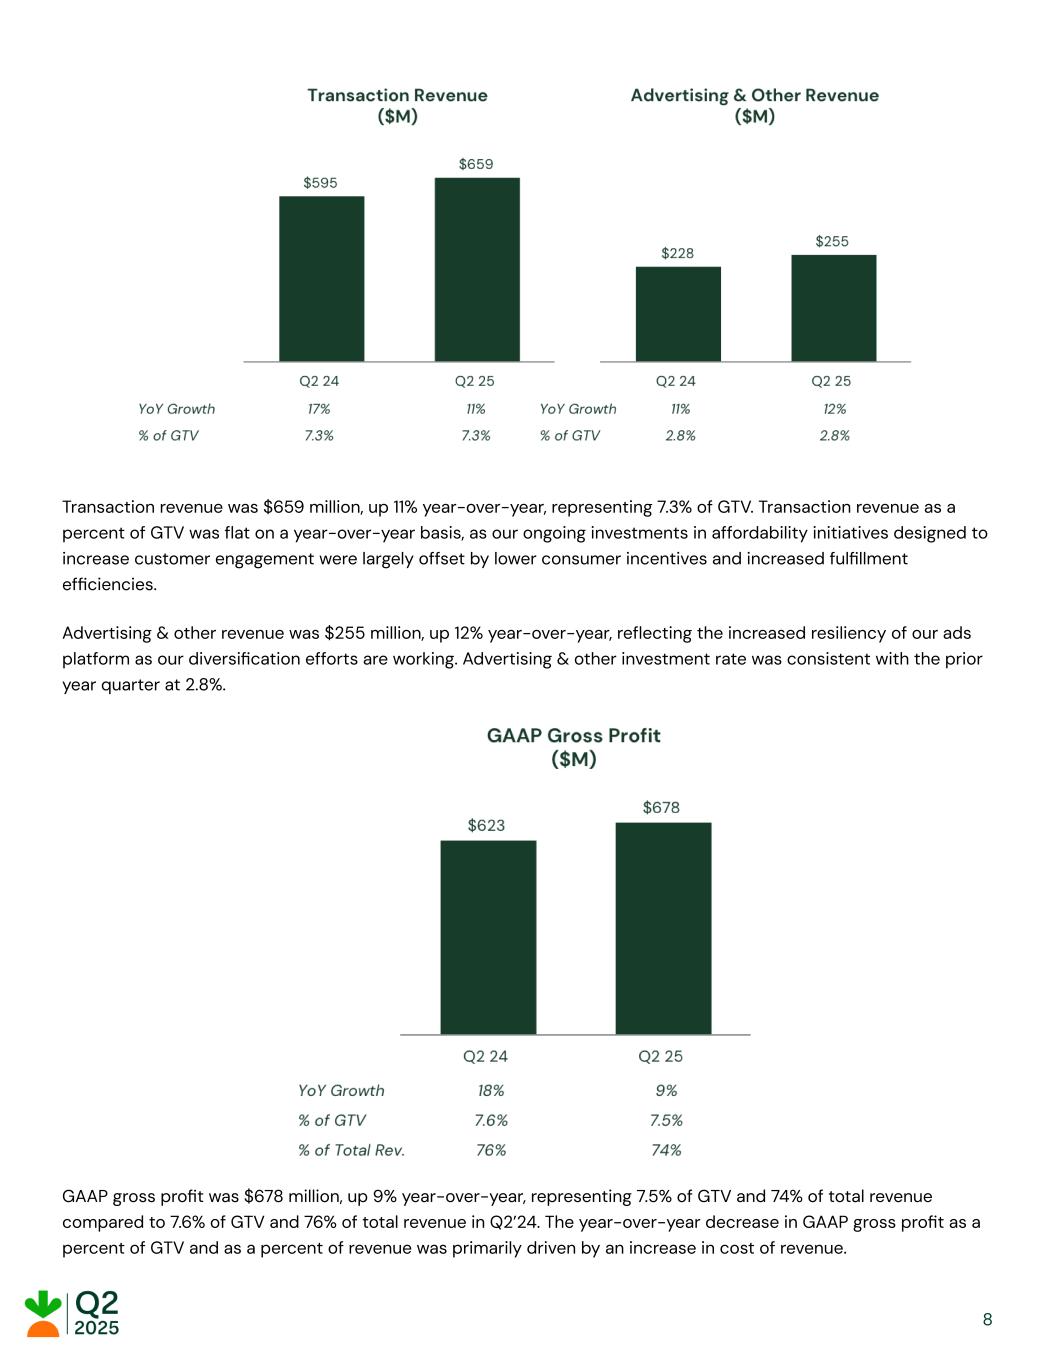
Transaction revenue was $659 million, up 11% year-over-year, representing 7.3% of GTV. Transaction revenue as a percent of GTV was flat on a year-over-year basis, as our ongoing investments in affordability initiatives designed to increase customer engagement were largely offset by lower consumer incentives and increased fulfillment efficiencies. Advertising & other revenue was $255 million, up 12% year-over-year, reflecting the increased resiliency of our ads platform as our diversification efforts are working. Advertising & other investment rate was consistent with the prior year quarter at 2.8%. GAAP gross profit was $678 million, up 9% year-over-year, representing 7.5% of GTV and 74% of total revenue compared to 7.6% of GTV and 76% of total revenue in Q2’24. The year-over-year decrease in GAAP gross profit as a percent of GTV and as a percent of revenue was primarily driven by an increase in cost of revenue. 8
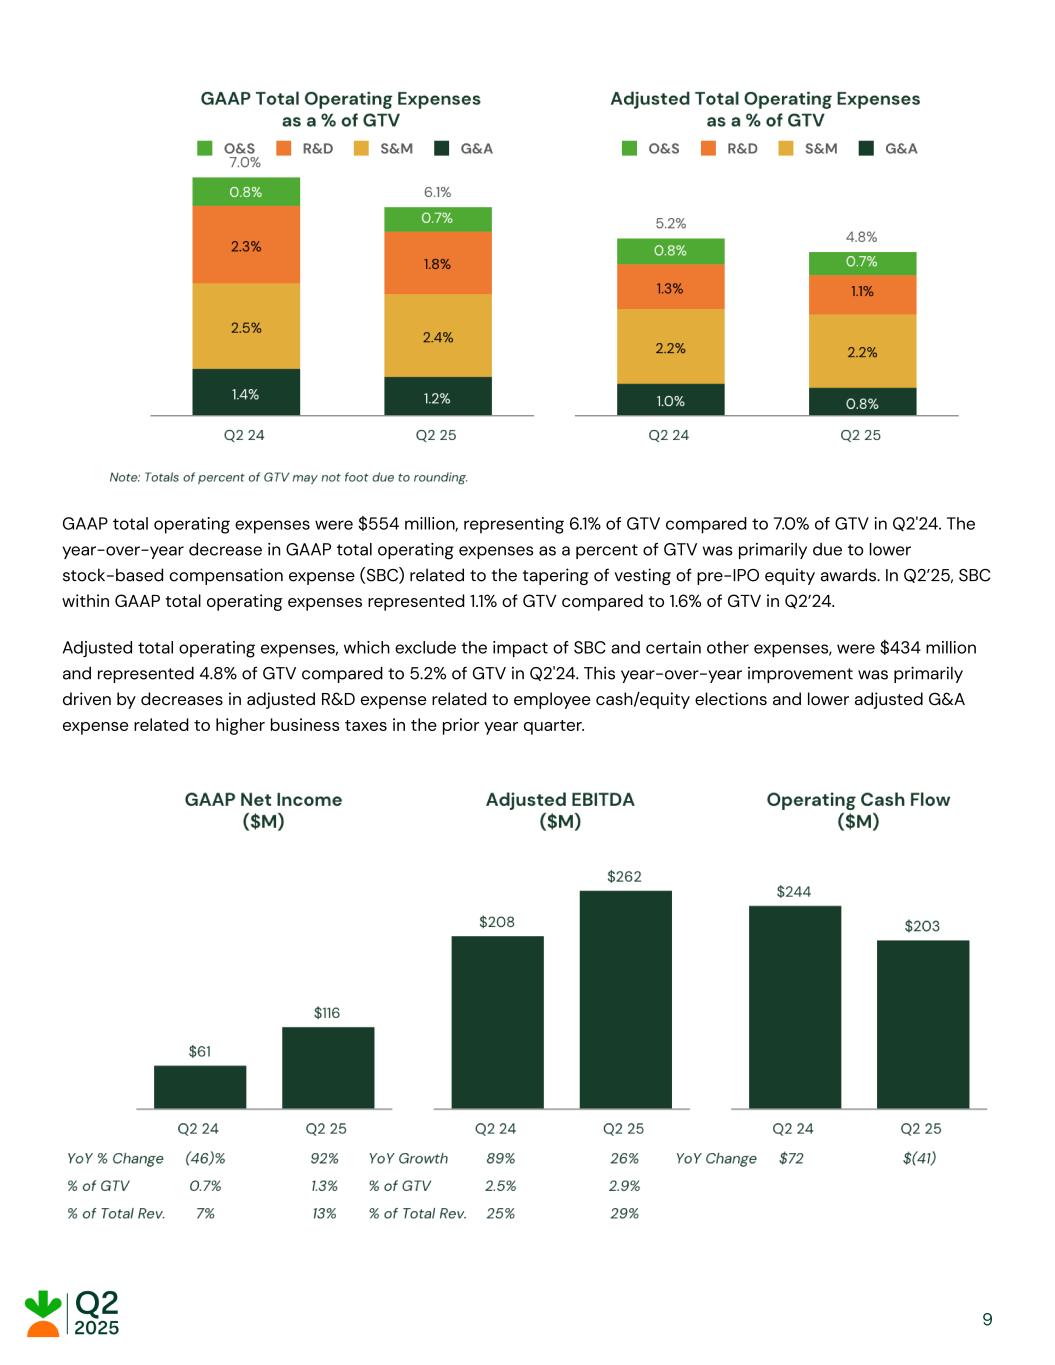
GAAP total operating expenses were $554 million, representing 6.1% of GTV compared to 7.0% of GTV in Q2'24. The year-over-year decrease in GAAP total operating expenses as a percent of GTV was primarily due to lower stock-based compensation expense (SBC) related to the tapering of vesting of pre-IPO equity awards. In Q2’25, SBC within GAAP total operating expenses represented 1.1% of GTV compared to 1.6% of GTV in Q2’24. Adjusted total operating expenses, which exclude the impact of SBC and certain other expenses, were $434 million and represented 4.8% of GTV compared to 5.2% of GTV in Q2'24. This year-over-year improvement was primarily driven by decreases in adjusted R&D expense related to employee cash/equity elections and lower adjusted G&A expense related to higher business taxes in the prior year quarter. 9
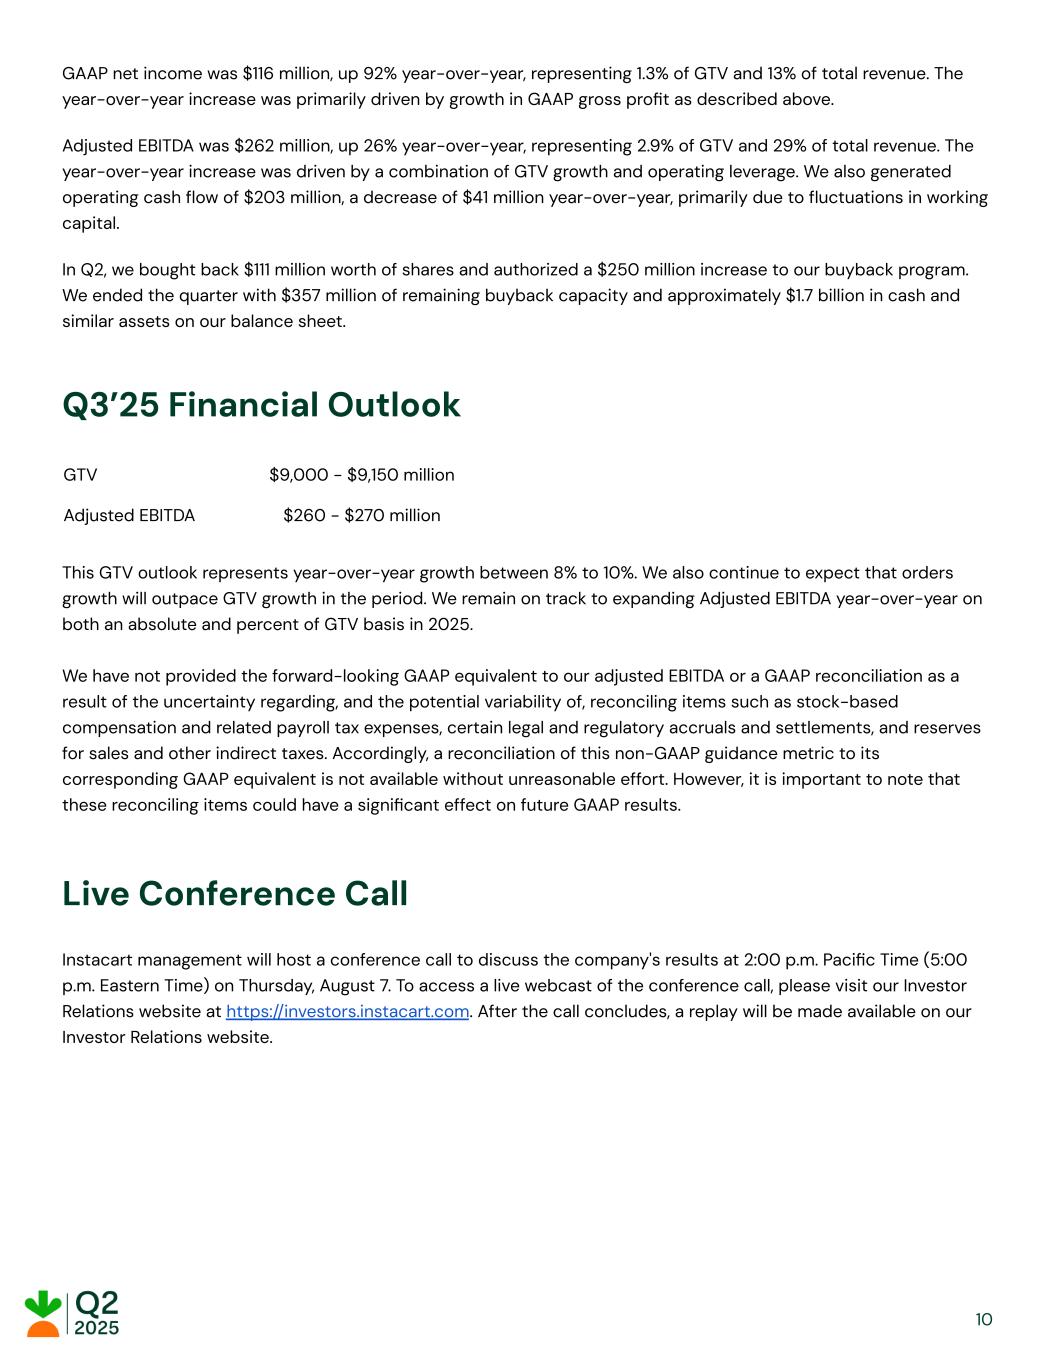
GAAP net income was $116 million, up 92% year-over-year, representing 1.3% of GTV and 13% of total revenue. The year-over-year increase was primarily driven by growth in GAAP gross profit as described above. Adjusted EBITDA was $262 million, up 26% year-over-year, representing 2.9% of GTV and 29% of total revenue. The year-over-year increase was driven by a combination of GTV growth and operating leverage. We also generated operating cash flow of $203 million, a decrease of $41 million year-over-year, primarily due to fluctuations in working capital. In Q2, we bought back $111 million worth of shares and authorized a $250 million increase to our buyback program. We ended the quarter with $357 million of remaining buyback capacity and approximately $1.7 billion in cash and similar assets on our balance sheet. Q3’25 Financial Outlook GTV $9,000 - $9,150 million Adjusted EBITDA $260 - $270 million This GTV outlook represents year-over-year growth between 8% to 10%. We also continue to expect that orders growth will outpace GTV growth in the period. We remain on track to expanding Adjusted EBITDA year-over-year on both an absolute and percent of GTV basis in 2025. We have not provided the forward-looking GAAP equivalent to our adjusted EBITDA or a GAAP reconciliation as a result of the uncertainty regarding, and the potential variability of, reconciling items such as stock-based compensation and related payroll tax expenses, certain legal and regulatory accruals and settlements, and reserves for sales and other indirect taxes. Accordingly, a reconciliation of this non-GAAP guidance metric to its corresponding GAAP equivalent is not available without unreasonable effort. However, it is important to note that these reconciling items could have a significant effect on future GAAP results. Live Conference Call Instacart management will host a conference call to discuss the company's results at 2:00 p.m. Pacific Time (5:00 p.m. Eastern Time) on Thursday, August 7. To access a live webcast of the conference call, please visit our Investor Relations website at https://investors.instacart.com. After the call concludes, a replay will be made available on our Investor Relations website. 10
Forward-Looking Statements This letter and the accompanying oral presentation contain forward-looking statements within the meaning of the Private Securities Litigation Reform Act of 1995. All statements other than statements of historical fact could be deemed forward-looking, including without limitation statements regarding our financial outlook, including GTV, adjusted EBITDA, transaction revenue, advertising and other revenue, SBC, and orders, trends in our business and industry, impacts from macroeconomic conditions, our plans and expectations regarding growth, products, features, and partnerships, including expansion of our capabilities, services, and solutions, the expected benefits of AI, our strategic priorities, investments, and initiatives, our ability to drive sales and growth for our partners, our expectations regarding our upcoming executive transition, and the level of activity under our share repurchase program. In some cases, you can identify forward-looking statements because they contain words such as “anticipate,” “believe,” “contemplate,” “continue,” “could,” “estimate,” “expect,” “intend,” “may,” “plan,” “potential,” “predict,” “project,” “should,” “target,” “toward,” “will,” or “would,” or the negative of these words or other similar terms or expressions. The forward-looking statements contained in this letter and the accompanying oral presentation are subject to known and unknown risks, uncertainties, assumptions, and other factors that may cause actual results or outcomes to be materially different from any future results or outcomes expressed or implied by the forward-looking statements. These risks, uncertainties, assumptions, and other factors include, but are not limited to, those related to anticipated trends, growth rates, and challenges in our business, industry, and the markets in which we operate; our ability to attract and increase engagement of customers and shoppers; our ability to effectively manage the increasing scale, scope, and complexity of our business; our ability to operate our business and effectively manage our growth and margins under evolving and uncertain macroeconomic conditions; our ability to achieve or maintain profitability and profitable growth; our ability to maintain and expand our relationships with retailers and advertisers; competition in our markets; our ability to expand our existing and develop new products, offerings, features, and use cases, bring them to market in a timely manner, and whether retailers, customers, brands, shoppers, or other partners launch or utilize such products, offerings, features, and use cases in the manner and timing that we expect; our ability to continue to grow across our current markets and expand into new markets; our estimated market opportunity; the impact on our business of macroeconomic and industry trends, including tariffs or other trade restrictions, inflation, elevated interest rates, supply chain challenges, cessation of or changes to government aid programs, heightened recession risk, market volatility, and geopolitical conflicts; legal and governmental proceedings; new or changes to laws and regulations and other regulatory matters and developments, particularly with respect to the classification of shoppers on our platform; the occurrence of any security incidents or disruptions of service on our platform or technology offerings; our reliance on key personnel and our ability to attract, integrate, and retain management and skilled personnel; our ability to identify, complete, and achieve anticipated benefits from acquisitions, strategic investments, collaborations, commercial arrangements, alliances, or partnerships; our ability to successfully integrate other businesses or our partners’ technologies that we acquire and realize the intended benefits of those acquisitions; the impact of weather patterns; and our reliance on third-party devices, operating systems, applications, and services that we do not control; as well as other risks described from time to time in our filings with the Securities and Exchange Commission (SEC), including in our Quarterly Report on Form 10-Q for the quarter ended March 31, 2025 filed with the SEC on May 8, 2025. 11
You should not rely on forward-looking statements as predictions of future events. We have based the forward-looking statements contained in this letter and the accompanying oral presentation primarily on information available to us as of the date of this letter and the accompanying oral presentation and our current expectations and projections about future events and trends that we believe may affect our business, financial condition, and results of operations. While we believe such information provides a reasonable basis for these statements, such information may be limited or incomplete. Our statements should not be read to indicate that we have conducted an exhaustive inquiry into, or review of, all relevant information. These statements are inherently uncertain, and investors are cautioned not to unduly rely on these statements. Moreover, we operate in a very competitive and rapidly changing environment, and new risks may emerge from time to time. It is not possible for us to predict all risks, nor can we assess the impact of all factors on our business or the extent to which any factor, or combination of factors, may cause actual results or outcomes to differ materially from those contained in any forward-looking statements we may make. Except as required by law, we undertake no obligation, and do not intend, to update these forward-looking statements. Key Business Metrics We use the following key business metrics to help us evaluate our business, identify trends affecting our performance, formulate business plans, and make strategic decisions. • Gross Transaction Value (GTV): We define GTV as the value of the products sold through Instacart, including applicable taxes, deposits and other local fees, customer tips, which go directly to shoppers, customer fees, which include flat subscription fees related to Instacart+ that are charged monthly or annually, and other fees. GTV consists of orders including those completed through Instacart Marketplace or services that are part of the Instacart Enterprise Platform. We believe that GTV indicates the health of our business, including our ability to drive revenue and profits, and the value we provide to our constituents. • Orders: We define an order as a completed customer transaction to purchase goods for delivery or pickup primarily from a single retailer through Instacart during the period indicated, including those completed through Instacart Marketplace or services that are part of the Instacart Enterprise Platform. We believe that orders are an indicator of the scale and growth of our business as well as the value we bring to our constituents. 12
Non-GAAP Financial Measures We use the following non-GAAP financial measures in conjunction with GAAP measures to assess performance, to inform the preparation of our annual operating budget and quarterly forecasts, to evaluate the effectiveness of our business strategies, and to discuss our business and financial performance with our board of directors. We believe that these non-GAAP financial measures provide useful information to investors about our business and financial performance, enhance their overall understanding of our past performance and future prospects, and allow for greater transparency with respect to metrics used by our management in their financial and operational decision making. We are presenting these non-GAAP financial measures to assist investors in seeing our business and financial performance through the eyes of management, and because we believe that these non-GAAP financial measures provide an additional tool for investors to use in comparing results of operations of our business over multiple periods with other companies in our industry. Adjusted EBITDA, Adjusted EBITDA as a Percent of GTV, and Adjusted EBITDA Margin. We define adjusted EBITDA as net income, adjusted to exclude (i) provision for income taxes, (ii) interest income, (iii) other (income) expense, net, (iv) depreciation and amortization expense, (v) stock-based compensation expense, (vi) payroll taxes related to stock-based compensation expense, (vii) certain legal and regulatory accruals and settlements, net, and (viii) reserves for sales and other indirect taxes, net. We define adjusted EBITDA margin as adjusted EBITDA as a percent of total revenue. We use adjusted EBITDA, adjusted EBITDA as a percent of GTV, and adjusted EBITDA margin because they are important measures upon which our management assesses our operating performance and the operating leverage in our business. Because adjusted EBITDA, adjusted EBITDA as a percent of GTV, and adjusted EBITDA margin facilitate internal comparisons of our historical operating performance, including as an indication of our total revenue growth and operating efficiencies when compared to GTV and total revenue over time, we use them to evaluate the effectiveness of our strategic initiatives and for business planning purposes. We also believe that adjusted EBITDA, adjusted EBITDA as a percent of GTV, and adjusted EBITDA margin, when taken collectively, may be useful to investors because they provide consistency and comparability with past financial performance, so that investors can evaluate our operating efficiencies by excluding certain items that may not be indicative of our business, results of operations, or outlook. In addition, we believe adjusted EBITDA is widely used by investors, securities analysts, rating agencies, and other parties in evaluating companies in our industry as a measure of operational performance. Adjusted EBITDA, adjusted EBITDA as a percent of GTV, and adjusted EBITDA margin should not be considered as alternatives to net income, net income as a percent of GTV, net income as a percent of total revenue, or any other measure of financial performance calculated and presented in accordance with GAAP. There are a number of limitations related to the use of adjusted EBITDA, adjusted EBITDA as a percent of GTV, and adjusted EBITDA margin rather than net income, net income as a percent of GTV, and net income as a percent of total revenue, which are the most directly comparable GAAP measures. Some of these limitations are that each of adjusted EBITDA, adjusted EBITDA as a percent of GTV, and adjusted EBITDA margin: 13
● excludes stock-based compensation expense; ● excludes payroll taxes related to stock-based compensation expense; ● excludes depreciation and amortization expense, and although these are non-cash expenses the assets being depreciated may have to be replaced in the future, increasing our cash requirements; ● does not reflect the positive or adverse adjustments related to the reserve for sales and other indirect taxes or certain legal regulatory accruals and settlements; ● does not reflect interest income which increases cash available to us; ● does not reflect other income or expense that includes unrealized and realized gains and losses on foreign currency exchange; and ● does not reflect provision for or benefit from income taxes that reduces or increases cash available to us. Adjusted Cost of Revenue and Adjusted Cost of Revenue as a Percent of GTV. We define adjusted cost of revenue as cost of revenue excluding depreciation and amortization expense and stock-based compensation expense. Adjusted Operations and Support Expense and Adjusted Operations and Support Expense as a Percent of GTV. We define adjusted operations and support expense as operations and support expense excluding depreciation and amortization expense, stock-based compensation expense, and payroll taxes related to stock-based compensation. Adjusted Research and Development Expense and Adjusted Research and Development Expense as a Percent of GTV. We define adjusted research and development expense as research and development expense excluding depreciation and amortization expense, stock-based compensation expense, and payroll taxes related to stock-based compensation. Adjusted Sales and Marketing Expense and Adjusted Sales and Marketing Expense as a Percent of GTV. We define adjusted sales and marketing expense as sales and marketing expense excluding depreciation and amortization expense, stock-based compensation expense, and payroll taxes related to stock-based compensation. Adjusted General and Administrative Expense and Adjusted General and Administrative Expense as a Percent of GTV. We define adjusted general and administrative expense as general and administrative expense excluding depreciation and amortization expense; stock-based compensation expense; payroll taxes related to stock-based compensation; certain legal and regulatory accruals and settlements, net; reserves for sales and other indirect taxes, net; and acquisition-related expenses. Adjusted Total Operating Expenses and Adjusted Total Operating Expenses as a Percent of GTV. We define adjusted total operating expenses as the sum of adjusted operations and support expense, adjusted research and development expense, adjusted sales and marketing expense, and adjusted general and administrative expense. 14
We exclude depreciation and amortization expense and stock-based compensation expense from our non-GAAP financial measures as these are non-cash in nature. We exclude payroll taxes related to the vesting and settlement of certain equity awards; certain legal and regulatory accruals and settlements, net; reserves for sales and other indirect taxes, net; and acquisition-related expenses as these are not indicative of our operating performance. Non-GAAP financial measures are not meant to be considered in isolation or as a substitute for comparable GAAP financial measures and should be read only in conjunction with our condensed consolidated financial statements prepared in accordance with GAAP. Our presentation of non-GAAP financial measures may not be comparable to similar measures used by other companies, which reduce their usefulness as comparative measures. In addition, other companies may not publish these or similar measures. Further, these measures have certain limitations in that they do not include the impact of certain expenses that are reflected in our consolidated statements of operations. We encourage investors and others to review our business, results of operations, and financial information in their entirety, not to rely on any single financial measure, and carefully consider our results under GAAP, as well as our supplemental non-GAAP information and the reconciliation between these presentations, to more fully understand our business. Please see the tables included at the end of this letter for the reconciliation of GAAP to non-GAAP results. 15
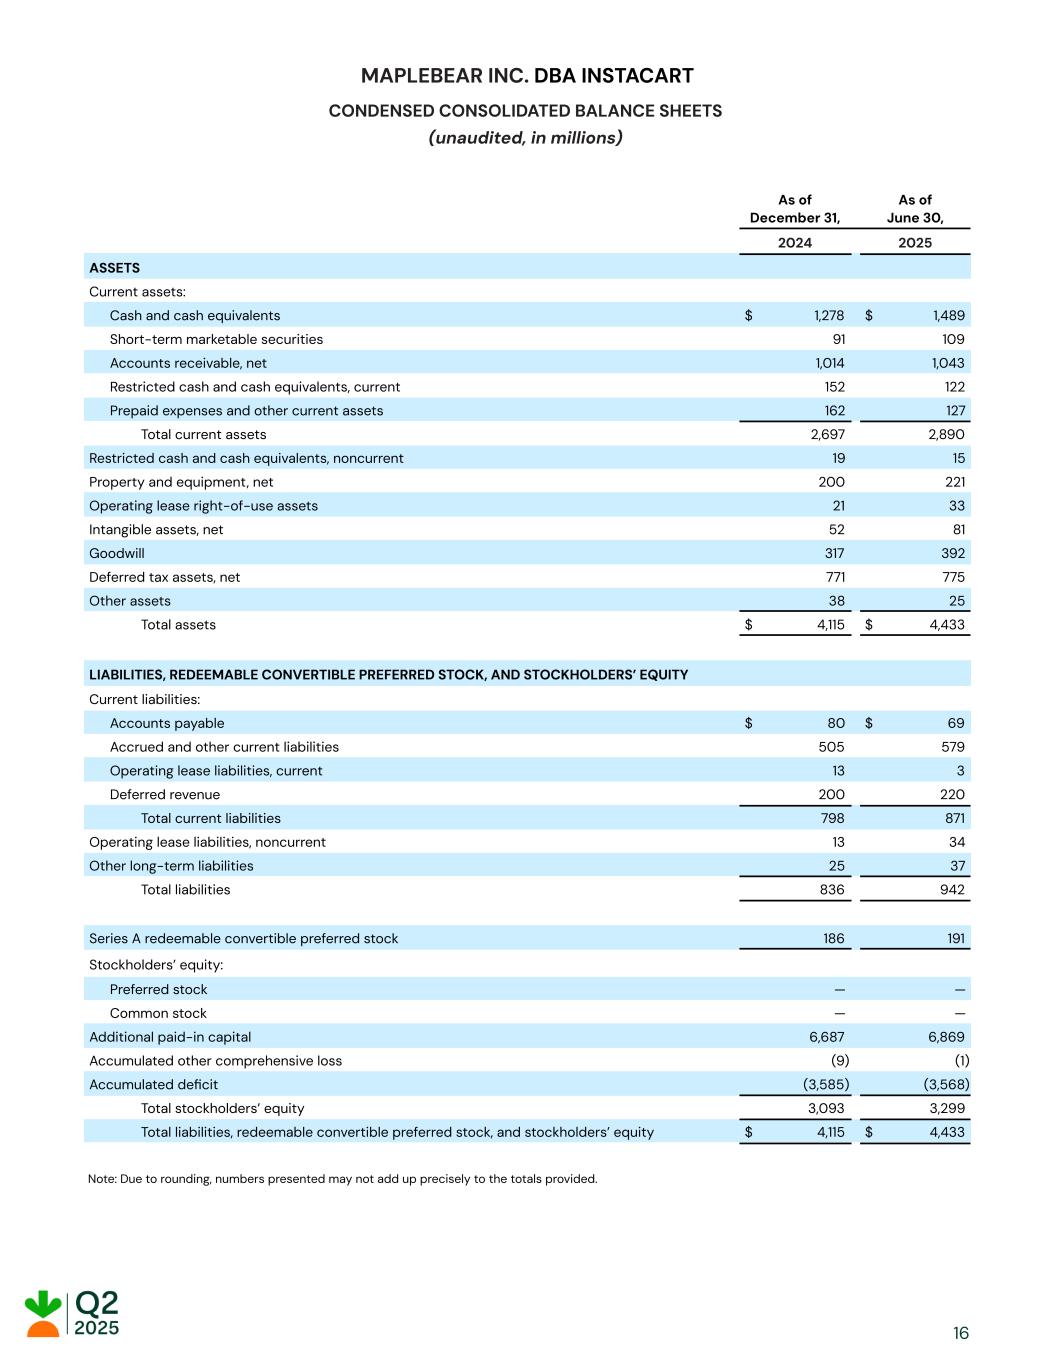
MAPLEBEAR INC. DBA INSTACART CONDENSED CONSOLIDATED BALANCE SHEETS (unaudited, in millions) As of December 31, As of June 30, 2024 2025 ASSETS Current assets: Cash and cash equivalents $ 1,278 $ 1,489 Short-term marketable securities 91 109 Accounts receivable, net 1,014 1,043 Restricted cash and cash equivalents, current 152 122 Prepaid expenses and other current assets 162 127 Total current assets 2,697 2,890 Restricted cash and cash equivalents, noncurrent 19 15 Property and equipment, net 200 221 Operating lease right-of-use assets 21 33 Intangible assets, net 52 81 Goodwill 317 392 Deferred tax assets, net 771 775 Other assets 38 25 Total assets $ 4,115 $ 4,433 LIABILITIES, REDEEMABLE CONVERTIBLE PREFERRED STOCK, AND STOCKHOLDERS’ EQUITY Current liabilities: Accounts payable $ 80 $ 69 Accrued and other current liabilities 505 579 Operating lease liabilities, current 13 3 Deferred revenue 200 220 Total current liabilities 798 871 Operating lease liabilities, noncurrent 13 34 Other long-term liabilities 25 37 Total liabilities 836 942 Series A redeemable convertible preferred stock 186 191 Stockholders’ equity: Preferred stock — — Common stock — — Additional paid-in capital 6,687 6,869 Accumulated other comprehensive loss (9) (1) Accumulated deficit (3,585) (3,568) Total stockholders’ equity 3,093 3,299 Total liabilities, redeemable convertible preferred stock, and stockholders’ equity $ 4,115 $ 4,433 Note: Due to rounding, numbers presented may not add up precisely to the totals provided. 16
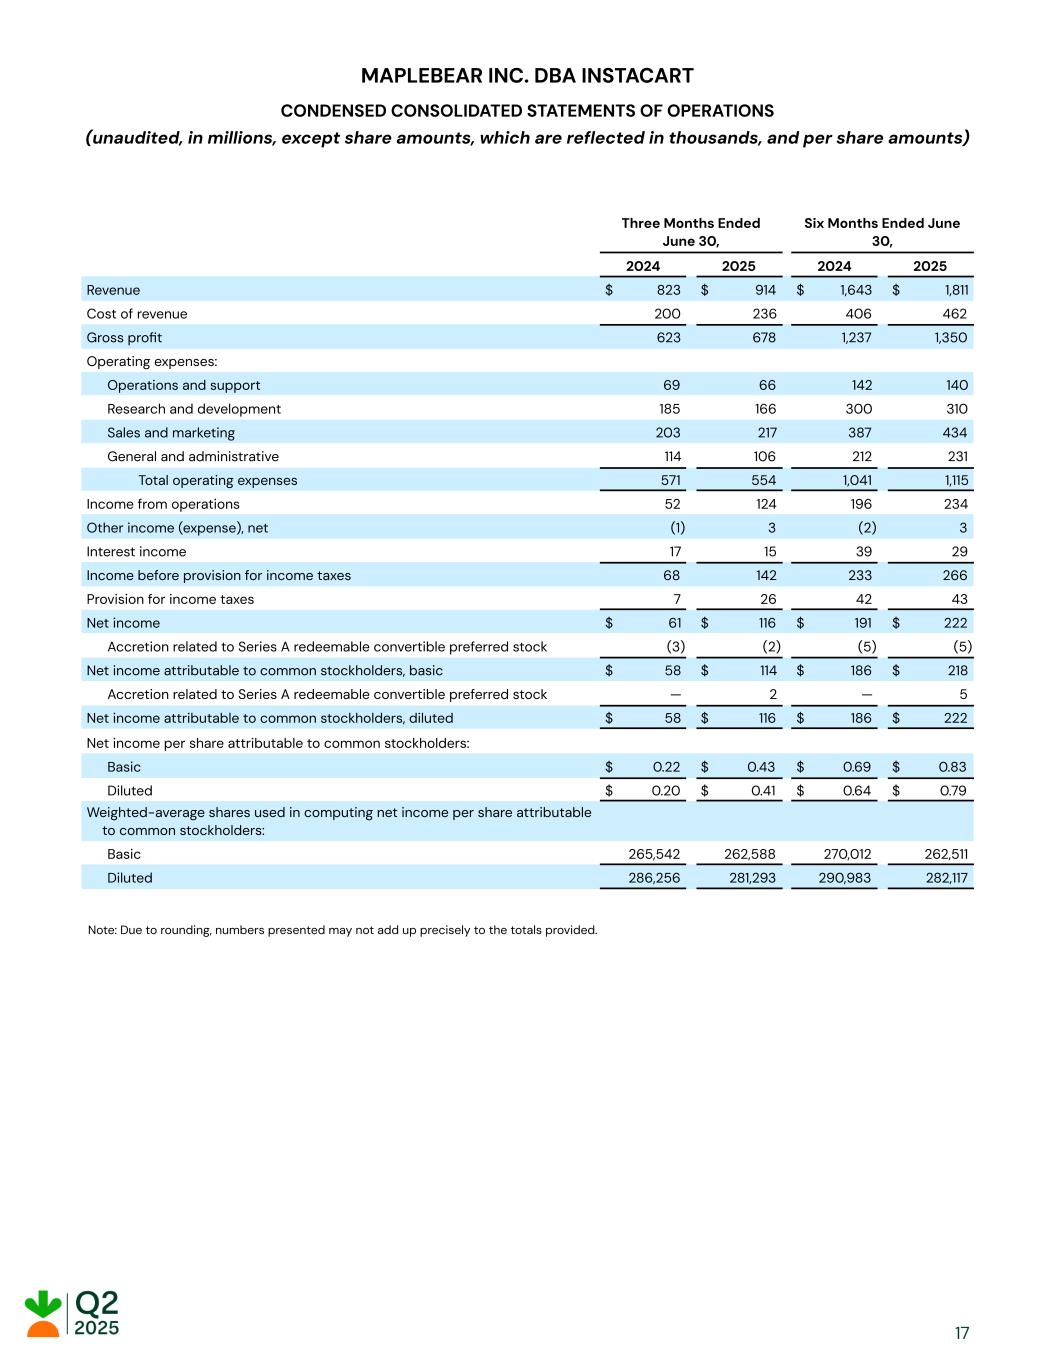
MAPLEBEAR INC. DBA INSTACART CONDENSED CONSOLIDATED STATEMENTS OF OPERATIONS (unaudited, in millions, except share amounts, which are reflected in thousands, and per share amounts) Three Months Ended June 30, Six Months Ended June 30, 2024 2025 2024 2025 Revenue $ 823 $ 914 $ 1,643 $ 1,811 Cost of revenue 200 236 406 462 Gross profit 623 678 1,237 1,350 Operating expenses: Operations and support 69 66 142 140 Research and development 185 166 300 310 Sales and marketing 203 217 387 434 General and administrative 114 106 212 231 Total operating expenses 571 554 1,041 1,115 Income from operations 52 124 196 234 Other income (expense), net (1) 3 (2) 3 Interest income 17 15 39 29 Income before provision for income taxes 68 142 233 266 Provision for income taxes 7 26 42 43 Net income $ 61 $ 116 $ 191 $ 222 Accretion related to Series A redeemable convertible preferred stock (3) (2) (5) (5) Net income attributable to common stockholders, basic $ 58 $ 114 $ 186 $ 218 Accretion related to Series A redeemable convertible preferred stock — 2 — 5 Net income attributable to common stockholders, diluted $ 58 $ 116 $ 186 $ 222 Net income per share attributable to common stockholders: Basic $ 0.22 $ 0.43 $ 0.69 $ 0.83 Diluted $ 0.20 $ 0.41 $ 0.64 $ 0.79 Weighted-average shares used in computing net income per share attributable to common stockholders: Basic 265,542 262,588 270,012 262,511 Diluted 286,256 281,293 290,983 282,117 Note: Due to rounding, numbers presented may not add up precisely to the totals provided. 17
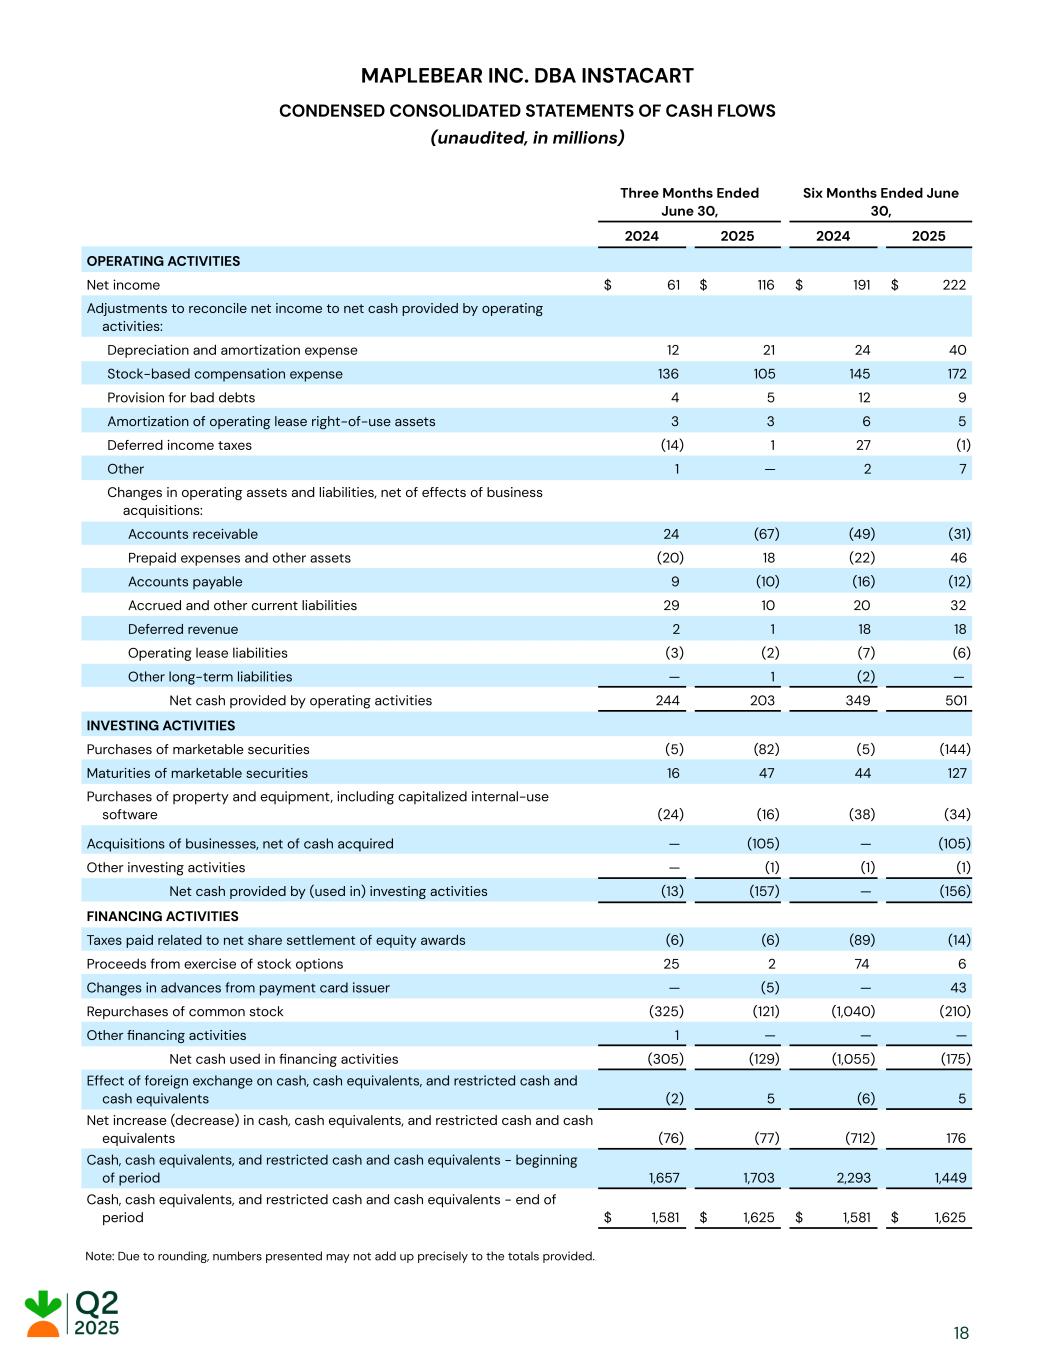
MAPLEBEAR INC. DBA INSTACART CONDENSED CONSOLIDATED STATEMENTS OF CASH FLOWS (unaudited, in millions) Three Months Ended June 30, Six Months Ended June 30, 2024 2025 2024 2025 OPERATING ACTIVITIES Net income $ 61 $ 116 $ 191 $ 222 Adjustments to reconcile net income to net cash provided by operating activities: Depreciation and amortization expense 12 21 24 40 Stock-based compensation expense 136 105 145 172 Provision for bad debts 4 5 12 9 Amortization of operating lease right-of-use assets 3 3 6 5 Deferred income taxes (14) 1 27 (1) Other 1 — 2 7 Changes in operating assets and liabilities, net of effects of business acquisitions: Accounts receivable 24 (67) (49) (31) Prepaid expenses and other assets (20) 18 (22) 46 Accounts payable 9 (10) (16) (12) Accrued and other current liabilities 29 10 20 32 Deferred revenue 2 1 18 18 Operating lease liabilities (3) (2) (7) (6) Other long-term liabilities — 1 (2) — Net cash provided by operating activities 244 203 349 501 INVESTING ACTIVITIES Purchases of marketable securities (5) (82) (5) (144) Maturities of marketable securities 16 47 44 127 Purchases of property and equipment, including capitalized internal-use software (24) (16) (38) (34) Acquisitions of businesses, net of cash acquired — (105) — (105) Other investing activities — (1) (1) (1) Net cash provided by (used in) investing activities (13) (157) — (156) FINANCING ACTIVITIES Taxes paid related to net share settlement of equity awards (6) (6) (89) (14) Proceeds from exercise of stock options 25 2 74 6 Changes in advances from payment card issuer — (5) — 43 Repurchases of common stock (325) (121) (1,040) (210) Other financing activities 1 — — — Net cash used in financing activities (305) (129) (1,055) (175) Effect of foreign exchange on cash, cash equivalents, and restricted cash and cash equivalents (2) 5 (6) 5 Net increase (decrease) in cash, cash equivalents, and restricted cash and cash equivalents (76) (77) (712) 176 Cash, cash equivalents, and restricted cash and cash equivalents - beginning of period 1,657 1,703 2,293 1,449 Cash, cash equivalents, and restricted cash and cash equivalents - end of period $ 1,581 $ 1,625 $ 1,581 $ 1,625 Note: Due to rounding, numbers presented may not add up precisely to the totals provided... 18
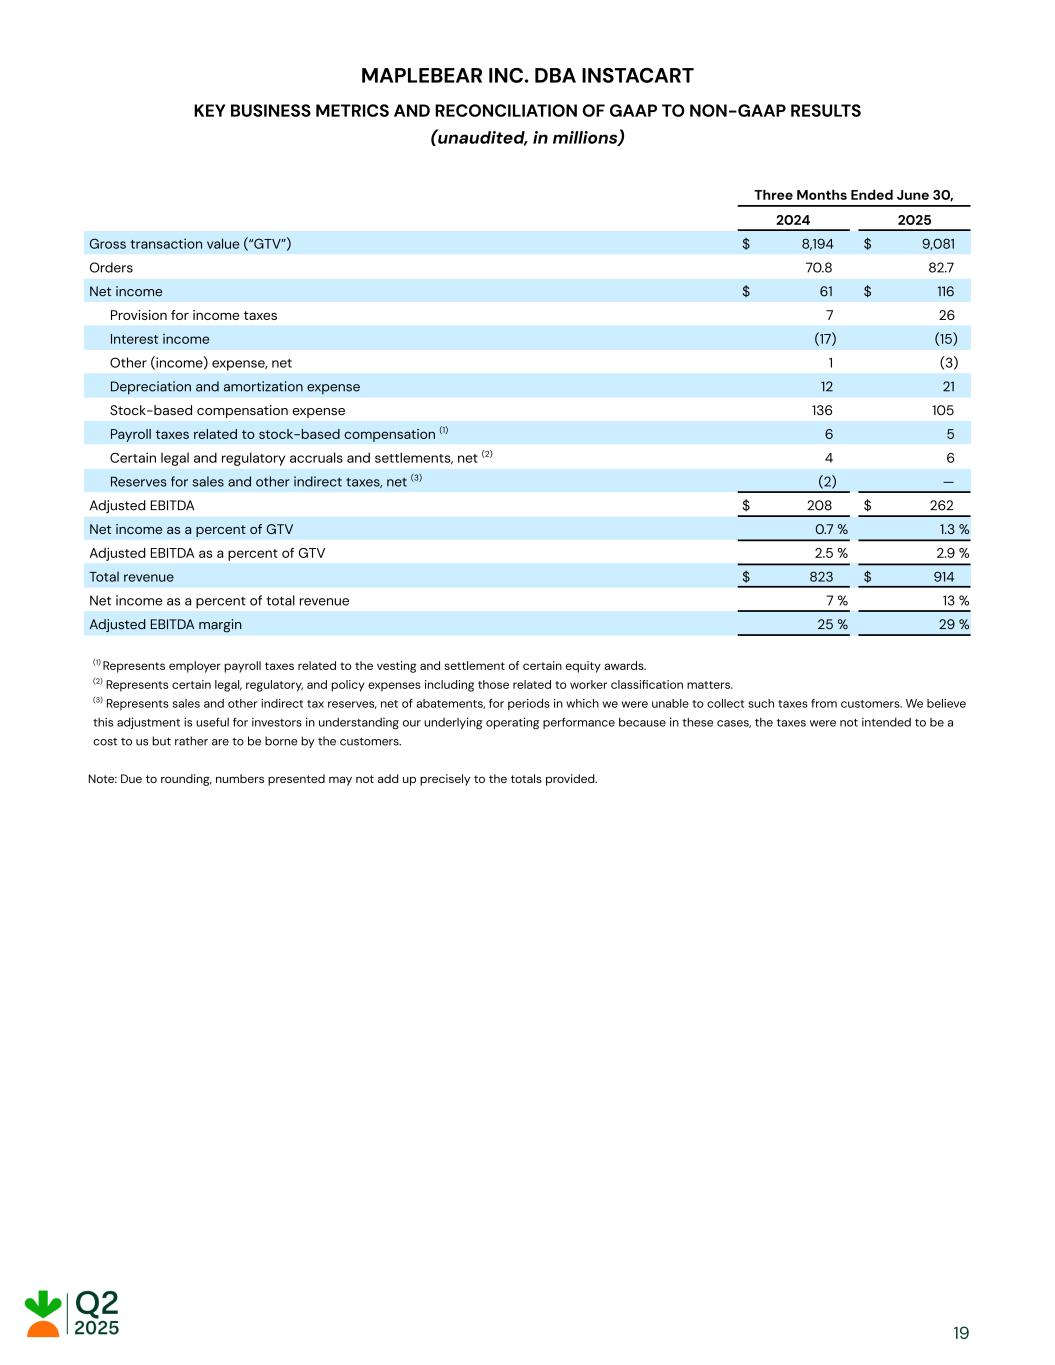
MAPLEBEAR INC. DBA INSTACART KEY BUSINESS METRICS AND RECONCILIATION OF GAAP TO NON-GAAP RESULTS (unaudited, in millions) Three Months Ended June 30, 2024 2025 Gross transaction value (“GTV”) $ 8,194 $ 9,081 Orders 70.8 82.7 Net income $ 61 $ 116 Provision for income taxes 7 26 Interest income (17) (15) Other (income) expense, net 1 (3) Depreciation and amortization expense 12 21 Stock-based compensation expense 136 105 Payroll taxes related to stock-based compensation (1) 6 5 Certain legal and regulatory accruals and settlements, net (2) 4 6 Reserves for sales and other indirect taxes, net (3) (2) — Adjusted EBITDA $ 208 $ 262 Net income as a percent of GTV 0.7 % 1.3 % Adjusted EBITDA as a percent of GTV 2.5 % 2.9 % Total revenue $ 823 $ 914 Net income as a percent of total revenue 7 % 13 % Adjusted EBITDA margin 25 % 29 % (1) Represents employer payroll taxes related to the vesting and settlement of certain equity awards. (2) Represents certain legal, regulatory, and policy expenses including those related to worker classification matters. (3) Represents sales and other indirect tax reserves, net of abatements, for periods in which we were unable to collect such taxes from customers. We believe this adjustment is useful for investors in understanding our underlying operating performance because in these cases, the taxes were not intended to be a cost to us but rather are to be borne by the customers. Note: Due to rounding, numbers presented may not add up precisely to the totals provided. 19
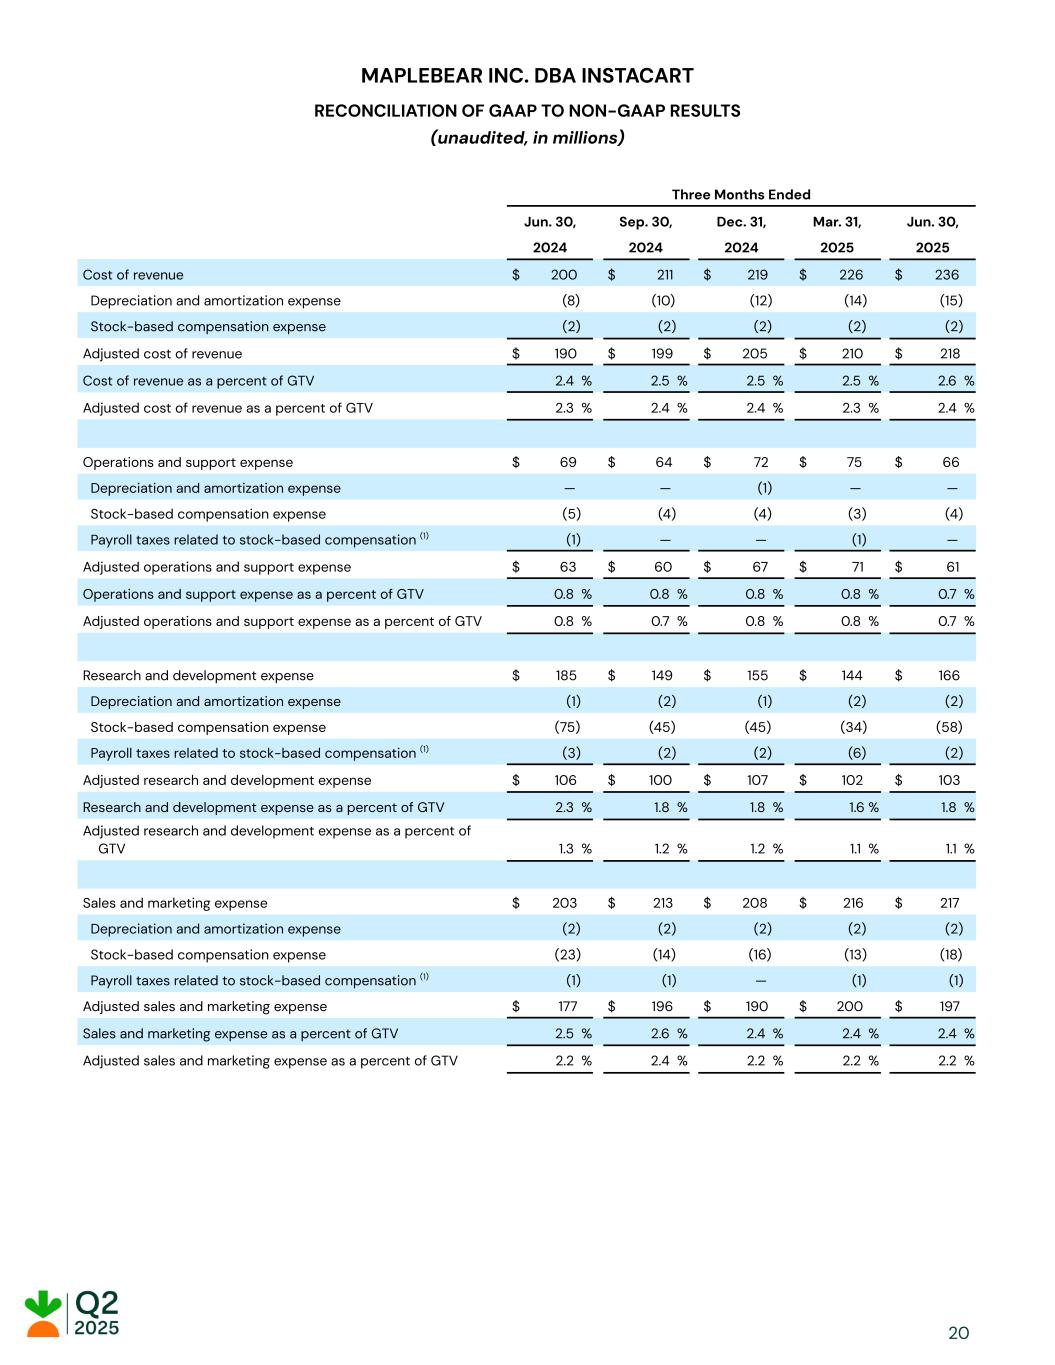
MAPLEBEAR INC. DBA INSTACART RECONCILIATION OF GAAP TO NON-GAAP RESULTS (unaudited, in millions) Three Months Ended Jun. 30, Sep. 30, Dec. 31, Mar. 31, Jun. 30, 2024 2024 2024 2025 2025 Cost of revenue $ 200 $ 211 $ 219 $ 226 $ 236 Depreciation and amortization expense (8) (10) (12) (14) (15) Stock-based compensation expense (2) (2) (2) (2) (2) Adjusted cost of revenue $ 190 $ 199 $ 205 $ 210 $ 218 Cost of revenue as a percent of GTV 2.4 % 2.5 % 2.5 % 2.5 % 2.6 % Adjusted cost of revenue as a percent of GTV 2.3 % 2.4 % 2.4 % 2.3 % 2.4 % Operations and support expense $ 69 $ 64 $ 72 $ 75 $ 66 Depreciation and amortization expense — — (1) — — Stock-based compensation expense (5) (4) (4) (3) (4) Payroll taxes related to stock-based compensation (1) (1) — — (1) — Adjusted operations and support expense $ 63 $ 60 $ 67 $ 71 $ 61 Operations and support expense as a percent of GTV 0.8 % 0.8 % 0.8 % 0.8 % 0.7 % Adjusted operations and support expense as a percent of GTV 0.8 % 0.7 % 0.8 % 0.8 % 0.7 % Research and development expense $ 185 $ 149 $ 155 $ 144 $ 166 Depreciation and amortization expense (1) (2) (1) (2) (2) Stock-based compensation expense (75) (45) (45) (34) (58) Payroll taxes related to stock-based compensation (1) (3) (2) (2) (6) (2) Adjusted research and development expense $ 106 $ 100 $ 107 $ 102 $ 103 Research and development expense as a percent of GTV 2.3 % 1.8 % 1.8 % 1.6 % 1.8 % Adjusted research and development expense as a percent of GTV 1.3 % 1.2 % 1.2 % 1.1 % 1.1 % Sales and marketing expense $ 203 $ 213 $ 208 $ 216 $ 217 Depreciation and amortization expense (2) (2) (2) (2) (2) Stock-based compensation expense (23) (14) (16) (13) (18) Payroll taxes related to stock-based compensation (1) (1) (1) — (1) (1) Adjusted sales and marketing expense $ 177 $ 196 $ 190 $ 200 $ 197 Sales and marketing expense as a percent of GTV 2.5 % 2.6 % 2.4 % 2.4 % 2.4 % Adjusted sales and marketing expense as a percent of GTV 2.2 % 2.4 % 2.2 % 2.2 % 2.2 % 20
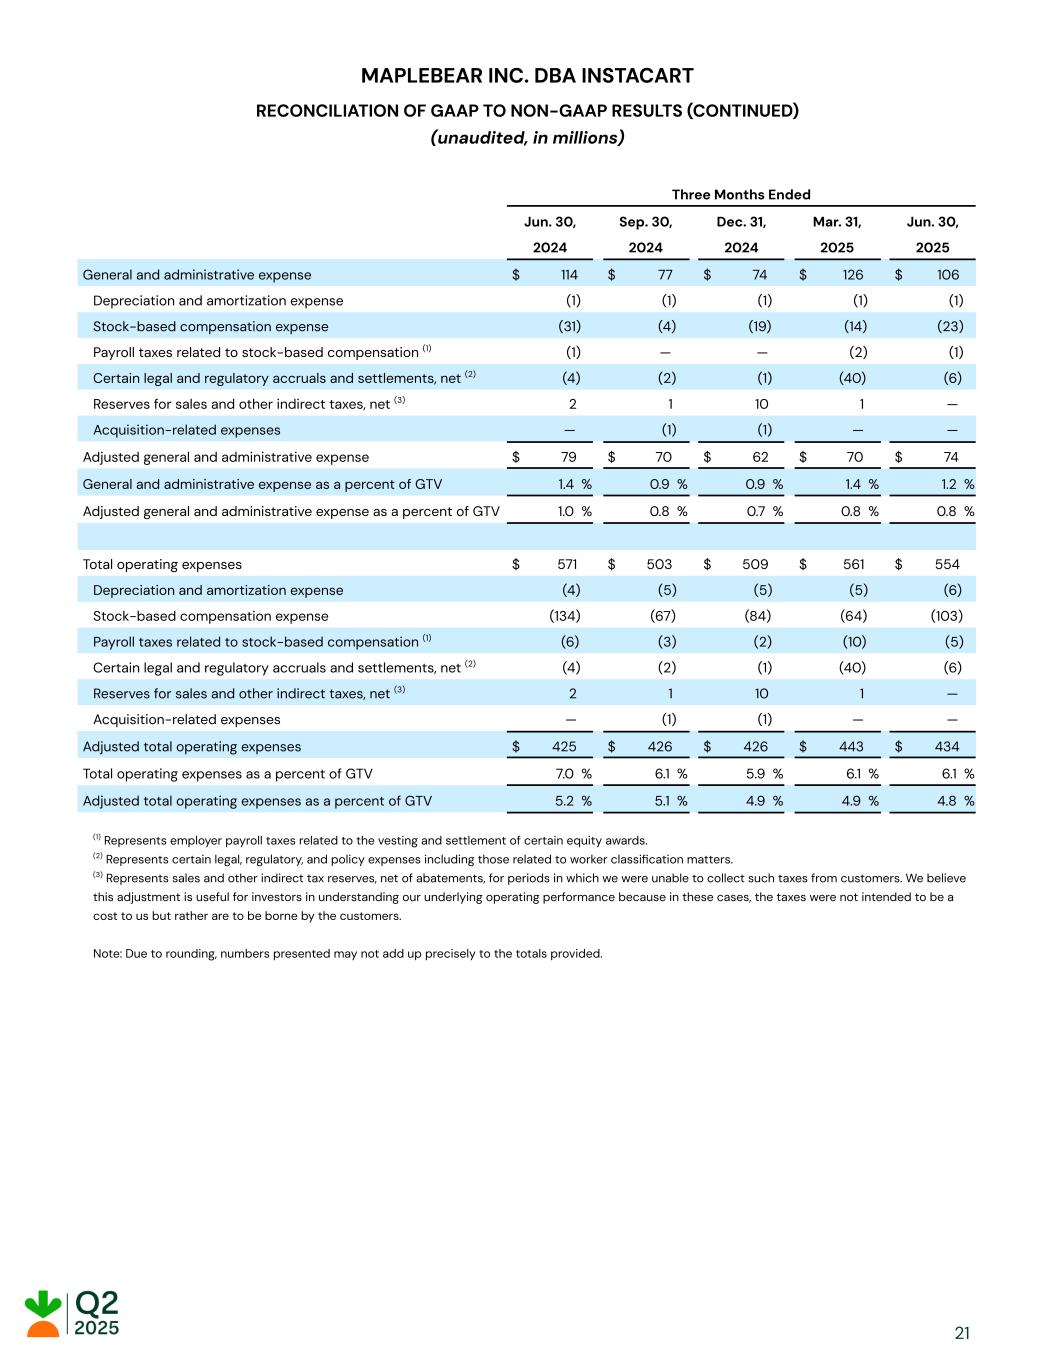
MAPLEBEAR INC. DBA INSTACART RECONCILIATION OF GAAP TO NON-GAAP RESULTS (CONTINUED) (unaudited, in millions) Three Months Ended Jun. 30, Sep. 30, Dec. 31, Mar. 31, Jun. 30, 2024 2024 2024 2025 2025 General and administrative expense $ 114 $ 77 $ 74 $ 126 $ 106 Depreciation and amortization expense (1) (1) (1) (1) (1) Stock-based compensation expense (31) (4) (19) (14) (23) Payroll taxes related to stock-based compensation (1) (1) — — (2) (1) Certain legal and regulatory accruals and settlements, net (2) (4) (2) (1) (40) (6) Reserves for sales and other indirect taxes, net (3) 2 1 10 1 — Acquisition-related expenses — (1) (1) — — Adjusted general and administrative expense $ 79 $ 70 $ 62 $ 70 $ 74 General and administrative expense as a percent of GTV 1.4 % 0.9 % 0.9 % 1.4 % 1.2 % Adjusted general and administrative expense as a percent of GTV 1.0 % 0.8 % 0.7 % 0.8 % 0.8 % Total operating expenses $ 571 $ 503 $ 509 $ 561 $ 554 Depreciation and amortization expense (4) (5) (5) (5) (6) Stock-based compensation expense (134) (67) (84) (64) (103) Payroll taxes related to stock-based compensation (1) (6) (3) (2) (10) (5) Certain legal and regulatory accruals and settlements, net (2) (4) (2) (1) (40) (6) Reserves for sales and other indirect taxes, net (3) 2 1 10 1 — Acquisition-related expenses — (1) (1) — — Adjusted total operating expenses $ 425 $ 426 $ 426 $ 443 $ 434 Total operating expenses as a percent of GTV 7.0 % 6.1 % 5.9 % 6.1 % 6.1 % Adjusted total operating expenses as a percent of GTV 5.2 % 5.1 % 4.9 % 4.9 % 4.8 % (1) Represents employer payroll taxes related to the vesting and settlement of certain equity awards. (2) Represents certain legal, regulatory, and policy expenses including those related to worker classification matters. (3) Represents sales and other indirect tax reserves, net of abatements, for periods in which we were unable to collect such taxes from customers. We believe this adjustment is useful for investors in understanding our underlying operating performance because in these cases, the taxes were not intended to be a cost to us but rather are to be borne by the customers. Note: Due to rounding, numbers presented may not add up precisely to the totals provided. 21