Discussion Materials April 30, 2020
Confidentiality and Disclaimer These materials have been prepared by Jason Incorporated (“Jason” or the
“Company”) solely for informational purposes. You should not definitively rely upon it or use it to form the definitive basis for any decision, contract, commitment or action whatsoever, with respect to any proposed transaction or otherwise.
You and your directors, officers, employees, agents, and affiliates must hold this document and any oral information provided in connection with this document in strict confidence and may not communicate, reproduce, distribute, or disclose it
to any other person, or refer to it publicly, in whole or in part, at any time except in accordance with the terms of an executed confidentiality agreement (a “Confidentiality Agreement”) between you and the Company. If you are not the intended
recipient of this document, please delete and destroy all copies immediately. This document is being shared per the terms of the Confidentiality Agreement.The information contained herein includes certain statements, estimates, and projections
with respect to the Company’s anticipated future performance and potential industry trends. Such statements, estimates, and projections reflect various assumptions concerning anticipated results and industry trends, which assumptions may or may
not prove to be correct. Actual results and trends may vary materially and adversely from the projections contained herein. The Company undertakes no obligation or responsibility to update any of the information contained in this document. Past
performance does not guarantee or predict future performance.This document and the information contained herein do not constitute an offer to sell or the solicitation of an offer to buy any security, commodity, or instrument or related
derivative. We recommend that the recipient seek independent third party legal, regulatory, accounting, and tax advice regarding the contents of this document. This document contains material non-public information concerning the Company and/or
its affiliates. You and your directors, officers, employees, agents, and affiliates must only use such information in accordance with the Confidentiality Agreement, your compliance policies and procedures, and applicable laws and
regulations. 2

Financial Projections: Osborn Section 1 Financial Projections: Osborn Section 2 Financial
Projections: Milsco Section 3 Financial Projections: Consolidated
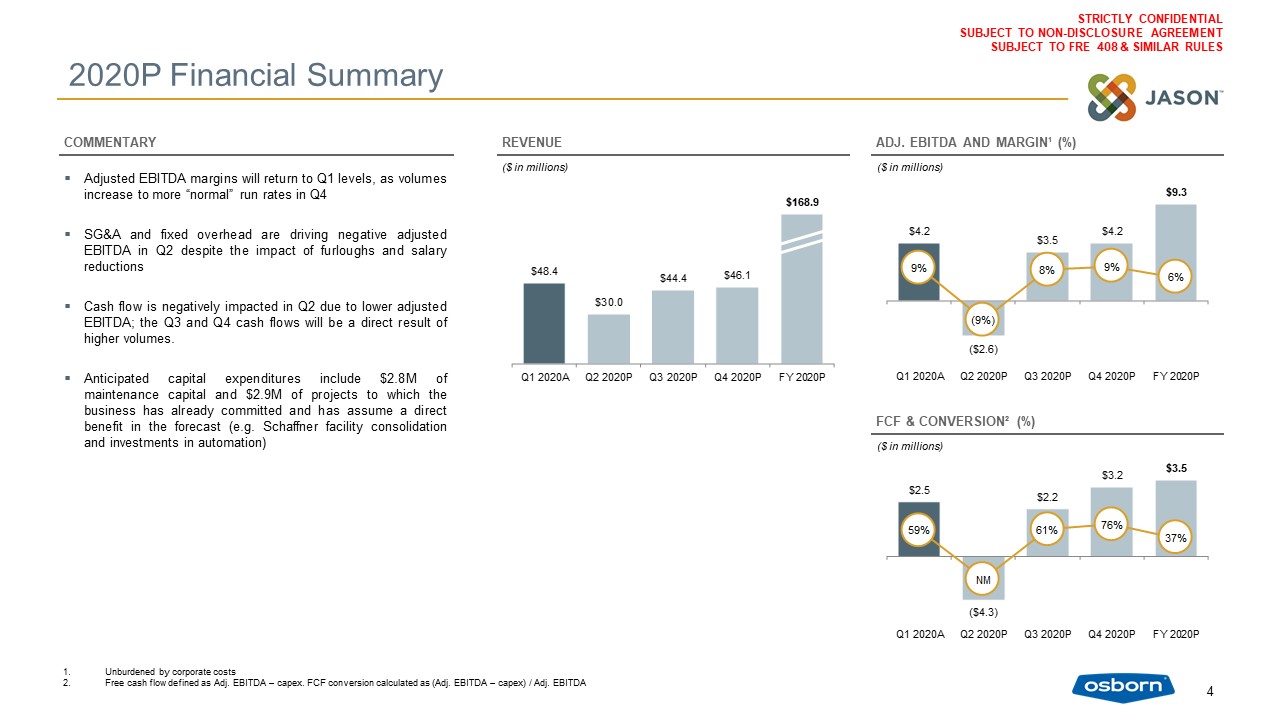
2020P Financial Summary Adjusted EBITDA margins will return to Q1 levels, as volumes increase to more
“normal” run rates in Q4SG&A and fixed overhead are driving negative adjusted EBITDA in Q2 despite the impact of furloughs and salary reductions Cash flow is negatively impacted in Q2 due to lower adjusted EBITDA; the Q3 and Q4 cash flows
will be a direct result of higher volumes.Anticipated capital expenditures include $2.8M of maintenance capital and $2.9M of projects to which the business has already committed and has assume a direct benefit in the forecast (e.g. Schaffner
facility consolidation and investments in automation) ($ in millions) Unburdened by corporate costsFree cash flow defined as Adj. EBITDA – capex. FCF conversion calculated as (Adj. EBITDA – capex) / Adj. EBITDA 4 REVENUE COMMENTARY ($
in millions) ADJ. EBITDA AND MARGIN¹ (%) ($ in millions) FCF & CONVERSION² (%)
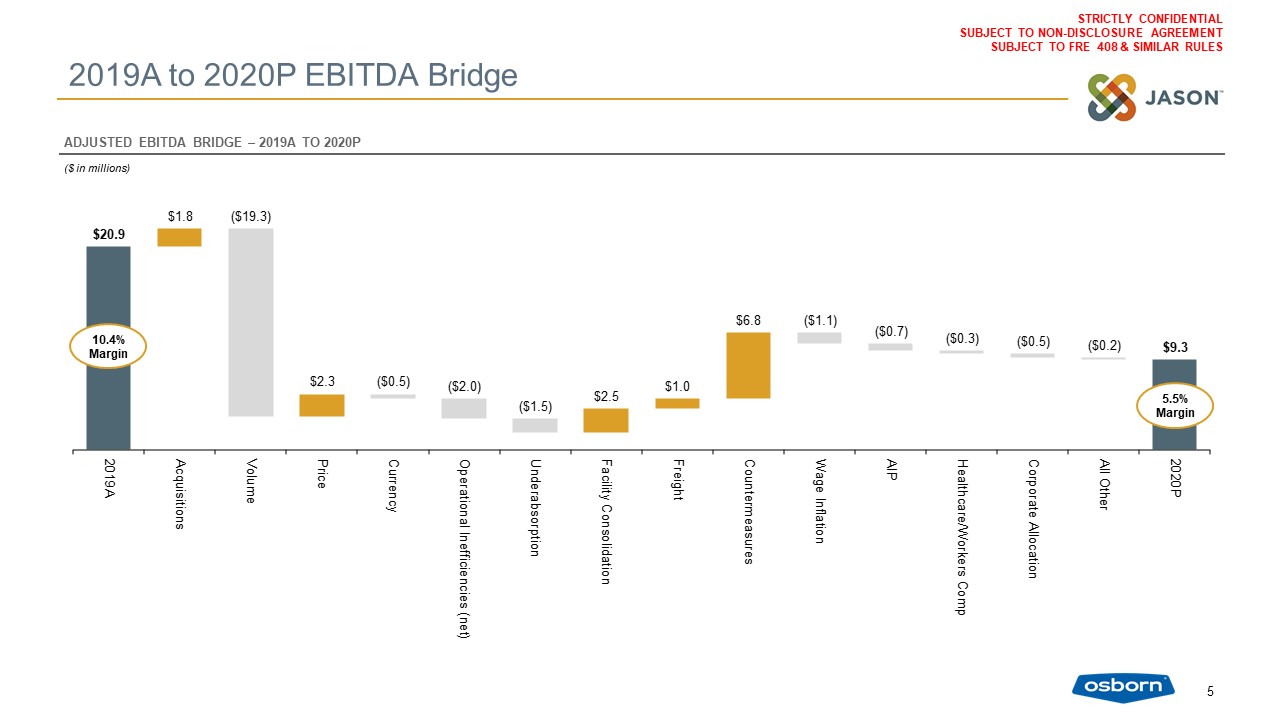
A C B E D 2019A to 2020P EBITDA Bridge 5 ADJUSTED EBITDA BRIDGE – 2019A TO 2020P ($ in
millions) 10.4% Margin 5.5% Margin
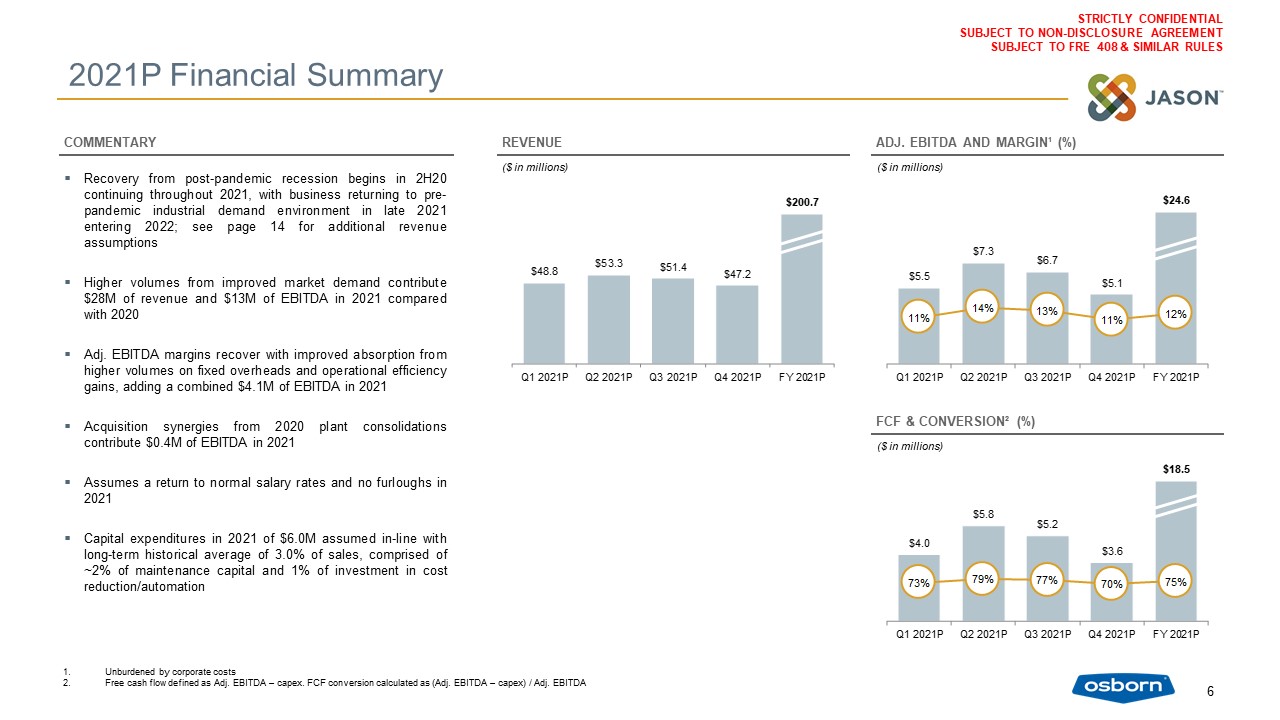
2021P Financial Summary Recovery from post-pandemic recession begins in 2H20 continuing throughout 2021,
with business returning to pre-pandemic industrial demand environment in late 2021 entering 2022; see page 14 for additional revenue assumptionsHigher volumes from improved market demand contribute $28M of revenue and $13M of EBITDA in 2021
compared with 2020Adj. EBITDA margins recover with improved absorption from higher volumes on fixed overheads and operational efficiency gains, adding a combined $4.1M of EBITDA in 2021Acquisition synergies from 2020 plant consolidations
contribute $0.4M of EBITDA in 2021Assumes a return to normal salary rates and no furloughs in 2021Capital expenditures in 2021 of $6.0M assumed in-line with long-term historical average of 3.0% of sales, comprised of ~2% of maintenance capital
and 1% of investment in cost reduction/automation ($ in millions) Unburdened by corporate costsFree cash flow defined as Adj. EBITDA – capex. FCF conversion calculated as (Adj. EBITDA – capex) / Adj. EBITDA 6 REVENUE COMMENTARY ($ in
millions) ADJ. EBITDA AND MARGIN¹ (%) ($ in millions) FCF & CONVERSION² (%)
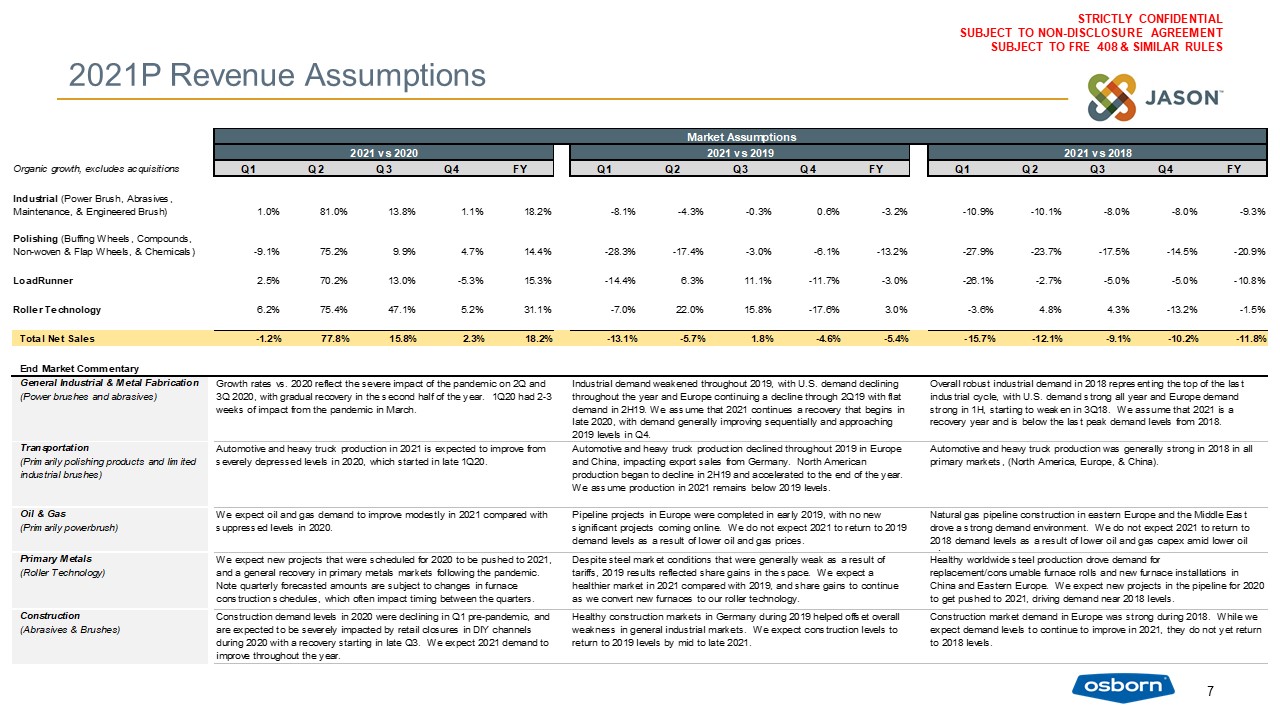
2021P Revenue Assumptions 7
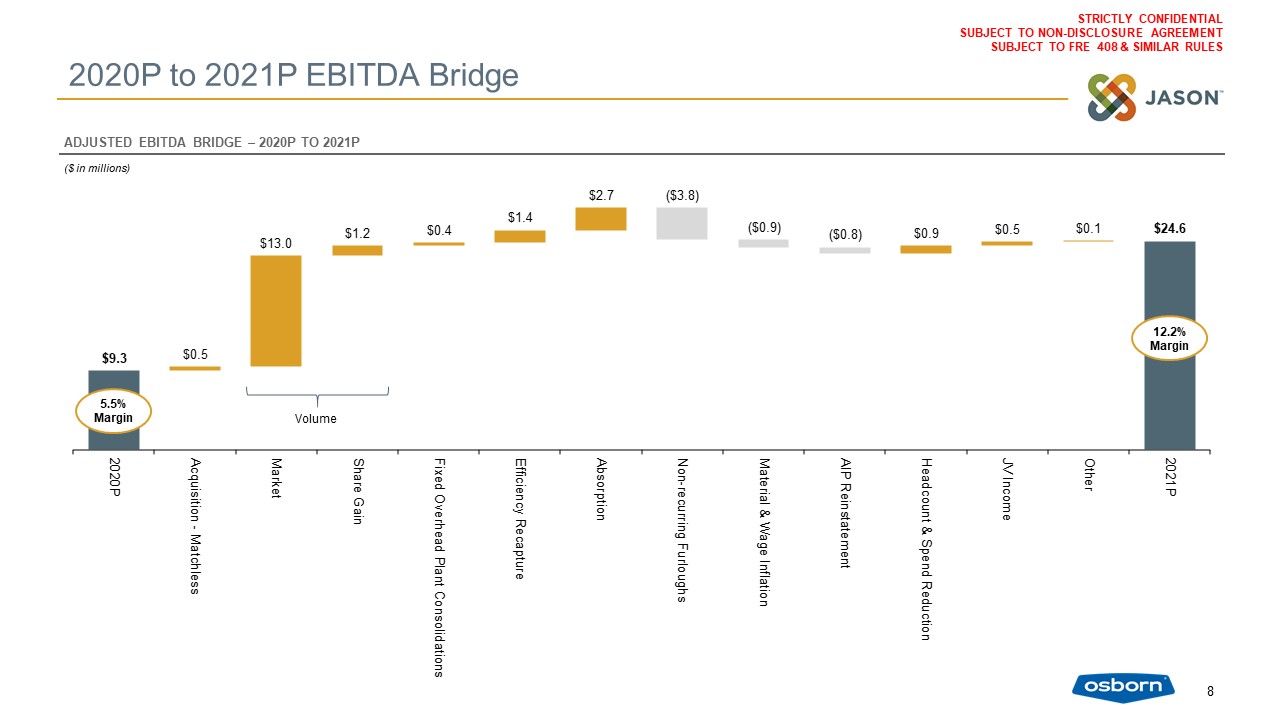
2020P to 2021P EBITDA Bridge 8 ADJUSTED EBITDA BRIDGE – 2020P TO 2021P ($ in
millions) Volume 5.5% Margin 12.2% Margin
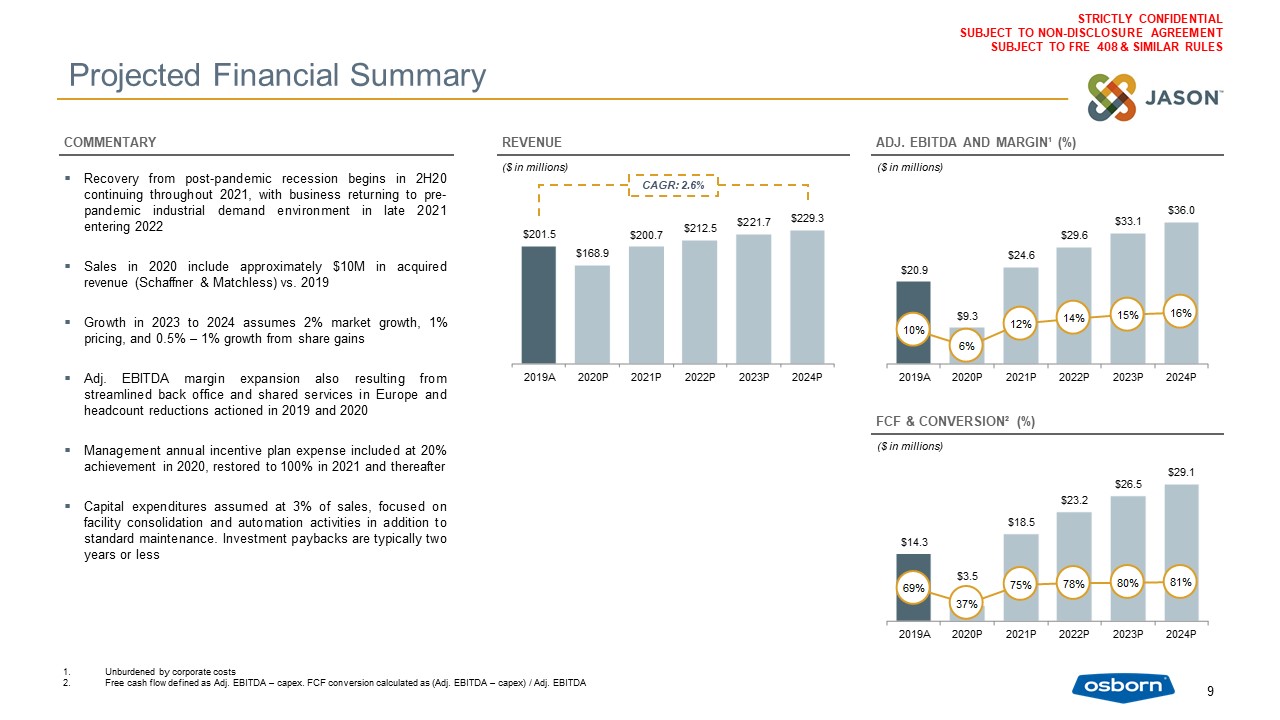
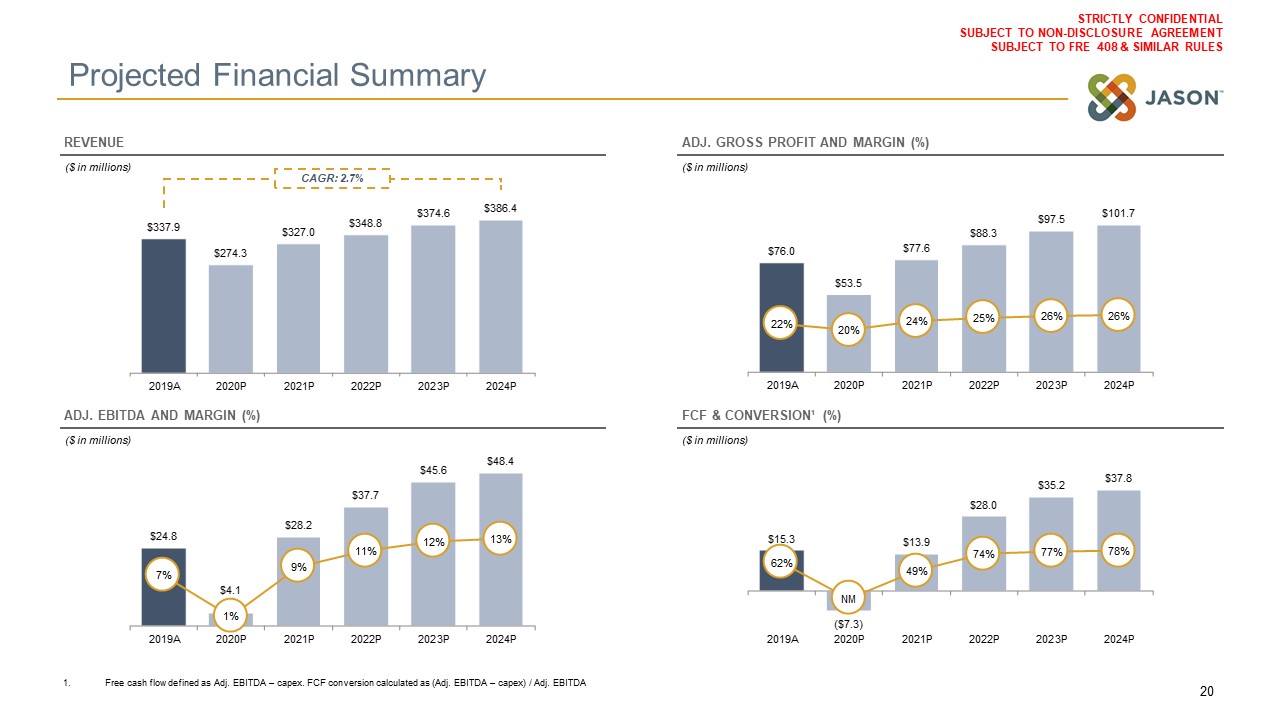
Projected Financial Summary Recovery from post-pandemic recession begins in 2H20 continuing throughout
2021, with business returning to pre-pandemic industrial demand environment in late 2021 entering 2022Sales in 2020 include approximately $10M in acquired revenue (Schaffner & Matchless) vs. 2019Growth in 2023 to 2024 assumes 2% market
growth, 1% pricing, and 0.5% – 1% growth from share gainsAdj. EBITDA margin expansion also resulting from streamlined back office and shared services in Europe and headcount reductions actioned in 2019 and 2020 Management annual incentive plan
expense included at 20% achievement in 2020, restored to 100% in 2021 and thereafter Capital expenditures assumed at 3% of sales, focused on facility consolidation and automation activities in addition to standard maintenance. Investment
paybacks are typically two years or less ($ in millions) ($ in millions) Unburdened by corporate costsFree cash flow defined as Adj. EBITDA – capex. FCF conversion calculated as (Adj. EBITDA – capex) / Adj.
EBITDA 9 REVENUE COMMENTARY FCF & CONVERSION² (%) CAGR: 2.6% ($ in millions) ADJ. EBITDA AND MARGIN¹ (%)

Financial Projections: Milsco Section 1 Financial Projections: Osborn Section 2 Financial
Projections: Milsco Section 3 Financial Projections: Consolidated
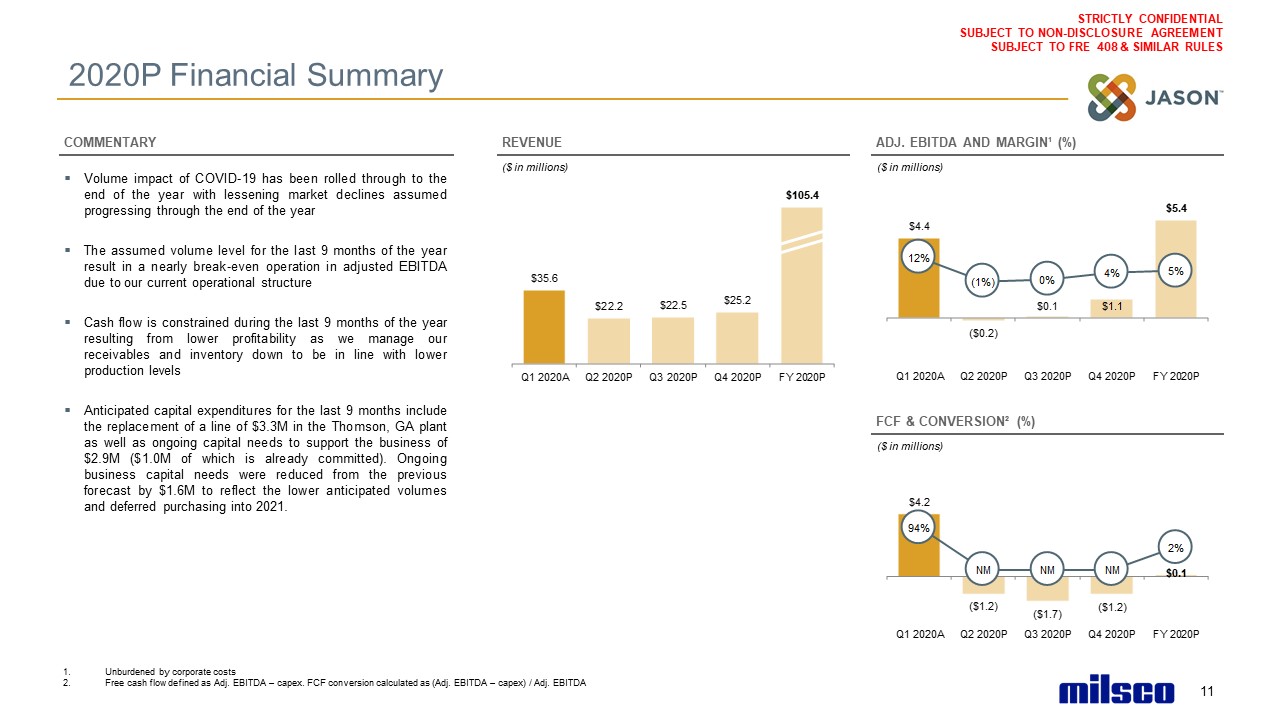
2020P Financial Summary Volume impact of COVID-19 has been rolled through to the end of the year with
lessening market declines assumed progressing through the end of the yearThe assumed volume level for the last 9 months of the year result in a nearly break-even operation in adjusted EBITDA due to our current operational structureCash flow is
constrained during the last 9 months of the year resulting from lower profitability as we manage our receivables and inventory down to be in line with lower production levelsAnticipated capital expenditures for the last 9 months include the
replacement of a line of $3.3M in the Thomson, GA plant as well as ongoing capital needs to support the business of $2.9M ($1.0M of which is already committed). Ongoing business capital needs were reduced from the previous forecast by $1.6M to
reflect the lower anticipated volumes and deferred purchasing into 2021. ($ in millions) ($ in millions) Unburdened by corporate costsFree cash flow defined as Adj. EBITDA – capex. FCF conversion calculated as (Adj. EBITDA – capex) / Adj.
EBITDA 11 REVENUE COMMENTARY FCF & CONVERSION² (%) ($ in millions) ADJ. EBITDA AND MARGIN¹ (%)
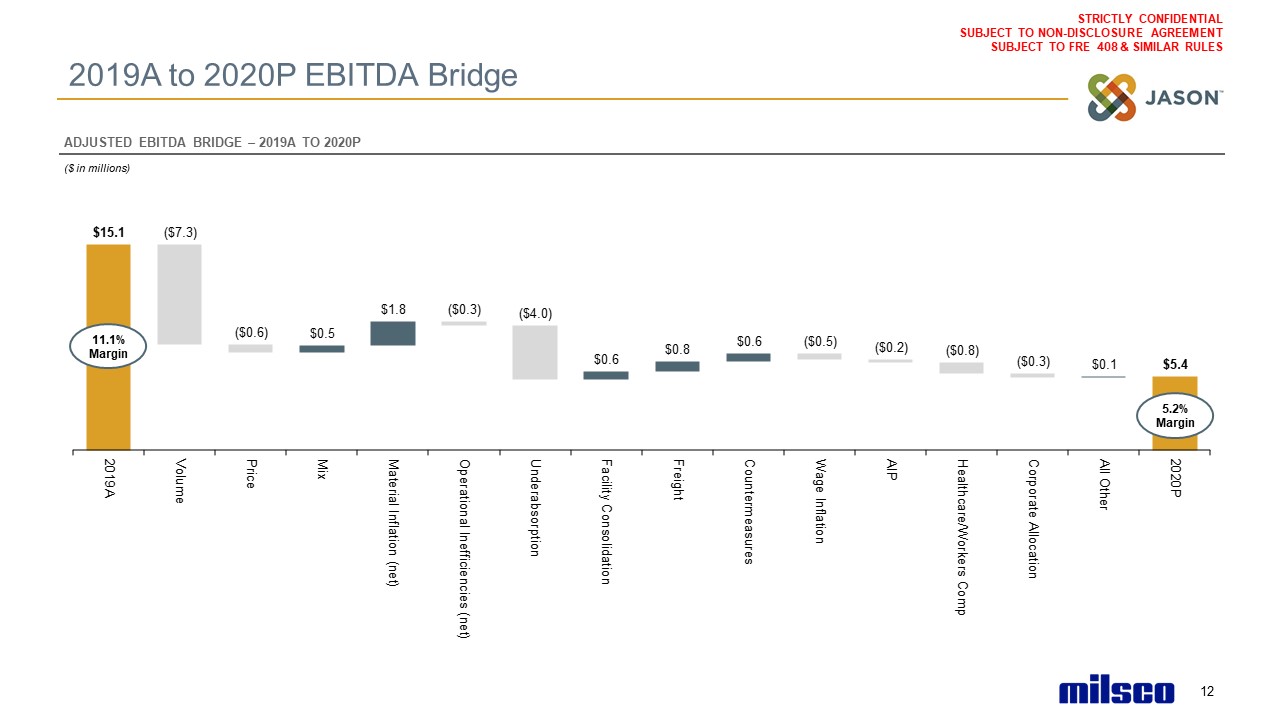
2019A to 2020P EBITDA Bridge ($ in millions) 12 ADJUSTED EBITDA BRIDGE – 2019A TO 2020P 11.1%
Margin 5.2% Margin
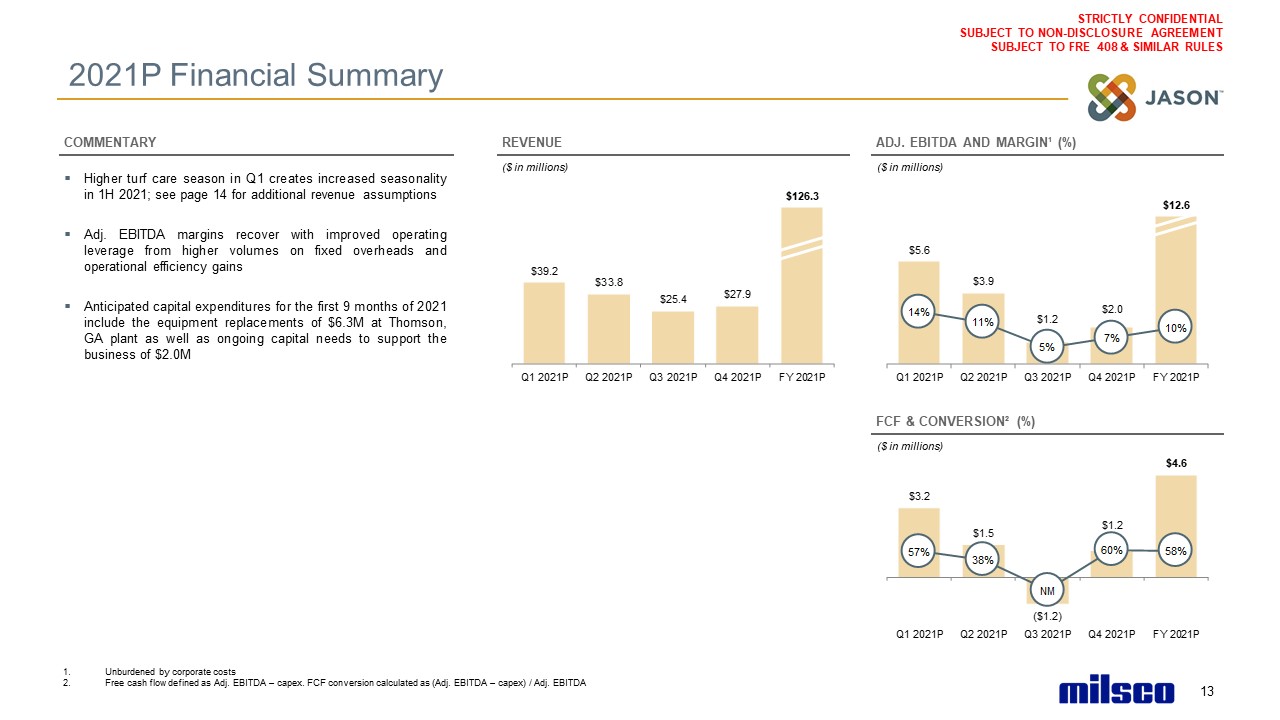
2021P Financial Summary Higher turf care season in Q1 creates increased seasonality in 1H 2021; see page
14 for additional revenue assumptionsAdj. EBITDA margins recover with improved operating leverage from higher volumes on fixed overheads and operational efficiency gainsAnticipated capital expenditures for the first 9 months of 2021 include the
equipment replacements of $6.3M at Thomson, GA plant as well as ongoing capital needs to support the business of $2.0M ($ in millions) ($ in millions) Unburdened by corporate costsFree cash flow defined as Adj. EBITDA – capex. FCF conversion
calculated as (Adj. EBITDA – capex) / Adj. EBITDA 13 REVENUE COMMENTARY FCF & CONVERSION² (%) ($ in millions) ADJ. EBITDA AND MARGIN¹ (%)
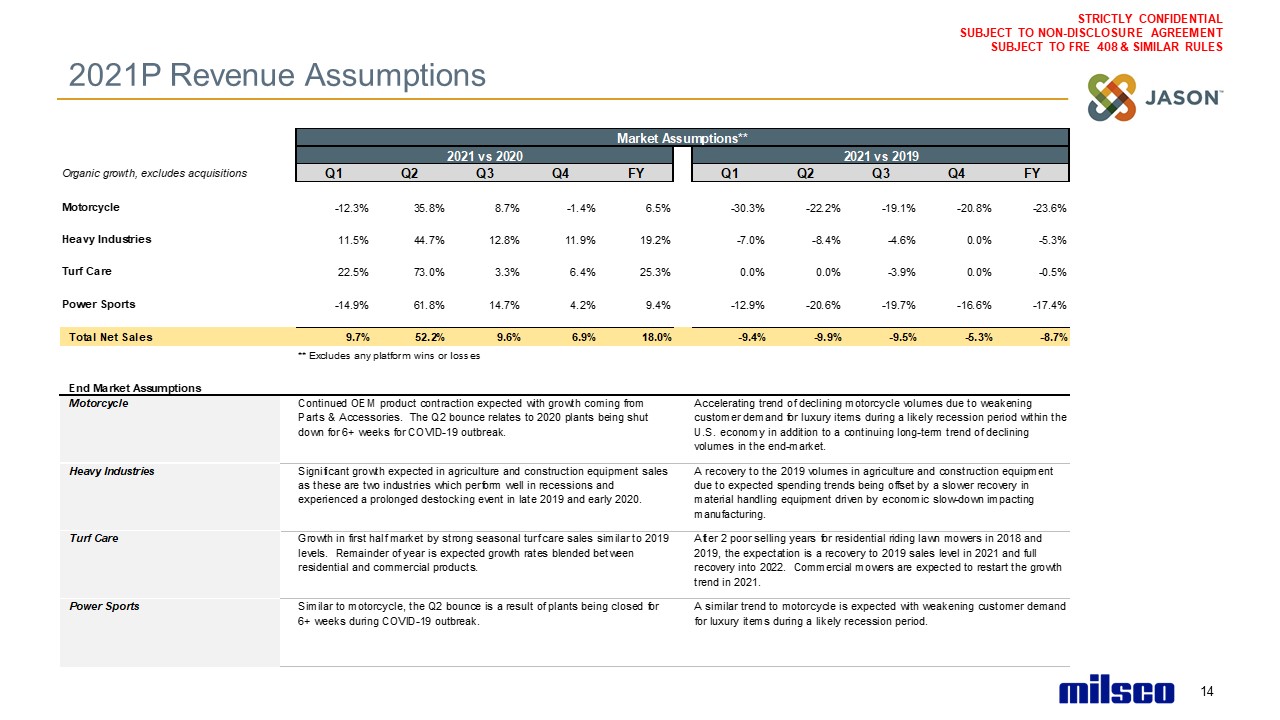
2021P Revenue Assumptions 14
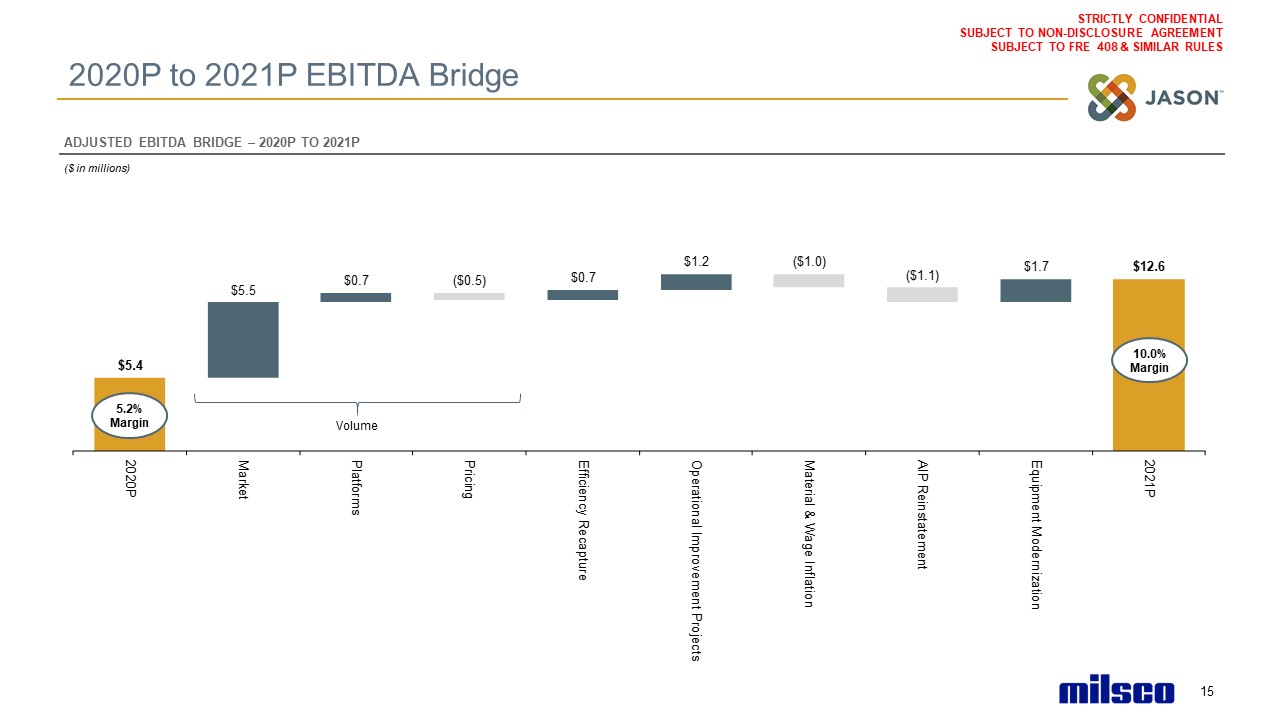
2020P to 2021P EBITDA Bridge ($ in millions) 15 ADJUSTED EBITDA BRIDGE – 2020P TO
2021P Volume 5.2% Margin 10.0% Margin
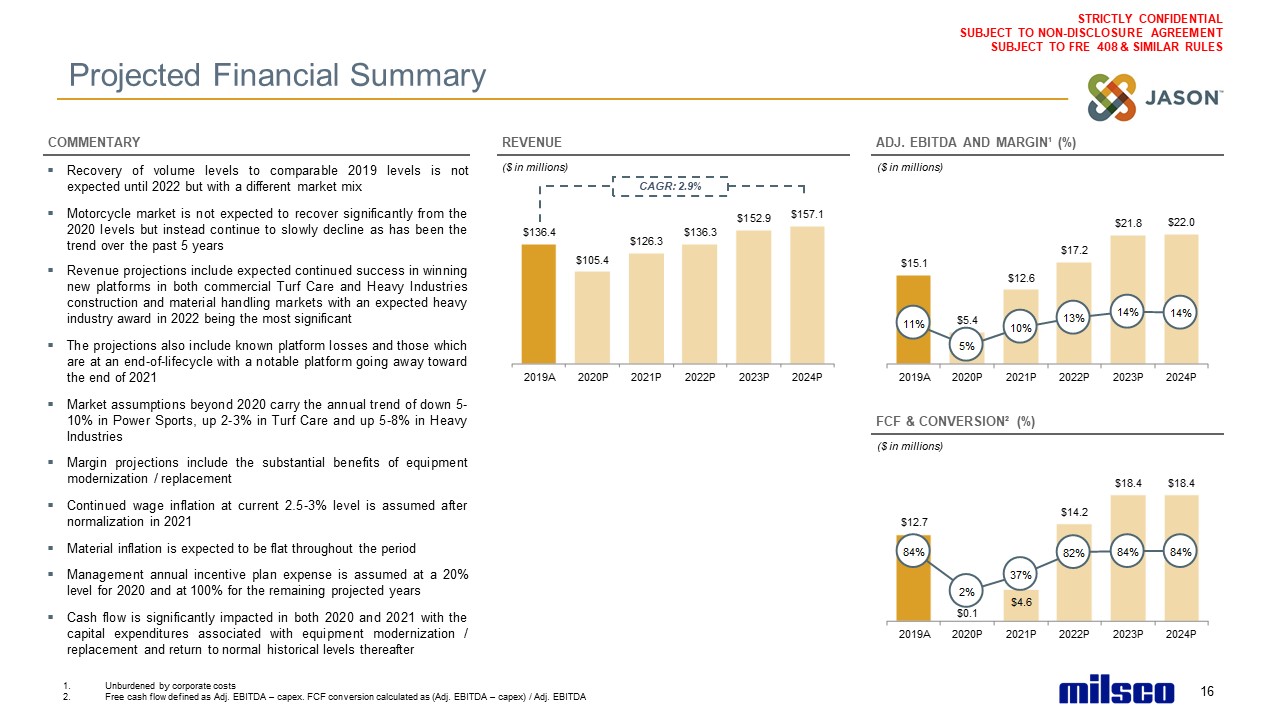
Projected Financial Summary Recovery of volume levels to comparable 2019 levels is not expected until
2022 but with a different market mix Motorcycle market is not expected to recover significantly from the 2020 levels but instead continue to slowly decline as has been the trend over the past 5 years Revenue projections include expected
continued success in winning new platforms in both commercial Turf Care and Heavy Industries construction and material handling markets with an expected heavy industry award in 2022 being the most significant The projections also include known
platform losses and those which are at an end-of-lifecycle with a notable platform going away toward the end of 2021 Market assumptions beyond 2020 carry the annual trend of down 5-10% in Power Sports, up 2-3% in Turf Care and up 5-8% in Heavy
IndustriesMargin projections include the substantial benefits of equipment modernization / replacementContinued wage inflation at current 2.5-3% level is assumed after normalization in 2021Material inflation is expected to be flat throughout
the periodManagement annual incentive plan expense is assumed at a 20% level for 2020 and at 100% for the remaining projected yearsCash flow is significantly impacted in both 2020 and 2021 with the capital expenditures associated with equipment
modernization / replacement and return to normal historical levels thereafter ($ in millions) ($ in millions) Unburdened by corporate costsFree cash flow defined as Adj. EBITDA – capex. FCF conversion calculated as (Adj. EBITDA – capex) /
Adj. EBITDA 16 REVENUE COMMENTARY ($ in millions) ADJ. EBITDA AND MARGIN¹ (%) FCF & CONVERSION² (%) CAGR: 2.9%

Financial Projections: Consolidated Section 1 Financial Projections: Osborn Section 2 Financial
Projections: Milsco Section 3 Financial Projections: Consolidated
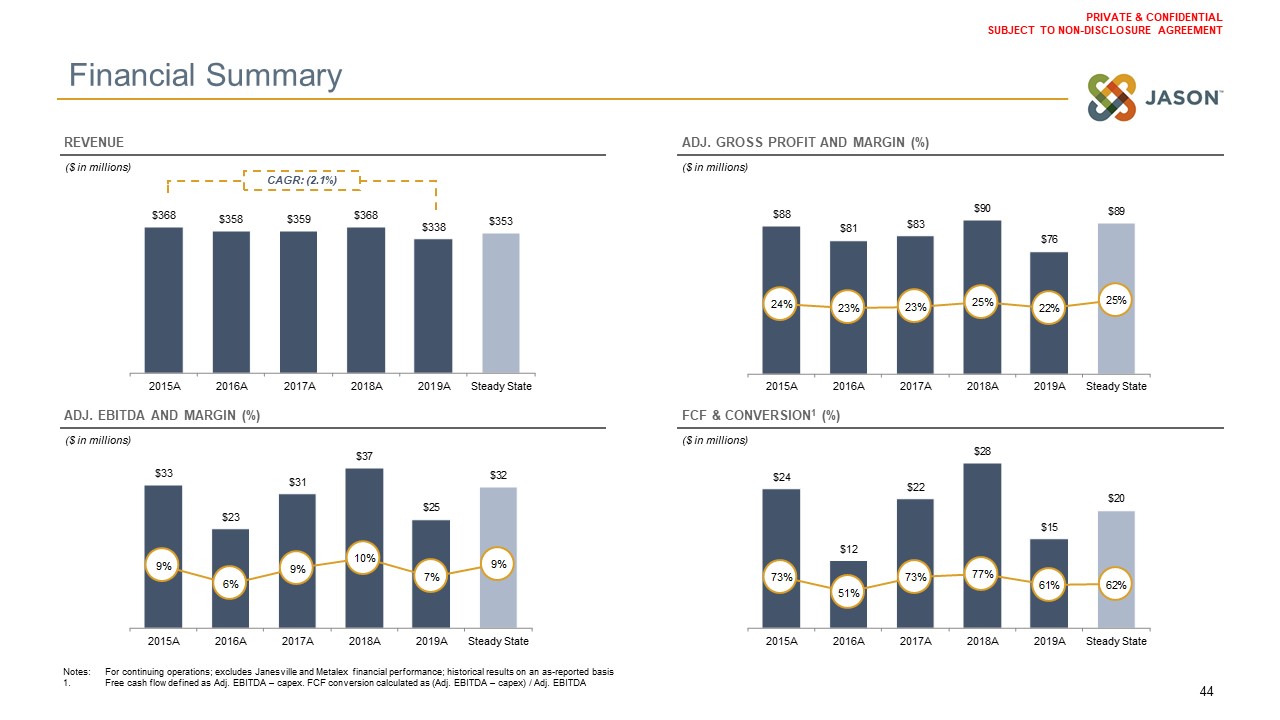
($ in millions) ($ in millions) ($ in millions) ($ in millions) Free cash flow defined as Adj. EBITDA
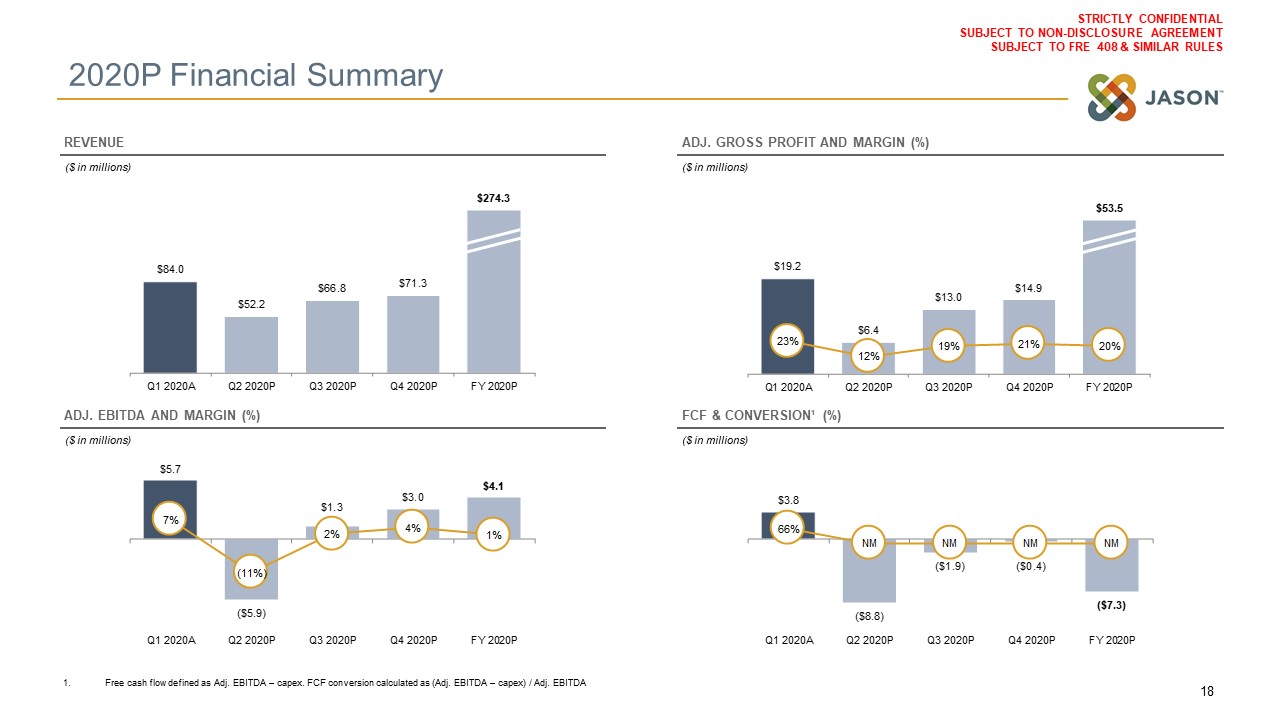
– capex. FCF conversion calculated as (Adj. EBITDA – capex) / Adj. EBITDA 18 REVENUE ADJ. GROSS PROFIT AND MARGIN (%) ADJ. EBITDA AND MARGIN (%) FCF & CONVERSION¹ (%) 2020P Financial Summary
($ in millions) ($ in millions) ($ in millions) ($ in millions) Free cash flow defined as Adj. EBITDA
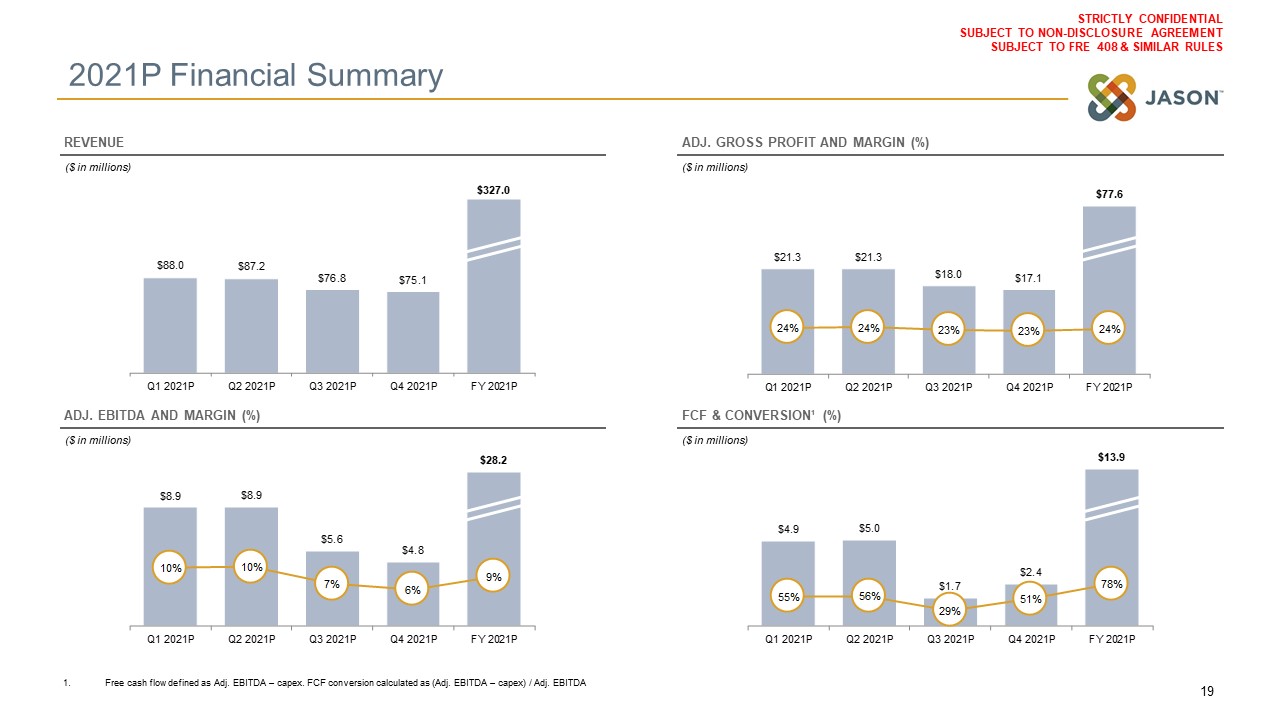
– capex. FCF conversion calculated as (Adj. EBITDA – capex) / Adj. EBITDA 19 REVENUE ADJ. GROSS PROFIT AND MARGIN (%) ADJ. EBITDA AND MARGIN (%) FCF & CONVERSION¹ (%) 2021P Financial Summary
($ in millions) ($ in millions) ($ in millions) ($ in millions) Free cash flow defined as Adj. EBITDA
– capex. FCF conversion calculated as (Adj. EBITDA – capex) / Adj. EBITDA 20 REVENUE ADJ. GROSS PROFIT AND MARGIN (%) ADJ. EBITDA AND MARGIN (%) FCF & CONVERSION¹ (%) Projected Financial Summary CAGR: 2.7%
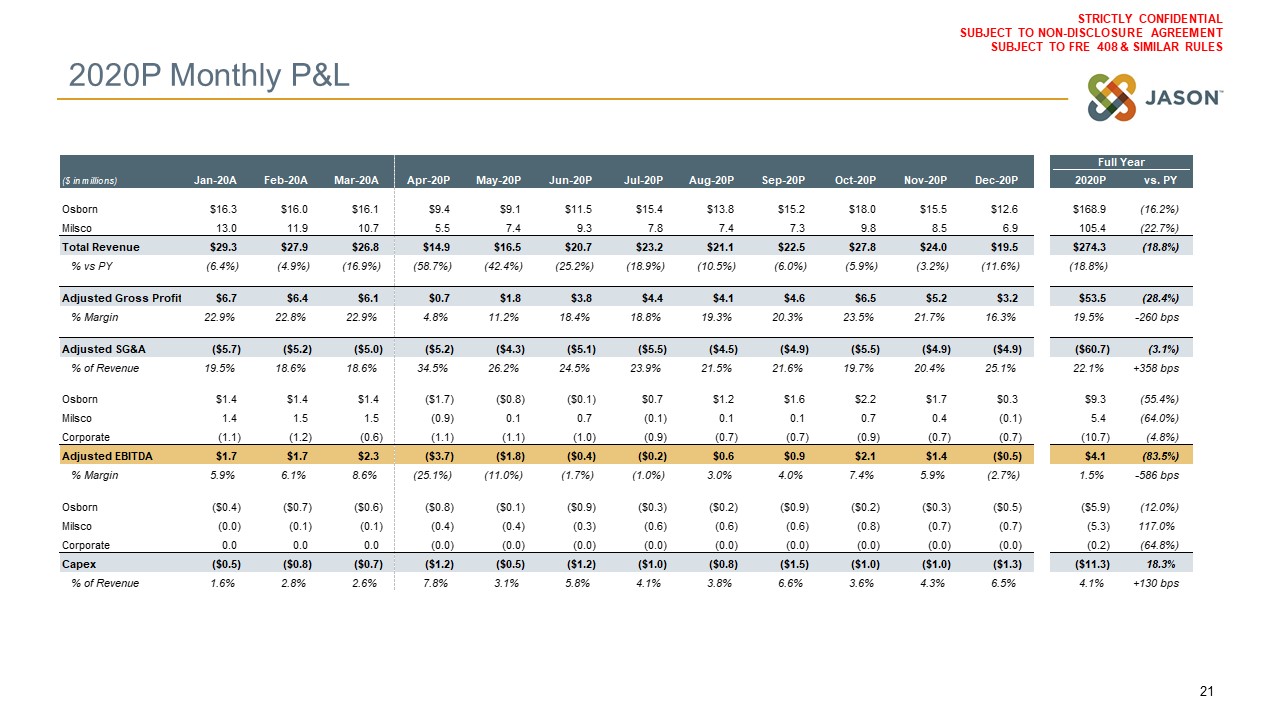
2020P Monthly P&L 21
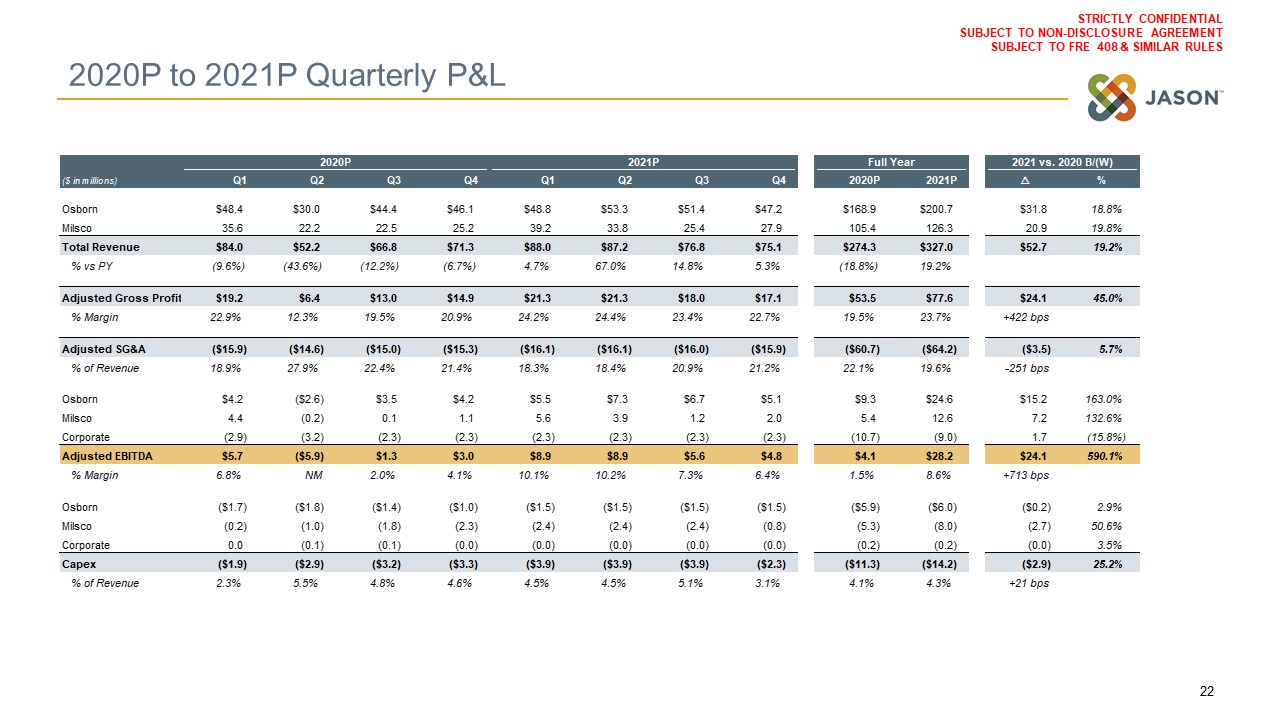
2020P to 2021P Quarterly P&L 22
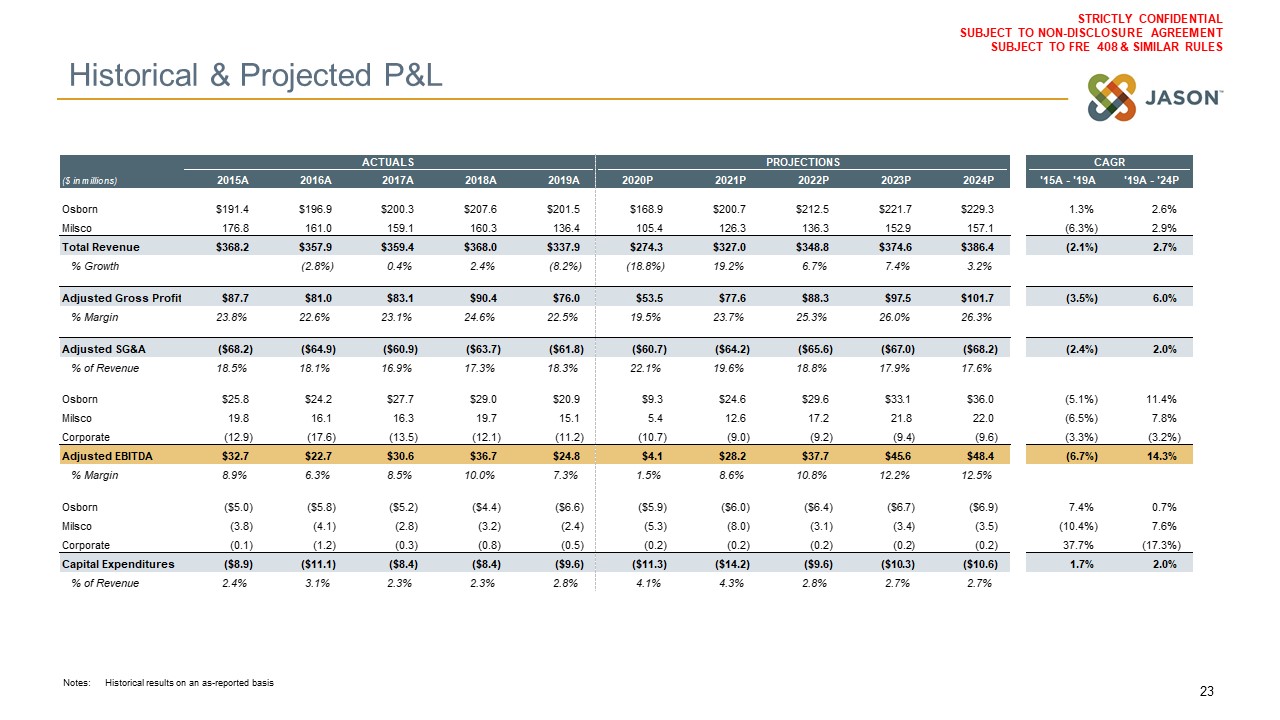
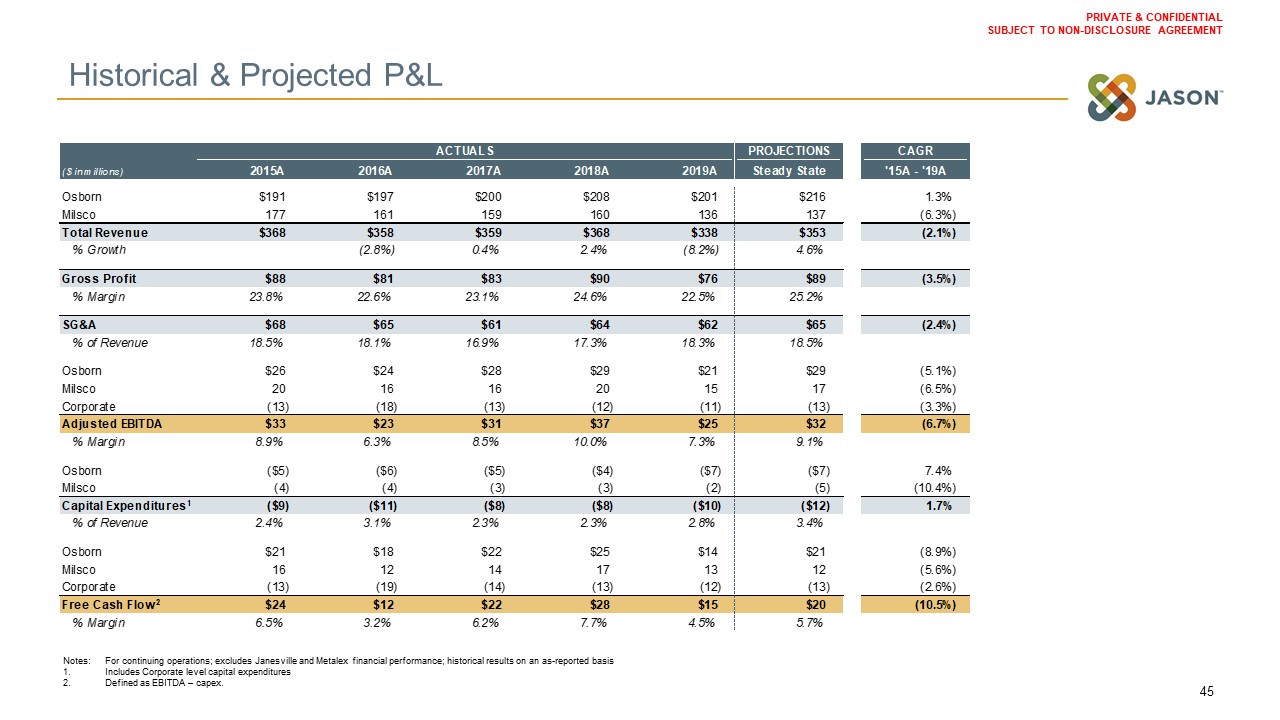
Historical & Projected P&L Notes: Historical results on an as-reported basis 23
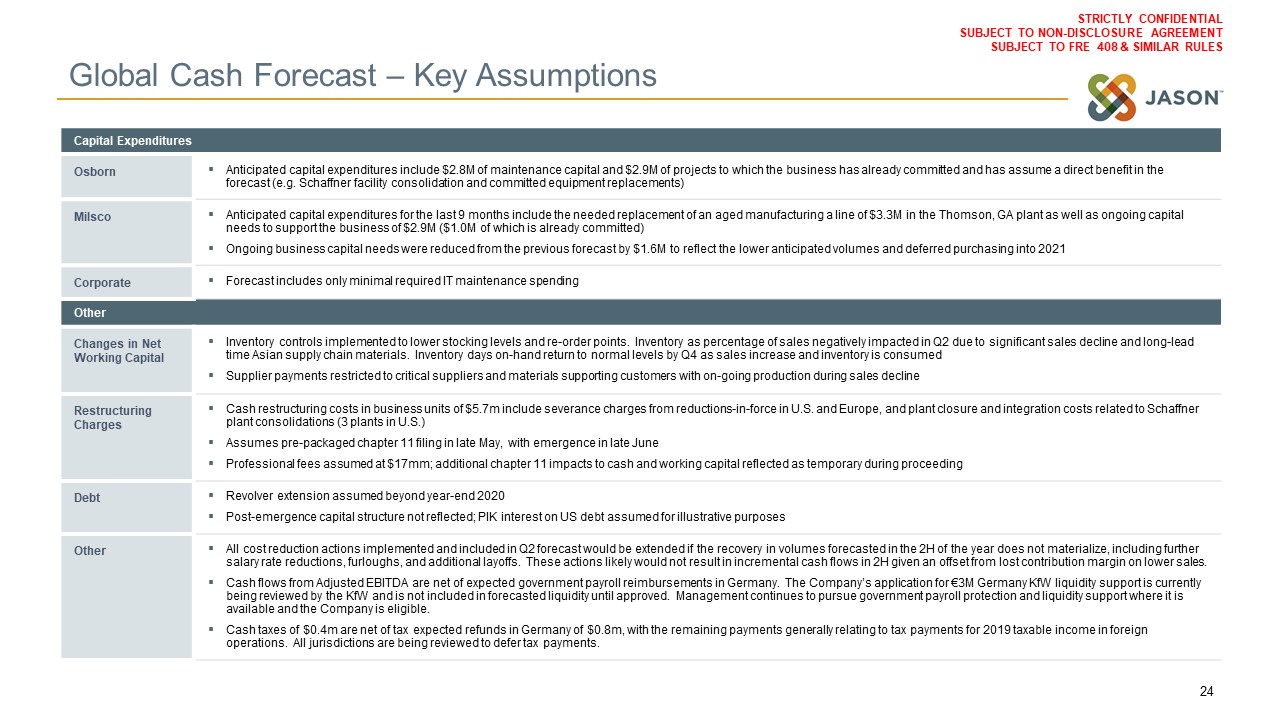
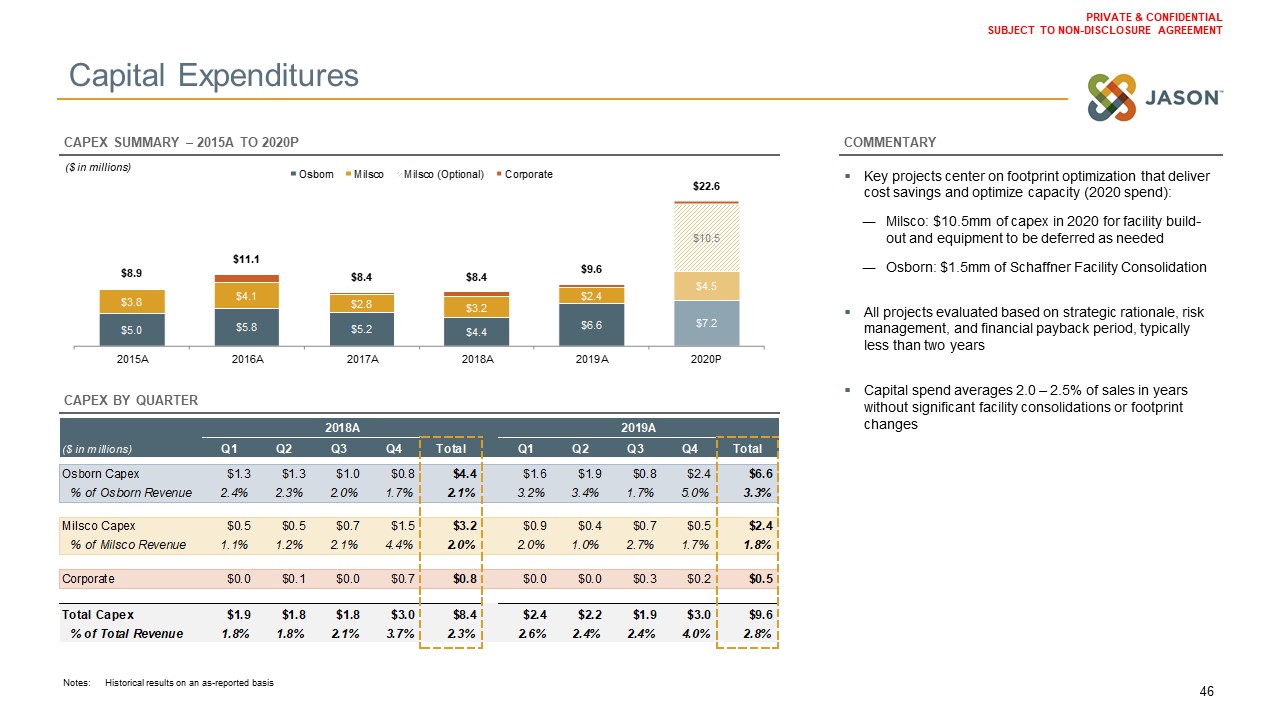
Global Cash Forecast – Key Assumptions 24 Capital Expenditures Osborn Anticipated capital
expenditures include $2.8M of maintenance capital and $2.9M of projects to which the business has already committed and has assume a direct benefit in the forecast (e.g. Schaffner facility consolidation and committed equipment
replacements) Milsco Anticipated capital expenditures for the last 9 months include the needed replacement of an aged manufacturing a line of $3.3M in the Thomson, GA plant as well as ongoing capital needs to support the business of $2.9M
($1.0M of which is already committed)Ongoing business capital needs were reduced from the previous forecast by $1.6M to reflect the lower anticipated volumes and deferred purchasing into 2021 Corporate Forecast includes only minimal required
IT maintenance spending Other Changes in Net Working Capital Inventory controls implemented to lower stocking levels and re-order points. Inventory as percentage of sales negatively impacted in Q2 due to significant sales decline and
long-lead time Asian supply chain materials. Inventory days on-hand return to normal levels by Q4 as sales increase and inventory is consumedSupplier payments restricted to critical suppliers and materials supporting customers with on-going
production during sales decline Restructuring Charges Cash restructuring costs in business units of $5.7m include severance charges from reductions-in-force in U.S. and Europe, and plant closure and integration costs related to Schaffner
plant consolidations (3 plants in U.S.)Assumes pre-packaged chapter 11 filing in late May, with emergence in late JuneProfessional fees assumed at $17mm; additional chapter 11 impacts to cash and working capital reflected as temporary during
proceeding Debt Revolver extension assumed beyond year-end 2020Post-emergence capital structure not reflected; PIK interest on US debt assumed for illustrative purposes Other All cost reduction actions implemented and included in Q2
forecast would be extended if the recovery in volumes forecasted in the 2H of the year does not materialize, including further salary rate reductions, furloughs, and additional layoffs. These actions likely would not result in incremental cash
flows in 2H given an offset from lost contribution margin on lower sales.Cash flows from Adjusted EBITDA are net of expected government payroll reimbursements in Germany. The Company’s application for €3M Germany KfW liquidity support is
currently being reviewed by the KfW and is not included in forecasted liquidity until approved. Management continues to pursue government payroll protection and liquidity support where it is available and the Company is eligible.Cash taxes of
$0.4m are net of tax expected refunds in Germany of $0.8m, with the remaining payments generally relating to tax payments for 2019 taxable income in foreign operations. All jurisdictions are being reviewed to defer tax payments.
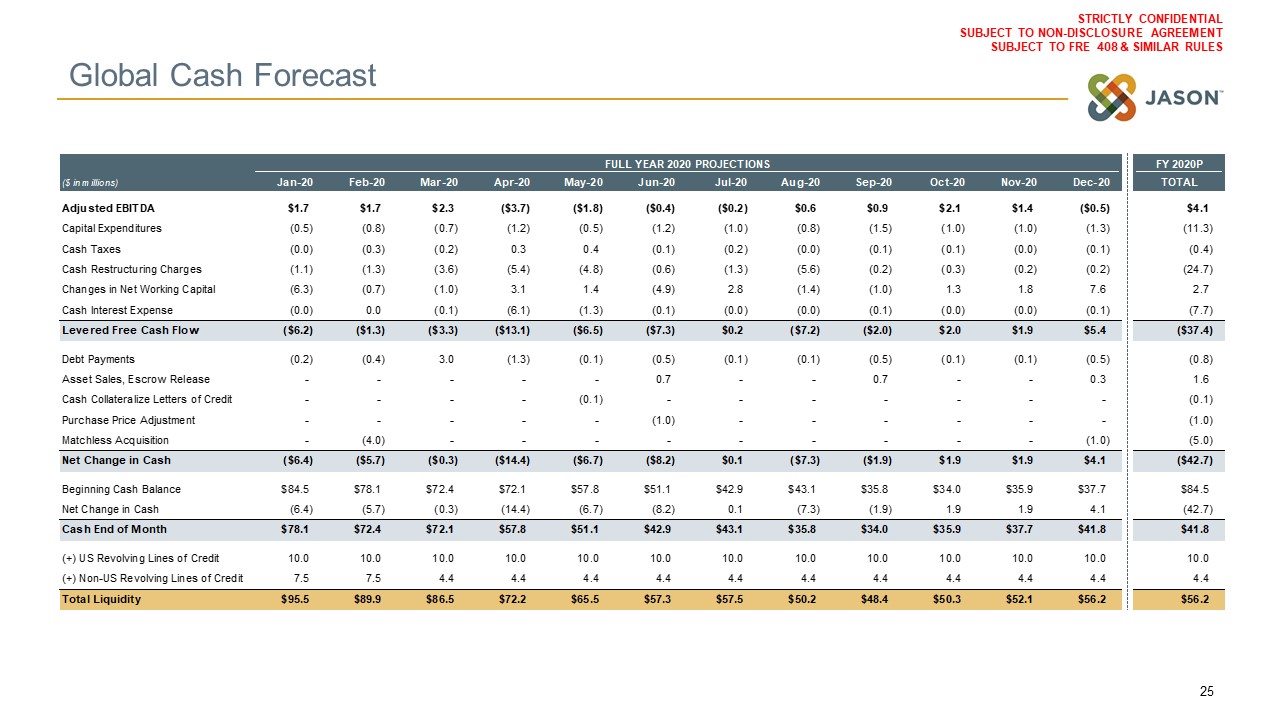
Global Cash Forecast 25
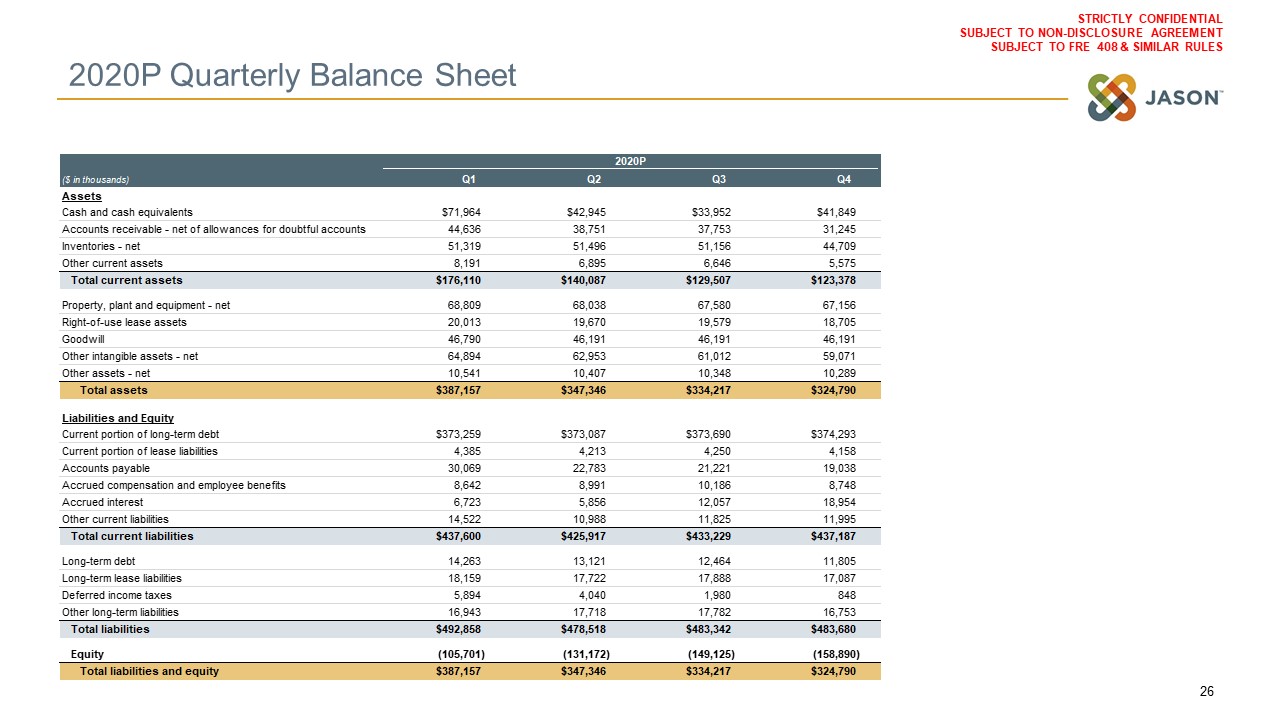
2020P Quarterly Balance Sheet 26