.2

3Q 2025 Earnings Supplement November 4, 2025
.2
3Q 2025 Earnings Supplement November 4, 2025
Disclosures This presentation includes forward-looking statements within the meaning of the Private Securities Litigation Reform Act of 1995 and Section 21E of the Securities Exchange Act of 1934, as amended. All statements other than statements of historical facts contained in this presentation, including statements regarding the outcome of the operational and portfolio reviews, the costs, cash outlays, benefits, timing and financial impacts of the actions that may be taken or transactions entered into in connection with the operational and portfolio reviews, expected benefits and synergies of the acquisition of Sertifi LLC, the benefits of Sertifi’s platform, financial results and margins, Flywire’s ability to successfully implement Flywire’s business plan, future results of operations and financial position, business strategy and plans and Flywire’s objectives for future operations, are forward -looking statements. The words “believe,” “may,” “will,” “estimate,” “continue,” “anticipate,” “intend,” “expect,” “plans,” “potential,” “seeks,” “projects,” “should,” “could” and “would” and similar expressions are intended to identify forward -looking statements, although not all forward-looking statements contain these identifying words. Flywire has based these forward-looking statements largely on Flywire’s current expectations and projections about future events and financial trends that Flywire believes may affect Flywire’s financial condition, results of operations, business strategy, short-term and long-term business operations and objectives, and financial needs. These forward-looking statements are subject to a number of risks, uncertainties and assumptions that are described in the “Risk Factors” and “Management’s Discussion and Analysis of Financial Condition and Results of Operations” sections of Flywire’s Annual Report on Form 10-K for the year ended December 31, 2024 and Quarterly Report on Form 10-Q for the quarter ended June 30, 2025, which are on file with the Securities and Exchange Commission (SEC) and available on the SEC’s website at www.sec.gov. Additional factors may be described in those sections of Flywire’s Quarterly Report on Form 10-Q for the quarter ended September 30, 2025, expected to be filed with the SEC in the fourth quarter of 2025. In light of these risks, uncertainties and assumptions, the forward -looking events and circumstances discussed in this presentation may not occur and actual results could differ materially and adversely from those anticipated or implied in the forward-looking statements. You should not rely upon forward-looking statements as predictions of future events or performance. In addition, projections, assumptions and estimates of the future performance of the industries in which Flywire operates and the markets it serves are inherently imprecise and subject to a high degree of uncertainty and risk. All financial projections contained in this presentation are forward -looking statements and are based on Flywire’s management’s assessment of such matters. It is unlikely, however, that the assumptions on which Flywire has based its projections will prove to be fully correct or that the projected figures will be attained. Flywire’s actual future results may differ materially from Flywire’s projections, and it makes no express or implied representation or warranty as to attainability of the results reflected in these projections. Investments in Flywire’s securities involve a high degree of risk and should be regarded as speculative. The information in this presentation is provided only as of November 4, 2025, and Flywire undertakes no obligation to update any forward-looking statements contained in this presentation on account of new information, future events, or otherwise, except as required by law. This presentation contains certain non-GAAP financial measures as defined by SEC rules. Flywire has provided a reconciliation of those measures to the most directly comparable GAAP measures, which is available in the Appendix. The company has not provided a quantitative reconciliation of forecasted FX-Neutral Revenue Less Ancillary Services Growth to forecasted GAAP Revenue Growth or forecasted Adjusted EBITDA Margin Growth to forecasted GAAP Net Income Margin Growth or to forecasted GAAP net income (loss) before income taxes within this presentation because Flywire is unable, without making unreasonable efforts, to calculate certain reconciling items with confidence. These items include but are not limited to income taxes which are directly impacted by unpredictable fluctuations in the market price of the company’s stock and in foreign exchange rates.
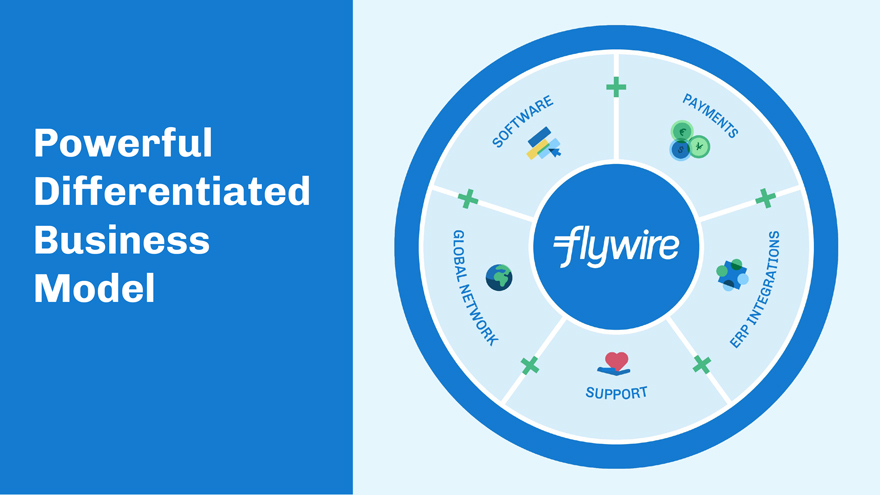
Powerful Differentiated Business Model

Q3 2025 Performance
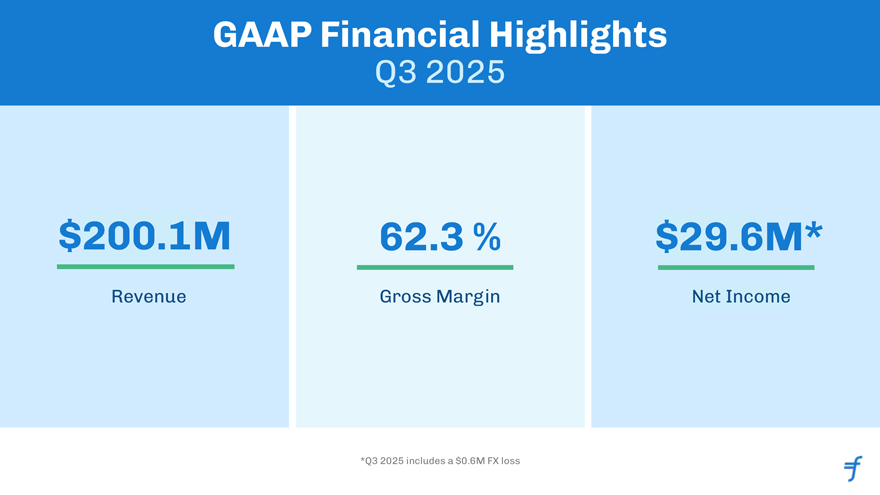
GAAP Financial Highlights Q3 2025 $200.1M Revenue 62.3 % Gross Margin $29.6M* Net Income
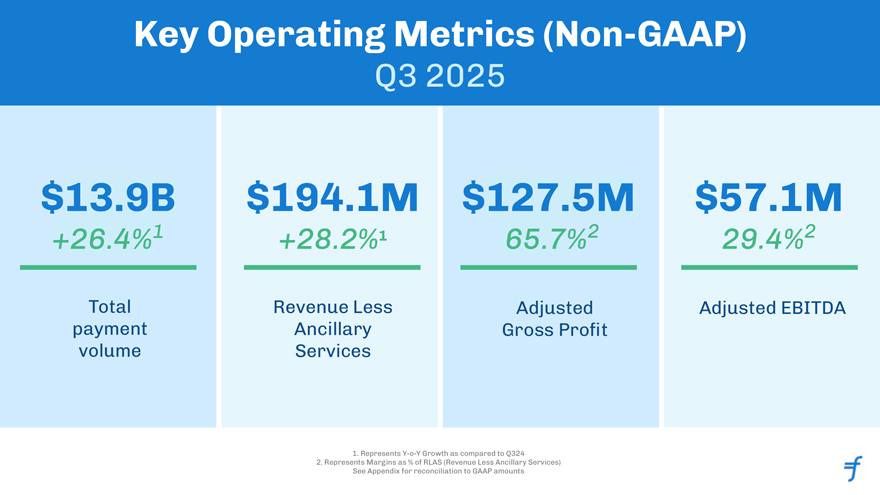
Key Operating Metrics (Non-GAAP) Q3 2025 $13.9B +26.4%1 $194.1M +28.2%1$127.5M 65.7%2 $57.1M 29.4%2 Total paymentvolume Revenue Less Ancillary Services Adjusted Gross Profit Adjusted EBITDA
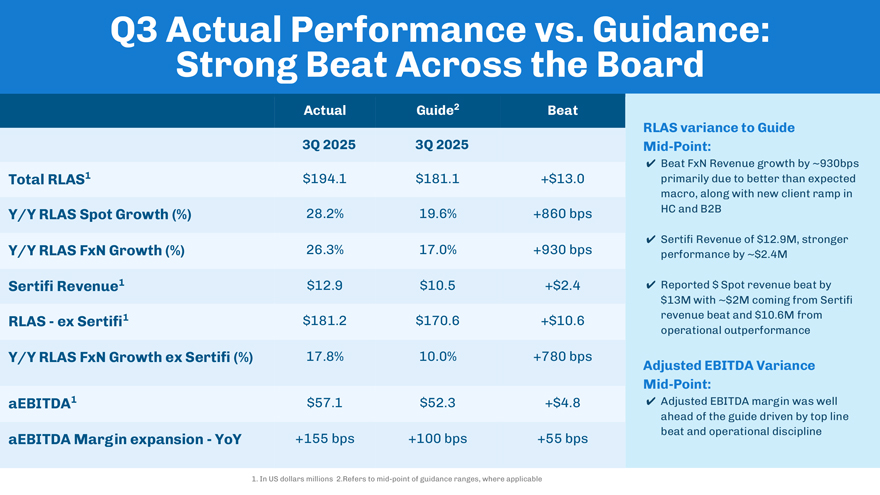
Q3 Actual Performance vs. Guidance: Strong Beat Across the Board Actual Guide2 Beat RLAS variance to Guide 3Q 2025 3Q 2025 Mid-Point: ✓ Beat FxN Revenue growth by ~930bps Total RLAS1 $194.1 $181.1 +$13.0 primarily due to better than expected macro, along with new client ramp in Y /Y RLAS Spot Growth (%) 28.2% 19.6% +860 bps HC and B2B ✓ Sertifi Revenue of $12.9M, stronger Y /Y RLAS FxN Growth (%) 26.3% 17.0% +930 bps performance by ~$2.4M Sertifi Revenue1 $12.9 $10.5 +$2.4 ✓ Reported $ Spot revenue beat by $13M with ~$2M coming from Sertifi RLAS—ex Sertifi1 $181.2 $170.6 +$10.6 revenue beat and $10.6M from operational outperformance Y /Y RLAS FxN Growth ex Sertifi (%) 17.8% 10.0% +780 bps Adjusted EBITDA Variance Mid-Point: aEBITDA1 $57.1 $52.3 +$4.8 ✓ Adjusted EBITDA margin was well ahead of the guide driven by top line beat and operational discipline aEBITDA Margin expansion—YoY +155 bps +100 bps +55 bps 1. In US dollars millions 2.Refers to mid-point of guidance ranges, where applicable
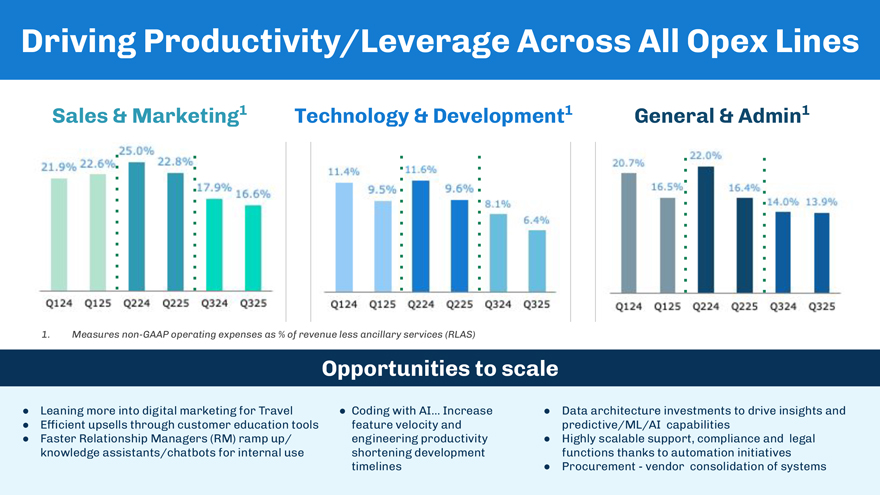
Driving Productivity/Leverage Across All Opex Lines Sales & Marketing1 Technology & Development1 General & Admin1 2122.6% n 4% ,U6% . 2O^o — ; • I I a7.9% ¦ 9-5%’ H 9.6%: I 16.5< I 16.4%; Illi : 11I L11 Q124 Q125 Q224 Q225 Q324 Q325 Q124 Q125 Q224 Q225 Q324 Q325 Q124 Q125 Q224 Q225 Q324 Q325 1. Measures non-GAAP operating expenses as % of revenue less ancillary services (RLAS) Opportunities to scale • Leaning more into digital marketing for Travel • Coding with AI... Increase • Data architecture investments to drive insights and • Efficient upsells through customer education tools feature velocity and predictive/ML/AI capabilities • Faster Relationship Managers (RM) ramp up/ engineering productivity • Highly scalable support, compliance and legal knowledge assistants/chatbots for internal use shortening development functions thanks to automation initiatives timelines • Procurement—vendor consolidation of systems

Spotlight: SFS Strategy ¥ $H£€ R ^ ¥ $H£€i

Students fear confusing bills, inflexible deadlines & payment completion Staff overwhelmed by manual payment reconciliation & student inquiries Collections feel punitive, damaging student credit & relationships IT teams daunted, juggling multiple disconnected systems

Helps domestic and international students pay tuition on time with flexible options Finance teams are able to automate reconciliation & better assist students CFOs have complete visibility into cash flow & improved collections IT leaders enjoy one technical partner and ease of management & upgrades

The Journey Ahead, Together Our mission to support your institution’s goals Unify & support the entire student journey Simplify all domestic & international payments Drive student enrollment & retention

UK SFS Client Example Anglia Ruskin University: Before & After SFS

Online payment portal UK open ranking Welcome to Anglia Ruskin University’s secure online payment service. This section R C m R P ir^ti^^^ <-’—; *” method of paying your tuition and ocoomodoHcn fee. It BEFORE. scams and fraud scams and frauds V V J I A Frequently asked questions yOU-re a uk student you can defer your tuition fee payments by taking out a student loan. W V 1 I Terms and conditions Many part-time students can also apply fora loan, and you won’t start paying it back until after you graduate. Find cut more about loans ~for undergraduate arc postgraduate students. Paying tuition and accommodotion fees Anglia Ruskin University no longer accepts payments directly into our bank account. Tuition and accommodation fees can both be paid directly using the methods below. If you have any questions or need help, please contact the Fees Team on 44 (0) 1245 683190 B.lLN«VVS b balance Details of how to pay your deposit will be included with your offer Letter You can Log_into your applicant portal on eVision to make your deposit payment JS^Emipi^^^H I If you have any questions regarding your deposit payment, please contact your admissions set-up Bank transfer from a UK bank account v X No secure authentication International bank transfer v X Payer entered an amount Debit or credit card v with no validation against their account balance Scams and fraud
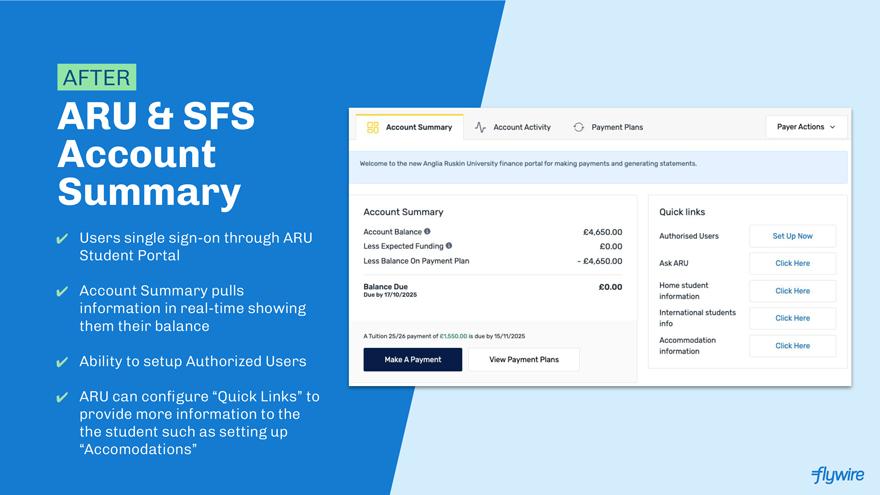
AFTER. ARU & SFS Account Summary ✓ Users single sign-on through ARU Student Portal ✓ Account Summary pulls information in real-time showing them their balance ✓ Ability to setup Authorized Users ✓ ARU can configure “Quick Links” to provide more information to the the student such as setting up “Accomodations” Account Summary Account Activity Payment Plans Payer Actions Welcome to the new Anglia Ruskin University finance portal for making payments and generating statements. Account Summary Quick links Account Balance© £4.650.00 Authorised Users Set Up Now Less Expected Funding O £0.00 Less Balance On Payment Plan -£4,650.00 Ask ARU Click Here Balance Due £0.00 Home student Due by 17/10/2025 information International students Click Here info A Tuition 25/26 payment of £1,550.00 is due by 15/11/2025 . ... Accommodation _ Click Here information View Payment Plans flywire
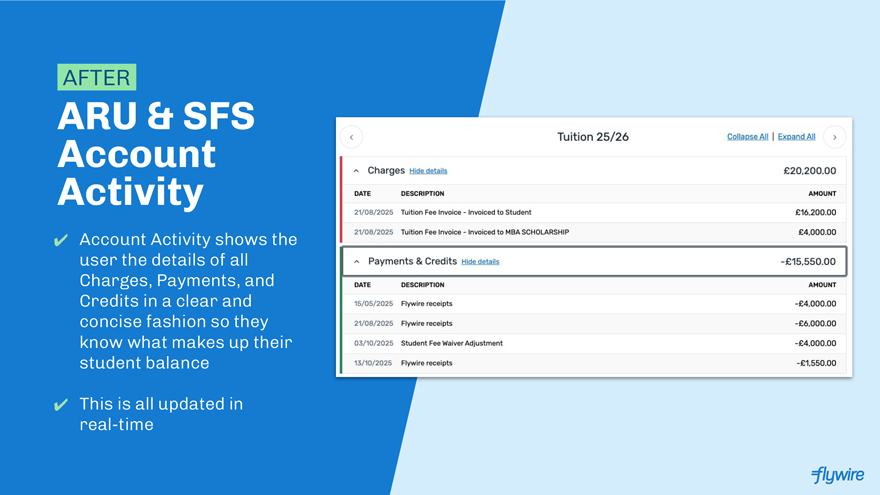
AFTER. ARU & SFS Account Activity ✓ Account Activity shows the user the details of all Charges, Payments, and Credits in a clear and concise fashion so they know what makes up their student balance ✓ This is all updated in real-time Tuition 25/26 Collapse All | Expand All > Charges Hide details £20.200.00 DATE DESCRIPTION AMOUNT 21/08/2025 Tuition Fee Invoice—Invoiced to Student £16.200.00 21/08/2025 Tuition Fee Invoice -Invoiced to MBA SCHOLARSHIP £4.000.00 Payments & Credits Hide details -£15,550.00 DATE DESCRIPTION AMOUNT 15/05/2025 Flywire receipts -£4,000.00 21/08/2025 Flywire receipts -£6.000.00 03/10/2025 Student Fee Waiver Adjustment -£4.000.00 13/10/2025 Flywire receipts -£1,550.00
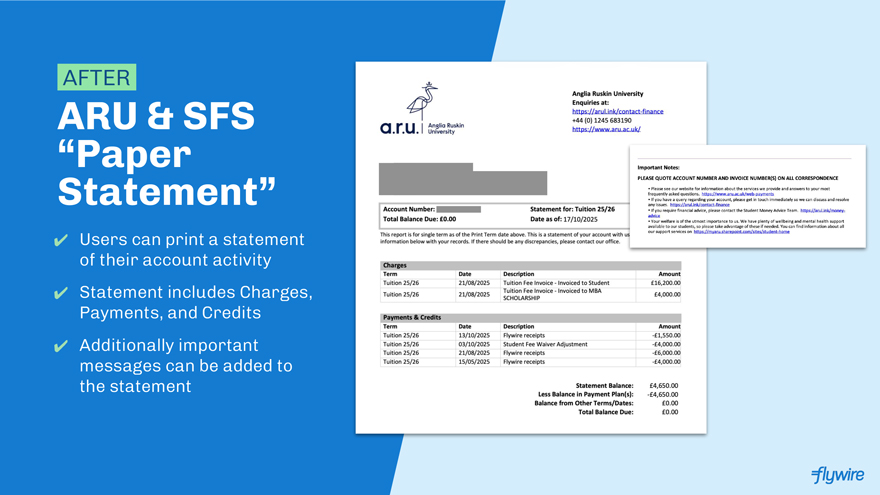
AFTER. ARU & SFS “Paper Statement” Users can print a statement of their account activity ✓ Statement includes Charges, Payments, and Credits ✓ Additionally important messages can be added to the statement Anglia Ruskin University Enquiries at: https://arul.ink/contact-finance +44(0)1245 683190 O.r.U. https://www.aru.ac.uk/ Important Notes: PLEASE QUOTE ACCOUNT NUMBER AND INVOICE NUMBER(S) ON ALL CORRESPONDENCE • Please see our website for information about the services we provide and answers to your most frequently asked questions, https://www.aru.ac.uk/web-payments • If you have a query regarding your account, please get in touch immediately so we can discuss and resolve ‘ any issues, https://arul.ink/contact-finance Account Number: Statement for: Tuition 25/26 • If you require financial advice, please contact the Student Money Advice Team, https://arul.ink/money- Total Balance Due. £0.00 Date as of. 17/10/2025 • Your welfare is of the utmost importance to us. We have plenty of wellbeing and mental health support available to our students, so please take advantage of these if needed. You can find information about all This report is for single term as of the Print Term date above. This is a statement of your account with us our support services on https://myaru.sharepoint.com/sites/student-home information below with your records. If there should be any discrepancies, please contact our office. Charges Term Date Description Amount Tuition 25/26 21/08/2025 Tuition Fee Invoice—Invoiced to Student £16,200.00 Tuition 25/26 21/08/2025 Tuition Fee Invoice—Invoiced to MBA £4,000.00 SCHOLARSHIP Payments & Credits Term Date Description Amount Tuition 25/26 13/10/2025 Flywire receipts -£1,550.00 Tuition 25/26 03/10/2025 Student Fee Waiver Adjustment -£4,000.00 Tuition 25/26 21/08/2025 Flywire receipts £6,000.00 Tuition 25/26 15/05/2025 Flywire receipts -£4,000.00 Statement Balance: £4,650.00 Less Balance in Payment Plan(s): -£4,650.00 Balance from Other Terms/Dates: £0.00 Total Balance Due: £0.00

AFTER. ARU & SFS Payment Plan ✓ Students and authorized users can now enroll in a payment plan ✓ Payment plans are updated in real-time with the finance system Account Summary Account Activity Payment Plans Tuition 25/26—Anglia Ruskin University Payer’s active plan Payment Due by 15/11/2025 Balance Balance 3 Paid Remaining Remaining £1,550.00 £1.550.00 £4,650.00 View Schedule A payment of £1,550.00 is due by 15/11/2025
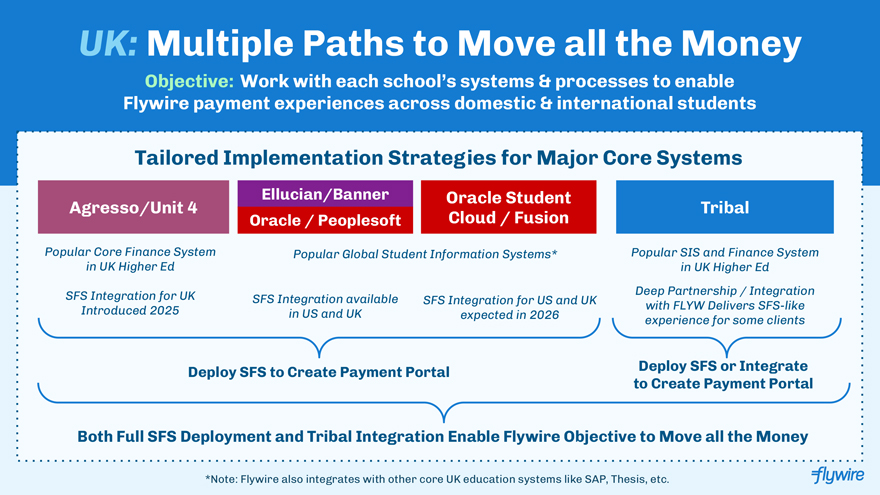
UK: Multiple Paths to Move all the Money Objective: Work with each school’s systems & processes to enable Flywire payment experiences across domestic & international students Tailored Implementation Strategies for Major Core Systems I Ellucian/Banner Oracle Student Agresso/Unit 4 Tribal Oracle / Peoplesoft Cloud / Fusion Popular Core Finance System Popular Global Student Information Systems* Popular SIS and Finance System in UK Higher Ed in UK Higher Ed SFS Integration for UK Deep Partnership / Integration SFS Integration available SFS Integration for US and UK with FLYW Delivers SFS-like Introduced 2025 in US and UK expected in 2026 experience for some clients Deploy SFS to Create Payment Portal Deploy SFS or Integrate to Create Payment Portal Both Full SFS Deployment and Tribal Integration Enable Flywire Objective to Move all the Money *Note: Flywire also integrates with other core UK education systems like SAP, Thesis, etc. flywire
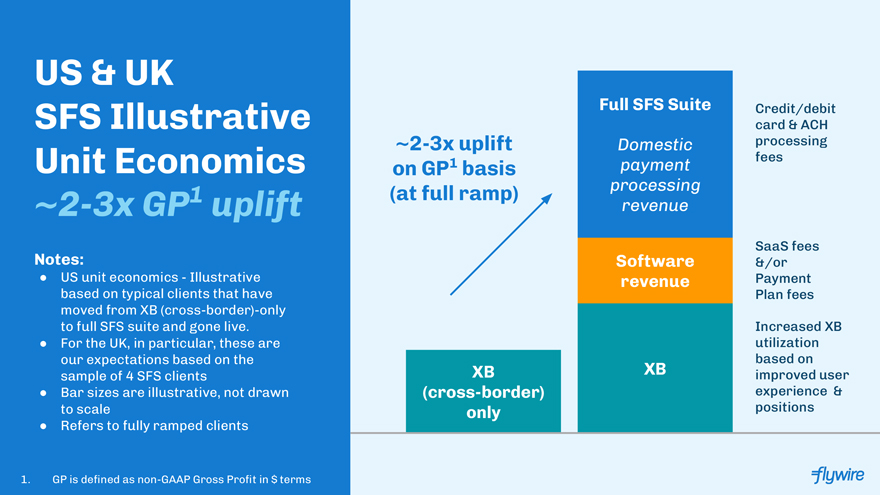
flywire US & UK SFS Illustrative Unit Economics ~2-3x GP1 uplift Notes: • US unit economics—Illustrative based on typical clients that have moved from XB (cross-border)-only to full SFS suite and gone live. • For the UK, in particular, these are our expectations based on the sample of 4 SFS clients • Bar sizes are illustrative, not drawn to scale • Refers to fully ramped clients 1. GP is defined as non-GAAP Gross Profit in $ terms FullCredit/debit card & ACH processing fees SaaS fees &/or Payment Plan fees Increased XB utilization based on improved user experience & positions
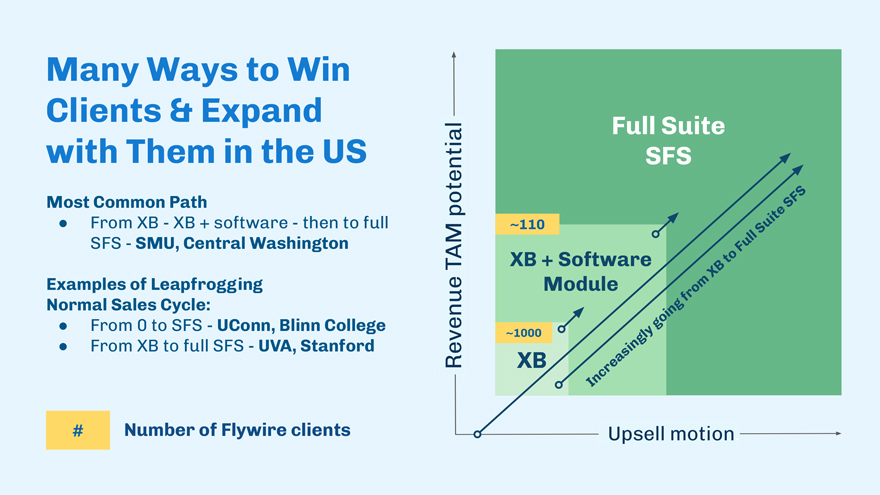
Many Ways to Win Clients & Expand with Them in the US Most Common Path • From XB—XB + software—then to full SFS—SMU, Central Washington Examples of Leapfrogging Normal Sales Cycle: • From 0 to SFS—UConn, Blinn College • From XB to full SFS—UVA, Stanford # Number of Flywire clients Full Suite SFS o ^ ~110 XB + Software Module ~1000 CD / / XB Upsell motion.

Spotlight: B2B & Invoiced
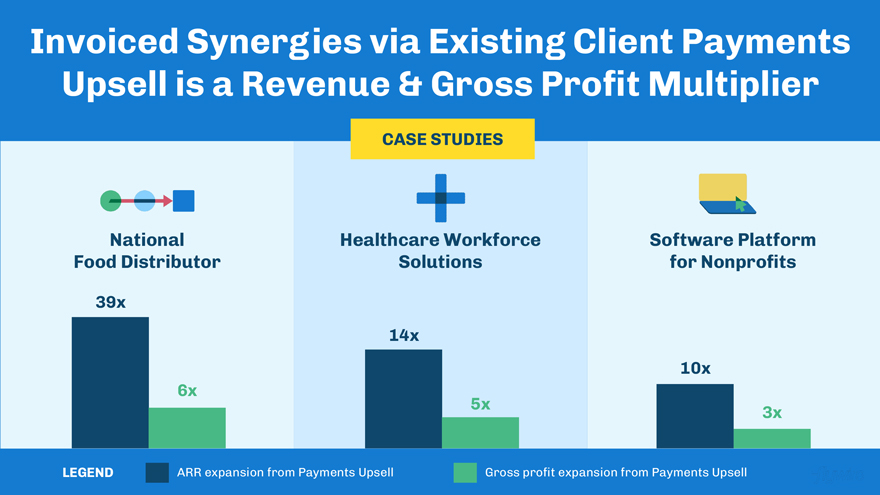
Invoiced Synergies via Existing Client Payments Upsell is a Revenue & Gross Profit Multiplier CASE STUDIES Healthcare Workforce Solutions 39x 14x 10x 6x 5x 3x LEGEND ¦ ARR expansion from Payments Upsell Gross profit expansion from Payments Upsell National Food Distributor Software Platform for Nonprofits

When We Land with AR Software & Payments, We Integrate Critical Workflows for Customers AR Software What delights the finance AR Software Workflows Payment Execution Workflows leads we sell to? Cards Banks ✓ Best-in-class payment capabilities: 140+ currencies METHODS METHODS H M ○ APMs ○ Surcharging 5b6c Visa ‘4242 o i m 1 Bank of America 8-14 Days 1 SEPA Direct Debit Vlsa 4242 H Embedded in industry leading AR software ^^TAiternatiVe MethOds Automation tools In-app integration ✓ Deep ERP integrations Stitch Avalara legalzoom ^ 3 Pay I LQb zapTer + man/morej ✓ Payer-friendly interface Invoiced by Flywire is the last mile that connects businesses’ ERP to their AR billing and payments
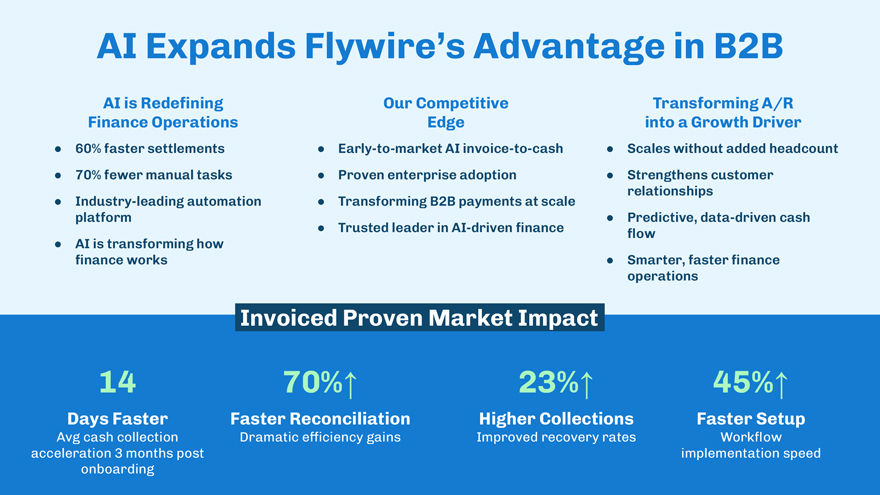
AI Expands Flywire’s Advantage in B2B AI is Redefining Our Competitive Transforming A/R Finance Operations Edge into a Growth Driver • 60% faster settlements • Early-to-market AI invoice-to-cash • Scales without added headcount • 70% fewer manual tasks • Proven enterprise adoption • Strengthens customer relationships • Industry-leading automation • Transforming B2B payments at scale platform • Predictive, data-driven cash • Trusted leader in AI-driven finance flow • AI is transforming how finance works • Smarter, faster finance operations Invoiced Proven Market Impact. 14 70% 23% 45% Days Faster Faster Reconciliation Higher Collections Faster Setup Avg cash collection Dramatic efficiency gains Improved recovery rates Workflow acceleration 3 months post implementation speed onboarding

2025 & Q4 Financial Outlook
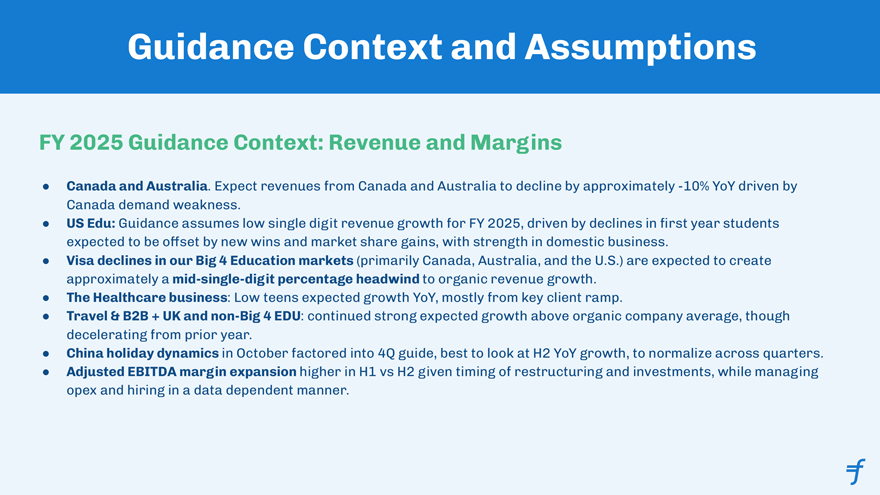
Guidance Context and Assumptions FY 2025 Guidance Context: Revenue and Margins • Canada and Australia. Expect revenues from Canada and Australia to decline by approximately -10% YoY driven by Canada demand weakness. • US Edu: Guidance assumes low single digit revenue growth for FY 2025, driven by declines in first year students expected to be offset by new wins and market share gains, with strength in domestic business. • Visa declines in our Big 4 Education markets (primarily Canada, Australia, and the U.S.) are expected to create approximately a mid-single-digit percentage headwind to organic revenue growth. • The Healthcare business: Low teens expected growth YoY, mostly from key client ramp. • Travel & B2B + UK and non-Big 4 EDU: continued strong expected growth above organic company average, though decelerating from prior year. • China holiday dynamics in October factored into 4Q guide, best to look at H2 YoY growth, to normalize across quarters. • Adjusted EBITDA margin expansion higher in H1 vs H2 given timing of restructuring and investments, while managing opex and hiring in a data dependent manner.
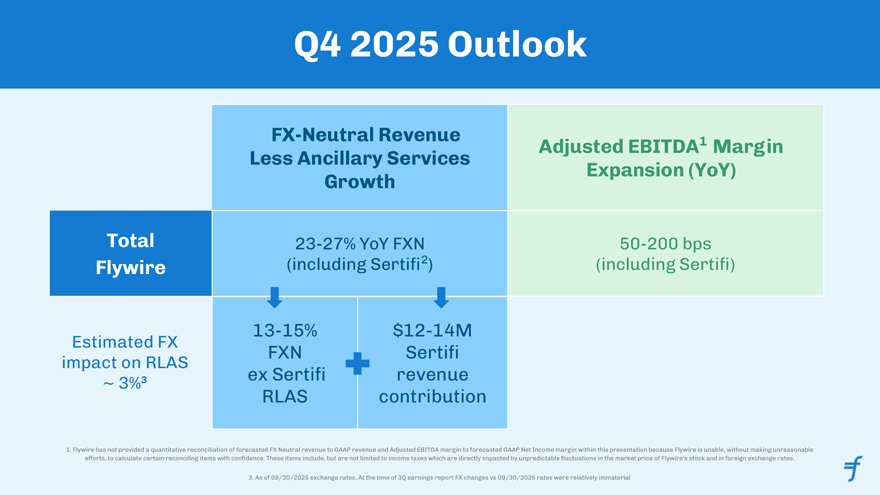
Q4 2025 Outlook FX-Neutral Revenue Adjusted EBITDA1 Margin Less Ancillary Services Growth Expansion (YoY) Tota23-27% YoY FXN 50-200 bps (including Sertifi2) (including Sertifi) 13-15% $12-14M Estimated FX Sertifi impact on RLAS ~ 3%3 ex Sertifi revenue RLAS contribution 1. Flywire has not provided a quantitative reconciliation of forecasted FX Neutral revenue to GAAP revenue and Adjusted EBITDA margin to forecasted GAAP Net Income margin within this presentation because Flywire is unable, without making unreasonable efforts, to calculate certain reconciling items with confidence. These items include, but are not limited to income taxes which are directly impacted by unpredictable fluctuations in the market price of Flywire’s stock and in foreign exchange rates. 3. As of 09/30/2025 exchange rates. At the time of 3Q earnings report FX changes vs 09/30/2025 rates were relatively immaterial
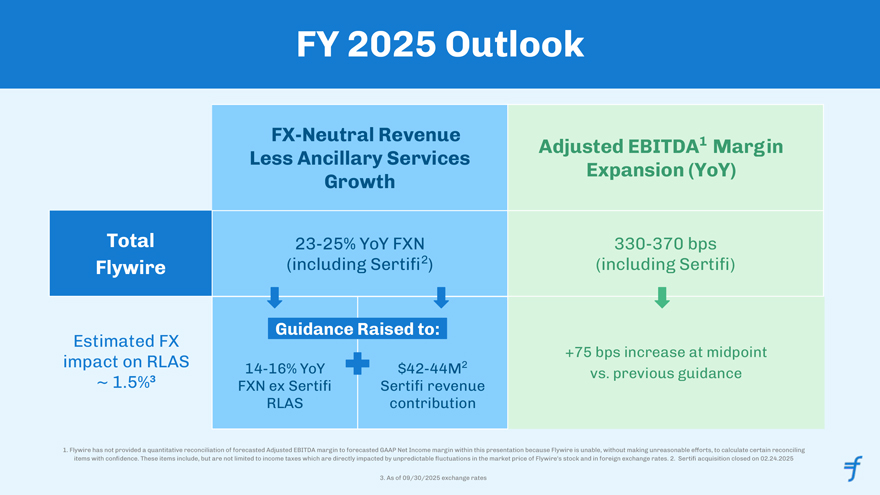
FY 2025 Outlook FX-Neutral Revenue Adjusted EBITDA1 Margin Less Ancillary Services Growth Expansion (YoY) Tota23-25% YoY FXN 330-370 bps (including Sertifi2) (including Sertifi) SBSB Guidance Raised to: RI +75 bps increase at midpoint ~ 3 14-16%YoY $42-44M2 vs. previous guidance ~ 1.5% FXN ex Sertifi Sertifi revenue RLAS contribution 1. Flywire has not provided a quantitative reconciliation of forecasted Adjusted EBITDA margin to forecasted GAAP Net Income margin within this presentation because Flywire is unable, without making unreasonable efforts, to calculate certain reconciling items with confidence. These items include, but are not limited to income taxes which are directly impacted by unpredictable fluctuations in the market price of Flywire’s stock and in foreign exchange rates. 2. Sertifi acquisition closed on 02.24.2025 3. As of 09/30/2025 exchange rates

Capital Allocation and Structure
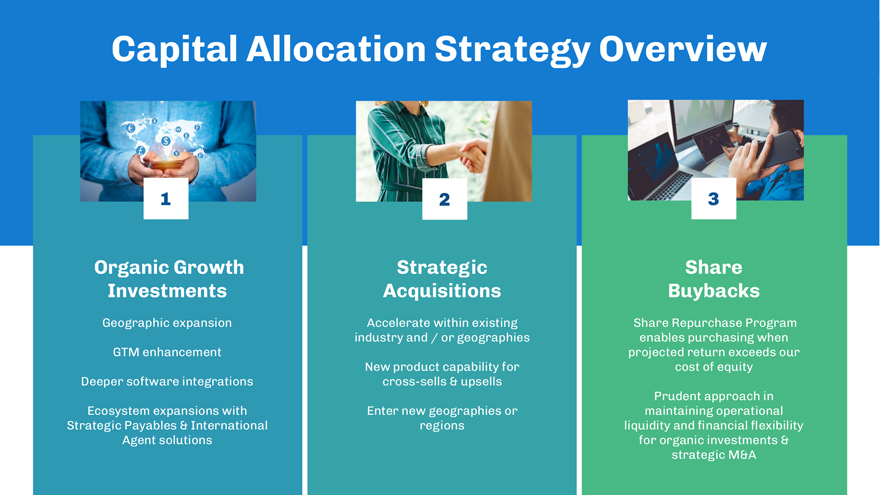
Capital Allocation Strategy Overview Sr1™ 1I u 2 l3 Organic Growth Strategic Share Investments Acquisitions Buybacks Geographic expansion Accelerate within existing Share Repurchase Program industry and / or geographies enables purchasing when GTM enhancement projected return exceeds our New product capability for cost of equity Deeper software integrations cross-sells & upsells Prudent approach in Ecosystem expansions with Enter new geographies or maintaining operational Strategic Payables & International regions liquidity and financial flexibility Agent solutions for organic investments & strategic M&A
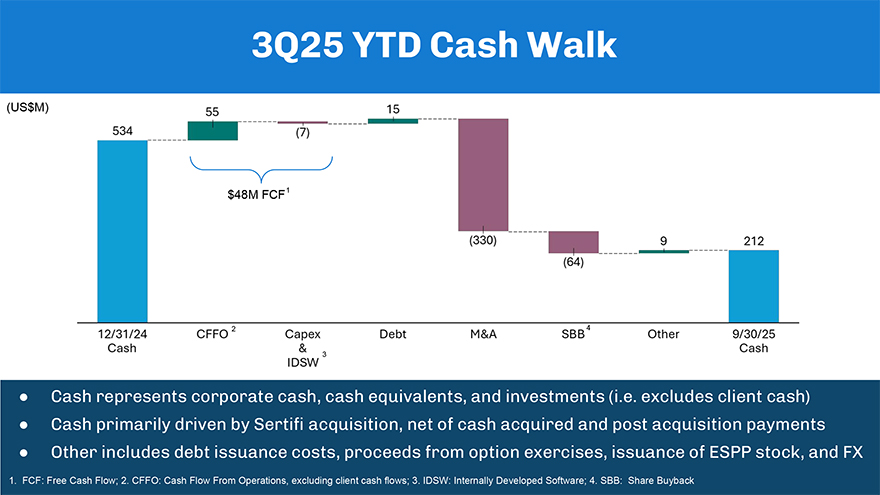
3Q25 YTD Cash Walk (US$M) 1 $48M FCF 2 4 3 Cash represents corporate cash, cash equivalents, and investments (i.e. excludes client cash) Cash primarily driven by Sertifi acquisition, net of cash acquired and post acquisition payments Other includes debt issuance costs, proceeds from option exercises, issuance of ESPP stock, and FX 1. FCF: Free Cash Flow; 2. CFFO: Cash Flow From Operations, excluding client cash flows; 3. IDSW: Internally Developed Software; 4. SBB: Share Buyback
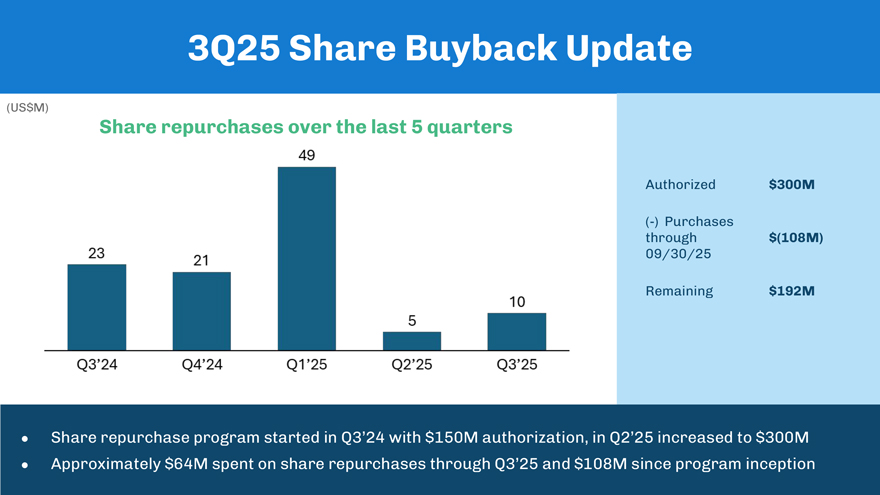
3Q25 Share Buyback Update (US$M) Authorized $300M (-) Purchases through $(108M) 09/30/25 Remaining $192M • Share repurchase program started in Q3’24 with $150M authorization, in Q2’25 increased to $300M • Approximately $64M spent on share repurchases through Q3’25 and $108M since program inception

Appendix
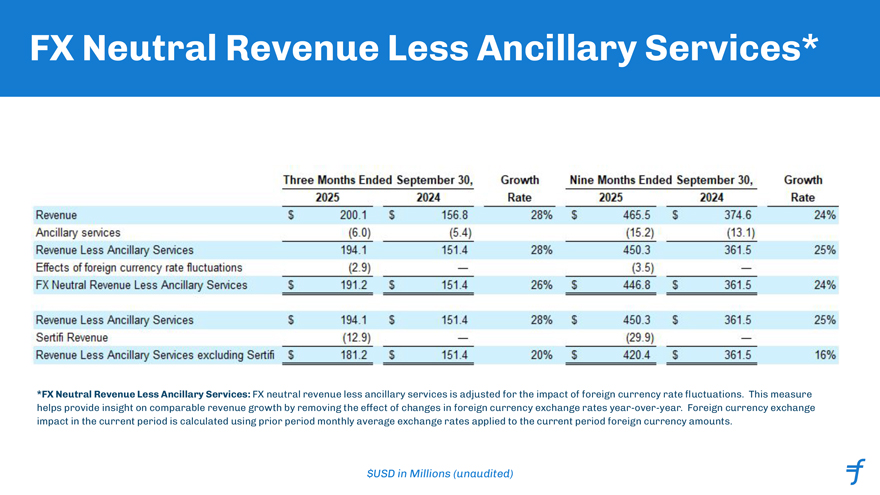
FX Neutral Revenue Less Ancillary Services* Three Months Ended September 30, Growth Nine Months Ended September 30, Growth 2025 2024 Rate 2025 2024 Rate Revenue $ 200.1I $ 156.8 28% $ 465.5 $ 374.6 24% Ancillary services (6.0) (5.4) (15.2) (13.1) Revenue Less Ancillary Services 194.1 151.4 28% 450.3 361.5 25% Effects of foreign currency rate fluctuations (2.9) — (3.5) — FX Neutral Revenue Less Ancillary Services $191.2 $151.4 26% $446.8 $361.5 24% Revenue Less Ancillary Services $ 194.1 $ 151.4 28% $ 450.3 $ 361.5 25% Sertifi Revenue (12.9) — (29.9) — Revenue Less Ancillary Services excluding Sertifi $181.2 $ 151.4 20% $420.4 $361.5 16% *FX Neutral Revenue Less Ancillary Services: FX neutral revenue less ancillary services is adjusted for the impact of foreign currency rate fluctuations. This measure helps provide insight on comparable revenue growth by removing the effect of changes in foreign currency exchange rates year-over-year. Foreign currency exchange impact in the current period is calculated using prior period monthly average exchange rates applied to the current period foreign currency amounts.
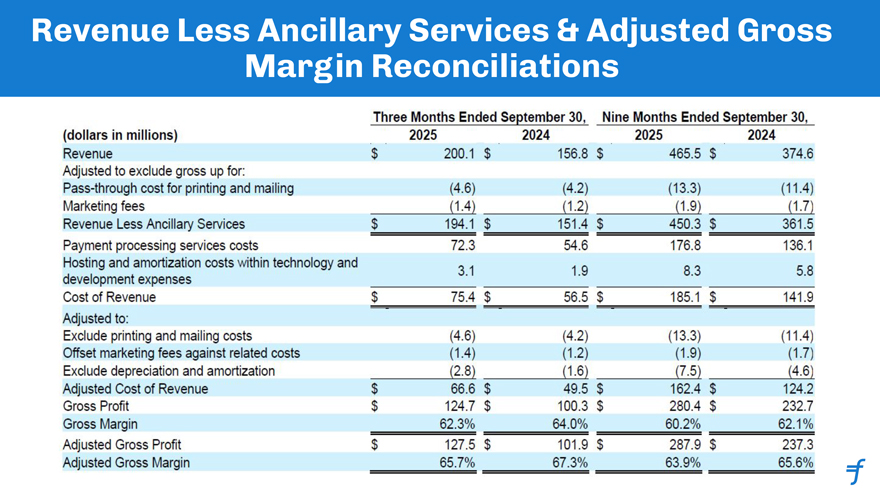
Revenue Less Ancillary Services & Adjusted Gross Margin Reconciliations Three Months Ended September 30, Nine Months Ended September 30, (dollars in millions) 2025 2024 2025 2024 Revenue $ 200.1 $ 156.8 $ 465.5 $ 374.6 Adjusted to exclude gross up for: Pass-through cost for printing and mailing (4.6) (4.2) (13.3) (11.4) Marketing fees (1.4) (1.2) (1.9) (1.7) Revenue Less Ancillary Services $ 194.1 $151.4 $450.3 $361.5 Payment processing services costs 72.3 54.6 176.8 136.1 Hosting and amortization costs within technology and , , 9 8 development expenses Cost of Revenue $ 75.4 $56.5 $185.1 $141.9 Adjusted to: Exclude printing and mailing costs (4.6) (4.2) (13.3) (11.4) Offset marketing fees against related costs (1.4) (1.2) (1.9) (1.7) Exclude depreciation and amortization (2.8) (1.6) (7.5) (4.6) Adjusted Cost of Revenue $ 66.6 $ 49.5 $ 162.4 $ 124.2 Gross Profit $ 124.7 $ 100.3 $ 280.4 $ 232.7 Gross Margin 62.3% 64.0% 60.2% 62.1% Adjusted Gross Profit $ 127.5 $ 101.9 $ 287.9 $ 237.3 Adjusted Gross Margin $USD in Millions (unaudited) 67.3% 63.9% 65.6% ^
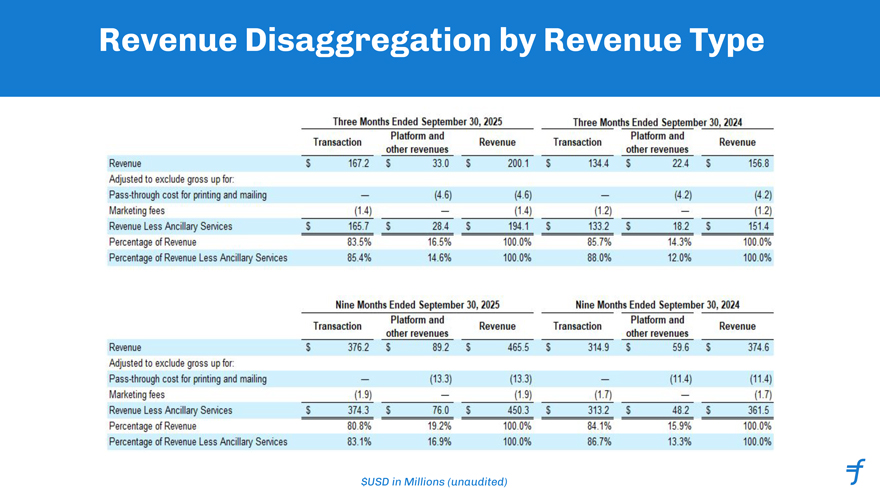
Revenue Disaggregation by Revenue Type Three Months Ended September 30, 2025 Three Months Ended September 30, 2024 T . Platform and n . Platform and n Transaction , Revenue Transaction L Revenue other revenues other revenues Revenue 1 167.2 1 IT 1 200.1 $ 134.4 $ 22.4 $ 156.8 Adjusted to exclude gross up for: Pass-through cost for printing and mailing — (4.6) (4.6) — (4.2) (4.2) Marketing fees (1.4) — (1.4) (1.2) (1-2) Revenue Less Ancillary Services $ 165.7 5 28.4 $ 194,1 $ 133.2 $18.2 $1514 Percentage of Revenue 83.5% 16.5% 100.0% 857% 14.3% 100.0% Percentage of Revenue Less Ancillary Services 85.4% 14.6% 100.0% 88.0% 12.0% 100.0% Nine Months Ended September 30, 2025 Nine Months Ended September 30, 2024 T . Platform and n Platform and n Transaction , Revenue Transaction L Revenue other revenues other revenues Revenue 1 376.2 1 89T $ 465.5 $ 314.9 $ 59.6 $ 374.6 Adjusted to exclude gross up for: Pass-through cost for printing and mailing — (13.3) (13.3) — (11.4) (11.4) Marketing fees (1.9) — (1.9) (17) —_ (17) Revenue Less Ancillary Sen/ices $ 374.3 $ 76.0 $ 450.3 $ 313.2 $48.2 $ 361,5 Percentage of Revenue 80.8% 19.2% 100.0% 84.1% 15.9% 100.0% Percentage of Revenue Less Ancillary Seivices 83.1% 16.9% 100.0% 867% 13.3% 100.0%
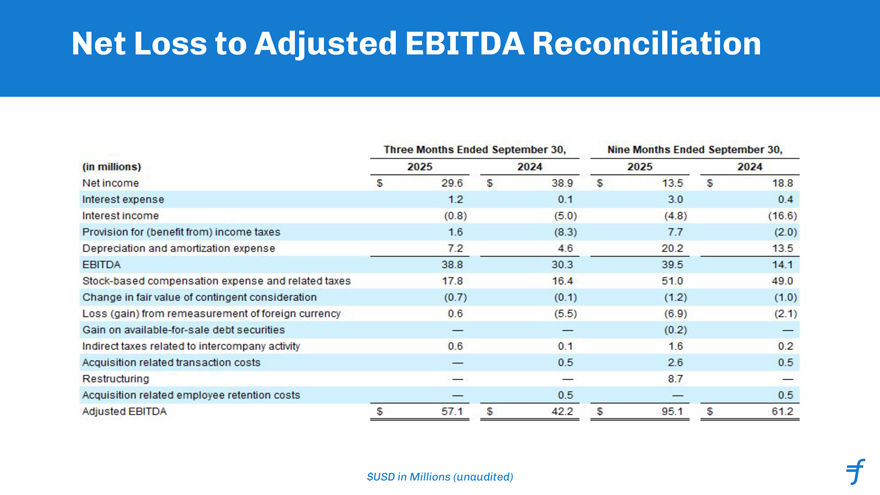
Net Loss to Adjusted EBITDA Reconciliation Three Months Ended September 30, Nine Months Ended September 30, (in millions} 2025 2024 2025 2024 Net income $ 29.6 $ 3-3.9 $ 13.5 $ 13.3 Interest expense 1.2 0.1 3.0 0.4 Interest income (0.3} (5.0) (4.3) (16.6) Provision for (benefit from) income taxes 1.6 (3.3) 7.7 (2.0) Depreciation and amortization expense 7.2 4.6 20.2 13.5 EBITDA 33.3 30.3 39.5 14.1 Stock-based compensation expense and related taxes 17.3 16.4 51.0 49.0 Change in fair value of contingent consideration (0.7) (0.1) (1.2) (1.0) Loss (gain)from remeasurement of foreign currency 0.6 (5.5) (6.9) (2.1) Gain on available-for-sale debt securities — — (0.2) — Indirect taxes related to intercompany activity 0.6 0.1 1.6 0.2 Acquisition related transaction costs — 0.5 2.6 0.5 Restructuring — — 8.7 — Acquisition related employee retention costs — 0.5 — 0.5 Adjusted EBITDA $57.1 $42.2 $95.1 $61.2 $USD in Millions (unaudited)
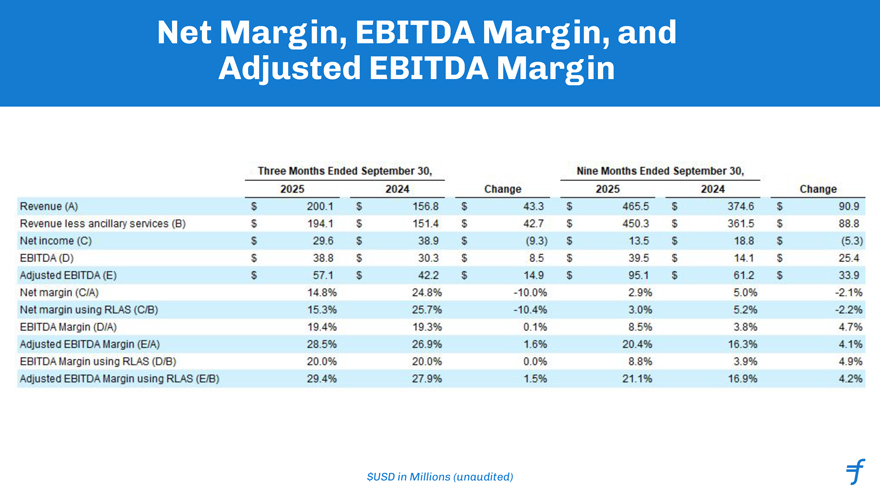
Net Margin, EBITDA Margin, and Adjusted EBITDA Margin Three Months Ended September 30, Nine Months Ended September 30, 2025 2024 Change 2025 2024 Change Revenue (A) $ 200.1 $ 156.8 $ 43.3 $ 465.5 $ 374.6 $ 90.9 Revenue less ancillary services (B) $ 194.1 $ 151.4 $ 42.7 $ 450.3 $ 361.5 $ 88.8 Net income (C) $ 29.6 $ 38.9 $ (9.3) $ 13.5 $ 18.8 $ (5.3) EBITDA (D) S 38.8 $ 30.3 $ 8.5 $ 39.5 $ 14.1 $ 25.4 Adjusted EBITDA (E) $ 57.1 $ 42.2 $ 14.9 $ 95.1 $ 61.2 $ 33.9 Net margin (C/A) 14.8% 24.8% -10.0% 2.9% 5.0% -2.1% Net margin using RLAS (C/B) 15.3% 25.7% -10.4% 3 0% 5.2% -2.2% EBITDA Margin (D/A) 19.4% 19.3% 0.1% 8.5% 3.8% 4.7% Adjusted EBITDA Margin (BA) 28.5% 26.9% 1.6% 20.4% 16.3% 4.1% EBITDA Margin using RLAS (D/B) 20.0% 20.0% 0.0% 8.8% 3.9% 4.9% Adjusted EBITDA Margin using RLAS (BB) 29.4% 27.9% 1.5% 21.1% 16.9% 4.2% *Q3 2025 includes a $0.6M FX loss 1. Represents Y-o-Y Growth as compared to Q324 2. Represents Margins as % of RLAS (Revenue Less Ancillary Services) See Appendix for reconciliation to GAAP amounts