TWIST BIOSCIENCE CORPORATION
681 Gateway Boulevard
South San Francisco, California 94080
NOTICE OF ANNUAL MEETING OF STOCKHOLDERS
TO BE HELD ON FEBRUARY 5, 2026
You are cordially invited to attend an annual meeting of stockholders (the “Annual Meeting”) of Twist
Bioscience Corporation (the “Company”) that will be held via live audiocast at
www.virtualshareholdermeeting.com/TWST2026 on February 5, 2026 at 7:00 am Pacific Standard Time for the
following purposes:
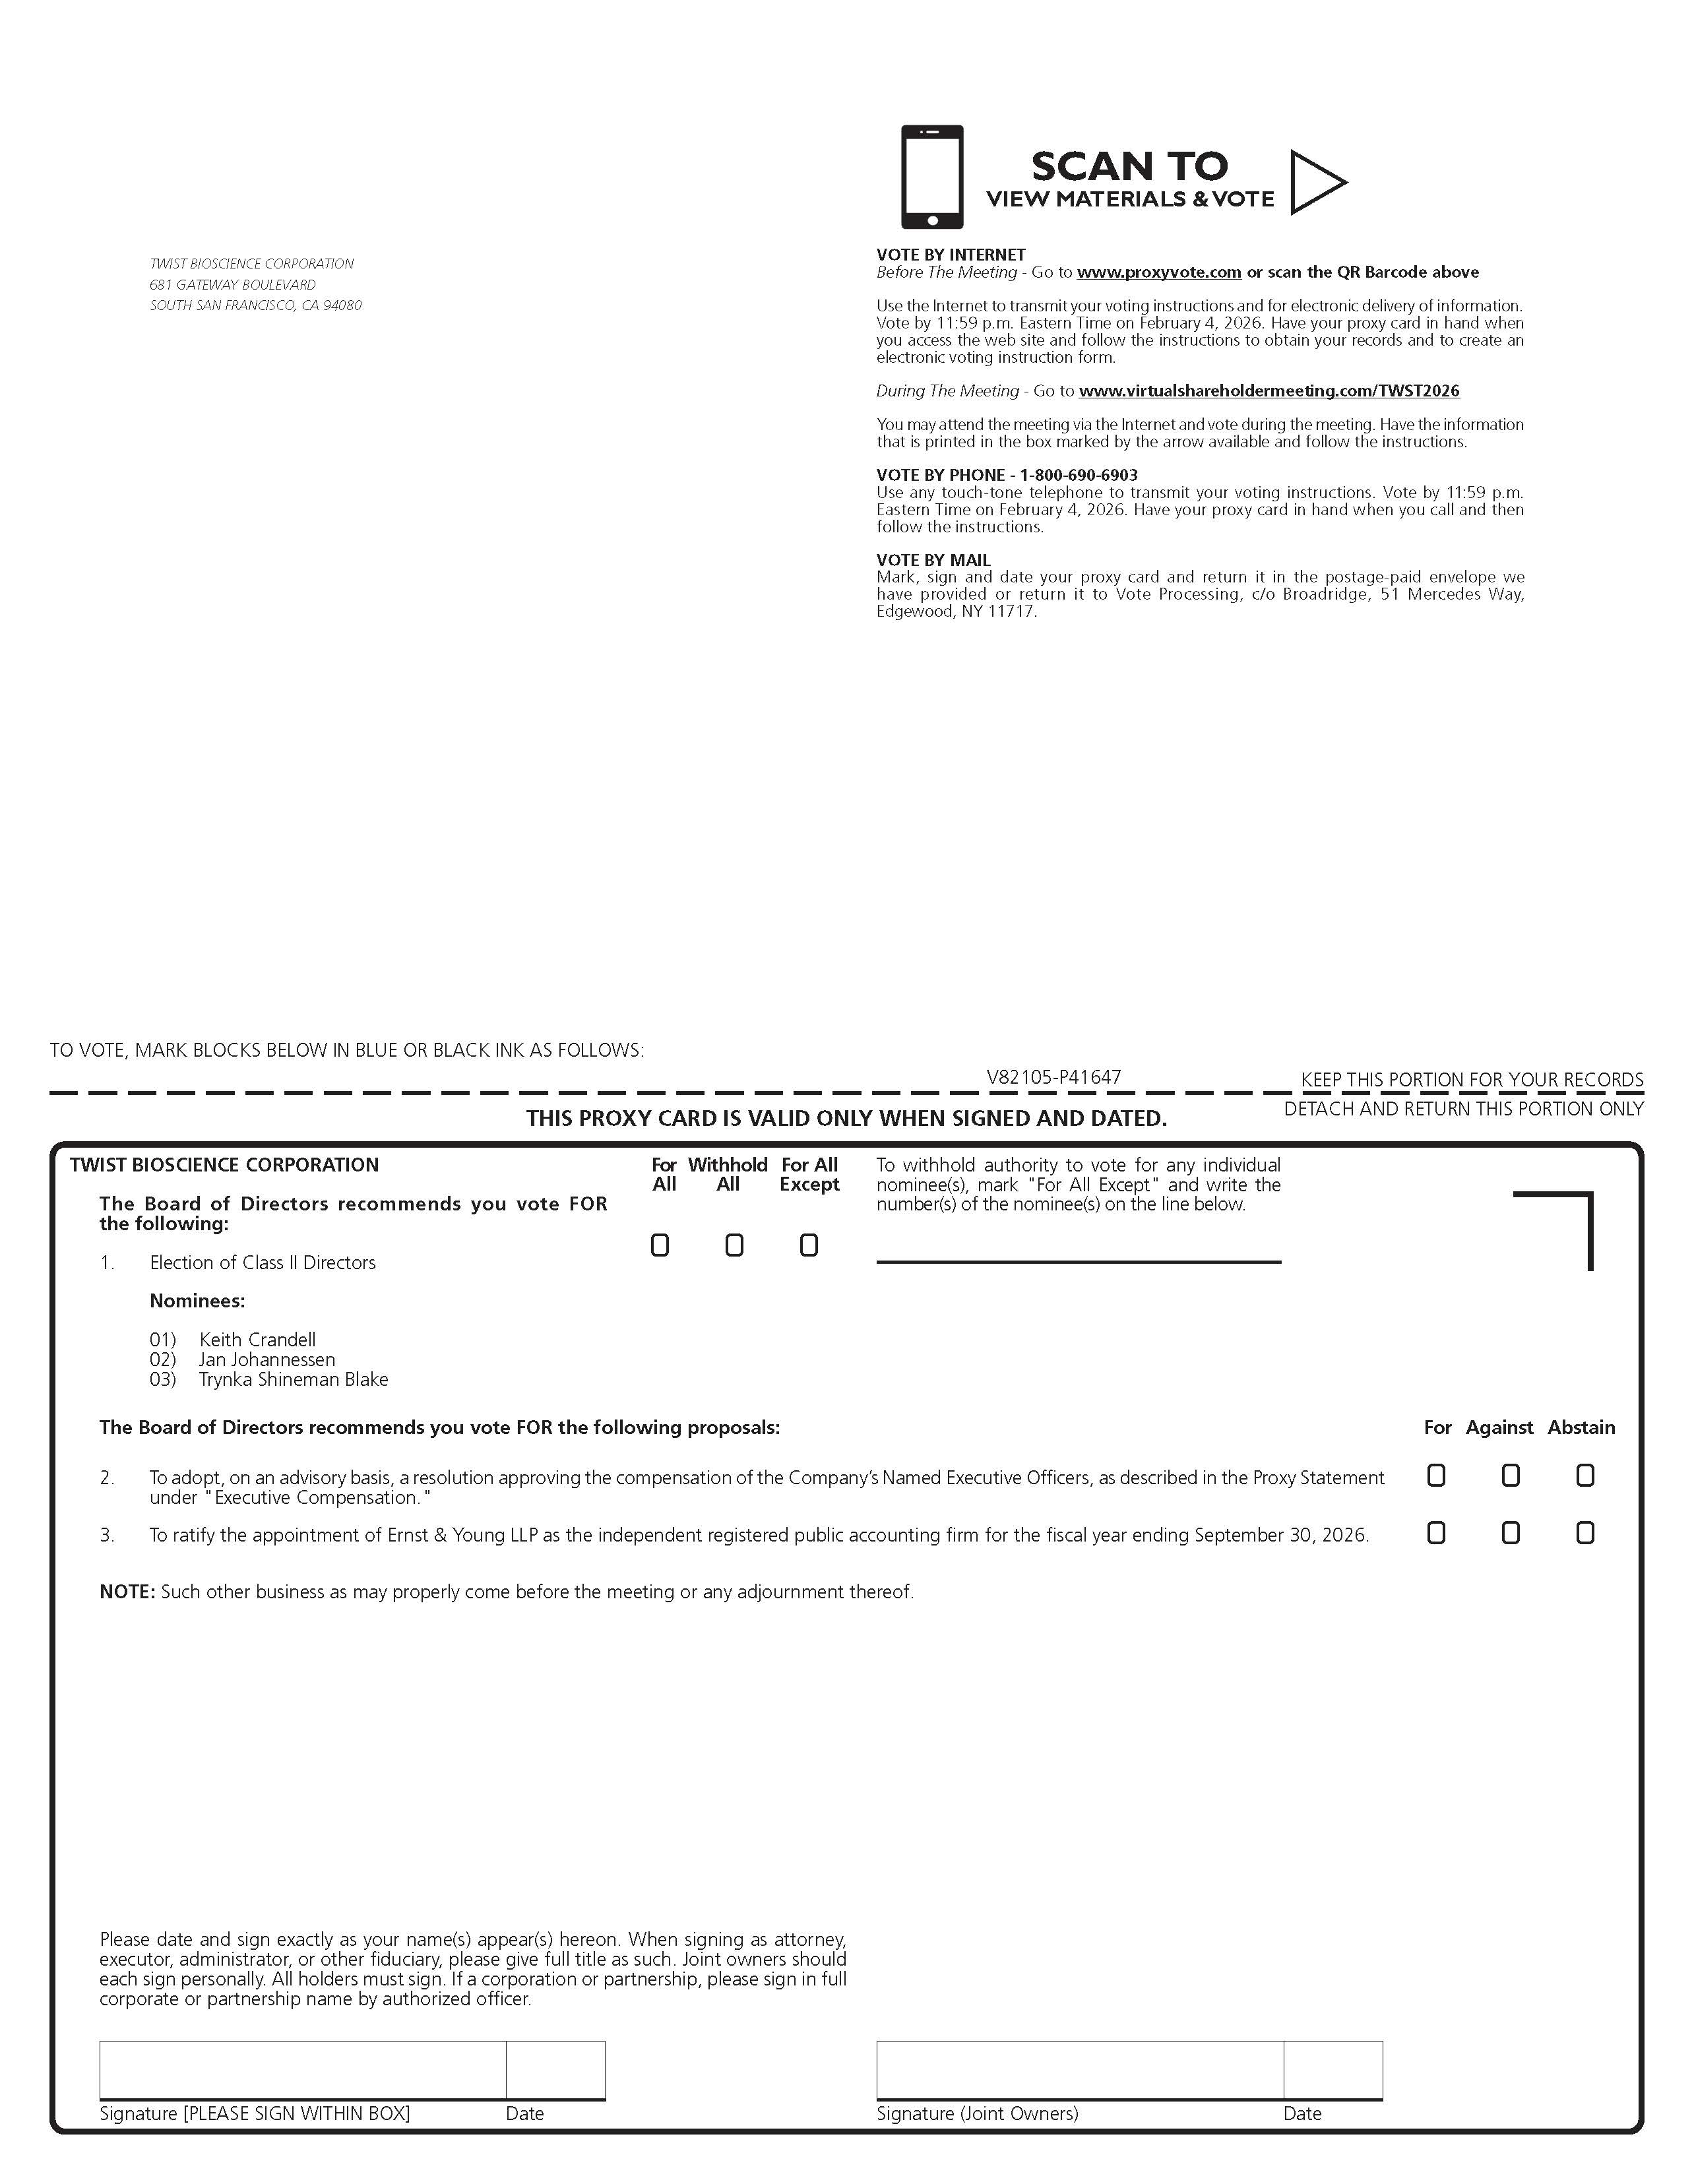
1.To elect three Class II directors of our Board of Directors to serve for the ensuing three years and until
their successors are elected and qualified or until their earlier resignation or removal;
2.To approve, on a non-binding and advisory basis, a resolution approving the compensation of our
Named Executive Officers, as described in the accompanying proxy statement under “Executive
Compensation”;
3.To ratify the appointment of Ernst & Young LLP as the Company’s independent registered public
accounting firm for the fiscal year ending September 30, 2026; and
4.To transact other business that may properly come before the Annual Meeting or any adjournments or
postponements thereof.
You can find more information about each of these items, including the nominees for directors, in the proxy
statement accompanying this notice. The record date for the Annual Meeting is December 26, 2025. Only
stockholders of record at the close of business on that date may vote at the meeting or any postponement or
adjournment thereof. This notice of annual meeting of stockholders and accompanying proxy statement and
form of proxy are first being mailed to stockholders on or about January 6, 2026.
The Board of Directors recommends that you vote in favor of each of the nominees for director (proposal 1)
and in favor of proposals 2 and 3, each as named or outlined in the proxy statement accompanying this notice.
Pursuant to rules promulgated by the Securities and Exchange Commission (“SEC”), we have elected to
provide access to our proxy materials both by sending you this full set of proxy materials, including a proxy
card, and by notifying you of the availability of our proxy materials on the internet. The proxy statement and our
2025 Annual Report to stockholders (the “2025 Annual Report”) are available at www.proxyvote.com.
You are cordially invited to attend the Annual Meeting via live audiocast. Whether or not you expect to
virtually attend the Annual Meeting, please vote on the matters to be considered as promptly as possible in
order to ensure your representation at the meeting. You may vote via the internet, by telephone or by returning
the enclosed proxy card. Even if you have voted by proxy, you may still vote via live audiocast if you virtually
attend the Annual Meeting by going to www.virtualshareholdermeeting.com/TWST2026 and logging in using the
16-digit control number found on your proxy card or voting instruction form. Once you are admitted as a
stockholder to the Annual Meeting, you may vote and ask questions by following the instructions available on
the meeting website. Your proxy is revocable in accordance with the procedures set forth in the proxy
statement.
You are encouraged to log in to www.virtualshareholdermeeting.com/TWST2026 before the Annual Meeting
begins. Online check-in will be available approximately 15 minutes before the meeting starts. If you encounter
any difficulties accessing or participating in the Annual Meeting through the meeting website, please call the
support team at the numbers listed on the website log-in screen.
By order of the Board of Directors,

Emily M. Leproust, Ph.D.
Chief Executive Officer