Please wait
| | | | | |
|
MANAGEMENT'S DISCUSSION AND ANALYSIS
FOR THE YEAR ENDED DECEMBER 31, 2021 |
| | | | | | | | |
| |
| 1 | Introduction | |
| 1.1 | | |
| 1.2 | | |
| 1.3 | | |
| 2 | | |
| 3 | | |
| 3.1 | Review of income statements | |
| 3.2 | Review of selected balance sheet items | |
| 3.3 | Subsequent events | |
| 4 | | |
| 4.1 | | |
| 4.2 | | |
| 4.2.1 | | |
| 4.2.2 | | |
| 4.3 | | |
| 5 | | |
| 5.1 | | |
| 5.2 | | |
| 5.3 | | |
| 6 | | |
| 7 | | |
| 7.1 | | |
| 7.2 | | |
| 7.3 | | |
| 7.4 | | |
| 7.5 | | |
| 7.6 | | |
| 7.7 | | |
| 8 | | |
| | |
| | | | | |
|
MANAGEMENT'S DISCUSSION AND ANALYSIS
FOR THE YEAR ENDED DECEMBER 31, 2021 |
Non-IFRS measures
This Management’s Discussion and Analysis (“MD&A”) should be read in conjunction with the consolidated financial statements and accompanying notes for the year ended December 31, 2021 and December 31, 2020 of Tricon Residential Inc. (“Tricon", "us", "we" or the “Company”), prepared in accordance with International Financial Reporting Standards (“IFRS”) as issued by the International Accounting Standards Board (“the IASB”).
The Company has included herein certain non-IFRS financial measures and non-IFRS ratios, including, but not limited to, net operating income ("NOI"), NOI margin, proportionate same-home NOI and NOI margin, funds from operations ("FFO"), core funds from operations ("Core FFO"), adjusted funds from operations ("AFFO"), Core FFO per share, AFFO per share, Core FFO payout ratio, AFFO payout ratio, as well as certain key indicators of the performance of our businesses which are supplementary financial measures. These measures are commonly used by entities in the real estate industry as useful metrics for measuring performance. We utilize these measures in managing our business, including performance measurement and capital allocation. In addition, certain of these measures are used in measuring compliance with our debt covenants. We believe that providing these performance measures on a supplemental basis is helpful to investors and shareholders in assessing the overall performance of the Company’s business. However, these measures are not recognized under and do not have any standardized meaning prescribed by IFRS as issued by the IASB, and are not necessarily comparable to similar measures presented by other publicly traded entities. These measures should be considered as supplemental in nature and not as a substitute for related financial information prepared in accordance with IFRS. Because non-IFRS financial measures, non-IFRS ratios and supplementary financial measures do not have standardized meanings prescribed under IFRS, securities regulations require that such measures be clearly defined, identified, and reconciled to their nearest IFRS measure. The definition, calculation and reconciliation of the non-IFRS financial measures and the requisite disclosure for non-IFRS ratios used in this MD&A are provided in Section 4 and Appendix A, and the supplementary financial measures which are key performance indicators presented herein are discussed in detail in Section 6.
The non-IFRS financial measures, non-IFRS ratios and supplementary financial measures presented herein should not be construed as alternatives to net income (loss) or cash flow from the Company’s activities, determined in accordance with IFRS, as indicators of Tricon’s financial performance. Tricon’s method of calculating these measures may differ from other issuers’ methods and, accordingly, these measures may not be comparable to similar measures presented by other publicly-traded entities.
Forward-looking statements
Certain statements in this MD&A are considered “forward-looking information” as defined under applicable securities laws (“forward-looking statements”). This document should be read in conjunction with material contained in the Company’s current consolidated financial statements along with the Company’s other publicly filed documents. Words such as “may”, “would”, “could”, “will”, “anticipate”, “believe”, “plan”, “expect”, “intend”, “estimate”, “aim”, “endeavor”, “project”, “continue”, "target" and similar expressions identify these forward-looking statements. Statements containing forward-looking information are not historical facts but instead reflect management’s expectations, intentions and beliefs concerning anticipated future events, results, circumstances, economic performance or expectations with respect to Tricon and its investments and are based on information currently available to management and on assumptions that management believes to be reasonable.
This MD&A includes forward-looking statements pertaining to: anticipated operational and financial performance; the Company’s strategic and operating plans and growth prospects; expected demographic and economic trends impacting the Company’s key markets; project plans, timelines and sales/rental expectations; expected performance fees; future cash flows; transaction and development timelines; anticipated demand for residential real estate; the anticipated growth of the Company's rental businesses; the acquisition of build-to-rent projects; the Company’s key priorities over the next three years and the manner in which they might be achieved; expected future acquisitions, acquisition pace, rent growth, operating expenses, occupancy and turnover rates, and capital expenditure programs for single-family rental homes and U.S. and Canadian multi-family rental apartments; rollout of operations programs and resident betterment programs; anticipated environmental, social and governance (“ESG”) initiatives; debt financing and refinancing intentions; and the ongoing impact of the COVID-19 pandemic. The assumptions underlying these forward-looking statements and a list of factors that may cause actual business performance to differ from current projections are discussed in this MD&A and in the Company’s Annual Information Form dated March 1, 2022 (the “AIF”), which is available on SEDAR at www.sedar.com. The continuing impact of COVID-19 on the operations, business and financial results of the Company may cause actual results to differ, possibly materially, from the results discussed in the forward-looking statements.
Forward-looking statements are necessarily based on estimates and assumptions that, while considered reasonable by management of the Company as of the date of this MD&A, are inherently subject to significant business, economic and competitive uncertainties and contingencies. The Company’s estimates, beliefs and assumptions, which may prove to be incorrect, include the various assumptions set forth herein, including, but not limited to the Company’s future growth potential; results of operations; future prospects and opportunities; demographic and industry trends; no change in legislative or regulatory matters; future levels of indebtedness; the tax laws as currently in effect; the continuing availability of capital and suitable acquisition and investment opportunities; current economic conditions including property value appreciation; and the anticipated impact of COVID-19.
When relying on forward-looking statements to make decisions, the Company cautions readers not to place undue reliance on these statements, as forward-looking statements involve significant unknown risks and uncertainties. Forward-looking statements should not be read as guarantees of future performance or results and will not necessarily be accurate indications of whether or not the times at or by which such performance or results will be achieved. A number of factors could cause actual results to differ, possibly materially, from the results discussed in the forward-looking statements, including, but not limited to, the Company’s ability to execute its growth strategies; the impact of changing conditions in the U.S. and Canadian multi-family housing market; increasing competition in the Canadian and U.S. single-family and multi-family housing market; the effect of fluctuations and cycles in the Canadian and U.S. real estate market; the marketability and value of the Company’s portfolio; changes in the attitudes, financial condition and demand of the Company’s demographic market; fluctuation in interest rates and volatility in financial markets; developments and changes in applicable laws and regulations; and the impact of COVID-19 on the operations, business and financial results of the Company.
| | | | | |
|
MANAGEMENT'S DISCUSSION AND ANALYSIS
FOR THE YEAR ENDED DECEMBER 31, 2021 |
Should one or more of these risks or uncertainties materialize, or should assumptions underlying the forward-looking statements prove incorrect, actual results, performance or achievements could vary materially from those expressed or implied by the forward-looking statements contained in this MD&A. See the AIF and the continuous disclosure documents referenced in Section 7.6 for a more complete list of risks relating to an investment in the Company and an indication of the impact the materialization of such risks could have on the Company, and therefore cause actual results to deviate from the forward-looking statements.
Certain statements included in this MD&A may be considered a “financial outlook” for purposes of applicable Canadian securities laws, and as such, the financial outlook may not be appropriate for purposes other than this document. Although the forward-looking statements contained in this MD&A are based upon what management currently believes to be reasonable assumptions (including those noted above), there can be no assurance that actual results, performance or achievements will be consistent with these forward-looking statements. The forward-looking statements contained in this document are expressly qualified in their entirety by this cautionary statement.
When relying on our forward-looking statements to make decisions with respect to the Company, investors and others should carefully consider the foregoing factors and other uncertainties and potential events. The forward-looking statements in this MD&A are made as of the date of this document and the Company does not intend to, or assume any obligation to, update or revise these forward-looking statements or information to reflect new information, events, results or circumstances or otherwise after the date on which such statements are made to reflect the occurrence of unanticipated events, except as required by law, including securities laws.
Market and industry data
This MD&A may include certain market and industry data and forecasts obtained from third-party sources, industry publications and publicly available information as well as industry data prepared by management on the basis of its knowledge of the industry in which the Company operates (including management’s estimates and assumptions relating to the industry based on that knowledge). Management’s knowledge of the North American residential real estate industry has been developed through its experience and participation in the industry. Management believes that its industry data is accurate and that its estimates and assumptions are reasonable, but there can be no assurance as to the accuracy or completeness of this data. Third-party sources generally state that the information contained therein has been obtained from sources believed to be reliable, but there can be no assurance as to the accuracy or completeness of included information. Although management believes it to be reliable, the Company has not independently verified any of the data from third-party sources referred to in this MD&A, or analyzed or verified the underlying studies or surveys relied upon or referred to by such sources, or ascertained the underlying economic assumptions relied upon by such sources.
Other
Select photos in this document are presented for illustrative purposes only, may be artists' renditions, and may not be representative of all properties in the Company’s portfolio.
| | | | | |
|
MANAGEMENT'S DISCUSSION AND ANALYSIS
FOR THE YEAR ENDED DECEMBER 31, 2021 |
1. Introduction
This Management’s Discussion and Analysis (“MD&A”) is dated as of March 1, 2022, the date it was approved by the Board of Directors of Tricon Residential Inc. (“Tricon", “us", “we” or the “Company”), and reflects all material events up to that date. It should be read in conjunction with the Company’s audited consolidated financial statements and related notes for the year ended December 31, 2021, which were prepared using International Financial Reporting Standards as issued by the International Accounting Standards Board (“IFRS”). The audited consolidated financial statements are available on the Company's website at www.triconresidential.com, on the Canadian Securities Administrators’ website at www.sedar.com, and as part of the Company's annual report (Form 40-F) filed on the EDGAR section of the U.S. Securities and Exchange Commission’s (“SEC”) website at www.sec.gov. Additional information about the Company, including its Annual Information Form, is available on these websites.
The registered office of the Company is at 7 St. Thomas Street, Suite 801, Toronto, Ontario M5S 2B7. The Company’s common shares were listed for trading on the New York Stock Exchange on October 7, 2021. The Company’s common shares are traded under the symbol TCN on both the New York Stock Exchange and the Toronto Stock Exchange.
All dollar amounts in this MD&A are expressed in U.S. dollars unless otherwise indicated.
1.1 Vision and guiding principles
Tricon was founded in 1988 as a fund manager for private clients and institutional investors focused on for-sale residential real estate development. The pursuit of continuous improvement as well as a desire to diversify and facilitate succession planning drove the Company’s decision to become publicly traded in 2010. While the U.S. for-sale housing industry was decimated in the Great Recession of 2007-2009, Tricon's strong foundation and its leaders' resilience helped it endure the downturn and learn valuable lessons that informed the Company's decision to ultimately focus on rental housing.
In the decade that followed, Tricon embarked on a deliberate transformation away from for-sale housing, which is inherently cyclical, to become a rental housing company that addresses the needs of a new generation facing reduced home affordability and a desire for meaningful human connections, convenience and a sense of community. Today, Tricon provides high-quality, essential shelter to residents. Tricon's business is defensive by design, intended to outperform in good times and perform relatively well in more challenging times.
Tricon was among the first to enter into and institutionalize the U.S. single-family rental industry. Our success has been built on a culture of innovation and a willingness to adopt new technologies to drive efficiencies and improve our residents’ lives. We believe that our ability to bring together capital, ideas, people and technology under one roof is unique in real estate and allows us to improve the resident experience, safeguard our stakeholders’ investments, and drive superior returns.
Tricon strives to be North America’s pre-eminent single-family rental housing company serving the middle-market demographic by owning quality properties in attractive markets, focusing on operational excellence, and delivering exceptional customer service. Tricon is driven by its purpose statement - Imagine a world where housing unlocks life’s potential - and encourages its employees to conduct themselves every day according to the following guiding principles:
•Go above and beyond to enrich the lives of our residents
•Commit to and inspire excellence in everything we do
•Ask questions, embrace problems, thrive on the process of innovation
•Do what is right, not what is easy
•Elevate each other so together we leave an enduring legacy
| | | | | |
|
MANAGEMENT'S DISCUSSION AND ANALYSIS
FOR THE YEAR ENDED DECEMBER 31, 2021 |
Tricon’s guiding principles underpin our business strategy and culture of taking care of our employees first, who in turn are empowered and inspired to provide residents with superior service and to positively impact local communities. When our residents are satisfied, they rent with us longer, treat our properties as their own, and are likely to refer friends and family to become new customers. We have realized that the best way to drive returns for our shareholders and private investors is to ensure our team and residents are fulfilled. This is why Our People and Our Residents are also two of our key ESG priorities (see Section 1.3).
1.2 Business and growth strategy
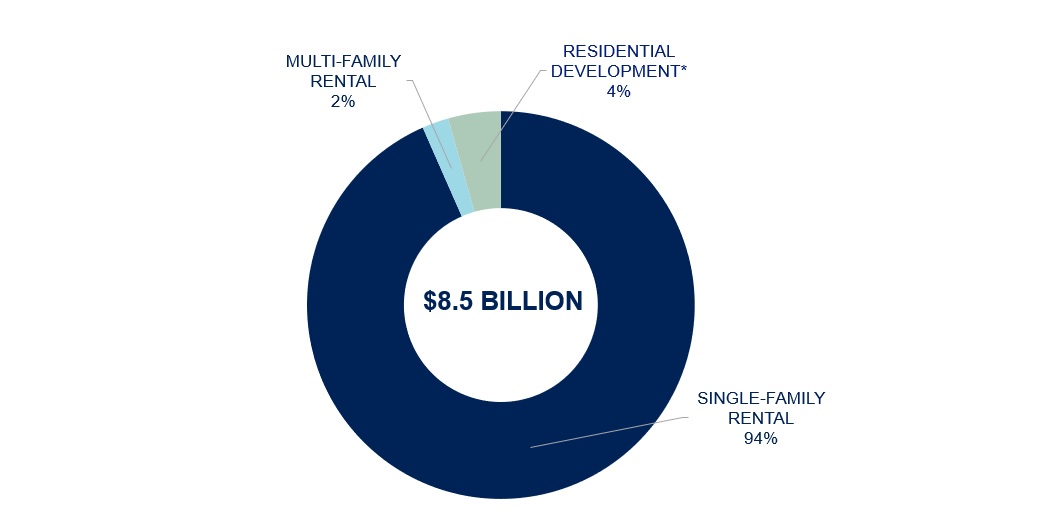
Tricon is an owner and operator of a growing portfolio of approximately 29,000 single-family rental homes located primarily in the U.S. Sun Belt. The Company also invests in adjacent residential businesses which include multi-family rental properties and residential development assets. Since the Company's initial public offering in 2010, Tricon has evolved from an asset manager focused on investing in "for-sale" housing development to a growth-oriented rental housing company with a comprehensive technology-enabled operating platform. As at December 31, 2021, about 94% of the Company’s real estate assets are stabilized single-family rental homes and the remaining 6% are invested in adjacent residential businesses.
*Includes dedicated “build-to-rent” single-family rental communities that will be transferred to the single-family rental segment upon stabilization.
(Based on the fair value of single-family homes, equity-accounted investments in multi-family rental properties, equity-accounted investments in Canadian residential developments, Canadian development properties (net of debt) and investments in U.S. residential developments.)
| | | | | |
|
MANAGEMENT'S DISCUSSION AND ANALYSIS
FOR THE YEAR ENDED DECEMBER 31, 2021 |
Tricon’s differentiated strategy
Tricon's U.S. single-family rental strategy targets the "middle-market" resident demographic which consists of over seven million U.S. renter households (source: U.S. Census Bureau). The Company defines the middle-market cohort as those households earning between $70,000 and $110,000 per year and with monthly rental payments of $1,300 to $2,100. These rent levels typically represent approximately 20-25% of household income, which provides each household with meaningful cushion to continue paying rent in times of economic hardship. Conversely, Tricon has the flexibility to increase rents and defray higher operating costs in a stronger economic environment without significantly impacting its residents’ financial well-being. Focusing on qualified middle-market families who are likely to be long-term residents is expected to result in lower turnover rates, thereby reducing turn costs and providing stable cash flows for the Company. Tricon offers its residents economic mobility and the convenience of renting a high-quality, renovated home without costly overhead expenses such as maintenance and property taxes, and with a focus on superior customer service.
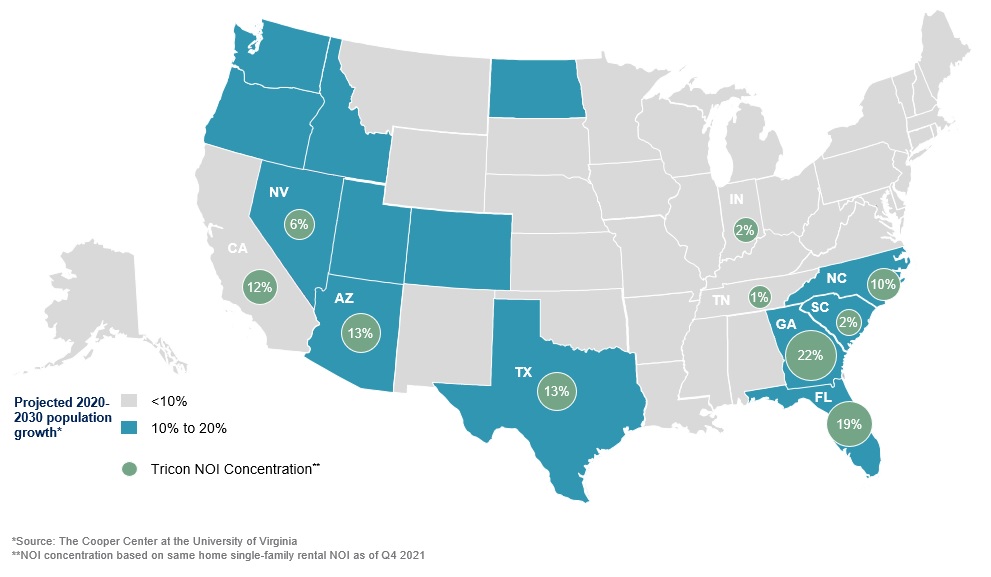
In addition to targeting the middle-market demographic, Tricon is focused on the U.S. Sun Belt, which is home to approximately 40% of all U.S. households and is expected to experience population growth in excess of 10% in most markets from 2020 to 2030 (source: The Cooper Center at the University of Virginia, 2018). The U.S. Sun Belt has experienced significant population and job growth over time, driven by a friendly business environment, lower tax rates, enhanced affordability and a warm climate. In many ways, the COVID-19 pandemic has accelerated these demographic trends and is expected to help drive even stronger relative population growth over the coming years in Tricon's core markets as Americans de-urbanize and seek out the relative safety of suburban living in less dense markets. Furthermore, the Company believes that work-from-home trends and in-migration to the Sun Belt states will likely continue as employers permit more flexible work arrangements and employees gravitate towards more affordable housing markets.
| | | | | |
|
MANAGEMENT'S DISCUSSION AND ANALYSIS
FOR THE YEAR ENDED DECEMBER 31, 2021 |
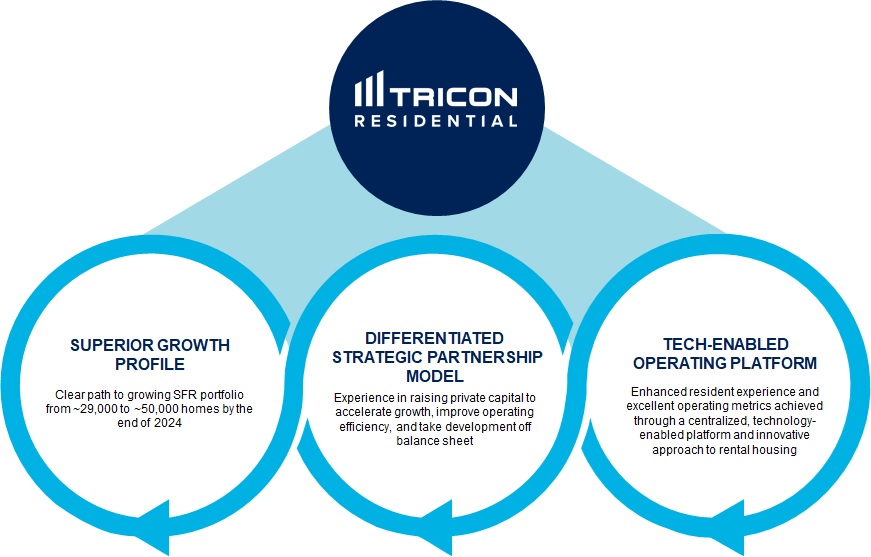
I. Superior growth profile
There is a significant runway for growth in the single-family rental industry as only ~3% of the 16 million rental homes in the United States are institutionally owned (source: Green Street U.S. Single-Family Rental Outlook, January 2022). We believe we are particularly well positioned to take advantage of this opportunity as one of the leading owners and operators in the industry, with one of the largest portfolios of single-family rental homes in the U.S. Sun Belt.
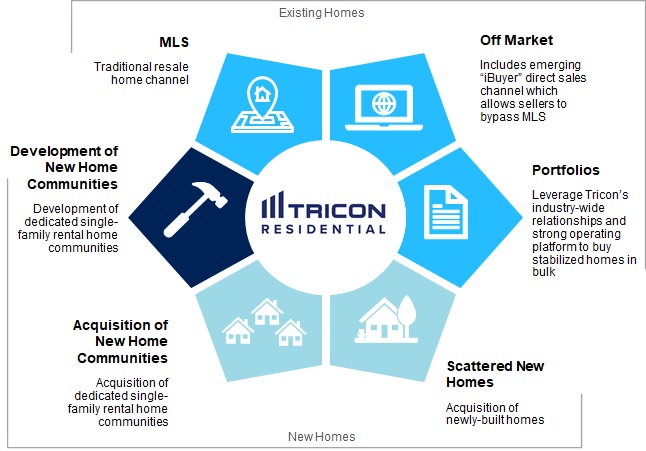
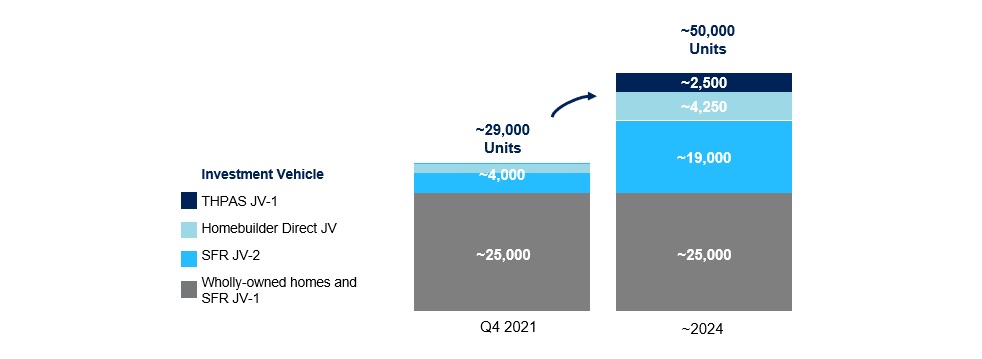
Tricon is targeting to grow its single-family rental home portfolio to 50,000 homes by the end of 2024 and has a disciplined acquisition platform that is capable of deploying large amounts of capital across multiple acquisition channels and markets simultaneously. Tricon sources acquisition opportunities of existing homes through traditional channels, including Multiple Listing Service (“MLS”), “iBuyer” direct channels, and portfolio acquisitions. These traditional channels will account for the majority of Tricon’s planned acquisitions over the next three years and leverage the Company’s acquisition platform which filters and ranks many listings per year while standardizing hundreds of key underwriting parameters, enabling the Company to efficiently convert listings into offers.
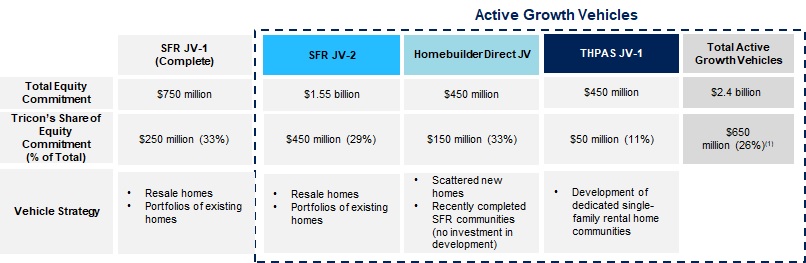
In an undersupplied housing market, Tricon also believes in adding to the supply of rental homes and providing accessible housing solutions through its three newest home growth channels. These include the development of dedicated “build-to-rent” communities and the acquisition of both scattered new homes and completed single-family rental communities directly from homebuilders. In aggregate, our six existing and new home acquisition channels are expected to provide the Company with sufficient volume to meet its acquisition targets.
| | | | | |
|
MANAGEMENT'S DISCUSSION AND ANALYSIS
FOR THE YEAR ENDED DECEMBER 31, 2021 |
II. Differentiated strategic partnership model
Through its differentiated strategic partnership model, Tricon has demonstrated its ability to raise and deploy third-party capital to accelerate growth, improve operating efficiency, and take development off balance sheet. Institutional investors with allocations to real estate have also been increasingly favoring more resilient residential and industrial investment strategies in light of the uncertainty created by COVID-19 around office, retail and hospitality assets. The so-called “beds and sheds” investment strategies have led to a significant increase in capital allocated to the residential sector in general and the single-family rental industry in particular, which in turn has lowered the cost of capital for industry participants and facilitated future growth. The Company has recently partnered with leading global real estate investors to form three complementary single-family rental joint ventures, each with a unique acquisition strategy that provides residents with more housing options at an accessible price point.
| | | | | |
|
MANAGEMENT'S DISCUSSION AND ANALYSIS
FOR THE YEAR ENDED DECEMBER 31, 2021 |
(1) As at December 31, 2021, Tricon's remaining unfunded equity commitment was approximately $455 million.
III. Technology-enabled operating platform
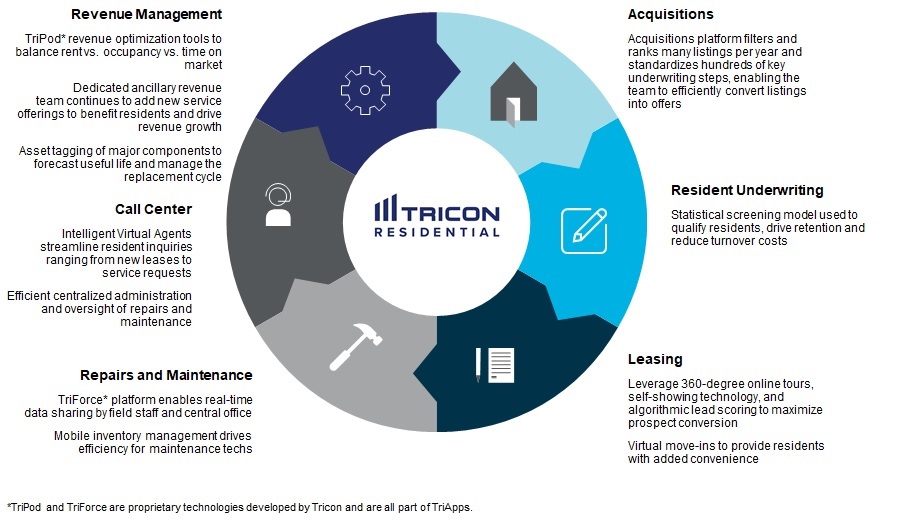
Tricon has developed a technology-enabled platform that supports its growth, provides its residents an elevated living experience, and optimizes operating efficiencies. The Company's proprietary suite of software applications, referred to as “TriApps”, automates every facet of the single-family rental business, as described below.
The Company has systematized the process of home acquisitions and, once homes are acquired, renovates them to a common standard before making them available for rent. Prospective residents are directed to the Company’s website where they can rent a home in a few easy steps. In the leasing process, Tricon leverages 360-degree online tours, self-showing technology, virtual self-move-ins and a statistical screening model to underwrite residents and drive retention. The proprietary TriForce App allows for dynamic coordination of repairs and maintenance activities among the field personnel, centralized office staff and third-party vendors by automating workflows, standardizing work scope and compressing the delegation of authority. Tricon uses logistics software and mobile inventory management to ensure its maintenance technicians can service homes in the most efficient manner and with a high first-time fix rate. In its call center, Tricon leverages intelligent virtual agents to automate leasing and maintenance inquiry intake so the call center team can focus on higher value work such as inside sales or customer service. And lastly, in revenue management, Tricon has pioneered revenue optimization tools to balance occupancy, time on market and rent growth, and to smooth out lease expiration schedules. Management believes the Company has a significant competitive advantage arising from its technology-enabled property management platform that is difficult to replicate and is highly scalable.
| | | | | |
|
MANAGEMENT'S DISCUSSION AND ANALYSIS
FOR THE YEAR ENDED DECEMBER 31, 2021 |
Adjacent residential businesses
Multi-family rental
Tricon operates and holds a 20% ownership interest in a portfolio of high-quality, affordably priced garden-style apartments located in desirable suburban sub-markets primarily in the U.S. Sun Belt. The portfolio comprises 23 properties totaling 7,289 units in 13 major markets and consists of new vintage garden-style complexes featuring resort-style amenities, including swimming pools and well-appointed fitness and common areas. Tricon holds these assets in partnership with institutional investors who have an investment bias towards long-term ownership and stable recurring cash flows. The institutional investors pay Tricon asset management fees, property management fees and possibly performance fees, enabling the Company to enhance its return on investment.
In Canada, Tricon operates and holds a 15% ownership interest in one 500-unit Class A rental property, The Selby, located in downtown Toronto. The Selby is currently managed through Tricon's vertically integrated platform, including local property management employees.
Residential development
Tricon develops new residential real estate properties, predominantly rental housing intended for long-term ownership. Such developments include (i) Class A multi-family rental apartments in Canada, (ii) single-family rental communities in the United States intended to operate as part of the single-family rental portfolio upon stabilization, and (iii) legacy land development and homebuilding projects predominantly in the United States.
(i) Canadian Class A multi-family rental apartments:
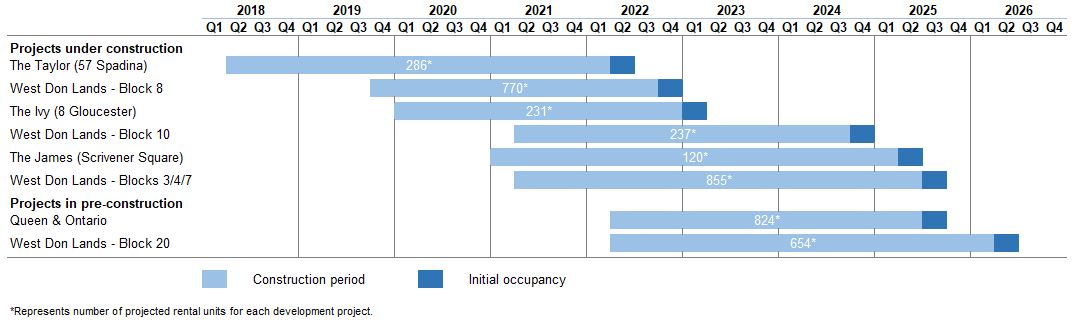
Tricon is one of the most active developers of Class A purpose-built rental apartment buildings in downtown Toronto with eight projects under development totaling approximately 3,977 units in which Tricon holds a 47% weighted average ownership interest based on net assets. Tricon holds these assets in partnerships with pension plans and strategic partners who have an investment bias towards long-term ownership and stable recurring cash flows.
| | | | | |
|
MANAGEMENT'S DISCUSSION AND ANALYSIS
FOR THE YEAR ENDED DECEMBER 31, 2021 |
These institutional investors or strategic partners pay Tricon development management fees, asset management fees and possibly performance fees, enabling the Company to enhance its return on investment.
(ii) U.S. single-family rental communities:
The Company's build-to-rent strategy is focused on developing well-designed, dedicated single-family home rental communities, which often include shared amenities such as parks, playgrounds, pools and community gathering spaces. This strategy adds another growth channel to Tricon’s single-family rental business, and leverages the Company’s complementary expertise in land development, homebuilding and single-family rental property management. Once developed and stabilized, these build-to-rent communities will be integrated into the Company’s technology-enabled property management platform. The Company currently has a pipeline of approximately 3,000 rental units in 23 new home communities across the U.S. Sun Belt and is on track to have over 600 new homes available for rent by the end of 2022 with the current pipeline substantially completed by the end of 2024.
(iii) U.S. land development and homebuilding:
The Company’s legacy business provides equity or equity-type financing to experienced local or regional developers and builders of for-sale housing primarily in the United States. These investments are typically made through Investment Vehicles that hold an interest in land development and homebuilding projects, including master-planned communities ("MPCs"). Tricon also serves as the developer of certain of its MPCs through its Houston-based subsidiary, The Johnson Companies LP (“Johnson”). Johnson is an integrated development platform with expertise in land entitlement, infrastructure, municipal bond finance and placemaking, and has deep relationships with public and regional homebuilders and commercial developers.
Johnson’s reputation for developing high-quality MPCs is further evidenced by Johnson having three MPCs ranked in the top 50 based on homebuilder sales in 2021 according to RCLCO Real Estate Consulting.
Private funds and advisory
Tricon earns fees from managing third-party capital invested in its real estate assets through separate accounts, joint ventures and commingled funds ("Investment Vehicles"). Activities of this business include:
(i) Asset management of third-party capital: Tricon manages capital on behalf of institutional investors, including pension funds, sovereign wealth funds, insurance companies and others who seek exposure to the residential real estate industry. Tricon managed $6.8 billion of Assets Under Management (“AUM”) on behalf of third-party investors (out of total AUM of $13.7 billion) as at December 31, 2021 across its single-family rental, multi-family rental and residential development business segments (refer to Section 6 and Appendix A for further information concerning the Company's AUM). For its services, Tricon earns asset management fees on fee-bearing capital totaling $2.8 million and $1.2 billion as at December 31, 2021 and 2020, respectively, as well as performance fees provided targeted investment returns are achieved.
Tricon manages third-party capital for twelve of the top 100 largest institutional real estate investors in the world (source: "PERE Global Investor 100" ranking, October 2021). In 2021, Tricon ranked 58th globally and second in Canada (compared to 65th globally and second in Canada in 2020) among global real estate investment managers based on the institutional equity raised since 2016, and is the largest investment manager exclusively focused on residential real estate in that ranking (source: "2021 PERE 100" manager ranking, June 2021).
(ii) Development management and related advisory services: Tricon earns development management fees from its rental development projects in Toronto, which leverage its fully integrated development team. In addition, Tricon earns contractual development fees and sales commissions from the development and sale of single-family lots, residential land parcels, and commercial land within the MPCs managed by its Johnson subsidiary.
(iii) Property management of rental properties: Tricon provides integrated property management services to its entire single-family and multi-family rental portfolio. The property management business is headquartered in Orange County, California, and provides resident-facing services including marketing, leasing, and repairs and maintenance delivered through a dedicated call center and local field offices. For its services, Tricon earns property management
| | | | | |
|
MANAGEMENT'S DISCUSSION AND ANALYSIS
FOR THE YEAR ENDED DECEMBER 31, 2021 |
fees, typically calculated as a set percentage of the gross revenues of each property, as well as leasing, construction and acquisition fees.
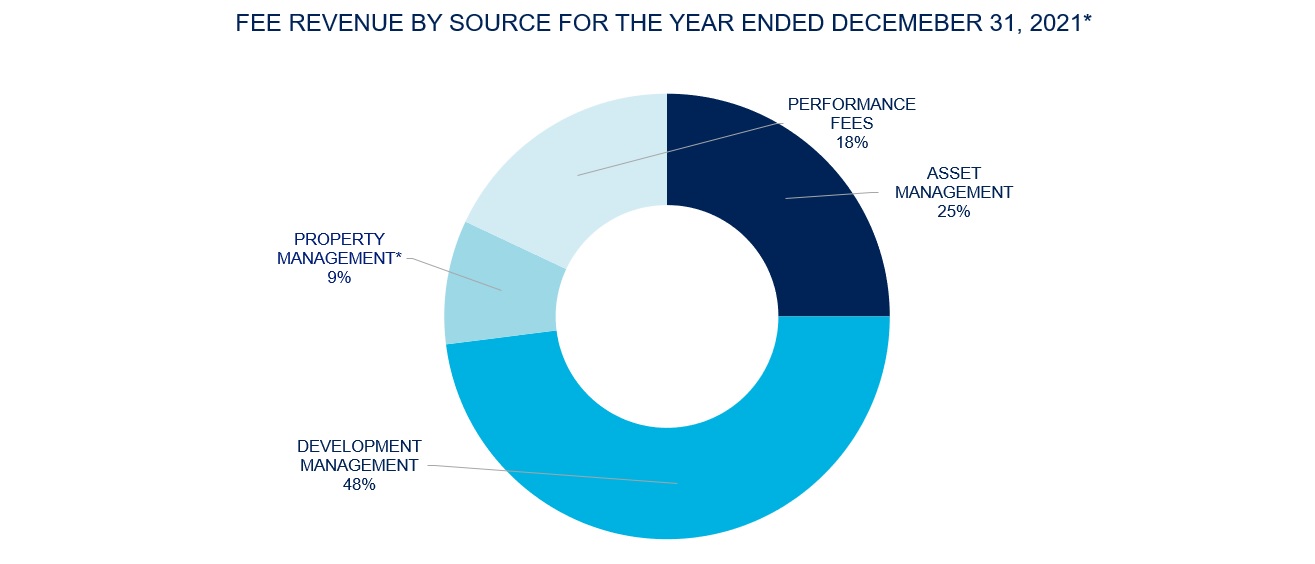
* Certain asset management fees and property management fees paid by the single-family rental business segment and certain development management fees paid by Canadian development properties are eliminated upon consolidation and are excluded from revenue from private funds and advisory services. Refer to Section 4.3 for a summary of revenue from private funds and advisory services for the year ended December 31, 2021.
1.3 Environmental, Social and Governance
Environmental, Social and Governance ("ESG") principles have guided Tricon's 33-year history of delivering business excellence. Following the publication of our ESG Roadmap in January 2020, our strategic priorities include:
Our People: Tricon is committed to engaging, supporting, and enriching the lives of our employees so they can thrive and, in turn, take care of our residents and the communities in which we operate. We are proud to have earned and maintained certification as a Great Place to Work for 2021 in Canada and the United States. The Great Place to Work Trust Index benchmarks employee attitudes, opinions, and satisfaction against other similarly sized Fortune Global 500 companies. The Great Place to Work certification affirms our focus on what is important – creating a workplace culture that puts people first: our team members, our residents and our communities.
Our Residents: Tricon's goal is to build meaningful communities where people can connect, grow and prosper. In addition to Tricon’s efforts to assist residents in need by self-governing rent growth on renewals, deferring late fees, and offering flexible rental payment plans throughout the COVID-19 pandemic, we recently announced the launch of Tricon Vantage, a market-leading suite of programs and services designed to enhance the financial well-being of our residents.
Tricon Vantage provides our residents with access to tools, resources and services to help them realize their financial goals. In collaboration with Operation Hope, Tricon Vantage gives residents complimentary access to financial literacy workshops, one-on-one coaching and guided group sessions tailored to their financial health and objectives. Tricon Vantage also offers qualifying residents access to a credit builder program to help build or improve residents' credit scores and a "first-look" home purchase program that gives qualifying residents the first opportunity to purchase the home they are renting in the event Tricon elects to sell. Additionally, we plan on announcing a down payment assistance initiative in 2022 as an additional service in our growing Tricon Vantage program.
When families have the stability necessary to build pathways to their financial freedom, whole communities can prosper. At Tricon, we believe that this compassionate approach to serving our residents is not only the right thing to do but also a key contributing factor to our high occupancy, industry-low turnover rate and leading resident satisfaction scores.
| | | | | |
|
MANAGEMENT'S DISCUSSION AND ANALYSIS
FOR THE YEAR ENDED DECEMBER 31, 2021 |
Our Innovation: Tricon is firmly committed to leveraging innovative technologies and housing solutions to drive convenience, connectivity and affordability. Core service offerings are guided by two key desired outcomes: (i) delivering superior service that creates exceptional resident experiences, and (ii) developing offerings that enhance the lives of residents while addressing their housing needs.
Our Impact: Tricon is committed to making investments and operational decisions that reduce our environmental impact and enhance our assets' sustainability and resource efficiency. In our ongoing commitment to environmental stewardship and providing exceptional value for our residents, we recently launched a solar energy pilot at select homes in the Southwestern United States. Tricon's Solar Home systems generate 100% clean, pollution-free and renewable energy sources. Residents living in one of our solar-powered homes are expected to enjoy meaningful energy savings, predictable energy costs and the awareness that they are doing their part to help the environment. Tricon will assess scaling the roll-out of the pilot project across additional homes beginning in 2022.
Our Governance: Tricon aims to proactively identify, understand and manage the risks to our business, while acting in a manner that exemplifies our commitment to ethics, integrity, trust and transparency. As a signatory to the United Nations-supported Principles for Responsible Investment ("PRI") and Canada’s BlackNorth Initiative CEO Pledge, we continue to embed a strong enterprise risk management culture, expand the diversity of our leadership and seek opportunities to strengthen our corporate governance practices.
Our second ESG annual report is slated for publication in the spring of 2022. Details of our key ESG commitments, initiatives, policies, and reported performance progress can be found at www.triconresidential.com/investors/sustainability.
| | | | | |
|
MANAGEMENT'S DISCUSSION AND ANALYSIS
FOR THE YEAR ENDED DECEMBER 31, 2021 |
2. Highlights
The following section presents highlights for the quarter on a consolidated and proportionate basis.
On March 31, 2021, the Company completed the syndication of its U.S. multi-family rental subsidiary to two institutional investors, which resulted in a disposition of 80% of the Company's interest in that subsidiary. Accordingly, the Company deconsolidated the subsidiary and reclassified its current- and prior-year period results as discontinued operations separate from the Company's continuing operations in accordance with IFRS 5. Refer to Notes 2 and 5 in the consolidated financial statements for more details.
Core funds from operations ("Core FFO"), Core FFO per share, Adjusted funds from operations ("AFFO"), and AFFO per share are non-IFRS financial measures and non-IFRS ratios as identified in Section 6. The Company uses guidance specified by the National Association of Real Estate Investment Trusts ("NAREIT") to calculate FFO, upon which Core FFO and AFFO are based. The measures are presented on a proportionate basis, reflecting only the portion attributable to Tricon's shareholders based on the Company's ownership percentage of the underlying entities and excludes the percentage associated with non-controlling and limited partners' interests. The Company believes that providing FFO, Core FFO and AFFO on a proportionate basis is helpful to investors in assessing the overall performance of the Company’s business. Note that FFO, Core FFO, Core FFO per share, AFFO and AFFO per share are not meant to be used in measuring the Company's liquidity. See “Non-IFRS measures” on page 1 and Appendix A for a reconciliation to the most directly comparable IFRS measures.
| | | | | |
|
MANAGEMENT'S DISCUSSION AND ANALYSIS
FOR THE YEAR ENDED DECEMBER 31, 2021 |
| | | | | | | | | | | | | | | | | |
| For the periods ended December 31 | Three months | | Twelve months |
| (in thousands of U.S. dollars, except per share amounts which are in U.S. dollars, unless otherwise indicated) | 2021 | 2020 | | 2021 | 2020 |
| | | | | |
| Financial highlights on a consolidated basis | | | | | |
| Net income from continuing operations, including: | $ | 126,977 | | $ | 75,808 | | | $ | 517,089 | | $ | 112,637 | |
| Fair value gain on rental properties | 261,676 | | 106,995 | | | 990,575 | | 220,849 | |
| Income (loss) from investments in U.S. residential developments | 10,530 | | 10,191 | | | 31,726 | | (61,776) | |
| | | | | |
| Basic earnings per share attributable to shareholders of Tricon from continuing operations | 0.47 | | 0.38 | | | 2.34 | | 0.56 | |
| Diluted earnings per share attributable to shareholders of Tricon from continuing operations | 0.46 | | 0.36 | | | 2.31 | | 0.56 | |
| | | | | |
| Net income (loss) from discontinued operations | — | | 5,670 | | | (67,562) | | 3,776 | |
| | | | | |
| Basic earnings (loss) per share attributable to shareholders of Tricon from discontinued operations | — | | 0.03 | | | (0.31) | | 0.02 | |
| Diluted earnings (loss) per share attributable to shareholders of Tricon from discontinued operations | — | | 0.03 | | | (0.31) | | 0.02 | |
| | | | | |
| | | | | |
| | | | | |
| | | | | |
| | | | | |
| | | | | |
| | | | | |
| | | | | |
| | | | | |
| | | | | |
| | | | | |
Dividends per share(1) | $ | 0.058 | | $ | 0.055 | | | $ | 0.225 | | $ | 0.207 | |
| | | | | |
| Weighted average shares outstanding - basic | 268,428,784 | | 194,679,682 | | | 219,834,130 | | 194,627,127 | |
| Weighted average shares outstanding - diluted | 270,953,420 | | 212,445,547 | | | 222,118,737 | | 195,795,473 | |
| | | | | |
Non-IFRS(2) measures on a proportionate basis | | | | | |
Core funds from operations ("Core FFO") (3) | $ | 45,630 | | $ | 41,430 | | | $ | 152,021 | | $ | 113,217 | |
Adjusted funds from operations ("AFFO") (3) | 36,548 | | 33,985 | | | 121,594 | | 85,342 | |
| | | | | |
Core FFO per share (4) | 0.15 | | 0.17 | | | 0.57 | | 0.51 | |
| | | | | |
| | | | | |
AFFO per share (4) | 0.12 | | 0.14 | | | 0.45 | | 0.38 | |
| | | | | |
| | | | | |
| | | | | |
| | | | | |
| | | | | |
| Select balance sheet items reported on a consolidated basis | | December 31, 2021 | December 31, 2020 |
| | | | | |
| Total assets | | $ | 9,148,617 | | $ | 7,174,834 | |
Total liabilities (5) | | 6,087,548 | | 5,431,596 | |
| Net assets attributable to shareholders of Tricon | | 3,053,794 | | 1,735,096 | |
| | | | | |
| Rental properties | | 7,978,396 | | 6,321,918 | |
| Debt | | 3,917,433 | | 4,137,506 | |
| | | | | |
| | | | | |
(1) Dividends are issued and paid in U.S. dollars. Prior to November 8, 2021, dividends were declared and paid in Canadian dollars; for reporting purposes, amounts recorded in equity were translated to U.S. dollars using the daily exchange rate on the applicable dividend record date.
(2) Non-IFRS measures are presented to illustrate alternative relevant measures to assess the Company's performance. Refer to “Non-IFRS measures” on page 1 and Appendix A.
(3) Performance share unit (PSU) expense of $1,520 and $3,633 for the three and twelve months ended December 31, 2020, respectively, have been removed from Core FFO to conform with the current period presentation. This change resulted in a $1,520 and $3,633 increase in Core FFO and AFFO for the three and twelve months ended December 31, 2020, respectively.
(4) Core FFO per share and AFFO per share are calculated using the total number of weighted average potential dilutive shares outstanding, including the assumed conversion of convertible debentures and exchange of preferred units issued by Tricon PIPE LLC, which was 306,247,538 and 268,562,442 for the three and twelve months ended December 31, 2021, respectively, and 247,739,665 and 223,849,152 for the three and twelve months ended December 31, 2020, respectively.
(5) Includes limited partners' interests in SFR JV-1, SFR JV-HD and SFR JV-2.
IFRS measures on a consolidated basis
Net income from continuing operations in the fourth quarter of 2021 was $127.0 million compared to $75.8 million in the fourth quarter of 2020, and included:
•Revenue from single-family rental properties of $123.4 million compared to $94.4 million in the fourth quarter of 2020, driven by 28.0% growth in the number of rental homes to 29,149 and an 8.7% increase in average
| | | | | |
|
MANAGEMENT'S DISCUSSION AND ANALYSIS
FOR THE YEAR ENDED DECEMBER 31, 2021 |
effective monthly rent, partially offset by a 2.4% decrease in occupancy driven by an accelerated pace of acquisition of vacant homes.
•Direct operating expenses of $40.0 million compared to $30.7 million in the fourth quarter of 2020, reflecting the growth in size of the single-family rental portfolio, higher property tax expenses associated with increasing property values, and incremental repairs and maintenance expenses as a result of a tighter labor market and supply chain delays.
•Revenue from private funds and advisory services of $17.7 million compared to $10.3 million in the fourth quarter of 2020 largely as a result of the syndication and internalization of property management functions of the U.S. multi-family portfolio, an increase in performance fees earned in the quarter, and higher development fees generated from Johnson communities.
•Fair value gain on rental properties of $261.7 million compared to $107.0 million in the fourth quarter of 2020 as a result of significantly higher home values for the single-family rental portfolio. The appreciation in home prices is attributable to a number of factors, including strong population and job growth in the U.S. Sun Belt markets, low mortgage interest rates, and a relatively low supply of new construction.
Net income from continuing operations for the year ended December 31, 2021 was $517.1 million compared to $112.6 million for the year ended December 31, 2020, and included:
•Revenue from single-family rental properties of $441.7 million and direct operating expenses of $145.8 million compared to $367.0 million and $121.2 million in the prior year, respectively, which translated to a net operating income ("NOI") increase of $50.2 million attributable to the organic expansion of the single-family rental portfolio as well as strong rent growth.
•Income from investments in U.S. residential developments of $31.7 million compared to a loss of $61.8 million in 2020; results in the current year reflect healthy project performance in the for-sale housing market and contrast with the comparative period when a major fair value adjustment was taken at the onset of the COVID-19 pandemic due to rapidly deteriorating business fundamentals.
•Fair value gain on rental properties of $990.6 million compared to $220.8 million in the prior year, for the reasons discussed above.
Non-IFRS measures on a proportionate basis
Core funds from operations ("Core FFO") for the fourth quarter of 2021 was $45.6 million, an increase of $4.2 million or 10% compared to $41.4 million in the fourth quarter of 2020. This growth in Core FFO reflects greater fees earned by the Company's Private Funds and Advisory business from new Investment Vehicles formed during the year and NOI growth from the single-family rental business as discussed above. The fourth quarter of 2020 also benefited from a $7.1 million current tax recovery, which did not occur in the current year.
Core FFO increased by $38.8 million or 34% to $152.0 million for the twelve months ended December 31, 2021, compared to $113.2 million in the prior year, for the same reasons discussed above. The full-year Core FFO also includes higher income from investments in U.S. residential developments, driven by improved project performance during the year.
Adjusted funds from operations ("AFFO") for the three and twelve months ended December 31, 2021 was $36.5 million and $121.6 million, respectively, an increase of $2.6 million (8%) and $36.3 million (42%) from the same periods in the prior year. This growth in AFFO was driven by the increase in Core FFO discussed above, partially offset by higher recurring capital expenditures associated with a larger single-family rental portfolio as well as inflationary cost pressures.
| | | | | |
|
MANAGEMENT'S DISCUSSION AND ANALYSIS
FOR THE YEAR ENDED DECEMBER 31, 2021 |
3. Consolidated financial results
The following section should be read in conjunction with the Company’s consolidated financial statements and related notes for the year ended December 31, 2021.
On March 31, 2021, the Company completed the syndication of its U.S. multi-family rental subsidiary to two institutional investors, which resulted in a disposition of 80% of the Company's interest in that subsidiary. Accordingly, the Company deconsolidated the subsidiary and reclassified its current- and prior-year period results as discontinued operations separate from the Company's continuing operations in accordance with IFRS 5. In addition, certain comparative figures have been adjusted to conform with the current period presentation. There was no impact on the financial position and the net income and comprehensive income of the Company as a result of this change in presentation.
Refer to Notes 2 and 5 in the consolidated financial statements for more details in relation to the above.
3.1 Review of income statements
Consolidated statements of income
| | | | | |
|
MANAGEMENT'S DISCUSSION AND ANALYSIS
FOR THE YEAR ENDED DECEMBER 31, 2021 |
| | | | | | | | | | | | | | | | | | | | | | | |
| For the periods ended December 31 | Three months | | Twelve months |
| (in thousands of U.S. dollars, except per share amounts which are in U.S. dollars) | 2021 | 2020 | Variance | | 2021 | 2020 | Variance |
| | | | | | | |
| Revenue from single-family rental properties | $ | 123,371 | | $ | 94,400 | | $ | 28,971 | | | $ | 441,743 | | $ | 366,982 | | $ | 74,761 | |
| Direct operating expenses | (40,016) | | (30,681) | | (9,335) | | | (145,768) | | (121,242) | | (24,526) | |
| Net operating income from single-family rental properties | 83,355 | | 63,719 | | 19,636 | | | 295,975 | | 245,740 | | 50,235 | |
| | | | | | | |
| Revenue from private funds and advisory services | 17,678 | | 10,339 | | 7,339 | | | 50,693 | | 34,090 | | 16,603 | |
| | | | | | | |
Income from equity-accounted investments in multi-family rental properties (1) | 33,961 | | 427 | | 33,534 | | | 75,333 | | 746 | | 74,587 | |
Income from equity-accounted investments in Canadian residential developments (2) | 10,085 | | 8,293 | | 1,792 | | | 8,200 | | 13,378 | | (5,178) | |
Other income (3) | 3,858 | | 2,083 | | 1,775 | | | 4,786 | | 2,565 | | 2,221 | |
Income (loss) from investments in U.S. residential developments (4) | 10,530 | | 10,191 | | 339 | | | 31,726 | | (61,776) | | 93,502 | |
| Compensation expense | (35,718) | | (17,200) | | (18,518) | | | (89,951) | | (52,095) | | (37,856) | |
| Performance fees expense | (40,854) | | (1,103) | | (39,751) | | | (42,272) | | (1,055) | | (41,217) | |
| General and administration expense | (14,565) | | (8,642) | | (5,923) | | | (41,420) | | (34,235) | | (7,185) | |
| Loss on debt extinguishment | — | | — | | — | | | (3,497) | | — | | (3,497) | |
| Transaction costs | (3,830) | | (1,986) | | (1,844) | | | (13,260) | | (11,607) | | (1,653) | |
| Interest expense | (35,648) | | (36,344) | | 696 | | | (147,680) | | (137,146) | | (10,534) | |
| Fair value gain on rental properties | 261,676 | | 106,995 | | 154,681 | | | 990,575 | | 220,849 | | 769,726 | |
| Fair value gain on Canadian development properties | 10,098 | | — | | 10,098 | | | 10,098 | | — | | 10,098 | |
| Fair value loss on derivative financial instruments and other liabilities | (72,783) | | (16,418) | | (56,365) | | | (220,177) | | (7,461) | | (212,716) | |
| Amortization and depreciation expense | (2,818) | | (2,608) | | (210) | | | (12,129) | | (10,826) | | (1,303) | |
| Realized and unrealized foreign exchange (loss) gain | (407) | | 948 | | (1,355) | | | (2,934) | | (170) | | (2,764) | |
| Net change in fair value of limited partners’ interests in single-family rental business | (43,519) | | (17,780) | | (25,739) | | | (185,921) | | (50,581) | | (135,340) | |
| 80,066 | | 26,856 | | 53,210 | | | 361,477 | | (129,414) | | 490,891 | |
| Income before income taxes from continuing operations | $ | 181,099 | | $ | 100,914 | | $ | 80,185 | | | $ | 708,145 | | $ | 150,416 | | $ | 557,729 | |
| Income tax expense from continuing operations | (54,122) | | (25,106) | | (29,016) | | | (191,056) | | (37,779) | | (153,277) | |
| | | | | | | |
| | | | | | | |
| Net income from continuing operations | $ | 126,977 | | $ | 75,808 | | $ | 51,169 | | | $ | 517,089 | | $ | 112,637 | | $ | 404,452 | |
| | | | | | | |
| Basic earnings per share attributable to shareholders of Tricon from continuing operations | 0.47 | | 0.38 | | 0.09 | | | 2.34 | | 0.56 | | 1.78 | |
| Diluted earnings per share attributable to shareholders of Tricon from continuing operations | 0.46 | | 0.36 | | 0.10 | | | 2.31 | | 0.56 | | 1.75 | |
| | | | | | | |
| Net income (loss) from discontinued operations | — | | 5,670 | | (5,670) | | | (67,562) | | 3,776 | | (71,338) | |
| | | | | | | |
| | | | | | | |
| | | | | | | |
| | | | | | | |
| | | | | | | |
| | | | | | | |
| | | | | | | |
| | | | | | | |
| | | | | | | |
| | | | | | | |
| | | | | | | |
| | | | | | | |
| | | | | | | |
| | | | | | | |
| | | | | | | |
| | | | | | | |
| | | | | | | |
| Basic earnings (loss) per share attributable to shareholders of Tricon from discontinued operations | — | | 0.03 | | (0.03) | | | (0.31) | | 0.02 | | (0.33) | |
| Diluted earnings (loss) per share attributable to shareholders of Tricon from discontinued operations | — | | 0.03 | | (0.03) | | | (0.31) | | 0.02 | | (0.33) | |
| | | | | | | |
| Weighted average shares outstanding - basic | 268,428,784 | | 194,679,682 | | 73,749,102 | | | 219,834,130 | | 194,627,127 | | 25,207,003 | |
Weighted average shares outstanding - diluted (5) | 270,953,420 | | 212,445,547 | | 58,507,873 | | | 222,118,737 | | 195,795,473 | | 26,323,264 | |
| | | | | |
|
MANAGEMENT'S DISCUSSION AND ANALYSIS
FOR THE YEAR ENDED DECEMBER 31, 2021 |
(1) Includes income from The Selby and the U.S. multi-family rental portfolio, which was syndicated on March 31, 2021 (Section 4.2.1).
(2) Includes income from The Taylor, West Don Lands, The Ivy, 7 Labatt and Queen & Ontario (Section 4.2.2).
(3) Includes other income from Canadian development properties, The James (Scrivener Square) and The Shops of Summerhill (Section 4.2.2), along with other non-cash income resulting from a derecognition of investments in U.S. residential developments. Refer to Note 10 to the consolidated financial statements. The comparative period also includes government assistance received by Johnson.
(4) Reflects the net change in the fair values of the underlying investments in the legacy for-sale housing business (Section 4.2.2).
(5) For the three and twelve months ended December 31, 2021, the Company's 2022 convertible debentures and the exchangeable preferred units of Tricon PIPE LLC were anti-dilutive. For the three months ended December 31, 2020, the Company’s 2022 convertible debentures were dilutive and the exchangeable preferred units of Tricon PIPE LLC were anti-dilutive, whereas for the twelve months ended December 31, 2020, both were anti-dilutive. Refer to Note 30 to the consolidated financial statements.
Revenue from single-family rental properties
The following table provides further details regarding revenue from single-family rental properties for the three and twelve months ended December 31, 2021 and 2020.
| | | | | | | | | | | | | | | | | | | | | | | |
| For the periods ended December 31 | Three months | | Twelve months |
| (in thousands of U.S. dollars) | 2021 | 2020 | Variance | | 2021 | 2020 | Variance |
| | | | | | | |
Rental revenue(1) | $ | 117,450 | | $ | 91,257 | | $ | 26,193 | | | $ | 423,806 | | $ | 354,313 | | $ | 69,493 | |
Other revenue(1) | 5,921 | | 3,143 | | 2,778 | | | 17,937 | | 12,669 | | 5,268 | |
| Revenue from single-family rental properties | $ | 123,371 | | $ | 94,400 | | $ | 28,971 | | | $ | 441,743 | | $ | 366,982 | | $ | 74,761 | |
(1) All rental and other revenue are reflected net of bad debt. The Company has reserved 100% of residents’ accounts receivable balances aged more than 30 days.
Revenue from single-family rental properties for the three months ended December 31, 2021 totaled $123.4 million, an increase of $29.0 million or 30.7% compared to $94.4 million for the same period in the prior year. The increase is attributable to:
•Growth of $26.2 million in rental revenue, reflecting a 28.0% portfolio expansion (29,149 rental homes compared to 22,766) and 8.7% year-over-year increase in average effective monthly rent per home ($1,591 compared to $1,464) driven by continued strong demand for single-family rental homes. This increase in revenue was partially offset by a 2.4% decrease in occupancy (94.0% compared to 96.4%) attributable to an accelerated pace of acquisition of vacant homes this quarter.
•An increase of $2.8 million in other revenue driven by portfolio expansion as well as incremental ancillary revenue from the roll-out of the Company's smart-home technology initiative along with higher resident enrollment in its renters insurance program. Tricon continues to modernize newly-acquired and existing homes with smart-home packages as they are vacated (approximately 51% of single-family rental homes were smart-home enabled at December 31, 2021 compared to 27% at December 31, 2020).
Revenue from single-family rental properties for the twelve months ended December 31, 2021 totaled $441.7 million, an increase of $74.8 million or 20.4% compared to the prior year, primarily driven by the rental portfolio growth as well as an improvement in the average monthly rent along with higher other revenue, partly offset by a decrease in occupancy for the reasons discussed above.
Direct operating expenses
The following table provides further details regarding direct operating expenses of the single-family rental portfolio for the three and twelve months ended December 31, 2021 and 2020.
| | | | | |
|
MANAGEMENT'S DISCUSSION AND ANALYSIS
FOR THE YEAR ENDED DECEMBER 31, 2021 |
| | | | | | | | | | | | | | | | | | | | | | | |
| For the periods ended December 31 | Three months | | Twelve months |
| (in thousands of U.S. dollars) | 2021 | 2020(1) | Variance | | 2021 | 2020(1) | Variance |
| | | | | | | |
| Property taxes | $ | 18,162 | | $ | 14,002 | | $ | 4,160 | | | $ | 66,493 | | $ | 55,615 | | $ | 10,878 | |
| Repairs and maintenance | 6,016 | | 4,809 | | 1,207 | | | 22,252 | | 17,995 | | 4,257 | |
| Turnover | 1,370 | | 1,437 | | (67) | | | 5,754 | | 6,580 | | (826) | |
| Property management expenses | 8,153 | | 5,939 | | 2,214 | | | 29,247 | | 24,543 | | 4,704 | |
| Property insurance | 1,680 | | 1,617 | | 63 | | | 6,081 | | 4,966 | | 1,115 | |
| Marketing and leasing | 553 | | 414 | | 139 | | | 1,747 | | 1,483 | | 264 | |
| Homeowners' association (HOA) costs | 1,723 | | 1,255 | | 468 | | | 6,169 | | 4,906 | | 1,263 | |
Other direct expense(2) | 2,359 | | 1,208 | | 1,151 | | | 8,025 | | 5,154 | | 2,871 | |
| Direct operating expenses | $ | 40,016 | | $ | 30,681 | | $ | 9,335 | | | $ | 145,768 | | $ | 121,242 | | $ | 24,526 | |
(1) The comparative period has been reclassified to conform with the current period presentation. Marketing and leasing expenses that were previously included in property management expenses have now been reclassified as a separate line item. Additionally, broker fees of $85 and $340 for the three and twelve months ended December 31, 2021, respectively, have been reclassified from property insurance to property management expenses.
(2) Other direct expense includes property utilities and other property operating costs associated with ancillary revenue offerings.
Direct operating expenses for the three months ended December 31, 2021 were $40.0 million, an increase of $9.3 million or 30.4% compared to the same period in the prior year. The variance is primarily attributable to:
•An increase of $4.2 million in property taxes driven by 28.0% growth in the size of the portfolio, as well as a higher property tax expense per home as a result of higher assessed property values propelled by home price appreciation.
•An increase of $1.2 million in repairs and maintenance owing to a larger portfolio of homes along with higher labor costs associated with a tighter employment market, as well as higher material costs caused by supply chain delays, due in part to the ongoing impact of the COVID-19 pandemic.
•An increase of $2.2 million in property management expenses as a result of additional operations personnel hired to manage a growing rental portfolio.
•An increase of $1.2 million in other direct expenses resulting from additional costs of supplying access to smart-home technology in more homes and providing renters insurance to more residents (these costs are offset by higher revenue). Higher utility costs on vacant homes acquired during the quarter also impacted other direct expenses. Once a home is renovated to the Company's standard and becomes rent-ready, utility costs are expensed by the Company until it is leased.
Direct operating expenses for the twelve months ended December 31, 2021 were $145.8 million, an increase of $24.5 million or 20.2% compared to the prior year primarily for the reasons described above.
Revenue from private funds and advisory services
The following table provides further details regarding revenue from private funds and advisory services for the three and twelve months ended December 31, 2021 and 2020, net of inter-segment revenues eliminated upon consolidation.
| | | | | | | | | | | | | | | | | | | | | | | |
| For the periods ended December 31 | Three months | | Twelve months |
| (in thousands of U.S. dollars) | 2021 | 2020 | Variance | | 2021 | 2020 | Variance |
| | | | | | | |
| Asset management fees | $ | 3,386 | | $ | 2,815 | | $ | 571 | | | $ | 12,719 | | $ | 12,061 | | $ | 658 | |
| Performance fees | 3,676 | | 1,691 | | 1,985 | | | 8,909 | | 2,836 | | 6,073 | |
| Development fees | 7,993 | | 5,653 | | 2,340 | | | 24,418 | | 18,298 | | 6,120 | |
| Property management fees | 2,623 | | 180 | | 2,443 | | | 4,647 | | 895 | | 3,752 | |
| Revenue from private funds and advisory services | $ | 17,678 | | $ | 10,339 | | $ | 7,339 | | | $ | 50,693 | | $ | 34,090 | | $ | 16,603 | |
| | | | | |
|
MANAGEMENT'S DISCUSSION AND ANALYSIS
FOR THE YEAR ENDED DECEMBER 31, 2021 |
Revenue from private funds and advisory services for the three months ended December 31, 2021 totaled $17.7 million, an increase of $7.3 million from the same period in the prior year, mainly attributable to:
•An increase of $2.4 million in property management fees earned from managing the U.S multi-family rental portfolio. The Company syndicated the rental portfolio on March 31, 2021 and internalized the property management functions in the third quarter of 2021, at which time the Company began earning property management fees.
•An increase of $2.3 million in development fees, including $2.0 million driven by strong lot sales at Johnson communities and $0.4 million from several Canadian residential development projects which commenced development over the past year.
•An increase of $2.0 million in performance fees primarily from legacy for-sale housing investments, which are earned by the Company when an Investment Vehicle's realized returns exceed third-party investor return thresholds. Typically, performance fees are episodic in nature and can fluctuate materially on a year-over-year basis.
Revenue from private funds and advisory services for the twelve months ended December 31, 2021 totaled $50.7 million, an increase of $16.6 million from the prior year largely for the reasons discussed above.
Income from equity-accounted investments in multi-family rental properties
Equity-accounted investments in multi-family rental properties include Tricon's 20% interest in the U.S. multi-family rental joint venture formed on March 31, 2021, along with its 15% investment in 592 Sherbourne LP, which owns The Selby.
The following table provides further details regarding income from equity-accounted investments in multi-family rental properties for the three and twelve months ended December 31, 2021 and 2020.
| | | | | | | | | | | | | | | | | | | | | | | |
| For the periods ended December 31 | Three months | | Twelve months |
| (in thousands of U.S. dollars) | 2021 | 2020 | Variance | | 2021 | 2020 | Variance |
| | | | | | | |
| | | | | | | |
| | | | | | | |
| U.S. multi-family rental portfolio | $ | 31,884 | | $ | — | | $ | 31,884 | | | $ | 73,078 | | $ | — | | $ | 73,078 | |
| 592 Sherbourne LP (The Selby) | 2,077 | | 427 | | 1,650 | | | 2,255 | | 746 | | 1,509 | |
| Income from equity-accounted investments in multi-family rental properties | $ | 33,961 | | $ | 427 | | $ | 33,534 | | | $ | 75,333 | | $ | 746 | | $ | 74,587 | |
Income from equity-accounted investments in multi-family rental properties for the three months ended December 31, 2021 was $34.0 million, a $33.5 million increase from the same period in the prior year. The variance was driven by:
•The inclusion of the U.S. multi-family rental portfolio as an equity-accounted investment in the current period and the incorporation of its associated income. While net operating income in the U.S. multi-family rental joint venture has now surpassed pre-pandemic levels, the majority of the income during the quarter was driven by fair value gains recorded on select properties. The fair values of the properties were determined using the direct income capitalization approach and fair value gains were recognized primarily as a result of capitalization rate compression in the U.S. Sun Belt. As at December 31, 2021, the Company has externally appraised approximately 80% of the U.S. multi-family rental properties within the portfolio. Prior to March 31, 2021, the financial results of the U.S. multi-family portfolio were accounted for under income from discontinued operations.
•An additional increase of $1.7 million in income from The Selby primarily attributable to fair value gains on the property in the current quarter while no fair value changes were recorded in the comparative period.
| | | | | |
|
MANAGEMENT'S DISCUSSION AND ANALYSIS
FOR THE YEAR ENDED DECEMBER 31, 2021 |
Income from equity-accounted investments in multi-family rental properties for the twelve months ended December 31, 2021 was $75.3 million, a $74.6 million increase from the prior year, attributable to the reasons discussed above.
Income from equity-accounted investments in Canadian residential developments
Equity-accounted investments in Canadian residential developments include joint ventures and equity holdings in development projects, namely The Taylor, West Don Lands, The Ivy and Queen & Ontario. The James (Scrivener Square) and The Shops of Summerhill are accounted for as Canadian development properties. The income earned from The Shops of Summerhill is presented as other income.
The following table presents the income from equity-accounted investments in Canadian residential developments for the three and twelve months ended December 31, 2021 and 2020.
| | | | | | | | | | | | | | | | | | | | | | | |
| For the periods ended December 31 | Three months | | Twelve months |
| (in thousands of U.S. dollars) | 2021 | 2020 | Variance | | 2021 | 2020 | Variance |
| | | | | | | |
| Income from equity-accounted investments in Canadian residential developments | $ | 10,085 | | $ | 8,293 | | $ | 1,792 | | | $ | 8,200 | | $ | 13,378 | | $ | (5,178) | |
Income from equity-accounted investments in Canadian residential developments for the three months ended December 31, 2021 was $10.1 million, an increase of $1.8 million from the same period in the prior year. Income in the current quarter was driven by fair value gains resulting from land value increases across the portfolio and the achievement of development milestones at The Taylor, which is nearing its initial occupancy. In comparison, the fair value gains in the comparative period were primarily attributable to development milestones achieved by Block 3/4/7 of the West Don Lands project.
Income from equity-accounted investments in Canadian residential developments for the twelve months ended December 31, 2021 was $8.2 million, a decrease of $5.2 million from the prior year. This decrease in income during the year was primarily attributable to a fair value adjustment realized on the sale of the 7 Labatt development project. Similar to the discussion above, the income in the comparative period reflected fair value gains on several blocks of the West Don Lands project.
Income (loss) from investments in U.S. residential developments
The following table presents the income (loss) from investments in U.S. residential developments for the three and twelve months ended December 31, 2021 and 2020.
| | | | | | | | | | | | | | | | | | | | | | | |
| For the periods ended December 31 | Three months | | Twelve months |
| (in thousands of U.S. dollars) | 2021 | 2020 | Variance | | 2021 | 2020 | Variance |
| | | | | | | |
| Income (loss) from investments in U.S. residential developments | $ | 10,530 | | $ | 10,191 | | $ | 339 | | | $ | 31,726 | | $ | (61,776) | | $ | 93,502 | |
Income from investments in U.S. residential developments for the three months ended December 31, 2021 was $10.5 million, an increase of $0.3 million from the same period in the prior year primarily driven by strong U.S. housing market fundamentals. The Company’s for-sale housing investments continued to benefit from an improving economy and healthy housing demand in various sub-markets throughout the U.S. Sun Belt. These trends are supported by low mortgage rates and ongoing de-urbanization as employees take advantage of flexible work arrangements, and increased preference for larger living spaces in suburban locations.
Income from investments in U.S. residential developments for the twelve months ended December 31, 2021 was $31.7 million, an increase of $93.5 million from the same period in the prior year. This year-over-year increase is attributable to the aforementioned healthy project performance in the current year as well as a one-time fair value write-down incurred in the comparative period. In the first quarter of 2020, the Company made a meaningful downward adjustment to the fair value of its investments in U.S. residential developments owing to rapidly deteriorating business fundamentals at the onset of the COVID-19 pandemic and the associated market and economic uncertainties at that time.
| | | | | |
|
MANAGEMENT'S DISCUSSION AND ANALYSIS
FOR THE YEAR ENDED DECEMBER 31, 2021 |
While the for-sale housing market outlook for 2022 appears favorable, management continues to monitor for possible inflationary pressures driving up labor and material costs, in addition to supply chain delays caused in part by the COVID-19 pandemic, which could have an impact on development timelines as well as new for-sale housing supply.
Compensation expense
The following table provides further details regarding compensation expense for the three and twelve months ended December 31, 2021 and 2020.
| | | | | | | | | | | | | | | | | | | | | | | | | | |
| For the periods ended December 31 | | Three months | | Twelve months |
| (in thousands of U.S. dollars) | | 2021 | 2020 | Variance | | 2021 | 2020 | Variance |
| | | | | | | | |
| Salaries and benefits | A | $ | 13,412 | | $ | 9,682 | | $ | 3,730 | | | $ | 43,630 | | $ | 34,501 | | $ | 9,129 | |
| | | | | | | | |
Cash-based (1) | | 5,038 | | 4,850 | | 188 | | | 15,922 | | 12,088 | | 3,834 | |
Equity-based (1) | | 8,668 | | 1,718 | | 6,950 | | | 16,306 | | 5,699 | | 10,607 | |
| Annual incentive plan ("AIP") | B | 13,706 | | 6,568 | | 7,138 | | | 32,228 | | 17,787 | | 14,441 | |
| | | | | | | | |
Cash-based (2) | | 8,283 | | 446 | | 7,837 | | | 13,532 | | (3,106) | | 16,638 | |
| Equity-based | | 317 | | 504 | | (187) | | | 561 | | 2,913 | | (2,352) | |
| Long-term incentive plan ("LTIP") | C | 8,600 | | 950 | | 7,650 | | | 14,093 | | (193) | | 14,286 | |
| | | | | | | | |
Total compensation expense (2) | A+B+C | $ | 35,718 | | $ | 17,200 | | $ | 18,518 | | | $ | 89,951 | | $ | 52,095 | | $ | 37,856 | |
(1) Include one-time allocations for special awards under the AIP.
(2) The comparative period has been reclassified to conform with the current period presentation. Refer to Note 2 of the consolidated financial statements for details.
Compensation expense for the three months ended December 31, 2021 was $35.7 million, an increase of $18.5 million compared to the same period in the prior year. The variance is attributable to:
•An increase of $7.7 million in LTIP expense, primarily related to cash-based LTIP expense attributable to higher estimated future performance fees that are expected to be paid to participants under the LTIP once the performance fees are realized. The increase in estimated future performance fees is driven by fair value gains across Tricon's Investment Vehicles, particularly in the single-family rental and multi-family rental business segments.
•An increase of $7.1 million in AIP expense, primarily related to a $3.8 million increase in cash-settled PSUs, which incorporates existing and new entitlements as well as increases from the revaluation of the PSU liability based on a higher stock price. In the three months ended December 31, 2021, the Company's share price on the TSX increased by $2.01 per share, on a USD-converted basis, compared to $0.70 in the comparative period. The current period also includes $3.3 million of one-time allocations for special awards to approximately 100 employees as a retention tool given the very competitive labor market.
•An increase of $3.7 million in payroll costs was a result of a 35% higher headcount to support Tricon's ongoing growth and expansion of business activities, as well as normal course salary adjustments.
Compensation expense for the twelve months ended December 31, 2021 was $90.0 million, an increase of $37.9 million compared to the prior year, corresponding to:
•An increase of $14.4 million in AIP expense, primarily related to cash-settled PSUs, including the revaluation of the PSU liability based on a higher stock price. Tricon's share price on the TSX increased by $6.29 per share in 2021, on a USD-converted basis, compared to $0.79 in the prior year. In addition, both cash-based and equity-based AIP awards increased in alignment with Tricon's overall financial performance, a significant increase in headcount (as described above), and expanded AIP eligibility as Tricon transitioned to a unified company and realigned the senior management team.
| | | | | |
|
MANAGEMENT'S DISCUSSION AND ANALYSIS
FOR THE YEAR ENDED DECEMBER 31, 2021 |
•An increase of $14.3 million in LTIP expense, primarily related to a $16.6 million increase in cash-based LTIP expense as discussed above. Note that the comparative period includes a $3.1 million reversal of cash-based LTIP expense accrual driven by fair value changes related to Tricon's investments in for-sale housing. The increase in cash-based LTIP expense is partially offset by a decrease of $2.4 million in equity-based LTIP expense attributable to the settlement of a significant number of outstanding stock options in the prior year.
•An increase of $9.1 million in payroll costs as described above.
Performance fees expense
The following table presents performance fees expense for the three and twelve months ended December 31, 2021 and 2020.
| | | | | | | | | | | | | | | | | | | | | | | |
| For the periods ended December 31 | Three months | | Twelve months |
| (in thousands of U.S. dollars) | 2021 | 2020 | Variance | | 2021 | 2020 | Variance |
| | | | | | | |
| Performance fees expense | $ | 40,854 | | $ | 1,103 | | $ | 39,751 | | | $ | 42,272 | $ | 1,055 | $ | 41,217 |
Performance fees expense for the three months ended December 31, 2021 was $40.9 million, an increase of $39.8 million compared to the same period in the prior year, driven by a significant increase in unrealized carried interest in connection with fair value gains of the underlying Investment Vehicles, which will be paid to key management equity participants if and when the amounts are in fact realized and paid. In aggregate, cash-based LTIP expense and performance fees expense represent no more than 50% of Tricon's share of performance fees from each Investment Vehicle.
Performance fees expense for the twelve months ended December 31, 2021 was $42.3 million, an increase of $41.2 million compared to the prior year, for the same reasons described above.
General and administration expense
The following table presents general and administration expense for the three and twelve months ended December 31, 2021 and 2020.
| | | | | | | | | | | | | | | | | | | | | | | |
| For the periods ended December 31 | Three months | | Twelve months |
| (in thousands of U.S. dollars) | 2021 | 2020 | Variance | | 2021 | 2020 | Variance |
| | | | | | | |
| General and administration expense | $ | 14,565 | | $ | 8,642 | | $ | 5,923 | | | $ | 41,420 | $ | 34,235 | $ | 7,185 |
General and administration expense for the three months ended December 31, 2021 was $14.6 million, an increase of $5.9 million compared to the same period in the prior year, corresponding with Tricon's significant growth throughout the year including its U.S. initial public offering in the fourth quarter which resulted in increased compliance costs. In addition, the Company incurred higher costs associated with travel and office reopening efforts, as pandemic-related restrictions eased, and the expansion of its technology-enabled operating platform.
General and administration expense for the twelve months ended December 31, 2021 was $41.4 million, an increase of $7.2 million compared to the prior year, for the same reasons described above.
Interest expense
The following table provides details regarding interest expense for the three and twelve months ended December 31, 2021 and 2020 by borrowing type and nature.
| | | | | |
|
MANAGEMENT'S DISCUSSION AND ANALYSIS
FOR THE YEAR ENDED DECEMBER 31, 2021 |
| | | | | | | | | | | | | | | | | | | | | | | | | | | |
| For the periods ended December 31 | Three months | | Twelve months | | |
| (in thousands of U.S. dollars) | 2021 | 2020 | Variance | | 2021 | 2020 | Variance | | | | |
| | | | | | | | | | | |
| Corporate borrowings | $ | 881 | | $ | 1,018 | | $ | (137) | | | $ | 4,458 | | $ | 13,032 | | $ | (8,574) | | | | | |
| Property-level borrowings | 26,538 | | 24,778 | | 1,760 | | | 102,669 | | 97,611 | | 5,058 | | | | | |
| Convertible debentures | — | | 2,506 | | (2,506) | | | 6,732 | | 9,927 | | (3,195) | | | | | |
| Due to Affiliate | 4,312 | | 4,312 | | — | | | 17,250 | | 5,654 | | 11,596 | | | | | |
| Amortization of deferred financing costs, discounts and lease obligations | 3,917 | | 3,730 | | 187 | | | 16,571 | | 10,922 | | 5,649 | | | | | |
| Total interest expense | $ | 35,648 | | $ | 36,344 | | $ | (696) | | | $ | 147,680 | | $ | 137,146 | | $ | 10,534 | | | | | |
| | | | | | | | | | | |
| Weighted average interest rate | | | | | 2.62 | % | 3.12 | % | (0.50 | %) | | | | |
Interest expense was $35.6 million for the three months ended December 31, 2021, a decrease of $0.7 million compared to $36.3 million for the same period last year. The variance is primarily attributable to:
•A decrease of $2.5 million in interest expense on convertible debentures as the outstanding 2022 convertible debentures were redeemed in full by the Company on September 9, 2021 (see Section 3.2).
•A partially offsetting increase of $1.8 million in interest expense on property-level borrowings, driven by additional debt of $749.9 million assumed to finance the Company's acquisition of single-family rental homes as part of its growth strategy. Despite the higher level of property-level borrowings, the Company benefited from a 0.31% decrease in the average effective interest rate compared to the fourth quarter of 2020.
Interest expense was $147.7 million for the twelve months ended December 31, 2021, an increase of $10.5 million compared to $137.1 million in the prior year. The variance is primarily attributable to:
•An increase of $11.6 million in interest expense on the Due to Affiliate balance in connection with the preferred unit issuance in September 2020. The twelve months ended December 31, 2021 reflects a full year of interest expense inclusion whereas the Company incurred only four months of interest expense in the prior year. These interest payments are to fund dividend payments by Tricon PIPE LLC.
•An increase of $5.6 million in the amortization of deferred financing costs and discounts associated with the Due to Affiliate and higher property-level debt balances.
•An increase of $5.1 million in interest expense on property-level borrowings, as described above. The increase in single-family rental borrowings outweighs the impact of a 0.34% decrease in the average effective interest rate compared to the prior year.
•A partially offsetting decrease of $8.6 million in interest expense on corporate borrowings, primarily resulting from lower utilization of the corporate credit facility during the current year. The weighted average balance on this facility was $39.1 million in 2021 compared to $237.1 million in 2020.
•A further decrease of $3.2 million in interest expense resulting from the convertible debentures redemption as discussed above.
Fair value gain on rental properties
The following table presents the fair value gain on rental properties held by the Company for the three and twelve months ended December 31, 2021 and 2020.
| | | | | | | | | | | | | | | | | | | | | | | |
| For the periods ended December 31 | Three months | | Twelve months |
| (in thousands of U.S. dollars) | 2021 | 2020 | Variance | | 2021 | 2020 | Variance |
| | | | | | | |
| Fair value gain on rental properties | $ | 261,676 | | $ | 106,995 | | $ | 154,681 | | | $ | 990,575 | | $ | 220,849 | | $ | 769,726 | |
| | | | | |
|
MANAGEMENT'S DISCUSSION AND ANALYSIS
FOR THE YEAR ENDED DECEMBER 31, 2021 |
Fair value gain on single-family rental properties was $261.7 million for the three months ended December 31, 2021, an increase of $154.7 million compared to $107.0 million for the same period last year. For the twelve months ended December 31, the fair value gain totaled $990.6 million, an increase of $769.7 million from the prior year. The fair value of single-family rental homes is typically determined primarily by using the Home Price Index ("HPI") methodology and periodically Broker Price Opinions (“BPOs”), as applicable. Refer to Note 6 in the consolidated financial statements for further details.
The higher home values for Tricon’s single-family rental portfolio are attributable to a number of factors, including strong population and job growth in the U.S. Sun Belt markets, a shortage of new housing supply and low mortgage interest rates. These factors contributed to HPI growth in the fourth quarter of 2021 of 5.2% (20.8% annualized), net of capital expenditures, compared to 4.2% (16.8% annualized) in the same period in the prior year. The HPI and BPO methodologies were also applied to a larger portfolio of homes (29,149 homes in Q4 2021 compared to 22,766 in Q4 2020), driving even higher fair value gains.
Fair value loss on derivative financial instruments and other liabilities
The following table presents the fair value loss on derivative financial instruments and other liabilities for the three and twelve months ended December 31, 2021 and 2020.
| | | | | | | | | | | | | | | | | | | | | | | |
| For the periods ended December 31 | Three months | | Twelve months |
| (in thousands of U.S. dollars) | 2021 | 2020 | Variance | | 2021 | 2020 | Variance |
| | | | | | | |
| Fair value loss on derivative financial instruments and other liabilities | $ | (72,783) | | $ | (16,418) | | $ | (56,365) | | | $ | (220,177) | | $ | (7,461) | | $ | (212,716) | |
For the three months ended December 31, 2021, the fair value loss on derivative financial instruments and other liabilities increased by $56.4 million to $72.8 million compared to a loss of $16.4 million in the same period in the prior year. The fair value loss on the derivative financial instruments was driven by an overall increase in Tricon's share price, on a USD-converted basis, which served to increase the probability of exchange of the preferred units of Tricon PIPE LLC into Tricon common shares. Refer to Notes 20 and 21 of the Company's consolidated financial statements for the year ended December 31, 2021 for details on the derivative financial instrument.
For the twelve months ended December 31, 2021, the fair value loss on derivative financial instruments and other liabilities increased by $212.7 million to $220.2 million compared to a $7.5 million loss in the same period in the prior year. The variance is primarily driven by:
•An increase of $176.9 million in the derivative liability in connection with the exchangeable preferred units, as discussed above.
•An increase of $36.7 million in fair value loss on the 2022 convertible debentures, as a result of the increase in share price discussed above. As at December 31, 2021, all of the 2022 convertible debentures had been converted into Tricon's common shares.
The Company also has other types of derivative financial instruments that consist of $0.4 million in interest rate caps on the Company’s floating-rate debt which are used as an interest-rate risk mitigation strategy.
Net change in fair value of limited partners’ interests in single-family rental business
Limited partner ownership interests in the single-family rental joint ventures, "SFR JV-1", "SFR JV-HD" and "SFR JV-2", are in the form of non-controlling limited partnership interests which are classified as liabilities under the provisions of IFRS. The following table presents the net change in fair value of limited partners' interests in the single-family rental business for the three and twelve months ended December 31, 2021 and 2020.
| | | | | |
|
MANAGEMENT'S DISCUSSION AND ANALYSIS
FOR THE YEAR ENDED DECEMBER 31, 2021 |
| | | | | | | | | | | | | | | | | | | | | | | |
| For the periods ended December 31 | Three months | | Twelve months |
| (in thousands of U.S. dollars) | 2021 | 2020 | Variance | | 2021 | 2020 | Variance |
| | | | | | | |
| Net change in fair value of limited partners’ interests in single-family rental business | $ | (43,519) | | $ | (17,780) | | $ | (25,739) | | | $ | (185,921) | | $ | (50,581) | | $ | (135,340) | |
For the three months ended December 31, 2021, the change in fair value of limited partners' interests in the single-family rental business was $43.5 million compared to $17.8 million for the same period in the prior year, representing an increase in non-controlling limited partners' interests of $25.7 million. This increase mainly reflects additional income earned from SFR JV-1 during the period that is attributable to the Company’s joint venture partners. The higher income was mainly driven by a $26.0 million increase in the limited partners' share of the fair value gain on rental properties and a $10.7 million increase in NOI, which were partly offset by an $11.0 million increase in interest expense and other expenses.
The SFR JV-HD and SFR JV-2 joint ventures did not have a meaningful impact on the net change in fair value of limited partners' interests in the single-family rental business given their recent formation.
For the twelve months ended December 31, 2021, the change in fair value of limited partners' interests in the single-family rental business was $185.9 million compared to $50.6 million for the same period in the prior year, representing an increase of $135.3 million. The factors driving this change are consistent with those discussed above.
Income tax expense from continuing operations
The following table provides details regarding income tax expense from continuing operations for the three and twelve months ended December 31, 2021 and 2020.
| | | | | | | | | | | | | | | | | | | | | | | |
| For the periods ended December 31 | Three months | | Twelve months |
| (in thousands of U.S. dollars) | 2021 | 2020 | Variance | | 2021 | 2020 | Variance |
| | | | | | | |
| Income tax (expense) recovery - current | $ | (615) | | $ | 7,082 | | $ | (7,697) | | | $ | 43,427 | | $ | 4,045 | | $ | 39,382 | |
| Income tax expense - deferred | (53,507) | | (32,188) | | (21,319) | | | (234,483) | | (41,824) | | (192,659) | |
| Income tax expense from continuing operations | $ | (54,122) | | $ | (25,106) | | $ | (29,016) | | | $ | (191,056) | | $ | (37,779) | | $ | (153,277) | |
For the three months ended December 31, 2021, income tax expense from continuing operations was $54.1 million, an increase of $29.0 million compared to $25.1 million in the same period in the prior year, which was driven primarily by deferred tax expense on a higher fair value gain recognized on the single-family rental properties. In addition, current tax expense increased by $7.7 million largely as a result of a current tax recovery of $7.1 million in the fourth quarter of 2020. The prior-year tax recovery had arisen from the utilization of a loss carryback provision which enabled the Company to apply tax losses from certain corporate entities in 2020 against taxes paid in previous periods.
For the twelve months ended December 31, 2021, income tax expense from continuing operations was $191.1 million, an increase of $153.3 million compared to an income tax expense of $37.8 million in the prior year. This change is primarily driven by an increase in deferred tax expense. The Company's higher deferred tax expense resulted from (i) a higher fair value gain on the single-family rental properties, and (ii) the crystallization of tax losses carried forward from prior years, which were previously recorded as deferred tax recoveries. The crystallization of tax losses allowed the Company to largely offset cash taxes triggered by the sale of the Company's 80% interest in the U.S. multi-family portfolio, and hence Tricon recorded a $43.4 million current tax recovery from continuing operations.
| | | | | |
|
MANAGEMENT'S DISCUSSION AND ANALYSIS
FOR THE YEAR ENDED DECEMBER 31, 2021 |
Net income (loss) from discontinued operations
| | | | | | | | | | | | | | | | | | | | | | | |
| For the periods ended December 31 | Three months | | Twelve months |
| (in thousands of U.S. dollars) | 2021 | 2020 | Variance | | 2021 | 2020 | Variance |
| | | | | | | |
| | | | | | | |
| | | | | | | |
| Net operating income from multi-family rental properties | $ | — | | $ | 16,233 | | $ | (16,233) | | | $ | 16,224 | | $ | 65,438 | | $ | (49,214) | |
| | | | | | | |
| Interest expense | — | | (8,077) | | 8,077 | | | (7,845) | | (33,464) | | 25,619 | |
| Other expenses | — | | (1,546) | | 1,546 | | | (1,176) | | (7,067) | | 5,891 | |
| Goodwill derecognition | — | | — | | — | | | (79,112) | | — | | (79,112) | |
| Transaction costs | — | | — | | — | | | (3,285) | | — | | (3,285) | |
| Marked to market adjustment on rental properties | — | | — | | — | | | (2,030) | | (22,535) | | 20,505 | |
| | | | | | | |
| Income (loss) before income taxes from discontinued operations | $ | — | | $ | 6,610 | | $ | (6,610) | | | $ | (77,224) | | $ | 2,372 | | $ | (79,596) | |
Current income tax recovery (expense)(1) | — | | 5 | | (5) | | | (46,502) | | 5 | | (46,507) | |
| Deferred income tax (expense) recovery | — | | (945) | | 945 | | | 56,164 | | 1,399 | | 54,765 | |
| Net income (loss) from discontinued operations | $ | — | | $ | 5,670 | | $ | (5,670) | | | $ | (67,562) | | $ | 3,776 | | $ | (71,338) | |
(1) The sale gave rise to current income tax expense since the transaction value exceeded the tax cost basis and resulted in a taxable gain.
On March 31, 2021, the Company completed its previously announced joint venture arrangement with two institutional investors. Under the arrangement, the two third-party investors acquired a combined 80% interest in the existing U.S. multi-family rental portfolio with Tricon retaining a 20% interest in the joint venture. The sale reflected a total portfolio value of $1.331 billion including in-place debt, which was in line with the portfolio’s fair value reflected on Tricon’s balance sheet as of December 31, 2020. Tricon recognized its remaining 20% interest at fair value on the transaction date and proceeded to account for it as an equity-accounted investment. The business’ current- and prior-period results were reclassified as discontinued operations separate from the Company's continuing operations.
The transaction resulted in a derecognition of goodwill that was previously recognized by the Company when Tricon transitioned to a rental housing company effective January 1, 2020. Goodwill of $79.1 million arose from the initial recognition of deferred tax liabilities based on the difference in the tax bases and the fair values of the net assets deemed to have been acquired on the transition day. The Company’s disposition of an 80% interest in the business constituted a loss of control from an accounting perspective, and therefore, the entire balance sheet of the U.S. multi-family rental business and the associated goodwill on the corporate balance sheet were deconsolidated. This deconsolidation loss was partially offset by a $9.7 million favorable tax impact, including (i) a $56.2 million tax recovery achieved through the reversal of the deferred tax liability associated with the portfolio, and (ii) a $46.5 million current tax expense arising from the sale. The current tax expense was then applied against the $44.5 million current tax recovery from continuing operations, resulting in only $2.0 million of current tax payable.
The sale resulted in cash consideration of $431.6 million, which Tricon used in part to repay $295.2 million of debt (including $107.6 million of its U.S. multi-family credit facility, $112.6 million of single-family rental property-level debt and $75.0 million of the corporate credit facility). The Company used the remaining proceeds from the sale to fund growth in the single-family rental portfolio and for general corporate purposes. The joint venture also gives Tricon the opportunity to earn incremental property management, asset management and performance fees from managing the associated third-party capital.
| | | | | |
|
MANAGEMENT'S DISCUSSION AND ANALYSIS
FOR THE YEAR ENDED DECEMBER 31, 2021 |
3.2 Review of selected balance sheet items
| | | | | | | | | | | | | | |
| | | | | | | | |
As at
(in thousands of U.S. dollars) | December 31, 2021 | December 31, 2020 | | | | | | |
| | | | | | | | |
| Assets | | | | | | | | |
| Non-current assets | | | | | | | | |
| Rental properties | $ | 7,978,396 | | $ | 6,321,918 | | | | | | | |
| Equity-accounted investments in multi-family rental properties | 199,285 | | 19,913 | | | | | | | |
| Equity-accounted investments in Canadian residential developments | 98,675 | | 74,955 | | | | | | | |
| Canadian development properties | 133,250 | | 110,018 | | | | | | | |
| Investments in U.S. residential developments | 143,153 | | 164,842 | | | | | | | |
| Restricted cash | 123,329 | | 116,302 | | | | | | | |
| Goodwill | 29,726 | | 108,838 | | | | | | | |
| Deferred income tax assets | 96,945 | | 102,444 | | | | | | | |
| Intangible assets | 9,324 | | 12,363 | | | | | | | |
| Other assets | 84,749 | | 47,990 | | | | | | | |
| Derivative financial instruments | 363 | | 841 | | | | | | | |
| Total non-current assets | 8,897,195 | | 7,080,424 | | | | | | | |
| | | | | | | | |
| Current assets | | | | | | | | |
| Cash | 176,894 | | 55,158 | | | | | | | |
| Amounts receivable | 41,582 | | 25,593 | | | | | | | |
| Prepaid expenses and deposits | 32,946 | | 13,659 | | | | | | | |
| Total current assets | 251,422 | | 94,410 | | | | | | | |
| Total assets | $ | 9,148,617 | | $ | 7,174,834 | | | | | | | |
| | | | | | | | |
| Liabilities | | | | | | | | |
| Non-current liabilities | | | | | | | | |
| Long-term debt | $ | 3,662,628 | | $ | 3,863,316 | | | | | | | |
| Convertible debentures | — | | 165,956 | | | | | | | |
| Due to Affiliate | 256,362 | | 251,647 | | | | | | | |
| Derivative financial instruments | 230,305 | | 45,494 | | | | | | | |
| Deferred income tax liabilities | 461,689 | | 298,071 | | | | | | | |
| Limited partners' interests in single-family rental business | 947,452 | | 356,305 | | | | | | | |
| Long-term incentive plan | 21,431 | | 11,688 | | | | | | | |
| Performance fees liability | 48,358 | | 6,242 | | | | | | | |
| Other liabilities | 28,958 | | 4,599 | | | | | | | |
| Total non-current liabilities | 5,657,183 | | 5,003,318 | | | | | | | |
| | | | | | | | |
| Current liabilities | | | | | | | | |
| Amounts payable and accrued liabilities | 102,954 | | 98,290 | | | | | | | |
| Resident security deposits | 56,785 | | 45,157 | | | | | | | |
| Dividends payable | 15,821 | | 10,641 | | | | | | | |
| Current portion of long-term debt | 254,805 | | 274,190 | | | | | | | |
| Total current liabilities | 430,365 | | 428,278 | | | | | | | |
| Total liabilities | 6,087,548 | | 5,431,596 | | | | | | | |
| | | | | | | | |
| Equity | | | | | | | | |
| Share capital | 2,114,783 | | 1,192,963 | | | | | | | |
| Contributed surplus | 22,790 | | 19,738 | | | | | | | |
| Cumulative translation adjustment | 22,842 | | 23,395 | | | | | | | |
| Retained earnings | 893,379 | | 499,000 | | | | | | | |
| Total shareholders' equity | 3,053,794 | | 1,735,096 | | | | | | | |
| Non-controlling interest | 7,275 | | 8,142 | | | | | | | |
| Total equity | 3,061,069 | | 1,743,238 | | | | | | | |
| Total liabilities and equity | $ | 9,148,617 | | $ | 7,174,834 | | | | | | | |
| | | | | |
|
MANAGEMENT'S DISCUSSION AND ANALYSIS
FOR THE YEAR ENDED DECEMBER 31, 2021 |
Rental properties
The table below presents the changes in the fair value of rental properties by business segment for the years ended December 31, 2021 and 2020.
| | | | | | | | | | | | |
| December 31, 2021 |
| (in thousands of U.S. dollars) | Single-Family Rental | Multi-Family Rental | | Total |
| | | | |
| Opening balance | $ | 4,990,542 | | $ | 1,331,376 | | | $ | 6,321,918 | |
| Acquisitions | 1,835,235 | | — | | | 1,835,235 | |
| Capital expenditures | 196,572 | | 2,030 | | | 198,602 | |
| Fair value adjustments | 990,575 | | — | | | 990,575 | |
| Dispositions | (34,528) | | (1,333,406) | | | (1,367,934) | |
| Balance, end of year | $ | 7,978,396 | | $ | — | | | $ | 7,978,396 | |
| | | | |
| | | | |
| December 31, 2020 |
| (in thousands of U.S. dollars) | Single-Family Rental | Multi-Family Rental | | Total |
| | | | |
| Opening balance | $ | 4,337,681 | | $ | 1,344,844 | | | $ | 5,682,525 | |
| Acquisitions | 356,514 | | — | | | 356,514 | |
| Capital expenditures | 93,568 | | 9,067 | | | 102,635 | |
| Fair value adjustments | 220,849 | | (22,535) | | | 198,314 | |
| Dispositions | (18,070) | | — | | | (18,070) | |
| Balance, end of year | $ | 4,990,542 | | $ | 1,331,376 | | | $ | 6,321,918 | |
Rental properties increased by $1.7 billion to $8.0 billion as at December 31, 2021, from $6.3 billion as at December 31, 2020. The increase was driven by:
•Acquisitions of 6,574 single-family rental homes for $1.8 billion, partially offset by the disposition of 173 properties with an aggregate carrying value of $34.5 million.
•Capital expenditures of $198.6 million of which $134.4 million was attributable to the renovation of newly-acquired single-family homes, and the remainder to the maintenance and improvement of homes across the existing single-family rental portfolio.
•Fair value gain of $990.6 million on the single-family rental portfolio driven by very strong demand for single-family homes, as previously discussed, combined with relatively limited supply in the Company’s Sun Belt markets that contributed to significant home price appreciation.
•A partially offsetting decrease from the disposition of an 80% interest in the U.S. multi-family portfolio on March 31, 2021, which resulted in the deconsolidation of $1.3 billion of rental properties. The Company's remaining 20% interest in the U.S. multi-family rental joint venture is equity-accounted effective March 31, 2021.
Equity-accounted investments in multi-family rental properties
Equity-accounted investments in multi-family rental properties include Tricon's 20% interest in the U.S. multi-family rental joint venture formed on March 31, 2021 along with its 15% investment in 592 Sherbourne LP, which owns The Selby. The table below presents the change in equity-accounted investments in multi-family rental properties for the years ended December 31, 2021 and 2020.
| | | | | |
|
MANAGEMENT'S DISCUSSION AND ANALYSIS
FOR THE YEAR ENDED DECEMBER 31, 2021 |
| | | | | | | | |
| (in thousands of U.S. dollars) | December 31, 2021 | December 31, 2020 |
| | |
Opening balance (1) | $ | 19,913 | | $ | 19,733 | |
| Initial recognition of equity-accounted investment in U.S. multi-family rental properties | 107,895 | | — | |
| Advances | 453 | | — | |
| Distributions | (4,428) | | (935) | |
| Income from equity-accounted investments in multi-family rental properties | 75,333 | | 746 | |
| Translation adjustment | 119 | | 369 | |
| Balance, end of year | $ | 199,285 | | $ | 19,913 | |
(1) As at December 31, 2020, Tricon's equity-accounted investments in multi-family properties include The Selby only.
Equity-accounted investments in multi-family rental properties increased by $179.4 million to $199.3 million as at December 31, 2021 compared to $19.9 million as at December 31, 2020. The increase was primarily attributable to the initial recognition of Tricon's equity-accounted investment in the U.S. multi-family rental joint venture on March 31, 2021 as well as subsequent income from this portfolio driven by the fair value gains on selected properties as previously discussed, partially offset by distributions from the joint venture.
Equity-accounted investments in Canadian residential developments
The table below presents the change in equity-accounted investments in Canadian residential developments for the years ended December 31, 2021 and 2020.
| | | | | | | | | | | |
| (in thousands of U.S. dollars) | December 31, 2021 | | December 31, 2020 |
| | | |
| Opening balance | $ | 74,955 | | | $ | 55,408 | |
| | | |
| Advances | 30,089 | | | 4,294 | |
| Distributions | (14,772) | | | — | |
| Income from equity-accounted investments in Canadian residential developments | 8,200 | | | 13,378 | |
| Translation adjustment | 203 | | | 1,875 | |
| Balance, end of year | $ | 98,675 | | | $ | 74,955 | |
Equity-accounted investments in Canadian residential developments increased by $23.7 million to $98.7 million as at December 31, 2021 compared to $75.0 million as at December 31, 2020. The increase was primarily attributable to (i) advances of $30.1 million to fund the acquisition of Queen & Ontario (the first project under the Company's joint venture with the Canada Pension Plan Investment Board) and development activities across the portfolio, (ii) income of $8.2 million driven by fair value gains, and (iii) a favorable foreign exchange translation adjustment of $0.2 million. This increase was partially offset by distributions of $14.8 million received from the sale of the 7 Labatt development project during the fourth quarter of 2021.
Canadian development properties
The table below presents the change in Canadian development properties, which are comprised of The James (Scrivener Square) and The Shops of Summerhill, for the years ended December 31, 2021 and 2020.
| | | | | | | | | | | |
| (in thousands of U.S. dollars) | December 31, 2021 | | December 31, 2020 |
| | | |
| Opening balance | $ | 110,018 | | | $ | 35,625 | |
| Acquisitions | — | | | 65,861 | |
| Development expenditures | 12,748 | | | 2,998 | |
| | | |
| Fair value adjustments | 10,098 | | | — | |
| Translation adjustment | 386 | | | 5,534 | |
| Balance, end of year | $ | 133,250 | | | $ | 110,018 | |
Canadian development properties increased by $23.2 million to $133.3 million as at December 31, 2021 compared to $110.0 million as at December 31, 2020. The increase was driven by (i) a ramp-up of development activity at The
| | | | | |
|
MANAGEMENT'S DISCUSSION AND ANALYSIS
FOR THE YEAR ENDED DECEMBER 31, 2021 |
James as construction began at the start of 2021, resulting in $12.7 million of development expenditures, (ii) a fair value gain of $10.1 million owing to appreciation of land value, and (iii) a favorable foreign exchange translation adjustment of $0.4 million.
Investments in U.S. residential developments
The table below presents the change in investments in U.S. residential developments for the years ended December 31, 2021 and 2020.
| | | | | | | | |
| (in thousands of U.S. dollars) | December 31, 2021 | December 31, 2020 |
| | |
| Opening balance | $ | 164,842 | | $ | 300,653 | |
| Advances | 6,706 | | 3,408 | |
| Distributions | (55,744) | | (77,443) | |
Derecognition of investment in U.S. residential developments (1) | (4,377) | | — | |
| Income (loss) from investments in U.S. residential developments | 31,726 | | (61,776) | |
| Balance, end of year | $ | 143,153 | | $ | 164,842 | |
(1) In accordance with IFRS 10 and IAS 28.22, a certain investment in U.S. residential developments ceased to meet the definition of an associate during the fourth quarter of 2021 and became a consolidated subsidiary. This investment's total assets and total liabilities are now included in the Company's amounts receivable and amounts payable and accrued liabilities, respectively.
Investments in U.S. residential developments decreased by $21.6 million to $143.2 million as at December 31, 2021 compared to $164.8 million as at December 31, 2020. The decrease was mainly driven by distributions of $55.7 million from multiple projects in advanced stages of development. This decrease was partially offset by advances of $6.7 million, largely made to the Company's build-to-rent Investment Vehicle, and investment income of $31.7 million driven by favorable economic conditions and strong project performance.
Debt
The following table summarizes the consolidated net debt position of the Company.
| | | | | | | | | | | |
As at
(in thousands of U.S. dollars) | December 31, 2021 | December 31, 2020 | Variance |
| | | |
| Single-family rental properties borrowings | $ | 3,906,482 | | $ | 3,156,601 | | $ | 749,881 | |
| Multi-family rental properties borrowings | — | | 910,340 | | (910,340) | |
| Canadian development properties borrowings | 34,207 | | 60,037 | | (25,830) | |
| Corporate borrowings | 13,962 | | 37,089 | | (23,127) | |
| $ | 3,954,651 | | $ | 4,164,067 | | $ | (209,416) | |
| Transaction costs (net of amortization) | (36,123) | | (25,019) | | (11,104) | |
| Debt discount (net of amortization) | (1,095) | | (1,542) | | 447 | |
Total debt per balance sheet(1) | $ | 3,917,433 | | $ | 4,137,506 | | $ | (220,073) | |
| Cash and restricted cash | (300,223) | | (171,460) | | (128,763) | |
Net debt(2) | $ | 3,617,210 | | $ | 3,966,046 | | $ | (348,836) | |
(1) Excludes the 2022 convertible debentures and Due to Affiliate.
(2) Non-IFRS measure; see “Non-IFRS measures” on page 1 and Section 6.
Net debt decreased by $0.3 billion to $3.6 billion as at December 31, 2021, from $4.0 billion as at December 31, 2020. The variance was primarily attributable to:
•A reduction of $910.3 million in multi-family rental borrowings in connection with the Company’s sale of 80% of its interests in the U.S. multi-family rental business on March 31, 2021. This transaction resulted in the deconsolidation of $800.5 million of long-term debt and the full repayment of an associated $109.9 million credit facility with a portion of the proceeds from the sale.
•A decrease of $25.8 million in Canadian development properties borrowings primarily attributable to the full repayment of the vendor take-back loan relating to The James.
| | | | | |
|
MANAGEMENT'S DISCUSSION AND ANALYSIS
FOR THE YEAR ENDED DECEMBER 31, 2021 |
•A decrease of $23.1 million in corporate borrowings primarily attributable to the repayment of the outstanding corporate credit facility balance of $26.0 million, partially offset by an increase of $2.9 million from a new corporate office mortgage obtained during the year.
•An offsetting net increase of $749.9 million in single-family rental properties borrowings driven by additional indebtedness to finance the acquisition of new homes.
•An increase in cash and restricted cash of $128.8 million, which further reduced the net debt balance, driven by higher cash balances held in order to be acquisition-ready subsequent to year-end as well as more restricted cash reserved to pay for upcoming property expenses and renovation projects on the single-family rental properties.
The weighted average interest rate applicable to debt owed by the Company as at December 31, 2021 was 2.62%. The following table summarizes the debt structure and leverage position as at December 31, 2021:
| | | | | | | | | | | | | | | | | | |
| (in thousands of U.S. dollars) | | | | | | |
| Debt structure | Balance | % of total | | Weighted average interest rate | Weighted average time to maturity (years) | |
| Fixed | $ | 2,703,628 | | 68.4 | % | | 2.83 | % | 4.2 | |
| Floating | 1,251,023 | | 31.6 | % | | 2.16 | % | 2.3 | |
| Total/Weighted average | $ | 3,954,651 | | 100.0 | % | | 2.62 | % | 3.6 | |
| | | | | | |
| | | | | | |
| | | | | | |
| | | | | | |
| | | | | | |
| | | | | | |
During the fourth quarter, the Company repaid in full the 2017-1 securitization debt's outstanding balance of $455.3 million with a portion of the net proceeds received from its U.S. initial public offering and private placement of common shares, completed on October 12, 2021 (see Section 5.3). In addition, SFR JV-1 completed a new securitization transaction on November 9, 2021 with a total face value of $683.6 million, the proceeds of which were used to repay short-term debt. As a result of these transactions, Tricon extended the weighted average time to maturity of its debt to 3.6 years as at December 31, 2021, representing an increase of 0.6 years from the previous quarter, and reduced its weighted average interest rate by 0.24% to 2.62% compared to 2.86% in the prior quarter.
As at December 31, 2021, Tricon's near-term debt maturities primarily consist of a term loan of $220.2 million in connection with Tricon's single-family rental properties, and a land loan and a mortgage totaling $34.2 million related to the Company's Canadian residential developments. The Company intends to enter into an agreement to extend the term loan prior to its maturity in October 2022, and to refinance the land loan with a construction loan.
Tricon's debt maturities as at December 31, 2021 are presented below, assuming the exercise of all extension options.
| | | | | |
|
MANAGEMENT'S DISCUSSION AND ANALYSIS
FOR THE YEAR ENDED DECEMBER 31, 2021 |
* Reflects the maturity dates after all extensions have been exercised. The Company intends to exercise the extension options available on all loans.
Convertible debentures
The table below presents the outstanding balance of the Company's 5.75% extendible convertible unsecured subordinated debentures due March 31, 2022 (the "2022 convertible debentures") at December 31, 2021 and December 31, 2020.
| | | | | | | | | | | |
| (in thousands of U.S. dollars) | December 31, 2021 | | December 31, 2020 |
| | | |
| Principal amount outstanding | $ | — | | | $ | 172,400 | |
| Less: Transaction costs (net of amortization) | — | | | (2,249) | |
| Liability component on initial recognition | — | | | 170,151 | |
| Debentures discount (net of amortization) | — | | | (4,195) | |
| 2022 convertible debentures | $ | — | | | $ | 165,956 | |
On July 30, 2021, the Company gave notice to debenture holders of its intention to redeem in full all of the outstanding balance of the then-outstanding 2022 convertible debentures effective September 9, 2021, and elected to satisfy the redemption proceeds by the issuance of common shares. In total, during 2021, the Company issued 16,449,980 common shares in connection with the conversion or redemption of the aggregate principal amount outstanding of $172.4 million.
At the beginning of 2021, the debentures had an unamortized balance of $6.4 million in debentures discount and issuance costs, of which $2.9 million were amortized during the year ended December 31, 2021 and $3.5 million were recognized as a loss on debt extinguishment.
| | | | | |
|
MANAGEMENT'S DISCUSSION AND ANALYSIS
FOR THE YEAR ENDED DECEMBER 31, 2021 |
3.3 Subsequent events
Quarterly dividend
On March 1, 2022, the Board of Directors of the Company declared a dividend of $0.058 per common share in U.S. dollars payable on or after April 15, 2022 to shareholders of record on March 31, 2022.
| | | | | |
|
MANAGEMENT'S DISCUSSION AND ANALYSIS
FOR THE YEAR ENDED DECEMBER 31, 2021 |
4. Operating results of businesses
Management believes that information concerning the underlying activities within each of the Company’s operating businesses is useful for investors in understanding the Company’s overall performance, and this section presents key operating highlights for the quarter on a business-by-business basis. Management monitors the underlying activities within those businesses using non-IFRS measures and Key Performance Indicators ("KPIs"). A list of these measures and KPIs, together with a description of the information each measure reflects and the reasons why management believes the measure to be useful or relevant in evaluating the underlying performance of the Company’s businesses, is set out in Section 6. The supplemental measures presented herein are not recognized under IFRS and should not be construed as alternatives to net income determined in accordance with IFRS as indicators of Tricon’s financial performance. Tricon’s method of calculating these measures may differ from other issuers’ methods and, accordingly, these measures may not be comparable to similar measures presented by other publicly-traded entities.
The financial results and performance metrics in Section 4 and where indicated throughout this document reflect Tricon’s proportionate results, unless otherwise stated, as described in Section 6. Refer to “Non-IFRS measures” on page 1 and to Appendix A for IFRS reconciliations of financial information. The number of rental homes, properties or units quoted in Section 4 are presented in aggregate.
4.1 Single-Family Rental
Business update
The Company’s single-family rental business continued to benefit from various trends that have been accelerated by the COVID-19 pandemic, including favorable demographic shifts driving new household formation, as well as strong population and job growth in U.S. Sun Belt markets. Meanwhile, an imbalance persists between the demand for affordable single-family homes, both for homebuyers and renters, and the supply of new construction. This imbalance has contributed to rising home prices and higher down payments required for homebuyers, which in turn has made homeownership less attainable for some families and increased demand for rental homes. Tricon’s relatively affordable single-family rental homes provide a much-needed alternative for those seeking the benefits of a home without the added cost of ownership.
These dynamics contributed to the Company's strong operating performance during the quarter, including record-low same home resident turnover of 16.3%, same home occupancy of 97.6%, as well as healthy same home blended rent growth of 8.8% (comprised of 19.1% growth on new move-ins and 5.7% on renewals). The Company continues to self-govern and moderate rent growth for existing residents as part of its ESG policy and in an effort to encourage increased resident tenure.
As the economy has recovered, pandemic-related supply chain bottlenecks and labor shortages have created inflationary cost pressures across the single-family rental industry. Tricon has experienced such inflationary pressures in its labor and materials costs, but has successfully mitigated their impact on net operating margin by growing its revenues and capturing operating efficiencies arising from a greater scale of operations.
ACQUISITIONS UPDATE
During the quarter, the Company expanded its portfolio through the organic acquisition of 2,016 homes at an average cost per home of $335,000, including closing costs and up-front renovations, for a total acquisition cost of $675 million, of which Tricon's proportionate share was approximately $203 million. The average acquisition cost per home of $335,000 increased 48% year-over-year (from $226,000 in Q4 2020) for three primary reasons: (i) the expansion of the acquisition program to more expensive markets, including Phoenix, Las Vegas, Austin and Nashville; (ii) the purchase of newer vintage homes which tend to have a higher cost; and (iii) significant year-over-year home price appreciation as discussed above. Tricon plans to purchase approximately 1,800 to 2,000 homes in the first quarter of 2022, continuing its strong acquisition pace while also reflecting the seasonality of listings and home sales which are lower in winter months (see “Forward-looking statements” on page 1). While home prices
| | | | | |
|
MANAGEMENT'S DISCUSSION AND ANALYSIS
FOR THE YEAR ENDED DECEMBER 31, 2021 |
have appreciated in Tricon’s acquisition markets, rents have also been increasing at a similar pace, allowing the Company to continue acquiring homes at attractive cap rates.
OPERATING RESULTS – PROPORTIONATE TOTAL PORTFOLIO
| | | | | | | | | | | | | | | | | | | | | | | |
| For the periods ended December 31 | Three months | | Twelve months |
| (in U.S. dollars) | 2021 | 2020 | Variance | | 2021 | 2020 | Variance |
| | | | | | | |
Operating metrics(1) | | | | | | | |
| Tricon wholly-owned rental homes | 15,156 | | 15,329 | | (173) | | | 15,156 | | 15,329 | | (173) | |
| SFR JV homes | 13,993 | | 7,437 | | 6,556 | | | 13,993 | | 7,437 | | 6,556 | |
| Rental homes | 29,149 | | 22,766 | | 6,383 | | | 29,149 | | 22,766 | | 6,383 | |
| | | | | | | |
| Occupancy | 94.0 | % | 96.4 | % | (2.4 | %) | | 94.0 | % | 96.6 | % | (2.6 | %) |
| | | | | | | |
| | | | | | | |
| Average monthly rent | $ | 1,591 | | $ | 1,464 | | $ | 127 | | | $ | 1,529 | | $ | 1,442 | | $ | 87 | |
| | | | | | | |
| | | | | | | |
| | | | | | | |
| | | | | | | |
(1) The operating metrics reflect Tricon's proportionate share of the total portfolio, other than the number of rental homes which is presented in aggregate. The occupancy and average monthly rent are KPIs and are defined in Section 6.
| | | | | | | | | | | | | | | | | | | | | | | | | | | | | | | | | | | |
| For the periods ended December 31 | Three months | | Twelve months | | |
| (in thousands of U.S. dollars) | 2021 | 2020(1) | Variance | % Variance | | 2021 | 2020(1) | Variance | % Variance | | | | | | |
| | | | | | | | | | | | | | | |
Rental revenue(2) | $ | 84,470 | | $ | 72,886 | | $ | 11,584 | | 15.9 | % | | $ | 319,442 | $ | 287,217 | $ | 32,225 | | 11.2 | % | | | | | | |
Other revenue(2) | 3,822 | | 2,368 | | 1,454 | | 61.4 | % | | 12,169 | 9,723 | 2,446 | | 25.2 | % | | | | | | |
| Total revenue from rental properties | 88,292 | | 75,254 | | 13,038 | | 17.3 | % | | 331,611 | 296,940 | 34,671 | | 11.7 | % | | | | | | |
| | | | | | | | | | | | | | | |
| Property taxes | 13,096 | | 11,415 | | 1,681 | | 14.7 | % | | 50,477 | 45,768 | 4,709 | | 10.3 | % | | | | | | |
| Repairs and maintenance | 4,794 | | 4,058 | | 736 | | 18.1 | % | | 18,025 | 15,360 | 2,665 | | 17.4 | % | | | | | | |
| Turnover | 991 | | 986 | | 5 | | 0.5 | % | | 3,790 | 5,195 | (1,405) | | (27.0 | %) | | | | | | |
| Property management expenses | 5,809 | | 5,031 | | 778 | | 15.5 | % | | 21,848 | 19,876 | 1,972 | | 9.9 | % | | | | | | |
| Property insurance | 1,284 | | 1,083 | | 201 | | 18.6 | % | | 4,905 | 4,266 | 639 | | 15.0 | % | | | | | | |
| Marketing and leasing | 260 | | 303 | | (43) | | (14.2 | %) | | 996 | 1,110 | (114) | | (10.3 | %) | | | | | | |
| Homeowners' association (HOA) costs | 1,203 | | 976 | | 227 | | 23.3 | % | | 4,592 | 3,858 | 734 | | 19.0 | % | | | | | | |
| Other direct expenses | 1,501 | | 926 | | 575 | | 62.1 | % | | 5,323 | 3,979 | 1,344 | | 33.8 | % | | | | | | |
| Total direct operating expenses | 28,938 | | 24,778 | | 4,160 | | 16.8 | % | | 109,956 | 99,412 | 10,544 | | 10.6 | % | | | | | | |
| | | | | | | | | | | | | | | |
Net operating income (NOI)(3) | $ | 59,354 | | $ | 50,476 | | $ | 8,878 | | 17.6 | % | | $ | 221,655 | $ | 197,528 | $ | 24,127 | | 12.2 | % | | | | | | |
Net operating income (NOI) margin(3) | 67.2 | % | 67.1 | % | | | | 66.8% | 66.5% | | | | | | | | |
(1) The Company elected to replace its property management expense with directly incurred property-level compensation costs effective January 1, 2021. The property management expense above represents property-level operations personnel costs. Marketing and leasing expenses that were previously included in the property management expense have now been reclassified as a separate line item. The comparative period has been reclassified to conform with the current period presentation, and there was no impact on NOI or NOI margin as a result of this change in presentation.
(2) All rental and other revenue are reflected net of bad debt. The Company has reserved 100% of residents’ accounts receivable balances aged more than 30 days.
(3) Non-IFRS measures; see “Non-IFRS measures” on page 1, Section 6 and Appendix A.
| | | | | |
|
MANAGEMENT'S DISCUSSION AND ANALYSIS
FOR THE YEAR ENDED DECEMBER 31, 2021 |
Total portfolio NOI increased by $8.9 million or 17.6% to $59.4 million in the fourth quarter of 2021 compared to $50.5 million in the fourth quarter of 2020, as revenue expansion outpaced expense growth.
Rental revenue during the quarter increased by $11.6 million or 15.9% as a result of higher average monthly rent ($1,591 in Q4 2021 vs. $1,464 in Q4 2020) and a larger rental portfolio (Tricon’s proportionate share of rental homes was 19,707 in Q4 2021 compared to 17,698 in Q4 2020), partially offset by a 2.4% decrease in occupancy owing to the accelerated acquisition of vacant homes. Other revenue also increased by $1.5 million or 61.4 %, driven by portfolio expansion, incremental ancillary revenue earned on services provided to residents, such as smart-home technology-enabled homes and renters insurance, and the resumption of late fee charges that were partially waived in the fourth quarter of 2020.
Direct operating expenses in the quarter increased by $4.2 million or 16.8% driven by higher costs incurred on a larger portfolio of homes, including higher material and labor costs associated with supply chain delays and a tighter labor market, respectively. This increase was partially offset by savings on marketing and leasing expenses. The turnover expense remained stable despite a larger portfolio as a result of a meaningful reduction in turnover and higher resident chargebacks.
OPERATING RESULTS – PROPORTIONATE SAME HOME PORTFOLIO
The same home portfolio includes homes that have been stabilized since September 30, 2019 as per the NAREIT guidelines (see Section 6).
For the same home portfolio, blended rent growth for the quarter was 8.8% (including 19.1% on new leases and 5.7% on renewals), accompanied by a 0.3% increase in occupancy to 97.6% from 97.3% recorded in the same period in 2020. Management expects that a favorable supply-demand imbalance coupled with embedded portfolio loss-to-lease (estimated by management to be at least 15% to 20% of current rents) will continue to drive robust rent growth into 2022 (see “Forward-looking statements” on page 1). The Company’s continued focus on resident retention helped it achieve a record-low annualized turnover rate of 16.3% on the same home portfolio, a 6.3% decrease compared to 22.6% in the fourth quarter of 2020. These KPIs are defined in Section 6.
| | | | | | | | | | | | | | | | | | | | | | | |
| For the periods ended December 31 | Three months | | Twelve months |
| (in U.S. dollars) | 2021 | 2020 | Variance | | 2021 | 2020 | Variance |
| | | | | | | |
Operating metrics - same home(1) | | | | | | | |
| Tricon wholly-owned rental homes | 14,734 | | 14,734 | | — | | | 14,734 | | 14,734 | | — | |
| SFR JV homes | 3,373 | | 3,373 | | — | | | 3,373 | | 3,373 | | — | |
| Rental homes | 18,107 | | 18,107 | | — | | | 18,107 | | 18,107 | | — | |
| | | | | | | |
Occupancy(2) | 97.6 | % | 97.3 | % | 0.3 | % | | 97.6 | % | 97.2 | % | 0.4 | % |
| Annualized turnover rate | 16.3 | % | 22.6 | % | (6.3 | %) | | 19.7 | % | 23.3 | % | (3.6 | %) |
| | | | | | | |
| Average monthly rent | $ | 1,562 | | $ | 1,464 | | $ | 98 | | | $ | 1,522 | | $ | 1,440 | | $ | 82 | |
| | | | | | | |
Average rent growth - renewal(2) | 5.7 | % | 3.0 | % | 2.7 | % | | 4.9 | % | 3.4 | % | 1.5 | % |
Average rent growth - new move-in(2) | 19.1 | % | 11.2 | % | 7.9 | % | | 17.1 | % | 9.6 | % | 7.5 | % |
Average rent growth - blended(2) | 8.8 | % | 5.5 | % | 3.3 | % | | 8.2 | % | 5.2 | % | 3.0 | % |
(1) The operating metrics reflect Tricon's proportionate share of the same home portfolio, other than the total number of homes comprising the same home portfolio which is presented in aggregate.
(2) Rent growth on a proportionate same home portfolio of 20,665 rental homes was 8.3% in January 2022, including 19.1% growth on new leases and 6.3% growth on renewals, while the same home occupancy increased to 97.9%.
| | | | | |
|
MANAGEMENT'S DISCUSSION AND ANALYSIS
FOR THE YEAR ENDED DECEMBER 31, 2021 |
| | | | | | | | | | | | | | | | | | | | | | | | | | | | | | | | |
| For the three months ended December 31 | | | | | | |
| (in thousands of U.S. dollars) | 2021 | % of revenue | 2020 | % of revenue | Variance | % Variance | | | | | | | | | | | | |
| | | | | | | | | | | | | | | | | | |
Rental revenue(1) | $ | 71,097 | | $ | 65,917 | | $ | 5,180 | | 7.9 | % | | | | | | | | | | | | |
Other revenue(1) | 2,987 | | 2,099 | | 888 | | 42.3 | % | | | | | | | | | | | | |
| Total revenue from rental properties | $ | 74,084 | 100.0 | % | $ | 68,016 | 100.0 | % | $ | 6,068 | | 8.9 | % | | | | | | | | | | | | |
| | | | | | | | | | | | | | | | | | |
| | | | | | | | | | | | | | | | | | |
| Property taxes | 11,061 | 14.9 | % | 10,472 | 15.4 | % | 589 | | 5.6 | % | | | | | | | | | | | | |
| Repairs and maintenance | 4,239 | 5.7 | % | 3,740 | 5.5 | % | 499 | | 13.3 | % | | | | | | | | | | | | |
| Turnover | 917 | 1.2 | % | 912 | 1.3 | % | 5 | | 0.5 | % | | | | | | | | | | | | |
| Property management expenses | 3,981 | 5.4 | % | 4,210 | 6.2 | % | (229) | | (5.4 | %) | | | | | | | | | | | | |
| Property insurance | 1,117 | 1.5 | % | 1,008 | 1.5 | % | 109 | | 10.8 | % | | | | | | | | | | | | |
| Marketing and leasing | 117 | 0.2 | % | 254 | 0.4 | % | (137) | | (53.9 | %) | | | | | | | | | | | | |
| Homeowners' association (HOA) costs | 924 | 1.2 | % | 818 | 1.2 | % | 106 | | 13.0 | % | | | | | | | | | | | | |
| Other direct expenses | 1,126 | 1.5 | % | 721 | 1.1 | % | 405 | | 56.2 | % | | | | | | | | | | | | |
| Total direct operating expenses | 23,482 | | 22,135 | | 1,347 | | 6.1 | % | | | | | | | | | | | | |
| | | | | | | | | | | | | | | | | | |
| | | | | | | | | | | | | | | | | | |
Net operating income (NOI)(2) | $ | 50,602 | | $ | 45,881 | | $ | 4,721 | | 10.3 | % | | | | | | | | | | | | |
| | | | | | | | | | | | | | | | | | |
Net operating income (NOI) margin(2) | 68.3% | | 67.5% | | | | | | | | | | | | | | | |
(1) All rental and other revenue are reflected net of bad debt. The Company has reserved 100% of residents’ accounts receivable balances aged more than 30 days. The bad debt expense during the quarter represented 1.9% of revenue compared to 2.7% in the same period in the prior year.
(2) Non-IFRS measures; see “Non-IFRS measures” on page 1, Section 6 and Appendix A..
| | | | | | | | | | | | | | | | | | | | |
| For the twelve months ended December 31 | | |
| (in thousands of U.S. dollars) | 2021 | % of revenue | 2020 | % of revenue | Variance | % Variance |
| | | | | | |
Rental revenue(1) | $ | 276,900 | | | $ | 262,094 | | | $ | 14,806 | | 5.6 | % |
Other revenue(1) | 9,773 | | | 8,595 | | | 1,178 | | 13.7 | % |
| Total revenue from rental properties | $ | 286,673 | | 100.0 | % | $ | 270,689 | | 100.0 | % | $ | 15,984 | | 5.9 | % |
| | | | | | |
| | | | | | |
| Property taxes | 44,194 | | 15.4 | % | 42,232 | | 15.6 | % | 1,962 | | 4.6 | % |
| Repairs and maintenance | 16,253 | | 5.7 | % | 14,166 | | 5.2 | % | 2,087 | | 14.7 | % |
| Turnover | 3,428 | | 1.2 | % | 4,938 | | 1.8 | % | (1,510) | | (30.6 | %) |
| Property management expenses | 15,923 | | 5.6 | % | 16,838 | | 6.2 | % | (915) | | (5.4 | %) |
| Property insurance | 4,380 | | 1.5 | % | 3,989 | | 1.5 | % | 391 | | 9.8 | % |
| Marketing and leasing | 618 | | 0.2 | % | 948 | | 0.4 | % | (330) | | (34.8 | %) |
| Homeowners' association (HOA) costs | 3,664 | | 1.3 | % | 3,266 | | 1.2 | % | 398 | | 12.2 | % |
| Other direct expenses | 3,921 | | 1.4 | % | 3,136 | | 1.2 | % | 785 | | 25.0 | % |
| Total direct operating expenses | 92,381 | | | 89,513 | | | 2,868 | | 3.2 | % |
| | | | | | |
| | | | | | |
Net operating income (NOI)(2) | $ | 194,292 | | | $ | 181,176 | | | $ | 13,116 | | 7.2 | % |
| | | | | | |
Net operating income (NOI) margin(2) | 67.8 | % | | 66.9 | % | | | |
(1) All rental and other revenue are reflected net of bad debt. The Company has reserved 100% of residents’ accounts receivable balances aged more than 30 days.
(2) Non-IFRS measures; see “Non-IFRS measures” on page 1, Section 6 and Appendix A.
| | | | | |
|
MANAGEMENT'S DISCUSSION AND ANALYSIS
FOR THE YEAR ENDED DECEMBER 31, 2021 |
Total revenue for the same home portfolio increased by $6.1 million or 8.9% to $74.1 million in the fourth quarter of 2021 compared to $68.0 million for the same period in the prior year. This favorable change was primarily attributable to the following:
•Rental revenue – Rental revenue was $71.1 million compared to $65.9 million in the comparative period, representing an increase of 7.9%. This favorable variance was primarily driven by a higher average monthly rent per occupied home of 6.7% ($1,562 in Q4 2021 compared to $1,464 in Q4 2020), a 0.3% increase in occupancy from 97.3% to 97.6%, and lower bad debt expense as collection rates improved. Since the onset of the COVID-19 pandemic, bad debt increased to a peak of 2.8% of revenues in the fourth quarter of 2020 but has since decreased to 1.9% in the current period with the benefit of $3.6 million in government rental assistance collected by or on behalf of our residents during the quarter and an improved economy.
•Other revenue – Other revenue was $3.0 million compared to $2.1 million in the fourth quarter of 2020, an increase of 42.3%. This growth was partly driven by incremental ancillary fees from the Company’s smart-home technology initiative along with higher resident enrollment in its renters insurance program. Tricon continues to roll-out its smart-home package into newly acquired and turned homes, offering residents convenient keyless access, smart thermostats, and a suite of in-home sensors (approximately 38% of same home properties were smart-home enabled in the current quarter compared to 21% in the same period in the prior year). The Company also resumed the collection of late fees in 2021 in all markets where permissible whereas it had partially waived these fees in the comparative period.
Same home operating expenses increased by $1.3 million or 6.1% to $23.5 million in the fourth quarter of 2021 from $22.1 million during the same period in 2020. The variance is largely attributable to the following:
•Property taxes – Property taxes were $11.1 million compared to $10.5 million in the comparative period, an increase of 5.6% as a result of higher assessed property values corresponding to home price appreciation. The robust demand for single-family homes in the U.S. Sun Belt coupled with constrained housing supply are expected to continue to inflate assessed property values and property tax expenses as a result. Tricon works with a property tax consultant to monitor tax assessments and appeal them where appropriate.
•Repairs and maintenance – Repairs and maintenance expenses were $4.2 million compared to $3.7 million in the comparative period, an increase of 13.3%. The variance in repairs and maintenance was driven by higher labor costs associated with a tighter employment market, as well as higher material costs linked to supply chain delays causing longer lead times, diminished vendor inventory levels and inflationary cost pressure.
•Property management expenses – Property management expenses were $4.0 million compared to $4.2 million in the comparative period, a decrease of 5.4%. The variance was driven by efficiencies realized within the property management function as the Company scaled to manage 29,149 homes in the current quarter compared to 22,766 in the same period in the prior year, resulting in a lower property management cost per home.
•Other direct expenses – Other direct expenses were $1.1 million compared to $0.7 million in the comparative period, an increase of $0.4 million or 56.2%, driven by the additional costs of providing smart-home technology and renters insurance to more residents, as discussed above.
As revenue growth outpaced expense growth, NOI increased by 10.3% to $50.6 million in the fourth quarter of 2021 compared to $45.9 million in the fourth quarter of 2020. In addition, the same home NOI margin increased to a record 68.3% in the fourth quarter of 2021 compared to 67.5% in the same period in the prior year.
| | | | | |
|
MANAGEMENT'S DISCUSSION AND ANALYSIS
FOR THE YEAR ENDED DECEMBER 31, 2021 |
4.2 Adjacent residential businesses
4.2.1 Multi-Family Rental
Tricon's multi-family rental business segment consists of 24 assets, including 23 predominantly garden-style apartments in the U.S. Sun Belt and one Class A high-rise property in downtown Toronto (note that eight other properties in downtown Toronto are currently under development and are discussed in Section 4.2.2).
U.S. multi-family rental
Syndication of the U.S. multi-family rental portfolio
On March 31, 2021, the Company entered into a joint venture arrangement with two institutional investors, with Tricon retaining a 20% interest in the existing U.S. multi-family rental portfolio and the investors acquiring a combined 80% interest. Following the syndication, effective April 1, 2021, the Company began reporting only on its 20% proportionate share of the U.S. multi-family rental operating results and, as a result, comparative results have been recast, where appropriate.
Operating results overview
The Company's U.S. multi-family rental business delivered strong operational performance in the fourth quarter of 2021 supported by continued population and job growth in the U.S. Sun Belt, an ongoing economic recovery, as well as effective asset management and marketing efforts. Specifically, the portfolio achieved occupancy of 96.6%, blended rent growth of 13.5% and record-low turnover of 37.6%.
For the three months ended December 31, 2021, NOI increased by $0.7 million or 20.6% year-over-year to $3.9 million, attributable primarily to a $0.7 million or 13.0% increase in revenue buoyed by strong leasing demand and rent growth. This favorable revenue variance was explained by (i) a 3.0% year-over-year increase in average physical occupancy from 93.6% to 96.6%, (ii) a 7.1% year-over-year increase in average monthly rent per occupied unit ($1,303 in Q4 2021 vs. 1,217 in Q4 2020) and (iii) a $0.1 million decrease in concessions associated with improved leasing demand. Direct operating expenses remained stable at $2.3 million; while there were higher property management costs incurred from a competitive labor market and rising material prices, they were fully offset by recoveries from successful property tax appeals in the fourth quarter of 2021.
| | | | | | | | | | | | | | | | | | | | | | | |
| For the periods ended December 31 | Three months | | Twelve months |
| (in thousands of U.S. dollars, except average monthly rent which is in U.S. dollars) | 2021 | 2020(1) | Variance | | 2021 | 2020(1) | Variance |
| | | | | | | |
| Number of properties | 23 | 23 | — | | 23 | 23 | — |
| Number of units | 7,289 | 7,289 | — | | 7,289 | 7,289 | — |
| | | | | | | |
| Occupancy | 96.6% | 93.6% | 3.0% | | 95.9% | 93.6% | 2.3% |
| Annualized turnover rate | 37.6% | 46.5% | (8.9%) | | 44.5% | 50.6% | (6.1%) |
| | | | | | | |
| Average monthly rent | $ | 1,303 | $ | 1,217 | $ | 86 | | $ | 1,252 | $ | 1,232 | $ | 20 |
| | | | | | | |
| Average rent growth - renewal | 10.7% | 2.3% | 8.4% | | 10.5% | 4.7% | 5.8% |
| Average rent growth - new move-in | 17.6% | (5.6%) | 23.2% | | 16.8% | (1.6%) | 18.4% |
| Average rent growth - blended | 13.5% | (1.8%) | 15.3% | | 12.9% | 1.6% | 11.3% |
| | | | | | | |
| Total revenue from rental properties | $ | 6,235 | $ | 5,516 | $ | 719 | | $ | 23,878 | $ | 22,265 | $ | 1,613 |
Total direct operating expenses(2) | 2,319 | 2,268 | 51 | | 9,612 | 9,178 | 434 |
| | | | | | | |
Net operating income (NOI)(2),(3) | $ | 3,916 | $ | 3,248 | $ | 668 | | $ | 14,266 | $ | 13,087 | $ | 1,179 |
Net operating income (NOI) margin(2),(3) | 62.8% | 58.9% | | | 59.7% | 58.8% | |
Note: Given that the unit count did not change from 2020 to 2021, this is also the "Same Property" portfolio.
(1) Results prior to the syndication of the U.S. multi-family portfolio have been recast to reflect Tricon's current 20% ownership in the portfolio to assist the reader with comparability.
| | | | | |
|
MANAGEMENT'S DISCUSSION AND ANALYSIS
FOR THE YEAR ENDED DECEMBER 31, 2021 |
(2) The Company elected to present its expenses related to indirect property management overhead activities as part of the corporate operating expenses effective January 1, 2021. The property management expenses above represent on-site property management personnel costs. Comparative periods have therefore been reclassified to conform with the current presentation.
(3) Non-IFRS measures; see “Non-IFRS measures” on page 1, Section 6 and Appendix A.
Canadian multi-family rental - The Selby
In the fourth quarter of 2021, The Selby's operating performance benefited from the stabilization of overall rental market conditions in downtown Toronto coupled with successful execution of targeted marketing and resident retention activities. The property achieved occupancy of 97.8% (a 10.8% year-over-year increase) as well as 5.6% blended rent growth, returning to positive levels for the first time since the onset of the pandemic as the need for rental concessions abated.
| | | | | | | | | | | | | | | | | | | | | | | |
| For the periods ended December 31 | Three months | | Twelve months |
| (in thousands of Canadian dollars, except average monthly rent which is in Canadian dollars, unless otherwise indicated) | 2021 | 2020 | Variance | | 2021 | 2020 | Variance |
| | | | | | | |
| Number of properties | 1 | 1 | — | | 1 | 1 | — |
| Number of units | 500 | 500 | — | | 500 | 500 | — |
| | | | | | | |
| Occupancy | 97.8% | 87.0% | 10.8% | | 90.6% | 87.0% | 3.6% |
| Annualized turnover rate | 30.4% | 41.6% | (11.2%) | | 34.0% | 33.8% | 0.2% |
| | | | | | | |
Average monthly rent(1) | $ | 2,405 | $ | 2,648 | $ | (243) | | $ | 2,482 | $ | 2,663 | $ | (181) |
| | | | | | | |
| Average rent growth - renewal | 4.6% | 1.3% | 3.3% | | (3.3%) | 0.1% | (3.4%) |
| Average rent growth - new move-in | 7.4% | (11.3%) | 18.7% | | (15.7%) | (6.3%) | (9.4%) |
| Average rent growth - blended | 5.6% | (5.1%) | 10.7% | | (10.0%) | (2.2%) | (7.8%) |
| | | | | | | |
| Total revenue from rental properties | $ | 553 | $ | 516 | $ | 37 | | $ | 2,015 | $ | 2,118 | $ | (103) |
| Total direct operating expenses | 224 | 229 | (5) | | 905 | 876 | 29 |
| | | | | | | |
Net operating income (NOI)(2), (3) | $ | 329 | $ | 287 | $ | 42 | | $ | 1,110 | $ | 1,242 | $ | (132) |
Net operating income (NOI) margin(2), (3) | 59.5% | 55.6% | | | 55.1% | 58.6% | |
Net operating income (NOI)(2), (3) | US$ | 261 | US$ | 220 | US$ | 41 | | US$ | 885 | US$ | 927 | US$ | (42) |
(1) Presented in Canadian dollars. Average monthly rent in Q4 2021 was $2,405, a $243 decrease from Q4 2020, reflecting higher amortization of concessions offered in the first half of 2021 in order to drive occupancy.
(2) All dollar amounts in this table represent Tricon's 15% share of the operating results.
(3) Non-IFRS measures; see “Non-IFRS measures” on page 1, Section 6 and Appendix A.
| | | | | |
|
MANAGEMENT'S DISCUSSION AND ANALYSIS
FOR THE YEAR ENDED DECEMBER 31, 2021 |
4.2.2 Residential Development
Tricon's residential development business segment currently includes (i) new Class A multi-family rental apartments in Canada that are in the development and construction stages, (ii) built-to-rent, dedicated single-family rental communities in the United States with the intention to operate as part of the single-family rental portfolio upon stabilization, and (iii) legacy investments in for-sale housing development projects predominantly in the United States.
| | | | | | | | |
As at
(in thousands of U.S. dollars) | December 31, 2021 | December 31, 2020 |
| | |
| Canadian residential developments | $ | 204,129 | | $ | 128,116 | |
| | |
| | |
| | |
| | |
| U.S. residential developments | 143,153 | | 164,842 | |
| | |
| Net investments in residential developments | $ | 347,282 | | $ | 292,958 | |
| | |
| Net investments in residential developments as a % of total real estate assets | 4 | % | 5 | % |
Canadian residential developments
The Company is one of the most active rental developers in downtown Toronto with eight projects totaling 3,977 units under construction or in pre-construction as at December 31, 2021. The Company's portfolio also includes an existing commercial property, The Shops of Summerhill, adjacent to one of its multi-family development properties. Once construction is complete and lease-up stabilization occurs, newly built Canadian multi-family rental apartments will transition from the residential development business segment to Tricon’s multi-family rental business segment.
As at December 31, 2021, the carrying value of Tricon's net assets in its Canadian multi-family development portfolio was $204.1 million. The following table summarizes the net assets by stage of development.
| | | | | | | | | | | | | | | | | | | | | | | | | | | | | |
| December 31, 2021 | | December 31, 2020 |
| (in thousands of U.S. dollars) | Tricon's share of property value | Tricon's share of debt and lease obligations(1) | Tricon's share of net working capital and other items | Tricon's net assets (2) | | Tricon's share of property value | Tricon's share of debt and lease obligations(1) | Tricon's share of net working capital and other items | Tricon's net assets (2) |
| | | | | | | | | |
| Projects in pre-construction | $ | 49,779 | | $ | (32,489) | | $ | 708 | | $ | 17,998 | | | $ | 15,232 | | $ | (14,551) | | $ | 256 | | $ | 937 | |
| Projects under construction | 282,583 | | (128,206) | | 2,706 | | 157,083 | | | 188,431 | | (103,976) | | 641 | | 85,096 | |
Stabilized commercial property(3) | 39,401 | | (12,113) | | 1,755 | | 29,043 | | | 36,719 | | (12,463) | | 1,647 | | 25,903 | |
Disposed project(4) | — | | — | | 5 | | 5 | | | 24,941 | | (8,814) | | 53 | | 16,180 | |
| Total | $ | 371,763 | | $ | (172,808) | | $ | 5,174 | | $ | 204,129 | | | $ | 265,323 | | $ | (139,804) | | $ | 2,597 | | $ | 128,116 | |
| | | | | | | | | |
| Equity-accounted investments in Canadian residential developments | $ | 238,513 | | $ | (138,609) | | $ | (1,229) | | $ | 98,675 | | | $ | 155,305 | | $ | (79,786) | | $ | (564) | | $ | 74,955 | |
| Canadian development properties, net of debt | 133,250 | | (34,199) | | 6,403 | | 105,454 | | | 110,018 | | (60,018) | | 3,161 | | 53,161 | |
| Total | $ | 371,763 | | $ | (172,808) | | $ | 5,174 | | $ | 204,129 | | | $ | 265,323 | | $ | (139,804) | | $ | 2,597 | | $ | 128,116 | |
(1) Tricon's share of debt and lease obligations of $172,808 (December 31, 2020 - $139,804) consists of $135,906 of land and construction loans (net of deferred financing fees) and $36,902 of lease obligations under ground leases (December 31, 2020 - $105,473 and $34,331, respectively).
(2) Represents Tricon's share of development properties and other working capital items, net of debt and lease obligations.
(3) Represents The Shops of Summerhill, an adjacent commercial property to The James development project.
(4) The project was disposed of in the fourth quarter of 2021. On November 12, 2021, Tricon, along with its institutional partner, sold their combined 80% interest in the 7 Labatt partnership to the remaining joint venture partner. Tricon has no additional dispositions planned in the near term (see Section 3.1).
Projected units and timelines are estimated based on current project plans which are subject to change. Refer to page 1, "Forward-looking statements".
| | | | | |
|
MANAGEMENT'S DISCUSSION AND ANALYSIS
FOR THE YEAR ENDED DECEMBER 31, 2021 |
Investments in U.S. residential developments
The Company’s U.S. residential developments include the development of dedicated build-to-rent single-family communities and legacy investments in for-sale housing, including land development and homebuilding projects.
The build-to-rent strategy is currently being pursued within the existing THPAS JV-1 joint venture Investment Vehicle, which is capitalized with $450 million of equity commitments, including $50 million from Tricon and $400 million from an institutional investor. The THPAS JV-1 joint venture's build-to-rent portfolio currently consists of 1,355 units under development across eight communities in Texas and California. This investment represents $5.3 million of Tricon’s $143.2 million total U.S. residential development investments at fair value.
The Company’s legacy for-sale housing investments are structured as self-liquidating investments with cash flows generated as land, lots or homes are sold to third-party buyers (typically large homebuilders or commercial developers in the case of land and end consumers for homebuilding). These investments represent $137.9 million of Tricon’s $143.2 million total U.S. residential development investments at fair value.
In aggregate, the Company's U.S. residential development investments represent 1.6% of the Company's total assets but are expected to generate approximately $275.1 million of net cash flow to Tricon, a majority of which will be over the next five years (see “Non-IFRS measures and forward-looking statements” on page 1). These assets generated $18.1 million of distributions to Tricon in the fourth quarter of 2021, including $3.3 million in performance fees, and $64.3 million in 2021, including $8.6 million of performance fees.
| | | | | | | | | | | | | | | |
| (in thousands of U.S. dollars) | | Advances
to date | Distributions to date(1) | Tricon's fair value of investment | Projected distributions net of advances remaining(2) |
| | | | | |
| Investments in U.S. residential developments | | $ | 526,772 | | $ | 507,730 | | $ | 143,153 | | $ | 275,088 | |
(1) Distributions include repayments of preferred return and capital.
(2) Projected distributions are based on current project plans which are subject to change. Distributions received in 2021 net of advances were largely consistent with previously disclosed projections, and the remaining projected distributions net of advances are not materially different from previously disclosed figures; however, the above figures have been adjusted to reflect new projects initiated in 2021. Refer to page 1, "Forward-looking statements".
The scheduled time frame for Tricon to receive the projected net distributions remaining is as follows:
| | | | | | | | | | | | | | |
| (in thousands of U.S. dollars) | 1 to 2 years | 3 to 5 years | More than 5 years | Total |
| | | | |
| Projected distributions net of advances remaining | $ | 46,599 | | $ | 135,158 | | $ | 93,331 | | $ | 275,088 | |
| | | | | |
|
MANAGEMENT'S DISCUSSION AND ANALYSIS
FOR THE YEAR ENDED DECEMBER 31, 2021 |
4.3 Private Funds and Advisory
Through its private funds and advisory ("PF&A") business, Tricon earns fees from managing third-party capital co-invested in its real estate assets. Activities of this business include providing asset management, property management and development management services. The Company intends to continue raising and managing third-party capital to generate scale and drive operational synergies, diversify its investor base, capitalize on opportunities that would otherwise be too large for the Company, reduce its balance sheet exposure to development activities, and enhance Tricon’s return on equity by earning asset management and other fees.
Performance overview
The following table provides details of revenue from private funds and advisory services for the three and twelve months ended December 31, 2021 and 2020, net of inter-segment revenues eliminated upon consolidation.
| | | | | | | | | | | | | | | | | | | | | | | |
| For the periods ended December 31 | Three months | | Twelve months |
| (in thousands of U.S. dollars) | 2021 | 2020 | Variance | | 2021 | 2020 | Variance |
| | | | | | | |
Asset management fees (1) | $ | 3,386 | | $ | 2,815 | | $ | 571 | | | $ | 12,719 | | $ | 12,061 | | $ | 658 | |
Performance fees (2) | 3,676 | | 1,691 | | 1,985 | | | 8,909 | | 2,836 | | 6,073 | |
Development fees (3) | 7,993 | | 5,653 | | 2,340 | | | 24,418 | | 18,298 | | 6,120 | |
Property management fees (4) | 2,623 | | 180 | | 2,443 | | | 4,647 | | 895 | | 3,752 | |
| Revenue from private funds and advisory services | 17,678 | | 10,339 | | 7,339 | | | 50,693 | | 34,090 | | 16,603 | |
| | | | | | | |
Asset management fees (5) | 2,547 | | — | | 2,547 | | | 4,941 | | — | | 4,941 | |
Property management fees (5) | 5,437 | | 709 | | 4,728 | | | 11,841 | | 2,613 | | 9,228 | |
Other fees (5),(6) | — | | — | | — | | | 989 | | — | | 989 | |
Fees eliminated upon consolidation (5) | 7,984 | | 709 | | 7,275 | | | 17,771 | | 2,613 | | 15,158 | |
| | | | | | | |
Total FFO (7) impact from fees | $ | 25,662 | | $ | 11,048 | | $ | 14,614 | | | $ | 68,464 | | $ | 36,703 | | $ | 31,761 | |
(1) Ranges typically from 0.5-2% of committed or invested capital throughout the lives of the Investment Vehicles under management.
(2) Calculated as approximately 20% (in most cases) of net cash flow after investors’ capital has been returned, together with a pre-tax preferred return on capital of, typically, between 8% and 10%.
(3) Calculated as 2-5% of the sales price of single-family lots, residential land parcels and commercial land within master-planned communities, and 4-5% of overall development costs of Canadian multi-family rental apartments.
(4) Includes 4-7.75% of rental revenue from multi-family rental properties, build-to-rent single-family homes and other ancillary fees.
(5) Asset management fees, property management fees (including acquisition fees calculated at 1% of pre-renovation costs and leasing fees) and other fees earned from the limited partners of the single-family rental joint ventures are eliminated upon the consolidation of these Investment Vehicles. Such fees are accounted for within Tricon's proportionate Core FFO.
(6) Includes preferred return earned by the Company from third-party limited partners upon the sale of a portfolio of single-family homes to a single-family joint venture.
(7) Non-IFRS measures; see “Non-IFRS measures” on page 1, Section 6 and Appendix A.
The following table provides the details of revenue from private funds and advisory services before inter-segment revenues eliminated upon consolidation.
| | | | | | | | | | | | | | | | | | | | | | | |
| For the periods ended December 31 | Three months | | Twelve months |
| (in thousands of U.S. dollars) | 2021 | 2020 | Variance | | 2021 | 2020 | Variance |
| | | | | | | |
| Asset management fees | $ | 5,933 | | $ | 2,815 | | $ | 3,118 | | | $ | 17,660 | | $ | 12,061 | | $ | 5,599 | |
| Performance fees | 3,676 | | 1,691 | | 1,985 | | | 8,909 | | 2,836 | | 6,073 | |
| Development fees | 7,993 | | 5,653 | | 2,340 | | | 24,418 | | 18,298 | | 6,120 | |
| Property management fees | 8,060 | | 889 | | 7,171 | | | 16,488 | | 3,508 | | 12,980 | |
Other fees (1) | — | | — | | — | | | 989 | | — | | 989 | |
| Total FFO impact from fees | $ | 25,662 | | $ | 11,048 | | $ | 14,614 | | | $ | 68,464 | | $ | 36,703 | | $ | 31,761 | |
(1) Includes preferred return earned by the Company from third-party limited partners upon the sale of a portfolio of single-family homes to a single-family joint venture.
| | | | | |
|
MANAGEMENT'S DISCUSSION AND ANALYSIS
FOR THE YEAR ENDED DECEMBER 31, 2021 |
Asset management fees
Tricon manages $2.8 billion of fee-bearing capital across its business segments on which it earns asset management fee revenue. In the year ended December 31, 2021, fee-bearing capital increased by $1.6 billion compared to $1.2 billion as at December 31, 2020, primarily driven by the formation of the SFR JV-HD and SFR JV-2 joint ventures as well the syndication of the U.S. multi-family rental portfolio.
Performance fees
Performance fee revenues in the fourth quarter were $3.7 million, an increase of $2.0 million compared to the same period in 2020, as the performance of Tricon's legacy for-sale housing investments continued to improve. The Company earns performance fees once targeted returns are achieved by Investment Vehicles and records them only to the extent that it is highly probable that a significant amount of the cumulative revenue recognized will not reverse. Consideration for these services is variable as it is dependent upon the occurrence of a future event that includes the repayment of investor capital and a predetermined rate of return.
| | | | | | | | | | | | | | |
| (in thousands of U.S. dollars) | 1 to 2 years | 3 to 5 years | More than 5 years | Total |
| | | | |
| | | | |
| | | | |
| | | | |
| | | | |
| | | | |
| | | | |
| | | | |
| | | | |
| | | | |
| | | | |
| | | | |
| | | | |
| | | | |
| | | | |
| | | | |
Estimated future performance fees (1),(2) | $ | 10,000 | | $ | 81,000 | | $ | 148,000 | | $ | 239,000 | |
(1) Estimated future performance fees are calculated pursuant to current business plans, which involve estimating future cash flows from operations and eventual sale, less construction and development costs, to determine the quantum and timing of funding requirements and cash distributions for each Investment Vehicle. Such estimated future performance fees are discounted based on expected time horizons and risk (including the risks set out in the AIF and the risk that future performance does not align with the assumptions noted under the heading “Forward-looking statements” on page 1), and presented above before the deduction of any amounts paid to employees under the LTIP and performance fee expense to unitholders of the participation arrangements. Forward-looking information; see page 1.
(2) The actual performance fee revenues for the current year exceeded previously disclosed projections by approximately $7 million. The Company had recorded a significant write-down of its investments in the for-sale housing business under the context of a precipitous drop in sales and uncertainty over the timing of future cash flows brought on by the COVID-19 pandemic in early 2020. Accordingly, the Company also made a downward adjustment to its estimated future performance fees in 2020. Despite these uncertainties brought on by the pandemic, the Company was able to recover some of its previously recognized losses owing to the acceleration in housing demand in the latter part of 2020 and into 2021, which has led to the variance. In addition, the Company revised its projection for the near-term estimated future performance fees by $3 million to reflect the continuing economic recovery trend and project-level performance improvement.
Development fees
| | | | | | | | | | | | | | | | | | | | | | | |
| For the periods ended December 31 | Three months | | Twelve months |
| (in thousands of U.S. dollars) | 2021 | 2020 | Variance | | 2021 | 2020 | Variance |
| | | | | | | |
| The Johnson Companies (“Johnson”) | $ | 6,823 | | $ | 4,833 | | $ | 1,990 | | | $ | 18,653 | | $ | 14,586 | | $ | 4,067 | |
| Tricon Development Group ("TDG") | 1,170 | | 820 | | 350 | | | 5,765 | | 3,712 | | 2,053 | |
| Development fees | $ | 7,993 | | $ | 5,653 | | $ | 2,340 | | | $ | 24,418 | | $ | 18,298 | | $ | 6,120 | |
Development fee revenues in the fourth quarter increased by $2.3 million, including $2.0 million from Johnson driven by strong lot sales in its communities and meaningfully higher lot prices; development fees from Canadian residential development projects also increased as several projects commenced development over the past year.
Property management fees
The Company earned $8.1 million in property management fees in the quarter through its rental operating platform, representing a $7.2 million increase from the comparative period, driven primarily by acquisition fees generated from the SFR JV-HD and SFR JV-2 joint ventures, as well as fees earned upon the internalization of property management functions of the U.S. multi-family rental portfolio in the third quarter of 2021.
Corporate overhead efficiency
Fees earned from managing third-party capital allow Tricon to continually improve operating efficiency and offset corporate overhead expenses. The following table provides details of the Company's net overhead expenses for the three and twelve months ended December 31, 2021 and 2020:
| | | | | |
|
MANAGEMENT'S DISCUSSION AND ANALYSIS
FOR THE YEAR ENDED DECEMBER 31, 2021 |
| | | | | | | | | | | | | | | | | | | | | | | |
| For the periods ended December 31 | Three months | | Twelve months |
| (in thousands of U.S. dollars) | 2021 | 2020 | Variance | | 2021 | 2020 | Variance |
| Total FFO impact from fees (excluding performance fees) | $ | 21,986 | $ | 9,357 | $ | 12,629 | | $ | 58,566 | $ | 33,867 | $ | 24,699 |
| | | | | | | |
| Salaries and benefits | (13,412) | (9,682) | (3,730) | | (43,630) | (34,501) | (9,129) |
| Cash-based AIP expense | (5,038) | (4,850) | (188) | | (15,922) | (12,088) | (3,834) |
Proportionate cash general and administration expense(1) | (12,379) | (7,794) | (4,585) | | (36,147) | (31,254) | (4,893) |
| Recurring gross overhead expenses | (30,829) | (22,326) | (8,503) | | (95,699) | (77,843) | (17,856) |
| | | | | | | |
| | | | | | | |
| Overhead expenses, net | $ | (8,843) | $ | (12,969) | $ | 4,126 | | $ | (37,133) | $ | (43,976) | $ | 6,843 |
| | | | | | | |
| Total FFO impact from fees (excluding performance fees) as a percentage of recurring gross overhead expenses | 71 | % | 42 | % | 29 | % | | 61 | % | 44 | % | 17 | % |
(1) See Appendix A for reconciliation to general and administrative expense per the Company's consolidated financial statements.
| | | | | |
|
MANAGEMENT'S DISCUSSION AND ANALYSIS
FOR THE YEAR ENDED DECEMBER 31, 2021 |
5. Liquidity and capital resources
5.1 Financing strategy
The Company seeks to maintain financial strength and flexibility by lowering its cost of debt and equity capital and minimizing interest rate fluctuations over the long term. Some key elements of Tricon’s financing strategy are:
•Using various forms of debt such as floating-rate bank financing and unsecured debentures with conversion features, and attempting to stagger the maturity of its obligations.
•Using convertible or exchangeable securities where the principal can be redeemed by the issuance of common shares at the Company’s option.
•Where appropriate, raising equity through the public or private markets in the U.S. and Canada to finance its growth and strengthen its financial position.
5.2 Liquidity
Tricon generates substantial liquidity through:
•Stable cash flow received from our single-family rental business.
•Cash distributions from operating cash flow generated by our multi-family rental businesses.
•Cash distributions from land, lot and home sales in our legacy for-sale housing business.
•Fee income from our PF&A business.
•Repatriation of capital extracted through refinancings.
•Cash distributions generated from the turnover of assets with shorter investment horizons.
•Syndicating investments to private investors and thereby extracting Tricon's invested capital.
To enable us to react to attractive acquisition or investment opportunities and deal with contingencies when they arise, we typically maintain sufficient liquidity at the corporate level and within our key operating platforms. Our primary sources of liquidity consist of cash and a corporate credit facility.
| | | | | |
|
MANAGEMENT'S DISCUSSION AND ANALYSIS
FOR THE YEAR ENDED DECEMBER 31, 2021 |
Contractual obligations
The following table presents the contractual maturities of the Company’s financial liabilities at December 31, 2021, excluding remaining unamortized deferred financing fees and debt discount:
| | | | | | | | | | | | | | | | | |
| (in thousands of U.S. dollars) | | | | | |
| December 31, 2021 | Due on demand
and within the
year | From 1 to 2
years | From 3 to 4
years | From 5 years
and later | Total |
| | | | | |
| Liabilities | | | | | |
Debt(1) | $ | 254,805 | | $ | 822,163 | | $ | 2,439,432 | | $ | 438,251 | | $ | 3,954,651 | |
| Other liabilities | — | | 8,538 | | 7,863 | | 18,347 | | 34,748 | |
| Limited partners' interests in single-family rental business | — | | — | | 600,572 | | 346,880 | | 947,452 | |
| Derivative financial instruments | — | | — | | — | | 230,305 | | 230,305 | |
| Due to Affiliate | — | | — | | — | | 300,000 | | 300,000 | |
| Amounts payable and accrued liabilities | 102,954 | | — | | — | | — | | 102,954 | |
| Resident security deposits | 56,785 | | — | | — | | — | | 56,785 | |
| Dividends payable | 15,821 | | — | | — | | — | | 15,821 | |
| Total | $ | 430,365 | | $ | 830,701 | | $ | 3,047,867 | | $ | 1,333,783 | | $ | 5,642,716 | |
(1) The contractual maturities reflect the maturity dates after all extensions have been exercised. The Company intends to exercise the extension options available on all loans.
Working capital
As at December 31, 2021, Tricon had a net working capital deficit of $178.9 million, reflecting current assets of $251.4 million, offset by current liabilities of $430.4 million. The working capital deficit is primarily due to the term loan of $220.2 million coming due in October 2022, for which the Company intends to negotiate an extension. The Company has determined that its current financial obligations and working capital deficit are adequately funded from the available borrowing capacity and from operating cash flows.
5.3 Capital resources
Debt structure
Management mitigates interest rate risk by maintaining the majority of its debt at fixed rates. The impact of variable interest rate increases or decreases is discussed in the Company’s consolidated financial statements. Management also mitigates its exposure to fixed-rate interest risk by staggering maturities with the objective of achieving even, annual maturities over a ten-year time horizon to reduce Tricon’s exposure to interest rate fluctuations in any one period. The Company’s long-term debt structure is presented in Note 18 of the Company's consolidated financial statements, which information is incorporated herein by reference, and further summarized in Section 3.2 of this document.
The Company provides financial guarantees for land loans and construction loans in its residential development business.
As at December 31, 2021, the Company was in compliance with all of its financial covenants.
Equity issuance and cancellations
The Company’s Dividend Reinvestment Plan (“DRIP”) provides eligible holders of common shares with the opportunity to reinvest their cash dividends paid on the Company’s common shares to purchase additional common shares at a price equal to the average market price (as defined in the DRIP) on the applicable dividend payment date, less an applicable discount of up to 5% determined by the Board from time to time.
| | | | | |
|
MANAGEMENT'S DISCUSSION AND ANALYSIS
FOR THE YEAR ENDED DECEMBER 31, 2021 |
On June 8, 2021, the Company completed the offering, on a bought deal basis, of 15,480,725 common shares at a price of $10.77 per common share of the Company for gross proceeds of $166.7 million. Net proceeds from the offering were $161.8 million, which reflects $6.6 million of equity issuance costs incurred partially offset by $1.7 million of deferred tax recoveries.
On July 30, 2021, the Company gave notice to debenture holders of its intention to redeem in full all of the outstanding balance of the then-outstanding 2022 convertible debentures effective September 9, 2021, and elected to satisfy the redemption proceeds by the issuance of common shares of the Company. In total, the Company issued 16,449,980 common shares in connection with the conversion or redemption of the $172.4 million aggregate principal amount of the 2022 convertible debentures during 2021. Cash was also paid in lieu of any fractional shares that would otherwise have been issued on conversion or redemption.
On October 12, 2021, the Company closed its previously-announced initial public offering of common shares in the United States and concurrent public offering in Canada. A total of 46,248,746 common shares were issued, for aggregate gross proceeds to the Company of $570.3 million. Net proceeds from the offering were $547.6 million, which reflects $30.2 million of equity issuance costs incurred partially offset by $7.5 million of deferred tax recoveries.
As at December 31, 2021, there were 272,773,225 common shares issued by the Company, of which 272,176,046 were outstanding and 597,179 were reserved to settle restricted share awards in accordance with the Company's Restricted Share Plan. In addition, the Company had 2,017,327 outstanding stock options and 2,847,575 outstanding deferred share units (DSUs).
As at December 31, 2021, there was $300.0 million in outstanding aggregate principal amount of Due to Affiliate in connection with the exchangeable preferred units issued by Tricon PIPE LLC (see Section 3.1). Pursuant to the transaction documents associated with such issuance, the investors in such preferred units have rights to exchange the preferred units into common shares of the Company at an exchange price of $8.50 per common share, as may be adjusted from time to time in accordance with the terms of such transaction documents. As at December 31, 2021, this equated to 35,294,118 common shares of the Company.
The following table summarizes the Company's equity capital structure at December 31, 2021 and December 31, 2020:
| | | | | | | | | | | |
| December 31, 2021 | December 31, 2020 | Variance |
| | | |
| Common shares outstanding | 272,176,046 | | 193,175,802 | | 79,000,244 | |
| Restricted common shares | 597,179 | | 369,113 | | 228,066 | |
| Number of basic common shares issued | 272,773,225 | | 193,544,915 | | 79,228,310 | |
| | | |
| Outstanding stock options | 2,017,327 | | 2,241,339 | | (224,012) | |
| Outstanding deferred share units (DSUs) | 2,847,575 | | 2,376,655 | | 470,920 | |
| Exchangeable preferred units | 35,294,118 | | 35,294,118 | | — | |
| Convertible debentures units | — | | 16,481,837 | | (16,481,837) | |
| | | | | |
|
MANAGEMENT'S DISCUSSION AND ANALYSIS
FOR THE YEAR ENDED DECEMBER 31, 2021 |
6. Operational key performance indicators
The non-IFRS financial measures, non-IFRS ratios, and KPI supplementary financial measures discussed throughout this MD&A for each of the Company’s business segments are calculated based on Tricon's proportionate share of each portfolio or business and are defined and discussed below. The presentation on a proportionate basis reflects only the portion attributable to Tricon's shareholders based on the Company's ownership percentage of the underlying entities and excludes the percentage associated with non-controlling and limited partners' interests. The Company believes that providing these measures on a proportionate basis is helpful to investors in assessing the overall performance of the Company’s business. These measures are commonly used by entities in the real estate industry as useful metrics for measuring performance; however, they do not have any standardized meaning prescribed by IFRS and are not necessarily comparable to similar measures presented by other publicly-traded entities. These measures should be considered as supplemental in nature and not as a substitute for the related financial information prepared in accordance with IFRS. See “Non-IFRS measures” on page 1 and Appendix A.
Single-family and multi-family rental
•Net operating income ("NOI") represents total revenue from rental properties, less direct operating expenses and property management expenses. NOI excludes non-property specific and indirect overhead expenses, interest expense and non-core income or expenses such as gains or losses on the disposition of rental properties. Tricon believes NOI is a helpful metric to evaluate the performance of its rental business and compare it to industry peers.
•Net operating income ("NOI") margin represents net operating income as a percentage of total revenue from rental properties.
•Occupancy rate represents the total number of days that units were occupied during the measurement period, divided by the total number of days that the units were owned during the measurement period (excluding units held for sale). Management believes occupancy is a main driver of rental revenues and that comparing occupancy across different periods is helpful in evaluating changes in rental revenues.
•Annualized turnover rate during the period represents the number of resident move-outs divided by the weighted average number of rental units (excluding units held for sale) in the period, annualized for a twelve-month period. Management believes the annualized turnover rate impacts occupancy and therefore revenue, as well as the cost to maintain the rental portfolios.
•Average monthly rent represents average monthly rental income per unit for occupied units and reflects the impact of rent concessions amortized over the life of the related leases. Tricon believes average monthly rent reflects pricing trends which impact rental revenue over time.
•Average rent growth during the period represents the percentage difference between the monthly rent from an expiring lease and the monthly rent from the next lease and reflects the impact of rent concessions amortized over the life of the related lease. Leases are either renewal leases, where a current resident chooses to stay for a subsequent lease term, or a new lease, where a previous resident moves out and a new resident signs a lease to occupy the same unit. Average rent growth drives average monthly rent and management finds it is useful to evaluate changes in rental revenue across periods.
•“Same home” or “same home portfolio” includes homes that were stabilized 90 days prior to the first day of the prior-year comparative period as per the guidelines of the National Rental Home Council. It excludes homes that have been sold or homes that have been designated for sale. This same home portfolio is defined on January 1 of each reporting year. Based on this definition, any home currently included in the same home portfolio will have satisfied the conditions described above prior to September 30, 2019, and those homes have been held in operations throughout the full periods presented in both 2020 and 2021.
| | | | | |
|
MANAGEMENT'S DISCUSSION AND ANALYSIS
FOR THE YEAR ENDED DECEMBER 31, 2021 |
Private Funds and Advisory
•Total fee revenue represents total asset management, property management, development management and performance fees earned, excluding inter-company fees earned.
•Assets Under Management (“AUM”) includes balance sheet capital invested in the Company's principal investments and capital managed on behalf of third-party investors and is a helpful measure in evaluating the Company’s ability to grow and manage strategic capital. AUM is calculated as follows:
| | | | | |
| ASSETS UNDER MANAGEMENT |
| Principal Assets Under Management |
| Single-family rental, multi-family rental and Canadian residential developments | Fair value of rental and development properties plus unfunded commitment |
| U.S. residential developments | Fair value of invested capital plus unfunded commitment |
| Third-Party Assets Under Management |
| Single-family rental, multi-family rental and Canadian residential developments | Fair value of rental and development properties plus unfunded commitment |
| U.S. residential developments | |
| For-sale housing | Outstanding invested equity and unfunded commitment |
| Build-to-rent | Outstanding invested equity and project-level funded debt plus unfunded commitment |
Company operating performance
Funds from operations (“FFO”), core funds from operations (“Core FFO”) and adjusted funds from operations ("AFFO") are metrics that management believes to be helpful in evaluating the Company's operating performance, considering the recent expansion of its residential rental portfolio. These are metrics commonly used by securities analysts, investors and other interested parties in the evaluation of real estate entities, particularly those that own and operate income-producing properties. Management believes that providing these performance measures on a supplemental basis is helpful to investors in assessing the overall performance of the Company’s business.
•FFO represents net income excluding the impact of fair value adjustments and amortization of intangibles arising from business combinations. The Company's definition of FFO reflects all adjustments that are specified by the National Association of Real Estate Investment Trusts ("NAREIT"). In addition to the adjustments prescribed by NAREIT, Tricon excludes any fair value gains that arise as a result of reporting under IFRS, except for fair value gains arising from Tricon's U.S. residential developments business which are intended to act as a proxy for cash generation.
•Core FFO presents FFO as a normalized figure, adjusting for transaction costs, convertible debentures interest, interest on Due to Affiliate, fees eliminated upon consolidation, non-recurring and non-cash items.
•AFFO represents Core FFO less recurring capital expenditures, which represent ongoing costs associated with maintaining and preserving the quality of a property after it has been renovated.
Tricon’s method of calculating FFO is substantially in accordance with NAREIT’s recommendations, but may differ from other issuers’ methods and, accordingly, may not be comparable to FFO reported by other issuers.
Core FFO and AFFO per share amounts are calculated based on the weighted average common shares outstanding in the period, assuming the conversion of all potentially dilutive shares (including convertible debt and exchangeable preferred units) to show the full dilutive impact to shareholders.
Core FFO and AFFO payout ratios are calculated by dividing dividends declared for the period by Core FFO and AFFO, respectively, which are indicative of the Company's ability to fund dividend payments using cash from operations.
| | | | | |
|
MANAGEMENT'S DISCUSSION AND ANALYSIS
FOR THE YEAR ENDED DECEMBER 31, 2021 |
| | | | | |
|
MANAGEMENT'S DISCUSSION AND ANALYSIS
FOR THE YEAR ENDED DECEMBER 31, 2021 |
Net debt
Net debt represents the Company's total current and long-term debt per its consolidated financial statements, less its cash and restricted cash. Management believes it is a helpful liquidity measure to reflect the Company's ability to meet all of its obligations simultaneously if they were due immediately.
7. Accounting estimates and policies, controls and procedures, and risk analysis
7.1 Revenue and income recognition
The following table summarizes the revenue earned from the Company’s business segments.
| | | | | |
| TOTAL REVENUE |
| Revenue |
| Revenue from single-family rental properties | • Lease revenue is primary rental revenue from a lease contract, earned directly from leasing the homes. |
| • Ancillary revenue is income earned from residents that is not primary rental revenue from a lease contract. Ancillary revenue includes application fees, pet fees, smart home fees, other service fees, late fees and early termination fees. |
| • Non-lease revenue includes property management services, such as repairs and maintenance performed on the properties. |
| Revenue from private funds and advisory services | • Asset management fees from managing third-party capital invested through Investment Vehicles within the single-family rental, multi-family rental and residential development businesses. |
| • Performance fees from Investment Vehicles. |
| • Development management and advisory fees generated from residential development projects. |
| • Property management fees from managing single-family rental homes and multi-family rental properties. |
Revenue from single-family rental properties
Revenue recognition under a lease commences when a resident has a right to use the leased asset, which is typically when the resident takes possession of, or controls the physical use of, the leased property. Generally, this occurs on the lease commencement date.
Lease contracts with residents normally include lease and non-lease components, which may be bundled into one fixed gross lease payment. Lease revenue earned directly from leasing the homes is recognized and measured on a straight-line basis over the lease term in accordance with IFRS 16, Leases (“IFRS 16”). Leases for single-family rental homes are generally for a term of one to two years.
Ancillary revenue is income the Company generates from providing services that are not primary rental revenue from a lease contract. Ancillary revenue includes pet fees, early termination fees and other service fees. Ancillary revenue is measured at the amount of consideration which the Company expects to receive in exchange for providing services to a resident. Ancillary revenue is included with revenue from single-family rental properties in the consolidated statements of comprehensive income
In addition to revenue generated from the lease component, revenue from single-family rental properties includes a non-lease component earned from the residents, which is recognized under IFRS 15, Revenue from Contracts with Customers (“IFRS 15”). Non-lease revenue includes property management services, such as repairs and maintenance performed on the properties. These services represent a single performance obligation and revenue is recognized over time as the services are provided, regardless of when the payment is received. Revenue from rental properties is allocated to non-lease components using a cost-plus margin approach whereby the Company separates the operating costs that pertain to the services provided to the residents and applies a reasonable profit margin.
| | | | | |
|
MANAGEMENT'S DISCUSSION AND ANALYSIS
FOR THE YEAR ENDED DECEMBER 31, 2021 |
The Company has concluded that it is the principal in all of its revenue arrangements since it controls the specified goods or services before those goods or services are transferred to customers.
Revenue from private funds and advisory services
The Company's vertically integrated management platform provides asset management, development management and property management services.
The Company provides asset management services to joint venture partners and third-party investors for which it earns market-based fees in connection with its businesses in the United States and Canada. These contractual fees are typically 1-2% of committed or invested capital throughout the lives of the Investment Vehicles under management. The Company may also earn performance fees once targeted returns are achieved by an Investment Vehicle. The Company recognizes performance fees only to the extent that it is highly probable that a significant amount of the cumulative revenue recognized will not reverse. Consideration for these services is variable as it is dependent upon the occurrence of a future event that includes the repayment of investor capital and a predetermined rate of return. Revenue from performance fees is typically earned and recognized towards the end of the life of an Investment Vehicle.
The Company also earns development management and advisory service fees from third parties and/or related parties. Development management and advisory services are satisfied over time. Revenues are recognized based on the best estimate of the amounts earned for those services, which typically reflects contractual fees of 2-5% of the sales price of single-family lots, residential land parcels and commercial land within master-planned communities, and 4-5% of overall development costs of Canadian multi-family rental apartments. The Company includes variable consideration in the revenues only to the extent that it is highly probable that a significant amount of the cumulative revenue recognized will not reverse. Specifically for Johnson, consideration for these services is variable as it is dependent upon the occurrence of a future event that is the sale of the developed property. Revenue is typically recognized as the development of the property is completed, and control has been transferred to the respective buyer. These management fees earned in exchange for providing development management and advisory services are billed upon the sale of the property.
The Company earns property management fees, leasing fees, acquisition and disposition fees, and construction management fees through its rental operating platform. These management services are satisfied over time and revenues are recognized as services are provided in accordance with IFRS 15.
Income from equity-accounted investments in multi-family rental properties and Canadian residential developments
The Company recognizes income from equity-accounted investments in multi-family rental properties and Canadian residential developments under the equity method, as per IAS 28, Investments in Associates and Joint Ventures ("IAS 28"). The Company's equity-accounted investments in multi-family rental properties and Canadian residential developments are initially recognized at cost, and adjusted thereafter to recognize the Company's share of profit or loss of the investee in accordance with Tricon's accounting policies, which are discussed in Note 3 to the consolidated financial statements.
Income from investments in U.S. residential developments
The Company's investments in U.S residential developments meet the definition of associates and are accounted for under the equity method per IAS 28; however, Tricon has elected to apply the exception in paragraph IAS 28.36A, which permits a non-investment company investor to elect to retain investment entity accounting for associates that themselves qualify as investment entities.
As a result, the Company's investments in U.S. residential developments are measured at fair value, and income from investments in U.S. residential developments is calculated based on its share of the changes in the fair value of the net assets of each of the Investment Vehicles in which it invests. The fair value of each Investment Vehicle’s net assets is determined by the waterfall distribution calculations specified in the relevant governing agreements. The inputs into the waterfall distribution calculations include the fair values of the land development and homebuilding projects and working capital held by the Investment Vehicles. The fair values of the land development
| | | | | |
|
MANAGEMENT'S DISCUSSION AND ANALYSIS
FOR THE YEAR ENDED DECEMBER 31, 2021 |
and homebuilding projects are based on appraisals prepared by external third-party valuators or on internal valuations using comparable methodologies and assumptions.
7.2 Accounting estimates and policies
The Company makes estimates and assumptions concerning the future. The resulting accounting estimates will, by definition, seldom equal the related actual results. Refer to the notes to the consolidated financial statements for details on critical accounting estimates.
Transition to a rental housing company
In January 2020, the Company completed its previously announced transition to an owner and operator of diversified rental housing, resulting in the Company determining that it no longer meets the criteria for being an investment entity ("Investment Entity Accounting") under IFRS 10, Consolidated Financial Statements ("IFRS 10"). The exact timing of the transition from an investment entity to a rental housing company is highly judgmental and the Company concluded that this transition occurred in January 2020. As a result, effective January 1, 2020 (the “Transition Date”), the Company was required to apply the acquisition method of accounting as per IFRS 3, Business Combinations ("IFRS 3"), to all subsidiaries that were previously measured at fair value through profit or loss ("FVTPL").
Consequently, the Company began consolidating the financial results of controlled subsidiaries including those holding its investments in single-family rental homes and U.S. multi-family rental properties, resulting in the inclusion of these subsidiaries’ assets, liabilities and non-controlling interests on the balance sheet of the Company. Similarly, these subsidiaries' income and expenses have been reported on the Company’s consolidated statement of comprehensive income together with the non-controlling interests’ share of income.
Concurrently, the Company's investments in Canadian residential developments and U.S. residential developments are accounted for in one of two ways: (i) proportionate consolidation for joint operations for the period between January 1, 2020 and June 22, 2020, during which time the Company owned 50% and 25% interests in The James and The Shops of Summerhill, respectively; and (ii) equity accounting for associates and joint ventures, in accordance with IFRS 11, Joint Arrangements and IAS 28.
On March 31, 2021, the Company completed the syndication of its U.S. multi-family rental subsidiary, Tricon US Multi-Family REIT LLC, which resulted in a disposition of 80% of the Company's interest in that subsidiary. Accordingly, the Company reclassified the current- and prior-year period results and cash flows of the U.S. multi-family rental subsidiary as discontinued operations separate from the Company's continuing operations in accordance with IFRS 5, Non-current Assets Held for Sale and Discontinued Operations ("IFRS 5").
The accounting impact of the Company's businesses and their presentation in the Company's consolidated financial statements are summarized in the table below.
| | | | | |
|
MANAGEMENT'S DISCUSSION AND ANALYSIS
FOR THE YEAR ENDED DECEMBER 31, 2021 |
| | | | | | | | | | | | | | | | | |
| ACCOUNTING | PRESENTATION |
| Business segment | Accounting assessment | Accounting methodology | Presentation in Balance Sheet | Presentation in Statement of Income | Presentation of Non-controlling interest |
| Single-Family Rental | | | | | |
| Tricon wholly-owned | Controlled subsidiary | Consolidation | Rental properties | Revenue from single-family rental properties | N/A |
| SFR JV-1 | Controlled subsidiary | Consolidation | Limited partners' interests
(Component of liabilities) |
| SFR JV-HD | Controlled subsidiary | Consolidation |
| SFR JV-2 | Controlled subsidiary | Consolidation |
| | | | | |
| Multi-Family Rental | | | | | |
U.S. multi-family (1) | Controlled subsidiary for the period between January 1, 2020 and March 30, 2021, and joint venture from March 31, 2021 | Consolidation between January 1, 2020 and March 30, 2021, and equity method from March 31, 2021 | Rental properties as at December 31, 2020
Equity-accounted investments in multi-family rental properties as at December 31, 2021 | Net income (loss) from discontinued operations between January 1, 2020 and March 30, 2021
Income from equity-accounted investments in multi-family rental properties from March 31, 2021 | N/A |
Canadian multi-family:
592 Sherbourne
(The Selby) | Investments in associate | Equity method | Equity-accounted investments in multi-family rental properties | Income from equity-accounted investments in multi-family rental properties | N/A |
| | | | | |
| Canadian residential developments | | | | | |
The Shops of
Summerhill | Joint operation for the period between January 1, 2020 and June 22, 2020, and controlled subsidiary from June 23, 2020 | Proportionate consolidation between January 1, 2020 and June 22, 2020, and consolidation from June 23, 2020 | Canadian development properties
| Other income | N/A |
| The James (Scrivener Square) | N/A |
| | | | | |
57 Spadina
(The Taylor) | Investments in associate | Equity method | Equity-accounted investments in Canadian residential developments | Income from equity-accounted investments in Canadian residential developments | N/A |
| WDL - Block 8 | Joint venture | Equity method | N/A |
| WDL - Block 20 | Joint venture | Equity method | N/A |
| WDL - Blocks 3/4/7 | Joint venture | Equity method | N/A |
| WDL - Block 10 | Joint venture | Equity method | N/A |
| 6~8 Gloucester (The Ivy) | Joint venture | Equity method | N/A |
7 Labatt(2) | Joint venture | Equity method | N/A |
| Queen & Ontario | Joint venture | Equity method | N/A |
| | | | | |
| U.S. residential developments | | | | | |
| Build-to-rent | Investments in associates | Equity method | Investments in U.S. residential developments | Income from investments in U.S. residential developments | N/A |
| For-sale housing | Investments in associates | Equity method | N/A |
| | | | | |
| Private Funds and Advisory | | | | | |
| Private funds GP entities | Controlled subsidiary | Consolidation | Consolidated | Revenue from private funds and advisory services | N/A |
| Johnson development management | Controlled subsidiary | Consolidation | Consolidated | Component of equity |
(1) On March 31, 2021, the Company sold an 80% ownership interest in its U.S. multi-family rental portfolio.
(2) On November 12, 2021, the Company's joint venture, Labatt Village Holding LP, sold its 80% ownership interest in the 7 Labatt project to the remaining joint venture partner.
| | | | | |
|
MANAGEMENT'S DISCUSSION AND ANALYSIS
FOR THE YEAR ENDED DECEMBER 31, 2021 |
Significant estimates
Income taxes
The determination of the Company’s income and other tax liabilities requires interpretation of complex laws and regulations often involving multiple jurisdictions. Significant estimates are required in determining the Company’s consolidated income tax provision. There are many transactions and calculations for which the ultimate tax determination is uncertain. The Company recognizes liabilities for anticipated tax audit issues based on estimates of whether additional taxes will be due. Where the final tax outcome of these matters is different from the amounts that were initially recorded, such differences will impact the current tax and deferred tax provisions. Furthermore, deferred income tax balances are recorded using enacted or substantively enacted future income tax rates. Changes in enacted income tax rates are not within the control of management. However, any such changes in income tax rates may result in actual income tax amounts that may differ significantly from estimates recorded in deferred tax balances.
Valuation of rental properties
The fair values of single-family rental properties are typically determined using a combination of internal and external processes and valuation techniques according to the valuation policy as set out in Note 6 of the consolidated financial statements. The valuation inputs are considered Level 3 as judgment is used in determining the weight to apply to inputs based on recent repeat-sales data information and whether adjustments are needed to account for unique characteristics of the assets. A change to these inputs could significantly alter the fair values of the rental properties.
Fair value of investments
The fair values of the Company’s investments in U.S. residential development associates are determined using the valuation methodologies described in Note 10 of the consolidated financial statements. By their nature, these valuation techniques require the use of assumptions that are mainly based on market conditions existing at the end of each reporting period. Changes in the underlying assumptions could materially impact the determination of the fair value of a financial instrument. Imprecision in determining fair value using valuation techniques may affect the investment income recognized in a particular period.
Fair value of incentive plans and participation arrangements
Management is required to make certain assumptions and to estimate future financial performance in order to estimate the fair value of incentive plans and performance fees participation arrangements at each consolidated balance sheet date. Significant estimates and assumptions relating to such incentive plans and participation arrangements are disclosed in Notes 3, 31 and 32 of the consolidated financial statements. The LTIP and the performance fees liability require management to estimate future non-IFRS earnings measures, namely future performance fees relative to each Investment Vehicle. Future non-IFRS measures are estimated based on current projections, and are updated at least annually, taking into account actual performance since inception.
Goodwill impairment
Assessment of impairment is based on management’s judgment of whether there are internal and external factors that would indicate that an asset or CGU is impaired. The determination of the Company’s goodwill impairment involves management’s significant estimates and assumptions with respect to future cash flows, growth rates and discount rates of the underlying CGU. The risk premiums expected by market participants related to uncertainties about the industry and assumptions relating to future cash flows may differ, depending on economic conditions and other events. Changes in any of these underlying assumptions could materially affect the assessment of the recoverable value of a CGU (refer to Note 13 of the consolidated financial statements).
| | | | | |
|
MANAGEMENT'S DISCUSSION AND ANALYSIS
FOR THE YEAR ENDED DECEMBER 31, 2021 |
Significant judgments
Acquisition of rental properties
The Company’s accounting policies relating to rental properties are described in Note 3 of the consolidated financial statements. In applying these policies, judgment is exercised in determining whether certain costs are additions to the carrying amount of a rental property and whether properties acquired are considered to be asset acquisitions or business combinations. Should the purchase meet the criteria of a business combination, then transaction costs such as appraisal and legal fees are expensed immediately and included in the consolidated statements of comprehensive income. If the purchase is an asset acquisition, transaction costs form part of the purchase price and earnings are not immediately affected.
Basis of consolidation
The consolidated financial statements of the Company include the accounts of Tricon and its wholly-owned subsidiaries, as well as entities over which the Company exercises control on a basis other than majority ownership of voting interests within the scope of IFRS 10. Judgment is applied in determining if an entity meets the criteria of control as defined in the accounting standard.
Investments in joint ventures and joint arrangements
The Company makes judgments in determining the appropriate accounting for investments in other entities. These judgments include determining the significant relevant activities and assessing the level of influence Tricon has over the activities through contractual arrangements. In addition, the Company also determines whether Tricon's rights and obligations are directly related to the assets and liabilities of the arrangement or to the net assets of the joint arrangement.
7.3 Controls and procedures
Pursuant to National Instrument 52-109 - Certification of Disclosure in Issuers' Annual and Interim Filings released by the Canadian Securities Administrators, the Company’s CEO and CFO have evaluated the design and operating effectiveness of the Company’s disclosure controls and procedures and the Company’s internal controls over financial reporting for the year ended December 31, 2021. The CEO and CFO did not identify any material weaknesses in the Company’s system of internal controls over financial reporting.
During the year ended December 31, 2021, there were no changes to policies, procedures and processes that comprise the system of internal controls over financial reporting that may have affected, or are reasonably likely to materially affect, the Company's internal controls over financial reporting. Such controls and procedures are subject to continuous review and changes to such controls and procedures may require management resources and systems in the future.
Management does not expect that the disclosure controls or internal controls over financial reporting of the Company will prevent or detect all errors and all fraud or will be effective under all potential future conditions. A control system is subject to inherent limitations and, no matter how well designed and operated, can provide only reasonable, not absolute, assurance that the control system's objectives will be met. Further, the design of a control system must reflect that there are resource constraints, and the benefits of controls must be considered relative to their costs. Inherent limitations include the realities that judgments in decision-making can be faulty, and that breakdowns can occur because of simple errors or mistakes. Controls can also be circumvented by individual acts of some persons, by collusion of two or more people or by management override of the controls. Due to the inherent limitations in a cost-effective control system, misstatements due to error or fraud may occur and not be detected. The design of any control system is also based in part upon certain assumptions about the likelihood of future events, and there can be no assurance that any design will succeed in achieving its stated goals under all potential conditions. Projections of any evaluations of effectiveness to future periods are subject to the risk that controls may become inadequate because of changes in conditions, or that the degree of compliance with the policies or procedures may deteriorate.
| | | | | |
|
MANAGEMENT'S DISCUSSION AND ANALYSIS
FOR THE YEAR ENDED DECEMBER 31, 2021 |
7.4 Transactions with related parties
Senior management of the Company own units, directly or indirectly, in the various Tricon's Investment Vehicles, as well as common shares of the Company. Refer to Note 34 in the consolidated financial statements for further details concerning the Company’s transactions with related parties, which information is incorporated herein by reference.
7.5 Dividends
On March 1, 2022, the Board of Directors of the Company declared a dividend of $0.058 per common share in U.S. dollars payable on or after April 15, 2022 to shareholders of record on March 31, 2022.
For the three months ended December 31, 2021 and 2020, the Core FFO payout ratios were 35% and 26% and the AFFO payout ratios were 43% and 31%, respectively. The Core FFO and AFFO payout ratios are non-IFRS measures and their definitions, calculations and reconciliations are provided in Section 6 and Appendix A.
7.6 Compensation incentive plans
The Company’s annual compensation incentive plans include an annual incentive plan (“AIP”) and a long-term incentive plan (“LTIP”).
Annual Incentive Plan ("AIP")
The Company’s AIP provides for an aggregate bonus pool based on the sum of all employees’ individual AIP targets. The portion of the pool attributable to senior executive management is market-benchmarked and subject to an adjustment factor, as approved by the Board, of between 50% and 150%, based on the achievement of Company performance objectives determined by the Board at the beginning of each year. The final pool is then allocated among employees based on individual and collective performance. AIP awards will be made in cash and equity-based grants, with the proportion of equity-based awards being correlated to the seniority of an individual’s role within the Company. Equity-based AIP awards are granted in a combination of deferred share units ("DSUs"), performance share units ("PSUs"), stock options and restricted shares, pursuant to the Company's Deferred Share Unit Plan, Performance Share Unit Plan, Stock Option Plan and Restricted Share Plan, respectively.
Long-term incentive plan ("LTIP")
LTIP expense is generated from two sources: (i) a portion of the Company’s share of performance fees or carried interest from certain Investment Vehicles, paid in cash when received; and (ii) 15% of the income from THP1 US (a U.S. residential development Investment Vehicle), payable in DSUs which vest in equal tranches over a three-year period. Amounts under the LTIP are allocated among employees in accordance with the plan.
For the expense generated from the Company’s share of performance fees or carried interest from certain Investment Vehicles, the Company estimates its total liability by determining unrealized carried interest at each reporting date based on the estimated fair value of the underlying investments. Once determined, the component that is payable to employees as part of the LTIP is recognized as LTIP liability, and the component that is payable to key management equity participants is allocated to performance fees liability. The combined amount recognized as LTIP liability and performance fees liability represents no more than 50% of the Company's share of unrealized carried interest for each Investment Vehicle. Changes in the LTIP liability are recognized in the consolidated statements of comprehensive income.
Complete details concerning the Company’s compensation plans are set out in the Company’s most recent Management Information Circular, available on SEDAR at www.sedar.com and on the Company’s website at www.triconresidential.com.
| | | | | |
|
MANAGEMENT'S DISCUSSION AND ANALYSIS
FOR THE YEAR ENDED DECEMBER 31, 2021 |
7.7 Risk definition and management
There are certain risks inherent in the Company’s activities and those of its investees, including the ones described below, which may impact the Company’s financial and operating performance, the value of its investments and the value of its securities. The Annual Information Form contains a more detailed summary of risk factors pertaining to the Company and its business under the heading “Risk Factors”, which section is incorporated herein by reference. The disclosures in this MD&A are subject to the risk factors outlined in the AIF. Other risks and uncertainties that the Company does not presently consider to be material, or of which the Company is not presently aware, may become important factors that affect the Company’s future financial condition and results of operations. The occurrence of any of the risks discussed herein or in the AIF could materially and adversely affect the business, prospects, financial condition, results of operations, cash flow or the ability of the Company to make dividends or the value of its shares.
Liquidity risk
Residential real estate assets generally cannot be sold quickly, particularly if local market conditions are poor. As a result, the Company may not be able to acquire or sell assets promptly in response to economic or other conditions. If the Company were required to quickly liquidate its assets, there is a risk that it would realize sale proceeds less than the current book value of its real estate investments. This inability to promptly reallocate capital or exit the market in a timely manner could adversely affect the Company’s financial condition and performance.
Additionally, financial difficulties of other property owners resulting in distressed sales could depress real estate values in the markets in which we invest. These restrictions could reduce our ability to respond to changes in the performance of our portfolios and could adversely affect our financial condition and performance.
Indebtedness and rising interest rates
The degree to which the Company is leveraged could have important consequences to the Company, including: (i) the Company’s future ability to obtain additional financing for working capital, capital expenditures or other purposes may be limited; (ii) the Company may be unable to refinance indebtedness on terms acceptable to the Company or at all; (iii) a significant portion of the Company’s cash flow could be dedicated to the payment of the principal of and interest on its indebtedness, thereby reducing funds available for future operations, capital expenditures and/or dividends on its common shares and increasing the risk of default on the Company's debt obligations; (iv) the Company may be negatively impacted by rising interest rates; and (v) the Company may be more vulnerable to economic downturns and be limited in its ability to withstand competitive pressures.
Moreover, rising interest rates, decreased availability of mortgage financing or of certain mortgage programs, higher down payment requirements or increased monthly mortgage costs may increase the cost of capital for the Company and may lead to reduced demand for new home sales and resales and mortgage loans, which could negatively impact our financial condition and performance.
The Company manages interest rate risk by structuring its financings to stagger the maturities of its debt, thereby mitigating the exposure to interest rate and other credit rate fluctuations.
Benchmark interest rate reform risk
Regulators in the United Kingdom and elsewhere have recommended and are seeking to implement broad changes to benchmark interest rates, such as LIBOR. It is expected that a transition away from the widespread use of LIBOR and such other benchmark rates to alternative reference rates and other potential interest rate benchmark reforms will occur over the course of the next few years. For example, in July 2017,the United Kingdom’s Financial Conduct Authority announced a desire to phase out the use of LIBOR by the end of 2021. On March 5, 2021, the administrator of LIBOR, ICE Benchmark Administration Limited, announced its intention to cease publishing two USD LIBOR settings immediately after publication on December 31, 2021, with the majority of the USD LIBOR settings to end immediately after publication on June 30, 2023. Although financial regulators and industry working groups have suggested alternative reference rates, such as European Interbank Offer Rate ("EURIBOR"), Sterling Overnight Interbank Average Rate ("SONIA") and Secured Overnight Financing Rate ("SOFR"), global consensus
| | | | | |
|
MANAGEMENT'S DISCUSSION AND ANALYSIS
FOR THE YEAR ENDED DECEMBER 31, 2021 |
on alternative rates is lacking and the process for amending existing contracts or instruments to transition away from LIBOR remains unclear.
As a result, there is near-term uncertainty about how the currently dominant benchmarks will be phased out, the speed at which modified or replacement benchmarks will take their place, the acceptance of such alternatives, and the ultimate effect any such changes may have on markets for financial instruments and the access to and cost of debt. Abandonment of or modifications to such benchmarks could have adverse impacts on the Company’s newly-issued financial instruments and existing financial instruments that reference such benchmarks. Uncertainty and risk also remain regarding the willingness and ability of issuers and lenders to include revised provisions in new and existing contracts or instruments. While some of the Company’s debt instruments may contemplate a scenario where LIBOR or another applicable benchmark is no longer available by providing for an alternative rate-setting methodology, not all of our instruments may have such provisions, and the impact of any such alternative methodologies is unclear.
Abandonment of or modifications to LIBOR or another relevant benchmark could lead to market instability, and could adversely impact the pricing, liquidity, value or return of the Company’s debt instruments, affect the Company’s ability to meet its payment obligations thereunder, require extensive changes to documentation, result in disputes, or cause the Company to incur additional costs. Depending on these and several other factors, many of which are beyond the Company’s control, the Company’s business, financial condition and results of operations could be materially adversely impacted by any such market transition or reform of benchmark interest rates. It remains uncertain how such changes would be implemented and the effects such changes may have on the Company, its business, financial condition and results of operations, its investees and financial markets generally. The Company continues to actively monitor these potential changes and to include alternative rate-setting methodologies in its newly-issued debt instruments.
Guarantees of project debt
The Company may agree to provide financial assistance to the subsidiary entities through which it carries on its activities. Such financial assistance may include the provision of payment guarantees to a project entity’s lenders of acquisition financing, construction debt or long-term financing, and the provision of construction completion guarantees. Such guarantees may be joint or several with other partners in a particular investment. The Company’s and its partners’ guarantees of project-level obligations may not be in proportion to their respective investments in the project entity. The provision of such guarantees may reduce the Company’s capacity to borrow funds under its separate credit facilities, which may impact its ability to finance its operations. If such guarantees are called upon for payment or performance, they may have a negative impact on the Company’s cash position and financial performance. If the Company provides a joint guarantee with an investment partner, a default by the partner in its payment or performance obligation under the guarantee could cause the Company to pay a disproportionate amount in satisfaction of the guarantee, which may have a negative impact on the Company’s cash position and financial performance.
Operational and credit risks
On a strategic and selective basis, we and our for-sale housing investment vehicles provide financing to develop properties. The residential real estate development business involves significant risks that could adversely affect performance, including: the developer may not be able to complete construction on schedule or within budget, resulting in increased debt service expense and construction costs and delays in selling the properties; the developer may not be able to obtain, or may experience delays in obtaining, all necessary zoning, land-use, building, occupancy and other governmental permits and authorizations for the properties; the developer may not be able to sell properties on favorable terms or at all; construction costs, total investment amounts and the Company's or investment vehicle’s share of remaining funding may exceed our estimates; and projects may not be completed and delivered as planned. The Company endeavors to minimize operational losses in this area by ensuring that effective infrastructure and controls exist. These controls are constantly reviewed and improvements are implemented, if deemed necessary; however, they do not guarantee that the Company’s financial or operational results will not be negatively impacted.
| | | | | |
|
MANAGEMENT'S DISCUSSION AND ANALYSIS
FOR THE YEAR ENDED DECEMBER 31, 2021 |
Our for-sale housing investments are made through the financing of local developers, including Johnson, and, consequently, we rely to a great extent on those developers to successfully manage their development projects. Furthermore, given the Company’s majority interest in Johnson, we rely on Johnson’s ability to execute on portions of our for-sale housing business strategy. Investments in partnerships, joint ventures or other entities may involve risks not present were a third party not involved, including the possibility that the development partners might become bankrupt or otherwise fail to fund their share of required capital contributions. Additionally, the development partners might at any time have economic or other business interests or goals which are inconsistent with our business interests or goals. In addition, we do not have sole control of certain important decisions relating to these development properties, including decisions relating to: the sale of the development properties; refinancing; timing and amount of distributions of cash from such development properties; and capital improvements. Any of these factors could negatively impact the value of our investments and our financial condition and performance.
Capital commitment
The third-party investors in Tricon’s investment vehicles comprise a relatively small group of reputable, primarily institutional, investors. To date, each of these investors has met its commitments on called capital and we have received no indications that any investor will be unable to meet its capital commitments in the future. While our experience with our investors suggests that commitments will be honored, and notwithstanding the adverse consequences to a defaulting investor under the terms of the applicable investment vehicle, no assurances can be given that an investor will meet its entire commitment over the life of an investment vehicle. A failure by one or more investors to satisfy a drawdown request could impair an investment vehicle’s ability to fully finance its investment, which could have a material adverse effect on the performance and value of that investment, which in turn could negatively impact the Company’s financial condition and performance.
| | | | | |
|
MANAGEMENT'S DISCUSSION AND ANALYSIS
FOR THE YEAR ENDED DECEMBER 31, 2021 |
8. Historical financial information
The following tables shows selected IFRS measures for the past eight quarters. The comparative period results have been recast in conformity with the current period presentation to show the results from the U.S. multi-family rental subsidiary as discontinued operations separate from the Company's continuing operations.
| | | | | | | | | | | | | | | | |
| For the three months ended | | | | | | |
| (in thousands of U.S. dollars, except per share amounts which are in U.S. dollars) | December 31, 2021 | September 30, 2021 | June 30, 2021 | March 31, 2021 | | |
| | | | | | |
| Financial statement results | | | | | | |
| Net operating income from single-family rental properties from continuing operations | $ | 83,355 | | $ | 75,704 | | $ | 70,744 | | $ | 66,172 | | | |
| Total revenue from continuing operations | 141,049 | | 124,949 | | 119,034 | | 107,404 | | | |
| Net income from continuing operations | 126,977 | | 201,886 | | 146,322 | | 41,904 | | | |
| Net loss from discontinued operations | — | | — | | — | | (67,562) | | | |
| Net income (loss) | 126,977 | | 201,886 | | 146,322 | | (25,658) | | | |
| Basic earnings per share from continuing operations | 0.47 | | 0.93 | | 0.73 | | 0.21 | | | |
| Basic loss per share from discontinued operations | — | | — | | — | | (0.34) | | | |
| Basic earnings (loss) per share | 0.47 | | 0.93 | | 0.73 | | (0.13) | | | |
| Diluted earnings per share from continuing operations | 0.46 | | 0.92 | | 0.72 | | 0.21 | | | |
| Diluted loss per share from discontinued operations | — | | — | | — | | (0.35) | | | |
| Diluted earnings (loss) per share | 0.46 | | 0.92 | | 0.72 | | (0.14) | | | |
| | | | | | | | | | | | | | | |
| For the three months ended | | | | | |
| (in thousands of U.S. dollars, except per share amounts which are in U.S. dollars) | December 31, 2020 | September 30, 2020 | June 30, 2020 | March 31, 2020 | |
| | | | | |
| Financial statement results | | | | | |
| Net operating income from single-family rental properties from continuing operations | $ | 63,719 | | $ | 62,753 | | $ | 61,248 | | $ | 58,020 | | |
| Total revenue from continuing operations | 104,739 | | 101,545 | | 99,302 | | 95,486 | | |
| Net income (loss) from continuing operations | 75,808 | | 53,197 | | 30,165 | | (46,533) | | |
| Net income (loss) from discontinued operations | 5,670 | | 4,902 | | (12,824) | | 6,028 | | |
| Net income (loss) | 81,478 | | 58,099 | | 17,341 | | (40,505) | | |
| Basic earnings (loss) per share from continuing operations | 0.38 | | 0.27 | | 0.16 | | (0.24) | | |
| Basic earnings (loss) per share from discontinued operations | 0.03 | | 0.03 | | (0.07) | | 0.03 | | |
| Basic earnings (loss) per share | 0.41 | | 0.30 | | 0.09 | | (0.21) | | |
| Diluted earnings (loss) per share from continuing operations | 0.36 | | 0.21 | | 0.16 | | (0.24) | | |
| Diluted earnings (loss) per share from discontinued operations | 0.03 | | 0.02 | | (0.07) | | 0.03 | | |
| Diluted earnings (loss) per share | 0.39 | | 0.23 | | 0.09 | | (0.21) | | |
| | | | | |
Over the past couple of years, the Company’s single-family rental business benefited from a number of trends that have been accelerated by the COVID-19 pandemic, including in-migration and strong population growth in U.S. Sun Belt markets, favorable demographic shifts driving new household formation, as well as a shift towards work-from-home employment with families prioritizing larger living spaces. Meanwhile, the supply of new housing was constrained by ongoing challenges related to securing entitlements for new lots and by a shortage of labor and materials, including pandemic-related supply chain bottlenecks. This imbalance in supply and demand has contributed to rising home prices and higher down payments required for homebuyers, which in turn has made homeownership less attainable for some families and increased demand for rental homes.
| | | | | |
|
MANAGEMENT'S DISCUSSION AND ANALYSIS
FOR THE YEAR ENDED DECEMBER 31, 2021 |
The following tables show selected IFRS measures for the past three years.
| | | | | | | | | | | | |
| For the twelve months ended | | | | |
| (in thousands of U.S. dollars, except per share amounts which are in U.S. dollars, unless otherwise indicated) | December 31, 2021 | December 31, 2020 | December 31, 2019 | |
| | | | |
| Financial statement results | | | | |
Total revenue (1) | $ | 492,436 | | $ | 401,072 | | $ | 39,895 | | |
| Net income | 449,527 | | 116,413 | | 114,135 | | |
| Basic earnings per share | 2.03 | | 0.58 | | 0.65 | | |
| Diluted earnings per share | 2.00 | | 0.58 | | 0.63 | | |
Dividends per share (2) | $ | 0.23 | | C$ | 0.28 | | C$ | 0.28 | | |
(1) For the year ended December 31, 2019, excludes investment income recognized under Investment Entity accounting.
(2) Prior to November 8, 2021, dividends were declared and paid in Canadian dollars. Dividends paid in Canadian dollars were translated to U.S dollars using the daily exchange rate on the applicable dividend record date.
| | | | | | | | | | | |
| (in thousands of U.S. dollars) | December 31, 2021 | December 31, 2020 | December 31, 2019 |
| | | |
| Total assets | $ | 9,148,617 | | $ | 7,174,834 | | $ | 2,302,289 | |
| Debt | 3,917,433 | | 4,137,506 | | 470,553 | |
The following factors have caused material changes to the Company's financial results over the past three years:
•Tricon's single-family rental portfolio grew by 39% from 21,014 homes as at December 31, 2019 to 29,149 homes as at December 31, 2021. The fair value of the single-family rental portfolio grew by 84% from $4.3 billion as at December 31, 2019 to $8.0 billion as at December 31, 2021.
•On June 11, 2019, the Company completed the acquisition of Starlight U.S. Multi-Family (No. 5) Core Fund (the “U.S. multi-family rental portfolio”), thus establishing a new U.S. multi-family platform for Tricon. The acquisition of the portfolio, which consists of 23 properties totaling 7,289 units in 13 major markets, increased the value of Tricon's rental portfolio by $1.3 billion and contributed $111.2 million of rental revenue for the year ended December 31, 2020.
•In January 2020, the Company completed its transition to an owner and operator of diversified rental housing, resulting in the Company determining that it no longer meets the criteria for being an investment entity under IFRS 10. As a result, the Company began consolidating the financial results of controlled subsidiaries including those holding its investments in single-family rental homes and U.S. multi-family rental properties, resulting in the inclusion of these subsidiaries’ assets, liabilities and non-controlling interests in the balance sheet of the Company on a prospective basis in accordance with the relevant guidance of IFRS 10.
•On March 31, 2021, the Company sold an 80% interest in its U.S. multi-family rental portfolio to two institutional investors for net cash consideration of $431.6 million, and recognized its remaining 20% interest at fair value on the transaction date and proceeded to account for it as an equity-accounted investment. As a result, the Company recognized a loss of $84.4 million for the three months ended March 31, 2021, which includes $79.1 million related to derecognition of goodwill related to the portfolio. In accordance with IFRS 5, the Company reclassified the current- and prior-period results and cash flows of the U.S. multi-family portfolio as discontinued operations separate from the Company's continuing operations.
•On May 10, 2021, the Company announced a new joint venture ("SFR JV-HD") with two leading institutional investors to acquire up to 5,000 newly built single-family rental homes from national and regional homebuilders. The joint venture has committed capital of up to $450 million, for a total purchasing potential of up to $1.5 billion including associated leverage. On July 19, 2021, the Company announced another new joint venture ("SFR JV-2") with three institutional investors to acquire over 18,000 existing single-family rental homes targeting the middle-market demographic in the U.S. Sun Belt. The joint venture has committed capital of up to $1.55 billion, for a total purchasing potential of up to $5 billion including associated leverage. Since the launch of the joint
| | | | | |
|
MANAGEMENT'S DISCUSSION AND ANALYSIS
FOR THE YEAR ENDED DECEMBER 31, 2021 |
ventures, the Company's single-family rental portfolio has grown by approximately 4,400 homes or $1.4 billion in value.
•On October 7, 2021, the Company’s common shares were listed for trading on the New York Stock Exchange. On October 12, 2021, the Company closed a public offering and concurrent private placement of common shares resulting in a total issuance of 46,248,746 common shares for aggregate gross proceeds of $570.3 million, and net proceeds of $547.6 million after taking into account underwriters' fees and other equity issuance costs partially offset by deferred tax recoveries.
| | | | | |
|
MANAGEMENT'S DISCUSSION AND ANALYSIS
FOR THE YEAR ENDED DECEMBER 31, 2021 |
7 St. Thomas Street, Suite 801 Toronto, Ontario M5S 2B7
T 416-925-7228 F 416-925-7964 www.triconresidential.com
| | | | | |
|
MANAGEMENT'S DISCUSSION AND ANALYSIS
FOR THE YEAR ENDED DECEMBER 31, 2021 |
Appendix A - Reconciliations
Management considers NOI, NOI margin, Core FFO, Core FFO per share, AFFO and AFFO per share to be key measures of the Company's operating performance (see Section 6 for definitions and page 1 for discussion of non-IFRS measures).
RECONCILIATION OF NET INCOME TO FFO, CORE FFO AND AFFO
| | | | | | | | | | | | | | | | | | | | | | | |
| For the periods ended December 31 | Three months | | Twelve months |
| (in thousands of U.S. dollars) | 2021 | 2020 | Variance | | 2021 | 2020 | Variance |
| | | | | | | |
| Net income from continuing operations attributable to Tricon's shareholders | $ | 125,122 | | $ | 74,008 | | $ | 51,114 | | | $ | 512,817 | | $ | 109,546 | | $ | 403,271 | |
| | | | | | | |
| Fair value gain on rental properties | (261,676) | | (106,995) | | (154,681) | | | (990,575) | | (220,849) | | (769,726) | |
| Fair value gain on Canadian development properties | (10,098) | | — | | (10,098) | | | (10,098) | | — | | (10,098) | |
| Fair value loss on derivative financial instruments and other liabilities | 72,783 | | 16,418 | | 56,365 | | | 220,177 | | 7,461 | | 212,716 | |
| Loss from investments in U.S. residential developments | — | | — | | — | | | — | | 79,579 | | (79,579) | |
| Limited partners' share of FFO adjustments | 41,720 | | 12,204 | | 29,516 | | | 171,498 | | 30,388 | | 141,110 | |
| FFO attributable to Tricon's shareholders | $ | (32,149) | | $ | (4,365) | | $ | (27,784) | | | $ | (96,181) | | $ | 6,125 | | $ | (102,306) | |
| | | | | | | |
| Core FFO from U.S. and Canadian multi-family rental | 2,318 | | 7,199 | | (4,881) | | | 13,805 | | 27,977 | | (14,172) | |
| Income from equity-accounted investments in multi-family rental properties | (33,961) | | (427) | | (33,534) | | | (75,333) | | (746) | | (74,587) | |
| Income from equity-accounted investments in Canadian residential developments | (10,085) | | (8,293) | | (1,792) | | | (8,200) | | (13,378) | | 5,178 | |
| Deferred tax expense | 53,507 | | 32,188 | | 21,319 | | | 234,483 | | 41,824 | | 192,659 | |
| Current tax impact on sale of U.S. multi-family rental portfolio | — | | — | | — | | | (44,502) | | — | | (44,502) | |
| Interest on convertible debentures | — | | 2,506 | | (2,506) | | | 6,732 | | 9,927 | | (3,195) | |
| Interest on Due to Affiliate | 4,312 | | 4,312 | | — | | | 17,250 | | 5,654 | | 11,596 | |
| Amortization of deferred financing costs, discounts and lease obligations | 3,917 | | 3,730 | | 187 | | | 16,571 | | 10,922 | | 5,649 | |
Equity-based, non-cash and non-recurring compensation (1),(2) | 56,050 | | 2,222 | | 53,828 | | | 66,262 | | 8,719 | | 57,543 | |
Other adjustments (3) | 1,721 | | 2,358 | | (637) | | | 21,134 | | 16,193 | | 4,941 | |
| Core FFO attributable to Tricon's shareholders | $ | 45,630 | | $ | 41,430 | | $ | 4,200 | | | $ | 152,021 | | $ | 113,217 | | $ | 38,804 | |
| | | | | | | |
Recurring capital expenditures (4) | (9,082) | | (7,445) | | (1,637) | | | (30,427) | | (27,875) | | (2,552) | |
| AFFO attributable to Tricon's shareholders | $ | 36,548 | | $ | 33,985 | | $ | 2,563 | | | $ | 121,594 | | $ | 85,342 | | $ | 36,252 | |
| | | | | | | |
| | | | | | | |
| | | | | | | |
| | | | | | | |
Core FFO payout ratio (5) | 35% | 26% | 9% | | 33% | 35% | (2)% |
AFFO payout ratio (5) | 43% | 31% | 12% | | 42% | 47% | (5)% |
| | | | | | | |
| Weighted average shares outstanding - diluted | 306,247,538 | 247,739,665 | 58,507,873 | | 268,562,442 | 223,849,152 | 44,713,290 |
(1) Includes performance fees expense, which is accrued based on changes in the unrealized carried interest liability of the underlying Investment Vehicles and hence is added back to Core FFO as a non-cash expense. Performance fees are paid and deducted in arriving at Core FFO only when the associated fee revenue has been realized. For the three and twelve months ended December 31, 2021, the Company paid $196 of performance fees (2020 - nil), which is netted from the adjustment for equity-based, non-cash and non-recurring compensation.
(2) Performance share unit (PSU) expense of $1,520 and $3,633 for the three and twelve months ended December 31, 2020, respectively, have been removed from Core FFO to conform with the current period presentation. This change resulted in a $1,520 and $3,633 increase in Core FFO and AFFO for the three and twelve months ended December 31, 2020, respectively.
(3) Includes the following adjustments:
| | | | | |
|
MANAGEMENT'S DISCUSSION AND ANALYSIS
FOR THE YEAR ENDED DECEMBER 31, 2021 |
| | | | | | | | | | | | | | | | | | | | | | | |
| For the periods ended December 31 | Three months | | Twelve months |
| (in thousands of U.S. dollars) | 2021 | 2020 | Variance | | 2021 | 2020 | Variance |
| | | | | | | |
| Transaction costs | $ | 3,830 | | $ | 1,986 | | $ | 1,844 | | | $ | 13,260 | | $ | 11,607 | | $ | 1,653 | |
| Loss on debt extinguishment | — | | — | | — | | | 3,497 | | — | | 3,497 | |
| Amortization and depreciation expense | 2,818 | | 2,608 | | 210 | | | 12,129 | | 10,826 | | 1,303 | |
| Realized and unrealized foreign exchange loss (gain) | 407 | | (948) | | 1,355 | | | 2,934 | | 170 | | 2,764 | |
| Lease payments on right-of-use assets | (643) | | (569) | | (74) | | | (2,466) | | (2,415) | | (51) | |
| Core FFO adjustments to income from investments in U.S. residential developments | 401 | | 1,252 | | (851) | | | 827 | | 993 | | (166) | |
| Non-controlling interest's share of Core FFO adjustments | (219) | | 512 | | (731) | | | (1,056) | | (651) | | (405) | |
| Other non-recurring adjustments | (3,459) | | (1,774) | | (1,685) | | | (3,459) | | (1,774) | | (1,685) | |
| Limited partners' share of Core FFO adjustments | (1,414) | | (709) | | (705) | | | (4,532) | | (2,563) | | (1,969) | |
| Total other adjustments | $ | 1,721 | | $ | 2,358 | | $ | (637) | | | $ | 21,134 | | $ | 16,193 | | $ | 4,941 | |
(4) Recurring capital expenditures represent ongoing costs associated with maintaining and preserving the quality of a property after it has been renovated. Capital expenditures related to renovations or value-enhancement are excluded from recurring capital expenditures.
(5) Core FFO and AFFO payout ratios are computed by dividing dividends declared for the period by Core FFO and AFFO, respectively. Prior to November 8, 2021, dividends were declared and paid in Canadian dollars; for reporting purposes amounts recorded in equity were translated to U.S. dollars using the daily exchange rate on the applicable dividend record date.
RECONCILIATION OF RECURRING SINGLE-FAMILY RENTAL PROPORTIONATE CAPITAL EXPENDITURES TO CONSOLIDATED PORTFOLIO CAPITAL EXPENDITURES BY PERIOD
| | | | | | | | | | | | | | | | | | | | | | | | | | | | | |
(in thousands of U.S. dollars) | | Q4 2021 | Q3 2021 | Q2 2021 | Q1 2021 | Q4 2020 | Q3 2020 | Q2 2020 | Q1 2020 |
| | | | | | | | | |
| | | | | | | | | |
| | | | | | | | | |
| Recurring capital expenditures, proportionate total portfolio | (A) | $ | 8,259 | $ | 6,750 | $ | 6,950 | $ | 5,303 | $ | 5,550 | $ | 6,392 | $ | 4,958 | $ | 5,562 |
| Up-front renovation and value-enhancing capital expenditures, proportionate total portfolio | | 24,915 | 26,189 | 19,359 | 15,983 | 15,517 | 8,545 | 8,680 | 11,665 |
| Total capital expenditures, proportionate total portfolio | | 33,174 | 32,939 | 26,309 | 21,286 | 21,067 | 14,937 | 13,638 | 17,227 |
Limited partners' share of capital expenditures(1) | | 39,516 | 19,629 | 12,746 | 10,973 | 10,753 | 4,063 | 3,696 | 8,187 |
Total capital expenditures
by period | | $ | 72,690 | $ | 52,568 | $ | 39,055 | $ | 32,259 | $ | 31,820 | $ | 19,000 | $ | 17,334 | $ | 25,414 |
(1) Represents the limited partners' interest of the capital expenditures in SFR JV-1, SFR JV-2 and SFR JV-HD.
RECONCILIATION OF SINGLE-FAMILY RENTAL TOTAL PORTFOLIO RECURRING CAPITAL EXPENDITURES TO RECURRING CAPITAL EXPENDITURES IN AFFO
| | | | | | | | | | | | | | | | | | | | | | | | | | | | | |
(in thousands of U.S. dollars) | | Q4 2021 | Q3 2021 | Q2 2021 | Q1 2021 | Q4 2020 | Q3 2020 | Q2 2020 | Q1 2020 |
| | | | | | | | | |
| Recurring capital expenditures, single-family rental proportionate total portfolio | (A) | $ | 8,259 | $ | 6,750 | $ | 6,950 | $ | 5,303 | $ | 5,550 | $ | 6,392 | $ | 4,958 | $ | 5,562 |
| Recurring capital expenditures from adjacent residential businesses | | 823 | 390 | 550 | 1,402 | 1,895 | 1,512 | 925 | 1,081 |
| Recurring capital expenditures in AFFO | | $ | 9,082 | $ | 7,140 | $ | 7,500 | $ | 6,705 | $ | 7,445 | $ | 7,904 | $ | 5,883 | $ | 6,643 |
| | | | | |
|
MANAGEMENT'S DISCUSSION AND ANALYSIS
FOR THE YEAR ENDED DECEMBER 31, 2021 |
RECONCILIATION OF QUARTERLY CONSOLIDATED CAPITAL EXPENDITURES TO CONSOLIDATED SINGLE FAMILY RENTAL PROPERTIES
| | | | | | | | | | | |
| (in thousands of U.S. dollars) | December 31, 2021 | | December 31, 2020 |
| | | |
| Opening balance | $ | 4,990,542 | | | $ | 4,337,681 | |
| Acquisitions | 1,835,235 | | | 356,514 | |
| Total capital expenditures by period | | | |
| Q1 | 32,259 | | | 25,414 | |
| Q2 | 39,055 | | | 17,334 | |
| Q3 | 52,568 | | | 19,000 | |
| Q4 | 72,690 | | | 31,820 | |
| Total capital expenditures | 196,572 | | | 93,568 | |
| | | |
| Fair value adjustments | 990,575 | | | 220,849 | |
| Dispositions | (34,528) | | | (18,070) | |
| Single-family rental properties balance per the financial statements, end of year | $ | 7,978,396 | | | $ | 4,990,542 | |
RECONCILIATION OF SINGLE-FAMILY RENTAL TOTAL AND SAME HOME NOI
| | | | | | | | | | | | | | | | | |
| For the periods ended December 31 | Three months | | Twelve months |
(in thousands of U.S. dollars) | 2021 | 2020 | | 2021 | 2020 |
| | | | | |
Net operating income (NOI), proportionate same home portfolio | $ | 50,602 | | $ | 45,881 | | | $ | 194,292 | | $ | 181,176 | |
Net operating income (NOI), proportionate non-same home portfolio | 8,752 | | 4,595 | | | 27,363 | | 16,352 | |
Net operating income (NOI), proportionate total portfolio | 59,354 | | 50,476 | | | 221,655 | | 197,528 | |
Limited partners' share of NOI(1) | 24,001 | | 13,243 | | | 74,320 | | 48,212 | |
Net operating income from single-family rental properties per financial statements | $ | 83,355 | | $ | 63,719 | | | $ | 295,975 | | $ | 245,740 | |
(1) Represents the limited partners' interest in the NOI from SFR JV-1, SFR JV-2 and SFR JV-HD.
RECONCILIATION OF U.S. MULTI-FAMILY RENTAL NOI
| | | | | | | | | | | | | | | | | |
| For the periods ended December 31 | Three months | | Twelve months |
(in thousands of U.S. dollars) | 2021 | 2020 | | 2021 | 2020 |
| | | | | |
| Net operating income (NOI), proportionate portfolio | $ | 3,916 | | $ | — | | | $ | 14,266 | | $ | — | |
| Less: net operating income (NOI) in discontinued operations | — | | — | | | (3,245) | | — | |
| Interest expense, proportionate portfolio | (1,388) | | — | | | (4,150) | | — | |
| Other expenses, proportionate portfolio | (426) | | — | | | (2,005) | | — | |
| Fair value gain on multi-family rental properties, proportionate portfolio | 29,782 | | — | | | 68,212 | | — | |
Income from equity-accounted investments in U.S. multi-family rental properties per financial statements(1) | $ | 31,884 | | $ | — | | | $ | 73,078 | | $ | — | |
| | | | | |
Net operating income (NOI), proportionate portfolio(2) | $ | — | | $ | 3,248 | | | $ | 3,245 | | $ | 13,087 | |
Net operating income (NOI), IFRS reconciliation(2) | — | | 12,985 | | | 12,979 | | 52,351 | |
| Interest expense | — | | (8,077) | | | (7,845) | | (33,464) | |
| Other expenses | — | | (1,546) | | | (1,176) | | (7,067) | |
| Fair value loss on multi-family rental properties | — | | — | | | — | | (22,535) | |
Loss on sale (1) | — | | — | | | (84,427) | | — | |
Net income (loss) from discontinued operations before income taxes per financial statements(1) | $ | — | | $ | 6,610 | | | $ | (77,224) | | $ | 2,372 | |
(1) On March 31, 2021, the Company sold an 80% interest in its subsidiary, Tricon US Multi-Family REIT LLC, to two institutional investors. This resulted in net income from Tricon's U.S. multi-family rental business to be equity-accounted for starting on March 31, 2021 and classified as discontinued operations for all periods prior to that date. The loss on sale was mainly attributable to the derecognition of goodwill as described in Section 3.1. (2) The total NOI from discontinued operations represents 100% of Tricon's NOI before the syndication of the U.S. multi-family rental portfolio on March 31, 2021. Of the total balance, only 20% is presented in the comparative NOI in Section 4.2 to assist the reader with comparability.
| | | | | |
|
MANAGEMENT'S DISCUSSION AND ANALYSIS
FOR THE YEAR ENDED DECEMBER 31, 2021 |
RECONCILIATION OF CANADIAN MULTI-FAMILY RENTAL NOI
| | | | | | | | | | | | | | | | | |
| For the periods ended December 31 | Three months | | Twelve months |
(in thousands of U.S. dollars) | 2021 | 2020 | | 2021 | 2020 |
| | | | | |
| Net operating income (NOI), proportionate portfolio | $ | 261 | | $ | 220 | | | $ | 885 | | $ | 927 | |
Other (expenses) income, proportionate portfolio(1) | (268) | | 207 | | | (714) | | (181) | |
| Fair value gain on multi-family rental property, proportionate portfolio | 2,084 | | — | | | 2,084 | | — | |
Income from equity-accounted investments in Canadian multi-family rental properties per financial statements | $ | 2,077 | | $ | 427 | | | $ | 2,255 | | $ | 746 | |
(1) Other income for the three months ended December 31, 2020 includes insurance proceeds related to water damage in a prior period.
RECONCILIATION OF PROPORTIONATE CASH GENERAL AND ADMINISTRATION EXPENSES
| | | | | | | | | | | | | | | | | | | | | | | |
| For the periods ended December 31 | Three months | | Twelve months |
| (in thousands of U.S. dollars) | 2021 | 2020 | Variance | | 2021 | 2020 | Variance |
| Proportionate cash general and administration expense | $ | 12,379 | | $ | 7,794 | | $ | 4,585 | | | $ | 36,147 | | $ | 31,254 | | $ | 4,893 | |
| Less: cash lease payments | (643) | | (569) | | (74) | | | (2,466) | | (2,415) | | (51) | |
| Proportionate general and administration expense | $ | 11,736 | | $ | 7,225 | | $ | 4,511 | | | $ | 33,681 | | $ | 28,839 | | $ | 4,842 | |
| Limited partners' share of general and administration expenses | 2,829 | | 1,417 | | 1,412 | | | 7,739 | | 5,396 | | 2,343 | |
| General and administration expense per financial statements | $ | 14,565 | | $ | 8,642 | | $ | 5,923 | | | $ | 41,420 | | $ | 34,235 | | $ | 7,185 | |
TOTAL ASSETS UNDER MANAGEMENT
| | | | | | | | | | | | | | | | | |
| December 31, 2021 | | December 31, 2020 |
| (in thousands of U.S. dollars) | Balance | % of total AUM | | Balance | % of total AUM |
| | | | | |
| Third-party AUM | $ | 6,816,668 | | 49.6 | % | | $ | 2,850,004 | | 32.2 | % |
| Principal AUM | 6,919,664 | | 50.4 | % | | 5,997,489 | | 67.8 | % |
| Total AUM | $ | 13,736,332 | | 100.0 | % | | $ | 8,847,493 | | 100.0 | % |
(1) The Company changed its definition of AUM in the current year in order to better align with the fair value of the assets comprising a portion of the AUM (refer to Section 6). The AUM in the comparative period has been recast to conform with the current period presentation. This change resulted in increases of $296,646 and $95,917 in third-party AUM and principal AUM, respectively, for a total increase of $392,563 in the total AUM as at December 31, 2020.