

|
(in thousands, except per share data) (Unaudited)
|
||||||||
|
FY 2024
|
FY2025
|
|||||||
|
31-Dec-24
|
31-Dec-25
|
|||||||
|
Net income attributable to CareTrust REIT, Inc.
|
$
|
125,080
|
$
|
320,538
|
||||
|
Real estate related depreciation and amortization
|
56,804
|
90,390
|
||||||
|
Noncontrolling interests' share of real estate related depreciation and amortization
|
(837
|
)
|
(10,408
|
)
|
||||
|
Impairment of real estate investments
|
42,225
|
2,483
|
||||||
|
Loss (gain) on sale of real estate, net
|
2,208
|
(31,548
|
)
|
|||||
|
FFO attributable to CareTrust REIT, Inc.
|
225,480
|
371,455
|
||||||
|
Write-off of deferred financing costs
|
354
|
-
|
||||||
|
Gain on foreign currency transactions, net
|
-
|
(4,012
|
)
|
|||||
|
Provision for loan losses
|
4,900
|
-
|
||||||
|
Accelerated amortization of lease intangibles, net of noncontrolling interests' share
|
-
|
(1,023
|
)
|
|||||
|
Property operating expenses (recoveries)
|
6,891
|
(174
|
)
|
|||||
|
Non-routine transaction costs
|
1,326
|
5,329
|
||||||
|
Loss on extinguishment of debt
|
657
|
390
|
||||||
|
Amortization of stock-based compensation related to extraordinary incentive plan
|
-
|
3,483
|
||||||
|
Extraordinary incentive plan payment
|
2,313
|
-
|
||||||
|
Qualifying retirement benefits
|
-
|
1,896
|
||||||
|
Other expenses
|
-
|
359
|
||||||
|
Other income, net of NCI share(1)
|
-
|
(2,171
|
)
|
|||||
|
Unrealized gain on other real estate related investments, net
|
(9,045
|
)
|
(15,831
|
)
|
||||
|
Normalized FFO attributable to CareTrust REIT, Inc.
|
$
|
232,876
|
$
|
359,701
|
||||
|
FFO per share attributable to CareTrust REIT, Inc.
|
$
|
1.45
|
$
|
1.82
|
||||
|
Normalized FFO per share attributable to CareTrust REIT, Inc.
|
$
|
1.50
|
$
|
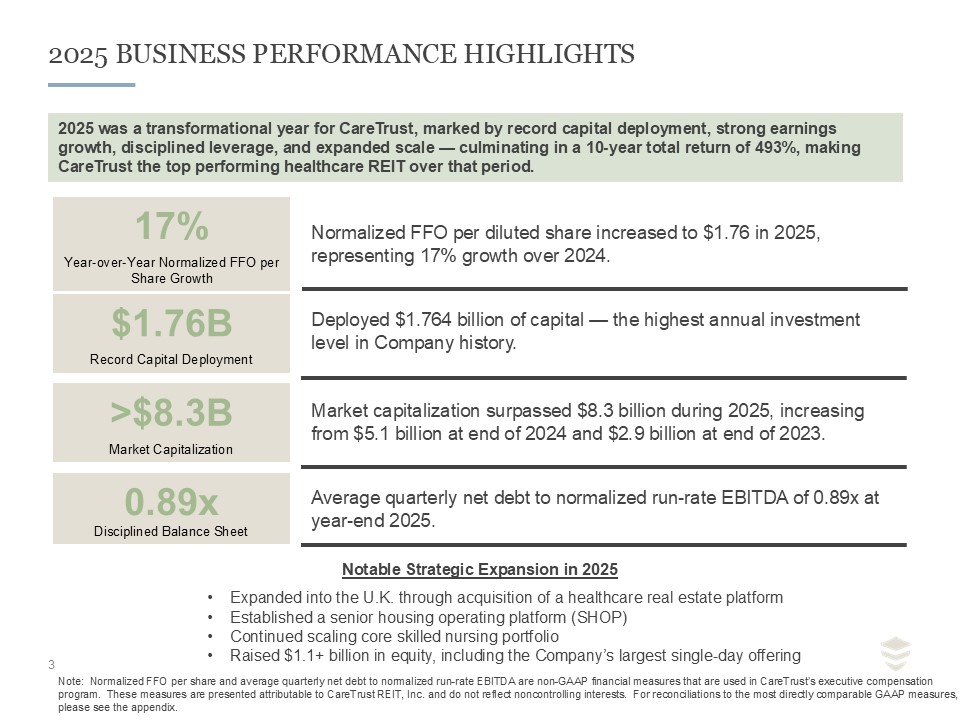
1.76
|
||||
|
Diluted weighted average shares outstanding (2)
|
155,325
|
204,351
|
||||||
|
(1) Other income, net of NCI share represents a fee received in connection with the release of a facility from a purchase agreement, net of commission fees paid.
|
||||||||
|
(2) For the periods presented, the diluted weighted average shares have been calculated using the treasury stock method.
|
||||||||

| (in thousands) (Unaudited) | ||||||||||||||||
|
Quarter Ended March 31, 2025
|
Quarter Ended June 30, 2025
|
Quarter Ended
September 30, 2025
|
Quarter Ended December 31, 2025
|
|||||||||||||
|
Net income attributable to CareTrust REIT, Inc.
|
65,802
|
68,545
|
74,901
|
111,290
|
||||||||||||
|
Depreciation and amortization
|
17,841
|
21,215
|
24,309
|
27,142
|
||||||||||||
|
Noncontrolling interests’ share of real estate related depreciation and amortization
|
(2,223
|
)
|
(2,513
|
)
|
(2,796
|
)
|
(2,876
|
)
|
||||||||
|
Interest expense
|
6,669
|
13,038
|
12,622
|
11,378
|
||||||||||||
|
Income tax expense
|
-
|
1,030
|
2,077
|
1,894
|
||||||||||||
|
Amortization of stock-based compensation
|
3,093
|
1,945
|
1,700
|
28
|
||||||||||||
|
Amortization of stock-based compensation related to extraordinary incentive plan
|
816
|
1,081
|
793
|
793
|
||||||||||||
|
EBITDA attributable to CareTrust REIT, Inc.
|
91,998
|
104,341
|
113,606
|
149,649
|
||||||||||||
|
Impairment of real estate investments
|
-
|
-
|
452
|
2,031
|
||||||||||||
|
(Gain) loss on foreign currency transactions, net
|
-
|
(4,413
|
)
|
298
|
103
|
|||||||||||
|
Property operating (recoveries) expenses
|
(105
|
)
|
1,090
|
402
|
(1,561
|
)
|
||||||||||
|
Gain on sale of real estate, net
|
(3,876
|
)
|
-
|
-
|
(27,672
|
)
|
||||||||||
|
Loss on extinguishment of debt
|
-
|
-
|
390
|
-
|
||||||||||||
|
Non-routine transaction costs
|
888
|
61
|
560
|
3,820
|
||||||||||||
|
Accelerated amortization of lease intangibles, net of noncontrolling interests’ share
|
-
|
-
|
(1,023
|
)
|
-
|
|||||||||||
|
Qualifying retirement benefits
|
-
|
-
|
-
|
1,896
|
||||||||||||
|
Other expenses
|
-
|
-
|
-
|
359
|
||||||||||||
|
Other income, net of NCI shares
|
-
|
-
|
-
|
(2,171
|
)
|
|||||||||||
|
Unrealized gain on other real estate related investments, net
|
(1,287
|
)
|
(1,968
|
)
|
(3,603
|
)
|
(8,973
|
)
|
||||||||
|
Normalized EBITDA attributable to CareTrust REIT, Inc.
|
87,618
|
99,111
|
111,082
|
117,481
|
||||||||||||
|
Full impact of annual investments(1)
|
82
|
10,126
|
615
|
2,747
|
||||||||||||
|
Normalized Run Rate EBITDA attributable to CareTrust REIT, Inc.
|
87,700
|
109,237
|
111,697
|
120,228
|
||||||||||||
|
Total Debt
|
825,000
|
1,161,990
|
900,000
|
900,000
|
||||||||||||
|
Cash, cash equivalents, restricted cash and escrow deposits on acquisitions of real estate
|
(667,101
|
)
|
(306,051
|
)
|
(712,480
|
)
|
(339,295
|
)
|
||||||||
|
Net proceeds from ATM forward(2)
|
-
|
-
|
-
|
(238,033
|
)
|
|||||||||||
|
Net Debt
|
157,899
|
855,939
|
187,520
|
322,672
|
||||||||||||
|
Annualized Normalized Run Rate EBITDA attributable to CareTrust REIT, Inc.(3)
|
350,800
|
436,948
|
446,788
|
480,912
|
||||||||||||
|
Net Debt to Annualized Normalized Run Rate EBITDA attributable to CareTrust REIT, Inc.(4)
|
0.5
|
x
|
2.0
|
x
|
0.4
|
x
|
0.7
|
x
|
||||||||
|
Average Quarterly Net Debt to Annualized Normalized Run Rate EBITDA attributable to CareTrust REIT, Inc. at December 31, 2025(5)
|
0.89
|
x
|
||||||||||||||
|
(1)
|
Quarterly adjustments give effect to the investments completed and loans receivable pay downs during the three months ended for the respective period as though such investments and repayments were
completed as of the beginning of the period.
|
|
(2)
|
Assumes the net proceeds from the future expected settlement of shares sold under equity forward contracts through the Company's ATM program reduces outstanding debt and assumes the shares were issued.
|
|
(3)
|
Annualized Normalized Run Rate EBITDA attributable to CareTrust REIT, Inc. is calculated as Normalized Run Rate EBITDA attributable to CareTrust REIT, Inc. for the quarter multiplied by four (4).
|
|
(4)
|
Net Debt to Annualized Normalized Run Rate EBITDA attributable to CareTrust REIT, Inc. compares net debt as of the last day of the quarter to the Annualized Normalized Run Rate EBITDA attributable to
CareTrust REIT, Inc. for the quarter.
|
|
(5)
|
Average Quarterly Net Debt to Annualized Normalized Run Rate EBITDA attributable to CareTrust REIT, Inc. at December 31, 2025 is calculated by taking the weighted average of the Net Debt to Annualized
Normalized Run Rate EBITDA attributable to CareTrust REIT, Inc. for the four quarters in the year ended December 31, 2025.
|
