
3Q 2017
Earnings
Presentation
November 9, 2017
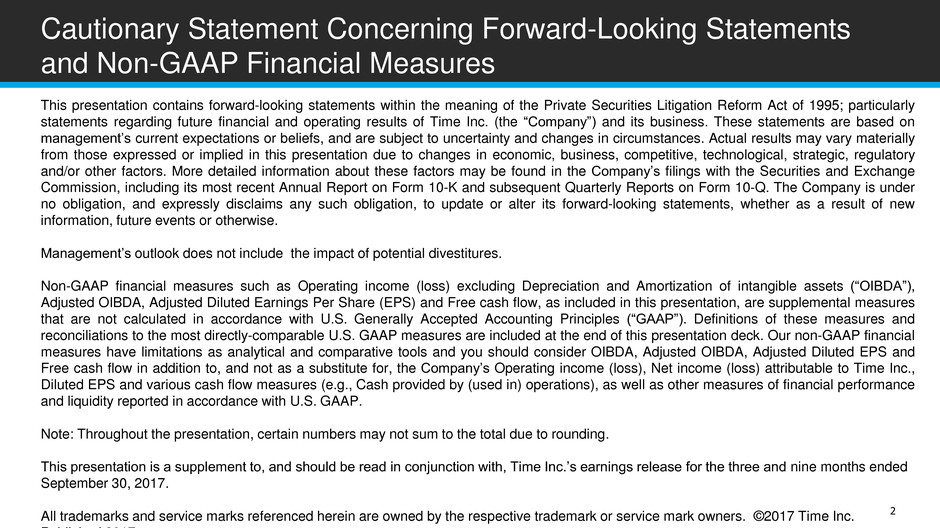
This presentation contains forward-looking statements within the meaning of the Private Securities Litigation Reform Act of 1995; particularly
statements regarding future financial and operating results of Time Inc. (the ―Company‖) and its business. These statements are based on
management’s current expectations or beliefs, and are subject to uncertainty and changes in circumstances. Actual results may vary materially
from those expressed or implied in this presentation due to changes in economic, business, competitive, technological, strategic, regulatory
and/or other factors. More detailed information about these factors may be found in the Company’s filings with the Securities and Exchange
Commission, including its most recent Annual Report on Form 10-K and subsequent Quarterly Reports on Form 10-Q. The Company is under
no obligation, and expressly disclaims any such obligation, to update or alter its forward-looking statements, whether as a result of new
information, future events or otherwise.
Management’s outlook does not include the impact of potential divestitures.
Non-GAAP financial measures such as Operating income (loss) excluding Depreciation and Amortization of intangible assets (―OIBDA‖),
Adjusted OIBDA, Adjusted Diluted Earnings Per Share (EPS) and Free cash flow, as included in this presentation, are supplemental measures
that are not calculated in accordance with U.S. Generally Accepted Accounting Principles (―GAAP‖). Definitions of these measures and
reconciliations to the most directly-comparable U.S. GAAP measures are included at the end of this presentation deck. Our non-GAAP financial
measures have limitations as analytical and comparative tools and you should consider OIBDA, Adjusted OIBDA, Adjusted Diluted EPS and
Free cash flow in addition to, and not as a substitute for, the Company’s Operating income (loss), Net income (loss) attributable to Time Inc.,
Diluted EPS and various cash flow measures (e.g., Cash provided by (used in) operations), as well as other measures of financial performance
and liquidity reported in accordance with U.S. GAAP.
Note: Throughout the presentation, certain numbers may not sum to the total due to rounding.
This presentation is a supplement to, and should be read in conjunction with, Time Inc.’s earnings release for the three and nine months ended
September 30, 2017.
All trademarks and service marks referenced herein are owned by the respective trademark or service mark owners. ©2017 Time Inc.
Published 2017.
2
Cautionary Statement Concerning Forward-Looking Statements
and Non-GAAP Financial Measures
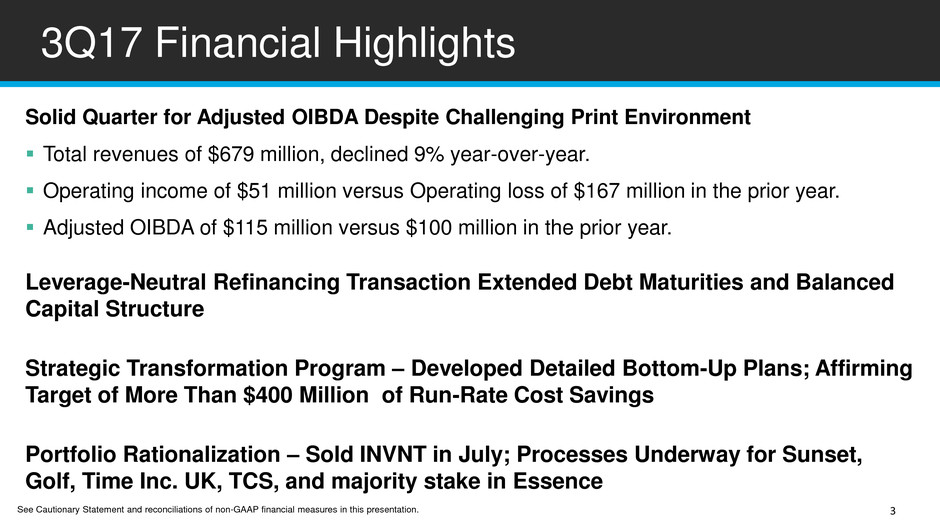
Solid Quarter for Adjusted OIBDA Despite Challenging Print Environment
Total revenues of $679 million, declined 9% year-over-year.
Operating income of $51 million versus Operating loss of $167 million in the prior year.
Adjusted OIBDA of $115 million versus $100 million in the prior year.
Leverage-Neutral Refinancing Transaction Extended Debt Maturities and Balanced
Capital Structure
Strategic Transformation Program – Developed Detailed Bottom-Up Plans; Affirming
Target of More Than $400 Million of Run-Rate Cost Savings
Portfolio Rationalization – Sold INVNT in July; Processes Underway for Sunset,
Golf, Time Inc. UK, TCS, and majority stake in Essence
3Q17 Financial Highlights
3 See Cautionary Statement and reconciliations of non-GAAP financial measures in this presentation.
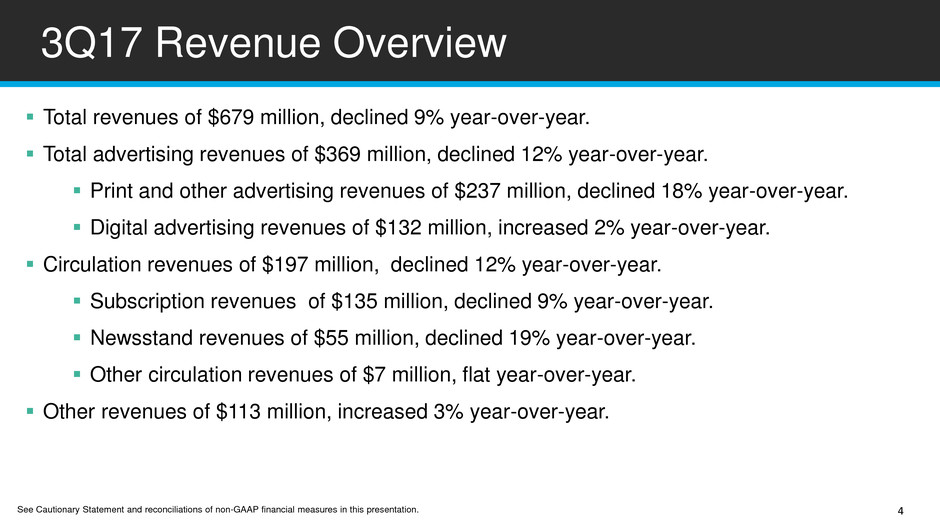
Total revenues of $679 million, declined 9% year-over-year.
Total advertising revenues of $369 million, declined 12% year-over-year.
Print and other advertising revenues of $237 million, declined 18% year-over-year.
Digital advertising revenues of $132 million, increased 2% year-over-year.
Circulation revenues of $197 million, declined 12% year-over-year.
Subscription revenues of $135 million, declined 9% year-over-year.
Newsstand revenues of $55 million, declined 19% year-over-year.
Other circulation revenues of $7 million, flat year-over-year.
Other revenues of $113 million, increased 3% year-over-year.
3Q17 Revenue Overview
4 See Cautionary Statement and reconciliations of non-GAAP financial measures in this presentation.
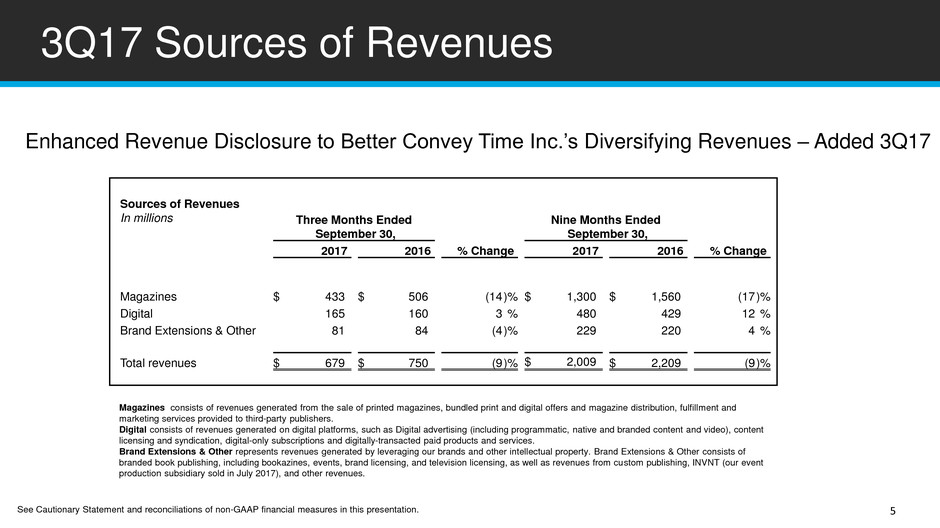
3Q17 Sources of Revenues
Sources of Revenues
In millions Three Months Ended
September 30,
Nine Months Ended
September 30,
2017 2016 % Change 2017 2016 % Change
Magazines $ 433
$ 506
(14 )% $ 1,300
$ 1,560
(17 )%
Digital 165 160 3 % 480 429 12 %
Brand Extensions & Other 81 84 (4 )% 229 220 4 %
Total revenues $ 679 $ 750 (9 )% $ 2,009 $ 2,209 (9 )%
Enhanced Revenue Disclosure to Better Convey Time Inc.’s Diversifying Revenues – Added 3Q17
Magazines consists of revenues generated from the sale of printed magazines, bundled print and digital offers and magazine distribution, fulfillment and
marketing services provided to third-party publishers.
Digital consists of revenues generated on digital platforms, such as Digital advertising (including programmatic, native and branded content and video), content
licensing and syndication, digital-only subscriptions and digitally-transacted paid products and services.
Brand Extensions & Other represents revenues generated by leveraging our brands and other intellectual property. Brand Extensions & Other consists of
branded book publishing, including bookazines, events, brand licensing, and television licensing, as well as revenues from custom publishing, INVNT (our event
production subsidiary sold in July 2017), and other revenues.
See Cautionary Statement and reconciliations of non-GAAP financial measures in this presentation. 5
$326 $293
$326
$279
Costs of Revenues (COR)
Selling, General & Administrative Expenses (SG&A)
3Q17 Costs of Revenues and SG&A Expenses
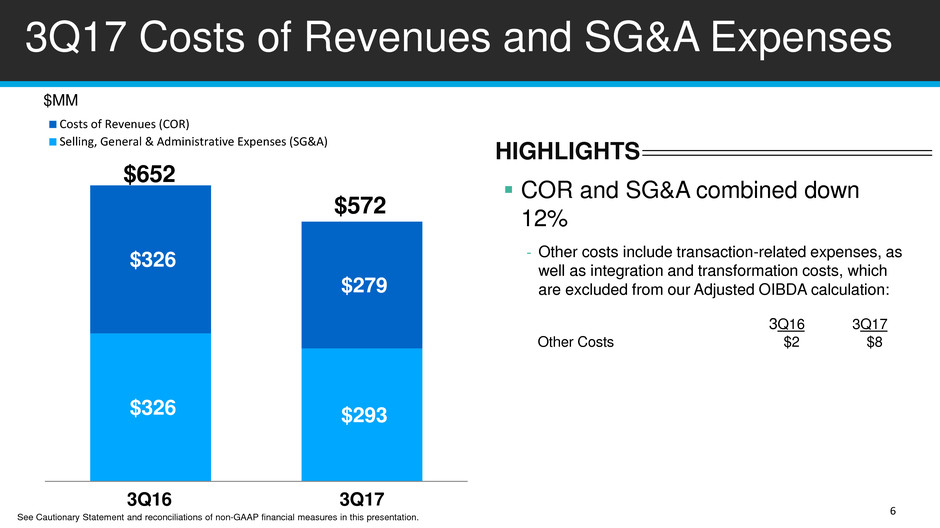
COR and SG&A combined down
12%
- Other costs include transaction-related expenses, as
well as integration and transformation costs, which
are excluded from our Adjusted OIBDA calculation:
3Q16 3Q17
Other Costs $2 $8
$572
$652
HIGHLIGHTS
3Q16 3Q17
$MM
See Cautionary Statement and reconciliations of non-GAAP financial measures in this presentation.
6
1 2
3Q17 Adjusted OIBDA & Adjusted EPS
$100
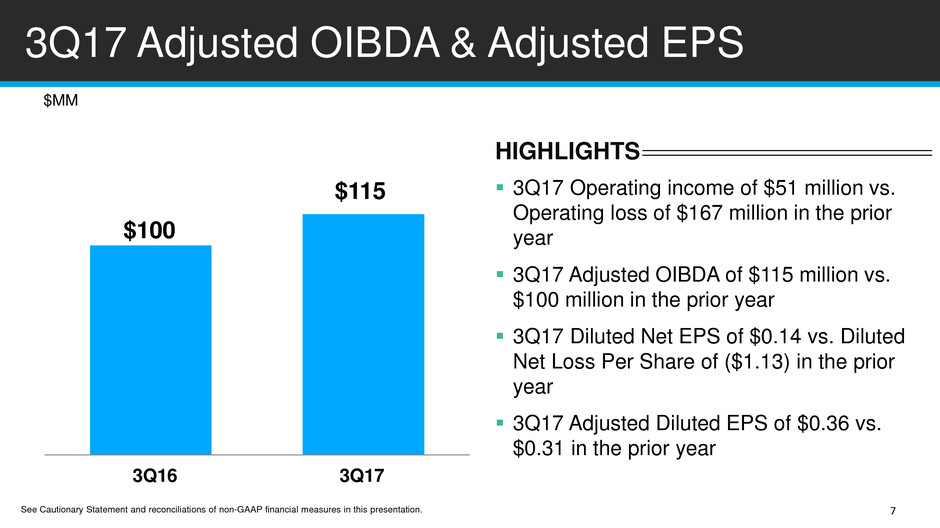
$115 3Q17 Operating income of $51 million vs.
Operating loss of $167 million in the prior
year
3Q17 Adjusted OIBDA of $115 million vs.
$100 million in the prior year
3Q17 Diluted Net EPS of $0.14 vs. Diluted
Net Loss Per Share of ($1.13) in the prior
year
3Q17 Adjusted Diluted EPS of $0.36 vs.
$0.31 in the prior year
HIGHLIGHTS
3Q16 3Q17
$MM
See Cautionary Statement and reconciliations of non-GAAP financial measures in this presentation. 7
3Q17 Cash Update
HIGHLIGHTS
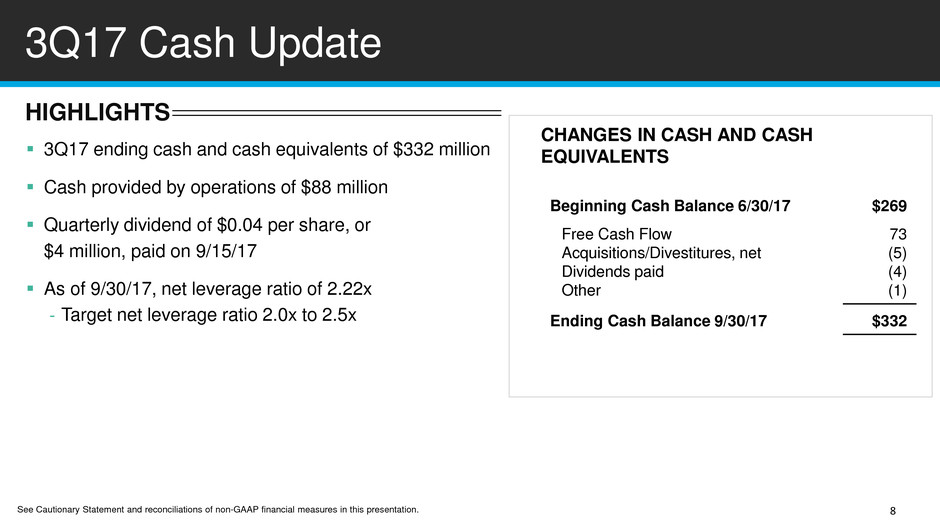
3Q17 ending cash and cash equivalents of $332 million
Cash provided by operations of $88 million
Quarterly dividend of $0.04 per share, or
$4 million, paid on 9/15/17
As of 9/30/17, net leverage ratio of 2.22x
- Target net leverage ratio 2.0x to 2.5x
CHANGES IN CASH AND CASH
EQUIVALENTS
Beginning Cash Balance 6/30/17 $269
Free Cash Flow
Acquisitions/Divestitures, net
Dividends paid
Other
73
(5)
(4)
(1)
Ending Cash Balance 9/30/17 $332
See Cautionary Statement and reconciliations of non-GAAP financial measures in this presentation. 8

Q&A

Appendix
(1) OIBDA is defined as Operating income (loss) excluding Depreciation and Amortization of intangible assets.
(2) (Gain) loss on operating assets, net reflects primarily the recognition of a gain on sale of certain of our titles and of the deferred gain from the sale-
leaseback of the Blue Fin Building that was completed in the fourth quarter of 2015.
(3) Other costs related to mergers, acquisitions, investments and dispositions, and integration and transformation costs during the periods presented are
included within Selling, general and administrative expenses within the Statements of Operations.
(4) Adjusted OIBDA is defined as OIBDA adjusted for impairments of Goodwill, intangible assets, fixed assets and investments; Restructuring and severance
costs; (Gain) loss on operating assets, net; Pension settlements/curtailments; and Other costs related to mergers, acquisitions, investments and
dispositions, and integration and transformation costs.
TIME INC.
RECONCILIATION OF OPERATING INCOME (LOSS) TO ADJUSTED OIBDA
(Unaudited; in millions)
Schedule I
Three Months Ended
September 30,
Nine Months Ended
September 30,
2017 2016 2017 2016
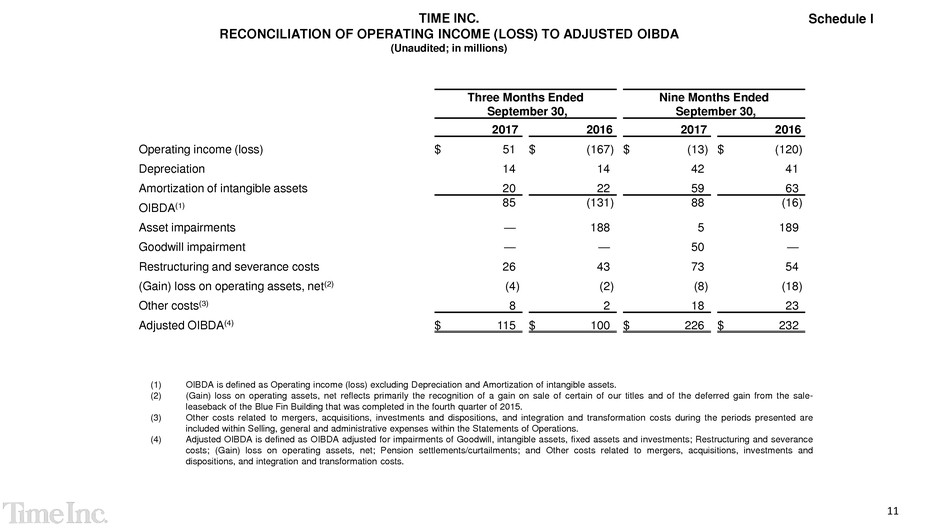
Operating income (loss) $ 51 $ (167 ) $ (13 ) $ (120 )
Depreciation 14 14 42 41
Amortization of intangible assets 20 22 59 63
OIBDA(1) 85 (131 ) 88 (16 )
Asset impairments — 188 5 189
Goodwill impairment — — 50 —
Restructuring and severance costs 26 43 73 54
(Gain) loss on operating assets, net(2) (4 ) (2 ) (8 ) (18 )
Other costs(3) 8 2 18 23
Adjusted OIBDA(4) $ 115 $ 100 $ 226 $ 232
11
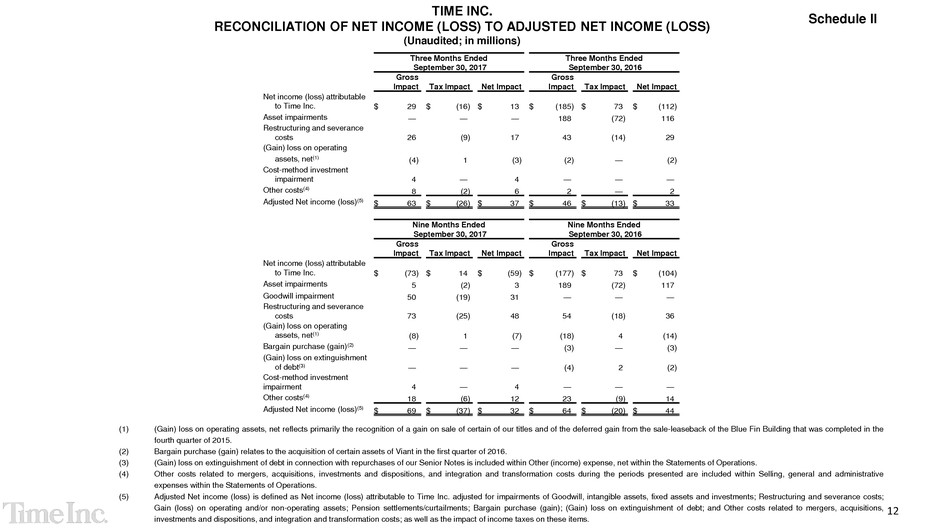
TIME INC.
RECONCILIATION OF NET INCOME (LOSS) TO ADJUSTED NET INCOME (LOSS)
(Unaudited; in millions)
Schedule II
(1) (Gain) loss on operating assets, net reflects primarily the recognition of a gain on sale of certain of our titles and of the deferred gain from the sale-leaseback of the Blue Fin Building that was completed in the
fourth quarter of 2015.
(2) Bargain purchase (gain) relates to the acquisition of certain assets of Viant in the first quarter of 2016.
(3) (Gain) loss on extinguishment of debt in connection with repurchases of our Senior Notes is included within Other (income) expense, net within the Statements of Operations.
(4) Other costs related to mergers, acquisitions, investments and dispositions, and integration and transformation costs during the periods presented are included within Selling, general and administrative
expenses within the Statements of Operations.
(5) Adjusted Net income (loss) is defined as Net income (loss) attributable to Time Inc. adjusted for impairments of Goodwill, intangible assets, fixed assets and investments; Restructuring and severance costs;
Gain (loss) on operating and/or non-operating assets; Pension settlements/curtailments; Bargain purchase (gain); (Gain) loss on extinguishment of debt; and Other costs related to mergers, acquisitions,
investments and dispositions, and integration and transformation costs; as well as the impact of income taxes on these items.
Three Months Ended
September 30, 2017
Three Months Ended
September 30, 2016
Gross
Impact Tax Impact Net Impact
Gross
Impact Tax Impact Net Impact
Net income (loss) attributable
to Time Inc. $ 29
$ (16 ) $ 13
$ (185 ) $ 73
$ (112 )
Asset impairments — — — 188 (72 ) 116
Restructuring and severance
costs 26
(9 ) 17
43
(14 ) 29
(Gain) loss on operating
assets, net(1) (4 ) 1
(3 ) (2 ) —
(2 )
Cost-method investment
impairment 4
—
4
—
—
—
Other costs(4) 8 (2 ) 6 2 — 2
Adjusted Net income (loss)(5) $ 63 $ (26 ) $ 37 $ 46 $ (13 ) $ 33
Nine Months Ended
September 30, 2017
Nine Months Ended
September 30, 2016
Gross
Impact Tax Impact Net Impact
Gross
Impact Tax Impact Net Impact
Net income (loss) attributable
to Time Inc. $ (73 ) $ 14
$ (59 ) $ (177 ) $ 73
$ (104 )
Asset impairments 5 (2 ) 3 189 (72 ) 117
Goodwill impairment 50 (19 ) 31 — — —
Restructuring and severance
costs 73
(25 ) 48
54
(18 ) 36
(Gain) loss on operating
assets, net(1) (8 ) 1
(7 ) (18 ) 4
(14 )
Bargain purchase (gain)(2) — — — (3 ) — (3 )
(Gain) loss on extinguishment
of debt(3) —
—
—
(4 ) 2
(2 )
Cost-method investment
impairment 4
—
4
—
—
—
Other costs(4) 18 (6 ) 12 23 (9 ) 14
Adjusted Net income (loss)(5) $ 69 $ (37 ) $ 32 $ 64 $ (20 ) $ 44
12
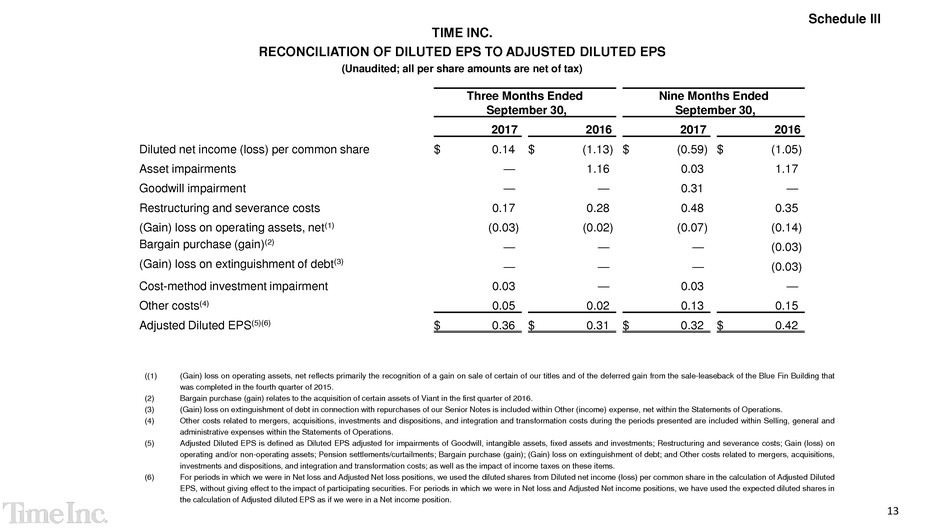
Schedule III
TIME INC.
RECONCILIATION OF DILUTED EPS TO ADJUSTED DILUTED EPS
(Unaudited; all per share amounts are net of tax)
((1) (Gain) loss on operating assets, net reflects primarily the recognition of a gain on sale of certain of our titles and of the deferred gain from the sale-leaseback of the Blue Fin Building that
was completed in the fourth quarter of 2015.
(2) Bargain purchase (gain) relates to the acquisition of certain assets of Viant in the first quarter of 2016.
(3) (Gain) loss on extinguishment of debt in connection with repurchases of our Senior Notes is included within Other (income) expense, net within the Statements of Operations.
(4) Other costs related to mergers, acquisitions, investments and dispositions, and integration and transformation costs during the periods presented are included within Selling, general and
administrative expenses within the Statements of Operations.
(5) Adjusted Diluted EPS is defined as Diluted EPS adjusted for impairments of Goodwill, intangible assets, fixed assets and investments; Restructuring and severance costs; Gain (loss) on
operating and/or non-operating assets; Pension settlements/curtailments; Bargain purchase (gain); (Gain) loss on extinguishment of debt; and Other costs related to mergers, acquisitions,
investments and dispositions, and integration and transformation costs; as well as the impact of income taxes on these items.
(6) For periods in which we were in Net loss and Adjusted Net loss positions, we used the diluted shares from Diluted net income (loss) per common share in the calculation of Adjusted Diluted
EPS, without giving effect to the impact of participating securities. For periods in which we were in Net loss and Adjusted Net income positions, we have used the expected diluted shares in
the calculation of Adjusted diluted EPS as if we were in a Net income position.
Three Months Ended
September 30,
Nine Months Ended
September 30,
2017 2016 2017 2016
Diluted net income (loss) per common share $ 0.14 $ (1.13 ) $ (0.59 ) $ (1.05 )
Asset impairments — 1.16 0.03 1.17
Goodwill impairment — — 0.31 —
Restructuring and severance costs 0.17 0.28 0.48 0.35
(Gain) loss on operating assets, net(1) (0.03 ) (0.02 ) (0.07 ) (0.14 )
Bargain purchase (gain)(2) — — — (0.03 )
(Gain) loss on extinguishment of debt(3) — — — (0.03 )
Cost-method investment impairment 0.03 — 0.03 —
Other costs(4) 0.05 0.02 0.13 0.15
Adjusted Diluted EPS(5)(6) $ 0.36 $ 0.31 $ 0.32 $ 0.42
13
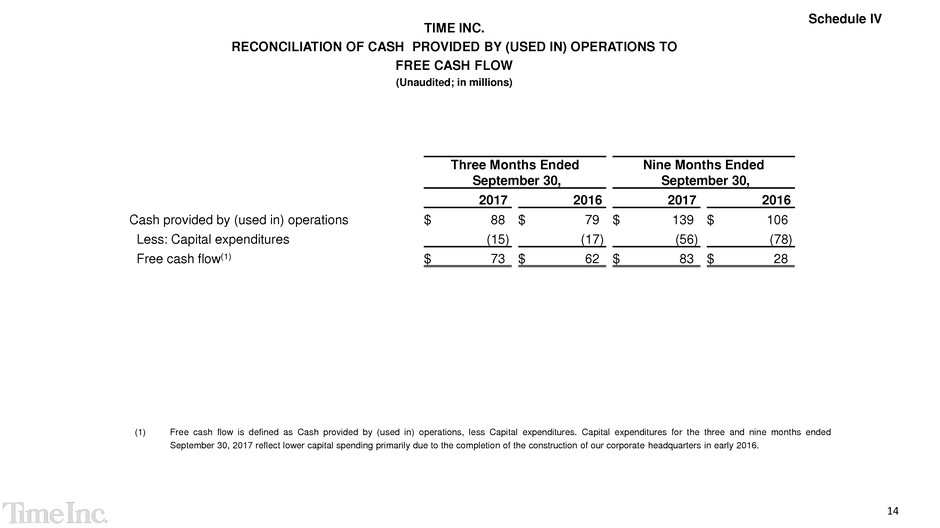
TIME INC.
RECONCILIATION OF CASH PROVIDED BY (USED IN) OPERATIONS TO
FREE CASH FLOW
(Unaudited; in millions)
Schedule IV
(1) Free cash flow is defined as Cash provided by (used in) operations, less Capital expenditures. Capital expenditures for the three and nine months ended
September 30, 2017 reflect lower capital spending primarily due to the completion of the construction of our corporate headquarters in early 2016.
Three Months Ended
September 30,
Nine Months Ended
September 30,
2017 2016 2017 2016
Cash provided by (used in) operations $ 88 $ 79 $ 139 $ 106
Less: Capital expenditures (15 ) (17 ) (56 ) (78 )
Free cash flow(1) $ 73 $ 62 $ 83 $ 28
14
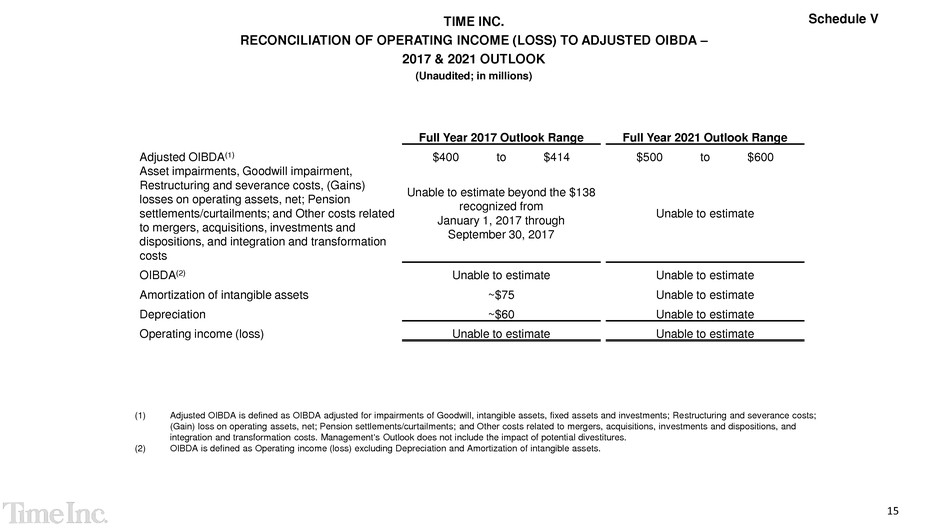
Schedule V TIME INC.
RECONCILIATION OF OPERATING INCOME (LOSS) TO ADJUSTED OIBDA –
2017 & 2021 OUTLOOK
(Unaudited; in millions)
(1) Adjusted OIBDA is defined as OIBDA adjusted for impairments of Goodwill, intangible assets, fixed assets and investments; Restructuring and severance costs;
(Gain) loss on operating assets, net; Pension settlements/curtailments; and Other costs related to mergers, acquisitions, investments and dispositions, and
integration and transformation costs. Management's Outlook does not include the impact of potential divestitures.
(2) OIBDA is defined as Operating income (loss) excluding Depreciation and Amortization of intangible assets.
Full Year 2017 Outlook Range Full Year 2021 Outlook Range
Adjusted OIBDA(1) $400 to $414 $500 to $600
Asset impairments, Goodwill impairment,
Restructuring and severance costs, (Gains)
losses on operating assets, net; Pension
settlements/curtailments; and Other costs related
to mergers, acquisitions, investments and
dispositions, and integration and transformation
costs
Unable to estimate beyond the $138
recognized from
January 1, 2017 through
September 30, 2017
Unable to estimate
OIBDA(2) Unable to estimate Unable to estimate
Amortization of intangible assets ~$75 Unable to estimate
Depreciation ~$60 Unable to estimate
Operating income (loss) Unable to estimate Unable to estimate
15

3Q 2017
Earnings
Presentation
November 9, 2017