QUARTERLY REPORT PURSUANT TO SECTION 13 OR 15(d) OF THE SECURITIES EXCHANGE ACT OF 1934
For the quarterly period ended June 30, 2025
or
☐
TRANSITION REPORT PURSUANT TO SECTION 13 OR 15(d) OF THE SECURITIES EXCHANGE ACT OF 1934
For the transition period from to
Commission File Number: 001-36228
Navient Corporation
(Exact name of registrant as specified in its charter)
Delaware
46-4054283
(State or other jurisdiction of
incorporation or organization)
(I.R.S. Employer
Identification No.)
13865 Sunrise Valley Drive, Herndon, Virginia20171
(703) 810-3000
(Address of principal executive offices)
(Telephone Number)
(703) 810-3000
(Registrant’s telephone number, including area code)
(Former name, former address and former fiscal year, if changed since last report)
Indicate by check mark whether the registrant: (1) has filed all reports required to be filed by Section 13 or 15(d) of the Securities Exchange Act of 1934 during the preceding 12 months (or for such shorter period that the registrant was required to file such reports), and (2) has been subject to such filing requirements for the past 90 days. Yes☑ No ☐
Indicate by check mark whether the registrant has submitted electronically every Interactive Data File required to be submitted pursuant to Rule 405 of Regulation S-T (§ 232.405 of this chapter)during the preceding 12 months (or for such shorter period that the registrant was required to submit such files). Yes☑ No ☐
Indicate by check mark whether the registrant is a large accelerated filer, an accelerated filer, a non-accelerated filer, smaller reporting company, or an emerging growth company. See the definitions of “large accelerated filer,” “accelerated filer,” “smaller reporting company,” and “emerging growth company” in Rule 12b-2 of the Exchange Act. (Check one):
Large accelerated filer
☒
Accelerated filer
☐
Non-accelerated filer
☐
Smaller reporting company
☐
Emerging growth company
☐
If an emerging growth company, indicate by check mark if the registrant has elected not to use the extended transition period for complying with any new or revised financial accounting standards provided pursuant to Section 13(a) of the Exchange Act. ☐
Indicate by check mark whether the registrant is a shell company (as defined in Rule 12b-2 of the Exchange Act). Yes ☐ No ☑
Securities registered pursuant to Section 12(b) of the Act.
Title of each class
Trading
Symbol(s)
Name of each exchange on which registered
Common stock, par value $.01 per share
NAVI
The NASDAQ Global Select Market
6% Senior Notes due December 15, 2043
JSM
The NASDAQ Global Select Market
Preferred Stock Purchase Rights
None
The NASDAQ Global Select Market
As of June 30, 2025, there were 99,431,038 shares of common stock outstanding.
TABLE OF CONTENTS
Organization of Our Form 10-Q
The order and presentation of content in our Quarterly Report on Form 10-Q (Form 10-Q) differs from the traditional Securities and Exchange Commission (SEC) Form 10-Q format. Our format is designed to improve readability and to better present how we organize and manage our business. See Appendix A, "Form 10-Q Cross-Reference Index" for a cross-reference index to the traditional SEC Form 10-Q format.
This Form 10-Q contains “forward-looking” statements and other information that is based on management’s current expectations as of the date of this report. Statements that are not historical facts, including statements about our beliefs, opinions, or expectations and statements that assume or are dependent upon future events, are forward-looking statements and often contain words such as “expect,” “assume,” “anticipate,” “intend,” “plan,” “believe,” “seek,” “see,” “will,” “would,” “may,” “could,” “should,” “goals,” or “target.” Such statements are based on management's expectations as of the date of this filing and involve many risks and uncertainties that could cause our actual results to differ materially from those expressed or implied in our forward-looking statements. Such risks and uncertainties are discussed more fully under the section titled “Risk Factors” and include, but are not limited to the following:
•
general economic conditions, including the potential impact of inflation and interest rates on Navient and its clients and customers and on the creditworthiness of third parties;
•
increased defaults on education loans held by us;
•
unanticipated repayment trends on education loans including prepayments or deferrals resulting from new interpretations or the timing of the execution and implementation of current laws, rules or regulations or future laws, executive orders or other policy initiatives that operate to encourage or require consolidation, abolish existing or create additional income-based repayment or debt forgiveness programs or establish other policies and programs which may increase or decrease the prepayment rates on education loans and accelerate or slow down the repayment of the bonds in our securitization trusts;
•
a reduction in our credit ratings;
•
changes to applicable laws, rules, regulations and government policies, as well as changing regulatory and governmental oversight;
•
changes in the general interest rate environment, including the availability of any relevant money-market index rate or the relationship between the relevant money-market index rate and the rate at which our assets are priced;
•
the interest rate characteristics of our assets do not always match those of our funding arrangements;
•
adverse market conditions or an inability to effectively manage our liquidity risk or access liquidity could negatively impact us;
•
the cost and availability of funding in the capital markets;
•
our ability to earn Floor Income and our ability to enter into hedges relative to that Floor Income are dependent on the future interest rate environment and therefore is variable;
•
our use of derivatives exposes us to credit and market risk;
•
our ability to continually and effectively align our cost structure with our business operations;
•
a failure or breach of our operating systems, infrastructure or information technology systems;
•
failure by any third party providing us material services or products or a breach or violation of law by one of these third parties;
•
our current or previous work with government clients exposes us to additional risks inherent in the government contracting environment;
•
acquisitions, strategic initiatives and investments or divestitures that we pursue;
•
shareholder activism; and
•
reputational risk and social factors.
Given these risks and uncertainties, readers are cautioned not to place undue reliance on such forward-looking statements. Readers are urged to carefully review and consider the various disclosures made in this Form 10-Q and in other documents we file from time to time with the SEC that disclose risks and uncertainties that may affect our business.
The preparation of our consolidated financial statements also requires management to make certain estimates and assumptions including estimates and assumptions about future events. These estimates or assumptions may prove to be incorrect and actual results could differ materially. All forward-looking statements contained in this report are qualified by these cautionary statements and are made only as of the date of this report. We do not undertake any obligation to update or revise these forward-looking statements except as required by law.
Through this discussion and analysis, we intend to provide the reader with some narrative context for how our management views our consolidated financial statements, additional context within which to assess our operating results, and information on the quality and variability of our earnings, liquidity and cash flows.
1
USE OF NON-GAAP FINANCIAL MEASURES
We prepare financial statements and present financial results in accordance with GAAP. However, we also evaluate our business segments and present our financial results on a basis that differs from GAAP. We refer to this different basis of presentation as Core Earnings, which is a non-GAAP financial measure. We provide this Core Earnings basis of presentation on a consolidated basis and for each business segment because this is what we review internally when making management decisions regarding our performance and how we allocate resources. We also include this information in our presentations with credit rating agencies, lenders and investors. Because our Core Earnings basis of presentation is our measure of profit or loss for our segments, we are required by GAAP to provide Core Earnings disclosures in the notes to our consolidated financial statements for our business segments.
In addition to Core Earnings, we present the following other non-GAAP financial measures: Tangible Equity, Adjusted Tangible Equity Ratio, Earnings before Interest, Taxes, Depreciation and Amortization Expense (EBITDA) (for the Business Processing segment), and Allowance for Loan Losses Excluding Expected Future Recoveries on Previously Fully Charged-off Loans. Definitions for the non-GAAP financial measures and reconciliations are provided below, except that reconciliations of forward-looking non-GAAP financial measures are not provided because the Company is unable to provide such reconciliations without unreasonable effort due to the uncertainty and inherent difficulty of predicting the occurrence and financial impact of certain items, including, but not limited to, the impact of any mark-to-market gains/losses resulting from our use of derivative instruments to hedge our economic risks. See “Management’s Discussion and Analysis of Financial Condition and Results of Operations — Non-GAAP Financial Measures” for a further discussion and a complete reconciliation between GAAP net income and Core Earnings.
2
Business
Overview and Fundamentals of Our Business
Navient (Nasdaq: NAVI) helps students and families confidently manage the cost of higher education. We create long-term value for customers and investors through responsible lending, flexible refinancing, trusted servicing oversight, and decades of portfolio management expertise. Our employees thrive in a culture of belonging, where they are supported and proud to deliver meaningful outcomes. Learn more on Navient.com.
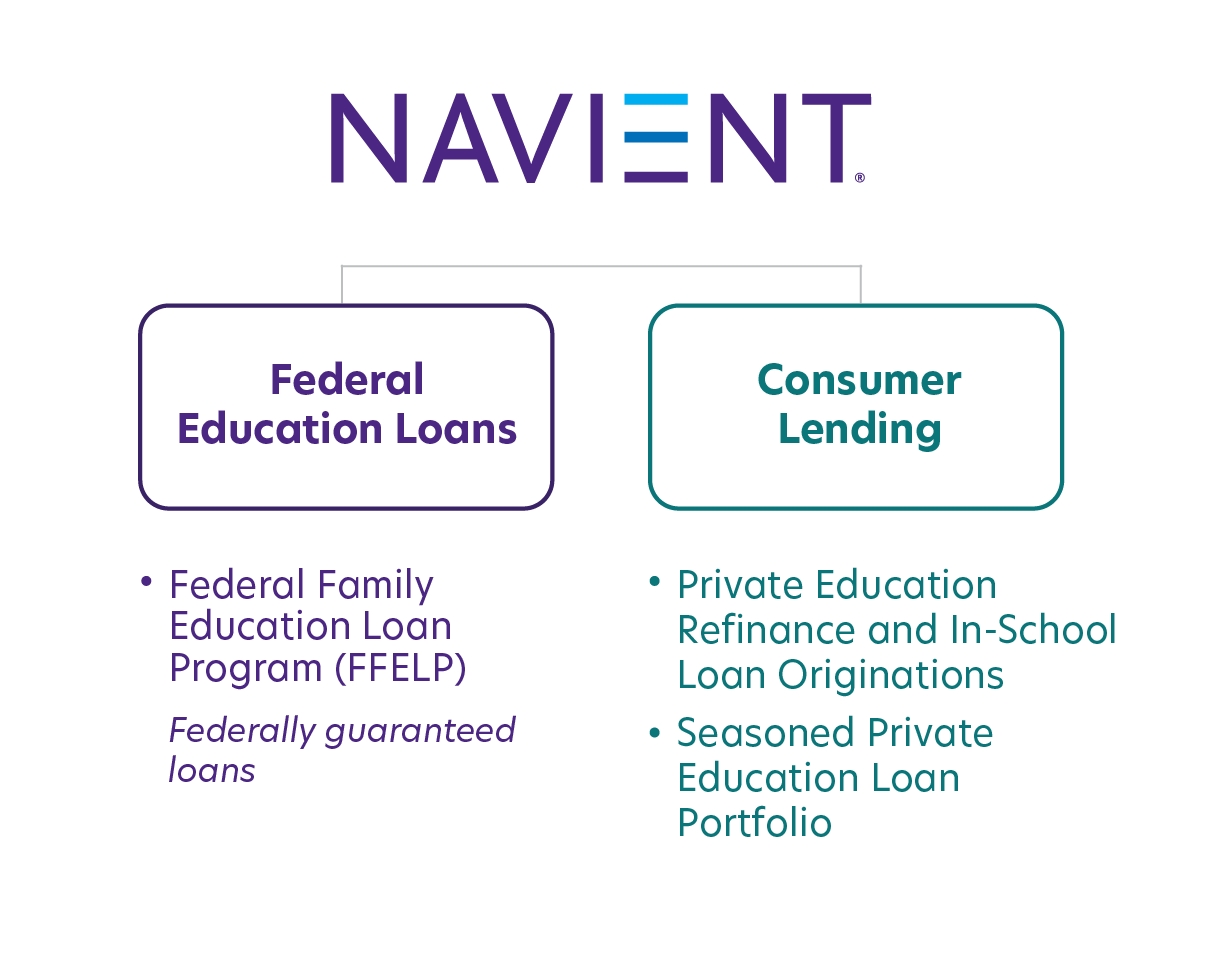
With a focus on data-driven insights, service, compliance and innovative support, Navient’s business consists of:
•
Federal Education Loans
We own and manage a portfolio of $29.6 billion of federally guaranteed Federal Family Education Loan Program (FFELP) Loans. We support the success of our customers and ensure a compliant, efficient customer experience.
•
Consumer Lending
We own and manage a portfolio of $15.5 billion of Private Education Loans. Through our Earnest brand we also refinance and originate Private Education Loans. We help students and families succeed through the college journey with innovative planning tools, student loans and refinancing products through our Earnest brand. In the first half of 2025, we originated $1.0 billion of Private Education Loans, an 87% increase from $538 million a year ago.
Navient previously provided both healthcare and government business processing services. Our healthcare services business was sold in September 2024 and our government services business was sold in February 2025, marking the end of Navient providing business processing solutions. See "Recent Business Developments" for more detail.
Maximizing Cash Flows from Loan Portfolios and Maintaining a Strong Balance Sheet
Our second-quarter 2025 results continue to demonstrate the strength of our balance sheet, credit risk management and underwriting of high-quality private education loans with attractive economics.
By optimizing capital adequacy and allocating capital to highly accretive opportunities, including organic growth and acquisitions, we remain well positioned to pay dividends and repurchase stock, while maintaining appropriate leverage that supports our credit ratings and ensures ongoing access to capital markets.
In December 2021, our Board of Directors approved a share repurchase program authorizing the purchase of up to $1 billion of the Company’s outstanding common stock. At June 30, 2025, $52 million remained in share repurchase authorization.
3
To inform our capital allocation decisions, we use the Adjusted Tangible Equity Ratio(1) in addition to other metrics. Our GAAP equity-to-asset ratio was 5.1% and our Adjusted Tangible Equity Ratio(1) was 9.8% as of June 30, 2025.
(Dollars and shares in millions)
Q2-25
Q2-24
Shares repurchased
1.9
2.5
Reduction in shares outstanding
2
%
2
%
Total repurchases in dollars
$
24
$
38
Dividends paid
$
16
$
17
Total Capital Returned(2)
$
40
$
55
GAAP equity-to-asset ratio
5.1
%
4.9
%
Adjusted Tangible Equity Ratio(1)
9.8
%
8.2
%
Commitment to Corporate Social Responsibility and Compliance
We maintain a robust, multi-layered compliance management system and thoroughly understand and comply with applicable federal, state, and local laws. We follow the industry-leading “Three Lines Model” compliance framework. This framework and other compliance protocols ensure we adhere to key industry laws and regulations including but not limited to: Fair and Accurate Credit Transactions Act (FACTA); Fair Credit Reporting Act (FCRA); Fair Debt Collection Practices Act (FDCPA); Electronic Funds Transfer Act (EFTA); Equal Credit Opportunity Act (ECOA); Gramm-Leach-Bliley Act (GLBA); Health Insurance Portability and Accountability Act (HIPAA); IRS Publication 1075; Servicemembers Civil Relief Act (SCRA); Military Lending Act (MLA); Telephone Consumer Protection Act (TCPA); Truth in Lending Act (TILA); Unfair, Deceptive, or Abusive Acts and Practices (UDAAP); state laws; and state and city licensing.
We are committed to contributing to the social and economic wellbeing of our communities; fostering the success of our customers; supporting a culture of integrity and inclusion in our workforce; and embracing sustainable business practices. Navient has earned recognition from a variety of leading organizations for our continued commitment to social responsibility. Our employees are engaged in our communities through company-sponsored volunteering and philanthropic programs.
Navient is committed to a sustainable future. We leverage technologies that minimize energy use in our office buildings and promote widespread adoption of “paperless” digital customer communications. Navient prioritizes the usage of power-saving features to our buildings to reduce energy usage. Energy efficiency and reducing carbon dioxide (CO2) and CO2 equivalents are among the many factors considered in our real estate decisions.
(1)
Item is a non-GAAP financial measure. For a description and reconciliation, see “Management’s Discussion and Analysis of Financial Condition and Results of Operations — Non-GAAP Financial Measures.”
(2)
Capital Returned is defined as share repurchases and dividends paid.
4
Recent Business Developments
On January 30, 2024, as a result of an in-depth review of our business, Navient announced strategic actions to simplify our company, reduce our expense base, and enhance our flexibility. We have made substantial progress on these actions. We adopted a variable, outsourced servicing model when MOHELA began servicing our loan portfolio in July 2024. We completed the divestiture of our Business Processing segment business with our healthcare services business sold in September 2024 and our government services business sold in February 2025. In conjunction with the decision to outsource student loan servicing, divesting the Business Processing segment increased the opportunities for shared cost reduction. Along with the above actions, we are also reshaping our shared services functions and corporate footprint to align with the needs of a more focused, flexible and streamlined company. The $42 million of restructuring and other reorganization charges recognized in 2024 and the first half of 2025 (the vast majority of which relates to severance in connection with job abolishments) reflects the progress made to date in connection with this effort. As of June 30, 2025, we have reduced our headcount by over 80% since the beginning of 2024.
In 2025, as it relates to the above strategic actions:
•
We are providing transition services related to the outsourcing of servicing and divestiture of the Business Processing segment. The transition services related to the outsourcing of servicing and the sale of our healthcare services business ended in May 2025. We expect the transition services related to our government services business to be mostly completed by the end of 2025.
•
We expect to have additional cost saving initiatives implemented which will further reduce our operating costs mostly in connection with our shared service functions and corporate footprint.
•
We are executing on enhancing the value of our growth business related to in-school and refinance Private Education Loan originations, investing in capabilities to grow high-quality originations that generate targeted returns. In the first half of 2025, total originations nearly doubled to $1.0 billion compared to $538 million a year ago and almost tripled from our originations of $366 million just two years ago.
How We Organize Our Business
Today we operate our business in two primary segments: Federal Education Loans and Consumer Lending. As of February 2025, we had divested our Business Processing segment.
5
Federal Education Loans Segment
Navient owns and manages FFELP Loans and is the master servicer on this portfolio. We generate revenue primarily through net interest income on our FFELP Loans.
Consumer Lending Segment
Navient owns and manages Private Education Loans and is the master servicer for these portfolios. Through our Earnest brand, we also refinance and originate in-school Private Education Loans. "Refinance" Private Education Loans are loans where a borrower has refinanced their education loans, and "In-school" Private Education Loans are loans originally made to borrowers while they are attending school. We generate revenue primarily through net interest income on our Private Education Loan portfolio.
Through our Earnest brand, we help students and families in the planning and paying for college journey. Our digital tools empower people to find scholarships and compare financial aid offers. We believe our 50 years of experience, product design, digital marketing strategies, and origination and servicing expertise provide a unique competitive advantage. We see meaningful growth opportunities in originating Private Education Loans, generating attractive long-term, risk-adjusted returns.
The passage of new legislation on July 3, 2025 (the "Big Beautiful Bill") marks a significant shift in federal student lending programs, notably eliminating the GradPLUS loan program effective July 1, 2026. This development is anticipated to drive increased demand for private in-school graduate loans, presenting a unique loan origination growth opportunity for Navient. With our disciplined approach to growing in-school volume with a focus on graduate borrowers, we are well-positioned to capture our share of this expanded market.
Business Processing Segment
In September 2024, Navient completed the sale of Xtend, which comprised the Company's healthcare services business in its Business Processing segment. In February 2025, Navient completed the sale of its government services businesses, which constitutes the remainder of the Business Processing segment.
Prior to the sale of its healthcare and government services businesses, Navient provided business processing solutions such as omnichannel contact center services, workflow processing, and revenue cycle optimization. We leveraged the same expertise and intelligent tools we use to deliver successful results for portfolios we own. Our support enabled our clients to ensure better constituent outcomes, meet rapidly changing needs, improve technology, reduce operating expenses, manage risk and optimize revenue opportunities. Our clients included:
•
Government: We offered our solutions to federal agencies, state governments, tolling and parking authorities, and other public sector clients.
•
Healthcare: Our clients included hospitals, hospital systems, medical centers, large physician groups, other healthcare providers and public health departments.
Other Segment
This segment consists of our corporate liquidity portfolio, gains and losses incurred on the repurchase of debt, unallocated expenses of shared services (which includes regulatory expenses) and restructuring/other reorganization expenses. Additionally, the segment contains the revenue and expenses in connection with the transition services we are performing related to the outsourcing of servicing and divestiture of our Business Processing segment discussed under "Recent Business Developments."
6
Management’s Discussion and Analysis of Financial Condition and Results of Operations
Selected Historical Financial Information and Ratios
Three Months Ended June 30,
Six Months Ended June 30,
(In millions, except per share data)
2025
2024
2025
2024
GAAP Basis
Net income
$
14
$
36
$
11
$
109
Diluted earnings per common share
$
.13
$
.32
$
.11
$
.97
Weighted average shares used to compute diluted earnings per share
101
112
102
113
Return on assets
.11
%
.26
%
.05
%
.39
%
Core Earnings Basis(1)
Net income(1)
$
21
$
33
$
47
$
86
Diluted earnings per common share(1)
$
.20
$
.29
$
.46
$
.77
Weighted average shares used to compute diluted earnings per share
101
112
102
113
Net interest margin, Federal Education Loans segment
.70
%
.36
%
.66
%
.46
%
Net interest margin, Consumer Lending segment
2.32
%
2.89
%
2.54
%
2.94
%
Return on assets
.17
%
.24
%
.19
%
.31
%
Education Loan Portfolios
Ending FFELP Loans, net
$
29,618
$
32,940
$
29,618
$
32,940
Ending Private Education Loans, net
15,530
16,238
15,530
16,238
Ending total education loans, net
$
45,148
$
49,178
$
45,148
$
49,178
Average FFELP Loans
$
30,327
$
34,741
$
30,619
$
35,950
Average Private Education Loans
15,992
16,936
16,075
17,160
Average total education loans
$
46,319
$
51,677
$
46,694
$
53,110
(1)
Item is a non-GAAP financial measure. For a description and reconciliation, see “Non-GAAP Financial Measures – Core Earnings.”
7
The Quarter in Review
We prepare financial statements and present financial results in accordance with GAAP. However, we also evaluate our business segments and present financial results on a basis that differs from GAAP. We refer to this different basis of presentation as Core Earnings. We provide this Core Earnings basis of presentation on a consolidated basis and for each business segment because this is what we review internally when making management decisions regarding our performance and how we allocate resources. We also include this information in our presentations with credit rating agencies, lenders and investors. Because our Core Earnings basis of presentation corresponds to our segment financial presentations, we are required by GAAP to provide certain Core Earnings disclosures in the notes to our consolidated financial statements for our business segments. See “Non-GAAP Financial Measures — Core Earnings” for a further discussion and a complete reconciliation between GAAP net income and Core Earnings.
Second-quarter 2025 net income was $14 million ($0.13 diluted earnings per share), compared with net income of $36 million ($0.32 diluted earnings per share) for the year-ago quarter. See “Results of Operations — GAAP Comparison of Second-Quarter 2025 Results with Second-Quarter 2024” for a discussion of the primary contributors to the change in GAAP earnings between periods.
Second-quarter 2025 Core Earnings net income was $21 million ($0.20 diluted Core Earnings per share), compared with $33 million ($0.29 diluted Core Earnings per share) for the year-ago quarter. See “Segment Results” for a discussion of the primary contributors to the change in Core Earnings between periods.
GAAP and Core Earnings results included:
•
Provision for loan losses of $37 million ($8 million for FFELP and $29 million for Consumer Lending). The $23 million increase from the year-ago quarter is a result of increased originations, a weakening in the forecasted macroeconomic outlook, higher delinquencies as well as the extension of the FFELP portfolio.
•
Regulatory and restructuring expenses of $1 million ($0.01 diluted loss per share).
Financial highlights of second-quarter 2025 include:
Federal Education Loans segment:
•
Net income of $30 million.
•
Net interest margin of 0.70%.
•
FFELP Loan prepayments of $228 million compared to $2.5 billion in second-quarter 2024.
Consumer Lending segment:
•
Net income of $26 million.
•
Net interest margin of 2.32%.
•
Originated $500 million of Private Education Loans.
Business Processing segment:
•
Navient no longer provides business processing segment services after the sale in February 2025 of the government services business.
Capital, funding and liquidity:
•
GAAP equity-to-asset ratio of 5.1% and adjusted tangible equity ratio(1) of 9.8%.
•
Repurchased $24 million of common shares. $52 million common share repurchase authority remains outstanding.
•
Paid $16 million in common stock dividends.
•
Issued $500 million of unsecured debt and $536 million of asset-backed securities.
(1)
Item is a non-GAAP financial measure. For a description and reconciliation, see “Non-GAAP Financial Measures.”
8
Operating Expenses:
•
Operating expenses of $100 million, of which $13 million is in connection with transition services we have provided related to our various strategic initiatives. There is $14 million of revenue recognized in Other revenue related to these services.
The transition services related to the outsourcing of servicing and the sale of our healthcare services business
ended in May 2025. We expect the transition services related to the sale of our government services business to
be mostly completed by the end of 2025.
Results of Operations
GAAP Income Statements (Unaudited)
Three Months Ended June 30,
Increase (Decrease)
Six Months Ended June 30,
Increase (Decrease)
(In millions, except per share data)
2025
2024
$
%
2025
2024
$
%
Interest income
FFELP Loans
$
483
$
608
$
(125
)
(21
)%
$
975
$
1,269
$
(294
)
(23
)%
Private Education Loans
273
317
(44
)
(14
)
562
645
(83
)
(13
)
Cash and investments
22
48
(26
)
(54
)
43
86
(43
)
(50
)
Total interest income
778
973
(195
)
(20
)
1,580
2,000
(420
)
(21
)
Total interest expense
650
843
(193
)
(23
)
1,322
1,718
(396
)
(23
)
Net interest income
128
130
(2
)
(2
)
258
282
(24
)
(9
)
Less: provisions for loan losses
37
14
23
164
67
26
41
158
Net interest income after provisions for loan losses
91
116
(25
)
(22
)
191
256
(65
)
(25
)
Other income (loss):
Servicing revenue
14
18
(4
)
(22
)
27
35
(8
)
(23
)
Asset recovery and business processing revenue
—
81
(81
)
(100
)
23
158
(135
)
(85
)
Other income
19
4
15
375
33
13
20
154
Gains (losses) on derivative and hedging activities, net
(5
)
14
(19
)
(136
)
(30
)
46
(76
)
(165
)
Total other income
28
117
(89
)
(76
)
53
252
(199
)
(79
)
Expenses:
Operating expenses
100
166
(66
)
(40
)
227
350
(123
)
(35
)
Goodwill and acquired intangible assets impairment and amortization expense
1
3
(2
)
(67
)
2
5
(3
)
(60
)
Restructuring/other reorganization expenses
—
16
(16
)
(100
)
3
17
(14
)
(82
)
Total expenses
101
185
(84
)
(45
)
232
372
(140
)
(38
)
Income before income tax expense
18
48
(30
)
(63
)
12
136
(124
)
(91
)
Income tax expense
4
12
(8
)
(67
)
1
27
(26
)
(96
)
Net income
$
14
$
36
$
(22
)
(61
)%
$
11
$
109
$
(98
)
(90
)%
Basic earnings per common share
$
.14
$
.32
$
(.18
)
(56
)%
$
.11
$
.98
$
(.87
)
(89
)%
Diluted earnings per common share
$
.13
$
.32
$
(.19
)
(59
)%
$
.11
$
.97
$
(.86
)
(89
)%
Dividends per common share
$
.16
$
.16
$
—
—
$
.32
$
.32
$
—
—
9
GAAP Comparison of Second-Quarter 2025 Results with Second-Quarter 2024
For the three months ended June 30, 2025, net income was $14 million, or $0.13 diluted earnings per common share, compared with net income of $36 million, or $0.32 diluted earnings per common share, for the year-ago period.
The primary contributors to the change in net income are as follows:
•Net interest income decreased by $2 million primarily as a result of the paydown of the FFELP and Private Education Loan portfolios, and increased reserving for the increase in accrued interest receivable on Private Education Loans greater than 90-days delinquent. This decrease was partially offset by a $22 million decline in premium amortization on the FFELP Loan portfolio due to the significant decrease in prepayments from $2.5 billion in the year-ago period to $228 million in the current period.
•Provisions for loan losses increased $23 million from $14 million to $37 million:
○ The provision for FFELP Loan losses increased $10 million from $(2) million to $8 million.
○ The provision for Private Education Loan losses increased $13 million from $16 million to $29 million.
The provision for FFELP Loan losses of $8 million in the current period was primarily the result of an increase in delinquency balances. The provision of $(2) million in the year-ago quarter was the result of stable credit trends.
The provision for Private Education Loan losses of $29 million in the current period included $7 million in connection with loan originations and $22 million related to a general reserve build (primarily as a result of an increase in delinquency balances as well as a weakening in the forecasted macroeconomic metrics used to estimate expected losses). The provision of $16 million in the year-ago quarter included $6 million in connection with loan originations and $10 million related to a general reserve build.
•Asset recovery and business processing revenue decreased $81 million as a result of the sale of our healthcare services business in the third quarter of 2024 ($32 million of the decrease), and our government services business in February 2025 ($49 million of the decrease). With the sale of our government services business, Navient no longer provides business processing segment services.
•Other income increased $15 million primarily related to the transition services we provide related to our various strategic initiatives. The transition services related to the outsourcing of servicing and the sale of our healthcare services business ended in May 2025. We expect the transition services related to the sale of our government services business to be mostly completed by the end of 2025.
•Net gains on derivative and hedging activities decreased $19 million. The primary factor affecting the change was interest rate fluctuations. Valuations of derivative instruments fluctuate based upon many factors including changes in interest rates and other market factors. As a result, net gains and losses on derivative and hedging activities may vary significantly in future periods.
•Operating expenses decreased $66 million, $74 million of which was due to a decline in business processing expenses as a result of the sale of our government services business in February 2025 and our healthcare services business in the third quarter of 2024 ($62 million of the reduction is in the Business Processing segment and $12 million of the reduction is in the Other segment). In addition, regulatory-related expenses decreased $11 million due to a $12 million contingency loss accrual recorded in the year-ago quarter related to the September 2024 CFPB settlement agreement. Current period expense includes $13 million incurred in connection with providing transition services related to our various strategic initiatives. We expect these services to be mostly completed by the end of 2025. There is $14 million of revenue recognized in Other revenue related to these services.
•Restructuring and other reorganization expenses decreased $16 primarily due to a decrease in severance-related costs in connection with the various strategic initiatives being implemented to simplify the company, reduce our expense base and enhance our flexibility.
We repurchased 1.9 million and 2.5 million shares of our common stock during the second quarters of 2025 and 2024, respectively. As a result of repurchases, our average outstanding diluted shares decreased by 11 million common shares (or 10%) from the year-ago period.
10
GAAP Comparison of Six Months Ended June 30, 2025 Results with Six Months Ended June 30, 2024
For the six months ended June 30, 2025, net income was $11 million, or $0.11 diluted earnings per common share, compared with net income of $109 million, or $0.97 diluted earnings per common share, for the year-ago period.
The primary contributors to the change in net income are as follows:
•Net interest income decreased by $24 million primarily as a result of the paydown of the FFELP and Private Education Loan portfolios, the impact of decreasing interest rates on the different index resets for the FFELP Loan and Private Education Loan assets and debt, as well as a $7 million decrease in mark-to-market gains on fair value hedges recorded in interest expense. This decrease was partially offset by a $40 million decline in premium amortization on the FFELP Loan portfolio due to the significant decrease in prepayments from $4.1 billion in the year-ago period to $485 million in the current period.
•Provisions for loan losses increased $41 million, from $26 million to $67 million:
○ The provision for FFELP Loan losses increased $17 million from $(1) million to $16 million.
○ The provision for Private Education Loan losses increased $24 million from $27 million to $51 million.
The provision for FFELP Loan losses of $16 million in the current period was primarily the result of an increase in delinquency balances. The provision of $(1) million in the year-ago period was the result of stable credit trends.
The provision for Private Education Loan losses of $51 million in the current period included $14 million in connection with loan originations and $37 million related to a general reserve build (primarily as a result of an increase in delinquency balances as well as a weakening in the forecasted macroeconomic metrics used to estimate expected losses). The provision of $27 million in the year-ago period included $11 million in connection with loan originations and $16 million related to a general reserve build.
•Asset recovery and business processing revenue decreased $135 million as a result of the sale of our healthcare services business in the third quarter of 2024 ($61 million of the decrease), and our government services business in February 2025 ($74 million of the decrease). With the sale of our government services business, Navient no longer provides business processing segment services.
•Other income increased $20 million primarily related to the transition services we provide related to our various strategic initiatives. The transition services related to the outsourcing of servicing and the sale of our healthcare services business ended in May 2025. We expect the transition services related to the sale of our government services business to be mostly completed by the end of 2025.
•Net gains on derivative and hedging activities decreased $76 million. The primary factor affecting the change was interest rate fluctuations. Valuations of derivative instruments fluctuate based upon many factors including changes in interest rates and other market factors. As a result, net gains and losses on derivative and hedging activities may vary significantly in future periods.
•Operating expenses decreased $123 million, $132 million of which was due to a decline in business processing expenses as a result of the sale of our government services business in February 2025 and our healthcare services business in the third quarter of 2024 ($111 million of the reduction is in the Business Processing segment and $21 million of the reduction is in the Other segment). In addition, regulatory-related expenses decreased $23 million due to a $32 million contingency loss accrual recorded in the year-ago period related to the September 2024 CFPB settlement agreement. Current period expense includes $23 million incurred in connection with providing transition services related to our various strategic initiatives. We expect these services to be mostly completed by the end of 2025. There is $25 million of revenue recognized in Other revenue related to these services.
•Restructuring and other reorganization expenses decreased $14 million primarily due to a decrease in severance-related costs in connection with the various strategic initiatives being implemented to simplify the company, reduce our expense base and enhance our flexibility.
•The effective income tax rates for the current and year-ago periods were 9% and 20%, respectively. The movement in the effective income tax rate was primarily driven by state tax expense in connection with uncertain tax positions as well as changes in the valuation allowance attributed to disallowed interest expense carryovers.
We repurchased 4.5 million and 5.0 million shares of our common stock during the six months ended of June 30, 2025 and 2024, respectively. As a result of repurchases, our average outstanding diluted shares decreased by 11 million common shares (or 10%) from the year-ago period.
11
Segment Results
Federal Education Loans Segment
The following table presents Core Earnings results for our Federal Education Loans segment.
Three Months Ended June 30,
% Increase (Decrease)
Six Months Ended June 30,
% Increase (Decrease)
(Dollars in millions)
2025
2024
2025 vs. 2024
2025
2024
2025 vs. 2024
Interest income:
FFELP Loans
$
483
$
608
(21
)%
$
975
$
1,269
(23
)%
Cash and investments
10
28
(64
)
20
51
(61
)
Total interest income
493
636
(22
)
995
1,320
(25
)
Total interest expense
438
603
(27
)
892
1,233
(28
)
Net interest income
55
33
67
103
87
18
Less: provision for loan losses
8
(2
)
500
16
(1
)
1,700
Net interest income after provision for loan losses
47
35
34
87
88
(1
)
Total other income
10
17
(41
)
20
33
(39
)
Direct operating expenses
17
16
6
37
33
12
Income before income tax expense
40
36
11
70
88
(20
)
Income tax expense
10
8
25
16
20
(20
)
Net income
$
30
$
28
7
%
$
54
$
68
(21
)%
Comparison of Second-Quarter 2025 Results with Second-Quarter 2024
•
Net income was $30 million compared to $28 million.
•
Net interest income increased $22 million primarily due to a decrease in premium amortization as a result of the significant decline in prepayments from $2.5 billion in the year-ago quarter to $228 million in the current quarter.
•
Provision for loan losses increased $10 million. The $8 million of provision for loan losses in second-quarter 2025 was primarily the result of an increase in delinquency balances. The $(2) million of provision for loan losses in second-quarter 2024 was the result of relatively stable credit trends.
o
Net charge-offs were $8 million compared to $10 million.
o
Delinquencies greater than 90 days were $2.5 billion compared to $1.9 billion.
o
Forbearances were $3.7 billion compared to $5.3 billion.
•
Other income decreased $7 million primarily as a result of lower late fees and third-party servicing fees.
•
Expenses were $1 million higher primarily as a result of transitioning the servicing of our portfolio to a third party on July 1, 2024. As expected, for consolidated Navient (across the Federal Education Loans, Consumer Lending and Other segments), costs were neutral (net of transition services revenue earned) in the current quarter compared to costs we would have incurred if the servicing function remained in-house. Over the remaining life of the portfolio, we expect a significant overall cost savings to be realized.
12
Key performance metrics are as follows:
Three Months Ended June 30,
Six Months Ended June 30,
(Dollars in millions)
2025
2024
2025
2024
Segment net interest margin
.70
%
.36
%
.66
%
.46
%
FFELP Loans:
FFELP Loan spread
.75
%
.49
%
.71
%
.58
%
Provision for loan losses
$
8
$
(2
)
$
16
$
(1
)
Net charge-offs
$
8
$
10
$
14
$
20
Net charge-off rate
.14
%
.14
%
.12
%
.14
%
Greater than 30-days delinquency rate
19.0
%
13.5
%
19.0
%
13.5
%
Greater than 90-days delinquency rate
10.1
%
7.0
%
10.1
%
7.0
%
Forbearance rate
12.8
%
16.8
%
12.8
%
16.8
%
Average FFELP Loans
$
30,327
$
34,741
$
30,619
$
35,950
Ending FFELP Loans, net
$
29,618
$
32,940
$
29,618
$
32,940
Net Interest Margin
The following table details the net interest margin.
Three Months Ended June 30,
Six Months Ended June 30,
2025
2024
2025
2024
FFELP Loan yield
6.13
%
6.83
%
6.17
%
6.87
%
Floor Income
.25
.21
.25
.23
FFELP Loan net yield
6.38
7.04
6.42
7.10
FFELP Loan cost of funds
(5.63
)
(6.55
)
(5.71
)
(6.52
)
FFELP Loan spread
.75
.49
.71
.58
Other interest-earning asset spread impact
(.05
)
(.13
)
(.05
)
(.12
)
Net interest margin(1)
.70
%
.36
%
.66
%
.46
%
(1)
The average balances of the interest-earning assets for the respective periods are:
Three Months Ended June 30,
Six Months Ended June 30,
(Dollars in millions)
2025
2024
2025
2024
FFELP Loans
$
30,327
$
34,741
$
30,619
$
35,950
Other interest-earning assets
861
2,192
875
2,026
Total FFELP Loan interest-earning assets
$
31,188
$
36,933
$
31,494
$
37,976
The 34 basis point increase in the net interest margin in second-quarter 2025 is primarily the result of premium amortization being $22 million higher in the year-ago period (25 basis points) due to prepayments being significantly higher at $2.5 billion in the year-ago period versus $228 million in the current period.
As of June 30, 2025, our FFELP Loan portfolio totaled $29.6 billion, comprised of $10.8 billion of FFELP Stafford Loans and $18.8 billion of FFELP Consolidation Loans. The weighted-average life of these portfolios as of June 30, 2025 was 8 years and 8 years, respectively, assuming a Constant Prepayment Rate (CPR) of 7% and 5%, respectively.
13
Floor Income
The following table analyzes, on a Core Earnings basis, the ability of the FFELP Loans in our portfolio to earn Floor Income after June 30, 2025 and 2024, based on interest rates as of those dates.
(Dollars in billions)
June 30, 2025
June 30, 2024
Education loans eligible to earn Floor Income
$
29.4
$
32.7
Less: post-March 31, 2006 disbursed loans required to rebate Floor Income
(14.2
)
(15.7
)
Less: economically hedged Floor Income
(.7
)
(1.8
)
Education loans eligible to earn Floor Income after rebates and economically hedged
$
14.5
$
15.2
Education loans earning Floor Income
$
4.9
$
.9
The following table presents a projection of the average balance of FFELP Consolidation Loans for which Fixed Rate Floor Income has been economically hedged with derivatives for the period July 1, 2025 to December 31, 2028.
(Dollars in billions)
July 1, 2025 to December 31, 2025
2026
2027
2028
Average balance of FFELP Consolidation Loans whose Floor Income is economically hedged
$
.7
$
.6
$
.3
$
.2
Provision for Loan Losses
Provision for loan losses increased $10 million. The $8 million of provision for loan losses in the current quarter was primarily the result of an increase in delinquency balances. The $(2) million of provision for loan losses in the year-ago quarter was the result of relatively stable credit trends.
Other Income
Other income decreased $7 million primarily as a result of lower late fees and third-party servicing fees.
Operating Expenses
Operating expenses for the Federal Education Loans segment primarily include costs incurred to perform servicing on our FFELP Loan portfolio and federal education loans held by other institutions. Expenses were $1 million higher primarily as a result of transitioning the servicing of our portfolio to a third party on July 1, 2024. As expected, for consolidated Navient (across the Federal Education Loan, Consumer Lending and Other segments), costs were neutral (net of transition services revenue earned) in second-quarter 2025 compared to costs we would have incurred if the servicing function remained in-house. Over the remaining life of the portfolio, we expect a significant overall cost savings to be realized. This increase in servicing expense was partially offset by the decline in the size of the portfolio.
14
Consumer Lending Segment
The following table presents Core Earnings results for our Consumer Lending segment.
Three Months Ended June 30,
% Increase (Decrease)
Six Months Ended June 30,
% Increase (Decrease)
(Dollars in millions)
2025
2024
2025 vs. 2024
2025
2024
2025 vs. 2024
Interest income:
Private Education Loans
$
273
$
317
(14
)%
$
562
$
645
(13
)%
Cash and investments
5
7
(29
)
10
14
(29
)
Interest income
278
324
(14
)
572
659
(13
)
Interest expense
183
198
(8
)
364
400
(9
)
Net interest income
95
126
(25
)
208
259
(20
)
Less: provision for loan losses
29
16
81
51
27
89
Net interest income after provision for loan losses
66
110
(40
)
157
232
(32
)
Total other income
3
3
—
6
8
(25
)
Direct operating expenses
36
34
6
70
67
4
Income before income tax expense
33
79
(58
)
93
173
(46
)
Income tax expense
7
19
(63
)
21
40
(48
)
Net income
$
26
$
60
(57
)%
$
72
$
133
(46
)%
Comparison of Second-Quarter 2025 Results with Second-Quarter 2024
•
Originated $500 million of Private Education Loans compared to $278 million.
o
Refinance Loan originations were $443 million compared to $222 million.
o
In-school loan originations were $57 million compared to $56 million.
•
Net income was $26 million compared to $60 million.
•
Net interest income decreased $31 million, of which $20 million was due to the paydown of the loan portfolio and $11 million was due to reserving for the increase in accrued interest receivable on loans greater than 90-days delinquent.
•
Provision for loan losses increased $13 million. The provision for loan losses of $29 million in the current period included $7 million in connection with loan originations and $22 million related to a general reserve build (primarily as a result of an increase in delinquency balances as well as a weakening in the forecasted macroeconomic metrics used to estimate expected losses). The provision for loan losses of $16 million in the year-ago period included $6 million in connection with loan originations and $10 million related to a general reserve build.
o
Excluding $1 million related to the change in the net charge-off rate on defaulted loans in second-quarter 2025, net charge-offs were $79 million, up $12 million from $67 million.
o
Private Education Loan delinquencies greater than 90 days: $459 million, up $108 million from $351 million.
o
Private Education Loan forbearances: $250 million, down $44 million from $294 million.
•
Expenses increased $2 million primarily as a result of higher marketing spend associated with higher loan origination volume.
Average balance of Private Education Refinance Loans
$
8,531
$
8,662
$
8,497
$
8,729
Ending balance of Private Education Refinance Loans
$
8,469
$
8,494
$
8,469
$
8,494
Private Education Refinance Loan originations
$
443
$
222
$
914
$
450
(1)
Excludes $1 million and $2 million of charge-offs on the expected future recoveries of previously fully charged-off loans in the three and six months ended June 30, 2025, respectively, as a result of increasing the net charge-off rate on defaulted loans.
Net Interest Margin
The following table details the net interest margin.
Three Months Ended June 30,
Six Months Ended June 30,
2025
2024
2025
2024
Private Education Loan yield
6.85
%
7.53
%
7.05
%
7.56
%
Private Education Loan cost of funds
(4.43
)
(4.52
)
(4.41
)
(4.50
)
Private Education Loan spread
2.42
3.01
2.64
3.06
Other interest-earning asset spread impact
(.10
)
(.12
)
(.10
)
(.12
)
Net interest margin(1)
2.32
%
2.89
%
2.54
%
2.94
%
(1)
The average balances of the interest-earning assets for the respective periods are:
Three Months Ended June 30,
Six Months Ended June 30,
(Dollars in millions)
2025
2024
2025
2024
Private Education Loans
$
15,992
$
16,936
$
16,075
$
17,160
Other interest-earning assets
482
572
485
558
Total Private Education Loan interest-earning assets
$
16,474
$
17,508
$
16,560
$
17,718
The 57 basis point decrease in the net interest margin in second-quarter 2025 is primarily the result of an $11 million increase (30 basis points) in reserving in connection with the increase in accrued interest receivable on loans greater than 90-days delinquent. In addition, the continued shift of the Refinance Loan portfolio becoming a higher percentage of the overall Private Education Loan portfolio and the Refinance Loan portfolio earning a lower net interest margin compared to the legacy portfolio reduces the overall net interest margin.
As of June 30, 2025, our Private Education Loan portfolio totaled $15.5 billion, comprised of $8.5 billion of refinance loans and $7.0 billion of non-refinance loans. The weighted-average life of these portfolios as of June 30, 2025 was 5 years and 5 years, respectively, assuming a CPR of 10% and 10%, respectively.
16
Provision for Loan Losses
The provision for Private Education Loan losses increased $13 million. The provision for loan losses of $29 million in second quarter 2025 included $7 million in connection with loan originations and $22 million related to a general reserve build (primarily as a result of an increase in delinquency balances as well as a weakening in the forecasted macroeconomic metrics used to estimate expected losses). The provision for loan losses of $16 million in the year-ago period included $6 million in connection with loan originations and $10 million related to a general reserve build.
Operating Expenses
Operating expenses for our consumer lending segment include costs to originate, acquire, service and collect on our consumer loan portfolio. Operating expenses increased $2 million primarily as a result of higher marketing spend associated with higher loan origination volume.
Business Processing Segment
The following table presents Core Earnings results for our Business Processing segment.
Three Months Ended June 30,
% Increase (Decrease)
Six Months Ended June 30,
% Increase (Decrease)
(Dollars in millions)
2025
2024
2025 vs. 2024
2025
2024
2025 vs. 2024
Business processing revenue
$
—
$
81
(100
)%
$
23
$
158
(85
)%
Direct operating expenses
—
62
(100
)
20
131
(85
)
Income before income tax expense
—
19
(100
)
3
27
(89
)
Income tax expense
—
4
(100
)
1
6
(83
)
Net income
$
—
$
15
(100
)%
$
2
$
21
(90
)%
Comparison of Second-Quarter 2025 Results with Second-Quarter 2024
•
With the sale of our government services business in February 2025, Navient no longer provides business processing segment services. Navient is providing certain transition services (reflected in the Other segment) in connection with the sale of our business processing businesses. The transition services in connection with the sale of our healthcare business ended May 2025 and we expect the transition services in connection with the sale of our government services business to be mostly completed by the end of 2025.
Key performance metrics are as follows:
Three Months Ended June 30,
Six Months Ended June 30,
(Dollars in millions)
2025
2024
2025
2024
Revenue from government services
$
—
$
49
$
23
$
97
Revenue from healthcare services
—
32
—
61
Total fee revenue
$
—
$
81
$
23
$
158
EBITDA(1)
$
—
$
20
$
3
$
29
EBITDA margin(1)
—
%
25
%
13
%
18
%
(1)
Item is a non-GAAP financial measure. For a description and reconciliation, see “Non-GAAP Financial Measures.”
17
Other Segment
The following table presents Core Earnings results for our Other segment.
Three Months Ended June 30,
% Increase (Decrease)
Six Months Ended June 30,
% Increase (Decrease)
(Dollars in millions)
2025
2024
2025 vs. 2024
2025
2024
2025 vs. 2024
Net interest loss after provision for loan losses
$
(19
)
$
(23
)
(17
)%
$
(36
)
$
(47
)
(23
)%
Other revenue (loss)
20
2
900
34
7
386
Expenses:
Unallocated shared services operating expenses:
Unallocated information technology costs
20
20
—
41
42
(2
)
Unallocated corporate costs
27
34
(21
)
59
77
(23
)
Total unallocated shared services operating expenses
47
54
(13
)
100
119
(16
)
Restructuring/other reorganization expenses
—
16
(100
)
3
17
(82
)
Total expenses
47
70
(33
)
103
136
(24
)
Loss before income tax benefit
(46
)
(91
)
(49
)
(105
)
(176
)
(40
)
Income tax benefit
(11
)
(21
)
(48
)
(24
)
(40
)
(40
)
Net income (loss)
$
(35
)
$
(70
)
(50
)%
$
(81
)
$
(136
)
(40
)%
Net Interest Loss after Provision for Loan Losses
Net interest loss after provision for loan losses is due to the negative carrying cost of our corporate liquidity portfolio. The amount of the net interest loss is primarily a result of the size of the liquidity portfolio as well as the cost of funds of the debt funding the corporate liquidity portfolio.
Other Revenue (Loss)
All revenue and expense in connection with the transition services we are performing related to the outsourcing of servicing and divestiture of our Business Processing segment are included in the Other segment. The increase from the year-ago quarter relates to these services.
Unallocated Shared Services Operating Expenses
Unallocated shared services operating expenses are costs primarily related to information technology costs related to infrastructure and operations, stock-based compensation expense, accounting, finance, legal, compliance and risk management, regulatory-related expenses, human resources, certain executive management, the Board of Directors, and transition services discussed above under "Other Revenue." Regulatory-related expenses include actual settlement amounts as well as third-party professional fees we incur in connection with such regulatory matters and are presented net of any insurance reimbursements for covered costs related to such matters. Expenses decreased $7 million from second-quarter 2024, primarily as a result of an $11 million decrease in regulatory-related expenses. Regulatory-related expenses were $1 million and $12 million in second quarters 2025 and 2024, respectively, with second-quarter 2024 including a contingency loss accrual of $20 million related to the $120 million settlement agreement entered into with the CFPB in September 2024. There was also a decrease in expenses related to cost reduction efforts in connection with the various strategic initiatives being implemented to simplify the Company, reduce our expense base and enhance our flexibility, which was mostly offset by $13 million of costs incurred providing temporary transition services in connection with the various strategic initiatives.
See “Note 10 – Commitments, Contingencies and Guarantees” for a discussion of legal and regulatory matters where it is reasonably possible that a loss contingency exists. The Company is unable to anticipate the timing of a resolution or the impact that certain matters may have on the Company’s consolidated financial position, liquidity, results of operation or cash flows. As a result, it is not possible at this time to estimate a range of potential exposure, if any, for amounts that may be payable in connection with certain matters and reserves have not been established. It is possible that an adverse ruling or rulings may have a material adverse impact on the Company.
Restructuring/Other Reorganization Expenses
These expenses decreased $16 million primarily due to a decrease in severance-related costs in connection with the various strategic initiatives being implemented to simplify the Company, reduce our expense base and enhance our flexibility.
18
Financial Condition
This section provides information regarding the balances, activity and credit performance metrics of our education loan portfolio.
Summary of Our Education Loan Portfolio
Ending Education Loan Balances, net
June 30, 2025
(Dollars in millions)
FFELP Stafford and Other
FFELP Consolidation Loans
Total FFELP Loans
Private Education Loans
Total Portfolio
Total education loan portfolio:
In-school(1)
$
8
$
—
$
8
$
88
$
96
Grace, repayment and other(2)
10,933
18,859
29,792
15,790
45,582
Total
10,941
18,859
29,800
15,878
45,678
Allowance for loan losses
(144
)
(38
)
(182
)
(348
)
(530
)
Total education loan portfolio
$
10,797
$
18,821
$
29,618
$
15,530
$
45,148
% of total FFELP
36
%
64
%
100
%
% of total
24
%
42
%
66
%
34
%
100
%
December 31, 2024
(Dollars in millions)
FFELP Stafford and Other
FFELP Consolidation Loans
Total FFELP Loans
Private Education Loans
Total Portfolio
Total education loan portfolio:
In-school(1)
$
9
$
—
$
9
$
95
$
104
Grace, repayment and other(2)
11,233
19,790
31,023
16,062
47,085
Total
11,242
19,790
31,032
16,157
47,189
Allowance for loan losses
(139
)
(41
)
(180
)
(441
)
(621
)
Total education loan portfolio
$
11,103
$
19,749
$
30,852
$
15,716
$
46,568
% of total FFELP
36
%
64
%
100
%
% of total
24
%
42
%
66
%
34
%
100
%
June 30, 2024
(Dollars in millions)
FFELP Stafford and Other
FFELP Consolidation Loans
Total FFELP Loans
Private Education Loans
Total Portfolio
Total education loan portfolio:
In-school(1)
$
11
$
—
$
11
$
70
$
81
Grace, repayment and other(2)
11,931
21,192
33,123
16,661
49,784
Total
11,942
21,192
33,134
16,731
49,865
Allowance for loan losses
(146
)
(48
)
(194
)
(493
)
(687
)
Total education loan portfolio
$
11,796
$
21,144
$
32,940
$
16,238
$
49,178
% of total FFELP
36
%
64
%
100
%
% of total
24
%
43
%
67
%
33
%
100
%
(1)
Loans for customers still attending school and are not yet required to make payments on the loan.
(2)
Includes loans in deferment or forbearance.
19
Education Loan Activity
Three Months Ended June 30, 2025
(Dollars in millions)
FFELP Stafford and Other
FFELP Consolidation Loans
Total FFELP Loans
Private Education Loans
Total Portfolio
Beginning balance
$
10,975
$
19,269
$
30,244
$
15,690
$
45,934
Acquisitions (originations and purchases)(1)
—
—
—
472
472
Capitalized interest and premium/discount amortization
130
129
259
42
301
Refinancings and consolidations to third parties
(103
)
(119
)
(222
)
(54
)
(276
)
Repayments and other
(205
)
(458
)
(663
)
(620
)
(1,283
)
Ending balance
$
10,797
$
18,821
$
29,618
$
15,530
$
45,148
Three Months Ended June 30, 2024
(Dollars in millions)
FFELP Stafford and Other
FFELP Consolidation Loans
Total FFELP Loans
Private Education Loans
Total Portfolio
Beginning balance
$
12,677
$
23,202
$
35,879
$
16,608
$
52,487
Acquisitions (originations and purchases)(1)
—
—
—
247
247
Capitalized interest and premium/discount amortization
120
127
247
47
294
Refinancings and consolidations to third parties
(749
)
(1,636
)
(2,385
)
(49
)
(2,434
)
Repayments and other
(252
)
(549
)
(801
)
(615
)
(1,416
)
Ending balance
$
11,796
$
21,144
$
32,940
$
16,238
$
49,178
Six Months Ended June 30, 2025
(Dollars in millions)
FFELP Stafford and Other
FFELP Consolidation Loans
Total FFELP Loans
Private Education Loans
Total Portfolio
Beginning balance
$
11,103
$
19,749
$
30,852
$
15,716
$
46,568
Acquisitions (originations and purchases)(1)
—
—
—
1,103
1,103
Capitalized interest and premium/discount amortization
267
252
519
91
610
Refinancings and consolidations to third parties
(186
)
(238
)
(424
)
(109
)
(533
)
Repayments and other
(387
)
(942
)
(1,329
)
(1,271
)
(2,600
)
Ending balance
$
10,797
$
18,821
$
29,618
$
15,530
$
45,148
Six Months Ended June 30, 2024
(Dollars in millions)
FFELP Stafford and Other
FFELP Consolidation Loans
Total FFELP Loans
Private Education Loans
Total Portfolio
Beginning balance
$
13,564
$
24,361
$
37,925
$
16,902
$
54,827
Acquisitions (originations and purchases)(1)
—
—
—
610
610
Capitalized interest and premium/discount amortization
254
267
521
106
627
Refinancings and consolidations to third parties
(1,231
)
(2,424
)
(3,655
)
(99
)
(3,754
)
Repayments and other
(791
)
(1,060
)
(1,851
)
(1,281
)
(3,132
)
Ending balance
$
11,796
$
21,144
$
32,940
$
16,238
$
49,178
(1)
Includes the origination of $73 million and $44 million of Private Education Refinance Loans in the second-quarters of 2025 and 2024, respectively, and $146 million and $91 million in the six months ended June 30, 2025 and 2024, respectively, that refinanced FFELP and Private Education Loans that were on our balance sheet
20
FFELP Loan Portfolio Performance
June 30, 2025
December 31, 2024
June 30, 2024
(Dollars in millions)
Balance
%
Balance
%
Balance
%
Loans in-school/grace/deferment(1)
$
1,280
$
1,262
$
1,403
Loans in forbearance(2)
3,653
4,365
5,320
Loans in repayment and percentage of each status:
Loans current
20,145
81.0
%
20,675
81.4
%
22,833
86.5
%
Loans delinquent 31-60 days(3)
1,333
5.4
1,479
5.8
1,041
3.9
Loans delinquent 61-90 days(3)
863
3.5
1,043
4.1
680
2.6
Loans delinquent greater than 90 days(3)
2,526
10.1
2,208
8.7
1,857
7.0
Total FFELP Loans in repayment
24,867
100
%
25,405
100
%
26,411
100
%
Total FFELP Loans
29,800
31,032
33,134
FFELP Loan allowance for losses
(182
)
(180
)
(194
)
FFELP Loans, net
$
29,618
$
30,852
$
32,940
Percentage of FFELP Loans in repayment
83.4
%
81.9
%
79.7
%
Delinquencies as a percentage of FFELP Loans in repayment
19.0
%
18.6
%
13.5
%
FFELP Loans in forbearance as a percentage of loans in repayment and forbearance
12.8
%
14.7
%
16.8
%
(1)
Loans for customers who may still be attending school or engaging in other permitted educational activities and are not yet required to make payments on their loans, e.g., residency periods for medical students or a grace period for bar exam preparation, as well as loans for customers who have requested and qualify for other permitted program deferments such as military, unemployment, or economic hardships.
(2)
Loans for customers who have used their allowable deferment time or do not qualify for deferment, that need additional time to obtain employment or who have temporarily ceased making payments due to hardship or other factors such as disaster relief.
(3)
The period of delinquency is based on the number of days scheduled payments are contractually past due.
Private Education Loan Portfolio Performance
June 30, 2025
December 31, 2024
June 30, 2024
(Dollars in millions)
Balance
%
Balance
%
Balance
%
Loans in-school/grace/deferment(1)
$
361
$
372
$
350
Loans in forbearance(2)
250
422
294
Loans in repayment and percentage of each status:
Loans current
14,296
93.6
%
14,419
93.9
%
15,250
94.8
%
Loans delinquent 31-60 days(3)
335
2.2
319
2.1
311
1.9
Loans delinquent 61-90 days(3)
177
1.2
206
1.3
175
1.1
Loans delinquent greater than 90 days(3)
459
3.0
419
2.7
351
2.2
Total Private Education Loans in repayment
15,267
100
%
15,363
100
%
16,087
100
%
Total Private Education Loans
15,878
16,157
16,731
Private Education Loan allowance for losses
(348
)
(441
)
(493
)
Private Education Loans, net
$
15,530
$
15,716
$
16,238
Percentage of Private Education Loans in repayment
96.2
%
95.1
%
96.2
%
Delinquencies as a percentage of Private Education Loans in repayment
6.4
%
6.1
%
5.2
%
Loans in forbearance as a percentage of loans in repayment and forbearance
1.6
%
2.7
%
1.8
%
Percentage of Private Education Loans with a cosigner(4)
32
%
32
%
32
%
(1)
Loans for customers who are attending school or are in other permitted educational activities and are not yet required to make payments on their loans, e.g., internship periods, as well as loans for customers who have requested and qualify for other permitted program deferments such as various military eligible deferments.
(2)
Loans for customers who have requested extension of grace period generally during employment transition or who have temporarily ceased making full payments due to hardship or other factors such as disaster relief consistent with established loan program servicing policies and procedures.
(3)
The period of delinquency is based on the number of days scheduled payments are contractually past due.
(4)
Excluding Private Education Refinance Loans, which do not have a cosigner, the cosigner rate was 66% for all periods presented.
21
Allowance for Loan Losses
Three Months Ended June 30,
2025
2024
(Dollars in millions)
FFELP Loans
Private Education Loans
Total
FFELP Loans
Private Education Loans
Total
Allowance at beginning of period
$
182
$
397
$
579
$
206
$
538
$
744
Total provision
8
29
37
(2
)
16
14
Charge-offs:
Gross charge-offs
(8
)
(92
)
(100
)
(10
)
(77
)
(87
)
Expected future recoveries on current period gross charge-offs
—
13
13
—
10
10
Total(1)
(8
)
(79
)
(87
)
(10
)
(67
)
(77
)
Adjustment resulting from the change in charge-off rate(2)
—
(1
)
(1
)
—
—
—
Net charge-offs
(8
)
(80
)
(88
)
(10
)
(67
)
(77
)
Decrease in expected future recoveries on previously fully charged-off loans(3)
—
2
2
—
6
6
Allowance at end of period (GAAP)
182
348
530
194
493
687
Plus: expected future recoveries on previously fully charged-off loans(3)
—
172
172
—
211
211
Allowance at end of period excluding expected future recoveries on previously fully charged-off loans (Non-GAAP Financial Measure)(4)
$
182
$
520
$
702
$
194
$
704
$
898
Net charge-offs as a percentage of average loans in repayment, excluding the net adjustment resulting from the change in charge-off rate (annualized)(2)
.14
%
2.06
%
.14
%
1.65
%
Net adjustment resulting from the change in charge -off rate as a percentage of average loans in repayment (annualized)(2)
—
%
.02
%
—
%
—
%
Net charge-offs as a percentage of average loans in repayment (annualized)
.14
%
2.08
%
.14
%
1.65
%
Allowance coverage of charge-offs (annualized)(4)
5.2
1.6
(Non-GAAP)
5.0
2.6
(Non-GAAP)
Allowance as a percentage of the ending total loan balance(4)
.6
%
3.3
%
(Non-GAAP)
.6
%
4.2
%
(Non-GAAP)
Allowance as a percentage of the ending loans in repayment(4)
.7
%
3.4
%
(Non-GAAP)
.7
%
4.4
%
(Non-GAAP)
Ending total loans
$
29,800
$
15,878
$
33,134
$
16,731
Average loans in repayment
$
25,133
$
15,375
$
27,509
$
16,271
Ending loans in repayment
$
24,867
$
15,267
$
26,411
$
16,087
(1)
Charge-offs are reported net of expected recoveries. For Private Education Loans, we charge off the estimated loss of a defaulted loan balance by charging off the entire defaulted loan balance and estimating recoveries on a pool basis. These estimated recoveries are referred to as "expected future recoveries on previously fully charged-off loans." For FFELP Loans, the recovery is received at the time of charge-off.
(2)
Related to increasing the net charge-off rate on defaulted Private Education Loans and the resulting reduction in the balance of expected future recoveries on previously fully charged-off loans.
(3)
At the end of each month, for Private Education Loans that are 212 days past due, we charge off the estimated loss of a defaulted loan balance by charging off the entire loan balance and estimating recoveries on a pool basis. These estimated recoveries are referred to as “expected future recoveries on previously fully charged-off loans.” If actual periodic recoveries are less than expected, the difference is immediately reflected as a reduction to expected future recoveries on previously fully charged-off loans. If actual periodic recoveries are greater than expected, they will be reflected as a recovery through the allowance for Private Education Loan losses once the cumulative recovery amount exceeds the cumulative amount originally expected to be recovered. The following table summarizes the activity in the expected future recoveries on previously fully charged-off loans
Three Months Ended June 30,
(Dollars in millions)
2025
2024
Beginning of period expected future recoveries on previously fully charged-off loans
$
174
$
217
Expected future recoveries of current period defaults
13
10
Recoveries (cash collected)
(11
)
(10
)
Charge-offs (as a result of lower recovery expectations)
(4
)
(6
)
End of period expected future recoveries on previously fully charged-off loans
$
172
$
211
Change in balance during period
$
(2
)
$
(6
)
(4)
The allowance used for these metrics excludes the expected future recoveries on previously fully charged-off loans to better reflect the current expected credit losses remaining in the portfolio.
22
Six Months Ended June 30,
2025
2024
(Dollars in millions)
FFELP Loans
Private Education Loans
Total
FFELP Loans
Private Education Loans
Total
Beginning balance
$
180
$
441
$
621
$
215
$
617
$
832
Total provision
16
51
67
(1
)
27
26
Charge-offs:
Gross charge-offs
(14
)
(173
)
(187
)
(20
)
(187
)
(207
)
Expected future recoveries on current period gross charge-offs
—
23
23
—
21
21
Total(1)
(14
)
(150
)
(164
)
(20
)
(166
)
(186
)
Adjustment resulting from the change in charge-off rate(2)
—
(2
)
(2
)
—
—
—
Net charge-offs
(14
)
(152
)
(166
)
(20
)
(166
)
(186
)
Decrease in expected future recoveries on previously fully charged-off loans(3)
—
8
8
—
15
15
Allowance at end of period (GAAP)
182
348
530
194
493
687
Plus: expected future recoveries on previously fully charged-off loans(3)
—
172
172
—
211
211
Allowance at end of period excluding expected future recoveries on previously fully charged-off loans (Non-GAAP Financial Measure)(4)
$
182
$
520
$
702
$
194
$
704
$
898
Net charge-offs as a percentage of average loans in repayment, excluding the net adjustment resulting from the change in the charge-off rate (annualized)(2)
.12
%
1.96
%
.14
%
2.03
%
Net adjustment resulting from the change in charge -off rate as a percentage of average loans in repayment (annualized)(2)
—
%
.02
%
—
%
—
%
Net charge-offs as a percentage of average loans in repayment (annualized)
.12
%
1.98
%
.14
%
2.03
%
Allowance coverage of charge-offs (annualized)(4)
6.1
1.7
(Non-GAAP)
4.9
2.1
(Non-GAAP)
Allowance as a percentage of the ending total loan balance(4)
.6
%
3.3
%
(Non-GAAP)
.6
%
4.2
%
(Non-GAAP)
Allowance as a percentage of the ending loans in repayment(4)
.7
%
3.4
%
(Non-GAAP)
.7
%
4.4
%
(Non-GAAP)
Ending total loans
$
29,800
$
15,878
$
33,134
$
16,731
Average loans in repayment
$
25,295
$
15,423
$
28,622
$
16,471
Ending loans in repayment
$
24,867
$
15,267
$
26,411
$
16,087
(1)
Charge-offs are reported net of expected recoveries. For Private Education Loans, we charge off the estimated loss of a defaulted loan balance by charging off the entire defaulted loan balance and estimating recoveries on a pool basis. These estimated recoveries are referred to as "expected future recoveries on previously fully charged-off loans." For FFELP Loans, the recovery is received at the time of charge-off.
(2)
Related to increasing the net charge-off rate on defaulted Private Education Loans and the resulting reduction in the balance of expected future recoveries on previously fully charged-off loans.
(3)
At the end of each month, for Private Education Loans that are 212 days past due, we charge off the estimated loss of a defaulted loan balance by charging off the entire loan balance and estimating recoveries on a pool basis. These estimated recoveries are referred to as “expected future recoveries on previously fully charged-off loans.” If actual periodic recoveries are less than expected, the difference is immediately reflected as a reduction to expected future recoveries on previously fully charged-off loans. If actual periodic recoveries are greater than expected, they will be reflected as a recovery through the allowance for Private Education Loan losses once the cumulative recovery amount exceeds the cumulative amount originally expected to be recovered. The following table summarizes the activity in the expected future recoveries on previously fully charged-off loans
Six Months Ended June 30,
(Dollars in millions)
2025
2024
Beginning of period expected future recoveries on previously fully charged-off loans
$
179
$
226
Expected future recoveries of current period defaults
23
21
Recoveries (cash collected)
(21
)
(21
)
Charge-offs (as a result of lower recovery expectations)
(10
)
(15
)
End of period expected future recoveries on previously fully charged-off loans
$
172
$
211
Change in balance during period
$
(8
)
$
(15
)
(4)
The allowance used for these metrics excludes the expected future recoveries on previously fully charged-off loans to better reflect the current expected credit losses remaining in the portfolio.
23
Liquidity and Capital Resources
Funding and Liquidity Risk Management
The following “Liquidity and Capital Resources” discussion concentrates primarily on our Federal Education Loans and Consumer Lending segments. Our Business Processing segment required minimal liquidity and funding.
We define liquidity as cash and high-quality liquid assets that we can use to meet our cash requirements. Our two primary liquidity needs are: (1) servicing our debt and (2) our ongoing ability to meet our cash needs for running the operations of our businesses (including derivative collateral requirements) throughout market cycles, including during periods of financial stress. Secondary liquidity needs, which can be adjusted as needed, include the origination of Private Education Loans, acquisitions of Private Education Loan portfolios, acquisitions of companies, the payment of common stock dividends and the repurchase of our common stock. To achieve these objectives, we analyze and monitor our liquidity needs and maintain excess liquidity and access to diverse funding sources including the issuance of unsecured debt and the issuance of secured debt primarily through asset-backed securitizations and/or other financing facilities.
We define our liquidity risk as the potential inability to meet our obligations when they become due without incurring unacceptable losses or to invest in future asset growth and business operations at reasonable market rates. Our primary liquidity risk relates to our ability to service our debt, meet our other business obligations and to continue to grow our business. The ability to access the capital markets is impacted by general market and economic conditions, our credit ratings, as well as the overall availability of funding sources in the marketplace. In addition, credit ratings may be important to customers or counterparties when we compete in certain markets and when we seek to engage in certain transactions.
Credit ratings and outlooks are opinions subject to ongoing review by the rating agencies and may change, from time to time, based on our financial performance, industry and market dynamics and other factors. Other factors that influence our credit ratings include the rating agencies’ assessment of the general operating environment, our relative positions in the markets in which we compete, reputation, liquidity position, the level and volatility of earnings, corporate governance and risk management policies, capital position and capital management practices. A negative change in our credit rating could have a negative effect on our liquidity because it might raise the cost and availability of funding and potentially require additional cash collateral or restrict cash currently held as collateral on existing borrowings or derivative collateral arrangements. It is our objective to improve our credit ratings so that we can continue to efficiently access the capital markets even in difficult economic and market conditions. We have unsecured debt totaling $5.3 billion at June 30, 2025. Three credit rating agencies currently rate our long-term unsecured debt at below investment grade.
We expect to fund our ongoing liquidity needs, including the repayment of $0.5 billion of senior unsecured notes that mature in the short term (i.e., over the next 12 months) and the remaining $4.8 billion of senior unsecured notes that mature in the long term (from 2026 to 2043 with 69% maturing by 2031), through a number of sources. These sources include our cash on hand, unencumbered FFELP Loan and Private Education Refinance Loan portfolios (see “Sources of Primary Liquidity” below), the predictable operating cash flows provided by operating activities, the repayment of principal on unencumbered education loan assets, and the distribution of overcollateralization from our securitization trusts. We may also, depending on market conditions and availability, draw down on our secured FFELP Loan and Private Education Loan asset-backed commercial paper (ABCP) facilities, issue term ABS, enter into additional Private Education Loan and FFELP Loan ABS repurchase facilities, or issue additional unsecured debt.
We originate Private Education Loans (a portion of which is obtained through a forward purchase agreement). We also have purchased and may purchase, in future periods, Private Education Loan portfolios from third parties. Those originations and purchases are part of our ongoing liquidity needs. We purchased 1.9 million shares of common stock for $24 million in the first quarter of 2025 and have $52 million of unused share repurchase authority as of June 30, 2025.
24
Sources of Primary Liquidity
(Dollars in millions)
June 30, 2025
December 31, 2024
June 30, 2024
Ending Balances:
Unrestricted cash
$
712
$
722
$
1,088
Unencumbered FFELP Loans
51
232
160
Unencumbered Private Education Refinance Loans
510
242
326
Total
$
1,273
$
1,196
$
1,574
Three Months Ended
Six Months Ended
(Dollars in millions)
June 30, 2025
December 31, 2024
June 30, 2024
June 30, 2025
June 30, 2024
Average Balances:
Unrestricted cash
$
743
$
737
$
1,116
$
658
$
941
Unencumbered FFELP Loans
73
316
148
123
132
Unencumbered Private Education Refinance Loans
629
433
224
517
221
Total
$
1,445
$
1,486
$
1,488
$
1,298
$
1,294
Sources of Additional Liquidity
Liquidity may also be available under our secured credit facilities. Maximum borrowing capacity under the FFELP Loan and Private Education Loan ABCP facilities will vary and be subject to each agreement’s borrowing conditions, including, among others, facility size, current usage and availability of qualifying collateral from unencumbered loans. The following tables detail the additional borrowing capacity of these facilities with maturity dates ranging from October 2025 to April 2027.
(Dollars in millions)
June 30, 2025
December 31, 2024
June 30, 2024
Ending Balances:
FFELP Loan ABCP facilities
$
190
$
424
$
416
Private Education Loan ABCP facilities
1,754
1,490
2,088
Total
$
1,944
$
1,914
$
2,504
Three Months Ended
Six Months Ended
(Dollars in millions)
June 30, 2025
December 31, 2024
June 30, 2024
June 30, 2025
June 30, 2024
Average Balances:
FFELP Loan ABCP facilities
$
219
$
423
$
409
$
284
$
409
Private Education Loan ABCP facilities
1,613
1,799
1,664
1,530
1,613
Total
$
1,832
$
2,222
$
2,073
$
1,814
$
2,022
At June 30, 2025, we had a total of $2.9 billion of unencumbered tangible assets inclusive of those listed in the table above as sources of primary liquidity. Total unencumbered education loans comprised $1.3 billion of our unencumbered tangible assets of which $1.3 billion and $51 million related to Private Education Loans and FFELP Loans, respectively. In addition, as of June 30, 2025, we had $4.8 billion of encumbered net assets (i.e., overcollateralization) in our various financing facilities (consolidated variable interest entities). We enter into repurchase facilities at times to borrow against the encumbered net assets of these financing vehicles. As of June 30, 2025, $0.7 billion of repurchase facility borrowings were outstanding.
25
The following table reconciles encumbered and unencumbered assets and their net impact on total Tangible Equity.
(Dollars in billions)
June 30, 2025
December 31, 2024
Net assets of consolidated variable interest entities (encumbered assets) — FFELP Loans
$
2.8
$
2.8
Net assets of consolidated variable interest entities (encumbered assets) — Private Education Loans
2.0
2.0
Tangible unencumbered assets(1)
2.9
2.9
Senior unsecured debt
(5.3
)
(5.4
)
Mark-to-market on unsecured hedged debt(2)
—
.2
Other liabilities, net
(.3
)
(.3
)
Total Tangible Equity (3)
$
2.1
$
2.2
(1)
Excludes goodwill and acquired intangible assets.
(2)
At June 30, 2025 and December 31, 2024, there were $(72) million and $(181) million, respectively, of net gains (losses) on derivatives hedging this debt in unencumbered assets, which partially offset these gains (losses).
(3)
Item is a non-GAAP financial measure. For a description and reconciliation, see “Non-GAAP Financial Measures.”
Borrowings
Ending Balances
June 30, 2025
December 31, 2024
(Dollars in millions)
Short Term
Long Term
Total
Short Term
Long Term
Total
Unsecured borrowings:
Senior unsecured debt
$
505
$
4,798
$
5,303
$
553
$
4,806
$
5,359
Total unsecured borrowings
505
4,798
5,303
553
4,806
5,359
Secured borrowings:
FFELP Loan securitizations
117
26,948
27,065
41
28,268
28,309
Private Education Loan securitizations
562
10,322
10,884
631
10,338
10,969
FFELP Loan ABCP facilities
1,531
301
1,832
1,586
74
1,660
Private Education Loan ABCP facilities
1,943
—
1,943
2,274
—
2,274
Other
97
39
136
54
40
94
Total secured borrowings
4,250
37,610
41,860
4,586
38,720
43,306
Core Earnings basis borrowings(1)
4,755
42,408
47,163
5,139
43,526
48,665
Adjustment for GAAP accounting treatment
(3
)
(63
)
(66
)
(5
)
(342
)
(347
)
GAAP basis borrowings
$
4,752
$
42,345
$
47,097
$
5,134
$
43,184
$
48,318
Average Balances
Three Months Ended June 30,
Six Months Ended June 30,
2025
2024
2025
2024
(Dollars in millions)
Average Balance
Average Rate
Average Balance
Average Rate
Average Balance
Average Rate
Average Balance
Average Rate
Unsecured borrowings:
Senior unsecured debt
$
5,512
8.48
%
$
5,859
9.26
%
$
5,419
8.50
%
$
5,858
9.25
%
Total unsecured borrowings
5,512
8.48
5,859
9.26
5,419
8.50
5,858
9.25
Secured borrowings:
FFELP Loan securitizations
27,372
5.46
32,938
6.42
27,691
5.55
33,899
6.38
Private Education Loan securitizations
10,690
3.68
11,777
3.67
10,714
3.65
11,842
3.61
FFELP Loan ABCP facilities
1,820
5.76
1,761
6.94
1,772
5.82
1,827
6.96
Private Education Loan ABCP facilities
2,105
6.34
2,156
7.36
2,204
6.33
2,199
7.31
Other
105
1.57
96
(3.45
)
98
.91
104
(2.50
)
Total secured borrowings
42,092
5.06
48,728
5.79
42,479
5.11
49,871
5.77
Core Earnings basis borrowings(1)
47,604
5.45
54,587
6.17
47,898
5.50
55,729
6.14
Adjustment for GAAP accounting treatment
—
.03
—
.04
—
.07
—
.06
GAAP basis borrowings
$
47,604
5.48
%
$
54,587
6.21
%
$
47,898
5.57
%
$
55,729
6.20
%
(1)
Item is a non-GAAP financial measure. For a description and reconciliation, see “Non-GAAP Financial Measures.” The differences in derivative accounting give rise to the difference above.
26
Critical Accounting Policies and Estimates
Management’s Discussion and Analysis of Financial Condition and Results of Operations addresses our consolidated financial statements, which have been prepared in accordance with generally accepted accounting principles in the United States of America (GAAP). A discussion of our critical accounting policies, which includes the allowance for loan losses, goodwill impairment assessment, premium and discount amortization, and the impact of the SDR Plan on our accounting policies and estimates, can be found in our 2024 Form 10-K.
Non-GAAP Financial Measures
In addition to financial results reported on a GAAP basis, Navient also provides certain performance measures which are non-GAAP financial measures. We present the following non-GAAP financial measures: (1) Core Earnings, (2) Tangible Equity (as well as the Adjusted Tangible Equity Ratio), (3) EBITDA for the Business Processing segment, and (4) Allowance for Loan Losses Excluding Expected Future Recoveries on Previously Fully Charged-off Loans. Definitions for the non-GAAP financial measures and reconciliations are provided below, except that reconciliations of forward-looking non-GAAP financial measures are not provided because the Company is unable to provide such reconciliations without unreasonable effort due to the uncertainty and inherent difficulty of predicting the occurrence and financial impact of certain items, including, but not limited to, the impact of any mark-to-market gains/losses resulting from our use of derivative instruments to hedge our economic risks.
1. Core Earnings
We prepare financial statements and present financial results in accordance with GAAP. However, we also evaluate our business segments and present financial results on a basis that differs from GAAP. We refer to this different basis of presentation as Core Earnings. We provide this Core Earnings basis of presentation on a consolidated basis and for each business segment because this is what we review internally when making management decisions regarding our performance and how we allocate resources. We also refer to this information in our presentations with credit rating agencies, lenders and investors. Because our Core Earnings basis of presentation corresponds to our segment financial presentations, we are required by GAAP to provide certain Core Earnings disclosures in the notes to our consolidated financial statements for our business segments.
Core Earnings are not a substitute for reported results under GAAP. We use Core Earnings to manage our business segments because Core Earnings reflect adjustments to GAAP financial results for two items, discussed below, that can create significant volatility mostly due to timing factors generally beyond the control of management. Accordingly, we believe that Core Earnings provide management with a useful basis from which to better evaluate results from ongoing operations against the business plan or against results from prior periods. Consequently, we disclose this information because we believe it provides investors with additional information regarding the operational and performance indicators that are most closely assessed by management. When compared to GAAP results, the two items we remove to result in our Core Earnings presentations are:
(1)
Mark-to-market gains/losses resulting from our use of derivative instruments to hedge our economic risks that do not qualify for hedge accounting treatment or do qualify for hedge accounting treatment but result in ineffectiveness; and
(2)
The accounting for goodwill and acquired intangible assets.
While GAAP provides a uniform, comprehensive basis of accounting, for the reasons described above, our Core Earnings basis of presentation does not. Core Earnings are subject to certain general and specific limitations that investors should carefully consider. For example, there is no comprehensive, authoritative guidance for management reporting. Our Core Earnings are not defined terms within GAAP and may not be comparable to similarly titled measures reported by other companies. Accordingly, our Core Earnings presentation does not represent a comprehensive basis of accounting. Investors, therefore, may not be able to compare our performance with that of other financial services companies based upon Core Earnings. Core Earnings results are only meant to supplement GAAP results by providing additional information regarding the operational and performance indicators that are most closely used by management, our Board of Directors, credit rating agencies, lenders and investors to assess performance.
27
The following tables show our consolidated GAAP results, Core Earnings results (including for each reportable segment) along with the adjustments made to the income/expense items to reconcile the consolidated GAAP results to the Core Earnings results as required by GAAP and reported in “Note 11 — Segment Reporting.”
Three Months Ended June 30, 2025
Adjustments
Reportable Segments
(Dollars in millions)
Total GAAP
Reclassi- fications
Additions/ (Subtractions)
Total Adjustments (1)
Total Core Earnings
Federal Education Loans
Consumer Lending
Business Processing
Other
Interest income:
Education loans
$
756
$
483
$
273
$
—
$
—
Cash and investments
22
10
5
—
7
Total interest income
778
493
278
—
7
Total interest expense
650
438
183
—
26
Net interest income (loss)
128
$
5
$
(2
)
$
3
$
131
55
95
—
(19
)
Less: provisions for loan losses
37
37
8
29
—
—
Net interest income (loss) after provisions for loan losses
91
47
66
—
(19
)
Other income (loss):
Servicing revenue
14
11
3
—
—
Asset recovery and business processing revenue
—
—
—
—
—
Other revenue (loss)
14
(1
)
—
—
20
Total other income
28
(5
)
10
5
33
10
3
—
20
Expenses:
Direct operating expenses
53
17
36
—
—
Unallocated shared services expenses
47
—
—
—
47
Operating expenses
100
—
—
—
100
17
36
—
47
Goodwill and acquired intangible asset impairment and amortization
1
—
(1
)
(1
)
—
—
—
—
—
Restructuring/other reorganization expenses
—
—
—
—
—
—
—
—
—
Total expenses
101
—
(1
)
(1
)
100
17
36
—
47
Income (loss) before income tax expense (benefit)
18
—
9
9
27
40
33
—
(46
)
Income tax expense (benefit)(2)
4
—
2
2
6
10
7
—
(11
)
Net income (loss)
$
14
$
—
$
7
$
7
$
21
$
30
$
26
$
—
$
(35
)
(1)
Core Earnings adjustments to GAAP:
Three Months Ended June 30, 2025
(Dollars in millions)
Net Impact of Derivative Accounting
Net Impact of Goodwill and Acquired Intangibles
Total
Net interest income (loss) after provisions for loan losses
$
3
$
—
$
3
Total other income (loss)
5
—
5
Goodwill and acquired intangible asset impairment and amortization
—
(1
)
(1
)
Total Core Earnings adjustments to GAAP
$
8
$
1
9
Income tax expense (benefit)
2
Net income (loss)
$
7
(2)
Income taxes are based on a percentage of net income before tax for the individual reportable segment.
28
Three Months Ended June 30, 2024
Adjustments
Reportable Segments
(Dollars in millions)
Total GAAP
Reclassi- fications
Additions/ (Subtractions)
Total Adjustments (1)
Total Core Earnings
Federal Education Loans
Consumer Lending
Business Processing
Other
Interest income:
Education loans
$
925
$
608
$
317
$
—
$
—
Cash and investments
48
28
7
—
13
Total interest income
973
636
324
—
13
Total interest expense
843
603
198
—
36
Net interest income (loss)
130
$
9
$
(3
)
$
6
$
136
33
126
—
(23
)
Less: provisions for loan losses
14
14
(2
)
16
—
—
Net interest income (loss) after provisions for loan losses
116
35
110
—
(23
)
Other income (loss):
Servicing revenue
18
15
3
—
—
Asset recovery and business processing revenue
81
—
—
81
—
Other revenue
18
2
—
—
2
Total other income
117
(9
)
(5
)
(14
)
103
17
3
81
2
Expenses:
Direct operating expenses
112
16
34
62
—
Unallocated shared services expenses
54
—
—
—
54
Operating expenses
166
—
—
—
166
16
34
62
54
Goodwill and acquired intangible asset impairment and amortization
3
—
(3
)
(3
)
—
—
—
—
—
Restructuring/other reorganization expenses
16
—
—
—
16
—
—
—
16
Total expenses
185
—
(3
)
(3
)
182
16
34
62
70
Income (loss) before income tax expense (benefit)
48
—
(5
)
(5
)
43
36
79
19
(91
)
Income tax expense (benefit)(2)
12
—
(2
)
(2
)
10
8
19
4
(21
)
Net income (loss)
$
36
$
—
$
(3
)
$
(3
)
$
33
$
28
$
60
$
15
$
(70
)
(1)
Core Earnings adjustments to GAAP:
Three Months Ended June 30, 2024
(Dollars in millions)
Net Impact of Derivative Accounting
Net Impact of Goodwill and Acquired Intangibles
Total
Net interest income (loss) after provisions for loan losses
$
6
$
—
$
6
Total other income (loss)
(14
)
—
(14
)
Goodwill and acquired intangible asset impairment and amortization
—
(3
)
(3
)
Total Core Earnings adjustments to GAAP
$
(8
)
$
3
(5
)
Income tax expense (benefit)
(2
)
Net income (loss)
$
(3
)
(2)
Income taxes are based on a percentage of net income before tax for the individual reportable segment.
29
Six Months Ended June 30, 2025
Adjustments
Reportable Segments
(Dollars in millions)
Total GAAP
Reclassi- fications
Additions/ (Subtractions)
Total Adjustments (1)
Total Core Earnings
Federal Education Loans
Consumer Lending
Business Processing
Other
Interest income:
Education loans
$
1,537
$
975
$
562
$
—
$
—
Cash and investments
43
20
10
—
13
Total interest income
1,580
995
572
—
13
Total interest expense
1,322
892
364
—
49
Net interest income (loss)
258
$
11
$
6
$
17
$
275
103
208
—
(36
)
Less: provisions for loan losses
67
67
16
51
—
—
Net interest income (loss) after provisions for loan losses
191
87
157
—
(36
)
Other income (loss):
Servicing revenue
27
21
6
—
—
Asset recovery and business processing revenue
23
—
—
23
—
Other revenue (loss)
3
(1
)
—
—
34
Total other income
53
(11
)
41
30
83
20
6
23
34
Expenses:
Direct operating expenses
127
37
70
20
—
Unallocated shared services expenses
100
—
—
—
100
Operating expenses
227
—
—
—
227
37
70
20
100
Goodwill and acquired intangible asset impairment and amortization
2
—
(2
)
(2
)
—
—
—
—
—
Restructuring/other reorganization expenses
3
—
—
—
3
—
—
—
3
Total expenses
232
—
(2
)
(2
)
230
37
70
20
103
Income (loss) before income tax expense (benefit)
12
—
49
49
61
70
93
3
(105
)
Income tax expense (benefit)(2)
1
—
13
13
14
16
21
1
(24
)
Net income (loss)
$
11
$
—
$
36
$
36
$
47
$
54
$
72
$
2
$
(81
)
(1)
Core Earnings adjustments to GAAP:
Six Months Ended June 30, 2025
(Dollars in millions)
NetImpact of Derivative Accounting
Net Impact of Goodwill and Acquired Intangibles
Total
Net interest income (loss) after provisions for loan losses
$
17
$
—
$
17
Total other income (loss)
30
—
30
Goodwill and acquired intangible asset impairment and amortization
—
(2
)
(2
)
Total Core Earnings adjustments to GAAP
$
47
$
2
49
Income tax expense (benefit)
13
Net income (loss)
$
36
(2)
Income taxes are based on a percentage of net income before tax for the individual reportable segment.
30
Six Months Ended June 30, 2024
Adjustments
Reportable Segments
(Dollars in millions)
Total GAAP
Reclassi- fications
Additions/ (Subtractions)
Total Adjustments (1)
Total Core Earnings
Federal Education Loans
Consumer Lending
Business Processing
Other
Interest income:
Education loans
$
1,914
$
1,269
$
645
$
—
$
—
Cash and investments
86
51
14
—
21
Total interest income
2,000
1,320
659
—
21
Total interest expense
1,718
1,233
400
—
68
Net interest income (loss)
282
$
19
$
(2
)
$
17
$
299
87
259
—
(47
)
Less: provisions for loan losses
26
26
(1
)
27
—
—
Net interest income (loss) after provisions for loan losses
256
88
232
—
(47
)
Other income (loss):
Servicing revenue
35
28
7
—
—
Asset recovery and business processing revenue
158
—
—
158
—
Other revenue
59
5
1
—
7
Total other income
252
(19
)
(27
)
(46
)
206
33
8
158
7
Expenses:
Direct operating expenses
231
33
67
131
—
Unallocated shared services expenses
119
—
—
—
119
Operating expenses
350
—
—
—
350
33
67
131
119
Goodwill and acquired intangible asset impairment and amortization
5
—
(5
)
(5
)
—
—
—
—
—
Restructuring/other reorganization expenses
17
—
—
—
17
—
—
—
17
Total expenses
372
—
(5
)
(5
)
367
33
67
131
136
Income (loss) before income tax expense (benefit)
136
—
(24
)
(24
)
112
88
173
27
(176
)
Income tax expense (benefit)(2)
27
—
(1
)
(1
)
26
20
40
6
(40
)
Net income (loss)
$
109
$
—
$
(23
)
$
(23
)
$
86
$
68
$
133
$
21
$
(136
)
(1)
Core Earnings adjustments to GAAP:
Six Months Ended June 30, 2024
(Dollars in millions)
Net Impact of Derivative Accounting
Net Impact of Goodwill and Acquired Intangibles
Total
Net interest income (loss) after provisions for loan losses
$
17
$
—
$
17
Total other income (loss)
(46
)
—
(46
)
Goodwill and acquired intangible asset impairment and amortization
—
(5
)
(5
)
Total Core Earnings adjustments to GAAP
$
(29
)
$
5
(24
)
Income tax expense (benefit)
(1
)
Net income (loss)
$
(23
)
(2)
Income taxes are based on a percentage of net income before tax for the individual reportable segment.
31
The following discussion summarizes the differences between Core Earnings and GAAP net income and details each specific adjustment required to reconcile our Core Earnings segment presentation to our GAAP earnings.
Three Months Ended June 30,
Six Months Ended June 30,
(Dollars in millions)
2025
2024
2025
2024
GAAP net income (loss)
$
14
$
36
$
11
$
109
Core Earnings adjustments to GAAP:
Net impact of derivative accounting
8
(8
)
47
(29
)
Net impact of goodwill and acquired intangible assets
1
3
2
5
Net income tax effect
(2
)
2
(13
)
1
Total Core Earnings adjustments to GAAP
7
(3
)
36
(23
)
Core Earnings net income
$
21
$
33
$
47
$
86
(1) Derivative Accounting: Core Earnings exclude periodic gains and losses that are caused by the mark-to-market valuations on derivatives that do not qualify for hedge accounting treatment under GAAP, as well as the periodic mark-to-market gains and losses that are a result of ineffectiveness recognized related to effective hedges under GAAP. Under GAAP, for our derivatives that are held to maturity, the mark-to-market gain or loss over the life of the contract will equal $0. In our Core Earnings presentation, we recognize the economic effect of these hedges, which generally results in any net settlement cash paid or received being recognized ratably as an interest expense or revenue over the hedged item’s life.
The accounting for derivatives requires that changes in the fair value of derivative instruments be recognized currently in earnings, with no fair value adjustment of the hedged item, unless specific hedge accounting criteria are met. The gains and losses recorded in “Gains (losses) on derivative and hedging activities, net” and interest expense (for qualifying fair value hedges) are primarily caused by interest rate and foreign currency exchange rate volatility and changing credit spreads during the period as well as the volume and term of derivatives not receiving hedge accounting treatment. We believe that our derivatives are effective economic hedges, and as such, are a critical element of our interest rate and foreign currency risk management strategy. However, some of our derivatives do not qualify for hedge accounting treatment and the stand-alone derivative is adjusted to fair value in the income statement with no consideration for the corresponding change in fair value of the hedged item. See our 2024 Form 10-K for further discussion.
32
The table below quantifies the adjustments for derivative accounting between GAAP and Core Earnings net income.
Three Months Ended June 30,
Six Months Ended June 30,
(Dollars in millions)
2025
2024
2025
2024
Core Earnings derivative adjustments:
(Gains) losses on derivative and hedging activities, net, included in other income
$
5
$
(14
)
$
30
$
(46
)
Plus: (Gains) losses on fair value hedging activity included in interest expense
(4
)
(5
)
2
(5
)
Total (gains) losses in GAAP net income
1
(19
)
32
(51
)
Plus: Reclassification of settlement income (expense) on derivative and hedging activities, net(1)
5
9
11
19
Mark-to-market (gains) losses on derivative and hedging activities, net(2)
6
(10
)
43
(32
)
Other derivative accounting adjustments(3)
2
2
4
3
Total net impact of derivative accounting
$
8
$
(8
)
$
47
$
(29
)
(1)
Derivative accounting requires net settlement income/expense on derivatives that do not qualify as hedges to be recorded in a separate income statement line item below net interest income. Under our Core Earnings presentation, these settlements are reclassified to the income statement line item of the economically hedged item. For our Core Earnings net interest income, this would primarily include reclassifying the net settlement amounts related to certain of our interest rate swaps to debt interest expense. The table below summarizes these net settlements on derivative and hedging activities and the associated reclassification on a Core Earnings basis.
Three Months Ended June 30,
Six Months Ended June 30,
(Dollars in millions)
2025
2024
2025
2024
Reclassification of settlements on derivative and hedging activities:
Net settlement income (expense) on interest rate swaps reclassified to net interest income
$
5
$
9
$
11
$
19
Total reclassifications of settlement income (expense) on derivative and hedging activities
$
5
$
9
$
11
$
19
(2)
“Mark-to-market (gains) losses on derivative and hedging activities, net” is comprised of the following:
Three Months Ended June 30,
Six Months Ended June 30,
(Dollars in millions)
2025
2024
2025
2024
Fair value hedges
$
4
$
2
$
7
$
(2
)
Foreign currency hedges
(8
)
(7
)
(5
)
(3
)
Other (a)
10
(5
)
41
(27
)
Total mark-to-market (gains) losses on derivative and hedging activities, net
$
6
$
(10
)
$
43
$
(32
)
(a)
Primarily derivatives that are used to economically hedge the origination of fixed rate Private Education Loans that don't qualify for hedge accounting. We believe that these derivatives are effective economic hedges, and as such, are a critical element of our interest rate risk management strategy.
(3)
Other derivative accounting adjustments consist of adjustments related to certain terminated derivatives that did not receive hedge accounting treatment under GAAP but were economic hedges under Core Earnings and, as a result, such gains or losses are amortized into Core Earnings over the life of the hedged item.
33
Cumulative Impact of Derivative Accounting under GAAP compared to Core Earnings
As of June 30, 2025, derivative accounting has decreased GAAP equity by approximately $30 million as a result of cumulative net mark-to-market losses (after tax) recognized under GAAP, but not in Core Earnings. The following table rolls forward the cumulative impact to GAAP equity due to these after-tax mark-to-market net gains and losses related to derivative accounting.
Three Months Ended June 30,
Six Months Ended June 30,
(Dollars in millions)
2025
2024
2025
2024
Beginning impact of derivative accounting on GAAP equity
$
(22
)
$
11
$
8
$
(1
)
Net impact of net mark-to-market gains (losses) under derivative accounting(1)
(8
)
1
(38
)
13
Ending impact of derivative accounting on GAAP equity
$
(30
)
$
12
$
(30
)
$
12
(1)
Net impact of net mark-to-market gains (losses) under derivative accounting is composed of the following:
Three Months Ended June 30,
Six Months Ended June 30,
(Dollars in millions)
2025
2024
2025
2024
Total pre-tax net impact of derivative accounting recognized in net income(2)
$
(8
)
$
8
$
(47
)
$
29
Tax and other impacts of derivative accounting adjustments
2
(2
)
12
(7
)
Change in mark-to-market gains (losses) on derivatives, net of tax recognized in other comprehensive income
(2
)
(5
)
(3
)
(9
)
Net impact of net mark-to-market gains (losses) under derivative accounting
$
(8
)
$
1
$
(38
)
$
13
(2)
See “Core Earnings derivative adjustments” table above.
Hedging Embedded Floor Income
We use pay-fixed swaps and fixed rate debt to economically hedge embedded Floor Income in our FFELP Loans. Historically, we have used these instruments on a periodic basis and depending upon market conditions and pricing, we may enter into additional hedges in the future. Under GAAP, the pay-fixed swaps are accounted for as cash flow hedges. The table below shows the amount of hedged Floor Income that will be recognized in Core Earnings in future periods based on these hedge strategies.
(Dollars in millions)
June 30, 2025
June 30, 2024
Total hedged Floor Income, net of tax(1)(2)
$
35
$
69
(1)
$46 million and $90 million on a pre-tax basis as of June 30, 2025 and June 30, 2024, respectively.
(2)
Of the $35 million as of June 30, 2025, approximately $8 million, $14 million, $7 million and $6 million will be recognized as part of Core Earnings net income in the remainder of 2025, 2026, 2027 and 2028, respectively.
(2)Goodwill and Acquired Intangible Assets: Our Core Earnings exclude goodwill and intangible asset impairment and the amortization of acquired intangible assets. The following table summarizes the goodwill and acquired intangible asset adjustments.
Three Months Ended June 30,
Six Months Ended June 30,
(Dollars in millions)
2025
2024
2025
2024
Core Earnings goodwill and acquired intangible asset adjustments
$
1
$
3
$
2
$
5
34
2. Tangible Equity and Adjusted Tangible Equity Ratio
Adjusted Tangible Equity Ratio measures the ratio of Navient’s Tangible Equity to its tangible assets. We adjust this ratio to exclude the assets and equity associated with our FFELP Loan portfolio because FFELP Loans are no longer originated and the FFELP Loan portfolio bears a 3% maximum loss exposure under the terms of the federal guaranty. Management believes that excluding this portfolio from the ratio enhances its usefulness to investors. Management uses this ratio, in addition to other metrics, for analysis and decision making related to capital allocation decisions. The Adjusted Tangible Equity Ratio is calculated as:
(Dollars in millions)
June 30, 2025
June 30, 2024
Navient Corporation's stockholders' equity
$
2,564
$
2,748
Less: Goodwill and acquired intangible assets
436
690
Tangible Equity
2,128
2,058
Less: Equity held for FFELP Loans
148
165
Adjusted Tangible Equity
$
1,980
$
1,893
Divided by:
Total assets
$
50,222
$
56,622
Less:
Goodwill and acquired intangible assets
436
690
FFELP Loans
29,618
32,940
Adjusted tangible assets
$
20,168
$
22,992
Adjusted Tangible Equity Ratio
9.8
%
8.2
%
3. Earnings before Interest, Taxes, Depreciation and Amortization Expense (EBITDA)
This measures the operating performance of the Business Processing segment and is used by management and equity investors to monitor operating performance and determine the value of those businesses. EBITDA for the Business Processing segment is calculated as:
Three Months Ended June 30,
Six Months Ended June 30,
(Dollars in millions)
2025
2024
2025
2024
Pre-tax income
$
—
$
19
$
3
$
27
Plus:
Depreciation and amortization expense(1)
—
1
—
2
EBITDA
$
—
$
20
$
3
$
29
Divided by:
Total revenue
$
—
$
81
$
23
$
158
EBITDA margin
—
%
25
%
13
%
18
%
(1)
There is no interest expense in this segment.
35
4. Allowance for Loan Losses Excluding Expected Future Recoveries on Previously Fully Charged-off
Loans
The allowance for loan losses on the Private Education Loan portfolio used for the three credit metrics below excludes the expected future recoveries on previously fully charged-off loans to better reflect the current expected credit losses remaining in connection with the loans on balance sheet that have not charged off. That is, as of June 30, 2025, the $520 million Private Education Loan allowance for loan losses excluding expected future recoveries on previously fully charged-off loans represents the current expected credit losses that remain in connection with the $15,878 million Private Education Loan portfolio. The $172 million of expected future recoveries on previously fully charged-off loans, which is collected over an average 15-year period, mechanically is a reduction to the overall allowance for loan losses. However, it is not related to the $15,878 million Private Education Loan portfolio on our balance sheet and, as a result, management excludes this impact to the allowance to better evaluate and assess our overall credit loss coverage on the Private Education Loan portfolio. We believe this provides a more meaningful and holistic view of the available credit loss coverage on our non-charged-off Private Education Loan portfolio. We believe this information is useful to our investors, lenders and rating agencies.
Allowance for Loan Losses Metrics – Private Education Loans
Three Months Ended June 30,
Six Months Ended June 30,
(Dollars in millions)
2025
2024
2025
2024
Allowance at end of period (GAAP)
$
348
$
493
$
348
$
493
Plus: expected future recoveries on previously fully charged-off loans
172
211
172
211
Allowance at end of period excluding expected future recoveries on previously fully charged-off loans (Non-GAAP Financial Measure)
$
520
$
704
$
520
$
704
Ending total loans
$
15,878
$
16,731
$
15,878
$
16,731
Ending loans in repayment
$
15,267
$
16,087
$
15,267
$
16,087
Net charge-offs
$
80
$
67
$
152
$
166
Allowance coverage of charge-offs (annualized):
GAAP
1.1
1.8
1.1
1.5
Adjustment(1)
.5
.8
.6
.6
Non-GAAP Financial Measure(1)
1.6
2.6
1.7
2.1
Allowance as a percentage of the ending total loan balance:
GAAP
2.2
%
2.9
%
2.2
%
2.9
%
Adjustment(1)
1.1
1.3
1.1
1.3
Non-GAAP Financial Measure(1)
3.3
%
4.2
%
3.3
%
4.2
%
Allowance as a percentage of the ending loans in repayment:
GAAP
2.3
%
3.1
%
2.3
%
3.1
%
Adjustment(1)
1.1
1.3
1.1
1.3
Non-GAAP Financial Measure(1)
3.4
%
4.4
%
3.4
%
4.4
%
(1)
The allowance used for these credit metrics excludes the expected future recoveries on previously fully charged-off loans. See discussion above.
36
Legal Proceedings
For a discussion of legal matters as of June 30, 2025, please refer to “Note 10 – Commitments, Contingencies and Guarantees”to our consolidated financial statements included in this report, which is incorporated into this item by reference.
Risk Factors
The risk factors disclosed in our 2024 Form 10-K should be considered together with information included in this Form 10-Q. We believe there have been no material changes to the risk factors previously disclosed in our 2024 Form 10-K.
37
Quantitative and Qualitative Disclosures about Market Risk
Interest Rate Sensitivity Analysis
Our interest rate risk management seeks to limit the impact of movements in interest rates on our results of operations and financial position. The following tables summarize the potential effect on earnings over the next 12 months and the potential effect on fair values of balance sheet assets and liabilities at June 30, 2025 and 2024, based upon a sensitivity analysis performed by management assuming a hypothetical increase and decrease in market interest rates of 100 basis points. The earnings sensitivities assume an immediate increase and decrease in market interest rates of 100 basis points and are applied only to financial assets and liabilities, including hedging instruments, that existed at the balance sheet date and do not take into account any new assets, liabilities or hedging instruments that may arise over the next 12 months.
As of June 30, 2025
As of June 30, 2024
Impact on Annual Earnings If:
Impact on Annual Earnings If:
Interest Rates
Interest Rates
(Dollars in millions, except per share amounts)
Increase 100 Basis Points
Decrease 100 Basis Points
Increase 100 Basis Points
Decrease 100 Basis Points
Effect on Earnings:
Change in pre-tax net income before mark-to -market gains (losses) on derivative and hedging activities
$
(13
)
$
39
$
14
$
23
Mark-to-market gains (losses) on derivative and hedging activities
51
(54
)
48
(49
)
Increase (decrease) in income before taxes
$
38
$
(15
)
$
62
$
(26
)
Increase (decrease) in net income after taxes
$
29
$
(12
)
$
48
$
(20
)
Increase (decrease) in diluted earnings per common share
$
.29
$
(.12
)
$
.43
$
(.18
)
38
At June 30, 2025
Interest Rates:
Change from Increase of 100 Basis Points
Change from Decrease of 100 Basis Points
(Dollars in millions)
Fair Value
$
%
$
%
Effect on Fair Values:
Assets
Education Loans
$
44,477
$
(75
)
—
%
$
103
—
%
Other earning assets
2,212
—
—
—
—
Other assets
2,862
3
—
93
3
Total assets gain/(loss)
$
49,551
$
(72
)
—
%
$
196
—
%
Liabilities
Interest-bearing liabilities
$
46,436
$
(237
)
(1
)%
$
252
1
%
Other liabilities
561
81
14
11
2
Total liabilities (gain)/loss
$
46,997
$
(156
)
—
%
$
263
1
%
At December 31, 2024
Interest Rates:
Change from Increase of 100 Basis Points
Change from Decrease of 100 Basis Points
(Dollars in millions)
Fair Value
$
%
$
%
Effect on Fair Values:
Assets
Education Loans
$
46,133
$
(63
)
—
%
$
90
—
%
Other earning assets
2,246
—
—
—
—
Other assets
2,975
52
(2
)
20
1
Total assets gain/(loss)
$
51,354
$
(11
)
—
%
$
110
—
%
Liabilities
Interest-bearing liabilities
$
47,505
$
(226
)
—
%
$
241
1
%
Other liabilities
830
105
13
(35
)
(4
)
Total liabilities (gain)/loss
$
48,335
$
(121
)
—
%
$
206
—
%
A primary objective in our funding is to minimize our sensitivity to changing interest rates by generally funding our floating rate education loan portfolio with floating rate debt and our fixed rate education loan portfolio with fixed rate debt although we can have a mismatch at times. In addition, we can have a mismatch in the index (including the frequency of reset) of floating rate debt versus floating rate assets. In addition, due to the ability of some FFELP Loans to earn Floor Income, we can have a fixed versus floating mismatch in funding if the education loan earns at the fixed borrower rate and the funding remains floating. We use pay-fixed swaps and fixed rate debt to economically hedge embedded Floor Income in our FFELP Loans. Historically, we have used these instruments on a periodic basis and depending upon market conditions and pricing, we may enter into additional hedges in the future. The result of these hedging transactions is to fix the relative spread between the education loan asset rate and the funding instrument rate.
In the preceding tables, under the scenario where interest rates increase or decrease by 100 basis points, the change in pre-tax net income before the mark-to-market gains (losses) on derivative and hedging activities is primarily due to the impact of (i) a portion of our unhedged FFELP Loans being in a fixed-rate mode due to Floor Income, while being funded with variable rate debt; (ii) certain FFELP fixed rate loans becoming variable interest rate loans when variable interest rates rise above a certain level (Special Allowance Payment or “SAP”). When these loans are funded with fixed rate debt (as we do for a portion of the portfolio to economically hedge Floor Income) we earn additional interest income when earning the higher variable rate that is in effect; and (iii) a portion of our variable rate assets being funded with fixed rate liabilities. Item (i) will generally cause income to decrease when interest rates increase and income to increase when interest rates decrease. Item (ii) and (iii) have the opposite effect. The change due to the interest rate scenario where interest rates increase by 100 basis points in the current period is primarily a result of item (i) having a more significant impact than item (ii) and (iii) as a result of interest rates being lower compared to the prior period. The change due to the interest scenario where interest rates decrease by 100 basis points in the current period is primarily a result of item (i) having a more significant impact than item (ii) and (iii) as a result of interest rates being lower compared to the prior period. The relative changes from the prior period are primarily the result of interest rates being lower in the current period.
39
In the preceding tables, under the scenario where interest rates increase or decrease by 100 basis points, the change in mark-to-market gains (losses) on derivative and hedging activities in both periods is primarily due to (i) the notional amount and remaining term of our derivative portfolio and related hedged debt and (ii) the interest rate environment. In both periods, the mark-to-market gains (losses) are primarily related to derivatives that don’t qualify for hedge accounting that are used to economically hedge the origination of fixed rate Private Education Loans. As a result of not qualifying for hedge accounting, there is not an offsetting mark-to-market of the hedged item in this analysis.
In addition to interest rate risk addressed in the preceding tables, we are also exposed to risks related to foreign currency exchange rates. Foreign currency exchange risk is primarily the result of foreign currency denominated debt issued by us. When we issue foreign denominated corporate unsecured and securitization debt, our policy is to use cross-currency interest rate swaps to swap all foreign currency denominated debt payments (fixed and floating) to USD SOFR using a fixed exchange rate. In the tables above, there would be an immaterial impact on earnings if exchange rates were to decrease or increase, due to the terms of the hedging instrument and hedged items matching. The balance sheet interest-bearing liabilities would be affected by a change in exchange rates; however, the change would be materially offset by the cross-currency interest rate swaps in other assets or other liabilities. In certain economic environments, volatility in the spread between spot and forward foreign exchange rates has resulted in mark-to-market impacts to current period earnings which have not been factored into the above analysis. The earnings impact is noncash, and at maturity of the instruments the cumulative mark-to-market impact will be zero. Navient has not issued foreign currency denominated debt since 2008.
Asset and Liability Funding Gap
The table below presents our assets and liabilities (funding) arranged by underlying indices as of June 30, 2025. Management analyzes interest rate risk and in doing so includes all derivatives that are economically hedging our debt whether they qualify as effective hedges or not (Core Earnings basis). Accordingly, we present the asset and liability funding gap on a Core Earnings basis. The difference between the asset and the funding is the funding gap for the specified index. This represents our exposure to interest rate risk in the form of basis risk and repricing risk, which is the risk that the different indices may reset at different frequencies or may not move in the same direction or at the same magnitude.
Index (Dollars in billions)
Frequency of Variable Resets
Assets
Funding
Funding Gap
3 month Treasury bill
weekly
$
1.6
$
—
$
1.6
3 month Treasury bill
annual
.1
—
.1
Prime
annual
.1
—
.1
Prime
quarterly
.8
—
.8
Prime
monthly
2.8
—
2.8
3 month Term SOFR
quarterly
.2
1.0
(.8
)
3 month Term SOFR (1)
monthly
—
.6
(.6
)
1 month Term SOFR
monthly
1.8
.7
1.1
Overnight SOFR(2)
daily
27.9
28.6
(.7
)
Non Discrete reset (1)
monthly
—
4.1
(4.1
)
Non Discrete reset (3)
daily/weekly
2.2
—
2.2
Fixed Rate (4)
12.7
15.2
(2.5
)
Total
$
50.2
$
50.2
$
—
(1)
Funding includes debt related to Repurchase Facilities.
(2)
The assets are indexed to 30-day average overnight SOFR. A portion of the funding uses the daily average of overnight SOFR from a period preceding the accrual period of the asset ("lookback debt"). Funding includes $13.3 billion of 30-day average SOFR lookback debt and $13.3 billion of 90-day average SOFR lookback debt.
(3)
Assets include restricted and unrestricted cash equivalents and other overnight type instruments. Funding includes the obligation to return cash collateral held related to derivatives exposures.
(4)
Assets include receivables and other assets (including goodwill and acquired intangibles). Funding includes other liabilities and stockholders' equity.
40
We use interest rate swaps and other derivatives to achieve our risk management objectives. Our asset liability management strategy is to match assets with debt (in combination with derivatives) that have the same underlying index and reset frequency or, when economical, have interest rate characteristics that we believe are highly correlated. Interest earned on our FFELP Loans is primarily indexed to 30-day average overnight SOFR, which is reset daily, and our cost of funds is primarily indexed to overnight SOFR but resetting at different times than the asset. A source of variability in FFELP net interest income could also be Floor Income we earn on certain FFELP Loans. Pursuant to the terms of the FFELP, certain FFELP Loans can earn interest at the stated fixed rate of interest as underlying debt interest rate expense remains variable. We refer to this additional spread income as “Floor Income.” Floor Income can be volatile since it is dependent on interest rate levels. We frequently hedge this volatility to lock in the value of the Floor Income over the term of the contract. Interest earned on our Private Education Refinance Loans is generally fixed rate with the related cost of funds generally fixed rate as well. Interest earned on the remaining Private Education Loans is generally indexed to either one-month Prime or term SOFR rates and our cost of funds is primarily indexed to one-month or three-month term SOFR. The use of funding with index types and reset frequencies that are different from our assets exposes us to interest rate risk in the form of basis and repricing risk. This could result in our cost of funds not moving in the same direction or with the same magnitude as the yield on our assets. While we believe this risk is low, as all of these indices are short-term with rate movements that are highly correlated over a long period of time, market disruptions (which have occurred in prior years) can lead to a temporary divergence between indices resulting in a negative impact to our earnings.
Unregistered Sales of Equity Securities and Use of Proceeds
Issuer Purchases of Equity Securities
The following table provides information relating to our purchases of shares of our common stock in the three months ended June 30, 2025.
(In millions, except per share data)
Total Number of Shares Purchased(1)
Average Price Paid per Share
Total Number of Shares Purchased as Part of Publicly Announced Plans or Programs(1)(2)
Approximate Dollar Value of Shares That May Yet Be Purchased Under Publicly Announced Plans or Programs(1)
Period:
April 1 — April 30, 2025
.7
$
11.24
.7
$
68
May 1 — May 31, 2025
.6
13.00
.6
$
60
June 1 — June 30, 2025
.6
13.71
.6
$
52
Total second-quarter 2025
1.9
$
12.56
1.9
(1)
On December 10, 2021, our Board of Directors approved a $1 billion multi-year share repurchase program (the Share Repurchase Program). The Share Repurchase Program does not have an expiration date.
(2)
On March 17, 2025, the Company entered into a "Rule 10b5-1 trading arrangement" intended to satisfy the affirmative defense conditions of Rule 10b5-1, pursuant to which the Company will purchase the applicable shares during second-quarter 2025 from April 1, 2025 to April 30, 2025. This plan terminated by its terms on May 1, 2025. On June 16, 2025, the Company entered into a "Rule 10b5-1 trading arrangement" intended to satisfy the affirmative defense conditions of Rule 10b5-1, pursuant to which the Company will purchase the applicable shares during second-quarter 2025 from June 17, 2025 to June 30, 2025. This plan terminates by its terms on July 31, 2025.
41
Other Information
Director and Officer Trading Arrangements
During the quarter ended June 30, 2025, none of the Company’s directors or officers who are subject to the filing requirements of Section 16 of the Securities and Exchange Act adopted or terminated a Rule 10b5-1 trading arrangement or a non-Rule 10b5-1 trading arrangement (as defined in Item 408(c) of Regulation S-K, Item 408.
Controls and Procedures
Disclosure Controls and Procedures
Our management, with the participation of our Principal Executive and Principal Financial Officers, evaluated the effectiveness of our disclosure controls and procedures (as defined in Rules 13a-15(e) and 15d-15(e) under the Securities Exchange Act of 1934, as amended (the Exchange Act)) as of June 30, 2025. Based on this evaluation, our Principal Executive and Principal Financial Officers concluded that, as of June 30, 2025, our disclosure controls and procedures were effective to ensure that information required to be disclosed by us in the reports that we file or submit under the Exchange Act is (a) recorded, processed, summarized and reported within the time periods specified in the SEC’s rules and forms and (b) accumulated and communicated to our management, including our Principal Executive and Principal Financial Officers as appropriate, to allow timely decisions regarding required disclosure.
Changes in Internal Control over Financial Reporting
No change in our internal control over financial reporting (as defined in Rules 13a-15(f) and 15d-15(f) under the Exchange Act) occurred during the fiscal quarter ended June 30, 2025 that has materially affected, or is reasonably likely to materially affect, our internal control over financial reporting.
Inline XBRL Instance Document–the instance document does not appear in the Interactive Data File as its XBRL tags are embedded within the Inline XBRL document.
101.SCH*
Inline XBRL Taxonomy Extension Schema With Embedded Linkbase Documents.
104
Cover Page Interactive Data File (formatted as Inline XBRL and contained in Exhibit 101).
* Filed herewith
** Furnished herewith
43
Financial Statements
NAVIENT CORPORATION
CONSOLIDATED BALANCE SHEETS
(In millions, except per share amounts)
(Unaudited)
June 30, 2025
December 31, 2024
Assets
FFELP Loans (net of allowance for losses of $182 and $180, respectively)
$
29,618
$
30,852
Private Education Loans (net of allowance for losses of $348 and $441, respectively)
15,530
15,716
Investments
135
143
Cash and cash equivalents
712
722
Restricted cash and cash equivalents
1,365
1,381
Goodwill and acquired intangible assets, net
436
437
Other assets
2,426
2,538
Total assets
$
50,222
$
51,789
Liabilities
Short-term borrowings
$
4,752
$
5,134
Long-term borrowings
42,345
43,184
Other liabilities
561
830
Total liabilities
47,658
49,148
Commitments and contingencies
Equity
Series A Junior Participating Preferred Stock, par value $0.20 per share; 2 million shares authorized at December 31, 2021; no shares issued or outstanding
—
—
Common stock, par value $0.01 per share, 1.125 billion shares authorized: 467 million and 465 million shares issued, respectively
4
4
Additional paid-in capital
3,394
3,380
Accumulated other comprehensive income (net of tax expense of $0 and $1, respectively)
—
3
Retained earnings
4,674
4,697
Total stockholders’ equity before treasury stock
8,072
8,084
Less: Common stock held in treasury at cost: 367 million and 362 million shares, respectively
(5,508
)
(5,443
)
Total equity
2,564
2,641
Total liabilities and equity
$
50,222
$
51,789
Supplemental information — assets and liabilities of consolidated variable interest entities:
June 30, 2025
December 31, 2024
FFELP Loans
$
29,565
$
30,620
Private Education Loans
14,221
14,638
Restricted cash
1,363
1,364
Other assets, net
1,366
1,224
Short-term borrowings
4,153
4,532
Long-term borrowings
37,552
38,497
Net assets of consolidated variable interest entities
$
4,810
$
4,817
See accompanying notes to consolidated financial statements.
44
NAVIENT CORPORATION
CONSOLIDATED STATEMENTS OF INCOME
(In millions, except per share amounts)
(Unaudited)
Three Months Ended June 30,
Six Months Ended June 30,
2025
2024
2025
2024
Interest income:
FFELP Loans
$
483
$
608
$
975
$
1,269
Private Education Loans
273
317
562
645
Cash and investments
22
48
43
86
Total interest income
778
973
1,580
2,000
Total interest expense
650
843
1,322
1,718
Net interest income
128
130
258
282
Less: provisions for loan losses
37
14
67
26
Net interest income after provisions for loan losses
91
116
191
256
Other income (loss):
Servicing revenue
14
18
27
35
Asset recovery and business processing revenue
—
81
23
158
Other income
19
4
33
13
Gains (losses) on derivative and hedging activities, net
(5
)
14
(30
)
46
Total other income
28
117
53
252
Expenses:
Salaries and benefits
35
87
84
188
Other operating expenses
65
79
143
162
Total operating expenses
100
166
227
350
Goodwill and acquired intangible asset impairment and amortization expense
1
3
2
5
Restructuring/other reorganization expenses
—
16
3
17
Total expenses
101
185
232
372
Income before income tax expense
18
48
12
136
Income tax expense
4
12
1
27
Net income
$
14
$
36
$
11
$
109
Basic earnings per common share
$
.14
$
.32
$
.11
$
.98
Average common shares outstanding
100
111
101
112
Diluted earnings per common share
$
.13
$
.32
$
.11
$
.97
Average common and common equivalent shares outstanding
101
112
102
113
Dividends per common share
$
.16
$
.16
$
.32
$
.32
See accompanying notes to consolidated financial statements.
45
NAVIENT CORPORATION
CONSOLIDATED STATEMENTS OF COMPREHENSIVE INCOME
(In millions)
(Unaudited)
Three Months Ended June 30,
Six Months Ended June 30,
2025
2024
2025
2024
Net income
$
14
$
36
$
11
$
109
Net changes in cash flow hedges, net of tax(1)
(2
)
(5
)
(3
)
(9
)
Total comprehensive income
$
12
$
31
$
8
$
100
(1)
See “Note 5 – Derivative Financial Instruments.”
See accompanying notes to consolidated financial statements.
46
NAVIENT CORPORATION
CONSOLIDATED STATEMENTS OF CHANGES IN STOCKHOLDERS’ EQUITY
(In millions, except share and per share amounts)
(Unaudited)
Accumulated
Common Stock Shares
Additional
Other
Common
Paid-In
Comprehensive
Retained
Treasury
Total
Issued
Treasury
Outstanding
Stock
Capital
Income (Loss)
Earnings
Stock
Equity
Balance at March 31, 2024
465,031,305
(353,206,556
)
111,824,749
$
4
$
3,360
$
15
$
4,691
$
(5,304
)
$
2,766
Comprehensive income (loss):
Net income (loss)
—
—
—
—
—
—
36
—
36
Other comprehensive income (loss), net of tax
—
—
—
—
—
(5
)
—
—
(5
)
Total comprehensive income (loss)
—
—
—
—
—
—
—
—
31
Cash dividends:
Common stock ($.16 per share)
—
—
—
—
—
—
(17
)
—
(17
)
Dividend equivalent units related to employee stock-based compensation plans
—
—
—
—
—
—
—
—
—
Issuance of common shares
76,826
—
76,826
—
—
—
—
—
—
Stock-based compensation expense
—
—
—
—
7
—
—
—
7
Common stock repurchased
—
(2,466,060
)
(2,466,060
)
—
—
—
—
(38
)
(38
)
Shares repurchased related to employee stock-based compensation plans
—
(25,421
)
(25,421
)
—
—
—
—
—
—
Other
—
—
—
—
—
—
—
(1
)
(1
)
Balance at June 30, 2024
465,108,131
(355,698,037
)
109,410,094
$
4
$
3,367
$
10
$
4,710
$
(5,343
)
$
2,748
Balance at March 31, 2025
466,581,434
(365,246,956
)
101,334,478
$
4
$
3,390
$
2
$
4,677
$
(5,484
)
$
2,589
Comprehensive income (loss):
Net income (loss)
—
—
—
—
—
—
14
—
14
Other comprehensive income (loss), net of tax
—
—
—
—
—
(2
)
—
—
(2
)
Total comprehensive income (loss)
—
—
—
—
—
—
—
—
12
Cash dividends:
—
Common stock ($.16 per share)
—
—
—
—
—
—
(16
)
—
(16
)
Dividend equivalent units related to employee stock-based compensation plans
—
—
—
—
—
—
(1
)
—
(1
)
Issuance of common shares
14,995
—
14,995
—
—
—
—
—
—
Stock-based compensation expense
—
—
—
—
4
—
—
—
4
Common stock repurchased
—
(1,910,892
)
(1,910,892
)
—
—
—
—
(24
)
(24
)
Shares repurchased related to employee stock-based compensation plans
—
(7,543
)
(7,543
)
—
—
—
—
—
—
Other
—
—
—
—
—
—
—
—
—
Balance at June 30, 2025
466,596,429
(367,165,391
)
99,431,038
$
4
$
3,394
—
$
4,674
$
(5,508
)
$
2,564
See accompanying notes to consolidated financial statements.
47
NAVIENT CORPORATION
CONSOLIDATED STATEMENTS OF CHANGES IN STOCKHOLDERS’ EQUITY
(In millions, except share and per share amounts)
(Unaudited)
Accumulated
Common Stock Shares
Additional
Other
Common
Paid-In
Comprehensive
Retained
Treasury
Total
Issued
Treasury
Outstanding
Stock
Capital
Income (Loss)
Earnings
Stock
Equity
Balance at December 31, 2023
463,715,048
(350,210,737
)
113,504,311
$
4
$
3,353
$
19
$
4,638
$
(5,254
)
$
2,760
Comprehensive income (loss):
Net income (loss)
—
—
—
—
—
—
109
—
109
Other comprehensive income (loss), net of tax
—
—
—
—
—
(9
)
—
—
(9
)
Total comprehensive income (loss)
—
—
—
—
—
—
—
—
100
Cash dividends:
Common stock ($.32 per share)
—
—
—
—
—
—
(35
)
—
(35
)
Dividend equivalent units related to employee stock-based compensation plans
—
—
—
—
—
—
(2
)
—
(2
)
Issuance of common shares
1,393,083
—
1,393,083
—
2
—
—
—
2
Stock-based compensation expense
—
—
—
—
12
—
—
—
12
Common stock repurchased
—
(5,017,909
)
(5,017,909
)
—
—
—
—
(81
)
(81
)
Shares repurchased related to employee stock-based compensation plans
—
(469,391
)
(469,391
)
—
—
—
—
(7
)
(7
)
Other
—
—
—
—
—
—
—
(1
)
(1
)
Balance at June 30, 2024
465,108,131
(355,698,037
)
109,410,094
$
4
$
3,367
$
10
$
4,710
$
(5,343
)
$
2,748
Balance at December 31, 2024
465,308,901
(362,283,344
)
103,025,557
$
4
$
3,380
$
3
$
4,697
$
(5,443
)
$
2,641
Comprehensive income (loss):
Net income (loss)
—
—
—
—
—
—
11
—
11
Other comprehensive income (loss), net of tax
—
—
—
—
—
(3
)
—
—
(3
)
Total comprehensive income (loss)
—
—
—
—
—
—
—
—
8
Cash dividends:
—
Common stock ($.32 per share)
—
—
—
—
—
—
(32
)
—
(32
)
Dividend equivalent units related to employee stock-based compensation plans
—
—
—
—
—
—
(2
)
—
(2
)
Issuance of common shares
1,287,528
—
1,287,528
—
2
—
—
—
2
Stock-based compensation expense
—
—
—
—
12
—
—
—
12
Common stock repurchased
—
(4,463,392
)
(4,463,392
)
—
—
—
—
(59
)
(59
)
Shares repurchased related to employee stock-based compensation plans
—
(418,655
)
(418,655
)
—
—
—
—
(6
)
(6
)
Other
—
—
—
—
—
—
—
—
—
Balance at June 30, 2025
466,596,429
(367,165,391
)
99,431,038
$
4
$
3,394
—
$
4,674
$
(5,508
)
$
2,564
See accompanying notes to consolidated financial statements.
48
NAVIENT CORPORATION
CONSOLIDATED STATEMENTS OF CASH FLOWS
(In millions)
(Unaudited)
Six Months Ended June 30,
2025
2024
Cash flows from operating activities
Net income
$
11
$
109
Adjustments to reconcile net income to net cash provided by operating activities:
Goodwill and acquired intangible asset impairment and amortization expense
2
5
Stock-based compensation expense
12
12
Mark-to-market (gains) losses on derivative and hedging activities, net
93
(30
)
Provisions for loan losses
67
26
Decrease in accrued interest receivable
72
276
Increase (decrease) in accrued interest payable
(4
)
12
(Increase) decrease in other assets
(3
)
79
(Decrease) in other liabilities
(53
)
(28
)
Total adjustments
186
352
Net cash provided by operating activities
197
461
Cash flows from investing activities
Education loans originated and acquired
(1,103
)
(610
)
Proceeds from payments on education loans
2,460
6,200
Other investing activities, net
24
8
Disposal of subsidiaries, net of cash and restricted cash disposed of
25
—
Net cash provided by investing activities
1,406
5,598
Cash flows from financing activities
Borrowings collateralized by loans in trust - issued
1,081
1,106
Borrowings collateralized by loans in trust - repaid
(2,430
)
(5,154
)
Asset-backed commercial paper conduits, net
(160
)
(622
)
Long-term unsecured notes issued
495
—
Long-term unsecured notes repaid
(554
)
(7
)
Other financing activities, net
30
(53
)
Common stock repurchased
(59
)
(81
)
Common dividends paid
(32
)
(35
)
Net cash used in financing activities
(1,629
)
(4,846
)
Net increase (decrease) in cash, cash equivalents, restricted cash and restricted cash equivalents
(26
)
1,213
Cash, cash equivalents, restricted cash and restricted cash equivalents at beginning of period
2,103
2,793
Cash, cash equivalents, restricted cash and restricted cash equivalents at end of period
$
2,077
$
4,006
Supplemental disclosure of cash flow information:
Cash disbursements made (refunds received) for:
Interest paid
$
1,314
$
1,680
Income taxes paid
$
1
$
30
Income taxes refunds received
$
—
$
(1
)
Reconciliation of the Consolidated Statements of Cash Flows to the Consolidated Balance Sheets:
Cash and cash equivalents
$
712
$
1,088
Restricted cash and restricted cash equivalents
1,365
2,918
Total cash, cash equivalents, restricted cash and restricted cash equivalents at end of period
$
2,077
$
4,006
See accompanying notes to consolidated financial statements.
49
NAVIENT CORPORATION
NOTES TO CONSOLIDATED FINANCIAL STATEMENTS
(Information at June 30, 2025 and for the three and six months ended
June 30, 2025 and 2024 is unaudited)
1.Significant Accounting Policies
Basis of Presentation
The accompanying unaudited, consolidated financial statements of Navient have been prepared in accordance with generally accepted accounting principles in the United States of America (GAAP) for interim financial information. Accordingly, they do not include all of the information and footnotes required by GAAP for complete consolidated financial statements. The consolidated financial statements include the accounts of Navient and its majority-owned and controlled subsidiaries and those Variable Interest Entities (VIEs) for which we are the primary beneficiary, after eliminating the effects of intercompany accounts and transactions. In the opinion of management, all adjustments considered necessary for a fair statement of the results for the interim periods have been included. The preparation of financial statements in conformity with GAAP requires management to make estimates and assumptions that affect the amounts reported in the consolidated financial statements and accompanying notes. Actual results could differ from those estimates. Operating results for the three and six months ended June 30, 2025 are not necessarily indicative of the results for the year ending December 31, 2025 or for any other period. These unaudited financial statements should be read in conjunction with the audited financial statements and related notes included in our 2024 Form 10-K. Definitions for certain capitalized terms used but not otherwise defined in this Form 10-Q can be found in our 2024 Form 10-K.
Recently Issued Accounting Pronouncements
Income Taxes
In December 2023, the FASB issued ASU No. 2023-09, “Income Taxes – Improvements to Income Tax Disclosures,” which requires companies to disclose additional information in specified categories regarding reconciliation of the effective tax rate to the statutory rate for federal, state, and foreign income taxes. The ASU also eliminates certain existing disclosure requirements related to uncertain tax positions and unrecognized deferred tax liabilities. The guidance is effective for fiscal years beginning after January 1, 2025. Early adoption is permitted; however, we will implement the guidance in our 2025 annual Form 10-K filing.
50
NAVIENT CORPORATION
NOTES TO CONSOLIDATED FINANCIAL STATEMENTS
(Information at June 30, 2025 and for the three and six months ended
June 30, 2025 and 2024 is unaudited)
2. Allowance for Loan Losses
Allowance for Loan Losses Roll Forward
Three Months Ended June 30,
2025
2024
(Dollars in millions)
FFELP Loans
Private Education Loans
Total
FFELP Loans
Private Education Loans
Total
Allowance at beginning of period
$
182
$
397
$
579
$
206
$
538
$
744
Total provision
8
29
37
(2
)
16
14
Charge-offs:
Gross charge-offs
(8
)
(92
)
(100
)
(10
)
(77
)
(87
)
Expected future recoveries on current period gross charge-offs
—
13
13
—
10
10
Total(1)
(8
)
(79
)
(87
)
(10
)
(67
)
(77
)
Adjustment resulting from the change in charge-off rate(2)
—
(1
)
(1
)
—
—
—
Net charge-offs
(8
)
(80
)
(88
)
(10
)
(67
)
(77
)
Decrease in expected future recoveries on previously fully charged-off loans(3)
—
2
2
—
6
6
Allowance at end of period
$
182
$
348
$
530
$
194
$
493
$
687
Net charge-offs as a percentage of average loans in repayment, excluding the net adjustment resulting from the change in charge-off rate (annualized)(2)
.14
%
2.06
%
.14
%
1.65
%
Net adjustment resulting from the change in charge -off rate as a percentage of average loans in repayment (annualized)(2)
—
%
.02
%
—
%
—
%
Net charge-offs as a percentage of average loans in repayment (annualized)
.14
%
2.08
%
.14
%
1.65
%
Ending total loans
$
29,800
$
15,878
$
33,134
$
16,731
Average loans in repayment
$
25,133
$
15,375
$
27,509
$
16,271
Ending loans in repayment
$
24,867
$
15,267
$
26,411
$
16,087
(1)
Charge-offs are reported net of expected recoveries. For Private Education Loans, we charge off the estimated loss of a defaulted loan balance by charging off the entire defaulted loan balance and estimating recoveries on a pool basis. These estimated recoveries are referred to as "expected future recoveries on previously fully charged-off loans." For FFELP Loans, the recovery is received at the time of charge-off.
(2)
Related to increasing the net charge-off rate on defaulted Private Education Loans and the resulting reduction in the balance of expected future recoveries on previously fully charged-off loans.
(3)
At the end of each month, for Private Education Loans that are 212 days past due, we charge off the estimated loss of a defaulted loan balance by charging off the entire loan balance and estimating recoveries on a pool basis. These estimated recoveries are referred to as “expected future recoveries on previously fully charged-off loans.” If actual periodic recoveries are less than expected, the difference is immediately reflected as a reduction to expected future recoveries on previously fully charged-off loans. If actual periodic recoveries are greater than expected, they will be reflected as a recovery through the allowance for Private Education Loan losses once the cumulative recovery amount exceeds the cumulative amount originally expected to be recovered. The following table summarizes the activity in the expected future recoveries on previously fully charged-off loans
Three Months Ended June 30,
(Dollars in millions)
2025
2024
Beginning of period expected future recoveries on previously fully charged-off loans
$
174
$
217
Expected future recoveries of current period defaults
13
10
Recoveries (cash collected)
(11
)
(10
)
Charge-offs (as a result of lower recovery expectations)
(4
)
(6
)
End of period expected future recoveries on previously fully charged-off loans
$
172
$
211
Change in balance during period
$
(2
)
$
(6
)
51
NAVIENT CORPORATION
NOTES TO CONSOLIDATED FINANCIAL STATEMENTS
(Information at June 30, 2025 and for the three and six months ended
June 30, 2025 and 2024 is unaudited)
2. Allowance for Loan Losses (Continued)
Allowance for Loan Losses Roll Forward
Six Months Ended June 30,
2025
2024
(Dollars in millions)
FFELP Loans
Private Education Loans
Total
FFELP Loans
Private Education Loans
Total
Allowance at beginning of period
$
180
$
441
$
621
$
215
$
617
$
832
Total provision
16
51
67
(1
)
27
26
Charge-offs:
Gross charge-offs
(14
)
(173
)
(187
)
(20
)
(187
)
(207
)
Expected future recoveries on current period gross charge-offs
—
23
23
—
21
21
Total(1)
(14
)
(150
)
(164
)
(20
)
(166
)
(186
)
Adjustment resulting from the change in charge-off rate(2)
—
(2
)
(2
)
—
—
—
Net charge-offs
(14
)
(152
)
(166
)
(20
)
(166
)
(186
)
Decrease in expected future recoveries on previously fully charged-off loans(3)
—
8
8
—
15
15
Allowance at end of period
$
182
$
348
$
530
$
194
$
493
$
687
Net charge-offs as a percentage of average loans in repayment, excluding the net adjustment resulting from the change in charge-off rate (annualized)(2)
.12
%
1.96
%
.14
%
2.03
%
Net adjustment resulting from the change in charge -off rate as a percentage of average loans in repayment (annualized)(2)
—
%
.02
%
—
%
—
%
Net charge-offs as a percentage of average loans in repayment (annualized)
.12
%
1.98
%
.14
%
2.03
%
Ending total loans
$
29,800
$
15,878
$
33,134
$
16,731
Average loans in repayment
$
25,295
$
15,423
$
28,622
$
16,471
Ending loans in repayment
$
24,867
$
15,267
$
26,411
$
16,087
(1)
Charge-offs are reported net of expected recoveries. For Private Education Loans, we charge off the estimated loss of a defaulted loan balance by charging off the entire defaulted loan balance and estimating recoveries on a pool basis. These estimated recoveries are referred to as "expected future recoveries on previously fully charged-off loans." For FFELP Loans, the recovery is received at the time of charge-off.
(2)
Related to increasing the net charge-off rate on defaulted Private Education Loans and the resulting reduction in the balance of expected future recoveries on previously fully charged-off loans.
(3)
At the end of each month, for Private Education Loans that are 212 days past due, we charge off the estimated loss of a defaulted loan balance by charging off the entire loan balance and estimating recoveries on a pool basis. These estimated recoveries are referred to as “expected future recoveries on previously fully charged-off loans.” If actual periodic recoveries are less than expected, the difference is immediately reflected as a reduction to expected future recoveries on previously fully charged-off loans. If actual periodic recoveries are greater than expected, they will be reflected as a recovery through the allowance for Private Education Loan losses once the cumulative recovery amount exceeds the cumulative amount originally expected to be recovered. The following table summarizes the activity in the expected future recoveries on previously fully charged-off loans
Six Months Ended June 30,
(Dollars in millions)
2025
2024
Beginning of period expected future recoveries on previously fully charged-off loans
$
179
$
226
Expected future recoveries of current period defaults
23
21
Recoveries (cash collected)
(21
)
(21
)
Charge-offs (as a result of lower recovery expectations)
(10
)
(15
)
End of period expected future recoveries on previously fully charged-off loans
$
172
$
211
Change in balance during period
$
(8
)
$
(15
)
52
NAVIENT CORPORATION
NOTES TO CONSOLIDATED FINANCIAL STATEMENTS
(Information at June 30, 2025 and for the three and six months ended
June 30, 2025 and 2024 is unaudited)
2. Allowance for Loan Losses (Continued)
Key Credit Quality Indicators
We assess and determine the collectability of our education loan portfolios by evaluating certain risk characteristics we refer to as key credit quality indicators. Key credit quality indicators are incorporated into the allowance for loan losses calculation.
FFELP Loans
FFELP Loans are substantially insured and guaranteed as to their principal and accrued interest in the event of default. The key credit quality indicators are loan status and loan type.
FFELP Loan Delinquencies
June 30, 2025
December 31, 2024
June 30, 2024
(Dollars in millions)
Balance
%
Balance
%
Balance
%
Loans in-school/grace/deferment(1)
$
1,280
$
1,262
$
1,403
Loans in forbearance(2)
3,653
4,365
5,320
Loans in repayment and percentage of each status:
Loans current
20,145
81.0
%
20,675
81.4
%
22,833
86.5
%
Loans delinquent 31-60 days(3)
1,333
5.4
1,479
5.8
1,041
3.9
Loans delinquent 61-90 days(3)
863
3.5
1,043
4.1
680
2.6
Loans delinquent greater than 90 days(3)
2,526
10.1
2,208
8.7
1,857
7.0
Total FFELP Loans in repayment
24,867
100
%
25,405
100
%
26,411
100
%
Total FFELP Loans
29,800
31,032
33,134
FFELP Loan allowance for losses
(182
)
(180
)
(194
)
FFELP Loans, net
$
29,618
$
30,852
$
32,940
Percentage of FFELP Loans in repayment
83.4
%
81.9
%
79.7
%
Delinquencies as a percentage of FFELP Loans in repayment
19.0
%
18.6
%
13.5
%
FFELP Loans in forbearance as a percentage of loans in repayment and forbearance
12.8
%
14.7
%
16.8
%
(1)
Loans for customers who may still be attending school or engaging in other permitted educational activities and are not yet required to make payments on their loans, e.g., residency periods for medical students or a grace period for bar exam preparation, as well as loans for customers who have requested and qualify for other permitted program deferments such as military, unemployment, or economic hardships.
(2)
Loans for customers who have used their allowable deferment time or do not qualify for deferment, that need additional time to obtain employment or who have temporarily ceased making full payments due to hardship or other factors such as disaster relief consistent with established loan program servicing policies and procedures.
(3)
The period of delinquency is based on the number of days scheduled payments are contractually past due.
Loan type:
(Dollars in millions)
June 30, 2025
June 30, 2024
Change
Stafford Loans
$
9,703
$
10,589
$
(886
)
Consolidation Loans
17,077
19,273
(2,196
)
Rehab Loans
3,020
3,272
(252
)
Total loans, gross
$
29,800
$
33,134
$
(3,334
)
53
NAVIENT CORPORATION
NOTES TO CONSOLIDATED FINANCIAL STATEMENTS
(Information at June 30, 2025 and for the three and six months ended
June 30, 2025 and 2024 is unaudited)
2. Allowance for Loan Losses (Continued)
Private Education Loans
The key credit quality indicators are credit scores (FICO scores), loan status, loan seasoning, certain loan modifications, the existence of a cosigner and school type. The FICO score is the higher of the borrower or co-borrower score and is updated at least every six months while school type is assessed at origination. The other Private Education Loan key quality indicators are updated quarterly.
Private Education Loan Credit Quality Indicators by Origination Year
June 30, 2025
(Dollars in millions)
2025
2024
2023
2022
2021
Prior
Total
% of Total
Credit Quality Indicators
FICO Scores:
640 and above
$
940
$
1,146
$
635
$
1,167
$
2,991
$
7,020
$
13,899
88
%
Below 640
14
48
46
102
166
1,603
1,979
12
Total
$
954
$
1,194
$
681
$
1,269
$
3,157
$
8,623
$
15,878
100
%
Loan Status:
In-school/grace/ deferment/forbearance
$
29
$
91
$
55
$
51
$
73
$
312
$
611
4
%
Current/90 days or less delinquent
924
1,097
618
1,201
3,063
7,905
14,808
93
Greater than 90 days delinquent
1
6
8
17
21
406
459
3
Total
$
954
$
1,194
$
681
$
1,269
$
3,157
$
8,623
$
15,878
100
%
Seasoning(1):
1-12 payments
$
932
$
879
$
28
$
22
$
11
$
30
$
1,902
12
%
13-24 payments
—
238
484
48
37
41
848
6
25-36 payments
—
—
125
524
107
85
841
5
37-48 payments
—
—
—
645
2,182
160
2,987
19
More than 48 payments
—
—
—
—
784
8,155
8,939
56
Loans in-school/ grace/deferment
22
77
44
30
36
152
361
2
Total
$
954
$
1,194
$
681
$
1,269
$
3,157
$
8,623
$
15,878
100
%
Certain Loan Modifications(2):
Modified
$
—
$
6
$
27
$
98
$
203
$
5,077
$
5,411
34
%
Non-Modified
954
1,188
654
1,171
2,954
3,546
10,467
66
Total
$
954
$
1,194
$
681
$
1,269
$
3,157
$
8,623
$
15,878
100
%
Cosigners:
With cosigner(3)
$
152
$
342
$
225
$
136
$
70
$
4,179
$
5,104
32
%
Without cosigner
802
852
456
1,133
3,087
4,444
10,774
68
Total
$
954
$
1,194
$
681
$
1,269
$
3,157
$
8,623
$
15,878
100
%
School Type:
Not-for-profit
$
893
$
1,127
$
643
$
1,201
$
2,971
$
7,489
$
14,324
90
%
For-profit
61
67
38
68
186
1,134
1,554
10
Total
$
954
$
1,194
$
681
$
1,269
$
3,157
$
8,623
$
15,878
100
%
Allowance for loan losses
(348
)
Total loans, net
$
15,530
Charge-Offs
$
—
$
(2
)
$
(3
)
$
(6
)
$
(12
)
$
(129
)
$
(152
)
(1)
Number of months in active repayment for which a scheduled payment was received.
(2)
Loan Modifications represents the historical definition of a troubled debt restructuring (TDR) prior to the implementation of ASU No. 2022-02 on January 1, 2023. Any loan that meets the historical definition of a TDR retains that classification for the life of the loan (including loans that met that definition after January 1, 2023). This includes loans given rate modifications, term extensions or forbearance greater than 3 months in the prior 24-month period. This classification is not intended to reconcile in any way to the modification disclosures required under ASU No. 2022-02.
(3)
Excluding Private Education Refinance Loans, which do not have a cosigner, the cosigner rate was 66% for total loans at June 30, 2025.
54
NAVIENT CORPORATION
NOTES TO CONSOLIDATED FINANCIAL STATEMENTS
(Information at June 30, 2025 and for the three and six months ended
June 30, 2025 and 2024 is unaudited)
2. Allowance for Loan Losses (Continued)
Private Education Loan Credit Quality Indicators by Origination Year
June 30, 2024
(Dollars in millions)
2024
2023
2022
2021
2020
Prior
Total
% of Total
Credit Quality Indicators
FICO Scores:
640 and above
$
490
$
841
$
1,453
$
3,591
$
1,119
$
7,513
$
15,007
90
%
Below 640
8
20
75
137
31
1,453
1,724
10
Total
$
498
$
861
$
1,528
$
3,728
$
1,150
$
8,966
$
16,731
100
%
Loan Status:
In-school/grace/ deferment/forbearance
$
22
$
69
$
64
$
80
$
19
$
390
$
644
4
%
Current/90 days or less delinquent
476
789
1,454
3,634
1,127
8,256
15,736
94
Greater than 90 days delinquent
—
3
10
14
4
320
351
2
Total
$
498
$
861
$
1,528
$
3,728
$
1,150
$
8,966
$
16,731
100
%
Seasoning(1):
1-12 payments
$
479
$
632
$
36
$
24
$
3
$
45
$
1,219
7
%
13-24 payments
—
172
656
82
11
61
982
6
25-36 payments
—
—
791
2,602
28
111
3,532
21
37-48 payments
—
—
—
976
683
206
1,865
11
More than 48 payments
—
—
—
—
416
8,367
8,783
53
Loans in-school/ grace/deferment
19
57
45
44
9
176
350
2
Total
$
498
$
861
$
1,528
$
3,728
$
1,150
$
8,966
$
16,731
100
%
Certain Loan Modifications(2):
Modified
$
—
$
3
$
64
$
161
$
53
$
5,538
$
5,819
35
%
Non-Modified
498
858
1,464
3,567
1,097
3,428
10,912
65
Total
$
498
$
861
$
1,528
$
3,728
$
1,150
$
8,966
$
16,731
100
%
Cosigners:
With cosigner(3)
$
76
$
264
$
168
$
87
$
21
$
4,808
$
5,424
32
%
Without cosigner
422
597
1,360
3,641
1,129
4,158
11,307
68
Total
$
498
$
861
$
1,528
$
3,728
$
1,150
$
8,966
$
16,731
100
%
School Type:
Not-for-profit
$
335
$
814
$
1,447
$
3,511
$
1,099
$
7,674
$
14,880
89
%
For-profit
163
47
81
217
51
1,292
1,851
11
Total
$
498
$
861
$
1,528
$
3,728
$
1,150
$
8,966
$
16,731
100
%
Allowance for loan losses
(493
)
Total loans, net
$
16,238
Charge-Offs
$
—
$
(1
)
$
(5
)
$
(9
)
$
(2
)
$
(149
)
$
(166
)
(1)
Number of months in active repayment for which a scheduled payment was received.
(2)
Loan Modifications represents the historical definition of a troubled debt restructuring (TDR) prior to the implementation of ASU 2022-02 on January 1, 2023. Any loan that meets the historical definition of a TDR retains that classification for the life of the loan (including loans that met that definition after January 1, 2023). This includes loans given rate modifications, term extensions or forbearance greater than 3 months in the prior 24-month period. This classification is not intended to reconcile in any way to the new modification disclosures required under ASU 2022-02.
(3)
Excluding Private Education Refinance Loans, which do not have a cosigner, the cosigner rate was 66% for total loans at June 30, 2024.
55
NAVIENT CORPORATION
NOTES TO CONSOLIDATED FINANCIAL STATEMENTS
(Information at June 30, 2025 and for the three and six months ended
June 30, 2025 and 2024 is unaudited)
2. Allowance for Loan Losses (Continued)
Private Education Loan Delinquencies
June 30, 2025
December 31, 2024
June 30, 2024
(Dollars in millions)
Balance
%
Balance
%
Balance
%
Loans in-school/grace/deferment(1)
$
361
$
372
$
350
Loans in forbearance(2)
250
422
294
Loans in repayment and percentage of each status:
Loans current
14,296
93.6
%
14,419
93.9
%
15,250
94.8
%
Loans delinquent 31-60 days(3)
335
2.2
319
2.1
311
1.9
Loans delinquent 61-90 days(3)
177
1.2
206
1.3
175
1.1
Loans delinquent greater than 90 days(3)
459
3.0
419
2.7
351
2.2
Total loans in repayment
15,267
100
%
15,363
100
%
16,087
100
%
Total loans
15,878
16,157
16,731
Allowance for losses
(348
)
(441
)
(493
)
Loans, net
$
15,530
$
15,716
$
16,238
Percentage of loans in repayment
96.2
%
95.1
%
96.2
%
Delinquencies as a percentage of loans in repayment
6.4
%
6.1
%
5.2
%
Loans in forbearance as a percentage of loans in repayment and forbearance
1.6
%
2.7
%
1.8
%
(1)
Loans for customers who are attending school or are in other permitted educational activities and are not yet required to make payments on their loans, e.g., internship periods, as well as loans for customers who have requested and qualify for other permitted program deferments such as various military eligible deferments.
(2)
Loans for customers who have requested extension of grace period generally during employment transition or who have temporarily ceased making full payments due to hardship or other factors such as disaster relief consistent with established loan program servicing policies and procedures.
(3)
The period of delinquency is based on the number of days scheduled payments are contractually past due.
Loan Modifications to Borrowers Experiencing Financial Difficulty
We adjust the terms of Private Education Loans for certain borrowers when we believe such changes will help our customers better manage their student loan obligations, achieve better outcomes and increase the collectability of the loans. These changes generally take the form of a temporary interest rate reduction, a temporary forbearance of payments, a temporary interest-only payment, and a temporary interest rate reduction with a permanent extension of the loan term. The effect of modifications of loans made to borrowers who are experiencing financial difficulty is already included in the allowance for credit losses because of the measurement methodologies used to estimate the allowance. The model design predicts borrowers that will have financial difficulty in the future and require loan modification and increased life of loan default risk.
Under our current forbearance practices, temporary hardship forbearance of payments generally cannot exceed 12 months over the life of the loan. However, exceptions can be made in cases where borrowers have shown the ability to make a substantial number of monthly principal and interest payments and in those cases borrowers can be granted up to 24 months of hardship forbearance over the life of the loan. We offer other administrative forbearances (e.g., death and disability, bankruptcy, military service, and disaster forbearance) that are either required by law (such as the Servicemembers Civil Relief Act) or are considered separate from our active loss mitigation programs and therefore are not considered to be loan modifications requiring disclosure under ASU No. 2022-02.
FFELP Loans are at least 97 percent guaranteed as to their principal and accrued interest by the federal government in the event of default and, therefore, we do not deem FFELP Loans as nonperforming from a credit risk perspective at any point in their life cycle prior to claim payment and continue to accrue interest on those loans through the date of claim. Further, FFELP loan modification events are either legal entitlements subject to regulatory-driven eligibility criteria or addressed in the promissory note terms, so we do not consider these events as a component of our loan modification programs.
56
NAVIENT CORPORATION
NOTES TO CONSOLIDATED FINANCIAL STATEMENTS
(Information at June 30, 2025 and for the three and six months ended
June 30, 2025 and 2024 is unaudited)
2. Allowance for Loan Losses (Continued)
The following tables show the amortized cost basis as of June 30, 2025 and 2024 of the loans to borrowers experiencing financial difficulty that were modified during the respective period.
Three Months Ended June 30, 2025
Loan Modifications Made to Borrowers Experiencing Financial Difficulty
(Dollars in millions)
Interest Rate Reductions(1)
More Than an Insignificant Payment Delay (2)
Combination Rate Reduction and Term Extension
Loan Type
Amortized Cost
% of Loan Type
Amortized Cost
% of Loan Type
Amortized Cost
% of Loan Type
Private Education Loans
$
568
3.6
%
$
295
1.9
%
$
35
.2
%
Three Months Ended June 30, 2024
Loan Modifications Made to Borrowers Experiencing Financial Difficulty
(Dollars in millions)
Interest Rate Reductions(1)
More Than an Insignificant Payment Delay (2)
Combination Rate Reduction and Term Extension
Loan Type
Amortized Cost
% of Loan Type
Amortized Cost
% of Loan Type
Amortized Cost
% of Loan Type
Private Education Loans
$
601
3.6
%
$
314
1.9
%
$
39
.2
%
Six Months Ended June 30, 2025
(Dollars in millions)
Interest Rate Reductions(1)
More Than an Insignificant Payment Delay (2)
Combination Rate Reduction and Term Extension
Loan Type
Amortized Cost
% of Loan Type
Amortized Cost
% of Loan Type
Amortized Cost
% of Loan Type
Private Education Loans
$
1,171
7.4
%
$
548
3.5
%
$
75
.5
%
Six Months Ended June 30, 2024
(Dollars in millions)
Interest Rate Reductions(1)
More Than an Insignificant Payment Delay (2)
Combination Rate Reduction and Term Extension
Loan Type
Amortized Cost
% of Loan Type
Amortized Cost
% of Loan Type
Amortized Cost
% of Loan Type
Private Education Loans
$
1,143
6.8
%
$
597
3.6
%
$
78
.5
%
(1)
As of June 30, 2025 and 2024, there was $1.0 billion and $1.1 billion, respectively, of loans in the interest rate reduction program.
(2)
More Than an Insignificant Payment Delay includes loans granted more than 3 months of short-term interest only payments or hardship forbearance.
57
NAVIENT CORPORATION
NOTES TO CONSOLIDATED FINANCIAL STATEMENTS
(Information at June 30, 2025 and for the three and six months ended
June 30, 2025 and 2024 is unaudited)
2. Allowance for Loan Losses (Continued)
For those loans modified in the three and six months ended June 30, 2025 and 2024, the following tables show the impact of such modification.
Three Months Ended June 30, 2025
Loan Type
Interest Rate Reductions
More Than an Insignificant Payment Delay
Combination Rate Reduction and Term Extension
Private Education Loans
Reduced the weighted average contractual rate from 12.3% to 5.3%
Added an average 5 months to the remaining life of the loans
Added an average 7 years to the remaining life of the loans and reduced the weighted average contractual rate from 12.1% to 5.4%.
Three Months Ended June 30, 2024
Loan Type
Interest Rate Reductions
More Than an Insignificant Payment Delay
Combination Rate Reduction and Term Extension
Private Education Loans
Reduced the weighted average contractual rate from 13.3% to 5.5%
Added an average 5 months to the remaining life of the loans
Added an average 7 years to the remaining life of the loans and reduced the weighted average contractual rate from 12.7% to 5.3%.
Six Months Ended June 30, 2025
Loan Type
Interest Rate Reductions
More Than an Insignificant Payment Delay
Combination Rate Reduction and Term Extension
Private Education Loans
Reduced the weighted average contractual rate from 12.4% to 5.4%
Added an average 7 months to the remaining life of the loans
Added an average 7 years to the remaining life of the loans and reduced the weighted average contractual rate from 12.0% to 5.4%.
Six Months Ended June 30, 2024
Loan Type
Interest Rate Reductions
More Than an Insignificant Payment Delay
Combination Rate Reduction and Term Extension
Private Education Loans
Reduced the weighted average contractual rate from 13.3% to 5.5%
Added an average 6 months to the remaining life of the loans
Added an average 7 years to the remaining life of the loans and reduced the weighted average contractual rate from 12.8% to 5.3%.
58
NAVIENT CORPORATION
NOTES TO CONSOLIDATED FINANCIAL STATEMENTS
(Information at June 30, 2025 and for the three and six months ended
June 30, 2025 and 2024 is unaudited)
2. Allowance for Loan Losses (Continued)
The following table provides the amount of loan modifications for which a charge-off or payment default occurred in the respective period and within 12 months of the loan receiving a loan modification. We define payment default as 60 days or more past due for purposes of this disclosure. We closely monitor performance of the loans to borrowers experiencing financial difficulty that are modified to understand the effectiveness of the modification efforts.
Three Months Ended June 30,
Six Months Ended June 30,
(Dollars in millions)
2025
2024
2025
2024
Modified loans (amortized cost) (1)
$
109
$
128
$
179
$
163
Payment default (par)
$
111
$
131
$
183
$
167
Charge-offs (par)
$
15
$
10
$
25
$
12
(1)
For the three months ended June 30, 2025 and 2024, the modified loans include $71 million and $101 million, respectively, of Interest Rate Reduction, $5 million and $5 million, respectively, of Combination Rate Reduction and Term Extension, and $33 million and $22 million, respectively, of More Than Insignificant Payment Delay. For the six months ended June 30, 2025 and 2024, the modified loans include $119 million and $121 million, respectively, of Interest Rate Reduction, $8 million and $7 million, respectively, of Combination Rate Reduction and Term Extension, and $52 million and $35 million, respectively, of More Than Insignificant Payment Delay.
The following table provides the performance and related loan status of Private Education Loans that have been modified within the 12 months prior to June 30, 2025 and the 12 months prior to December 31, 2024, respectively.
Payment Status (Amortized Cost)
(Dollars in millions)
Twelve Months Ended
Loan Status
June 30, 2025
December 31, 2024
Loans in school/deferment
$
20
$
21
Loans in forbearance
78
162
Loans current
2,111
2,037
Loans delinquent 31 - 60 days
181
172
Loans delinquent 61 - 90 days
100
117
Loans delinquent greater than 90 days
164
186
Total modified loans
$
2,654
$
2,695
59
NAVIENT CORPORATION
NOTES TO CONSOLIDATED FINANCIAL STATEMENTS
(Information at June 30, 2025 and for the three and six months ended
June 30, 2025 and 2024 is unaudited)
3. Borrowings
The following table summarizes our borrowings.
June 30, 2025
December 31, 2024
(Dollars in millions)
Short Term
Long Term
Total
Short Term
Long Term
Total
Unsecured borrowings:
Senior unsecured debt
$
505
$
4,798
$
5,303
$
553
$
4,806
$
5,359
Total unsecured borrowings
505
4,798
5,303
553
4,806
5,359
Secured borrowings:
FFELP Loan securitizations(1)(2)
117
26,948
27,065
41
28,268
28,309
Private Education Loan securitizations(3)
562
10,322
10,884
631
10,338
10,969
FFELP Loan ABCP facilities(4)
1,531
301
1,832
1,586
74
1,660
Private Education Loan ABCP facilities(4)
1,943
—
1,943
2,274
—
2,274
Other(5)
97
39
136
54
40
94
Total secured borrowings
4,250
37,610
41,860
4,586
38,720
43,306
Total before hedge accounting adjustments
4,755
42,408
47,163
5,139
43,526
48,665
Hedge accounting adjustments
(3
)
(63
)
(66
)
(5
)
(342
)
(347
)
Total
$
4,752
$
42,345
$
47,097
$
5,134
$
43,184
$
48,318
(1)
Includes $117 million and $41 million of short-term debt and $0 million and $87 million of long-term debt related to the FFELP Loan ABS repurchase facilities (FFELP Loan Repurchase Facilities) as of June 30, 2025 and December 31, 2024, respectively.
(2)
Includes defaulted FFELP secured debt tranches with a remaining principal amount of $1.2 billion as of June 30, 2025 as a result of not maturing by their respective contractual maturity dates. Notices were delivered to the trustee, rating agencies and bondholders alerting them to these maturity date defaults. At this time, it is expected the bonds will be paid in full between 2028 and 2038. There is no impact to the principal amount owed or the coupon at which the bonds accrue, and there is no revised contractual maturity date.
(3)
Includes $562 million and $631 million of short-term debt related to the Private Education Loan ABS repurchase facilities (Private Education Loan Repurchase Facilities) as of June 30, 2025 and December 31, 2024, respectively.
(4)
ABCP facilities include $432 million and $121 million of gross issuances in the three months ended June 30, 2025 and 2024, respectively, and $587 million and $944 million of gross paydowns in the three months ended June 30, 2025 and 2024, respectively. ABCP facilities include $964 million and $522 million of gross issuances in the six months ended June 30, 2025 and 2024, respectively, and $1.1 billion and $1.1 billion of gross paydowns in the six months ended June 30, 2025 and 2024, respectively.
(5)
“Other” primarily includes the obligation to return cash collateral held related to derivative exposure.
60
NAVIENT CORPORATION
NOTES TO CONSOLIDATED FINANCIAL STATEMENTS
(Information at June 30, 2025 and for the three and six months ended
June 30, 2025 and 2024 is unaudited)
3. Borrowings (Continued)
Variable Interest Entities
We consolidated the following financing VIEs as of June 30, 2025 and December 31, 2024, as we are the primary beneficiary. As a result, these VIEs are accounted for as secured borrowings.
June 30, 2025
Debt Outstanding
Carrying Amount of Assets Securing Debt Outstanding
(Dollars in millions)
Short Term
Long Term
Total
Loans
Cash
Other Assets
Total
Secured Borrowings — VIEs:
FFELP Loan securitizations
$
117
$
26,948
$
27,065
$
27,749
$
871
$
1,187
$
29,807
Private Education Loan securitizations
562
10,322
10,884
12,103
342
130
12,575
FFELP Loan ABCP facilities
1,531
301
1,832
1,816
65
86
1,967
Private Education Loan ABCP facilities
1,943
—
1,943
2,118
85
38
2,241
Total before hedge accounting adjustments
4,153
37,571
41,724
43,786
1,363
1,441
46,590
Hedge accounting adjustments
—
(19
)
(19
)
—
—
(75
)
(75
)
Total
$
4,153
$
37,552
$
41,705
$
43,786
$
1,363
$
1,366
$
46,515
December 31, 2024
Debt Outstanding
Carrying Amount of Assets Securing Debt Outstanding
(Dollars in millions)
Short Term
Long Term
Total
Loans
Cash
Other Assets
Total
Secured Borrowings — VIEs:
FFELP Loan securitizations
$
41
$
28,268
$
28,309
$
28,983
$
901
$
1,211
$
31,095
Private Education Loan securitizations
631
10,338
10,969
12,054
335
113
12,502
FFELP Loan ABCP facilities
1,586
74
1,660
1,637
53
78
1,768
Private Education Loan ABCP facilities
2,274
—
2,274
2,584
75
66
2,725
Total before hedge accounting adjustments
4,532
38,680
43,212
45,258
1,364
1,468
48,090
Hedge accounting adjustments
—
(183
)
(183
)
—
—
(244
)
(244
)
Total
$
4,532
$
38,497
$
43,029
$
45,258
$
1,364
$
1,224
$
47,846
61
NAVIENT CORPORATION
NOTES TO CONSOLIDATED FINANCIAL STATEMENTS
(Information at June 30, 2025 and for the three and six months ended
June 30, 2025 and 2024 is unaudited)
4. Divestitures
As it relates to our Business Processing Healthcare Services reporting unit, on September 19, 2024, Navient completed the sale of its membership interest in Xtend, LLC, which comprised the Company's healthcare services business, resulting in a $219 million gain on sale. As a result, $112 million of goodwill and acquired intangible assets were a part of our basis in this entity, and these assets were therefore removed from our balance sheet upon the sale.
On December 19, 2024, Navient entered into an agreement to sell its government services businesses. During the fourth quarter of 2024, our government services businesses met the criteria for held for sale classification. The basis of these subsidiaries was written down to their estimated sales price or fair value less cost to sell, which was equal to the estimated net sales price resulting in a $28 million loss, which is presented in the "Gain on sale of subsidiaries, net" line in the statement of income. In February 2025, Navient completed the sale of its government services businesses for net consideration of $44 million, which constitutes the remainder of the Business Processing segment.
There was no revenue in the Business Processing segment in the second quarter of 2025. The $81 million of revenue in the Business Processing segment in the second quarter of 2024 included $32 million related to healthcare services and $49 million related to government services, of which $14 million, $18 million and $17 million related to federal government, state and local government, and tolling authorities clients, respectively.
The $23 million of revenue in the Business Processing segment in the six months ended June 30, 2025 was related to government services, of which $4 million, $8 million and $11 million related to federal government, state and local government, and tolling authorities clients, respectively. The $158 million of revenue in the Business Processing segment in the six months ended June 30, 2024 included $61 million related to healthcare services and $97 million related to government services of which $29 million, $35 million and $33 million related to federal government, state and local government, and tolling authorities clients, respectively.
62
NAVIENT CORPORATION
NOTES TO CONSOLIDATED FINANCIAL STATEMENTS
(Information at June 30, 2025 and for the three and six months ended
June 30, 2025 and 2024 is unaudited)
5. Derivative Financial Instruments
Summary of Derivative Financial Statement Impact
The following tables summarize the fair values and notional amounts of all derivative instruments and their impact on net income and other comprehensive income.
Impact of Derivatives on Balance Sheet
Cash Flow
Fair Value(3)
Trading
Total
(Dollars in millions)
Hedged Risk Exposure
Jun 30, 2025
Dec 31, 2024
Jun 30, 2025
Dec 31, 2024
Jun 30, 2025
Dec 31, 2024
Jun 30, 2025
Dec 31, 2024
Fair Values(1)
Derivative Assets:
Interest rate swaps
Interest rate
$
—
$
—
$
43
$
25
$
—
$
—
$
43
$
25
Cross-currency interest rate swaps
—
—
4
—
—
4
—
Total derivative assets(2)
—
—
47
25
—
—
47
25
Derivative Liabilities:
Interest rate swaps
Interest rate
—
—
—
—
—
—
—
—
Cross-currency interest rate swaps
Foreign currency and interest rate
—
—
(79
)
(244
)
—
—
(79
)
(244
)
Total derivative liabilities(2)
—
—
(79
)
(244
)
—
—
(79
)
(244
)
Net total derivatives
$
—
$
—
$
(32
)
$
(219
)
$
—
$
—
$
(32
)
$
(219
)
(1)
Fair values reported are exclusive of collateral held and pledged and accrued interest. Assets and liabilities are presented without consideration of master netting agreements. Derivatives are carried on the balance sheet based on net position by counterparty under master netting agreements and classified in other assets or other liabilities depending on whether in a net positive or negative position.
(2)
The following table reconciles gross positions without the impact of master netting agreements to the balance sheet classification:
Other Assets
Other Liabilities
(Dollar in millions)
June 30, 2025
December 31, 2024
June 30, 2025
December 31, 2024
Gross position
$
47
$
25
$
(79
)
$
(244
)
Impact of master netting agreements
—
—
—
—
Derivative values with impact of master netting agreements (as carried on balance sheet)
47
25
(79
)
(244
)
Cash collateral (held) pledged
(46
)
(26
)
39
30
Net position
$
1
$
(1
)
$
(40
)
$
(214
)
(3)
The following table shows the carrying value of liabilities in fair value hedges and the related fair value hedging adjustments to these liabilities:
As of June 30, 2025
As of December 31, 2024
(Dollar in millions)
Carrying Value
Hedge Basis Adjustments
Carrying Value
Hedge Basis Adjustments
Short-term borrowings
$
496
$
(3
)
$
495
$
(5
)
Long-term borrowings
$
4,720
$
(66
)
$
4,517
$
(345
)
63
NAVIENT CORPORATION
NOTES TO CONSOLIDATED FINANCIAL STATEMENTS
(Information at June 30, 2025 and for the three and six months ended
June 30, 2025 and 2024 is unaudited)
5. Derivative Financial Instruments (Continued)
The above fair values include adjustments when necessary for counterparty credit risk.
Cash Flow
Fair Value
Trading
Total
(Dollars in billions)
Jun 30, 2025
Dec 31, 2024
Jun 30, 2025
Dec 31, 2024
Jun 30, 2025
Dec 31, 2024
Jun 30, 2025
Dec 31, 2024
Notional Values:
Interest rate swaps
$
.4
$
.1
$
4.1
$
4.1
$
1.7
$
2.2
$
6.2
$
6.4
Cross-currency interest rate swaps
—
—
1.3
1.3
—
—
1.3
1.3
Total derivatives
$
.4
$
.1
$
5.4
$
5.4
$
1.7
$
2.2
$
7.5
$
7.7
Mark-to-MarketImpact of Derivatives on Statements of Income
Total Gains (Losses)
Three Months Ended June 30,
Six Months Ended June 30,
(Dollars in millions)
2025
2024
2025
2024
Fair Value Hedges:
Interest Rate Swaps
Gains (losses) recognized in net income on derivatives
$
51
$
6
$
109
$
(48
)
Gains (losses) recognized in net income on hedged items
(55
)
(8
)
(116
)
50
Net fair value hedge ineffectiveness gains (losses)
(4
)
(2
)
(7
)
2
Cross-currency interest rate swaps
Gains (losses) recognized in net income on derivatives
115
1
169
(33
)
Gains (losses) recognized in net income on hedged items
(107
)
6
(164
)
36
Net fair value hedge ineffectiveness gains (losses)
8
7
5
3
Total fair value hedges(1)(2)
4
5
(2
)
5
Cash Flow Hedges:
Total cash flow hedges(2)
—
—
—
—
Trading:
Interest rate swaps
(5
)
14
(30
)
46
Total trading derivatives(3)
(5
)
14
(30
)
46
Mark-to-market gains (losses) recognized
$
(1
)
$
19
$
(32
)
$
51
(1)
Recorded in interest expense in the consolidated statements of income.
(2)
The accrued interest income (expense) on fair value hedges and cash flow hedges is recorded in interest expense and is excluded from this table.
(3)
Recorded in “gains (losses) on derivative and hedging activities, net” in the consolidated statements of income.
64
NAVIENT CORPORATION
NOTES TO CONSOLIDATED FINANCIAL STATEMENTS
(Information at June 30, 2025 and for the three and six months ended
June 30, 2025 and 2024 is unaudited)
5. Derivative Financial Instruments (Continued)
Impact of Derivatives on Other Comprehensive Income (Equity)
Three Months Ended June 30,
Six Months Ended June 30,
(Dollars in millions)
2025
2024
2025
2024
Total gains (losses) on cash flow hedges
$
(2
)
$
1
$
(2
)
$
4
Reclassification adjustments for derivative (gains) losses included in net income (interest expense)(1)
—
(6
)
(1
)
(13
)
Net changes in cash flow hedges, net of tax
$
(2
)
$
(5
)
$
(3
)
$
(9
)
(1)
Includes net settlement income/expense.
Collateral
The following table details collateral held and pledged related to derivative exposure between us and our derivative counterparties:
(Dollars in millions)
June 30, 2025
December 31, 2024
Collateral held:
Cash (obligation to return cash collateral is recorded in short-term borrowings)
$
46
$
26
Securities at fair value — corporate derivatives (not recorded in financial statements)(1)
—
—
Securities at fair value — on-balance sheet securitization derivatives (not recorded in financial statements)(2)
—
—
Total collateral held
$
46
$
26
Derivative asset at fair value including accrued interest
$
55
$
33
Collateral pledged to others:
Cash (right to receive return of cash collateral is recorded in investments)
$
39
$
30
Total collateral pledged
$
39
$
30
Derivative liability at fair value including accrued interest and premium receivable
$
85
$
250
(1)
The Company has the ability to sell or re-pledge securities it holds as collateral.
(2)
The trusts do not have the ability to sell or re-pledge securities they hold as collateral.
Our corporate derivatives contain credit contingent features. At our current unsecured credit rating, we have fully collateralized our corporate derivative liability position (including accrued interest and net of premiums receivable) of $0 with our counterparties. Downgrades in our unsecured credit rating would not result in any additional collateral requirements. Trust related derivatives do not contain credit contingent features related to our or the trusts’ credit ratings. At June 30, 2025 and December 31, 2024, we had a net positive exposure (derivative gain positions to us less collateral which has been posted by counterparties to us) related to Navient Corporation derivatives of $6 million and $9 million, respectively. The trusts are not required to post collateral to the counterparties. At June 30, 2025 and December 31, 2024, the net positive exposure on swaps in securitization trusts was $4 million and $0 million, respectively.
6. Other Assets
The following table provides the detail of our other assets.
(Dollars in millions)
June 30, 2025
December 31, 2024
Accrued interest receivable
$
1,661
$
1,733
Benefit and insurance-related investments
460
459
Income tax asset, net
100
120
Derivatives at fair value
47
25
Accounts receivable
19
49
Fixed assets
28
52
Other
111
100
Total
$
2,426
$
2,538
65
NAVIENT CORPORATION
NOTES TO CONSOLIDATED FINANCIAL STATEMENTS
(Information at June 30, 2025 and for the three and six months ended
June 30, 2025 and 2024 is unaudited)
7. Stockholders’ Equity
The following table summarizes common share repurchases, issuances and dividends paid.
Three Months Ended June 30,
Six Months Ended June 30,
(Dollars and shares in millions, except per share amounts)
2025
2024
2025
2024
Common stock repurchased(1)
1.9
2.5
4.5
5.0
Common stock repurchased (in dollars)(1)
$
24
$
38
$
59
$
81
Average purchase price per share(1)
$
12.56
$
15.41
$
13.22
$
16.14
Remaining common stock repurchase authority(1)
$
52
$
209
$
52
$
209
Shares repurchased related to employee stock- based compensation plans(2)
—
—
.4
.5
Average purchase price per share(2)
$
—
$
—
$
13.74
$
16.04
Common shares issued(3)
—
.1
1.3
1.4
Dividends paid
$
16
$
17
$
32
$
35
Dividends per share
$
.16
$
.16
$
.32
$
.32
(1)
Common shares purchased under our share repurchase program. Our Board of Directors authorized a $1 billion multi-year share repurchase program in December 2021.
(2)
Comprises shares withheld from the vesting of restricted stock for employees’ tax withholding obligations.
(3)
Common shares issued under our various compensation and benefit plans.
The closing price of our common stock on June 30, 2025 was $14.10.
8. Earnings (Loss) per Common Share
Basic earnings (loss) per common share (EPS) are calculated using the weighted average number of shares of common stock outstanding during each period. A reconciliation of the numerators and denominators of the basic and diluted EPS calculations on a GAAP basis follows.
Three Months Ended June 30,
Six Months Ended June 30,
(In millions, except per share data)
2025
2024
2025
2024
Numerator:
Net income (loss)
$
14
$
36
$
11
$
109
Denominator:
Weighted average shares used to compute basic EPS
100
111
101
112
Effect of dilutive securities:
Dilutive effect of restricted stock, restricted stock units, performance stock units, and Employee Stock Purchase Plan (ESPP)(1)
1
1
1
1
Dilutive potential common shares(2)
1
1
1
1
Weighted average shares used to compute diluted EPS
101
112
102
113
Basic earnings (loss) per common share
$
.14
$
.32
$
.11
$
.98
Diluted earnings (loss) per common share
$
.13
$
.32
$
.11
$
.97
(1)
Includes the potential dilutive effect of additional common shares that are issuable upon the vesting of restricted stock, restricted stock units and performance stock units and the outstanding commitment to issue shares under applicable ESPPs, determined by the treasury stock method.
(2)
For the three months ended March 31, 2025 and 2024, approximately 0 million and 0 million shares, respectively, were outstanding but not included in the computation of diluted earnings per share because they were anti-dilutive. For the six months ended June 30, 2025 and 2024, securities covering approximately 0 million and 0 million shares, respectively, were outstanding but not included in the computation of diluted earnings per share because they were anti-dilutive
66
NAVIENT CORPORATION
NOTES TO CONSOLIDATED FINANCIAL STATEMENTS
(Information at June 30, 2025 and for the three and six months ended
June 30, 2025 and 2024 is unaudited)
9. Fair Value Measurements
We use estimates of fair value in applying various accounting standards in our financial statements. We categorize our fair value estimates based on a hierarchical framework associated with three levels of price transparency utilized in measuring financial instruments at fair value. The fair value of the items discussed below are separately disclosed in this footnote.
During the three and six months ended June 30, 2025, there were no significant transfers of financial instruments between levels, or changes in our methodology used to value our financial instruments.
The following table summarizes the valuation of our financial instruments that are marked-to-market on a recurring basis. During the second-quarters of 2025 and 2024, there were no significant transfers of financial instruments between levels.
Fair Value Measurements on a Recurring Basis
June 30, 2025
December 31, 2024
(Dollars in millions)
Level 1
Level 2
Level 3
Total
Level 1
Level 2
Level 3
Total
Assets
Derivative instruments:(1)
Interest rate swaps
$
—
$
43
$
—
$
43
$
—
$
25
$
—
$
25
Cross currency interest rate swaps
—
—
4
4
—
—
—
—
Total derivative assets(2)
—
43
4
47
—
25
—
25
Total
$
—
$
43
$
4
$
47
$
—
$
25
$
—
$
25
Liabilities(3)
Derivative instruments(1)
Interest rate swaps
$
—
$
—
$
—
$
—
$
—
$
—
$
—
$
—
Cross-currency interest rate swaps
—
—
(79
)
(79
)
—
—
(244
)
(244
)
Total derivative liabilities(2)
—
—
(79
)
(79
)
—
—
(244
)
(244
)
Total
$
—
$
—
$
(79
)
$
(79
)
$
—
$
—
$
(244
)
$
(244
)
(1)
Fair value of derivative instruments excludes accrued interest and the value of collateral.
(2)
See "Note 5 – Derivative Financial Instruments" for a reconciliation of gross positions without the impact of master netting agreements to the balance sheet classification.
(3)
Borrowings which are the hedged item in a fair value hedge relationship and which are adjusted for changes in value due to benchmark interest rates only are not carried at full fair value and not reflected in this table.
67
NAVIENT CORPORATION
NOTES TO CONSOLIDATED FINANCIAL STATEMENTS
(Information at June 30, 2025 and for the three and six months ended
June 30, 2025 and 2024 is unaudited)
9. Fair Value Measurements (Continued)
The following tables summarize the change in balance sheet carrying value associated with level 3 financial instruments carried at fair value on a recurring basis.
Three Months Ended June 30,
2025
2024
Derivative instruments
Derivative instruments
(Dollars in millions)
Interest Rate Swaps
Cross Currency Interest Rate Swaps
Other
Total Derivative Instruments
Interest Rate Swaps
Cross Currency Interest Rate Swaps
Other
Total Derivative Instruments
Balance, beginning of period
$
—
$
(190
)
$
—
$
(190
)
$
(1
)
$
(223
)
$
—
$
(224
)
Total gains/(losses):
Included in earnings(1)
—
107
—
107
—
(9
)
—
(9
)
Included in other comprehensive income
—
—
—
—
—
—
—
—
Settlements
—
8
—
8
—
10
—
10
Transfers in and/or out of level 3
—
—
—
—
—
—
—
—
Balance, end of period
$
—
$
(75
)
$
—
$
(75
)
$
(1
)
$
(222
)
$
—
$
(223
)
Change in mark-to- market gains/ (losses) relating to instruments still held at the reporting date(2)
$
—
$
115
$
—
$
115
$
—
$
1
$
—
$
1
Six Months Ended June 30,
2025
2024
Derivative instruments
Derivative instruments
(Dollars in millions)
Interest RateSwaps
Cross Currency Interest Rate Swaps
Other
Total Derivative Instruments
Interest Rate Swaps
Cross Currency Interest Rate Swaps
Other
Total Derivative Instruments
Balance, beginning of period
$
—
$
(244
)
$
—
$
(244
)
$
(1
)
$
(189
)
$
—
$
(190
)
Total gains/(losses):
Included in earnings(1)
—
152
—
152
—
(53
)
—
(53
)
Included in other comprehensive income
—
—
—
—
—
—
—
—
Settlements
—
17
—
17
—
20
—
20
Transfers in and/or out of level 3
—
—
—
—
—
—
—
—
Balance, end of period
$
—
$
(75
)
$
—
$
(75
)
$
(1
)
$
(222
)
$
—
$
(223
)
Change in mark-to- market gains/ (losses) relating to instruments still held at the reporting date(2)
$
—
$
169
$
—
$
169
$
—
$
(33
)
$
—
$
(33
)
(1)
“Included in earnings” is comprised of the following amounts recorded in the specified line item in the consolidated statements of income:
Three Months Ended June 30,
Six Months Ended June 30,
(Dollars in millions)
2025
2024
2025
2024
Gains (losses) on derivative and hedging activities, net
$
—
$
—
$
—
$
—
Interest expense
107
(9
)
152
(53
)
Total
$
107
$
(9
)
$
152
$
(53
)
(2)
Recorded in “gains (losses) on derivative and hedging activities, net” in the consolidated statements of income for interest rate swaps. Recorded in interest expense for cross-currency interest rate swaps in fair value hedges.
68
NAVIENT CORPORATION
NOTES TO CONSOLIDATED FINANCIAL STATEMENTS
(Information at June 30, 2025 and for the three and six months ended
June 30, 2025 and 2024 is unaudited)
9. Fair Value Measurements (Continued)
The following table presents the significant inputs that are unobservable or from inactive markets used in the recurring valuations of the level 3 financial instruments detailed above.
(Dollars in millions)
Fair Value at June 30, 2025
Valuation Technique
Input
Range and Weighted Average
Derivatives
Cross-currency interest rate swaps
$
(75
)
Discounted cash flow
Constant Prepayment Rate
5%
Total
(75
)
The following table summarizes the fair values of our financial assets and liabilities, including derivative financial instruments.
June 30, 2025
December 31, 2024
(Dollars in millions)
Fair Value
Carrying Value
Difference
Fair Value
Carrying Value
Difference
Earning assets
FFELP Loans
$
29,261
$
29,618
$
(357
)
$
30,766
$
30,852
$
(86
)
Private Education Loans
15,216
15,530
(314
)
15,367
15,716
(349
)
Cash and investments
2,212
2,212
—
2,246
2,246
—
Total earning assets
46,689
47,360
(671
)
48,379
48,814
(435
)
Interest-bearing liabilities
Short-term borrowings
4,764
4,752
(12
)
5,144
5,134
(10
)
Long-term borrowings
41,672
42,345
673
42,361
43,184
823
Total interest-bearing liabilities
46,436
47,097
661
47,505
48,318
813
Derivative financial instruments
Interest rate swaps
43
43
—
25
25
—
Cross-currency interest rate swaps
(75
)
(75
)
—
(244
)
(244
)
—
Excess of net asset fair value over carrying value
$
(10
)
$
378
10. Commitments, Contingencies and Guarantees
Legal Proceedings
We and our subsidiaries and affiliates are subject to various claims, lawsuits and other actions that arise in the normal course of business. We believe that these claims, lawsuits and other actions will not, individually or in the aggregate, have a material adverse effect on our business, financial condition or results of operations, except as otherwise disclosed. Most of these matters are claims including individual and class action lawsuits relating to loan servicing or business processing and which allege violations of state or federal laws in connection with servicing or collection activities on education loans and other debts.
In the ordinary course of our business, the Company and our subsidiaries and affiliates receive information and document requests and investigative demands from various entities including State Attorneys General, U.S. Attorneys, legislative committees, individual members of Congress and administrative agencies. These requests may be informational, regulatory or enforcement in nature and may relate to our business practices, the industries in which we operate, or companies with whom we conduct business. Generally, our practice has been and continues to be to cooperate with these bodies and to be responsive to any such requests.
The number of these inquiries and the volume of related information demands have normalized at elevated levels and therefore the Company must continue to expend time and resources to timely respond to these requests which may, depending on their outcome, result in payments of restitution, fines and penalties.
Contingencies
In the ordinary course of business, we and our subsidiaries are defendants in or parties to pending and threatened legal actions and proceedings including actions brought on behalf of various classes of claimants. These actions and proceedings may be based on alleged violations of consumer protection, securities, employment and other laws. In certain of these actions and proceedings, claims for substantial monetary damage are asserted against us and our subsidiaries. We and our subsidiaries are also subject to potential unasserted claims by third parties.
69
NAVIENT CORPORATION
NOTES TO CONSOLIDATED FINANCIAL STATEMENTS
(Information at June 30, 2025 and for the three and six months ended
June 30, 2025 and 2024 is unaudited)
10.Commitments, Contingencies and Guarantees (Continued)
In the ordinary course of business, we and our subsidiaries are subject to regulatory examinations, information gathering requests, inquiries and investigations. In connection with formal and informal inquiries in these cases, we and our subsidiaries receive requests, subpoenas and orders for documents, testimony and information in connection with various aspects of our regulated activities.
In view of the inherent difficulty of predicting the outcome of litigation and regulatory matters, we may not be able to predict what the eventual outcome of the pending matters will be, what the timing or the ultimate resolution of these matters will be, or what the eventual loss, fines or penalties, if any, related to each pending matter may be.
The Company accrues a liability for litigation, regulatory matters, and unasserted contract claims when those matters present loss contingencies that are both probable and reasonably estimable. When loss contingencies are not both probable and reasonably estimable, we do not accrue a liability. Based on current knowledge, management does not believe that loss contingencies, if any, arising from pending investigations, litigation or regulatory matters will have a material adverse effect on our consolidated financial position, liquidity, results of operations or cash flows, except as otherwise disclosed.
The Company evaluates its outstanding legal and regulatory matters each reporting period, and makes adjustments to the accrued liabilities for such matters, upward or downward, as appropriate, based on the relevant facts and circumstances. The Company's accrued liabilities and estimated range of possible losses pertaining to certain matters can involve significant judgment given factors such as: the varying stages of the proceedings; the existence of numerous yet to be resolved issues; the breadth of the claims (often spanning multiple years and wide ranges of business activities); unspecified damages, civil money penalties or fines and/or the novelty of the legal issues presented; and the attendant uncertainty of the various potential outcomes of such proceedings, including where the Company has made assumptions concerning future rulings by the court or other adjudicator, or about the behavior or incentives of adverse parties or regulatory authorities. Various aspects of the legal proceedings underlying these estimates will change from time to time. Actual losses therefore may vary significantly from any estimates.
Regulatory Matters
The Company has been named as defendant in a number of putative class action and other cases alleging violations of various state and federal consumer protection laws including the Telephone Consumer Protection Act (TCPA), the Consumer Financial Protection Act of 2010 (CFPA), the Fair Credit Reporting Act (FCRA), the Fair Debt Collection Practices Act (FDCPA), in adversarial proceedings under the U.S. Bankruptcy Code, and various state consumer protection laws. At this point in time, the Company is unable to anticipate the timing of a resolution or the impact that these legal proceedings may have on the Company’s consolidated financial position, liquidity, results of operation or cash flows. As a result, it is not possible at this time to estimate a range of potential exposure, if any, for amounts that may be payable in connection with these matters and loss contingency accruals have not been established. It is possible that an adverse ruling or rulings may have a material adverse impact on the Company.
In addition, Navient and its subsidiaries are subject to examination or regulation by various federal regulatory, state licensing or other regulatory agencies as part of its ordinary course of business including the SEC, CFPB, FFIEC and ED. Items or matters similar to or different from those described above may arise during the course of those examinations. We also routinely receive inquiries or requests from various regulatory entities or bodies or government agencies concerning our business or our assets. Generally, the Company endeavors to cooperate with each such inquiry or request.
70
NAVIENT CORPORATION
NOTES TO CONSOLIDATED FINANCIAL STATEMENTS
(Information at June 30, 2025 and for the three and six months ended
June 30, 2025 and 2024 is unaudited)
11. Segment Reporting
We monitor and assess our ongoing operations and results based on the following three reportable operating segments: Federal Education Loans, Consumer Lending, and Other. As of February 2025, we had divested our Business Processing segment.
These segments meet the quantitative thresholds for reportable operating segments. Accordingly, the results of operations of these reportable operating segments are presented separately. The underlying operating segments are used by the Company’s chief operating decision maker, our chief executive officer, to manage the business, review operating performance and allocate resources, and qualify to be aggregated as part of the primary reportable operating segments. As discussed further below, we measure the profitability of our operating segments based on Core Earnings net income. Accordingly, information regarding our reportable operating segments' net income is provided on a Core Earnings basis.
Federal Education Loans Segment
Navient owns and manages FFELP Loans and is the master servicer on this portfolio. We generate revenue primarily through net interest income on our FFELP Loans.
The following table includes asset information for our Federal Education Loans segment.
(Dollars in millions)
June 30, 2025
December 31, 2024
FFELP Loans, net
$
29,618
$
30,852
Cash and investments(1)
938
955
Other
1,832
1,818
Total assets
$
32,388
$
33,625
(1)
Includes restricted cash and investments.
Consumer Lending Segment
Navient owns and manages Private Education Loans and is the master servicer for these portfolios. Through our Earnest brand, we also refinance and originate in-school Private Education Loans. "Refinance" Private Education Loans are loans where a borrower has refinanced their education loans, and "In-school" Private Education Loans are loans originally made to borrowers while they are attending school. We generate revenue primarily through net interest income on our Private Education Loan portfolio.
The following table includes asset information for our Consumer Lending segment.
(Dollars in millions)
June 30, 2025
December 31, 2024
Private Education Loans, net
$
15,530
$
15,716
Cash and investments(1)
532
524
Other
540
569
Total assets
$
16,602
$
16,809
(1)
Includes restricted cash and investments.
71
NAVIENT CORPORATION
NOTES TO CONSOLIDATED FINANCIAL STATEMENTS
(Information at June 30, 2025 and for the three and six months ended
June 30, 2025 and 2024 is unaudited)
11. Segment Reporting (Continued)
Business Processing Segment
In September 2024, Navient completed the sale of Xtend, which comprised the Company's healthcare services business in its Business Processing segment. In February 2025, Navient completed the sale of its government services businesses, which constituted the remainder of the Business Processing segment.
Prior to the sale of its healthcare and government services businesses, Navient provided business processing solutions such as omnichannel contact center services, workflow processing, and revenue cycle optimization. We leveraged the same expertise and intelligent tools we use to deliver successful results for portfolios we own. Our support enabled our clients to ensure better constituent outcomes, meet rapidly changing needs, improve technology, reduce operating expenses, manage risk and optimize revenue opportunities. Our clients included:
•
Government: We offered our solutions to federal agencies, state governments, tolling and parking authorities, and other public sector clients.
•
Healthcare:Our clients included hospitals, hospital systems, medical centers, large physician groups, other healthcare providers and public health departments.
At June 30, 2025 and December 31, 2024, the Business Processing segment had total assets of $0 and $103 million, respectively.
Other Segment
This segment consists of our corporate liquidity portfolio, gains and losses incurred on the repurchase of debt, unallocated expenses of shared services (which includes regulatory expenses) and restructuring/other reorganization expenses. Additionally, the segment contains the revenue and expenses in connection with the transition services we are performing related to the outsourcing of servicing and divestiture of our Business Processing segment.
Unallocated shared services expenses are comprised of costs primarily related to information technology costs related to infrastructure and operations, stock-based compensation expense, accounting, finance, legal, compliance and risk management, regulatory-related expenses, human resources, certain executive management and the Board of Directors. Regulatory-related expenses include actual settlement amounts as well as third-party professional fees we incur in connection with such regulatory matters and are presented net of any insurance reimbursements for covered costs related to such matters.
At June 30, 2025 and December 31, 2024, the Other segment had total assets of $1.2billion and $1.3 billion, respectively.
72
NAVIENT CORPORATION
NOTES TO CONSOLIDATED FINANCIAL STATEMENTS
(Information at June 30, 2025 and for the three and six months ended
June 30, 2025 and 2024 is unaudited)
11. Segment Reporting (Continued)
Measure of Profitability
We prepare financial statements and present financial results in accordance with GAAP. However, we also evaluate our business segments and present financial results on a basis that differs from GAAP. We refer to this different basis of presentation as Core Earnings. We provide this Core Earnings basis of presentation on a consolidated basis and for each business segment because this is what we review internally when making management decisions regarding our performance and how we allocate resources. We also refer to this information in our presentations with credit rating agencies, lenders and investors. Because our Core Earnings basis of presentation corresponds to our segment financial presentations, we are required by GAAP to provide Core Earnings disclosure in the notes to our consolidated financial statements for our business segments.
Core Earnings are not a substitute for reported results under GAAP. We use Core Earnings to manage our business segments because Core Earnings reflect adjustments to GAAP financial results for two items, discussed below, that can create significant volatility mostly due to timing factors generally beyond the control of management. Accordingly, we believe that Core Earnings provide management with a useful basis from which to better evaluate results from ongoing operations against the business plan or against results from prior periods. Consequently, we disclose this information because we believe it provides investors with additional information regarding the operational and performance indicators that are most closely assessed by management. When compared to GAAP results, the two items we remove to result in our Core Earnings presentations are:
1.
Mark-to-market gains/losses resulting from our use of derivative instruments to hedge our economic risks that do not qualify for hedge accounting treatment or do qualify for hedge accounting treatment but result in ineffectiveness; and
2.
The accounting for goodwill and acquired intangible assets.
While GAAP provides a uniform, comprehensive basis of accounting, for the reasons described above, our Core Earnings basis of presentation does not. Core Earnings are subject to certain general and specific limitations that investors should carefully consider. For example, there is no comprehensive, authoritative guidance for management reporting. Our Core Earnings are not defined terms within GAAP and may not be comparable to similarly titled measures reported by other companies. Accordingly, our Core Earnings presentation does not represent a comprehensive basis of accounting. Investors, therefore, may not be able to compare our performance with that of other financial services companies based upon Core Earnings. Core Earnings results are only meant to supplement GAAP results by providing additional information regarding the operational and performance indicators that are most closely used by management, our Board of Directors, credit rating agencies, lenders and investors to assess performance.
73
NAVIENT CORPORATION
NOTES TO CONSOLIDATED FINANCIAL STATEMENTS
(Information at June 30, 2025 and for the three and six months ended
June 30, 2025 and 2024 is unaudited)
11. Segment Reporting (Continued)
Segment Results and Reconciliations to GAAP
Three Months Ended June 30, 2025
Adjustments
Reportable Segments
(Dollars in millions)
Total GAAP
Reclassi- fications
Additions/ (Subtractions)
Total Adjustments (1)
Total Core Earnings
Federal Education Loans
Consumer Lending
Business Processing
Other
Interest income:
Education loans
$
756
$
483
$
273
$
—
$
—
Cash and investments
22
10
5
—
7
Total interest income
778
493
278
—
7
Total interest expense
650
438
183
—
26
Net interest income (loss)
128
$
5
$
(2
)
$
3
$
131
55
95
—
(19
)
Less: provisions for loan losses
37
37
8
29
—
—
Net interest income (loss) after provisions for loan losses
91
47
66
—
(19
)
Other income (loss):
Servicing revenue
14
11
3
—
—
Asset recovery and business processing revenue
—
—
—
—
—
Other revenue (loss)
14
(1
)
—
—
20
Total other income
28
(5
)
10
5
33
10
3
—
20
Expenses:
Direct operating expenses
53
17
36
—
—
Unallocated shared services expenses
47
—
—
—
47
Operating expenses(2)
100
—
—
—
100
17
36
—
47
Goodwill and acquired intangible asset impairment and amortization
1
—
(1
)
(1
)
—
—
—
—
—
Restructuring/other reorganization expenses
—
—
—
—
—
—
—
—
—
Total expenses
101
—
(1
)
(1
)
100
17
36
—
47
Income (loss) before income tax expense (benefit)
18
—
9
9
27
40
33
—
(46
)
Income tax expense (benefit)(3)
4
—
2
2
6
10
7
—
(11
)
Net income (loss)
$
14
$
—
$
7
$
7
$
21
$
30
$
26
$
—
$
(35
)
(1)
Core Earnings adjustments to GAAP:
Three Months Ended June 30, 2025
(Dollars in millions)
Net Impact of Derivative Accounting
Net Impact of Goodwill and Acquired Intangibles
Total
Net interest income (loss) after provisions for loan losses
$
3
$
—
$
3
Total other income (loss)
5
—
5
Goodwill and acquired intangible asset impairment and amortization
—
(1
)
(1
)
Total Core Earnings adjustments to GAAP
$
8
$
1
9
Income tax expense (benefit)
2
Net income (loss)
$
7
(2)
Reportable segment significant operating expenses are comprised of:
Three Months Ended June 30, 2025
(Dollars in millions)
Federal Education Loans
Consumer Lending
Business Processing
Other
Total
Servicing expenses
$
16
$
14
$
—
$
2
$
32
Information technology expenses
—
8
—
20
28
Corporate expenses
—
1
—
19
20
Other/remaining expenses
1
13
—
6
20
Operating expenses
$
17
$
36
$
—
$
47
$
100
(3)
Income taxes are based on a percentage of net income before tax for the individual reportable segment
74
NAVIENT CORPORATION
NOTES TO CONSOLIDATED FINANCIAL STATEMENTS
(Information at June 30, 2025 and for the three and six months ended
June 30, 2025 and 2024 is unaudited)
11. Segment Reporting (Continued)
Three Months Ended June 30, 2024
Adjustments
Reportable Segments
(Dollars in millions)
Total GAAP
Reclassi- fications
Additions/ (Subtractions)
Total Adjustments (1)
Total Core Earnings
Federal Education Loans
Consumer Lending
Business Processing
Other
Interest income:
Education loans
$
925
$
608
$
317
$
—
$
—
Cash and investments
48
28
7
—
13
Total interest income
973
636
324
—
13
Total interest expense
843
603
198
—
36
Net interest income (loss)
130
$
9
$
(3
)
$
6
$
136
33
126
—
(23
)
Less: provisions for loan losses
14
14
(2
)
16
—
—
Net interest income (loss) after provisions for loan losses
116
35
110
—
(23
)
Other income (loss):
Servicing revenue
18
15
3
—
—
Asset recovery and business processing revenue
81
—
—
81
—
Other revenue
18
2
—
—
2
Total other income
117
(9
)
(5
)
(14
)
103
17
3
81
2
Expenses:
Direct operating expenses
112
16
34
62
—
Unallocated shared services expenses
54
—
—
—
54
Operating expenses(2)
166
—
—
—
166
16
34
62
54
Goodwill and acquired intangible asset impairment and amortization
3
—
(3
)
(3
)
—
—
—
—
—
Restructuring/other reorganization expenses
16
—
—
—
16
—
—
—
16
Total expenses
185
—
(3
)
(3
)
182
16
34
62
70
Income (loss) before income tax expense (benefit)
48
—
(5
)
(5
)
43
36
79
19
(91
)
Income tax expense (benefit)(3)
12
—
(2
)
(2
)
10
8
19
4
(21
)
Net income (loss)
$
36
$
—
$
(3
)
$
(3
)
$
33
$
28
$
60
$
15
$
(70
)
(1)
Core Earnings adjustments to GAAP:
Three Months Ended June 30, 2024
(Dollars in millions)
Net Impact of Derivative Accounting
Net Impact of Goodwill and Acquired Intangibles
Total
Net interest income (loss) after provisions for loan losses
$
6
$
—
$
6
Total other income (loss)
(14
)
—
(14
)
Goodwill and acquired intangible asset impairment and amortization
—
(3
)
(3
)
Total Core Earnings adjustments to GAAP
$
(8
)
$
3
(5
)
Income tax expense (benefit)
(2
)
Net income (loss)
$
(3
)
(2)
Reportable segment significant operating expenses are comprised of:
Three Months Ended June 30, 2024
(Dollars in millions)
Federal Education Loans
Consumer Lending
Business Processing
Other
Total
Servicing expenses
$
10
$
13
$
—
$
—
$
23
Information technology expenses
3
7
4
20
34
Corporate expenses
1
1
1
21
24
Other/remaining expenses
2
13
57
13
85
Operating expenses
$
16
$
34
$
62
$
54
$
166
(3)
Income taxes are based on a percentage of net income before tax for the individual reportable segment
75
NAVIENT CORPORATION
NOTES TO CONSOLIDATED FINANCIAL STATEMENTS
(Information at June 30, 2025 and for the three and six months ended
June 30, 2025 and 2024 is unaudited)
11. Segment Reporting (Continued)
Six Months Ended June 30, 2025
Adjustments
Reportable Segments
(Dollars in millions)
Total GAAP
Reclassi- fications
Additions/ (Subtractions)
Total Adjustments (1)
Total Core Earnings
Federal Education Loans
Consumer Lending
Business Processing
Other
Interest income:
Education loans
$
1,537
$
975
$
562
$
—
$
—
Cash and investments
43
20
10
—
13
Total interest income
1,580
995
572
—
13
Total interest expense
1,322
892
364
—
49
Net interest income (loss)
258
$
11
$
6
$
17
$
275
103
208
—
(36
)
Less: provisions for loan losses
67
67
16
51
—
—
Net interest income (loss) after provisions for loan losses
191
87
157
—
(36
)
Other income (loss):
Servicing revenue
27
21
6
—
—
Asset recovery and business processing revenue
23
—
—
23
—
Other revenue
3
(1
)
—
—
34
Total other income (loss)
53
(11
)
41
30
83
20
6
23
34
Expenses:
Direct operating expenses
127
37
70
20
—
Unallocated shared services expenses
100
—
—
—
100
Operating expenses(2)
227
—
—
—
227
37
70
20
100
Goodwill and acquired intangible asset impairment and amortization
2
—
(2
)
(2
)
—
—
—
—
—
Restructuring/other reorganization expenses
3
—
—
—
3
—
—
—
3
Total expenses
232
—
(2
)
(2
)
230
37
70
20
103
Income (loss) before income tax expense (benefit)
12
—
49
49
61
70
93
3
(105
)
Income tax expense (benefit)(3)
1
—
13
13
14
16
21
1
(24
)
Net income (loss)
$
11
$
—
$
36
$
36
$
47
$
54
$
72
$
2
$
(81
)
(1)
Core Earnings adjustments to GAAP:
Six Months Ended June 30, 2025
(Dollars in millions)
NetImpact of Derivative Accounting
Net Impact of Goodwill and Acquired Intangibles
Total
Net interest income (loss) after provisions for loan losses
$
17
$
—
$
17
Total other income (loss)
30
—
30
Goodwill and acquired intangible asset impairment and amortization
—
(2
)
(2
)
Total Core Earnings adjustments to GAAP
$
47
$
2
49
Income tax expense (benefit)
13
Net income (loss)
$
36
(2)
Reportable segment significant operating expenses are comprised of:
Six Months Ended June 30, 2025
(Dollars in millions)
Federal Education Loans
Consumer Lending
Business Processing
Other
Total
Servicing expenses
$
34
$
28
$
—
$
5
$
67
Information technology expenses
—
17
1
41
59
Corporate expenses
1
1
—
43
45
Other/remaining expenses
2
24
19
11
56
Operating expenses
$
37
$
70
$
20
$
100
$
227
(3)
Income taxes are based on a percentage of net income before tax for the individual reportable segment
76
NAVIENT CORPORATION
NOTES TO CONSOLIDATED FINANCIAL STATEMENTS
(Information at June 30, 2025 and for the three and six months ended
June 30, 2025 and 2024 is unaudited)
11. Segment Reporting (Continued)
Six Months Ended June 30, 2024
Adjustments
Reportable Segments
(Dollars in millions)
Total GAAP
Reclassi- fications
Additions/ (Subtractions)
Total Adjustments (1)
Total Core Earnings
Federal Education Loans
Consumer Lending
Business Processing
Other
Interest income:
Education loans
$
1,914
$
1,269
$
645
$
—
$
—
Cash and investments
86
51
14
—
21
Total interest income
2,000
1,320
659
—
21
Total interest expense
1,718
1,233
400
—
68
Net interest income (loss)
282
$
19
$
(2
)
$
17
$
299
87
259
—
(47
)
Less: provisions for loan losses
26
26
(1
)
27
—
—
Net interest income (loss) after provisions for loan losses
256
88
232
—
(47
)
Other income (loss):
Servicing revenue
35
28
7
—
—
Asset recovery and business processing revenue
158
—
—
158
—
Other revenue
59
5
1
—
7
Total other income (loss)
252
(19
)
(27
)
(46
)
206
33
8
158
7
Expenses:
Direct operating expenses
231
33
67
131
—
Unallocated shared services expenses
119
—
—
—
119
Operating expenses(2)
350
—
—
—
350
33
67
131
119
Goodwill and acquired intangible asset impairment and amortization
5
—
(5
)
(5
)
—
—
—
—
—
Restructuring/other reorganization expenses
17
—
—
—
17
—
—
—
17
Total expenses
372
—
(5
)
(5
)
367
33
67
131
136
Income (loss) before income tax expense (benefit)
136
—
(24
)
(24
)
112
88
173
27
(176
)
Income tax expense (benefit)(3)
27
—
(1
)
(1
)
26
20
40
6
(40
)
Net income (loss)
$
109
$
—
$
(23
)
$
(23
)
$
86
$
68
$
133
$
21
$
(136
)
(1)
Core Earnings adjustments to GAAP:
Six Months Ended June 30, 2024
(Dollars in millions)
Net Impact of Derivative Accounting
Net Impact of Goodwill and Acquired Intangibles
Total
Net interest income (loss) after provisions for loan losses
$
17
$
—
$
17
Total other income (loss)
(46
)
—
(46
)
Goodwill and acquired intangible asset impairment and amortization
—
(5
)
(5
)
Total Core Earnings adjustments to GAAP
$
(29
)
$
5
(24
)
Income tax expense (benefit)
(1
)
Net income (loss)
$
(23
)
(2)
Reportable segment significant operating expenses are comprised of:
Six Months Ended June 30, 2024
(Dollars in millions)
Federal Education Loans
Consumer Lending
Business Processing
Other
Total
Servicing expenses
$
22
$
26
$
—
$
—
$
48
Information technology expenses
6
14
9
42
71
Corporate expenses
2
2
2
49
55
Other/remaining expenses
3
25
120
28
176
Operating expenses
$
33
$
67
$
131
$
119
$
350
(3)
Income taxes are based on a percentage of net income before tax for the individual reportable segment
77
NAVIENT CORPORATION
NOTES TO CONSOLIDATED FINANCIAL STATEMENTS
(Information at June 30, 2025 and for the three and six months ended
June 30, 2025 and 2024 is unaudited)
11. Segment Reporting (Continued)
Summary of Core Earnings Adjustments to GAAP
Three Months Ended June 30,
Six Months Ended June 30,
(Dollars in millions)
2025
2024
2025
2024
GAAP net income (loss)
$
14
$
36
$
11
$
109
Core Earnings adjustments to GAAP:
Net impact of derivative accounting(1)
8
(8
)
47
(29
)
Net impact of goodwill and acquired intangible assets(2)
1
3
2
5
Net tax effect(3)
(2
)
2
(13
)
1
Total Core Earnings adjustments to GAAP
7
(3
)
36
(23
)
Core Earnings net income
$
21
$
33
$
47
$
86
(1)
Derivative accounting: Core Earnings exclude periodic gains and losses that are caused by the mark-to-market valuations on derivatives that do not qualify for hedge accounting treatment under GAAP as well as the periodic mark-to-market gains and losses that are a result of ineffectiveness recognized related to effective hedges under GAAP. Under GAAP, for our derivatives that are held to maturity, the mark-to-market gain or loss over the life of the contract will equal $0. In our Core Earnings presentation, we recognize the economic effect of these hedges, which generally results in any net settlement cash paid or received being recognized ratably as an interest expense or revenue over the hedged item’s life.
(2)
Goodwill and acquired intangible assets: Our Core Earnings exclude goodwill and intangible asset impairment and amortization of acquired intangible assets.
(3)
Net tax effect: Such tax effect is based upon our Core Earnings effective tax rate for the year.
78
SIGNATURES
Pursuant to the requirements of the Securities Exchange Act of 1934, as amended, the Registrant has duly caused this report to be signed on its behalf by the undersigned hereunto duly authorized.