UNITED STATES
SECURITIES AND EXCHANGE COMMISSION
Washington, D.C. 20509
Form 20-F
(Mark One)
| ☐ |
REGISTRATION STATEMENT PURSUANT TO SECTION 12(b) OR (g) OF THE SECURITIES EXCHANGE ACT OF 1934
|
OR
| ☒ |
ANNUAL REPORT PURSUANT TO SECTION 13 OR 15(d) OF THE SECURITIES EXCHANGE ACT OF 1934
|
For the fiscal year ended December 31, 2019
OR
| ☐ |
TRANSITION REPORT PURSUANT TO SECTION 13 OR 15(d) OF THE SECURITIES EXCHANGE ACT OF 1934
|
OR
| ☐ |
SHELL COMPANY REPORT PURSUANT TO SECTION 13 OR 15(d) OF THE SECURITIES EXCHANGE ACT OF 1934
|
Date of event requiring this shell company report__________
For the transition period from_________to_________
Commission file number: 001-36487
Atlantica Yield plc
(Exact name of Registrant as specified in its charter)
Not applicable
(Translation of Registrant’s name into English)
England and Wales
(Jurisdiction of incorporation or organization)
Great West House, GW1, 17th floor
Great West Road
Brentford, United Kingdom TW8 9DF
Tel: +44 203 499 0465
(Address of principal executive offices)
Santiago Seage
Great West House, GW1, 17th floor
Great West Road
Brentford, United Kingdom TW8 9DF
Tel: +44 203 499 0465
(Name, Telephone, E-mail and/or Facsimile number and Address of Company Contact Person)
Securities registered or to be registered pursuant to Section 12(b) of the Act.
|
Title of each class
|
Trading Symbol
|
Name of each exchange on which registered
|
|
|
Ordinary Shares, nominal value $0.10 per share
|
AY
|
NASDAQ Global Select Market
|
Securities registered or to be registered pursuant to Section 12(g) of the Act.
None
Securities for which there is a reporting obligation pursuant to Section 15(d) of the Act.
None
Indicate the number of outstanding shares of each of the issuer’s classes of capital or common stock as of the close of the period covered by the annual report: 101,601,666 ordinary shares, nominal
value $0.10 per share.
Indicate by check mark if the registrant is a well-known seasoned issuer, as defined in Rule 405 of the Securities Act. ☒Yes ☐ No
If this report is an annual or transition report, indicate by check mark if the registrant is not required to file reports pursuant to Section 13 or 15(d) of the Securities Exchange Act of 1934.
☐Yes ☒ No
Indicate by check mark whether the registrant (1) has filed all reports required to be filed by Section 13 or 15(d) of the Securities Exchange Act of 1934 during the preceding 12 months (or for
such shorter period that the registrant was required to file such reports), and (2) has been subject to such filing requirements for the past 90 days. ☒Yes ☐ No
Indicate by check mark whether the registrant has submitted electronically every Interactive Data File required to be submitted pursuant to Rule 405 of Regulation S-T (§232.405 of this chapter)
during the preceding 12 months (or for such shorter period that the registrant was required to submit such files). ☒Yes ☐ No
Indicate by check mark whether the registrant is a large accelerated filer, an accelerated filer, a non-accelerated filer, or an emerging growth company. See definition of “large accelerated filer,
“accelerated filer,” and “emerging growth company” in Rule 12b-2 of the Exchange Act.
|
Large accelerated filer ☒
|
Accelerated filer ☐
|
Non-accelerated filer ☐
|
|
Emerging growth company ☐
|
Indicate by check mark which basis of accounting the registrant has used to prepare the financial statements included in this filing:
|
U.S. GAAP ☐
|
International Financial Reporting Standards
as issued by the International Accounting
Standards Board ☒
|
Other ☐
|
If “Other” has been checked in response to the previous question indicate by check mark which financial statement item the registrant has elected to follow. ☐ Item 17 ☐ Item 18
If this is an annual report, indicate by check mark whether the registrant is a shell company (as defined in Rule 12b-2 of the Exchange Act). ☐Yes ☒No
ATLANTICA YIELD PLC
|
Page
|
||
|
6
|
||
|
10
|
||
| 11 | ||
|
ITEM 1.
|
12
|
|
|
ITEM 2.
|
12
|
|
|
ITEM 3.
|
12
|
|
|
A.
|
12
|
|
|
B.
|
18 | |
|
C.
|
18 | |
|
D.
|
19 | |
|
ITEM 4.
|
51
|
|
|
A.
|
51
|
|
|
B.
|
53
|
|
|
C.
|
116
|
|
|
D.
|
117
|
|
|
ITEM 4A.
|
117
|
|
|
ITEM 5.
|
117
|
|
|
A.
|
117
|
|
|
B.
|
132
|
|
|
C.
|
145
|
|
|
D.
|
145
|
|
|
E.
|
145
|
|
|
F.
|
146
|
|
|
G.
|
146
|
|
|
ITEM 6.
|
147
|
|
|
A.
|
147
|
|
|
B.
|
149
|
|
|
C.
|
156
|
|
|
D.
|
158
|
|
|
E.
|
158
|
|
|
ITEM 7.
|
159
|
|
|
A.
|
159
|
|
|
B.
|
160
|
|
|
C.
|
163
|
|
|
ITEM 8.
|
163
|
|
|
A.
|
163
|
|
|
B.
|
166
|
|
|
ITEM 9.
|
166
|
|
|
A.
|
166
|
|
|
B.
|
166
|
|
|
C.
|
166
|
|
|
D.
|
166
|
|
|
E.
|
166
|
|
|
F.
|
166
|
|
|
ITEM 10.
|
166
|
|
|
A.
|
166
|
|
|
B.
|
167
|
|
|
C.
|
167
|
|
|
D.
|
167
|
|
|
E.
|
167
|
|
|
F.
|
171
|
|
|
G.
|
171
|
|
|
H.
|
171
|
|
|
I.
|
171
|
|
|
ITEM 11.
|
171
|
|
|
ITEM 12.
|
173
|
|
A.
|
173
|
|
|
B.
|
173
|
|
|
C.
|
174
|
|
|
D.
|
174
|
|
|
ITEM 13.
|
174
|
|
|
ITEM 14.
|
174
|
|
|
ITEM 15.
|
174
|
|
|
ITEM 16.
|
175
|
|
|
ITEM 16A.
|
175
|
|
|
ITEM 16B.
|
175
|
|
|
ITEM 16C.
|
175
|
|
|
ITEM 16D.
|
177
|
|
|
ITEM 16E.
|
177
|
|
|
ITEM 16F.
|
177
|
|
|
ITEM 16G.
|
177
|
|
|
ITEM 16H.
|
178
|
|
|
ITEM 17.
|
178
|
|
|
ITEM 18.
|
178
|
|
|
ITEM 19.
|
178
|
CAUTIONARY STATEMENTS REGARDING FORWARD-LOOKING STATEMENTS
This report includes forward-looking statements within the meaning of the Private Securities Litigation Reform Act of 1995. Any statements that express, or involve discussions as to, expectations,
beliefs, plans, objectives, assumptions, strategies, future events or performance (often, but not always, through the use of words or phrases such as may result, are expected to, will continue, is anticipated, believe, will, could, should, would,
estimated, may, plan, potential, future, projection, goals, target, outlook, predict and intend or words of similar meaning) are not statements of historical facts and may be forward looking. Such statements occur throughout this report and include
statements with respect to our expected trends and outlook, potential market and currency fluctuations, occurrence and effects of certain trigger and conversion events, our capital requirements, changes in market price of our shares, future
regulatory requirements, the ability to identify and/or consummate future acquisitions on favorable terms, reputational risks, divergence of interests between our company and that of our largest shareholder’s and affiliates’, tax and insurance
implications, and more. Forward-looking statements involve estimates, assumptions and uncertainties. Accordingly, any such statements are qualified in their entirety by reference to, and are accompanied by, important factors included in Part I, Item
3D. Risk Factors (in addition to any assumptions and other factors referred to specifically in connection with such forward-looking statements) that could have a significant impact on our operations and financial results, and could cause our actual
results to differ materially from those contained or implied in forward-looking statements made by us or on our behalf in this Form 20-F, in presentations, on our website, in response to questions or otherwise. These forward-looking statements
include, but are not limited to, statements relating to:
| • |
the condition of the debt and equity capital markets and our ability to borrow additional funds and access capital markets, as well as our substantial indebtedness and the possibility that we may incur
additional indebtedness going forward;
|
| • |
the ability of our counterparties to satisfy their financial commitments or business obligations and our ability to seek new counterparties in a competitive market;
|
| • |
government regulation, including compliance with regulatory and permit requirements and changes in tax laws, market rules, rates, tariffs, environmental laws and policies affecting renewable energy;
|
| • |
risks relating to our activities in areas subject to economic, social and political uncertainties;
|
| • |
our ability to finance and consummate new acquisitions on favorable terms;
|
| • |
risks relating to new assets and businesses which have a higher risk profile and our ability to transition these successfully;
|
| • |
potential environmental liabilities and the cost and conditions of compliance with applicable environmental laws and regulations;
|
| • |
risks related to our reliance on third-party contractors or suppliers;
|
| • |
risks related to our exposure in the labor market;
|
| • |
potential issues arising with our operators’ employees including disagreement with employees’ unions and subcontractors;
|
| • |
risks related to extreme weather events related to climate change could damage our assets or result in significant liabilities and cause an increase in our operation and maintenance costs;
|
| • |
the effects of litigation and other legal proceedings (including bankruptcy) against us and our subsidiaries;
|
| • |
price fluctuations, revocation and termination provisions in our off-take agreements and power purchase agreements;
|
| • |
our electricity generation, our projections thereof and factors affecting production, including weather conditions, energy regulation, availability and curtailment;
|
| • |
risks related to our relationship with our shareholders including bankruptcy;
|
| • |
our substantial short-term and long-term indebtedness, including additional debt in the future;
|
| • |
reputational and financial damage caused by our off-taker PG&E and potential default under our project finance agreement due to a breach of our underlying PPA agreement with PG&E; and
|
| • |
other factors discussed under “Risk Factors”.
|
Any forward-looking statement speaks only as of the date on which such statement is made, and we undertake no obligation to update any forward-looking statement to reflect events or circumstances,
including, but not limited to, unanticipated events, after the date on which such statement is made, unless otherwise required by law. New factors emerge from time to time and it is not possible for management to predict all of such factors, nor can
it assess the impact of each such factor on the business or the extent to which any factor, or combination of factors, may cause actual results to differ materially from those contained or implied in any forward-looking statement.
In this annual report, all references to “U.S. dollar,” “$” and “USD” are to the lawful currency of the United States, all references to “euro,” “€” or “EUR” are to the single
currency of the participating member states of the European and Monetary Union of the Treaty Establishing the European Community, as amended from time to time and all references to “South African rand,” “R” and “ZAR” are to the lawful currency of the
Republic of South Africa.
Definitions
Unless otherwise specified or the context requires otherwise in this annual report:
| • |
references to “2016-2018 LTIP” refer to the long-term incentive plan which was in place between 2016 and 2018, and paid in March 2019;
|
| • |
references to “2019 Notes” refer to the 7.000% Senior Notes due 2019 in an aggregate principal amount of $255 million issued on November 17, 2014, as further described in “Item 5.B—Liquidity and Capital
Resources—Financing Arrangements—2019 Notes”;
|
| • |
references to “2020 Green Private Placement” refer to the €290 million (approximately $320 million) senior secured notes maturing in June 20, 2026 which are expected to be issued under a senior secured note
purchase agreement to be dated on or about April 1, 2020, to be entered with a group of institutional investors as purchasers of the notes issued thereunder as further described in “Item 5.B—Liquidity and Capital Resources—Financing
Arrangements—2020 Green Private Placement;
|
| • |
references to “AAGES” refer to the joint venture between Algonquin and Abengoa to invest in the development and construction of clean energy and water infrastructure contracted assets;
|
| • |
references to “AAGES ROFO Agreement” refer to the agreement we entered into with AAGES on March 5, 2018, which became effective upon completion of the Share Sale, that provides us a right of first offer to
purchase any of the AAGES ROFO Assets, as amended and restated from time to time;
|
| • |
references to “AAGES ROFO Assets” refer to any of AAGES’ contracted assets or proposed contracted assets that we expect to evaluate for future acquisition, with certain exceptions, for which AAGES has
provided us a right of first offer to purchase if offered for sale by AAGES;
|
| • |
references to “Abengoa” refer to Abengoa, S.A., together with its subsidiaries, unless the context otherwise requires;
|
| • |
references to “Abengoa ROFO Agreement” refer to the agreement we entered into with Abengoa on June 13, 2014, as amended and restated on December 9, 2014, that provides us a right of first offer to purchase
any of the present or future contracted assets in renewable energy, efficient natural gas, electric transmission and water of Abengoa that are in operation, and any other renewable energy, efficient natural gas, electric transmission and
water asset that is expected to generate contracted revenue and that Abengoa has transferred to an investment vehicle that are located in the United States, Canada, Mexico, Chile, Peru, Uruguay, Brazil, Colombia and the European Union,
and four additional assets in other selected regions, including a pipeline of specified assets that we expect to evaluate for future acquisition, for which Abengoa will provide us a right of first offer to purchase if offered for sale by
Abengoa or an investment vehicle to which Abengoa has transferred them;
|
| • |
references to “ACBH” refer to Abengoa Concessões Brasil Holding, a subsidiary holding company of Abengoa that was engaged in the development, construction, investment and management of concessions in
Brazil, comprised mostly of transmission lines and which is currently undergoing a restructuring process in Brazil;
|
| • |
references to “ACS” refer to ACS Group;
|
| • |
references to “ACT” refer to the gas-fired cogeneration facility located inside the Nuevo Pemex Gas Processing Facility near the city of Villahermosa in the State of Tabasco, Mexico;
|
| • |
references to “Algonquin” refer to, as the context requires, either Algonquin Power & Utilities Corp., a North American diversified generation, transmission and distribution utility, or Algonquin Power
& Utilities Corp. together with its subsidiaries;
|
| • |
references to “Algonquin ROFO Agreement” refer to the agreement we entered into with Algonquin on March 5, 2018, which became effective upon completion of the Share Sale, under which Algonquin granted us a
right of first offer to purchase any of the assets offered for sale located outside of the United States or Canada as amended from time to time. See “Item 7.B—Related Party Transactions—Algonquin drop down agreement and Right of First
Offer on assets outside the United States or Canada”;
|
| • |
references to “Annual Consolidated Financial Statements” refer to the audited annual consolidated financial statements as of December 31, 2019 and 2018 and for the years ended December 31, 2019, 2018 and
2017, including the related notes thereto, prepared in accordance with IFRS as issued by the IASB (as such terms are defined herein), included in this annual report;
|
| • |
references to “ASI Operations” refer to ASI Operations LLC;
|
| • |
references to “Asset Transfer” refer to the transfer of assets contributed by Abengoa prior to the consummation of our initial public offering through a series of transactions;
|
| • |
references to “Atlantica” refer to Atlantica Yield plc and, where the context requires, Atlantica Yield plc together with its consolidated subsidiaries;
|
| • |
references to “ATN” refer to ATN S.A., the operational electronic transmission asset in Peru, which is part of the Guaranteed Transmission System;
|
| • |
references to “ATS” refer to ABY Transmision Sur S.A.;
|
| • |
references to “AYES Canada” refer to Atlantica Yield Energy Solutions Canada Inc., a vehicle formed by Atlantica and Algonquin to channel co-investment opportunities;
|
| • |
references to “Befesa Agua Tenes” refer to Befesa Agua Tenes, S.L.U;
|
| • |
references to “cash available for distribution” refer to the cash distributions received by the Company from its subsidiaries minus cash expenses of the Company, including debt service and general and
administrative expenses;
|
| • |
references to “CESCE” refer to Compañia Española de Seguros de Credito a la Exportacion, S.A. the Spanish Company of Export Credit Insurance;
|
| • |
references to “CNMC” refer to Comision Nacional de los Mercados y de la Competencia, the Spanish state-owned regulator;
|
| • |
references to “COD” refer to the commercial operation date of the applicable facility;
|
| • |
references to “DOE” refer to the U.S. Department of Energy;
|
| • |
references to “DTC” refer to The Depository Trust Company;
|
| • |
references to “EMEA” refer to Europe, Middle East and Africa;
|
| • |
references to “EPACT” refer to the Energy Policy Act of 2005;
|
| • |
references to “EPC” refer to engineering, procurement and construction;
|
| • |
references to “EURIBOR” refer to Euro Interbank Offered Rate, a daily reference rate published by the European Money Markets Institute, based on the average interest rates at which Eurozone banks offer to
lend unsecured funds to other banks in the euro wholesale money market;
|
| • |
references to “EU” refer to the European Union;
|
| • |
references to “Exchange Act” refer to the U.S. Securities Exchange Act of 1934, as amended, or any successor statute, and the rules and regulations promulgated by the SEC thereunder;
|
| • |
references to “Federal Financing Bank” refer to a U.S. government corporation by that name;
|
| • |
references to “Financial Support Agreement” refer to the Financial Support Agreement we entered into with Abengoa on June 13, 2014, as amended and restated on September 28, 2017, pursuant to which Abengoa
agreed to maintain certain guarantees or letters of credit for a period of five years following our IPO;
|
| • |
references to the “First Dropdown Assets” refer to (i) a solar power complex in Spain, Solacor 1/2, with a capacity of 100 MW; (ii) a solar power complex in Spain, PS10/20, with a capacity of 31 MW; and
(iii) one on-shore wind farm in Uruguay, Cadonal, with a capacity of 50 MW, each as further described in “Item 4.B—Business Overview—Our Operations—Renewable Energy”;
|
| • |
references to “Flip Date” refer to such date that Liberty reaches a certain rate of return;
|
| • |
references to “Former Revolving Credit Facility” refer to the credit facility entered into on December 3, 2014, among the Company, as borrower, and Banco Santander, S.A., Bank of America, N.A., Citigroup
Global Markets Limited, HSBC Bank plc and RBC Capital Markets, as joint lead arrangers and joint bookrunners;
|
| • |
references to “FPA” refer to the U.S. Federal Power Act;
|
| • |
references to “Further Adjusted EBITDA” have the meaning set forth in “Presentation of Financial Information—Non-GAAP Financial Measures” in the section below;
|
| • |
references to “gross capacity” refers to the maximum, or rated, power generation capacity, in MW, of a facility or group of facilities, without adjusting for the facility’s power parasitics’ consumption, or
by our percentage of ownership interest in such facility as of the date of this annual report;
|
| • |
references to “GWh” refer to gigawatt hour;
|
| • |
references to “IFRIC 12” refer to International Financial Reporting Interpretations Committee’s Interpretation 12—Service Concessions Arrangements;
|
| • |
references to “IFRS as issued by the IASB” refer to International Financial Reporting Standards as issued by the International Accounting Standards Board;
|
| • |
references to “Initial Funding Commitment” refer to the provision of equity funding as required by Atlantica Yield, by AAGES and Algonquin, for the acquisition of assets and/or interests by Atlantica Yield
or its subsidiaries during 2018 and 2019, but no more than $100 million, subject to the approval of the board of directors of Algonquin;
|
| • |
references to “IPO” refer to our initial public offering of ordinary shares in June 2014;
|
| • |
references to “IRC” refer to the Internal Revenue Code of 1986;
|
| • |
references to “ITC” refer to investment tax credits;
|
| • |
references to “LIBOR” refer to London Interbank Offered Rate;
|
| • |
references to “LTIP” refer to the long-term incentive plan approved by the Board of Directors for 2019.
|
| • |
references to “MACRS” refer to the Modified Accelerated Cost Recovery System;
|
| • |
references to “Monterrey” refer to the 142 MW gas-fired engine facility including 130 MW installed capacity and 12 MW battery capacity, located in, Monterrey, Mexico;
|
| • |
references to “Multinational Investment Guarantee Agency” refer to Multinational Investment Guarantee Agency, a financial institution member of the World Bank Group which offers political insurance and
credit enhancement guarantees;
|
| • |
references to “MW” refer to megawatts;
|
| • |
references to “MWh” refer to megawatt hour;
|
| • |
references to “NEPA” refer to the National Environment Policy Act;
|
| • |
references to “NOL” refer to net operating loss;
|
| • |
references to “Note Issuance Facility 2017” refer to the senior secured note facility dated February 10, 2017, of €275 million (approximately $308 million), with Elavon Financial Services DAC, UK Branch, as
facility agent and a group of funds managed by Westbourne Capital as purchasers of the notes issued thereunder;
|
| • |
references to “Note Issuance Facility 2019” refer to the senior unsecured note facility dated April 30, 2019, of $300 million, with Lucid Agency Services Limited, as facility agent and a group of funds
managed by Westbourne Capital as purchasers of the notes issued thereunder;
|
| • |
references to “O&M” refer to operations and maintenance services provided at our various facilities;
|
| • |
references to “operation” refer to the status of projects that have reached COD (as defined above);
|
| • |
references to “Pemex” refer to Petróleos Mexicanos;
|
| • |
references to “PFIC” refer to passive foreign investment company within the meaning of Section 1297 of the IRC;
|
| • |
references to “PG&E” refer to PG&E Corporation and its regulated utility subsidiary, Pacific Gas and Electric Company collectively;
|
| • |
references to “PPA” refer to the power purchase agreements through which our power generating assets have contracted to sell energy to various off-takers;
|
| • |
references to “PTC” refer to production tax credits;
|
| • |
references to “PTS” refer to Pemex Transportation System;
|
| • |
references to “PURPA” refer to the Public Utility Regulatory Policies Act of 1978;
|
| • |
references to “REC” refer to Renewable Energy Certificate;
|
| • |
references to “Restructured Debt” refers to the restructuring agreement of Abengoa which we signed and agreed on October 25, 2016, subject to implementation of the restructuring, to receive 30% of the
amount owed to us in the form of tradable notes to be issued by Abengoa with the remaining 70% owed to us to be received in the form of equity in Abengoa;
|
| • |
references to “Registrar” refer to The Bank of New York Mellon;
|
| • |
references to “Revolving Credit Facility” refers to the credit and guaranty agreement with a syndicate of banks entered into on May 10, 2018 and amended on January 24, 2019 and August 2, 2019, providing for
a senior secured revolving credit facility in an aggregate principal amount of $425 million, of which $37.5 million matures on December 31, 2021, and the remaining $387.5 matures on December 31, 2022. The Revolving Credit Facility
replaced tranche A of the Former Revolving Credit Facility, which was repaid in full and cancelled prior to its maturity on June 1, 2018;
|
| • |
references to “Rioglass” refer to Rioglass Solar Holding, S.A.;
|
| • |
references to “ROFO” refer to a right of first offer;
|
| • |
references to “ROFO agreements” refer to the AAGES ROFO Agreement, Algonquin ROFO Agreement and Abengoa ROFO Agreement;
|
| • |
references to “RPS” refer to renewable portfolio standards adopted by 29 U.S. states and the District of Columbia that require a regulated retail electric utility to procure a specific percentage of its
total electricity delivered to retail customers in the respective state from eligible renewable generation resources, such as solar or wind generation facilities, by a specific date;
|
| • |
references to “RRRE” refer to the Specific Remuneration System Register (Registro de Regimen Retributivo Especifico) in Spain;
|
| • |
references to “Share Sale” refer to the sale by Abengoa to Algonquin of 25% of our ordinary shares pursuant to an agreement for the sale that was entered into in November 2017. All conditions precedent have
been satisfied and the parties have commenced the process for the transfer of our shares, which we expect to close in the upcoming days;
|
| • |
references to the “Shareholders’ Agreement” refer to the agreement by and among Algonquin Power & Utilities Corp., Abengoa-Algonquin Global Energy Solutions and Atlantica Yield plc, dated March 5, 2018
which became effective upon completion of the Share Sale;
|
| • |
references to “Solnova 1/3/4” refer to a 150 MW concentrating solar power facility wholly owned by Atlantica Yield, located in the municipality of Sanlucar la Mayor, Spain;
|
| • |
references to “TCJA” refer to the Tax Cuts and Jobs Act of 2017;
|
| • |
references to “U.K.” refer to the United Kingdom;
|
| • |
reference to “U.S.” or “United States” refer to the United States of America;
|
| • |
references to “we,” “us,” “our,” “Atlantica” and the “Company” refer to Atlantica Yield plc and its subsidiaries, unless the context otherwise requires.
|
The selected financial information as of December 31, 2019 and 2018 and for the years ended December 31, 2019, 2018 and 2017 is derived from, and qualified in its entirety by reference to, our
Annual Consolidated Financial Statements, which are included elsewhere in this annual report and prepared in accordance with IFRS as issued by the IASB. The selected financial information as of December 31, 2017 and 2016 and for the years ended
December 31, 2016 and 2015, is derived from, and qualified in its entirety by reference to, the annual consolidated financial statements as of December 31, 2018 and 2017 and for the years ended December 31, 2018, 2017 and 2016, which are included in
the annual report on Form 20-F filed with the SEC on February 28, 2019, and prepared in accordance with IFRS as issued by the IASB. The selected financial information as of December 31, 2015 is derived from, and qualified in its entirety by reference
to, the annual consolidated financial statements as of December 31, 2017 and 2016 and for the years ended December 31, 2017, 2016 and 2015, which are included in the annual report on Form 20-F filed with the SEC on March 7, 2018, and prepared in
accordance with IFRS as issued by the IASB.
Certain numerical figures set out in this annual report, including financial data presented in millions or thousands and percentages describing market shares, have been subject to rounding
adjustments, and, as a result, the totals of the data in this annual report may vary slightly from the actual arithmetic totals of such information. Percentages and amounts reflecting changes over time periods relating to financial and other data set
forth in “Item 5.A—Operating and Financial Review and Prospects—Operating Results” are calculated using the numerical data in our Annual Consolidated Financial Statements or the tabular presentation of other data (subject to rounding) contained in
this annual report, as applicable, and not using the numerical data in the narrative description thereof.
Non-GAAP Financial Measures
This annual report contains non-GAAP financial measures including Further Adjusted EBITDA.
Further Adjusted EBITDA is calculated as profit/(loss) for the year attributable to the parent company, after adding back loss/(profit) attributable to non-controlling interest from continued
operations, income tax, share of profit/(loss) of associates carried under the equity method, finance expense net, depreciation, amortization and impairment charges of entities included in the Annual Consolidated Financial Statements, and dividends
received from our preferred equity investment in ACBH prior to December 31, 2017. Further Adjusted EBITDA for 2014 includes preferred dividends received from ACBH for the first time during the third and fourth quarters of 2014. Further Adjusted
EBITDA for 2016 and for first quarter of 2017 includes compensation received from Abengoa in lieu of ACBH dividends.
Our management believes Further Adjusted EBITDA is useful to investors and other users of our financial statements in evaluating our operating performance because it provides them with an
additional tool to compare business performance across companies and across periods. This measure is widely used by investors to measure a company’s operating performance without regard to items such as interest expense, taxes, depreciation and
amortization, which can vary substantially from company to company depending upon accounting methods and book value of assets, capital structure and the method by which assets were acquired. This measure is widely used by other companies in the same
industry.
Our management uses Further Adjusted EBITDA as a measure of operating performance to assist in comparing performance from period to period on a consistent basis and to readily view operating
trends, as a measure for planning and forecasting overall expectations and for evaluating actual results against such expectations, and in communications with our board of directors, shareholders, creditors, analysts and investors concerning our
financial performance.
In our discussion of operating results, we have included foreign exchange impacts in our revenue by providing constant currency revenue growth. The constant currency presentation is not a measure
recognized under IFRS and excludes the impact of fluctuations in foreign currency exchange rates. We believe providing constant currency information provides valuable supplemental information regarding our results of operations. We calculate constant
currency amounts by converting our current period local currency revenue using the prior period foreign currency average exchange rates and comparing these adjusted amounts to our prior period reported results. This calculation may differ from
similarly titled measures used by others and, accordingly, the constant currency presentation is not meant to substitute for recorded amounts presented in conformity with IFRS as issued by the IASB nor should such amounts be considered in isolation.
We present non-GAAP financial measures because we believe that they and other similar measures are widely used by certain investors, securities analysts and other interested parties as supplemental
measures of performance and liquidity. The non-GAAP financial measures may not be comparable to other similarly titled measures of other companies and have limitations as analytical tools and should not be considered in isolation or as a substitute
for analysis of our operating results as reported under IFRS as issued by the IASB. Non-GAAP financial measures and ratios are not measurements of our performance or liquidity under IFRS as issued by the IASB and should not be considered as
alternatives to operating profit or profit for the year or any other performance measures derived in accordance with IFRS as issued by the IASB or any other generally accepted accounting principles or as alternatives to cash flow from operating,
investing or financing activities.
Some of the limitations of these non-GAAP measures are:
| • |
they do not reflect our cash expenditures or future requirements for capital expenditures or contractual commitments;
|
| • |
they do not reflect changes in, or cash requirements for, our working capital needs;
|
| • |
they may not reflect the significant interest expense, or the cash requirements necessary, to service interest or principal payments, on our debts;
|
| • |
although depreciation and amortization are non-cash charges, the assets being depreciated and amortized will often need to be replaced in the future and Further Adjusted EBITDA does not reflect any cash
requirements that would be required for such replacements;
|
| • |
some of the exceptional items that we eliminate in calculating Further Adjusted EBITDA reflect cash payments that were made, or will be made in the future; and
|
| • |
the fact that other companies in our industry may calculate Further Adjusted EBITDA differently than we do, which limits their usefulness as comparative measures.
|
In this annual report, we rely on, and refer to, information regarding our business and the markets in which we operate and compete. The market data and certain economic and industry data and
forecasts used in this annual report were obtained from internal surveys, market research, governmental and other publicly available information, independent industry publications and reports prepared by industry consultants. We believe that these
industry publications, surveys and forecasts are reliable, but we have not independently verified them, and there can be no assurance as to the accuracy or completeness of the included information.
Certain market information and other statements presented herein regarding our position relative to our competitors are not based on published statistical data or information obtained from
independent third parties but reflect our best estimates. We have based these estimates upon information obtained from our customers, trade and business organizations and associations and other contacts in the industries in which we operate.
Elsewhere in this annual report, statements regarding our contracted assets and concessions activities, our position in the industries and geographies in which we operate are based solely on our
experience, our internal studies and estimates and our own investigation of market conditions.
All of the information set forth in this annual report relating to the operations, financial results or market share of our competitors has been obtained from information made available to the
public in such companies’ publicly available reports and independent research, as well as from our experience, internal studies, estimates and investigation of market conditions. We have not funded, nor are we affiliated with, any of the sources
cited in this annual report. We have not independently verified the information and cannot guarantee its accuracy.
All third-party information, as outlined above, has to our knowledge been accurately reproduced and, as far as we are aware and are able to ascertain, no facts have been omitted which would render
the reproduced information inaccurate or misleading, but there can be no assurance as to the accuracy or completeness of the included information.
PART I
Not applicable.
Not applicable.
The tables below present selected consolidated financial and business level information for Atlantica as of and for each of the years ended December 31, 2019, 2018, 2017, 2016 and 2015.
The selected financial information as of December 31, 2019 and 2018 and for the years ended December 31, 2019, 2018 and 2017 is derived from, and qualified in its entirety by reference to, our
Annual Consolidated Financial Statements, which are included elsewhere in this annual report and prepared in accordance with IFRS as issued by the IASB. The selected financial information as of December 31, 2017 and 2016 and for the years ended
December 31, 2016 and 2015, is derived from, and qualified in its entirety by reference to, the annual consolidated financial statements as of December 31, 2018 and 2017 and for the years ended December 31, 2018, 2017 and 2016, which are included in
the annual report on Form 20-F filed with the SEC on February 28, 2019, and prepared in accordance with IFRS as issued by the IASB. The selected financial information as of December 31, 2015 is derived from, and qualified in its entirety by reference
to, the annual consolidated financial statements as of December 31, 2017 and 2016 and for the years ended December 31, 2017, 2016 and 2015, which are included in the annual report on Form 20-F filed with the SEC on March 7, 2018, and prepared in
accordance with IFRS as issued by the IASB.
The selected financial information as of and for the years ended December 31, 2019, 2018, 2017, 2016 and 2015 is not intended to be an indicator of our financial condition or results of operations
in the future. You should review such selected financial information together with our Annual Consolidated Financial Statements and notes thereto, included elsewhere in this annual report.
The following tables should be read in conjunction with “Item 5.A—Operating and Financial Review and Prospects—Operating Results” and our Annual Consolidated Financial Statements and related notes
included elsewhere in this annual report.
Consolidated income statements for the years ended December 31, 2019, 2018, 2017, 2016 and 2015
|
Year ended December 31,
|
||||||||||||||||||||
|
2019
|
2018
|
2017
|
2016
|
2015
|
||||||||||||||||
|
($ in millions, except for share and per share information)
|
||||||||||||||||||||
|
Revenue
|
1,011.5
|
1,043.8
|
1,008.4
|
971.8
|
790.9
|
|||||||||||||||
|
Other operating income
|
93.8
|
132.5
|
80.8
|
65.5
|
68.8
|
|||||||||||||||
|
Employee benefit expense
|
(32.2
|
)
|
(15.1
|
)
|
(18.7
|
)
|
(14.8
|
)
|
(5.8
|
)
|
||||||||||
|
Depreciation, amortization and impairment charges
|
(310.8
|
)
|
(362.7
|
)
|
(311.0
|
)
|
(332.9
|
)
|
(261.3
|
)
|
||||||||||
|
Other operating expenses
|
(261.8
|
)
|
(310.6
|
)
|
(301.5
|
)
|
(287.2
|
)
|
(248.1
|
)
|
||||||||||
|
Operating profit/(loss)
|
500.5
|
487.9
|
458.0
|
402.4
|
344.5
|
|||||||||||||||
|
Financial income
|
4.1
|
36.4
|
1.0
|
3.3
|
3.5
|
|||||||||||||||
|
Financial expense
|
(408.0
|
)
|
(425.0
|
)
|
(463.7
|
)
|
(408.0
|
)
|
(333.9
|
)
|
||||||||||
|
Net exchange differences
|
2.7
|
1.6
|
(4.1
|
)
|
(9.6
|
)
|
3.9
|
|||||||||||||
|
Other financial income/(expense), net
|
(1.1
|
)
|
(8.2
|
)
|
18.4
|
8.5
|
(200.2
|
)
|
||||||||||||
|
Financial expense, net
|
(402.3
|
)
|
(395.2
|
)
|
(448.4
|
)
|
(405.8
|
)
|
(526.7
|
)
|
||||||||||
|
Share of profit/(loss) of associates carried under the equity method
|
7.4
|
5.2
|
5.3
|
6.7
|
7.8
|
|||||||||||||||
|
Profit/(loss) before income tax
|
105.6
|
97.9
|
14.9
|
3.3
|
(174.4
|
)
|
||||||||||||||
|
Income tax benefit/(expense)
|
(31.0
|
)
|
(42.6
|
)
|
(119.8
|
)
|
(1.7
|
)
|
(23.8
|
)
|
||||||||||
|
Profit/(loss) for the year
|
74.6
|
55.3
|
(104.9
|
)
|
1.6
|
(198.2
|
)
|
|||||||||||||
|
Profit/(loss) attributable to non-controlling interest
|
(12.5
|
)
|
(13.7
|
)
|
(6.9
|
)
|
(6.5
|
)
|
(10.8
|
)
|
||||||||||
|
Profit/(loss) for the year attributable to the parent company
|
62.1
|
41.6
|
(111.8
|
)
|
(4.9
|
)
|
(209.0
|
)
|
||||||||||||
|
Less Predecessor Loss prior to Initial Public Offering on June 12, 2014
|
—
|
—
|
—
|
—
|
—
|
|||||||||||||||
|
Net profit/(loss) attributable to the parent company subsequent to Initial Public Offering
|
—
|
—
|
—
|
—
|
—
|
|||||||||||||||
|
Weighted average number of ordinary shares outstanding (millions)
|
101.1
|
100.2
|
100.2
|
100.2
|
92.8
|
|||||||||||||||
|
Basic and diluted earnings per share attributable to the parent company (U.S. dollar per share)
|
0.61
|
0.42
|
(1.12
|
)
|
(0.05
|
)
|
(2.25
|
)
|
||||||||||||
|
Dividend paid per share(1)
|
1.57
|
1.38
|
1.05
|
0.4530
|
1.4292
|
|||||||||||||||
Notes:
| (1) |
2019: On February 26, 2019, the board of directors declared a dividend of $0.37 per share corresponding to the fourth quarter of 2018, which was paid on March 22,
2019. On May 7, 2019, the board of directors approved a dividend of $0.39 per share corresponding to the first quarter of 2019, which was paid on June 14, 2019. On August 2, 2019, the board of directors approved a dividend of $0.40 per
share corresponding to the second quarter of 2019, which was paid on September 13, 2019. On November 5, 2019, the board of directors approved a dividend of $0.41 per share corresponding to the third quarter of 2019, which was paid on
December 13, 2019.
|
2018: On February 27, 2018, the board of directors declared a dividend of $0.31 per share corresponding to the fourth quarter of 2017,
which was paid on March 27, 2018. On May 11, 2018, the board of directors declared a dividend of $0.32 per share corresponding to the first quarter of 2018, which was paid on June 15, 2018. On July 31, 2018, the board of directors declared a dividend
of $0.34 per share corresponding to the second quarter of 2018, which was paid on September 15, 2018. On October 31, 2018, the board of directors declared a dividend of $0.36 per share corresponding to the third quarter of 2018 which was paid on
December 14, 2018.
2017: On February 27, 2017, the board of directors declared a dividend of
$0.25 per share corresponding to the fourth quarter of 2016, which was paid on March 15, 2017. From that amount, we retained $10.4 million of the dividend attributable to Abengoa. On May 12, 2017, the board of directors declared a dividend of
$0.25 per share corresponding to the first quarter of 2017 which was paid on June 15, 2017. On July 28, 2017, the board of directors declared a dividend of $0.26 per share corresponding to the second quarter of 2017 which was paid on August 31,
2017. On November 10, 2017, the board of directors declared a dividend of $0.29 per share corresponding to the third quarter of 2017 which was paid on December 15, 2017.
2016: In February 2016, taking into consideration the uncertainties resulting from the situation of Abengoa, the board of directors
decided to postpone the decision whether to declare a dividend in respect of the fourth quarter of 2015 until the second quarter of 2016. In May 2016, considering the uncertainties in Abengoa situation, our board of directors decided not to declare a
dividend in respect of the fourth quarter of 2015 and to postpone the decision on whether to declare a dividend in respect of the first quarter 2016 until we had obtained greater clarity on cross default and change of ownership issues. On August 3,
2016, based on waivers or forbearances obtained to that date, our board of directors decided to declare a dividend of $0.145 per share for the first quarter of 2016 and a dividend of $0.145 per share for the second quarter of 2016. The dividend was
paid on September 15, 2016, to shareholders of record August 31, 2016. From that amount, we retained $12.3 million of the dividend attributable to Abengoa. On November 11, 2016, our board of directors, based on waivers or forbearances obtained to
that date, decided to declare a dividend of $0.163 per share, paid on December 15, 2016, to shareholders of record on November 30, 2016, and from that amount we retained $6.7 million of the dividend attributable to Abengoa in accordance with the
provisions of the parent support agreement and an agreement reached with Abengoa in relation to the ACBH preferred equity investment.
2015: On March 16, 2015 we paid a dividend of $0.2592 per share to shareholders of record February 28, 2015. On June 15, 2015 we paid a
dividend of $0.34 per share to shareholders of record May 29, 2015. On September 15, 2015 we paid a dividend of $0.40 per share to shareholders of record May 29, 2015. On December 16, 2015, we paid a dividend of $0.43 per share to shareholders of
record as of November 30, 2015, corresponding to the third quarter of 2015, and from that amount we retained $9 million of the dividend attributable to Abengoa in accordance with the provisions of the parent support agreement and an agreement reached
with Abengoa in relation to the ACBH preferred equity investment. See “Item 4.B—Business Overview—Electric Transmission—Exchangeable Preferred Equity Investment in Abengoa Concessões Brasil Holding.”
Consolidated statements of financial position as of December 31, 2019, 2018, 2017, 2016 and 2015
|
As of December 31,
|
||||||||||||||||||||
|
2019
|
2018
|
2017
|
2016
|
2015
|
||||||||||||||||
|
($ in millions)
|
||||||||||||||||||||
|
Non-Current assets:
|
||||||||||||||||||||
|
Contracted concessional assets
|
8,161.1
|
8,549.2
|
9,084.2
|
8,924.2
|
9,300.9
|
|||||||||||||||
|
Investments carried under the equity method
|
139.9
|
53.4
|
55.8
|
55.0
|
56.2
|
|||||||||||||||
|
Financial investments
|
91.6
|
52.7
|
45.3
|
69.8
|
93.8
|
|||||||||||||||
|
Deferred tax assets
|
148.0
|
136.0
|
165.1
|
202.9
|
191.3
|
|||||||||||||||
|
Total non-current assets
|
8,540.6
|
8,791.3
|
9,350.4
|
9,251.9
|
9,642.2
|
|||||||||||||||
|
Current assets:
|
||||||||||||||||||||
|
Inventories
|
20.3
|
18.9
|
17.9
|
15.5
|
14.9
|
|||||||||||||||
|
Trade and other receivables
|
317.6
|
236.4
|
244.4
|
207.6
|
197.3
|
|||||||||||||||
|
Financial investments
|
218.6
|
240.8
|
210.1
|
228.0
|
221.4
|
|||||||||||||||
|
Cash and cash equivalents
|
562.8
|
631.5
|
669.4
|
594.8
|
514.7
|
|||||||||||||||
|
Total current assets
|
1,119.2
|
1,127.7
|
1,141.9
|
1,045.9
|
948.3
|
|||||||||||||||
|
Total assets
|
9,659.8
|
9,919.0
|
10,492.3
|
10,297.8
|
10,590.5
|
|||||||||||||||
|
Total equity
|
1,714.9
|
1,756.1
|
1,895.4
|
1,959.1
|
2,023.5
|
|||||||||||||||
|
Non-current liabilities:
|
||||||||||||||||||||
|
Long-term corporate debt
|
695.1
|
415.2
|
574.2
|
376.3
|
661.3
|
|||||||||||||||
|
Long-term project debt
|
4,069.9
|
4,826.7
|
5,228.9
|
4,629.2
|
3,574.5
|
|||||||||||||||
|
Other liabilities
|
2,206.6
|
2,181.9
|
2,292.9
|
2,158.1
|
2,238.4
|
|||||||||||||||
|
Total non-current liabilities
|
6,971.6
|
7,423.8
|
8,096.5
|
7,163.6
|
6.474.2
|
|||||||||||||||
|
Current liabilities:
|
||||||||||||||||||||
|
Short-term corporate debt
|
28.7
|
268.9
|
68.9
|
291.9
|
3.2
|
|||||||||||||||
|
Short-term project debt
|
782.4
|
264.4
|
246.3
|
701.3
|
1,896.1
|
|||||||||||||||
|
Other liabilities
|
162.3
|
205.8
|
187.0
|
181.9
|
193.5
|
|||||||||||||||
|
Total current liabilities
|
973.4
|
739.1
|
500.4
|
1,175.1
|
2,092.8
|
|||||||||||||||
|
Equity and total liabilities
|
9,659.8
|
9,919.0
|
10,492.3
|
10,297.8
|
10,590.5
|
|||||||||||||||
Consolidated cash flow statements for the years ended December 31, 2019, 2018, 2017, 2016 and 2015
|
Year ended December 31,
|
||||||||||||||||||||
|
2019
|
2018
|
2017
|
2016
|
2015
|
||||||||||||||||
|
($ in millions)
|
||||||||||||||||||||
|
Gross cash flows from operating activities
|
||||||||||||||||||||
|
Profit/(loss) for the year
|
62.1
|
55.3
|
(104.9
|
)
|
1.6
|
(198.2
|
)
|
|||||||||||||
|
Adjustments to reconcile after-tax profit to net cash generated by operating activities
|
701.8
|
697.6
|
848.8
|
664.8
|
734.9
|
|||||||||||||||
|
Profit for the year adjusted by non-monetary items
|
776.4
|
752.9
|
743.9
|
666.4
|
536.7
|
|||||||||||||||
|
Net interest / taxes paid
|
(299.5
|
)
|
(333.5
|
)
|
(349.5
|
)
|
(334.0
|
)
|
(310.2
|
)
|
||||||||||
|
Variations in working capital
|
(113.4
|
)
|
(18.4
|
)
|
(8.8
|
)
|
2.0
|
73.1
|
||||||||||||
|
Total net cash flow provided by/(used in) operating activities
|
363.6
|
401.0
|
385.6
|
334.4
|
299.6
|
|||||||||||||||
|
Net cash flows from investing activities
|
||||||||||||||||||||
|
Investments in entities under the equity method
|
30.4
|
4.4
|
3.0
|
5.0
|
4.4
|
|||||||||||||||
|
Investments in contracted concessional assets(1)
|
22.0
|
68.0
|
30.1
|
(6.0
|
)
|
(106.0
|
)
|
|||||||||||||
|
Other non-current assets/liabilities
|
2.7
|
(16.7
|
)
|
8.2
|
(3.6
|
)
|
5.7
|
|||||||||||||
|
Acquisitions / sales of subsidiaries and other financial instruments
|
(173.4
|
)
|
(70.6
|
)
|
30.1
|
(21.7
|
)
|
(834.0
|
)
|
|||||||||||
|
Total net cash flows provided by/ (used in) investing activities
|
(118.2
|
)
|
(14.9
|
)
|
71.4
|
(26.3
|
)
|
(929.9
|
)
|
|||||||||||
|
Net cash flows provided by/ (used in) financing activities
|
(310.1
|
)
|
(405.2
|
)
|
(416.3
|
)
|
(226.1
|
)
|
810.9
|
|||||||||||
|
Net increase/(decrease) in cash and cash equivalents
|
(64.8
|
)
|
(19.1
|
)
|
40.7
|
82.0
|
180.6
|
|||||||||||||
|
Cash, cash equivalents and bank overdrafts at beginning of the year
|
631.5
|
669.4
|
594.8
|
514.7
|
354.2
|
|||||||||||||||
|
Translation differences cash or cash equivalents
|
(3.9
|
)
|
(18.8
|
)
|
33.9
|
(1.9
|
)
|
(20.1
|
)
|
|||||||||||
|
Cash and cash equivalents at the end of the year
|
562.8
|
631.5
|
669.4
|
594.8
|
514.7
|
|||||||||||||||
_________________
| (1) |
Includes proceeds for $22.2 million, $72.6 million and $42.5 million in 2019, 2018 and 2017 respectively. See note 6 of the Annual Consolidated Financial Statements.
|
Geography and business sector data
Revenue by geography
|
Year ended December 31,
|
||||||||||||||||||||
|
2019
|
2018
|
2017
|
2016
|
2015
|
||||||||||||||||
|
($ in millions)
|
||||||||||||||||||||
|
North America
|
333.0
|
357.2
|
332.7
|
337.0
|
328.1
|
|||||||||||||||
|
South America
|
142.2
|
123.2
|
120.8
|
118.8
|
112.5
|
|||||||||||||||
|
EMEA
|
536.3
|
563.4
|
554.9
|
516.0
|
350.3
|
|||||||||||||||
|
Total revenue
|
1,011.5
|
1,043.8
|
1,008.4
|
971.8
|
790.9
|
|||||||||||||||
Revenue by business sector
|
Year ended December 31,
|
||||||||||||||||||||
|
2019
|
2018
|
2017
|
2016
|
2015
|
||||||||||||||||
|
($ in millions)
|
||||||||||||||||||||
|
Renewable energy
|
761.1
|
793.5
|
767.2
|
724.3
|
543.0
|
|||||||||||||||
|
Efficient natural gas
|
122.3
|
130.8
|
119.8
|
128.1
|
138.7
|
|||||||||||||||
|
Electric transmission
|
103.5
|
96.0
|
95.1
|
95.1
|
86.4
|
|||||||||||||||
|
Water
|
24.6
|
23.5
|
26.3
|
24.3
|
22.8
|
|||||||||||||||
|
Total revenue
|
1,011.5
|
1,043.8
|
1,008.4
|
971.8
|
790.9
|
|||||||||||||||
Non-GAAP financial data
Further Adjusted EBITDA by geography
|
Year ended December 31,
|
||||||||||||||||||||
|
2019
|
2018
|
2017
|
2016
|
2015
|
||||||||||||||||
|
($ in millions)
|
||||||||||||||||||||
|
North America(1)
|
305.1
|
308.8
|
282.3
|
284.7
|
279.6
|
|||||||||||||||
|
South America
|
115.3
|
100.2
|
108.8
|
124.6
|
110.9
|
|||||||||||||||
|
EMEA(1)
|
390.8
|
441.6
|
388.2
|
354.0
|
233.7
|
|||||||||||||||
|
Further Adjusted EBITDA(2)(3)(4)
|
811.2
|
850.6
|
779.3
|
763.3
|
624.2
|
|||||||||||||||
Note:
| (1) |
Further Adjusted EBITDA for EMEA and North America does not include our pro rata share of EBITDA from unconsolidated affiliates, which was $10.4 million, $8.1 million, $7.3 million, $8.8 million and $12.3
million for the years ended December 31, 2019, 2018, 2017, 2016 and 2015.
|
| (2) |
Further Adjusted EBITDA is a supplemental non-GAAP financial measure. We present non-GAAP financial measures because we believe that they and other similar measures are widely used by certain investors,
securities analysts and other interest parties. The non-GAAP financial measures may not be comparable to other similarly titled measures of other companies and have limitations as analytical tools and should not be considered in isolation
or as a substitute for analysis of our operating results as reported under IFRS as issued by the IASB. Non-GAAP financial measures are not measurements of our performance or liquidity under IFRS as issued by the IASB and should not be
considered as alternatives to operating profit or profit for the year or any other performance measure derived in accordance with IFRS as issued by the IASB or any other generally accepted accounting principles. See “Presentation of
Financial Information—Non-GAAP Financial Measures.”
|
| (3) |
Further Adjusted EBITDA is calculated as profit/(loss) for the year attributable to the parent company, after adding back loss/(profit) attributable to non-controlling interest from continued operations,
income tax, share of profit/(loss) of associates carried under the equity method, finance expense net, depreciation, amortization and impairment charges of entities included in the Annual Consolidated Financial Statements, and dividends
received from our preferred equity investment in ACBH. Further Adjusted EBITDA for 2016 and the first quarter of 2017 includes compensation received from Abengoa in lieu of ACBH dividends. Further Adjusted EBITDA is not a measure of
performance under IFRS as issued by the IASB and you should not consider Further Adjusted EBITDA as an alternative to operating income or profits or as a measure of our operating performance, cash flows from operating, investing and
financing activities or as a measure of our ability to meet our cash needs or any other measures of performance under generally accepted accounting principles. We believe that Further Adjusted EBITDA is a useful indicator of our ability
to incur and service our indebtedness and can assist securities analysts, investors and other parties to evaluate us. Further Adjusted EBITDA and similar measures are used by different companies for different purposes and are often
calculated in ways that reflect the circumstances of those companies. Further Adjusted EBITDA may not be indicative of our historical operating results, nor is it meant to be predictive of potential future results.
|
| (4) |
Further Adjusted EBITDA does not include our pro rata share of EBITDA from unconsolidated affiliates, which was $10.4 million, $8.1 million, $7.3 million, $8.8 million and $12.3 million for the years ended
December 31, 2019, 2018, 2017, 2016 and 2015.
|
Further Adjusted EBITDA by business sector
|
Year ended December 31,
|
||||||||||||||||||||
|
2019
|
2018
|
2017
|
2016
|
2015
|
||||||||||||||||
|
($ in millions)
|
||||||||||||||||||||
|
Renewable energy(1)
|
603.7
|
664.4
|
569.2
|
538.4
|
414.0
|
|||||||||||||||
|
Efficient natural gas(1)
|
107.5
|
93.9
|
106.1
|
106.5
|
107.7
|
|||||||||||||||
|
Electric transmission
|
85.6
|
78.4
|
87.7
|
104.8
|
89.0
|
|||||||||||||||
|
Water(1)
|
14.4
|
13.9
|
16.3
|
13.6
|
13.5
|
|||||||||||||||
|
Further Adjusted EBITDA(2)(3)(4)
|
811.2
|
850.6
|
779.3
|
763.3
|
624.2
|
|||||||||||||||
Note:
| (1) |
Further Adjusted EBITDA for Water, Efficient natural gas and Renewable energy does not include our pro rata share of EBITDA from unconsolidated affiliates, which was $10.4 million, $8.1 million, $7.3
million, $8.8 million and $12.3 million for the years ended December 31, 2019, 2018, 2017, 2016 and 2015.
|
| (2) |
Further Adjusted EBITDA is a supplemental non-GAAP financial measure. We present non-GAAP financial measures because we believe that they and other similar measures are widely used by certain investors,
securities analysts and other interest parties. The non-GAAP financial measures may not be comparable to other similarly titled measures of other companies and have limitations as analytical tools and should not be considered in isolation
or as a substitute for analysis of our operating results as reported under IFRS as issued by the IASB. Non-GAAP financial measures are not measurements of our performance or liquidity under IFRS as issued by the IASB and should not be
considered as alternatives to operating profit or profit for the year or any other performance measure derived in accordance with IFRS as issued by the IASB or any other generally accepted accounting principles. See “Presentation of
Financial Information—Non-GAAP Financial Measures.”
|
| (3) |
Further Adjusted EBITDA is calculated as profit/(loss) for the year attributable to the parent company, after adding back loss/(profit) attributable to non-controlling interest from continued operations,
income tax, share of profit/(loss) of associates carried under the equity method, finance expense net, depreciation, amortization and impairment charges of entities included in the Annual Consolidated Financial Statements, and dividends
received from our preferred equity investment in ACBH. Further Adjusted EBITDA for 2016 and the first quarter of 2017 includes compensation received from Abengoa in lieu of ACBH dividends. Further Adjusted EBITDA is not a measure of
performance under IFRS as issued by the IASB and you should not consider Further Adjusted EBITDA as an alternative to operating income or profits or as a measure of our operating performance, cash flows from operating, investing and
financing activities or as a measure of our ability to meet our cash needs or any other measures of performance under generally accepted accounting principles. We believe that Further Adjusted EBITDA is a useful indicator of our ability
to incur and service our indebtedness and can assist securities analysts, investors and other parties to evaluate us. Further Adjusted EBITDA and similar measures are used by different companies for different purposes and are often
calculated in ways that reflect the circumstances of those companies. Further Adjusted EBITDA may not be indicative of our historical operating results, nor is it meant to be predictive of potential future results. See “Presentation of
Financial Information—Non-GAAP Financial Measures.”
|
| (4) |
Further Adjusted EBITDA does not include our pro rata share of EBITDA from unconsolidated affiliates, which was $10.4 million, $8.1 million, $7.3 million, $8.8 million and $12.3 million for the years ended
December 31, 2019, 2018, 2017, 2016 and 2015.
|
The following table sets forth a reconciliation of Further Adjusted EBITDA to our profit/(loss) for the year from continuing operations:
Reconciliation of profit/(loss) for the year to Further Adjusted EBITDA
|
Year ended December 31,
|
||||||||||||||||||||
|
2019
|
2018
|
2017
|
2016
|
2015
|
||||||||||||||||
|
($ in millions)
|
||||||||||||||||||||
|
Profit/(loss) for the year attributable to the parent company
|
62.1
|
41.6
|
(111.8
|
)
|
(4.9
|
)
|
(209.0
|
)
|
||||||||||||
|
Profit/(loss) attributable to non-controlling interest from continued operations
|
12.5
|
13.7
|
6.9
|
6.5
|
10.8
|
|||||||||||||||
|
Income tax
|
30.9
|
42.6
|
119.8
|
1.7
|
23.8
|
|||||||||||||||
|
Share of loss/(profit) of associates carried under the equity method
|
(7.5
|
)
|
(5.2
|
)
|
(5.3
|
)
|
(6.7
|
)
|
(7.8
|
)
|
||||||||||
|
Financial expenses, net
|
402.3
|
395.2
|
448.4
|
405.8
|
526.7
|
|||||||||||||||
|
Operating profit/(loss)
|
500.4
|
487.9
|
458.0
|
402.4
|
344.5
|
|||||||||||||||
|
Depreciation, amortization and impairment charges
|
310.8
|
362.7
|
311.0
|
332.9
|
261.3
|
|||||||||||||||
|
Dividend from preferred equity investment
|
-
|
-
|
10.3
|
28.0
|
18.4
|
|||||||||||||||
|
Further Adjusted EBITDA
|
811.2
|
850.6
|
779.3
|
763.3
|
624.2
|
|||||||||||||||
The following table sets forth a reconciliation of Further Adjusted EBITDA to our net cash generated by or used in operating activities:
Reconciliation of net cash generated by operating activities to Further Adjusted EBITDA
|
Year ended December 31,
|
||||||||||||||||||||
|
2019
|
2018
|
2017
|
2016
|
2015
|
||||||||||||||||
|
($ in millions)
|
||||||||||||||||||||
|
Net cash generated by operating activities
|
363.5
|
401.0
|
385.6
|
334.4
|
299.6
|
|||||||||||||||
|
Interests (paid)/received
|
299.5
|
321.0
|
344.7
|
332.1
|
310.2
|
|||||||||||||||
|
Income tax (paid)/received
|
0
|
12.5
|
4.8
|
2.0
|
(0.5
|
)
|
||||||||||||||
|
Variations in working capital
|
113.4
|
18.4
|
8.8
|
(2.0
|
)
|
(73.1
|
)
|
|||||||||||||
|
Non-monetary adjustments, other cash finance costs and other
|
34.8
|
97.7
|
35.4
|
96.8
|
88.0
|
|||||||||||||||
|
Further Adjusted EBITDA
|
811.2
|
850.6
|
779.3
|
763.3
|
624.2
|
|||||||||||||||
Not applicable.
Not applicable.
Investing in our securities involves a high degree of risk. You should carefully consider the risks and uncertainties described below, together with the other information
contained in this annual report, including our Annual Consolidated Financial Statements and related notes, included elsewhere in this annual report, before making any investment decision. The risks described below may not be the only risks we face.
We have described only those risks that we currently consider to be material and there may be additional risks that we do not currently consider to be material or of which we are not currently aware. Any of the following risks and uncertainties could
have a material adverse effect on our business, prospects, results of operations and financial condition. The market price of our securities could decline due to any of these risks and uncertainties, and you could lose all or part of your investment.
Risks Related to Our Business and the Markets in Which We Operate
Difficult conditions in the global economy and in the global capital markets have caused, and may continue to cause, a sharp reduction in worldwide demand for
our products and services.
Our results of operations have been, and continue to be, materially affected by conditions in the global economy. In the United States, capital markets have been experiencing some volatility
recently probably driven by signs of a global economic slowdown, concerns on upcoming decisions on interest rates, inflation fears, trade tensions with China and the escalation of the conflict with Iran. Concerns over inflation, volatile oil and gas
prices, geopolitical issues, the availability and cost of credit, sovereign debt and the instability of the euro have contributed to increased volatility and diminished expectations for the economy and global capital markets going forward. These
factors have in the past precipitated economic slowdowns and led to a recent recession and weak economic growth. Adverse events and continuing disruptions in the global economy and in the global capital markets may have a material adverse effect on
our business, financial condition, results of operations and cash flows. Moreover, even in the absence of a market downturn, we are exposed to substantial risk of loss due to market volatility with certain factors, including volatile oil prices,
interest rates, consumer spending, business investment, government spending, inflation affecting the business and economic environment that could affect the economic and financial situation of our concession contracts counterparties and, ultimately,
the profitability and growth of our business.
Generalized or localized downturns or inflationary or deflationary pressures in our key geographical areas could also have a material adverse effect on our business, financial condition, results of
operations and cash flows. A significant portion of our business activity is concentrated in the United States, Mexico, Peru and Spain. Consequently, we are significantly affected by the general economic conditions in these countries. Spain, for
instance, has experienced negative economic conditions in the last few years, including high unemployment and significant government debt, increased lately by the continued uncertainty regarding the Catalonian political situation, which we believe
could adversely affect our operations in the future. The effects on the European and global economy of the exit of the United Kingdom from the European Union or of any other member states from the Eurozone, the dissolution of the euro, or the
perception that any of these events are imminent, are inherently difficult to predict and could give rise to operational disruptions or other risks of contagion to our business and have a material adverse effect on our business, financial condition,
results of operations and cash flows. In addition, to the extent uncertainty regarding the European economic recovery continues to negatively affect government or regional budgets, our business, financial condition, results of operations and cash
flows could be materially adversely affected. Various European political parties who question the austerity policies implemented in certain European countries have added political instability to the region. Finally, the elections to the European
Parliament held on May 23-26, 2019, have resulted in changes in the political landscape which may have an impact on the internal policies of the European Union and, ultimately, on our business, financial condition, results of operations and cash
flows. Additionally, political changes in key geographies, including the United States, could affect our business in the United States or in other countries including, for example, Mexico. Finally, other downturns or disruptions provoked by social
unrest in the countries where we operate, like those we have seen in Chile or Algeria, or diseases like the COVID-19 could have a material adverse impact on our business, financial condition, results of operations and cash flows.
We may not be able to arrange the required or desired financing for acquisitions and for the successful refinancing of the Company’s project level and
corporate level indebtedness.
The global capital and credit markets have experienced in the past and may continue to experience periods of extreme volatility and disruption. At times, our access to financing was curtailed by
market conditions and other factors. In recent years, capital markets have been highly volatile, particularly in the United States and Europe. These adverse market conditions could prevent us from accessing the capital markets in a manner that would
permit the Company to make acquisitions or refinance its debt on satisfactory terms or at all. Continued disruptions, uncertainty or volatility in the global capital and credit markets may limit our access to additional capital required to operate or
grow our business, including our access to new debt and equity capital to make further acquisitions or access to project debt, which we may use to fund or refinance many of our projects and corporate level debt, even in cases where such capital has
already been committed. Such market conditions may limit our ability to replace, in a timely manner, maturing liabilities and access the capital necessary to grow our business, or replace financing previously committed for a project that ceases to be
available to us. As a result, we may be forced to delay raising capital, issue shorter-term securities than we prefer, or bear a higher cost of capital which could decrease our profitability and significantly reduce our financial flexibility or even
require us to modify our dividend policy. In the event we are required to replace previously committed financing to certain projects that subsequently becomes unavailable, we may have to postpone or cancel planned acquisitions or capital
expenditures. The inability to raise capital, higher costs of capital or postponement or cancellation of planned acquisitions or capital expenditures may have a materially adverse effect on our business, financial condition, results of operations and
cash flows. In addition, our ability to arrange financing, either at the corporate level or at a non-recourse project level subsidiary, and the costs of such capital, are dependent on numerous factors, including:
| • |
general economic and capital market conditions;
|
| • |
credit availability from banks and other financial institutions;
|
| • |
investor confidence in us and Algonquin as our largest shareholder
|
| • |
our financial performance and the financial performance of our subsidiaries;
|
| • |
our level of indebtedness and compliance with covenants in debt agreements;
|
| • |
maintenance of acceptable project credit ratings or credit quality;
|
| • |
cash flow; and
|
| • |
provisions of tax and securities laws that may impact raising capital.
|
We may not be successful in obtaining additional capital for these or other reasons. Furthermore, we may be unable to refinance or replace project level financing arrangements or other credit
facilities on favorable terms or at all upon the expiration or termination thereof. Our failure, or the failure of any of our projects, to obtain additional capital may constitute a default under such existing indebtedness and may have a material
adverse effect on our business, financial condition, results of operations and cash flows.
Counterparties to our off-take agreements may not fulfill their obligations and, as our contracts expire, we may not be able to replace them with agreements
on similar terms in light of increasing competition in the markets in which we operate.
A significant portion of the electric power we generate, the transmission capacity we have, and our desalination capacity is sold under long-term off-take agreements with public utilities,
industrial or commercial end-users or governmental entities, with a weighted average remaining duration of approximately 18 years as of December 31, 2019.
If, for any reason, including, but not limited to, a deterioration in their financial situation or bankruptcy, any of the purchasers of power, transmission capacity or desalination capacity under
these agreements are unable or unwilling to fulfill their related contractual obligations or if they refuse to accept delivery of power delivered thereunder or if they otherwise terminate such agreements prior to the expiration thereof, or if prices
were re-negotiated under a bankruptcy situation, or if they delayed payments, our assets, liabilities, business, financial condition, results of operations and cash flow may be materially adversely affected. Furthermore, to the extent any of our
power, transmission capacity or desalination capacity purchasers are, or are controlled by, governmental entities, our facilities may be subject to sovereign risk or legislative or other political action that may hamper their contractual performance.
On January 29, 2019, PG&E, the off-taker for Atlantica Yield with respect to the Mojave plant, filed for reorganization under Chapter 11 of the Bankruptcy Code in the U.S. Bankruptcy Court for the Northern District
of California (the “Bankruptcy Court”). As a consequence, PG&E did not pay the portion of the invoice corresponding to the electricity delivered for the period between January 1 and January 28, 2019, which was due on February 25, given that the
services relate to the pre-petition period and any payment therefore would require approval by the Bankruptcy Court. However, Mojave Solar filed a 503(b)(9) claim for the portion of energy delivered 20 days prior to the PG&E filing, which was
approved by an order of the Bankruptcy Court on August 15, 2019. Mojave Solar filed a general unsecured claim on October 17, 2019 for the remaining outstanding balance of energy. Further, PG&E has paid all invoices corresponding to the
electricity delivered after January 28. Due to the PG&E Chapter 11 filings, a default of the PPA agreement with PG&E occurred with the PG&E bankruptcy filing. Since PG&E failed to assume the PPA within 180 days from the commencement
of PG&E’s Chapter 11 proceeding, a technical event of default was triggered under our Mojave project finance agreement in July 2019. Although we do not expect the acceleration of debt to be declared by the DOE, the project debt agreement does not
have what International Accounting Standards define as an unconditional right to defer the settlement of the debt for at least twelve months, as the event of default provision make that right not totally unconditional, and therefore the debt has been
presented as current in our financial statements. As of December 31, 2019, Mojave had $707 million outstanding under its project financing agreement with the Federal Financing Bank, with a guarantee from the DOE. Additionally, Mojave represented
approximately 13.5% of 2018 project level cash available for distribution. Chapter 11 bankruptcy is a complex process and we do not know at this time whether PG&E will seek to reject the PPA or not. However, PG&E has continued to be in
compliance with the remaining terms and conditions of the PPA, including with all payment terms of the PPA up through the date hereof with the exception of services for prepetition services that became due and payable after the chapter 11 filing
date. It remains possible that at any time during the chapter 11 proceeding, PG&E may decide to cease performing under the PPA and attempt to reject or renegotiate the terms of its contract with us. If PG&E rejected the contract and stopped
making payments in accordance with the PPA, Mojave could fail in servicing its debt under its project finance agreement, which would also cause a default under the project finance agreement. If not cured or waived, an event of default in the project
finance agreement could result in debt acceleration and, if such amounts were not timely paid, the DOE could decide to foreclose on the asset. Further, it is possible that the current timetable for confirmation could be delayed due to various matters
relating to the treatment of claims, including claims that may arise during the Chapter 11 case. The PG&E bankruptcy has heightened the risk that project level cash distributions could be restricted for an undetermined period of time, thereby
impacting our corporate liquidity and corporate leverage. Mojave project cash distributions to the corporate level normally take place at the end of the year. The last distribution received at the corporate level took place in December 2018. Unless
the technical event or default is cured or waived, distributions may not be made during the pendency of the bankruptcy. Such events may have a material adverse effect on our business, financial condition, results of operations and cash flows.
During recent months, the credit rating of Eskom has also weakened and is currently CCC+ from S&P Global Rating (“S&P”), B3 from Moody’s Investor Service Inc. (“Moody’s”) and BB- from Fitch
Ratings Inc. (“Fitch”). Eskom is the off-taker of our Kaxu solar plant, a state-owned, limited liability company, wholly owned by the government of the Republic of South Africa. Eskom’s payment guarantees to our solar plant Kaxu are underwritten by
the South African Department of Energy, under the terms of an implementation agreement. The credit ratings of the Republic of South Africa as of the date of this report are BB/Baa3/BB+ by S&P, Moody’s and Fitch, respectively.
In addition, the credit rating of Pemex has also weakened and is currently BBB+ from S&P, Baa3 from Moody’s and BB+ from Fitch. We have been experiencing delays in collections in the last few
months. Although we believe they are partially due to changes in personnel following the elections last year, we continue to monitor the situation closely.
The cost of renewable energy has considerably decreased over the past years, becoming a consistently competitive source of power generation compared to traditional fossil fuels in many regions, and
it is expected to continue falling in the future. In addition, there has been an increase in the number of players and competition in the renewable energy space in the last few years, industrial companies and other independent power producer as well
as large infrastructure funds and other financial players. The reduction in the cost of renewable energy and the intense competition has contributed to a reduction in electricity prices paid by the off-takers. In light of these market conditions, we
may not be able to replace an expiring or terminated agreement with an agreement on equivalent terms and conditions, including at prices that permit operation of the related facility on a profitable basis. In addition, we believe many of our
competitors have well-established relationships with our current and potential suppliers, lenders and customers and have extensive knowledge of our target markets. As a result, these competitors may be able to respond more quickly to evolving
industry standards and changing customer requirements than us. Adoption of technology more advanced than our own could reduce the power production costs of our competitors, resulting in their having a lower cost structure than is achievable with the
technologies we currently employ and adversely affect our ability to compete for off-take agreement renewals. If we are unable to replace an expiring or terminated off-take agreement, the affected facility may temporarily or permanently cease
operations. External events, such as a severe economic downturn and lower commodity prices, could also impair the ability of some counterparties to our off-take agreements and other customer agreements to pay for energy and/or other products and
services received.
Our inability to enter into new or replacement off-take agreements or to compete successfully against current and future competitors in the markets in which we operate may have a material adverse
effect on our business, financial condition, results of operations and cash flows.
Government regulations could change at any time and such changes may negatively impact our current business and our growth strategy.
In some of our assets such as the Spanish solar plants and one of our transmission lines in Chile, revenues are based on existing regulation. We may also acquire in the future additional assets or
businesses with regulated revenues. For these types of assets and businesses, if regulation changes, it may have a material adverse effect on our business, financial condition, results of operations and cash flows.
In addition, our strategy to grow our business through the acquisition of renewable energy projects partly depends on current government policies that promote and support renewable energy and
enhance the economic viability of owning solar and wind energy projects. Renewable energy projects currently benefit from various U.S. federal, state and local governmental incentives, such as ITCs, PTCs, loan guarantees, RPS programs, or MACRS along
with other incentives. These policies have had a significant impact on the development of renewable energy and they could change at any time, especially in the event that the current administration was to embark on further significant changes in
federal energy policy. The current U.S. administration has also made public statements regarding overturning or modifying policies of, or regulations enacted by, the prior administration that placed limitations on coal and gas electric generation,
mining and/or exploration. Additionally, many of these government incentives, including the ITCs and the PTCs, are subject to phase-out and/or expiration. These incentives make the development of renewable energy projects more competitive by
providing tax credits, accelerated depreciation and expensing for a portion of the development costs, decreasing the costs associated with developing such projects or creating demand for renewable energy assets through RPS programs. A loss or
reduction in such incentives or the value of such incentives, a change in policy away from limitations on coal and gas electric generation, mining and exploration, or a reduction in the capacity of potential investors to benefit from such incentives
could decrease the attractiveness of solar or renewable energy projects to project developers, and the attractiveness of solar energy systems to utilities, retailers and customers. Such a loss or reduction could also reduce our acquisition
opportunities and our willingness to pursue renewable energy projects due to higher operating costs or lower revenues from off-take agreements. See also “—Risks Related to Taxation.”
The current U.S. administration’s environmental and tax policies may create regulatory uncertainty in the clean energy sector and may lead to a reduction or removal of various clean energy programs
and initiatives designed to curtail climate change. Such a reduction or removal of incentives may diminish the market for future renewable energy off-take agreements and reduce the ability for renewable developers to compete for future energy
off-take agreements, which may reduce incentives for project developers to invest in the development and construction of clean energy and water infrastructure contracted assets. To the extent that these policies are changed in a manner that reduces
the incentives or the value of such incentives or reduces the capacity of potential investors to benefit from such incentives, this could cause reduced revenues and reduced economic returns, resulting in increased financing costs and difficulty in
obtaining financing.
The reduction in the corporate tax rate diminishes the benefit of tax incentives for potential investors and reduces the value of accelerated depreciation deductions and the expensing of certain
capital expenditures. Any effort to overturn federal and state laws, regulations or policies that are supportive of existing or new solar energy generation or that remove costs or other limitations on other types of generation that compete with solar
energy projects could materially and adversely affect the Company’s business. Additionally, the current U.S. administration is exploring potential legal and regulatory strategies to subsidize coal and nuclear generation, which could allow those
technologies to become more cost competitive relative to renewable generation sources.
Additionally, some U.S. states with RPS targets have met, or in the near future will meet, their renewable energy targets. For example, California, which has among the most aggressive RPS laws in
the United States, is poised to meet its current mandate of 33.0% renewable energy by 2020 with already-proposed new renewable energy projects, though significant additional investments will be required to meet the higher renewable energy mandate of
60.0% by 2030 and 100% by 2045 that was adopted in 2018. If, as a result of achieving these targets, these and other U.S. states do not increase their targets in the near future, demand for additional renewable energy could decrease.
In addition, the substantial increase of grid connected intermittent solar and wind generation assets resulting from the adoption of RPS targets has created significant technical challenges for
grid operators. As a result, RPS targets may need to be scaled back or delayed in order to develop technologies or infrastructure to accommodate this increase in intermittent generation assets.
We rely, in a significant part, on environmental and other regulations of industrial and local government activities, including regulations mandating, among other things, reductions in carbon or
other greenhouse gas emissions or use of energy from renewable sources. If the businesses to which such regulations relate were deregulated or if such regulations were materially changed or weakened, the profitability of our current and future
projects could suffer, which could in turn have a material adverse effect on our business, financial condition, results of operations and cash flows. In addition, uncertainty regarding possible changes to any such regulations has adversely affected
us in the past, and may adversely affect in the future, our ability to refinance a project or to satisfy other financing needs.
Subsidy regimes for renewable energy generation have been challenged in the past on constitutional and other grounds (including that such regimes constitute impermissible European Union state aid)
in certain jurisdictions. In addition, certain loan-guarantee programs in the United States, including those which have enabled the DOE to provide loan guarantees to support our Solana and Mojave projects in the United States, have been challenged on
grounds of failure by the appropriate authorities to comply with applicable U.S. federal administrative and energy law. If all or part of the subsidy and incentive regimes for renewable energy generation in any jurisdiction in which we operate were
found to be unlawful and, therefore, reduced or discontinued, we may be unable to compete effectively with conventional and other renewable forms of energy.
We currently have two financing arrangements with the Federal Financing Bank for the Solana and Mojave assets, repayment of which to the Federal Financing Bank by those projects is with a guarantee
by the DOE. Additionally, these projects benefit from the ITCs. Unilateral changes to these agreements or the ITC regime may have a material adverse effect on our business, financial condition, results of operations and cash flows.
Potential acquisition of solar projects could be more challenging if the cost of solar panels does not decline or increases in the future, including as a
result of increases in the cost of solar panels or tariffs on imported solar panels imposed by the U.S. government.
The cost of solar panels, which declined in recent years, and the raw materials necessary to manufacture them has been a key driver in the pricing of solar energy systems and customer adoption of
this form of renewable energy. The U.S. government has imposed tariffs on solar cells manufactured in China, which is a large producer of solar cells, thereby increasing the price of solar panels containing Chinese-manufactured solar cells. While
solar panels containing solar cells manufactured outside of China are not subject to such tariffs, the prices of these solar panels are, and may continue to be, more expensive than panels produced using Chinese solar cells, before giving effect to
the tariff penalties, and such tariffs may create upward pressure on prices.
In addition, the U.S. government conducted in the past years trade investigations relating to solar modules manufactured in China (with cells from other countries) and cells manufactured in Taiwan,
which resulted in import tariffs on foreign-manufactured solar panel. As a result, in early January 2015, the U.S. government imposed preliminary tariffs on solar cells manufactured in Taiwan and solar panels and modules containing such cells.
Similar measures were taken for solar cells manufactured in China at the beginning of 2018, the tariff steps down from 30% in 2018 to 15% over four years and then is eliminated.
With the stabilization or increase of solar panel and raw materials prices, our growth could slow. Although Atlantica does not purchase solar panels directly, higher cost solar panels could reduce
our willingness to pursue renewable energy projects due to higher operating costs or lower revenues from off-take agreements.
We are exposed to political, social and macroeconomic risks relating to the United Kingdom’s exit from the European Union.
On June 23, 2016, the electorate in the United Kingdom voted in favor of leaving the European Union (commonly referred to as “Brexit”), and the U.K. government invoked Article 50 of the Lisbon
Treaty related to withdrawal on March 29, 2017. The withdrawal of the United Kingdom from the European Union was initially expected to take effect on March 29, 2019. Under Article 50, the Treaty on the European Union and the Treaty on the Functioning
of the European Union cease to apply in the relevant state from the date of entry into force of a withdrawal agreement or, failing that, two years after the notification of intention to withdraw, although this period may be extended in certain
circumstances. On March 14, 2019, the U.K. government sought permission from the EU to extend Article 50 and agree a later Brexit date. On January 31, 2020, the U.K. ceased to be part of the European Union and entered into a transition period to,
among other things, negotiate an agreement with the EU on the future terms of the United Kingdom’s relationship with the European Union. The transition period is currently expected to end on December 31, 2020. As of the date of this report, the
United Kingdom and the European Union have not reached an agreement. Therefore, the impact of the United Kingdom’s departure from, and future relationship with, the European Union are uncertain. There is the potential that the United Kingdom and the
European Union may not agree to a withdrawal arrangement before the date the United Kingdom leaves the European Union. Regardless of the eventual timing or terms of the United Kingdom’s exit from the EU, the result of the 2016 referendum continues to
create significant political, regulatory and macroeconomic uncertainty.
There are a number of areas of uncertainty in connection with the future of the United Kingdom and its relationship with the EU. The negotiation of the United Kingdom’s exit terms and related
matters may take several years. Given this uncertainty and the range of possible outcomes, it is not currently possible to determine the impact that the United Kingdom’s departure from the EU and/or any related matters may have on general economic
conditions in the United Kingdom or the EU. The exit of the United Kingdom (or any other country) from the EU or prolonged periods of uncertainty relating to any of these possibilities could result in significant macroeconomic deterioration,
including, but not limited to, further decreases in global stock exchange indices, increased foreign exchange volatility, decreased GDP in the European Union or other markets in which we operate, issues with cross-border trade, political and
regulatory uncertainty and further sovereign credit downgrades. In addition, there could be changes to tax regulation affecting the repatriation of dividends from other countries, which may negatively affect us. Additionally, the impact of potential
changes to the United Kingdom’s migration policy could adversely impact our employees of non-U.K. nationality currently working in the United Kingdom as well as have an uncertain impact on cross-border labor. The potential loss of the EU “passport,”
or any other potential restrictions on free travel of UK citizens to Europe, and vice versa, could adversely impact the jobs market in general and our operations in Europe. Finally, Brexit is likely to lead to legal uncertainty in areas such as data
protection, taxation, and potentially divergent national laws and regulations as the UK determines which EU laws to replace or replicate, including the General Data Protection Regulation. Any of these effects of Brexit, and others we cannot
anticipate, could adversely affect our business, financial condition, results of operations and cash flows.
We have international operations and investments, including in emerging markets that could be subject to economic, social and political uncertainties.
We operate our activities in a range of international locations, including North America (Canada, the United States and Mexico), South America (Colombia, Peru, Chile and Uruguay), and EMEA (Spain,
Algeria and South Africa), and we may expand our operations to certain core countries within these regions. Accordingly, we face a number of risks associated with operating and investing in different countries that may have a material adverse effect
on our business, financial condition, results of operations and cash flows. These risks include, but are not limited to, adapting to the regulatory requirements of such countries, compliance with changes in laws and regulations applicable to foreign
corporations, the uncertainty of judicial processes, and the absence, loss or non-renewal of favorable treaties, or similar agreements, with local authorities or political, social and economic instability, all of which can place disproportionate
demands on our management, as well as significant demands on our operational and financial personnel and business. As a result, we can provide no assurance that our future international operations and investments will remain profitable.
A significant portion of our current and potential future operations and investments are conducted in various emerging countries worldwide. Our activities and investments in these countries involve
a number of risks that are more prevalent than in developed markets, such as economic and governmental instability, the possibility of significant amendments to, or changes in, the application of governmental regulations, the nationalization and
expropriation of private property, payment collection difficulties, social problems, substantial fluctuations in interest and exchange rates, changes in the tax framework or the unpredictability of enforcement of contractual provisions, currency
control measures, limits on the repatriation of funds and other unfavorable interventions or restrictions imposed by public authorities. In countries such as Algeria or South Africa, a change in government can cause instability in the country and a
new government may decide to change laws and regulations affecting our assets or may decide to expropriate such assets, all of which may have a material adverse effect on our business, financial condition, results of operations and cash flows.
For example, in Algeria, protests started in February 2019 after former president announced that he would run for a fifth term in office. Although the president stepped down several weeks later,
demonstrations and protests have been ongoing and political instability remains. In addition, in Chile violent social protests started in October 2019. Several social measures were approved; however, the social crisis has not been resolved yet.
Protests could have an adverse effect on our business, financial condition, results of operations and cash flows. In addition, potential social measures could also have an adverse effect in our business, for example, if the government decided to
increase taxation on our assets.
Our U.S. dollar-denominated contracts in Algeria, Mexico, Chile and Peru are payable in local currency at the exchange rate of the payment date and in some cases include portions in local currency;
our contract for Kaxu in South Africa is denominated and payable in South African rands. In the event of a rapid devaluation or implementation of exchange or currency controls, we may not be able to exchange the local currency for the agreed dollar
amount, which could affect our cash available for distribution. Governments in Latin America and Africa frequently intervene in the economies of their respective countries and occasionally make significant changes in policy and regulations.
Governmental actions in certain countries to control inflation and other policies and regulations have often involved, among other measures, price controls, currency devaluations, capital or exchange controls and limits on imports. Such devaluation,
implementation of exchange or currency controls or governmental involvement may have a material adverse effect on our business, financial condition, results of operations and cash flows.
Decreases in government budgets, reductions in government subsidies and adverse changes in law may adversely affect our business and growth plan.
Poor economic conditions have affected, and continue to affect, government budgets and threaten the continuation of government subsidies such as regulated revenues, cash grants, tax benefits and
other similar subsidies that benefit our business, particularly with respect to renewable energy. Such economic conditions may also lead to changes in laws that may be adverse to us. Policies supporting the development of renewable energy have had a
significant effect on the growth of investments in renewable energy and could change at any time. Government subsidies and incentives make the development of renewable projects more competitive by providing tax credits and accelerated depreciation
for a portion of the development costs, decreasing the costs associated with developing such projects or creating demand for renewable energy assets through RPS programs. A loss or reduction in such incentives could decrease the attractiveness of
renewable energy projects to project developers and the attractiveness of renewable energy to utilities, which could reduce our acquisition opportunities. Such a loss or reduction could also reduce our willingness to pursue renewable energy projects
due to higher operating costs or lower revenues. The reduction or elimination of subsidies or incentives or adverse changes in law could have a material adverse effect on our business, financial condition, results of operations and cash flows,
inclusive of our existing projects, and the lack of availability of new projects undertaken in reliance on the continuation of such subsidies could adversely affect our growth plan.
Our cash dividend policy may limit our ability to grow and make acquisitions through cash on hand.
Our dividend policy is to distribute a high percentage of our cash available for distribution, after corporate general and administrative expenses and cash interest payments and less reserves for
the prudent conduct of our business, each quarter and to rely primarily upon external financing sources, including the issuance of debt and equity securities as well as borrowings under credit facilities to fund our acquisitions and potential growth
capital expenditures. We intend to distribute as dividend a high portion of the cash available for distribution that we generate on an annual basis, although our board of directors could modify that payout target in the future. We may be precluded
from pursuing otherwise attractive acquisitions if the projected short-term cash flow from the acquisition or investment is not adequate to service the capital raised to fund the acquisition or investment, after giving effect to our available cash
reserves.
On account of our dividend policy, our growth may not be as fast as that of businesses that reinvest their available cash to expand ongoing operations. To the extent we issue additional equity
securities in connection with any acquisitions or growth capital expenditures, the payment of dividends on these additional equity securities may increase the risk that we will be unable to maintain or increase our per share dividend. There are no
limitations in our articles of association on our ability to issue equity securities, including preferred shares or other securities ranking senior to our shares. The issuance of additional debt securities and/or the incurrence of additional bank
borrowings or other debt by us or by intermediate subsidiaries or by our project-level subsidiaries to finance our growth strategy could result in increased interest expense, increased debt repayment and the imposition of additional or more
restrictive covenants, which, in turn, may impact the cash distributions we receive from our subsidiaries.
We may not be able to identify and reach agreements with new partners similar to the AAGES and Algonquin ROFO agreements.
We intend to enter into an agreement or agreements with new partners that own or develop renewable energy, electric transmission or water assets in the geographies in which we operate. Any such new
partner would be a source of assets in addition to AAGES, Algonquin and Abengoa. We cannot be certain that we will be successful in identifying or reaching an agreement with new partners. We also cannot be certain that any agreement with a new
partner will have terms similar to the AAGES ROFO Agreement and such terms may be less favorable to us. Even if we do reach an agreement with a new partner, it cannot be certain that we will be able to acquire additional assets from any such partner
in the future.
If we are unable to identify and reach an agreement on favorable terms with new partners with suitable assets, or unable to consummate future acquisitions from any such sponsor, it may limit our
ability to execute our growth strategy and may have a materially adverse effect on our business, financial condition, results of operation and cash flows.
We may not be able to arrange the required or desired financing for acquisitions.
Our ability to effectively consummate future acquisitions will also depend on our ability to arrange the required or desired financing for acquisitions or to refinance existing corporate debt. We
may not have access to the capital markets to issue new equity or debt securities or sufficient availability under our credit facilities or have access to project level financing on commercially reasonable terms when acquisition opportunities arise.
At times, our access to financing was curtailed by market conditions and other factors. In recent years, capital markets have been highly volatile, particularly in the United States and Europe. These adverse market conditions could prevent us from
accessing the capital markets in a manner that would permit us to make an acquisition or refinance any corporate facility in a timely manner.
An inability to obtain the required or desired financing could significantly limit our ability to consummate future acquisitions and accomplish our growth strategy. If financing is available,
utilization of our credit facilities, debt securities or project level financing for all or a portion of the purchase price of an acquisition, as applicable, could significantly increase our interest expense and debt repayment, impose additional or
more restrictive covenants, and reduce cash available for distribution. Similarly, the issuance of additional equity securities as consideration for acquisitions could cause significant shareholder dilution and reduce our per share cash available for
distribution if the acquisitions are not sufficiently accretive. If we are unable to obtain financing necessary for acquisitions, it will hamper our ability to execute our growth strategy and limit our ability to increase the amount of dividends paid
to holders of our shares.
We may not be able to identify or consummate future acquisitions on favorable terms, or at all.
Our business strategy includes growth through the acquisition of additional revenue-generating assets. This strategy depends on our ability to successfully identify and evaluate acquisition
opportunities and consummate acquisitions on favorable terms. However, the number of acquisition opportunities may be limited. We cannot be certain that AAGES, Algonquin or Abengoa will offer us assets under the ROFO agreements that fit within our
portfolio of assets or contribute to our growth strategy. The Atacama project in Chile is currently owned by APW-1, an investment vehicle initially created by Abengoa as a joint venture with EIG and currently fully owned by EIG, an investment fund;
although the Atacama project is subject to our ROFO agreement with APW-1, we cannot be certain that APW-1 will wish to sell the Atacama project at an attractive price or at all. See “Item 4.B—Business Overview—Our Business Strategy.”
Our ability to acquire future renewable energy projects or businesses depends on the viability of renewable energy projects generally. These projects currently are in many cases contingent on
public policy mechanisms including, among others, ITCs, cash grants, loan guarantees, accelerated depreciation, expensing for certain capital expenditures, carbon trading plans, environmental tax credits and research and development incentives, as
discussed in “Item 4.B—Regulation—Regulation in the United States—U.S. Federal Considerations for Renewable Energy Generation Facilities.” These mechanisms have been implemented at the U.S. federal and state levels and in certain other jurisdictions
where our assets are located to support the development of renewable generation and other clean infrastructure technologies. The availability and continuation of public policy support mechanisms will drive a significant part of the economics and
viability of our growth strategy and expansion into clean energy investments. See “—Government regulations providing incentives and subsidies for renewable energy could change at any time, including pursuant to the proposed environmental and tax
policies of the current administration in the United States, and such changes may negatively impact our current business and our growth strategy.”
Our ability to consummate future acquisitions may also depend on our ability to obtain any required government or regulatory approvals for such acquisitions, including, but not limited to, the
Federal Energy Regulatory Commission, or FERC, approval under Section 203 of the FPA in respect of acquisitions in the United States; or any other approvals in the countries in which we may purchase assets in the future. We may also be required to
seek authorizations, waivers or notifications from debt and/or equity financing providers at the project or holding company level; local or regional agencies or bodies; and/or development agencies or institutions that may have a contractual right to
authorize a proposed acquisition.
Furthermore, we will compete with other local and international companies for acquisition opportunities from third parties, which may increase our cost of making acquisitions or cause us to refrain
from making acquisitions from third parties. Some of our competitors for acquisitions are much larger than us, with substantially greater resources. These companies may be able to pay more for acquisitions due to cost of capital advantages, potential
synergies or other drivers, and may be able to identify, evaluate, bid for and purchase a greater number of assets than our financial or human resources permit. If we are unable to identify and consummate future acquisitions, it will impede our
ability to execute our growth strategy and limit our ability to increase the amount of dividends paid to holders of our shares.
Our ability to consummate future acquisitions also depends on the availability of financing. See “—We may not be able to arrange the required or desired financing for acquisitions.”
Finally, demand for renewable energy may be affected by the cost of other energy sources, including nuclear, coal, natural gas and oil. For example, low natural gas prices have led, in some
instances, to increased natural gas consumption in lieu of other energy sources. To the extent renewable energy becomes less cost-competitive, demand for renewable energy could decrease. Slow growth or a long-term reduction in the energy demand could
cause a reduction in the development of renewable energy programs projects. Decreases in the prices of electricity could affect our ability to acquire assets, as renewable energy developers may not be able to compete with providers of other energy
sources at such lower prices. Our inability to acquire assets could have a material adverse effect on our ability to execute our growth strategy.
In order to grow our business, we may acquire assets or businesses which have a higher risk profile or are less ESG-friendly than certain assets in our
current portfolio.
In order to grow our business, we may acquire assets and businesses which may have a higher risk profile than certain of the assets we currently own. Competition to acquire contracted assets in
operation has been high in recent years and is expected to continue being so. As a result, we have recently announced acquisitions with some exposure to development and construction risk. We may consider investing in assets which are not currently in
operation and which are subject to development and construction risk. Construction of renewable assets, among others, is subject to risk of cost overruns and delays. There can be no assurances that assets under development and construction will
perform as expected or that the returns will be as expected. In addition, we may consider acquiring business which are not contracted, including regulated businesses, which are subject to demand risk. We may also consider acquiring assets which are
not contracted or not fully contracted, for which revenues will depend on the price of the electricity and which are subject to merchant risk. Furthermore, we may consider acquiring assets with revenues not denominated in US dollars or euros, which
would increase our exposure to local currency and which could generate higher volatility in the cash flows we generate. In all these types of assets and businesses, the risk of not meeting the expected cash flow generation and expected returns is
higher than in contracted assets. In addition, these type of assets and businesses could present a higher variability in the cash flows they generate. In addition, we may acquire assets which may be considered as less ESG-friendly than certain assets
in our current portfolio by current and potential investors. For example, considering the competitive landscape for renewable assets in recent years, we may acquire additional natural gas assets. Although we have set a target to maintain at least 80%
of our revenues generated by low carbon footprint assets, some investors with a focus on ESG may consider this target not sufficiently, which could cause us to become less attractive to investors.
As a result, the consummation of acquisitions may have a material adverse effect on our ability to grow, our business, financial condition, results of operations and cash flows.
We cannot guarantee the success of our recent and future acquisitions.
Acquisitions of companies and assets are subject to substantial risks, including the failure to identify material problems during due diligence (for which we may not be indemnified post-closing),
the risk of over-paying for assets (or not making acquisitions on an accretive basis) and the ability to retain customers. Furthermore, the integration and consolidation of acquisitions requires substantial human, financial and other resources and,
ultimately, our acquisitions may divert management’s attention from our existing business concerns, disrupt our ongoing business or not be successfully integrated at all. There can be no assurances that any future acquisitions will perform as
expected or that the returns will be as expected. As a result, the consummation of acquisitions may have a material adverse effect on our ability to grow, our business, financial condition, results of operations and cash flows.
We may be unable to complete all, or any, such transactions that we may analyze. Even where we consummate acquisitions, we may be unable to achieve projected cash flows; recognize unexpected
liabilities or costs; or encounter regulatory complications arising from such transactions. Furthermore, the terms and conditions of financing for such acquisitions or financial investments could restrict the manner in which we conduct our business.
These risks could have a material adverse effect on our business, financial condition, results of operations and cash flows.
We may not be able to close some of the acquisitions that we have recently announced. In some of these acquisitions, we have signed a share purchase agreement, but closing of the acquisition is
subject to closing conditions and authorizations. For example, in the acquisition of PTS, we have acquired a 5% interest in the project and intend to increase our interest once the asset is in operation and we have obtained authorizations from
third parties. In the acquisition of ATN Expansion 2, transfer of the concession agreement is pending authorization from the Ministry of Energy in Peru. If this authorization were not to be obtained within an eight-month period from signing, the
transaction would be reversed with no penalties to Atlantica.
In addition, some of the transactions we have announced are acquisitions of assets under construction. Although our construction risk is limited, taking into account the nature of the assets and
protection clauses in the share purchase agreements, there could be delays in construction and cost overruns not covered by the protection clauses in the relevant share purchase agreement, which may restrict us to get to the expected CAFD in the
assets we are acquiring.
We may also make acquisitions or investments in assets that are located in different jurisdictions and are different from, and may be riskier than, those jurisdictions in which we currently operate
(Canada, the United States, Mexico, Colombia, Peru, Chile, Uruguay, Spain, South Africa and Algeria). See “—We have international operations and investments, including in emerging markets that could be subject to economic, social and political
uncertainties.” These changes may have a material adverse effect on our business, financial condition, results of operations and cash flows.
We are subject to extensive governmental regulation in a number of different jurisdictions, and our inability to comply with existing regulations or
requirements or changes in applicable regulations or requirements may have a negative impact on our business, financial condition, results of operations and cash flows.
We are subject to extensive regulation of our business in the countries in which we operate. Such laws and regulations require licenses, permits and other approvals to be obtained in connection
with the operations of our activities. This regulatory framework imposes significant actual, day-to-day compliance burdens, costs and risks on us. In particular, the power plants and transmission lines that we own are subject to strict international,
national, state and local regulations relating to their operation and expansion (including, among other things, leasing and use of land, and corresponding building permits, landscape conservation, noise regulation, environmental protection and
environmental permits and electric transmission and distribution network congestion regulations). Non-compliance with such regulations could result in reputational damage, the revocation of permits, sanctions, fines, criminal penalties or decrease in
our ESG ratings. Compliance with regulatory requirements may result in substantial costs to our operations that may not be recovered. In addition, we cannot predict the timing or form of any future regulatory or law enforcement initiatives. Changes
in existing energy, environmental and administrative laws and regulations may have a material adverse effect on our business, financial condition, results of operations and cash flows, including on our growth plan and investment strategy. Our
business may also be affected by additional taxes imposed on our activities, reduction of regulated tariffs and other cuts or measures.
Further, similar changes in laws and regulations could increase the size and number of claims and damages asserted against us or subject us to enforcement actions, fines and even criminal
penalties. In addition, changes in laws and regulations may, in certain cases, have retroactive effect and may cause the result of operations to be lower than expected. In particular, our activities in the energy sector are subject to regulations
applicable to the economic regime of generation of electricity from renewable sources and to subsidies or public support in the benefit of our production of energy from renewable energy sources, which vary by jurisdiction, and are subject to
modifications that may be more restrictive or unfavorable to us.
Our business is subject to stringent environmental regulation.
We are subject to significant environmental regulation, which, among other things, requires us to obtain and maintain regulatory licenses, permits and other approvals and comply with the
requirements of such licenses, permits and other approvals and perform environmental impact studies on changes to projects. In addition, our assets need to comply with strict environmental regulation on air emissions, water usage and contaminating
spills, among others. As a company with a focus on ESG and most of the business in renewable energy, environmental incidents can also significantly harm our reputation. There can be no assurance that:
| • |
public opposition will not result in delays, modifications to or cancellation of any project or license;
|
| • |
laws or regulations will not change or be interpreted in a manner that increases our costs of compliance and may have a material adverse effect on our business, financial condition, results of operations
and cash flows, including preventing us from operating an asset if we are not in compliance; or
|
| • |
governmental authorities will approve our environmental impact studies where required to implement proposed changes to operational projects.
|
We believe that we are currently in material compliance with all applicable regulations, including those governing the environment. In the past, we have experienced some environmental accidents and
we have been found not to be in compliance with certain environmental regulations and have incurred fines and penalties associated with such violations which, to date, have not been material in amount. We can give no assurance, however, that we will
continue to be in compliance or avoid material fines, penalties, sanctions and expenses associated with compliance issues in the future. Violation of such regulations may give rise to significant liability, including fines, damages, fees and
expenses, and site closures. Generally, relevant governmental authorities are empowered to clean up and remediate releases of environmental damage and to charge the costs of such remediation and clean-up to the owners or occupiers of the property,
the persons responsible for the release and environmental damage, the producer of the contaminant and other parties, or to direct the responsible parties to take such action. These governmental authorities may also impose a tax or other liens on the
responsible parties to secure the parties’ reimbursement obligations.
Environmental regulation has changed rapidly in recent years, and it is possible that we will be subject to even more stringent environmental standards in the future, including in relation to
climate change. We cannot predict the amounts of any increased capital expenditures or any increases in operating costs or other expenses that we may incur to comply with applicable environmental, or other regulatory, requirements, or whether these
costs can be passed on to its concession contract counterparties through price increases. The costs of compliance as well as non-compliance may have a material adverse effect on our business, financial condition, results of operations and cash flows.
Increases in the cost of energy and gas could increase our operating costs in some of our assets.
Some of our activities require some consumption of energy and gas, and we are vulnerable to material fluctuations in their prices. For example, our Spanish solar assets produce a small percentage
of their electricity using natural gas. Although our energy and gas purchase contracts generally include indexing mechanisms, we cannot guarantee that these mechanisms will cover all of the additional costs generated by an increase in energy and gas
prices, particularly for long-term contracts, and some of the contracts entered into by us do not include any indexing provisions. Significant increases in the cost of energy or gas, or shortages of the supply of energy and/or gas, may have a
materially adverse effect on our business, financial condition, results of operations and cash flows.
Transactions with counterparties expose us to credit risk which we must effectively manage to mitigate the effect of counterparty default.
We are exposed to the credit risk profile of the counterparties to our long-term concession contracts, our suppliers and our financing providers. Although we actively manage this credit risk
through diversification and other measures, our risk management strategy may not be successful in limiting our exposure to credit risk. Our inability to manage this exposure may have a material adverse effect on our business, financial condition,
results of operations and cash flow. See “Risk Factors - Counterparties to our off-take agreements may not fulfill their obligations and, as our contracts expire, we may not be able to replace them with agreements on similar terms in light of
increasing competition in the markets in which we operate.”
We may be subject to increased finance expenses if we do not effectively manage our exposure to interest rate and foreign currency exchange rate risks.
We are exposed to various types of market risk in the normal course of business, including the impact of interest rate changes and foreign currency exchange rate fluctuations. Some of our
indebtedness (including project-level indebtedness) bears interest at variable rates, generally linked to market benchmarks such as EURIBOR and U.S. LIBOR. Any increase in interest rates would increase our finance expenses relating to our variable
rate indebtedness and increase the costs of refinancing our existing indebtedness and issuing new debt.
In addition, although most of our long-term contracts are denominated in, indexed or hedged to U.S. dollars, we conduct our business and incur certain costs in the local currency of the countries
in which we operate. In addition, the revenues, costs and debt of our solar assets in Spain are denominated in euros. Since the beginning of 2017, we have maintained euro-denominated debt at the corporate level. Interest payments in euros and our
euro denominated general and administrative expenses create a natural hedge for a portion of the distributions from Spanish assets. Our strategy is to hedge the exchange rate for the distributions from our Spanish assets after deducting
euro-denominated interest payments and euro-denominated general and administrative expenses. Through currency options, we hedge on a rolling basis 100% of the net euro net exposure for the next 12 months and 75% of the net euro net exposure for the
following 12 months. See “Item 5.A—Operating and Financial Review—Results of Operations—Factors Affecting our Results of Operations.”
As we continue expanding our business, an increasing percentage of our revenue and cost of sales may be denominated in currencies other than our reporting currency, the U.S. dollar. Under that
scenario, we would become subject to increasing currency exchange risk, whereby changes in exchange rates between the U.S. dollar and the other currencies in which we do business could result in foreign exchange losses.
In addition, we seek to actively work with lending financial institutions to mitigate our interest rate risk exposure and to secure lower interest rates by entering into interest rate options and
swaps. As a matter of policy, we seek to cover at least 70% of our outstanding long-term project debt interest rate risk. We estimate that approximately 91% of our total interest risk exposure was fixed or hedged as of December 31, 2019.
If our risk-management strategies are not successful in limiting our exposure to changes in interest rates and foreign currency exchange rates our business, financial condition, results of
operations and cash flows maybe materially adversely affected.
Uncertainty relating to the LIBOR calculation process and potential phasing out of LIBOR in the future may adversely affect the value of any outstanding debt instruments.
National and international regulators and law enforcement agencies have conducted investigations into a number of rates or indices known as “reference rates.” Actions by such regulators and law
enforcement agencies may result in changes to the manner in which certain reference rates are determined, their discontinuance, or the establishment of alternative reference rates. In particular, on July 27, 2017, the Chief Executive of the U.K.
Financial Conduct Authority (the “FCA”), which regulates LIBOR, announced that the FCA will no longer persuade or compel banks to submit rates for the calculation of LIBOR after 2021. Such announcement indicates that the continuation of LIBOR on the
current form cannot and will not be guaranteed after 2021. As a result, it appears highly likely that LIBOR will be discontinued or modified by 2021. On May 31, 2019, the Alternative Reference Rates Committee (“ARRC”) published their final
recommendations for new guidelines for LIBOR securitizations, which has been well-received by the securities market. The ARRC proposed that the Secured Overnight Financing Rate (“SOFR”) is the rate that represents best practice as the alternative to
USD-LIBOR for use in derivatives and other financial contracts that are currently indexed to USD-LIBOR. SOFR is a more generic measure than LIBOR and considers the cost of borrowing cash overnight, collateralized by U.S. Treasury securities. Whether
or not SOFR will attain market traction as a LIBOR replacement tool remains in question. As such, the future of LIBOR at this time is uncertain. In preparation for the potential phase out of LIBOR starting in 2021, we may need to renegotiate our
financial obligations and derivative instruments linked to LIBOR.
Given the inherent differences between LIBOR and SOFR or any other alternative benchmark rate that may be established, there are many uncertainties regarding a transition from LIBOR. At this time,
it is not possible to predict the effect that these developments, any discontinuance, modification or other reforms to LIBOR or any other reference rate, or the establishment of alternative reference rates may have on LIBOR, other benchmarks, or
LIBOR-based debt instruments. Uncertainty as to the nature of such potential discontinuance, modification, alternative reference rates or other reforms may materially adversely affect the trading market for securities linked to such benchmarks.
Furthermore, the use of alternative reference rates, including SOFR, or other reforms could cause the interest rate calculated for the LIBOR-based debt instruments to be materially different than expected. As of December 31, 2019, total notional
amount of debt referenced to LIBOR was approximately $847 million and total notional amount of derivatives hedging this debt, thus indexed to LIBOR as well was approximately $569 million.
Our competitive position could be adversely affected by changes in technology, prices, industry standards and other factors.
The markets in which our assets or projects operate change rapidly because of technological innovations and rapid price fluctuations, industry standards, product instructions, customer
requirements and the economic environment. New technology or changes in industry and customer requirements may put pressure on the profitability of our existing projects by increasing the incentives of counterparties to our long-term contracts to
seek new alternative projects or request higher service standards.
The performance of our assets under our concession contracts may be adversely affected by problems related to our reliance on third-party contractors and
suppliers.
Our projects rely on the supply of services, equipment, including technologically complex equipment and software which we subcontract to Abengoa and other third-party suppliers in order to meet our
contractual obligations under our contracted concessions. We rely on the equipment, design and technology of third parties to operate our assets. In circumstances where key components of our equipment, including but not limited to turbines, water
pumps, heat exchangers, transformers or electrical generators fail because of design failures or faulty operation or for any other reason, we rely on third parties to continue operating our assets. Equipment may not last as long as expected and we
may need to replace it earlier than planned. Damages to our equipment may not be covered by insurance in place. In some cases, the replacement of damaged equipment can take a long period of time, which can cause our plants to curtail or cease
operations during such time, which could have a negative impact on our business, financial condition, results of operations and cash flows. We had significant interruptions in 2017 at Kaxu as a result of water pump failures and at Solana in 2017 as a
result of transformer failures. In addition, Solana and Kaxu have experienced technical issues in the heat exchangers within their storage system. Repairs have been carried out in both assets. In Solana, in 2019 we completed the implementation of
improvements in our heat exchangers as proposed by the equipment supplier and Abengoa in order to improve reliability, replaced one of the six heat exchangers and acquired an additional one as back-up. In addition, in the last quarter of 2017 and the
first quarter of 2018, we had temporary unavailability at some of our plants due to technical inspections of the turbines that were requested by the supplier of the turbines. Furthermore, in Mojave certain improvements in one of our turbines carried
out by General Electric in late 2018 resulted in technical difficulties in 2019, which has caused the plant to produce at reduced capacity in the second half of 2019. Similar interruptions could happen again at our plants due to failures in key
equipment. Design failures, technical inspections by suppliers or the need to replace key equipment can require unexpected capital expenditures and/or outages in our plants, which may have a material adverse effect on our business, financial
condition, results of operations and cash flows.
In addition, the delivery of products or services which are not in compliance with the requirements of the subcontract, or the late supply of products and services, can cause us to be in default
under our contracts with our concession counterparties. To the extent we are not able to transfer all of the risk or be fully indemnified by third-party contractors and suppliers, we may be subject to a claim by our customers as a result of a problem
caused by a third party that could have a material adverse effect on our reputation, business, results of operations, financial condition and cash flows.
Supplier concentration may expose us to significant financial credit or performance risk.
We often rely on a single contracted supplier or a small number of suppliers for the provision of equipment, technology, fuel, transportation of fuel, and/or other services required for the
operation of certain of our facilities. If any of these suppliers, including Abengoa and its subsidiaries, cannot perform under their operation and maintenance and other agreements with us, or satisfy their related warranty obligations, we will need
to access the marketplace to provide or repair these products and services. There can be no assurance that the marketplace can provide these products and services as, when and where required. We may not be able to enter into replacement agreements on
favorable terms or at all. If we are unable to enter into replacement agreements to provide for equipment, technology or fuel and other required services, we may be required to seek to purchase the related goods or services at market prices, exposing
us to the risk of unavailability and market price volatility. We may also be required to make significant capital contributions to remove, replace or redesign equipment that cannot be supported or maintained by replacement suppliers, which may have a
material adverse effect on our credit support terms, business, financial condition, results of operations, and cash flows.
The failure of any supplier or customer to fulfill its contractual obligations to us may have a material adverse effect on our business, financial condition, results of operations and cash flows.
Consequently, the financial performance of our facilities is dependent on the credit quality of, and continued performance by, our suppliers and vendors.
We may have joint venture partners or other co-investors with whom we have material disagreements.
We have made and may continue to make equity investments in certain strategic assets managed by or together with third parties, including governmental entities and private entities. In certain
cases, we may only have partial or joint control over a particular asset. We hold a minority stake in Honaine (Algeria), PTS and Monterrey (Mexico), Amherst (Canada) and Ten West Link (United States) and do not have control over the operation of
these assets. In addition, we have partners in Seville PV, Solacor 1/2, Solaben 2/3, Skikda, Kaxu and Solana. Investments in assets over which we have no, partial or joint control are subject to the risk that the other shareholders of the assets, who
may have different business or investment strategies than us or with whom we may have a disagreement or dispute, may have the ability to independently make or block business, financial or management decisions, such as appoint members of management,
which may be crucial to the success of the project or our investment in the project, or otherwise implement initiatives which may be contrary to our interests. Additionally, the approval of other shareholders or partners may be required to sell,
pledge, transfer, assign or otherwise convey our interest in such assets. Similarly, the approval of other shareholders or partners may be required to acquire AAGES’, Algonquin’s, Abengoa’s or third parties’ interests in potential acquisitions.
Alternatively, other shareholders may have rights of first refusal or rights of first offer in the event of a proposed sale or transfer of our interests in such assets or in the event of our acquisition of an interest in new assets pursuant to the
ROFO agreements or with third parties. These restrictions may limit the price or interest level for our interests in such assets, in the event we want to sell such interests.
Finally, our partners in existing or future projects, including tax equity investors, may be unable, or unwilling, to fulfill their obligations under the relevant shareholder agreements, may
experience financial or other difficulties or might sell their position to third parties that we did not choose, which may adversely affect our investment in a particular joint venture or adversely affect us. In certain of our joint ventures, we may
also be reliant on the particular expertise of our partners and, as a result, any failure to perform its obligations in a diligent manner could also adversely affect the joint venture. If any of the foregoing were to occur, our business, financial
condition, results of operations and cash flows may be materially adversely affected.
Our failure to maintain safe work environments may expose us to significant financial losses, as well as civil and criminal liabilities.
The facilities we operate often put our employees and others, including those of our subcontractors, in close proximity with large pieces of mechanized equipment, moving vehicles, manufacturing or
industrial processes, heat or liquids stored under pressure and highly regulated materials. On most projects and at most facilities, we, together with the operations and maintenance supplier, are responsible for safety and, accordingly, must
implement safe practices and safety procedures, which are also applicable to on-site subcontractors. If we or the operations and maintenance supplier fail to design and implement such practices and procedures or if the practices and procedures are
ineffective or if our operations and maintenance service providers or other suppliers do not follow them, our employees and others may become injured and our and others’ property may become damaged. Unsafe work sites also have the potential to
increase employee turnover, increase the cost of a project to our customers or the operation of a facility, and raise our operating costs. Any of the foregoing could result in reputational damage and/or financial losses, which could have a material
adverse effect on our business, financial condition, results of operations and cash flows.
In addition, our projects and the operation of our facilities can involve the handling of hazardous and other highly regulated materials, which, if improperly handled or disposed of, could subject
us or our suppliers to civil and criminal liabilities. We are also subject to regulations dealing with occupational health and safety. Although we maintain divisions whose primary purpose is to ensure we implement effective health, safety and
environmental work procedures throughout our organization, the failure to comply with such regulations could subject us to reputational damage and/or liability. In addition, we may incur liability based on allegations of illness or disease resulting
from exposure of employees or other persons to hazardous materials that we handle or are present in our workplaces.
The operation and maintenance of most of our assets is labor intensive, and therefore work stoppages by employees could harm our business.
The operation and maintenance of most of our assets is labor intensive and our operators’ employees and some of our employees in assets where we perform the operation and maintenance services are
covered by collective bargaining agreements. A dispute with a union or employees represented by a union could result in production interruptions caused by work stoppages. In addition, we subcontract the operation and maintenance services in some of
our assets. Abengoa is the operation and maintenance supplier in most of the assets for which we subcontract operation and maintenance services and Abengoa’s financial situation could cause a higher risk of dispute with their employees. If our
operators’ employees were to initiate a work stoppage, they may not be able to reach an agreement with them as fast as in the case where we were negotiation with our own employees. Further, outbreaks of pandemic diseases, such as COVID-19, or the
fear of such events, could provoke responses, including government-imposed travel restrictions, which may limit our employees' access to our facilities. If a strike or work stoppage or disruption were to occur, our business, financial conditions,
results of operations and cash flows may be materially adversely affected.
We may be subject to litigation and other legal proceedings.
We are subject to the risk of legal claims and proceedings (including bankruptcy), requests for arbitration as well as regulatory enforcement actions in the ordinary course of our business and
otherwise, including claims against our subsidiaries related to Abengoa or our subsidiaries not meeting their obligations. See “Item 4.B—Business Overview—Legal Proceedings.” The results of legal and regulatory proceedings cannot be predicted with
certainty. We cannot guarantee that the results of current or future legal or regulatory proceedings or actions will not materially harm our operations, business, financial condition or results of operations, nor can we guarantee that we will not
incur losses in connection with current or future legal or regulatory proceedings or actions that exceed any provisions we may have set aside in respect of such proceedings or actions or that exceed any available insurance coverage, which may have a
material adverse effect on our business, financial condition, results of operations and cash flows. See “Item 4.B—Business Overview—Legal Proceedings.”
We are subject to reputational risk, and our reputation is closely related to that of Algonquin and Abengoa.
We rely on our reputation to do business, obtain financing, hire and retain employees and attract investors, one or more of which could be adversely affected if our reputation were damaged. Harm to
our reputation could arise from real or perceived faulty or obsolete technology, failure to comply with legal and regulatory requirements, difficulties in meeting contractual obligations or standards of quality and service, ethical issues, money
laundering and insolvency, among others.
Algonquin is currently our largest shareholder. Our reputation is affected by Algonquin’s reputation. If the public image or reputation of Algonquin were to be damaged as a result of adverse
publicity, poor financial or operating performance, changes in financial condition, decline in the price of its shares or otherwise, we could be adversely affected, which could have a material adverse effect on our business, financial condition,
results of operations and cash flows.
In addition, our reputation remains affected by Abengoa’s reputation, given Abengoa was until 2018 our largest shareholder and is currently our largest supplier. The public image and reputation of
Abengoa has suffered as a result of its financial condition and its restructuring process. We have been adversely affected due to our relationship with Abengoa. Any further developments with respect to Abengoa’s financial condition or operating
performance or any failure by Abengoa to satisfactorily resolve the proceedings could further harm our reputation, which could have an adverse effect on our business, financial condition, results of operations and cash flows. See “—Risks Related to
Our Relationship with Algonquin and Abengoa.”
The loss of one or more of our executive officers or key employees may adversely affect our ability to effectively manage our projects.
We depend on our experienced management team and the loss of one or more key executives may negatively affect our business. We also depend on our ability to retain and motivate key employees and
attract qualified new employees. We may not be able to replace departing members of our management team or key employees. Integrating new executives into our management team and training new employees with no prior experience in our industry could
prove disruptive to our projects, require a disproportionate amount of resources and management attention and ultimately prove unsuccessful. An inability to attract and retain sufficient technical and managerial personnel could limit our ability to
effectively manage our projects, which could have a material adverse effect on our business, financial condition, results of operations and cash flows.
We use information technology and communications systems to run our business, the failure of which could significantly impact our operations and business.
We are dependent upon information technology systems to run our operations. Our information technology systems are subject to disruption, damage or failure from a variety of sources, including,
without limitation, computer viruses, security breaches, cyber-attacks, phishing attacks, natural disasters and design defects. Recently, energy facilities worldwide have been experiencing an increased number of cyber-attacks. Cybersecurity
incidents, in particular, are constantly evolving and include malicious software, attempts to gain unauthorized access to data and other electronic security breaches that could lead to disruptions in systems, unauthorized release of confidential or
otherwise protected information and to the corruption of data. Various measures have been implemented to minimize our risks related to information technology systems and network disruptions. However, given the unpredictability of the timing, nature
and scope of information technology disruptions, we could potentially be subject to production downtimes, operational delays, the compromising of confidential or otherwise protected information, destruction or corruption of data, security breaches,
other manipulation or improper use of our systems and networks or financial losses from remedial actions, any of which could have a material adverse effect on our competitive position, financial condition, results of operations or cash flows.
We maintain global information technology and communication networks and applications to support our business activities. Information technology security processes may not prevent future malicious
actions, denial-of-service attacks, or fraud, resulting in corruption of operating systems, theft of commercially sensitive data, misappropriation of funds and businesses (also known as phishing) and operational disruption. Material system breaches
and failures could result in significant interruptions that could in turn affect our operating results and reputation.
Negative impacts on biodiversity, including harming of protected species or other environmental hazards can result in curtailment of power plant operations,
monetary fines and negative publicity.
Managing and operating large infrastructure assets may have a negative impact on biodiversity in the regions where we operate. In particular, the operation of wind and solar power plants can
adversely affect endangered, threatened or otherwise protected animal species. Wind power plants involve a risk that protected species will be harmed, as the turbine blades travel at a high rate of speed and may strike flying animals (such as birds
or bats) that happen to travel into the path of spinning blades. Solar power plants can also present a risk to animals.
Excessive killing of protected species or other environmental accidents or hazards could result in requirements to implement mitigation strategies, including curtailment of operations, and/or
substantial monetary fines and negative publicity. We cannot guarantee that any curtailment of operations, monetary fines that are levied or negative publicity as a result of incidental killing of protected species and other environmental hazards
will not have a material adverse effect on our business, financial condition, results of operations and cash flows.
Our international operations require us to comply with anti-corruption and other laws and regulations of the United States government and various non-U.S.
jurisdictions.
Doing business in multiple countries requires us and our subsidiaries to comply with the laws and regulations of the United States government and various non-U.S. jurisdictions. Our failure to
comply with these rules and regulations may expose us to liabilities. These laws and regulations may apply to us, our subsidiaries, individual directors, officers, employees and agents, and may restrict our operations, trade practices, investment
decisions and partnering activities.
In particular, our non-U.S. operations are subject to United States and foreign anti-corruption laws and regulations, such as the Foreign Corrupt Practices Act of 1977, as amended (“FCPA”), and
similar laws and regulations. The FCPA prohibits United States companies and their officers, directors, employees and agents acting on their behalf from corruptly offering, promising, authorizing or providing anything of value to foreign officials
for the purposes of influencing official decisions or obtaining or retaining business or otherwise obtaining favorable treatment. The FCPA also requires companies to make and keep books, records and accounts that accurately and fairly reflect
transactions and dispositions of assets and to maintain a system of adequate internal accounting controls. As part of our business, we deal with state-owned business enterprises, the employees and representatives of which may be considered foreign
officials for purposes of the FCPA. As a result, business dealings between our employees and any such foreign official could expose us to the risk of violating anti-corruption laws even if such business practices may be customary or are not otherwise
prohibited between the us and a private third party. Violations of these legal requirements are punishable by criminal fines and imprisonment, civil penalties, disgorgement of profits, injunctions, debarment from government contracts as well as other
remedial measures.
We have established policies and procedures designed to assist us and our personnel in complying with applicable United States and non-U.S. laws and regulations; however, we cannot assure you that
these policies and procedures will completely eliminate the risk of a violation of these legal requirements, and any such violation (inadvertent or otherwise) could have a material adverse effect on our business, financial condition, results of
operations and cash flows.
The seasonality of our operations may affect our liquidity.
We will need to maintain sufficient financial liquidity at the asset level to absorb the impact of seasonal variations in energy production or other significant events. In our assets, the principal
source of liquidity is cash generated from our operating activities and the principal use of liquidity consists of project debt service. Our quarterly results of operations may fluctuate significantly for various reasons, mostly related to weather
patterns.
For instance, the amount of electricity and revenues generated by our solar generation facilities is dependent in part on the amount of solar radiation. The electricity produced and revenues
generated by a wind power plant depend heavily on wind conditions, which are variable and difficult to predict. Operating results for wind power plants vary significantly from period to period depending on the wind conditions during the periods in
question. We expect our portfolio of renewable energy facilities to generate the lowest amount of electricity during the first and fourth quarters.
The seasonality of our energy production may create increased demand on our working capital reserves during periods where cash generated from operating activities is lower, which could result in
lower distributions from assets to the holding company level, in which event our financial condition may be materially adversely affected.
If we are deemed to be an investment company, we may be required to institute burdensome compliance requirements and our activities may be restricted, which
may make it difficult for us to complete strategic acquisitions or effect combinations.
If we were deemed to be an investment company under the Investment Company Act of 1940 (the “Investment Company Act”) our business would be subject to applicable restrictions under the Investment
Company Act, which could make it impractical for us to continue our business as contemplated. We believe our company is not an investment company under Section 3(b)(1) of the Investment Company Act because we are primarily engaged in a noninvestment
company business, and we intend to conduct our operations so that we will not be deemed an investment company. However, if we were to be deemed an investment company, restrictions imposed by the Investment Company Act, including limitations on our
capital structure and our ability to transact with affiliates, could make it impractical for us to continue our business as contemplated.
Risks Related to Our Assets
The concession agreements or power purchase agreements under which we conduct some of our operations are subject to revocation or termination.
Certain of our operations are conducted pursuant to contracts and concessions granted by various governmental bodies and others are pursuant to power purchase agreements signed with governmental
entities and private clients. Generally, these contracts and concessions give us rights to provide services for a limited period of time, subject to various governmental regulations. The governmental bodies or private clients responsible for
regulating and monitoring these services often have broad powers to monitor our compliance with the applicable concession and power purchase contracts and can require us to supply them with technical, administrative and financial information. Among
other obligations, we may be required to comply with operating targets and efficiency and safety standards established in the concession. Such commitments and standards may be amended in certain cases by the governmental bodies. Our failure to comply
with the concession agreements and power purchase agreements or other regulatory requirements may result in contracts and concessions being revoked, not being granted, upheld or renewed in our favor, or, if granted, upheld or renewed, may not be done
on as favorable terms as currently applicable. This could have a material adverse effect on our business, financial condition, results of operations and cash flows.
In some of the markets in which we are present, or in which we may own assets in the future, political instability, economic crisis or social unrest may give rise to a change in policies regarding
long-term contracted assets with private companies, like us, in strategic sectors such as power generation, electric transmission or water. Any such changes could lead to modifications of the economic terms of our concession contracts or, in extreme
scenarios, the nationalization of our assets, which could have a material adverse effect on our business, financial condition, results of operations and cash flows.
Revenues in our solar assets in Spain are mainly defined by regulation and some of the parameters defining the remuneration are subject to review every six
years. Revenues in Chile TL3 are also mainly defined by regulation.
In 2013, the Spanish government modified regulations applicable to renewable energy assets, including solar power. According to Royal Decree 413/2014, solar electricity producers in Spain received:
(i) the pool price for the power they produce and (ii) a payment based on the standard investment cost for each type of plant (without any relation whatsoever to the amount of power they generate). This payment based on investment (in €/MW of
installed capacity) is supplemented, in the case of solar plants, by an “operating payment” (in €/MWh produced).
The principle driving this economic regime is that the payments received by a renewable energy producer should be equivalent to the costs that they are unable to recover on the electricity pool
market where they compete with non-renewable technologies. This economic regime seeks to allow a “well-run and efficient enterprise” to recover the costs of building and running a plant, plus a reasonable return on investment (project investment rate
of return). The rate applicable during the first regulatory period was 7.398%. Until December 31, 2019, this reasonable return was calculated as the average yield on Spanish government 10-year bonds on the secondary market in a 24-month period
preceding the new regulatory period, plus a spread depending on the government’s decision based on (i) appropriate profit for this specific type of renewable electricity generation and electricity generation as a whole, considering the financial
condition of the Spanish electricity system and Spanish prevailing economic conditions; and (ii) borrowing costs for electricity generation companies using renewable energy sources with regulated payment systems, which are efficient and well run,
within Europe.
Payment criteria are based on prevailing economic conditions in Spain, demand for electricity and reasonable profits for electricity generation activities and can be revised every six years at the
end of each regulatory period. The first regulatory period commenced on July 14, 2013, the date on which Royal Decree-law 9/2013 came into force and ended on December 31, 2019. The values of parameters used to calculate the payments can be changed at
the end of each regulatory period, except for a plant’s useful life and the value of a plant’s initial investment.
On July 27, 2018, CNMC (the regulator for the electricity system in Spain) issued a draft proposal for the calculation of the reasonable rate of return for the regulatory period 2020-2025. On
November 2, 2018, CNMC issued its final report with a proposed reasonable rate of return of 7.09%. In December 2018 the government issued a draft project law proposing a reasonable rate of return of 7.09%, with the possibility of maintaining the
7.398% reasonable rate of return under certain circumstances. On November 24, 2019, the Spanish government approved Royal Decree-law 17/2019 setting out a 7.09% rate of reasonable return applicable from January 1, 2020 until December 31, 2025 as a
general rule and the possibility, under certain circumstances including not having any ongoing legal proceeding against the Kingdom of Spain ongoing, of maintaining the 7.398% reasonable rate of return for two consecutive regulatory periods. The
reasonable return is no longer calculated by reference to the Spanish government 10-year bonds but by reference to the weighted average cost of capital (WACC). The WACC is the calculation method that most of the European regulators apply in most of
the cases to determine the return rates applicable to regulated activities within the energy sector. As a result, some of the assets in our Spanish portfolio are receiving a remuneration based on a 7.09% reasonable rate of return until December 31,
2025 while others are receiving a remuneration based on a 7.398% reasonable rate of return until December 31, 2031. We estimate the impact of this change to be approximately € 3 million per year reduction in our cash available for distribution.
If the payments for renewable energy plants are revised to lower amounts in the next regulatory period starting on January 1, 2026 until December 31, 2031 or starting on January 1, 2032, depending
on each asset, this could have a material adverse effect on our business, financial condition, results of operations and cash flows. As a reference, assuming our Spanish assets continue to perform as expected and assuming no additional changes of
circumstances, with the information currently available, Atlantica estimates that a reduction of 100 basis points in the reasonable rate of return on investment set by the Spanish government could cause a reduction in its cash available for
distribution of approximately €18 million per year. This estimate is subject to certain assumptions, which may change in the future.
Revenue from our contracted assets and concessions is significantly dependent on regulated tariffs or other long-term fixed rate arrangements that restrict
our ability to increase revenue from these operations.
The revenue that we generate from our contracted assets and concessions is significantly dependent on regulated tariffs or other long-term fixed rate arrangements. Under most of our concession
agreements, a tariff structure is established upon execution of such agreements, and we have limited or no possibility to independently raise tariffs beyond the established rates and indexation or adjustment mechanisms. Similarly, under a long-term
PPA, we are required to deliver power at a fixed rate for the contract period or to maintain our asset available for a fixed rate, in some cases with predefined escalation rights. In addition, we may be unable to adjust our tariffs or rates as a
result of fluctuations in prices of raw materials, exchange rates, labor and subcontractor costs during the operating phase of these projects, or any other variations in the conditions of specific jurisdictions in which our concession-type
infrastructure projects are located, which may reduce our profitability. Moreover, in some cases, if we fail to comply with certain pre-established conditions, the government or customer (as applicable) may reduce the tariffs or rates payable to us.
In addition, during the life of a concession, the relevant government authority may in some cases unilaterally impose additional restrictions on our tariff rates, subject to the regulatory frameworks applicable in each jurisdiction. In some cases,
governments may also postpone annual tariff increases until a new tariff structure is approved without compensating us for lost revenue. Furthermore, changes in laws and regulations may, in certain cases, have retroactive effect and expose us to
additional compliance costs or interfere with our existing financial and business planning.
Revenue from our renewable energy and efficient natural gas facilities is partially exposed to market electricity prices.
Revenue and operating costs from certain of our existing or future projects depend to some extent on market prices for sale of electricity. Market prices may be volatile and are affected by various
factors, including the cost of raw materials, user demand, and if applicable, the price of greenhouse gas emission rights. In several of the jurisdictions in which we operate, we are exposed to remuneration schemes which contain both regulated
incentive and market price components. In such jurisdictions, the regulated incentive component may not compensate for fluctuations in the market price component, and, consequently, total remuneration may be volatile. There can be no assurance that
market prices will remain at levels which enable us to maintain profit margins and desired rates of return on investment. A decline in market prices below anticipated levels could have a material adverse effect on our business, financial condition,
results of operations and cash flows.
Our renewable energy projects will be negatively affected if there are adverse changes to national and international laws and policies that support renewable
energy sources.
Certain countries, such as the United States, a market that is one of our principal markets, have in recent years enacted policies of active support for renewable energy. These policies have
included feed-in tariffs and renewable energy purchase obligations, mandatory quotas and/or portfolio standards imposed on utilities and certain tax incentives (such as ITCs in the United States).
Certain policies currently in place may expire, be suspended or be phased out over time, cease upon exhaustion of the allocated funding or be subject to cancellation or non-renewal, particularly if
the cost of renewable energy exceeds the cost of generation of energy from other means. Accordingly, we cannot guarantee that such government support will be maintained in full, in part or at all.
If the governments and regulatory authorities in the jurisdictions in which we operate or plan to operate were to further decrease or abandon their support for development of renewable energy due
to, for example, competing funding priorities, political considerations or a desire to favor other energy sources, renewable or otherwise, the assets we plan to acquire in the future could become less profitable or cease to be economically viable.
Such an outcome could have a material adverse effect on our ability to execute our growth strategy.
Lack of electric transmission capacity availability, potential upgrade costs to the electric transmission grid, and other systems constraints could
significantly impact our ability to generate electricity power sales.
We depend on electric interconnection and transmission facilities owned and operated by others to deliver the wholesale power we sell from our electric generation assets to our customers. A failure
or delay in the operation or development of these interconnection or transmission facilities or a significant increase in the cost of the development of such facilities could result in the loss of revenues. Such failures or delays could limit the
amount of power our operating facilities deliver or delay the completion of our construction projects, as the case may be. Additionally, such failures, delays or increased costs may have a material adverse effect on our business, financial condition,
results of operations and cash flows. If a region’s electric transmission infrastructure is inadequate, our ability to generate electricity may be limited. If restrictive transmission price regulation is imposed, the transmission companies may not
have a sufficient incentive to invest in expansion of transmission infrastructure. We cannot predict whether interconnection and transmission facilities will be expanded in specific markets to accommodate competitive access to those markets. Certain
of our operating facilities’ generation of electricity may be curtailed without compensation due to transmission limitations or limitations on the electricity grid’s ability to accommodate intermittent electricity generating sources, reducing our
revenues and impairing our ability to fully capitalize on a particular facility’s generating potential. Such curtailments may have a material adverse effect on our business, financial condition, results of operations and cash flows.
We do not own all of the land on which our renewable energy, efficient natural gas or electric transmission assets are located, which could result in
disruption to our operations.
We do not own all of the land on which our power generation or electric transmission assets are located, and we are, therefore, subject to the possibility of less desirable terms and increased
costs to retain necessary land use if we do not have valid leases or rights-of-way or if such rights-of-way lapse or terminate or if the owners of the land enter into bankruptcy protection or seek to terminate contracts in some other way. Although we
have obtained rights to construct and operate these assets pursuant to related lease arrangements, our rights to conduct those activities are subject to certain exceptions, including the term of the lease arrangement. Our loss of these rights,
through our inability to renew right-of-way contracts or otherwise, may adversely affect our ability to operate our power generation and electric transmission assets and may therefore have a material adverse effect on our business, financial
condition, results of operation and cash flow.
Certain of our facilities may not perform as expected.
Our expectations regarding the operating performance of certain assets in our portfolio, particularly Solana and Kaxu, assets recently acquired and assets for which acquisition has recently been
announced, are based on assumptions, estimates and past experience, and without the benefit of a substantial operating history. Our projections regarding our ability to generate cash available for distribution assumes facilities perform in accordance
to our expectations. However, the ability of these facilities to meet our performance expectations is subject to the risks inherent in power generation facilities and the construction of such facilities, including, but not limited to, degradation of
equipment in excess of our expectations, system failures and outages. The failure of these facilities to perform as we expect may have a material adverse effect on our business, financial condition, results of operations and cash flows.
In the case of Solana, we have a partnership with Liberty Interactive Corporation, or Liberty, pursuant to which Liberty agreed to invest $300 million in the parent company of the project entity,
in exchange for the right to receive a large part of taxable losses and distributions until such time when Liberty reaches a certain rate of return, or the flip date. Given the underperformance of the asset in the last years, we cannot assure the
Flip Date will occur or when it will occur. We expect potential cash distributions from Solana to go mostly or entirely to Liberty in the upcoming years. If the Flip Date never occurs or if there is a delay longer than currently anticipated, this
will adversely affect the cash flows expected from that project. We signed an option to acquire, until April 30, 2020, Liberty’s equity interest in Solana for approximately $300 million.
Our business may be adversely affected by an increased number of extreme weather events related to climate change.
Climate change is causing an increasing number of severe and extreme weather events which are a risk to our facilities, including days of extremely high temperatures, severe winds and rains,
hurricanes, droughts, fires, cyclones, hail and floods, among others. Other risks include:
| • |
Rising temperatures are also increasing the frequency and intensity of droughts and risk of fire. For example, in California, the size and ferocity of fires has increased significantly in the past 20 years,
which have also been very hot and dry years. California wildfires have been especially catastrophic, causing human fatalities and significant material losses. Our transmission lines, including transmission lines and substations which are
part of our solar assets, could cause fires, which can create significant liabilities if the fire damaged third parties.
|
| • |
Severe floods could damage our plants, especially our transmission lines or our generation assets. If an unexpected flood runs close to an existing transmission tower it could cause the fall of one or more
transmission towers. Similarly, floods can damage the solar field in our solar plants.
|
| • |
Severe winds could cause damage in the solar fields in our solar assets. In 2016, the solar field of Solana was damaged by a wind micro-burst and similar events could happen in the future in our assets.
|
| • |
Severe droughts could result in water restrictions or in a deterioration of water properties. Droughts may affect the cooling capacity of our power projects. A deterioration of the quality of the water
would have an impact on chemical costs in our water treatment plants within our generation capabilities.
|
| • |
Changes in temperature extremes could also affect to feed water process temperature in desalination plants, causing an increase of the chemical products consumption and generating a risk of growth of algae
and mollusks within the facilities.
|
| • |
Storms with intense lightning activity could damage our plants, especially our wind assets. Our wind farms in Uruguay have already experienced some damages in the past and our assets could be affected
again.
|
Furthermore, components of our system, such as structures, mirrors, absorber tubes, blades, PV panels or transformers are susceptible to being damaged by severe weather, including for example hail.
In addition, replacement and spare parts for key components may be difficult or costly to acquire or may be unavailable and may have long lead times.
If any of these events were to occur at any of our plants, facilities or electric transmission lines, we may not be able to carry out our business activities at that location or such operations
could be significantly reduced. Any of these circumstances could result in lost revenue at these sites during the period of disruption and costly remediation, which could have a material adverse effect on our business, financial condition, results of
operations and cash flows.
Our business may be adversely affected by rising mean temperatures caused by climate change.
In addition, to the physical risks previously mentioned, rising temperatures could cause an increase in our operation and maintenance costs. Rising temperatures are associated to the reduction of
the cycle efficiency of our turbines. A temperature rise would also be associated to a reduction of efficiency in solar photovoltaic modules. Modules efficiency is reduced above a certain temperature threshold. When the temperature of the solar panel
increases, its output current slightly increases while the voltage output is reduced linearly therefore panel power decreases. A mean temperature rise would also have an impact in our wind facilities. Wind energy component is dependent on the air
density among other factors. Our desalination plants could also be affected by a temperature increase that would imply higher consumption of chemicals used for operational purposes. This could cause a material adverse effect in our business,
financial condition, results of operations and cash flows.
Our business may be adversely affected by catastrophes, natural disasters, unexpected geological or other physical conditions, or criminal or terrorist acts
at one or more of our plants, facilities and electric transmission lines.
If one or more of our plants, facilities or electric transmission lines were to be subject in the future to fire, flood, extreme weather conditions (including severe wind), earthquakes or other
natural disaster, adverse weather conditions, drought, terrorism, power loss or other catastrophe, or if unexpected geological or other adverse physical conditions (including earthquakes) were to occur at any of our plants, facilities or electric
transmission lines, we may not be able to carry out our business activities at that location or such operations could be significantly reduced. Any of these circumstances could result in lost revenue at these sites during the period of disruption and
costly remediation, which could have a material adverse effect on our business, financial condition, results of operations and cash flows. In addition, it is possible that our sites and assets could be affected by criminal or terrorist acts. There
are also certain risks for which we may not be able to acquire adequate insurance coverage, including earthquakes. Any such events could have a material adverse effect on our business, financial condition, results of operations and cash flows.
Our insurance may be insufficient to cover relevant risks or the cost of our insurance may increase.
We cannot guarantee that our insurance coverage is, or will be, sufficient to cover all of the possible losses we may face in the future. Our property damage and business interruption policies have
exclusions with respect to some equipment which, if damaged, could result in financial losses and business interruptions. Some of our project finance arrangements include conditions regarding coverage that we could need to modify. If we were to incur
a serious uninsured loss or a loss that significantly exceeded the coverage limits established in our insurance policies or we were not able to modify coverage conditions, this could have a material adverse effect on our business, financial
condition, results of operations and cash flows.
In addition, our insurance policies are subject to review by our counterparties. We may not be able to renew our insurance policies in the terms required by our power purchase agreements and
project financing agreements, which could require a waiver from those parties. If insurance premiums were to increase in the future, if certain types of insurance coverage were to become unavailable or there was an increase in deductibles for damages
and/or loss of production, it could have a material adverse effect on our ability to comply with our obligations to off-takers and lenders in our project finance agreements. In addition, we might not be able to maintain insurance coverage comparable
to those that are currently in effect at comparable cost, or at all. If we were unable to pass any increase in insurance premiums on to our customers, such additional costs could have a material adverse effect on our business, financial condition,
results of operations and cash flows.
The generation of electric energy from renewable energy sources depends heavily on suitable meteorological conditions, and if solar or wind conditions are
unfavorable, our electricity generation, and therefore revenue from our renewable energy generation facilities using our systems, may be substantially below our expectations.
The electricity produced, and revenues generated by a renewable energy generation facility are highly dependent on suitable solar or wind conditions, as applicable, and associated weather
conditions, which are beyond our control.
Unfavorable weather and atmospheric conditions could impair the effectiveness of our assets or reduce their output beneath their rated capacity or require shutdown of key equipment, hampering
operation of our renewable assets and our ability to achieve forecasted revenues and cash flows. As climate change increases the frequency and severity of severe weather conditions and may have the long-term effect of changing meteorological
conditions at our project sites, such situations may increase in frequency and/or severity.
We base our investment decisions with respect to each renewable generation facility on the findings of related wind and solar studies conducted on-site by third parties prior to construction or
based on historical conditions at existing facilities. However, actual climatic conditions at a facility site, particularly wind conditions, which are sometimes severe, may not conform to the findings of these studies and therefore, our solar and
wind energy facilities may not meet anticipated production levels or the rated capacity of its generation assets, which may have a material adverse effect on our business, financial condition, results of operations and cash flows.
Disruption of the fuel supplies necessary to generate power at our efficient natural gas generation facilities may increase costs or result in disruptions in
production.
Delivery of fossil fuels to fuel our efficient natural gas and some solar power generation facilities is dependent upon the infrastructure, including natural gas pipelines, available to serve each
such generation facility, as well as upon the continuing financial viability of contractual counterparties. As a result, we are subject to the risks of disruptions or curtailments in the production of power at these generation facilities if a
counterparty fails to perform or if there is a disruption in the relevant fuel delivery infrastructure. Increased costs and disruptions in production may have a material adverse effect in our business, financial condition, results of operations and
cash flows.
Maintenance, expansion and refurbishment of electric generation and other facilities involve significant risks that could result in unplanned power outages or
reduced output or availability.
The facilities in our portfolio may require periodic upgrading and improvement in the future. Any unexpected operational or mechanical failure, including failure associated with breakdowns and
forced outages, could reduce the performance and availability of our facilities below expected levels, reducing our revenues. Degradation of the performance of our solar facilities above levels provided for in the related off-take agreements may also
reduce its revenues. Unanticipated capital expenditures associated with maintaining, upgrading or repairing our facilities may also reduce profitability.
If we make any major modifications to our efficient natural gas or renewable power generation facilities or electric transmission lines, we may be required to comply with more stringent
environmental regulations, which would likely result in substantial additional capital expenditures. We may also choose to repower, refurbish or upgrade our facilities based on our assessment that such activity will provide adequate financial
returns. Such facilities require time for development and capital expenditures before commencement of commercial operations, and key assumptions underpinning a decision to make such an investment may prove incorrect, including assumptions regarding
construction costs, timing, available financing and future fuel and power prices. This may have a material adverse effect on our business, financial condition, results of operations and cash flows.
Risks Related to Our Relationship with Algonquin and Abengoa
Algonquin is our largest shareholder and exercises substantial influence over us.
Currently, Algonquin beneficially owns 44.2% of our ordinary shares and is entitled to vote approximately 41.5% of our ordinary shares. As a result of this ownership, Algonquin has substantial
influence on our affairs and their ownership interest and voting power constitute a significant percentage of the shares eligible to vote on any matter requiring the approval of our shareholders. Such matters include the election of directors, the
adoption of amendments to our articles of association and approval of mergers or sale of all or a high percentage of our assets. This concentration of ownership may also have the effect of discouraging others from making tender offers for our shares.
There can be no assurance that the interests of Algonquin will coincide with the interests of the purchasers of our shares or that Algonquin will act in a manner that is in our best interests. If Algonquin sells its shares to a single shareholder,
that new shareholder could continue to exercise substantial influence and could seek to influence or change our strategy or corporate governance or could take effective control of us. In addition, we did not have a prior relationship with Algonquin
and we have limited knowledge and visibility of their operations and plans.
Our ownership structure and certain service agreements may create significant conflicts of interest that may be resolved in a manner that is not in our best
interests.
Our ownership structure involves a number of relationships that may give rise to certain conflicts of interest between us, Algonquin, and the rest of our shareholders. Currently, two of our
directors are affiliated with Algonquin.
Currently, AAGES and Algonquin are related parties and may have interests that differ from our interests, including with respect to the types of acquisitions made, the timing and amount of
dividends paid by us, the reinvestment of returns generated by our operations, the use of leverage when making acquisitions and the appointment of outside advisors and service providers. Any transaction between us and AAGES or Algonquin (including
the acquisition of any ROFO assets or any co-investment with AAGES or Algonquin or any investment on an Algonquin asset) is subject to our related party transaction policy, which requires prior approval of such transaction by a majority of the
non-conflicted directors, typically our independent directors. The existence of our related party transaction approval policy may not insulate us from derivative claims related to related party transactions and the conflicts of interest described in
this risk factor. Regardless of the merits of such claims, we may be required to spend significant management time and financial resources in the defense thereof. Additionally, to the extent we fail to appropriately deal with any such conflicts, it
could negatively impact our reputation and ability to raise additional funds and the willingness of counterparties to do business with us, all of which may have a material adverse effect on our business, financial condition, results of operations and
cash flows.
If Abengoa defaults on certain of its debt obligations, we could potentially be in default of certain of our project financing agreements.
The project financing arrangement of Kaxu contains cross-default provisions related to Abengoa such that debt defaults by Abengoa, subject to certain threshold amounts and/or a restructuring
process, could trigger a default under the Kaxu project financing arrangement. In March 2017, Atlantica obtained a waiver in its Kaxu project financing arrangement which waives any potential cross-defaults with Abengoa up to that date, but it does
not cover potential future cross-default events.
Abengoa has been undergoing a debt restructuring process and may default on its debt again in the future. If Abengoa defaults on its debt, there is no guarantee that we will be able to obtain
additional cross-default waivers under the Kaxu project financing. Without a waiver, we would be in default of our obligations under the Kaxu project financing. A cross-default scenario, if not cured or waived, may entitle lenders to demand repayment
or enforce on their security interests, which may have a material adverse effect on our business, financial condition, results of operations and cash flows.
Abengoa’s financial condition could affect its ability to satisfy its obligations with us under different agreements, including (i) operation and maintenance
agreements and, (ii) the Tenes share purchase agreement, as well as indemnities and other contracts in place.
We have current and future collection rights with certain subsidiaries of Abengoa. Moreover, Abengoa has a number of obligations and indemnities which have resulted or could result in additional
liability obligations to us or to our assets. Inability of Abengoa to pay their obligations when due would have a negative impact on our current or future cash position.
A deterioration in the financial position of Abengoa and of certain of its subsidiaries may result in a material adverse effect on certain of our operation and maintenance agreements. Abengoa and
its subsidiaries provide operation and maintenance services for many of our assets. We cannot guarantee that Abengoa and/or its subcontractors will be able to continue performing with the same level of service and under the same terms and conditions,
and at the same prices. For instance, although we have separated our IT systems from Abengoa’s, we still rely on some of Abengoa’s operational IT systems and communications systems in some of our assets. If Abengoa faces a deterioration in its
financial position, it may have a material adverse effect on our business, financial condition, results of operations and cash flows.
Because we have long-term operation and maintenance agreements with Abengoa for many of our assets, if Abengoa cannot continue performing current services at the same prices, we may need to
renegotiate contracts and pay higher prices or change the scope of the contracts. This could also cause us to change suppliers or to pay higher prices or change the level of services. This may have a material adverse effect on our business, financial
condition, results of operations and cash flows. A deterioration in the financial position of Abengoa may also result in a material adverse effect on Abengoa’s and its subsidiaries’ obligations, warranties and guarantees, indemnities or any other
agreement. In addition, Abengoa represented that further to the accession to the restructuring agreement, we would not be a guarantor of any obligation of Abengoa with respect to third parties and agreed to indemnify us for any penalty claimed by
third parties resulting from any breach in such representations.
In January 2019, we entered into an agreement with Abengoa under the Abengoa ROFO Agreement for the acquisition of Befesa Agua Tenés, S.L.U., a holding company which owns a 51% stake of Tenes, a
water desalination plant in Algeria. The price agreed for the equity value was $24.5 million, of which $19.9 million were paid in January 2019 as an advanced payment. Closing of the acquisition was subject to conditions precedent, including approval
by the Algerian administration. Such conditions precedent were not fulfilled as of September 30, 2019. Therefore, in accordance with the terms of the share purchase agreement the advanced payment was converted into a secured loan to be reimbursed by
Befesa Agua Tenes, together with 12% per annum interest, through a full cash-sweep of all the dividends generated to be received from the asset. These dividends would be guaranteed by a right of usufruct over the economic rights and certain political
rights and a pledge over the shares of Befesa Agua Tenes, granted by Abengoa to the Company. The share purchase agreement requires that the repayment occurs no later than September 30, 2031. In October 2019 the Company received a first payment of
$7.8 million through the cash sweep mechanism. If Abengoa was not able to reimburse the advanced payment, this may have an adverse effect on our results of operations and cash flows.
Furthermore, pursuant to different agreeements, Abengoa has certain amounts payable to us and has provided guarantees and indemnities covering for example potential tax liabilities for assets
acquired from Abengoa. If as a result of its financial situation Abengoa did not comply with these obligations, this could have a material adverse effect on our business, financial situation, results of operations and cash flows.
There may be unanticipated consequences of further restructurings by Abengoa or ongoing bankruptcy proceedings by Abengoa’s subsidiaries that we have not yet identified. There are uncertainties as
to how any further bankruptcy proceedings would be resolved and how our relationship with Abengoa would be affected following the initiation or resolution of any such proceedings.
We may not be able to consummate future acquisitions from AAGES, Algonquin or Abengoa.
Our ability to grow through acquisitions depends, in part, on AAGES’, Algonquin’s and Abengoa’s ability to present us with acquisition opportunities. AAGES, Algonquin or Abengoa may have financial
and resource constraints limiting or eliminating their ability to continue building the contracted assets which are currently under construction and may have financial and resource constraints limiting or eliminating their ability to develop and
build new contracted assets. Abengoa has undergone a restructuring process in recent years. In addition, AAGES, Algonquin or Abengoa may sell assets under development and, in the case of Abengoa, under construction, before they reach their commercial
operation date. In addition, some of the assets subject to the ROFO Agreements may not be attractive enough to us for different reasons. For example, in the case of A3T, a cogeneration asset in Mexico, Abengoa signed PPAs with payments to be made in
local currency, which may make our acquisition of this asset less likely. In addition, the Atacama project in Chile is currently owned by APW-1, an investment vehicle initially created by Abengoa as a joint venture with EIG and currently fully owned
by EIG, an investment fund; although the Atacama project is subject to our ROFO agreement with APW-1, we cannot be certain that APW-1 will wish to sell the Atacama project at an attractive price or at all. Furthermore, there may be circumstances out
of our control which limit our ability to acquire the rest of the assets in the Abengoa portfolio which are subject to the Abengoa ROFO Agreement.
AAGES and Algonquin may not offer us assets at all or may not offer us assets that fit within our portfolio or contribute to our growth strategy. Only certain assets outside the United States and
Canada are included in the Algonquin ROFO Agreement. Furthermore, Algonquin can terminate its ROFO agreement with us with a 180-day notice.
Additionally, we may not reach an agreement on the price of assets offered by AAGES, Algonquin or Abengoa. For these reasons, we may not be able to consummate future acquisitions from AAGES,
Algonquin or Abengoa which may restrict our ability to grow. Furthermore, we may not be able to renew the Abengoa ROFO Agreement. The Abengoa ROFO Agreement had an initial term of five years and has been extended until July 2022. We will be able to
unilaterally extend the term of the Abengoa ROFO Agreement as many times as desired for an additional three-year period, provided that we have executed at least one acquisition in the previous two years after having been offered at least four
projects.
All the above could limit our ability to grow, which may have a material adverse effect on our business, financial condition, results of operations and cash flows.
Abengoa may be forced to initiate a bankruptcy filing under the Spanish Insolvency Act and, as a result, it may be subject to insolvency claw-back actions in
which transactions may be set aside.
Under the Spanish Insolvency Act, the transactions a company has entered into during the two years prior to the opening of insolvency proceedings can be set aside, irrespective of whether there was
intent to defraud, if those transactions are considered materially damaging to the insolvency estate. Material damage is assessed on the basis of the circumstances at the time the transaction was carried out, without the benefit of hindsight and
without considering subsequent events or occurrences, including events in relation to insolvency proceedings or the request to set-aside the transaction. Though we could be considered a “connected person” for purposes of Spanish bankruptcy
proceedings (which triggers a presumption of damage), transactions we have entered into with Abengoa in the previous two years before it may be declared insolvent (if such action were to take place) would not automatically be set aside. The court
would consider if the transactions were detrimental to Abengoa on the terms on which they were made and the suitability of the transactions at the time they were entered into, if the transaction followed market standards and prices, had real economic
value and if a transaction was carried out on the same conditions as it would have been by independent parties.
In practice, transactions that are subject to claw-back with respect to companies in the same group relate to: (a) unjustified payments or advances from the insolvent company to another group
company, (b) transfers of assets or rights by the insolvent company to another group company at below market value, (c) payment-in-kind arrangements in which the property another group company receives in payment is higher in value than the debt owed
to it, and (d) security provided by the insolvent company for another group company’s obligations. This determination will be a question of fact before a Spanish court if Abengoa initiates a bankruptcy filing in Spain, however if any of the
transactions entered into between us and Abengoa, including those related to drop-downs assets, were declared invalid by a Spanish court, unless it is determined we acted in bad faith, such transaction would be unwound and we would receive back the
cash paid, which may have a material adverse effect on our business, financial condition, results of operations and cash flows.
The outcome of any bankruptcy proceedings that may be initiated by Abengoa would be difficult to predict given that Abengoa is incorporated in Spain and has assets and operations in several
countries around the world. In the event of any bankruptcy or similar proceeding involving Abengoa or any of its subsidiaries, bankruptcy laws other than those of Spain could apply. The rights of Abengoa’s creditors may be subject to the laws of a
number of jurisdictions and such multi-jurisdictional proceedings are typically complex and often result in substantial uncertainty. In addition, the bankruptcy and other laws of such jurisdictions may be materially different from, or in conflict
with, one another. If Abengoa is subject to U.S. bankruptcy law, bankruptcy courts in the United States may seek to assert jurisdiction over all of its assets, wherever located, including property situated in other countries.
A bankruptcy filing by Abengoa may permanently affect Abengoa’s operations. We cannot predict how any bankruptcy proceeding would be resolved or how our relationship with Abengoa will be affected
following the initiation of any such proceedings or after the resolution of any such proceedings. Any bankruptcy proceedings initiated by Abengoa may have a material adverse effect on our business, financial condition, results of operations and cash
flows.
Risks Related to Our Indebtedness
Our indebtedness could expose us to the risk of increased interest rates and limit our ability to react to changes in the economy or our industry. It could
also adversely affect our ability to raise additional capital to fund our operations or pay dividends.
As of December 31, 2019, we had (i) $4,852.3 million of total indebtedness under various project-level debt arrangements and (ii) $723.8 million of total indebtedness under our corporate
arrangements, which include the Note Issuance Facility 2019, the three tranches of the €275 million Note Issuance Facility 2017 maturing in 2022, 2023, and 2024, and drawdowns under the Revolving Credit Facility. In addition, we may incur in the
future additional project-level debt and corporate debt.
Our substantial debt could have important negative consequences on our business financial condition, results of operation and cash flows including:
| • |
increasing our vulnerability to general economic and industry conditions;
|
| • |
requiring a substantial portion of our cash flow from operations to be dedicated to the payment of principal and interest on our indebtedness, therefore reducing our ability to pay dividends to holders of
our shares or to use our cash flow to fund our operations, capital expenditures and future business opportunities;
|
| • |
limiting our ability to enter into long-term power sales, fuel purchases and swaps which require credit support;
|
| • |
limiting our ability to fund operations or future acquisitions;
|
| • |
restricting our ability to make certain distributions with respect to our shares and the ability of our subsidiaries to make certain distributions to us, in light of restricted payment and other financial
covenants in our credit facilities and other financing agreements;
|
| • |
exposing us to the risk of increased interest rates because a portion of some of our borrowings (below 10% as of December 31, 2019 after giving effect to hedging agreements) are at variable rates of
interest;
|
| • |
limiting our ability to obtain additional financing for working capital, including collateral postings, capital expenditures, debt service requirements, acquisitions and general corporate or other purposes;
and
|
| • |
limiting our ability to adjust to changing market conditions and placing us at a competitive disadvantage compared to our competitors who have less debt.
|
The operating and financial restrictions and covenants in the Revolving Credit Facility, the Note Issuance Facility 2017 and the Note Issuance Facility 2019 may adversely affect our ability to
finance our future operations or capital needs, to engage in other business activities that may be in our interest and to execute our business strategy as we intend to do so. Each contains covenants that limit certain of our, the guarantors’ and
other subsidiaries’ activities. In February 2020 we have priced our secured 2020 Green Private Placement that we expect to close in April 2020. We expect to use the proceeds of the 2020 Green Private Placement to refinance and cancel in full the Note
Issuance Facility 2017. The note purchase agreement to be entered into under the 2020 Green Private Placement will also contain financial restrictions and covenants which, if closed, may also limit certain of our the guarantors’ and other
subsidiaries’ activities. If we breach any of these covenants, a default may result, which, if not cured or waived, could result in the acceleration of our debt. See “Item 5.B—Operating and Financial Review and Prospects—Liquidity and Capital
Resources—Financing Arrangements—Revolving Credit Facility.”
Our inability to satisfy certain financial covenants may prevent cash distributions by the particular project(s) to us and, our failure to comply with those and other covenants could result in an
event of default which, if not cured or waived, may entitle the related noteholders or lenders, as applicable to demand repayment or to enforce their security interests, which may have a material adverse effect on our business, financial condition,
results of operations and cash flows. In addition, failure to comply with such covenants, including covenants under the Revolving Credit Facility, the Note Issuance Facility 2017, the Note Issuance Facility 2019 and, if closed, the 2020 Green Private
Placement may entitle the related noteholders or lenders, as applicable, to demand repayment and accelerate all such indebtedness. If our project-level subsidiaries are unable to make distributions, it would likely have a material adverse effect on
our ability to pay dividends to holders of our shares.
Letter of credit facilities or bank guarantees to support project-level contractual obligations generally need to be renewed, at which time we will need to satisfy applicable financial ratios and
covenants. If we are unable to renew the letters of credit as expected or replace them with letters of credit under different facilities on favorable terms or at all, we may experience a material adverse effect on our business, financial condition,
results of operations and cash flows. Furthermore, such inability may constitute a default under certain project-level financing arrangements, restrict the ability of the project-level subsidiary to make distributions to us and/or reduce the amount
of cash available at such subsidiary to make distributions to us.
We may not be able to refinance our existing indebtedness.
Our ability to arrange financing, either at corporate level or at a project-level, and the costs of such capital, are dependent on numerous factors, including:
| • |
general economic and capital market conditions;
|
| • |
credit availability from banks and other financial institutions;
|
| • |
investor confidence in us and our partner Algonquin, our largest shareholder;
|
| • |
our financial performance and the financial performance of our subsidiaries;
|
| • |
our level of indebtedness and compliance with covenants in debt agreements;
|
| • |
maintenance of acceptable project and corporate credit ratings or credit quality;
|
| • |
cash flow; and
|
| • |
provisions of tax and securities laws that may impact raising capital.
|
We may not be successful in obtaining additional capital for these or other reasons. Furthermore, we may be unable to refinance or replace project-level financing arrangements or other credit
facilities on favorable terms or at all upon the expiration or termination thereof. Our failure, or the failure of any of our projects, to obtain additional capital or enter into new or replacement financing arrangements when due may constitute a
default under such existing indebtedness in case we are not able to repay such indebtedness and may have a material adverse effect on our business, financial condition, results of operations and cash flows.
Potential future defaults by our subsidiaries, our off-takers, our suppliers, Abengoa or other persons could adversely affect us.
The financing agreements of our project subsidiaries are primarily loan agreements and related documents which, except as noted below, require the loans to be repaid solely from the revenue of the
project being financed thereby, and provide that the repayment of the loans (and interest thereon) is secured solely by the shares, physical assets, contracts and cash flow of that project company. This type of financing is usually referred to herein
as “project debt.” As of December 31, 2019, we had $4,852.3 million of outstanding indebtedness under various project-level debt arrangements.
While the lenders under our project debt do not have direct recourse to us or our subsidiaries (other than the letter of credit and bank guarantee facilities) ), defaults by the project borrowers
under such financings can still have important consequences for us and our subsidiaries, including, without limitation:
| • |
reducing our receipt of dividends, fees, interest payments, loans and other sources of cash, since the project company will typically be prohibited from distributing cash to us and our subsidiaries until
the event of default is cured or waived;
|
| • |
default under our other debt instruments;
|
| • |
causing us to record a loss in the event the lender forecloses on the assets of the project company; and
|
| • |
the loss or impairment of investors’ and project finance lenders’ confidence in us.
|
If we fail to satisfy any of our debt service obligations or breach any related financial or operating covenants, the applicable lender could declare the full amount of the relevant project debt to
be immediately due and payable and could foreclose on any assets pledged as collateral.
In addition, the financing arrangement of Kaxu contained cross-default provisions related to Abengoa, such that debt defaults by Abengoa, subject to certain threshold amounts and/or a restructuring
process, could trigger defaults under such project financing arrangement. In March 2017, the Company signed a waiver which gives clearance to cross-defaults that might have arisen from Abengoa insolvency and restructuring up to that date, but does
not extend to potential future cross-default events.
Under the Revolving Credit Facility, the 2020 Green Private Placement (which is expected to be funded on or about April 1, 2020 and replace our Note Issuance Facility 2017) and the Note Issuance
Facility 2019, a payment default with respect to indebtedness having an aggregate principal amount of $100 million (or the greater of $40.0 million and 1.5% of consolidated total assets with respect to the Note Issuance Facility 2019) or more by one
or more of our non-recourse subsidiaries representing more than 25% of the cash available for distribution distributed in the previous four fiscal quarters could trigger a default under such Revolving Credit Facility and/or the Note Issuance Facility
2019, as the case may be. In addition, our Note Issuance Facility 2017 (which is expected to be replaced by the 2020 Green Private Placement) includes a cross-default provision related to a payment default by one or more of our non-recourse
subsidiaries representing more than 20% of the cash available for distribution distributed in the previous four fiscal quarters could trigger a default, provided that these subsidiaries have an indebtedness higher than $100 million in the case of
non-recourse subsidiaries or more than $75 million in the case of subsidiaries other than non-recourse subsidiaries.
Any of these events may have a material adverse effect on our business, financial condition, results of operations and cash flows.
A change of control or a delisting of our shares may have negative implications for us.
If any investor acquires more than 50.0% of our shares or if our ordinary shares cease to be listed in NASDAQ or a similar stock exchange, we may be required to refinance all or part of our
corporate debt or obtain waivers from the related noteholders or lenders, as applicable, due to the fact that all of our corporate financing agreements contain customary change of control provisions and delisting restrictions . If we fail to obtain
such waivers and the related noteholders or lenders, as applicable, elect to accelerate the relevant corporate debt, we may not be able to repay or refinance such debt (on favorable terms or at all), which may have a material adverse effect on our
business, financial condition results of operations and cash flows. Additionally, in the event of a change of control we could see an increase in the yearly state property tax payment in Mojave, which would be reassessed by the tax authority at the
time the change of control potentially occurred. Our best estimate with current information available and subject to further analysis is that we could have an incremental annual payment of property tax of approximately $12 million to $14 million,
which could potentially decrease progressively over time as the asset depreciates. Additionally, an ownership change under section 382 could be triggered and could have a significant negative impact on our tax positions in the U.S.
Risks Related to Ownership of Our Shares
We may not be able to pay a specific or increasing level of cash dividends to holders of our shares in the future.
The amount of our cash available for distribution principally depends upon the amount of cash we generate from our operations, which will fluctuate from quarter to quarter based on, among other
things:
| • |
the level of our operating and general and administrative expenses;
|
| • |
seasonal variations in revenues generated by the business;
|
| • |
operational performance of our assets;
|
| • |
potential capital expenditure requirements in our assets in the case there were technical problems not covered by the EPC contractor guarantee or by insurance;
|
| • |
our debt service requirements and other liabilities;
|
| • |
fluctuations in our working capital needs;
|
| • |
fluctuations in foreign exchange rates;
|
| • |
our ability to borrow funds;
|
| • |
restrictions contained in our debt agreements (including our project-level financing);
|
| • |
changes in our revenues due to delays in collections from our off-takers, legal disputes regarding contact terms or adjustments contemplated in existing regulation or changes in regulation or taxes in the
countries in which we operate;
|
| • |
potential restrictions on payment of dividends arising from the bankruptcy of PG&E;
|
| • |
potential restrictions on payment of dividends arising from cross-default provisions with Abengoa in our Kaxu project financing agreements; and
|
| • |
other business risks affecting our cash levels.
|
As a result of all these factors, we cannot guarantee that we will have sufficient cash generated from operations to pay a specific or increasing level of cash dividends to holders of our shares.
Furthermore, holders of our shares should be aware that the amount of cash available for distribution depends primarily on our cash flow, and is not solely a function of profitability, which is affected by non-cash items. We may incur other expenses
or liabilities during a period that could significantly reduce or eliminate our cash available for distribution and, in turn, impair our ability to pay dividends to shareholders during the period. Because we are a holding company, our ability to pay
dividends on our shares is limited by restrictions or limitations on the ability of our subsidiaries to pay dividends or make other distributions, such as pursuant to shareholder loans, capital reductions or other means, to us, including restrictions
under the terms of the agreements governing project-level financing, the Revolving Credit Facility, the Note Issuance Facility 2017, the Note Issuance Facility 2019, the 2020 Green Private Placement (if and when closed) or legal, regulatory or other
restrictions or limitations applicable in the various jurisdictions in which we operate, such as exchange controls or similar matters or corporate law limitations, any of which could change from time to time and thereby limit our subsidiaries’
ability to pay dividends or make other distributions to us. Our project-level financing agreements generally prohibit distributions to us unless certain specific conditions are met, including the satisfaction of financial ratios.
In 2016, our board of directors decided not to pay a dividend with respect to the first quarter, and declared a reduced dividend in the following quarters, based on the fact that certain of our
assets contained cross default provisions and change of ownership provisions with Abengoa. In 2017 and 2018, with the receipt of most waivers, we progressively increased our dividends. However, we cannot assure you that our board of directors will
not take similar measures in upcoming periods.
Our cash available for distribution will likely fluctuate from quarter to quarter, in some cases significantly, due to seasonality. See “Item 4.B—Business Overview—Seasonality.” As result, we may
reduce the amount of cash we distribute in a particular quarter to establish reserves to fund distributions to shareholders in future periods for which the cash distributions we would otherwise receive from our subsidiary project companies would
otherwise be insufficient to pay our quarterly dividend. If we fail to establish sufficient reserves, we may not be able to maintain our quarterly dividend with a respect to a quarter adversely affected by seasonality.
Dividends to holders of our shares will be paid at the discretion of our board of directors. Our board of directors may decrease the level of or entirely discontinue payment of dividends. Our
board of directors may change our dividend policy at any point in time or modify the dividend for specific quarters following prevailing conditions. For a description of additional restrictions and factors that may affect our ability to pay cash
dividends, please see “Item 8.A—Consolidated Statements and Other Financial Information—Dividend Policy.”
We are a holding company and our only material assets are our interests in our subsidiaries, upon whom we are dependent for distributions to
pay dividends, taxes and other expenses.
We are a holding company whose sole material assets consist of our interests in our subsidiaries. We do not have any independent means of generating revenue. We intend to cause our operating
subsidiaries to make distributions to us in an amount sufficient to cover our corporate debt service, corporate general and administrative expenses, all applicable taxes payable and dividends, if any, declared by us. To the extent that we need
funds for a quarterly cash dividend to holders of our shares or otherwise, and one or more of our operating subsidiaries is restricted from making such distributions under the terms of its financing or other agreements or applicable law and
regulations or is otherwise unable to provide such funds, it could materially adversely affect our liquidity and financial condition and limit our ability to pay dividends to shareholders.
We have a limited operating history and as a result there is no assurance we can operate on a profitable basis.
We have a limited operating history on which to base an evaluation of our business and prospects. Our prospects must be considered in light of the risks, expenses and difficulties frequently
encountered by companies in their early stages of operation. We cannot assure you that we will be successful in addressing the risks we may encounter, and our failure to do so could have a material adverse effect on our business, financial
condition, results of operations and cash flows.
Market interest rates may have an effect on the value of our shares.
One of the factors that will influence the price of our shares will be the effective dividend yield of our shares (i.e., the yield as a percentage of the then-market price of our shares)
relative to market interest rates. A continued increase in market interest rates, which are still at low levels compared to historical rates, may lead prospective purchasers of our shares to expect a higher dividend yield. Lower stock price of
our shares might make our dividend per share growth more difficult, since acquisitions financed with equity could be less accretive or not accretive. Our inability to increase our dividend as a result of an increase in borrowing costs,
insufficient cash available for distribution or otherwise could result in selling pressure on, and a decrease in, the market price of our shares as investors seek alternative investments with higher yield.
Market volatility may affect the price of our shares and the value of your investment.
The market for securities issued by issuers such as us is influenced by economic and market conditions and, to varying degrees, market conditions, interest rates, currency exchange rates and
inflation rates in other countries. There can be no assurance that events in the United States, Latin America, Europe, Africa or elsewhere will not cause market volatility or that such volatility will not adversely affect the price of the shares
or that economic and market conditions will not have any other adverse effect. Fluctuations in interest rates may give rise to arbitrage opportunities based upon changes in the relative value of the shares. Any trading by arbitrageurs hedge funds
could, in turn, affect the trading price of the shares. In the past there has been correlation between the price of our shares, the price of oil and the price of shares of master limited partnerships, or MLPs, and a decline in the price of oil or
MLP shares could cause a decline in the price of our shares. The price of our shares can also be affected by our peers’ share price. Securities markets in general may experience extreme volatility that is unrelated to the operating performance of
particular companies. Any broad market fluctuations may adversely affect the trading of our shares.
In addition, the market price of our shares may fluctuate in the event of negative developments at Algonquin, termination of the AAGES, Algonquin or Abengoa ROFO Agreements, failure by us to
close co-investments or drop-downs from Algonquin, if Algonquin communicated lower interest in co-investments with us or a change in their strategy regarding our partnership, additions or departures of our key personnel, changes in market
valuations of similar companies, Algonquin or Abengoa and/or speculation in the press or investment community regarding us, Algonquin or Abengoa.
There can be no assurance that our exploration of strategic alternatives will result in any transaction being consummated, and speculation and uncertainty
regarding the outcome of our exploration of strategic alternatives may adversely impact our business.
Our board of directors has formed a Special Committee with the purpose of evaluating a wide range of strategic alternatives available to us to optimize our value and to improve returns to
shareholders. There can be no assurance that this process will result in the pursuit or consummation of any strategic transaction or that there will be a formal cessation of the process.
In addition, this process involves the dedication of significant resources and the incurrence of significant costs and expenses. Certain strategic alternatives for us may require shareholder
approval. In addition, speculation and uncertainty regarding our exploration of strategic alternatives may cause or result in the disruption of our business; diversion of significant resources of our management and staff difficulty in recruiting,
hiring, motivating and retaining talented and skilled personnel; difficulty in maintaining or negotiating and consummating new, business or strategic relationships or transactions; disruption of our relationships with customers, business partners
and service providers; inability to respond effectively to competitive pressures, industry developments and future opportunities; and increased share price volatility.
If we are unable to mitigate these or other potential risks related to the uncertainty caused by our exploration of strategic alternatives, it may disrupt our business or adversely impact our
financial condition, results of operations and cash flows.
Furthermore, even if this process results in the pursuit of any proposed strategic transaction, there is no assurance that such strategic transaction will be consummated. We may be unable to
obtain any regulatory or third-party approvals or consents (including any applicable approvals or consents related to our projects) that may be required to complete such strategic transaction, and we may be unable to satisfy other closing
conditions for such strategic transaction, in the anticipated timeframe or at all. Any condition, to the extent imposed, for obtaining any necessary approvals or consents could delay the completion of such strategic transaction for a significant
period of time or prevent it from occurring at all. Our failure to complete such strategic transaction could materially adversely affect our business and prospects.
You may experience dilution of your ownership interest due to the future issuance of additional shares.
In order to finance our business and in order to finance the growth of our business through future acquisitions, we may require additional funds from additional equity or debt financings,
including tax equity financing transactions or sales of preferred shares or other classes of shares or convertible debt or convertible equity issued by a subsidiary. We may need to issue equity to complete future acquisitions, expansions and
capital expenditures. We may also need to issue equity for other reasons, including paying the general and administrative costs of our business or our corporate debt. In the future, we may issue our previously authorized and unissued securities,
resulting in the dilution of the ownership interests of purchasers of our shares . The potential issuance of additional shares or preferred stock or convertible debt may create downward pressure on the trading price of our shares. We may also
issue additional shares or other securities that are convertible into or exercisable for our shares in future public offerings or private placements for capital-raising purposes or for other business purposes, potentially at an offering price,
conversion price or exercise price that is below the offering price for our shares in any of our previous offering.
If securities or industry analysts do not publish or cease to publish research or reports about us, our business or our market, or if they
change their recommendations regarding our shares adversely, the price and trading volume of our shares could decline.
The trading market for our shares will be influenced by the research and reports that industry or securities analysts may publish about us, Algonquin, our business, our market or our
competitors. If any of the analysts who may cover us change their recommendations regarding our shares adversely, or provide more favorable relative recommendations about our competitors, the price of our shares would likely decline. The fact
that the size of the yieldco sector may be reducing may cause a decrease in interest from industry analysts in us. In addition, increased regulation, especially in Europe is also causing a decrease in coverage in small and mid-capitalization
companies. If any analyst who may cover us were to cease coverage of our company or fail to regularly publish reports on us, we could lose visibility in the financial markets, which in turn could cause the price or trading volume of our shares to
decline.
Future sales of our shares by Algonquin or its lenders or by other substantial shareholders may cause the price of our shares to fall.
The market price of our shares could decline as a result of future sales by Algonquin of its shares in the market, or the perception that these sales could occur. Algonquin is the beneficial
owner of approximately 44.2% of our ordinary shares. On November 28, 2018, AAGES obtained a secured credit facility in the amount of $306,500,000. The AAGES secured credit facility is collateralized through a pledge of the Atlantica shares held
by AY Holdings. A collateral shortfall would occur if the net obligation as defined in the agreement would equal or exceed 50% of the market value of the Atlantica shares in which case the AAGES Credit Facility lenders would have the right to
sell Atlantica shares to eliminate the collateral shortfall.
If AAGES defaulted on any of these financing arrangements, its lenders may foreclose on the shares and sell the shares in the market. Future sales of substantial amounts of the shares and/or
equity-related securities in the public market, or the perception that such sales could occur, could adversely affect prevailing trading prices of the shares and could impair our ability to raise capital through future offerings of equity or
equity-related securities. The price of the shares could be depressed by investors’ anticipation of the potential sale in the market of substantial additional amounts of shares. Disposals of shares could increase the number of shares being
offered for sale in the market and depress the trading price of our shares.
As a “foreign private issuer” in the United States, we are exempt from certain rules under the U.S. securities laws and are permitted to
file less information with the SEC than U.S. companies.
As a “foreign private issuer,” we are exempt from certain rules under the Exchange Act that impose certain disclosure obligations and procedural requirements for proxy solicitations under
Section 14 of the Exchange Act. In addition, our officers, directors and principal shareholders are exempt from the reporting and “short-swing” profit recovery provisions of Section 16 of the Exchange Act and the rules under the Exchange Act with
respect to their purchases and sales of our shares. Moreover, we are not required to file periodic reports and financial statements with the SEC as frequently or as promptly as U.S. companies whose securities are registered under the Exchange
Act. In addition, we are not required to comply with Regulation FD, which restricts the selective disclosure of material information.
If we were to lose our “foreign private issuer” status, we would no longer be exempt from certain provisions of the U.S. securities laws we would be required to commence reporting on forms
required of U.S. companies, and we could incur increased compliance and other costs, among other consequences.
Judgments of U.S. courts may not be enforceable against us.
Judgments of U.S. courts, including those predicated on the civil liability provisions of the federal securities laws of the United States, may not be enforceable in courts in the United
Kingdom or other countries in which we operate. As a result, our shareholders who obtain a judgment against us in the United States may not be able to require us to pay the amount of the judgment.
There are limitations on enforceability of civil liabilities under U.S. federal securities laws.
We are incorporated under the laws of England and Wales. Most of our officers and directors reside outside of the United States. In addition, a portion of our assets and the majority of the
assets of our directors and officers are located outside the United States. As a result, it may be difficult or impossible to serve legal process on persons located outside the United States and to force them to appear in a U.S. court. It may
also be difficult or impossible to enforce a judgment of a U.S. court against persons outside the United States, or to enforce a judgment of a foreign court against such persons in the United States. We believe that there may be doubt as to the
enforceability against persons in England and Wales and in Spain, whether in original actions or in actions for the enforcement of judgments of U.S. courts, of civil liabilities predicated solely upon the laws of the United States, including its
federal securities laws. Because we are a foreign private issuer, our directors and officers will not be subject to rules under the Exchange Act that under certain circumstances would require directors and officers to forfeit to us any
“short-swing” profits realized from purchases and sales, as determined under the Exchange Act and the rules thereunder, of our equity securities. In addition, punitive damages in actions brought in the United States or elsewhere may be
unenforceable in England and Wales and in Spain.
Shareholders in certain jurisdictions may not be able to exercise their pre-emptive rights if we increase our share capital.
Under our articles of association, holders of our shares generally have the right to subscribe and pay for a sufficient number of our shares to maintain their relative ownership percentages
prior to the issuance of any new shares in exchange for cash consideration. Holders of shares in certain jurisdictions may not be able to exercise their pre-emptive rights unless securities laws have been complied with in such jurisdictions with
respect to such rights and the related shares, or an exemption from the requirements of the securities laws of these jurisdictions is available. To the extent that such shareholders are not able to exercise their pre-emptive rights, the
pre-emptive rights would lapse, and the proportional interests of such holders would be reduced.
In addition, under the Shareholders Agreement, AAGES or Algonquin or both of them may subscribe to capital increases in cash for (i) up to 100.0% of our ordinary shares if the purpose of the
issuance is to fund our acquisition of assets under the AAGES or Algonquin ROFO Agreement; and (ii) up to 66.0% of our ordinary shares if the purpose of the issuance is to fund our acquisition of assets under the Abengoa ROFO Agreement. If we
issue ordinary shares for any other purpose, AAGES or Algonquin may subscribe in cash for our ordinary shares in a pro rata amount of such AAGES’ or Algonquin’s aggregate holding of voting rights in us. The Shareholders Agreement may be
terminated or modified in the future.
The rights of our shareholders may differ from the rights typically offered to shareholders of a U.S. corporation organized in Delaware.
We are incorporated under English law. The rights of holders of our shares are governed by English law, including the provisions of the UK Companies Act 2006, and by our articles of
association. These rights differ in certain respects from the rights of shareholders in typical U.S. corporations organized in Delaware. The principal differences are set forth in “Item 10.B—Memorandum and Articles of Association.”
Provisions in the UK City Code on Takeovers and Mergers may have anti-takeover effects that could discourage an acquisition of us by others,
even if an acquisition would be beneficial to our shareholders.
The UK City Code on Takeovers and Mergers, or the Takeover Code, applies, among other things, to an offer for a public company whose registered office is in the United Kingdom and whose
securities are not admitted to trading on a regulated market in the United Kingdom if the company is considered by the Panel on Takeovers and Mergers, or the Takeover Panel, to have its place of central management and control in the United
Kingdom. This is known as the “residency test.” The test for central management and control under the Takeover Code is different from that used by the UK tax authorities. Under the Takeover Code, the Takeover Panel will determine whether we have
our place of central management and control in the United Kingdom by looking at various factors, including the structure of our board of directors, the functions of the directors and where they are resident.
If at the time of a takeover offer the Takeover Panel determines that we have our place of central management and control in the United Kingdom, we would be subject to a number of rules and
restrictions, including but not limited to the following: (1) our ability to enter into deal protection arrangements with a bidder would be extremely limited; (2) we may not, without the approval of our shareholders, be able to perform certain
actions that could have the effect of frustrating an offer, such as issuing shares or carrying out acquisitions or disposals; and (3) we would be obliged to provide equality of information to all bona fide competing bidders.
Risks Related to Taxation
Changes in our tax position can significantly affect our reported earnings and cash flows.
We have assets in different jurisdictions, which are subject to different tax regimes. Changes in tax regimes such as the reduction or elimination of tax benefits, or the reduction of tax rates
overall in markets where we operate could adversely affect the market for investments in our projects by third parties. A reduction in corporate tax rates could make investments in renewable projects less attractive to potential tax equity
investors, in which case we may not be able to obtain third-party financing on terms as beneficial as in the past, or at all, which could limit our ability to grow our business. Limitations on the deductibility of interest expense could reduce
our ability to deduct the interest we pay on our debt. These and other potential changes in tax regulations could have a material adverse effect on our results and cash flows.
Changes in corporate tax rates and/or other relevant tax laws in the United Kingdom, the United States, Spain, Mexico or the other countries in which our assets are located may have a material
impact on our future tax rate and/or our required tax payments. Such changes may include measures enacted in response to the ongoing initiatives in relation to fiscal legislation at an international level, such as the Action Plan on Base Erosion
and Profit Shifting of the Organization for Economic Co-operation and Development. The final determination of our tax liability could be different from the forecasted amount, which may have a material adverse effect on our business, financial
condition, results of operations and cash flows. Changes to the U.K. controlled foreign company rules or adverse interpretations of them, could have an impact on our future tax rate and/or our required tax payments. With respect to some of our
projects, we must meet defined requirements to apply favorable tax treatment, such as lower tax rates or exemptions. We intend to meet these requirements in order to benefit from the favorable tax treatment; however, there can be no assurance
that we will be able to comply with all of the necessary requirements in the future, or the requirements could change or be interpreted in another manner, which could give rise to a greater tax liability and which may have a material adverse
effect on our business, results of operations, financial condition and cash flows.
According to public information, the government of Spain has proposed a modification to the tax legislation to limit certain deductions and introduces a minimum tax rule in the corporate income
tax. The proposed modification would also contemplate a reduction in the tax exemption on dividends received from affiliates from 100% to 95% . This modification is subject to approval by Parliament and could be changed in the future. In
addition, the details of the new regulation are still largely unknown. Based on available public information we do not expect a significant impact in cash flows from our Spanish solar assets in the upcoming years, but the outcome is still
uncertain.
In addition, the Chilean Congress recently approved the tax reform bill proposed by the local government to increase taxes that would fund the new social agenda, announced after recent social
protests.
In 2019, the Mexican Congress approved the tax bill proposed by the new government, which introduces new provisions in the income tax law and value added tax laws, among others. The tax reform
introduced an additional limitation to the deduction of interest for tax purposes up to 30% of the adjusted EBITDA. However, this limitation might not be applicable to debt granted to finance public infrastructure works, construction and land
located in Mexico, exploration, extraction, and other projects of the extractive industry, transport, storage or distribution of oil and hydrocarbons, or for the generation, transmission or storage of electricity or water.
Our future tax liability may be greater than expected if we do not use sufficient NOLs to offset our taxable income.
We have NOLs that we can use to offset future taxable income. Based on our current portfolio of assets, which include renewable assets that benefit from an accelerated tax depreciation
schedule, and subject to potential tax audits, which may result in income, sales, use or other tax obligations, we do not expect to pay significant taxes in the upcoming years.
Although we expect these NOLs will be available as a future benefit, in the event that they are not generated as expected, or are successfully challenged by the local tax authorities, such as
the IRS or Her Majesty’s Revenue and Customs among others, by way of a tax audit or otherwise, or are subject to future limitations as discussed below, our ability to realize these benefits may be limited. A reduction in our expected NOLs, a
limitation on our ability to use such NOLs or the occurrence of future tax audits may result in a material increase in our estimated future income tax liability and may have a material adverse effect on our business, financial condition, results
of operations and cash flows.
Our ability to use U.S. NOLs to offset future income may be limited.
We have generated significant U.S. NOLs. We generally are able to carry U.S. NOLs forward to reduce our tax liability in future years. Federal U.S. NOLs generated on or before December 31, 2017
can generally be carried back two years and carried forward for up to twenty years and can be applied to offset 100% of taxable income in such years. Under the TCJA, however, federal U.S. NOLs incurred in 2018 and in future years may be carried
forward indefinitely but may not be carried back and the deductibility of such federal U.S. NOLs is limited to 80% of taxable income in such years.
In addition, our ability to use U.S. NOLs generated is subject to the rules of Sections 382 of the IRC. This section generally restricts the use of U.S. NOLs if we were to experience an
“ownership change” as defined under Section 382 of the IRC, and similar state rules. In general, an “ownership change” would occur if our “5-percent shareholders,” as defined under Section 382 of the IRC, collectively increased their ownership in
us to more than 50 percentage points over a rolling three-year period. A corporation that experiences an ownership change will generally be subject to an annual limitation on the use of its pre-ownership change U.S. NOLs equal to the equity value
of the corporation immediately before the ownership change, multiplied by the long-term tax-exempt rate for the month in which the ownership change occurs, and increased by a certain portion of any “built-in-gains.”
The Abengoa restructuring carried out in 2017 caused a change of ownership under Section 382 of the IRC, which limited in part our ability to use net operating loss carryforwards. The 41.5%
Share Sale by Abengoa of its stake in us may have caused another change of ownership, which may limit further our ability to use net operating loss carryforwards in the United States. Future sales by our largest shareholder, future equity
issuances and in general the activity of our direct or indirect shareholders may limit further our ability to use net operating loss carryforwards in the United States, which could have a potential adverse effect on cash flows from U.S. assets
expected in the future. In addition, changes in our shareholder base during 2019 may have triggered an ownership change under Section 382 of the IRC. In addition, the Internal Revenue Service recently issued proposed regulations for the
calculation of built-in gains and losses under Section 382. If enacted, these new regulations, may significantly limit our annual use of pre-ownership change U.S. NOLs in the event a new ownership change occurs after the new rule is in place.
In addition, because we have recorded tax credits for the U.S. tax losses carryforwards in the past, a limit to our ability to use U.S. NOLs could result in writing off tax credits, which could
cause a substantial non-cash income tax expense in our financial statements.
Distributions to U.S. Holders of our shares may be fully taxable as dividends.
It is difficult to predict whether or to what extent we will generate earnings or profits as computed for U.S. federal income tax purposes in any given tax year. If we make distributions on the
shares from current or accumulated earnings and profits as computed for U.S. federal income tax purposes, such distributions generally will be taxable to U.S. Holders of our shares as ordinary dividend income for U.S. federal income tax purposes.
Under current law, if certain requirements are met, such dividends would be eligible for the lower tax rates applicable to qualified dividend income of certain non-corporate U.S. Holders. While we expect that a portion of our distributions to
U.S. Holders of our shares may exceed our current and accumulated earnings and profits as computed for U.S. federal income tax purposes, and therefore may constitute a non-taxable return of capital to the extent of a U.S. Holder’s basis in our
shares, no assurance can be given that this will occur. We intend to calculate our earnings and profits annually in accordance with U.S. federal income tax principles. See “Item 10.E—Taxation—Material U.S. Federal Income Tax Considerations.”
If we are a passive foreign investment company for U.S. federal income tax purposes for any taxable year, U.S. Holders of our shares could
be subject to adverse U.S. federal income tax consequences.
If we were a PFIC for any taxable year during which a U.S. Holder held our shares, certain adverse U.S. federal income tax consequences may apply to the U.S. Holder. We do not believe that we
were a PFIC for our 2019 taxable year and do not expect to be a PFIC for U.S. federal income tax purposes for the current taxable year or in the foreseeable future. However, PFIC status depends on the composition of a company’s income and assets
and the fair market value of its assets (including, among others, less than 25.0% owned equity investments) from time to time, as well as on the application of complex statutory and regulatory rules that are subject to potentially varying or
changing interpretations. Accordingly, there can be no assurance that we will not be considered a PFIC for any taxable year.
If we were a PFIC, U.S. Holders of our shares may be subject to adverse U.S. federal income tax consequences, such as taxation at the highest marginal ordinary income tax rates on capital gains
and on certain actual or deemed distributions, interest charges on certain taxes treated as deferred, and additional reporting requirements. See “Item 10.E—Taxation—Material U.S. Federal Income Tax Considerations—Passive foreign investment
company rules.”
We were incorporated in England and Wales as a private limited company on December 17, 2013 under the name “Abengoa Yield Limited.” On March 19, 2014, we were re-registered as a public limited
company, under the name “Abengoa Yield plc.” On January 7, 2016, we changed our corporate brand to Atlantica Yield. At our annual shareholders meeting held in May 2016, we changed our legal name to Atlantica Yield plc.
The address of our principal executive offices is Great West House, GW1, 17th floor, Great West Road, Brentford, United Kingdom TW8 9DF, and our phone number is +44 203 499 0465.
Our current agent in the U.S. is ASHUSA Inc., a Delaware company with its principal office located at 1553 W. Todd Drive, Suite 204, Tempe, Arizona 85283, United States.
We are a sustainable infrastructure company that owns and manages renewable energy, efficient natural gas, transmission and transportation infrastructures and water assets. We currently have
operating facilities in North America (United States, Canada and Mexico), South America (Peru, Chile and Uruguay) and EMEA (Spain, Algeria and South Africa). We intend to expand our portfolio, maintaining North America, South America and Europe
as our core geographies.
We own or have an interest in a portfolio of diversified assets in terms of type of technology and geographic footprint. Our portfolio consists of 25 assets with 1,496 MW of aggregate renewable
energy installed generation capacity, 343 MW of efficient natural gas-fired power generation capacity, 10.5 M ft3 per day of water desalination and 1,166 miles of electric transmission lines.
On June 18, 2014, we completed our IPO and listed our shares on the NASDAQ Global Select Market under the symbol “ABY.” On November 14, 2017, the ticker symbol was changed to “AY.” Prior to the
consummation of our IPO, Abengoa transferred to us ten assets representing an initial portfolio comprising 710 MW of renewable energy generation, 300 MW of efficient natural gas power generation and 1,018 miles of electric transmission lines and
an exchangeable preferred equity investment in ACBH.
On November 1, 2017, Algonquin agreed to acquire 25.0% of our shares from Abengoa and upon completion of the Share Sale, became our largest shareholder. In addition, Algonquin and Abengoa
created a joint venture, AAGES, to jointly invest in the development and construction of clean energy and water infrastructure contracted assets. On March 5, 2018 we entered into a ROFO agreement with AAGES, which provides us with a right of
first offer on any proposed sale, transfer or other disposition of AAGES ROFO Assets. In addition, we entered into a ROFO agreement with Algonquin covering certain of their non-U.S. and non-Canadian assets. Additionally, on November 27, 2018,
Algonquin acquired from Abengoa the remaining 16.5% of our shares previously held by Abengoa and in 2019, Algonquin progressively increased its stake in our shares up to 44.2%.
Recent Acquisitions
In January 2019, we entered into an agreement with Abengoa under the Abengoa ROFO Agreement for the acquisition of Befesa Agua Tenes, a
holding company which owns a 51% stake in Tenes, a water desalination plant in Algeria that is similar in several aspects to our Skikda and Honaine plants. The price agreed for the equity value was $24.5 million, of which $19.9 million was paid
in January 2019 as an advanced payment. Closing of the acquisition was subject to conditions precedent, including approval by the Algerian administration. The conditions precedent set forth in the share purchase agreement were not fulfilled as
of September 30, 2019. Therefore, in accordance with the terms of the share purchase agreement the advanced payment has been converted into a secured loan to be reimbursed by Befesa Agua Tenes, together with 12% per annum interest, through a
full cash-sweep of all the dividends generated to be received from the asset. The share purchase agreement requires that the repayment occurs no later than September 30, 2031. In October 2019 we received a first payment in the amount of $7.8
million through the cash sweep mechanism.
In April 2019, we entered into an agreement to acquire a 30% stake in Monterrey, a 142 MW gas-fired engine facility including 130 MW installed capacity and 12 MW battery capacity. The
acquisition closed on August 2, 2019 and we paid $42 million for the total equity investment. The asset, located in Mexico, has been in operation since 2018 and represents our first investment in electric batteries. It has a U.S.
dollar-denominated 20-year PPA with two international large corporations engaged in the car manufacturing industry as well as a 20-year contract for the natural gas transportation from Texas with a U.S. energy company. The PPA also includes price
escalation factors. The asset is the sole electricity supplier for the off-takers, it has no commodity risk and also has the possibility to sell excess energy to the North-East region of the country. We have also entered into a ROFO agreement
with the seller of the shares for the remaining 70% stake in the asset.
Additionally, on May 24, 2019, Atlantica and Algonquin formed AYES Canada, a vehicle to channel co-investment opportunities in which Atlantica holds the majority of voting rights. AYES Canada’s
first investment was in Amherst Island, a 75 MW wind plant in Canada owned by the project company Windlectric, Inc. (“Windlectric”). Atlantica invested $4.9 million and Algonquin invested $92.3 million, both through AYES Canada, which in turn
invested those funds in Amherst Island Partnership, the holding company of Windlectric. Since Atlantica has control over AYES Canada under IFRS 10 “Consolidated Financial Statements”, its consolidated financial statements initially showed a total
investment in the Amherst Island project of $97.2 million, accounted for as “Investments carried under the equity method” (Note 7) and Algonquin’s portion of that investment of $92.3 million as “Non-controlling interest”. In addition, and under
certain circumstances considered remote by both companies, Atlantica and Algonquin have options to convert shares of AYES Canada currently owned by Algonquin into Atlantica ordinary shares in exchange for a higher stake in the plant, subject to
the provisions of the standstill and enhanced collaboration agreements with Algonquin.
On May 31, 2019, we entered into an agreement with Abengoa to acquire a 15% stake in Rioglass, a multinational manufacturer of solar components in order to secure certain Abengoa obligations.
The investment was $7 million, and it is classified as available for sale and is expected to generate interest income for us once divested.
On August 2, 2019, we closed the acquisition of ASI Operations, the company that performs the operation and maintenance services to Solana and Mojave plants. The consideration paid was $6
million. Additionally, we have internalized part of the operation and maintenance activities contracted in two wind assets, maintaining a direct relationship with the supplier for the turbine maintenance services.
On October 22, 2019, we closed the acquisition of ATN Expansion 2, as previously announced, for a total equity investment of approximately $20 million. The off-taker is Enel Green Power Peru.
Transfer of the concession agreement is pending authorization from the Ministry of Energy in Peru. If this authorization were not to be obtained within an eight-month period, the transaction would be reversed with no penalties to Atlantica.
Our largest shareholder Algonquin
On November 1, 2017, Algonquin announced that it had reached an agreement with Abengoa to acquire 25.0% of our shares from Abengoa, which closed in March 2018. On November 27, 2018, Algonquin
acquired the remaining 16.5% of our shares held by Abengoa, bringing its total equity interest in Atlantica up to 41.5%.
On May 9, 2019, Algonquin, AAGES and Atlantica entered into the Enhanced Cooperation Agreement, and Algonquin and Atlantica entered into a subscription agreement pursuant to which, among other
things, Atlantica agreed to permit Algonquin to acquire, and Algonquin agreed to purchase, a 1.4% stake in Atlantica. Algonquin completed this on May 22, 2019. On May 31, 2019, AAGES (AY Holdings) B.V. entered into an accelerated share purchase
transaction with Morgan Stanley & Co. LLC, pursuant to which AAGES acquired 2,000,000 ordinary shares, bringing its total equity interest in Atlantica up to 44.2%. Under this agreement, we agreed with Algonquin to analyze jointly during the
next six months Algonquin’s contracted assets portfolio in the U.S. and Canada to identify assets where a drop down could add value for both parties, according to each company’s key metrics. This process is taking longer than initially expected
and we cannot guarantee that it will result in investments. Furthermore, the Shareholders Agreement has been amended to allow Algonquin to increase its shareholding in Atlantica up to a 48.5% without any change in corporate governance.
Algonquin’s voting rights and rights to appoint directors are limited to a 41.5% and the difference between Algonquin’s ownership and 41.5% will vote replicating non-Algonquin’s shareholders vote.
In 2017, we also signed a ROFO agreement with AAGES, the joint venture created between Algonquin and Abengoa to invest in the development and construction of clean energy and water
infrastructure contracted assets. The AAGES ROFO Agreement provides us with a right of first offer on any proposed sale, transfer or other disposition of AAGES ROFO Assets. See “Item 7.B—Related Party Transactions.”
Overview
We are a sustainable infrastructure company that owns and manages renewable energy, efficient natural gas, transmission and transportation infrastructures and water assets. We currently have
operating facilities in North America (United States, Canada and Mexico), South America (Peru, Chile and Uruguay) and EMEA (Spain, Algeria and South Africa). We intend to expand our portfolio, maintaining North America, South America and Europe
as our core geographies.
As of the date of this annual report, we own or have an interest in a portfolio of high-quality and diversified assets in terms of type of asset, technology and geographic footprint. Our
portfolio consists of 25 assets with 1,496 MW of aggregate renewable energy installed generation capacity, 343 MW of efficient natural gas-fired power generation capacity, 10.5 M ft3 per day of water desalination and 1,166 miles of electric transmission lines.
All of our assets have contracted revenue (regulated revenue in the case of our Spanish assets and one transmission line in Chile) and are underpinned by long-term contracts. As of December 31,
2019, our assets had a weighted average remaining contract life of approximately 18 years. Most of the assets we own or in which we have an interest have project-finance agreements in place.
We intend to take advantage of, and leverage our growth strategy on, favorable trends in the clean power generation, transmission and transportation infrastructures and water sectors globally,
including energy scarcity and the focus on the reduction of carbon emissions. Our portfolio of operating assets and our strategy focus on sustainable technology including renewable energy, efficient natural gas, water infrastructure, and
transmission networks as enablers of a sustainable power generation mix. Renewable energy is expected to represent in most markets the majority of new investments in the power sector in most markets, according to Bloomberg New Energy Finance
2019. Approximately 50% of the world’s power generation by 2050 is expected to come from renewable sources, which indicates that renewable energy is becoming mainstream. Global installed capacity is expected to shift from 57% fossil fuels today
to approximately two-thirds renewables by 2050. A 12-terawatt expansion of generating capacity is estimated to require approximately $13.3 trillion of new investment between now and 2050 – of which approximately 77% is expected to go to
renewables. Another approximately $843 billion of investment goes to batteries along with an estimated $11.4 trillion to expected to go to transmission and distribution during that period. We believe regions will need to complement investments in
renewable energy with investments in efficient natural gas, in transmission networks and in storage. We believe that we are well positioned to benefit from the expected transition towards a more sustainable power generation mix. In addition, we
believe that water is going to be the next frontier in a transition towards a more sustainable world. New sources of water are needed worldwide and water desalination and water transportation infrastructure should help make that possible. We
currently participate in two water desalination plants with a 10 million cubic feet capacity and we have reached an agreement to acquire a third.
We are focused on high-quality and long-life facilities as well as long-term agreements that we expect will produce stable, long-term cash flows. We intend to grow our cash available for
distribution and our dividend to shareholders through organic growth and by acquiring new assets and/or businesses where revenues may not be fully contracted.
We believe we can achieve organic growth through the optimization of the existing portfolio, price escalation factors in many of our assets and the expansion of current assets, particularly our
transmission lines, to which new assets can be connected. We currently own three transmission lines in Peru and four in Chile. We believe that current regulations in Peru and Chile provide a growth opportunity by expanding transmission lines to
connect new clients. Additionally, we should have repowering opportunities in certain existing generation assets.
Additionally, we expect to acquire assets from third parties leveraging the local presence and network we have in geographies and sectors in which we operate. We
have also entered into and intend to enter into agreements or partnerships with developers or asset owners to acquire assets in operation, construction or development. We may also invest directly or through investment vehicles with partners in
assets under development or construction, ensuring that such investments are always a small part of our total investments.
In addition, we have in place exclusive agreements with AAGES and Algonquin. The AAGES ROFO Agreement provides us with a right of first offer on any proposed sale, transfer or other disposition
of certain of AAGES’s assets. The Algonquin ROFO Agreement provides us a right of first offer on any proposed sale, transfer or other disposition of any of Algonquin’s contracted facilities or with infrastructure facilities located outside of the
United States or Canada which are developed under expected long-term revenue agreements or concession agreements. See “Item 4.B—Business Overview—Our Business Strategy” and “Item 7.B—Related Party Transactions—Abengoa Right of First Offer.”
With this business model, our objective is to pay a consistent and growing cash dividend to shareholders that is sustainable on a long-term basis. We expect to distribute a significant
percentage of our cash available for distribution as cash dividends and we will seek to increase such cash dividends over time through organic growth and through the acquisition of assets. Pursuant to our cash dividend policy, we intend to pay a
cash dividend each quarter to holders of our shares.
Current Operations
Our portfolio consists of 15 renewable energy assets, a natural gas-fired cogeneration facility, a minority stake in a 142 MW gas-fired engine facility including, several electric transmission
lines and minority stakes in two water desalination plants, all of which are fully operational. We expect that the majority of our cash available for distribution over the next three years will be in U.S. dollars, indexed to the U.S. dollar or in
euros. We intend to maintain a ratio of over 80% of our cash available for distribution denominated in U.S. dollars or euros and to hedge the euros for the upcoming 24 months on a rolling basis strategy. As of
December 31, 2019, approximately 92% of our project-level debt was hedged against changes in interest rates through an underlying fixed rate on the debt instrument or through interest rate swaps, caps or similar hedging instruments.
The following table provides an overview of our current assets:
|
Assets
|
Type
|
Ownership
|
Location
|
Currency(1)
|
Capacity
(Gross)
|
off-taker
|
Counterparty
Credit
Rating(2)
|
COD
|
Contract
Years
Left(3)
|
|||||||||
|
Solana
|
Renewable (Solar)
|
100% Class B(4)
|
Arizona (USA)
|
USD
|
280 MW
|
APS
|
A-/A2/A-
|
2013
|
24
|
|||||||||
|
Mojave
|
Renewable (Solar)
|
100%
|
California (USA)
|
USD
|
280 MW
|
PG&E
|
D/WR/WD
|
2014
|
20
|
|||||||||
|
Solaben 2/3(5)
|
Renewable (Solar)
|
70%(6)
|
Spain
|
EUR
|
2x50 MW
|
Wholesale market/Spanish Electric System
|
A/Baa1/A-
|
2012
|
18 / 17
|
|||||||||
|
Solacor 1/2(7)
|
Renewable (Solar)
|
87%(8)
|
Spain
|
EUR
|
2x50 MW
|
Wholesale market/Spanish Electric System
|
A /Baa1/A-
|
2012
|
17 / 17
|
|||||||||
|
PS10/20(9)
|
Renewable (Solar)
|
100%
|
Spain
|
EUR
|
31 MW
|
Wholesale market/Spanish Electric System
|
A /Baa1/A-
|
2007 & 2009
|
12 / 14
|
|||||||||
|
Helioenergy 1/2(10)
|
Renewable (Solar)
|
100%
|
Spain
|
EUR
|
2x50 MW
|
Wholesale market/Spanish Electric System
|
A /Baa1/A-
|
2011
|
17 / 17
|
|||||||||
|
Helios ½(11)
|
Renewable (Solar)
|
100%
|
Spain
|
EUR
|
2x50 MW
|
Wholesale market/Spanish Electric System
|
A /Baa1/A-
|
2012
|
18 / 18
|
|||||||||
|
Solnova 1/3/4(12)
|
Renewable (Solar)
|
100%
|
Spain
|
EUR
|
3x50 MW
|
Wholesale market/Spanish Electric System
|
A /Baa1/A-
|
2010
|
15 / 15 / 16
|
|||||||||
|
Solaben 1/6(13)
|
Renewable (Solar)
|
100%
|
Spain
|
EUR
|
2x50 MW
|
Wholesale market/Spanish Electric System
|
A /Baa1/A-
|
2013
|
19 / 19
|
|||||||||
|
Seville PV
|
Renewable (Solar)
|
80%(14)
|
Spain
|
EUR
|
1 MW
|
Wholesale market/Spanish Electric System
|
A /Baa1/A-
|
2006
|
16
|
|||||||||
|
Kaxu
|
Renewable (Solar)
|
51%(15)
|
South Africa
|
ZAR
|
100 MW
|
Eskom
|
BB/Baa3/
BB+(16)
|
2015
|
15
|
|||||||||
|
Palmatir
|
Renewable (Wind)
|
100%
|
Uruguay
|
USD
|
50 MW
|
Uruguay
|
BBB/Baa2/
BBB-(17)
|
2014
|
14
|
|||||||||
|
Cadonal
|
Renewable (Wind)
|
100%
|
Uruguay
|
USD
|
50 MW
|
Uruguay
|
BBB/Baa2/
BBB-(17)
|
2014
|
15
|
|||||||||
|
Melowind
|
Renewable
(Wind)
|
100%
|
Uruguay
|
USD
|
50 MW
|
Uruguay
|
BBB/Baa2/
BBB-(17)
|
2015
|
16
|
|||||||||
|
Mini-hydro Peru
|
Renewable (Hydro)
|
100%
|
Peru
|
USD
|
4 MW
|
Peru
|
BBB+/A3/ BBB+
|
2012
|
13
|
|||||||||
|
ACT
|
Efficient
Natural
Gas
|
99.99%(18)
|
Mexico
|
USD
|
300 MW
|
Pemex
|
BBB+/ Baa3/
BB+
|
2013
|
13
|
|||||||||
|
Monterrey
|
Efficient Natural Gas
|
30%
|
Mexico
|
USD
|
142 MW
|
Industrial Customers
|
Not rated
|
2018
|
19
|
|||||||||
|
ATN
|
Transmission
Line
|
100%
|
Peru
|
USD
|
379 miles
|
Peru
|
BBB+/A3/
BBB+
|
2011
|
21
|
|||||||||
|
ATS
|
Transmission
Line
|
100%
|
Peru
|
USD
|
569 miles
|
Peru
|
BBB+/A3/
BBB+
|
2014
|
24
|
|||||||||
|
ATN2
|
Transmission
Line
|
100%
|
Peru
|
USD
|
81 miles
|
Minera
Las
Bambas
|
Not rated
|
2015
|
13
|
|||||||||
|
Quadra 1/2
|
Transmission
Line
|
100%
|
Chile
|
USD
|
49
miles/32
miles
|
Sierra
Gorda
|
Not rated
|
2014
|
15 / 15
|
|||||||||
|
Palmucho
|
Transmission
Line
|
100%
|
Chile
|
USD
|
6 miles
|
Enel
Generacion
Chile
|
BBB+/Baa2/
BBB+
|
2007
|
18
|
|||||||||
|
Chile TL3
|
Transmission
Line
|
100%
|
Chile
|
USD
|
50 miles
|
CNE (National Energy Commision)
|
A+/A1/A
|
1993
|
Regulated
|
|||||||||
|
Honaine
|
Water
|
25.5%(19)
|
Algeria
|
USD
|
7 M
ft3/day
|
Sonatrach/ADE
|
Not rated
|
2012
|
18
|
|||||||||
|
Water
|
34.2%(20)
|
Algeria
|
USD
|
3.5 M
ft3/day
|
Sonatrach/ADE
|
Not rated
|
2009
|
14
|
Notes:
| (1) |
Certain contracts denominated in U.S. dollars are payable in local currency.
|
| (2) |
Reflects the counterparty’s issuer credit ratings issued by Standard & Poor’s Ratings Services, or S&P, Moody’s Investors Service Inc., or Moody’s, and Fitch Ratings Ltd, or Fitch.
|
| (3) |
Number of years remaining on contract as at December 31, 2018.
|
| (4) |
On September 30, 2013, Liberty agreed to invest $300 million in Class A shares of Arizona Solar Holding, the holding company of Solana, in exchange for a share of the dividends and the taxable loss
generated by Solana.
|
| (5) |
Solaben 2 and Solaben 3 are separate special purpose vehicles with separate agreements, but they are treated as a single platform.
|
| (6) |
Itochu Corporation, a Japanese trading company, holds 30.0% of the shares in each of Solaben 2 and Solaben 3.
|
| (7) |
Solacor 1 and Solacor 2 are separate special purpose vehicles with separate agreements but they are treated as a single platform.
|
| (8) |
JGC Corporation, a Japanese engineering company, holds 13.0% of the shares in each of Solacor 1 and Solacor 2.
|
| (9) |
PS10 and PS20 are separate special purpose vehicles with separate agreements but they are treated as a single platform.
|
| (10) |
Helioenergy 1 and Helioenergy 2 are separate special purpose vehicles with separate agreements but they are treated as a single platform.
|
| (11) |
Helios 1 and Helios 2 are separate special purpose vehicles with separate agreements but they are treated as a single platform.
|
| (12) |
Solnova 1, Solnova 3 and Solnova 4 are separate special purpose vehicles with separate agreements but they are treated as a single platform.
|
| (13) |
Solaben 1 and Solaben 6 are separate special purpose vehicles with separate agreements, but they are treated as a single platform.
|
| (14) |
Instituto para la Diversificacion y Ahorro de la Energia, or IDEA, a Spanish state-owned company, holds 20.0% of the shares in Seville PV.
|
| (15) |
Industrial Development Corporation of South Africa owns 29.0% and Kaxu Community Trust owns 20.0% of Kaxu.
|
| (16) |
Refers to the credit rating of the Republic of South Africa.
|
| (17) |
Refers to the credit rating of Uruguay, as UTE is unrated.
|
| (18) |
1 share is owned by Abengoa México, S.A. de C.V. and 1 share is owned by Abener Energía, S.A., both wholly owned by Abengoa.
|
| (19) |
Algerian Energy Company, SPA owns 49.0% of the shares in Honaine and Sacyr Agua, S.L. and a subsidiary of Sacyr S.A. owns the remaining 25.5%.
|
| (20) |
Algerian Energy Company, SPA owns 49.0% of the shares in Honaine and Sacyt Agua, S.L., and a subsidiary of Sacyr S.A. owns the remaining 25.5%.
|
Our assets and operations are organized into the following four business sectors:
Renewable Energy
Our renewable energy assets include two solar power plants in the United States, Solana and Mojave, each with a gross capacity of 280 MW and located in Arizona and California, respectively.
Solana is a party to a PPA with Arizona Public Service Company and Mojave is a party to a PPA with PG&E. PG&E filed for reorganization under Chapter 11 of the Bankruptcy Code in the U.S., which has caused a default under the PPA agreement
with Mojave, which could have a material adverse effect on our business, financial condition, results of operations and cash flow. See “Item 3.D—Risk Factors—Counterparties to our off-take agreements may not fulfill their obligations and, as our
contracts expire, we may not be able to replace them with agreements on similar terms in light of increasing competition in the markets in which we operate.”
Additionally, we own or have an interest in the following solar power plants in Spain with a total gross capacity of 682 MW: (i) Solaben 2/3, a 100 MW solar power complex; (ii) Solacor 1/2, a
100 MW solar power complex; (iii) PS10/20, a 31 MW solar power complex; (iv) Helioenergy 1/2, a 100 MW solar power complex; (v) Helios 1/2, a 100 MW solar power complex; (vi) Solnova 1/3/4, a 150 MW solar power complex; (vii) 74.99% of the shares
and a 30-year usufruct of the economic rights of the remaining 25.01% of the shares of Solaben 1/6, a 100 MW solar power complex in Spain, which usufruct does not expire until September 2045; and (viii) an 80% stake in Seville PV, a 1 MW solar
photovoltaic plant. All such projects receive market and regulated revenues under the economic framework for renewable energy projects in Spain. See “Item 4.B—Business Overview—Regulations.”
We also own 51.0% of Kaxu, a 100 MW solar power plant in South Africa. Kaxu is a party to a 20-year (15 years remaining) PPA with Eskom, the state-owned utility company in South Africa.
We also own three onshore wind farms in Uruguay: Palmatir, Cadonal and Melowind, each with an installed capacity of 50 MW. Each wind farm is subject to a 20-year (14, 15 and 16 years remaining,
respectively) U.S. dollar-denominated PPA with a state-owned utility company in Uruguay.
Finally, we have an exclusive concession of a 4 MW hydroelectric power plant in Peru pursuant to a 20-year concession agreement (13 years remaining) with the Peruvian Ministry of Energy.
Efficient Natural Gas
Our efficient natural gas asset consists of ACT and Monterrey. ACT is a 300 MW cogeneration plant in Mexico which is a party to a 20-year take-or-pay agreement (13 years remaining) with the
state-owned company Petróleos Mexicanos, or Pemex, for the sale of electric power and steam. Pemex also supplies the natural gas required for the plant at no cost to ACT, which insulates the project from natural gas price fluctuations.
We also own a 30% stake in Monterrey, a 142 MW gas-fired engine facility including 130 MW installed capacity and 12 MW battery capacity. Monterrey’s acquisition was closed on August 2, 2019.
The asset, located in Mexico, has been in operation since 2018 and represents our first investment in electric batteries. It has a U.S. dollar-denominated 20-year PPA with two international large corporations engaged in the car manufacturing
industry as well as a 20-year contract for the natural gas transportation from Texas with a U.S. energy company. The PPA also includes price escalation factors. The asset is the sole electricity supplier for the off-takers, it has no commodity
risk and also has the possibility to sell excess energy to the North-East region of the country. We have also entered into a ROFO agreement with the seller of the shares for the remaining 70% stake in the asset.
Electric Transmission
Our electric transmission assets consist of (i) three lines in Peru (ATN, ATN2 and ATS), spanning a total of 1,029 miles and (ii) four lines in Chile (Quadra 1, Quadra 2, Palmucho and Chile
TL3), spanning a total of 137 miles.
ATN and ATS are subject to a U.S. dollar-denominated 30-year contract (21 and 24 years remaining, respectively) with the Peruvian Ministry of Energy. ATN2 is subject to a U.S.
dollar-denominated 18-year contract (13 years remaining) with Minera Las Bambas mining company, which is owned by a partnership consisting of subsidiaries of China Minmetals Corporation, Guoxin International Investment Co. Ltd and CITIC Metal Co.
Ltd. Quadra 1 and Quadra 2 are subject to a contract with 15 years remaining with Sierra Gorda SCM, a mining company owned by Sumitomo Corporation, Sumitomo Metal Mining and KGHM Polska Mietz. Palmucho is a six-mile electric transmission line and
substation subject to a contract with 20 years remaining with a utility, Endesa Chile. Finally, Chile TL3 is a 50-mile transmission line that has a tariff under the regulation in place in Chile, denominated in U.S. dollars and indexed to U.S. and
Chilean inflation rates.
Water
Our water assets consist of minority stakes in two desalination plants in Algeria, Honaine and Skikda, with an aggregate capacity of 10.5 M ft3 per day. Each asset has a 30-year take-or-pay
water purchase agreement (18 and 14 years remaining, respectively) with Sonatrach/Algerienne des Eaux. We also have a secured loan in Tenes, another water desalination plant in Algeria, to be reimbursed by Befesa Agua Tenes, together with 12% per
annum interest, through a full cash-sweep of all the dividends generated to be received from the asset.
Our Business Strategy
Our primary business strategy is to generate stable cash flows through our portfolio of assets under long term contracts or under regulation. We intend to distribute
a stable cash dividend to our shareholders. Our objective is to increase the dividend, while ensuring the ongoing stability and sustainability of our business.
We will seek to grow our cash available for distribution and our dividend to shareholders through organic growth and by acquiring new assets. We believe that our diversification by business
sector and geography provides us with access to different sources of growth. We expect to deliver organic growth through the optimization of the existing portfolio and through investments in the expansion of our current assets, particularly in
our transmission lines sector. In addition, we expect to acquire assets from AAGES. We expect to complement this with acquisitions from third parties and potential new future partnerships. We intend to grow our business in the segments where we
are already present, maintaining renewable energy as our main segment and with a focus in North and South America.
Our plan for executing this strategy includes the following key components:
Focus on stable, long-term contracted or regulated assets in the power and water sectors, including renewable energy,
efficient natural gas generation and transmission and transportation infrastructures, as well as water sectors
We intend to focus on owning and operating stable, long-term contracted sustainable infrastructures, for which we believe we possess extensive experience and proven systems and management
processes, as well as the critical mass to benefit from operating efficiencies and scale. We expect that this will allow us to maximize value and cash flow generation. We intend to maintain a diversified portfolio in the future, maintaining a
large majority of our revenues from low-carbon footprint assets, as we believe these technologies will undergo significant growth in our targeted geographies.
Maintain geographic diversification across three principal geographic areas
Our focus on three core geographies, North America, South America and Europe, helps to ensure exposure to markets in which we believe the renewable energy, efficient natural gas and
transmission and transportation sectors will continue growing significantly.
Increase cash available for distribution through the optimization of the existing portfolio and through the investments in the expansion of our current
assets, particularly in our transmission lines, to which new assets can be connected.
We intend to grow our cash available for distribution to shareholders through organic growth that we expect to deliver through the optimization of the existing portfolio, price escalation
factors in many of our assets as well as through investments in the expansion of our current assets, particularly in our transmission lines sector. We intend to increase production in our assets through further management and optimization
initiatives and in some cases through repowering.
We currently own three transmission lines in Peru and four in Chile. Current regulations in Peru and Chile provide a growth opportunity by expanding transmission lines to connect new clients.
We have identified several opportunities to grow organically in Peru and Chile by expanding our current assets. These opportunities consist of (i) new clients that need to use our current
assets, in situations where virtually no investments are required from us, while we will get additional revenues from these new business opportunities and (ii) expansion of current transmission lines to grant access to new clients. In this case,
certain investments are required to build new assets that connect the new clients to our current backbone transmission lines. We would expect that in some cases these new assets would become part of our concession assets contract with the State,
for which we would be remunerated.
Increase cash available for distribution through the acquisition of new sustainable infrastructure, including renewable energy, efficient natural gas and
transmission and transportation infrastructures, as well as water assets
We will seek to grow our cash available for distribution to shareholders by acquiring new assets, typically contracted or regulated. We have an exclusive ROFO agreement with AAGES and
Algonquin. We further have and expect to execute similar agreements with other developers or asset owners or enter into partnerships with such developers or asset owners in order to acquire assets in operation or to invest directly or through
investment vehicles in assets under development or construction, ensuring that such investments are always a small part of our total investments. Finally, we expect to acquire assets from third parties leveraging the local presence and network we
have in the geographies and sectors where we operate. We believe that our know-how and operating expertise in our key markets together with a critical mass of assets in several geographic areas and the access to capital provided by being a listed
company will assist us in realizing our growth plans.
Foster a low-risk approach
We intend to maintain a portfolio of contracted assets with a low-risk profile for all or part of our revenues by engaging with creditworthy off-take counterparties and entering into long-term
contracted revenue agreements. Over 80% of cash available for distribution is in U.S. dollars or euros, and we hedge euros for the upcoming 24 months on a rolling basis. We further mitigate the risk of our investments by pursuing proven
technologies in which we have significant experience, located in countries where we believe conditions to be stable and safe.
In certain situations, we could invest, or co-invest with partners, in assets before they enter into operation, in assets with shorter or partially contracted revenue period, or subject to
regulation, or in assets with revenue in currencies other than U.S. dollar or euro.
Additionally, our policies and management systems include thorough risk analysis and risk management processes that we apply whenever we acquire an asset, and which we are obligated to review
monthly throughout the life of the asset. Our policy is to insure all of our assets whenever economically feasible.
Maintain financial strength and flexibility
We intend to maintain a solid financial position through a combination of cash on hand and undrawn credit facilities.
Our Competitive Strengths
We believe that we are well-positioned to execute our business strategies because of the following competitive strengths:
Stable and predictable long-term cash flows with attractive tax profiles
We believe that our asset portfolio has a stable, predictable cash flow profile consisting of predominantly long-life electric power generation and electric transmission assets that generate
revenues under long-term fixed priced contracts or pursuant to regulated rates. Additionally, our facilities have minimal or no fuel risk. The off-take agreements for our assets have a weighted average remaining duration of approximately 18 years
as of December 31, 2019, providing long-term cash flow stability and visibility. For the fiscal year 2019, approximately 54% of our revenues was related to availability payments in the different business sectors in which we operate, which
includes our transmission lines, our efficient natural gas plant ACT, our water assets and approximately 70% revenues received by our Spanish solar assets. Furthermore, due to the fact that we are a U.K. resident company, we should benefit from a
more favorable treatment than would apply if we were a corporation in the United States when receiving dividends from our subsidiaries that hold our international assets because they should generally be exempt from U.K. taxation due to the U.K.’s
distribution exemption. Based on our current portfolio of assets, which includes renewable assets that benefit from an accelerated tax depreciation schedule, and current tax regulations in the jurisdictions in which we operate, we do not expect
to pay significant income tax in the upcoming years in most of our geographies due to existing net operating losses, or NOLs. See “Item 3.D—Risk Factors—Risks Related to Taxation—Our future tax liability may be greater than expected if we do not
use NOLs sufficient to offset our taxable income,” “Item 3.D—Risk Factors—Risks Related to Taxation—Our ability to use U.S. NOLs to offset future income may be limited” and “Item 3.D—Risk Factors—Risks Related to Taxation—Changes in our tax
position can significantly affect our reported earnings and cash flows.” Furthermore, based on our current portfolio of assets, we believe that there is limited repatriation risk in the jurisdictions in which we operate. See “Item 3.D—Risk
Factors—Risks Related to Our Business and the Markets in Which We Operate—We have international operations and investments, including in emerging markets that could be subject to economic, social and political uncertainties.”
Highly diversified portfolio by geography and technology
The renewable energy industry has grown during the recent years and it is expected to continue growing in the next decades. According to Bloomberg New Energy Finance – 2019, approximately 50%
of the world’s power generation by 2050 is expected to come from renewable sources, which it is expected to translate into approximately $10 trillion in investments in new zero-emissions power generation assets through 2050. Global installed
capacity is expected to shift from 57% fossil fuels today to approximately two-thirds renewables by 2050. A 12-terawatt expansion of generating capacity is estimated to require approximately $13.3 trillion of new investment between now and 2050 –
of which approximately 77% is expected to go to renewables. Another approximately $843 billion of investment goes to batteries along with an estimated $11.4 trillion to expected to go to transmission and distribution during that period. The
significant increase expected in the renewable energy space over the next decades also requires significant new investments in electric transmission and distribution lines for power supply, as well as storage and natural gas generation for
dispatchability, with each becoming key elements to support wind and solar energy generation.
Against this backdrop of expected growth, we believe that our exposure to international markets will allow us to pursue greater growth opportunities and achieve higher returns than we would
have if we had a narrow geographic or technological focus. Our portfolio of assets uses technologies that we expect to benefit from these long-term trends in the electricity sector. Our renewable energy generation assets generate low or no
emissions and serve markets where we expect growth in demand in the future. Additionally, our electric transmission lines connect electricity systems to key areas in their respective markets and we expect significant electric transmission
investment in our geographies. As a result, we believe that we may be able to benefit from opportunities to repower some of our assets during the lives of our existing PPAs and, in some cases, to extend the terms of those contracts after current
PPAs expire. We expect our well-diversified portfolio of assets by technology and geography to maintain cash flow stability.
A sustainable growth strategy
We expect to acquire assets from third parties leveraging the local presence and network we have in geographies and sectors in which we operate. We have also entered into and intend to enter
into agreements or partnerships with developers or asset owners to acquire assets in operation, construction or development. We may also invest directly or through investment vehicles with partners in assets under development or construction,
ensuring that such investments are always a small part of our total investments. Additionally, Algonquin, a North American diversified generation, transmission and distribution utility company and our largest shareholder, owns a 44.2% stake in
our capital stock. In addition, Algonquin and Abengoa have created AAGES, a joint venture designed to invest in the development and construction of contracted clean energy and water infrastructure contracted assets. We have signed a ROFO
agreement with AAGES aimed at enhancing our growth opportunities by creating a new platform for the development and construction of contracted clean energy and water infrastructure assets.
Our Operations
Renewable energy
The following table presents our renewable energy assets, all of which are operational:
|
Assets
|
Type
|
Ownership
|
Location
|
Currency
|
Capacity
(Gross)
|
off-taker
|
Counterparty
Credit
Rating(1)
|
COD
|
Contract
Years
Left
|
|||||||||
|
Solana
|
Renewable (Solar)
|
100% Class B
|
Arizona (USA)
|
USD
|
280 MW
|
APS
|
A-/A2/A-
|
2013
|
24
|
|||||||||
|
Mojave
|
Renewable (Solar)
|
100%
|
California (USA)
|
USD
|
280 MW
|
PG&E
|
D/WR/WD
|
2014
|
20
|
|||||||||
|
Solaben 2/3
|
Renewable (Solar)
|
70%
|
Spain
|
EUR
|
2x50 MW
|
Wholesale market/Spanish Electric System
|
A/Baa1/A-
|
2012
|
18 / 17
|
|||||||||
|
Solacor 1/2
|
Renewable (Solar)
|
87%
|
Spain
|
EUR
|
2x50 MW
|
Wholesale market/Spanish Electric System
|
A /Baa1/A-
|
2012
|
17 / 17
|
|||||||||
|
PS10/20
|
Renewable (Solar)
|
100%
|
Spain
|
EUR
|
31 MW
|
Wholesale market/Spanish Electric System
|
A /Baa1/A-
|
2007 & 2009
|
12 / 14
|
|||||||||
|
Helioenergy 1/2
|
Renewable (Solar)
|
100%
|
Spain
|
EUR
|
2x50 MW
|
Wholesale market/Spanish Electric System
|
A /Baa1/A-
|
2011
|
17 / 17
|
|||||||||
|
Helios ½
|
Renewable (Solar)
|
100%
|
Spain
|
EUR
|
2x50 MW
|
Wholesale market/Spanish Electric System
|
A /Baa1/A-
|
2012
|
18 / 18
|
|||||||||
|
Solnova 1/3/4
|
Renewable (Solar)
|
100%
|
Spain
|
EUR
|
3x50 MW
|
Wholesale market/Spanish Electric System
|
A /Baa1/A-
|
2010
|
15 / 15 / 16
|
|||||||||
|
Solaben 1/6
|
Renewable (Solar)
|
100%
|
Spain
|
EUR
|
2x50 MW
|
Wholesale market/Spanish Electric System
|
A /Baa1/A-
|
2013
|
19 / 19
|
|||||||||
|
Seville PV
|
Renewable (Solar)
|
80%
|
Spain
|
EUR
|
1 MW
|
Wholesale market/Spanish Electric System
|
A /Baa1/A-
|
2006
|
16
|
|||||||||
|
Kaxu
|
Renewable (Solar)
|
51%
|
South Africa
|
ZAR
|
100 MW
|
Eskom
|
BB/Baa3/
BB+(2)
|
2015
|
15
|
|||||||||
|
Palmatir
|
Renewable (Wind)
|
100%
|
Uruguay
|
USD
|
50 MW
|
Uruguay
|
BBB/Baa2/
BBB-(3)
|
2014
|
14
|
|||||||||
|
Cadonal
|
Renewable (Wind)
|
100%
|
Uruguay
|
USD
|
50 MW
|
Uruguay
|
BBB/Baa2/
BBB-(3)
|
2014
|
15
|
|||||||||
|
Melowind
|
Renewable
(Wind)
|
100%
|
Uruguay
|
USD
|
50 MW
|
Uruguay
|
BBB/Baa2/
BBB-(3)
|
2015
|
16
|
|||||||||
|
Mini-hydro Peru
|
Renewable (Hydro)
|
100%
|
Peru
|
USD
|
4 MW
|
Peru
|
BBB+/A3/ BBB+
|
2012
|
13
|
Notes:—
| (1) |
Reflects counterparty’s issuer credit ratings issued by S&P, Moody’s and Fitch.
|
| (2) |
Refers to the credit rating of the Republic of South Africa.
|
| (3) |
Refers to the credit rating of Uruguay, as UTE is unrated.
|
Solana
Overview. The Solana Solar plant, or Solana, is a 250 MW net (280 MW gross) solar electric generation facility located in Maricopa County, Arizona,
approximately 70 miles southwest of Phoenix, Arizona Solar One LLC, or Arizona Solar, owns the Solana project. Solana includes a 22-mile 230kV transmission line and a molten salt thermal energy storage system. Solana reached COD on October 9,
2013.
Solana relies on a conventional parabolic trough solar power system to generate electricity. The parabolic trough technology has been used for over 25 years at the Solar Electric Generating
Systems (SEGS) facilities located in the Mojave Desert in Southern California. Our thirteen 50 MW parabolic trough facilities in Spain have also used this technology since 2010. Solana produces electricity by means of an integrated process using
solar energy to heat a synthetic petroleum-based fluid in a closed-loop system that, in turn, heats water to create steam to drive a conventional steam turbine. Solana employs a two-tank molten salt thermal energy storage system that provides an
additional six hours of solar dispatchability to increase its efficiency.
PPA. Solana has a 30-year, fixed-price PPA with Arizona Public Service Company, or APS, for at least 110% of the output of the project. The PPA provides
for the sale of electricity at a fixed base price approved by the Arizona Corporation Commission with annual increases of 1.84% per year. The PPA includes on-going performance obligations and is intended to provide Arizona Solar with consistent
and predictable monthly revenues that are sufficient to cover operating costs and debt service and to earn an equity return.
EPC Agreements. The construction of Solana was carried out by subsidiaries of Abengoa under an arm’s-length, fixed-price and date-certain EPC contract,
that was executed on December 20, 2010. Abengoa completed construction of Solana on October 9, 2013.
Arizona Solar’s EPC contract contains warranties that protect Arizona Solar against defects in design, materials and workmanship for one year after completion and under these warranties Abengoa
is required to conduct certain repairs and improvements to ensure the plant reaches its technical capacity. Solana has not yet achieved its technical capacity on a continuous basis. During the last few years and into 2020, repairs and
improvements were and will be conducted on three plant systems: the steam generator, the water plant and the storage heat exchangers. In July 2016, the solar field was damaged after a severe wind event and in 2017, we received insurance
compensation for damages and loss of revenue. In July 2017, there was an incident with electric transformers, which caused the plant to produce at a reduced capacity during July and part of August. All the necessary repairs were completed in
August and we received a significant portion of the insurance compensation in 2017. In addition, Solana experienced technical issues in the heat exchangers within its storage system. Repairs have been carried out in the past years. In 2019 we
completed the implementation of such improvements and the replacement of one of the six heat exchangers and acquired an additional one as back-up. We cannot assure that the repairs, improvements and replacements made will be effective or
sufficient.
In November 2017, in the context of the agreement reached between Abengoa and Algonquin for the initial acquisition by Algonquin of 25.0% of our shares and based on the obligations of Abengoa
under an EPC contract, the DOE signed a consent in relation to the Solana and Mojave projects which reduced the minimum ownership required by Abengoa in us from 30.0% to 16.0%. Solana received an aggregate amount of $120 million in payments from
Abengoa ($42.5 million in December 2017 and $77.5 million in March 2018). Of the received sums, $95 million was used to repay project debt and $25 million was set aside to cover other Abengoa obligations. In addition, in November 2018 in the
context of the DOE consent to allow Abengoa to sell entirely its stake in Atlantica, Solana received $16.5 million, of which $9 million was used to repay project debt and $7.5 million were set aside to cover potential repairs and other Abengoa
obligations. Additionally, the long-term payments schedule signed between Abengoa and Solana was amended to include $7.4 million payable semi-annually over 2 years and $10.3 million payable semi-annually over the subsequent 4 years, beginning in
January 2019. Solana also received a parcel of land adjacent to the Solana site accounted for at a fair value of $7.3 million and $22.2 million of cash proceeds received by Abengoa. Furthermore, Abengoa agreed to pay $13 million to fund a reserve
account progressively in 2020 and 2021. If Abengoa were not to make these payments, we would need to make them and in return we would reduce future bonus payments to Abengoa under certain operation and maintenance agreements. The aforementioned
amounts result of Abengoa’s obligations as EPC contractor.
O&M. ASI Operations, a former wholly-owned subsidiary of Abengoa, provides O&M services for Solana, focused exclusively on providing personnel.
On July 30, 2019, Atlantica signed an agreement with Abengoa to acquire ASI Operations for a price of approximately $6 million. ASI Operations, provides O&M services for Solana, focused exclusively on providing personnel. Payments to
third-party suppliers are made directly by Arizona Solar. With this acquisition, we reduced our dependence on Abengoa as an O&M supplier and expect to achieve cost reductions.
Project Level Financing. Arizona Solar executed a loan guarantee agreement with the DOE on December 20, 2010, to provide a loan guarantee in connection
with a two-tranche loan of approximately $1.445 billion from the FFB. The short-term tranche of $450 million has been repaid. The long-term tranche is payable over a 29-year term with the cash generated by the project. The principal balance of
this tranche was $779 million as of December 31, 2019.
The FFB loan permits dividend distributions on a semi-annual basis as long as the debt service coverage ratio for the previous four fiscal quarters is at least 1.20x after December 31, 2019,
and the projected debt service coverage ratio for the next four fiscal quarters is at least 1.20x. As of December 31, 2019, Solana met the minimum debt service coverage ratio, however it did not meet certain operating thresholds applicable in
2019 for distributions. The asset may or may not meet ratios or other conditions thresholds in 2020.
Partnerships. On September 30, 2013, Abengoa entered into an agreement with Liberty, pursuant to which Liberty agreed to invest $300 million for all of
the Class A membership interests of ASO Holdings Company LLC, the parent of Arizona Solar, giving Liberty the right to receive 61.20% of ASO Holdings Company LLC’s taxable losses and distributions until such time as Liberty reaches a certain rate
of return, or the Flip Date. Given that Solana has not performed as expected, Liberty will require additional distributions in order to reach the agreed rate of return. The distributions in the upcoming years will depend on the performance of
Solana and we expect them to go mostly or entirely to Liberty. After the Flip Date, Liberty will be entitled to receive 22.60% of taxable losses and distributions. In 2017, we agreed with Liberty to increase their information rights and their
participation in decisions with respect to Arizona Solar. All figures in this annual report take into account Liberty’s share of dividends. We indirectly own 100% of the Class B membership interests in ASO Holdings Company LLC. In addition, we
signed an option to acquire, until April 30, 2020, Liberty’s equity interest in Solana for approximately $300 million. According to the contract signed, final price includes a performance earn-out based on the average annual net production of the
asset for the four calendar years with the highest annual net production during the five calendar years of 2020 through 2024. We expect to initially finance the acquisition with available liquidity, proceeds of a bridge financing currently under
negotiation and potential project debt refinancing in Spain.
Mojave
Overview. The Mojave Solar Project, or Mojave, is a 250 MW net (280 MW gross) solar electric generation facility wholly-owned by us located in San
Bernardino County, California, approximately 100 miles northeast of Los Angeles. Mojave completed construction and reached COD on December 1, 2014. Mojave Solar LLC, or Mojave Solar, owns the Mojave project.
Mojave relies on a conventional parabolic trough solar power system to generate electricity and is similar to Solana with respect to technology and general design. The main difference between
Solana and Mojave is that Mojave does not have a molten salt storage system, as the off-taker did not require one.
PPA. Mojave has a 25-year, fixed-price PPA with Pacific Gas & Electric Company, or PG&E, for 100% of the output of Mojave. The PPA began on COD.
The PPA provides for the sale of electricity at a fixed base price with seasonal adjustments and adjustments for time of delivery. Mojave Solar can deliver and receive payment for at least 110% of contracted capacity under the PPA.
On January 29, 2019, PG&E, the off-taker for Atlantica Yield with respect to the Mojave plant, filed for reorganization under Chapter 11 of the Bankruptcy Code in the U.S. Bankruptcy Court
for the Northern District of California. See “Item 3.D—Risk Factors— Counterparties to our off-take agreements may not fulfill their obligations and, as our contracts expire, we may not be able to replace them with agreements on similar terms in
light of increasing competition in the markets in which we operate.”
O&M. ASI Operations, a former wholly-owned subsidiary of Abengoa, used to provide O&M services for Solana, focused exclusively on providing
personnel. On July 30, 2019, Atlantica signed an agreement with Abengoa to acquire ASI Operations, the company that performs the operation and maintenance services for our U.S. solar assets, for a price of approximately $6 million. ASI
Operations, provides O&M services for Solana, focused exclusively on providing personnel. Payments to third-party suppliers are made directly by Arizona Solar. With this acquisition, we reduced our dependence on Abengoa as an O&M supplier
and expect to achieve cost reductions.
Project Level Financing. Mojave Solar executed a loan guarantee agreement with the DOE on September 12, 2011, to provide a loan guarantee in connection
with a two-tranche FFB loan of approximately $1,202 million. The short-term tranche has been repaid. The long-term tranche is payable over a 25-year term with the cash generated by the project. The principal balance of this tranche was $698
million as of December 31, 2019. The FFB loan has an average fixed interest rate of 2.75% and each disbursement is linked to the U.S. Treasury bond with the maturity of that disbursement. Since PG&E failed to assume the PPA within 180
days from the commencement of PG&E’s Chapter 11 proceeding, a technical event of default was triggered under our Mojave project finance agreement in July 2019. However, PG&E has continued to be in compliance with the remaining terms and
conditions of the PPA, including with all payment terms of the PPA up through the date hereof with the exception of services for prepetition services that became due and payable after the chapter 11 filing. See “Item 3.D—Risk Factors—
Counterparties to our off-take agreements may not fulfill their obligations and, as our contracts expire, we may not be able to replace them with agreements on similar terms in light of increasing competition in the markets in which we operate.”
The financing arrangement permits dividend distributions on a semi-annual basis after the first principal repayment of the long-term tranche, as long as the debt service coverage ratio for the
previous four fiscal quarters is at least 1.20x and the projected debt service coverage ratio for the next four fiscal quarters is at least 1.20x. As a result of the PG&E Chapter 11, a technical event of default was triggered under our Mojave
project finance agreement in July 2019 and the asset was not able to make distributions in 2019. Until the technical event of default is cured or waived, distributions may not be made during the pendency of the bankruptcy.
Solaben 2/3
Overview. The Solaben 2 and Solaben 3 projects are two 50 MW solar power plants located in the municipality of Logrosan, Spain. Solaben 2 reached COD in
2012 and Solaben 3 reached COD in 2012. Solaben 2/3 each rely on a conventional parabolic trough solar power system to generate electricity. The technology is similar to the technology used in other solar power plants that we own in the United
States and in other locations in Spain. Solaben 2/3 benefits from the tax accelerated depreciation regime established by the Spanish Corporate Income Tax Act.
Regulation. Renewable energy projects in Spain sell the power they produce into the wholesale electricity market and receive additional payments from
the Comision Nacional de los Mercados y de la Competencia, or CNMC, the Spanish state-owned regulator.
Solar power plants receive, in addition to the revenues from the sale of electricity in the market, two monthly payments. These payments consist of: (i) a fixed monthly payment based on
installed capacity, and (ii) a variable payment based on net electricity produced. There is a maximum number of production hours per year beyond which no variable payment is received. The regulation also includes a minimum number of yearly hours
of generation, under which the plant would receive no regulated payments for that year and another higher threshold below which regulated payments would be reduced for a certain year. Those numbers are 35.0% and 60.0% of the maximum yearly hours,
respectively. We expect that a plant would fail to achieve these thresholds only in cases of major breakdowns. See “—Regulation—Regulation in Spain.”
Spain has senior unsecured credit ratings of A from S&P, Baa1 from Moody’s and A- from Fitch.
O&M. ASE, an Abengoa’s subsidiary, is the contractor for O&M services at Solaben 2/3. ASE has agreed to operate the facility in accordance with
prudent industry practices, ensure compliance with all applicable government and agency permits, licenses and approvals, and feed-in tariff terms, and to assist Solaben 2/3 in connection with the procurement of all necessary support and ancillary
services. Each O&M agreement is an all-in contract that we could terminate every third year starting in December 2015.
Project Level Financing. On December 16, 2010, Solaben 2 and Solaben 3 each entered into a 20-year loan agreement with a syndicate of banks formed by
the MUFG, Mizuho, HSBC and Sumitomo Mitsui Banking Corporation. The loan for Solaben 2 was for €169.3 million and the loan for Solaben 3 was for €171.5 million. The banks providing these loans obtained commercial and political risk insurance from
Nippon Export and Investment Insurance, which allowed for lower financing costs. The interest rate for each loan is a floating rate based on six-month EURIBOR plus a margin of 1.5%. We initially hedged 80% of our EURIBOR exposure with the same
banks providing the financing. The hedge was structured 50% through a swap set at approximately 3.7% and 50% through a cap with a 3.75% strike. In November 2013, Solaben 2/3 hedged the remaining 20% exposure through a cap with a 0.75% strike
through 2017. Furthermore, in 2017, we contracted additional caps with a 1% strike covering 19.1% of the principal of Solaben 2 and 20% of the principal of Solaben 3. Both caps hedge the interest rate from the middle of 2017 through 2025.
The outstanding amount of these loans as of December 31, 2019 was €121 million for Solaben 2 and €124 million for Solaben 3.
The financing arrangements permit cash distribution to shareholders twice per year if the debt service coverage ratio is at least 1.10x.
Partnerships. Itochu Corporation, a Japanese trading company, holds a 30% stake in the economic rights of each of Solaben 2 and Solaben 3.
Solacor 1/2
Overview. The Solacor 1/2 project is a 100 MW solar power complex located in the municipality of El Carpio, Spain. COD was reached in February 2012 for
Solacor 1 and in March 2012 for Solacor 2. Solacor 1/2 relies on a conventional parabolic trough solar power system to generate electricity. The technology is similar to the technology used in other solar power plants that we own in other
locations in Spain. Solacor 1/2 benefits from the tax accelerated depreciation regime established by the Spanish Corporate Income Tax Act.
Regulation. Renewable energy projects in Spain sell the power they produce into the wholesale electricity market and receive additional payments from
CNMC. See Solaben 2/3 above and “—Regulation—Regulation in Spain.”
Spain has senior unsecured credit ratings of A from S&P, Baa1 from Moody’s and A- from Fitch.
O&M. ASE is the contractor for O&M services at Solacor 1/2. ASE has agreed to operate the facility in accordance with prudent utility practices,
ensure compliance with all applicable government and agency permits, licenses and approvals, and feed-in tariff terms, and to assist Solacor 1/2 in connection with the procurement of all necessary support and ancillary services. Each O&M
agreement is an all-in contract that we could terminate every third year starting in December 2015.
Project Level Financing. On August 6, 2010, Solacor 1/2 entered into 20-year loan agreements with a syndicate of banks formed by BNP Paribas, Mizuho,
HSBC and SMBC. The loans for Solacor 1/2 totaled €353 million. The banks providing these loans obtained commercial and political risk insurance from Nippon Export and Investment Insurance, which allowed for lower financing costs. The interest
rate for the loans is a floating rate based on six-month EURIBOR plus a margin of 1.5%. We initially hedged 82% of our EURIBOR exposure on with the same banks providing the financing. The hedge was structured 54% through a swap set at
approximately 3.20% and 28% through a cap with a 3.25% strike. Furthermore, in 2017, we contracted additional caps with a 1% strike covering 19.3% of the principal of Solacor 1 and 18.2% of the principal of Solacor 2. Both caps hedge the interest
rate through 2025. The total outstanding amount of these loans as of December 31, 2019 was €243 million.
These financing arrangements permit cash distribution to shareholders twice per year if the debt service coverage ratio is at least 1.10x.
Partnerships. JGC Corporation, a Japanese engineering company, holds a 13% stake in the economic rights in Solacor 1/2.
PS10/20
Overview. PS10/20 is a 31 MW solar power complex wholly owned by us located in the municipality of Sanlucar la Mayor, Spain. PS10 reached COD in March
2007 and PS20 reached COD in May 2009.
Regulation. Renewable energy projects in Spain sell the power they produce into the wholesale electricity market and receive additional payments from
CNMC. See Solaben 2/3 above and “Regulation—Regulation in Spain.”
Spain has senior unsecured credit ratings of A from S&P, Baa1 from Moody’s and A- from Fitch.
O&M. ASE is the contractor for O&M services at PS10/20. ASE has agreed to operate the facility in accordance with prudent utility practices,
ensure compliance with all applicable government and agency permits, licenses and approvals, and feed-in tariff terms, and to assist PS10/20 in connection with the procurement of all necessary support and ancillary services. Each O&M
agreement is a 21-year all-in contract that expires on the 21st anniversary of COD.
Project Level Financing. On November 17, 2006, PS10 entered into a 21.5-year loan agreement with a syndicate of banks formed by Bankia and Natixis. On
June 14, 2007, the loan agreement entered into a novation in order to include in the syndicate of banks the European Investment Bank and Caja de Ahorros del Mediterraneo, which was later acquired by Banco Sabadell, S.A. The loan was for €43.4
million. The interest rate for the loan is a floating rate based on six-month EURIBOR plus a margin of 1.0% to 1.10% (depending on the level of the debt service coverage ratio). We hedged 100% of our EURIBOR exposure with the same banks providing
the financing. The hedge was structured 30% through a swap set at approximately 4.07% and 70% through a cap with a 4.25% strike. Furthermore, in 2017, we contracted an additional cap with a 1% strike covering 35.0% of the principal of PS10
through 2025. The outstanding amount of this loan as of December 31, 2019 was €23 million.
PS20 entered into a 24.5-year loan agreement with a syndicate of banks formed by Bankia and Natixis Banques Populaires, Spanish Branch on November 17, 2006. On June 14, 2007, the loan agreement
was entered into a novation in order to include in the syndicate of banks the European Investment Bank and Caja de Ahorros del Mediterraneo, which was later acquired by Banco Sabadell, S.A. The loan was for €94.6 million. The interest rate for
the loan is a floating rate based on six-month EURIBOR plus a margin of 1.0% to 1.10% (depending on the level of the debt service coverage ratio). We initially hedged 100% of our EURIBOR exposure with the same banks providing the financing. The
hedge was structured 30% through a swap set at approximately 4.07% and 70% through a cap with a 4.5% strike. Furthermore, in 2017, we contracted additional caps with a 1% strike covering 35.0% of the principal of PS20 through 2025. The
outstanding amount of this loan as of December 31, 2019 was €58 million.
These financing arrangements permit cash distribution to shareholders once per year if the debt service coverage ratio is at least 1.10x.
Helios 1/2
Overview. The Helios 1/2 project is a 100 MW solar power facility wholly owned by us located in the municipality of Arenas de San Juan, Puerto Lapice
and Villarta de San Juan, Spain. Helios 1 and Helios 2 reached COD in 2012. Helios 1/2 relies on a conventional parabolic trough concentrating solar power system to generate electricity. This technology is similar to the technology used in other
solar power plants that we own in other locations in Spain. Helios 1/2 benefits from the tax accelerated depreciation regime established by the Spanish Corporate Income Tax Act.
Regulation. Renewable energy projects in Spain sell the power they produce into the wholesale electricity market and receive additional payments from
CNMC. See Solaben 2/3 above and “—Regulation—Regulation in Spain.”
Spain has senior unsecured credit ratings of A from S&P, Baa1 from Moody’s and A- from Fitch.
O&M. ASE is the contractor for O&M services at Helios 1/2. ASE has agreed to operate the facility in accordance with prudent utility practices,
ensure compliance with all applicable government and agency permits, licenses and approvals, and feed-in tariff terms, as well as to assist Helios 1/2 in connection with the procurement of all necessary support and ancillary services. The O&M
agreement is an all-in contract that expires on the 25th anniversary of the COD.
Project Level Financing. On May 17, 2018 we refinanced Helios 1/2 as expected in our financial plan.
The new project finances are two mini-perm loan agreements for a total amount of €292 million for both projects with a syndicate of eight banks formed by Santander S.A., Caixabank S.A., Bankia
S.A., ICO, Credit Agricole Corporate, ING Bank N.V., Abanca S.A. and Bankinter S.A. The increase in notional with respect to the previous financing was used to partially cancel the swap in place and pay refinancing costs. The mini-perm structure
consists of sculpting semiannual debt service payments using an underlying tenor of 15 years but with a contractual legal maturity in 2027. We expect to refinance Helios 1/2 before 2028. The interest rate for the loans is a floating rate based on
six-month EURIBOR plus a margin of: (i) 2.25% until December 2020; (ii) 2.50% from January 2021 until December 2024; (iii) 2.75% from January 2025 until maturity.
The loans are currently 70% hedged with swaps with some of the same banks providing the financing. We have maintained part of the swaps which were previously in place. As a result, 64% of the
swap hedged portion is structured through a swap set at approximately 3.85% and 36% through a new swap contracted in 2018 set at approximately 0.89%. Furthermore, in 2017, we contracted additional caps with a 1% strike covering 11% of the
principal of both loan agreements through 2025. The outstanding amount of the loans as of December 31, 2019 was €227 million.
The financing agreements of both plants permit cash distributions to shareholders twice per year from 2019 onwards if the debt service coverage ratio is at least 1.15x.
Helioenergy 1/2
Overview. Helioenergy 1/2 is a 100 MW solar power complex wholly owned by us located in Ecija, Spain and reached COD in the second half of 2011.
Helioenergy 1/2 relies on a conventional parabolic trough concentrating solar power system to generate electricity. This technology is similar to the technology used in other solar power plants that we own in other locations in Spain. Helioenergy
1/2 benefits from the tax accelerated depreciation regime established by the Spanish Corporate Income Tax Act.
Regulation. Renewable energy projects in Spain sell the power they produce into the wholesale electricity market and receive additional payments from
CNMC. See Solaben 2/3 above and “—Regulation—Regulation in Spain.”
Spain has senior unsecured credit ratings of A from S&P, Baa1 from Moody’s and A- from Fitch.
O&M. ASE is the O&M services contractor for Helioenergy 1/2. ASE agreed to operate the facility in accordance with prudent utility practices,
ensure compliance with all applicable government and agency permits, licenses and approvals, and feed-in tariff terms, as well as to assist Helioenergy 1/2 in connection with the procurement of all necessary support and ancillary services. The
O&M agreement is an all-in contract that expires on the 20th anniversary of the COD.
Project Level Financing. On June 26, 2018 we refinanced Helioenergy 1/2 as part of our financial plan, for the same amount that was outstanding as of
the date of the refinancing. On June 26, 2018, Helioenergy 1 entered into a 15-year loan agreement of €108.9 million and Helioenergy 2 entered into a 15-year loan agreement of €109.6 million with a syndicate of banks consisting, in both
agreements, of Banco Santander, S.A., CaixaBank, S.A., Bankia, S.A., Credit Agricole Corporate and Investment Bank, S.A., Bankinter, S.A., Unicaja Banco, S.A. and ING Bank, N.V., Spanish Branch and the investment firm Rivage Investment. The
interest rate for the loans is a floating rate based on six-month EURIBOR plus a margin of 2.25% until December 2025 and 2.50% until maturity. Debt service is sculpted according to the specific characteristics of the project. In addition, each of
the two projects entered into a 17-year, fully amortizing loan agreement with an institutional investor for a €22.5 million (€45 million in total) with a fixed interest rate of 4.37%.
We have maintained the original swap which hedged the previous financing. As a result, the banking tranche is 97% hedged through a swap set at approximately 3.8% strike. In addition, we have
the remaining 3% hedged through a cap with a 1% strike. The outstanding amount of these loans as of December 31, 2019 was €221 million.
The financing arrangements permit cash distributions to shareholders semi-annually year based on a debt service coverage ratio of at least 1.15x.
Solnova 1/3/4
Overview. The Solnova 1/3/4 project is a 150 MW solar power facility wholly owned by us located in the municipality of Sanlucar la Mayor, Spain. Solnova
1 and Solnova 3 projects reached COD in the second quarter of 2010 and Solnova 4 reached COD in the third quarter of 2010. Solnova 1/3/4 relies on a conventional parabolic trough concentrating solar power system to generate electricity. This
technology is similar to the technology used in other solar power plants that we own in other locations in Spain. Solnova 1/3/4 benefits from the tax accelerated depreciation regime established by the Spanish Corporate Income Tax Act.
Regulation. Renewable energy projects in Spain sell the power they produce into the wholesale electricity market and receive additional payments from
CNMC. See Solaben 2/3 above and “—Regulation—Regulation in Spain.”
Spain has senior unsecured credit ratings of A from S&P, Baa1 from Moody’s and A- from Fitch.
O&M. ASE is the O&M services contractor for Solnova Solar Platform. ASE has agreed to operate the facility in accordance with prudent utility
practices, ensure compliance with all applicable government and agency permits, licenses and approvals, and feed-in tariff terms, as well as to assist Solnova in connection with the procurement of all necessary support and ancillary services. The
O&M agreement is a 25-year, all-in contract that expires on the 25th anniversary of COD.
Project Level Financing. On December 18, 2007, Solnova 1 entered into a 22-year loan agreement for €233.4 million with a syndicate of banks including
Societe Generale, Santander, Credit Agricole CIB, Natixis, Banco Sabadell (Sabadell and Dexia), Credit Industriel et Commercial, Kfw IPEX-Bank, IKB Deutsche Industriebank, SMBC, Caixa Bank, DEPFA Bank, Landesbank Baden-Wurttemberg and BEI. The
interest rate for the loan is a floating rate based on six-month EURIBOR plus a margin in the range of 1.15% up to 1.25%, depending on the debt services coverage ratio. We initially hedged 80% of our EURIBOR exposure with the same banks providing
the financing. The hedge was structured 100% through a swap set at approximately 4.76% strike. Furthermore, in 2017, we contracted an additional cap with a 1% strike covering 20% of the principal of Solnova 1 through 2025.
On January 15, 2008, Solnova 3 entered into a 22-year loan agreement for €227.5 million with a syndicate of banks including Societe Generale, Santander, Credit Agricole CIB, Natixis, Banco
Sabadell, Credit Industriel et Commercial, Kfw IPEX-Bank, IKB Deutsche Industriebank, SMBC, Caixa Bank, DEPFA Bank, Landesbank Baden-Wurttemberg and BEI. The interest rate for the loan is a floating rate based on six-month EURIBOR plus a margin
in the range from 1.15% up to 1.25%, depending on the debt services coverage ratio. The EURIBOR exposure was initially 80% hedged with the same banks providing the financing. The hedge is structured 30% through a swap set at approximately 4.34%
cost and 70% through a cap at approximately 4.65%. In 2017 and 2018, we partially replaced the original cap with an additional cap contracted with a 1% strike covering approximately 77% of the principal of Solnova 3 from the middle of 2017
through 2025.
On August 5, 2008, Solnova 4 entered into a 22-year loan agreement for €217.1 million with a syndicate of banks including Santander, Bankia, Credit Agricole CIB, Banco Sabadell (Sabadell y
Dexia), ING Belgium, Kfw IPEX-Bank, Landesbank Baden-Wurttemberg, Natixis, Societe Generale and UBI Banca. The interest rate for the loan is a floating rate based on six-month EURIBOR plus a margin in the range from 1.50% up to 1.60%, depending
on the debt services coverage ratio. The EURIBOR exposure was initially 83% hedged with the same banks providing the financing. The hedge was structured 100% through a swap set at approximately 4.87% strike. Furthermore, in 2017 and 2018, we
contracted additional cap hedging with a 1% strike covering 17% of the principal of Solnova 4 from the middle 2017 through 2025.
As of December 31, 2019, the outstanding amount of these loans was €450 million.
The financing arrangements of the three plants permit cash distributions to shareholders once per year if the debt service coverage ratio is at least 1.15x.
Solaben 1/6
Overview. Solaben 1/6 is a 100 MW solar power facility wholly owned by us located in the municipality of Logrosan, Spain. Solaben 1/6 reached COD in the
third quarter of 2013. Solaben 1/6 relies on a conventional parabolic trough concentrating solar power system to generate electricity. This technology is similar to the technology used in other solar power plants that we own in other locations in
Spain. Solaben 1/6 benefits from the tax accelerated depreciation regime established by the Spanish Corporate Income Tax Act.
Regulation. Renewable energy projects in Spain sell the power they produce into the wholesale electricity market and receive additional payments from
CNMC. See Solaben 2/3 above and “—Regulation—Regulation in Spain.”
Spain has senior unsecured credit ratings of A from S&P, Baa1 from Moody’s and A- from Fitch.
O&M. ASE is the O&M services contractor for Solaben 1/6. ASE has agreed to operate the facility in accordance with prudent utility practices,
ensure compliance with all applicable government and agency permits, licenses and approvals, and feed-in tariff terms, as well as to assist Solaben 1/6 in connection with the procurement of all necessary support and ancillary services. Each
O&M agreement is a 25-year, all-in contract that expires on the 25th anniversary of the COD.
Project Level Financing. On September 30, 2015, Solaben Luxembourg S.A., a holding company of the two project companies, issued a project bond for €285
million. The bonds mature in December 2034. The bonds have a coupon of 3.758% and interest are payable in semi-annual instalments on June 30 and December 31 of each year. The principal of the bonds is amortized over the life of the bonds. The
bonds permit dividend distributions semi-annually until September 30, 2019 and annually after September 30, 2019. The debt service coverage ratio must be at least 1.30x until December 31, 2018, and 1.40x after January 1, 2019.
The outstanding amount of the project bonds as of December 31, 2019 was €214 million.
Seville PV
Overview. Seville PV is a 1 MW photovoltaic farm located alongside PS 10/20 and Solnova 1/3/4, in Sanlucar La Mayor, Spain.
Regulation. Seville PV is subject to the same regulations as our other solar facilities in Spain except that it has a regulatory life of 30 years. See
“—Regulation—Regulation in Spain.” Spain has senior unsecured credit ratings of A from S&P, Baa1 from Moody’s and A- from Fitch.
O&M. Seville PV has an O&M agreement in place with Prodiel.
Project Level Financing. Seville PV does not have any project level financing.
Kaxu
Overview. Kaxu Solar One Solar, or Kaxu, is a 100 MW net solar conventional parabolic trough project with a molten salt thermal energy storage system
and is located in Pofadder, Northern Cape Province, South Africa. We, through ABY Solar South Africa (Pty) Ltd, own 51% of the Kaxu project. The project company, Kaxu Solar One (Pty) Ltd., is currently owned by: us (51%), Industrial Development
Corporation of South Africa (29%) and Kaxu Community Trust (20%). The project reached COD in January 2015.
Kaxu relies on a conventional parabolic trough solar power system to generate electricity. This technology is similar to the technology used in solar power plants that we own in Spain.
PPA. Kaxu has a 20-year PPA with Eskom, under a take–or-pay contract for the purchase of electricity up to the contracted capacity from the facility.
The PPA expires in February 2035. Eskom purchases all the output of the Kaxu plant under a fixed-price formula in South African Rand subject to indexation to local inflation.
Eskom is a state-owned, limited liability company, wholly owned by the government of the Republic of South Africa. Eskom’s payment guarantees are underwritten by the South African Department of
Energy, under the terms of an implementation agreement. Eskom’s credit ratings are currently CCC+ from S&P, B3 from Moody’s and BB- from Fitch. The Republic of South Africa’s credit ratings are currently BB from S&P, Baa3 from Moody’s and
BB+ from Fitch.
In addition, in 2019 we entered into a political risk insurance agreement with the Multinational Investment Guarantee Agency for Kaxu. The insurance provides protection for breach of contract
up to $98.6 million in the event the South African Department of Energy does not comply with its obligations as guarantor. This insurance policy does not cover credit risk.
EPC Agreement. Certain Abengoa subsidiaries carried out the construction of Kaxu under an arm’s-length, fixed-price and date-certain engineering,
procurement and construction contract. In December 2016, two water pumps failed, temporarily limiting the plant’s production until repaired. During 2017, we carried out repairs on the water pumps and the heat exchangers in the storage system. The
insurance claim for repairs and loss of production of the water pumps was collected in the second quarter of 2017.
In Kaxu, the EPC contract provided a performance guarantee of 12 consecutive and uninterrupted months within the initial 24-month period, for the benefit of the project company and the
financing parties. In Kaxu, we reached an agreement with Abengoa as EPC supplier and the lenders under the project financing agreement to extend the production guarantee until October 2018. In the extended period, Kaxu reached the main target
production parameters but not all of them, which resulted in obligations and guarantees of approximately $2 million. Kaxu’s dividend distributions to the holding company level are subject to a number of conditions, including the asset reaching
formal completion and Abengoa fulfilling the previous obligations as EPC supplier. In exchange for that extension, Abengoa agreed to perform certain technical improvements in the heat exchangers and provided an approximately $15 million letter of
credit to guarantee the correct performance of those heat exchangers in the upcoming 5 years.
O&M. Kaxu entered into an O&M agreement with Kaxu CSP O&M Company, a company owned by a subsidiary of Abengoa Solar (92%) and Kaxu Black
Employee Trust, (8%) for the operation and maintenance of the project. The O&M agreement is for a period of 20 years from COD (expiring in 2035). The operator operates the facility in accordance with prudent utility practices, to ensure
compliance with all applicable government and agency permits, licenses, approvals and PPA terms, and to assist Kaxu with the procurement of necessary support and ancillary services.
Project Level Financing. Kaxu entered into a long-term financing agreement with a lenders’ group including Nedbank and RMB, Industrial Development
Corporation of South Africa and Development Bank of Southern Africa, and the International Finance Corporation for a total approximate amount of ZAR 5,860.0 million. The loan consists of senior and subordinated long-term loans payable in South
African rand over an 18-year term with the cash generated by the project. The interest rate exposure was initially 100% hedged through a swap with the same banks providing the financing, and the coverage progressively reduces over the life of the
loan with a current effective annual interest rate of approximately 11%.
As of December 31, 2019, the outstanding amount of these loans was ZAR 5,381 million, or approximately $384 million.
The financing arrangement permits dividend distributions on a semi-annual basis after the first repayment of debt has occurred, as long as the historical and projected debt service coverage
ratios are at least 1.2x. In 2018, although Kaxu’s debt coverage reached the minimum threshold, distributions were delayed as a consequence of the planned finalization of the guarantee period in late 2018. In 2019, Kaxu made distributions after
obtaining bank approvals, since the asset has not fulfilled all bank requirements to reach financial completion, which is expected to be obtained in the upcoming months.
Palmatir
Overview. Palmatir is an on-shore wind farm facility wholly owned by us, in Uruguay with nominal installed capacity of 50 MW. Palmatir has 25 wind
turbines and each turbine has a nominal capacity of 2 MW. Palmatir reached COD in May 2014.
The wind farm is located in Tacuarembo, 170 miles north of the city of Montevideo. Gamesa, a global leader in the manufacture and maintenance of wind turbines, supplied the turbines through its
U.S. subsidiary.
PPA. Palmatir signed a PPA with UTE on September 14, 2011 for 100% of the electricity produced. UTE pays a fixed tariff under the PPA, which is
denominated in U.S. dollars and will be partially adjusted in January of each year based on a formula referring to U.S. CPI, the Uruguay’s Indice de Precios al Productor de Productos Nacionales and the applicable UYU/U.S. dollars exchange rate.
UTE is unrated, and Uruguay has senior unsecured credit ratings of BBB from S&P, Baa2 from Moody’s and BBB- from Fitch.
O&M. In the second half of 2019, we internalized the operation activities of Palmatir, previously provided by Operacion y Mantenimiento Uruguay S.A.
(formerly Omega), a subsidiary of Abengoa. We have a turbine O&M agreement with Siemens Gamesa that covers scheduled and unscheduled turbine maintenance, a supply of spare parts, wind farm monitoring and reporting services.
Project Level Financing. On April 11, 2013, Palmatir entered into a financing agreement for a 20-year loan in two tranches in connection with the
project. The first tranche is a $73 million loan from the U.S. Export Import Bank with a fixed interest rate of 3.11%. The second tranche is a $40 million loan from the Inter-American Development Bank with a floating interest rate of six-month
U.S. LIBOR plus 4.125%. The U.S. LIBOR exposure was 80% hedged with a swap at a rate of 2.22% with the financing bank. The combined principal balance of both tranches as of December 31, 2019 was $87 million.
Cash distributions are permissible annually subject to a historical debt service coverage ratio for the previous twelve-month period of at least 1.25x and a projected debt service coverage
ratio of at least 1.30x for the following twelve-month period
Cadonal
Overview. Cadonal is an on-shore wind farm facility wholly owned by us, located in Uruguay with nominal installed capacity of 50 MW. Cadonal has 25 wind
turbines of 2 MW each. Cadonal reached COD in December 2014.
The wind farm is located in Flores, 105 miles north of the city of Montevideo. Gamesa supplied the turbines.
PPA. Cadonal signed a PPA with UTE on December 28, 2012, for 100% of the electricity produced. UTE pays a fixed tariff under the PPA, which is
denominated in U.S. dollars and is partially adjusted every January based on a formula referring to U.S. CPI, the Uruguay’s Indice de Precios al Productor de Productos Nacionales and the applicable UYU/U.S. dollars exchange rate.
UTE is unrated, and Uruguay has senior unsecured credit ratings of BBB from S&P, Baa2 from Moody’s and BBB- from Fitch.
O&M. In the second half of 2019, we internalized the operation activities of Cadonal, previously provided by Operacion y Mantenimiento Uruguay S.A.
(formerly Omega), a subsidiary of Abengoa. We have a turbine O&M agreement with Siemens Gamesa that covers scheduled and unscheduled turbine maintenance, a supply of spare parts, wind farm monitoring and reporting services.
Project Level Financing. On September 15, 2014, Cadonal entered into an A/B loan agreement and a subordinated debt tranche. The A tranche, with a tenor
of 19.5 years, is a $40.5 million loan from Corporacion Andina de Fomento (“CAF”), with a floating interest rate of six-month U.S. LIBOR plus 3.9% for as long as CAF has access to funding from BankBankengruppe Kreditanstalt fur Wiederaufbau, or
KfW, through its program for the development of certain climate-relevant projects. An interest rate swap was arranged in order to mitigate interest rate risk for the tranche A, covering the 70% of the interests through a swap set at approximately
3.29% strike. The tranche B is a $40.5 million loan from DNB Bank with a floating interest rate of six-month U.S. LIBOR plus 3.65% for as long as CAF has access to funding from KfW, with a tenor of 17.5 years. The U.S. LIBOR exposure on the
tranche B loan was approximately 70% hedged through swap set at approximately 3.16% strike. The subordinated debt tranche provided by CAF in the amount of $9.1 million, with a tenor of 19.5 years and a floating interest rate of six-month U.S.
LIBOR plus 6.5%. The combined principal balance of these loans as of December 31, 2019 was $78 million.
Cash distributions are permissible semi-annually subject to a historical senior debt service coverage ratio for the previous twelve-month period of at least 1.20x, a total debt service coverage
ratio of at least 1.10x and a projected senior debt service coverage ratio for the following twelve-month period of at least 1.10x, except in the case of the first distribution, in which case the projected senior debt service coverage ratio for
the following twelve-month period must be at least 1.20x, the projected total debt service coverage for the following twelve-month period must be at least 1.10x, and both the historical senior debt coverage ratio and the historical total debt
coverage ratio must be confirmed by the auditors. As of December 31, 2019, Cadonal did not meet the minimum ratio for distributions nor the minimum ratio required by the project finance lenders. We obtained a waiver from the lenders prior to
December 31, 2019.
Melowind
Overview. Melowind is an on-shore wind farm facility wholly owned by us, located in Uruguay with nominal installed capacity of 50 MW. Melowind has 20
wind turbines, each with a capacity of 2.5 MW. The asset reached COD in November 2015.
The wind farm is located in Cerro Largo, 200 miles north of the city of Montevideo. Nordex supplied the turbines.
PPA. Melowind signed a PPA with UTE in 2015, for 100% of the electricity produced. UTE pays a fixed tariff under the PPA, which is denominated in U.S.
dollars and is partially adjusted every year based on a formula referring to U.S. CPI, the Uruguay’s Indice de Precios al Productor de Productos Nacionales and the applicable Uruguayan Peso and U.S. dollars exchange rate.
UTE is unrated and Uruguay has senior unsecured credit ratings of BBB from S&P, Baa2 from Moody’s and BBB- from Fitch.
O&M. Melowind signed an agreement with Nordex, covering the maintenance tasks of the wind turbines. The scope of works of this agreement includes
operation, scheduled and unscheduled maintenance. In addition, Melowind signed an O&M agreement with Ingener covering the maintenance tasks of the civil works and electrical infrastructure.
Project Level Financing. On December 13, 2018, Melowind entered into a financing agreement with Banco Santander payable over a period of 16 years. The
financing consists of a $76 million loan, a $4.6 million revolving debt service reserve facility an additional $1.1million for the issuance of guarantees. The interest rate is a floating rate based on six-month LIBOR plus a margin of 2.25% until
December 2021, 2.5% from January 2022 to December 2024, 2.75% from January 2025 to December 2027 and 3.0% from January 2028 to December 2034. The LIBOR exposure was 75% hedged with a swap at a rate of 3.26% with the financing bank. As of December
31, 2019, the outstanding amount of the loan was $75 million.
Cash distributions are permissible semi-annually subject, among other things, to a historical debt service coverage ratio for the previous twelve-month period of at least 1.15x.
Mini-hydro Peru
Overview. Mini-hydro Peru is a 4 MW mini-hydroelectric power plant located approximately 99 miles from Lima, Peru which was acquired on February 28,
2018. The plant reached COD in April 2012.
Concession Agreement. It has a 20-year fixed-price concession agreement denominated in U.S. dollars with the
Ministry of Energy of Peru and the price is adjusted annually in accordance with the U.S. Consumer Price Index.
Peru has a long-term credit rating of BBB+ from S&P, A3 from Moody’s and BBB+ from Fitch.
O&M. The operation and maintenance service is performed internally.
Project Level Financing. The asset has a 17-year, non-recourse project financing with Inter-American Investment Corporation. As of December 31, 2019,
the outstanding amount on the loan was $5 million.
Efficient Natural Gas
The following table provides an overview of our efficient natural gas assets:
|
Assets
|
Type
|
Ownership
|
Location
|
Currency
|
Capacity
(Gross)
|
off-taker
|
Counterparty
Credit
Rating(1)
|
COD
|
Contract
Years
Left
|
|||||||||
|
ACT
|
Efficient
Natural
Gas
|
99.99%(2)
|
Mexico
|
USD(3)
|
300 MW
|
Pemex
|
BBB+/ Baa3/
BB+
|
2013
|
13
|
|||||||||
|
Monterrey
|
Efficient Natural Gas
|
30%
|
Mexico
|
USD
|
142 MW
|
Industrial Customers
|
Not rated
|
2018
|
19
|
Notes:—
| (1) |
Reflects the counterparty’s issuer credit ratings issued by S&P, Moody’s and Fitch.
|
| (2) |
One share is owned by Abengoa México, S.A. de C.V. and 1 share is owned by Abener Energía, S.A., both wholly owned by Abengoa.
|
| (3) |
Payable in Mexican pesos.
|
ACT
Overview. ACT is a gas-fired cogeneration facility 99.9% owned by us located inside the Nuevo Pemex Gas Processing Facility near the city of
Villahermosa in the State of Tabasco, Mexico. It has a rated capacity of approximately 300 MW and between 550 and 800 metric tons per hour of steam. ACT reached COD on April 1, 2013. ACT Energy Mexico, S. de R.L. de C.V., or ACT Energy Mexico,
owns ACT.
The ACT plant uses mature and proven gas combustion turbines and heat recovery technology. Specifically, the ACT plant utilizes two GE Power & Water “F” technology natural gas-fired
combustion turbines and two Cerrey, S.A. de C.V., or Cerrey, heat recovery steam generators.
Conversion Services Agreement. On September 18, 2009, ACT entered into the Pemex CSA, with Pemex, under which ACT is required to sell all of the plant’s
thermal and electrical output to Pemex. The Pemex CSA has an initial term of 19 years from the in-service date and will expire on March 31, 2033. The parties may mutually extend the Pemex CSA for an additional 20-year period. The Pemex CSA
requires Pemex to supply the facility, free of charge, with the fuel and water necessary to operate ACT, and the latter has to produce electrical energy and steam requested by Pemex based on the expected levels of efficiency. The Pemex CSA is
denominated in U.S. dollars. The price is fixed and will be adjusted annually, part of it according to inflation and part according to a mechanism agreed in the contract that on average over the life of the contract reflects expected inflation.
Pemex has a corporate credit rating of BBB+ by S&P, Baa3 by Moody’s and BB+ by Fitch.
O&M. GE International provides services for the maintenance, service and repair of the gas turbines as well as certain equipment, parts, materials,
supplies, components, engineering support test services and inspection and repair services. In addition, NAES México, S. de R.L. de C.V. (“NAES”), is responsible for the O&M of the ACT plant. The O&M agreement with NAES expires upon the
expiration of the Pemex CSA, although we may cancel it with no penalty at any time. ACT Energy Mexico pays NAES for its reimbursable costs, operating costs and a management fee.
Project Level Financing. On December 19, 2013, ACT Energy Mexico entered into a $680 million senior loan agreement with a syndicate of banks including
Banco Santander, Banobras and Credit Agricole Corporate & Investment Bank. Each tranche of the loan is denominated in U.S. dollars. The financing consists of a $333 million of tranche one and a $327 million of tranche two plus an additional
$20 million for the issuance of a letter of credit. After the entry of SMBC, EDC, La Caixa, Nafin and Bancomext into the financing in 2014 and subsequent to the first scheduled principal repayment, the first tranche amounted to $205.4 million and
the second tranche to $450.0 million, thereby continuing to maintain the same aggregate total amount of $680 million.
The first tranche has a 10-year maturity, the second tranche has an 18-year maturity and the letter of credit may be convertible into additional principal that will be added to the first
tranche. The interest rate on each tranche is a floating rate based on the three-month U.S. LIBOR plus a margin of 3.0% until December 2019, 3.5% from January 2020 to December 2024 and 3.75% from January 2025 to December 2031. The senior loan
agreement requires ACT Energy Mexico to hedge the interest rate for a minimum amount of 75% of the outstanding debt amount during at least 75% of the debt term. In 2014, ACT closed a swap for an initial notional amount of $493.8 million at a
weighted average rate of 3.92%.
The senior loan agreement permits cash distributions to shareholders provided that the debt service coverage ratio is at least 1.20x, or at any time provided that the last four quarters had a
debt service coverage ratio of at least 1.20x.
The outstanding amount of these loans as of December 31, 2019 was $529 million.
Partnerships. We own all of the shares of ACT except for two ordinary shares, which represent less than 0.01% of the total capital of ACT and which are
owned by wholly owned subsidiaries of Abengoa.
Monterrey
Overview. Monterrey is a 142 MW gas-fired engine facility including 130 MW installed capacity and 12 MW battery capacity. We acquired a 30% stake in
Monterrey in August 2019. The asset, located in Mexico, has been in operation since 2018 and represents our first investment in electric batteries.
The power plant is configured with seven 18.6 MW Wärtsilä 18V50SG natural gas internal combustion engines. In addition, the flexible 12 MW/12 MWh battery storage system improves the quality,
reliability and allows for on-peak/off-peak arbitrage strategy.
PPA. It has a U.S. dollar-denominated 20-year PPA with two international large corporations engaged in the car manufacturing industry. The PPA also
includes price escalation factors. The asset is the sole electricity supplier for the off-takers. In order to provide electricity, the asset also has a 20-year contract for the natural gas transportation from Texas with a U.S. energy company.
The initial capacity to be provided to the off-takers is 100-MW, for which the asset receives a capacity take-or pay payment on top of the payment that it receives in relation to the energy
demanded by the off-takers under the PPA terms.The PPA also provides that the off-taker may require additional capacity up to 128-MW.
O&M. Wärtsilä Mexico performs the O&M for Monterrey, including manpower, technical support, online monitoring, maintenance planning, performance
guarantees and risk management. The term of the contract is three years from COD. The structure is a cost reimbursement plus operating fee indexed to Mexican CPI, capped at 2.25% per annum.
In addition, the asset has in place a Generator Maintenance Agreement with Wärtsilä Mexico for the seven generators for a period of 15 years from COD or until each generator has reached 101,000
running hours. The structure is a fixed fee plus a variable fee plus a recovery guarantee fee per year and an overhaul fee. In addition, there are performance liquidated damages and a bonus scheme.
Project Level Financing. On June 28, 2018, Pemcorp S.A.P.I. de C.V. (“Pemcorp”), the project company that owns Monterrey, entered into a $111 million
term loan agreement with a syndicate of banks including Natixis, Sumitomo Mitsui Banking Corporation and The Korea Development Bank. The loan is denominated in U.S. dollars and matures on June 28, 2023. The interest rate is a floating rate based
on the three-month U.S. LIBOR plus a margin of 2.75% with a 0.25% increase after three years. The LIBOR exposure was 75% hedged with a swap rate of 3.02% with the financing bank.
The loan agreement permits cash distributions after the asset reached COD provided that the debt service coverage ratio is at least 1.20x.
Partnerships and ROFO Agreement. Our partner in Monterrey is Arroyo Energy, an independent investment manager focused on power and energy
infrastructure assets in the U.S., Mexico and Chile, which currently owns 70% of the asset. We have also entered into a ROFO agreement with Arroyo Energy for the remaining 70% stake in Monterrey, currently owned by them.
Electric Transmission
The following table provides an overview of our electric transmission assets, each of which is operational:
|
Assets
|
Type
|
Ownership
|
Location
|
Currency(1)
|
Capacity
(Gross)
|
off-taker
|
Counterparty
Credit
Rating(2)
|
COD
|
Contract
Years Left
|
|||||||||
|
ATN
|
Transmission
Line
|
100%
|
Peru
|
USD
|
365 miles
|
Peru
|
BBB+/A3/
BBB+
|
2011
|
21
|
|||||||||
|
ATS
|
Transmission
Line
|
100%
|
Peru
|
USD
|
569 miles
|
Peru
|
BBB+/A3/
BBB+
|
2014
|
24
|
|||||||||
|
AN2
|
Transmission
Line
|
100%
|
Peru
|
USD
|
81 miles
|
Minera
Las
Bambas
|
Not rated
|
2015
|
13
|
|||||||||
|
Quadra 1/2
|
Transmission
Line
|
100%
|
Chile
|
USD
|
49
miles/32
miles
|
Sierra
Gorda
|
Not rated
|
2014
|
15 / 15
|
|||||||||
|
Palmucho
|
Transmission
Line
|
100%
|
Chile
|
USD
|
6 miles
|
Enel
Generacion
Chile
|
BBB+/Baa1/
BBB+
|
2007
|
18
|
|||||||||
|
Chile TL3
|
Transmission
Line
|
100%
|
Chile
|
USD
|
50 miles
|
CNE (National Energy Commision)
|
A+/A1/
A
|
1993
|
Regulated
|
Notes:—
| (1) |
Certain contracts denominated in U.S. dollars are payable in local currency.
|
| (2) |
Reflects counterparty’s issuer credit ratings issued by S&P, Moody’s and Fitch.
|
ATN
Overview. ATN S.A. or the ATN Project, in Peru is part of the Guaranteed Transmission System and comprises several sections of transmission lines and
substations. ATN reached COD in 2011. On December 28, 2018, ATN S.A. completed the acquisition of a 220-kV power substation and two small transmission to connect our line to the Shahuindo (ATN expansion 1) mine located nearby. In October 2019, we
also closed the acquisition of ATN Expansion 2.
Concession Agreement. Pursuant to the initial concession agreement, the Peruvian Ministry of Energy, on behalf of the Peruvian Government, granted ATN a
concession to construct, develop, own, operate and maintain the ATN Project. The initial concession agreement became effective on May 22, 2008 and will expire 30 years after the COD of Line 1, which was achieved on January 11, 2011.
Pursuant to the initial concession agreement, ATN owns all assets that it has acquired to construct and operate the ATN Project for the duration of the concession. The ownership of these assets
will revert to the Peruvian Ministry of Energy upon termination of the initial concession agreement.
The ATN Project has a 30-year, fixed-price tariff base denominated in U.S. dollars that is adjusted annually after the COD for each line in accordance with the U.S. Finished Goods Less Food and
Energy Index as published by the U.S. Department of Labor. Our receipt of the tariff base is independent from the effective utilization of the transmission lines and substations related to the ATN Project. The tariff base is intended to provide
the ATN Project with consistent and predictable monthly revenues sufficient to cover the ATN Project’s operating costs and debt service and to earn an equity return.
In addition, both ATN Expansion 1 and ATN Expansion 2 have 20-year PPAs denominated in US $.
Peru has a long-term credit rating of BBB+ from S&P, A3 from Moody’s and BBB+ from Fitch.
O&M. ATN has an O&M agreement with Omega Perú Operación y Mantenimiento S.A., a subsidiary of Abengoa, specialized in O&M services for
electric transmission lines across South American countries. This O&M agreement has a 27-year term with a fixed annual price adjusted yearly with the variation of the U.S. Finished Goods Less Food and Energy Index.
Project Level Financing. On September 26, 2013, ATN completed the issue of a project bond in four tranches. To implement the bond issuance, ATN created
a trust holding all of the assets and economic rights arising out of the definitive concession agreement. The first tranche has a principal amount of $15 million with a five-year term with quarterly amortization and bears interest at a rate of
3.845% per year. The second tranche has a principal amount of $50 million with a 15-year term with quarterly amortization and bears interest at a rate of 6.15% per year. The second tranche has a five-year grace period for principal repayment. The
third tranche has a principal amount of $45 million with a 26-year term and bears interest at a rate of 7.53% per year. The third tranche has a 15-year grace period for principal repayments. The fourth tranche has a principal amount of $10
million with a 15-year term and bears interest at a rate of 6.88% per year. The fourth tranche has a 5-year grace period for principal repayments. As of December 31, 2019, $101 million in aggregate principal amount was outstanding.
Cash distributions are subject to a historical debt service coverage ratio for the last six months of at least 1.10x.
ATS
Overview. ABY Transmisión Sur S.A., or ATS Project, in Peru is part of the Guaranteed Transmission System, and comprises several sections of
transmission lines and substations. ATS reached COD on January 17, 2014.
Concession Agreement. The initial concession agreement became effective on July 22, 2010 and will expire 30 years after achieving COD. Pursuant to the
initial concession agreement, ATS will own all assets it has acquired to construct and operate the ATS Project for the duration of the concession. These assets will revert to the Peruvian Ministry of Energy upon termination of the initial
concession agreement.
The ATS Project has a 30-year, fixed-price tariff base denominated in U.S. dollars and is adjusted annually after the COD in accordance with the U.S. Finished Goods Less Food and Energy Index
as published by the U.S. Department of Labor. Our receipt of the tariff base will be independent from the effective utilization of the transmission lines and substations related to the ATS Project. The tariff base is intended to provide the ATS
Project with consistent and predictable monthly revenues sufficient to cover the ATS Project’s operating costs and debt service and to earn an equity return.
Peru has a long-term credit rating of BBB+ from S&P, A3 from Moody’s and BBB+ from Fitch.
O&M. Omega Perú Operación y Mantenimiento S.A., a wholly-owned subsidiary of Abengoa, provides O&M services for the ATS Project. Omega Peru has
agreed to operate the facility in accordance with prudent utility practices, ensure compliance with all applicable government and agency permits, licenses, approvals and concession agreement terms. The O&M agreement provides a fixed fee that
is adjusted annually on the anniversary of the execution of the O&M agreement to reflect the variation in the U.S. Finished Goods Less Food and Energy Index. The O&M agreement was executed for a five-year term that renews automatically
for an additional five-year period until the termination of the initial concession agreement, unless either party exercises its right not to renew the O&M agreement.
Project Level Financing. On April 8, 2014, ATS issued a project bond in one tranche denominated in U.S. dollars. The project bond has a principal amount
of $432 million with a 29-year term with semi-annual amortization and bears a fixed interest rate of 6.875%. As of December 31, 2019, $405 million was outstanding.
Cash distributions may be made every six months subject to a trailing historical debt service coverage ratio for the previous two quarters of at least 1.20x.
ATS is 25% owned by ABY Concessions Perú S.A., wholly owned by Atlantica, and 75% owned by ATN, S.A., which is owned by ABY Concessions Perú S.A.
ATN2
Overview. ATN2, wholly owned by us and located in Peru, is part of the Complementary Transmission System, or Sistema
Complementario de Transmision, or SCT, and consists of the following facilities: (i) the approximately 130km, 220kV line from SE Cotaruse to Las Bambas; (ii) the connection to the gate of Las Bambas Substation and (iii) the expansion of
the Cotaruse 220kV substation (works assigned to Consorcio Transmantaro). ATN2 reached COD in June 2015.
Minera Las Bambas is owned by a partnership consisting of a China Minmetals Corporation subsidiary (62.5%), a wholly owned subsidiary of Guoxin International Investment Co. Ltd (22.5%) and
CITIC Metal Co. Ltd (15.0%).
The ATN2 Project has an 18-year, fixed-price tariff base denominated in U.S. dollars, partially adjusted annually in accordance with the U.S. Finished Goods Less Food and Energy Index as
published by the U.S. Department of Labor. Our receipt of the tariff base is independent from the effective utilization of the transmission lines and substations related to the ATN2 Project.
Maintenance & Monitoring. Omega Peru Operación y Mantenimiento S.A., a wholly-owned subsidiary of Abengoa, provides maintenance and monitoring
services for ATN2 under a 6-year term contract that is renewed every six years. Omega Peru has agreed to maintain the facility in accordance with prudent utility practices, ensure compliance with all applicable government and agency permits,
licenses, approvals and concession agreement terms.
Project Level Financing. On September 28, 2011, a 15-year loan agreement was executed with Banco de Credito del Peru, or BCP, for a commitment of $50.0
million. On November 24, 2014, a new 15-year tranche was signed with BCP for $31.0 million. On September 26, 2018, we prepaid $24.4 million of U.S. dollar denominated project level debt of ATN2. All debt has a fixed interest rate amounting to
9.1% on a weighted average basis. In November 2019, we reached an agreement with the lenders to extend the tenor by 1.5 years and reduce the cost in a range of 75 to 100 basis points, depending on the tranche. As of December 31, 2019, the
outstanding amount of the ATN2 project loan was $58 million. Cash distributions are subject to a debt service coverage ratio of at least 1.15x.
Quadra 1 & Quadra 2
Overview. Transmisora Mejillones, or Quadra 1, is a transmission line project consisting of a 220kV double circuit transmission line that begins at the
Encuentro electrical substation that is owned by Transelec and is located in the commune of Maria Elena. Quadra 1 connects to the Sierra Gorda substation owned by Sierra Gorda SCM, a mining company and is located in the commune of Sierra Gorda.
The project covers approximately 49 miles.
Transmisora Baquedano, or Quadra 2, is a transmission line project that provides electricity to the seawater pump stations owned by the Sierra Gorda SCM. It consists of a simple circuit 220kV
electric transmission line that begins at the Angamos electrical substation owned by EE Cochrane, an electrical company, and is located in the commune of Mejillones. Quadra 2 connects to the PS1 transformer substation. This section of Quadra 2
covers approximately seven miles.
Quadra 1 and Quadra 2 reached COD in 2014.
Concession Agreement. Both projects have concession agreements with the Sierra Gorda SCM mining company, which is owned by Sumitomo Corporation,
Sumitomo Metal Mining and KGHM Polska Mietz. The concession agreement is denominated in U.S. dollars and has a 21-year term that began on the COD. The contract price is indexed mainly to the U.S. CPI.
The concession agreement grants in favor of Sierra Gorda a call option over the transmission line, exercisable at any time during the life of the contract. According to the call option, Sierra
Gorda is entitled to purchase the transmission line at an agreed price and with a six-month prior written notice.
O&M. Transelec S.A. performs operations services at Quadra 1 until March 2018. After that date, operations will be performed by Enor Chile S.A.
under a 10-year contract expiring in 2027. Gas Atacama S.A. is providing operations services at Quadra 2 under a 12-year contract expiring in August 2029. Cobra Chile Servicios S.A. is performing maintenance services at Quadra 1 and Quadra 2
under 6-year contracts expiring in August 2023.
Project Level Financing. On June 27, 2019, we refinanced the project debt of our Chilean assets Palmucho, Chile TL3, Quadra 1 and Quadra 2. The new
financing agreement consists of a single loan agreement for Palmucho, Chile TL3, Quadra 1 and Quadra 2 for a total amount of $75 million with a syndicate of local banks formed by Itaú, Banco de Credito del Peru (BCP) and Banco BICE. The new
project debt has replaced the previous two independent project loans in Quadra 1 and Quadra 2. The new loan is denominated in U.S. dollars and matures on September 30, 2031, which is a maturity date two years later than the original financing.
The new loan has a semi-annual amortization schedule and accrues interest at a variable rate based on the six-month U.S. LIBOR plus 3.60%, which represents a 20-basis point improvement compared to the previous financing. We have cancelled the
swaps previously in place and contracted a new interest rate swap at an approximate fixed rate of 2.25% to hedge 75% of the amount nominal during the entire debt term.
The new financing agreement is cross-collateralized jointly between the Chilean assets and permits cash distributions to its parent company twice per year if the combined debt service coverage
ratio for the three assets is at least 1.20x.
As of December 31, 2019, $70 million in aggregate principal amount was outstanding in respect of Quadra 1 and Quadra 2.
Palmucho
Overview. Palmucho is a short transmission line in Chile that is approximately 6 miles. It delivers energy generated by the Palmucho Plant, which is
owned by Enel Generacion Chile, to the Sistema Eléctrico Nacional (SEN). The Palmucho Plant connects to the number 2 circuit of the 220kV Ralco—Charrua transmission line at the 66/220kV Zona de Caida substation. The Palmucho project has been in
operation since October 2007.
Concession Services Agreement. Palmucho has a 14-year concession contract with Enel Generacion Chile, whereby both parties are obliged to enter into a
four-year valid toll contract at the end of the term of the concession contract and the valid toll contract will be renewed for three periods of four years each until one of the parties decides not to renew. Enel Generacion Chile operates the
Palmucho project and Cobra Chile maintains the project.
Enel Generacion Chile has a senior unsecured credit rating of BBB+ from S&P, Baa2 from Moody’s and BBB+ from Fitch.
O&M. Palmucho executed an operation and maintenance agreement with Cobra in February 2017 after terminating a previous agreement.
Project Level Financing. See Project Level Financing section for Quadra 1 and Quadra 2 above.
Chile TL3
Overview. Chile TL3 is a 50-mile 66kV transmission line in operation in Chile.
In addition to supplying power to the Pangue plant, Chile TL3 also supplies electric power to the different communities of the area, including Santa Bárbara, Chile. Chile TL3 reached COD in
1993.
Chile TL3 generates revenues under the current regulation in Chile. The asset has a fixed-price tariff based on the return to the investment and the operating and maintenance costs denominated
in U.S. dollars, and it is partially adjusted annually in accordance with the U.S. and Chilean Consumer Price Indexes and currency exchange rates.
Chile has a senior unsecured credit rating of A+ from S&P, A1 from Moody’s and A from Fitch.
O&M. Our staff performs operations services at Chile TL3. Cobra Montajes, Servicios y Agua Limitada performs maintenance services at Chile TL3
under a 4-year contracts expiring in 2022.
Project Level Financing. See Project Level Financing section for Quadra 1 and Quadra 2 above.
Water
The following table presents our interests in water assets, each of which is operational:
|
Assets
|
Type
|
Location
|
Capacity
|
off-taker
|
Currency(1)
|
Counterparty
Credit
Rating
|
COD
|
Contract
Years
Left
|
|||||||||
|
Honaine
|
Water
|
Algeria
|
7 M ft3/day
|
Sonatrach/ADE
|
U.S. dollar
|
Not rated
|
2012
|
18
|
|||||||||
|
Skikda
|
Water
|
Algeria
|
3.5 M ft3/day
|
Sonatrach/ADE
|
U.S. dollar
|
Not rated
|
2009
|
14
|
Note:—
| (1) |
Payable in local currency.
|
Honaine
Overview. On February 3, 2015, we completed the acquisition of 25.5% of Honaine pursuant to the Abengoa ROFO Agreement.
The Honaine project is a water desalination plant located in Taffsout, Algeria, near three important cities: Oran, to the northeast, and Sidi Bel Abbes and Tlemcen, to the southeast. Myah Bahr
Honaine Spa (“MBH”), is the vehicle incorporated in Algeria for the purposes of owning the Honaine project. Algerian Energy Company, SPA, or AEC, owns 49% and Sociedad Anonima Depuracion y Tratamientos, or Sacyr Agua, S.L, subsidiary of Sacyr
S.A., owns the remaining 25.5% of the Honaine project.
AEC is the Algerian agency in charge of delivering Algeria’s large-scale desalination program.
The technology used in the Honaine plant is currently the most commonly used in this kind of project. It consists of desalination using membranes by reverse osmosis. Honaine has a capacity of 7
M ft3 per day of desalinated water and has been in operation since July 2012. The project serves a population of 1.0 million.
Honaine has a corporate income tax exemption until 2021. After that period, in case the exemption is not extended, a claim may be made under the water purchase agreement for compensation in the
tariff.
Concessions Agreement. The water purchase agreement is a U.S. dollar indexed 30-year take-or-pay contract with Sonatrach/Algerienne des Eaux, or ADE,
from the date of execution, or 25-year term from COD. The tariff structure is based upon plant capacity and water production, covering variable cost (water cost plus electricity cost). Tariffs are adjusted monthly based on the indexation
mechanisms that include local inflation, U.S. inflation and the exchange rate between the U.S. dollar and local currency.
Operations & Maintenance. In May 2007, MBH signed an operation and maintenance contract and a membrane and chemical products supply contract with
UTE Desaladora Honaine Operacion y Mantenimiento (a joint venture between Abengoa Water, S.L. and Sacyr, S.A., each holding 50%).
The O&M agreement is a 30-year contract from the date of execution (or 25-year term from COD) with a fixed fee and a variable component. The fixed O&M cost covers mainly structural and
staff costs. The variable O&M cost covers the chemical products, filters cost and membranes costs related to the water production.
Project Level Financing. In May 2007, MBH signed a financing agreement (as amended in November 2008 and June 2013) with Credit Populaire d’Algerie. The
final amount of the loan was $233 million and it accrues fixed-rate interest of 3.75%. The repayment of the Honaine facility agreement consists of sixty quarterly payments, ending in April 2027.
The financing arrangements permit cash distribution to shareholders once per year under certain conditions, including that the audited financials for the prior fiscal year indicate a debt
service coverage ratio of at least 1.25x.
Partnerships. 51% of the plant is owned by Geida Tlemcen, which is jointly owned by us (50%) and Sacyr Agua, S.L. (50%). The other 49% is held by AEC.
Skikda
Overview. On February 3, 2015, we completed the acquisition of 34.2% of Skikda pursuant to the Abengoa ROFO Agreement.
The Skikda project is a water desalination plant located in Skikda, Algeria. Skikda is located 510 km east of Algiers. Aguas de Skikda, or ADS, is the vehicle incorporated in Algeria for the
purposes of owning the Skikda project. AEC owns 49% and Sacyr Agua, S.L., subsidiary of Sacyr S.A., owns the remaining 16.83% of the Skikda project.
AEC is the Algerian agency in charge of delivering Algeria’s large-scale desalination program.
The technology used in the Skikda plant is currently the most commonly used in this kind of project. It consists of the use of membranes to obtain desalinated water by reverse osmosis. Skikda
has a capacity of 3.5 M ft3 per day of desalinated water and has been in operation since May 2009. The project serves a population of 0.5 million.
Skikda had a corporate income tax exemption until 2019. After that period, the exemption had not been extended. Project have been partly compensated under the water purchase agreement in the tariff.
Concessions Agreement. The water purchase agreement is a U.S. dollar indexed 30-year take-or-pay contract with Sonatrach/ADE from the date of
execution, or 25-year term from COD. The tariff structure is based upon plant capacity and water production, covering variable cost (water cost plus electricity cost). Tariffs are adjusted monthly based on the indexation mechanisms that include
local inflation, U.S. inflation and the exchange rate between the U.S. dollar and local currency.
O&M. In July 2005, ADS signed an operation and maintenance contract and a membrane and chemical products supply contract with UTE Desaladora Skikda
Operacion y Mantenimiento (a joint venture between Abengoa Water, S.L. holding 67%, and Sacyr, S.A., holding 33%).
The O&M agreement is a 30-year contract from the date of execution (or 25-year term from COD) with a fixed fee and a variable component. The fixed O&M cost covers mainly structural cost
and staff costs. The variable O&M cost covers the chemical products, filters cost and membranes costs related to the water production.
Project Level Financing. In July 2005, ADS signed a financing agreement (as amended in May 2009) with Banque Nationale d’Algerie, or BNA. The final
amount of the loan was $108.9 million and it accrues fixed-rate interest of 3.75%. The repayment of the Skikda facility agreement consists of sixty quarterly payments, ending in May 2024.
As of December 31, 2019, the outstanding amount of the Skikda project loan was $24 million.
The financing arrangements permit cash distribution to shareholders once per year under certain conditions, including that the audited financials for the prior fiscal year indicate a debt
service coverage ratio of at least 1.25x.
Partnerships. 51% of the plant is owned by Geida Skikda, which is jointly owned by us (67%) and Sacyr Agua, S.L. owns (33%). The other 49% is held by
AEC.
Our Growth Strategy
We intend to grow our cash available for distribution and our dividend to shareholders through:
| • |
organic growth through the optimization of the existing portfolio, investments in the expansion of our current assets, particularly in our transmission lines sector, and the repowering of our current
generation assets;
|
| • |
acquisitions of assets from third parties;
|
| • |
acquiring new assets from AAGES and Algonquin under our current ROFO agreements and co-investing with Algonquin;
|
| • |
potential new future partnerships with other developers or asset owners to acquire assets or to invest directly or through investment vehicles in assets under development, ensuring that such investments
are always a small part of our total investments.
|
In general, we expect to acquire assets that are developed and operational. We also plan to make investments in assets that are under development or construction. We also might acquire assets
or businesses where revenues are not contracted.
We intend to use the following investment guidelines in evaluating prospective acquisitions in order to successfully execute our growth strategy:
| • |
generally high quality off-takers or regulation, with long-term contracted revenue;
|
| • |
limited exposure to assets under construction or development, generally co-investing with partners;
|
| • |
project financing in place at each project or mechanisms to obtain it at COD;
|
| • |
management and operational systems and processes at an adequate level;
|
| • |
focus on regions and countries that provide an optimal balance between growth opportunities and security and risk considerations, including the United States, Canada, Mexico, Chile, Peru, Uruguay,
Colombia and the European Union; and
|
| • |
preference for U.S. dollar-denominated revenues, but we could also acquire assets or business that generate revenues in other currencies.
|
Acquisitions
Historical acquisitions
Following our IPO in 2014, we completed a series of four dropdown asset acquisitions with Abengoa, which formed the basis for our asset portfolio including Solacor 1/2, PS 10/20, Cadonal,
Honaine, Skikda, Helioenergy 1/2, Helios 1/2, Solnova 1/3/4, Kaxu, ATN2 and Solaben 1/6. In 2016 and 2017, we acquired a stake in Seville PV and a transmission line in the United States from Abengoa.
2018 acquisitions
In February 2018, we completed the acquisition of a 4 MW mini-hydroelectric power plant in Peru for a cash consideration of approximately $9
million. The plant reached COD in 2012. It has a fixed-price concession agreement denominated in U.S. dollars with the Ministry of Energy of Peru and the price is adjusted annually in accordance with the U.S. Consumer Price Index.
In October 2018 we reached an agreement to acquire PTS, a natural gas transportation platform located in the Gulf of Mexico, close to ACT,
our efficient natural gas plant. PTS will have a contracted compression capacity of 450 million standard cubic feet per day and is currently under construction. The service agreement signed with Pemex on October 18, 2017 is a “take-or-pay”
11-year term contract starting in 2020, with a possibility of future extension at the discretion of both parties. On October 10, 2018, we acquired a 5% ownership in the project; once the project begins operation, which is expected in the first
half of 2020, we expect to acquire an additional 65% stake, subject to final approvals. We are currently under negotiations with the seller about certain aspects of the agreement. The total equity investment for the 100% stake is estimated to
be approximately $150 million. The amount paid so far has been negligible.
On December 28, 2018, the Company completed the acquisition of a power substation and two small transmission lines in Peru, constituting an expansion of the ATN
transmission line (“ATN expansion 1”). Total purchase price for this asset was $16 million.
In December 2018, we completed the acquisition of Chile TL3, a transmission line currently in operation in Chile. The asset has a tariff under the regulation in place in Chile, denominated in
U.S. dollars and indexed to U.S. and Chilean inflation rates. Our investment was approximately $6 million.
In December 2018, we completed the acquisition of Melowind, a 50 MW wind plant in Uruguay, from Enel Green Power S.p.A. The asset has been in operation since 2015 and has a 20-year US
dollar-denominated PPA in place for 100% of the electricity produced. The off-taker is the state-owned power company UTE, which has an investment grade credit rating. The total purchase price for this asset was approximately $45 million.
2019 acquisitions
In January 2019, we entered into an agreement with Abengoa under the Abengoa ROFO Agreement for the acquisition of Befesa Agua Tenes, a holding company which owns a 51% stake in Tenes, a water
desalination plant in Algeria that is similar in several aspects to our Skikda and Honaine plants. The price agreed for the equity value was $24.5 million, of which $19.9 million was paid in January 2019 as an advanced payment. Closing of the
acquisition was subject to conditions precedent, including approval by the Algerian administration. The conditions precedent set forth in the share purchase agreement were not fulfilled as of September 30, 2019. Therefore, in accordance with the
terms of the share purchase agreement the advanced payment has been converted into a secured loan to be reimbursed by Befesa Agua Tenes, together with 12% per annum interest, through a full cash-sweep of all the dividends generated to be received
from the asset. The share purchase agreement requires that the repayment occurs no later than September 30, 2031. In October 2019 we received a first payment in the amount of $7.8 million through the cash sweep mechanism
In April 2019, we entered into an agreement to acquire a 30% stake in Monterrey, a 142 MW gas-fired engine facility including 130 MW installed capacity and 12 MW battery capacity. The
acquisition closed on August 2, 2019 and we paid $42 million for the total equity investment. The asset, located in Mexico, has been in operation since 2018 and represents our first investment in electric batteries. It has a U.S.
dollar-denominated 20-year PPA with two international large corporations engaged in the car manufacturing industry as well as a 20-year contract for the natural gas transportation from Texas with a U.S. energy company. The PPA also includes price
escalation factors. The asset is the sole electricity supplier for the off-takers, it has no commodity risk and also has the possibility to sell excess energy to the North-East region of the country once the plant is connected to the grid. We
have also entered into a ROFO agreement with the seller of the shares for the remaining 70% stake in the asset.
On May 24, 2019, Atlantica and Algonquin formed AYES Canada, a vehicle to channel co-investment opportunities in which Atlantica holds the majority of voting rights. AYES Canada’s first
investment was in Amherst Island, a 75 MW wind plant in Canada owned by the project company Windlectric, Inc. (“Windlectric”). Atlantica invested $4.9 million and Algonquin invested $92.3 million, both through AYES Canada, which in turn invested
those funds in Amherst Island Partnership, the holding company of Windlectric. Since Atlantica has control over AYES Canada under IFRS 10 “Consolidated Financial Statements”, its consolidated financial statements initially showed a total
investment in the Amherst Island project of $97.2 million, accounted for as “Investments carried under the equity method” (Note 7) and Algonquin’s portion of that investment of $92.3 million as “Non-controlling interest”. In addition, and under
certain circumstances considered remote by both companies, Atlantica and Algonquin have options to convert shares of AYES Canada currently owned by Algonquin into Atlantica ordinary shares in exchange for a higher stake in the plant, subject to
the provisions of the standstill and enhanced collaboration agreements with Algonquin.
On May 31, 2019, we entered into an agreement with Abengoa to acquire a 15% stake in Rioglass, a multinational manufacturer of solar components in order to secure certain Abengoa obligations.
The investment was $7 million, and it is classified as available for sale and is expected to generate interest income for us once divested.
On August 2, 2019, we closed the acquisition of ASI Operations, the company that performs the operation and maintenance services to Solana and Mojave plants. The consideration paid was $6
million.
In October 2019, we closed the acquisition of ATN Expansion 2, as previously announced, for a total equity investment of approximately $20 million. The off-taker is Enel Green Power Peru.
Transfer of the concession agreement is pending authorization from the Ministry of Energy in Peru. If this authorization were not to be obtained within an eight-month period, the transaction would be reversed with no penalties to Atlantica.
Customers and Contracts
We derive our revenue from selling electricity, electric transmission capacity and desalination capacity. Our customers are mainly comprised of governments and electrical utilities, the latter
with which we typically have entered into PPAs. We also employ concession contracts, typically ranging from 20 to 30 years. We also have regulated assets in Spain and Chile (Chile TL3). See the description of each asset under “—Our Operations”
for more detail on each concession contract.
Our main contracts in our business also include the project finance contracts with banks or financial institutions and the operation and maintenance contracts of each of our assets. See
description of financing and operation and maintenance contracts under “—Our Operations.”
Additionally, we have entered into a ROFO agreement and other agreements with Abengoa as well as a ROFO agreement with both AAGES and Algonquin. See “Item 7.B - Related Party Transactions” for
more detail on these contracts.
Competition
Renewable energy, efficient natural gas and electric transmission are all capital-intensive and commodity-driven businesses with numerous industry participants. We compete based on the location
of our assets in various countries and regions; however, because our assets typically have 20- to 30-year contracts, competition with other asset operations is limited with respect to existing assets until the expiration of the PPAs. Power
generation and transmission are highly regulated businesses in each country in which we operate and are currently highly fragmented and have a diverse industry structure. Our competitors have a wide variety of capabilities and resources. Our
competitors include, among others, regulated utilities and transmission companies, other independent power producers and power marketers or trading companies and state-owned monopolies.
Intellectual Property
In general, the construction or other agreements in each asset allow us to use the technology and intellectual property of suppliers. We own the Atlantica Yield name and the
www.atlanticayield.com domain. The website address is a textual reference only, meaning that the information contained on our website is not a part of, and is not incorporated by reference in this Annual Report.
Regulatory and Environmental Matters
See “Item 4.B—Business Overview—Regulation.”
Insurance
We maintain the types and amounts of insurance coverage that we believe are consistent with customary industry practices in the jurisdictions in which we operate. Our insurance policies cover
employee-related accidents and injuries, property damage, machinery breakdowns, fixed assets, facilities and liability deriving from our activities, including environmental liability. We maintain business interruption insurance for interruptions
resulting from incidents covered by insurance policies, with a customary deductible period. Our insurance policies also cover directors’ and officers’ liability and third-party insurance. We cannot assure you, however, that our insurance coverage
will adequately protect us from all risks that may arise or in amounts sufficient to prevent any material loss or that premiums will not increase in the future and that insurers will not change the terms of the policies in the future, including
changes in deductible costs and periods. See “Item 3.D — Risk Factors—Risks Related to Our Business and the Markets in Which We Operate—Our insurance may be insufficient to cover relevant risks or the cost of our insurance may increase.”
Seasonality
Our operating results and cash flows can be significantly affected by weather in some of our most relevant projects, such as the solar power plants. We expect to derive a majority of our annual
revenues in the months of May through September, when solar generation is the highest in the majority of our markets and when some of our off-take arrangements provide for higher payments to us.
Environment and Sustainability
Environmental management is a key priority in our business and operations. Our facilities and operations are subject to significant government regulation, including stringent and comprehensive
federal, provincial and local laws, statutes, regulations, guidelines, policies, directives and other requirements governing or relating to, among other things: air emissions; discharges into water; storage, handling, use, disposal,
transportation and distribution of dangerous materials and hazardous, residual and other regulated materials, such as chemicals; the prevention of releases of hazardous materials into the environment; the presence and remediation of hazardous
materials in soil and groundwater, both on and offsite; the protection of natural resources; land use and zoning matters; and workers’ health and safety matters. We consider environmental protection as an area of performance and as such,
environmental issues are included among the responsibilities of our key executives.
Employees and Human Resources
As of the date of this Annual Report, we had 425 employees (including both operations and maintenance and general and administrative staff). Following our acquisition of ASI Ops, certain of our
employees now belong to a labor union. We believe that the relationship between the Company and its labor union is good. We have not experienced any strikes or work stoppages in our workforce. One of our plants has experienced strikes by
employees of one of our operation and maintenance suppliers in the past.
Safety and Maintenance
We implement and follow the industry safety standards in the countries where we operate in the interest of the safety of our employees and contractors and the communities where our operations
are located. In terms of operational efficiency, we focus on ensuring long-term availability, reliability and asset integrity with maintenance and monitoring.
We carefully selected the suppliers of our solar panels, turbines, windmills, transmission towers and equipment through a detailed evaluation process, focusing on their commercial track record
and regular availability of components and replacement parts for the proper functioning and maintenance of our assets and facilities.
Properties
See “Item 4.B—Business Overview—Our Operations.”
Legal Proceedings
On October 17, 2016, ACT received a request for arbitration from the International Court of Arbitration of the International Chamber of Commerce presented by Pemex. Pemex was requesting
compensation for damages caused by a fire that occurred in their facilities during the construction of the ACT cogeneration plant in December 2012, for a total amount of approximately $20 million. On July 5, 2017, Seguros Inbursa, the insurer of
Pemex, joined as a second claimant in the process. On December 19, 2018 the parties of the arbitration executed a settlement agreement to finalize the claim without any financial impact for ACT. On March 8, 2019 the ICC arbitration tribunal
confirmed the settlement agreement and the arbitration was terminated.
A number of Abengoa’s subcontractors and insurance companies that issued bonds covering Abengoa’s obligations under such contracts in the U.S. have included some of the non-recourse
subsidiaries of Atlantica in the U.S. as co-defendants in claims against Abengoa. Generally, the subsidiaries of Atlantica have been dismissed as defendants at early stages of the processes. With respect to a claim addressed by a group of
insurance companies to a number of Abengoa’s subsidiaries and to Solana (Arizona Solar One) for Abengoa related losses of approximately $20 million that could increase, according to the insurance companies, up to a maximum of approximately $200
million if all their exposure resulted in losses. Atlantica reached an agreement with all but one of the above-mentioned insurance companies, under which they agreed to dismiss their claims in exchange for payments of approximately $4.3 million,
which were paid in 2018. The insurance company that did not join the agreement has temporarily stopped legal actions against Atlantica, and Atlantica does not expect this particular claim to have a material adverse effect on its business.
In addition, an insurance company covering certain Abengoa obligations in Mexico has claimed certain amounts related to a potential loss. This claim is covered by existing indemnities from
Abengoa. Nevertheless, Atlantica has reached an agreement under which Atlantica´s maximum theoretical exposure would in any case be limited to approximately $35 million, including $2.5 million to be held in an escrow account. In January 2019, the
insurance company executed $2.5 million from the escrow account and Abengoa reimbursed such amount according to the existing indemnities in force between Atlantica and Abengoa. The payments by Atlantica would only happen if and when the actual
loss has been confirmed, if Abengoa has not fulfilled their obligations and after arbitration, if the Company initiates it.
The Company is not a party to any other significant legal proceeding other than legal proceedings arising in the ordinary course of its business. The Company is party to various administrative
and regulatory proceedings that have arisen in the ordinary course of business. While the Company does not expect these proceedings, either individually or in the aggregate, to have a material adverse effect on its financial position or results
of operations, because of the nature of these proceedings the Company is not able to predict their ultimate outcomes, some of which may be unfavorable to the Company.
Regulation
Overview
We operate in a significant number of highly regulated markets. The degree of regulation to which our activities are subject varies by country. In a number of the countries in which we operate,
regulation is carried out mainly by national regulatory authorities. In others, such as the United States and, to a certain degree, Spain, there are various additional layers of regulation at the state, regional and/or local level. In countries
with these additional layers of regulatory agencies, the scope, nature and extent of regulation may differ among the various states, regions and/or localities.
While we believe the requisite authorizations, permits and approvals for our assets have been obtained and that our activities are operated in substantial compliance with applicable laws and
regulations, we remain subject to a varied and complex body of laws and regulations that both public officials and private parties may seek to enforce. The following is a description of the primary industry-related regulations applicable to our
assets that are currently in force in the principal markets in which we operate.
Regulation in the United States
In the United States, our electricity generation project companies are subject to extensive federal, state and local laws and regulations that govern the development, ownership, business
organization and operation of power generation facilities. The federal government regulates wholesale sales, operation and interstate transmission of electric power through FERC and through other federal agencies, and certain environmental,
health and safety matters. State and local governments regulate the siting, permitting, construction and operation of power generation facilities, the retail sale of electricity and certain other environmental, health, safety and permitting
matters.
United States Federal Regulation of the Power Generation Facilities and Electric Transmission
The United States federal government regulates the wholesale sale of electric power and the transmission of electricity in interstate commerce through FERC, which draws its jurisdiction from
the FPA, as amended, and from other federal legislation such as the PURPA, the Energy Policy Act of 1992, and the EPACT 2005. EPACT 2005 repealed the Public Utility Holding Company Act of 1935 and replaced it with the Public Utility Holding
Company Act of 2005, or PUHCA.
Federal Regulation of Electricity Generators
The FPA provides FERC with exclusive ratemaking jurisdiction over all public utilities that engage in wholesale sales of electricity and/or the transmission of electricity in interstate
commerce. The owners of renewable energy facilities selling at wholesale are therefore generally subject to FERC’s ratemaking jurisdiction. FERC may authorize a public utility to make wholesale sales of electric energy and related products at
negotiated or market-based rates if the public utility can demonstrate that it does not have, or that it has adequately mitigated, horizontal and vertical market power and that it cannot otherwise erect barriers to market entry. Entities granted
market-based rate approval face ongoing filing and compliance requirements. Failure to comply with such requirements may result in a revocation of market-based rate authority, disgorgement of profits, civil penalties or other remedies that FERC
finds appropriate based on the specific underlying facts and circumstances. In granting market-based rate approval to a wholesale generator, FERC also typically grants blanket authorizations under Section 204 of the FPA and FERC’s regulations for
the issuance of securities and the assumption of debt liabilities.
If the criteria for market-based rate authority are not met, FERC has the authority to impose conditions on the exercise of market rate authority that are designed to mitigate market power or
to withhold or rescind market-based rate authority altogether and require sales to be made based on cost-of-service rates, which could in either case result in a reduction in rates. FERC also has the authority to assess substantial civil
penalties (potentially over $1.0 million per day per violation) and impose other monetary or regulatory penalties for failure to comply with tariff provisions or the requirements of the FPA.
FERC approval under the FPA may be required prior to a change in ownership or control of voting interests, directly or through one or more subsidiaries, in any public utility (including one of
our U.S. project companies) or any public utility assets. FERC approval may also be required for individuals to serve as common officers or directors of public utilities or of a public utility and certain other companies that provide financing or
equipment to public utilities.
FERC also implements the requirements of PUHCA applicable to “holding companies” having direct or indirect voting interests of 10% or more in companies that (among other activities) own or
operate facilities used for the generation of electricity for sale, which includes renewable energy facilities. PUHCA imposes certain record-keeping, reporting and accounting obligations on such holding companies and certain of their affiliates.
However, holding companies that own only exempt wholesale generators (“EWGs”) foreign utility companies, and certain qualifying facilities under PURPA are exempt from the federal access to books and records provisions of PUHCA. EWGs are owners or
operators of electric generation facilities (including producers of renewable energy, such as solar projects) that are engaged exclusively in the business of owning and/or operating generating facilities and selling electricity at wholesale. An
EWG cannot make retail sales of electricity, may only own or operate the limited interconnection facilities necessary to connect its generating facility to the grid, and faces restrictions in transacting business with affiliated regulated
utilities.
Regulation of Electricity Sales
Electricity transactions in the United States may be bilateral in nature, whereby two parties contract for the sale and purchase of electricity, subject to various governmental approval
processes or guidelines that may apply to the contract, or they may take place within a single, centralized clearing market for purchases and sales of energy, electric generating capacity and ancillary services. Given the limited interconnections
between power transmission systems in the United States and differences among market rules, regional markets have formed as part of the power transmission systems operated by regional transmission organizations (“RTOs”) or independent system
operators (“ISOs”) in places such as California, the Midwest, New York, Texas, the Mid-Atlantic region and New England.
Federal Reliability Standards
EPACT 2005 amended the FPA to grant FERC jurisdiction over all users, owners and operators of the bulk power system for the purpose of enforcing compliance with certain standards for the
reliable operation of the bulk power system. Pursuant to its authority under the FPA, FERC certified the North American Electric Reliability Corporation (“NERC”) as the entity responsible for developing reliability standards, submitting them to
FERC for approval, and overseeing and enforcing compliance with them, subject in each case to FERC review. NERC, in turn, has delegated certain monitoring and enforcement powers to regional reliability organizations. Users, owners, and operators
of the bulk power system meeting certain materiality thresholds are required to register with the NERC compliance registry and comply with FERC-approved reliability standards.
In the western United States, NERC has a delegation agreement with the Western Electricity Coordinating Council (“WECC”) whose service territory extends from Canada to Mexico and includes the
provinces of Alberta and British Columbia, the northern portion of Baja California, Mexico, and all or portions of the 14 western states in between. WECC is the regional entity responsible for coordinating, promoting and enforcing bulk power
system reliability in its service territory. Any entity that owns, operates or uses any portion of the bulk power system must comply with NERC or WECC’s mandatory reliability standards. Failure to comply with these mandatory reliability standards
may subject a user, owner or operator to sanctions, including substantial monetary penalties, which range from $1,000 to $1 million per day per violation for the most severe cases, where companies show negligence and lack evidence of adequate
compliance.
Federal Environmental Regulation, Permitting and Compliance
Construction and operation of power generation facilities, including solar power plants, and the generation and electric transmission of renewable energy from such facilities are subject to
environmental regulation at the federal, state and local level. State and local regulatory processes are discussed separately in a subsequent section. At the federal level, environmental laws and regulations typically require a lengthy and
complex process for obtaining licenses, permits and approvals prior to construction, operation or modification of a generation project or electric transmission facilities. Prior to development, permitting authorities may require that project
developers consider and address, among other things, the impact on water resources and water quality, endangered species and other biological resources, compatibility with existing land uses and zoning, agricultural resources, archaeological,
paleontological, recreational and cultural considerations, environmental justice and cumulative and visual impacts. In an effort to identify and minimize the potential impacts to these resources, power generation facilities may be required to
comply with a myriad of federal regulatory programs and applicable federal permits under the NEPA, the Endangered Species Act, the Clean Water Act, the National Historic Preservation Act, the Resource Conservation and Recovery Act, the
Comprehensive Environmental Response, Compensation, and Liability Act, the Environmental Protection and Community Right-to-Know Act and the National Wilderness Preservation Act, among other federal laws.
In addition, various federal environmental, health and safety regulations applicable during the construction phase are also applicable to the operational phase of power generation facilities.
During the operational phase, obtaining certain federal permits or federal approval of certain operating documents (e.g., O&M plans, the spill prevention, control and countermeasure plan, and an emergency and preparedness response plan), as
well as maintaining strict compliance with such permits or operating documents, is mandatory. Failure to maintain compliance may result in the revocation of any applicable permit or authorization, civil and criminal charges and fines or
potentially the closure of the plant.
U.S. Federal Income Tax Reform
On December 22, 2017, the TCJA was signed into law. The centerpiece of the TCJA is the permanent reduction in the corporate income tax rate to 21% from 35% under prior law. Among other changes,
the TCJA imposes new limitations on interest deductions, imposes a new excise tax on certain payments made to non-U.S. related parties, changes the rules relating to the use of NOLs and temporarily changes the rules relating to depreciation
deductions.
The TCJA limits net business interest expense deductions to 30% of adjusted taxable income. For 2018 through 2021, this amount generally approximates to earnings before interest, taxes,
depreciation and amortization (i.e., EBITDA). For tax years beginning after December 31, 2021, adjusted taxable income is determined by adding back only interest and taxes (i.e., it generally will approximate EBIT). The amount of interest paid or
accrued that exceeds 30% of adjusted taxable income is treated as excess interest expense and may be carried forward to future taxable years. TCJA does not provide any grandfathering for debt that existed prior to enactment. This new limitation
replaces the earnings stripping rules under Section 163(j) of the IRC that applied to interest paid on certain debt to or guaranteed by a related party.
The TCJA also imposes an excise tax on certain deductible payments, including interest, made by certain U.S. corporations to a non-U.S. related party to the extent the payment is not subject to
U.S. withholding tax (the “BEAT”). The BEAT payable for any taxable year is an amount equal to the excess, if any, of (i) 10% (5% in 2018 and 12.5% after 2025) of the taxable income of the taxpayer calculated without regard to any deductions
allowed for base erosion payments for the taxable year and certain net operating losses attributable to base erosion payments, over (ii) the taxpayer’s regular tax liability reduced by certain tax credits. The BEAT only applies to corporations
with average annual gross receipts of at least $500M for the prior three-year period and that have made outbound deductible payments that constitute at least 3% (2% for financial group members) of the aggregate amount of certain deductions
allowed for the taxable year (both generally determined on a group-wide basis).
NOLs generated on or before December 31, 2017 can generally be carried back two years and carried forward up to twenty years and can be applied to offset 100% of taxable income in such years.
Under the TCJA, however, federal NOLs incurred in 2018 and in future years may be carried forward indefinitely but generally may not be carried back. Additionally, the deductibility of such federal NOLs is generally limited to 80% of taxable
income in such years. The rules regarding “ownership changes” under Section 382 of the IRC were left unchanged.
Under prior law, the cost of property was required to be capitalized and recovered over time through annual deductions for depreciation or amortization. Tangible property generally was
depreciated under MACRS. Most of the equipment used in solar power projects, such as Solana and Mojave, qualifies for five-year depreciation under MACRS. Additionally, some equipment used in solar power projects qualified for bonus depreciation
if it was equipment placed in service prior to 2020 (with a phase down for property placed in service after 2017). The TCJA temporarily extends and modifies the additional first year depreciation deduction. Under the TCJA, generally, bonus
depreciation is 100% for property acquired and placed in service after September 27, 2017 and before 2023.
U.S. Federal Considerations for Renewable Energy Generation Facilities
The United States provides various federal, state and local tax incentives to stimulate investment in renewable energy generation capacity, including solar power. These tax incentives are
subject to change and, possibly, elimination in the future. Certain U.S. federal income tax incentives are described below.
Section 1603 U.S. Treasury Grant Program
In lieu of claiming certain U.S. federal income tax credits, in particular, the ITC, owners of eligible solar energy property were eligible for a period of time to receive a cash grant from
U.S. Treasury equal to 30% of the tax basis of the eligible property. Among other requirements, to be eligible for a 1603 Cash Grant, the eligible property must have been placed in service in 2009, 2010 or 2011 or, for property not placed in
service during that period, the construction of the specified energy property must have begun after December 31, 2008 and before January 1, 2012. In addition, eligible solar energy property must be placed in service by January 1, 2017. Applicants
who began construction after December 31, 2008 and before January 1, 2012, but who did not place the eligible solar energy property in service prior to October 1, 2012, were required to file a preliminary 1603 Cash Grant application prior to
October 1, 2012. These applicants were further required to file a final or “converted” 1603 Cash Grant application no later than 180 days after the eligible solar energy property was placed in service. The preliminary 1603 Cash Grant application
for Solana was filed in September 2012, and the final 1603 Cash Grant application for Solana was filed on November 14, 2013 with additional information provided to the U.S. Treasury in 2014. A final award from the U.S. Treasury was made as of
October 2014. The preliminary 1603 Cash Grant application for Mojave was filed on September 14, 2012. Mojave reached COD in December 2014, and a final 1603 Cash Grant application was filed on February 5, 2015. A final award from the U.S. Treasury
was made to Mojave as of September 2015.
Under the 1603 Cash Grant, certain persons, “disqualified persons,” are ineligible to receive the 1603 Cash Grant and are prohibited from owning a direct or indirect interest in otherwise 1603
Cash Grant-eligible solar energy property, unless the indirect interest is held through an entity taxable as a C-corporation for U.S. federal income tax purposes. 1603 Cash Grants are subject to recapture during the five-year period beginning on
the date the eligible solar energy property is placed in service. The amount of the 1603 Cash Grant subject to recapture decreases ratably over the five-year recapture period. Among other events, failure of the eligible property to be used for
its intended purpose or the direct or indirect transfer to a disqualified person (as described above) will cause recapture of the 1603 Cash Grant. Portions of the Solana and Mojave Cash Grant awards remain subject to this potential recapture.
Federal Loan Guarantee Program
The DOE, in an effort to promote the rapid deployment of renewable energy and electric power transmission projects, was authorized to grant guarantees with respect to certain loans to renewable
energy projects and related manufacturing facilities and electric power transmission projects under Section 1703 of EPACT 2005. Previously, the DOE also granted guarantees with respect to certain loans made under Section 1705 of EPACT 2005. In
order to have qualified for the Section 1705 program, physical construction must have commenced at the primary site of the project on or before September 30, 2011. NEPA review must have been completed prior to the issuance of a loan guarantee. In
May 2011, the Section 1705 program expired by statute, and the DOE announced that it would no longer accept new applications under that program. On September 30, 2011, the Section 1705 loan guarantee program closed with no further loan guarantees
to be issued. The DOE has also closed the Section 1703 loan guarantee program for solar assets, although it is still open for other technologies.
The senior debt for Solana and Mojave is guaranteed by the DOE pursuant to the Section 1705 loan guarantee program.
State and Local Regulation of the Electricity Industry in the United States
State regulatory agencies in the United States have jurisdiction over the rates and terms of electricity service to retail customers. Regulated investor-owned utilities often must obtain state
approval for the contracts through which they purchase electricity, including renewable energy, if they seek to pass along the costs of these contracts to their retail ratepayers. Municipal utilities and electric cooperatives are typically
governed on these matters by their city councils or elected boards of directors. Different states apply different standards for determining acceptable prices for utility procurement contracts, including PPAs. Our electricity generation project
companies operate in Arizona and California. Information about the regulatory frameworks in Arizona and California is provided below.
United States State-Level Incentives
In addition to federal legislation, many states have enacted legislation, principally in the form of renewable portfolio standards, or RPS, which generally require electric utilities to
generate or purchase a certain percentage of their electricity supplied to consumers from renewable resources. In certain states, it is not only mandatory to meet these percentages, which in general are on the increase from renewable resources,
but also electric utilities may be required to generate or purchase a percentage of their electricity supplied to consumers from specific renewable energy technologies, including solar technology. Depending upon the state, various certifications,
permits, contracts and approvals may be required in order for a project to qualify for particular RPS programs. Some states, for example, require that only renewable energy generated in-state counts towards the RPS. According to the Database of
State Incentives for Renewable Energy, as of January 2020, 49 states and United States territories have adopted some type of RPS standards. Although there is currently no federal RPS program, there have been proposals to create a federal RPS
standard for renewable energy.
RECs are typically used in conjunction with RPS programs as tradable certificates demonstrating that a certain number of kWh have been generated from renewable resources. Under many RPS
programs, a utility may generally demonstrate, through its ownership of RECs, that it has supported an amount of renewable energy generation equal to its state-mandated RPS percentage. The sale of RECs can represent a significant additional
revenue stream for renewable energy generators. In RPS states where a liquid REC market does not exist, renewable energy can be bought or sold through “bundled” PPAs, where the PPA price includes the price for renewable energy attributes. Some
states require that RECs and the associated electricity be purchased together in order to count towards the RPS. In states that do not have RPS requirements, certain entities buy RECs voluntarily. These RECs generally have lower prices than RECs
that are used to meet RPS obligations. The price of RECs can vary significantly, depending on their availability, which in turn depends upon the amount of renewable generation that has been put in service in a state that has implemented RPS
requirements. In some states, the number of successful projects has generated more RECs than required to meet the applicable RPS requirements for a given year or years, leading to steep drops in the market price for RECs. Additionally, demand for
RECs can be driven by requirements (such as those imposed under the California Environmental Quality Act) that development projects mitigate potential significant greenhouse gas (“GHG”) impacts identified in connection with environmental
clearances.
California has enacted legislation that increases its existing RPS to 60.0% by 2030 and 100% by 2045 for publicly-owned and investor-owned utilities, or IOUs. Arizona currently has a RPS of 15%
by 2025, with 30% of the RPS to be met from distributed generation, although there have been proposals to increase these percentages.
Other incentives that states and localities have adopted to encourage the development of renewable resources include property and state tax exemptions and abatements, state grants, and rebate
programs. In addition, a number of states collect electricity surcharges on residential and commercial users and through public benefit funds reinvest some of these funds in renewable energy projects. California offered a property tax incentive
for certain solar energy systems installed between January 1, 1999 and December 31, 2016. The Arizona Department of Revenue provides a corporate tax credit based on production for solar, wind, or biomass systems that are 5 MW or larger and are
installed on or after December 31, 2010 and before January 1, 2021.
Solar generation may also be incentivized by state GHG emission reduction measures, such as California’s cap and trade scheme, which caps and reduces GHG emissions. The California cap and trade
program went into effect with respect to the electricity and other sectors starting in 2013.
Arizona
Regulation of Retail Electricity Service in Arizona
The Arizona Corporation Commission (“ACC”) has complete and exclusive jurisdiction over the rates and terms under which regulated utilities may provide electricity service to retail customers
in Arizona. Under the Arizona Constitution, the ACC has unilateral authority over all utility regulation, including electric and natural gas utilities. The ACC also oversees all rate cases for its jurisdictional utilities, and as such has
oversight of renewable energy procurement contracts by regulated electric utilities. Under Arizona’s Renewable Energy Standard & Tariff (“REST”) regulated electric utilities must supply an increasing percentage of their retail electric energy
sales from eligible renewable resources, including solar, wind, biomass, biogas and geothermal technologies. The renewable energy requirement is 10% of retail electric sales in 2020 and increases annually until it reaches 15% in 2025.
Unlike many other state regulatory commissions, the ACC does not approve PPAs executed by regulated utilities, nor does it issue rulings of “prudency” regarding PPAs. This practice leaves a
utility somewhat at risk of recovering its costs until a successful rate case finding is rendered by the ACC. Rate recovery requests may not be filed until the utility begins to make actual expenditures for power procurement. In the case of
Solana, however, the power purchaser, Arizona Public Service Company, or APS, voluntarily sought a hearing before the ACC to request its informal opinion of the prudency of the Solana PPA. After ACC staff conducted an analysis of the costs and
benefits of Solana to Arizona ratepayers, it recommended to the ACC commissioners that the PPA should be deemed “a reasonable means” by which APS could meet its requirements under the REST. The ACC affirmed the staff’s recommendation on September
30, 2008, thereby providing greater assurance of APS’s successful rate recovery request.
Performance and Operational Provisions of Solana’s PPA
The PPA executed between APS and Solana’s project company, Arizona Solar, contains provisions related to guarantees of performance (e.g., provision of minimum annual REC eligible energy
quantities to APS). The provisions are largely intended to protect APS’ ability to meet its mandatory requirements under the REST, and to prevent APS from having to procure REC eligible power elsewhere at an unknown, and possibly higher, cost
than the PPA price.
Siting and Construction of New Power Generation Facilities in Arizona
The Arizona Power Plant & Transmission Line Siting Committee, or Siting Committee, oversees utility and private developer applications to build power plants (of 100 MW or more) or
transmission projects (of 115,000 volts or more) within Arizona. The Siting Committee holds public meetings and evidentiary hearings to determine whether a proposed generation or transmission project is compatible with the preservation of the
state’s environmental protection interests, and if the finding is affirmative, makes a recommendation to the ACC to grant a Certificate of Environmental Compatibility, to the applicant. The ACC then has authority to approve, decline or modify the
Siting Committee’s recommendation.
The ACC granted Certificates of Environmental Compatibility to Solana on December 11, 2008, for both the 280 MW solar generation project and its associated 20.8-mile, 230 kilovolt transmission
line. Both the generation facility and transmission line Certificates of Environmental Compatibility contain obligatory conditions and stipulations, none of which could present a risk to Solana during the operational phase.
Other Arizona Permitting and Compliance Frameworks
Various state and county regulations, mostly related to the environment and public health and safety, are applicable during the operational phase of a solar power plant located in Maricopa
County, Arizona. Such regulations include the Arizona Aquifer Water Quality Standards and Aquifer Protection Permit Rules, the Maricopa County Special Use Permit Stipulations, the Maricopa County Air Pollution Control Regulations, and the
Maricopa County Zoning Ordinances and Regulations. Obtaining a permit or requesting the approval of certain operating plans, as well as strict compliance with such permits and plans, is mandatory. Failure to comply may result in the revocation of
the permit or authorization, civil and criminal charges and fines, or potentially the closure of Solana.
In addition, in accordance with the NEPA designation of a Finding of No Significant Impact (FONSI) issued by the DOE, Solana must comply with certain water requirements due to the reduction in
tail water runoff being contributed to a wash located near the site. In coordination with Arizona Game & Fish Department and the U.S. Fish and Wildlife Service, Solana must provide 447 acre-feet of water annually as a direct off-set to the
reduction in tail water runoff from the site. This requirement is for the duration of Solana, and failure to comply would trigger an administrative procedure that could cause temporary closure of the plant until the non-compliance condition is
cured.
Regulations Affecting Operating Generating Facilities in Arizona
Many of the permits obtained for Solana carry specific conditions that must be complied with during the operational phase of the facility and which are continuously monitored, measured, and
documented by the Solana plant operators. The primary obligations that commenced during commissioning and/or commercial operation are those related to reliability, emergency response, potential hazards of waste disposal, and human health and
safety. These requirements originate with federal laws, and in many cases are enforced via delegated authority from the appropriate federal agency to a state or county agency. These include:
| • |
NERC Reliability Standards and Critical Infrastructure Plans, delegated to WECC as the regional authority;
|
| • |
Emergency Planning and Community Right-to-Know Act, delegated to the Arizona Division of Emergency Management;
|
| • |
Resource Conservation and Recovery Act, delegated to EPA Region 9 in San Francisco, California; and
|
| • |
Occupational Safety and Health Administration federal requirements.
|
California
Regulation of Retail Electricity Service in California
The California Public Utilities Commission, or CPUC, governs, among other entities, California’s three large investor-owned utilities, including Pacific Gas & Electric Company, or PG&E.
PG&E is required to file an RPS procurement plan annually with the CPUC. Once the CPUC approves the plan, PG&E issues a request for offers, or RFO, for renewable energy. It then evaluates all of the bids using a “least-cost, best-fit”
evaluation process approved by the CPUC and develops a short list of acceptable bids. In August 2008, Mojave was submitted as a renewable solar thermal project in response to PG&E’s 2008 RFO solicitation and placed on its short list for
additional negotiations. After two years of negotiations, PG&E and Mojave Solar executed a final PPA, for which PG&E filed with the CPUC an advice letter requesting approval of the PPA in July 2011. The CPUC reviewed the PPA and approved
the contract by issuing a formal decision in November 2011. The terms of the PPA govern Mojave during its development, construction and operating period. The CPUC historically does not retroactively apply new regulations or rulings to previously
approved PPAs that would result in any economic impact.
Performance and Operational Provisions of Mojave’s PPA
The PPA executed between PG&E and Mojave’s project company, Mojave Solar, contains provisions related to guarantees of performance (e.g., provision of minimum annual REC eligible energy
quantities to PG&E). The provisions are largely intended to protect PG&E’s ability to meet its mandatory requirements established by the CPUC, and to prevent PG&E from having to procure REC eligible power elsewhere at an unknown, and
possibly higher, cost than the PPA price.
Siting and Construction of New Power Generation Facilities in California
The California Energy Commission, or CEC, is the lead agency for licensing thermal power plants of 50 MW and larger under the California Environmental Quality Act and has a certified regulatory
program under such Act. The CEC is comprised of five commissioners, two of whom oversee all hearings, workshops and related proceedings on a specific project. The CEC’s siting process evaluates Applications for Certification, or AFCs, to ensure
that only power plants that are actually needed will be built, provides review by independent staff with technical expertise in public health and safety, environmental sciences, engineering and reliability, ensures simultaneous review and full
participation by all state and local agencies, as well as coordination with federal agencies, resulting in issuance of one regulatory permit within a specific time frame, with full opportunity for participation by public and interest groups.
On August 10, 2009, Mojave’s AFC for its nominal 250 MW project was filed with the CEC. The CEC approved Mojave’s AFC with the CEC decision issued on September 8, 2010. The CEC monitors the
power plant’s construction, operational phase and eventual decommissioning through a compliance proceeding.
Regulations Affecting Operating Generating Facilities in California
Mojave must maintain compliance with the CEC decision conditions of certification. These conditions of certification address, among others, biological resources, health and safety, cultural
resources, fire safety, and water. The conditions require Mojave to provide plans, notifications, and other reports on an ongoing basis. As noted above, such compliance is monitored by CEC staff. Per the CEC decision, “failure to comply with any
of the Conditions of Certification or the compliance conditions may result in reopening of the case and revocation of Energy Commission certification; an administrative fine; or other action as appropriate.” Additional regulations are
administered by the California Independent System Operator and under the terms of the federally administered Large Generator Interconnection Agreement.
Regulation in Mexico
Overview
The following is a description of the regulation of the Mexican power industry applicable to the conventional or natural gas generation of electricity.
Pursuant to the Mexican Constitution, the electricity industry in Mexico was entirely controlled by the federal government, acting through the Federal Electricity Commission, or CFE, an entity
wholly owned and controlled by the Mexican government, and legally independent from the Mexican Ministry of Energy, Secretaría de Energía. CFE was the only entity authorized to provide electricity directly to the public and to supply services to
the Mexican wholesale market. CFE was also responsible for the construction and maintenance of infrastructure necessary for the delivery of electricity, such as the national electric grid, the Sistema Eléctrico Nacional, or SEN.
As a result of Mexico’s energy reform bill enacted on December 21, 2013, articles 25, 27 and 28 of the Mexican Constitution were amended in order to end the long-standing state monopoly in the
oil, petrochemical and power sectors, and allow private investment in these areas for their development in an open market. Hence, the power generation sector is now open to full private participation and investment, creating a competitive spot
market in power generation, although electric transmission and distribution will remain public services to be provided exclusively by CFE. With the enactment of the secondary legislation, the generation, transmission, distribution and
commercialization of power in Mexico is governed by a new legal framework which will likely improve the development of the sector.
Notwithstanding the legal changes, we do not expect any negative consequences for ACT Energy Mexico, or ACT, or for the power generated and delivered to Pemex Gas y Petroquímica Básica. (today
Pemex Transformación Industrial).
Until the recent energy reform, the whole set of activities regarding generation, transmission, distribution and commercialization of power for public use were considered areas of national
strategic importance. As a result, such activities were carried out exclusively by CFE. The national electric grid was also controlled by CFE through the Centro Nacional de Control de Energía, or the CENACE, which operated the national electric
grid and controlled delivery of all electricity generated by CFE and private generators connected to the grid. CFE was a vertically-integrated state monopoly that served the whole country, and CENACE was a semi-independent agency that was part of
CFE. As a result of the energy reform, CENACE became a decentralized public agency, which will continue to be responsible for the operation and control of the national electric grid with the aim of having an impartial third party (not CFE)
operate the wholesale electricity market, guaranteeing open access to the national electric grid for both transmission and distribution of electricity. CENACE has emerged as an Independent System Operator, or ISO, which is a figure adopted
worldwide in other mature energy markets.
The generation, transmission and distribution of electricity were regulated by the Ley del Servicio Público de Energía Eléctrica, or Electricity Law; enacted in 1975 and amended in 1992. Since
the implementation of the 1992 amendment to the Electricity Law, private entities have been allowed to participate in the following activities not considered public utility services, as defined by such law:
| • |
Cogeneration. The electricity produced is used to supply power to the establishments associated with the cogeneration process and/or the shareholders of the
cogeneration company;
|
| • |
Self-Supply Generation. The electricity produced is used for the self-supply purposes of the holder of the relevant self-supply power generation permit and/or
its shareholders;
|
| • |
Independent Power Production. All the electricity produced is delivered to CFE;
|
| • |
Small-Scale Production. The electricity produced does not exceed 30 MW and is used for export purposes or the supply of all power output is sold to CFE;
|
| • |
Exports. The electricity produced is exported in its entirety; and
|
| • |
Imports for Independent Consumption. The import of power is used for self-supply purposes.
|
The regulatory framework of the Mexican power industry is undergoing a transitory period, as the energy reform is still in the process of being fully implemented, given that the secondary
legislation derived from such amendments to the Mexican Constitution was published in the Official Federal Gazette, or Diario Oficial de la Federacion, on August 11, 2014, and there are still a few regulatory instruments pending issuance. See
“—Regulation in Mexico—Transitory Regime—Electric Industry Law.”
The changes made by the energy reform are being implemented through a profound modification of the legal framework that had governed the development of the energy industry in the country, which
has involved the entrance into force of new laws and the amendment of current laws.
The new laws enacted so far are listed below:
| • |
Oil and Gas Law, or Ley de Hidrocarburos;
|
| • |
Electric Industry Law, or Ley de la Industria Eléctrica;
|
| • |
Geothermal Energy Law, or Ley de Energía Geotérmica;
|
| • |
Petróleos Mexicanos Law, or Ley de Petróleos Mexicanos;
|
| • |
Federal Electricity Commission Law, or Ley de la Comisión Federal de Electricidad;
|
| • |
Energy Regulatory Bodies Law, or Ley de los Organos Reguladores Coordinados en Materia Energética;
|
| • |
National Industrial Safety and Environmental Protection Law of the Oil and Gas Sector, or Ley de la Agencia Nacional de Seguridad Industrial y de Protección al Medio Ambiente del Sector Hidrocarburos;
|
| • |
Mexican Petroleum Fund for Stabilization and Development, or Ley del Fondo Mexicano del Petróleo para la Estabilización y el Desarrollo; and
|
| • |
Oil and Gas Revenue Law, or Ley de Ingresos sobre Hidrocarburos.
|
| • |
Energy Transition Law or Ley de Transición Energética.
|
Additionally, 12 laws were amended in order to unify their content with the new regulatory framework. The following are the amended laws:
| • |
Foreign Investment Law, or Ley de Inversión Extranjera;
|
| • |
Mining Law, or Ley Minera;
|
| • |
Private Public Partnerships Law, or Ley de Asociaciones Público Privadas;
|
| • |
National Water Law, or Ley de Aguas Nacionales;
|
| • |
Federal Law of Government-Owned Entities, or Ley Federal de las Entidades Paraestatales;
|
| • |
Public Sector Acquisitions, Leases and Services Law, or Ley de Adquisiciones, Arrendamientos y Servicios del Sector Público;
|
| • |
Public Works and Related Services Law, or Ley de Obras Públicas y Servicios Relacionados con las mismas;
|
| • |
Organizational Law of the Federal Government, or Ley Organica de la Administracion Publica Federal;
|
| • |
Federal Fees Law, or Ley Federal de Derechos;
|
| • |
Fiscal Coordination Law, or Ley de Coordinación Fiscal;
|
| • |
Federal Budget and Treasury Accountability Law, or Ley Federal de Presupuesto y Responsabilidad Hacendaria; and
|
| • |
General Public Debt Law, or Ley General de Deuda Pública.
|
Furthermore, on October 31, 2014, the following regulations and regulatory instruments, which will contribute to the implementation of the aforementioned secondary legislation, were published in the Official
Federal Gazette:
| • |
Regulations of the Oil and Gas Law, or Reglamento de la Ley de Hidrocarburos;
|
| • |
Regulations of the activities referred to in Chapter Three of the Oil and Gas Law, or Reglamento de las actividades a que se refiere el Título Tercero de la Ley de Hidrocarburos;
|
| • |
Oil and Gas Revenue Law Regulations, or Reglamento de la Ley de Ingresos sobre Hidrocarburos;
|
| • |
Electric Industry Law, or Reglamento de la Ley de la Industria Eléctrica;
|
| • |
Geothermal Energy Law Regulations, or Reglamento de la Ley de Energía Geotérmica;
|
| • |
Regulations of Petroleos Mexicanos Law, or Reglamento de la Ley de Petróleos Mexicanos;
|
| • |
Regulations of the Federal Commission of Electricity Law, or Reglamento de la Ley de la Comisión Federal de Electricidad;
|
| • |
Internal Regulations of the Mexican Ministry of Energy, or Reglamento Interior de la Secretaria de Energía; and
|
| • |
Internal Regulations of the National Agency of Industrial Safety and Environmental Protection, or Reglamento Interior de la Agencia Nacional de Seguridad Industrial
y de Protección al Medio Ambiente del Sector Hidrocarburos.
|
Additionally, the executive branch also published the following decrees, which amended the existing regulations of different laws and which are relevant for the development of the energy sector:
| • |
Decree amending and supplementing various provisions of the Public Partnerships Law Regulation, or Decreto por el que reforman, adicionan y derogan diversas disposiciones del Reglamento de la Ley de
Asociaciones Público Privadas;
|
| • |
Decree amending and supplementing various provisions of the Federal Budget and Treasury Accountability Law, or Decreto por el que reforman, adicionan y derogan diversas disposiciones del Reglamento de
la Ley Federal de Presupuesto y Responsabilidad Hacendaria;
|
| • |
Decree amending and supplementing various provisions of the Internal Regulation for the Ministry of Finance and Public Credit, or Decreto por el que reforman, adicionan y derogan diversas
disposiciones del Reglamento Interior de la Secretaría de Hacienda y Crédito Público;
|
| • |
Decree amending and supplementing various provisions of the Regulations of the Mining Law, or Decreto por el que reforman, adicionan y derogan diversas disposiciones del Reglamento de la Ley Minera;
|
| • |
Decree amending and supplementing various provisions of the Regulations of the Foreign Investment Law and of the National Registry of Foreign Investment, or Decreto por el que reforman, adicionan y
derogan diversas disposiciones del Reglamento de la Ley de Inversión Extranjera y del Registro Nacional de Inversiones Extranjeras;
|
| • |
Decree amending and supplementing various provisions of the Internal Regulations of the Ministry of Economics, or Decreto por el que reforman, adicionan y derogan diversas disposiciones del Reglamento
Interior de la Secretaría de Economía;
|
| • |
Decree amending and supplementing various provisions of the Internal Regulations of the Ministry of Agrarian, Territory and Urban Development, or Decreto por el que reforman, adicionan y derogan
diversas disposiciones del Reglamento Interior de la Secretaría de Desarrollo Agrario, Territorial y Urbano;
|
| • |
Decree amending and supplementing various provisions of the Regulations of the General Law for Sustainable Forestry Development, or Decreto por el que reforman, adicionan y derogan diversas
disposiciones del Reglamento de la Ley General de Desarrollo Forestal Sustentable;
|
| • |
Decree amending and supplementing various provisions of the Regulations of the General Law of Ecological Balance and Environmental Protection on Environmental Impact Assessment, or Decreto por el que
reforman, adicionan y derogan diversas disposiciones del Reglamento de la Ley General del Equilibrio Ecológico y la Protección al Ambiente en Materia de Evaluación del Impacto Ambiental;
|
| • |
Decree amending and supplementing various provisions of the Regulations of the General Law of Ecological Balance and Environmental Protection regarding prevention and Control of Air Pollution, or
Decreto por el que reforman, adicionan y derogan diversas disposiciones del Reglamento de la Ley General del Equilibrio Ecológico y la Protección al Ambiente en Materia de Prevención y Control de la Contaminación de la Atmósfera;
|
| • |
Decree amending and supplementing various provisions for the Regulations of the General Law for Prevention and Integral Waste Management, or Decreto por el que reforman, adicionan y derogan diversas
disposiciones del Reglamento de la Ley General para la Prevención y Gestión Integral de Residuos;
|
| • |
Decree amending and supplementing various provisions of the Regulations of the General Law of Ecological Balance and Environmental Protection on Environmental Zoning, or Decreto por el que reforman,
adicionan y derogan diversas disposiciones del Reglamento de la Ley General del Equilibrio Ecológico y la Protección al Ambiente en Materia de Ordenamiento Ecológico;
|
| • |
Decree amending and supplementing various provisions of the Regulations of the General Law of Ecological Balance and Environmental Protection regarding Emissions to the Atmosphere and Transfer of
Pollutants, or Decreto por el que reforman, adicionan y derogan diversas disposiciones del Reglamento de la Ley General del Equilibrio Ecológico y la Protección al Ambiente en Materia de Registro de Emisiones y Transferencia de
Contaminantes;
|
| • |
Decree amending and supplementing various provisions of the Internal Regulations of the Ministry of Environment and Natural Resources, or Decreto por el que reforman, adicionan y derogan diversas
disposiciones del Reglamento Interior de la Secretaría de Medio Ambiente y Recursos Naturales; and
|
| • |
Decree amending and supplementing various provisions of the Regulations of the General Law of Ecological Balance and Environmental Protection on Self-Regulation and Environmental Audits, or Decreto
por el que reforman, adicionan y derogan diversas disposiciones del Reglamento de la Ley General del Equilibrio Ecológico y la Protección al Ambiente en Materia de Autorregulación y Auditorías
Ambientales
|
Conventional Electricity Generation in Mexico
The former legal framework for conventional electricity generation in Mexico included the regulation of fossil fuels, such as carbon, diesel, fuel oil and natural gas, as well as nuclear
fission regulation, which includes nuclear power plants and all related activities.
Accordingly, power generation under independent power production or self-supply schemes was not considered a public utility service and, therefore, could be performed by private companies and
individuals pursuant to permits issued by the Energy Regulatory Commission, Comisión Reguladora de Energía, or CRE. The CRE is a federal agency created in 1995 in order to enforce the laws and
regulations relating to natural gas and electricity, and has the authority to issue permits, set tariffs, supervise, ensure adequate supply and, in the case of gas, promote competition.
As previously indicated, the Mexican federal government, acting through CFE, controlled the entire chain of activities related to electric power, including generation, sale, distribution and
transmission. The energy reform allows the private sector to openly participate in two important parts of the production chain: the generation and the sale of electricity.
Pursuant to the reform, the private energy sector is now able to invest in electricity generation with the requisite permits. The sale of electricity by private parties is already taking
place, with the initiation of operations of the Wholesale Electricity Market, Mercado Electrico Mayorista, or MEM, in Mexico under the new legal framework, privately sold electricity is being
transmitted and distributed by CFE.
The reforms are expected to have positive effects on the electricity industry in Mexico, allowing the private sector to play an active role where a government monopoly once existed,
generating greater investment and better technology.
As a result of the energy reform, the electricity sector has ceased to be a chain of activities vertically integrated in a partially privatized sector, and has become an area open to private
investment in which, although CFE will maintain control, the possibility of private sector investment has increased significantly and will continue to be increased through a more flexible regulatory scheme that permits the execution of
contracts to carry out various activities and the creation of new markets in the electricity sector. Among the most significant changes are the following:
| • |
Participation that is open to the private sector in the generation of electricity through a permit granted by CRE. Private parties may also sell the energy generated and transmitted by CFE through
commercial schemes.
|
| • |
Participation of the private sector, together with CFE, in the activities of transmission and distribution through the execution of the corresponding service contracts.
|
| • |
Participation of the private sector in activities of financing, maintenance, management, operation and expansion of the power infrastructure through service contracts with CFE, with adequate
compensation.
|
| • |
Transformation of the CENACE into a decentralized public body responsible for the operational control of the national electric grid, so that it is an impartial third party (and not the CFE) that
operates the wholesale electricity market, guaranteeing open access to the national electric grid, for both transmission and distribution of electric power.
|
| • |
Creation of the MEM, operated by the CENACE, in which the participants carry out electric power purchase and sale transactions through contracts between the participants in the MEM. The CENACE is now
responsible for managing the supply and demand of the MEM participants, carrying out transactions and generating prices continuously. The price paid in the MEM transactions represents a competitive price, reflecting the costs of
generation and other operating costs of electricity, as well as the volume of electric power demanded and supplied in the MEM.
|
| • |
Creation of the trader, under the new Electric Industry Law, as the holder of a MEM participant agreement, which purpose is to carry out trading activities (execution of contracts for purchase and
sale of electricity within the MEM, among others). The traders may sign contracts with qualified users (through the provider-trader) or execute such contracts with other traders (non-provider trader).
|
| • |
The permits granted by the CRE under the currently repealed Electricity Law, will continue in force under its terms. The holders of those permits that choose to remain under the provisions of the
Electricity Law may, at any time, transfer to the new rules.
|
| • |
The Geothermal Energy Law, the purpose of which is to regulate the recognition, exploration and exploitation of geothermal resources for the use of underground thermal energy within the limits of
Mexican territory, in order to generate electricity or use it otherwise.
|
| • |
The activities regulated by the Geothermal Energy Law are considered to be in the public interest and their development will have preference over activities of other sectors when there is a conflict.
|
| • |
The activities pursued under the Geothermal Energy Law will be carried out through different registries, permits, authorizations and concessions granted by the competent authorities applicable for
each case. For exploration activities, a permit will be sufficient, while for exploitation activities, a concession will be required.
|
| • |
Amendment of several articles of the National Water Law, for the purpose of (i) adapting certain definitions of that law to the new definitions introduced by the Geothermal Energy Law; (ii) including
geothermal fields under regulated, prohibited or reserved zones; and (iii) establishing the obligation of requesting the relevant permits, authorizations and concessions from the National Water Commission in order to engage in the
activities of geothermal fields exploration.
|
Electric Industry Law
The Electric Industry Law, as part of the package of secondary legislation that implements the constitutional energy reform, regulates planning activities, the control of the national
electric grid, the public services of transmission and distribution of electricity, and all other activities related to the Mexican energy industry, in order to promote the sustainable development of the industry and to ensure its continuous,
efficient, and secure operation for the benefit of all users, as well as the fulfillment of the obligations to provide a general and public service of electricity, to develop clean energies, and to reduce contaminating emissions.
Pursuant to the Electric Industry Law, the government holds the operational control of the national electric grid, through the CENACE, and CENACE, as an ISO, will indicate the elements for
the national transmission grid and the related operations which may correspond to the wholesale market.
Regulations of the Electric Industry Law
The Regulations of the Electric Industry Law provide details for the application of the Electric Industry Law and complete the implementation of the restructured electric industry in Mexico.
These regulations expand on certain administrative procedures in the electric industry, such as the development of public bidding procedures by CFE, for private sector contracts for
activities related to the national electric grid; the specific requirements for the application for power generation and power supply permits with CRE; the process for infrastructure contributions by the private sector to the State; and the
registration of participants in the wholesale spot market with CENACE.
Permits and Authorizations
Pursuant to the Electric Industry Law, all power plants with a capacity greater than or equal to 0.5 MW and all power plants of all capacities represented by a generator (i.e., the holder of
one or more generation permits or holder of a wholesale market participant agreement that represents the corresponding power plants in the wholesale market or, prior authorization granted by CRE, power plants located abroad) require a
generation permit granted by CRE. Authorization granted by CRE is also required for the import of electricity from a power plant located abroad and interconnected exclusively to the national electric grid. Power plants of any capacity
exclusively intended for personal use during emergencies or interruptions in electric supply will not require a permit.
The Electric Industry Law provides for several requirements which generators who represent power plants interconnected to the national electric grid have to comply with, including, among
others, the execution of the corresponding interconnection agreements, issued by CRE. Regarding the production of their power plants, generators may carry out commercialization activities which include, among others, the following: (i)
representing exempt generators (i.e., owner or holder of one or more power plants which do not require or have a generation permit) in the MEM; (ii) carrying out sale and purchase transactions of energy, related services included in the MEM,
and power or other products which ensure enough resources to meet the electric demand, and all other products, duties or penalties required for the efficient operation of the national electric grid, among others; and (iii) executing, among
others, the corresponding electric coverage agreements (i.e., agreement entered into by participants of the MEM which purpose is the sale and purchase of electric energy or related products) with other MEM participants, including other
generators, traders (i.e., holder of a MEM participant agreement which purpose is to carry out commercialization activities), and qualified users (i.e., final user who is registered before CRE to acquire electricity supply as a MEM participant
or through a qualified provider).
Pursuant to the former legal framework for the Mexican electric industry, permits for self-supply, cogeneration, independent production, small production, import, and export of electricity
were granted by CRE for indefinite periods of time, except for independent power producer permits, which were granted for 30-year renewable terms. In addition to the legal and technical requirements established by law to obtain such permits,
CFE’s approval was required as part of CRE’s permit approval process. Pursuant to the transitory regime, such permits will be in force for the duration of the corresponding interconnection agreements executed under their scope; nevertheless,
such interconnection agreements should have achieved commercial operation by December 31, 2019 at the latest, or otherwise be cancelled.
CRE may also issue a supply permit for private parties, which will allow companies to participate in the MEM by carrying out transactions with final users, which are called “qualified users.”
In this sense, private parties may supply power directly to consumers through bilateral long-term agreements, which will be partially regulated by the CRE.
Consequently, the Mexican power industry had been divided into two main areas: (i) the public service of electricity under CFE’s control, and (ii) the activities where private parties may be
involved (such as where CFE actively promoted private investment in the construction and operation of power plants for supplying CFE and private parties under self-supply and cogeneration schemes).
While power generated in Mexico is still predominantly generated by CFE, there is a large amount of electricity generated by private energy producers, which generally fall under the
categories of independent power production and self-supply generation, although cogeneration has come to be a relevant source of power as a result of certain amendments enacted in 2006 which allowed Pemex to develop new cogeneration projects
independently and in collaboration with CFE. These amendments allowed Pemex to enter into the Pemex conversion services agreement and to receive the power generated by ACT.
As a consequence of the corresponding reforms the issuance of a new class of permit available to those interested in generating electricity is provided for pursuant to the Electric Industry
Law. This permit expanded the ways in which entities are allowed to participate as energy producers under the Electric Industry Law and is within the scope of the CRE’s regulatory control.
The permits provided for in the Electric Industry Law are, as aforementioned, granted and issued by CRE, upon prior submission of the corresponding application, payment of the corresponding
duties, all relevant legal and technical information, and project description. Such permits will be terminated or revoked pursuant to the different scenarios indicated in the Electric Industry Law and its regulations, and as determined by CRE.
The regulations list the documentation to be submitted to apply for a permit with CRE, as well as the corresponding timeline for the application procedure and the essential elements that CRE
must include in the permit title.
Transmission and Distribution of Electricity in Mexico
Pursuant to the Electric Industry Law, regarding conventional energy generation, dispatchers and distributors are responsible for the national transmission grid and the general distribution
grids and will operate their grids pursuant to the instruction provided by CENACE. Whereas in the past there were no regulatory limitations that would interfere with a private generator engaging in transmission activities, and, regarding
distribution activities, these could only be performed by CFE, with the new regulatory framework derived from the constitutional reform and the legal provisions therein, the public service of electricity and its transmission are considered as
strategic areas and will continue to be government-controlled, notwithstanding the possibility of the Mexican government, acting through CFE, to be able to enter into agreements with the private sector, or, acting through the Mexican Ministry
of Energy, to form partnerships or enter into agreements with the private sector to carry out the financing, installation, maintenance, administration, operation or expansion of the infrastructure required to provide electricity transmission
and distribution services, in terms of the provisions of the Electric Industry Law.
Such agreements will be awarded to private companies through bidding rounds, conducted by CENACE, which will determine the needs of the national electric grid, and carry out the corresponding
tender processes. In addition, all dispatchers and distributors will have the obligation to execute the corresponding connection and interconnection agreements, based on the model contracts issued by CRE, regarding the interconnection of power
plants or the connection of load centers, and the MEM regulations will indicate the criteria for CENACE to define the specifications for the required infrastructure necessary for the interconnection of power plants and the connection of load
centers, as well as the mechanisms to determine preference matters for applications or requests and the procedure for their evaluation.
CFE is required by law to provide its wheeling (the transfer of electrical power through transmission and distribution lines to another utility), dispatch and backup services to all permit
holders whenever the requested service is technically feasible on a first-come, first-served basis. CFE’s wheeling services are provided pursuant to an interconnection agreement and a transmission services agreement entered into between CFE and
the relevant permit holder (in ACT’s case, these were executed by Pemex). Those agreements follow model contracts approved by the CRE, which also approves the methodology used to calculate the applicable tariffs. The permit holders must build
their own transmission lines for self-use in order to connect to the power grid. In addition, permit holders are required to enter into a back-up services agreement with CFE, which also follow a model agreement approved by the CRE.
The Electric Industry Law incorporates new requirements to carry out the sale and purchase of electricity. Aside from being classified as a generator or qualified user, along with the need to
comply with the rules issued by CRE for the execution of the corresponding agreements, there are new requirements for the interconnection to the transmission grid owned by CFE. The Electric Industry Law introduces and provides for the concepts
of connection and interconnection, the first referring to the load points of users and the latter referring to generators’ power plants. Regarding interconnection, the most significant change is the need to execute new model agreements in order
to adapt them to the new modalities and activities under the scope of regulation of the Electric Industry Law.
Furthermore, the transitory provisions contained in the Electric Industry Law provide that those interconnection agreements which were executed under the scope of regulation of the
Electricity Law will remain in force, notwithstanding the possibility that executing the new contract models that have been issued by CRE may prove beneficial in order to adapt to the new changing aspects of the industry; as with previous
agreements, companies will only be limited to the authorized activities under such contracts (e.g. wheeling will only be available for the amount of energy and for the specific purpose established therein). This suggests that new models of
interconnection agreements may be more flexible to cover the implementation of the various activities allowed.
The regulations provide that CRE must implement a regulatory regime providing for the conditions for the procurement of the public services of transmission and distribution of electric power
based on the principles of proportionality and equality, aiming to prevent transporters, distributors and suppliers from exercising excessive market power that could negatively affect final users. Such regulatory regime considers the degree of
openness in the market, the concentration of participants and any other condition of the competition in every division of the industry. The regulations also establish the possible cases of curtailment of the services of transmission and
distribution of electric power and provide for standard procedures in different situations.
Commercialization of Electricity
Under the Electric Industry Law, the trader is the holder of a MEM participant agreement, and carries out commercial activities, among which are executing electric coverage agreements for the
sale and purchase of electricity within the MEM. Under the Electric Industry Law, electric coverage agreements are those agreements executed between MEM participants through which those participants engage in the sale of electric energy or
related products. Traders may enter into such agreements with qualified users (through the figure of the provider-trader) or with other traders (who are not providers).
Excluding qualified users, basic providers provide the basic supply to all people who so request it and whose load centers are located in their operation areas. Qualified providers provide
the qualified supply to qualified users in terms of free competition. Prior commencement of the qualified or basic supply services, the final user must execute a supply agreement with the appropriate provider, and such agreements will require
registration before the Federal Attorney’s Office of Consumer, or Procuraduria Federal del Consumidor, or PROFECO. In this regard, CRE issues the general terms and conditions for the electrical supply
services, which will determine the rights and obligations of the service provider and the final user, correspondingly.
Qualified users are those final users who are duly registered as such before CRE in order to acquire power as MEM participants or by a qualified provider. In terms of the Electric Industry
Law, users holding load points with a demand greater than or equal to 3 MW may be included in the qualified users registry (but such amount will decrease in one MW per year following the first year until reaching 1 MW). In this case, having the
property in which the electric power is intended to be supplied registered as qualified under the corresponding rules to be issued will suffice. Within the MEM, qualified users may purchase energy through electric coverage agreements executed
with CENACE or directly with traders.
Supply
Supply activities carried out in the new electric industry may be either in the basic or qualified modalities. Power supply agreements may be executed by and between providers and final
users, under the corresponding supply permits issued by CRE. Basic supply refers to that which is provided by a provider under a regulated tariff to any applicant who is not a qualified user. “Qualified supply” refers to that which is provided
in terms of free competition to qualified users.
For basic supply, private generators may participate in the auctions conducted by CENACE, in order for CFE to acquire the energy in the most convenient economic terms and conditions, and thus
CFE will be able to supply power to users who so request it before CENACE, who will carry out the referred auction and determine whom the electricity will be purchased from (these auctions have been currently cancelled by the current federal
administration). CRE will also determine the requirements that providers must comply with in order to acquire energy and execute contracts for electric coverage with users.
As for qualified supply, qualified providers may carry out transactions directly through long-term supply agreements with qualified users. Under these agreements, the parties are be free to
agree upon the terms and conditions (including economic conditions) thereof, abiding by certain general guidelines issued by CRE.
Open Access
Both the Electric Industry Law and in the regulations thereunder establish that CFE is obligated to grant non-discriminatory open access to all users of the national electric grid. This
enhances the existence of an open electricity market, where various competitors in almost all segments of the supply chain requiring the use of the national electric grid coexist and develop their activities. Open access is a crucial component
of the electric industry since CFE, as owner of the grid, competes directly with other private sector participants in several activities of the industry, which could lead to a monopoly by CFE. In order to avoid such situation, the CENACE, as an
independent system operator, will ensure competitive conditions for all users who want to use CFE’s infrastructure.
Pursuant to the regulations, CRE issued the general guidelines regarding open access conditions, the procedure for users to request such open access and the procedure to which the CENACE will
be subject to grant this open access, among others.
Tariffs
Transmission, distribution, basic supply and last resort supply, as well as the operation of CENACE, are subject to regulatory accounting guidelines established by CRE. CRE has issued general
administrative provisions regarding the methodology to determine the calculation and adjustment of the regulated tariffs for transmission, distribution, basic provider operation and CENACE operation services, as well as all related services
which are not included in the MEM.
Dispatchers, distributors, basic providers and the CENACE are required to publish their tariffs, as indicated by CRE, through general administrative provisions.
Wholesale Spot Market, Mercado Eléctrico Mayorista
The Electric Industry Law provided for the creation of a MEM, operated by CENACE, in which participants can carry out a number of different transactions provided for in said law, among which
are the sale of electricity and related products.
MEM participants can be (i) generators, (ii) provider-traders, (iii) non-provider traders, or (iv) qualified users, prior to execution of the corresponding agreement with CENACE. Transactions
carried out within the MEM must be formalized through “electric coverage agreements” executed by and between such MEM participants. Generators, as MEM participants may, sell their generated energy and both traders and qualified users may
purchase such energy through CENACE, which is the independent operator of the electric system.
CENACE is responsible for managing the supply and demand of MEM participants, conducting transactions and continuously generating prices. The price to be paid in MEM transactions has to be a
“competition price” in terms of the Electric Industry Law and has to reflect elements such as electricity generation costs and other operating costs, as well as the amount of electricity demanded by and supplied within the MEM. Such competition
price serves as a reference for long-term supply agreements between providers and qualified users, partially replacing the current CFE-published tariffs.
Even though the Electric Industry Law provides the general guidelines to which the operation of the MEM is subject, on September 8, 2015, the Mexican Ministry of Energy published the
Guidelines of the Market (Bases del Mercado Eléctrico), as the general administrative provisions which establish the principles for the design and operation of the MEM. The regulations list certain
topics which are described in depth in the Rules of the Market (Reglas del Mercado), such as the methodology that is used to forecast the level of demand in the spot market, information on market
participants, and the methodology to determine the price of the electricity sold and purchased within the spot market.
The Guidelines are part of the Rules of the Market, which are administrative provisions of general application that specifically detail different aspects of the operation of the MEM, and
determine the rules that all market participants, such as generators, traders, suppliers, non-supplier traders or qualified users, as well as the competent authorities must comply with. It further outlines the procedures they must follow in
order to maintain the proper management, operation and planning of the MEM. Pursuant to the Guidelines, which were subsequently supplemented by guidelines for market practices, operational guidelines and criteria and operating procedures, the
different participants of the electricity industry are able to carry out activities which are now open to private participation, due to the so-called energy reform that took place in late 2013 in Mexico, and which were implemented and now
regulated through the Electric Industry Law and its Regulations (such activities include, among others, transactions of sale of electricity and related services, power, financial transmission rights and clean energy certificates).
Public Consultation
The Electric Industry Law and the regulations thereunder set out the obligation to carry out a prior consultation process in the event a project is to be developed in certain lands where
communities or indigenous people are found. This obligation, which is established in international treaties, as well as in Article 2 of the Political Constitution of the United Mexican States, is now established in the new legal framework to
provide certainty regarding community and social issues in all projects within the electric industry.
The aforementioned general obligation is provided for in the Electric Industry Law and the regulations thereunder detail the specific procedure to be followed, including the filing of a
social and cultural impact assessments before the Mexican Ministry of Energy and the different stages that the prior consultation entail, among others.
Transitory Regime
Given that the Electric Industry Law set various deadlines for the full implementation of its provisions (such as the issuance of the “Market Rules”, the full entry into operation of the MEM;
or the Terms and Conditions for the Supply of Electricity), a transitory regime was established. This regime intended to provide clarity and certainty to all participants of the industry who had ongoing projects, or planned to start projects at
that time of transition.
Permits
Permits granted by CRE, in accordance with the Electricity Law, will continue to be governed under the terms set out therein and other applicable provisions. Holders of such permits who
decide to remain under the regulation of Electricity Law may, at any time, migrate to the new regime if it suits their interests.
Interconnection agreements
In order to be able to execute an interconnection agreement in terms of the Electricity Law (in the event not previously executed), those interested in doing so should have complied with the
following conditions: (i) having obtained or having applied for a permit in any of the modalities provided by the Electricity Law, prior to the entry into force of the Electric Industry Law (August 11, 2014); (ii) having notified CRE about its
intention to continue with the development of the relevant project; and (iii) having provided proof evidencing that the appropriate financing for the project has already been obtained, that they have already contracted the supply of the main
equipment required for the project, and that at least 30% of the total investment for the project has been paid, before December 31, 2016. Additionally, it is possible to execute an interconnection agreement in terms of the Electricity Law if a
company participated in an open season process, through which CRE granted transmission capacity to several participating companies.
The Electric Industry Law also provides certainty regarding interconnection agreements which have been executed with CFE prior to the enactment of the Electric Industry Law, as those
agreements which were executed under the scope of regulation of the Electricity Law will remain in force for their entire duration (although they will not be subject to renewal or extension upon their termination). With the enactment of the
Electric Industry Law, it is now only possible to modify executed interconnection agreements in relation to the load points, surplus sales, support services; cost of stamp wheeling and other conditions contained therein which may apply.
Permit holders who choose to remain under the scope of regulation of the Electricity Law and decide to keep their interconnection agreements will be governed by the terms and conditions set
forth therein and, consequently, will not be subject to the rules of the MEM.
Notwithstanding the foregoing, it is important to mention that the transitory clauses of the Electric Industry Law provide that if those interconnection agreements executed under the
provisions of the Electricity Law do not reach commercial operation by December 31, 2019 at the latest, then they will be cancelled.
Network’s Code
On April 8, 2016, the Network’s Code (Código de Red) was published in the Federal Official Gazzette. Such code establishes the conditions of
efficiency, quality, reliability, continuity and sustainability in order to allow and promote the development, maintenance, operation, enlargement and modernization of the National Electric System in a coordinate way based on the
technical-operative requirements, and in an economical and efficient way, under the principles of open access and without improper discrimination.
Among other provisions, the Network’s Code sets forth the obligation of different market participants to meet several technical requirements and improvements of their electric facilities with
the purpose of ensuring the efficiency, quality, reliability, continuity and sustainability of the Sistema Eléctrico Nacional.
It is important to bear in mind that the Network’s Code became effective by April 9, 2019, which provided members of the industry (grandfathered or not) a three year period to complete all
works necessary to meet the aforementioned requirements. Taking into consideration the foregoing, all members of the industry should have finished such works by April, 2019. Strictly speaking, if any member of the industry did not timely comply
with this obligation, the relevant penalties will be imposed.
Former Regulatory Framework
The following laws and regulations include constitutional, legal and administrative provisions applying to the development of cogeneration projects in Mexico, according to the former regulatory framework:
| • |
The Mexican Constitution. Pursuant to articles 25, 27 and 28 of the Mexican Constitution, the supply of electricity, a public service in Mexico, including its generation, transmission, transformation,
distribution and sale are activities expressly reserved to the Mexican federal government.
|
| • |
Electricity Law. Along with its regulations, this law provides the main legal framework through which the Mexican federal government, acting through CFE, provides the public its electricity supply, as
well as the regulations applicable to power generation, sale and purchase for the private sector.
|
| • |
Law of the Energy Regulatory Commission, Ley de la Comisión Reguladora de Energía. This regulates the manner in which the CRE operates.
|
| • |
Resolution number RES/146/2001, issued by the CRE: Fee Calculation Methodology for Electricity Transmission Services, Metodología para la determinación de los cargos
por servicios de transmisión de energía eléctrica. This regulation provides the mechanism pursuant to which CFE will calculate the appropriate charges for the requests of transmission services.
|
| • |
Interconnection Agreement, Contrato de Interconexión, issued by the CRE.
|
| • |
Transmission Agreement, Convenio de Transmisión, issued by the CRE.
|
| • |
Methodology and criteria for high-efficiency cogeneration, Metodología y criterios de cogeneración eficiente
|
| • |
Guidelines for the validation as high-efficiency cogeneration systems (Disposiciones para acreditar sistemas de cogeneración eficiente).
|
Current Regulatory Framework
The following laws and regulations are among the main provisions that include constitutional, legal and regulatory provisions applying to the development of cogeneration projects in Mexico,
according to the recently enacted regulatory framework:
| • |
Political Constitution of the United Mexican States (Constitución Política de los Estados Unidos Mexicanos).
|
| • |
Electric Industry Law (Ley de la Industria Eléctrica).
|
| • |
Regulation of the Electric Industry Law (Reglamento de la Ley de la Industria Eléctrica)
|
| • |
Energy Regulatory Bodies Law (Ley de los Órganos Reguladores Coordinados en Materia Energética).
|
| • |
Energy Transition Law (Ley de Transición Energética).
|
| • |
Federal Electricity Commission Law (Ley de la Comisión Federal de Electricidad).
|
| • |
Regulations of the Federal Electricity Commission Law (Reglamento de la Ley de la Comisión Federal de Electricidad).
|
| • |
Terms for the strict legal segregation of the Federal Electricity Commission (Términos para la estricta separación legal de la Comisión Federal de Electricidad).
|
| • |
Geothermal Energy Law (Ley de Energía Geotérmica).
|
| • |
Guidelines that regulate the criteria for granting clean energy certificates (Lineamientos que establecen los criterios para el otorgamiento de certificados de
energía limpia) which have been recently amended and which relevant implications will be further mentioned below.
|
| • |
Guidelines of the Market (Bases del Mercado Eléctrico).
|
| • |
Network’s Code (Código de Red).
|
| • |
General Administrative Provisions that establish the terms for the operation of the Register of Qualified Users (Disposiciones administrativas de carácter general que
establecen los términos para la operación y funcionamiento del registro de Usuarios Calificados).
|
| • |
Resolution by means of which the Energy Regulatory Commission issues the general administrative provisions that establish the general conditions for the provision of the energy supply (Resolución por la que la Comisión Reguladora de Energía expide las Disposiciones administrativas de carácter general que establecen las condiciones generales para la prestación del suministro eléctrico).
|
| • |
Mechanism to request the modification of the permits granted under the Electricity Public Service Law for generation permits, as well as the criteria under which the permit holders of such regime may
execute an interconnection contract while the Wholesale Electricity Market becomes effective (Mecanismo para solicitar la modificación de los permisos otorgados bajo la Ley del Servicio Público de
Energía Eléctrica por permisos con carácter único de generación, así como los criterios bajo los cuales los permisionarios de dicho régimen podrán celebrar un contrato de interconexión en tanto entra en operación el mercado
eléctrico mayorista).
|
| • |
General administrative provisions for the operation of the certificate procurement system and the compliance with the clean energy obligations (Disposiciones
administrativas de carácter general para el funcionamiento del sistema de gestión de certificados y cumplimiento de obligaciones de energías limpias).
|
| • |
General administrative provisions that establish the minimum requirement to be met by suppliers and qualified users participating in the Electricity Market to acquire energy demand in terms of article
12, section XXI, of the Electricity Industry Law (Disposiciones administrativas de carácter general que establecen el Requisito mínimo que deberán cumplir los suministradores y los usuarios
calificados participantes del mercado para adquirir potencia en términos del artículo 12, fracción XXI, de la Ley de la Industria Eléctrica).
|
| • |
General administrative provisions regarding open access and provision of services in the National Transmission Network and the General Distribution Networks (Disposiciones
administrativas de carácter general en materia de acceso abierto y prestación de los servicios en la Red Nacional de Transmisión y las Redes Generales de Distribución de Energía Eléctrica).
|
| • |
General administrative provisions that establish the requirements and minimum amounts of electricity coverage contracts that suppliers must hold regarding electric power, energy demand and clean
energy certificates that they will supply to the represented load centers and their verification (Disposiciones administrativas de carácter general que establecen los requisitos y montos mínimos de
contratos de cobertura eléctrica que los suministradores deberán celebrar relativos a la energía eléctrica, potencia y certificados de energía limpia que suministrarán a los centros de carga que representen y su verificación).
|
In addition to the above-mentioned provisions, the following general normative bodies must be taken into consideration and which may be published/modified from time to time:
| • |
Market practice manuals;
|
| • |
General administrative provisions issued by CRE, as applicable;
|
| • |
Guidelines, criteria and operating procedures of the electricity sector;
|
| • |
Mexican official standards issued by the Ministry of Energy and the Ministry of Economy (Secretaría de Economía), as applicable;
|
| • |
Resolutions issued by Energy Regulatory Commission, as applicable;
|
| • |
Decrees and guidelines issued by the Ministry of Energy; and
|
| • |
Resolutions issued by CENACE, CRE and the Ministry of Energy.
|
Clean Energy Certificates
As mentioned above, the guidelines that regulate the criteria for granting clean energy certificates (lineamientos que establecen los criterios para el
otorgamiento de certificados de energía limpia) have been recently amended. On October 28, 2019, some previously applicable requirements for such granting purposes were eliminated, especially the provision (among others) which
established that grandfathered clean power plants that reached its commercial operation date prior August 11, 2014, would not be entitled to be granted with clean energy certificates.
The purpose of such modification, as argued by the Federal Government, is to seek a decrease in the electricity price produced by means of clean technologies and to promote the competition
between generators, leading to better prices and avoiding speculation.
Notwithstanding the above the private investment sector of the industry has expressed a total rejection of the aforementioned amendment, given that it represents a risk to the national and
international investments injected into the Mexican market under the originally enacted guidelines. The main argument of such sector is that with this amendment, the incentive for investments in generation projects by mean of clean technologies
would disappear, given that the purchase and sale of clean energy certificates would not be profitable anymore.
It is important to bear in mind that various legal recourses (amparo lawsuits) have been filed by private companies and associations in order to challenge the validity and enforceability of
the relevant amendment. In this regard, several definite suspensions have been granted to such companies; nevertheless, different controversies have arisen from these trials, including jurisdiction disputes. Notwithstanding the foregoing, it
is worth-mentioning that the validity and legality of the relevant amendments is still subject to review of the courts with jurisdiction.
Regulation in Peru
Below is a general overview of certain Peruvian electricity sector regulations. This overview should not be considered a full description of all regulations.
The Electric Transmission Sector
The Peruvian electric system serves energy to a large area of the country through its national grid, the SEIN (the Sistema Eléctrico Interconectado Nacional),
that has transmission lines and substations operating at 500, 220, 138, 69 and 33-kV levels.
Pursuant to Law 28832, which is applicable to any transmission project commissioned after July 2006, the transmission facilities integrating the transmission grid are classified as those
belonging to: either (i) the Guaranteed Transmission System, or Sistema Garantizado de Transmisión (SGT), for transmission facilities that are included in the transmission plan and developed pursuant to
a concession agreement granted by the Peruvian government to the winner of a public tender, or (ii) the Complementary Transmission System, or Sistema Complementario de Transmisión (SCT), for
transmission facilities that are either (a) included in the transmission plan and developed by the private entity that was awarded a concession as a result of the successful review of a private initiative proposal, or (b) not included in the
transmission plan.
Under Law 28832, the projected expansions of the transmission system identified in the Peruvian transmission plan are part of the SGT. The government organizes tender procedures to call
private investors interested in building the projected lines of the SGT. Under SGT Concession Agreements, the concessionaire shall build the lines and be responsible for their operation and maintenance. Recovery of the investment during the
term of the contract (up to 30 years) is guaranteed thereunder. The concessionaire owns the transmission assets during the term of the contract. Upon expiry of the contract the assets return to the State which shall call a new tender if the
lines are required at such time for the operation of the system.
Transmission lines of interest to generation plants, distribution networks or large consumers are part of the SCT. The lines of the SCT included in the Peruvian transmission plan and certain
projects that exclusively serve the demand, as defined by the government, may be subject to tenders for the granting of SCT Concession Agreements up to 30 years. The rest of the SCT projects are subject to the general regime in which the owners
of the SCT lines (for example, the generation companies building them to connect their plants to the system) are the holders of the respective Definitive Transmission Concession and own the transmission assets through the term of the
concession.
Open Access Regime
The activity of electricity transmission is a public service according to Peruvian law; such service is subject to open access regulations, which imply that the owner of a transmission
infrastructure is obliged to allow third parties to connect to the SEIN through its transmission facilities. However, third parties requesting access to a transmission system have the obligation to assume the costs of any additional investment
required to increase the connection capacity, if required to make the interconnection feasible. The terms and conditions of the required new investments shall be negotiated in an interconnection agreement.
Access of third parties to the SGT with facilities that are not included in the Peruvian transmission plan requires a previous verification by the Comité de Operación Económica del Sistema
Interconectado Nacional, or COES, of the technical conformity of such connection facilities. For those facilities needed for the electrical continuity of the SGT, the third party seeking access assumes the costs of expansion and compensation
for their use, and the corresponding SGT concessionaire is responsible for the implementation, operation and maintenance of these facilities. The operation and maintenance costs of these facilities are those arising from the agreement between
the SGT concessionaire and the third party seeking access.
Pursuant Peruvian Law, the concessionaire owns the transmission infrastructure needed for the electrical continuity of the SGT. These infrastructures will be concession assets under the
contract. As a general rule, under the SGT Concession Agreement, upon expiry of the contract the assets return to the Peruvian State.
If a private interconnection agreement is not reached through private negotiation, a request for an interconnection mandate can be filed before the Organismo
Supervisor de la Inversión en Energía y Minería, or OSINERGMIN, who will determine the conditions applicable to the connection, if it is technically feasible. To that end an assessment of the different connection possibilities shall be
submitted to OSINERGMIN by the applicant to determine the most efficient technical solution.
The participation of OSINERGMIN shall guarantee and enforce compliance with the legal principle of open access to transmission and distribution networks. An interconnection mandate
establishes the conditions under which the interconnection shall take place. The parties usually prefer to reach an agreement establishing those conditions. However, in cases where an agreement is not feasible due to the pre-existence of
previous interconnection commitments with other companies, OSINERGMIN has been willing to grant new interconnection mandates as long as there is available capacity.
Tariff Regime
The SGT is compensated through the tariff base, which is the authorized annual remuneration for facilities belonging to the SGT. The tariff base is established in annual amounts and includes
the following: (i) remuneration of investments (including adjustments), which is calculated based on a 30-year recovery period applying a 12% rate of return, (ii) efficient operating and maintenance costs, and (iii) the liquidation of
imbalances between the authorized tariff base for the previous year and the proceeds obtained during that year.
The tariff base will be paid through the (i) tariff income and (ii) the transmission toll. The tariff income is paid monthly by the electricity generation companies in proportion to their
respective capacity income. The transmission toll is paid by the electricity generation companies based on their collection of the transmission toll paid by their respective customers pursuant to Article 26 of Law 28832 and Article 27 of the
Transmission Rules, or Reglamento de Transmision, approved by the Supreme Decree No. 027-2007-EM.
The electricity generation companies are paid by customers via capacity charges and energy charges established in their respective supply contracts. These capacity charges include a
transmission toll per unit of peak demand needed to cover the costs to be paid for the SGT.
The monthly payments to be made by electricity generation companies to the transmission companies are liquidated by the COES, in application of the tariffs determined by OSINERGMIN. A portion
of the amount collected by the electricity generation companies from customers is allocated to the transmission companies that own facilities in the SGT. As such, electricity generation companies collect the money required to pay the SGT
facilities from customers.
Non-regulated customers include large electricity consumers with a maximum annual power demand over 2,500 kW and customers with maximum annual power demands between 200 kW and 2500 kW that
may choose to be regulated customers or not. Non-regulated customers may freely negotiate their energy prices with suppliers.
The SCT is remunerated on the basis of the annual average cost of the corresponding facilities approved by OSINERGMIN. The applicable tariffs and their respective actualization formulas are
approved by OSINERGMIN every four years.
Penalties
The concessionaires must maintain certain quality, safety and maintenance standards of the facilities. The failure to meet the quality standards established by applicable industry
regulations, such as the technical rules of quality for power services, approved by Supreme Decree No. 020-97-EM, and the National Power Code, may result in the imposition of penalties, fines and restrictions. In addition to these penalties,
fines and restrictions, if our concession is terminated due to the breach of obligations under the Concession Agreements, the Peruvian Ministry of Energy may appoint an intervenor to supervise the operations related to the concession to ensure
the continuity in the provision of the service, and the compliance with applicable laws and regulations.
If a concessionaire suspends or interrupts the service for reasons other than regular maintenance and repairs, force majeure events, or failures caused by third parties, such concessionaire
may be required to indemnify those who were affected for the damages caused by any such service interruption, in accordance with applicable regulations. In addition, the OSINERGMIN could impose penalties, including, among others, (a)
admonishment, (b) successive fines, depending on the nature and effect of the interruption and its frequency, (c) temporary suspension of activities, and (d) definitive suspension of activities and the provisional administration of operations
by an intervenor, if a termination event occurs and the Peruvian Ministry of Energy notifies of its desire to terminate the SGT Concession Agreement.
Also, OEFA (Agency of Environmental Evaluation and Control), the entity in charge of the supervision, inspection and sanction concerning environmental matters, may impose fines and corrective
measures to the companies in case of violation of the environmental rules and regulations.
Electricity Legal Framework
The principal laws and regulations governing the Peruvian power sector, or the Power Legal Framework, are: (i) the Power Concessions Law (or Ley de
Concesiones Electricas, PCL), approved by Law No. 25844, and its implementing rules (Supreme Decree No. 09-93-EM); (ii) the Law to Ensure the Efficient Development of Electricity Generation (or Ley
para Asegurar el Desarrollo Eficiente de la Generacion Electrica), approved by Law No. 28832, or Law No. 28832; (iii) the Transmission Rules (or Reglamento de Transmision), approved by the
Supreme Decree No. 027-2007-EM, or the Transmission Rules; (iv) the General Environmental Law (Law No. 28611); (v) the new Regulations for the Environmental Protection in Power Activities, approved by Supreme Decree No. 014-2019-EM, published
on July 7, 2019; (vi) the Power Sector Antitrust Law (Law No. 26876) and its regulations (Supreme Decree No. 017-98-ITINCI); (vii) the Laws creating OSINERGMIN (Law No. 26734 and Law No. 28964); (viii) the OSINERGMIN Rules (Supreme Decree No.
054-2001-PCM); (ix) the Regulatory Agencies of Private Investment in Public Services Framework Law (Law No. 27332); and (x) the Legislative Decree that promotes investment in the generation of power through renewable resources (Legislative
Decree No. 1002) and its regulations (Supreme Decree No. 012-2011-EM).
These laws regulate how to enter the electricity sector (applicable permits and licenses); the main obligations of the different participants of the electricity market (generators,
transmission companies and distribution companies); remuneration systems for the different market participants; rights of electricity consumers and the attributions of the competent authorities.
Other relevant laws are: (i) the Public Consultation Law and its regulations (Law No. 29785 and Supreme Decree No. 001-2012-MC) for projects that may affect rights of indigenous and native
communities and (ii) Law of National Heritage (Law 28296) and relevant regulations (among others, Supreme Decree No.003-2014-MC and Supreme Decree 011-2006-ED) for obtaining the CIRA which is issued by the Ministry of Culture, certifying there
are no archaeological remains in an area. Prior to performance of any activity or construction works, titleholders shall obtain the corresponding CIRA.
Some of the main aspects of Peru’s regulatory framework concerning its power sector are: (i) the separation between the power generation, transmission and distribution activities; (ii)
unregulated prices for the generation of power supplied to unregulated customers; (iii) regulated prices for the generation of power supplied to regulated customers; (iv) regulated prices applicable to transmission and distribution of power for
both regulated and unregulated customers; and (v) the private administration of the SEIN, according to the principles of efficiency, cost reduction, guaranty of quality and reliability in the provision of services.
All entities that generate, transmit or distribute power to third parties in Peru, including self-generators and co-generators that sell their excess capacity and energy in the SEIN, are
regulated by the Power Legal Framework.
Although significant private investments have been made in the Peruvian power sector and independent entities have been created to regulate and coordinate its oversight, the Peruvian
government still retains ultimate oversight and regulatory control. In addition, the Peruvian government owns and controls various generation and distribution companies in Peru.
The New Regulation for Environmental Protection in Electrical Activities
In accordance with the current environmental legal framework, as a general rule, prior to the construction and beginning of the electrical activities (i.e. generation, transmission or
distribution) the holder must obtain from the Ministry of Energy and Mines (hereinafter, “MINEM”) the Instrument for Environmental Management (hereinafter, “IEM”), which after its approval is mandatory for implementation.
By Supreme Decree No. 014-2019-EM, published on July 7, 2019, the MINEM approved the new Regulation for Environmental Protection in Electrical Activities (hereinafter, the “REPEA”).
The REPEA establishes the obligation to have an Environmental Certification prior to the beginning of the construction and operation of any electrical activities capable of generating
environmental impacts. The Instruments for Environmental Management (hereinafter, “IEM”) regulated are the following:
(i) Environmental studies
| • |
Environmental Impact Statement (DIA) - Category I
|
| • |
Semi-detailed Environmental Impact Study (EIAsd) - Category II
|
| • |
Detailed Environmental Impact Study (EIA-d) - Category III
|
(ii) Complementary Instruments for Environmental Management
| • |
Total Abandonment Plan (PAT)
|
| • |
Partial Abandonment Plan (PAP)
|
| • |
Rehabilitation Plan (PR)
|
| • |
Sustainability Technical Report (ITS)
|
| • |
Plan Directed to Remediation (PDR), within the framework of the regulations on the Standard Quality of Environmental for Soil
|
| • |
Environmental Management Plan for Polychlorinated Biphenyls (PGAPCB).
|
In the Seventh Subchapter of the Third Chapter of the REPEA, the figure of the Environmental Adaptation Plan (hereinafter, “EAP”) was created, which consists in a complementary and
exceptional IEM that seeks to facilitate the adaptation of electrical activities to the current environmental obligations and regulations (i.e. correct or adapt transmission lines installed in routes that vary from the specific coordinates, and
even from the study area, approved by MINEM in the environmental certifications).
The holder of electrical activities that decides to make use the presentation of the EAP, must send a communication to the MINEM. This communication must be sent within a maximum period of
ninety (90) working days from the entry into force of the REPEA and must contain information on the modifications not contemplated in the previous IEM. This deadline expired on November 19, 2019.
The EAP must contain the main real and/or potential negative effects generated by an electrical facility that was built failing to comply some or all aspects approved by the MINEM in the
environmental certifications). Likewise, it must provide for corrective and/or permanent measures, as well as implementation schedules in relation to the environmental commitments that the administrators adopt.
The REPEA regulates three (3) cases of fact in which the presentation of an EAP proceeded, such as:
| (i) |
In the case of electricity activities, without having previously obtained the approval of the Environmental Study or complementary IEM.
|
| (ii) |
In the case of electrical activities not contemplated in the previous assumption, which have an Environmental Study or complementary IEM and have been made extensions and/or modifications to the
activity, without having previously carried out the corresponding modification procedure.
|
| (iii) |
In case the Holder has an Affidavit for the development of their electrical activities, within the framework of the current regulations at the time, instead of having an Environmental Study.
|
It is pertinent to point out that, the REPEA establishes that in cases (i) and (ii), persists the supervisory and supervise power of the Competent Authority in Environmental Control Matters,
that is, the viability of the intervention of the Agency for Environmental Assessment and Inspection (hereinafter, “OEFA”) for the imposition of sanctions when the existence of administrative responsibility is demonstrated within the framework
of a sanctioning administrative procedure.
It was the responsibility of the competent environmental authority to analyze the application submitted, without prejudice to requesting assistance from other entities, if applicable.
According to the Fourth Final Complementary Provision of the REPEA, the administrator who made the request for the presentation of the EAP had a maximum and non-extendable term of three (3)
years (counted from the expiration of the ninety-day term described in the paragraph above) for the effective delivery of the EAP, in accordance with the guidelines contained in Annex 2 of the REPEA.
The Guaranteed Transmission System—SGT Concession Agreement
ATN and ATS (hereinafter, ABY Transmisión Sur), as concessionaires, have SGT Concession Agreements granted by the Peruvian government as a result of a public tender.
Under the SGT Concession Agreement, the Peruvian Ministry of Energy grants the concession necessary to construct, develop, own, operate, and maintain the transmission lines and substations
comprising a project to provide electricity transmission services that has been included in the Peruvian transmission plan.
The SGT Concession Agreement must specify the works schedule of the project and the corresponding guaranties of compliance. It also specifies the causes of termination of the agreement. The
SGT concessionaires are not obliged to pay the grantor any consideration for the SGT Concession Agreement.
Under the SGT Concession Agreement, the concessionaire shall build the lines and be responsible for their operation and maintenance. The recovery of the investment during the term of the
contract (30 years) is guaranteed thereunder. The concessionaire owns the transmission assets during the term of the contract. Upon expiry of the contract the assets return to the state, which shall call a new tender if the lines are required
at such time for the operation of the system.
In addition to the SGT Concession Agreement, the SGT concessionaire should obtain from the Peruvian Ministry of Energy a Definitive Concession, or the Definitive Concession, which entitles
such concessionaire to develop the activity of electricity transmission. The Definitive Concession will be granted for the term of the SGT Concession Agreement, and under the terms and conditions of the latter (among others, the works schedule
of the project).
Under the Definitive Concession, if the concessionaire requests it, the grantor shall impose easements on the lands required for the execution of the project in accordance with applicable
laws, but the grantor does not assume the costs associated with such easements.
Under the SGT Concession Agreement upon request, the grantor is also required to use its best efforts to assist in obtaining licenses, permits, authorizations, concessions and other rights
when the owner of the project complies with the legal requirements to obtain them and they are not granted on a timely basis by the competent authorities.
Revenues
The revenues of the project are established under the terms of the SGT Concession Agreement. In addition, the revenues of the project are funded by the users of electricity system.
In effect, the compensation for facilities that are part of the SGT is allocated to customers by OSINERGMIN according to the amounts of investment, operational and maintenance costs set forth
in the SGT Concession Agreement. The SGT will receive monthly compensation from the generation companies that collect the tariff base from their customers. Their compensation will be paid on a monthly basis and these monthly payments are
liquidated by the COES, following the tariffs established annually by OSINERGMIN.
As of the commercial operation date, the owner of a project receives the revenue from payments of the tariff base pursuant to the SGT Concession Agreement. The calculation of the tariff base
is based on: (i) an amount which represents a return on investment, including operation and maintenance costs and (ii) the amount determined on May 1 of each year by OSINERGMIN, in order to compensate for any intra-year difference between the
compensation we should have received in the immediately preceding tariff year in U.S. dollars and the amount actually paid in Peruvian soles, determined at the exchange rate published in the Official Gazette “El Peruano” on the last working day
prior to the fifteenth day of the month following the relevant month for which the services were charged to the electricity generation companies.
Every year, before the beginning of the new tariff period, OSINERGMIN will recalculate and determine the tariff base in U.S. dollars for the period which starts from May 1 of such year to
April 30 of the following year. This determination is approved in April of each year through a resolution published in the Official Gazette, “El Peruano.”
Regulation in Spain
On November 26, 1997, the European Union published a report, or White Paper, which outlined a strategy and a community-wide action plan aimed at doubling energy production from renewable
energy sources in the European Union from 6% in 1996 to 12% by 2010. The White Paper proposed a number of measures to promote the use of renewable energy sources, including measures designed to provide renewable energy sources better access to
the electricity market. The Kyoto Protocol, ratified by the EU and its Member States on May 31, 2002, imposed a target of reducing EU emissions of greenhouse gases by 8%.
Directive 2009/28/EC on the Promotion of the Use of Energy from Renewable Sources of the European Parliament and of the Council of the European Union, or the 2009 Renewable Energy Directive,
set mandatory national overall targets for each Member State consistent with at least 20% of EU total energy consumption coming from renewable energy sources by 2020. In order to comply with these mandatory renewable energy targets, all EU
Member States, including Spain, were required to develop a national action plan, called a National Renewable Energy Action Plan, or NREAP. Spain’s NREAP was issued on June 30, 2010 and sent to the European Commission.
In its NREAP, Spain set a target of 22.7% for primary energy consumption to be supplied by renewable energy sources and a target of 42.3% of total electricity consumption to be supplied by
renewable energy sources by 2020.
In 2011, a new Renewable Energies Plan, referred to as REP 2011-2020, was developed by the European Parliament and the Council of the European Union under the 2009 Renewable Energy Directive
that added a new target to the 2009 Renewable Energy Directive, a minimum of 10% of transportation energy consumption to be supplied from renewable energy sources in each Member State by 2020.
In Spain, these targets mean that energy from renewable sources should represent at least 20% of total energy consumption by 2020, consistent with the EU target, with a minimum of 10% of
transportation consumption to be derived from renewable sources by that same year.
Article 3.3(a) of the 2009 Renewable Energy Directive states that in order to reach the targets set for 2020, Member States may apply support schemes and incentives for renewable energy.
These support systems or incentives are different in each country, but the most common are:
| • |
Green certificates. Producers of renewable energy receive a “green certificate” for each MWh they generate, and suppliers of energy have an obligation to
purchase part of the energy that they supply from renewable sources.
|
| • |
Investment grants and direct subsidies. These help defray the costs of installing renewable energy generation plants.
|
| • |
Tax exemptions or relief. These include ITCs, cash grants in lieu of tax credits and accelerated depreciation, among others.
|
| • |
System of direct support of prices. These include regulated tariffs and premiums and involve a regulatory guarantee to purchase energy generated by a renewable energy plant for an allotted period of
time at a fixed tariff per kWh, for a maximum annual number of hours, so that the producer is ensured of a reasonable return on its investment.
|
Regulatory Framework Applicable to Solar Power Plants Currently in Operation
The applicable legal framework for solar power plants already in operation is set out in the following legal instruments:
| • |
Royal Decree-law 9/2013, of July 12, containing emergency measures to guarantee the financial stability of the electricity system, referred to as Royal Decree-law 9/2013;
|
| • |
Law 24/2013, of December 26, the Electricity Sector Act, referred to as the Electricity Act;
|
| • |
Royal Decree 1955/2000, of December 1, regulating the activities of transmission, distribution, marketing, supply and authorisation procedures for electrical energy facilities, referred to as Royal
Decree 1955/2000.
|
| • |
Royal Decree 413/2014, of June 6, regulating electricity production from renewable energy sources, combined heat and power and waste, referred to as Royal Decree 413/2014;
|
| • |
Royal Decree-Law 15/2018 of 5 October on urgent measures for energy transition and consumer protection; referred to as Royal Decree-Law 15/2018.Royal Decree-Law 17/2019 of 22 November adopting urgent
measures for the necessary adaptation of remuneration parameters affecting the electricity system and responding to the process of cessation of activity of thermal power plants, referred to as Royal Decree-Law 17/2019.
|
| • |
Ministerial Order IET/1045/2014 of June 16, published on June 20, 2014, approving the remuneration parameters for standard facilities, applicable to certain electricity production facilities based on
renewable energy, cogeneration and waste, referred to as Revenue Order;
|
| • |
Ministerial Order IET/1882/2014 of October 14, published on October 16, 2014, establishing the methodology for the calculation of the electricity associated to the gas consumption in CSP plants; and
|
| • |
Ministerial Order ETU/130/2017 of February 17, published on February 22, 2017, updating the remuneration parameters for the existing standard renewable energy facilities applicable from 1 January
2017, referred to as Updated Parameters Order.
|
| • |
Royal Decree-Law 17/2019 of 22 November adopting urgent measures for the necessary adaptation of remuneration parameters affecting the electricity system and responding to the process of cessation of
activity of thermal power plants, referred to as Royal Decree-Law 17/2019.
|
Primary Rights and Obligations under the Electricity Act
The high penetration of production technologies from renewable energy sources, cogeneration and waste, included in the so-called special regime for the production of electrical energy, meant
that their singular regulation linked to power and its technology had no object. On the contrary, it made it necessary for the regulation to contemplate these facilities in a manner analogous to that of the rest of the technologies that are
integrated into the market, and in any case, that they are considered by reason of their technology and implications for the system, rather than by reason of their power, so that the differentiated concepts of ordinary and special regime were
abandoned. For this reason, there is a unified regulation, without prejudice to the singular considerations that need to be established.
Notwithstanding the above, the Electricity Act eliminates specifies the priority access and dispatch criteria for electricity from renewable energy sources and high-efficiency cogeneration,
in accordance with European Community directives and continues to recognize the following rights for producers with facilities that use renewable energy sources:
| • |
Priority off-take. Producers of electricity from renewable sources will have priority over conventional generators in transmitting to off takers the energy
they produce over conventional generators under equal market conditions, without prejudice to the requirements relating to the maintenance of the reliability and safety of the national electricity system and based on transparent and
non-discriminatory criteria, in terms to be determined by the Government in a regulatory manner.
|
| • |
Priority of access and connection to transmission and distribution networks. Without prejudice to the security of supply and the efficient development of the
system, producers of electricity from renewable energy sources will have priority in obtaining access and connecting to the grid, subject to the terms set forth in the regulations, on the basis of objective, transparent and
non-discriminatory criteria.
|
| • |
Entitlement to a specific payment scheme: In the case of existing facilities for the production of energy from renewable energy sources for which the specific
remuneration system is recognised it is stablished a remuneration system based on the necessary participation in the market of these facilities, complemented by market income with a specific regulated remuneration that allows these
technologies to compete on an equal conditions with the rest of the technologies on the market. This specific complementary remuneration will be sufficient to reach the minimum level necessary to cover the costs and enables them to
compete on a level playing field with the other, non-renewable technologies on the market while achieving a reasonable return on investment. In case of new facilities, the Government can establish a specific remuneration and the
granting of it would be via auction.
|
The significant obligations of the renewable energy electricity producers under the Electricity Act include, inter alia, a requirement to:
| • |
Offer to sell the energy they produce through the market operator even when they have not entered into a bilateral or forward contract and so are excluded from the bidding system managed by the market
operator.
|
| • |
Maintain the plant’s planned production capacity. Power lines, which include connections with the transmission or distribution network and transformers, are considered part of the production facility.
|
| • |
Contract and pay the corresponding fees, whether directly or through their representatives, to the transmission or distribution companies to which the renewable energy facilities are connected in
order for their power to be fed into the grid.
|
Additionally, the Royal Decree 413/2004 establishes the following relevant obligations for the renewable energy electricity facilities:
| • |
Having, prior to the beginning of discharge into the grid, the equipment for measuring electrical energy.
|
| • |
The facilities must be registered in the Administrative Register of Electrical Energy Production Facilities under the Ministry of Industry.
|
| • |
Voltage dips: all facilities or groupings of photovoltaic facilities with an installed power greater than 2 MW, in accordance with the definition of grouping, shall be obliged to comply with the
requirements for responding to voltage dips established by means of the corresponding operating procedure.
|
| • |
Control centres: all facilities with installed power greater than 5 MW, and those with installed power less than or equal to 5 MW but which form part of a grouping of the same subgroup of article 2
whose total sum of installed powers is greater than 5 MW, must be attached to a generation control centre.
|
| • |
Send of telemetric measurements: all facilities producing from renewable energy sources, cogeneration and waste with installed capacity greater than 1 MW, or less than or equal to 1 MW but which form
part of a grouping of the same subgroup whose total installed capacity is greater than 1 MW, must send telemetric measurements to the system operator in real time.
|
Compliance with these last three obligations will be a necessary condition for the receipt of the specific retribution regime and must be accredited before the body in charge of carrying out
the settlements. Otherwise, only market revenues will be received, without prejudice to the applicable sanctioning regime.
Permits and authorisations
The Electricity Act and the Royal Decree 1955/2000 generally require in terms of the promotion, construction and operation of facilities for the production of energy from renewable energy
sources the obtaining of the following administrative authorisations:
| • |
Prior Administrative authorization (Autorización Administrativa Previa), which refers to the preliminary project of the installation as a technical document
that will be processed, where appropriate, together with the environmental impact study.
|
| • |
Approval of the execution project (Autorización Administrativa de Construcción), which refers to the specific project of the facility and allows its owner to
construct or establish it.
|
| • |
Operating permit (Autorización Administrativa de Explotación), which, once the project has been executed, allows the facilities to be energised and to proceed
with their commercial exploitation.
|
Registration on Public Registers
The Electricity Act and Royal Decree 413/2014 require electricity generation facilities to be entered on the official register of electricity production plants maintained by the Ministry of
Energy, Tourism and Digital Agenda.
The autonomous regions may keep their own registers of electricity generation plants they have authorized if such plants have a capacity of 50 MW or less. The registration details of these
plants must be provided to the Ministry of Energy, Tourism and Digital Agenda electronically.
Solaben 2/3 and Solaben 1/6 are on the register of the autonomous region Extremadura and the Ministry of Energy, Tourism and Digital Agenda.
Solacor 1/2, PS10/20, Helioenergy 1∕2 and Solnova 1/3/4 are on the register of the autonomous region of
Andalusia and the Ministry of Energy, Tourism and Digital Agenda.
Helios 1/2 is on the register of the autonomous region Castilla La Mancha and the Ministry of Energy, Tourism and Digital Agenda.
To receive their facility-specific reimbursement, renewable energy facilities are required under the Electricity Act and Royal Decree 413/2014 to be recorded on a new register the RRRE.
Unregistered plants will only receive the pool price.
The first transitional provision of Royal Decree 413/2014 states that power plants based on renewable sources recognized under the previous economic regime, as in the case of Solaben 2/3,
Solacor ½, PS10/20 will be automatically included in the RRRE.
Change of Compensation System Applicable to Solar Power Plants
Royal Decree-law 9/2013 introduced a change in the payment system applicable to new and existing electricity production facilities using renewable energy sources to guarantee the financial
stability of the electric system. The purpose of Royal Decree-law 9/2013, which entered into force on July 14, 2013, was to adopt a series of measures to ensure the sustainability of the electric system and to combat the shortfalls between
electricity system revenues and costs, referred to as the tariff deficit.
The measures adopted were focused primarily on the following areas: (i) the legal and financial regime for existing electricity production facilities using renewable energy sources,
co-generation and residual waste; (ii) the remuneration regime for transport and distribution activities; (iii) Spain’s guarantee of the securitization fund to cover the tariff deficit; and (iv) certain aspects related to capacity payments,
assumption of the cost of the subsidized tariff and a review of access charges.
Royal Decree-law 9/2013 established an entirely new remuneration system, abolishing the remuneration system based on a regulated tariff applicable to electricity production facilities using
renewable energy sources (including facilities in operation at the time that Royal Decree-law 9/2013 entered into force).
Prior to the adoption of Royal Decree-law 9/2013, electricity production facilities using renewable energy sources received revenues tied to their electricity produced according to their
power output. This involved receiving feed-in tariffs, in €/kWh, that were split into two components: (i) the pool price of electricity and (ii) an equivalent premium, consisting of the difference between the pool price and the set feed-in
tariff for each type of plant (feed in tariff = pool price + equivalent premium). This revenue was received for a maximum annual number of hours and for a pre-determined number of years, depending on the technology used in each case. For any
additional hours produced, producers received the pool price.
The repealed economic scheme was applied on a transitional basis until new provisions were approved to fully implement the new remuneration system. Settlements made after July 14, 2013 were
made in accordance with the previous regime until the new implementing regulations have been adopted. However, following the implementation of these new regulations, payments made during this interim period were recalculated in accordance with
the new regulations. The difference between the amounts received under the prior regime and those calculated under the new regime were deducted from the first nine settlements that followed the approval of the new implementing regulations.
Current System
According to Royal Decree 413/2014, producers receive (i) the pool price for the power they produce and (ii) a specific remuneration.
A specific remuneration system is established to encourage the production of energy from renewable energy sources, high-efficiency cogeneration and waste, which may be received by the
facilities in addition to their corresponding remuneration for their participation in the electricity production market through any of their contracting modalities.
This remuneration system shall apply to production facilities using renewable energy sources, high-efficiency cogeneration and waste that do not reach the minimum level necessary to cover the
costs that allow them to compete on an equal footing with the rest of the technologies on the market, obtaining a reasonable return, referring to the standard installation that is applicable in each case.
The granting of this specific remuneration system for new facilities shall be established by means of competitive competition procedures that shall conform to the principles of transparency,
objectivity and non-discrimination.
In order to determine the specific remuneration system applicable in each case, each installation, depending on its characteristics, will be assigned a standard installation (which will be
established according to technology, installed power, age, electrical system, etc.).
The specific remuneration of each installation will be obtained from the remuneration parameters of the corresponding standard installation and from the characteristics of the installation
itself.
For the calculation of the remuneration parameters of the standard installation, the values resulting from the competitive competition procedure shall be applied.
This specific remuneration system shall consist of:
| a) |
A remuneration term per unit of installed power, which shall be called investment remuneration (Rinv) and shall be expressed in €/MW. To determine this parameter, the standard value of the initial
investment resulting from the competitive tendering procedure established to grant the specific remuneration system to each installation will be considered. For the calculation of the annual income from the remuneration for the
investment of an installation, the remuneration for the investment (Rinv) of the associated typical installation shall be multiplied by the power entitled to the specific remuneration system, without prejudice to the correction
according to the number of equivalent hours of operation.
|
| b) |
A remuneration term for the operation, which shall be called remuneration for the operation (Ro) and shall be calculated in accordance with the provisions of Article 17 of the Royal Decree 413/2014,
expressed in €/MWh. In order to calculate the income from the remuneration for the operation of an installation, the remuneration for the operation (Ro) of the associated typical installation shall be multiplied, for each settlement
period, by the energy sold on the production market in any of its forms of contracting in said period, attributable to the fraction of power entitled to a specific remuneration system, without prejudice to the correction based on
the number of equivalent hours of operation.
|
For solar thermal plants, electrical energy attributable to the use of other fuels shall be excluded. The production of energy from the support fuel of solar thermal plants may not exceed 12
per cent of the total electricity production to be entitled to receive the specific remuneration system. The repetition of this non-compliance is reason for the cancellation of the inscription in the RRRE.
To calculate the energy attributable to the fraction of power entitled to a specific remuneration system, the corresponding energy shall be multiplied by the ratio resulting from dividing the
power entitled to a specific remuneration system by the installed power.
In order to determine the power entitled to the specific remuneration system of a facility, the value of the power registered for this purpose in the register of the specific remuneration
system in operation for said facility shall be taken as the value of the power registered for this purpose in the register of the specific remuneration system in operation for said facility.
For the granting of the specific remuneration system, the conditions, technologies or group of specific facilities that may participate in the competitive competition mechanism shall be
established by royal decree.
Subsequently, by order of the Minister of Industry, Energy and Tourism, with the prior agreement of the Government’s Delegate Committee for Economic Affairs, the remuneration parameters
corresponding to the type of reference facilities that are the object of the competitive bidding mechanism shall be established, as well as the terms in which it shall be developed. The granting of this specific remuneration system for existing
facilities is regulated in the first transitory provision of RD 413/2014, that establishes that they will be automatically registered on a date to be determined by order of the Minister of Industry,
Energy and Tourism. In any case, it contemplates the possibility of requesting the modification of the inaccuracies that could contain the data of the registry after the referred automatic inscription.
As established in Order IET/1168/2014, of 3 July, the existing facilities were automatically registered in the RRRE on 9 July 2014. In order to determine the information required for
automatic registration in the RRRE, the information included in the “Settlement System” at the time of registration has been taken into account or, for those facilities not yet included in said System,
that of the remuneration pre-allocation register.
It should be borne in mind that for the purposes of the liquidation of the specific remuneration regime (former primacy special regime), renewable facilities must be registered in the
liquidation system of the CNMC. In order for an installation to be registered in said Settlement System, it must be operating and registered in the well-deserved Register. Thus, the automatic inscription in the RRRE has been carried out in a
state of pre-allocation or in a state of exploitation, in accordance with the following:
| a) |
Those facilities which, at the time of registration, although having recognised primary remuneration, were not registered in the settlement system, i.e. those facilities which, although having
recognised primary remuneration because they were registered in the corresponding pre-allocation register when RD-Law 9/2013 came into force, were not included in the Settlement System on 9 July 2014, as they were not operating or
definitively registered in Registro de Instalaciones de Producción en Régimen Especial (“RAIPRE”), have been registered in a pre-allocation state. In this regard, the information contained
in the remuneration pre-allocation register has been taken into account for registration.
|
| b) |
Those facilities which, at the time of registration, were registered in the settlement system, i.e. operating and definitively registered in the RAIPRE on 9 July 2014, have been registered in a state
of operation.
|
Specifically, in accordance with the sixth additional provision of RD 413/2014, so that the facilities registered in the RRRE in a state of pre-allocation under the first transitory provision
may be registered in the RRRE in a state of operation, it is an essential requirement that the installation be definitively registered in the RAIPRE and start evacuating energy prior to the given deadline, that is, within the maximum period
applicable to them for this purpose (generally thirty-six months) from the date of notification of the resolution by which they were registered in the pre-allocation of remuneration register.
Payment Factors for Solar Power Plants
The payment system applicable for each plant is based on various criteria considered by the Ministry of Ecological Transition and includes the specific technology used, amount of power
produced relative to operating costs, age of the facility and any other differentiating factor deemed necessary to consider in applications of the payment system.
Revenue Order recognizes six types of solar thermal plants: (i) parabolic trough collectors without a storage system, (ii) parabolic trough collectors with a storage system, (iii) central or
tower receivers without a storage system, (iv) central or tower receivers with a storage system, (v) linear collectors and (vi) solar-biomass hybrids.
To determine the payment system applicable to each plant, the following factors are considered:
| • |
Net investment value. This consists of a standard amount per MW for each type of plant, calculated by the method set out in Royal Decree 413/2014, which is the
amount invested in the plant and not depreciated as of July 14, 2013.
|
| • |
Useful life of the plant. For solar thermal plants this is 25 years and for fhotovoltaic plants this is 30 years.
|
| • |
Return on investment. Considering the net asset value determined on the basis of a standard cost per MW built, an amount is set per unit of power, which
enables investment costs that cannot be recovered through the pool price to be recouped over the useful life of the plant.
|
| • |
Operating remuneration. An amount is set per unit of power and hour that, added to the pool price, enables the producer to recoup all the plant’s operating and
maintenance costs. Operating expenses include the cost of land, electricity, gas and water bills, management, security, corrective and preventive maintenance, representation costs, the Spanish tax on special immovable properties,
insurance, applicable generation charges and a generation tax which is equal to 7% of total revenue.
|
| • |
Maximum number of operating hours. A maximum number of hours is set for which each plant type can receive the operating remuneration
|
| • |
Operating threshold. Plants must operate for more than a set number of hours per year to receive the return on investment and operating remuneration.
|
| • |
Minimum operating hours. Plants that cross the operating threshold but operate for fewer hours than the annual minimum hours receive a lower remuneration.
|
The Ministry of Ecological Transition and Demographic Challenge submitted a draft ministerial order for public consultation from January 9, 2020 to January 21, 2020, whose object is:
(i) to update the remuneration parameters of the standard installations for the regulatory period from 1 January 2020 to 31 December 2025, and to set, where appropriate, the values of the
remuneration for the operation that will be applicable during the first half of 2020, thereby complying with the provisions of the aforementioned article 20 of Royal Decree 413/2014, of 6 June, and article 3 of Order IET/1345/2015, of 2 July.
(ii) to update the values of the investment incentive for the reduction of the cost of generation, applicable to standard installations associated with isolated electricity systems in
non-mainland territories.
In application of the sole additional provision of Royal Decree-Law 17/2019, the deadline for the approval of the proposed order that is being submitted for a hearing is 29 February 2020.
The draft order is currently pending to obtain a report from the CNMC which shall conduct a hearing proceeding through the Electricity Advisory Council (Consejo Consultivo de Electricidad).
In any case, although the order is not yet approved, the remuneration parameters resulting from this review shall be applicable from the start of the regulatory period. Once this order has
been approved, the payment applications or, where applicable, the collection rights that may be applicable shall be settled with a charge to the following settlement. The proposed parameters are set forth in the table below.
|
Useful
Life(1
|
Return on
Investment
2020 draft
(euros/MW)
|
Operating
Remuneration
2020 draft
(euros/GWh)
|
Maximum
Hours
|
Minimum
Hours
|
Operating
Threshold
|
||||||||||||||||
|
Solaben 2
|
25 years
|
398,174
|
37,527
|
2,016
|
1,210
|
706
|
|||||||||||||||
|
Solaben 3
|
25 years
|
398,174
|
37,527
|
2,016
|
1,210
|
706
|
|||||||||||||||
|
Solacor 1
|
25 years
|
398,174
|
37,527
|
2,016
|
1,210
|
706
|
|||||||||||||||
|
Solacor 2
|
25 years
|
398,174
|
37,527
|
2,016
|
1,210
|
706
|
|||||||||||||||
|
PS 10
|
25 years
|
550,263
|
59,614
|
1,848
|
1,109
|
647
|
|||||||||||||||
|
PS 20
|
25 years
|
407,269
|
53,789
|
1,848
|
1,109
|
647
|
|||||||||||||||
|
Helioenergy 1
|
25 years
|
393,071
|
37,650
|
2,016
|
1,210
|
706
|
|||||||||||||||
|
Helioenergy 2
|
25 years
|
393,071
|
37,650
|
2,016
|
1,210
|
706
|
|||||||||||||||
|
Helios 1
|
25 years
|
407,037
|
37,858
|
2,016
|
1,210
|
706
|
|||||||||||||||
|
Helios 2
|
25 years
|
407,037
|
37,858
|
2,016
|
1,210
|
706
|
|||||||||||||||
|
Solnova 1
|
25 years
|
413,423
|
38,222
|
2,016
|
1,210
|
706
|
|||||||||||||||
|
Solnova 3
|
25 years
|
413,423
|
38,222
|
2,016
|
1,210
|
706
|
|||||||||||||||
|
Solnova 4
|
25 years
|
413,423
|
38,222
|
2,016
|
1,210
|
706
|
|||||||||||||||
|
Solaben 1
|
25 years
|
403,599
|
37,730
|
2,016
|
1,210
|
706
|
|||||||||||||||
|
Solaben 6
|
25 years
|
403,599
|
37,730
|
2,016
|
1,210
|
706
|
|||||||||||||||
|
Seville PV
|
30 years
|
709,200
|
24,700
|
2,061
|
1,237
|
721
|
|||||||||||||||
Regulatory Periods
Payment criteria are based on prevailing economic conditions in Spain, demand for electricity and reasonable profits for electricity generation activities and can be revised every three or
six years. The Royal Decree 413/2014 establishes statutory periods of six years, with the first statutory period running from July 14, 2013 (the date of entry into force of Royal Decree-law 9/2013) to December 31, 2019 and the second regulatory
period beginning in January 2020. Each statutory period is divided into two statutory half-periods of three years.
This “statutory period” mechanism aims to set forth how and when the Ministry of Ecological Transition and Demographic Challenge is entitled to revise the different payment factors used to
determine the specific remuneration to be received by the standard facilities.
At the end of each statutory half-period (three years) the Ministry of Ecological Transition and Demographic Challenge may revise (i) the electricity market price estimates and (ii) the
adjustment value for electricity market price deviations in the preceding statutory half-period.
In this regard, the proposed Parameters Order updates the remuneration parameters of the standard facilities, for the regulatory half-period between 1 January 2020 and 31 December 2023, and
the approval of the estimated market price for each year of said half-period (which is estimated pursuant to the draft ministerial order in 55.85 €/MWh, 52.54 €/MWh and 49.36 €/MWh, respectively, for the years 2020, 2021 and 2022). The draft of
the ministerial order has been positively assessed by the CNMC, but it has not been approved yet. In any case, the remuneration parameters resulting from this review shall be applicable from the start of the regulatory period. Once this order
has been approved, the payment applications or, where applicable, the collection rights that may be applicable shall be settled with a charge to the following settlement.
Reasonable Rate of Return
According to article 14 of the Electricity Act, the remuneration system shall not exceed the minimum level necessary to cover the costs that allow production facilities from renewable energy
sources, high-efficiency cogeneration and waste to compete on an equal level with the other technologies on the market and that allows reasonable return to be obtained in relation to the standard installation in each applicable case. This
reasonable return will be, before tax, on the average secondary market yield of the 10-year government treasury note by applying the appropriate differential.
According to the Tenth Additional Provision of the Electricity Act, for production activities from renewable energy sources, cogeneration and waste with a specific remuneration system, the
first regulatory period will begin on the date of entry into force of Royal Decree-Law 9/2013, of 12 July. In this period, the value on which the profitability of the reference rate projects will revolve for the competitive competition
procedures, before taxes, will be the average secondary market yield for the three months prior to the entry into force of Royal Decree-Law 9/2013, of 12 July, of the 10-year State Obligations increased by 300 basic points. Before the start of
a new regulatory period, a revised reasonable return can be established for each plant type, calculated as the average yield on Spanish government 10-year bonds on the secondary market in the 24 months through the month of May preceding the new
regulatory period, plus a spread. This spread is based on the following criteria:
| • |
Appropriate profit for this specific type of renewable electricity generation and electricity generation as a whole, considering the financial condition of the Spanish electricity system and Spanish
prevailing economic conditions; and
|
| • |
Borrowing costs for electricity generation companies using renewable energy sources with regulated payment systems, which are efficient and well run, within Europe.
|
As stated before, the next regulatory period has begun on January 1, 2020.
On July 27, 2018, CNMC (the regulator for the electricity system in Spain) issued a draft proposal for the calculation of the reasonable rate of return for the regulatory period 2020-2025.
The reasonable return is no longer calculated by reference to the Spanish government 10-year bonds but by reference to the weighted average cost of capital (WACC). The WACC is the calculation method that most of the European regulators apply in
most of the cases to determine the return rates applicable to regulated activities within the energy sector.
Following the recommendations of the CNMC, the Government has recently adopted the Royal Decree-Law 17/2019, which came into force on November 24, 2020 (and was validated by the Permanent
Delegation of the Congress on November 27, 2020), and which is aimed to update the reasonable rate of return that applies to standard renewable energy facilities in the period 2020-2025. In accordance with the sole article of this Royal
Decree-Law, the reasonable return applicable over the remaining regulatory life of standard facilities, which will be used to review and update the remuneration parameters that will be applicable during the second regulatory period, is 7.09%.
The measure is intended to create certainty for investors, since it establishes by means of a regulation with the rank of law the new value of reasonable return for the following regulatory period.
In addition, the Royal Decree-Law introduces a third final provision in Law 24/2013, of 26 December, on the Electricity Sector, which exceptionally, gives the option to the owners of
renewable facilities that were recognized as having primary remuneration before the entry into force of Royal Decree-Law 9/2013, that at the value on which the reasonable return fixed for the first regulatory period turns cannot be revised
during the two consecutive regulatory periods starting on 1 January 2020. In other words, they will be able to maintain a reasonable profitability for their facilities of 7.398% until 2031. In any event, it is possible to waive this value, in
which case the retribution will be calculated taking into account the reasonable return value fixed for each regulatory period (which in case of 2020 is 7.398%).
However, this new measure shall not be applicable when an arbitration or judicial proceeding based on the modification of the special remuneration system after Royal Decree 661/2007 is
initiated or has been previously initiated in respect of the profitability of these facilities, unless it is proven that the arbitration or legal proceedings have been early terminated and the resumption or continuation of the proceedings and
the receipt of compensation or indemnification has been duly waived.
Access Fee
Royal Decree-law 14/2010 was passed in order to eliminate the shortfalls between electricity system revenues and costs, referred to as the tariff deficit in the electricity sector.
The First Transitional Provision of Royal Decree-law 14/2010 provided that the owners of electricity production facilities pay a fee for access to the grid to the transmission and
distribution companies (this access previously having been provided at no cost) from January 1, 2011. During the interim period, the access fee payable is: (i) calculated at €0.5 per MWh delivered to the network or (ii) any other amount that
the Ministry of Ecological Transition and Demographic Challenge establishes.
Royal Decree 1544/2011 implemented the Sole Transitional Provision of Royal Decree 14/2010 and confirmed the interim access fee imposed on electricity producers (€0.5 per MWh), subject to the
adoption of a final method for calculating the access fee.
Electricity Sales Tax
On December 27, 2012, the Spanish Parliament approved Law 15/2012, which became effective on January 1, 2013. The aim of Law 15/2012 is to try to combat the problem of the so-called tariff
deficit, which reached approximately €28 billion as of December 2013.
Law 15/2012, as amended, provides for an electricity sales tax which is levied on activities related to electricity production. The tax is triggered by the sale of electricity and affects
ordinary energy producers and those generating power from renewable sources. The tax, a flat rate of 7%, is levied on the total income received from the power produced at each of the facilities, which means that every calendar year, solar power
plants will be required to pay 7% of the total amount which they are entitled to receive for production and incorporation into the electricity system of electric power, measured as the net output generated.
However, the Royal Decree-Law 15/2018 included a six-month exemption from this tax, for the electricity produced and incorporated into the electricity system, coinciding with the months of
greatest demand and highest prices in the wholesale electricity markets. This entails modifying the calculation of the tax base and of the fractioned payments regulated in the tax regulations, in the following manner:
| • |
For fiscal year 2018 the taxable base of the Tax on the Value of the Production of Electrical Energy was made up of the total amount corresponding to the taxpayer for the production and incorporation
into the electrical system of electrical energy, measured in plant bars, for each installation in the tax period reduced by the remuneration corresponding to the electricity incorporated into the system during the last calendar
quarter.
|
| • |
The fractioned payments for the last quarter were calculated on the basis of the value of the electric power production in plant bars made during the tax period reduced by the remunerations
corresponding to the electricity incorporated into the system during the last calendar quarter, applying the tax rate provided for in Article 8 of Law 15/2012 and deducting the amount of the fractioned payments previously made.
|
| • |
For fiscal year 2019, the taxable base of the Tax on the Value of the Production of Electrical Energy was made up of the total amount corresponding to the taxpayer for the production and incorporation
into the electrical system of electrical energy, measured in plant bars, for each installation in the tax period reduced by the remuneration corresponding to the electricity incorporated into the system during the first calendar
quarter.
|
However, we expect the remuneration to be adjusted for the lower tax paid in these two quarters when remuneration parameters are reviewed, so that no impact is expected.
The fractioned payments are calculated on the basis of the value of the electricity production in plant bars from the beginning of the tax period until the end of the three, six, nine or
twelve months referred to in the previous section, reduced by the amount of the remuneration corresponding to the electricity incorporated into the system during the first calendar quarter, applying the tax rate provided for in Article 8 of Law
15/2012 and deducting the amount of the fractioned payments previously made.
Tax Incentive of Accelerated Depreciation of New Assets
Under provisions of the Spanish Corporate Income Tax Act, tax-free depreciation is permitted on investments in new material assets and investment properties used for economic activities
acquired between January 1, 2009 and March 31, 2012. Taxpayers who made investments during such period and have amounts pending to be deducted for this concept may apply such amounts with certain limitations.
Taxpayers who made or will make investments from March 31, 2012 through March 31, 2015 in new material assets and investment properties used for economic activities are permitted to take
accelerated depreciation for those assets subject to certain limitations. The accelerated depreciation is permitted if:
| • |
40% of the tax base before the amortization or depreciation and before the offset of tax loss carryforwards for taxpayers (subject to requirements to keep up employment levels); or
|
| • |
20% of the tax base before the amortization or depreciation and before the offset of tax loss carryforwards for taxpayers (without employment requirements).
|
Most of the investment in our Spanish assets was undertaken within the regime that applied between January 1, 2009 and March 31, 2012.
These limitations do not apply in respect of companies that meet the requirements set forth in article 108.1 of the Spanish Corporate Income Tax Act related to the special rules for
enterprises of a reduced size.
The following summary chart sets forth our ownership structure as of the date of this annual report:
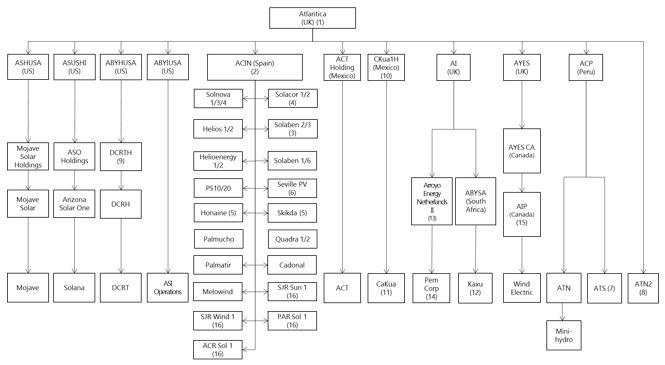
Notes:—
| (1) |
Atlantica Yield plc directly holds one share in Palmucho and 10 shares in each of Quadra 1 and Quadra 2.
|
| (2) |
ACIN directly holds one share in each of ABY Concessions Peru S.A., ATN S.A. and ATS S.A.
|
| (3) |
30% is held by Itochu, a Japanese company.
|
| (4) |
13% is held by JGC, a Japanese company.
|
| (5) |
AEC holds 49% of Honaine and Skikda. Sacyr Agua, S.L. holds 25.5% of Honaine and 16.9% of Skikda.
|
| (6) |
20% of Seville PV is held by Instituto de Diversificacion y Ahorro de la Energia, or IDEA, a Spanish state-owned company.
|
| (7) |
ATN holds a 75% stake in ATS.
|
| (8) |
ATN holds a 25% stake in ATN2.
|
| (9) |
85.5% is held by Starwood
|
| (10) |
ACTH directly holds one share in CKua1H
|
| (11) |
95% is held by ACS
|
| (12) |
49% held by Industrial Development Corporation, a South African Government entity
|
| (13) |
70% held by Arroyo Energy
|
| (14) |
100% indirectly held by Arroyo Energy Netherlands II
|
| (15) |
60% held by Algonquin Power & Utilities Corp
|
See “Item 4.B—Business Overview.”
Not applicable.
The following discussion should be read together with, and is qualified in its entirety by reference to, our Annual Consolidated Financial Statements. The following discussion contains
forward-looking statements that reflect our plans, estimates and beliefs, which are based on assumptions we believe to be reasonable. Our actual results could differ materially from those discussed in these forward-looking statements as a
result of various factors, including those set forth under “Item 3.D—Risk Factors” and elsewhere in this annual report.
Overview
We are a sustainable company that owns and manages renewable energy, efficient natural gas, transmission and transportation infrastructures and water assets. We currently have operating
facilities in North America (United States, Canada and Mexico), South America (Peru, Chile and Uruguay) and EMEA (Spain, Algeria and South Africa). We intend to expand our portfolio, maintaining North America, South America and Europe as our
core geographies.
As of the date of this annual report, we own or have an interest in a portfolio of high-quality and diversified assets in terms of type of asset, technology and geographic footprint. Our
portfolio consists of 25 assets with 1,496 MW of aggregate renewable energy installed generation capacity, 343 MW of efficient natural gas-fired power generation capacity, 10.5 M ft3 per day of water desalination and 1,166 miles of electric transmission lines.
All of our assets have contracted revenue (regulated revenue in the case of our Spanish assets and one transmission line in Chile) and are underpinned by long-term contracts. As of December
31, 2019, our assets had a weighted average remaining contract life of approximately 18 years. Most of the assets we own or in which we have an interest have project-finance agreements in place.
We intend to take advantage of, and leverage our growth strategy on, favorable trends in the clean power generation, transmission and transportation infrastructures and water sectors
globally, including energy scarcity and the focus on the reduction of carbon emissions. Our portfolio of operating assets and our strategy focuses on sustainable technology including renewable energy, efficient natural gas, and transmission
networks as enablers of a sustainable power generation mix and on water infrastructure. Renewable energy is expected to represent in most markets the majority of new investments in the power sector, according to Bloomberg New Energy Finance
2019, approximately 50% of the world’s power generation by 2050 is expected to come from renewable sources, which indicates that renewable energy is becoming mainstream. Global installed capacity is expected to shift from 57% fossil fuels today
to approximately two-thirds renewables by 2050. A 12-terawatt expansion of generating capacity is estimated to require approximately $13.3 trillion of new investment between now and 2050 – of which approximately 77% is expected to go to
renewables. Another approximately $843 billion of investment goes to batteries along with an estimated $11.4 trillion to expected to go to transmission and distribution during that period. We believe regions will need to complement investments
in renewable energy with investments in efficient natural gas, in transmission networks and in storage. We believe that we are well positioned to benefit from the expected transition towards a more sustainable power generation mix. In addition,
we believe that water is going to be the next frontier in a transition towards a more sustainable world. New sources of water are needed worldwide and water desalination and water transportation infrastructure should help make that possible. We
currently participate in two water desalination plants with a 10 million cubic feet capacity and we have an investment in a third desalination plant through a loan.
We are focused on high-quality, long-life facilities as well as long-term agreements that we expect will produce stable, long-term cash flows. We intend to grow our cash available for
distribution and our dividend to shareholders through organic growth and by acquiring new assets and/or businesses where revenues may not be fully contracted.
We believe we can achieve organic growth through the optimization of the existing portfolio, escalation factors in many of our assets and the expansion of current assets, particularly our
transmission lines, to which new assets can be connected. We currently own three transmission lines in Peru and four in Chile. We believe that current regulations in Peru and Chile provide a growth opportunity by expanding transmission lines to
connect new clients. Additionally, we should have repowering opportunities in certain existing generation assets.
Additionally, we expect to acquire assets from third parties leveraging the local presence and network we have in geographies and sectors in which we operate. We have also entered into and
intend to enter into agreements or partnerships with developers or asset owners to acquire assets in operation, construction or development. We may also invest directly or through investment vehicles with partners in assets under development or
construction, ensuring that such investments are always a small part of our total investments.
In addition, we have in place exclusive agreements with AAGES and Algonquin. The AAGES ROFO Agreement provides us with a right of first offer on any proposed sale, transfer or other
disposition of certain of AAGES’s assets. The Algonquin ROFO Agreement provides us a right of first offer on any proposed sale, transfer or other disposition of any of Algonquin’s contracted facilities or with infrastructure facilities located
outside of the United States or Canada which are developed under expected long-term revenue agreements or concession agreements. See “Item 4.B—Business Overview—Our Business Strategy” and “Item 7.B—Related Party Transactions—Abengoa Right of
First Offer.”
With this business model, our objective is to pay a consistent and growing cash dividend to shareholders that is sustainable on a long-term basis. We expect to distribute a significant
percentage of our cash available for distribution as cash dividends and we will seek to increase such cash dividends over time through organic growth and through the acquisition of assets. Pursuant to our cash dividend policy, we intend to pay
a cash dividend each quarter to holders of our shares.
2018 and 2019 acquisitions
In February 2018, we completed the acquisition of a 4 MW mini-hydroelectric power plant in Peru for a cash consideration of approximately
$9 million. The plant reached COD in 2012. It has a fixed-price concession agreement denominated in U.S. dollars with the Ministry of Energy of Peru and the price is adjusted annually in accordance with the U.S. Consumer Price Index.
In October 2018 we reached an agreement to acquire PTS, a natural gas transportation platform located in the Gulf of Mexico, close to ACT,
our efficient natural gas plant. PTS will have a contracted compression capacity of 450 million standard cubic feet per day and is currently under construction. The service agreement signed with Pemex on October 18, 2017 is a “take-or-pay”
11-year term contract starting in 2020, with a possibility of future extension at the discretion of both parties. On October 10, 2018, we acquired a 5% ownership in the project; once the project begins operation, which is expected in the
first half of 2020, we expect to acquire an additional 65% stake, subject to final approvals. We are currently under negotiations with the seller about certain aspects of the agreement. The total equity investment for the 100% stake is
estimated to be approximately $150 million. The amount paid so far has been negligible.
On December 28, 2018, the Company completed the acquisition of a power substation and two small transmission lines in Peru, constituting an expansion of the
ATN transmission line (“ATN expansion 1”). Total purchase price for this asset amounted to $16 million.
In December 2018, we completed the acquisition of Chile TL3, a transmission line currently in operation in Chile. The asset has a tariff under the regulation in place in Chile, denominated
in U.S. dollars and indexed to U.S. and Chilean inflation rates. Our investment was approximately $6 million.
In December 2018, we completed the acquisition of Melowind, a 50 MW wind plant in Uruguay, from Enel Green Power S.p.A. The asset has been in operation since 2015 and has a 20-year US
dollar-denominated PPA in place for 100% of the electricity produced. The off-taker is the state-owned power company UTE, which has an investment grade credit rating. The total purchase price for this asset was approximately $45 million.
In January 2019, we entered into an agreement with Abengoa under the Abengoa ROFO Agreement for the acquisition of Befesa Agua Tenes, a
holding company which owns a 51% stake in Tenes, a water desalination plant in Algeria that is similar in several aspects to our Skikda and Honaine plants. The price agreed for the equity value was $24.5 million, of which $19.9 million was
paid in January 2019 as an advanced payment. Closing of the acquisition was subject to conditions precedent, including approval by the Algerian administration. The conditions precedent set forth in the share purchase agreement were not
fulfilled as of September 30, 2019. Therefore in accordance with the terms of the share purchase agreement the advanced payment has been converted into a secured loan to be reimbursed by Befesa Agua Tenes, together with 12% per annum
interest, through a full cash-sweep of all the dividends generated to be received from the asset. The share purchase agreement requires that the repayment occurs no later than September 30, 2031. In October 2019 we received a first payment in
the amount of $7.8 million through the cash sweep mechanism.
In April 2019, we entered into an agreement to acquire a 30% stake in Monterrey, a 142 MW gas-fired engine facility including 130 MW installed capacity and 12 MW battery capacity. The
acquisition closed on August 2, 2019 and we paid $42 million for the total equity investment. The asset, located in Mexico, has been in operation since 2018 and represents our first investment in electric batteries. It has a U.S.
dollar-denominated 20-year PPA with two international large corporations engaged in the car manufacturing industry as well as a 20-year contract for the natural gas transportation from Texas with a U.S. energy company. The PPA also includes
price escalation factors. The asset is the sole electricity supplier for the off-takers, it has no commodity risk and also has the possibility to sell excess energy to the North-East region of the country. We have also entered into a ROFO
agreement with the seller of the shares for the remaining 70% stake in the asset.
Additionally, on May 24, 2019, Atlantica and Algonquin formed AYES Canada, a vehicle to channel co-investment opportunities in which Atlantica holds the majority of voting rights. AYES
Canada’s first investment was in Amherst Island, a 75 MW wind plant in Canada owned by the project company Windlectric, Inc. (“Windlectric”). Atlantica invested $4.9 million and Algonquin invested $92.3 million, both through AYES Canada, which
in turn invested those funds in Amherst Island Partnership, the holding company of Windlectric. Since Atlantica has control over AYES Canada under IFRS 10 “Consolidated Financial Statements”, its consolidated financial statements initially
showed a total investment in the Amherst Island project of $97.2 million, accounted for as “Investments carried under the equity method” (Note 7) and Algonquin’s portion of that investment of $92.3 million as “Non-controlling interest”. In
addition, and under certain circumstances considered remote by both companies, Atlantica and Algonquin have options to convert shares of AYES Canada currently owned by Algonquin into Atlantica ordinary shares in exchange for a higher stake in
the plant, subject to the provisions of the standstill and enhanced collaboration agreements with Algonquin.
On May 31, 2019, we entered into an agreement with Abengoa to acquire a 15% stake in Rioglass, a multinational manufacturer of solar components in order to secure certain Abengoa obligations.
The investment was $7 million, and it is classified as available for sale and is expected to generate interest income for us once divested.
On August 2, 2019, we closed the acquisition of ASI Operations, the company that performs the operation and maintenance services to Solana and Mojave plants. The consideration paid was $6
million. Additionally, we have internalized part of the operation and maintenance activities contracted in two wind assets, maintaining a direct relationship with the supplier for the turbine maintenance services.
On October 22, 2019, we closed the acquisition of ATN Expansion 2, as previously announced, for a total equity investment of approximately $20 million. The off-taker is Enel Green Power Peru.
Transfer of the concession agreement is pending authorization from the Ministry of Energy in Peru. If this authorization were not to be obtained within an eight-month period, the transaction would be reversed with no penalties to Atlantica.
Recent Developments
On May 9, 2019, we signed a new enhanced collaboration agreement with Algonquin according to which:
| • |
Both companies have agreed to analyze jointly during the following six months Algonquin’s contracted assets portfolio in the U.S. and Canada to
identify assets where a drop down could add value for both parties, according to each company’s key metrics. This process is taking longer than initially expected.
|
| • |
The existing Shareholders Agreement has been modified to allow Algonquin to increase its shareholding in Atlantica up to a 48.5% without any change
in corporate governance. Algonquin’s voting rights and rights to appoint directors are limited to a 41.5% and the difference between Algonquin’s ownership and 41.5% will vote replicating non-Algonquin’s shareholders vote. Part of this investment in Atlantica’s shares was done by Algonquin by subscribing $30 million dollars in new shares issued by Atlantica on May 22, 2019. In addition, Algonquin
acquired an additional 2 million shares through an accelerated share purchase agreement signed with a broker on May 31, 2019, increasing its stake in us up to a 44.2%.
|
We cannot guarantee that we will be able to consummate the acquisition of the stakes or the investments following the agreement with
Algonquin.
On May 7, 2019, a proposal led by AAGES won the bidding process for a new transmission line in Uruguay. The project includes two transmission lines of approximately 50 miles and a substation,
which will be contracted under 20 and 30 year agreements, respectively, in U.S. dollars with UTE, the current off-taker in the three plants we own in Uruguay. One of the competing bidders initiated a process that could lead to the exclusion of
the AAGES proposal.
In addition, we have signed an option to acquire, until April 30, 2020, Liberty’s equity interest in Solana for approximately $300 million. Liberty is the tax equity investor in our Solana
asset. We expect to initially finance the acquisition with available liquidity, proceeds of a bridge financing currently under negotiation and potential project debt refinancings in Spain.
In February 2020 we have priced a € 290 million secured 2020 Green Private Placement that we expect to close in April 2020 subject to certain conditions. The private placement accrues
interest at an annual 1.96% interest, payable quarterly and has a June 2026 maturity. We expect to use the proceeds to refinance and cancel in full the Note Issuance Facility 2017. We cannot guarantee that the 2020 Green Private Placement will
close as expected or at all.
On February 26, 2020, our board of directors approved a dividend of $0.41 per share, which represents an increase of 10.8% from the fourth quarter of 2018. The dividend is expected to be paid
on March 23, 2020, to shareholders of record as of March 12, 2020.
On January 29, 2020, one year following its chapter 11 bankruptcy filing, PG&E announced that the majority of stakeholders were supportive of PG&E’s proposed plan of reorganization
and a schedule to confirm the plan by May 27, 2020 was filed with the Bankruptcy Court. PG&E’s proposed plan is contingent upon having access to a California state-run wildfire fund, with such access contingent on several factors including
approval from the California governor. See “ Item 3.D— Risk Factor— Counterparties to our off-take agreements may not fulfill their obligations and, as our contracts expire, we may not be able to replace them with agreements on similar terms in
light of increasing competition in the markets in which we operate.”
Key Metrics
We regularly review a number of financial measurements and operating metrics to evaluate our performance, measure our growth and make strategic decisions. In addition to traditional IFRS
performance measures, such as total revenue, we also consider Further Adjusted EBITDA. Our management believes Further Adjusted EBITDA is useful to investors and other users of our financial statements in evaluating our operating performance
because it provides them with additional tools to compare business performance across companies and across periods. EBITDA is widely used by investors to measure a company’s operating performance without regard to items such as interest
expense, taxes, depreciation and amortization, which can vary substantially from company to company depending upon accounting methods and book value of assets, capital structure and the method by which assets were acquired. Further Adjusted
EBITDA is widely used by other companies in the same industry.
Further Adjusted EBITDA is calculated as profit/(loss) for the year attributable to the parent company, after adding back loss/(profit) attributable to non-controlling interest from continued
operations, income tax, share of profit/(loss) of associates carried under the equity method, finance expense net, depreciation, amortization and impairment charges of entities included in the Annual Consolidated Financial Statements, and
dividends received from our preferred equity investment in ACBH. Further Adjusted EBITDA for the first quarter of 2017 includes compensation received from Abengoa in lieu of ACBH dividends. See “Presentation of Financial Information—Non-GAAP
Financial Measures” and “—Factors Affecting the Comparability of Our Results of Operations—Exchangeable Preferred Equity Investment in Abengoa Concessões Brasil Holding.”
Results of Operations
Revenue by geography
Our revenue and Further Adjusted EBITDA by geography and business sector for the years ended December 31, 2019, 2018 and 2017 are set forth in the following tables:
|
Year ended December 31,
|
||||||||||||||||||||||||
|
2019
|
2018
|
2017
|
||||||||||||||||||||||
|
$ in
millions
|
% of
revenue
|
$ in
millions
|
% of
revenue
|
$ in
millions
|
% of
revenue
|
|||||||||||||||||||
|
North America
|
$
|
333.0
|
32.9
|
%
|
$
|
357.2
|
34.2
|
%
|
$
|
332.7
|
33.0
|
%
|
||||||||||||
|
South America
|
142.2
|
14.1
|
%
|
123.2
|
11.8
|
%
|
120.8
|
12.0
|
%
|
|||||||||||||||
|
EMEA
|
536.3
|
53.0
|
%
|
563.4
|
54.0
|
%
|
554.9
|
55.0
|
%
|
|||||||||||||||
|
Total revenue
|
$
|
1,011.5
|
100.0
|
%
|
$
|
1,043.8
|
100
|
%
|
$
|
1,008.4
|
100
|
%
|
||||||||||||
Revenue by business sector
|
Year ended December 31,
|
||||||||||||||||||||||||
|
2019
|
2018
|
2017
|
||||||||||||||||||||||
|
$ in
millions
|
% of
revenue
|
$ in
millions
|
% of
revenue
|
$ in
millions
|
% of
revenue
|
|||||||||||||||||||
|
Renewable Energy
|
$
|
761.1
|
75.2
|
%
|
$
|
793.5
|
76.0
|
%
|
$
|
767.2
|
76.1
|
%
|
||||||||||||
|
Efficient Natural Gas
|
122.3
|
12.1
|
%
|
130.8
|
12.5
|
%
|
119.8
|
11.9
|
%
|
|||||||||||||||
|
Electric Transmission
|
103.5
|
10.2
|
%
|
96.0
|
9.2
|
%
|
95.1
|
9.4
|
%
|
|||||||||||||||
|
Water
|
24.6
|
2.4
|
%
|
23.5
|
2.3
|
%
|
26.3
|
2.6
|
%
|
|||||||||||||||
|
Total revenue
|
$
|
1,011.5
|
100.0
|
%
|
$
|
1,043.8
|
100
|
%
|
$
|
1,008.4
|
100
|
%
|
||||||||||||
Further Adjusted EBITDA by geography
|
Year ended December 31,
|
||||||||||||||||||||||||
|
2019
|
2018
|
2017
|
||||||||||||||||||||||
|
$ in
millions
|
% of
revenue
|
$ in
millions
|
% of
revenue
|
$ in
millions
|
% of
revenue
|
|||||||||||||||||||
|
North America
|
$
|
305.1
|
91.6
|
%
|
$
|
308.8
|
86.4
|
%
|
$
|
282.3
|
84.9
|
%
|
||||||||||||
|
South America
|
115.3
|
81.1
|
%
|
100.2
|
81.3
|
%
|
108.8
|
90.0
|
%
|
|||||||||||||||
|
EMEA
|
390.8
|
72.9
|
%
|
441.6
|
78.4
|
%
|
388.2
|
70.0
|
%
|
|||||||||||||||
|
Further Adjusted EBITDA(1)
|
$
|
811.2
|
80.2
|
%
|
$
|
850.6
|
81.5
|
%
|
$
|
779.3
|
77.3
|
%
|
||||||||||||
Further Adjusted EBITDA by business sector
|
Year ended December 31,
|
||||||||||||||||||||||||
|
2019
|
2018
|
2017
|
||||||||||||||||||||||
|
$ in
millions
|
% of
revenue
|
$ in
millions
|
% of
revenue
|
$ in
millions
|
% of
revenue
|
|||||||||||||||||||
|
Renewable Energy
|
$
|
603.7
|
$
|
79.3
|
%
|
$
|
664.4
|
83.7
|
%
|
$
|
569.2
|
74.2
|
%
|
|||||||||||
|
Efficient Natural Gas
|
107.5
|
87.9
|
%
|
93.9
|
71.8
|
%
|
106.1
|
88.6
|
%
|
|||||||||||||||
|
Electric Transmission
|
85.6
|
82.7
|
%
|
78.4
|
81.7
|
%
|
87.7
|
92.2
|
%
|
|||||||||||||||
|
Water
|
14.4
|
58.5
|
%
|
13.9
|
59.1
|
%
|
16.3
|
62.0
|
%
|
|||||||||||||||
|
Further Adjusted EBITDA(1)
|
$
|
811.2
|
$
|
80.2
|
%
|
$
|
850.6
|
81.5
|
%
|
$
|
779.3
|
77.3
|
%
|
|||||||||||
Note:—
| (1) |
Further Adjusted EBITDA is calculated as profit/(loss) for the year attributable to the parent company, after adding back loss/(profit) attributable to non-controlling interest from continued
operations, income tax, share of profit/(loss) of associates carried under the equity method, finance expense net, depreciation, amortization and impairment charges of entities included in the Annual Consolidated Financial
Statements, and dividends received from our preferred equity investment in ACBH until the first quarter of 2017. Further Adjusted EBITDA for the first quarter of 2017 includes compensation received from Abengoa in lieu of ACBH
dividends. Further Adjusted EBITDA is not a measure of performance under IFRS as issued by the IASB and you should not consider Further Adjusted EBITDA as an alternative to operating income or profits or as a measure of our
operating performance, cash flows from operating, investing and financing activities or as a measure of our ability to meet our cash needs or any other measures of performance under generally accepted accounting principles. We
believe that Further Adjusted EBITDA is a useful indicator of our ability to incur and service our indebtedness and can assist securities analysts, investors and other parties to evaluate us. Further Adjusted EBITDA and similar
measures are used by different companies for different purposes and are often calculated in ways that reflect the circumstances of those companies. Further Adjusted EBITDA may not be indicative of our historical operating results,
nor is it meant to be predictive of potential future results. See “Presentation of Financial Information—Non-GAAP Financial Measures.”
|
Factors Affecting the Comparability of Our Results of Operations
Acquisitions
The results of operations of each acquisition have been consolidated since the date of their respective acquisition except for Monterrey, which is recorded under the equity method since its
acquisition date. The acquisitions we have made during the last three years and any other acquisitions we may make from time to time, will affect the comparability of our results of operations.
Agreement to repurchase long-term operation and maintenance variable services
The operation and maintenance services received in some of our Spanish solar assets include a variable portion payable in the long-term. On April 26, 2018, we purchased from Abengoa the
long-term operation and maintenance payable accrued until December 31, 2017, which amounted to $57.3 million. We paid $18.3 million for this payable and as a result, in the second quarter of 2018, we recorded a one-time gain for the difference,
amounting to $39.0 million which was recorded in “Other Operating Income” (see “Comparison of the Years Ended December 31, 2019 and 2018 Other operating income”).
Project debt refinancing
In the second quarter of 2018, we refinanced Helios 1/2 and Helioenergy 1/2. Under the new IFRS 9, when there is a refinancing with a non-substantial modification of the original debt, there
is a gain or loss recorded in the income statement. This gain or loss is equal to the difference between the present value of the cash flows under the original terms of the former financing and the present value of the cash flows under the new
financing, each discounted at the original effective interest rate. As a result, we recorded non-cash financial income of $36.6 million in the second quarter of 2018.
Exchangeable Preferred Equity Investment in Abengoa Concessões Brasil Holding
Since our IPO until 2017 we held an exchangeable preferred equity investment in ACBH. See “Item 4.B—Business Overview— Electric Transmission—Exchangeable Preferred Equity Investment in
Abengoa Concessões Brasil Holding.” In the third quarter of 2016, we entered into an agreement with Abengoa relating to the ACBH preferred equity investment under which, among other things, we were recognized as the legal owner of the dividends
that we retained from Abengoa and these amounts were recorded as Further Adjusted EBITDA in 2017 ($10.4 million) and in 2016 ($28.0 million). As a result of this agreement, we waived, as agreed, all our rights under the ACBH agreements,
including our right to further retain dividends payable to Abengoa. As a result, in March 2017, we wrote off the accounting value of the ACBH instrument, which amounted to $30.5 million as of December 31, 2016. We no longer own any shares in
ACBH and we sold entirely all the debt and equity instruments we received from Abengoa.
Impairment
In the fourth quarter of 2018, we recorded an impairment of $42.7 million relating to Solana due to the underperformance of the plant in the past few years and the uncertainty of the
production level expected in the future. See Note 6 of our Annual Consolidated Financial Statements.
Change of ownership under Section 382 of the Internal Revenue Code
Under section 382 of the IRC, an “ownership change” would occur if our direct and indirect “5-percent shareholders,” as defined under Section 382 of the IRC, collectively increased their
ownership in us by more than 50 percentage points over a rolling three-year period. In 2017, as a result of Abengoa’s restructuring and the change in its shareholder base, we experienced a change of ownership as defined under section 382 of the
IRC, which caused an annual limitation on the use of the pre-ownership change U.S. NOLs generated by our U.S. solar assets equal to the equity value of the asset immediately before the ownership change, multiplied by the long-term tax-exempt
rate for the month in which the ownership change occurs, and increased by a certain portion of any “built-in-gains.” In addition, because we had recorded tax credits for the U.S. tax loss carryforwards in the past, the limitation to our ability
to use net operating loss carryforwards in the United States resulted in writing off tax credits previously recognized equal to $96 million in 2017. This one-time income tax expense did not have any cash impact in 2017.
U.S. Tax Reform
In December 2017, the TCJA was enacted in the United States. The measures adopted include, among other measures, a decrease in the federal corporate tax rate from 35.0% to 21.0% effective
January 1, 2018. We therefore adjusted the deferred tax assets and liabilities of our U.S. entities using the new enacted corporate tax rate as of December 31, 2017, resulting in a one-time non-cash income tax expense of $19 million recorded in
the consolidated income statement for the year ended December 31, 2017.
Factors Affecting Our Results of Operations
Interest rates
We incur significant indebtedness at the corporate and asset level. The interest rate risk arises mainly from indebtedness with variable interest rates.
Most of our debt consists of project debt. As of December 31, 2019, approximately 92% of our project debt has either fixed interest rates or has been hedged with swaps or caps.
To mitigate interest rate risk, we primarily use long-term interest rate swaps and interest rate options which, in exchange for a fee, offer protection against a rise in interest rates. We
estimate that approximately 91% of our total interest risk exposure was fixed or hedged as of December 31, 2019. Nevertheless, our results of operations can be affected by changes in interest rates with respect to the unhedged portion of our
indebtedness that bears interest at floating rates, which typically bears a spread over EURIBOR or LIBOR.
Exchange rates
Our functional currency is the U.S. dollar, as most of our revenues and expenses are denominated or linked to U.S. dollars. All our companies located in North America, South America and
Algeria have their PPAs, or concessional agreements, and financing contracts signed in, or indexed totally or partially to, U.S. dollars. Our solar power plants in Spain have their revenues and expenses denominated in euros, and Kaxu, our
solar plant in South Africa, has its revenues and expenses denominated in South African rand.
Our strategy is to hedge cash distributions from our Spanish assets. We hedge the exchange rate for the distributions from our Spanish assets after deducting euro-denominated interest
payments and euro-denominated general and administrative expenses. Through currency options, we have hedged 100% of our euro-denominated net exposure for the next 12 months and 75% of our euro-denominated net exposure for the following 12
months. We expect to continue with this hedging strategy on a rolling basis.
Although we hedge cash-flows in euros, fluctuations in the value of the euro in relation to the U.S. dollar may affect our operating results. Impacts associated with fluctuations in foreign
currency are discussed in more detail under “Item 11—Quantitative and Qualitative Disclosure about Market Risk—Foreign exchange rate risk”. In subsidiaries with functional currency other than the U.S. dollar, assets and liabilities are
translated into U.S. dollars using end-of-period exchange rates. Revenue, expenses and cash flows are translated using average rates of exchange. Fluctuations in the value of the South African rand in relation to the U.S. dollar may also
affect our operating results.
Apart from the impact of translation differences described above, the exposure of our income statement to fluctuations of foreign currencies is limited, as the financing of projects is
typically denominated in the same currency as that of the contracted revenue agreement. This policy seeks to ensure that the main revenue and expenses in foreign companies are denominated in the same currency, limiting our risk of foreign
exchange differences in our financial results.
In our discussion of operating results, we have included foreign exchange impacts in our revenue by providing constant currency revenue
growth. The constant currency presentation is not a measure recognized under IFRS and excludes the impact of fluctuations in foreign currency exchange rates. We believe providing constant currency information provides valuable supplemental
information regarding our results of operations. We calculate constant currency amounts by converting our current period local currency revenue using the prior period foreign currency average exchange rates and comparing these adjusted
amounts to our prior period reported results. This calculation may differ from similarly titled measures used by others and, accordingly, the constant currency presentation is not meant to substitute for recorded amounts presented in
conformity with IFRS as issued by the IASB nor should such amounts be considered in isolation.
Key Performance Indicators
In addition to the factors described above, we closely monitor the following key drivers of our business sectors’ performance to plan for our needs, and to adjust our expectations, financial
budgets and forecasts appropriately.
|
As of and for the year ended December 31,
|
||||||||||||
|
2019
|
2018
|
2017
|
||||||||||
|
Renewable Energy
|
||||||||||||
|
MW in operation(1)
|
1,496
|
1,496
|
1,442
|
|||||||||
|
GWh produced(2)
|
3,236
|
3,058
|
3,167
|
|||||||||
|
Efficient Natural Gas
|
||||||||||||
|
MW in operation(3)
|
343
|
300
|
300
|
|||||||||
|
GWh produced(4)
|
2,090
|
2,318
|
2,372
|
|||||||||
|
Availability (%)(4)(5)
|
95.0
|
%
|
99.8
|
%
|
100.5
|
%
|
||||||
|
Electric Transmission
|
||||||||||||
|
Miles in operation
|
1,166
|
1,152
|
1,099
|
|||||||||
|
Availability (%)(6)
|
100.0
|
%
|
99.9
|
%
|
97.9
|
%
|
||||||
|
Water
|
||||||||||||
|
Mft3 in operation(1)
|
10.5
|
10.5
|
10.5
|
|||||||||
|
Availability (%)(6)
|
101.2
|
%
|
102.0
|
%
|
101.8
|
%
|
||||||
Note:
| (1) |
Represents total installed capacity in assets owned at the end of the period, regardless of our percentage of ownership in each of the assets.
|
| (2) |
Includes curtailment in wind assets for which we receive compensation
|
| (3) |
Includes 43MW corresponding to our 30% share of Monterrey since August 2, 2019
|
| (4) |
Major maintenance overhaul held in Q1 and Q2 2019, as scheduled, which reduced production and electric availability as per the contract. GWh produced in the third quarter of 2019 also includes 30%
production from Monterrey since August 2019.
|
| (5) |
Electric availability refers to operational MW over contracted MW
|
| (6) |
Availability refers to actual availability divided by contracted availability.
|
Results of Operations
The table below illustrates our results of operations for the years ended December 31, 2019, 2018 and 2017.
|
Year ended December 31,
|
||||||||||||
|
2019
|
2018
|
2017
|
||||||||||
|
$ in millions
|
||||||||||||
|
Revenue
|
1,011.5
|
$
|
1,043.8
|
$
|
1,008.4
|
|||||||
|
Other operating income
|
93.8
|
132.5
|
80.8
|
|||||||||
|
Employee benefit expenses
|
(32.2
|
)
|
(15.1
|
)
|
(18.7
|
)
|
||||||
|
Depreciation, amortization and impairment charges
|
(310.8
|
)
|
(362.7
|
)
|
(311.0
|
)
|
||||||
|
Other operating expenses
|
(261.8
|
)
|
(310.6
|
)
|
(301.5
|
)
|
||||||
|
Operating profit/(loss)
|
$
|
500.4
|
$
|
487.9
|
$
|
458.0
|
||||||
|
Financial income
|
4.1
|
36.4
|
1.0
|
|||||||||
|
Financial expense
|
(408.0
|
)
|
(425.0
|
)
|
(463.7
|
)
|
||||||
|
Net exchange differences
|
2.7
|
1.6
|
(4.1
|
)
|
||||||||
|
Other financial income/(expense), net
|
(1.1
|
)
|
(8.2
|
)
|
18.4
|
|||||||
|
Financial expense, net
|
$
|
(402.3
|
)
|
$
|
(395.2
|
)
|
$
|
(448.4
|
)
|
|||
|
Share of profit/(loss) of associates carried under the equity method
|
7.4
|
5.2
|
5.3
|
|||||||||
|
Profit/(loss) before income tax
|
$
|
105.6
|
$
|
97.9
|
$
|
14.9
|
||||||
|
Income tax
|
(30.9
|
)
|
(42.6
|
)
|
(119.8
|
)
|
||||||
|
Profit/(loss) for the year
|
$
|
74.6
|
$
|
55.3
|
$
|
(104.9
|
)
|
|||||
|
Profit/(loss) attributable to non-controlling interests
|
(12.5
|
)
|
(13.7
|
)
|
(6.9
|
)
|
||||||
|
Profit / (loss) for the year attributable to the parent company
|
$
|
62.1
|
$
|
41.6
|
$
|
(111.8
|
)
|
|||||
Comparison of the Years Ended December 31, 2019 and 2018
The significant variances or variances of the significant components of the results of operations are discussed in the following section
Revenue
Revenue decreased by 3.1% to $1,011.5 million for the year ended December 31, 2019, compared to $1,043.8 million for the year ended December 31, 2018. The decrease was primarily due to the
effect of the depreciation of the euro and the South African rand against the U.S. dollar. On a constant currency basis, revenue for the year ended December 31, 2019 would have remained stable at $1,043.6 million, compared to year ended
December 31, 2018. Although we hedge our net cash flow exposure to the euro, variations in the euro to U.S. dollar exchange rate affect our revenues and Further Adjusted EBITDA. The decrease in revenue was also due in part to lower production
from our U.S. solar assets, resulting from lower solar radiation in the first half of 2019, longer than expected maintenance stops in the first quarter and reduced capacity in Mojave in the second half of the year. These effects were partially
offset by an increase in revenues from our recent acquisitions of wind and transmission assets and solid operational performance in the rest of our assets.
Other operating income
The following table sets forth our other operating income for the years ended December 31, 2019 and 2018:
|
Year ended December 31,
|
||||||||
|
2019
|
2018
|
|||||||
|
Other operating income
|
$ in millions
|
|||||||
|
Grants
|
59.1
|
59.4
|
||||||
|
Income from various services
|
34.7
|
34.2
|
||||||
|
Income from purchase of long-term O&M payable
|
-
|
39.0
|
||||||
|
Total
|
93.8
|
132.6
|
||||||
Other operating income decreased by 29% to $93.8 million for the year ended December 31, 2019, compared to $132.5 million for the year ended December 31, 2018. The decrease was mainly due to
the one-time gain we recorded in the second quarter of 2018 in relation to the purchase from Abengoa of the long-term operation and maintenance payable accrued until December 31, 2017, which amounted to $57.3 million. We paid $18.3 million for
this and as a result in the second quarter of 2018 we recorded a one-time gain equal to the difference, amounting to $39.0 million. Excluding this one-time impact, other operating income for the year ended December 31, 2019 was in line with the
same period of 2018.
Grants represent the financial support provided by the U.S. government to Solana and Mojave and consist of ITC Cash Grant and an implicit grant related to the below market interest rates of
the project loans with the Federal Financing Bank. Income from various services include amounts received for our U.S. solar assets from our EPC contractor under their obligations and amounts received from insurance claims.
Employee benefits expenses
Employee benefit expenses increased by 113% to $32.2 million for the year ended December 31, 2019, compared to $15.1 million for the year ended December 31, 2018. The increase is primarily
due to the internalization of operation and maintenance services in our U.S. solar assets, following the acquisition of ASI Operations on July 30, 2019. The operation and maintenance costs for these assets were mainly recorded as “Other
operating expenses” until July 30, 2019. We expect this internalization to result in a cost reduction of $0.5 million to $0.6 million per year, which corresponds to the margin fee previously paid to Abengoa. The increase of employee benefit
expenses is also due to a $4.7 million reversal in the fourth quarter of 2018 of the accrual of the 2016-2018 LTIP. The plan covered the three-year period 2016 to 2018 and was paid in March 2019.
Depreciation, amortization and impairment charges
Depreciation, amortization and impairment charges decreased by 14.3% to $310.8 million for the year ended December 31, 2019, compared with $362.7 million for the year ended December 31, 2018,
mainly due to the recognition of a $42.7 million impairment relating to Solana during the fourth quarter of 2018 with no corresponding amount in 2019. The decrease is also due to a reversal of the impairment provisions in ACT in 2019 as a
result of the application of IFRS 9. IFRS 9 requires impairment provisions to be based on the expected credit losses on financial assets rather than on actual credit losses and the expected loss decreased in the year ended December 31, 2019.
This decrease was partially offset by the increase resulting from the new assets acquired at the end of 2018.
Other operating expenses
The following table sets forth our other operating expenses for the years ended December 31, 2019 and 2018:
|
Year ended December 31,
|
||||||||||||||||
|
2019
|
2018
|
|||||||||||||||
|
Other operating expenses
|
$ in
millions
|
% of
revenue
|
$ in
millions
|
% of
revenue
|
||||||||||||
|
Raw Materials
|
9.7
|
1.0
|
%
|
10.6
|
1.0
|
%
|
||||||||||
|
Leases and fees
|
1.9
|
0.2
|
%
|
1.7
|
0.2
|
%
|
||||||||||
|
Operation and maintenance
|
116.0
|
11.5
|
%
|
145.8
|
13.8
|
%
|
||||||||||
|
Independent professional services
|
41.6
|
4.1
|
%
|
43.2
|
4.1
|
%
|
||||||||||
|
Supplies
|
25.8
|
2.6
|
%
|
26.0
|
2.3
|
%
|
||||||||||
|
Insurance
|
24.0
|
2.4
|
%
|
24.2
|
2.6
|
%
|
||||||||||
|
Levies and duties
|
34.8
|
3.4
|
%
|
37.5
|
3.5
|
%
|
||||||||||
|
Other expenses
|
8.0
|
0.8
|
%
|
21.6
|
2.0
|
%
|
||||||||||
|
Total
|
261.8
|
26.0
|
%
|
310.6
|
29.
|
%
|
||||||||||
Other operating expenses decreased by 16% to $261.8 million for the year ended December 31, 2019, compared to $310.6 million for the year ended December 31, 2018. This decrease was mainly due
to lower costs in ACT since a major overhaul took place during the first half of 2019. Operation and maintenance costs in ACT are higher in the quarters prior to the major overhaul. The decrease was also due to the internalization of the
operation and maintenance services in our U.S. solar assets which commenced on July 30, 2019, given most of the costs have been recorded in “Employee benefit expenses” since that date.
Operating profit
As a result of the above factors, operating profit increased by 2.6% to $500.4 million for the year ended December 31, 2019, compared with $487.9 million for the year ended December 31, 2018.
Financial income and financial expense
|
Year ended December 31,
|
||||||||
|
Financial income and financial expense
|
2019
|
2018
|
||||||
| $ in millions | ||||||||
|
Financial income
|
4.1
|
36.4
|
||||||
|
Financial expense
|
(408.0
|
)
|
(425.0
|
)
|
||||
|
Net exchange differences
|
2.7
|
1.6
|
||||||
|
Other financial income/(expense), net
|
(1.1
|
)
|
(8.2
|
)
|
||||
|
Financial expense, net
|
(402.3
|
)
|
(395.2
|
)
|
||||
Financial income
Financial income decreased to $4.1 million for the year ended December 31, 2019, compared to $36.4 million for the year ended December 31, 2018, mainly due to a non-cash financial income of
$36.4 million recorded in the second quarter of 2018, resulting from the refinancing of Helios 1/2 and Helioenergy 1/2. Under the new IFRS 9, when there is a refinancing with a non-substantial modification of the original debt, there is a gain
or loss recorded in the income statement. This gain or loss is equal to the difference between the present value of the cash flows under the original terms of the former financing and the present value of the cash flows under the new financing,
discounted both at the original effective interest rate.
Financial expense
The following table sets forth our financial expense for the years ended December 31, 2019 and 2018:
|
Year ended December 31,
|
||||||||
|
Financial expense
|
2019
|
2018
|
||||||
|
$ in millions
|
||||||||
|
Expenses due to interest:
|
||||||||
|
Loans with credit entities
|
(259.4
|
)
|
(256.7
|
)
|
||||
|
Other debts
|
(89.3
|
)
|
(100.1
|
)
|
||||
|
Interest rates losses derivatives: cash flow hedges
|
(59.3
|
)
|
(68.2
|
)
|
||||
|
Total
|
(408.0
|
)
|
(425.0
|
)
|
||||
Financial expense decreased by 4% to $408.0 million for the year ended December 31, 2019, compared to $425.0 million for the year ended December 31, 2018. The decrease is mainly due to the
decrease in interest on other debts, which consists of interest on the notes issued by ATS, ATN and Solaben Luxembourg and interests related to the investments from Liberty. Decrease in 2019 in interest and other debt is primarily due to a
lower financial cost related to the the Liberty liability compared to the previous year. In 2018 we updated the accounting model used to calculate this liability taking into account the past underperformance of Solana and recorded a non-cash
expense. This decrease was partially offset by the increase in interest from loans with credit entities due to cancelation costs and fees related to the prepayment in full of the 2019 Notes in the second quarter of 2019 and to the increase and
extension of the Revolving Credit Facility signed on August 2, 2019.
Losses from interest rate derivatives designated as cash flow hedges correspond primarily to transfers from equity to financial expense when the hedged item is impacting the consolidated
condensed income statement.
Other financial income/(expense), net
|
Year ended December 31,
|
||||||||
|
Other financial income/(expense), net
|
2019
|
2018
|
||||||
|
$ in millions
|
||||||||
|
Other financial income
|
14.2
|
14.4
|
||||||
|
Other financial losses
|
(15.3
|
)
|
(22.6
|
)
|
||||
|
Total
|
(1.1
|
)
|
(8.2
|
)
|
||||
Other financial income/(expense), net decreased to a expense of $ 1.1 million for the year ended December 31, 2019 compared to a net expense of $8.2 million for the year ended December 31,
2018. Other financial income in 2019 are primarily interests on deposits. Other financial expense primarily corresponds to expenses for guarantees and letters of credit, wire transfers, other bank fees and other minor financial expenses. The
decrease in other financial expense was mostly due to $6.2 million cost recorded in the second quarter of 2018 in relation to the cancelation of project guarantees in Mojave.
Share of profit of associates carried under the equity method
Share of profit of associates carried under the equity method increased by 43% to $7.5 million in the year ended December 31, 2019 compared to $5.2 million in the year ended December 31,
2018. This includes the results of Honaine and Monterrey, which are recorded under the equity method. The increase was primarily due to an increase in the contribution from Honaine.
Profit/(loss) before income tax
As a result of the previously mentioned factors, we reported a profit before income taxes of $105.6 million for the year ended December 31, 2019, compared to a profit before income taxes of
$97.9 million for the year ended December 31, 2018.
Income tax
The effective tax rate for the periods presented has been established based on management’s best estimates. For the year ended December 31, 2019, income tax amounted to an expense of $30.9
million, with a profit before income tax of $105.6 million. For the year ended December 31, 2018, income tax amounted to a $42.6 million of expense, with a profit before income tax of $97.9 million.
The effective tax rate differs from the nominal tax rate mainly due to permanent differences and treatment of tax credits in some jurisdictions.
Profit attributable to non-controlling interests
Profit attributable to non-controlling interests was $12.5 million for the year ended December 31, 2019 compared to $13.7 million for the year ended December 31, 2018. Profit attributable to
non-controlling interest corresponds to the portion attributable to our partners in the assets that we consolidate (Kaxu, Skikda, Solaben 2/3, Solacor 1/2 and Seville PV).
Profit / (loss) attributable to the parent company
As a result of the previously mentioned factors, profit attributable to the parent company was $62.1 million for the year ended December 31, 2019, compared to a profit of $41.6 million for
the year ended December 31, 2018.
Comparison of the Years Ended December 31, 2018 and 2017
The significant variances or variances of the significant components of the results of operations between the years ended December 31, 2018 and December 31, 2017, are discussed in the Form
20-F filed with the SEC on February 28, 2019.
Segment Reporting
We organize our business into the following three geographies where the contracted assets and concessions are located:
• North America;
• South America; and
• EMEA.
In addition, we have identified the following business sectors based on the type of activity:
• Renewable energy, which includes our activities related to the production of electricity from concentrating solar power and wind plants;
• Efficient natural gas, which includes our activities related to the production of electricity and steam from natural gas;
• Electric transmission, which includes our activities related to the operation of electric transmission lines; and
• Water, which includes our activities related to desalination plants.
As a result, we report our results in accordance with both criteria.
Comparison of the Years Ended December 31, 2019 and 2018
Revenue and Further Adjusted EBITDA by geography
The following table sets forth our revenue, Further Adjusted EBITDA and volumes for the years ended December 31, 2019 and 2018, by geographic region:
Revenue by geography
|
Year ended December 31,
|
||||||||||||||||
|
2019
|
2018
|
|||||||||||||||
|
Revenue by geography
|
$ in
millions
|
% of
revenue
|
$ in
millions
|
% of
revenue
|
||||||||||||
|
North America
|
333.0
|
32.9
|
%
|
357.2
|
34.2
|
%
|
||||||||||
|
South America
|
142.2
|
14.1
|
%
|
123.2
|
11.8
|
%
|
||||||||||
|
EMEA
|
536.3
|
53.0
|
%
|
563.4
|
54.0
|
%
|
||||||||||
|
Total revenue
|
1,011.5
|
100.0
|
%
|
1,043.8
|
100.0
|
%
|
||||||||||
Further Adjusted EBITDA by geography
|
Year ended December 31,
|
||||||||||||||||
|
2019
|
2018
|
|||||||||||||||
|
Further Adjusted EBITDA by geography
|
$ in
millions
|
% of
revenue
|
$ in
millions
|
% of
revenue
|
||||||||||||
|
North America
|
305.1
|
91.6
|
%
|
308.8
|
86.4
|
%
|
||||||||||
|
South America
|
115.3
|
81.1
|
%
|
100.2
|
81.3
|
%
|
||||||||||
|
EMEA
|
390.8
|
72.9
|
%
|
441.6
|
78.4
|
%
|
||||||||||
|
Further Adjusted EBITDA(1)
|
811.2
|
80.2
|
%
|
850.6
|
81.5
|
%
|
||||||||||
Note:
| (1) |
Further Adjusted EBITDA is calculated as profit/(loss) for the year attributable to the parent company, after adding back loss/(profit) attributable to non-controlling interest from continued
operations, income tax, share of profit/(loss) of associates carried under the equity method, finance expense net, depreciation, amortization and impairment charges of entities included in the Annual Consolidated Financial
Statements, and dividends received from our preferred equity investment in ACBH until the first quarter of 2017. Further Adjusted EBITDA is not a measure of performance under IFRS as issued by the IASB, and you should not consider
Further Adjusted EBITDA as an alternative to operating income or profits or as a measure of our operating performance, cash flows from operating, investing and financing activities or as a measure of our ability to meet our cash
needs or any other measures of performance under generally accepted accounting principles. We believe that Further Adjusted EBITDA is a useful indicator of our ability to incur and service our indebtedness and can assist securities
analysts, investors and other parties to evaluate us. Further Adjusted EBITDA and similar measures are used by different companies for different purposes and are often calculated in ways that reflect the circumstances of those
companies. Further Adjusted EBITDA may not be indicative of our historical operating results, nor is it meant to be predictive of potential future results. See “Presentation of Financial Information—Non-GAAP Financial Measures.”
|
Volume by geography
|
Volume produced/availability
|
||||||||
|
Year ended December 31,
|
||||||||
|
Volume by geography
|
2019
|
2018
|
||||||
|
North America (GWh) (1)
|
3,397
|
3,700
|
||||||
|
North America availability(1)(2)
|
95.0
|
%
|
99.8
|
%
|
||||
|
South America (GWh) (3)
|
516
|
349
|
||||||
|
South America availability(4)
|
100
|
%
|
100
|
%
|
||||
|
EMEA (GWh)
|
1,413
|
1,326
|
||||||
|
EMEA availability(4)
|
101.2
|
%
|
102.0
|
%
|
||||
Note:
| (1) |
Major maintenance overhaul conducted in Q1 and Q2 2019 in ACT, as scheduled, which reduced electric production, as per the contract. GWh produced in 2019 also includes 30% production from Monterrey
since August 2019
|
| (2) |
Electric availability refers to operational MW over contracted MW with Pemex
|
| (3) |
Includes curtailment production in wind assets for which we receive compensation
|
| (4) |
Availability refers to actual availability divided by contracted availability
|
North America
Revenue decreased by 6.8% to $333 million for the year ended December 31, 2019, compared to $357.2 million for the year ended December 31, 2018. The decrease was primarily due to lower
production from our U.S. solar assets, mainly as a result of lower solar radiation in the first half of 2019, longer than expected maintenance stops in the first quarter and reduced capacity in Mojave in the second half of the year. Further
Adjusted EBITDA margin increased to 91.6% in the year ended December 31, 2019, compared to 86.4% from the previous year. The increase was mainly due to ACT, where a scheduled major overhaul took place in the first half of 2019, as operation and
maintenance costs are higher in the quarters prior to such major overhauls.
South America
Revenue increased by 15.4% to $142.2 million for the year ended December 31, 2019, compared to $123.2 million for the year ended December 31, 2018. Production increased by 51.8% and
availabilities remained in line with the same period of last year. Further Adjusted EBITDA increased by 15.1% to $115.3 million for the year ended December 31, 2019 compared to $100.2 million for the year ended December 31, 2018. Production,
revenue and Further Adjusted EBITDA increase was primarily a result of the contribution of the newly acquired assets in the region consisting of Melowind, Chile TL3 and ATN Expansion 1 and since October 2019 ATN Expansion 2. Further Adjusted
EBITDA margin remained stable in the year ended December 31, 2019 compared to the previous year.
EMEA
Revenue decreased by 4.8% to $536.3 million for the year ended December 31, 2019, compared to $563.4 million for the year ended December 31, 2018. This revenue decrease was mainly due to the
depreciation of the euro and the South African rand against the U.S. dollar for the year ended December 31, 2019 compared to the previous year. On a constant currency basis, revenue for the year ended December 31, 2019 would have been $568.4
million, representing a 0.9% increase compared to the period ended December 31, 2018. The decrease is also due to lower electricity prices in Spain, which affects a small portion of our revenues in accordance with the regulation in place. This
decrease was partially offset by increased production in Spain and South Africa, where our assets continue to deliver solid operational performance. Further Adjusted EBITDA decreased by 11.5% to $390.8 million for the year ended December 31,
2019 compared to $441.6 million for the period ended December 31, 2018. Further Adjusted EBITDA margin decreased to 72.9% for the year ended December 31, 2019 compared to 78.4% for the previous year. The decrease was mainly due to the $39
million one-time gain we recorded in the second quarter of 2018.
Revenue and Further Adjusted EBITDA by business sector
The following table sets forth our revenue, Further Adjusted EBITDA and volumes for the years ended December 31, 2019 and 2018, by business sector:
|
Revenue by business sector
|
Year ended December 31,
|
|||||||||||||||
|
2019
|
2018
|
|||||||||||||||
|
Revenue by business sector
|
$ in
millions
|
% of
revenue
|
$ in
millions
|
% of
revenue
|
||||||||||||
|
Renewable energy
|
761.1
|
75.2
|
%
|
793.5
|
76.0
|
%
|
||||||||||
|
Efficient natural gas
|
122.3
|
12.1
|
%
|
130.8
|
12.5
|
%
|
||||||||||
|
Electric transmission lines
|
103.5
|
10.2
|
%
|
96.0
|
9.2
|
%
|
||||||||||
|
Water
|
24.6
|
2.4
|
%
|
23.5
|
2.3
|
%
|
||||||||||
|
Total revenue
|
1,011.5
|
100.0
|
%
|
1,043.8
|
100.0
|
%
|
||||||||||
Further Adjusted EBITDA by business sector
|
Year ended December 31,
|
||||||||||||||||
|
2019
|
2018
|
|||||||||||||||
|
Further Adjusted EBITDA by business sector
|
$ in
millions
|
% of
revenue
|
$ in
millions
|
% of
revenue
|
||||||||||||
|
Renewable energy
|
603.7
|
79.3
|
%
|
664.4
|
83.7
|
%
|
||||||||||
|
Efficient natural gas
|
107.5
|
87.9
|
%
|
93.9
|
71.8
|
%
|
||||||||||
|
Electric transmission lines
|
85.6
|
82.7
|
%
|
78.4
|
81.7
|
%
|
||||||||||
|
Water
|
14.4
|
58.5
|
%
|
13.9
|
59.1
|
%
|
||||||||||
|
Further Adjusted EBITDA(1)
|
811.2
|
80.2
|
%
|
850.6
|
81.5
|
%
|
||||||||||
Note:
| (1) |
Further Adjusted EBITDA is calculated as profit/(loss) for the year attributable to the parent company, after adding back loss/(profit) attributable to non-controlling interest from continued
operations, income tax, share of profit/(loss) of associates carried under the equity method, finance expense net, depreciation, amortization and impairment charges of entities included in the Annual Consolidated Financial
Statements, and dividends received from our preferred equity investment in ACBH until the first quarter of 2017. Further Adjusted EBITDA is not a measure of performance under IFRS as issued by the IASB, and you should not consider
Further Adjusted EBITDA as an alternative to operating income or profits or as a measure of our operating performance, cash flows from operating, investing and financing activities or as a measure of our ability to meet our cash
needs or any other measures of performance under generally accepted accounting principles. We believe that Further Adjusted EBITDA is a useful indicator of our ability to incur and service our indebtedness and can assist securities
analysts, investors and other parties to evaluate us. Further Adjusted EBITDA and similar measures are used by different companies for different purposes and are often calculated in ways that reflect the circumstances of those
companies. Further Adjusted EBITDA may not be indicative of our historical operating results, nor is it meant to be predictive of potential future results. See “Presentation of Financial Information—Non-GAAP Financial Measures.”
|
Volume by business sector
|
Volume produced/availability
|
||||||||
|
Year ended December 31,
|
||||||||
|
Volume by business sector
|
2019
|
2018
|
||||||
|
Renewable energy (GWh) (1)
|
3,235
|
3,049
|
||||||
|
Efficient natural gas Power (GWh) (2)
|
2,090
|
2,318
|
||||||
|
Efficient natural gas Power availability(3)
|
95
|
%
|
99.8
|
%
|
||||
|
Electric transmission availability(4)
|
100
|
%
|
99.9
|
%
|
||||
|
Water availability(4)
|
101
|
%
|
102
|
%
|
||||
Note:
| (1) |
Includes curtailment production in wind assets for which we receive compensation
|
| (2) |
Major maintenance overhaul conducted in Q1 and Q2 2019 in ACT, as scheduled, which reduced electric production, as per the contract. GWh produced in 2019 also includes 30% production from Monterrey
since August 2, 2019
|
| (3) |
Electric availability refers to operational MW over contracted MW with Pemex. Major overhaul held in Q1and Q2 2019, as scheduled, which reduced the electric availability as per the contract with Pemex
|
| (4) |
Availability refers to actual availability divided by contracted availability
|
Renewable energy
Revenue decreased by 4.1% to $761.1 million for the year ended December 31, 2019, compared to $793.5 million for the year ended December 31, 2018. Further Adjusted EBITDA decreased by 9.1% to
$603.7 million for the period ended December 31, 2019, compared to $664.4 million for the period ended December 31, 2018. Revenue decreased mainly due to the depreciation of the euro and the South African rand against the U.S. dollar during
2019 compared to 2018. On a constant currency basis, revenue for period ended December 31, 2019 would have been $793.2 million, stable compared to December 31, 2018 revenue. The decrease was also due to lower production in our solar assets in
the United States, mainly due to lower solar radiation in 2019, longer than expected maintenance stops in the first quarter and reduced capacity in Mojave in the second half of 2019. This decrease was partially offset by an increase in
production in Spain and Kaxu, which continue to deliver solid operational performance and by an increase resulting from the contribution of the newly acquired Melowind asset. Further Adjusted EBITDA and Further Adjusted EBITDA margin decrease
were due to the factors mentioned above as well as to the $39 million one-time gain recorded in 2018 described in “Other Operating Income” See “Comparison of the Years Ended December 31, 2019 and 2018 Other operating income”.
Efficient natural gas
Revenue decreased by 6.5% to $122.3 million for the year ended December 31, 2019, compared to $130.8 million for the year ended December 31, 2018, while Further Adjusted EBITDA increased by
14.5% to $107.5 million for the period ended December 31, 2019, compared to $93.9 million for the period ended December 31, 2018. Further Adjusted EBITDA margin increased to 87.9% in the year ended December 31, 2019 from 71.8% in the year ended
December 31, 2018. A major overhaul held in 2019, as scheduled, which reduced the electric availability as per the contract with Pemex without causing a reduction in Further Adjusted EBITDA, since it was scheduled. Further Adjusted EBITDA
increased mainly due to the major overhaul previously mentioned, since operation and maintenance costs are higher in the quarters prior to such major overhauls. In addition, Further Adjusted EBITDA also increased due to a one-time adjustment in
the financial model of approximately $6 million, with no impact in cash in 2019. Our ACT asset is accounted for under IFRIC 12 following the financial asset model, and a decrease in future
operation and maintenance costs has increased the value of the asset, causing a one-time increase in Revenues and Further Adjusted EBITDA.
Electric transmission lines
Revenue increased by 7.8% to $103.5 million for the year ended December 31, 2019, compared to $96.0 million for the year ended December 31, 2018, while Further Adjusted EBITDA increased by
9.2% to $85.6 million for the year ended December 31, 2019, compared to $78.4 million for the year ended December 31, 2018. Further Adjusted EBITDA margin increased to 82.7% in the year ended December 31, 2019 from 81.7% in the year ended
December 31, 2018. Both revenue and Further Adjusted EBITDA increases were mainly due to the contribution from the recently acquired transmission assets consisting of Chile TL3, ATN Expansion 1 and since October 2019 from ATN Expansion 2, with
no corresponding contribution in the previous year.
Water
Revenue and Further Adjusted EBITDA remained stable for the year ended December 31, 2019, amounting to $24.6 million and $14.4 million, respectively, compared to $23.5 million and $13.9
million, respectively, for the year ended December 31, 2018. Further Adjusted EBITDA margin decreased to 58.5% in the year ended December 31, 2019 from 59.1% in the year ended December 31, 2018.
Comparison of the Years Ended December 31, 2018 and 2017
The significant variances in the revenues and volume, by geographic region and business sector, between the years ended December 31, 2018 and December 31, 2017, are discussed in the Form 20-F
filed with the SEC on February 28, 2019.
The liquidity and capital resources discussion which follows contains certain estimates as of the date of this annual report of our sources and uses of liquidity (including estimated future
capital resources and capital expenditures) and future financial and operating results. These estimates, while presented with numerical specificity, necessarily reflect numerous estimates and assumptions made by us with respect to industry
performance, general business, economic, regulatory, market and financial conditions and other future events, as well as matters specific to our businesses, all of which are difficult or impossible to predict and many of which are beyond our
control. These estimates reflect subjective judgment in many respects and thus are susceptible to multiple interpretations and periodic revisions based on actual experience and business, economic, regulatory, financial and other developments.
As such, these estimates constitute forward-looking information and are subject to risks and uncertainties that could cause our actual sources and uses of liquidity (including estimated future capital resources and capital expenditures) and
financial and operating results to differ materially from the estimates made here, including, but not limited to, our performance, industry performance, general business and economic conditions, customer requirements, competition, adverse
changes in applicable laws, regulations or rules, and the various risks set forth in this annual report. See “Forward-looking Statements.”
In addition, these estimates reflect assumptions of our management as of the time that they were prepared as to certain business decisions that were and are subject to change. These estimates
also may be affected by our ability to achieve strategic goals, objectives and targets over the applicable periods. The estimates cannot, therefore, be considered a guarantee of future sources and uses of liquidity (including estimated future
capital resources and capital expenditures) and future financial and operating results, and the information should not be relied on as such. None of us, or our board of directors, advisors, officers, directors or representatives intends to, and
each of them disclaims any obligation to, update, revise, or correct these estimates, except as otherwise required by law, including if the estimates are or become inaccurate (even in the short-term).
The inclusion of these estimates in this annual report should not be deemed an admission or representation by us or our board of directors that such information is viewed by us or our board
of directors as material information of ours. Such information should be evaluated, if at all, in conjunction with the historical financial statements and other information about us contained in this annual report. None of us, or our board of
directors, advisors, officers, directors or representatives has made or makes any representation to any prospective investor or other person regarding our ultimate performance compared to the information contained in these estimates or that
forecasted results will be achieved. In light of the foregoing factors and the uncertainties inherent in the information provided above, investors are cautioned not to place undue reliance on these estimates. Our liquidity plans are subject to
a number of risks and uncertainties, some of which are outside of our control. Macroeconomic conditions could limit our ability to successfully execute our business plans and, therefore, adversely affect our liquidity plans. See “Item 3.D—Risk
Factors.”
Our principal liquidity and capital requirements consist of the following:
| • |
debt service requirements on our existing and future debt;
|
| • |
cash dividends to investors; and
|
| • |
acquisitions of new companies and operations (see “Item 4.B—Business Overview—Our Business Strategy”).
|
As a normal part of our business, depending on market conditions, we will from time to time consider opportunities to repay, redeem, repurchase or refinance our indebtedness. Changes in our
operating plans, lower than anticipated sales, increased expenses, acquisitions or other events may cause us to seek additional debt or equity financing in future periods. There can be no guarantee that financing will be available on acceptable
terms or at all. Debt financing, if available, could impose additional cash payment obligations and additional covenants and operating restrictions. In addition, any of the items discussed in detail under “Item 3.D—Risk Factors” and other
factors may also significantly impact our liquidity.
Liquidity position
As of December 31, 2019, our cash and cash equivalents at the project company level were $496.8 million compared to $524.8 million as of December 31, 2018. In addition, our cash and cash
equivalents at the Company level were $66.0 million as of December 31, 2019 compared to $105.0 million as of December 31, 2018. Additionally, as of December 31, 2019, we had approximately $341 million available under our Revolving Credit
Facility and therefore a total corporate liquidity of $407 million. On August 2, 2019, we entered into an amendment to our Revolving Credit Facility, which increased the commitments thereunder by an additional amount of $125 million, which
represents a total amount of $425 million.
Sources of liquidity
We expect our ongoing sources of liquidity to include cash on hand, cash generated from our operations, project debt arrangements, corporate debt and the issuance of additional equity
securities, as appropriate, and given market conditions. Our financing agreements consist mainly of the project-level financings for our various assets, the Note Issuance Facility 2019, the Revolving Credit Facility, the Note Issuance Facility
2017, a line of credit with a local bank and our commercial paper program.
Note Issuance Facility 2019
On April 30, 2019, we entered into the Note Issuance Facility 2019, a senior unsecured financing with Lucid Agency Services Limited, as agent, and a group of funds managed by Westbourne
Capital as purchasers of the notes issued thereunder for a total amount of the euro equivalent of $300 million. The notes under the Note Issuance Facility 2019 were issued in May 2019 and are due on April 30, 2025. The 2019 Note Issuance
Facility includes an upfront fee of 2% paid upon drawdown. From their issue date to December 31, 2019 interest on the notes issued under the Note Issuance Facility 2019 accrued at a rate per annum equal to the sum of 3-month EURIBOR plus a
margin of 4.65%. The principal amount of the notes issued under the Note Issuance Facility 2019 was hedged with an interest rate swap, resulting in an all-in interest cost of 4.4%. Starting January 1, 2020, the applicable margin for the
determination of interest on the notes issued under the Note Issuance Facility 2019 decreased to 4.50% resulting in an all-in interest cost of 4.24, following satisfaction of the requirements set forth in the Note Issuance Facility 2019 for
such margin decrease, including the effectiveness of the Royal Decree-law 17/2019 which approved a reasonable rate of return higher than 7% (see “—Regulation—Regulation in Spain.”). The Note Issuance Facility 2019 provides that we may elect to,
subject to the satisfaction of certain conditions, capitalize interest on the notes issued thereunder for a period of up to two years from closing at our discretion, subject to certain conditions. We elected to capitalize interest on the notes
issued under the Note Issuance Facility 2019 for the upcoming quarters.
The notes issued under the Note Issuance Facility 2019 are guaranteed on a senior unsecured basis by our subsidiaries ABY Concessions Infrastructures, S.L.U., ABY Concessions Perú S.A., ACT
Holding, S.A. de C.V., ASHUSA Inc., ASUSHI Inc. and Atlantica Investments Limited. If we fail to make payments on the notes issued under the 2019 Note Issuance Facility, the guarantors are requested to repay on a joint and several basis.
The Note Issuance Facility 2019 contains covenants that limit certain of our and the guarantors’ activities, including those relating to: mergers; consolidations; certain limitations on the
ability to create liens; sales, transfers and other dispositions of property and assets; providing new guarantees; transactions with affiliates; and our ability to pay cash dividends is also subject to certain standard restrictions.
Additionally, we are required to comply with a maintenance leverage ratio of our indebtedness to our cash available for distribution of 5.00:1.00 (which may be increased under certain conditions to 5.50:1.00 for a limited period in the event we
consummate certain acquisitions).
The Note Issuance Facility 2019 also contains customary events of default (subject in certain cases to customary grace and cure periods). Generally, if an event of default occurs and is not
cured within the time periods specified, the agent or the holders of more than 50% of the principal amount of the notes then outstanding may declare all of the notes issued under the Note Issuance Facility 2019 to be due and payable
immediately.
The proceeds of the notes issued under the Note Issuance Facility2019 were used to prepay and subsequently cancel in full the 2019 Notes and for general corporate purposes.
Revolving Credit Facility
On May 10, 2018, we entered into a $215 million Revolving Credit Facility with a syndicate of banks with Royal Bank of Canada as administrative agent and Royal Bank of Canada and Canadian
Imperial Bank of Commerce, as issuers of letters of credit. This facility was increased by $85 million to $300 million in January 2019. In addition, on August 2, 2019 the facility was further increased by $125 million to a total limit of $425
million and the maturity of a portion of loans in a principal amount of $387.5 million extended from December 31, 2022, with the remaining $37.5 million maturing on December 31, 2021. As of December 31, 2019, we had $84 million outstanding
under the Revolving Credit Facility and $341.0 million available.
Loans under the facility accrue interest at a rate per annum equal to: (A) for Eurodollar rate loans, LIBOR plus a percentage determined by reference to our leverage ratio, ranging between
1.60% and 2.25% and (B) for base rate loans, the highest of (i) the rate per annum equal to the weighted average of the rates on overnight U.S. Federal funds transactions with members of the U.S. Federal Reserve System arranged by U.S. Federal
funds brokers on such day plus 1/2 of 1.00%, (ii) the prime rate of the administrative agent under the Revolving Credit Facility and (iii) LIBOR plus 1.00%, in any case, plus a percentage determined by reference to our leverage ratio, ranging
between 0.60% and 1.00.
Note Issuance Facility 2017
On February 10, 2017, we entered into the Note Issuance Facility 2017, a senior secured note facility with Elavon Financial Services DAC, UK Branch, as gent, and a group of funds managed by
Westbourne Capital as purchasers of the notes issued thereunder for a total amount of €275 million (approximately $308.4 million), with three series of notes: series 1 notes worth €92 million mature in 2022; series 2 notes worth €91.5 million
mature in 2023; and series 3 notes worth €91.5 million mature in 2024. Interest on all series accrues at a rate per annum equal to the sum of 3-month EURIBOR plus 4.90%. We fully hedged the principal amount of the notes issued under the Note
Issuance Facility 2017 with a swap that fixed the interest rate at 5.50%. We expect to repay in full and cancel all series of notes issued under the Note Issuance Facility 2017 with the proceeds of the 2020 Green Private Placement.
2019 Notes
On November 17, 2014, we issued the 2019 Notes in an aggregate principal amount of $255 million with an original maturity date of November 15, 2019. On May 31, 2019 we prepaid the 2019 Notes
before maturity in accordance with the terms thereof with the proceeds of the notes issued under the Note Issuance Facility 2019.
Other Credit Lines
In July 2017, we signed a line of credit with a bank for up to €10.0 million (approximately $11.2 million) which is available in euros or U.S. dollars. Amounts drawn accrue interest at a
rate per annum equal to EURIBOR plus 2.25% or LIBOR plus 2.25%, depending on the currency. On December 13, 2019, the terms of the credit facility have been modified and the maturity date has been extended from July 4, 2020 to December 13, 2021
and the new interest rate per year set is EURIBOR plus 2% or LIBOR plus 2%, depending on the currency. As of December 31, 2019, the Company had drawn down an amount of $10.1 million.
ESG-linked Financial Guarantee Line
In June 2019, we signed our first ESG-linked financial guarantee line with ING Bank, N.V. The guarantee line has a limit of approximately $39 million. The cost is linked to Atlantica’s
environmental, social and governance performance under Sustainalytics, a leading sustainable rating agency. The green guarantees will be exclusively used for renewable assets. We are using and expect to continue use this guarantee line to
progressively release restricted cash in some of our projects, providing additional financial flexibility.
Commercial Paper Program
On October 8, 2019, we filed a euro commercial paper program with the Alternative Fixed Income Market (MARF) in Spain. The program allows Atlantica to issue short term notes over the next twelve months for up to €50 million, with such notes having a tenor of up to two years. As of the date of this report we have issued €25 million under
the program at an average cost of 0.66%.
2020 Green Private Placement
On February 6, 2020, we completed the pricing of a total amount of €290 million (approximately $320 million), senior secured notes maturing in June 20, 2026, which are expected to be issued
under a senior secured note purchase agreement to be entered into with a group of institutional investors as purchasers. Interest on the notes to be issued under the 2020 Green Private placement is expected to accrue at a rate per annum equal
to 1.96%. Signing of the note purchase agreement is expected to occur on or about April 1, 2020 and closing is expected to occur promptly thereafter, subject to certain conditions. We cannot guarantee that such conditions will be satisfied and
that closing will occur. In case the transaction is closed, if at any time the rating of such senior secured notes is below investment grade, the interest rate thereon would increase by 100 basis points until such notes are rated
again investment grade .
The 2020 Green Private Placement complies with the Green Bond Principles and has a second party opinion by Sustainalytics. The proceeds of the 2020 Green Private Placement are expected to be
used to repay in full and cancel all series of notes issued under the Note Issuance Facility 2017.
See “Item 5.B –Liquidity and Capital Resources – Financing Arrangements” for further detail on our financing arrangements.
Uses of liquidity and capital requirements
Debt service
Principal payments on debt as of December 31, 2019, are due in the following periods according to their contracted maturities:
Repayment schedule by geography
|
Total
|
Up to one
year
|
Between
one and
three years
|
Between
three and
five years
|
Subsequent
years
|
||||||||||||||||
|
$ in millions
|
||||||||||||||||||||
|
North America
|
$
|
1.676,3
|
81,5
|
167,5
|
196,2
|
1.2311,1
|
||||||||||||||
|
South America
|
884,8
|
36,1
|
63,6
|
76,5
|
708,7
|
|||||||||||||||
|
EMEA
|
2.291,3
|
151,8
|
325,3
|
382,4
|
1.431,7
|
|||||||||||||||
|
Total project debt
|
$
|
4.852,3
|
269,4
|
566,4
|
655,0
|
3.371,5
|
||||||||||||||
|
Corporate debt
|
$
|
723,8
|
28,7
|
200,5
|
200,9
|
293,7
|
||||||||||||||
|
Total
|
$
|
5.576,1
|
298,1
|
756,9
|
855,9
|
3.665,2
|
||||||||||||||
|
Repayment schedule by business sector
|
Total
|
Up to one
year
|
Between
one and
three years
|
Between
three and
five years
|
Subsequent
years
|
|||||||||||||||
|
$ in millions
|
||||||||||||||||||||
|
Renewable energy
|
$
|
3.658,5
|
$
|
209,3
|
$
|
436,9
|
$
|
521,3
|
$
|
2.491,1
|
||||||||||
|
Efficient natural gas
|
529,3
|
31,6
|
68,3
|
77,5
|
351,9
|
|||||||||||||||
|
Electric transmission
|
640,2
|
23,3
|
40,6
|
47,7
|
528,5
|
|||||||||||||||
|
Water
|
24,3
|
5,1
|
10,7
|
8,5
|
0,0
|
|||||||||||||||
|
Total project debt
|
$
|
4.852,3
|
$
|
269,4
|
$
|
566,4
|
$
|
655,0
|
$
|
3.371,5
|
||||||||||
|
Corporate debt
|
$
|
723,8
|
$
|
28,7
|
$
|
200,5
|
$
|
200,9
|
$
|
293,7
|
||||||||||
|
Total
|
$
|
5.576.1
|
$
|
298,1
|
$
|
756,9
|
$
|
855,9
|
$
|
3.665,2
|
||||||||||
The project debt maturities will be repaid with cash flows generated from the projects in respect of which that financing was incurred.
Cash dividends to investors
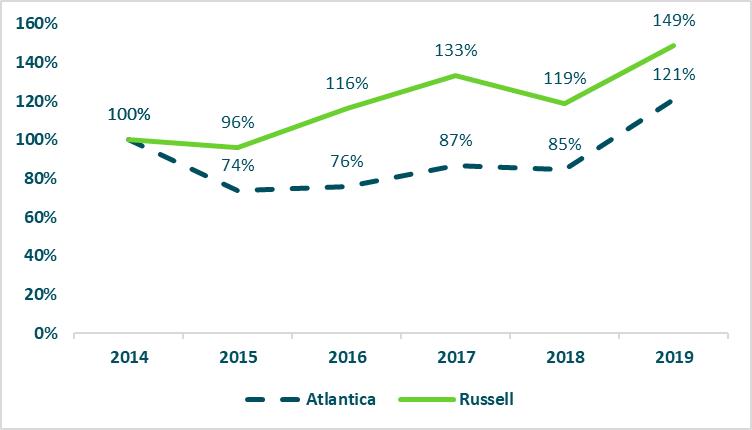
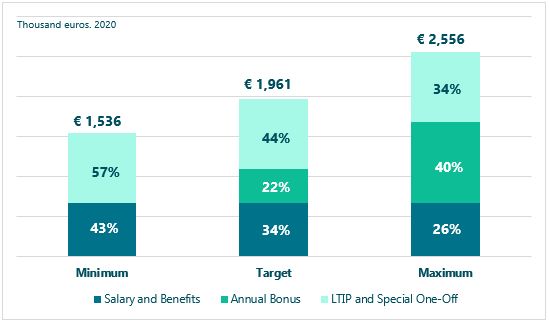
We began serving as the Company’s auditor in 2014. In 2019, we became the predecessor auditor.
We intend to distribute to holders of our shares a significant portion of our cash available for distribution less all cash expenses including
corporate debt service and corporate general and administrative expenses and less reserves for the prudent conduct of our business (including, among other things, dividend shortfall as a result of fluctuations in our cash flows), on an annual
basis. We intend to distribute a quarterly dividend to shareholders. Our board of directors may, by resolution, amend the cash dividend policy at any time. The determination of the amount of the cash dividends to be paid to holders of our
shares will be made by our board of directors and will depend upon our financial condition, results of operations, cash flow, long-term prospects and any other matters that our board of directors deem relevant.
Our cash available for distribution is likely to fluctuate from quarter to quarter and, in some cases, significantly as a result of the
seasonality of our assets, the terms of our financing arrangements, maintenance and outage schedules, among other factors. Accordingly, during quarters in which our projects generate cash available for distribution in excess of the amount
necessary for us to pay our stated quarterly dividend, we may reserve a portion of the excess to fund cash distributions in future quarters. In quarters in which we do not generate sufficient cash available for distribution to fund our stated
quarterly cash dividend, if our board of directors so determines, we may use retained cash flow from other quarters, as well as other sources of cash.
| • |
On February 26, 2019, our board of directors approved a dividend of $0.37 per share. The dividend was paid on March 22, 2019, to shareholders of record as of March 12, 2019.
|
| • |
On May 7, 2019, our board of directors approved a dividend of $0.39 per share. The dividend was paid on June 14, 2019, to shareholders of record as of June 3, 2019.
|
| • |
On August 2, 2019 our board of directors approved a dividend of $0.40 per share. The dividend was paid on September 13, 2019 to shareholders of record as of August 30, 2019.
|
| • |
On November 5, 2019 our board of directors approved a dividend of $0.41 per share. The dividend was paid on December 13, 2019 to shareholders of record as of November 29, 2019.
|
| • |
On February 26, 2020, our board of directors approved a dividend of $0.41 per share. The dividend is expected to be paid on March 23, 2020, to shareholders of record as of March 12, 2020.
|
Acquisitions
In October 2018 we reached an agreement to acquire PTS, a natural gas transportation
platform located in the Gulf of Mexico, close to ACT, our efficient natural gas plant. PTS will have a contracted compression capacity of 450 million standard cubic feet per day and is currently under construction. The service agreement
signed with Pemex on October 18, 2017 is a “take-or-pay” 11-year term contract starting in 2020, with a possibility of future extension at the discretion of both parties. On October 10, 2018, we acquired a 5% ownership in the project; once
the project begins operation, which is expected in the first half of 2020, we expect to acquire an additional 65% stake, subject to final approvals. We are currently under negotiations with the seller about certain aspects of the agreement.
The total equity investment for the 100% stake is estimated to be approximately $150 million. The amount paid so far has been negligible.
In addition, we have signed an option to acquire, until April 30, 2020, Liberty’s equity interest in Solana for approximately $300 million.
Liberty is the tax equity investor in our Solana asset. We expect to initially finance the acquisition with available liquidity, proceeds of a bridge financing currently under negotiation and potential project debt refinancings in Spain.
Cash flow
The following table sets forth cash flow data for the years ended December 31, 2019, 2018 and 2017:
|
Year ended December 31,
|
||||||||||||
|
2019
|
2018
|
2017
|
||||||||||
|
$ in millions
|
||||||||||||
|
Gross cash flows from operating activities
|
||||||||||||
|
Profit/(loss) for the year
|
74.6
|
$
|
55.3
|
$
|
(104.9
|
)
|
||||||
|
Adjustments to reconcile after-tax profit to net cash generated by operating activities
|
701.9
|
697.6
|
848.8
|
|||||||||
|
Profit for the year adjusted by non-monetary items
|
776.5
|
$
|
752.9
|
$
|
743.9
|
|||||||
|
Net interest/taxes paid
|
(299.5
|
)
|
(333.5
|
)
|
(349.5
|
)
|
||||||
|
Variations in working capital
|
(113.4
|
)
|
(18.4
|
)
|
(8.8
|
)
|
||||||
|
Total net cash flow provided by/(used in) operating activities
|
363.6
|
$
|
401.0
|
$
|
385.6
|
|||||||
|
Net cash flows from investing activities
|
||||||||||||
|
Investments in entities under equity method
|
30.5
|
4.4
|
3.0
|
|||||||||
|
Investments in contracted concessional assets(1)
|
22.0
|
68.0
|
30.1
|
|||||||||
|
Other non-current assets/liabilities
|
2.7
|
(16.7
|
)
|
8.2
|
||||||||
|
Acquisitions / sales of subsidiaries and other financial instruments
|
(173.4
|
)
|
(70.6
|
)
|
30.1
|
|||||||
|
Total net cash flows provided by/(used in) investing activities
|
(118.2
|
)
|
$
|
(14.9
|
)
|
$
|
71.4
|
|||||
|
Net cash flows provided by/(used in) financing activities
|
(310.2
|
)
|
$
|
(405.2
|
)
|
$
|
(416.3
|
)
|
||||
|
Net increase in cash and cash equivalents
|
(64.8
|
)
|
(19.1
|
)
|
40.7
|
|||||||
|
Cash, cash equivalents and bank overdraft at beginning of the year
|
631.5
|
669.4
|
594.8
|
|||||||||
|
Translation differences cash or cash equivalents
|
(3.9
|
)
|
(18.8
|
)
|
33.9
|
|||||||
|
Cash and cash equivalents at the end of the period
|
562.8
|
$
|
631.5
|
$
|
669.4
|
|||||||
Note:
| (1) |
Includes proceeds for $22.2 million, $72.6 million and $42.5 million in 2019, 2018 and 2017 respectively, see Note 6 of the Annual Consolidated Financial Statements.
|
Net cash flows provided by/(used in) operating activities
Net cash provided by operating activities in the year ended December 31, 2019 was $363.6 million compared to $401.0 million for the year ended
December 31, 2018. The decrease was mainly due to a higher variation in working capital resulting from longer collection periods mainly in Mexico compared to the same period of the previous year. In addition, our payments to suppliers increased
in 2019 because at the end of 2018 accounts payable were higher than usual in ACT and Mojave due to major overhaul maintenance.
The significant variances in the net cash flows provided by or used in operating activities for the year ended December 31, 2018 are discussed
in the Form 20-F filed with the SEC on February 28, 2019.
Net cash provided by/(used in) investing activities
For the year ended December 31, 2019, net cash used in investing activities was $118.3 million and corresponded mainly to the investment in
Amherst Island. Atlantica and Algonquin formed AYES Canada, a vehicle to channel co-investment opportunities and the first investment was in Amherst Island, a 75 MW wind plant in Canada. Atlantica invested $4.9 million and Algonquin invested
$92.3 million, both through AYES Canada. Since Atlantica controls AYES Canada under IFRS 10, we show in Net cash used in investing activities the total $97.2 million invested by AYES Canada in the project company and in Net cash provided by
financing activities the $92.3 million received from Algonquin by AYES Canada. In addition, net cash used in investing activities includes $42 million payment for the acquisition of Monterrey, $19.9 million payment for Tenes, which became a
financial investment after the conditions precedent were not fulfilled and $20 million payment for the acquisition of ATN Expansion 2. Net cash used in investing activities also included $22.2 million related to amounts received by Solana from
Abengoa in relation to the DOE consents to decrease Abengoa’s ownership in Atlantica to 16.5% and to allow Abengoa to sell entirely its stake in Atlantica. From an accounting perspective, because the payment resulted from Abengoa’s obligations
under the EPC contract, most of the amount received in 2019 was recorded as reducing the asset value and was therefore classified as cash provided by investing activities.
For the year ended December 31, 2018, net cash used in investing activities was $14.9 million and included $73.2 million of acquisitions
previously announced, corresponding to the acquisition of Melowind ($42.8 million), the first payment related to the expansion of our ATN transmission line ($14.2 million), the acquisition of a mini-hydroelectric plant in Peru ($9.3 million)
and the acquisition of Chile TL3 ($6.0 million). Net cash used in investing activities also included $67.9 million related to the $136.5 million received by Solana from Abengoa in relation to the DOE consents to decrease Abengoa’s ownership in
Atlantica to 16.5% and to allow Abengoa to sell entirely its stake in Atlantica. From an accounting perspective, since the payment resulted from Abengoa’s obligations under the EPC contract, most of the amount received in 2018 was recorded as
reducing the asset value and was therefore classified as cash provided by investing activities.
Net cash provided by/(used in) financing activities
For the year ended December 31, 2019, net cash used in financing activities was $310.2 million and corresponded principally to $603.1 million
of principal debt repayments, of which $259.7 million corresponded to the prepayment of the 2019 Notes, $281.8 million of project debt repayments and $60 million of Revolving Credit Facility repayment. We also received $293.1 million net
proceeds under the Note Issuance Facility 2019, net of fees, commercial paper for a total amount of $27.2 million and $32.6 million net of fees under our Revolving Credit Facility. In addition, we paid $159.0 million of dividends to
shareholders and $29.2 million to non-controlling interest. As explained above, we also include $92.3 million corresponding to Algonquin’s participation in Amherst.
For the year ended December 31, 2018, net cash used in financing activities was $405.2 million and corresponded primarily to $386.0 million of
the repayments of principal of our financing agreements, of which $61.6 million were prepayments by Solana using the proceeds of the two payments received from Abengoa in connection with the DOE consents and $54 million corresponded to the
prepayment and cancelation of our Former Revolving Credit Facility. The remainder corresponded mostly to scheduled project debt repayments. Additionally, we drew down $107.5 million of the new Revolving Credit Facility which was signed in May
2018 and we paid $143.0 million of dividends to shareholders.
Financing Arrangements
2019 Notes
On November 17, 2014, we issued the 2019 Notes in an aggregate principal amount of $255 million. With an original maturity date of November
15, 2019. On May 31, 2019 we prepaid the 2019 Notes before maturity in accordance with the terms thereof with the proceeds of the notes issued under the Note Issuance Facility 2019.
Revolving Credit Facility
On May 10, 2018, we entered into a $215 million Revolving Credit Facility with a syndicate of banks, with Royal Bank of Canada as administrative agent and Royal Bank of Canada and Canadian Imperial Bank of Commerce, as issuers of letters of credit. This facility was increased by $85
million to $300 million in January, 2019. In addition, on August 2, 2019, the facility was further increased by $125 million to a total limit of $425 million and the maturity of a portion of loans in a principal amount of $387.5 million
extended from December 31, 2021 to December 31, 2022 with the remaining $37.5 million maturing on December 31, 2021. As of December 31, 2019, we had $84 million outstanding under the Revolving Credit Facility and $341.0 million available. The
Revolving Credit Facility replaced tranche A of the Former Revolving Credit Facility, which was repaid and cancelled ahead of its maturity.
Loans under the Revolving Credit Facility accrue interest at a rate per annum equal to: (A) for Eurodollar rate loans, LIBOR plus a percentage
determined by reference to our leverage ratio, ranging between 1.60% and 2.25% and (B) for base rate loans, the highest of (i) the rate per annum equal to the weighted average of the rates on overnight U.S. Federal funds transactions with
members of the U.S. Federal Reserve System arranged by U.S. Federal funds brokers on such day plus 1/2 of 1.00%, (ii) the prime rate of the administrative agent under the Revolving Credit Facility and (iii) LIBOR plus 1.00%, in any case, plus a
percentage determined by reference to our leverage ratio, ranging between 0.60% and 1.00%. Letters of credit are subject to a sublimit under the Revolving Credit Facility of $70 million.
Our payment obligations under the Revolving Credit Facility are guaranteed by our subsidiaries ABY Concessions Infrastructures, S.L.U., ABY
Concessions Peru S.A., ACT Holding, S.A. de C.V., ASHUSA Inc., ASUSHI Inc. and Atlantica Investment Ltd (formerly as Atlantica Yield South Africa Ltd). The Revolving Credit Facility is also secured by a pledge over the shares of the guarantors
listed above.
The Revolving Credit Facility contains covenants that limit certain of our and the guarantors’ activities, including those relating to:
mergers; customary change of control provisions; consolidations; the ability to incur additional indebtedness; sales, transfers and other dispositions of property and assets; providing new guarantees; investments; granting additional security
interests; entering into transactions with affiliates and our ability to pay cash dividends and is also subject to certain standard restrictions. Additionally, we are required to comply with (i) a maintenance leverage ratio of our indebtedness
at the holding level to our cash available for distribution of 5.0x and (ii) debt service coverage ratio of cash available for distribution to debt service payments of 2.0x. The Revolving Credit Facility also contains customary events of
default, upon the occurrence of which the lenders holding more than 50% of the aggregate loans and commitments then outstanding have the ability to declare the unpaid principal amount of all outstanding loans, and interest accrued thereon, to
be immediately due and payable. In addition, the Revolving Credit Facility includes a material non-recourse subsidiary default provision related to a default by our project subsidiaries in their financing arrangements, such that a payment
default of indebtedness with an aggregate principal amount in excess of $100 million by one or more of our non-recourse subsidiaries representing more than 25% of the cash available for distribution distributed in the previous four fiscal
quarters could trigger a default under our Revolving Credit Facility.
Note Issuance Facility 2017
On February 10, 2017, we entered into the Note Issuance Facility 2017, a senior secured note facility with Elavon Financial Services DAC, UK
Branch as agent and a group of funds managed by Westbourne Capital as purchasers of the notes issued thereunder for a total amount of €275 million (approximately $308.4 million), with three series of notes: series 1 notes worth €92 million
mature in 2022; series 2 notes worth €91.5 million mature in 2023; and series 3 notes worth €91.5 million mature in 2024. Interest on all series accrues at a rate per annum equal to the sum of 3-month EURIBOR plus 4.90%. We fully hedged the
principal amount of the notes issued under the Note Issuance Facility 2017 with a swap that fixed the interest rate at 5.50%.
The obligations under the Note Issuance Facility 2017 rank pari passu with our outstanding obligations under the Revolving Credit Facility as
well as the Note Issuance Facility 2019. Our payment obligations under the Note Issuance Facility 2017 are guaranteed, collectively, by ASHUSA Inc., ASUSHI Inc., Atlantica Investment Ltd (formerly as Atlantica Yield South Africa Limited), ABY
Concessions Perú S.A., ABY Concessions Infrastructures, S.L.U. and ACT Holding, S.A. de C.V. The Note Issuance Facility 2017 is also secured by a high percentage of our assets and the assets of the guarantors, subject to customary exceptions.
The Note Issuance Facility 2017 contains covenants that limit certain of our and the guarantors’ activities, including those relating to:
mergers; consolidations; certain limitations on the ability to incur additional indebtedness; sales, transfers and other dispositions of property and assets; providing new guarantees; investments; granting additional security interests;
entering into transactions with affiliates and our ability to pay cash dividends is also subject to certain standard restrictions. Additionally, we are required to comply with (i) a maintenance leverage ratio of our indebtedness (including that
of our subsidiaries) to our cash available for distribution of 5.00:1.00 on and after January 1, 2017, and of 4.75:1.00 on and after January 1, 2020, and (ii) a debt service coverage ratio of 2.00:1.00 of cash available for distribution to debt
service payments.
The Note Issuance Facility 2017 also contains customary events of default, upon the occurrence of which holders of more than 50% of the notes
then outstanding have the ability to declare the unpaid principal amount of all outstanding notes, and interest accrued thereon, to be immediately due and payable. In addition, our Note Issuance Facility 2017 includes a material subsidiary
cross-default provision such that a payment default by one or more of our non-recourse subsidiaries representing more than 20% of the cash available for distribution distributed in the previous four fiscal quarters could trigger a default,
provided that these subsidiaries have an indebtedness higher than $100 million in the case of non-recourse subsidiaries or more than $75 million in the case of subsidiaries other than non-recourse subsidiaries.
We expect to repay in full and cancel all series of notes issued under the Note Issuance Facility 2017 with the proceeds of the 2020 Green
Private Placement.
Note Issuance Facility 2019
On April 30, 2019, we entered into the Note Issuance Facility 2019, a senior unsecured financing with Lucid Agency Services Limited, as agent,
and a group of funds managed by Westbourne Capital as purchasers of the notes issued thereunder for a total amount of the euro equivalent of $300 million. The notes under the Note Issuance Facility 2019 were issued in May 2019 and are due on
April 30, 2025. The Note Issuance Facility 2019 includes an upfront fee of 2% paid upon drawdown. From their issue date to December 31, 2019, interest on the notes issued under the Note Issuance Facility 2019 accrued at a rate per annum equal
to the sum of 3-month EURIBOR plus a margin of 4.65%. The principal amount of the notes issued under the Note Issuance Facility 2019 was hedged with an interest rate swap, resulting in an all-in interest cost of 4.4%. Starting January 1, 2020,
the applicable margin for the determination of interest on the notes issued under the Note Issuance Facility 2019 decreased to 4.50% resulting in an all-in interest cost of 4.24%, following satisfaction of the requirements set forth in the
Note Issuance Facility, 2019 for such margin decrease, including the effectiveness of the Royal Decree-law 17/2019 which approved a reasonable rate of return higher than 7% (see “—Regulation—Regulation in Spain.”). The Note Issuance Facility 2019 provides that we may elect, subject to the satisfaction of certain conditions, capitalize interest on the notes issued thereunder for a period of up to two years
from closing at our discretion, subject to certain conditions. We elected to capitalize interest on the notes issued under the Note Issuance Facility 2019 for the upcoming quarters.
The obligations under the Note Issuance Facility 2019 rank pari passu with our outstanding obligations under the Revolving Credit Facility as
well as the Note Issuance Facility 2017. Our payment obligations under the Note Issuance Facility 2019 are guaranteed, collectively, by ASHUSA Inc., ASUSHI Inc., Atlantica Investment Ltd (formerly as Atlantica Yield South Africa Limited), ABY
Concessions Peru S.A., ABY Concessions Infrastructures, S.L.U. and ACT Holding, S.A. de C.V.
The Note Issuance Facility 2019 contains covenants that limit certain of our and the guarantors’ activities, including those relating to:
mergers; consolidations; sales, transfers and other dispositions of property and assets; providing new guarantees; granting additional security interests; entering into transactions with affiliates and our ability to pay cash dividends is also
subject to certain standard restrictions. The restrictions under the Note Issuance Facility 2019 on sales, transfers and other dispositions of property and assets; pay cash dividends and entering into transactions with affiliates may be
suspended if the notes under the Note Issuance Facility 2019 obtain investment grade ratings from at least two rating agencies, we deliver notice thereof to the holders of the notes with an offer to purchase such notes at par, and no default
under the Note Issuance Facility 2019 has occurred.
Additionally, we are required to comply with a maintenance leverage ratio of our indebtedness (including that of our subsidiaries) to our cash
available for distribution of 5.00:1.00.
The Note Issuance Facility 2019 also contains customary events of default, upon the occurrence of which holders of more than 50% of the notes
then outstanding have the ability to declare the unpaid principal amount of all outstanding notes, and interest accrued thereon, to be immediately due and payable. In addition, the Note Issuance Facility 2019 includes a material non-recourse
subsidiary default provision related to a default by our project subsidiaries in their financing arrangements, such that a payment default of indebtedness with an aggregate principal amount in excess of the greater of $40.0 million and 1.5% of
consolidated total assets by one or more of our non-recourse subsidiaries representing more than 25% of the cash available for distribution distributed in the previous four fiscal quarters could trigger a default under our Note Issuance
Facility 2019.
The proceeds of the Note Issuance Facility 2019 were used to redeem in full and subsequently cancel the 2019 Notes and for general corporate
purposes.
Other Credit Lines
In July 2017, we signed a line of credit with a bank for up to €10.0 million (approximately $11.2 million) which is available in euros or U.S.
dollars. Amounts drawn accrue interest at a rate per annum equal to EURIBOR plus 2.25% or LIBOR plus 2.25%, depending on the currency. On December 13, 2019, the terms of the credit facility have been modified and the maturity date has been
extended from July 4, 2020 to December 13, 2021 and the new interest rate per year set is EURIBOR plus 2% or LIBOR plus 2%, depending on the currency. As of December 31, 2019, the Company had drawn down an amount of $10.1 million.
ESG-linked financial guarantee line
In June 2019, we signed our first ESG-linked financial guarantee line with ING Bank, N.V. The guarantee line has a limit of approximately $39
million. The cost is linked to Atlantica’s environmental, social and governance performance under Sustainalytics, a leading sustainable rating agency. The green guarantees will be exclusively used for renewable assets. We are using and expect
to continue to use this guarantee line to progressively release restricted cash in some of our projects, providing additional financial flexibility.
Commercial paper program
On October 8, 2019, we filed a euro commercial paper program with the Alternative Fixed Income Market (MARF) in Spain. The program allows
Atlantica to issue short term notes over the next twelve months for up to €50 million, with such notes having a tenor of up to two years. As of the date of this report we have issued €25 million under the program at an average cost of 0.66%.
On February 6, 2020, we completed the pricing of a total amount of €290 million (approximately $319 million), senior secured notes maturing in
June 20, 2026, which are expected to be issued under a senior secured note purchase agreement to be entered into with a group of institutional investors as purchasers. Interest on the notes is expected to accrue at a rate per annum equal to
1.96%. Signing of the note purchase agreement is expected to occur on or about April 1, 2020 and closing is expected to occur promptly thereafter, subject to certain conditions. We cannot guarantee the such conditions will be satisfied and that
closing will occur. In case the transaction is closed, if at any time the rating of such senior secured notes is below investment grade, the interest rate thereon would increase by 100 basis points until such notes are rated again investment
grade .
The 2020 Green Private Placement complies with the Green Bond Principles and has a second party opinion by Sustainalytics. Our obligations
under the 2020 Green Private Placement are expected to rank pari passu with our outstanding obligations under the Revolving Credit Facility as well as the Note Issuance Facility 2019. Our payment obligations under the 2020 Green Private
Placement are expected to be guaranteed, collectively, by ASHUSA Inc., ASUSHI Inc., Atlantica Investment Ltd (formerly as Atlantica Yield South Africa Limited), ABY Concessions Perú S.A., ABY Concessions Infrastructures, S.L.U. and ACT
Holding, S.A. de C.V. The 2020 Green Private Placement is expected to be secured by a high percentage of our assets and the assets of the guarantors (subject to customary exceptions), which collateral is expected to be shared with the lenders
under the Revolving Credit Facility.
The 2020 Green Private Placement is expected to contain covenants that limit certain of our and the guarantors’ activities, including those
relating to: mergers; customary change of control provisions; consolidations; the ability to incur additional indebtedness; sales, transfers and other dispositions of property and assets; providing new guarantees; investments; granting
additional security interests; entering into transactions with affiliates and our ability to pay cash dividends and is also subject to certain standard restrictions. Additionally, we expect to be required to comply with (i) a maintenance
leverage ratio of our indebtedness at the holding level to our cash available for distribution of 5.0x and (ii) debt service coverage ratio of cash available for distribution to debt service payments of 2.0x.
The 2020 Green Private Placement is expected to contain customary events of default, upon the occurrence of which the holders of more than 50%
in principal amount of the notes outstanding will have the ability to declare the unpaid principal amount of all notes, and interest accrued thereon, to be immediately due and payable. In addition, the 2020 Green Private Placement 0 is expected
to include a material non-recourse subsidiary default provision related to a default by our project subsidiaries in their financing arrangements, such that a payment default of indebtedness with an aggregate principal amount in excess of $100
million by one or more of our non-recourse subsidiaries representing more than 25% of the cash available for distribution distributed in the previous four fiscal quarters could trigger a default under our 2020 Green Private Placement.
The proceeds of the 2020 Green Private Placement are expected to be used to repay in full and cancel all series of notes issued under the Note
Issuance Facility 2017.
Project level financing
We have outstanding project-specific debt that is backed by certain of our assets. These financing arrangements generally include a pledge of
shares of the entities holding our assets and customary covenants, including restrictive covenants that limit the ability of the project-level entities to make cash distributions to their parent companies and ultimately to us including if
certain financial ratios are not met. For more information about the debt of project level entities, see “Item 4.B—Business Overview—Our Operations.”
The preparation of our Annual Consolidated Financial Statements in conformity with IFRS requires us to make estimates and judgments that
affect the reported amounts of assets, liabilities, revenues and expenses. We base our estimates on historical experience and on various other assumptions we believe to be reasonable under the specific circumstances, the results of which form
the basis for making judgments about the carrying values of assets and liabilities that are not readily apparent from other sources. Actual results may differ from these estimates under different assumptions or conditions.
An understanding of the accounting policies for these items is important to understand the Annual Consolidated Financial Statements. The
following discussion provides more information regarding the estimates and assumptions used for these items in accordance with IFRS and should be considered in conjunction with the Annual Consolidated Financial Statements.
The most critical accounting policies, which reflect significant management estimates and judgment to determine amounts in our Annual
Consolidated Financial Statements, are as follows:
| - |
Contracted concessional agreements and PPAs;
|
| - |
Impairment of intangible assets and property, plants and equipment;
|
| - |
Assessment of control;
|
| - |
Derivative financial instruments and fair value estimates; and
|
| - |
Income taxes and recoverable amount of deferred tax assets.
|
Some of these accounting policies require the application of significant judgment by management to select the appropriate assumptions to
determine these estimates. These assumptions and estimates are based on our historical experience, forecasts and other circumstances and expectations as of the close of the financial period. The assessment is considered in relation to the
global economic situation of the industries and regions where we operate, taking into account future development of our businesses. By their nature, these judgments are subject to an inherent degree of uncertainty; therefore, actual results
could materially differ from the estimates and assumptions used. In such cases, the carrying values of assets and liabilities are adjusted.
As of the date of preparation of our Annual Consolidated Financial Statements, no relevant changes in the estimates made are anticipated and,
therefore, no significant changes in the value of the assets and liabilities recognized at December 31, 2019, are expected.
Although these estimates and assumptions are being made using all available facts and circumstances, it is possible that future events may
require management to amend such estimates and assumptions in future periods. Changes in accounting estimates are recognized prospectively, in accordance with IAS 8, in the consolidated income statement of the year in which the change occurs.
Our significant accounting policies are more fully described in note 2 to our Annual Consolidated Financial Statements, presented elsewhere in this annual report.
Contracted concessional agreements
Contracted concessional assets and power purchase agreements (PPAs) include fixed assets financed through project debt, related to service
concession arrangements recorded in accordance with IFRIC 12, except for Palmucho, which is recorded in accordance with IAS 16 and PS10, PS20, Mini-Hydro, Chile TL 3 and Seville PV, which are recorded as tangible assets in accordance with IFRS
16. The infrastructures accounted for as concessions are related to the activities concerning electric transmission lines, solar electricity generation plants, cogeneration plants, wind farms and water desalination plants. The infrastructure
used in a concession can be classified as an intangible asset or a financial asset, depending on the nature of the payment entitlements established in the agreement.
The application of IFRIC 12 requires extensive judgment in relation with, among other factors, (i) the identification of certain
infrastructures and contractual agreements in the scope of IFRIC 12, (ii) the understanding of the nature of the payments in order to determine the classification of the infrastructure as a financial asset or as an intangible asset and (iii)
the timing and recognition of the revenue from construction and concessionary activity.
Under the terms of contractual arrangements within the scope of this interpretation, the operator shall recognize and measure revenue in
accordance with IFRS 15 for the services it performs.
| a) |
Intangible assets
|
We recognize an intangible asset to the extent that we receive a right to charge final customers for the use of the infrastructure. This
intangible asset is subject to the provisions of IAS 38 and is amortized linearly, taking into account the estimated period of commercial operation of infrastructure, which generally coincides with the concession period.
Once the infrastructure is in operation, the treatment of income and expenses is as follows:
| - |
Revenues from the updated annual revenue for the contracted concession, as well as operations and maintenance services are recognized in each period according to IFRS 15 “Revenue from contracts with
customers”
|
| - |
Operating and maintenance costs and general overheads and administrative costs are recorded in accordance with the nature of the cost incurred (amount due) in each period.
|
| - |
Financing costs are expensed as incurred.
|
| b) |
Financial assets
|
We recognize a financial asset when demand risk is assumed by the grantor, to the extent that the contracted concession holder has an
unconditional right to receive payments for the asset. This asset is recognized at the fair value of the construction services provided, considering upgrade services in accordance with IFRS 15, if any.
The financial asset is subsequently recorded at amortized cost calculated according to the effective interest method. Revenue from operations
and maintenance services is recognized in each period according to IFRS 15 “Revenue from contracts with Customers.” The remuneration of managing and operating the asset resulting from the valuation at amortized cost is also recorded in revenue.
Financing costs are expensed as incurred.
According to IFRS 9, we recognize an allowance for expected credit losses (ECLs) for all debt instruments not held at fair value through
profit or loss. ECLs are based on the difference between the contractual cash flows due in accordance with the contract and all the cash flows that we expect to receive.
There are two main approaches to applying the ECL model according to IFRS 9: the general approach which involves a three stage approach, and
the simplified approach, which can be applied to trade receivables, contract assets and lease receivables. We have elected to apply the simplified approach. Under this approach, there is no need to monitor for significant increases in credit
risk and entities will be required to measure lifetime expected credit losses at each end of reporting period.
The key elements of the ECL calculations are the following:
| - |
the Probability of Default (“PD”) is an estimate of the likelihood of default over a given time horizon. We calculate PD based on Credit Default Swaps spreads (“CDS”);
|
| - |
the Exposure at Default (“EAD”) is an estimate of the exposure at a future default date;
|
| - |
the Loss Given Default (“LGD”) is an estimate of the loss arising in the case where a default occurs at a given time. It is based on the difference between the contractual cash flows due and those
that we would expect to receive. It is expressed as a percentage of the EAD.
|
| c) |
Property, plant and equipment
|
Assets recorded as property, plant and equipment (PS10/20, Mini-Hydro, Chile TL3and Seville PV) are measured at historical cost, including all
expenses directly attributable to the acquisition, less depreciation and impairment losses, with the exception of land, which is presented net of any impairment losses. Once the infrastructure is in operation, the treatment of income and
expenses is equal to intangible assets.
Impairment of intangible assets and property, plant and equipment
We review our contracted revenue assets to identify any indicators of impairment annually.
The recoverable amount of an asset is the higher of its fair value less costs to sell and its value in use, defined as the present value of
the estimated future cash flows to be generated by the asset. In the event that the asset does not generate cash flows independently of other assets, we calculate the recoverable amount of the cash generating unit, or CGU to which the asset
belongs.
When the carrying amount of the CGU to which these assets belong is lower than its recoverable amount assets are impaired.
Assumptions used to calculate value in use include a discount rate and projections considering real data based on the contract terms and
projected changes in both selling prices and costs. The discount rate is estimated by management, to reflect both changes in the value of money over time and the risks associated with the specific CGU.
For contracted or concession revenue assets with a defined useful life and with a specific financial structure, cash flow projections until
the end of the project are considered and no terminal value is assumed. Contracted revenue assets have a contractual structure that permits to estimate quite accurately the costs of the project and revenue during the life of the project.
Projections take into account real data based on the contract terms and fundamental assumptions based on part in specific reports prepared
internally and supported by specialists, assumptions on demand and assumptions on production. Additionally, assumptions on macroeconomic conditions are also considered, such as inflation rates, future interest rates and sensitivity analysis are
performed over all major assumptions, which can have a significant impact on the value of the asset.
Cash flow projections of CGUs are calculated in the functional currency of those CGUs and are discounted using rates that take into
consideration the risk corresponding to each specific country and currency.
Taking into account that in most CGUs its specific financial structure is linked to the financial structure of the projects that are part of
those CGUs, the discount rate used to calculate the present value of cash flow projections is based on the weighted average cost of capital, or WACC, for the type of asset, adjusted, if necessary, in accordance with the business of the specific
activity and with the risk associated with the country where the project is performed. In any case, sensitivity analyses are performed, especially in relation with the discount rate used and fair value changes in the main business variables, in
order to ensure that possible changes in the estimates of these items do not impact the possible recovery of recognized assets. See note 2 to our Annual Consolidated Financial Statements for further information on WACC.
In the event that the recoverable amount of an asset is lower than its carrying amount, an impairment charge for the difference would be
recorded in the consolidated income statement under the item “depreciation, amortization and impairment charges.”
Assessment of control
Control over an investee is achieved when we have power over the investee, we are exposed, or have rights, to variable returns from our
involvement with the investee and have the ability to use its power to affect its returns. We reassess whether or not we control an investee when facts and circumstances indicate that there are changes to one or more of these three elements of
control.
We use the acquisition method to account for business combinations of companies controlled by a third party. According to this method,
identifiable assets acquired and liabilities and contingent liabilities assumed in a business combination are measured initially at their fair values at the acquisition date. Any contingent consideration is recognized at fair value at the
acquisition date and subsequent changes in its fair value are recognized in accordance with IFRS 9 either in profit or loss or as a change to other comprehensive income. Acquisition-related costs are expensed as incurred. We recognize any
non-controlling interest in the acquired entity either at fair value or at the non-controlling interest’s proportionate share of the acquirer’s net assets on an acquisition-by-acquisition basis.
All assets and liabilities between entities within the group, equity, income, expenses and cash flows relating to transactions between
entities of the group are eliminated in full.
Derivative financial instruments and fair value estimates
Derivatives are recorded at fair value. We apply hedge accounting to all hedging derivatives that qualify to be accounted for as hedges under
IFRS.
When hedge accounting is applied, hedging strategy and risk management objectives are documented at inception, as well as the relationship
between hedging instruments and hedged items. Effectiveness of the hedging relationship needs to be assessed on an ongoing basis. Effectiveness tests are performed prospectively at inception and at each reporting date, following the dollar
offset method.
We apply cash flow hedge accounting. Under this method, the effective portion of changes in fair value of derivatives designated as cash flow
hedges are recorded temporarily in equity and are subsequently reclassified from equity to profit or loss in the same period or periods during which the hedged item affects profit or loss. Any ineffective portion of the hedged transaction is
recorded in the consolidated income statement as it occurs.
When interest rate options are designated as hedging instruments, the intrinsic value and time value of the financial hedge instrument are
separated. Changes in intrinsic and time value which are highly effective are recorded in equity and subsequently reclassified from equity to profit or loss in the same period or periods during which the hedged item affects profit or loss. Any
ineffectiveness is recorded as financial income or expense as it occurs.
When the hedging instrument matures or is sold, or when it no longer meets the requirements to apply hedge accounting, accumulated gains and
losses recorded in equity remain as such until the forecast transaction is ultimately recognized in the income statement. However, if it becomes unlikely that the forecast transaction will actually take place, the accumulated gains and losses
in equity are recognized immediately in the income statement.
The inputs used to calculate fair value of our derivatives are based on inputs other than quoted prices that are observable for the asset or
liability, either directly (i.e., as prices) or indirectly (i.e., derived from prices), through the application of valuation models (Level 2). The valuation techniques used to calculate fair value of our derivatives include discounting
estimated future cash flows, using assumptions based on market conditions at the date of valuation or using market prices of similar comparable instruments, amongst others. The valuation of derivatives requires the use of considerable
professional judgment. These determinations were based on available market information and appropriate valuation methodologies. The use of different market assumptions and/or estimation methodologies may have a material effect on the estimated
fair value amounts.
Income taxes and recoverable amount of deferred tax assets
The current income tax provision is calculated on the basis of relevant tax laws in force at the date of the statement of financial position
in the countries in which the subsidiaries and associates operate and generate taxable income.
Determining income tax provision requires judgment in assessing the timing and the amount of deductible and taxable items, as well as the
interpretation and application of tax laws in different jurisdictions. Due to this fact, contingencies or additional tax expenses could arise as a result of tax inspections or different interpretations of certain tax laws by the corresponding
tax authorities.
We recognize deferred tax assets for all deductible temporary differences and all unused tax losses and tax credits to the extent that it is
probable that future taxable profit will be available against which they can be utilized.
We consider it probable that we will have sufficient taxable profit available in the future to enable a deferred tax asset to be recovered
when:
| · |
There are sufficient taxable temporary differences relating to the same tax authority, and the same taxable entity is expected to reverse either in the same period as the expected reversal of the
deductible temporary difference or in periods into which a tax loss arising from the deferred tax asset can be carried back or forward.
|
| · |
It is probable that the taxable entity will have sufficient taxable profit, relating to the same tax authority and the same taxable entity, in the same period as the reversal of the deductible
temporary difference (or in the periods into which a tax loss arising from the deferred tax asset can be carried back or forward).
|
| · |
Tax planning opportunities are available to the entity that will create taxable profit in appropriate periods.
|
Our management assesses the recoverability of deferred tax assets on the basis of estimates of future taxable profit. These estimates are
derived from the projections of each of our assets. Based on our current estimates, we expect to generate sufficient future taxable income to achieve the realization of our current tax credits and tax loss carryforwards, supported by our
historical trend of business performance.
In assessing the recoverability of our deferred tax assets, our management also considers the foreseen reversal of deferred tax liabilities
and tax planning strategies. To the extent management relies on deferred tax liabilities for the readability of our deferred tax assets, such deferred tax liabilities are expected to reverse in the same period and jurisdiction and are of the
same character as the temporary differences giving rise to the deferred tax assets. We consider that the recovery of our current deferred tax assets is probable without counting on potential tax planning strategies that we could use in the
future.
Not applicable.
Other than as disclosed elsewhere in this annual report, we are not aware of any trends, uncertainties, demands, commitments or events for the
year ended December 31, 2019 that are reasonably likely to have a material adverse effect on our revenues, income, profitability, liquidity or capital resources, or that caused the disclosed financial information to be not necessarily
indicative of future operating results or financial conditions.
As of December 31, 2019, the overall sum of the Bank Bond and the Surety Insurance directly deposited by subsidiaries of Atlantica as a
guarantee to third parties (clients, financial entities and other third parties) was $38.2 million and corresponded to operations of technical nature ($32.4 million as of December 31, 2018). In addition, the outstanding amount of guarantees
issued by Atlantica Yield plc as of December 31, 2019 was $130.1 million ($60.5 million as of December 31, 2018). Guarantees issued by Atlantica correspond mainly to guarantees provided to off-takers in our PPAs, guarantees issued to replace
debt service reserve accounts and guarantees for points of access for renewable projects, which have been partially canceled as of the date of this annual report. For further discussion, see note 19 to our Annual Consolidated Financial
Statements included elsewhere in this annual report.
The following table summarizes our contractual obligations as of December 31, 2019.
|
Total
|
Up to one
year
|
Between
one and
three years
|
Between
three and
five years
|
Subsequent
years
|
||||||||||||||||
|
$ in millions
|
||||||||||||||||||||
|
Corporate debt
|
$
|
723.8
|
$
|
28.7
|
$
|
200.5
|
$
|
200.9
|
$
|
293.7
|
||||||||||
|
Loans with credit institutions (project debt)
|
4,105.9
|
241.1
|
504.9
|
598.8
|
2,761.0
|
|||||||||||||||
|
Notes and bonds (project debt)
|
746.4
|
28.3
|
51.5
|
56.2
|
610.4
|
|||||||||||||||
|
Purchase commitments
|
2,991.4
|
129.6
|
278.4
|
269.6
|
2,313.8
|
|||||||||||||||
|
Accrued interest estimate during the useful life of loans
|
2,472.1
|
294.7
|
549.3
|
471.5
|
1,156.5
|
|||||||||||||||
As described in the table above, we have other contractual obligations to make future payments in connection with bank debt and notes and
bonds. In addition, during the normal course of business, we enter into agreements where we commit to future purchases of goods and services from third parties.
Corporate debt refers to the Revolving Credit Facility, the Note Issuance Facility 2019 the Note Issuance Facility 2017, the Euro Commercial
Paper Program and other credit lines, which are described in detail in note 14 to our Annual Consolidated Financial Statements.
For more detailed information on project debt (loans with credit institutions) refer to note 15 to our Annual Consolidated Financial
Statements.
Notes and bonds refer to the carrying value of issuances made at ATS, ATN and Solaben 1/6.
Purchase obligations include agreements for the purchase of goods or services that are enforceable and legally binding on the combined group
and that specify all significant terms, including fixed or minimum quantities to be purchased, fixed, minimum or variable price provisions and the appropriate timing of the transactions.
Accrued interest estimate during the useful life of loans represents the estimation for the total amount of interest to be paid or accumulated
over the useful life of the loans, notes and bonds.
Capital Expenditures
Our capital spending program is limited considering all our projects are in operation. Maintenance capex is limited and in some cases it is
included within the operation and maintenance agreement, thus included in operating expenses with our Income Statement.
This annual report contains forward-looking statements within the meaning of Section 27A of the Securities Act and Section 21E of the Exchange
Act and as defined in the Private Securities Litigation Reform Act of 1995. See “Cautionary Statements Regarding Forward-Looking Statements.”
Board of Directors of Atlantica Yield
The board of directors of Atlantica Yield comprises the following eight members:
|
Name
|
Position
|
Year of birth
|
||
|
Daniel Villalba
|
Director and Chairman of the Board
|
1947
|
||
|
Santiago Seage
|
Chief Executive Officer and Director
|
1969
|
||
|
Ian Robertson
|
Director
|
1959
|
||
|
Christopher Jarratt
|
Director
|
1958
|
||
|
Jackson Robinson
|
Director
|
1942
|
||
|
Robert Dove
|
Director
|
1954
|
||
|
Andrea Brentan
|
Director
|
1949
|
||
|
Francisco J. Martinez
|
Director
|
1958
|
The business address of the members of the board of directors of Atlantica Yield is Great West House, GW1, 17th floor, Great West Road,
Brentford, United Kingdom, TW8 9DF.
There are no family relationships among any of our executive officers or directors. There are no potential conflicts of interest between the
private interests or other duties of the members of the board of directors listed above and their duties to Atlantica Yield, except in the case of Mr. Ian Robertson and Mr. Christopher Jarratt who serve on Algonquin’s board as Chief Executive
Officer and Vice Chair, respectively.
The following is the biographical information of members of our board of directors.
Daniel Villalba, Director and Chairman of the Board
Daniel Villalba has served as a director since our formation in 2014. Mr. Villalba was previously a Professor of Business Economics at the
Universidad Autonoma de Madrid. He also previously served as the CEO of Inverban, a broker and investment bank, and independent board member of Vueling, an airline currently part of International Airlines Group, Abengoa and the Madrid Stock
Exchange, as well as a board member of several private companies. He also has written more than 50 academic papers and books. Mr. Villalba holds a Master of Science in Operations Research from Stanford University, a Master of Science in
Business Administration from the University of Massachusetts and a PhD in Economics from the Universidad Autonoma de Madrid. Mr. Villalba was elected chairman of the board on November 27, 2015.
Santiago Seage, Chief Executive Officer and Director
Mr. Seage has served as a director since our formation in 2014 until March 2018 and from December 2018. Mr. Seage has served as our Chief
Executive Officer since our formation, except for the six-month period between May and November 2015, while he was Chairman of our Board and Chief Executive Officer of Abengoa. Prior to the foregoing, he served as Abengoa Solar’s CEO beginning
in 2006. Before joining Abengoa, he was a partner with McKinsey & Company. Mr. Seage holds a degree in Business Management from ICADE University in Madrid.
Ian Robertson, Director
Mr. Robertson has served as a director of the board since March 9, 2018. Mr. Robertson is a founder of Algonquin and currently serves as
Algonquin’s CEO. He has close to 30 years of experience in the development, financing, acquisition and operation of electric power generating projects and in the operation of diversified regulated utilities. Mr. Robertson is an electrical
engineer who holds a Bachelor of Applied Science degree (University of Waterloo), a Professional Engineering designation, a Master of Business Administration degree (York University), and a Global Professional Master of Laws degree (University
of Toronto). He is also a CFA® charterholder and a Chartered Director (C.Dir. - McMaster University).
Christopher Jarratt, Director
Mr. Jarratt has served as a director of the board since March 9, 2018. Mr. Jarratt is a founder of Algonquin and currently serves as
Algonquin’s Vice Chair. He has nearly 30 years of experience in the independent electric power and utility sectors. Mr. Jarratt holds an Honors Bachelor of Science degree from the University of Guelph, a Professional Engineering designation and
is a Chartered Director (C.Dir.- McMaster University).
Jackson Robinson, Director
Mr. Robinson has served as a director since our formation in 2014. Mr. Robinson is Vice Chairman and Portfolio Manager at Trillium Asset
Management. He also serves on the advisory board of several institutions including ACORE (American Council on Renewable Energy), EFW (Energy, Food & Water) and Bambeco (Sustainable Housewares). He holds a Bachelor’s degree from Brown
University.
Robert Dove, Director
Mr. Dove serves as a Senior Advisor and consultant to a number of infrastructure investors. Prior to his retirement in 2017, he was a partner,
managing director and a head of the Carlyle Infrastructure Fund. He also held various positions at Bechtel Group Inc. and UBS Securities.
Andrea Brentan, Director
Mr. Brentan has extensive experience in the power sector. He currently serves as a senior advisor to Bain Capital and as non-executive
chairman of FTI Consulting in Spain. Prior to that, he was CEO of Endesa, an international utility, from 2009 to 2014. Mr. Brentan has also held different executive positions at Enel, Alstom Power and ABB.
Francisco J. Martinez, Director
Mr. Francisco J. Martinez has more than 30 years of experience as a certified public accountant. Until 2013, Mr. Martinez was a partner at PWC
in charge of the Energy sector, including audit, legal and tax. He also served as the deputy director for economy at the energy regulator of Spain (CNE) between 1995 and 1998.
Senior Management of Atlantica Yield
We have a senior management team with extensive experience in developing, financing, managing and operating contracted assets.
Our senior management is made up of the following members:
|
Name
|
Position
|
Year of birth
|
||
|
Santiago Seage
|
Chief Executive Officer and Director
|
1969
|
||
|
Francisco Martinez-Davis
|
Chief Financial Officer
|
1963
|
||
|
Emiliano Garcia
|
Vice President North America
|
1968
|
||
|
Antonio Merino
|
Vice President South America
|
1967
|
||
|
David Esteban
|
Vice President EMEA
|
1979
|
||
|
Irene M. Hernandez
|
General Counsel and Chief of Compliance
|
1980
|
||
|
Stevens C. Moore
|
Vice President Strategy and Corporate Development
|
1973
|
The business address of the members of the senior management of Atlantica Yield is Great West House, GW1, 17 floor, Great West Road,
Brentford, United Kingdom, TW8 9DF.
There are no potential conflicts of interest between the private interests or other duties of the members of the senior management listed
above and their duties to Atlantica Yield. There are no family relationships among any of our executive officers or directors.
Below are the biographies of those members of the senior management of Atlantica Yield who do not also serve on our board of directors.
Francisco Martinez-Davis, Chief Financial Officer
Mr. Martinez-Davis was appointed as our Chief Financial Officer on January 11, 2016. Mr. Martinez-Davis has more than 25 years of experience
in senior finance positions both in the United States and Spain. He has served as Chief Financial Officer of several large industrial companies. Most recently, he was Chief Financial Officer for the company responsible for the management and
operation of metropolitan rail service of the city of Madrid where he was also member of the Executive Committee. He has also worked as CFO for a retailer and as Deputy General Manager in Finance and Treasury for Telefonica Moviles. Prior to
that, he worked for different investment banks in New York City and London for more than 10 years, including J.P. Morgan Chase & Co. and BNP Paribas. Mr. Martinez-Davis holds a Bachelor of Science, cum laude, in Business Administration from
Villanova University in Philadelphia and an MBA from The Wharton School at the University of Pennsylvania.
Emiliano Garcia, Vice President North America
Mr. Garcia serves as Vice President of our North American business. Based in Phoenix, Arizona, he is responsible for managing two of our key
assets, Solana and Mojave. Mr. Garcia was previously the General Manager of Abengoa Solar in the United States and of the Solana Power Plant. Before that, he held a number of managerial positions in various Abengoa companies over two decades.
Mr. Garcia holds a Bachelor’s degree in Engineering from Madrid Technical University.
Antonio Merino, Vice President South America
Mr. Merino serves as Vice President of our South American business. Previously, he was the Vice President of Abengoa’s Brazilian business, as
well as the head of Abengoa’s commercial activities and partnerships in South America. Mr. Merino holds an MBA from San Telmo International Institute.
David Esteban, Vice President EMEA
Mr. Esteban has served as Vice President of our operations in EMEA since July 2014. He had previously served at Abengoa’s Corporate Concession
department for two years. Before joining Abengoa, David worked for the management consulting firm Arthur D. Little for seven years in the industries of Telecoms & Energy and then moved to a private equity firm specialized in renewable
investments in Europe for three years.
Irene M. Hernandez, General Counsel
Ms. Hernandez has served as our General Counsel since June 2014. Prior to that, she served as head of our legal department since the date of
our formation. Before that, Ms. Hernandez served as Deputy Secretary General at Abengoa Solar since 2012. Before joining Abengoa, she worked for several law firms. Ms. Hernandez holds a law degree from Complutense Madrid University and a
Master’s degree in law from the Madrid Bar Association (Colegio de Abogados de Madrid (ICAM)).
Stevens C. Moore, Vice President Strategy & Corporate Development
Mr. Moore has more than 22 years of experience in finance positions in Spain, the United Kingdom and the United States. He has worked in
various positions in structured and leveraged finance at Citibank and Banco Santander, and vice president of M&A at GBS Finanzas. Most recently, he was director of corporate development and investor relations at Codere, the Madrid stock
exchange listed international gaming company. He holds a B.A. degree in history from Tulane University of New Orleans, Louisiana.
Lead Independent Director
Our corporate governance guidelines provide that one of our independent directors shall serve as a lead independent director at any time when
an independent director is not serving as the chairman of our board of directors. Mr. Villalba served as our lead independent director until he was named chairman of our board of directors on November 27, 2015, a position he holds until today.
Compensation of Board of Directors and Chief Executive Officer
We paid remuneration only to independent non-executive directors and Santiago Seage (Chief Executive Officer and
Executive Director), other directors were not paid remuneration. Since April 2019, each independent non-executive director receives an annual compensation of $150.0 thousand. As chairman of the board of directors, Mr. Villalba receives an
additional $75.0 thousand per year. As chairman of the audit committee, Mr. Francisco J. Martinez receives an additional $15.0 thousand per year. As chairman of the Nominating and Corporate Governance Committee and Compensation Committee, Mr.
Dove and Mr. Robinson receive an additional $10.0 thousand per year.
Until March 2019, each independent director received a total annual compensation of $134.0 thousand and as chairman of the board
of directors, Mr. Villalba received an additional $61.0 thousand per year. In 2019, each independent director received a total annual compensation detailed in the table below. As chairman of the audit committee, Mr. Francisco J. Martinez received an additional $15 thousand per year. As chairman of the Nominating and Corporate Governance Committee and Compensation
Committee, Mr. Dove and Mr. Robinson receive an additional $10 thousand per year.
Until December 31, 2019, the policy was not to compensate other non-executive directors for the time dedicated. The remuneration to
non-independent non-executive directors is a change to our remuneration policy approved by the Compensation Committee and by the Board of Directors. The Company is seeking shareholder approval to compensate non-independent non-executive
directors on the same terms as we compensate independent non-executive directors.
The total compensation received by our independent directors and Chief Executive Officer from us during 2019 is set forth in the table below.
The compensation of the Chief Executive Officer is defined in euros. Amounts have been converted to US $ for presentation purposes.
|
Directors, Remuneration for the year ended December 31, 2019
|
||||||||||||||||||||||||
|
Salary
and
Fees
|
All
Taxable
Benefits
|
Annual
Bonuses
|
LTIP
|
Pension
|
Total
|
|||||||||||||||||||
|
(in thousands of U.S. dollars)
|
||||||||||||||||||||||||
|
Santiago Seage
|
727.7
|
-
|
957.7
|
-
|
|
-
|
1,685.4
|
|||||||||||||||||
|
Daniel Villalba
|
217.5
|
-
|
-
|
-
|
-
|
217.5
|
||||||||||||||||||
|
Jackson Robinson
|
155.9
|
-
|
-
|
-
|
-
|
155.9
|
||||||||||||||||||
|
Robert Dove
|
155.9
|
-
|
-
|
-
|
-
|
155.9
|
||||||||||||||||||
|
Andrea Brentan
|
146.0
|
-
|
-
|
-
|
-
|
146.0
|
||||||||||||||||||
|
Francisco J. Martinez
|
161.0
|
-
|
-
|
-
|
-
|
161.0
|
||||||||||||||||||
|
Total
|
1,564.0
|
-
|
957.7
|
-
|
-
|
2,521.7
|
||||||||||||||||||
|
Directors, Remuneration for the year ended December 31, 2018
|
||||||||||||||||||||||||
|
Salary and
Fees
|
All
Taxable
Benefits
|
Annual
Bonuses
|
2016-2018
LTIP
|
Pension
|
Total
|
|||||||||||||||||||
|
(in thousands of U.S. dollars)
|
||||||||||||||||||||||||
|
Santiago Seage
|
767.8
|
-
|
992.2
|
751.1
|
-
|
2,511.1
|
||||||||||||||||||
|
Daniel Villalba
|
160.0
|
-
|
-
|
-
|
-
|
160.0
|
||||||||||||||||||
|
Jackson Robinson
|
118.3
|
-
|
-
|
-
|
-
|
118.3
|
||||||||||||||||||
|
Robert Dove
|
118.3
|
-
|
-
|
-
|
-
|
118.3
|
||||||||||||||||||
|
Andrea Brentan
|
114.2
|
-
|
-
|
-
|
-
|
114.2
|
||||||||||||||||||
|
Francisco J. Martinez
|
120.4
|
-
|
-
|
-
|
-
|
120.4
|
||||||||||||||||||
|
Total
|
1,399.0
|
-
|
992.2
|
751.1
|
-
|
3,142.3
|
||||||||||||||||||
Only directors who received remuneration are included in the table above.
Each member of our board of directors will be indemnified for his actions associated with being a director to the extent permitted by law.
None of the directors received any pension remuneration in 2018 nor 2019. The CEO received the 2016-2018 LTIP compensation in 2018, paid in
March 2019. No long-term awards have vested in 2019.
During the year 2019, most of the objectives defined for the Chief Executive Officer’s variable bonus were met or exceeded and the
Compensation Committee decided to approve a bonus corresponding to 100.7% of the potential variable compensation, which will be payable in 2020. In 2018, most of the objectives defined for the Chief Executive Officer’s variable bonus were met
or exceeded and the Compensation Committee decided to approve a bonus corresponding to 101.8% of the potential variable compensation, which was paid in 2019:
|
Percentage
weight
|
Achievement
|
||
|
CAFD (cash available for distribution) – Equal or Higher than $190 million
|
40%
|
100%
|
|
|
EBITDA – Equal or Higher than $827 million
|
10%
|
99%
|
|
|
Present and close value creating and accretive investment opportunities
|
15%
|
100%
|
|
|
Lead the works of the strategic review and plan
|
20%
|
100%
|
|
|
Achieve health and safety targets – (Frequency with Leave / Lost Time Index below 4.5 and General frequency index below 13.8) based on reliable targets and consistent measure metrics
|
10%
|
120%
|
|
|
Implement the succession plan
|
5%
|
75%
|
The Chief Executive Officer’s maximum potential bonus could be 120% of such bonus.
The 2016-2018 Long-Term Incentive Plan (LTIP) was in place for the three-year period from 2016 to 2018. The award corresponding to the Chief
Executive Officer was a 21.95% of the maximum potential award, which amounted to $751 thousand, which was paid in 2019.
A new remuneration policy, including long-term incentive awards was approved at our 2019 Annual General Meeting held in June 2019. Following
that policy, we have yearly long-term incentive plans which are detailed under the section “Long-term Incentive Awards”.
Total Shareholder Return and Chief Executive Officer Pay
The chart below shows the Company’s total shareholder return since June 2014, the date of our Initial Public Offering (“IPO”), until the end
of 2019 compared with the total shareholder return of the companies in the Russell 2000 Index. The chart represents the progression of the return, including investment, starting from the time of the IPO at a 100%-point. In addition, dividends
are assumed to have been re-invested at the closing price of each dividend payment date.
We believe the Russell 2000 Index is an adequate benchmark as it represents a broad range of companies of similar size.
TSR is calculated in US dollars.
The table below shows the total remuneration of the Chief Executive Officer and his bonuses and 2016-2018 LTIP grants expressed as a
percentage of the maximum he is likely to be awarded. We have also included an additional reference point to show the maximum remuneration receivable assuming a share price appreciation of 50%.
|
Year
|
Bonus
|
LTIP awards
|
|||||
|
(In thousands of U.S. Dollars)
|
|||||||
|
Total Pay
|
Percentage of
maximum
|
Amount of
bonus
|
Percentage of
maximum
|
Value
|
|||
|
2019
|
1,685.4
|
100.7%
|
957.7
|
-
|
-
|
||
|
2018
|
2,511.1
|
101.8%
|
992.2
|
21.95%
|
751.1
|
||
|
2017
|
1,602.0
|
96.25%
|
924.2
|
-
|
-
|
||
|
2016
|
1,499.4
|
100%
|
940.5
|
-
|
-
|
||
|
2015
|
1,597.6(1)
|
-
|
-
|
-
|
-
|
||
|
2014
|
174.1
|
-
|
-
|
-
|
-
|
||
|
(1) Includes €1,189.50 thousand termination payment received by Mr. Garoz after leaving the Company in November 25 2015.
|
|||||||
The chief executive officer did not receive any variable remuneration for service provided to the Company for the years ended 31 December 2015
and 2014. Santiago Seage occupied that office between January and May 2015, and again since late November 2015. Meanwhile, Mr. Garoz held that position between May and November 2015, when he left the Company.
In 2017, the Company accrued $924.2 thousand of the bonus paid to the Chief Executive Officer in 2018. In 2018, the Company accrued $992.2
thousand of the bonus payable to the Chief Executive Officer in 2019, in accordance with his service agreement.
If from January 1st, 2019 to December 31st, 2019 in 2019 the share price had increased by 50%, the remuneration for the CEO for the year 2019
would have been $1,685.4 million, the same as the amount actually received since no long-term incentives related to the share price have vested in 2019.
In 2019, the Company accrued $957.7 thousand of the bonus paid payable to the Chief Executive Officer in 2020.
Under the LTIP 2019, the CEO holds 46,987 share units, convertible into shares in the future as per the LTIP and 122,080 options as per the
2019 LTIP. In addition, the CEO holds 43,606 share units under the one-off plan.
Chief Executive Officer Pay vs. Employee Pay
The table below sets out the percentage change between the year 2018 and 2019 in salary, benefits and bonus (determined on the same basis as
for the Single Total Figure table) for the Chief Executive Officer and the average per capita change for employees of the Group as a whole excluding the Chief Executive Officer.
|
Element of remuneration
|
Percentage change for Chief
Executive Officer
|
Percentage change for
Employees excluding the CEO
|
|
|
Salary
|
0%
|
5.1%
|
|
|
Benefits
|
n/a
|
n/a
|
|
|
Bonus
|
(1.1%)
|
5.6%
|
Relative Importance of Spend on Pay
The following table sets out the change in overall employee costs, directors’ compensation and dividends.
|
$ in million
|
Amount in
2019
|
Amount in
2018
|
Difference
|
|
|
Spend on pay for all employees of the group
|
27.7
|
15.1
|
12.6
|
|
|
Total remuneration of directors
|
2.5
|
3.2
|
(0.7)
|
|
|
Dividends paid (*)
|
159.0
|
133.2
|
25.8
|
The company has not made any share repurchases during 2019 nor 2018.
The average number of employees in 2019 in the Group was 306 employees, compared to 207 employees in 2018. The $12.6 million increase in spend
on pay is due to the acquisition in July 2019 of ASI Operations, the company that performs the operation and maintenance services to the Solana and Mojave plants. In addition, in 2018, the amount effectively payable under the long-term
incentive plan corresponding to the 2016-2018 period was lower than the amount accrued, so we recorded a reversal of the accrual, which also explains the increase in spend on pay.
The $0.7 million decrease in total remuneration of directors is due to the CEO’s 2016-2018 long-term incentive plan that became payable as of
December 31, 2018. In 2019, no long-term incentives vested.
Long-Term Incentive Awards
In 2016, we adopted our 2016-2018 LTIP for management, for the period from 2016 to 2018. Twelve executives,
including our CEO, were eligible under LTIP. The LTIP provides that each eligible executive was entitled to the payment of a long-term incentive cash bonus in March 2019 calculated as a function of Total Annual Shareholder’s Return, or TSR,
objectives over the 2016-18 period, a metric intended to align management and shareholder interests. The maximum bonus was 50% (or, in the CEO’s case, 70%) of the total remuneration received by the executive over the period from 2016-18.
Specifically, 50% of the bonus was based on our TSR and 50% on the relative performance in terms of TSR versus a group of similarly structured companies selected by the Compensation Committee. Given the TSR in the three-year period from January
1, 2016 and December 31, 2018 and the TSR versus the peer group during that same period, the amount payable under the LTIP amounted to 21.95% of the maximum potential amount, which represented a total amount of $1,618.0 thousand, paid in March
2019.
A new remuneration policy including long-term incentive awards was approved at our 2019 Annual General Meeting held in June 2019.
In April 2018, the Board of Directors approved the implementation of a remuneration policy including LTIP awards. The first long-term
incentive plan for the 2019 period (the “Long-Term Incentive Plan 2019” or “LTIP 2019”) permits the grant of share options and restricted stock units (“Awards”) to the executive team of the Company (the “Executives”). The LTIP applies to
approximately 14 executives and the Board of Directors proposed to include the Chief Executive Officer, who is also a Director. The Chief Executive Officer’s participation in the LTIP was approved by shareholders’ at the 2019 annual general
meeting in June 2019.
The purpose of this LTIP is to attract and retain the best talent for positions of substantial responsibility in the Company, to encourage
ownership in the Company by the executive team whose long-term service the Company considers essential to its continued progress and, thereby, encourage recipients to act in the shareholders’ interest and to promote the success the Company.
The aggregate number of shares which may be reserved for issuance under the LTIP must not exceed 2% of the number of the shares outstanding at
the time of the Awards are granted but is expected to be significantly less. However, the Company may decide that, instead of issuing or transferring shares, the Executives may be paid in cash.
The value of the Awards will be defined as 50% of the Executives’ total annual compensation for the year closed before the date upon which an
Award is granted and, in the case of the Chief Executive Officer, would be 70% of the same previous year total compensation at the grant date (“Awards Value”). The share options will represent 25% of the Award Value and the restricted stock
units will represent 75% of the Award Value.
In addition to the LTIP 2019 and following the remuneration policy approved at our 2019 Annual General Meeting, in December 2019 the Board of
Directors approved the implementation of a long-term incentive plan for the 2020 period (the “2020 Long-Term Incentive Plan” or “2020 LTIP”) in the same terms as of the LTIP. The 2020 LTIP applies to approximately 13 executives including the
Chief Executive Officer.
Main terms of the LTIP
|
Share Options
|
Restricted Stock Units
|
|||
|
Nature
|
Option cost shall be calculated by a third party using the Black-scholes or some other accepted methodology.
|
Conditions shall be based on continuing employment (or other service relationship) and/or achievement of a minimum 5% average annual total shareholders return (“TSR”).
|
||
|
Exercisability and vesting period
|
One-third of the total number of options awarded shall vest on each anniversary of the date upon which an award was granted.
The Company will decide at vesting if cash or shares are given as payment.
|
The shares will vest on the third anniversary of the grant date but only if the total annual shareholders return (“TSR”) has been at least a 5% yearly average over such 3-year period.
|
||
|
Ownership and dividends
|
The participant shall have the rights of a shareholder only as to shares acquired upon the exercise of an option and not as to unexercised options.
Until the Shares are issued or transferred, no right to vote at any meeting or to receive dividends or any other rights as a shareholder shall exist.
|
The participant will be entitled to receive, for each share unit, a payment equivalent to the amount of any dividend or distribution paid on one share between the grant date and the
date on which the share unit vests.
|
If a participant’s employment terminates by reason of involuntary termination (death, disability, retirement dismissal rendered unfair, etc.),
any portion of his/her Award shall thereafter continue to vest and become exercisable according to the terms of the LTIP but such participant shall be no longer entitled to be granted Awards under the LTIP.
If a participant incurs a termination of employment for cause or voluntary resignation or withdrawal, options that have vested on the
termination date will be exercisable within the period of 30 days from such termination date but any unvested Awards (options or restricted stock units) shall lapse.
If there is a change in control, all Awards shall vest in full on the date of the change in control. The participants must exercise their
options within a period of 30 days.
If the Company is delisted, all outstanding Awards shall vest in full on the date of delisting and will be settled in cash. The cash payment
for restricted stock units will be the last quoted share price of the Company and the cash payment for any outstanding share options will be the difference between the last quoted share price and the exercise price for the applicable option.
Such cash payments will be made after applicable tax deductions within 30 days of the delisting.
In addition, in February 2019 the Board of Directors approved a special one-off plan which permitted the grant of stock units to certain
members of the Management and certain members of the Middle Management , consisting of approximately 25 managers including the Chief Executive Officer. The value of the award was defined as 50% of 2019 target remuneration (including salary and
variable bonus). The share units vest over 3 years, one third each year starting in 2020, provided that the manager is still an employee of the company. This was approved by shareholders at the 2019 annual general meeting. Executive directors
do not receive any pension contributions.
The executive director do not receive any pension contributions.
None of the non-executive directors receive bonuses, long-term incentive awards, pension or other benefits in respect of their services to the
Company.
There are no provisions for the recovery of sums paid or the withholding of any sum.
For 2020 the bonus objectives are the following:
|
Percentage
weight
|
|
|
CAFD (cash available for distribution) – Equal or higher than the CAFD budgeted in the 2020 budget
|
40%
|
|
EBITDA– Equal or Higher than the EBITDA budgeted in the 2020 budget
|
15%
|
|
Close accretive acquisitions for the Company
|
20%
|
|
Achieve health and safety targets - (Frequency with Leave / Lost Time Index below 3.5 and General frequency index below 11.0) based on reliable targets and consistent measure metrics
|
10%
|
|
Implement the succession plan
|
15%
|
The Compensation Committee approved a fixed remuneration of €663 thousand for the Chief Executive Officer for 2020, a 2%
increase versus 2019.
For 2020, the bonus measures for the remuneration of the Chief Executive Officer, will focus on four areas: financial targets, value
creating growth/investments, health and safety and implementing the succession plan.
This approach is intended to provide a balanced assessment of how the business has performed over the course of the year against stated
objectives. Targets are aligned with the annual plan and strategic and operational priorities for the year.
Total remuneration of the only executive director for a minimum, target and maximum performance in 2020 is presented in the chart below.
Assumptions made for each scenario are as follows:
| ◾ | Minimum: |
fixed remuneration plus portion of LTIP and one-off plans vesting in 2020 | |
| ◾ | Target: |
fixed remuneration plus portion of LTIP and one-off plans vesting in 2020 plus half of maximum annual bonus | |
| ◾ | Maximum: |
fixed remuneration plus portion of LTIP and one-off plans vesting in 2020 plus maximum annual bonus |
LTIP and one-off plan have been included for the amounts vesting in 2020, assuming a share price of $31.24 (February 26, 2020 share price).
Key Management Compensation for 2019
|
$ thousand
|
2019
|
2018
|
||
|
Short-term employee benefits
|
4,494.6
|
4,309.9
|
||
|
LTIP Awards
|
-
|
1,361.5
|
||
|
Post-employment benefits
|
-
|
-
|
||
|
Other long-term benefits
|
-
|
-
|
||
|
Termination benefits
|
-
|
-
|
||
|
Share-based payment
|
-
|
-
|
||
|
Total
|
4,494.6
|
5,671.4
|
Key management includes Directors, Chief Executive Officer, CFO and 5 key executives.
Our board of directors consists of eight directors, five of whom are independent. Under our articles of association, our board may consist of
7 to 13 members. Additionally, our articles of association established a term of office of up to 3 years. Upon retirement, our board members are eligible for reelection. Executive directors, our chairman, and lead independent directors can be
appointed for a period as decided by the directors. Santiago Seage has been serving as director since 2013 (except from March to December 2018), and Daniel Villalba and Jackson Robinson have served since 2014. Robert Dove, Andrea Brentan, and
Francisco J. Martinez were appointed in 2017, and Ian Robertson and Christopher Jarratt were appointed in 2018. Santiago Seage was reappointed on December 18, 2018.
Directors will not vote on matters that represent or could represent a conflict of interests. Directors affiliated with Algonquin do not vote
on matters that represent or could represent a conflict of interests, including the evaluation of assets offered to us under the AAGES and Algonquin ROFO Agreements. See “Item 7.B—Related Party Transactions—Procedures for Review, Approval and
Ratification of Related Party Transactions; Conflicts of Interest.”
Our board of directors is responsible for, among other things, overseeing the conduct of our business; reviewing and, where appropriate,
approving, our long-term strategic, financial and organizational goals and plans; and reviewing the performance of our chief executive officer and other members of senior management.
Under English law, the board of directors of an English company is responsible for the management, administration and representation of all
matters concerning the relevant business, subject to the company’s corporate constitution. Under English law and our constitution, the board of directors may delegate its powers to an executive committee or other delegated committee or to one
or more persons.
None of our non-executive directors have service contracts with us or any of our businesses providing for benefits upon termination of
employment.
Audit Committee
Our Audit Committee is responsible for monitoring and informing the board of directors on the work of external and internal auditors, control
systems, key processes and procedures, security and risks. The committee comprises the following three members, each of whom is an independent director:
|
Name
|
Position
|
|
|
Francisco J. Martinez
|
Chairman
|
|
|
Daniel Villalba
|
Member
|
|
|
Jackson Robinson
|
Member
|
The committee will meet as many times as required and a minimum of two times per year.
Our Audit Committee is directly responsible for overseeing the work of the external auditor engaged for the purpose of preparing or issuing an
auditor’s report or performing other audit, review or attest services, including the resolution of disagreements between the external auditor and management. The external auditor will report directly to our Audit Committee. Our Audit Committee
is also responsible for reviewing and approving our hiring policies regarding former employees of the external auditor. In addition, the Audit Committee preapproves all non-audit services undertaken by the external auditor.
Our Audit Committee is responsible for reviewing the adequacy and security of procedures for the confidential, anonymous submission by our
employees or contractors regarding any possible wrongdoing in financial reporting or other matters. Our Audit Committee is accountable to our board of directors and will provide a report to our board of directors after each regularly scheduled
Audit Committee meeting outlining the results of the Audit Committee’s activities and proceedings.
Nominating and Corporate Governance Committee
Our Nominating and Corporate Governance Committee comprises the following three members, two of whom are independent directors (Ian Robertson
is affiliated to Algonquin).
|
Name
|
Position
|
|
|
Robert Dove
|
Chairman
|
|
|
Daniel Villalba
|
Member
|
|
|
Ian Robertson
|
Member
|
The duties and functions of our Nominating and Corporate Governance Committee include, among others, regularly reviewing the structure, size
and composition (including the skills, knowledge, experience and diversity) of the board of directors and make recommendations to the board of directors with regard to any changes, and keep under review corporate governance rules and
developments (including ethics-related matters) that might affect us, with the aim of ensuring that our corporate governance policies and practices continue to be in line with best practice. Our Nominating and Corporate Governance Committee
meets at least twice a year at appropriate intervals in the financial reporting and audit cycle and otherwise as required. The committee informs and makes proposals to the board of directors.
Compensation Committee
Our Compensation Committee comprises the following three members, two of whom are independent directors (Christopher Jarratt is affiliated to
Algonquin).
|
Name
|
Position
|
|
|
Jackson Robinson
|
Chairman
|
|
|
Andrea Brentan
|
Member
|
|
|
Christopher Jarratt
|
Member
|
The duties and functions of our Compensation Committee include, among others, analyze, discuss and make recommendations to the board of
directors regarding the setting of the remuneration policy for all directors as well as senior management, including pension rights and any compensation. The committee meets at least twice a year at appropriate intervals in the financial
reporting and audit cycle and otherwise as required. The committee informs and makes proposals to the board of directors.
Related Party Transaction Committee
Our Related Party Transaction Committee comprises the following five members, each of whom is an independent director:
|
Name
|
Position
|
|
|
Daniel Villalba
|
Chairman
|
|
|
Jackson Robinson
|
Member
|
|
|
Andrea Brentan
|
Member
|
|
|
Robert Dove
|
Member
|
|
|
Francisco Jose Martinez
|
Member
|
The duties and functions of our Related Party Transaction Committee include, among others, evaluating on an ongoing basis existing
relationships between and among businesses and counterparties to ensure that all related parties are identified, monitoring related-party transactions, identifying changes in relationships with counterparties and overseeing the implementation
of a system for identifying, monitoring and reporting related-party transactions, including a periodic review of such transactions, applicable policies and procedures.
The Related Party Transaction Committee shall meet at such times as required and where it considers appropriate. The Related Party Transaction
Committee will report to the board of directors on the decisions and recommendations made by the committee, including but not limited to any conflict of interest and any procedure to manage such conflict of interest.
Special Committee / Strategic Review Committee
On February 13, 2019, we announced that our board of directors had formed a strategic review committee with the purpose of evaluating a wide range of strategic alternatives available to us to optimize our value and to improve returns to
shareholders. The role of the strategic review committee was subsumed by a special committee of the Board formed in September 2019. Our Special Committee has been evaluating a number of strategic alternatives and its work continues. Our
Special Committee now comprises our five independent directors:
|
Name
|
Position
|
|
|
Daniel Villalba
|
Chairman
|
|
|
Jackson Robinson
|
Member
|
|
|
Andrea Brentan
|
Member
|
|
|
Robert Dove
|
Member
|
|
|
Francisco Jose Martinez
|
Member
|
The duties and functions of our Special Committee are to (a) investigate, study and evaluate the current strategy, business model and cost of
capital for ourselves, our peers and other companies; (b) develop and present to the Board alternative strategies which may be available for execution by us to enhance shareholder value and, if considered necessary, improve our cost of capital;
and (c) review, negotiate, and make recommendations to the Board as to whether or not to pursue, offers and proposed transactions that would result in a sale of Atlantica and any strategic alternative available to Atlantica .
The following table shows the number of employees as of December 31, 2019, 2018 and 2017, on a consolidated basis:
|
Year ended December 31,
|
||||||||||||
|
Geography
|
2019
|
2018
|
2017
|
|||||||||
|
EMEA
|
50
|
53
|
56
|
|||||||||
|
North America
|
229
|
31
|
28
|
|||||||||
|
South America
|
43
|
37
|
15
|
|||||||||
|
Corporate
|
103
|
96
|
86
|
|||||||||
|
Total
|
425
|
217
|
185
|
|||||||||
The increase in the number of employees for the year ended December 31, 2019 as compared to the year ended December 31, 2018 is mainly due to
the acquisition of ASI Operations, the company which provides O&M services for the Solana and Mojave plants, focused exclusively on providing personnel. With this acquisition, we reduced our dependence on Abengoa as an O&M supplier and
expect to achieve cost reductions.
None of our directors or members of our senior management is the owner of more than one percent of our ordinary shares, and no director or
member of our senior management has voting rights with respect to our ordinary shares that are different from any other holder of our ordinary shares.
The following table sets forth information with respect to beneficial ownership of our ordinary shares as of the date of this annual report
by:
| • |
each of our directors and executive officers;
|
| • |
our directors and executive officers as a group; and
|
| • |
each person known to us to beneficially own 5% and more of our ordinary shares.
|
Beneficial ownership is determined in accordance with the rules and regulations of the SEC. It includes the sole or shared power to direct the
voting or the disposition of the securities or to receive the economic benefit of the ownership of the securities. In computing the number of shares beneficially owned by a person and the percentage ownership of that person, we have included
shares that the person has the right to acquire within 60 days of this annual report, including through the exercise of any option or other right and the vesting of restricted shares. These shares, however, are not included in the computation
of the percentage ownership of any other person. The calculations of percentage ownership in the table below is based on 101,601,666 ordinary shares outstanding as of the date of this annual report.
|
Name
|
Ordinary
Shares
Beneficially
Owned
|
Percentage
|
||||||
|
Directors and Officers
|
||||||||
|
Daniel Villalba
|
60,000
|
-
|
||||||
|
Santiago Seage
|
20,000
|
-
|
||||||
|
Jackson Robinson
|
10,688
|
-
|
||||||
|
Robert Dove
|
11,079
|
-
|
||||||
|
Francisco J. Martinez
|
6,703
|
-
|
||||||
|
Ian Robertson
|
2,500
|
-
|
||||||
|
Andrea Brentan
|
1,300
|
-
|
||||||
|
All Directors and executive officers as group
|
112,270
|
-
|
||||||
|
5% Beneficial Owners
|
||||||||
|
Algonquin (AY Holdco) B.V. (1)
|
44,942,065
|
44.2
|
%
|
|||||
|
Morgan Stanley (2)
|
7,321,982
|
7.3
|
%
|
|||||
| (1) |
This information is based solely on the Schedule 13D filed on June 3, 2019 by Algonquin Power & Utilities Corp., a corporation incorporated under the laws of Canada, Algonquin (AY Holdco) B.V., a
corporation incorporated under the laws of the Netherlands, and AAGES (AY Holdings) B.V., a corporation incorporated under the laws of the Netherlands.
|
| (2) |
This information is based solely on the Schedule 13G filed on February 11, 2020 by Morgan Stanley, corporation incorporated under the laws of Delaware. The registered address of Morgan Stanley is 1585
Broadway New York, NY 10036.
|
We have one class of ordinary shares, and each holder of our ordinary shares is entitled to one vote per share.
As of the date of this annual report, 101,601,666 of our ordinary shares were outstanding. Because some of our
ordinary shares are held by brokers and other nominees, the number of shares held by and the number of beneficial holders with addresses in the United States is not fully ascertainable. As of the date of this annual report, to the best of our
knowledge, one of our shareholders of record was located in the United States and held in the aggregate 98,217,259 ordinary shares representing approximately 96.69% of our outstanding shares. However, the United States shareholders of record
include Cede & Co., which, as nominee for The Depositary Trust Company, is the record holder of all such ordinary shares. Accordingly, we believe that the shares held by Cede & Co. include ordinary shares beneficially owned by both
United States and non-United States beneficial owners. As a result, these numbers may not accurately represent the number of beneficial owners in the United States.
Arrangements for Change in Control of the Company
On March 9, 2018, Algonquin completed an acquisition of a 25.0% stake in us from Abengoa with the option to acquire the remaining 16.5% stake.
On November 27, 2018, Algonquin announced that they had completed the purchase of a 16.5% equity interest in Atlantica from Abengoa. Following this purchase, Abengoa no longer had an equity interest in Atlantica. On May 9, 2019, Algonquin,
AAGES and the Company entered into the Enhanced Cooperation Agreement, and Algonquin and the Company entered into a subscription agreement pursuant to which, among other things, the Company agreed to permit Algonquin to acquire, and Algonquin
agreed to purchase, 1,384,402 ordinary shares, representing approximately 1.4% of the issued and outstanding Ordinary Shares. On May 22, 2019, Algonquin announced that they had completed the purchase of the 1.4% stake. After giving effect to
such purchase, Algonquin was the beneficial owner of 42,942,065 Ordinary Shares, representing approximately 42.3% of the issued and outstanding Ordinary Shares. On May 31, 2019, AAGES (AY Holdings) B.V. entered into an accelerated share
purchase transaction with Morgan Stanley & Co. LLC, pursuant to which on the same date AAGES acquired 2,000,000 Ordinary Shares for a total price of $53,750,000. After giving effect to such purchase, as of the date of this report, Algonquin
is the beneficial owner of 44,942,065 Ordinary Shares, representing approximately 44.2% of the issued and outstanding Ordinary Shares.
Agreements with Current Shareholders
We entered into the AAGES ROFO Agreement and Algonquin ROFO Agreement with AAGES and Algonquin, respectively. In addition, Algonquin, AAGES
and the Company entered into the Enhanced Cooperation Agreement, and Algonquin and the Company entered into the Subscription Agreement.
AAGES Right of First Offer
Pursuant to the AAGES ROFO Agreement, which we and AAGES entered into on March 5, 2018 and which became effective upon completion of the 25%
Share Sale, AAGES granted us a right of first offer on any proposed sale, transfer or other disposition of the AAGES’ ROFO Assets.
If AAGES transfers interests in any AAGES ROFO Asset, then AAGES must require such transferee to acquire the AAGES ROFO Asset subject to our
right of first offer except under certain circumstances summarized below. The AAGES ROFO Agreement has an initial term of ten years.
Prior to engaging in any negotiation regarding any disposition, sale or other transfer of any asset, AAGES will deliver a written notice to us
thereof, including a predefined set of information that is relevant for us to make a determination regarding the AAGES ROFO Asset, including the indicative price at which AAGES proposes to sell it to us. Once that information is received, a
60-day negotiation period will start. If an agreement is not reached, AAGES, during the following 30 months, may only sell, transfer, dispose or recontract such asset to a third party for an aggregate purchase price that is not less than 105%
of the last purchase price we offered during the negotiation period for assets located outside Canada and the US. For U.S. or Canadian assets, the purchase price must not be less than 100% of the last purchase price we offered during the
negotiation period.
Under the AAGES ROFO Agreement, AAGES is not obligated to sell any asset and, therefore, we do not know when, if ever, these assets will be
offered to us. In addition, in some of the assets under the AAGES ROFO Agreement, AAGES may have equity partners with rights regulating divestitures by AAGES of its stake such as drag-along and tag-along clauses, and rights of first refusal,
among others. We will consider and take into account all these clauses when deciding whether to present an offer.
Any material transaction between AAGES and us (including the proposed acquisition of any AAGES ROFO Asset) will be subject to our related
party transaction policy, which will require prior approval of such transaction by a majority of the non-conflicted directors of our board of directors. See “—Procedures for Review, Approval and Ratification of Related Party
Transactions;Conflicts of Interest,” “Item 3.D—Risk Factors—Risks Related to Our Relationship with Abengoa—We may not be able to consummate future acquisitions from AAGES, Algonquin or Abengoa” and “Item 3.D—Risk Factors.”
AAGES may enter into agreements with other companies with the objective of jointly developing the construction of new projects consisting of
concessional assets which are included in AAGES’ current or future portfolio. Pursuant to the terms of the AAGES ROFO Agreement, AAGES may sell equity in these assets to third parties without being subject to the AAGES ROFO Agreement under
certain circumstances in order to enhance the likelihood of success or financial prospects of such asset.
Algonquin Shareholders Agreement
In connection with the acquisition of 25.0% of our ordinary shares by Algonquin (indirectly through a subsidiary of AAGES), which completed in
March 2018, we entered into a Shareholders Agreement with Algonquin and AAGES, which became effective upon completion of the 25% Share Sale. The Shareholders Agreement, among other things, sets forth certain rights and restrictions with respect
to our ordinary shares, the main terms of which are summarized below.
On May 9, 2019, we signed a new enhanced collaboration agreement with Algonquin. Under this agreement, Atlantica had a right to acquire stakes
or make investments in two Algonquin assets in the U.S., subject to the parties acting reasonably and in good faith agreeing price and terms of such transfers. Additionally, we agreed with Algonquin to analyze jointly during the next six months
Algonquin’s contracted assets portfolio in the U.S. and Canada to identify assets where a drop down could add value for both parties, according to each company’s key metrics. This process is taking longer than initially expected and we cannot
guarantee that we will be able to consummate the acquisition of stakes or investments following the agreement with Algonquin.
Director Appointment Rights
The Shareholders Agreement provides that, if and to the extent provided in our articles, AAGES or Algonquin will have the right to appoint to
our board the maximum number of directors that corresponds to AAGES’ and Algonquin’s holding of voting rights, as per articles of association but in any event no more than (i) such number of directors as corresponds to 41.5% of our voting
securities; and (ii) 50% of our board less one, and if the resulting number is not a whole number, it shall be rounded up to the next whole number.
Furthermore, the Shareholders Agreement has been amended to allow Algonquin to increase its shareholding in Atlantica up to a 48.5% without
any change in corporate governance. Algonquin’s voting rights and rights to appoint directors are still limited to a 41.5% and the additional shares will vote replicating non-Algonquin’s shareholders vote.
One of the directors appointed by AAGES and Algonquin holding in the aggregate at least 25.0% of our voting securities will have the right to
be elected to any committee of our directors (except for the audit committee and related party transaction committee, and in those in which they are conflicted, or it is against the applicable law). In addition, so long as AAGES and Algonquin
have the right to appoint a director and no such director is then serving on our board of directors, AAGES and Algonquin may appoint an observer to our board of directors and any committee thereof (except for the audit committee and related
party transaction committee, and in those in which they are conflicted, or it is against the applicable law).
Dividends Distribution
We agreed that AAGES and Algonquin may terminate the Shareholders Agreement with respect to itself and its affiliates if, among others, our
board of directors confirms a dividend payment objective that is lower than 80% of the cash available for distribution or our board of directors does not confirm any dividend payment objective at least once during any period of more than 14
consecutive months.
As of December 31, 2019, our dividend payout objective was 80%. This objective can be modified by our board of directors in the future.
Pre-emption rights
AAGES and Algonquin may subscribe in cash for (i) up to 100% of our ordinary shares if the purpose of the issuance is to fund our acquisition
of assets under the AAGES ROFO Agreement and Algonquin ROFO Agreement; and (ii) up to 66% of our ordinary shares if the purpose of the issuance is to fund our acquisition of assets under the Abengoa ROFO Agreement. If we issue ordinary shares
for any other purpose, AAGES and Algonquin may subscribe in cash for ordinary shares in the amount pro rata to such AAGES’ and Algonquin’s aggregate holding of voting rights.
In addition, if AAGES and Algonquin elect to subscribe for at least 50% of an offering of our ordinary shares that will be listed, the price
per ordinary share for all persons that participate in such offering will be equal to 97% of the USD volume-weighted average closing price per ordinary share on NASDAQ (or other applicable stock exchange) over the 20 trading days immediately
preceding the date of AAGES’ and Algonquin’s receipt of notice of such proposed offering from us.
Standstill
Algonquin will not acquire any of our voting securities which may result in AAGES and Algonquin holding in the aggregate more than 48.5% of
the total voting rights. The exercise of subscription rights as part of the Shareholders Agreement (as amended by the Enhanced Cooperation Agreement) further provides that in any case AAGES and Algonquin cannot acquire 48.5% or more of our
voting securities or otherwise acquire control over us.
Also, AAGES and Algonquin will not be in breach of the standstill restriction if the shareholding of AAGES and Algonquin has increased in
connection with our action to reduce the number of our outstanding shares.
Termination
The Shareholders Agreement will terminate if, among others, AAGES and Algonquin and/or their affiliates cease to hold in the aggregate at
least 10% of the total voting rights attached to our voting securities. In addition, Shareholders Agreement could terminate if, among others, the (i) our articles are amended in a manner that adversely affects the rights of AAGES and Algonquin
to appoint directors, as such rights exist under our articles as of the date of the Shareholders Agreement; or (ii) we give notice to AAGES and Algonquin if: (a)(with respect to Algonquin and its affiliates only) a change of control over
Algonquin occurs; or (b)(with certain exceptions) on three occasions AAGES and Algonquin have not subscribed for our ordinary shares in the amount of at least its pro rata share, or have not fully paid for subscribed ordinary shares; or
(c)(with respect to Algonquin only) if the Algonquin ROFO Agreement terminates other than in connection with its breach by us.
AYES Shareholder Agreement
On May 24, 2019, Atlantica and Algonquin formed AYES Canada, a vehicle to channel co-investment opportunities in which Atlantica holds the
majority of voting rights. AYES Canada’s first investment was in Amherst Island, a 75 MW wind plant in Canada owned by the project company Windlectric, Inc. (“Windlectric”). Atlantica invested $4.9 million and Algonquin invested $92.3 million,
both through AYES Canada, which in turn invested those funds in Amherst Island Partnership , the holding company of Windlectric. Since Atlantica has control over AYES Canada under IFRS 10 “Consolidated Financial Statements”, its consolidated
financial statements show a total investment in the Amherst Island project of $97.2 million, accounted for as “Investments carried under the equity method” (Note 7) and Algonquin’s portion of that investment of $92.3 million as “Non-controlling
interest”. In addition, and under certain circumstances considered remote by both companies, Atlantica and Algonquin have options to convert shares of AYES Canada currently owned by Algonquin into Atlantica ordinary shares in exchange for a
higher stake in the plant, subject to the provisions of the standstill and enhanced collaboration agreements with Algonquin.
Algonquin drop down agreement and Right of First Offer on assets outside the United States or Canada
Under the Algonquin ROFO Agreement, Algonquin agreed to periodically discuss with us the possibility of offering for sale interests in certain
assets owned by Algonquin companies in Canada or the United States.
Pursuant to the Algonquin ROFO Agreement, which we and Algonquin entered into on March 5, 2018 and that became effective upon completion of
the Share Sale, Algonquin granted us a right of first offer on any proposed sale, transfer or other disposition of any of their contracted facilities or infrastructure facilities located outside of the United States or Canada which are
developed under expected long-term revenue agreements or concession agreements.
If Algonquin transfers interests in any asset under the Algonquin ROFO Agreement, then Algonquin must require such transferee to acquire any
asset under the Algonquin ROFO Agreement subject to our right of first offer except under certain circumstances summarized below. The Algonquin ROFO Agreement has an initial term of ten years.
Prior to engaging in any negotiation regarding any disposition, sale or other transfer of any asset under the Algonquin ROFO Agreement,
Algonquin will deliver a written notice to us thereof, including a set of predefined information that is relevant for us to make a determination regarding any asset under the Algonquin ROFO Agreement, including the indicative price at which
Algonquin proposes to sell it to us. Once that information is received, a 60-day negotiation period will start. If an agreement is not reached, Algonquin, during the following 30 months, may only sell, transfer, dispose or recontract such asset
under the Algonquin ROFO Agreement to a third party for an aggregate purchase price that is not less than 105% of the last purchaser price we offered during the negotiation period.
Under the Algonquin ROFO Agreement, Algonquin is not obligated to sell any assets under the Algonquin ROFO Agreement and, therefore, we do not
know when, if ever, these assets will be offered to us. In addition, in some of the assets under the Algonquin ROFO Agreement, Algonquin may have equity partners with rights regulating divestitures by Algonquin of its stake such as drag-along
and tag-along clauses, and rights of first refusal, among others. We will consider and take into account all these clauses when deciding whether to present an offer.
Any material transaction between Algonquin and us (including the proposed acquisition of any asset under the Algonquin ROFO Agreement) will be
subject to our related party transaction policy, which will require prior approval of such transaction by a majority non-conflicted directors of our board of directors. See “—Procedures for Review, Approval and Ratification of Related Party
Transactions Policy; Conflicts of Interest,” “Item 3.D—Risk Factors—Risks Related to Our Relationship with Abengoa—We may not be able to consummate future acquisitions from AAGES, Algonquin or Abengoa” and “Item 3.D—Risk Factors.” In addition,
Algonquin may terminate the Algonquin ROFO Agreement with us with a 180-day notice.
Procedures for Review, Approval and Ratification of Related Party Transactions; Conflicts of Interest
Our policy for the review, approval and ratification of related party transactions was updated and approved by the board of directors on
February 28, 2018. Our policy requires that all transactions with related parties are subject to approval or ratification in accordance with the procedures set forth in the policy by the non-conflicted directors at the board of directors. With
respect of any transaction with AAGES and Algonquin or its affiliates (other than our subsidiaries), including transactions pursuant to the ROFO agreements, the Related Party Transaction Committee is required to review all of the relevant facts
and circumstances and report its conclusions to the board. A majority of non-conflicted directors are required to either approve or disapprove of the entry into the transaction. In determining whether to approve or ratify a transaction with
AAGES, Algonquin or Abengoa, the directors unaffiliated with such entity are to consider, among other factors they may deem appropriate, whether the transaction is on terms no less favorable than terms generally available to an unaffiliated
third-party under the same or similar circumstances and the extent of AAGES’, Algonquin’s or Abengoa’s interest in the transaction. Our Related Party Transaction Policy is available on our website at www.atlanticayield.com.
Code of Conduct
We have adopted a code of conduct applicable all directors, officers and employees of Atlantica Yield and our subsidiaries. The Code of
Conduct is available on our website at www.atlanticayield.com, is communicated to all employees and is reviewed at least annually.
Not applicable.
We have included the Annual Consolidated Financial Statements as part of this annual report. See “Item 18—Financial Statements.”
Dividend Policy
Our Cash Dividend Policy
We expect to pay a quarterly dividend on or about the 75th day following the expiration of the first, second and third fiscal quarters to our
shareholders of record on or about the 60th day following the last day of such fiscal quarters. A quarterly dividend corresponding to the fourth quarter is usually declared in the first quarter of the following year. We expect to pay this
dividend on or about the 82nd day following the expiration of the corresponding fourth fiscal quarter to our shareholders of record in general on or about the 72nd day following the last day of such fiscal quarter. However, there might be
exceptions to these dates. Additionally, our board of directors may change our dividend policy at any point in time or modify the dividend for specific quarters following prevailing conditions.
The table below included our historical quarterly dividends since the beginning of 2017:
|
Declared
|
Record
|
Payable
|
Amount (USD) per share
|
|
February 26, 2020
|
March 12, 2020
|
March 23, 2020
|
0.41
|
|
November 5, 2019
|
November 29, 2019
|
December 13, 2019
|
0.41
|
|
August 2, 2019
|
August 30, 2019
|
September 13, 2019
|
0.40
|
|
May 7, 2019
|
June 3, 2019
|
June 14, 2019
|
0.39
|
|
February 26, 2019
|
March 12, 2019
|
March 22, 2019
|
0.37
|
|
October 31, 2018
|
November 30, 2018
|
December 14, 2018
|
0.36
|
|
August 6, 2018
|
August 31, 2018
|
September 15, 2018
|
0.34
|
|
May 14, 2018
|
May 31, 2018
|
June 15, 2018
|
0.32
|
|
March 7, 2018
|
March 19, 2018
|
March 27, 2018
|
0.31
|
|
November 13, 2017
|
November 30, 2017
|
December 15, 2017
|
0.29
|
|
August 03, 2017
|
August 31, 2017
|
September 15, 2017
|
0.26
|
|
May 15, 2017
|
May 31, 2017
|
June 15, 2017
|
0.25
|
|
February 27, 2017
|
March 6, 2017
|
March 15, 2017
|
0.25
|
We declared our first quarterly dividend in November 2014 and paid it on December 15, 2014. In February 2016, taking into consideration the
uncertainties resulting from the situation of Abengoa, the board of directors decided to postpone the decision whether to declare a dividend in respect of the fourth quarter of 2015 and in May 2016, our board of directors finally decided not to
declare a dividend in respect of the fourth quarter of 2015. Recently, on February 26, 2020, our board of directors approved a dividend of $0.41 per share corresponding to the fourth quarter of 2019, which is expected to be paid on March 23,
2020.
We intend to distribute a significant portion of our cash available for distribution as dividend, after considering the cash available for
distribution that we expect our projects will be able to generate, less reserves for the prudent conduct of our business (including for, among other things, dividend shortfalls as a result of fluctuations in our cash flows), on an annual basis.
We intend to distribute a quarterly dividend to shareholders. Our board of directors may, by resolution, amend the cash dividend policy at any time. We intend to grow our business via improvements in our existing projects and through the
acquisition of operational projects when market conditions are favorable, which, we believe, will facilitate the growth of our cash available for distribution and enable us to increase our dividend per share over time. However, the
determination of the amount of cash dividends to be paid to holders of our shares will be made by our board of directors and will depend upon our financial condition, results of operations, cash flow, long-term prospects and any other matters
that our board of directors deem relevant.
Our cash available for distribution is likely to fluctuate from quarter to quarter, in some cases significantly, as a result of the
seasonality of our assets, the terms of our financing arrangements, maintenance and outage schedules, among other factors. Accordingly, during quarters in which our projects generate cash available for distribution in excess of the amount
necessary for us to pay our stated quarterly dividend, we may reserve a portion of the excess to fund cash distributions in future quarters. In quarters in which we do not generate sufficient cash available for distribution to fund our stated
quarterly cash dividend, if our board of directors so determines, we may use retained cash flow from other quarters, as well as other sources of cash, to pay dividends to our shareholders.
Risks Regarding Our Cash Dividend Policy
We do not have a significant operating history as an independent company upon which to rely in evaluating whether we will have sufficient cash
available for distribution and other sources of liquidity to allow us to pay dividends on our shares quarterly, annually or at all. There is no guarantee that we will pay quarterly cash dividends to our shareholders. We do not have a legal
obligation to pay any dividend. While we currently intend to grow our business and increase our dividend per share over time, our cash dividend policy is subject to all the risks inherent in our business and may be changed at any time as a
result of certain restrictions and uncertainties, including the following:
| • |
The amount of our quarterly cash available for distribution could be impacted by restrictions on cash distributions contained in our project-level financing arrangements, which require that our
project-level subsidiaries comply with certain financial tests and covenants in order to make such cash distributions. Generally, these restrictions limit the frequency of permitted cash distributions to semi-annual or annual
payments, and prohibit distributions unless specified debt service coverage ratios, historical and/or projected, are met. See the sub-sections entitled “—Project Level Financing” under the individual project descriptions in “Item
4.B—Business Overview—Our Operations.” When forecasting cash available for distribution and dividend payments we have aimed to take these restrictions into consideration, but we cannot guarantee future dividends. In addition,
restrictions or delays on cash distributions could also happen if our project finance arrangements are under an event of default. On January 29, 2019, PG&E, the off-taker for Atlantica Yield with respect to the Mojave plant,
filed for reorganization under Chapter 11 of the Bankruptcy Code in the U.S. Bankruptcy Court for the Northern District of California. This situation is causing and could continue to cause, among other consequences, restrictions to
make cash distributions to the holding company. See “Item 3.D— Risk Factors. —Counterparties to our off-take agreements may not fulfill their obligations and, as our contracts expire, we may not be able to replace them with
agreements on similar terms in light of increasing competition in the markets in which we operate”.
|
| • |
Additionally, indebtedness we have incurred under the Revolving Credit Facility, the Note Issuance Facility 2017, the Note Issuance Facility 2019 and, if closed, the 2020 Green Private Placement
contain, among other covenants, certain financial incurrence and maintenance covenants, as applicable. See “Item 5.B—Liquidity and Capital Resources—Financing Arrangements.” In addition, we may incur debt in the future to acquire
new projects, the terms of which will likely require commencement of commercial operations prior to our ability to receive cash distributions from such acquired projects. These agreements likely will contain financial tests and
covenants that our subsidiaries must satisfy prior to making distributions. Should we or any of our project-level subsidiaries be unable to satisfy these covenants or if any of us are otherwise in default under such facilities, we
may be unable to receive sufficient cash distributions to pay our stated quarterly cash dividends notwithstanding our stated cash dividend policy. See the “Project Level Financing” descriptions contained in “Item 4.B—Business
Overview—Our Operations” for a description of such restrictions.
|
| • |
We and our board of directors have the authority to establish cash reserves for the prudent conduct of our business and for future cash dividends to our shareholders, and the establishment of or
increase in those reserves could result in a reduction in cash dividends from levels we currently anticipate pursuant to our stated cash dividend policy. These reserves may account for the fact that our project-level cash flows may
vary from year to year based on, among other things, changes in prices under off-take agreements, operational costs and other project contracts, compliance with the terms of project debt including debt repayment schedules, the
transition to market or recontracted pricing following the expiration of off-take agreements, working capital requirements and the operating performance of the assets. Our board of directors may increase reserves to account for the
seasonality that has historically existed in our assets’ cash flows and the variances in the pattern and frequency of distributions to us from our assets during the year. Furthermore, our board of directors may in the future
increase reserves in light of the uncertainty associated with potential negative outcomes resulting from PG&E bankruptcy filing on January 29, 2019, which triggered a technical event of default under our Mojave project finance
agreement in July 2019. If not cured or waived, an event of default in the project finance could result in debt acceleration and, if such amounts were not timely paid, the DOE could decide to foreclose on the asset. If not cured or
waived, an event of default could also result in restrictions to make cash distributions from Mojave to the holding level. See “Item 3.D— Risk Factors—Counterparties to our off-take agreements may not fulfill their obligations and,
as our contracts expire, we may not be able to replace them with agreements on similar terms in light of increasing competition in the markets in which we operate”. Our board of directors may increase reserves in light of the
uncertainty associated with Abengoa’s financial condition to account for potential costs that we may incur or limitations that may be imposed upon us as a result of cross-defaults under our Kaxu project financing arrangements.
|
| • |
We may lack sufficient cash to pay dividends to our shareholders due to cash flow shortfalls attributable to a number of operational, commercial or other factors, including low availability,
unexpected operating interruptions, legal liabilities, costs associated with governmental regulation, changes in governmental subsidies, delays in collections from our off-takers, changes in regulation, as well as increases in our
operating and/or general and administrative expenses, principal and interest payments on our and our subsidiaries’ outstanding debt, income tax expenses, failure of Abengoa to comply with its obligations under the agreements in
place, working capital requirements or anticipated cash needs at our project-level subsidiaries. See “Item 3.D—Risk Factors” for more information on the risks to which our business is subject.
|
| • |
We may pay cash to our shareholders via capital reduction in lieu of dividends in some years.
|
| • |
Our project companies’ cash distributions to us (in the form of dividends or other forms of cash distributions such as shareholder loan repayments) and, as a result, our ability to pay or grow our
dividends, are dependent upon the performance of our subsidiaries and their ability to distribute cash to us. The ability of our project-level subsidiaries to make cash distributions to us may be restricted by, among other things,
the provisions of existing and future indebtedness, applicable corporation laws and other laws and regulations.
|
| • |
Our board of directors may, by resolution, amend the cash dividend policy at any time. Our board of directors may elect to change the amount of dividends, suspend any dividend or decide to pay no
dividends even if there is ample cash available for distribution.
|
Our Ability to Grow our Business and Dividend
We intend to grow our business primarily through the improvement of existing assets and the acquisition of mainly contracted power generation
assets, electric transmission lines and other infrastructure assets, which, we believe will facilitate the growth of our cash available for distribution and enable us to increase our dividend per share over time. Our policy is to distribute a
significant portion of our cash available for distribution as a dividend. However, the final determination of the amount of cash dividends to be paid to our shareholders will be made by our board of directors and will depend upon our financial
condition, results of operations, cash flow, long-term prospects and any other matters that our board of directors deems relevant.
We expect that we will rely primarily upon external financing sources, including commercial bank borrowings and issuances of debt and equity
securities, to fund any future growth capital expenditures. To the extent we are unable to finance growth externally, our cash dividend policy could significantly impair our ability to grow because we do not currently intend to reserve a
substantial amount of cash generated from operations to fund growth opportunities. If external financing is not available to us on acceptable terms, our board of directors may decide to finance acquisitions with cash from operations, which
would reduce or even eliminate our cash available for distribution and, in turn, impair our ability to pay dividends to our shareholders. To the extent we issue additional shares to fund our business, our growth or for any other reason, the
payment of dividends on those additional shares may increase the risk that we will be unable to maintain or increase our per share dividend level. Additionally, the incurrence of additional commercial bank borrowings or other debt to finance
our growth would result in increased interest expense, which in turn may impact our cash available for distribution and, in turn, our ability to pay dividends to our shareholders.
There have been no significant changes since the date of the Annual Consolidated Financial Statements included in this annual report.
Our ordinary shares trade on the NASDAQ Global Select Market under the symbol “AY.”
Not applicable.
Our ordinary shares are traded on the NASDAQ Global Select Market under the symbol “AY.”
Not applicable.
Not applicable.
Not applicable.
Not applicable.
The information called for by this item has been reported previously in our Articles of Association on Form 6-K (File No. 001-36487), filed
with the SEC on May 21, 2018 as exhibit 3.1 and is incorporated by reference into this annual report.
See “Item 4.B—Business Overview,” “Item 5.B—Liquidity and Capital Resources—Financing Arrangements” and “Item 7.B—Related Party Transactions.”
See “Item 5.A—Operating Results—Factors Affecting Our Results of Operations—Regulation.”
Material UK Tax Considerations
The following is a general summary of material UK tax considerations relating to the ownership and disposal of our shares. The comments set
out below are based on current UK tax law as applied in England and Wales and HM Revenue & Customs, or HMRC, practice (which may not be binding on HMRC) as at the date of this summary, both of which are subject to change, possibly with
retrospective effect. They are intended as a general guide and apply to you only if you are a “U.S. Holder” (as defined in the section below entitled “Material U.S. Federal Income Tax Considerations”) and if:
| • |
you hold Atlantica Yield shares as an investment for tax purposes, as capital assets and you are the absolute beneficial owner thereof for UK tax purposes; and
|
| • |
you are an individual, you are not resident in the United Kingdom for UK tax purposes and do not hold Atlantica Yield shares for the purposes of a trade, profession, or vocation that you carry on in
the United Kingdom through a branch or agency, or if you are a corporation, you are not resident in the UK for UK tax purposes and do not hold the securities for the purpose of a trade carried on in the United Kingdom through a
permanent establishment in the United Kingdom.
|
This summary does not address all possible tax consequences relating to an investment in the shares. Certain categories of shareholders,
including those falling outside the category described above, those carrying on certain financial activities, those subject to specific tax regimes or benefitting from certain reliefs or exemptions, those connected with us and those for whom
the shares are employment-related securities may be subject to special rules and this summary does not apply to such shareholders and any general statements made in this disclosure do not take them into account.
This summary is for general information only and is not intended to be, nor should it be considered to be, legal or tax advice to any
particular investor. It does not address all of the tax considerations that may be relevant to specific investors in light of their particular circumstances or to investors subject to special treatment under UK tax law.
Potential investors should satisfy themselves prior to investing as to the overall tax consequences, including, specifically, the consequences
under UK tax law and HMRC practice of the acquisition, ownership and disposal of the shares in their own particular circumstances by consulting their own tax advisors.
UK Taxation of Dividends
We will not be required to withhold amounts on account of UK tax at source when paying a dividend in respect of our shares to a U.S. Holder.
U.S. Holders who hold their shares as an investment and not in connection with any trade carried on by them will not be subject to United
Kingdom tax in respect of any dividends.
UK Taxation of Capital Gains
An individual holder who is a U.S. Holder will generally not be liable to UK capital gains tax on capital gains realized on the disposal of
his or her Atlantica Yield shares unless such holder carries on (whether solely or in partnership) a trade, profession or vocation in the United Kingdom through a branch or agency in the United Kingdom to which the shares are attributable.
A corporate holder of shares that is a U.S. Holder will generally not be liable for UK corporation tax on chargeable gains realized on the
disposal of its Atlantica Yield shares unless it carries on a trade in the United Kingdom through a permanent establishment to which the shares are attributable.
An individual holder of shares who is temporarily a non-UK resident for UK tax purposes will, in certain circumstances, become liable to UK
tax on capital gains in respect of gains realized while he or she was not resident in the United Kingdom.
Stamp Duty and Stamp Duty Reserve Tax
The stamp duty and stamp duty reserve tax, or SDRT, treatment of the issue and transfer of, and the agreement to transfer, Atlantica Yield
shares outside a depositary receipt system or a clearance service are discussed in the paragraphs under ‘General’ below. The stamp duty and SDRT treatment of such transactions in relation to such systems are discussed in the paragraphs under
“Depositary Receipt Systems and Clearance Services” below.
General
No stamp duty, or SDRT, will arise on the issue of shares in registered form by Atlantica Yield.
An agreement to transfer our shares will normally give rise to a charge to SDRT at the rate of 0.5% of the amount or value of the
consideration payable for the transfer. SDRT is, in general, payable by the purchaser.
Transfers of our shares will generally be subject to stamp duty at the rate of 0.5% of the consideration given for the transfer (rounded up to
the next £5). The purchaser normally pays the stamp duty.
If a duly stamped transfer completing an agreement to transfer is produced within six years of the date on which the agreement is made (or, if
the agreement is conditional, the date on which the agreement becomes unconditional) any SDRT already paid is generally repayable, normally with interest, and any SDRT charge yet to be paid is cancelled.
Depositary Receipt Systems and Clearance Services
Following the Court of Justice of the European Union’s decision in C-569/07 HSBC Holdings Plc, Vidacos Nominees Limited v The Commissioners of
Her Majesty’s Revenue & Customs and the First-tier Tax Tribunal decision in HSBC Holdings Plc and The Bank of New York Mellon Corporation v. The Commissioners of Her Majesty’s Revenue & Customs, HMRC has confirmed that 1.5% SDRT is no
longer payable when new shares are issued to a clearance service or depositary receipt system.
Where our shares are transferred (i) to, or to a nominee or an agent for, a person whose business is or includes the provision of clearance
services or (ii) to, or to a nominee or an agent for, a person whose business is or includes issuing depositary receipts, stamp duty or SDRT will generally be payable at the higher rate of 1.5% of the amount or value of the consideration given
or, in certain circumstances, the value of the shares.
Except in relation to clearance services that have made an election under Section 97A(1) of the Finance Act of 1986 (to which the special
rules outlined below apply), no stamp duty or SDRT is payable in respect of transfers or agreements to transfer within clearance services or depositary receipt systems. Accordingly, no stamp duty or SDRT should, in practice, be required to be
paid in respect of transfers or agreements to transfer our shares within the facilities of The Depository Trust Company, or DTC.
There is an exception from the 1.5% charge on the transfer to, or to a nominee or agent for, a clearance service where the clearance service
has made and maintained an election under section 97A(1) of the Finance Act 1986, which has been approved by HMRC. In these circumstances, SDRT at the rate of 0.5% of the amount or value of the consideration payable for the transfer will arise
on any transfer of our shares into such an account and on subsequent agreements to transfer such shares within such account. It is our understanding that DTC has not made an election under section 97A(1) of the Finance Act of 1986.
Any liability for stamp duty or SDRT in respect of any other transfer into a clearance service or depositary receipt system, or in respect of
a transfer within any clearance service or depositary receipt system, which does arise will strictly be accountable by the clearance service or depositary receipt system operator or their nominee, as the case may be, but will, in practice, be
payable by the participants in the clearance service or depositary receipt system.
Material U.S. Federal Income Tax Considerations
The following is a summary of material U.S. federal income tax consequences of the acquisition, ownership and disposition of shares by U.S.
Holders (as defined below). This summary is based upon U.S. federal income tax laws (including the IRC, final, temporary and proposed Treasury regulations, rulings, judicial decisions and administrative pronouncements) all as of the date hereof
and all of which are subject to changes in wording or administrative or judicial interpretation occurring after the date hereof, possibly with retroactive effect.
As used herein, the term “U.S. Holder” means a beneficial owner of shares:
| (a) |
that is, for U.S. federal income tax purposes, (i) a citizen or resident of the United States, (ii) a corporation (or other entity taxable as a corporation) created or organized in or under the laws
of the United States or any political subdivision thereof, (iii) an estate the income of which is subject to U.S. federal income taxation regardless of its source, or (iv) a trust if a court within the United States is able to
exercise primary supervision over the administration of the trust and one or more U.S. persons have the authority to control all substantial decisions of the trust, or the trust has validly elected to be treated as a domestic trust
for U.S. federal income tax purposes;
|
| (b) |
that holds the shares as capital assets for U.S. federal income tax purposes; and
|
| (c) |
that owns, directly, indirectly or by attribution, less than 5% both of the vote and value of the interest in Atlantica Yield.
|
This summary does not cover all aspects of U.S. federal income taxation that may be relevant to, or the actual tax effect that any of the
matters described herein will have on, the acquisition, ownership or disposition of shares by particular investors, and does not address state, local, foreign or other tax laws. This summary does not address all of the U.S. federal income tax
considerations that may apply to U.S. Holders that are subject to special tax rules, such as U.S. citizens or lawful permanent residents of the United States living abroad, insurance companies, tax-exempt organizations, certain financial
institutions, persons subject to the alternative minimum tax or the net investment income tax, dealers and certain traders in securities or currencies, persons holding shares as part of a straddle, hedging, conversion or other integrated
transaction, partners in entities classified as partnerships for U.S. federal income tax purposes, persons holding shares through an individual retirement account or other tax-deferred account, persons whose functional currency is not the U.S.
dollar or persons that carry on a trade, business or vocation in the United Kingdom through a branch, agency or permanent establishment to which the shares are attributable. Such U.S. holders may be subject to U.S. federal income tax
consequences different from those set forth below.
If an entity classified as a partnership for U.S. federal income tax purposes holds shares, the U.S. federal income tax treatment of a partner
in such an entity generally will depend upon the status of the partner and the activities of the partnership. An entity treated as a partnership for U.S. federal income tax purposes that holds shares and its partners are urged to consult their
own tax advisors regarding the specific U.S. federal income tax consequences to the partnership and its partners of acquiring, owning and disposing of the shares.
This discussion assumes that Atlantica Yield is not, was not for its 2019 taxable year, and will not become a PFIC for U.S. federal income tax
purposes, as discussed below under “—Passive foreign investment company rules.”
Potential investors in shares should consult their own tax advisors concerning the specific U.S. federal, state and local tax consequences of
the ownership and disposition of shares in light of their particular situations as well as any consequences arising under the laws of any other taxing jurisdiction.
Taxation of distributions on the shares
Distributions received by a U.S. Holder on shares generally will constitute dividends to the extent paid out of Atlantica Yield current or
accumulated earnings and profits (as determined for U.S. federal income tax purposes). Atlantica Yield intends to annually calculate its earnings and profits in accordance with U.S. federal income tax principles. If distributions exceed
Atlantica Yield’s current and accumulated earnings and profits, such excess distributions will constitute a non-taxable return of capital to the extent of the U.S. Holder’s tax basis in its shares and will result in a reduction of such tax
basis. To the extent such excess exceeds a U.S. Holder’s tax basis in the shares, such excess will generally be taxed as capital gain.
Subject to certain exceptions for short-term and hedged positions, dividends received by certain non-corporate U.S. Holders of shares
generally will be subject to U.S. federal income taxation at rates lower than those applicable to other ordinary income if the dividends are “qualified dividend income.” Distributions received by a U.S. Holder on shares will be qualified
dividend income if: (i) shares are readily tradable on an established securities market in the United States (such as NASDAQ Global Select Market, where our shares are listed) and (ii) Atlantica Yield was not, for the year prior to the year in
which the dividends are paid, and is not, for the year in which the dividends are paid, a PFIC. As discussed below under “—Passive foreign investment company rules,” although there can be no assurance that Atlantica Yield will not be considered
a PFIC for any taxable year, Atlantica Yield does not believe that it was a PFIC for its 2019 taxable year and does not expect to be a PFIC for its current taxable year or in the foreseeable future. Non-corporate U.S. Holders should consult
their own tax advisors to determine whether they are subject to any special rules that limit their ability to be taxed at these favorable rates. Corporate U.S. Holders will not be entitled to claim the dividends-received deduction with respect
to dividends paid by Atlantica Yield. Dividends will be included in a U.S. Holder’s income on the date of the U.S. Holder’s receipt of the dividend.
Taxation upon sale or other disposition of shares
A U.S. Holder generally will recognize U.S. source capital gain or loss on the sale or other disposition of shares, which will generally be
long-term capital gain or loss if the U.S. Holder has owned shares for more than one year. The amount of the U.S. Holder’s gain or loss will be equal to the difference between such U.S. Holder’s adjusted tax basis in the shares sold or
otherwise disposed of and the amount realized on the sale or other disposition. Net long-term capital gain recognized by certain non-corporate U.S. Holders will be taxed at a lower rate than the rate applicable to ordinary income. The
deductibility of capital losses is subject to limitations.
Passive foreign investment company rules
If Atlantica Yield were a PFIC for any taxable year during which a U.S. Holder held shares, certain adverse U.S. federal income tax
consequences may apply to the U.S. Holder. Atlantica Yield does not believe that it was a PFIC for its 2019 taxable year and does not expect to be a PFIC for its current taxable year or in the foreseeable future. However, PFIC status depends on
the composition of a company’s income and assets and the fair market value of its assets (including, among others, less than 25% owned equity investments) from time to time, as well as on the application of complex statutory and regulatory
rules that are subject to potentially varying or changing interpretations. Accordingly, there can be no assurance that Atlantica Yield will not be considered a PFIC for any taxable year.
A non-U.S. corporation will be a PFIC in any taxable year in which, after taking into account the income and assets of the corporation and
certain subsidiaries pursuant to applicable “look-through rules,” either: (i) at least 75% of its gross income is “passive income” or (ii) at least 50% of the average value of its assets is attributable to assets which produce passive income or
are held for the production of passive income. For purposes of the PFIC rules, “passive income” includes, among other things, certain foreign currency gains, certain rents and the excess of gains over losses from certain commodities
transactions. Gains from commodities transactions, however, are generally excluded from the definition of passive income if such gains are active business gains from the sale of commodities and the foreign corporation’s commodities meet
specified criteria. The law is unclear as to what constitutes “active business gains” and there are also other uncertainties regarding the criteria that commodities must meet. Accordingly, there can be no assurance that Atlantica Yield is not,
was not for its 2019 taxable year, or will not become a PFIC or that changes in the management or ownership structure of Atlantica Yield or its assets, including as a result of any acquisitions pursuant to the ROFO agreements, will not impact
the determination of Atlantica Yield’s PFIC status.
If Atlantica Yield were a PFIC for any taxable year during which a U.S. Holder held shares, gain recognized by a U.S. Holder on a sale or
other disposition of the shares would generally be allocated ratably over the U.S. Holder’s holding period for the shares. The amounts allocated to the taxable year of the sale or other disposition and to any year before Atlantica Yield became
a PFIC would be taxed as ordinary income. The amount allocated to each other taxable year would be subject to U.S. federal income tax at the highest rate in effect in that year for individuals or corporations, as appropriate, and an interest
charge would be imposed on the resulting U.S. federal income tax liability. The same treatment would generally apply to any distribution in respect of shares to the extent the distribution exceeds 125% of the average of the annual distributions
on shares received by the U.S. Holder during the preceding three years or the U.S. Holder’s holding period, whichever is shorter. Certain elections may be available that would result in alternative treatments (such as mark-to-market treatment)
of the shares.
In addition, if Atlantica Yield were a PFIC for a taxable year in which it pays a dividend or in the prior taxable year, the favorable
dividend rate discussed above with respect to dividends paid to certain non-corporate U.S. Holders would not apply.
U.S. Holders should consult their own tax advisors regarding the PFIC rules.
Information reporting and backup withholding
Payments of dividends and sales proceeds that are made within the United States or through certain U.S. financial intermediaries generally are
subject to information reporting and to backup withholding unless the U.S. Holder is a corporation or other exempt recipient, or, in the case of backup withholding, the U.S. Holder provides a correct taxpayer identification number and certifies
that it is not subject to backup withholding. The amount of any backup withholding from a payment to a U.S. Holder will be allowed as a credit against the U.S. Holder’s U.S. federal income tax liability and may entitle such U.S. Holder to a
refund, provided that the required information is timely furnished to the Internal Revenue Service. U.S. Holders should consult their own tax advisors about these rules and any other reporting obligations that may apply to the ownership or
disposal of shares, including requirements related to the holding of certain “specified foreign financial assets.”
Not applicable.
Not applicable.
Our SEC filings are available to you on the SEC’s website at http://www.sec.gov. This site contains reports, proxy and information statements
and other information regarding issuers that file electronically with the SEC. The information on that website is not part of this report. We also make available on our website free of charge, our annual reports on Form 20-F and the text of
our reports on Form 6-K, including any amendments to these reports , as well as certain other SEC filings, as soon as reasonably practicable after they are electronically filed with or furnished to the SEC. Our website address is
www.atlanticayield.com . The information on that website is not part of this report.
As a foreign private issuer, we will be exempt from the rules under the Exchange Act related to the furnishing and content of proxy
statements, and our officers, directors and principal shareholders will be exempt from the reporting and short-swing profit recovery provisions contained in Section 16 of the Exchange Act. In addition, we will not be required under the Exchange
Act to file annual, quarterly and current reports and financial statements with the SEC as frequently or as promptly as United States companies whose securities are registered under the Exchange Act. However, for so long as we are listed on the
NASDAQ, or any other U.S. exchange, and are registered with the SEC, we will file with the SEC, within 120 days after the end of each fiscal year, or such applicable time as required by the SEC, an annual report on Form 20-F containing
financial statements audited by an independent registered public accounting firm. We also submit to the SEC on Form 6-K the interim financial information that we publish.
Not applicable.
Our activities are undertaken through our segments and are exposed to market risk, credit risk and liquidity risk. Risk is managed by our Risk
Management and Finance Department in accordance with mandatory internal management rules. The internal management rules provide written policies for the management of overall risk, as well as for specific areas, such as exchange rate risk,
interest rate risk, credit risk, liquidity risk, use of hedging instruments and derivatives and the investment of excess cash.
Market risk
We are exposed to market risk, such as movement in foreign exchange rates and interest rates. All of these market risks arise in the normal
course of business and we do not carry out speculative operations. For the purpose of managing these risks, we use a series of swaps and options on interest rates and foreign exchange rates. None of the derivative contracts signed has an
unlimited loss exposure.
Foreign exchange risk
The main cash flows from our subsidiaries are cash collections arising from long-term contracts with clients and debt payments arising from
project finance repayment. Given that financing of the projects is always denominated in the same currency in which the contract with the client is signed, a natural hedge exists for our main operations.
Our functional currency is the U.S. dollar, as most of our revenues and expenses are denominated or linked to U.S. dollars. All our companies located in
North America, South America and Algeria have their PPAs, or concessional agreements, and financing contracts signed in, or indexed totally or partially to, U.S. dollars. Our solar power plants in Spain have their revenues and expenses
denominated in euros, and Kaxu, our solar plant in South Africa, has its revenues and expenses denominated in South African rand.
Our strategy is to hedge cash distributions from our Spanish assets. We hedge the exchange rate for the distributions from our Spanish assets after deducting
euro-denominated interest payments and euro-denominated general and administrative expenses. Through currency options, we have hedged 100% of our euro-denominated net exposure for the next 12 months and 75% of our euro-denominated net
exposure for the following 12 months. We expect to continue with this hedging strategy on a rolling basis.
Although we hedge cash-flows in euros, fluctuations in the value of the euro in relation to the U.S. dollar may affect our operating results. In subsidiaries
with functional currency other than the U.S. dollar, assets and liabilities are translated into U.S. dollars using end-of-period exchange rates. Revenue, expenses and cash flows are translated using average rates of exchange. Fluctuations in
the value of the South African rand in relation to the U.S. dollar may also affect our operating results.
Apart from the impact of translation differences described above, the exposure of our income statement to fluctuations of foreign currencies is limited, as
the financing of projects is typically denominated in the same currency as that of the contracted revenue agreement. This policy seeks to ensure that the main revenue and expenses in foreign companies are denominated in the same currency,
limiting our risk of foreign exchange differences in our financial results.
Interest rate risk
Interest rate risks arise mainly from our financial liabilities at variable interest rate (less than 10% of our total project debt financing).
We use interest rate swaps and interest rate options (caps) to mitigate interest rate risk.
As a result, the notional amounts hedged as of December 31, 2019, contracted strikes and maturities, depending on the characteristics of the
debt on which the interest rate risk is being hedged, are very diverse, including the following:
| · |
Project debt in euro: between 81% and 100% of the notional amount, maturities until 2030 and average guaranteed strike interest rates of between 0.89% and 4.87%
|
| · |
Project debt in U.S. dollars: between 70% and 100% of the notional amount, maturities until 2034 and average guaranteed strike interest rates of between 1.98% and 5.27%
|
In connection with our interest rate derivative positions, the most significant impact on our Annual Consolidated Financial Statements are
derived from the changes in EURIBOR or LIBOR, which represents the reference interest rate for the majority of our debt.
In relation to our interest rate swaps positions, an increase in EURIBOR or LIBOR above the contracted fixed interest rate would create an
increase in our financial expense which would be positively mitigated by our hedges, reducing our financial expense to our contracted fixed interest rate. However, an increase in EURIBOR or LIBOR that does not exceed the contracted fixed
interest rate would not be offset by our derivative position and would result in a net financial loss recognized in our consolidated income statement. Conversely, a decrease in EURIBOR or LIBOR below the contracted fixed interest rate would
result in lower interest expense on our variable rate debt, which would be offset by a negative impact from the mark-to-market of our hedges, increasing our financial expense up to our contracted fixed interest rate, thus likely resulting in a
neutral effect.
In relation to our interest rate options positions, an increase in EURIBOR or LIBOR above the strike price would result in higher interest
expenses, which would be positively mitigated by our hedges, reducing our financial expense to our capped interest rate, whereas a decrease of EURIBOR or LIBOR below the strike price would result in lower interest expenses.
In addition to the above, our results of operations can be affected by changes in interest rates with respect to the unhedged portion of our
indebtedness that bears interest at floating rates.
In the event that EURIBOR and LIBOR had risen by 25 basis points as of December 31, 2019, with the rest of the variables remaining constant,
the effect in the consolidated income statement would have been a loss of $2.7 million (a loss of $2.7 million in 2018 and a loss of $1.1 million in 2017) and an increase in hedging reserves of $27.6 million ($32.9 million in 2018 and $39.1
million in 2017). The increase in hedging reserves would be mainly due to an increase in the fair value of interest rate swaps designated as hedges.
Credit risk
On January 29, 2019, PG&E, the off-taker for Atlantica with respect to the Mojave plant, filed for reorganization under Chapter 11 of the
Bankruptcy Code in the U.S. Bankruptcy Court for the Northern District of California. See “Item 3.D— Risk Factor— Counterparties to our off-take agreements may not fulfill their obligations and, as our contracts expire, we may not be able to
replace them with agreements on similar terms in light of increasing competition in the markets in which we operate.”
Eskom’s credit rating has also weakened and is currently CCC+ from S&P, B3 from Moody’s and BB- from Fitch. Eskom is the off-taker of our
Kaxu solar plant, a state-owned, limited liability company, wholly owned by the government of the Republic of South Africa. Eskom’s payment guarantees to our solar plant Kaxu are underwritten by the South African Department of Energy, under the
terms of an implementation agreement. The credit ratings of the Republic of South Africa as of the date of this report are BB/Baa3/BB+ by S&P, Moody’s and Fitch, respectively.
In addition, the credit rating of Pemex has also weakened and is currenty BBB+ from S&P, Baa3 from Moody’s and BB+ from Fitch. We have
been experiencing delays in collections in the last few months. Although we believe they are partially due to changes in personnel following the elections last year, we continue to monitor the situation closely.
Apart from these situations, we consider that in general we have limited credit risk with clients as revenues are derived from PPAs and other
revenue contracted agreements with electric utilities and state-owned entities.
In addition, in 2019 we entered into a political risk insurance agreement with the Multinational Investment Guarantee Agency for Kaxu. The
insurance provides protection for breach of contract up to $98.6 million in the event the South African Department of Energy does not comply with its obligations as guarantor. We have also increased coverage in our political risk insurance for
our assets in Algeria with CESCE up to $38.2 million, including 2 years dividend coverage. These insurance policies do not cover credit risk.
Liquidity risk
The objective of our financing and liquidity policy is to ensure that we maintain sufficient funds to meet our financial obligations as they
fall due.
Project finance borrowing permits us to finance projects through project debt and thereby insulate the rest of our assets from such credit
exposure. We incur project finance debt on a project-by-project basis.
The repayment profile of each project is established on the basis of the projected cash flow generation of the business. This ensures that
sufficient financing is available to meet deadlines and maturities, which mitigates the liquidity risk
Not applicable.
Not applicable.
Not applicable.
Not applicable.
PART II
We maintain disclosure controls and procedures, as defined in Rules 13a-15(e) and 15d-15(e) of the U.S. Exchange Act, that are designed to
ensure that information required to be disclosed by the Company in reports that we file or submit under the U.S. Exchange Act is (i) recorded, processed, summarized and reported within the time period specified in the SEC’s rules and forms; and
(ii) accumulated and communicated to our management, including our Chief Executive Officer (principal executive officer) and Chief Financial Officer (principal financial officer), as appropriate, to allow timely decisions regarding required
disclosure. Disclosure controls and procedures, no matter how well designed, can provide only reasonable assurance of achieving the desired control objectives.
Our management, with the participation of our Chief Executive Officer and Chief Financial Officer, has performed an evaluation of the
effectiveness of the design and operation of its disclosure controls and procedures (as defined in Rule 13a-15 (e) under the Exchange Act) as of December 31, 2019. There are inherent limitations to the effectiveness of any control system,
including disclosure controls and procedures.
Based upon their evaluation, our Chief Executive Officer and Chief Financial Officer concluded that our disclosure controls and procedures are
effective.
Management’s Report on Internal Control over Financial Reporting
Pursuant to Section 404 of the United States Sarbanes-Oxley Act, management is responsible for establishing and maintaining effective internal
control over financial reporting. This system is designed to provide reasonable assurance regarding the reliability of financial reporting and the preparation of financial statements for external purposes in accordance with generally accepted
accounting principles.
Because of its inherent limitations, internal control over financial reporting may not prevent or detect all misstatements. Also, projections
of any evaluation of effectiveness to future periods are subject to the risk that controls may become inadequate because of changes in conditions, or that the degree of compliance with the policies or procedures may deteriorate.
Our management assessed the effectiveness of our internal control over financial reporting as of December 31, 2019, based on the framework set
forth by the Committee of Sponsoring Organizations of the Treadway Commission, or COSO, in Internal Control—Integrated Framework (2013). Based on this assessment, management concluded that, as of December 31, 2019, its internal control over
financial reporting was effective based on those criteria.
Our internal control over financial reporting as of December 31, 2019, has been audited by Ernst & Young S.L., an independent registered
public accounting firm, as stated in their report which follows below.
Attestation Report of the Independent Registered Public Accounting Firm
The report of Ernst & Young , S.L., our Independent Registered Public Accounting Firm, on our internal control over financial reporting is
included herein at page F-2 of our Annual Consolidated Financial Statements.
Changes in Internal Controls over Financial Reporting
There has been no change in our internal control over financial reporting that occurred during 2019 that has materially affected, or is
reasonably likely to materially affect, our internal control over financial reporting.
Inherent Limitations of Disclosure Controls and Procedures in Internal Control over Financial Reporting
It should be noted that any system of controls, however well-designed and operated, can provide only reasonable, and not absolute, assurance
that the objectives of the system will be met. In addition, the design of any control system is based in part upon certain assumptions about the likelihood of future events. Projections regarding the effectiveness of a system of controls in
future periods are subject to the risk that such controls may become inadequate because of changes in conditions or deterioration in the degree of compliance with the policies or procedures.
See “Item 6.C—Board Practices—Audit Committee.” Our board of directors has determined that Mr. Francisco J. Martinez
and Mr. Daniel Villalba qualify as “audit committee financial experts” under applicable SEC rules.
Our board of directors has adopted a code of conduct for our employees, officers and directors to govern their relations with current and
potential customers, fellow employees, competitors, government and self-regulatory agencies, the media, and anyone else with whom we have contact. Our code of conduct is publicly available on our website at www.atlanticayield.com and it
is under review on yearly basis.
The following table provides information on the aggregate fees billed by our principal accountants, Ernst & Young , S.L. (“EY”) classified
by type of service rendered in 2019:
|
EY
|
Other
Auditors
|
Total
|
||||||||||
|
($ in thousands)
|
||||||||||||
|
Audit Fees
|
1,293
|
61
|
1,354
|
|||||||||
|
Audit-Related Fees
|
481
|
-
|
481
|
|||||||||
|
Tax Fees
|
406
|
-
|
406
|
|||||||||
|
All Other Fees
|
271
|
-
|
271
|
|||||||||
|
Total
|
2,451
|
61
|
2,512
|
|||||||||
The following table provides information on the aggregate fees billed by our principal accountants, Deloitte, S.L., to Atlantica Yield,
classified by type of service rendered in 2018:
|
Deloitte
|
Other
Auditors
|
Total
|
||||||||||
|
($ in thousands)
|
||||||||||||
|
Audit Fees
|
1,722
|
74
|
1,796
|
|||||||||
|
Audit-Related Fees
|
705
|
-
|
705
|
|||||||||
|
Tax Fees
|
-
|
-
|
-
|
|||||||||
|
All Other Fees
|
46
|
-
|
46
|
|||||||||
|
Total
|
2,473
|
74
|
2,547
|
|||||||||
“Audit Fees” are the aggregate fees billed for professional services in connection with the audit of our Annual Consolidated Financial
Statements, quarterly reviews of our interim financial statements and statutory audits of our subsidiaries’ financial statements under the rules of England and Wales and the countries in which our subsidiaries are organized. The decrease in
audit fees is mainly due to the change of external auditors in 2019.
“Audit-Related Fees” include fees charged for services that can only be provided by our auditor, such as consents and comfort letters of
non-recurring transactions, assurance and related services that are reasonably related to the performance of the audit or review of our financial statements. Fees paid during 2019 related to comfort letters and consents required for capital
market transactions of our major shareholder are also included in this category. The Audit Committee approved all of the services provided by Ernst & Young S.L and by other member firms of EY.
“Tax Fees” include mainly fees charged for transfer pricing services and tax compliance services in our US subsidiaries.
“All Other Fees” comprises fees billed in relation to financial advisory and due diligence services and other services which cannot be
comprised under other categories.
Audit Committee’s Policy on Pre-Approval of Audit and Permissible Non-Audit Services of the Independent Auditor
Subject to the approval of the independent auditor by our shareholders, the Audit Committee has the sole authority to appoint, retain or
replace the independent auditor. The Audit Committee is also directly responsible for the compensation and oversight of the work of the independent auditor. These policies generally provide that we will not engage our independent auditors to
render audit or non-audit services unless the service is specifically approved in advance by the Audit Committee. The Audit Committee’s pre-approval policy, which covers audit and non-audit services provided to us or to any of our subsidiaries,
is as follows:
| • |
The Audit Committee shall review and approve in advance the annual plan and scope of work of the independent external auditor, including staffing of the audit, and shall (i) review with the
independent external auditor any audit-related concerns and management’s response and (ii) confirm that any examination is performed in accordance with the relevant accounting standards;
|
| • |
The Audit Committee shall pre-approve all audit services, and all permitted non-audit services (including the fees and terms thereof) to be performed for us by the independent auditors, to the extent
required by law. The Audit Committee may delegate to one or more Committee members the authority to grant pre-approvals for audit and permitted non-audit services to be performed for us by the independent auditor, provided that
decisions of such members to grant pre-approvals shall be presented to the full Audit Committee at its next regularly scheduled meeting;
|
| • |
The list of audit services and all permitted non-audit services (including the fees and terms thereof) to be performed for us by the independent auditors pre-approved by the Audit Committee,
considering that these services clearly allowed from the point of independence is the following:
|
| • |
Audit services, including audit of financial statements, limited reviews, comfort letters, other verification works requested by regulator or supervisors;
|
| • |
Audit-related services, including due diligence services, verification of corporate social responsibility report, accounting or internal control advisory and preparation courses on these topics;
|
| • |
Tax services;
|
| • |
Other specific services, such as evaluation of the design, implementation and operation of a financial information system or control over financial reporting; and
|
| • |
Courses or seminars.
|
Only for information purposes, all audit and non-audit services will be reported to the Audit Committee on a quarterly basis.
Any other service shall be pre-approved by the Audit Committee. However, when for reasons of urgency, it is necessary to start the provision
of services prior to the next meeting of the Audit Committee, the Chairman of the Audit Committee is authorized to provide such approval, which shall be communicated to the Audit Committee subsequently.
In accordance with the above pre-approval policy, all audit and permitted non-audit services performed for us by our principal accountants, or
any of its affiliates, were approved by the Audit Committee of our board of directors, who concluded that the provision of such services by the independent accountants was compatible with the maintenance of that firm’s independence in the
conduct of its auditing functions: an auditor may not function in the role of management; an auditor may not audit his or her own work; and an auditor may not serve in an advocacy role for his or her client.
The Audit Committee approved all the services provided by Ernst & Young S.L and by other member firms of EY.
On May 9, 2019, Algonquin, AAGES and the Company entered into the Enhanced Cooperation Agreement, and Algonquin and the
Company entered into a subscription agreement pursuant to which, among other things, the Company agreed to permit Algonquin to acquire, and Algonquin agreed to purchase, 1,384,402 ordinary shares, representing approximately 1.4% of the issued
and outstanding Ordinary Shares. On May 22, 2019, Algonquin announced that they had completed the purchase of the 1.4% stake. After giving effect to such purchase, Algonquin was the beneficial owner of 42,942,065 Ordinary Shares, representing
approximately 42.3% of the issued and outstanding Ordinary Shares. On May 31, 2019, AAGES (AY Holdings) B.V. entered into an accelerated share purchase transaction with Morgan Stanley & Co. LLC, pursuant to which on the same date AAGES
acquired 2,000,000 Ordinary Shares for a total price of $53,750,000. After giving effect to such purchase, as of the date of this report, Algonquin is the beneficial owner of 44,942,065 Ordinary Shares, representing approximately 44.2% of the
issued and outstanding Ordinary Shares.
On May 21, 2018, we announced that the Annual General Meeting of Shareholders of the Company, held on May 11, 2018, voted to appoint Ernst
& Young LLP and Ernst & Young, S.L. (collectively, “EY”) to be our independent registered public accounting firm for up to four years starting on January 1, 2019.
On February 27, 2018, the Board of Directors of Atlantica, resolved to propose to the Annual General Meeting of Shareholders of the Company,
the appointment of EY as new auditor. Such selection was adopted at the proposal of the audit committee in accordance with the corporate governance guidelines recommending periodic rotation of the independent registered public accounting firm,
following a transparent selection process. As a consequence, Deloitte, S.L. was released as the independent registered public accounting firm of the Company as of February 28, 2019.
Under U.S. federal securities laws and NASDAQ rules we are a “foreign private issuer.” Under
NASDAQ Stock Market Rule 5615(a)(3), a foreign private issuer may follow home country corporate governance practices instead of certain of NASDAQ’s requirements, provided that such foreign private issuer discloses in its annual report filed
with the SEC each requirement of Rule 5600 that it does not follow and describes the home country practice followed in lieu of such requirement. In addition, a foreign private issuer that elects to follow a home country practice instead of
NASDAQ’s requirements must submit to NASDAQ a written statement from an independent counsel in such issuer’s home country certifying that the issuer’s practices are not prohibited by the home country’s laws.
As a foreign private issuer and as a UK company, we are not required to and we do not have: (i) a nominating/corporate governance committee
composed entirely of independent directors and (ii) a compensation committee composed entirely of independent directors or (iii) an annual performance evaluation of the nominating/corporate governance and compensation committees. These
exemptions do not modify the independence requirements for the audit committee, and we currently comply with the requirements of the Sarbanes-Oxley Act and the NASDAQ rules with respect to the audit committee.
Other than the matters described above, there are no significant differences between our corporate governance practices and those followed by
U.S. domestic companies under Nasdaq Stock Market Rules.
Not applicable.
PART III
We have elected to provide financial statements pursuant to Item 18.
The following exhibits are filed as part of this annual report:
|
Exhibit No.
|
Description
|
|
|
Amended and restated Articles of Association of Atlantica Yield plc (incorporated by reference from Exhibit 3.1 to Atlantica Yield plc’s Form 6-K, as amended, filed with the SEC on
May 21, 2018 – SEC File No. 001-36487).
|
||
|
Amended and Restated Right of First Offer Agreement by and between Abengoa Yield plc (now Atlantica Yield plc) and Abengoa, S.A., dated December 9, 2014 (incorporated by reference
from Exhibit 10.1 to Atlantica Yield plc’s Registration Statement on Form F-1 filed with the SEC on December 11, 2014 – SEC File No. 333-200848).
|
||
|
Operation and Maintenance Agreement between Abengoa Solar Espana, S.A. and Solaben Electricidad Dos, S.A., dated December 10, 2012 (incorporated by reference from Exhibit 10.8 to
Atlantica Yield plc’s draft registration statement on Form F-1 submitted to the SEC on February 28, 2014 – SEC File No. 377-00503).
|
||
|
Operation and Maintenance Agreement between Abengoa Solar Espana, S.A. and Solaben Electricidad Tres, S.A., dated December 10, 2012 (incorporated by reference from Exhibit 10.9 to
Atlantica Yield plc’s draft registration statement on Form F-1 submitted to the SEC on February 28, 2014 – SEC File No. 377-00503).
|
||
|
Credit and Guaranty Agreement dated May 10, 2018 (incorporated by reference from Exhibit 99.1 from Atlantica Yield plc’s Form 6-K filed with the SEC on September 5, 2018– SEC File No.
001-36487)
|
||
|
The Note Issuance Facility, dated February 10, 2017, among Atlantica Yield plc, HSBC Corporate Trust Company (UK) Limited as collateral agent, Elavon Financial Services DAC, UK Branch
as agent, and a group of funds managed by Westbourne Capital as purchasers of the notes issued thereunder (incorporated by reference from Exhibit 4.10 to Atlantica Yield plc’s amendment to the annual report on Form 20-F/A submitted to
the SEC on March 29, 2017 – SEC File No. 001-36487).
|
||
|
Amendment No. 1 to the Note Issuance Facility Agreement among Atlantica Yield plc, HSBC Corporate Trust Company (UK) Limited as collateral agent, Elavon Financial Services DAC, UK
Branch as agent and a group of funds managed by Westbourne Capital as purchasers of the notes issued thereunder, dated March 28, 2017 (incorporated by reference from Exhibit 4.11 to Atlantica Yield plc’s amendment to the annual report
on Form 20-F/A submitted to the SEC on March 29, 2017 – SEC File No. 001-36487).
|
||
|
Registration Rights Agreement dated March 28, 2017 among Atlantica Yield plc, Abengoa S.A., ACIL Luxco1 S.A. and GLAS Trust Corporation Limited as security agent (incorporated by
reference from Exhibit 4.12 from Atlantica Yield plc’s Form 6-K filed with the SEC on April 12, 2017 – SEC File No. 001-36487).
|
|
Shareholder’s Agreement dated March 5, 2018 among Atlantica Yield, AAGES and Algonquin Power & Utilities Corp. (incorporated by reference from Exhibit 4.13 from Atlantica Yield
plc’s Form 6-K filed with the SEC on March 12, 2018– SEC File No. 001-36487)
|
||
|
First Amendment and Joinder to Credit and Guaranty Agreement, dated January 24, 2019 (incorporated by reference from Exhibit 4.14 from Atlantica Yield plc’s Form 20-F filed with the
SEC on February 28, 2019 – SEC File No. 001-36487)
|
||
|
Right of First Offering Agreement dated March 5, 2018 between Atlantica Yield and Algonquin Power and Utilities Corp. (incorporated by reference from Exhibit 4.15 from Atlantica Yield
plc’s Form 6-K filed with the SEC on March 12, 2018– SEC File No. 001-36487)
|
||
|
The Note Issuance Facility, dated April 30, 2019, among Atlantica Yield plc, the guarantors named therein, FSS Trustee Corporation, as trustee, Lucid Agency Services, as agent, and a
group of funds managed by Westbourne Capital as purchasers of the notes issued thereunder
|
||
|
Second Amendment to Credit and Guaranty Agreement, dated August 2, 2019 (incorporated by reference from Exhibit 4.18 from Atlantica Yield plc’s Form 6-K filed with the SEC on November
7, 2019 – SEC File No. 001-36487)
|
||
|
Enhanced Cooperation Agreement, dated May 9, 2019, by and among Algonquin Power & Utilities, Corp., Atlantica Yield plc and Abengoa-Algonquin Global Energy Solutions B.V.
(incorporated by reference from Exhibit 99.1 from Atlantica Yield plc’s Form 6-K filed with the SEC on August 7, 2019 – SEC File No. 001-36487)
|
||
|
Subscription Agreement, dated May 9, 2019, by and between Algonquin Power & Utilities, Corp. and Atlantica Yield plc (incorporated by reference from Exhibit 99.2 from Atlantica
Yield plc’s Form 6-K filed with the SEC on August 7, 2019 – SEC File No. 001-36487)
|
||
|
AYES Shareholder Agreement, dated May 24, 2019, by and among Algonquin Power & Utilities, Corp., Atlantica Yield plc and Atlantica Yield Energy Solutions Canada Inc. (incorporated
by reference from Exhibit 99.3 from Atlantica Yield plc’s Form 6-K filed with the SEC on August 7, 2019 – SEC File No. 001-36487)
|
||
|
Third Amendment to Credit and Guaranty Agreement, dated December 17, 2019
|
||
|
Subsidiaries of Atlantica Yield plc.
|
||
|
Certification of Santiago Seage, Chief Executive Officer of Atlantica Yield plc, pursuant to Section 302 of the Sarbanes-Oxley Act of 2002.
|
||
|
Certification of Francisco Martinez-Davis, Chief Financial Officer of Atlantica Yield plc, pursuant to Section 302 of the Sarbanes-Oxley Act of 2002.
|
||
|
Certification pursuant to 18 U.S.C. Section 1350, as adopted pursuant to Section 906 of the Sarbanes-Oxley Act of 2002.
|
||
|
Consent of EY
|
||
|
Consent of Deloitte
|
||
| 15.3 |
Consent from Deloitte Algeria S.a.r.l. |
|
| 99.1 |
Financial Statements of Myah Bahr Honaine S.p.a as of December 31, 2019 and for the year ended December 31, 2019, 2018 and 2017.
|
|
|
101.INS
|
XBRL Instance Document
|
|
|
101.SCH
|
XBRL Taxonomy Extension Schema Document
|
|
|
101.CAL
|
XBRL Taxonomy Extension Calculation Linkbase Document
|
|
|
101.DEF
|
XBRL Taxonomy Extension Definition Linkbase Document
|
|
|
101.LAB
|
XBRL Taxonomy Extension Label Linkbase Document
|
|
|
101.PRE
|
XBRL Taxonomy Extension Presentation Linkbase Document
|
SIGNATURE
The registrant hereby certifies that it meets all of the requirements for filing on Form 20-F and that it has duly caused and authorized the
undersigned to sign this annual report on its behalf.
Date: February 27, 2020
|
ATLANTICA YIELD PLC
|
|||
|
By:
|
/s/ Santiago Seage
|
||
|
Name:
|
Santiago Seage
|
||
|
Title:
|
Chief Executive Officer
|
||
|
ATLANTICA YIELD PLC
|
|||
|
By:
|
/s/ Francisco Martinez-Davis
|
||
|
Name:
|
Francisco Martinez-Davis
|
||
|
Title:
|
Chief Financial Officer
|
||
180
ATLANTICA YIELD PLC
INDEX TO FINANCIAL STATEMENTS
Annual Consolidated Financial Statements as of December 31, 2019 and 2018 and for the years ended December 31, 2019, 2018 and
2017
|
Report of Ernst and Young, S.L.
|
F-5
|
|
Report of Deloitte, S.L.
|
F-6
|
|
Consolidated statements of financial position as of December 31, 2019 and 2018
|
F-7
|
|
Consolidated income statements for the years ended December 31, 2019, 2018 and 2017
|
F-9
|
|
Consolidated financial statements of comprehensive income for the years ended December 31, 2019, 2018 and 2017
|
F-10
|
|
Consolidated statements of changes in equity for the years ended December 31, 2019, 2018 and 2017
|
F-11
|
|
Consolidated cash flow statements for the years ended December 31, 2019, 2018 and 2017
|
F-14
|
|
Notes to the annual consolidated financial statements
|
F-15
|
|
Appendix I: Entities included in the Group as subsidiaries as of December 31, 2019 and 2018
|
F-57
|
|
Appendix II: Investments recorded under the equity method as of December 31, 2019
|
F-61
|
|
Appendix III-1 and Appendix III-2: Projects subject to the application of IFRIC 12 interpretation based on the concession of services as of December 31, 2019 and 2018
|
F-63
|
|
Appendix IV: Additional Information of Subsidiaries including material Non-controlling interest as of December 31, 2019
|
F-80
|
|
Appendix V (Schedule I): Condensed Financial Statements of Atlantica Yield plc
|
F-82
|
REPORT OF INDEPENDENT REGISTERED PUBLIC ACCOUNTING FIRM
To the shareholders and the Board of Directors of Atlantica Yield plc:
Opinion on the Financial Statements
We have audited the accompanying consolidated statements of financial position of Atlantica Yield plc (the “Company”) as of December 31, 2019, the related consolidated income statement, the consolidated
statement of comprehensive income, the consolidated statement of changes in equity and the consolidated cash flows statement, for the year ended December 31, 2019, and the related notes (collectively referred to as the “consolidated
financial statements”). In our opinion, the consolidated financial statements present fairly, in all material respects, the financial position of the Company at December 31, 2019, and the results of its operations and its cash flows for
the period ended December 31, 2019, in conformity with International Financial Reporting Standards as issued by International Accounting Standards Board.
We also have audited, in accordance with the standards of the Public Company Accounting Oversight Board (United States) (PCAOB), the Company’s internal control over financial reporting as of December 31,
2019, based on criteria established in Internal Control-Integrated Framework issued by the Committee of Sponsoring Organizations of the Treadway Commission (2013 framework), and our report dated February 26, 2020 expressed an unqualified
opinion thereon.
Basis for Opinion
These financial statements are the responsibility of the Company’s management. Our responsibility is to express an opinion on the Company’s financial statements based on our audits. We
are a public accounting firm registered with the PCAOB and are required to be independent with respect to the Company in accordance with the U.S. federal securities laws and the applicable rules and regulations of the Securities and
Exchange Commission and the PCAOB.
We conducted our audits in accordance with the standards of the PCAOB. Those standards require that we plan and perform the audit to obtain reasonable assurance about whether the
financial statements are free of material misstatement, whether due to error or fraud. Our audits included performing procedures to assess the risks of material misstatement of the financial statements, whether due to error or fraud, and
performing procedures that respond to those risks. Such procedures included examining, on a test basis, evidence regarding the amounts and disclosures in the financial statements. Our audits also included evaluating the accounting
principles used and significant estimates made by management, as well as evaluating the overall presentation of the financial statements. We believe that our audits provide a reasonable basis for our opinion.
F-1
Critical Audit Matter
The critical audit matter communicated below is a matter arising from the current period audit of the financial statements that was communicated or required to be communicated to the audit committee and
that: (1) relates to accounts or disclosures that are material to the financial statements and (2) involved our especially challenging, subjective or complex judgments. The communication of the critical audit matter does not alter in any
way our opinion on the consolidated financial statements, taken as a whole, and we are not, by communicating the critical audit matter below, providing a separate opinion on the critical audit matter or on the accounts or disclosures to
which it relates.
Recoverability assessment of contracted concessional assets
|
Description of the
Matter
|
At December 31, 2019, the Company’s revenues, totaling $1,011 million, were derived exclusively from its assets across a different range of geographies. The most significant assets and technologies of the Company are renewable
energy, efficient natural gas, transmission lines and water assets. As described in Note 2.3 to the consolidated financial statements, these assets are referred to as “contracted concessional assets” which are classified mostly,
as intangible assets or as financial assets, depending on the nature of the payment entitlements established in the agreement. Revenue derived from the Company’s contracted concessional assets are governed by power purchase
agreements (PPAs) with the Company’s customers, known as “off-takers” or by regulation.
As indicated in Note 2.5 to the consolidated financial statements, the Company reviews its contracted concessional assets for impairment indicators whenever events or changes in circumstances (“triggering events”) indicate that
the carrying amounts of the assets or group of assets may not be recoverable. In addition, as indicated in Note 6, the company updated Solana impairment test confirming the conclusions reached in the triggering event analysis.
Auditing the Company’s recoverability assessment related to the contracted concessional assets involves significant judgment in determining whether a triggering event occurred and, if an event did occur, in the assumptions used
by management in the determination if an impairment should be recorded. The main inputs considered when evaluating the triggering events include the performance of the plants in relation to external conditions such as weather and
technology changes, as well as legal and tax changes and financial conditions, among others. Significant assumptions used for the update of the impairment calculation of Solana, include, discount rates and projections considering
real data based on energy generation.
|
F-2
/s/ ERNST & YOUNG, S.L.
We have served as the Company’s auditor since 2019
Madrid, Spain
February 26, 2020
F-3
REPORTS OF INDEPENDENT REGISTERED PUBLIC ACCOUNTING FIRM
To the shareholders and the Board of Directors of Atlantica Yield plc:
Opinion on Internal Control over Financial Reporting
We have audited Atlantica Yield plc’s internal control over financial reporting as of December 31, 2019, based on criteria established in Internal Control — Integrated Framework issued by the Committee
of Sponsoring Organizations of the Treadway Commission (2013 framework) (the COSO criteria). In our opinion, Atlantica Yield plc (the Company) maintained, in all material respects, effective internal control over financial reporting
as of December 31, 2019, based on the COSO criteria.
We have also audited, in accordance with the standards of the Public Company Accounting Oversight Board (United States) (PCAOB), the 2019 consolidated financial statements of the Company and our report
dated February 26, 2020, expressed an unqualified opinion thereon.
Basis for Opinion
The Company’s management is responsible for maintaining effective internal control over financial reporting and for its assessment of the effectiveness of internal control over financial reporting
included in the accompanying Management’s Annual Report on Internal Control over Financial Reporting. Our responsibility is to express an opinion on the Company’s internal control over financial reporting based on our audit. We are a
public accounting firm registered with the PCAOB and are required to be independent with respect to the Company in accordance with the U.S. federal securities laws and the applicable rules and regulations of the Securities and
Exchange Commission and the PCAOB.
We conducted our audit in accordance with the standards of the PCAOB. Those standards require that we plan and perform the audit to obtain reasonable assurance about whether effective internal control
over financial reporting was maintained in all material respects.
Our audit included obtaining an understanding of internal control over financial reporting, assessing the risk that a material weakness exists, testing and evaluating the design and operating
effectiveness of internal control based on the assessed risk, and performing such other procedures as we considered necessary in the circumstances. We believe that our audit provides a reasonable basis for our opinion.
F-4
A company’s internal control over financial reporting is a process designed to provide reasonable assurance regarding the reliability of financial reporting and the preparation of financial statements
for external purposes in accordance with generally accepted accounting principles. A company’s internal control over financial reporting includes those policies and procedures that (1) pertain to the maintenance of records that, in
reasonable detail, accurately and fairly reflect the transactions and dispositions of the assets of the company; (2) provide reasonable assurance that transactions are recorded as necessary to permit preparation of financial
statements in accordance with generally accepted accounting principles, and that receipts and expenditures of the company are being made only in accordance with authorizations of management and directors of the company; and (3)
provide reasonable assurance regarding prevention or timely detection of unauthorized acquisition, use, or disposition of the company’s assets that could have a material effect on the financial statements.
Because of its inherent limitations, internal control over financial reporting may not prevent or detect misstatements. Also, projections of any evaluation of effectiveness to future periods are subject
to the risk that controls may become inadequate because of changes in conditions, or that the degree of compliance with the policies or procedures may deteriorate.
/s/ ERNST & YOUNG, S.L.
Madrid, Spain
February 26, 2020
F-5
To the shareholders and the Board of Directors of Atlantica Yield plc:
Opinion on the Financial Statements
We have audited the accompanying consolidated statements of financial position of Atlantica Yield plc and subsidiaries (the "Company") as of December 31, 2018, and the related consolidated income
statements, the consolidated statements of comprehensive income, the consolidated statements of changes in equity and the consolidated cash flow statements for each of the two years in the period ended December 31, 2018, and the
related notes (collectively referred to as the “financial statements”). In our opinion, the financial statements present fairly, in all material respects, the financial position of the Company
as of December 31, 2018, and the results of its operations and its cash flows for each of the two years in the period ended December 31, 2018, in conformity with International Financial Reporting Standards as issued by the
International Accounting Standards Board.
Basis for Opinion
These financial statements are the responsibility of the Company’s management. Our responsibility is to express an opinion on the Company’s financial statements based on our audits. We are a public
accounting firm registered with the PCAOB and are required to be independent with respect to the Company in accordance with the U.S. federal securities laws and the applicable rules and regulations of the Securities and Exchange
Commission and the PCAOB.
We conducted our audits in accordance with the standards of the PCAOB. Those standards require that we plan and perform the audit to obtain reasonable assurance about whether the financial statements
are free of material misstatement, whether due to error or fraud. Our audits included performing procedures to assess the risks of material misstatement of the financial statements, whether due to error or fraud, and performing
procedures that respond to those risks. Such procedures included examining, on a test basis, evidence regarding the amounts and disclosures in the financial statements. Our audits also included evaluating the accounting principles
used and significant estimates made by management, as well as evaluating the overall presentation of the financial statements. We believe that our audits provide a reasonable basis for our opinion.
/s/ Deloitte, S.L.
Madrid, Spain
February 26, 2019
We began serving as the Company’s auditor in 2014. In 2019, we became the predecessor auditor.
F-6
Amounts in thousands of U.S. dollars
|
As of December 31,
|
||||||||||||
|
Note (1)
|
2019
|
2018
|
||||||||||
|
Assets
|
||||||||||||
|
Non-current assets
|
||||||||||||
|
Contracted concessional assets
|
6
|
8,161,129
|
8,549,181
|
|||||||||
|
Investments carried under the equity method
|
7
|
139,925
|
53,419
|
|||||||||
|
Other receivables accounts
|
8
|
88,405
|
41,099
|
|||||||||
|
Derivative assets
|
8&9
|
3,182
|
11,571
|
|||||||||
|
Financial investments
|
8
|
91,587
|
52,670
|
|||||||||
|
Deferred tax assets
|
18
|
147,966
|
136,066
|
|||||||||
|
Total non-current assets
|
8,540,607
|
8,791,336
|
||||||||||
|
Current assets
|
||||||||||||
|
Inventories
|
20,268
|
18,924
|
||||||||||
|
Trade receivables
|
11
|
242,008
|
163,856
|
|||||||||
|
Credits and other receivables
|
11
|
75,560
|
72,539
|
|||||||||
|
Trade and other receivables
|
8&11
|
317,568
|
236,395
|
|||||||||
|
Financial investments
|
8
|
218,577
|
240,834
|
|||||||||
|
Cash and cash equivalents
|
8&12
|
562,795
|
631,542
|
|||||||||
|
Total current assets
|
1,119,208
|
1,127,695
|
||||||||||
|
Total assets
|
9,659,815
|
9,919,031
|
||||||||||
| (1) |
Notes 1 to 23 are an integral part of the consolidated financial statements
|
F-7
Consolidated statements of financial position as of December 31, 2019 and 2018
Amounts in thousands of U.S. dollars
|
As of December 31,
|
||||||||||||
|
Note (1)
|
2019
|
2018
|
||||||||||
|
Equity and liabilities
|
||||||||||||
|
Equity attributable to the Company
|
||||||||||||
|
Share capital
|
13
|
10,160
|
10,022
|
|||||||||
|
Parent company reserves
|
13
|
1,900,800
|
2,029,940
|
|||||||||
|
Other reserves
|
73,797
|
95,011
|
||||||||||
|
Accumulated currency translation differences
|
(90,824
|
)
|
(68,315
|
)
|
||||||||
|
Retained earnings
|
13
|
(385,457
|
)
|
(449,274
|
)
|
|||||||
|
Non-controlling interest
|
13
|
206,380
|
138,728
|
|||||||||
|
Total equity
|
1,714,856
|
1,756,112
|
||||||||||
|
Non-current liabilities
|
||||||||||||
|
Long-term corporate debt
|
14
|
695,085
|
415,168
|
|||||||||
|
Borrowings
|
3,351,780
|
4,081,093
|
||||||||||
|
Notes and bonds
|
718,129
|
745,566
|
||||||||||
|
Long-term project debt
|
15
|
4,069,909
|
4,826,659
|
|||||||||
|
Grants and other liabilities
|
16
|
1,641,752
|
1,658,126
|
|||||||||
|
Related parties
|
10
|
17,115
|
33,675
|
|||||||||
|
Derivative liabilities
|
9
|
298,744
|
279,152
|
|||||||||
|
Deferred tax liabilities
|
18
|
248,996
|
211,000
|
|||||||||
|
Total non-current liabilities
|
6,971,601
|
7,423,780
|
||||||||||
|
Current liabilities
|
||||||||||||
|
Short-term corporate debt
|
14
|
28,706
|
268,905
|
|||||||||
|
Borrowings
|
754,135
|
233,214
|
||||||||||
|
Notes and bonds
|
28,304
|
31,241
|
||||||||||
|
Short-term project debt
|
15
|
782,439
|
264,455
|
|||||||||
|
Trade payables and other current liabilities
|
17
|
128,062
|
192,033
|
|||||||||
|
Income and other tax payables
|
34,151
|
13,746
|
||||||||||
|
Total current liabilities
|
973,358
|
739,139
|
||||||||||
|
Total equity and liabilities
|
9,659,815
|
9,919,031
|
||||||||||
| (1) |
Notes 1 to 23 are an integral part of the consolidated financial statements
|
F-8
Amounts in thousands of U.S. dollars
|
Note (1)
|
For the year ended December 31,
|
|||||||||||||||
|
2019
|
2018
|
2017
|
||||||||||||||
|
Revenue
|
4
|
1,011,452
|
1,043,822
|
1,008,381
|
||||||||||||
|
Other operating income
|
20
|
93,774
|
132,557
|
80,844
|
||||||||||||
|
Employee benefit expenses
|
(32,246
|
)
|
(15,130
|
)
|
(18,854
|
)
|
||||||||||
|
Depreciation, amortization, and impairment charges
|
6
|
(310,755
|
)
|
(362,697
|
)
|
(310,960
|
)
|
|||||||||
|
Other operating expenses
|
20
|
(261,776
|
)
|
(310,642
|
)
|
(301,444
|
)
|
|||||||||
|
Operating profit
|
500,449
|
487,910
|
457,967
|
|||||||||||||
|
Financial income
|
21
|
4,121
|
36,444
|
1,007
|
||||||||||||
|
Financial expense
|
21
|
(407,990
|
)
|
(425,019
|
)
|
(463,717
|
)
|
|||||||||
|
Net exchange differences
|
2,674
|
1,597
|
(4,092
|
)
|
||||||||||||
|
Other financial income/(expense), net
|
21
|
(1,153
|
)
|
(8,235
|
)
|
18,434
|
||||||||||
|
Financial expense, net
|
(402,348
|
)
|
(395,213
|
)
|
(448,368
|
)
|
||||||||||
|
Share of profit/(loss) of associates carried under the equity method
|
7
|
7,457
|
5,231
|
5,351
|
||||||||||||
|
Profit/(loss) before income tax
|
105,558
|
97,928
|
14,950
|
|||||||||||||
|
Income tax
|
18
|
(30,950
|
)
|
(42,659
|
)
|
(119,837
|
)
|
|||||||||
|
Profit/(loss) for the year
|
74,608
|
55,269
|
(104,887
|
) |
||||||||||||
|
Loss/(profit) attributable to non-controlling interests
|
(12,473
|
)
|
(13,673
|
)
|
(6,917
|
)
|
||||||||||
|
Profit/(loss) for the year attributable to the Company
|
62,135
|
41,596
|
(111,804
|
)
|
||||||||||||
|
Weighted average number of ordinary shares outstanding (thousands)
|
22
|
101,063
|
100,217
|
100,217
|
||||||||||||
|
Basic and diluted earnings per share (U.S. dollar per share)
|
22
|
0.61
|
0.42
|
(1.12
|
)
|
|||||||||||
| (1) |
Notes 1 to 23 are an integral part of the consolidated financial statements
|
F-9
Consolidated statements of comprehensive income for the years ended December 31,
2019, 2018 and 2017
Amounts in thousands of U.S. dollars
|
For the year ended December 31,
|
||||||||||||||||
|
Note (1)
|
2019
|
2018
|
2017
|
|||||||||||||
|
Profit/(loss) for the year
|
74,608
|
55,269
|
(104,887
|
) |
||||||||||||
|
Items that may be subject to transfer to income statement
|
||||||||||||||||
|
Change in fair value of cash flow hedges
|
(81,713
|
)
|
(40,220
|
)
|
(28,535
|
)
|
||||||||||
|
Currency translation differences
|
(22,284
|
)
|
(57,628
|
)
|
121,924
|
|||||||||||
|
Tax effect
|
20,088
|
6,195
|
4,426
|
|||||||||||||
|
Net income/(expenses) recognized directly in equity
|
(83,909
|
)
|
(91,653
|
)
|
97,815
|
|||||||||||
|
Cash flow hedges
|
9
|
55,765
|
67,519
|
70,953
|
||||||||||||
|
Tax effect
|
(13,941
|
)
|
(16,880
|
)
|
(17,738
|
)
|
||||||||||
|
Transfers to income statement
|
41,824
|
50,639
|
53,215
|
|||||||||||||
|
Other comprehensive income/(loss)
|
(42,085
|
)
|
(41,014
|
)
|
151,030
|
|||||||||||
|
Total comprehensive income/(loss) for the year
|
32,523
|
14,255
|
46,143
|
|||||||||||||
|
Total comprehensive (income)/loss attributable to non-controlling interest
|
(12,429
|
)
|
(11,954
|
)
|
(14,773
|
)
|
||||||||||
|
Total comprehensive income/(loss) attributable to the Company
|
20,094
|
2,301
|
31,370
|
|||||||||||||
| (1) |
Notes 1 to 23 are an integral part of the consolidated financial statements
|
F-10
Amounts in thousands of U.S. dollars
|
Share
Capital
|
Parent
company
reserves
|
Other
reserves
|
Retained
earnings
|
Accumulated
currency
translation
differences
|
Total equity
attributable to
the Company
|
Non-
controlling
interest
|
Total equity
|
|||||||||||||||||||||||||
|
Balance as of January 1, 2017
|
10,022
|
2,268,457
|
52,797
|
(365,410
|
)
|
(133,150
|
)
|
1,832,716
|
126,395
|
1,959,111
|
||||||||||||||||||||||
|
Profit/(loss) for the year after taxes
|
-
|
-
|
-
|
(111,804
|
)
|
-
|
(111,804
|
)
|
6,917
|
(104,887
|
)
|
|||||||||||||||||||||
|
Change in fair value of cash flow hedges
|
-
|
-
|
41,242
|
-
|
-
|
41,242
|
1,176
|
42,418
|
||||||||||||||||||||||||
|
Currency translation differences
|
-
|
-
|
-
|
-
|
115,003
|
115,003
|
6,921
|
121,924
|
||||||||||||||||||||||||
|
Tax effect
|
-
|
-
|
(13,071
|
)
|
-
|
-
|
(13,071
|
)
|
(241
|
)
|
(13,312
|
)
|
||||||||||||||||||||
|
Other comprehensive income
|
-
|
-
|
28,171
|
-
|
115,003
|
143,174
|
7,856
|
151,030
|
||||||||||||||||||||||||
|
Total comprehensive income
|
-
|
-
|
28,171
|
(111,804
|
)
|
115,003
|
31,370
|
14,773
|
46,143
|
|||||||||||||||||||||||
|
Dividend distribution
|
-
|
(105,228
|
)
|
-
|
-
|
-
|
(105,228
|
)
|
(4,573
|
)
|
(109,801
|
)
|
||||||||||||||||||||
|
Balance as of December 31, 2017
|
10,022
|
2,163,229
|
80,968
|
(477,214
|
)
|
(18,147
|
)
|
1,758,858
|
136,595
|
1,895,453
|
||||||||||||||||||||||
F-11
|
Share
Capital
|
Parent
company
reserves
|
Other
reserves
|
Retained
earnings
|
Accumulated
currency
translation
differences
|
Total
equity
attributable
to the
Company
|
Non-
controlling
interest
|
Total
equity
|
|||||||||||||||||||||||||
|
Balance as of December 31, 2017
|
10,022
|
2,163,229
|
80,968
|
(477,214
|
)
|
(18,147
|
)
|
1,758,858
|
136,595
|
1,895,453
|
||||||||||||||||||||||
|
Application of new accounting standards (Effective January 1,2018)
|
-
|
-
|
1,326
|
(11,812
|
)
|
-
|
(10,486
|
)
|
-
|
(10,486
|
)
|
|||||||||||||||||||||
|
Balance as of January 1, 2018
|
10,022
|
2,163,229
|
82,294
|
(489,026
|
)
|
(18,147
|
)
|
1,748,372
|
136,595
|
1,884,967
|
||||||||||||||||||||||
|
Profit/(loss) for the year after taxes
|
-
|
-
|
-
|
41,596
|
-
|
41,596
|
13,673
|
55,269
|
||||||||||||||||||||||||
|
Change in fair value of cash flow hedges
|
-
|
-
|
21,474
|
(236
|
)
|
-
|
21,238
|
6,061
|
27,299
|
|||||||||||||||||||||||
|
Currency translation differences
|
-
|
-
|
-
|
-
|
(50,168
|
)
|
(50,168
|
)
|
(7,460
|
)
|
(57,628
|
)
|
||||||||||||||||||||
|
Tax effect
|
-
|
-
|
(8,757
|
)
|
(1,608
|
)
|
-
|
(10,365
|
)
|
(320
|
)
|
(10,685
|
)
|
|||||||||||||||||||
|
Other comprehensive income
|
-
|
-
|
12,717
|
(1,844
|
)
|
(50,168
|
)
|
(39,295
|
)
|
(1,719
|
)
|
(41,014
|
)
|
|||||||||||||||||||
|
Total comprehensive income
|
-
|
-
|
12,717
|
39,752
|
(50,168
|
)
|
2,301
|
11,954
|
14,255
|
|||||||||||||||||||||||
|
Dividend distribution
|
-
|
(133,289
|
)
|
-
|
-
|
-
|
(133,289
|
)
|
(9,821
|
)
|
(143,110
|
)
|
||||||||||||||||||||
|
Balance as of December 31, 2018
|
10,022
|
2,029,940
|
95,011
|
(449,274
|
)
|
(68,315
|
)
|
1,617,384
|
138,728
|
1,756,112
|
||||||||||||||||||||||
F-12
|
Share
Capital
|
Parent
company
reserves
|
Other
reserves
|
Retained
earnings
|
Accumulated
currency
translation
differences
|
Total
equity
attributable
to the
Company
|
Non-
controlling
interest
|
Total
equity
|
|||||||||||||||||||||||||
|
Balance as of January 1, 2019
|
10,022
|
2,029,940
|
95,011
|
(449,274
|
)
|
(68,315
|
)
|
1,617,384
|
138,728
|
1,756,112
|
||||||||||||||||||||||
|
Profit/(loss) for the year after taxes
|
-
|
-
|
-
|
62,135
|
-
|
62,135
|
12,473
|
74,608
|
||||||||||||||||||||||||
|
Change in fair value of cash flow hedges
|
-
|
-
|
(27,947
|
)
|
1,682
|
-
|
(26,265
|
)
|
317
|
(25,948
|
)
|
|||||||||||||||||||||
|
Currency translation differences
|
-
|
-
|
-
|
-
|
(22,509
|
)
|
(22,509
|
)
|
225
|
(22,284
|
)
|
|||||||||||||||||||||
|
Tax effect
|
-
|
-
|
6,733
|
-
|
-
|
6,733
|
(586
|
)
|
6,147
|
|||||||||||||||||||||||
|
Other comprehensive income
|
-
|
-
|
(21,214
|
)
|
1,682
|
(22,509
|
)
|
(42,041
|
)
|
(44
|
)
|
(42,085
|
)
|
|||||||||||||||||||
|
Total comprehensive income
|
-
|
-
|
(21,214
|
)
|
63,817
|
(22,509
|
)
|
20,094
|
12,429
|
32,523
|
||||||||||||||||||||||
|
Capital reduction
|
-
|
-
|
-
|
-
|
-
|
-
|
(2,688
|
)
|
(2,688
|
)
|
||||||||||||||||||||||
|
Capital increase (Note 13)
|
138
|
29,862
|
-
|
-
|
-
|
30,000
|
-
|
30,000
|
||||||||||||||||||||||||
|
Changes in the scope of consolidation (Note 5)
|
-
|
-
|
-
|
-
|
-
|
-
|
92,303
|
92,303
|
||||||||||||||||||||||||
|
Dividend distribution
|
-
|
(159,002
|
)
|
-
|
-
|
-
|
(159,002
|
)
|
(34,392
|
)
|
(193,394
|
)
|
||||||||||||||||||||
|
Balance as of December 31, 2019
|
10,160
|
1,900,800
|
73,797
|
(385,457
|
)
|
(90,824
|
)
|
1,508,476
|
206,380
|
1,714,856
|
||||||||||||||||||||||
Notes 1 to 23 are an integral part of the consolidated financial statements
F-13
Amounts in thousands of U.S. dollars
|
For the year ended
|
||||||||||||||||
|
Note (1)
|
2019
|
2018
|
2017
|
|||||||||||||
|
I. Profit/(loss) for the year
|
$
|
74,608
|
$
|
55,269
|
$
|
(104,887
|
)
|
|||||||||
|
Non-monetary adjustments
|
||||||||||||||||
|
Depreciation, amortization and impairment charges
|
6
|
310,755
|
362,697
|
310,960
|
||||||||||||
|
Financial (income)/expenses
|
405,634
|
396,411
|
443,517
|
|||||||||||||
|
Fair value (gains)/losses on derivative financial instruments
|
(613
|
)
|
399
|
759
|
||||||||||||
|
Shares of (profits)/losses from associates
|
(7,457
|
)
|
(5,231
|
)
|
(5,351
|
)
|
||||||||||
|
Income tax
|
18
|
30,950
|
42,659
|
119,837
|
||||||||||||
|
Changes in consolidation and other non-monetary items
|
(37,432
|
)
|
(99,280
|
)
|
(20,882
|
)
|
||||||||||
|
II. Profit for the year adjusted by non monetary items
|
$
|
776,445
|
$
|
752,924
|
$
|
743,953
|
||||||||||
|
Variations in working capital
|
||||||||||||||||
|
Inventories
|
(1,343
|
)
|
(1,991
|
)
|
(2,548
|
)
|
||||||||||
|
Trade and other receivables
|
(71,505
|
)
|
5,564
|
(23,799
|
)
|
|||||||||||
|
Trade payables and other current liabilities
|
(36,533
|
)
|
(4,898
|
)
|
22,474
|
|||||||||||
|
Financial investments and other current assets/liabilities
|
(3,970
|
)
|
(17,019
|
)
|
(4,924
|
)
|
||||||||||
|
III. Variations in working capital
|
$
|
(113,351
|
)
|
$
|
(18,344
|
)
|
$
|
(8,797
|
)
|
|||||||
|
Income tax received/(paid)
|
(23
|
)
|
(12,525
|
)
|
(4,779
|
)
|
||||||||||
|
Interest received
|
10,135
|
6,726
|
4,139
|
|||||||||||||
|
Interest paid
|
(309,625
|
)
|
(327,738
|
)
|
(348,893
|
)
|
||||||||||
|
A. Net cash provided by/(used in) operating activities
|
$
|
363,581
|
$
|
401,043
|
$
|
385,623
|
||||||||||
|
Investments in entities under the equity method
|
30,443
|
4,432
|
3,003
|
|||||||||||||
|
Investments in contracted concessional assets*
|
22,009
|
68,048
|
30,058
|
|||||||||||||
|
Other non-current assets/liabilities
|
2,703
|
(16,668
|
)
|
8,183
|
||||||||||||
|
(Acquisitions)/sales of subsidiaries and other financial instruments
|
(173,366
|
)
|
(70,672
|
)
|
30,124
|
|||||||||||
|
B. Net cash (used in)/provided by investing activities
|
$
|
(118,211
|
)
|
$
|
(14,860
|
)
|
$
|
71,368
|
||||||||
|
Proceeds from Project & Corporate debt
|
14&15
|
358,826
|
123,767
|
296,398
|
||||||||||||
|
Repayment of Project & Corporate debt
|
14&15
|
(603,070
|
)
|
(385,964
|
)
|
(613,242
|
)
|
|||||||||
|
Dividends paid to Company´s shareholders
|
(159,002
|
)
|
(133,289
|
)
|
(94,845
|
)
|
||||||||||
|
Dividends paid to Non-controlling interests
|
(29,239
|
)
|
(9,745
|
)
|
(4,638
|
)
|
||||||||||
|
Non-controlling interests capital contribution
|
92,303
|
-
|
-
|
|||||||||||||
|
Capital increase
|
30,000
|
-
|
-
|
|||||||||||||
|
C. Net cash provided by/(used in) financing activities
|
$
|
(310,182
|
)
|
$
|
(405,231
|
)
|
$
|
(416,327
|
)
|
|||||||
|
Net increase/(decrease) in cash and cash equivalents
|
$
|
(64,812
|
)
|
$
|
(19,048
|
)
|
$
|
40,664
|
||||||||
|
Cash and cash equivalents at beginning of the year
|
12
|
631,542
|
669,387
|
594,811
|
||||||||||||
|
Translation differences cash and cash equivalents
|
(3,935
|
)
|
(18,797
|
)
|
33,912
|
|||||||||||
|
Cash and cash equivalents at the end of the year
|
12
|
$
|
562,795
|
$
|
631,542
|
$
|
669,387
|
|||||||||
| * |
Includes proceeds for $22.2 million, $72.6 million and $42.5 million in 2019, 2018 and 2017 respectively (Note 6).
|
| (1) |
Notes 1 to 23 are an integral part of the consolidated financial statements
|
F-14
|
Note 1.- Nature of the business
|
F-11
|
|
Note 2.- Significant accounting policies
|
F-14
|
|
Note 3.- Financial risk management
|
F-25
|
|
Note 4.- Financial information by segment
|
F-24
|
|
Note 5.- Changes in the scope of the consolidated financial statements
|
F-29
|
|
Note 6.- Contracted concessional assets
|
F-31
|
|
Note 7.- Investments carried under the equity method
|
F-34
|
|
Note 8.- Financial instruments by category
|
F-35
|
|
Note 9.- Derivative financial instruments
|
F-36
|
|
Note 10.- Related parties
|
F-38
|
|
Note 11.- Clients and other receivables
|
F-39
|
|
Note 12.- Cash and cash equivalents
|
F-39
|
|
Note 13.- Equity
|
F-40
|
|
Note 14.- Corporate debt
|
F-40
|
|
Note 15.- Project debt
|
F-42
|
|
Note 16.- Grants and other liabilities
|
F-44
|
|
Note 17.-Trade payables and other current liabilities
|
F-45
|
|
Note 18.- Income tax
|
F-45
|
|
Note 19.- Commitments, third-party guarantees, contingent assets and liabilities
|
F-48
|
|
Note 20.- Other operating income and expenses
|
F-49
|
|
Note 21.- Financial income and expenses
|
F-50
|
|
Note 22.- Earnings per share
|
F-51
|
|
Note 23.- Other information
|
F-51
|
|
Appendices(1)
|
F-52
|
The Appendices are an integral part of the notes to the consolidated financial statements
F-15
Note 1.- Nature of the business
Atlantica Yield plc (“Atlantica” or the “Company”) was incorporated in England and Wales as a private limited company on December 17, 2013 under the name
Abengoa Yield Limited. On March 19, 2014, the Company was re-registered as a public limited company, under the name Abengoa Yield plc. On May 13, 2016, the change of the Company´s registered name to Atlantica Yield plc was filed with the
Registrar of Companies in the United Kingdom.
Atlantica is a sustainable total return infrastructure company that owns, manages and acquires renewable energy, efficient natural gas, electric transmission
lines and water assets focused on North America (the United States, Mexico and Canada), South America (Peru, Chile and Uruguay) and EMEA (Spain, Algeria and South Africa).
Atlantica’s shares began trading on the NASDAQ Global Select Market under the symbol “ABY” on June 13, 2014. The symbol changed to “AY” on November 11, 2017.
On March 9, 2018 and on November 27, 2018, Algonquin Power & Utilities (“Algonquin”) announced that it completed the acquisition from Abengoa S.A,
(“Abengoa”) of a 25% and 16.47% equity interest in Atlantica, respectively. Algonquin is the largest shareholder of the Company and currently owns a 44.2% stake in Atlantica. Algonquin’s shareholding in Atlantica may be increased up to a
48.5% without any change in corporate governance. Algonquin’s voting rights and rights to appoint directors are limited to a 41.5% and the additional 7% would vote replicating
non-Algonquin’s shareholders vote. Algonquin does not consolidate the Company in its consolidated financial statements.
During 2018, the Company closed the following acquisitions: a 100% stake in a 4 MW hydroelectric power plant in Peru (“Mini-Hydro”), a 5% stake in a natural
gas transportation in Mexico (Pemex Transportation System or “PTS”), a 100% stake in a 50 MW on-shore wind plant in Uruguay (“Melowind”), a 66kV transmission line in operation in Chile (“Chile TL3”) and a transmission line in Peru, which is
an expansion of ATN (“ATN Expansion 1”).
In January 2019, the Company entered into an agreement with Abengoa under the Abengoa ROFO Agreement for the acquisition of Befesa Agua Tenes, a holding
company which owns a 51% stake in Tenes, a water desalination plant in Algeria, similar in several aspects to Skikda and Honaine plants. The price agreed for the equity value was $24.5 million, of which $19.9 million were paid in January 2019
as an advanced payment. Closing of the acquisition was subject to conditions precedent, including approval by the Algerian administration. The conditions precedent set forth in the share purchase agreement were not fulfilled as of September
30, 2019. Therefore, in accordance with the terms of the share purchase agreement the advanced payment has been converted into a secured loan to be reimbursed by Befesa Agua Tenes, together with 12% per annum interest, through a full
cash-sweep of all the dividends generated to be received from the asset. These dividends would be guaranteed by a right of usufruct over the economic rights and certain political rights and a pledge over the shares of Befesa Agua Tenes,
granted by Abengoa to the Company. The share purchase agreement requires that the repayment occurs no later than September 30, 2031. In October 2019 the Company received a first payment of $7.8 million through the cash sweep mechanism.
On April 15, 2019, the Company entered into an agreement to acquire a 30% stake in Monterrey, a 142 MW gas-fired engine facility including 130 MW installed
capacity and 12 MW battery capacity (“Monterrey”). The acquisition was closed on August 2, 2019, after conditions precedent were fulfilled, and the Company paid $42 million for the total investment. The asset, located in Mexico, has been in
operation since 2018 and represents the first investment in electric batteries for the Company. It has a U.S. dollar-denominated 20-year PPA with two international large corporations engaged in the car manufacturing industry as well as a
20-year contract for the natural gas transportation with a U.S. energy company. The PPA also includes price escalation factors. The asset is the sole electricity supplier for the off-takers, it has no commodity risk and also has the
possibility to sell excess energy to the North-East region of the country. The Company also entered into a ROFO agreement with the seller of the shares for the remaining 70% stake in the asset.
On May 9, 2019, the Company entered into a partnership agreement with Algonquin, investing $4.9 million in the equity of a wind farm, Amherst Island, with a
75 MW installed capacity, owned and operated by Algonquin in Canada.
On August 2, 2019, the Company closed the acquisition of ASI Operations LLC (“ASI Ops”), the company that performs the operation and maintenance services to
Solana and Mojave plants. The consideration paid was $6 million.
F-16
On October 22, 2019, the Company closed the acquisition of ATN Expansion 2 from Enel Green Power Perú, for a total equity investment of approximately $20
million, controlling the asset from this date. Transfer of the concession agreement is pending authorization from the Ministry of Energy in Peru. If this authorization were not to be obtained within an eight-month period from the acquisition
date, the transaction would be reversed with no penalties to Atlantica. Enel Green Power Perú issued a bank guarantee to face this potential repayment obligation to Atlantica.
The following table provides an overview of the main concessional assets the Company owned or had an interest in as of December 31, 2019:
|
Assets
|
Type
|
Ownership
|
Location
|
Currency(8)
|
Capacity
(Gross)
|
Counterparty
Credit Ratings(9)
|
COD*
|
Contract
Years
Left(13)
|
|
Solana
|
Renewable
(Solar)
|
100%
Class B(1)
|
Arizona
(USA)
|
USD
|
280 MW
|
A-/A2/A-
|
2013
|
24
|
|
Mojave
|
Renewable
(Solar)
|
100%
|
California
(USA)
|
USD
|
280 MW
|
D/WR/WD
|
2014
|
20
|
|
Solaben 2 & 3
|
Renewable
(Solar)
|
70%(2)
|
Spain
|
Euro
|
2x50 MW
|
A/Baa1/A-
|
2012
|
18/17
|
|
Solacor 1 & 2
|
Renewable
(Solar)
|
87%(3)
|
Spain
|
Euro
|
2x50 MW
|
A/Baa1/A-
|
2012
|
17/17
|
|
PS10/PS20
|
Renewable
(Solar)
|
100%
|
Spain
|
Euro
|
31 MW
|
A/Baa1/A-
|
2007&
2009
|
12/14
|
|
Helioenergy 1 & 2
|
Renewable
(Solar)
|
100%
|
Spain
|
Euro
|
2x50 MW
|
A/Baa1/A-
|
2011
|
17/17
|
|
Helios 1 & 2
|
Renewable
(Solar)
|
100%
|
Spain
|
Euro
|
2x50 MW
|
A/Baa1/A-
|
2012
|
18/18
|
|
Solnova 1, 3 & 4
|
Renewable
(Solar)
|
100%
|
Spain
|
Euro
|
3x50 MW
|
A/Baa1/A-
|
2010
|
15/15/16
|
|
Solaben 1 & 6
|
Renewable
(Solar)
|
100%
|
Spain
|
Euro
|
2x50 MW
|
A/Baa1/A-
|
2013
|
19/19
|
|
Kaxu
|
Renewable
(Solar)
|
51%(4)
|
South
Africa
|
Rand
|
100 MW
|
BB/Baa3/
BB+(10)
|
2015
|
15
|
|
Palmatir
|
Renewable
(Wind)
|
100%
|
Uruguay
|
USD
|
50 MW
|
BBB/Baa2/BBB-(11)
|
2014
|
14
|
|
Cadonal
|
Renewable
(Wind)
|
100%
|
Uruguay
|
USD
|
50 MW
|
BBB/Baa2/BBB-(11)
|
2014
|
15
|
|
ACT
|
Efficient
natural gas
|
100%
|
Mexico
|
USD
|
300 MW
|
BBB+/ Baa3/BB+
|
2013
|
13
|
|
Monterrey
|
Efficient
natural gas
|
30%
|
Mexico
|
USD
|
142 MW
|
Not rated
|
2018
|
19
|
|
ATN (12)
|
Transmission
line
|
100%
|
Peru
|
USD
|
379 miles
|
BBB+/A3/BBB+
|
2011
|
21
|
F-17
|
ATS
|
Transmission
line
|
100%
|
Peru
|
USD
|
569 miles
|
BBB+/A3/BBB+
|
2014
|
24
|
|
ATN 2
|
Transmission
line
|
100%
|
Peru
|
USD
|
81 miles
|
Not rated
|
2015
|
13
|
|
Quadra 1
|
Transmission
line
|
100%
|
Chile
|
USD
|
49 miles
|
Not rated
|
2014
|
15
|
|
Quadra 2
|
Transmission
line
|
100%
|
Chile
|
USD
|
32 miles
|
Not rated
|
2014
|
15
|
|
Palmucho
|
Transmission
line
|
100%
|
Chile
|
USD
|
6 miles
|
BBB+/Baa2/
BBB+
|
2007
|
18
|
|
Chile TL3
|
Transmission
line
|
100%
|
Chile
|
USD
|
50 miles
|
A+/A1/A
|
1993
|
Regulated
|
|
Skikda
|
Water
|
34.2%(5)
|
Algeria
|
USD
|
3.5 M
ft3/day
|
Not rated
|
2009
|
14
|
|
Honaine
|
Water
|
25.5%(6)
|
Algeria
|
USD
|
7 M ft3/
day
|
Not rated
|
2012
|
18
|
|
Seville PV
|
Renewable
(Solar)
|
80%(7)
|
Spain
|
Euro
|
1 MW
|
A/Baa1/A-
|
2006
|
16
|
|
Melowind
|
Renewable
(Wind)
|
100%
|
Uruguay
|
USD
|
50MW
|
BBB/Baa2/BBB-
|
2015
|
16
|
|
Mini-Hydro
|
Renewable
(Hydraulic)
|
100%
|
Peru
|
USD
|
4 MW
|
BBB+/A3/BBB+
|
2012
|
13
|
| (1) |
On September 30, 2013, Liberty Interactive Corporation agreed to invest $300 million in Class A shares of ASO Holdings Company LLC, the holding company of Solana, in exchange for a share of the
dividends and the taxable losses generated by Solana.
|
| (2) |
Itochu Corporation, a Japanese trading company, holds 30% of the shares in each of Solaben 2 and Solaben 3.
|
| (3) |
JGC, a Japanese engineering company, holds 13% of the shares in each of Solacor 1 and Solacor 2.
|
| (4) |
Kaxu is owned by the Company (51%), Industrial Development Corporation of South Africa (29%) and Kaxu Community Trust (20%).
|
| (5) |
Algerian Energy Company, SPA owns 49% of Skikda and Sacyr Agua, S.L. owns the remaining 16.83%.
|
| (6) |
Algerian Energy Company, SPA owns 49% of Honaine and Sacyr Agua, S.L. owns the remaining 25.5%.
|
| (7) |
Instituto para la Diversificación y Ahorro de la Energía (“Idae”), a Spanish state owned company, holds 20% of the shares in Seville PV.
|
|
(8)
|
Certain contracts denominated in U.S. dollars are payable in local currency.
|
| (9) |
Reflects the counterparty’s credit ratings issued by Standard & Poor’s Ratings Services, or S&P, Moody’s Investors Service Inc., or Moody’s, and Fitch Ratings Ltd, or Fitch.
|
| (10) |
Refers to the credit rating of the Republic of South Africa. The off-taker is Eskom, which is a state-owned utility company in South Africa.
|
| (11) |
Refers to the credit rating of Uruguay, as UTE (Administración Nacional de Usinas y Transmisoras Eléctricas) is unrated.
|
| (12) |
Including the acquisition of ATN Expansion 1 & 2.
|
| (13) |
As of December 31, 2019.
|
| (*) |
Commercial Operation Date.
|
F-18
The project financing arrangement of Kaxu contains cross-default provisions related to Abengoa such that debt defaults by Abengoa, subject to certain
threshold amounts and/or a restructuring process, could trigger a default under the Kaxu project financing arrangement. In March 2017, Atlantica obtained a waiver in its Kaxu project financing arrangement which waives any potential
cross-defaults with Abengoa up to that date, but it does not cover potential future cross-default events. As of December 31, 2019, the Company is not aware of the existence of any cross-default events with Abengoa.
These consolidated financial statements were approved by the Board of Directors of the Company on February 26, 2020.
Note 2.- Significant accounting policies
2.1 Basis of preparation
These consolidated financial statements are presented in accordance with the International Financial Reporting Standards (“IFRS”) as issued by the
International Accounting Standards Board (“IASB”).
The consolidated financial statements are presented in U.S. dollars, which is the Company’s functional and presentation currency. Amounts included in these
consolidated financial statements are all expressed in thousands of U.S. dollars, unless otherwise indicated.
Application of new accounting standards
| a) |
Standards, interpretations and amendments effective from January 1, 2019 under IFRS-IASB, applied by the Company in the preparation of these consolidated financial statements:
|
| - |
IFRS 9 (Amendments to IFRS 9): Prepayment Features with Negative Compensation. This Standard is applicable for annual periods beginning on or after January 1, 2019 under IFRS-IASB, earlier
application is permitted.
|
| - |
IAS 19 (Amendments to IAS 19): Plan Amendment, Curtailment or Settlement. This amendment is mandatory for annual periods beginning on or after January 1, 2019 under IFRS-IASB, earlier application is
permitted.
|
| - |
IFRIC 23: Uncertainty over Income Tax Treatments. This Standard is applicable for annual periods beginning on or after January 1, 2019 under IFRS-IASB.
|
| - |
IAS 28 (Amendment). Long-term Interests in Associates and Joint Ventures. This amendment is mandatory for annual periods beginning on or after January 1, 2019 under IFRS-IASB, earlier application is
permitted.
|
| - |
Amendments resulting from Annual Improvements 2015–2017 Cycle (remeasurement of previously held interest). This amendment is mandatory for annual periods beginning on or after January 1, 2019 under
IFRS-IASB,
|
The applications of these amendments have not had any material impact on these consolidated financial statements.
| b) |
Standards, interpretations and amendments published by the IASB that will be effective for periods beginning on or after January 1, 2020:
|
F-19
| - |
IFRS 17 ‘Insurance Contracts’. This Standard is applicable for annual periods beginning on or after January 1, 2021 under IFRS-IASB, earlier application is permitted.
|
| - |
IFRS 3 (Amendment). Definition of Business. This amendment is mandatory for annual periods beginning on or after January 1, 2020 under IFRS-IASB, earlier application is permitted.
|
| - |
IAS 1 and IAS 8 (Amendment). Definition of Material. This amendment is mandatory for annual periods beginning on or after January 1, 2020 under IFRS-IASB, earlier application is permitted.
|
| - |
IAS 1 (Amendment). Classification of liabilities. This amendment is mandatory for annual periods beginning on or after January 1, 2022 under IFRS-IASB.
|
| - |
IFRS 7 and IFRS 9. Amendments regarding pre-replacement issues in the context of the IBOR reform. These amendments are mandatory for annual periods beginning on or after January 1, 2020 under
IFRS-IASB.
|
| - |
Amendments to References to the Conceptual Frameworks in IFRS Standards. This Standard is applicable for annual periods beginning on or after January 1, 2020 under IFRS-IASB.
|
The Company does not anticipate any significant impact on the consolidated financial statements derived from the application of the new standards and
amendments that will be effective for annual periods beginning on or after January 1, 2020, although it is currently still in the process of evaluating such application.
2.2. Principles to include and record companies in the consolidated financial statements
Companies included in these consolidated financial statements are accounted for as subsidiaries as long as Atlantica has had control over them and are
accounted for as investments under the equity method as long as Atlantica has had significant influence over them, in the periods presented.
| a) |
Controlled entities
|
Control is achieved when the Company:
| · |
Has power over the investee;
|
| · |
Is exposed, or has rights, to variable returns from its involvement with the investee; and
|
|
·
|
Has the ability to use its power to affect its returns.
|
The Company reassesses whether or not it controls an investee when facts and circumstances indicate that there are changes to one or more of the three
elements of control listed above.
The Company uses the acquisition method to account for business combinations of companies controlled by a third party. According to this method, identifiable
assets acquired and liabilities and contingent liabilities assumed in a business combination are measured initially at their fair values at the acquisition date. Any contingent consideration is recognized at fair value at the acquisition date
and subsequent changes in its fair value are recognized in accordance with IFRS 9 either in profit or loss or as a change to other comprehensive income. Acquisition related costs are expensed as incurred. The Company recognizes any
non-controlling interest in the acquiree either at fair value or at the non-controlling interest’s proportionate share of the acquirer’s net assets on an acquisition by acquisition basis.
All assets and liabilities between entities of the group, equity, income, expenses, and cash flows relating to transactions between entities of the group are
eliminated in full.
| b) |
Investments accounted for under the equity method
|
An associate is an entity over which the Company has significant influence. Significant influence is the power to participate in the financial and operating
policy decisions of the investee but is not control or joint control over those policies.
The results and assets and liabilities of associates are incorporated in these financial statements using the equity method of accounting. Under the equity method, an investment in an associate is initially
recognized in the statement of financial position at cost and adjusted thereafter to recognize the Company share of the profit or loss and other comprehensive income of the associate.
F-20
Controlled entities and associates included in these financial statements as of December 31, 2019 and 2018 are set out in appendices.
2.3. Contracted concessional assets and price purchase agreements
Contracted concessional assets and price purchase agreements (PPAs) include fixed assets financed through project debt, related to service concession
arrangements recorded in accordance with IFRIC 12, except for Palmucho, which is recorded in accordance with IFRS 16 and PS10, PS20, Mini-Hydro, Chile TL 3 and Seville PV, which are recorded as tangible assets in accordance with IAS 16. The
infrastructures accounted for by the Company as concessions are related to the activities concerning electric transmission lines, solar electricity generation plants, cogeneration plants, wind farms and water plants. The useful life of these
assets is approximately the same as the length of the concession arrangement. The infrastructure used in a concession can be classified as an intangible asset or a financial asset, depending on the nature of the payment entitlements
established in the agreement.
The application of IFRIC 12 requires extensive judgment in relation with, among other factors, (i) the identification of certain infrastructures and
contractual agreements in the scope of IFRIC 12, (ii) the understanding of the nature of the payments in order to determine the classification of the infrastructure as a financial asset or as an intangible asset and (iii) the timing and
recognition of the revenue from construction and concessionary activity.
Under the terms of contractual arrangements within the scope of this interpretation, the operator shall recognize and measure revenue in accordance with IFRS
15 for the services it performs.
| a) |
Intangible asset
|
The Company recognizes an intangible asset to the extent that it receives a right to charge final customers for the use of the infrastructure. This
intangible asset is subject to the provisions of IAS 38 and is amortized linearly, taking into account the estimated period of commercial operation of the infrastructure which coincides with the concession period.
Once the infrastructure is in operation, the treatment of income and expenses is as follows:
| · |
Revenues from the updated annual revenue for the contracted concession, as well as operations and maintenance services are recognized in each period according to IFRS 15 “Revenue from contracts with
Customers”.
|
| · |
Operating and maintenance costs and general overheads and administrative costs are recorded in accordance with the nature of the cost incurred (amount due) in each period.
|
| · |
Financing costs are expensed as incurred.
|
| b) |
Financial asset
|
The Company recognizes a financial asset when demand risk is assumed by the grantor, to the extent that the concession holder has an unconditional right to
receive payments for the asset. This asset is recognized at the fair value of the construction services provided, considering upgrade services in accordance with IFRS 15, if any.
The financial asset is subsequently recorded at amortized cost calculated according to the effective interest method. Revenue from operations and maintenance
services is recognized in each period according to IFRS 15 “Revenue from contracts with Customers”. The income from managing and operating the asset resulting from the valuation at amortized cost is also recorded in revenue.
Financing costs are expensed as incurred.
According to IFRS 9, Atlantica recognises an allowance for expected credit losses (ECLs) for all debt instruments not held at fair value through profit or
loss. ECLs are based on the difference between the contractual cash flows due in accordance with the contract and all the cash flows that the Company expects to receive.
F-21
There are two main approaches to applying the ECL model according to IFRS 9: the general approach which involves a three stage approach, and the simplified
approach, which can be applied to trade receivables, contract assets and lease receivables. Atlantica has elected to apply the simplified approach. Under this approach, there is no need to monitor for significant increases in credit risk and
entities will be required to measure lifetime expected credit losses at the end of each reporting period.
The key elements of the ECL calculations are the following:
| - |
the Probability of Default (“PD”) is an estimate of the likelihood of default over a given time horizon. Atlantica calculates PD based on Credit Default Swaps spreads (“CDS”);
|
| - |
the Exposure at Default (“EAD”) is an estimate of the exposure at a future default date;
|
| - |
the Loss Given Default (“LGD”) is an estimate of the loss arising in the case where a default occurs at a given time. It is based on the difference between the contractual cash flows due and those
that the Company would expect to receive. It is expressed as a percentage of the EAD.
|
| c) |
Property, plant and equipment
|
Property, plant and equipment includes property, plant and equipment of companies or project companies. Property, plant and equipment is measured at
historical cost, including all expenses directly attributable to the acquisition, less depreciation and impairment losses, with the exception of land, which is presented net of any impairment losses.
Once the infrastructure is in operation, the treatment of income and expenses is the same as the one described above for intangible asset.
|
d)
|
Right-of-use assets
|
Main right of use agreements correspond to land rights. The Company recognizes right-of-use assets at the commencement date of the lease (i.e., the date the underlying asset is available for use). Right-of-use
assets are measured at cost, less any accumulated depreciation and impairment losses, and adjusted for any remeasurement of lease liabilities. The cost of right-of-use assets includes the amount of lease liabilities recognised, initial
direct costs incurred, and lease payments made at or before the commencement date less any lease incentives received. Right-of-use assets are depreciated on a straight-line basis over the shorter of the lease term and the estimated useful
lives of the assets.
The right-of-use assets are also subject to assets impairment (Note 2.5).
2.4. Borrowing costs
Interest costs incurred in the construction of any qualifying asset are capitalized over the period required to complete and prepare the asset for its
intended use. A qualifying asset is an asset that necessarily takes a substantial period of time to get ready for its internal use or sale, which is considered to be more than one year. Remaining borrowing costs are expensed in the period in
which they are incurred.
2.5. Asset impairment
Atlantica reviews its contracted concessional assets to identify any indicators of impairment at least annually. When impairment indicators exist, the company calculates the
recoverable amount of the asset.
The recoverable amount of an asset is the higher of its fair value less costs to sell and its value in use, defined as the present value of the estimated
future cash flows to be generated by the asset. In the event that the asset does not generate cash flows independently of other assets, the Company calculates the recoverable amount of the Cash Generating Unit (‘CGU’) to which the asset
belongs.
When the carrying amount of the CGU to which these assets belong is higher than its recoverable amount, the assets are impaired.
Assumptions used to calculate value in use include a discount rate, growth rate and projections considering real data based in the contracts terms and
projected changes in both selling prices and costs. The discount rate is estimated by Management, to reflect both changes in the value of money over time and the risks associated with the specific CGU.
For contracted concessional assets, with a defined useful life and with a specific financial structure, cash flow projections until the end of the project
are considered and no terminal value is assumed.
Contracted concessional assets have a contractual structure that permits the Company to estimate quite accurately the costs of the project and revenue during
the life of the project.
F-22
Projections take into account real data based on the contract terms and fundamental assumptions based on specific reports prepared internally and supported
by specialists, assumptions on demand and assumptions on production. Additionally, assumptions on macro-economic conditions are taken into account, such as inflation rates, future interest rates, etc. and sensitivity analyses are performed
over all major assumptions which can have a significant impact in the value of the asset.
Cash flow projections of CGUs are calculated in the functional currency of those CGUs and are discounted using rates that take into consideration the risk
corresponding to each specific country and currency.
Taking into account that in most CGUs the specific financial structure is linked to the financial structure of the projects that are part of those CGUs, the
discount rate used to calculate the present value of cash-flow projections is based on the weighted average cost of capital (WACC) for the type of asset, adjusted, if necessary, in accordance with the business of the specific activity and
with the risk associated with the country where the project is performed.
In any case, sensitivity analyses are performed, especially in relation with the discount rate used and fair value changes in the main business variables, in
order to ensure that possible changes in the estimates of these items do not impact the recovery of recognized assets.
Accordingly, the following table provides a summary of the discount rates used (WACC) and growth rates to calculate the recoverable amount for CGUs with the
operating segment to which it pertains:
|
Operating segment
|
Discount rate
|
Growth rate
|
||||||
|
EMEA
|
4% - 6
|
%
|
0
|
%
|
||||
|
North America
|
4% - 5
|
%
|
0
|
%
|
||||
|
South America
|
5% - 7
|
%
|
0
|
%
|
||||
In the event that the recoverable amount of an asset is lower than its carrying amount, an impairment charge for the difference would be recorded in the
income statement under the item “Depreciation, amortization and impairment charges”.
Pursuant to IAS 36, an impairment loss is recognized by the Company if the carrying amount of these assets exceeds the present value of future cash flows
discounted at the initial effective interest rate.
2.6 Loans and accounts receivable
Loans and accounts receivable are non-derivative financial assets with fixed or determinable payments, not listed on an active market.
In accordance with IFRIC 12, certain assets under concessions qualify as financial assets and are recorded as is described in Note 2.3.
Pursuant to IFRS 9, an impairment loss is recognized if the carrying amount of these assets exceeds the present value of future cash flows discounted at the
initial effective interest rate.
Loans and accounts receivable are initially recognized at fair value plus transaction costs and are subsequently measured at amortized cost in accordance
with the effective interest rate method. Interest calculated using the effective interest rate method is recognized under other financial income within financial income.
2.7. Derivative financial instruments and hedging activities
Derivatives are recorded at fair value. The Company applies hedge accounting to all hedging derivatives that qualify to be accounted for as hedges under
IFRS-IASB.
When hedge accounting is applied, hedging strategy and risk management objectives are documented at inception, as well as the relationship between hedging
instruments and hedged items. Effectiveness of the hedging relationship needs to be assessed on an ongoing basis. Effectiveness tests are performed prospectively at inception and at each reporting date, following the dollar offset method.
F-23
Atlantica applies cash flow hedging. Under this method, the effective portion of changes in fair value of derivatives designated as cash flow hedges are
recorded temporarily in equity and are subsequently reclassified from equity to profit or loss in the same period or periods during which the hedged item affects profit or loss. Any ineffective portion of the hedged transaction is recorded in
the consolidated income statement as it occurs.
When interest rate options are designated as hedging instruments, the intrinsic value and time value of the financial hedge instrument are separated. Changes
in intrinsic and time value which are highly effective are recorded in equity and subsequently reclassified from equity to profit or loss in the same period or periods during which the hedged item affects profit or loss. Any ineffectiveness
is recorded as financial income or expense as it occurs.
When the hedging instrument matures or is sold, or when it no longer meets the requirements to apply hedge accounting, accumulated gains and losses recorded
in equity remain as such until the forecast transaction is ultimately recognized in the income statement. However, if it becomes unlikely that the forecast transaction will actually take place, the accumulated gains and losses in equity are
recognized immediately in the income statement.
2.8. Fair value estimates
Financial instruments measured at fair value are presented in accordance with the following level classification based on the nature of the inputs used for
the calculation of fair value:
| · |
Level 1: Inputs are quoted prices in active markets for identical assets or liabilities.
|
| · |
Level 2: Fair value is measured based on inputs other than quoted prices included within Level 1 that are observable for the asset or liability, either directly (i.e. as prices) or indirectly (i.e.
derived from prices).
|
| · |
Level 3: Fair value is measured based on unobservable inputs for the asset or liability.
|
In the event that prices cannot be observed, the management shall make its best estimate of the price that the market would otherwise establish based on
proprietary internal models which, in the majority of cases, use data based on observable market parameters as significant inputs (Level 2) but occasionally use market data that is not observed as significant inputs (Level 3). Different
techniques can be used to make this estimate, including extrapolation of observable market data. The best indication of the initial fair value of a financial instrument is the price of the transaction, except when the value of the instrument
can be obtained from other transactions carried out in the market with the same or similar instruments, or valued using a valuation technique in which the variables used only include observable market data, mainly interest rates. Differences
between the transaction price and the fair value based on valuation techniques that use data that is not observed in the market, are not initially recognized in the income statement.
Atlantica derivatives correspond primarily to the interest rate swaps designated as cash flow hedges, which are classified as Level 2.
Description of the valuation method
Interest rate swap valuations are made by valuing the swap part of the contract and valuing the credit risk. The methodology used by the market and applied
by Atlantica to value interest rate swaps is to discount the expected future cash flows according to the parameters of the contract. Variable interest rates, which are needed to estimate future cash flows, are calculated using the curve for
the corresponding currency and extracting the implicit rates for each of the reference dates in the contract. These estimated flows are discounted with the swap zero curve for the reference period of the contract.
The effect of the credit risk on the valuation of the interest rate swaps depends on the future settlement. If the settlement is favorable for the Company,
the counterparty credit spread will be incorporated to quantify the probability of default at maturity. If the expected settlement is negative for the Company, its own credit risk will be applied to the final settlement.
Classic models for valuing interest rate swaps use deterministic valuation of the future of variable rates, based on future outlooks. When quantifying credit
risk, this model is limited by considering only the risk for the current paying party, ignoring the fact that the derivative could change sign at maturity. A payer and receiver swaption model is proposed for these cases. This enables the
associated risk in each swap position to be reflected. Thus, the model shows each agent’s exposure, on each payment date, as the value of entering into the ‘tail’ of the swap, i.e. the live part of the swap.
F-24
Variables (Inputs)
Interest rate derivative valuation models use the corresponding interest rate curves for the relevant currency and underlying reference in order to estimate
the future cash flows and to discount them. Market prices for deposits, futures contracts and interest rate swaps are used to construct these curves. Interest rate options (caps and floors) also use the volatility of the reference interest
rate curve.
To estimate the credit risk of the counterparty, the credit default swap (CDS) spreads curve is obtained in the market for important individual issuers. For
less liquid issuers, the spreads curve is estimated using comparable CDSs or based on the country curve. To estimate proprietary credit risk, prices of debt issues in the market and CDSs for the sector and geographic location are used.
The fair value of the financial instruments that results from the aforementioned internal models takes into account, among other factors, the terms and
conditions of the contracts and observable market data, such as interest rates, credit risk and volatility. The valuation models do not include significant levels of subjectivity, since these methodologies can be adjusted and calibrated, as
appropriate, using the internal calculation of fair value and subsequently compared to the corresponding actively traded price. However, valuation adjustments may be necessary when the listed market prices are not available for comparison
purposes.
2.9. Trade and other receivables
Trade and other receivables are amounts due from customers for sales in the normal course of business. They are recognized initially at fair value and
subsequently measured at amortized cost using the effective interest rate method, less allowance for doubtful accounts. Trade receivables due in less than one year are carried at their face value at both initial recognition and subsequent
measurement, provided that the effect of not discounting flows is not significant.
An allowance for doubtful accounts is recorded when there is objective evidence that the Company will not be able to recover all amounts due as per the
original terms of the receivables. The Company has established a provision matrix that is based on its historical credit loss experience, adjusted for forward-looking factors specific to the debtors and the economic environment.
2.10. Cash and cash equivalents
Cash and cash equivalents include cash in hand, cash in bank and other highly-liquid current investments with an original maturity of three months or less
which are held for the purpose of meeting short-term cash commitments.
2.11. Grants
Grants are recognized at fair value when it is considered that there is a reasonable assurance that the grant will be received and that the necessary
qualifying conditions, as agreed with the entity assigning the grant, will be adequately complied with.
Grants are recorded as liabilities in the consolidated statement of financial position and are recognized in “Other operating income” in the consolidated
income statement based on the period necessary to match them with the costs they intend to compensate.
In addition, as described in Note 2.12 below, grants correspond also to loans with interest rates below market rates, for the initial difference between the
fair value of the loan and the proceeds received.
2.12. Loans and borrowings
Loans and borrowings are initially recognized at fair value, net of transaction costs incurred. Borrowings are subsequently measured at amortized cost and
any difference between the proceeds initially received (net of transaction costs incurred in obtaining such proceeds) and the repayment value is recognized in the consolidated income statement over the duration of the borrowing using the
effective interest rate method.
F-25
Loans with interest rates below market rates are initially recognized at fair value in liabilities and the difference between proceeds received from the loan
and its fair value is initially recorded within “Grants and Other liabilities” in the consolidated statement of financial position, and subsequently recorded in “Other operating income” in the consolidated income statement when the costs
financed with the loan are expensed.
Lease liabilities are recognized by the Company at the commencement date of the lease at the present value of lease payments to be made over the lease term. The
lease payments include the exercise price of a purchase option reasonably certain to be exercised by the Company and payments of penalties for terminating the lease, if the lease term reflects the Company exercising the option to terminate.
In calculating the present value of lease payments, the Company uses its incremental borrowing rate at the lease commencement date considering that the interest rate implicit in the lease is not readily determinable.
2.13. Bonds and notes
The Company initially recognizes ordinary notes at fair value, net of issuance costs incurred. Subsequently, notes are measured at amortized cost until
settlement upon maturity. Any other difference between the proceeds obtained (net of transaction costs) and the redemption value is recognized in the consolidated income statement over the term of the debt using the effective interest rate
method.
2.14. Income taxes
Current income tax expense is calculated on the basis of the tax laws in force as of the date of the consolidated statement of financial position in the
countries in which the subsidiaries and associates operate and generate taxable income.
Deferred income tax is calculated in accordance with the liability method, based upon the temporary differences arising between the carrying amount of assets
and liabilities and their tax base. Deferred income tax is determined using tax rates and regulations which are expected to apply at the time when the deferred tax is realized.
Deferred tax assets are recognized only when it is probable that sufficient future taxable profit will be available to use deferred tax assets.
2.15. Trade payables and other liabilities
Trade payables are obligations arising from purchases of goods and services in the ordinary course of business and are recognized initially at fair value and
are subsequently measured at their amortized cost using the effective interest method. Other liabilities are obligations not arising in the normal course of business and which are not treated as financing transactions. Advances received from
customers are recognized as “Trade payables and other current liabilities”.
2.16. Foreign currency transactions
The consolidated financial statements are presented in U.S. dollars, which is Atlantica’s functional and presentation currency. Financial statements of each
subsidiary within the Company are measured in the currency of the principal economic environment in which the subsidiary operates, which is the subsidiary’s functional currency.
Transactions denominated in a currency different from the subsidiary’s functional currency are translated into the subsidiary’s functional currency applying
the exchange rates in force at the time of the transactions. Foreign currency gains and losses that result from the settlement of these transactions and the translation of monetary assets and liabilities denominated in foreign currency at the
year-end rates are recognized in the consolidated income statement, unless they are deferred in equity, as occurs with cash flow hedges and net investment in foreign operations hedges.
Assets and liabilities of subsidiaries with a functional currency different from the Company’s reporting currency are translated to U.S. dollars at the
exchange rate in force at the closing date of the financial statements. Income and expenses are translated into U.S. dollars using the average annual exchange rate, which does not differ significantly from using the exchange rates of the
dates of each transaction. The difference between equity translated at the historical exchange rate and the net financial position that results from translating the assets and liabilities at the closing rate is recorded in equity under the
heading “Accumulated currency translation differences”.
Results of companies carried under the equity method are translated at the average annual exchange rate.
2.17. Equity
The Company has recyclable balances in its equity, corresponding mainly to hedge reserves and translation differences arising from currency conversion in the
preparation of these consolidated financial statements. These balances have been presented separately in Equity.
F-26
Non-controlling interest represents interest from other partners in entities included in these consolidated financial statements which are not fully owned by
Atlantica as of the dates presented.
Parent company reserves together with the Share capital represent the Parent’s net investment in the entities included in these consolidated financial
statements.
2.18. Provisions and contingencies
Provisions are recognized when:
| · |
there is a present obligation, either legal or constructive, as a result of past events;
|
| · |
it is more likely than not that there will be a future outflow of resources to settle the obligation; and
|
| · |
the amount has been reliably estimated.
|
Provisions are initially measured at the present value of the expected outflows required to settle the obligation and subsequently valued at amortized cost
following the effective interest method. The balance of provisions disclosed in the Notes reflects management’s best estimate of the potential exposure as of the date of preparation of the consolidated financial statements.
Contingent liabilities are possible obligations, existing obligations with low probability of a future outflow of economic resources and existing obligations
where the future outflow cannot be reliably estimated. Contingences are not recognized in the consolidated statements of financial position unless they have been acquired in a business combination.
Some companies included in the group have dismantling provisions, which are intended to cover future expenditures related to the dismantlement of the plants
and it will be likely to be settled with an outflow of resources in the long term (over 5 years).
Such provisions are accrued when the obligation for dismantling, removing and restoring the site on which the plant is located, is incurred, which is usually
during the construction period. The provision is measured in accordance with IAS 37, “Provisions, Contingent Liabilities and Contingent Assets” and is recorded as a liability under the heading “Grants and other liabilities” of the Financial
Statements, and the corresponding entry as part of the cost of the plant under the heading “Contracted concessional assets.”
2.19. Use of estimates
Some of the accounting policies applied require the application of significant judgment by management to select the appropriate assumptions to determine
these estimates. These assumptions and estimates are based on the historical experience, advice from experienced consultants, forecasts and other circumstances and expectations as of the close of the financial period. The assessment is
considered in relation to the global economic situation of the industries and regions where the Company operates, taking into account future development of the businesses of the Company. By their nature, these judgments are subject to an
inherent degree of uncertainty; therefore, actual results could materially differ from the estimates and assumptions used. In such cases, the carrying values of assets and liabilities are adjusted.
The most critical accounting policies, which reflect significant management estimates and judgment to determine amounts in these consolidated financial
statements, are as follows:
| · |
Contracted concessional agreements and PPAs.
|
| · |
Impairment of intangible assets and property, plant and equipment.
|
| · |
Assessment of control.
|
| · |
Derivative financial instruments and fair value estimates.
|
| · |
Income taxes and recoverable amount of deferred tax assets.
|
F-27
As of the date of preparation of these consolidated financial statements, no relevant changes in the estimates made are anticipated and, therefore, no
significant changes in the value of the assets and liabilities recognized at December 31, 2019, are expected.
Although these estimates and assumptions are being made using all available facts and circumstances, it is possible that future events may require management
to amend such estimates and assumptions in future periods. Changes in accounting estimates are recognized prospectively, in accordance with IAS 8, in the consolidated income statement of the year in which the change occurs.
Note 3.- Financial risk management
Atlantica’s activities are exposed to various financial risks: market risk (including currency risk and interest rate risk), credit risk and liquidity risk.
Risk is managed by the Company’s Risk Finance and Compliance Departments, which are responsible for identifying and evaluating financial risks quantifying them by project, region and company, in accordance with mandatory internal management
rules. Written internal policies exist for global risk management, as well as for specific areas of risk. In addition, there are official written management regulations regarding key controls and control procedures for each company and the
implementation of these controls is monitored through internal audit procedures.
| a) |
Market risk
|
The Company is exposed to market risk, such as movement in foreign exchange rates and interest rates. All of these market risks arise in the normal course of
business and the Company does not carry out speculative operations. For the purpose of managing these risks, the Company uses a series of interest rate swaps and options, and currency options. None of the derivative contracts signed has an
unlimited loss exposure.
| - |
Interest rate risk
|
Interest rate risk arises when the Company’s activities are exposed to changes in interest rates, which arises from financial liabilities at variable
interest rates. The main interest rate exposure for the Company relates to the variable interest rate with reference to the Libor and Euribor. To minimize the interest rate risk, the Company primarily uses interest rate swaps and interest
rate options (caps), which, in exchange for a fee, offer protection against an increase in interest rates. The Company does not use derivatives for speculative purposes.
As a result, the notional amounts hedged, strikes contracted and maturities, depending on the characteristics of the debt on which the interest rate risk is
being hedged, are very diverse, including the following:
| o |
Project debt in Euros: the Company hedges between 81% and 100% of the notional amount, maturities until 2030 and average guaranteed strike interest rates of between 0.89%% and 4.87%.
|
| o |
Project debt in U.S. dollars: the Company hedges between 70% and 100% of the notional amount, including maturities until 2034 and average guaranteed strike interest rates of between 1.98% and 5.27%.
|
In connection with the interest rate derivative positions of the Company, the most significant impacts on these consolidated financial statements are derived
from the changes in EURIBOR or LIBOR, which represent the reference interest rate for most of the debt of the Company. In the event that Euribor and Libor had risen by 25 basis points as of December 31, 2019, with the rest of the variables
remaining constant, the effect in the consolidated income statement would have been a loss of $2,745 thousand (a loss of $2,731 thousand in 2018 and a loss of $1,066 thousand in 2017) and an increase in hedging reserves of $27,570 thousand
($32,928 thousand in 2018 and $39,142 thousand in 2017). The increase in hedging reserves would be mainly due to an increase in the fair value of interest rate swaps designated as hedges.
A breakdown of the interest rates derivatives as of December 31, 2019 and 2018, is provided in Note 9.
| - |
Currency risk
|
The main cash flows in the entities included in these consolidated financial statements are cash collections arising from long-term contracts with clients and debt payments
arising from project finance repayment. Given that financing of the projects is always closed in the same currency in which the contract with client is signed, a natural hedge exists for the main operations of the Company.
F-28
In addition, the Company policy is to contract currency options with leading financial institutions, which guarantee a minimum Euro-U.S. dollar exchange rate
on the net distributions expected from Spanish solar assets. The net Euro exposure is 100% covered for the coming 12 months and 75% for the following 12 months on a rolling basis.
| b) |
Credit risk
|
The Company considers that it has a limited credit risk with clients as revenues derive from power purchase agreements with electric utilities and
state-owned entities. On January 29, 2019, PG&E, the off-taker for Atlantica with respect to the Mojave plant, filed for reorganization under Chapter 11 of the Bankruptcy Code in the U.S. Bankruptcy Court for the Northern District of
California (the “Bankruptcy Court”). As a consequence, PG&E did not pay the portion of the invoice corresponding to the electricity delivered for the period between January 1 and January 28, 2019, which was due on February 25, given that
the services relate to the pre-petition period and any payment therefore would require approval by the Bankruptcy Court. However, PG&E has paid all invoices corresponding to the electricity delivered after January 28 and has continued to
be in compliance with the remaining terms and conditions of the PPA.
| c) |
Liquidity risk
|
Atlantica’s liquidity and financing policy is intended to ensure that the Company maintains sufficient funds to meet our financial obligations as they fall
due.
Project finance borrowing permits the Company to finance the project through project debt and thereby insulate the rest of its assets from such credit
exposure. The Company incurs in project-finance debt on a project-by-project basis.
The repayment profile of each project is established on the basis of the projected cash flow generation of the business. This ensures that sufficient
financing is available to meet deadlines and maturities, which mitigates the liquidity risk significantly.
Note 4.- Financial information by segment
Atlantica’s segment structure reflects how management currently makes financial decisions and allocates resources. Its operating and reportable segments are
based on the following geographies where the contracted concessional assets are located:
| · |
North America
|
| · |
South America
|
| · |
EMEA
|
Based on the type of business, as of December 31, 2019 the Company had the following business sectors:
Renewable energy: Renewable energy assets include two solar plants in the United States, Solana and Mojave, each with
a gross capacity of 280 MW and located in Arizona and California, respectively. The Company owns eight solar platforms in Spain: Solacor 1 and 2 with a gross capacity of 100 MW, PS10 and PS20 with a gross capacity of 31 MW, Solaben 2 and 3
with a gross capacity of 100 MW, Helioenergy 1 and 2 with a gross capacity of 100 MW, Helios 1 and 2 with a gross capacity of 100 MW, Solnova 1, 3 and 4 with a gross capacity of 150 MW, Solaben 1 and 6 with a gross capacity of 100 MW and
Seville PV with a gross capacity of 1 MW. The Company also owns a solar plant in South Africa, Kaxu with a gross capacity of 100 MW. Additionally, the Company owns three wind farms in Uruguay, Palmatir, Cadonal and Melowind, with a gross
capacity of 50 MW each, and a hydroelectric power plant in Peru with a gross capacity of 4 MW.
Efficient natural gas: Efficient natural gas assets include (i) ACT, a 300 MW cogeneration plant in Mexico, which is
party to a 20-year take-or-pay contract with Pemex for the sale of electric power and steam, and (ii) a minority interest in Monterrey, a 142 MW gas-fired engine facility including 130 MW installed capacity and 12 MW battery capacity.
F-29
Electric transmission lines: Electric transmission assets include (i) three lines in Peru, ATN, ATS and ATN2, spanning a
total of 1,029 miles; and (ii) four lines in Chile, Quadra 1, Quadra 2, Palmucho and Chile TL3, spanning a total of 137 miles.
Water: Water assets include a minority interest in two desalination plants in Algeria, Honaine and Skikda with an
aggregate capacity of 10.5 M ft3 per day.
Atlantica’s Chief Operating Decision Maker (CODM) assesses the performance and assignment of resources according to the identified operating segments. The
CODM considers the revenues as a measure of the business activity and the Further Adjusted EBITDA as a measure of the performance of each segment. Further Adjusted EBITDA is calculated as profit/(loss) for the period attributable to the
parent company, after adding back loss/(profit) attributable to non-controlling interests from continued operations, income tax, share of profit/(loss) of associates carried under the equity method, finance expense net, depreciation,
amortization and impairment charges of entities included in these consolidated financial statements, and compensations received from Abengoa in lieu of Abengoa Concessões Brasil Holding (“ACBH”) dividends (for the period up to the first
quarter of 2017 only).
In order to assess performance of the business, the CODM receives reports of each reportable segment using revenues and Further Adjusted EBITDA. Net interest
expense evolution is assessed on a consolidated basis. Financial expense and amortization are not taken into consideration by the CODM for the allocation of resources.
In the years ended December 31, 2019 and December 31, 2018 Atlantica had four customers with revenues representing more than 10% of the total revenues, three
in the renewable energy and one in the efficient natural gas business sectors.
| a) |
The following tables show Revenues and Further Adjusted EBITDA by operating segments and business sectors for the years 2019, 2018 and 2017:
|
|
Revenue
|
Further Adjusted EBITDA
|
|||||||||||||||||||||||
|
For the year ended December 31,
|
For the year ended December 31,
|
|||||||||||||||||||||||
|
Geography
|
2019
|
2018
|
2017
|
2019
|
2018
|
2017
|
||||||||||||||||||
|
North America
|
$
|
332,965
|
$
|
357,177
|
$
|
332,705
|
$
|
305,085
|
$
|
308,748
|
$
|
282,328
|
||||||||||||
|
South America
|
142,207
|
123,214
|
120,797
|
115,346
|
100,234
|
108,766
|
||||||||||||||||||
|
EMEA
|
536,280
|
563,431
|
554,879
|
390,774
|
441,625
|
388,216
|
||||||||||||||||||
|
Total
|
$
|
1,011,452
|
$
|
1,043,822
|
$
|
1,008,381
|
$
|
811,204
|
$
|
850,607
|
$
|
779,310
|
||||||||||||
|
Revenue
|
Further Adjusted EBITDA
|
|||||||||||||||||||||||
|
For the year ended December 31,
|
For the year ended December 31,
|
|||||||||||||||||||||||
|
Business sectors
|
2019
|
2018
|
2017
|
2019
|
2018
|
2017
|
||||||||||||||||||
|
Renewable energy
|
$
|
761,090
|
$
|
793,557
|
$
|
767,226
|
$
|
603,666
|
$
|
664,428
|
$
|
569,193
|
||||||||||||
|
Efficient natural gas
|
122,281
|
130,799
|
119,784
|
107,457
|
93,858
|
106,140
|
||||||||||||||||||
|
Electric transmission lines
|
103,453
|
95,998
|
95,096
|
85,657
|
78,461
|
87,695
|
||||||||||||||||||
|
Water
|
24,629
|
23,468
|
26,275
|
14,424
|
13,860
|
16,282
|
||||||||||||||||||
|
Total
|
$
|
1,011,452
|
$
|
1,043,822
|
$
|
1,008,381
|
$
|
811,204
|
$
|
850,607
|
$
|
779,310
|
||||||||||||
The reconciliation of segment Further Adjusted EBITDA with the profit/(loss) attributable to the parent company is as follows:
|
For the year ended December 31,
|
||||||||||||
|
2019
|
2018
|
2017
|
||||||||||
|
Profit/(Loss) attributable to the Company
|
$
|
62,135
|
$
|
41,596
|
$
|
(111,804
|
)
|
|||||
|
Profit attributable to non-controlling interests
|
12,473
|
13,673
|
6,917
|
|||||||||
|
Income tax
|
30,950
|
42,659
|
119,837
|
|||||||||
|
Share of profits/(losses) of associates
|
(7,457
|
)
|
(5,231
|
)
|
(5,351
|
)
|
||||||
|
Dividend from exchangeable preferred equity investment in ACBH (Note 21)
|
-
|
-
|
10,383
|
|||||||||
|
Financial expense, net
|
402,348
|
395,213
|
448,368
|
|||||||||
|
Depreciation, amortization, and impairment charges
|
310,755
|
362,697
|
310,960
|
|||||||||
|
Total segment Further Adjusted EBITDA
|
$
|
811,204
|
$
|
850,607
|
$
|
779,310
|
||||||
F-30
| b) |
The assets and liabilities by operating segments (and business sector) at the end of 2019 and 2018 are as follows:
|
Assets and liabilities by geography as of December 31, 2019:
|
North
America
|
South America
|
EMEA
|
Balance as of
December 31,
2019
|
|||||||||||||
|
Assets allocated
|
||||||||||||||||
|
Contracted concessional assets
|
3,299,198
|
1,186,552
|
3,675,379
|
8,161,129
|
||||||||||||
|
Investments carried under the equity method
|
90,847
|
-
|
49,078
|
139,925
|
||||||||||||
|
Current financial investments
|
159,267
|
29,190
|
20,673
|
209,131
|
||||||||||||
|
Cash and cash equivalents (project companies)
|
181,458
|
80,909
|
234,097
|
496,464
|
||||||||||||
|
Subtotal allocated
|
3,730,771
|
1,296,652
|
3,979,227
|
9,006,649
|
||||||||||||
|
Unallocated assets
|
||||||||||||||||
|
Other non-current assets
|
239,553
|
|||||||||||||||
|
Other current assets (including cash and cash equivalents at holding company level)
|
413,613
|
|||||||||||||||
|
Subtotal unallocated
|
653,166
|
|||||||||||||||
|
Total assets
|
9,659,815
|
|||||||||||||||
|
North
America
|
South America
|
EMEA
|
Balance as of
December 31,
2019
|
|||||||||||||
|
Liabilities allocated
|
||||||||||||||||
|
Long-term and short-term project debt
|
1,676,251
|
884,835
|
2,291,262
|
4,852,348
|
||||||||||||
|
Grants and other liabilities
|
1,490,679
|
12,864
|
138,209
|
1,641,752
|
||||||||||||
|
Subtotal allocated
|
3,166,930
|
897,699
|
2,429,471
|
6,494,100
|
||||||||||||
|
Unallocated liabilities
|
||||||||||||||||
|
Long-term and short-term corporate debt
|
723,791
|
|||||||||||||||
|
Other non-current liabilities
|
564,855
|
|||||||||||||||
|
Other current liabilities
|
162,213
|
|||||||||||||||
|
Subtotal unallocated
|
1,450,859
|
|||||||||||||||
|
Total liabilities
|
7,944,959
|
|||||||||||||||
|
Equity unallocated
|
1,714,856
|
|||||||||||||||
|
Total liabilities and equity unallocated
|
3,165,715
|
|||||||||||||||
|
Total liabilities and equity
|
9,659,815
|
|||||||||||||||
Assets and liabilities by geography as of December 31, 2018:
|
North
America
|
South America
|
EMEA
|
Balance as of
December 31,
2018
|
|||||||||||||
|
Assets allocated
|
||||||||||||||||
|
Contracted concessional assets
|
3,453,652
|
1,210,624
|
3,884,905
|
8,549,181
|
||||||||||||
|
Investments carried under the equity method
|
-
|
-
|
53,419
|
53,419
|
||||||||||||
|
Current financial investments
|
147,213
|
61,959
|
30,080
|
239,252
|
||||||||||||
|
Cash and cash equivalents (project companies)
|
195,678
|
41,316
|
287,456
|
524,450
|
||||||||||||
|
Subtotal allocated
|
3,796,543
|
1,313,899
|
4,255,860
|
9,366,302
|
||||||||||||
|
Unallocated assets
|
||||||||||||||||
|
Other non-current assets
|
188,736
|
|||||||||||||||
|
Other current assets (including cash and cash equivalents at holding company level)
|
363,993
|
|||||||||||||||
|
Subtotal unallocated
|
552,729
|
|||||||||||||||
|
Total assets
|
9,919,031
|
|||||||||||||||
F-31
|
North
America
|
South America
|
EMEA
|
Balance as of
December 31,
2018
|
|||||||||||||
|
Liabilities allocated
|
||||||||||||||||
|
Long-term and short-term project debt
|
1,725,961
|
900,801
|
2,464,352
|
5,091,114
|
||||||||||||
|
Grants and other liabilities
|
1,527,724
|
7,550
|
122,852
|
1,658,126
|
||||||||||||
|
Subtotal allocated
|
3,253,685
|
908,351
|
2,587,204
|
6,749,240
|
||||||||||||
|
Unallocated liabilities
|
||||||||||||||||
|
Long-term and short-term corporate debt
|
684,073
|
|||||||||||||||
|
Other non-current liabilities
|
523,827
|
|||||||||||||||
|
Other current liabilities
|
205,779
|
|||||||||||||||
|
Subtotal unallocated
|
1,413,679
|
|||||||||||||||
|
Total liabilities
|
8,162,919
|
|||||||||||||||
|
Equity unallocated
|
1,756,112
|
|||||||||||||||
|
Total liabilities and equity unallocated
|
3,169,791
|
|||||||||||||||
|
Total liabilities and equity
|
9,919,031
|
|||||||||||||||
Assets and liabilities by business sectors as of December 31, 2019:
|
Renewable
energy
|
Efficient
natural
gas
|
Electric
transmission
lines
|
Water
|
Balance as
of
December
31,
2019
|
||||||||||||||||
|
Assets allocated
|
||||||||||||||||||||
|
Contracted concessional assets
|
6,644,024
|
559,069
|
872,757
|
85,280
|
8,161,129
|
|||||||||||||||
|
Investments carried under the equity method
|
77,549
|
17,154
|
-
|
45,222
|
139,925
|
|||||||||||||||
|
Current financial investments
|
13,798
|
148,723
|
28,237
|
18,373
|
209,131
|
|||||||||||||||
|
Cash and cash equivalents (project companies)
|
421,198
|
11,850
|
53,868
|
9,548
|
496,464
|
|||||||||||||||
|
Subtotal allocated
|
7,156,568
|
736,796
|
954,862
|
158,423
|
9,006,649
|
|||||||||||||||
|
Unallocated assets
|
||||||||||||||||||||
|
Other non-current assets
|
239,553
|
|||||||||||||||||||
|
Other current assets (including cash and cash equivalents at holding company level)
|
413,613
|
|||||||||||||||||||
|
Subtotal unallocated
|
653,166
|
|||||||||||||||||||
|
Total assets
|
9,659,815
|
|||||||||||||||||||
F-32
|
Renewable
energy
|
Efficient
natural gas
|
Electric
transmission
lines
|
Water
|
Balance as of
December 31,
2019
|
||||||||||||||||
|
Liabilities allocated
|
||||||||||||||||||||
|
Long-term and short-term project debt
|
3,658,507
|
529,350
|
640,160
|
24,331
|
4,852,348
|
|||||||||||||||
|
Grants and other liabilities
|
1,634,361
|
146
|
6,517
|
728
|
1,641,752
|
|||||||||||||||
|
Subtotal allocated
|
5,292,868
|
529,495
|
646,677
|
25,059
|
6,494,100
|
|||||||||||||||
|
Unallocated liabilities
|
||||||||||||||||||||
|
Long-term and short-term corporate debt
|
723,791
|
|||||||||||||||||||
|
Other non-current liabilities
|
564,855
|
|||||||||||||||||||
|
Other current liabilities
|
162,213
|
|||||||||||||||||||
|
Subtotal unallocated
|
1,450,859
|
|||||||||||||||||||
|
Total liabilities
|
7,944,959
|
|||||||||||||||||||
|
Equity unallocated
|
1,714,856
|
|||||||||||||||||||
|
Total liabilities and equity unallocated
|
3,165,715
|
|||||||||||||||||||
|
Total liabilities and equity
|
9,659,815
|
|||||||||||||||||||
Assets and liabilities by business sectors as of December 31, 2018:
|
Renewable
energy
|
Efficient
natural
gas
|
Electric
transmission
lines
|
Water
|
Balance as
of
December
31,
2018
|
||||||||||||||||
|
Assets allocated
|
||||||||||||||||||||
|
Contracted concessional assets
|
6,998,020
|
580,997
|
882,980
|
87,184
|
8,549,181
|
|||||||||||||||
|
Investments carried under the equity method
|
10,257
|
-
|
-
|
43,162
|
53,419
|
|||||||||||||||
|
Current financial investments
|
15,396
|
147,192
|
61,102
|
15,562
|
239,252
|
|||||||||||||||
|
Cash and cash equivalents (project companies)
|
453,096
|
45,625
|
14,043
|
11,686
|
524,450
|
|||||||||||||||
|
Subtotal allocated
|
7,476,769
|
773,814
|
958,125
|
157,594
|
9,366,302
|
|||||||||||||||
|
Unallocated assets
|
||||||||||||||||||||
|
Other non-current assets
|
188,736
|
|||||||||||||||||||
|
Other current assets (including cash and cash equivalents at holding company level)
|
363,993
|
|||||||||||||||||||
|
Subtotal unallocated
|
552,729
|
|||||||||||||||||||
|
Total assets
|
9,919,031
|
|||||||||||||||||||
F-33
|
Renewable
energy
|
Efficient
natural gas
|
Electric
transmission
lines
|
Water
|
Balance as of
December 31,
2018
|
||||||||||||||||
|
Liabilities allocated
|
||||||||||||||||||||
|
Long-term and short-term project debt
|
3,868,626
|
545,123
|
647,820
|
29,545
|
5,091,114
|
|||||||||||||||
|
Grants and other liabilities
|
1,656,146
|
161
|
1,025
|
794
|
1,658,126
|
|||||||||||||||
|
Subtotal allocated
|
5,524,772
|
545,284
|
648,845
|
30,339
|
6,749,240
|
|||||||||||||||
|
Unallocated liabilities
|
||||||||||||||||||||
|
Long-term and short-term corporate debt
|
684,073
|
|||||||||||||||||||
|
Other non-current liabilities
|
523,827
|
|||||||||||||||||||
|
Other current liabilities
|
205,779
|
|||||||||||||||||||
|
Subtotal unallocated
|
1,413,679
|
|||||||||||||||||||
|
Total liabilities
|
8,162,919
|
|||||||||||||||||||
|
Equity unallocated
|
1,756,112
|
|||||||||||||||||||
|
Total liabilities and equity unallocated
|
3,169,791
|
|||||||||||||||||||
|
Total liabilities and equity
|
9,919,031
|
|||||||||||||||||||
| c) |
The amount of depreciation, amortization and impairment charges recognized for the years ended December 31, 2019, 2018 and 2017 are as follows:
|
|
For the year ended December 31,
|
||||||||||||
|
Depreciation, amortization and impairment by geography
|
2019
|
2018
|
2017
|
|||||||||
|
North America
|
(116,232
|
)
|
(166,046
|
)
|
(123,726
|
)
|
||||||
|
South America
|
(47,844
|
)
|
(42,368
|
)
|
(40,880
|
)
|
||||||
|
EMEA
|
(146,679
|
)
|
(154,283
|
)
|
(146,354
|
)
|
||||||
|
Total
|
(310,755
|
)
|
(362,697
|
)
|
(310,960
|
)
|
||||||
|
For the year ended December 31,
|
||||||||||||
|
Depreciation, amortization and impairment by business sectors
|
2019
|
2018
|
2017
|
|||||||||
|
Renewable energy
|
(286,907
|
)
|
(323,538
|
)
|
(282,376
|
)
|
||||||
|
Electric transmission lines
|
(27,490
|
)
|
(28,925
|
)
|
(28,584
|
)
|
||||||
|
Efficient natural gas
|
3,102
|
(10,334
|
)
|
-
|
||||||||
|
Water
|
541
|
100
|
-
|
|||||||||
|
Total
|
(310,755
|
)
|
(362,697
|
)
|
(310,960
|
)
|
||||||
Note 5.- Changes in the scope of the consolidated financial statements
For the year ended December 31, 2019
On May 24, 2019, Atlantica and Algonquin formed Atlantica Yield Energy Solutions Canada Inc. (“AYES Canada”), a vehicle to channel co-investment
opportunities in which Atlantica holds the majority of voting rights. The first investment was in Amherst Island, a 75 MW wind plant in Canada owned by the project company Windlectric, Inc. (“Windlectric”). Atlantica invested $4.9 million and
Algonquin invested $92.3 million, both through AYES Canada, which in turn invested those funds in Amherst Island Partnership (“AIP”), the holding company of Windlectric. Atlantica accounts for the investment in AIP and ultimately Windlectric
under the equity method as per IAS 28, Investments in Associates and Joint Ventures. Since Atlantica has control over AYES Canada under IFRS 10 “Consolidated Financial Statements”, its consolidated financial statements initially showed a
total investment in the Amherst Island project of $97.2 million, accounted for as “Investments carried under the equity method” (Note 7) and Algonquin’s portion of that investment of $92.3 million as “Non-controlling interest”.
F-34
On August 2, 2019, the Company closed the acquisition of a 30% stake in Monterrey, a 142 MW gas-fired engine facility with batteries. The total investment
amounted to $42 million, out of which $17 million is an equity investment, and the rest is a shareholder loan classified as financial investments in these consolidated financial statements. The acquisition has been accounted for in the
consolidated accounts of Atlantica, in accordance with IAS 28, Investments in Associates.
On August 2, 2019, the Company closed the acquisition of a 100% stake in ASI Operations LLC (“ASI Ops”), the company that performs the operation and
maintenance services for the Solana and Mojave plants. The total equity investment amounted to $6 million. The acquisition has been accounted for in the consolidated financial statements of Atlantica, in accordance with IFRS 3, Business
Combinations.
On October 22, 2019, the Company closed the acquisition of ATN Expansion 2 from Enel Green Power Peru, for a total equity investment of $20 million,
controlling the asset from this date. Transfer of the concession agreement is pending authorization from the Ministry of Energy in Peru. If this authorization were not to be obtained within an eight-month period from the acquisition date, the
transaction would be reversed with no penalties to Atlantica. Enel Green Power Peru issued a bank guarantee to face this potential repayment obligation to Atlantica. The purchase has been accounted for in the consolidated accounts of
Atlantica, in accordance with IFRS 3, Business Combinations.
Impact of changes in the scope in the consolidated financial statements
The amount of assets and liabilities integrated at the effective acquisition date for the aggregated change in scope is shown in the following table:
|
Asset Acquisition
for the year ended December 31, 2019
|
||||
|
Concessional assets (Note 6)
|
28,738
|
|||
|
Investments carried under the equity method (Note 7)
|
113,897
|
|||
|
Other non-current assets
|
25,342
|
|||
|
Current assets
|
1,503
|
|||
|
Deferred tax liabilities (Note 18)
|
(2,539
|
)
|
||
|
Other current and non-current liabilities
|
(1,512
|
)
|
||
|
Non-controlling interests
|
(92,303
|
)
|
||
|
Asset acquisition - purchase price
|
(73,126
|
)
|
||
|
Net result of the asset acquisition
|
-
|
|||
The allocation of the purchase prices is provisional as of December 31, 2019 for some of the acquisitions. As such, the amounts indicated may be adjusted
during the measurement period to reflect new information obtained about facts and circumstances that existed at the acquisition date that, if known, would have affected the amounts recognized as of December 31, 2019. The measurement period
will not exceed one year from the acquisition dates.
The amount of revenue contributed by the acquisitions performed during 2019 to the consolidated financial statements of the Company for the year 2019 is $0.3
million, and the amount of profit after tax is $0.5 million. Had the acquisitions been consolidated from January 1, 2019, the consolidated statement of comprehensive income would have included additional revenue of $2.3 million and additional
loss after tax of $2.4 million.
For the year ended December 31, 2018
On February 28, 2018, the Company completed the acquisition of a 100% stake in Hidrocañete, S.A. (Mini-Hydro). Total purchase price for this asset amounted
to $9.3 million. The purchase was accounted for in the consolidated accounts of Atlantica, in accordance with IFRS 3, Business Combinations.
On October 10, 2018, the Company completed the acquisition of a 5% stake in Gas CA-KU-A1, S.A.P.I de C.V. (Pemex Transportation System or “PTS”). The
purchase was accounted for in the consolidated accounts of Atlantica, in accordance with IAS 28, Investments in Associates. Consideration for the initial 5% will amount to approximately $7 million and will be disbursed progressively. The
project is expected to enter operation in the first half of 2020.
F-35
On December 11, 2018, the Company completed the acquisition of a transmission line in Chile (Chile TL3). The total purchase price for this asset amounted to
$6.0 million. The purchase was accounted for in the consolidated accounts of Atlantica, in accordance with IFRS 3, Business Combinations.
On December 13, 2018, the Company completed the acquisition of a 100% stake in Estrellada, S.A. (Melowind). Total purchase price for this asset amounted to
$45.3 million. The purchase was accounted for in the consolidated accounts of Atlantica, in accordance with IFRS 3, Business Combinations.
On December 28, 2018, the Company completed the acquisition of a power substation and two small transmission lines in Peru, being an expansion of the ATN
transmission line (“ATN Expansion 1”). Total purchase price for this asset amounted to $16.0 million. The purchase was accounted for in the consolidated accounts of Atlantica, in accordance with IFRS 3, Business Combinations.
Impact of changes in the scope in the consolidated financial statements
The amount of assets and liabilities integrated at the effective acquisition date for the aggregated change in scope is shown in the following table:
|
Asset Acquisition
for the year ended December 31, 2018
|
||||
|
Concessional assets (Note 6)
|
155,909
|
|||
|
Investments carried under the equity method (Note 7)
|
1
|
|||
|
Current assets
|
5,646
|
|||
|
Project debt long term (Note 15)
|
(79,016
|
)
|
||
|
Deferred tax liabilities (Note 18)
|
(590
|
)
|
||
|
Project debt short term (Note 15)
|
(2,346
|
)
|
||
|
Other current and non-current liabilities
|
(3,000
|
)
|
||
|
Asset acquisition - purchase price
|
(76,604
|
)
|
||
|
Net result of the asset acquisition
|
-
|
|||
The allocation of the purchase prices was provisional as of December 31, 2018 for some of the acquisitions that were made effective near to year end. No
significant adjustments were made in 2019 to the amounts indicated in the table above during the measurement period (one year from the acquisition dates).
The amount of revenue contributed by the acquisitions performed during 2018 to the consolidated financial statements of the Company for the year 2018 was
$1.8 million, and the amount of loss after tax was $0.3 million. Had the acquisitions been consolidated from January 1, 2018, the consolidated statement of comprehensive income would have included additional revenue of $13.3 million and
additional loss after tax of $0.7 million.
Note 6.- Contracted concessional assets
Contracted concessional assets include fixed assets financed through project debt, related to service concession arrangements recorded in accordance with
IFRIC 12, except for Palmucho, which is recorded in accordance with IFRS 16, and PS10, PS20, Seville PV, Mini-Hydro and Chile TL3 which are recorded as property plant and equipment in accordance with IAS 16. Concessional assets recorded in
accordance with IFRIC 12 are either intangible or financial assets. As of December 31, 2019, contracted concessional financial assets amount to $819,146 thousand ($843,291 thousand as of December 31, 2018).
F-36
For further details on the application of IFRIC 12 to projects, see Appendix III.
| a) |
The following table shows the movements of contracted concessional assets included in the heading “Contracted Concessional assets” for 2019:
|
|
Cost
|
||||
|
Total as of January 1, 2019
|
10,475,828
|
|||
|
Additions
|
1,431
|
|||
|
Subtractions
|
(23,186
|
)
|
||
|
Change in the scope of the consolidated financial statements (Note 5)
|
28,738
|
|||
|
Translation differences
|
(81,941
|
)
|
||
|
Reclassification and other movements
|
(16,273
|
)
|
||
|
Total as of December 31, 2019
|
10,384,597
|
|||
|
Accumulated amortization
|
||||
|
Total as of January 1, 2019
|
(1,926,647
|
)
|
||
|
Additions
|
(310,755
|
)
|
||
|
Translation differences
|
15,778
|
|||
|
Reclassification and other movements
|
(1,844
|
)
|
||
|
Total accum. amort. as of December 31, 2019
|
(2,223,468
|
)
|
||
|
Net balance at December 31, 2019
|
8,161,129
|
|||
During 2019, contracted concessional assets decreased primarily due to the effect of the depreciation of the Euro against the U.S. dollar for the year ended
December 31, 2019 compared to the year ended December 31, 2018 and to the amortization charge for the year.
Other relevant movements in the cost of contracted concessional assets are an increase for the acquisition of new concessional assets (see Note 5), offset by
a decrease for the payments received from Abengoa by Solana in January, June and December 2019 further to Abengoa´s obligation as EPC Contractor for a total amount of $22.2 million (Note 15).
The decrease included in “Reclassification and other movements” is mainly due to the reclassification from the long to the short term of the current portion
of the contracted concessional financial assets.
Rights of use, as a result of applying IFRS 16, Leases, amounts to $54.0 million as of December 31, 2019 ($57.5 million at December 31, 2018). The decrease is
mainly due to the amortization for the year.
The Company has not identified any triggering event of impairment for its contracted concessional assets, and consequently, no losses from impairment of
contracted concessional assets were recorded during the year ended December 31, 2019. Likewise, during 2019, and as part of the triggering event analysis, Solana impairment test was updated, confirming the conclusions reached.
| b) |
The following table shows the movements of contracted concessional assets included in the heading “Contracted Concessional assets” for 2018:
|
|
Cost
|
||||
|
Total as of January 1, 2018
|
10,633,769
|
|||
|
Additions
|
10,463
|
|||
|
Application of IFRS 16 – Leases effective January 1, 2018
|
62,982
|
|||
|
Subtractions
|
(92,814
|
)
|
||
|
Change in the scope of the consolidated financial statements (Note 5)
|
170,040
|
|||
|
Translation differences
|
(280,680
|
)
|
||
|
Reclassification and other movements
|
(27,932
|
)
|
||
|
Total as of December 31, 2018
|
10,475,828
|
|||
F-37
|
Accumulated amortization
|
||||
|
Total as of January 1, 2018
|
(1,549,499
|
)
|
||
|
Application of IFRS9 - Expected Credit Losses effective January 1, 2018
|
(53,048
|
)
|
||
|
Additions
|
(362,697
|
)
|
||
|
Change in the scope of the consolidated financial statements (Note 5)
|
(14,131
|
)
|
||
|
Translation differences
|
52,728
|
|||
|
Total accum. amort. as of December 31, 2018
|
(1,926,647
|
)
|
||
|
Net balance at December 31, 2018
|
8,549,181
|
|||
During 2018, contracted concessional assets decreased primarily due to the effect of the depreciation of the Euro against the U.S. dollar for the year ended
December 31, 2019 compared to the year ended December 31, 2018 and to the amortization charge for the year.
Other relevant movements in the cost of contracted concessional assets are an increase for the acquisition of new concessional assets (see Note 5), the
impact of the application of IFRS 16, ´Leases´ from January 1, 2018, partially offset by a decrease for the payments received from Abengoa by Solana in March and December 2018 further to Abengoa´s obligation as EPC Contractor.
Amortization and impairment amount includes the recognition of impairment provisions based on expected credit losses due to the application of IFRS 9,
´Financial instruments´ from January 1, 2018.
The decrease included in “Reclassification and other movements” was mainly due to the reclassification from the long to the short term of the current portion
of the contracted concessional financial assets.
Considering the lower production compared with the run-rate production expected for Solana due to the technical issues experienced since COD in the asset and
the uncertainty around level of production in the future, the Company identified a triggering event of impairment during the year 2018 in compliance with IAS 36, Impairment of Assets. As a result, an impairment test has been performed
resulting in the recording of an impairment loss of $42,721 thousand as of December 31, 2018.
The impairment had been recorded within the line “Depreciation, amortization and impairment charges” of the consolidated income statement, decreasing the
amount of “Contracted concessional assets” pertaining to the Renewable energy sector and North America geography. The recoverable amount considered was the value in use and amounted to $1,141,209 thousand for Solana, as of December 31, 2018.
A specific discount rate had been used in each year considering changes in the debt/equity leverage ratio over the useful life of this project, resulting in the use of a range of discount rates between 5.0% and 5.8%.
An adverse change in the key assumptions which are individually used for the valuation could lead to future impairment recognition; specifically, a 5%
decrease in generation over the entire remaining useful life (PPA) of the project would have generated an additional impairment of approximately $72 million. An increase of 50 basis points in the discount rate would have lead to an additional
impairment of approximately $50 million.
In addition, the Company identified a triggering event of impairment for Mojave as a result of the negative credit outlooks of Pacific Gas and Electric
Company, the off-taker of the plant, as of December 31, 2018. This project was within the Renewable energy sector and North America geography. The Company therefore performed an impairment test as of December 31, 2018, which resulted in the
recoverable amount (value in use) exceeding the carrying amount of the asset by 10%. To determine the value in use of the asset, a specific discount rate had been used in each year considering changes in the debt/equity leverage ratio over
the useful life of this project, resulting in the use of a range of discount rates between 4.6% and 5.8%.
An adverse change in the key assumptions which are individually used for the valuation would not have lead to future impairment recognition; neither in case
of a 5% decrease in generation over the entire remaining useful life (PPA) of the project nor in case of an increase of 50 basis points in the discount rate.
F-38
Note 7.- Investments carried under the equity method
The table below shows the breakdown and the movement of the investments held in associates for 2019 and 2018:
|
Investments in associates
|
2019
|
2018
|
||||||
|
Initial balance
|
53,419
|
55,784
|
||||||
|
Share of (loss)/profit
|
7,457
|
5,231
|
||||||
|
Dividend distribution
|
(30,528
|
)
|
(4,463
|
)
|
||||
|
Equity distribution
|
(6,252
|
)
|
(122
|
)
|
||||
|
Change in the scope of the consolidated financial statements (Note 5)
|
113,897
|
-
|
||||||
|
Others (incl. currency translation differences)
|
1,932
|
(3,011
|
)
|
|||||
|
Final balance
|
139,925
|
53,419
|
||||||
During 2019, investments carried under the equity method increase primarily due to the acquisition of Amherst Island ($97.2 million) and Monterrey ($16.6
million) (see Note 5). The increase has been partially offset by the dividend distributions of Amherst Island Partnership ($25.9 million) and Geida Tlemcen S.L.($4.6 million).
The tables below show a breakdown of stand-alone amounts of assets, revenues and profit and loss as well as other information of interest for the years 2019
and 2018 for the associated companies:
|
Company
|
%
Shares
|
Non-
current
assets
|
Current
assets
|
Non-
current
liabilities
|
Current
liabilities
|
Revenue
|
Operating
profit/
(loss)
|
Net
profit/
(loss)
|
Investment
under the
equity
method
|
|||||||||||||||||||||||||||
|
Evacuación Valdecaballeros, S.L.
|
57.16
|
18,584
|
1,268
|
13,145
|
783
|
694
|
(277
|
)
|
(303
|
)
|
2,348
|
|||||||||||||||||||||||||
|
Myah Bahr Honaine, S.P.A.(*)
|
25.50
|
184,332
|
63,148
|
71,614
|
13,562
|
51,504
|
33,372
|
30,186
|
45,222
|
|||||||||||||||||||||||||||
|
Pectonex, R.F. Proprietary Limited
|
50.00
|
3,074
|
-
|
-
|
2
|
-
|
(190
|
)
|
(190
|
)
|
1,391
|
|||||||||||||||||||||||||
|
Evacuación Villanueva del Rey, S.L
|
40.02
|
2,946
|
107
|
1,841
|
225
|
-
|
47
|
-
|
-
|
|||||||||||||||||||||||||||
|
Ca Ku A1, S.A.P.I de CV (PTS)
|
5.00
|
486,179
|
55,423
|
-
|
543,077
|
-
|
(39
|
)
|
(495
|
)
|
-
|
|||||||||||||||||||||||||
|
Pemcorp SAPI de CV (**)
|
30.00
|
125,301
|
72,669
|
197,324
|
5,090
|
32,302
|
5,737
|
(10.073
|
)
|
17,179
|
||||||||||||||||||||||||||
|
ABY Infraestructuras S.L.U.
|
20.00
|
-
|
59
|
-
|
-
|
-
|
(104
|
)
|
(101
|
)
|
11
|
|||||||||||||||||||||||||
|
Windlectric Inc (***)
|
30.00
|
319,041
|
10,655
|
232,938
|
22,424
|
24,867
|
11,125
|
(6,537
|
)
|
73,693
|
||||||||||||||||||||||||||
|
Other renewable energy joint ventures (****)
|
50.00
|
47
|
146
|
6
|
70
|
-
|
(46
|
)
|
(46
|
)
|
81
|
|||||||||||||||||||||||||
|
As of December 31, 2019
|
139,925
|
|||||||||||||||||||||||||||||||||||
F-39
|
Company
|
%
Shares
|
Non-
current
assets
|
Current
assets
|
Non-
current
liabilities
|
Current
liabilities
|
Revenue
|
Operating
profit/
(loss)
|
Net
profit/
(loss)
|
Investment
under the
equity
method
|
|||||||||||||||||||||||||||
|
Evacuación Valdecaballeros, S.L.
|
57.16
|
19,679
|
820
|
381
|
420
|
320
|
(668
|
)
|
(693
|
)
|
8,773
|
|||||||||||||||||||||||||
|
Myah Bahr Honaine, S.P.A.(*)
|
25.50
|
186,484
|
63,224
|
81,942
|
13,184
|
50,118
|
25,778
|
22,193
|
43,161
|
|||||||||||||||||||||||||||
|
Pectonex, R.F. Proprietary Limited
|
50.00
|
3,186
|
-
|
-
|
2
|
-
|
(209
|
)
|
(209
|
)
|
1,485
|
|||||||||||||||||||||||||
|
Evacuación Villanueva del Rey, S.L
|
40.02
|
3,190
|
257
|
2,021
|
383
|
-
|
44
|
-
|
-
|
|||||||||||||||||||||||||||
|
Ca Ku A1, S.A.P.I de CV (PTS)
|
5.00
|
284,375
|
10,951
|
-
|
295,865
|
-
|
3
|
(624
|
)
|
-
|
||||||||||||||||||||||||||
|
As of December 31, 2018
|
53,419
|
|||||||||||||||||||||||||||||||||||
The Company has no control over Evacuación Valdecaballeros, S.L. as all relevant decisions of this company require the approval of a minimum of shareholders
accounting for more than 75% of the shares.
None of the associated companies referred to above is a listed company.
(*) Myah Bahr Honaine, S.P.A., the project entity, is 51% owned by Geida Tlemcen, S.L. which is accounted for using the equity method in these consolidated
financial statements. Share of profit of Myah Bahr Honaine S.P.A. included in these consolidated financial statements amounts to $7,697 thousand in 2019 and $5,659 thousand in 2018.
(**) Pemcorp SAPI de CV, Monterrey´s project entity, is 100% owned by Arroyo Netherlands II B.V. which is accounted for under the equity method in these
consolidated financial statements (Note 5). Arroyo Netherlands II B.V. is 30% owned by Atlantica. Share of profit of Pemcorp SAPI de CV included in these consolidated financial statements amounts to $521 thousand in 2019.
(***) Windlectric Inc., the project entity, is owned 100% by Amherst Island Partnership which is accounted for under the equity method (Note 5).
(****) Other renewable energy joint ventures correspond to investments made in the following entities located in Colombia: AC Renovables Sol 1 SAS Esp, PA
Renovables Sol 1 SAS Esp, SJ Renovables Sun 1 SAS Esp and SJ Renovables Wind 1 SAS Esp.
Note 8.- Financial instruments by category
Financial instruments are primarily deposits, derivatives, trade and other receivables and loans. Financial instruments by category (current and
non-current), reconciled with the statement of financial position as of December 31, 2019 and 2018 are as follows:
|
Notes
|
Amortized cost
|
Fair Value
Through Other
Comprehensive
Income
|
Fair value
Through
profit or loss
|
Balance as of
December 31,
2019
|
||||||||||||||||
|
Derivative assets
|
9
|
-
|
-
|
5,230
|
5,230
|
|||||||||||||||
|
Investment in Ten West Link
|
-
|
9,874
|
-
|
9,874
|
||||||||||||||||
|
Investment in Rioglass
|
-
|
-
|
7,000
|
7,000
|
||||||||||||||||
|
Other financial investments
|
288,060
|
-
|
-
|
288,060
|
||||||||||||||||
|
Trade and other receivables
|
11
|
317,568
|
-
|
-
|
317,568
|
|||||||||||||||
|
Cash and cash equivalents
|
12
|
562,795
|
-
|
-
|
562,795
|
|||||||||||||||
|
Total financial assets
|
1,168,423
|
9,874
|
12,230
|
1,190,527
|
||||||||||||||||
|
Corporate debt
|
14
|
723,791
|
-
|
-
|
723,791
|
|||||||||||||||
|
Project debt
|
15
|
4,852,348
|
-
|
-
|
4,852,348
|
|||||||||||||||
|
Related parties – non-current
|
10
|
17,115
|
-
|
-
|
17,115
|
|||||||||||||||
|
Trade and other current liabilities
|
17
|
128,062
|
-
|
-
|
128,062
|
|||||||||||||||
|
Derivative liabilities
|
9
|
-
|
-
|
298,744
|
298,744
|
|||||||||||||||
|
Total financial liabilities
|
5,721,316
|
-
|
298,744
|
6,020,060
|
||||||||||||||||
F-40
|
Notes
|
Amortized cost
|
Fair Value
Through Other
Comprehensive
Income
|
Fair value
Through
profit or loss
|
Balance as of
December 31,
2018
|
||||||||||||||||
|
Derivative assets
|
9
|
-
|
-
|
13,153
|
13,153
|
|||||||||||||||
|
Investment in Ten West Link
|
-
|
6,034
|
-
|
6,034
|
||||||||||||||||
|
Other financial investments
|
274,318
|
-
|
-
|
274,318
|
||||||||||||||||
|
Trade and other receivables
|
11
|
236,395
|
-
|
-
|
236,395
|
|||||||||||||||
|
Cash and cash equivalents
|
12
|
631,542
|
-
|
-
|
631,542
|
|||||||||||||||
|
Total financial assets
|
1,142,255
|
6,034
|
13,153
|
1,161,441
|
||||||||||||||||
|
Corporate debt
|
14
|
684,073
|
-
|
-
|
684,073
|
|||||||||||||||
|
Project debt
|
15
|
5,091,114
|
-
|
-
|
5,091,114
|
|||||||||||||||
|
Related parties – non-current
|
10
|
33,675
|
-
|
-
|
33,675
|
|||||||||||||||
|
Trade and other current liabilities
|
17
|
192,033
|
-
|
-
|
192,033
|
|||||||||||||||
|
Derivative liabilities
|
9
|
-
|
-
|
279,152
|
279,152
|
|||||||||||||||
|
Total financial liabilities
|
6,000,895
|
-
|
279,152
|
6,280,047
|
||||||||||||||||
Other financial investments include primarily the short-term portion of contracted concessional assets (see Note 6) for $160.6 million as of December 31, 2019
and for $159.1 million as of December 31, 2018.
Investment in Ten West Link is a 12.5% interest in a 114-mile transmission line in the U.S., currently under development.
Investment in Rioglass corresponds to 15.12% of the equity interest of Rioglass, a multinational solar power and renewable energy technology manufacturer,
acquired in May 2019 by the Company.
Note 9.- Derivative financial instruments
The breakdowns of the fair value amount of the derivative financial instruments as of December 31, 2019 and 2018 are as follows:
|
Balance as of December 31, 2019
|
Balance as of December 31, 2018
|
|||||||||||||||
|
|
Assets
|
Liabilities
|
Assets
|
Liabilities
|
||||||||||||
|
Interest rate cash flow hedge
|
1,619
|
298,744
|
9,923
|
279,152
|
||||||||||||
|
Foreign exchange derivatives instruments
|
3,610
|
-
|
3,230
|
-
|
||||||||||||
|
Total
|
5,230
|
298,744
|
13,153
|
279,152
|
||||||||||||
The derivatives are primarily interest rate cash-flow hedges. All are classified as non-current assets or non-current liabilities, as they hedge long-term
financing agreements.
Additionally, the Company owns currency options with leading international financial institutions, which guarantee minimum Euro-U.S. dollar exchange rates.
The strategy of the Company is to hedge the exchange rate for the net distributions from its Spanish assets after deducting euro-denominated interest payments and euro-denominated general and administrative expenses. Through currency options,
the strategy of the Company is to hedge 100% of its euro-denominated net exposure for the next 12 months and 75% of its euro denominated net exposure for the following 12 months, on a rolling basis. Change in fair value of these foreign
exchange derivatives instruments are recorded in the consolidated income statement.
F-41
As stated in Note 3 to these consolidated financial statements, the general policy is to hedge variable interest rates of financing agreements purchasing
call options (caps) in exchange of a premium to fix the maximum interest rate cost and contracting floating to fixed interest rate swaps.
As a result, the notional amounts hedged, strikes contracted and maturities, depending on the characteristics of the debt on which the interest rate risk is
being hedged, can be diverse:
| - |
Project debt in Euros: the Company hedges between 81% and 100% of the notional amount, maturities until 2030 and average guaranteed interest rates of between 0.89% and 4.87%.
|
| - |
Project debt in U.S. dollars: the Company hedges between 70% and 100% of the notional amount, including maturities until 2034 and average guaranteed interest rates of between 1.98% and 5.27%.
|
The table below shows a breakdown of the maturities of notional amounts of interest rate cash flow hedge derivatives as of December 31, 2019 and 2018.
|
Notionals
|
Balance as of December 31, 2019
|
Balance as of December 31, 2018
|
||||||||||||||
|
Assets
|
Liabilities
|
Assets
|
Liabilities
|
|||||||||||||
|
Up to 1 year
|
43,266
|
117,574
|
42,846
|
93,440
|
||||||||||||
|
Between 1 and 2 years
|
45,955
|
124,908
|
45,603
|
119,568
|
||||||||||||
|
Between 2 and 3 years
|
49,259
|
240,570
|
48,774
|
234,572
|
||||||||||||
|
Subsequent years
|
455,235
|
1,697,033
|
535,774
|
1,858,061
|
||||||||||||
|
Total
|
$
|
593,715
|
$
|
2,180,085
|
$
|
672,997
|
$
|
2,305,641
|
||||||||
The table below shows a breakdown of the maturity of the fair values of interest rate cash flow hedge derivatives as of December 31, 2019 and 2018:
|
Fair value
|
Balance as of December 31, 2019
|
Balance as of December 31, 2018
|
||||||||||||||
|
Assets
|
Liabilities
|
Assets
|
Liabilities
|
|||||||||||||
|
Up to 1 year
|
118
|
(18,721
|
)
|
493
|
(11,848
|
)
|
||||||||||
|
Between 1 and 2 years
|
128
|
(19,787
|
)
|
524
|
(13,231
|
)
|
||||||||||
|
Between 2 and 3 years
|
140
|
(21,802
|
)
|
562
|
(15,151
|
)
|
||||||||||
|
Subsequent years
|
1,234
|
(238,434
|
)
|
8,344
|
(238,922
|
)
|
||||||||||
|
Total
|
$
|
1,619
|
$
|
(298,744
|
)
|
$
|
9,923
|
$
|
(279,152
|
)
|
||||||
During 2019, fair value of derivatives decreased mainly due to a decrease in the fair value of interest rate cash-flow hedges resulting from the decrease in
future interest rates.
The net amount of the fair value of interest rate derivatives designated as cash flow hedges transferred to the consolidated income statement in 2019 is a
loss of $55,765 thousand (loss of $67,519 thousand in 2018 and a loss of $70,953 thousand in 2017). Additionally, the net amount of the time value component of the cash flow derivatives fair value recognized in the consolidated income
statement for the year 2019, 2018 and 2017 has been a gain of $157 thousand, a loss of $560 thousand and a loss of $860 thousand respectively.
The after-tax result accumulated in equity in connection with derivatives designated as cash flow hedges at the years ended December 31, 2019 and 2018,
amount to a $73,797 thousand gain and a $95,011 thousand gain respectively.
Note 10.- Related parties
During the normal course of business, the Company has historically conducted operations with related parties consisting mainly of Abengoa´s subsidiaries and non-controlling interests. The transactions were
completed at market rates.
F-42
Further to the sale of its remaining 16.47% stake in the Company to Algonquin on November 27, 2018, Abengoa ceased to fulfill the conditions to be a related
party as per IAS 24 - Related Parties Disclosures. Algonquin on its side is a related party since it completed the acquisition of a 25% stake in the Company in March 2018.
Details of balances with related parties as of December 31, 2019 and 2018, which therefore do not include balances with Abengoa, are as follows:
|
Balance as of December 31,
|
||||||||
|
2019
|
2018
|
|||||||
|
Credit receivables (current)
|
13,350
|
5,328
|
||||||
|
Total current receivables with related parties
|
13,350
|
5,328
|
||||||
|
Credit receivables (non-current)
|
21,355
|
-
|
||||||
|
Total non-current receivables with related parties
|
21,355
|
-
|
||||||
|
Credit payables (current)
|
23,979
|
19,352
|
||||||
|
Total current payables with related parties
|
23,979
|
19,352
|
||||||
|
Credit payables (non-current)
|
17,115
|
33,675
|
||||||
|
Total non-current payables with related parties
|
17,115
|
33,675
|
||||||
Current credit receivables as of December 31, 2019 mainly correspond to the short-term portion of the loan to Arroyo Netherland II B.V., the holding company
of Pemcorp SAPI de CV., Monterrey´s project entity (Note 5) for $5.0 million and to a dividend to be collected from Amherst Island Partnership for $5.5 million as of December 31, 2019.
Non-current credit receivables as of December 31, 2019 correspond to the long-term portion of the loan to Arroyo Netherland II B.V.
Credit payables relate to debts with non-controlling interests partners in Kaxu, Solaben 2&3 and Solacor 1&2 for an amount of $35.6 million as of
December 31, 2019 ($53.0 million as of December 31, 2018). Current credit payables also include the dividend to be paid from Atlantica Yield Energy Solutions Ltd to Algonquin for $5.4 million as of December 31, 2019.
The transactions carried out by entities included in these consolidated financial statements with related parties not included in the consolidation perimeter
of Atlantica, for the years ended December 31, 2019, 2018 and 2017 have been as follows:
|
For the twelve-month period ended December 31,
|
||||||||||||
|
2019
|
2018
|
2017
|
||||||||||
|
Services rendered
|
-
|
-
|
3,495
|
|||||||||
|
Services received
|
-
|
(101,582
|
)
|
(114,416
|
)
|
|||||||
|
Financial income
|
978
|
3,721
|
74
|
|||||||||
|
Financial expenses
|
(195
|
)
|
(398
|
)
|
(1,154
|
)
|
||||||
Services received in 2018 and 2017 primarily included operation and maintenance services received by some assets from Abengoa and subsidiaries of Abengoa,
which had been related parties during these years.
The total amount of the remuneration received by the Board of Directors of the Company, including the CEO, amounts to $2.5 million in 2019 ($3.1 million in 2018), including $1.0 million of annual bonus ($1.0 million in 2018). The decrease of the total remuneration in 2019 is mainly due to the CEO having received a long-term award of $0.8 million in 2018, paid in March 2019. No long-term awards have vested in 2019. None of the directors received any pension remuneration in 2018 nor 2019.
F-43
Note 11.- Trade and other receivables
Trade and other receivable as of December 31, 2019 and 2018, consist of the following:
|
Balance as of December 31,
|
||||||||
|
2019
|
2018
|
|||||||
|
Trade receivables
|
242,008
|
163,856
|
||||||
|
Tax receivables
|
50,901
|
54,959
|
||||||
|
Prepayments
|
5,150
|
5,521
|
||||||
|
Other accounts receivable
|
19,508
|
12,059
|
||||||
|
Total
|
317,568
|
236,395
|
||||||
As of December 31, 2019, and 2018, the fair value of clients and other accounts receivable does not differ significantly from its carrying value.
The increase in trade receivables as of December 31, 2019 is primarily due to delays in the collection of receivables from Pemex (ACT) and the Comision
Nacional de los Mercados y de la Competencia or “CNMC” (Spanish solar assets).
Trade receivables in foreign currency as of December 31, 2019 and 2018, are as follows:
|
Balance as of December 31,
|
||||||||
|
2019
|
2018
|
|||||||
|
Euro
|
108,280
|
91,303
|
||||||
|
South African Rand
|
24,289
|
25,193
|
||||||
|
Other
|
4,001
|
9,884
|
||||||
|
Total
|
136,570
|
126,380
|
||||||
Note 12.- Cash and cash equivalents
The following table shows the detail of Cash and cash equivalents as of December 31, 2019 and 2018:
|
Balance as of December 31,
|
||||||||
|
2019
|
2018
|
|||||||
|
Cash at bank and on hand - non restricted
|
223,867
|
335,114
|
||||||
|
Cash at bank and on hand - restricted
|
338,928
|
296,428
|
||||||
|
Total
|
562,795
|
631,542
|
||||||
Cash includes funds held to satisfy the customary requirements of certain non-recourse debt agreements within the Company´s projects amounting to $339
million as of December 31, 2019 ($296 million as of December 31, 2018).
The following breakdown shows the main currencies in which cash and cash equivalent balances are denominated:
|
Balance as of December 31,
|
||||||||
|
Currency
|
2019
|
2018
|
||||||
|
U.S. dollar
|
313,678
|
328,716
|
||||||
|
Euro
|
181,961
|
228,036
|
||||||
|
Algerian Dinar
|
9,301
|
11,602
|
||||||
|
South African Rand
|
47,679
|
55,257
|
||||||
|
Others
|
10,176
|
7,931
|
||||||
|
Total
|
562,795
|
631,542
|
||||||
F-44
Note 13.- Equity
As of December 31, 2019, the share capital of the Company amounts to $10,160,167 represented by 101,601,666 ordinary shares completely subscribed and
disbursed with a nominal value of $0.10 each, all in the same class and series. Each share grants one voting right.
Algonquin completed in 2018 the acquisition from Abengoa of its entire stake in Atlantica, 41.47% of the total shares of the Company, becoming the largest
shareholder of the Company. On May 22, 2019, the Company issued an additional 1,384,402 ordinary shares, which were fully subscribed by Algonquin for a total amount of $30,000,000, increasing the stake of Algonquin to 42.27%. Additionally,
Algonquin purchased 2,000,000 ordinary shares on May 31, 2019, increasing its stake in Atlantica to 44.2%.
Atlantica´s parent company reserves as of December 31, 2019 are made up of share premium account and distributable reserves.
Retained earnings primarily include results attributable to Atlantica.
Non-controlling interests fully relate to interests held by JGC in Solacor 1 and Solacor 2, by Idae in Seville PV, by Itochu Corporation in Solaben 2 and
Solaben 3, by Algerian Energy Company, SPA and Sacyr Agua S.L. in Skikda, by Industrial Development Corporation of South Africa (IDC) and Kaxu Community Trust in Kaxu and by Algonquin Power Co. in AYES Canada (refer to Note 1).
Additional information of subsidiaries including material Non-controlling interests as of December 31, 2019 and 2018, are disclosed in Appendix IV.
Dividends declared during the year 2019:
| - |
On February 26, 2019, the Board of Directors declared a dividend of $0.37 per share corresponding to the fourth quarter of 2018. The dividend was paid on March 22, 2019 for a total amount of $37.1
million
|
| - |
On May 7, 2019, the Board of Directors of the Company approved a dividend of $0.39 per share corresponding to the first quarter of 2019. The dividend was paid on June 14, 2019 for a total amount of
$39.6 million.
|
| - |
On August 2, 2019, the Board of Directors of the Company approved a dividend of $0.40 per share corresponding to the second quarter of 2019. The dividend was paid on September 13, 2019 for a total
amount of $40.6 million.
|
| - |
On November 5, 2019, the Board of Directors declared a dividend of $0.41 per share corresponding to the third quarter of 2019. The dividend was paid on December 13, 2019 for a total amount of $41.7
million.
|
In addition, as of December 31, 2019, there was no treasury stock and there have been no transactions with treasury stock during the period then ended.
Note 14.- Corporate debt
The breakdown of the corporate debt as of December 31, 2019 and 2018 is as follows:
|
Balance as of December 31,
|
||||||||
|
Non-current
|
2019
|
2018
|
||||||
|
Credit Facilities with financial entities
|
695,085
|
415,168
|
||||||
|
Total Non-current
|
695,085
|
415,168
|
||||||
|
Balance as of December 31,
|
||||||||
|
Current
|
2019
|
2018
|
||||||
|
Credit Facilities with financial entities
|
789
|
11,580
|
||||||
|
Notes and Bonds
|
27,917
|
257,325
|
||||||
|
Total Current
|
28,706
|
268,905
|
||||||
On November 17, 2014, the Company issued the Senior Notes due 2019 in an aggregate principal amount of $255,000 thousand (the “2019 Notes”). The 2019 Notes
accrued annual interest of 7.00% payable semi-annually beginning on May 15, 2015. The 2019 Notes were fully repaid on May 31, 2019.
F-45
On February 10, 2017, the Company issued Senior Notes due 2022, 2023, 2024 (the “Note Issuance Facility”), in an aggregate principal amount of €275,000
thousand. The 2022 to 2024 Notes accrue annual interest, equal to the sum of (i) EURIBOR plus (ii) 4.90%, as determined by the Agent. Interest on the Notes are payable in cash quarterly in arrears on each interest payment date. The Company
pays interest to the holders of record on each interest payment date. The interest rate on the Note Issuance Facility is fully hedged by two interest rate swaps contracted with Jefferies Financial Services, Inc. with effective date March 31,
2017 and maturity date December 31, 2022, resulting in the Company paying a net fixed interest rate of 5.5% on the Note Issuance Facility. Changes in fair value of these interest rate swaps have been recorded in the consolidated income
statement. The Note Issuance Facility is a € denominated liability for which the Company applies net investment hedge accounting. When converted to US$ at US$/€ closing exchange rate, it contributes to reduce the impact in translation
difference reserves generated in the equity of these consolidated financial statements by the conversion of the net assets of the Spanish solar assets into US$.
On July 20, 2017, the Company signed a credit facility (the “2017 Credit Facility”) for up to €10 million, approximately $11.2 million, which is available in
euros or U.S. dollars and was fully drawn down in 2017. Amounts drawn down accrue interest at a rate per year equal to EURIBOR plus 2.25% or LIBOR plus 2.25%, depending on the currency. On December 13, 2019, the terms of the credit facility
have been modified and the maturity date has been extended from July 4, 2020 to December 13, 2021 and the new interest rate per year set is EURIBOR plus 2% or LIBOR plus 2%, depending on the currency. As of December 31, 2019, the Company had
drawn down an amount of $10.1 million.
On May 10, 2018, the Company entered into a $215 million revolving credit facility (the “New Revolving Credit Facility”) with Royal Bank of Canada, as
administrative agent and Royal Bank of Canada and Canadian Imperial Bank of Commerce, as issuers of letters of credit. Amounts drawn down accrue interest at a rate per year equal to (A) for Eurodollar rate loans, LIBOR plus a percentage
determined by reference to the leverage ratio of the Company, ranging between 1.60% and 2.25% and (B) for base rate loans, the highest of (i) the rate per annum equal to the weighted average of the rates on overnight U.S. Federal funds
transactions with members of the U.S. Federal Reserve System arranged by U.S. Federal funds brokers on such day plus ½ of 1.00%, (ii) the U.S. prime rate and (iii) LIBOR plus 1.00%, in any case, plus a percentage determined by reference to
the leverage ratio of the Company, ranging between 0.60% and 1.00%. Letters of credit may be issued using up to $70 million of the Revolving Credit Facility. During the month of January 2019, the amount of the Revolving Credit Facility
increased from $215 million to $300 million. On August 2, 2019, the amount of the Revolving Credit Facility increased from $300 million to $425 million and the maturity was extended to December 31, 2022 for $387.5 million, while the remaining
$37.5 million matures on December 31, 2021. On December 31, 2019, the Company had drawn down a total amount of $81.1 million (net of debt issuance cost).
On April 30, 2019, the Company entered into a senior unsecured note facility with a group of funds managed by Westbourne Capital as purchasers of the notes
issued thereunder for a total amount of €268 million (the “2019 Note Issuance Facility”). The principal amount was issued in May 24, 2019 and was used to prepay and subsequently cancel in full the aforementioned 2019 Notes and for general
corporate purposes. The 2019 Note Issuance Facility includes an upfront fee of 2% paid on drawdown and its maturity date is April 30, 2025. Interest accrue at a rate per annum equal to the sum of 3-month EURIBOR plus 4.50%. The interest rate
on the 2019 Note Issuance Facility is fully hedged by an interest rate swap with effective date June 28, 2019 and maturity date June 30, 2022, resulting in the Company paying a net fixed interest rate of 4.2%. The 2019 Note Issuance Facility
provides that the Company may capitalize interest on the notes issued thereunder for a period of up to two years from closing at the Company´s discretion, subject to certain conditions.
On October 8, 2019, the Company filed a euro commercial paper program (the “Commercial Paper”) with the Alternative Fixed Income Market (MARF)
in Spain. The program allows Atlantica to issue short term notes over the next twelve months for up to €50 million, with such notes having a tenor of up
to two years. As of the date of this report the Company has issued €25 million under the program at an average cost of 0.66%.
The repayment schedule for the corporate debt as of December 31, 2019 is as follows:
|
2020
|
2021 |
2022
|
2023
|
2024 |
Subsequent
years
|
Total
|
||||||||||||||||||||||
|
New Revolving Credit Facility
|
701
|
-
|
81,164
|
-
|
-
|
-
|
81,865
|
|||||||||||||||||||||
|
Note Issuance Facility
|
84
|
-
|
101,317
|
100,513
|
100,413
|
-
|
302,327
|
|||||||||||||||||||||
|
2017 Credit Facility
|
4
|
10,085
|
-
|
-
|
-
|
-
|
10,089
|
|||||||||||||||||||||
|
2019 Notes Issuance Facility
|
-
|
7,938
|
-
|
-
|
-
|
293,655
|
301,593
|
|||||||||||||||||||||
|
Commercial Paper
|
27,917
|
-
|
-
|
-
|
-
|
-
|
27,917
|
|||||||||||||||||||||
|
Total
|
28,706
|
18,023
|
182,481
|
100,513
|
100,413
|
293,655
|
723,791
|
|||||||||||||||||||||
F-46
The following table details the movement in Corporate debt for the year 2019, split between cash and non-cash items:
|
January 1, 2019
|
Cash Flow
|
Non-cash changes
|
December 31, 2019
|
|||||||||||||
|
Corporate debt
|
684,073
|
6,620
|
33,098
|
723,791
|
||||||||||||
The non-cash changes primarily relate to interests accrued and to currency translation differences.
Note 15.- Project debt
The main purpose of the Company is the long-term ownership and management of contracted concessional assets, such as renewable energy, efficient natural gas,
electric transmission lines and water assets, which are financed through project debt. This note shows the project debt linked to the contracted concessional assets included in Note 6 of these consolidated financial statements.
Project debt is generally used to finance contracted assets, exclusively using as a guarantee the assets and cash flows of the company or group of companies
carrying out the activities financed. In most of the cases, the assets and/or contracts are set up as a guarantee to ensure the repayment of the related financing. In addition, the cash of the Company´s projects includes funds held to satisfy
the customary requirements of certain non-recourse debt agreements and other restricted cash for an amount of $339 million as of December 31, 2019 ($296 million as of December 31, 2018).
Compared with corporate debt, project debt has certain key advantages, including a greater leverage and a clearly defined risk profile.
The variations for 2019 and 2018 of project debt have been the following:
|
Project debt -
long term
|
Project debt -
short term
|
Total
|
||||||||||
|
Balance as of December 31, 2018
|
4,826,659
|
264,455
|
5,091,114
|
|||||||||
|
Increases
|
53,222
|
280,005
|
333,226
|
|||||||||
|
Decreases
|
(19,272
|
)
|
(516,147
|
)
|
(535,418
|
)
|
||||||
|
Currency translation differences
|
(33,718
|
)
|
(2,855
|
)
|
(36,574
|
)
|
||||||
|
Reclassifications
|
(756,981
|
)
|
756,981
|
-
|
||||||||
|
Balance as of December 31, 2019
|
4,069,909
|
782,439
|
4,852,348
|
|||||||||
The line “Increases” includes primarily accrued interests for the year.
The decrease of Project debt during the year 2019 is primarily due to the contractual payments of debt for the year and the partial repayment of Solana debt
using the indemnity received from Abengoa for $22.2 million (Note 10). Interests accrued are offset by a similar amount of interests paid during the year.
Due to the PG&E Corporation and its regulated utility subsidiary, Pacific Gas and Electric Company (“PG&E”), chapter 11 filings in January 2019, a
default of the PPA agreement with PG&E occurred. Since PG&E failed to assume the PPA within 180 days from the commencement of the PG&E’s chapter 11 proceedings, a technical event of default was triggered under the Mojave project
finance agreement in July 2019. Although the Company does not contemplate the scenario under which the DOE would declare the acceleration of debt repayment, the project debt agreement does not have an unconditional right to defer the
settlement of the debt for at least twelve months as of December 31, 2019, as the event of default provision make that right not totally unconditional, and therefore the debt has been presented as current in these consolidated financial
statements in accordance with International Accounting Standards 1 (“IAS 1”), “Presentation of Financial Statements”.
F-47
|
Project debt -
long term
|
Project debt -
short term
|
Total
|
||||||||||
|
Balance as of December 31, 2017
|
5,228,917
|
246,291
|
5,475,208
|
|||||||||
|
Increases
|
105,466
|
288,541
|
393,007
|
|||||||||
|
Decreases
|
(98,450
|
)
|
(522,317
|
)
|
(620,767
|
)
|
||||||
|
First time application of IFRS 9 effective January 1, 2018
|
(39,599
|
)
|
-
|
(39,599
|
)
|
|||||||
|
Debt refinancing IFRS 9 impact
|
(36,642
|
)
|
-
|
(36,642
|
)
|
|||||||
|
Change in the scope of the consolidated financial statements (Note 5)
|
79,016
|
2,346
|
81,362
|
|||||||||
|
Currency translation differences
|
(150,019
|
)
|
(12,436
|
)
|
(162,455
|
)
|
||||||
|
Reclassifications
|
(262,030
|
)
|
262,030
|
-
|
||||||||
|
Balance as of December 31, 2018
|
4,826,659
|
264,455
|
5,091,114
|
|||||||||
The line “Increases” includes primarily accrued interests for the year.
Main variations in Project debt during the year 2018 were the result of:
| - |
A net decrease primarily due to the contractual payments of debt for the year and the partial repayment of Solana debt using the indemnity received from Abengoa during the year 2018 for $61.5
million (see Note 10). Interests accrued are offset by a similar amount of interests paid during the year;
|
| - |
The impact of the first application of IFRS 9, ´Financial instruments´ from January 1, 2018;
|
| - |
The impact of the refinancing of the debts of Helios 1/2 and Helioenergy 1/2 on May 18, 2018 and June 26, 2018 respectively. The terms of the new debts are not substantially different from the
original debts refinanced and therefore the exchange of debts instruments does not qualify for an extinguishment of the original debts under IFRS 9, ´Financial instruments´. When there is a refinancing with a non-substantial
modification of the original debt, there is a gain or loss recorded in the income statement. This gain or loss is equal to the difference between the present value of the cash flows under the original terms of the former
financing and the present value of the cash flows under the new financing, discounted both at the original effective interest rate. In this respect, the Company recorded a $36.6 million financial income in the profit and loss
statement of the consolidated financial statements (see Note 21);
|
| - |
The acquisition of assets and the consolidation of its debt during the year (see Note 5).
|
The repayment schedule for project debt in accordance with the financing arrangements and assuming there will be no acceleration of the Mojave debt, as of December 31, 2019, is as
follows and is consistent with the projected cash flows of the related projects:
|
2020
|
2021
|
2022
|
2023
|
2024
|
Subsequent years
|
Total
|
|||||||||||||||||
|
Interest
Repayment
|
Nominal
repayment
|
||||||||||||||||||||||
|
12,799
|
256,620
|
262,787
|
293,642
|
319,962
|
335,067
|
3,371,724
|
4,852,348
|
||||||||||||||||
Current and non-current loans with credit entities include amounts in foreign currencies for a total of $2,291,262 thousand as of December 31, 2019 ($2,464,352 thousand as of December 31, 2018).
The following table details the movement in Project debt for the year 2019, split between cash and non-cash items:
|
January 1, 2019
|
Cash Flow
|
Non-cash changes
|
December 31, 2019
|
|||||||||
|
Project debt
|
5,091,114
|
(531,726
|
)
|
292,960
|
4,852,348
|
|||||||
The non-cash changes primarily relate to interests accrued and to currency translation differences.
F-48
The equivalent in U.S. dollars of the most significant foreign-currency-denominated debts held by the Company is as follows:
|
Balance as of December 31,
|
||||||||
|
Currency
|
2019
|
2018
|
||||||
|
Euro
|
1,882,618
|
2,049,892
|
||||||
|
Algerian Dinar
|
24,331
|
29,545
|
||||||
|
South African Rand
|
384,313
|
384,915
|
||||||
|
Total
|
2,291,262
|
2,464,352
|
||||||
All of the Company’s financing agreements have a carrying amount close to its fair value.
Note 16.- Grants and other liabilities
Grants and other liabilities as of December 31, 2019 and December 31, 2018 are as follows:
|
Balance as of December 31,
|
||||||
|
2019
|
2018
|
|||||
|
Grants
|
1,087,553
|
1,150,805
|
||||
|
Other liabilities
|
554,199
|
507,321
|
||||
|
Grant and other non-current liabilities
|
1,641,752
|
1,658,126
|
||||
As of December 31, 2019, the amount recorded in Grants corresponds primarily to the ITC Grant awarded by the U.S. Department of the Treasury to Solana and Mojave for a total amount of
$707 million ($739 million as of December 31, 2018), which was primarily used to fully repay the Solana and Mojave short-term tranche of the loan with the Federal Financing Bank. The amount recorded in Grants as a liability is
progressively recorded as other income over the useful life of the asset.
The remaining balance of the “Grants” account corresponds to loans with interest rates below market rates for Solana and Mojave for a total amount of $379 million ($410 million as of
December 31, 2018). Loans with the Federal Financing Bank guaranteed by the Department of Energy for these projects bear interest at a rate below market rates for these types of projects and terms. The difference between proceeds received
from these loans and its fair value, is initially recorded as “Grants” in the consolidated statement of financial position, and subsequently recorded in “Other operating income” starting at the entry into operation of the plants. Total
amount of income for these two types of grants for Solana and Mojave is $59.0 million and $59.3 million for the year ended December 31, 2019 and 2018, respectively.
Other liabilities mainly relate to the investment from Liberty Interactive Corporation (‘Liberty’) made on October 2, 2013 for an amount of $300 million. The investment was made in the
parent company of the project entity, in exchange for the right to receive a large part of taxable losses and distributions until such time when Liberty reaches a certain rate of return, or the Flip Date. Given the underperformance of the
asset in the last years, the Company cannot assure the Flip Date will occur or when it will occur. The company expects potential cash distributions from Solana to go mostly or entirely to Liberty in the upcoming years. If the Flip Date
never occurs or if there is a delay longer than currently anticipated, this will adversely affect the cash flows the Company expected from that project. In addition, the Company signed an option to acquire, until April 30, 2020, Liberty’s
equity interest in Solana.
According to the stipulations of IAS 32 and in spite of the fact that the investment of Liberty is in shares, it does not qualify as equity and has been classified as a liability as of
December 31, 2019 and 2018. The liability is recorded in Grants and other liabilities for a total amount of $380 million ($358 million as of December 31, 2018) and its current portion is recorded in other current liabilities for the
remaining amount (see Note 17). This liability has been initially valued at fair value, calculated as the present value of expected cash-flows during the useful life of the concession, and is then measured at amortized cost in accordance
with the effective interest method, considering the most updated expected future cash-flows.
Additionally, other liabilities include $54 million of finance lease liabilities and $60 million of dismantling provision as of December 31, 2019 ($57 million and $57 million as of
December 31,2018, respectively).
F-49
Note 17.- Trade payables and other current liabilities
Trade payables and other current liabilities as of December 31, 2019 and 2018 are as follows:
|
Balance as of December 31,
|
||||||||
|
Item
|
2019
|
2018
|
||||||
|
Trade accounts payables
|
52,062
|
109,430
|
||||||
|
Down payments from clients
|
565
|
6,289
|
||||||
|
Liberty (see Note 16)
|
41,032
|
37,119
|
||||||
|
Other accounts payable
|
34,403
|
39,195
|
||||||
|
Total
|
128,062
|
192,033
|
||||||
Trade accounts payables mainly relate to the operating and maintenance of the plants.
Nominal values of Trade payables and other current liabilities are considered to approximately equal to fair values and the effect of discounting them is not significant.
Note 18.- Income Tax
All the companies of Atlantica file income taxes according to the tax regulations in force in each country on an individual basis or under consolidation tax regulations.
The consolidated income tax has been calculated as an aggregation of income tax expenses/income of each individual company. In order to calculate the taxable income of the consolidated
entities individually, the accounting result is adjusted for temporary and permanent differences, recording the corresponding deferred tax assets and liabilities. At each consolidated income statement date, a current tax asset or
liability is recorded, representing income taxes currently refundable or payable. Deferred income taxes reflect the net tax effects of temporary differences between the carrying amount of assets and liabilities for financial statement and
income tax purposes, as determined under enacted tax laws and rates.
Income tax payable is the result of applying the applicable tax rate in force to each tax-paying entity, in accordance with the tax laws in force in the country in which the entity is
registered. Additionally, tax deductions and credits are available to certain entities, primarily relating to inter-company trades and tax treaties between various countries to prevent double taxation.
The Company offsets deferred tax assets and deferred tax liabilities in each entity where the latter has a legally enforceable right to set off current tax assets against current tax
liabilities, and the deferred tax assets and liabilities relate to income taxes levied by the same taxation authority.
As of December 31, 2019, and 2018, the analysis of deferred tax assets and deferred tax liabilities is as follows:
|
Deferred tax assets
|
Balance as of December 31,
|
|||||||
|
Concept
|
2019
|
2018
|
||||||
|
Net tax credits for tax losses carryforwards
|
61,693
|
55,835
|
||||||
|
Temporary differences on derivatives financial instruments
|
86,096
|
79,865
|
||||||
|
Other temporary differences
|
177
|
366
|
||||||
|
Total deferred tax assets
|
147,966
|
136,066
|
||||||
Most of the net tax credits for tax losses carryforwards corresponds to Peru, South Africa and solar plants in Spain as of December 31, 2019.
Temporary differences for derivatives financial instruments are mainly due to ACT ($17 million) and solar plants in Spain ($61 million).
In relation to tax losses carryforwards and deductions pending to be used recorded as deferred tax assets, the entities evaluate their recoverability projecting forecasted taxable result for the upcoming years and taking into account
their tax planning strategy. Deferred tax liabilities reversals are also considered in these projections, as well as any limitation established by tax regulations in force in each tax jurisdiction.
F-50
|
Deferred tax liabilities
|
Balance as of December 31,
|
|||||||
|
Concept
|
2019
|
2018
|
||||||
|
Temporary differences tax/book amortization
|
145,166
|
126,792
|
||||||
|
Other temporary differences tax/book value of contracted concessional assets
|
83,481
|
73,793
|
||||||
|
Other temporary differences
|
20,349
|
10,415
|
||||||
|
Total deferred tax liabilities
|
248,996
|
211,000
|
||||||
As of December 31, 2019 and 2018, temporary differences as a result of accelerated tax amortization resulted for some entities in a net deferred tax liability position. These are
primarily due to Solana and Mojave ($45 million in 2019 and $55 million in 2018) and solar plants in Spain ($100 million in 2019 and $74 million in 2018).
Other temporary differences between the tax and book value of contracted concessional assets, which resulted in a net deferred tax liability position relate primarily to ACT in both
years.
The movements in deferred tax assets and liabilities during the years ended December 31, 2019 and 2018 were as follows:
|
Deferred tax assets
|
Amount
|
|||
|
As of December 31, 2017
|
165,136
|
|||
|
First application of IFRS 9 effective January 1, 2018
|
11,811
|
|||
|
Increase/(decrease) through the consolidated income statement
|
(24,195
|
)
|
||
|
Increase/(decrease) through other consolidated comprehensive income (equity)
|
(10,685
|
)
|
||
|
Other movements
|
(6,001
|
)
|
||
|
As of December 31, 2018
|
136,066
|
|||
|
Increase/(decrease) through the consolidated income statement
|
5,809
|
|||
|
Increase/(decrease) through other consolidated comprehensive income (equity)
|
6,147
|
|||
|
Other movements
|
(56
|
)
|
||
|
As of December 31, 2019
|
147,966
|
|||
|
Deferred tax liabilities
|
Amount
|
|||
|
As of December 31, 2017
|
186,583
|
|||
|
First application of IFRS 9 effective January 1, 2018
|
8,849
|
|||
|
Increase/(decrease) through the consolidated income statement
|
17,996
|
|||
|
Change in the scope of the consolidated financial statements (Note 5)
|
590
|
|||
|
Other movements
|
(3,018
|
)
|
||
|
As of December 31, 2018
|
211,000
|
|||
|
Increase/(decrease) through the consolidated income statement
|
31,678
|
|||
|
Change in the scope of the consolidated financial statements (Note 5)
|
2,539
|
|||
|
Other movements
|
3,779
|
|||
|
As of December 31, 2019
|
248,996
|
|||
Details of income tax for the years ended December 31, 2019, 2018 and 2017 are as follows:
|
For the twelve-month period ended December 31,
|
||||||||||||
|
Item
|
2019
|
2018
|
2017
|
|||||||||
|
Current tax
|
(5,081
|
)
|
(468
|
)
|
(1,998
|
)
|
||||||
|
Deferred tax
|
(25,869
|
)
|
(42,191
|
)
|
(117,839
|
)
|
||||||
|
- relating to the origination and reversal of temporary differences
|
(25,869
|
)
|
(42,191
|
)
|
(98,508
|
)
|
||||||
|
- relating to changes in tax rates
|
-
|
-
|
(19,331
|
)
|
||||||||
|
Total income tax benefit/(expense)
|
(30,950
|
)
|
(42,659
|
)
|
(119,837
|
)
|
||||||
F-51
The reconciliation between the theoretical income tax resulting from applying an average statutory tax rate to profit/(loss) before income tax and the actual income tax expense
recognized in the consolidated income statements for the years ended December 31, 2019, 2018 and 2017, are as follows:
|
For the year ended December 31,
|
||||||||||||
|
Concept
|
2019
|
2018
|
2017
|
|||||||||
|
Consolidated income / (loss) before taxes
|
105,558
|
97,928
|
14,950
|
|||||||||
|
Average statutory tax rate
|
25
|
%
|
30
|
%
|
30
|
%
|
||||||
|
Corporate income tax at average statutory tax rate
|
(26,390
|
)
|
(29,378
|
)
|
(4,485
|
)
|
||||||
|
Income tax of associates, net
|
1,808
|
1,639
|
1,765
|
|||||||||
|
Differences in foreign tax rates
|
(7,076
|
)
|
752
|
3,304
|
||||||||
|
Permanent differences
|
11,220
|
5,385
|
19,324
|
|||||||||
|
Incentives, deductions, and unrecognized tax losses carryforwards
|
(14,161
|
)
|
(22,972
|
)
|
(20,994
|
)
|
||||||
|
Change in corporate income tax
|
-
|
-
|
(19,331
|
)
|
||||||||
|
U.S. Internal Revenue Code Section 382
|
-
|
-
|
(96,328
|
)
|
||||||||
|
Other non-taxable income/(expense)
|
3,649
|
1,915
|
(3,092
|
)
|
||||||||
|
Corporate income tax
|
(30,950
|
)
|
(42,659
|
)
|
(119,837
|
)
|
||||||
The average statutory tax rate used by the Company changed in 2019 considering some changes in the statutory tax rate of some geographies over the past years.
Permanent differences in 2019, 2018 and 2017 are mainly due to ACT (Mexico).
The main implications derived from the Tax Cuts and Jobs Act enacted in December 2017 in the U.S. entities are:
| - |
A reduction of the Federal income tax rate from 35% to 21%, effective since January 1, 2018 which effect on the deferred tax assets and liabilities resulted in a $19 million loss in the year
2017;
|
| - |
A limitation of the deduction for net interest expense of all businesses in the U.S. The new limitation is imposed on net interest expense that exceeds 30% of EBITDA from 2018 to 2021, and 30%
of EBIT from 2022 onwards. Interests disallowed would be deducted in the future in the event that those limits are not exceeded. After having considered the impacts of Section 382, the Company does not expect significant
negative effects from this net interest expense limitation;
|
| - |
NOLs arising in tax years beginning after 2017 would be limited to 80% of taxable income. For new NOLs recognized after 2017, an indefinite carryforward would be allowed. The limitation of 80%
is not applicable for NOLs generated before 2018. For existing NOLs before 2018, a carryforward of 20 years is still applicable. The new limitation does not trigger adverse tax effects to the U.S. subsidiaries of the Company
considering the amount of NOLs to be generated in upcoming years and the projected amount of taxable income of these entities after having considered the impacts of Section 382;
|
| - |
Base erosion anti-abuse tax (BEAT): The BEAT applies to certain U.S. corporations that make relevant deductible payments to foreign affiliates. The excess of 10% of a corporation’s taxable
income increased by those payments to foreign related parties over its regular tax liability, will be the base erosion tax due. BEAT provisions do not trigger adverse tax consequences for the U.S. subsidiaries of the Company
considering the amount of payments made to foreign affiliates for management and support services;
|
| - |
Potential tax erosion in the U.S.: The Company does not expect to have material adverse tax consequences in the U.S. subsidiaries as a result of the measures previously described.
|
F-52
Note 19.- Commitments, third-party guarantees, contingent assets and liabilities
Contractual obligations
The following tables shows the breakdown of the third-party commitments and contractual obligations as of December 31, 2019 and 2018:
|
2019
|
Total
|
2020
|
2021 and 2022
|
2023 and 2024
|
Subsequent
|
|||||||||||||||
|
Corporate debt
|
723,791
|
28,706
|
200,504
|
200,926
|
293,655
|
|||||||||||||||
|
Loans with credit institutions (project debt)
|
4,105,915
|
241,116
|
504,921
|
598,837
|
2,761,041
|
|||||||||||||||
|
Notes and bonds (project debt)
|
746,433
|
28,304
|
51,508
|
56,192
|
610,429
|
|||||||||||||||
|
Purchase commitments*
|
2,991,432
|
129,595
|
278,418
|
269,632
|
2,313,787
|
|||||||||||||||
|
Accrued interest estimate during the useful life of loans
|
2,472,070
|
294,676
|
549,320
|
471,535
|
1,156,539
|
|||||||||||||||
|
2018
|
Total
|
2019
|
2020 and 2021
|
2022 and 2023
|
Subsequent
|
|||||||||||||||
|
Corporate debt
|
684,073
|
268,905
|
107,560
|
205,258
|
102,350
|
|||||||||||||||
|
Loans with credit institutions (project debt)
|
4,314,307
|
233,214
|
476,191
|
571,374
|
3,033,528
|
|||||||||||||||
|
Notes and bonds (project debt)
|
776,807
|
31,241
|
49,445
|
54,879
|
641,242
|
|||||||||||||||
|
Purchase commitments*
|
3,082,495
|
131,417
|
264,461
|
259,775
|
2,426,842
|
|||||||||||||||
|
Accrued interest estimate during the useful life of loans
|
2,743,132
|
314,984
|
565,040
|
492,932
|
1,370,176
|
|||||||||||||||
The figures shown in the tables above do not include equity investments that the Company may be committed to realize in the future, if certain conditions are met, such as equity
investments in the PTS project.
*Purchase commitments included lease commitments for $93.0 million as of December 31, 2019 ($97.4 million as of December 31, 2018), of which $5.1 million is
due within one year and $87.9 million thereafter as of December 31, 2019 ($5.4 million due within one year and $92.0 million thereafter as of December 31, 2018).
Third-party guarantees
At the close of 2019 the overall sum of Bank Bond and Surety Insurance directly deposited by the subsidiaries of the Company as a guarantee to third parties (clients, financial entities
and other third parties) amounted to $38.2 million attributed to operations of technical nature ($32.4 million as of December 31, 2018). In addition, Atlantica Yield plc issued guarantees amounting to $130.1 million as of December 31,
2019 ($60.5 million as of December 31, 2018). Guarantees issued by Atlantica Yield plc correspond mainly to guarantees provided to off-takers in PPAs, guarantees replacing debt service reserve accounts and guarantees for points of access
for renewable projects, which have been partially canceled as of the date of this report.
Legal Proceedings
On October 17, 2016, ACT received a request for arbitration from the International Court of Arbitration of the International Chamber of Commerce presented by Pemex. Pemex was requesting
compensation for damages caused by a fire that occurred in their facilities during the construction of the ACT cogeneration plant in December 2012, for a total amount of approximately $20 million. On July 5, 2017, Seguros Inbursa, the
insurer of Pemex, joined as a second claimant in the process. On December 19, 2018 the parties of the arbitration executed a settlement agreement to finalize the claim without any financial impact for ACT. On March 8, 2019 the ICC
arbitration tribunal confirmed the settlement agreement and the arbitration was terminated.
A number of Abengoa’s subcontractors and insurance companies that issued bonds covering Abengoa’s obligations under such contracts in the U.S. have included some of the non-recourse subsidiaries of
Atlantica in the U.S. as co-defendants in claims against Abengoa. Generally, the subsidiaries of Atlantica have been dismissed as defendants at early stages of the processes. With respect to a claim addressed by a group of insurance
companies to a number of Abengoa’s subsidiaries and to Solana for Abengoa related losses of approximately $20 million that could increase, according to the insurance companies, up to a maximum of approximately $200 million if all their
exposure resulted in losses, Atlantica reached an agreement with all but one of the above-mentioned insurance companies, under which they agreed to dismiss their claims in exchange for payments of approximately $4.3 million, which were
paid in 2018. The insurance company that did not join the agreement has temporarily stopped legal actions against Atlantica, and Atlantica does not expect this particular claim to have a material adverse effect on its business.
F-53
In addition, an insurance company covering certain Abengoa’s obligations in Mexico has claimed certain amounts related to a potential loss. This claim is covered by existing indemnities
from Abengoa. Nevertheless, the Company has reached an agreement under which Atlantica´s maximum theoretical exposure would in any case be limited to approximately $35 million, including $2.5 million to be held in an escrow account. On
January 2019, the insurance company executed $2.5 million from the escrow account and Abengoa reimbursed such amount according to the existing indemnities in force between Atlantica and Abengoa. The payments by Atlantica would only happen
if and when the actual loss has been confirmed, Abengoa has not fulfilled their obligations and after arbitration, if the Company initiates it.
The Company is not a party to any other significant legal proceeding other than legal proceedings arising in the ordinary course of its business. The Company is party to various
administrative and regulatory proceedings that have arisen in the ordinary course of business. While the Company does not expect these proceedings, either individually or in the aggregate, to have a material adverse effect on its
financial position or results of operations, because of the nature of these proceedings the Company is not able to predict their ultimate outcomes, some of which may be unfavorable to the Company.
Other matters
Abengoa maintains a number of obligations under EPC, O&M and other contracts, as well as indemnities covering certain potential risks. Additionally, Abengoa represented that further
to the accession to its restructuring agreement, Atlantica would not be a guarantor of any obligation of Abengoa with respect to third parties and agreed to indemnify the Company for any penalty claimed by third parties resulting from any
breach in such representations. The Company has contingent assets, which have not been recognized as of December 31, 2019, related to the obligations of Abengoa referred above, which result and amounts will depend on the occurrence of
uncertain future events. In particular as of April 26, 2018 and November 27, 2018 Abengoa agreed to pay Atlantica certain amounts subject to conditions which are beyond the control of the Company.
The Company entered into a Financial Support Agreement on June 13, 2014, under which Abengoa agreed to maintain any guarantees and letters of credit that have been provided by it on
behalf of or for the benefit of Atlantica and its affiliates for a period of five years. This agreement with Abengoa expired in June 2019, and Abengoa’s commitment to maintain guarantees and letters of credit currently outstanding in the
Company´s affiliates´ favor expired, as well. The Company replaced all the guarantees where necessary.
Note 20.- Other operating income and expenses
The table below shows the detail of Other operating income and expenses for the years ended December 31, 2019, 2018 and 2017:
|
For the twelve-month year ended December 31,
|
||||||||||||
|
Other operating income
|
2019 | 2018 |
2017
|
|||||||||
|
Grants
|
59,142
|
59,421
|
59,707
|
|||||||||
|
Income from various services and insurance proceeds
|
34,632
|
34,181
|
21,137
|
|||||||||
|
Income from the purchase of the long-term operation and maintenance payable to Abengoa
|
-
|
38,955
|
-
|
|||||||||
|
Total
|
93,774
|
132,557
|
80,844
|
|||||||||
|
For the twelve-month year ended December 31,
|
||||||||||||
|
Other operating expenses
|
2019
|
2018
|
2017
|
|||||||||
|
Raw materials and consumables used
|
(9,719
|
)
|
(10,648
|
)
|
(16,983
|
)
|
||||||
|
Leases and fees
|
(1,850
|
)
|
(1,716
|
)
|
(6,641
|
)
|
||||||
|
Operation and maintenance
|
(116,018
|
)
|
(145,857
|
)
|
(129,873
|
)
|
||||||
|
Independent professional services
|
(41,579
|
)
|
(43,229
|
)
|
(36,178
|
)
|
||||||
|
Supplies
|
(25,823
|
)
|
(25,947
|
)
|
(20,350
|
)
|
||||||
|
Insurance
|
(23,971
|
)
|
(24,227
|
)
|
(24,289
|
)
|
||||||
|
Levies and duties
|
(34,844
|
)
|
(37,439
|
)
|
(52,409
|
)
|
||||||
|
Other expenses
|
(7,971
|
)
|
(21,579
|
)
|
(14,721
|
)
|
||||||
|
Total
|
(261,776
|
)
|
(310,642
|
)
|
(301,444
|
)
|
||||||
F-54
Grants income mainly relate to ITC cash grants and implicit grants recorded for accounting purposes in relation to the FFB loans with interest rates below market rates in Solana and
Mojave projects (Note 16).
Other operating income in 2018 includes $39.0 million one-time gain in relation to the purchase from Abengoa of the long-term operation and maintenance payable accrued for the period up to December 31,
2017.
Note 21.- Financial income and expenses
The following table sets forth financial income and expenses for the years ended December 31, 2019, 2018 and 2017:
|
For the year ended December 31,
|
||||||||||||
|
Financial income
|
2019 |
2018 |
2017 |
|||||||||
|
Interest income from loans and credits
|
3,665
|
36,296
|
325
|
|||||||||
|
Interest rates benefits derivatives: cash flow hedges
|
456
|
148
|
682
|
|||||||||
|
Total
|
4,121
|
36,444
|
1,007
|
|||||||||
| For the year ended December 31, | ||||||||||||
|
Financial expenses
|
2019
|
2018
|
2017
|
|||||||||
|
Expenses due to interest:
|
||||||||||||
|
- Loans from credit entities
|
(259,416
|
)
|
(256,736
|
)
|
(253,660
|
)
|
||||||
|
- Other debts
|
(89,256
|
)
|
(100,057
|
)
|
(137,562
|
)
|
||||||
|
Interest rates losses derivatives: cash flow hedges
|
(59,318
|
)
|
(68,226
|
)
|
(72,495
|
)
|
||||||
|
Total
|
(407,990
|
)
|
(425,019
|
)
|
(463,717
|
)
|
||||||
Financial income from loans and credits in 2018 primarily includes a non-monetary financial income of $36.6 million resulting from the refinancing of the debts of Helios 1&2 and
Helioenergy 1&2 in the second quarter of 2018 (Note 15).
Interests from other debts are primarily interests on the notes issued by ATS, ATN and Solaben Luxembourg and interests related to the investment from Liberty. The decrease in 2019 and
2018 are primarily due to a lower increase of the amortized cost of the Liberty debt compared to the previous year for $16 million and $23 million respectively (Note 16). Losses from interest rate derivatives designated as cash flow
hedges correspond primarily to transfers from equity to financial expense when the hedged item is impacting the consolidated income statement.
Other net financial income and expenses
The following table sets out Other net financial income and expenses for the years 2019, 2018 and 2017:
|
For the year ended December 31,
|
||||||||||||
|
Other financial income / (expenses)
|
2019
|
2018
|
2017
|
|||||||||
|
Dividend from ACBH (Brazil)
|
-
|
-
|
10,383
|
|||||||||
|
Other financial income
|
14,152
|
14,431
|
28,809
|
|||||||||
|
Other financial losses
|
(15,305
|
)
|
(22,666
|
)
|
(20,758
|
)
|
||||||
|
Total
|
(1,153
|
)
|
(8,235
|
) |
18,434
|
|||||||
According to an agreement reached with Abengoa in the third quarter of 2016, Abengoa acknowledged that Atlantica Yield is the legal owner of the dividends declared on February 24, 2017
and retained from Abengoa amounting to $10.4 million. As a result, the Company recorded $10.4 million as Other financial income on 2017 in accordance with the accounting treatment previously given to the ACBH dividend.
F-55
Other financial income in 2019 and 2018 are primarily interests on deposits and on loan granted to third parties. In 2017, it included a $16.2 million income as a result of the
termination of the currency swap agreement with Abengoa.
Other financial losses primarily include expenses for guarantees and letters of credit, wire transfers, other bank fees and other minor financial expenses.
Note 22.- Earnings per share
Basic earnings per share for the year 2019 has been calculated by dividing the profit/(loss) attributable to equity holders of the company by the number of shares outstanding. Diluted
earnings per share equals basic earnings per share for the years presented.
|
For the year ended December 31,
|
||||||||||||
|
Item
|
2019
|
2018
|
2017
|
|||||||||
|
Profit/(loss) from continuing operations attributable to Atlantica Yield Plc.
|
62,135
|
41,596
|
(111,804
|
)
|
||||||||
|
Average number of ordinary shares outstanding (thousands) - basic and diluted
|
101,063
|
100,217
|
100,217
|
|||||||||
|
Earnings per share from continuing operations (US dollar per share) - basic and diluted
|
0.61
|
0.42
|
(1.12
|
)
|
||||||||
|
Earnings per share from profit/ (loss) for the period (US dollar per share) - basic and diluted
|
0.61
|
0.42
|
(1.12
|
)
|
||||||||
Note 23.- Other information
23.1 Restricted Net assets
Certain of the consolidated entities are restricted from remitting certain funds to Atlantica Yield plc. as a result of a number of regulatory, contractual or statutory requirements.
These restrictions are mainly related to standard requirements to maintain debt service coverage ratios and other requirements from the financing arrangements. In addition, the Company considered Mojave´s net assets as restricted since
PG&E filed for reorganization under Chapter 11, resulting in a technical event of default being triggered under Mojave´s project finance agreement in July 2019. At December 31, 2019, the accumulated amount of the temporary
restrictions for the entire restricted term of these affiliates was $789 million.
The Company performed a test on the restricted net assets of consolidated subsidiaries in accordance with Securities and Exchange Commission Regulation S-X Rule 12-04 and concluded the
restricted net assets exceeded 25% of the consolidated net assets of the Company as of December 31, 2019. Therefore, the separate financial statements of Atlantica Yield, Plc. do have to be presented (see Appendix V (Schedule I) for
details).
23.2. United Kingdom’s exit from the European Union
On January 31, 2020, the United Kingdom (“UK”) ceased to be part of the European Union (“EU”) and entered into a transition period to, among other things, negotiate an agreement with
the EU on the future terms of the UK´s relationship with the EU. The transition period is currently expected to end on December 31, 2020. As of the date of this report, the UK and the EU have not reached an agreement. Therefore, the
impact of the UK’s departure from, and future relationship with the EU are uncertain.
23.3 Subsequent events
On February 26, 2020, the Board of Directors of the Company approved a dividend of $0.41 per share, which is expected to be paid on March 23, 2020.
F-56
Appendix I
Entities included in the Group as subsidiaries as of December 31, 2019
|
Company name
|
Project name
|
Registered address
|
% of
nominal
share
|
Business
|
||||
|
ACT Energy México, S. de R.L. de C.V.
|
ACT
|
Santa Barbara (Mexico)
|
100.00
|
(2)
|
||||
|
ABY infrastructures USA LLC.
|
Arizona (United States)
|
100.00
|
(5)
|
|||||
|
ABY Concessions Infrastructures, S.LU.
|
Seville (Spain)
|
100.00
|
(5)
|
|||||
|
ABY Concessions Perú, S.A.
|
Lima (Peru)
|
100.00
|
(5)
|
|||||
|
ABY Holdings USA LLC
|
Arizona (United States)
|
100.00
|
(5)
|
|||||
|
ASHUSA Inc.
|
Arizona (United States)
|
100.00
|
(5)
|
|||||
|
ABY South Africa (Pty) Ltd
|
Pretoria (South Africa)
|
100.00
|
(5)
|
|||||
|
ASUSHI, Inc.
|
Arizona (United States)
|
100.00
|
(5)
|
|||||
|
Atlantica Yield Chile SpA
|
Santiago de Chile (Chile)
|
100.00
|
(5)
|
|||||
|
ATN, S.A.
|
ATN
|
Lima (Peru)
|
100.00
|
(1)
|
||||
|
ABY Transmisión Sur, S.A.
|
ATS
|
Lima (Peru)
|
100.00
|
(1)
|
||||
|
ACT Holdings, S.A. de C.V.
|
Mexico D.F. (Mexico)
|
100.00
|
(5)
|
|||||
|
Aguas de Skikda S.P.A.
|
Skikda
|
Dely Ibrahim (Algeria)
|
51.00
|
(4)
|
||||
|
Arizona Solar One, LLC.
|
Solana
|
Arizona (United States)
|
100.00
|
(3)
|
||||
|
ASI Operations LLC
|
Arizona (United States)
|
100.00
|
(3)
|
|||||
|
ASO Holdings Company, LLC.
|
Colorado (United States)
|
100.00*
|
(5)
|
|||||
|
Atlantica Investment Ltd.
|
Brentford (United Kingdom)
|
100.00
|
(5)
|
|||||
|
AYES International UK Ltd
|
Brentford (United Kingdom)
|
100.00
|
(5)
|
|||||
|
Atlantica Yield España S.L.
|
Seville (Spain)
|
100.00
|
(5)
|
|||||
|
ATN 2, S.A.
|
ATN 2
|
Lima (Peru)
|
100.00
|
(1)
|
||||
|
AY Holding Uruguay, S.A.
|
Montevideo (Uruguay)
|
100.00
|
(5)
|
|||||
|
AYES Canada Inc.
|
Vancouver (Canada)
|
10.00**
|
(5)
|
|||||
|
Banitod, S.A.
|
Montevideo (Uruguay)
|
100.00
|
(5)
|
|||||
|
Cadonal, S.A.
|
Cadonal
|
Montevideo (Uruguay)
|
100.00
|
(3)
|
||||
|
Carpio Solar Inversiones, S.A.
|
Seville (Spain)
|
100.00
|
(5)
|
|||||
|
Ecija Solar Inversiones, S.A.
|
Seville (Spain)
|
100.00
|
(5)
|
|||||
|
CKA1 Holding S. de R.L. de C.V.
|
Mexico D.F. (Mexico)
|
100.00
|
(5)
|
|||||
|
Estrellada, S.A.
|
Melowind
|
Montevideo (Uruguay)
|
100.00
|
(3)
|
||||
|
Extremadura Equity Investments Sárl.
|
Luxembourg (Luxembourg)
|
100.00
|
(5)
|
|||||
|
Fotovoltaica Solar Sevilla, S.A.
|
Seville PV
|
Seville (Spain)
|
80.00
|
(3)
|
||||
|
Geida Skikda, S.L.
|
Madrid (Spain)
|
67.00
|
(5)
|
|||||
|
Helioenergy Electricidad Uno, S.A.
|
Helioenergy 1
|
Seville (Spain)
|
100.00
|
(3)
|
||||
|
Helioenergy Electricidad Dos, S.A.
|
Helioenergy 2
|
Seville (Spain)
|
100.00
|
(3)
|
||||
|
Helios I Hyperion Energy Investments, S.A.
|
Helios 1
|
Seville (Spain)
|
100.00
|
(3)
|
||||
|
Helios II Hyperion Energy Investments, S.A.
|
Helios 2
|
Seville (Spain)
|
100.00
|
(3)
|
||||
|
Hidrocañete S.A.
|
Mini-Hydro
|
Lima (Peru)
|
100.00
|
(3)
|
||||
|
Hypesol Energy Holding, S.L.
|
Seville (Spain)
|
100.00
|
(5)
|
|||||
|
Kaxu Solar One (Pty) Ltd.
|
Kaxu
|
Gauteng (South Africa)
|
51.00
|
(3)
|
||||
|
Logrosán Equity Investments Sárl.
|
Luxembourg (Luxembourg)
|
100.00
|
(5)
|
|||||
|
Logrosán Solar Inversiones, S.A.
|
Seville (Spain)
|
100.00
|
(5)
|
|||||
|
Logrosán Solar Inversiones Dos, S.L.
|
Seville (Spain)
|
100.00
|
(5)
|
|||||
|
Mojave Solar Holdings, LLC.
|
Colorado (United States)
|
100.00
|
(5)
|
|||||
|
Mojave Solar LLC.
|
Mojave
|
Arizona (United States)
|
100.00
|
(3)
|
||||
|
Palmatir S.A.
|
Palmatir
|
Montevideo (Uruguay)
|
100.00
|
(3)
|
F-57
|
Palmucho, S.A.
|
Palmucho
|
Santiago de Chile (Chile)
|
100.00
|
(1)
|
||||
|
RRHH Servicios Corporativos, S. de R.L. de C.V.
|
Santa Barbara. (Mexico)
|
100.00
|
(5)
|
|||||
|
Sanlucar Solar, S.A.
|
PS-10
|
Seville (Spain)
|
100.00
|
(3)
|
||||
|
Solaben Electricidad Uno S.A.
|
Solaben 1
|
Caceres (Spain)
|
100.00
|
(3)
|
||||
|
Solaben Electricidad Dos S.A.
|
Solaben 2
|
Caceres (Spain)
|
70.00
|
(3)
|
||||
|
Solaben Electricidad Tres S.A.
|
Solaben 3
|
Caceres (Spain)
|
70.00
|
(3)
|
||||
|
Solaben Electricidad Seis S.A.
|
Solaben 6
|
Caceres (Spain)
|
100.00
|
(3)
|
||||
|
Solaben Luxembourg S.A.
|
Luxembourg (Luxembourg)
|
100.00
|
(5)
|
|||||
|
Solacor Electricidad Uno, S.A.
|
Solacor 1
|
Seville (Spain)
|
87.00
|
(3)
|
||||
|
Solacor Electricidad Dos, S.A.
|
Solacor 2
|
Seville (Spain)
|
87.00
|
(3)
|
||||
|
ABY Servicios Corporativos S.A.
|
Seville (Spain)
|
100.00
|
(5)
|
|||||
|
Solar Processes, S.A.
|
PS-20
|
Seville (Spain)
|
100.00
|
(3)
|
||||
|
Solnova Solar Inversiones, S.A.
|
Seville (Spain)
|
100.00
|
(5)
|
|||||
|
Solnova Electricidad, S.A.
|
Solnova 1
|
Seville (Spain)
|
100.00
|
(3)
|
||||
|
Solnova Electricidad Tres, S.A.
|
Solnova 3
|
Seville (Spain)
|
100.00
|
(3)
|
||||
|
Solnova Electricidad Cuatro, S.A.
|
Solnova 4
|
Seville (Spain)
|
100.00
|
(3)
|
||||
|
Transmisora Mejillones, S.A.
|
Quadra 1
|
Santiago de Chile (Chile)
|
100.00
|
(1)
|
||||
|
Transmisora Baquedano, S.A.
|
Quadra 2
|
Santiago de Chile (Chile)
|
100.00
|
(1)
|
| (1) |
Business sector: Electric transmission lines
|
| (2) |
Business sector: Efficient natural gas
|
| (3) |
Business sector: Renewable energy
|
| (4) |
Business sector: Water
|
| (5) |
Holding Company
|
| * |
100% of Class A shares held by Liberty (US tax equity investor, non-related party).
|
| ** |
Atlantica has control over AYES Canada Inc. under IFRS 10, Consolidated Financial Statements.
|
The Appendices are an integral part of the Notes to the financial statements.
F-58
Appendices
Appendix I
Entities included in the Group as subsidiaries as of December 31, 2018
|
Company name
|
Project name
|
Registered address
|
% of
nominal
share
|
Business
|
||||
|
ACT Energy México, S. de R.L. de C.V.
|
ACT
|
Santa Barbara (Mexico)
|
100.00
|
(2)
|
||||
|
ABY infraestructuras, S.L.
|
Seville (Spain)
|
100.00
|
(5)
|
|||||
|
ABY infrastructures USA LLC.
|
Arizona (United States)
|
100.00
|
(5)
|
|||||
|
ABY Concessions Infrastructures, S.LU.
|
Seville (Spain)
|
100.00
|
(5)
|
|||||
|
ABY Concessions Perú, S.A.
|
Lima (Peru)
|
100.00
|
(5)
|
|||||
|
ABY Holdings USA LLC
|
Arizona (United States)
|
100.00
|
(5)
|
|||||
|
ASHUSA Inc.
|
Arizona (United States)
|
100.00
|
(5)
|
|||||
|
ABY South Africa (Pty) Ltd
|
Pretoria (South Africa)
|
100.00
|
(5)
|
|||||
|
ASUSHI, Inc.
|
Arizona (United States)
|
100.00
|
(5)
|
|||||
|
Atlantica Yield Chile SpA
|
Santiago de Chile (Chile)
|
100.00
|
(5)
|
|||||
|
ATN, S.A.
|
ATN
|
Lima (Peru)
|
100.00
|
(1)
|
||||
|
ABY Transmisión Sur, S.A.
|
ATS
|
Lima (Peru)
|
100.00
|
(1)
|
||||
|
ACT Holdings, S.A. de C.V.
|
Mexico D.F. (Mexico)
|
100.00
|
(5)
|
|||||
|
Aguas de Skikda S.P.A.
|
Skikda
|
Dely Ibrahim (Algeria)
|
51.00
|
(4)
|
||||
|
Arizona Solar One, LLC.
|
Solana
|
Arizona (United States)
|
100.00
|
(3)
|
||||
|
ASO Holdings Company, LLC.
|
Colorado (United States)
|
100.00*
|
(5)
|
|||||
|
Atlantica Investment Ltd.
|
Brentford (United Kingdom)
|
100.00
|
(5)
|
|||||
|
ATN 2, S.A.
|
ATN 2
|
Lima (Peru)
|
100.00
|
(1)
|
||||
|
AY Holding Uruguay, S.A.
|
Montevideo (Uruguay)
|
100.00
|
(5)
|
|||||
|
Banitod, S.A.
|
Montevideo (Uruguay)
|
100.00
|
(5)
|
|||||
|
Cadonal, S.A.
|
Cadonal
|
Montevideo (Uruguay)
|
100.00
|
(3)
|
||||
|
Carpio Solar Inversiones, S.A.
|
Seville (Spain)
|
100.00
|
(5)
|
|||||
|
Ecija Solar Inversiones, S.A.
|
Seville (Spain)
|
100.00
|
(5)
|
|||||
|
CKA1 Holding S. de R.L. de C.V.
|
Mexico D.F. (Mexico)
|
100.00
|
(5)
|
|||||
|
Estrellada, S.A.
|
Melowind
|
Montevideo (Uruguay)
|
100.00
|
(3)
|
||||
|
Extremadura Equity Investments Sárl.
|
Luxembourg (Luxembourg)
|
100.00
|
(5)
|
|||||
|
Fotovoltaica Solar Sevilla, S.A.
|
Seville PV
|
Seville (Spain)
|
80.00
|
(3)
|
||||
|
Geida Skikda, S.L.
|
Madrid (Spain)
|
67.00
|
(5)
|
|||||
|
Helioenergy Electricidad Uno, S.A.
|
Helioenergy 1
|
Seville (Spain)
|
100.00
|
(3)
|
||||
|
Helioenergy Electricidad Dos, S.A.
|
Helioenergy 2
|
Seville (Spain)
|
100.00
|
(3)
|
||||
|
Helios I Hyperion Energy Investments, S.A.
|
Helios 1
|
Seville (Spain)
|
100.00
|
(3)
|
||||
|
Helios II Hyperion Energy Investments, S.A.
|
Helios 2
|
Seville (Spain)
|
100.00
|
(3)
|
||||
|
Hidrocañete S.A.
|
Mini-Hydro
|
Lima (Peru)
|
100.00
|
(3)
|
||||
|
Hypesol Energy Holding, S.L.
|
Seville (Spain)
|
100.00
|
(5)
|
|||||
|
Kaxu Solar One (Pty) Ltd.
|
Kaxu
|
Gauteng (South Africa)
|
51.00
|
(3)
|
||||
|
Logrosán Equity Investments Sárl.
|
Luxembourg (Luxembourg)
|
100.00
|
(5)
|
|||||
|
Logrosán Solar Inversiones, S.A.
|
Seville (Spain)
|
100.00
|
(5)
|
|||||
|
Logrosán Solar Inversiones Dos, S.L.
|
Seville (Spain)
|
100.00
|
(5)
|
|||||
|
Mojave Solar Holdings, LLC.
|
Colorado (United States)
|
100.00
|
(5)
|
|||||
|
Mojave Solar LLC.
|
Mojave
|
Arizona (United States)
|
100.00
|
(3)
|
||||
|
Palmatir S.A.
|
Palmatir
|
Montevideo (Uruguay)
|
100.00
|
(3)
|
||||
|
Palmucho, S.A.
|
Palmucho
|
Santiago de Chile (Chile)
|
100.00
|
(1)
|
||||
|
RRHH Servicios Corporativos, S. de R.L. de C.V.
|
Santa Barbara. (Mexico)
|
100.00
|
(5)
|
F-59
|
Sanlucar Solar, S.A.
|
PS-10
|
Seville (Spain)
|
100.00
|
(3)
|
||||
|
Solaben Electricidad Uno S.A.
|
Solaben 1
|
Caceres (Spain)
|
100.00
|
(3)
|
||||
|
Solaben Electricidad Dos S.A.
|
Solaben 2
|
Caceres (Spain)
|
70.00
|
(3)
|
||||
|
Solaben Electricidad Tres S.A.
|
Solaben 3
|
Caceres (Spain)
|
70.00
|
(3)
|
||||
|
Solaben Electricidad Seis S.A.
|
Solaben 6
|
Caceres (Spain)
|
100.00
|
(3)
|
||||
|
Solaben Luxembourg S.A.
|
Luxembourg (Luxembourg)
|
100.00
|
(5)
|
|||||
|
Solacor Electricidad Uno, S.A.
|
Solacor 1
|
Seville (Spain)
|
87.00
|
(3)
|
||||
|
Solacor Electricidad Dos, S.A.
|
Solacor 2
|
Seville (Spain)
|
87.00
|
(3)
|
||||
|
ABY Servicios Corporativos S.A.
|
Seville (Spain)
|
100.00
|
(5)
|
|||||
|
Solar Processes, S.A.
|
PS-20
|
Seville (Spain)
|
100.00
|
(3)
|
||||
|
Solnova Solar Inversiones, S.A.
|
Seville (Spain)
|
100.00
|
(5)
|
|||||
|
Solnova Electricidad, S.A.
|
Solnova 1
|
Seville (Spain)
|
100.00
|
(3)
|
||||
|
Solnova Electricidad Tres, S.A.
|
Solnova 3
|
Seville (Spain)
|
100.00
|
(3)
|
||||
|
Solnova Electricidad Cuatro, S.A.
|
Solnova 4
|
Seville (Spain)
|
100.00
|
(3)
|
||||
|
Transmisora Mejillones, S.A.
|
Quadra 1
|
Santiago de Chile (Chile)
|
100.00
|
(1)
|
||||
|
Transmisora Baquedano, S.A.
|
Quadra 2
|
Santiago de Chile (Chile)
|
100.00
|
(1)
|
| (1) |
Business sector: Electric transmission lines
|
| (2) |
Business sector: Efficient natural gas
|
| (3) |
Business sector: Renewable energy
|
| (4) |
Business sector: Water
|
| (5) |
Holding Company
|
| * |
100% of Class A shares held by Liberty (US tax equity investor, non-related party).
|
The Appendices are an integral part of the Notes to the financial statements.
F-60
Appendix II
Investments recorded under the equity method as of December 31, 2019
|
Company name
|
Project
name
|
Registered
address
|
% of
nominal
share
|
Business
|
||||||||
|
ABY Infraestructuras, S.L.
|
Seville (Spain)
|
20.0
|
(3)
|
|||||||||
|
AC Renovables Sol 1 S.A.S. E.S.P.
|
Bogota (Colombia)
|
50.0
|
(3)
|
|||||||||
|
Amherst Island Partnership
|
Windlectric
|
Ontario (Canada)
|
30.0
|
(3)
|
||||||||
|
Arroyo Energy Netherlands II B.V.
|
Monterrey
|
Amsterdam (Netherlands)
|
30.0
|
(2)
|
||||||||
|
Ca Ku A1, S.A.P.I de CV
|
Mexico D.F. (Mexico)
|
5.0
|
(2)
|
|||||||||
|
Evacuacion Valdecaballeros, S.L.
|
Caceres (Spain)
|
57.2
|
(3)
|
|
||||||||
|
Evacuación Villanueva del Rey, S.L.
|
Seville (Spain)
|
40.0
|
(3)
|
|
||||||||
|
Geida Tlemcen S.L.
|
Honaine
|
Madrid (Spain)
|
50.0
|
(4)
|
|
|||||||
|
PA Renovables Sol 1 S.A.S. E.S.P.
|
Bogota (Colombia)
|
50.0
|
(3)
|
|||||||||
|
Pectonex R.F.
|
Pretoria (South Africa)
|
50.0
|
(3)
|
|
||||||||
|
SJ Renovables Sun 1 S.A.S. E.S.P.
|
Bogota (Colombia)
|
50.0
|
(3)
|
|
||||||||
|
SJ Renovables Wind 1 S.A.S. E.S.P.
|
Bogota (Colombia)
|
50.0
|
(3)
|
|
||||||||
F-61
Investments recorded under the equity method as of December 31, 2018
|
Company name
|
Project
name
|
Registered
address
|
% of
nominal
share
|
Business
|
||||||||
|
Evacuacion Valdecaballeros, S.L.
|
Caceres (Spain)
|
57.2
|
(3
|
)
|
||||||||
|
Geida Tlemcen S.L.
|
Honaine
|
Madrid (Spain)
|
50.0
|
(4
|
)
|
|||||||
|
Pectonex R.F.
|
Pretoria (South Africa)
|
50.0
|
(3
|
)
|
||||||||
|
Evacuación Villanueva del Rey, S.L.
|
Seville (Spain)
|
40.0
|
(3
|
)
|
||||||||
|
Ca Ku A1, S.A.P.I de CV
|
Mexico D.F. (Mexico)
|
5.0
|
(2
|
)
|
||||||||
| (1) |
Business sector: Electric transmission lines
|
| (2) |
Business sector: Efficient natural gas
|
| (3) |
Business sector: Renewable energy
|
| (4) |
Business sector: Water
|
| (5) |
Holding Company
|
The Appendices are an integral part of the Notes to the consolidated financial statements.
F-62
|
Appendix III-1
|
Projects subject to the application of IFRIC 12 interpretation based on the concession of
services as of December 31, 2019 and 2018
Description of the Arrangements
Solana
Solana is a 250 MW net (280 MW gross) solar electric generation facility located in Maricopa County, Arizona, approximately 70 miles southwest of Phoenix. Arizona Solar One LLC, or
Arizona Solar, owns the Solana project. Solana includes a 22-mile 230kV transmission line and a molten salt thermal energy storage system. The construction of Solana commenced in December 2010 and Solana reached COD on October 9, 2013.
Solana has a 30-year, PPA with Arizona Public Service, or APS, approved by the Arizona Corporation Commission (ACC). The PPA provides for the sale of electricity at a fixed price per
MWh with annual increases of 1.84% per year. The PPA includes limitations on the amount and condition of the energy that is received by APS with minimum and maximum thresholds for delivery capacity that must not be breached.
Mojave
Mojave is a 250 MW net (280 MW gross) solar electric generation facility located in San Bernardino County, California, approximately 100 miles northeast of Los Angeles. Abengoa
commenced construction of Mojave in September 2011 and Mojave reached COD on December 1, 2014.
Mojave has a 25-year, PPA with Pacific Gas & Electric Company, or PG&E, approved by the California Public Utilities Commission (CPUC). The PPA began on COD. The PPA provides for
the sale of electricity at a fixed base price per MWh without any indexation mechanism, including limitations on the amount and condition of the energy that is received by PG&E with minimum and maximum thresholds for delivery capacity
that must not be breached.
Palmatir
Palmatir is an on-shore wind farm facility in Uruguay with nominal installed capacity of 50 MW. Palmatir has 25 wind turbines and each turbine has a nominal capacity of 2 MW. UTE
(Administracion Nacional de Usinas y Transmisiones Electricas), Uruguay’s state-owned electricity company, has agreed to purchase all energy produced by Palmatir pursuant to a 20-year PPA.
Palmatir reached COD in May 2014. The wind farm is located in Tacuarembo, 170 miles north of the city of Montevideo.
Palmatir signed a PPA with UTE on September 14, 2011 for 100% of the electricity produced, approved by URSEA (Unidad Reguladora de Servicios de Energia y Agua). UTE will pay a
fixed-price tariff per MWh under the PPA, which is denominated in U.S. dollars and will be partially adjusted in January of each year according to a formula based on inflation.
Cadonal
Cadonal is an on-shore wind farm facility in Uruguay with nominal installed capacity of 50 MW. Cadonal has 25 wind turbines and each turbine has a nominal capacity of 2 MW each. UTE
(Administracion Nacional de Usinas y Trasmisiones Electricas), Uruguay´s state-owned electricity company, has agreed to purchase all energy produced by Cadonal pursuant to a 20-year PPA.
Cadonal reached COD in December 2014. The wind farm is located in Flores, 105 miles north of the city of Montevideo.
Cadonal signed a PPA with UTE on December 28, 2012 for 100% of the electricity produced, approved by URSEA (Unidad Reguladora de Servicios de Energia y Agua). UTE pays a fixed tariff
per MWh under the PPA, which is denominated in U.S. dollars and will be adjusted every January considering both U.S. and Uruguay´s inflation indexes and the exchange rate between Uruguayan pesos and U.S. dollars.
F-63
Solaben 2 & Solaben 3
The Solaben 2 and Solaben 3 are two 50 MW Concentrating Solar Power facilities and are part of Abengoa’s Extremadura Solar Complex. The Extremadura Solar Complex consists of four
Concentrating Solar Power plants (Solaben 1, Solaben 2, Solaben 3 and Solaben 6), and is located in the municipality of Logrosan, Spain. Abengoa commenced construction of Solaben 2 and Solaben 3 in August 2010. Solaben 2 reached COD in
June 2012 and Solaben 3 reached COD in October 2012. Solaben Electricidad Dos, S.A., or SE2, owns Solaben 2 and Solaben Electricidad Tres, S.A., or SE3, owns Solaben 3.
Renewable energy plants in Spain, like Solaben 2 and Solaben 3, are regulated by the Government through a series of laws and rulings which guarantee the owners of the plants a
reasonable remuneration for their investments. Solaben 2 and Solaben 3 sell the power they produce into the wholesale electricity market, where offer and demand are matched and the pool price is determined, and also receive additional
payments from the Comision Nacional de los Mercados y de la Competencia, or CNMC, the Spanish state-owned regulator.
Solacor 1 & Solacor 2
The Solacor 1 and Solacor 2 are two 50 MW Concentrating Solar Power facilities and are part of Abengoa’s El Carpio Solar Complex, located in the municipality of El Carpio, Spain. The
Carpio Solar Complex consists in a conventional parabolic trough Concentrating Solar Power system to generate electricity. Abengoa commenced construction of Solacor 1 and Solacor 2 in September 2010. The COD was reached in two phases, the
first one, Solacor 1, was reached in February 2012 and the second one, Solacor 2, was reached in March 2012. JGC Corporation holds 13% of Solacor 1 & Solacor 2, a Japanese engineering company.
Renewable energy plants in Spain, like Solacor 1 and Solacor 2, are regulated by the Government through a series of laws and rulings which guarantee the owners of the plants a
reasonable remuneration for their investments. Solacor 1 and Solacor 2 sell the power they produce into the wholesale electricity market, where offer and demand are matched and the pool price is determined, and also receive additional
payments from the Comision Nacional de los Mercados y de la Competencia, or CNMC, the Spanish state-owned regulator.
ACT
The ACT plant is a gas-fired cogeneration facility with a rated capacity of approximately 300 MW and between 550 and 800 metric tons per hour of steam. The plant includes a substation
and an approximately 52 mile and 115-kilowatt transmission line.
On September 18, 2009, ACT Energy México entered into the Pemex Conversion Services Agreement, or the Pemex CSA, with Petroleos Mexicanos, or Pemex. Pemex is a state-owned oil and gas
company supervised by the Comision Reguladora de Energía (CRE), the Mexican state agency that regulates the energy industry. The Pemex CSA has a term of 20 years from the in-service date and will expire on March 31, 2033.
According to the Pemex CSA, ACT must provide, in exchange for a fixed price with escalation adjustments, services including the supply and transformation of natural gas and water into
thermal energy and electricity. Part of the electricity is to be supplied directly to a Pemex facility nearby, allowing the Comision Federal de Electricidad (CFE) to supply less electricity to that facility. Approximately 90% of the
electricity must be injected into the Mexican electricity network to be used by retail and industrial end customers of CFE in the region. Pemex is then entitled to receive an equivalent amount of energy in more than 1,000 of their
facilities in other parts of the country from CFE, following an adjustment mechanism under the supervision of CFE.
The Pemex CSA is denominated in U.S. dollars. The price is a fixed tariff and will be adjusted annually, part of it according to inflation and part according to a mechanism agreed in
the contract that on average over the life of the contract reflects expected inflation. The components of the price structure and yearly adjustment mechanisms were prepared by Pemex and provided to bidders as part of the request for
proposal documents.
F-64
ATN
ATN, or the ATN Project, in Peru is part of the SGT (Sistema Garantizado de Transmision), which includes all transmission line concessions allocated by a bidding process by the
government and is comprised of the following facilities:
| (i) |
the approximately 356 mile, 220kV line from Carhuamayo-Paragsha-Conococha-Kiman-Ayllu-Cajamarca Norte;
|
| (ii) |
the 4.3 mile, 138kV link between the existing Huallanca substation and Kiman Ayllu substations;
|
| (iii) |
the 1.9 mile, 138kV link between the 138kV Carhuamayo substation and the 220kV Carhuamayo substation;
|
| (iv) |
the new Conococha and Kiman Ayllu substations; and
|
| (v) |
the expansion of the Cajamarca Norte, 220kV Carhuamayo, 138kV Carhuamayo and 220kV Paragsha substations.
|
Additionally, on December 28, 2018 ATN completed the acquisition of a 220-kV power substation and two small transmission lines to connect the lines of the Company to the Shahuindo mine
located nearby (ATN Expansion 1) and, on October 22, 2019, the Company closed the acquisition of ATN Expansion 2.
Pursuant to the initial concession agreement, the Ministry of Energy, on behalf of the Peruvian Government, granted ATN a concession to construct, develop, own, operate and maintain the
ATN Project. The initial concession agreement became effective on May 22, 2008 and will expire 30 years after COD of the first tranche of the line, which took place in January 2011. ATN is obliged to provide the service of transmission of
electric energy through the operation and maintenance of the electric transmission line, according to the terms of the contract and the applicable law.
The laws and regulations of Peru establish the key parameters of the concession contract, the price indexation mechanism, the rights and obligations of the operator and the procedures
that have to be followed in order to fix the applicable tariff, which occurs through a regulated bidding process. Once the bidding process is complete and the operator is granted the concession, the pricing of the power transmission
service is established in the concession agreement. ATN has a 30-year concession agreement with a fixed-price tariff base denominated in U.S. dollars that is adjusted annually after COD of each line, in accordance with the U.S. Finished
Goods Less Food and Energy Index published by the U.S. Department of Labor.
ATS
ABY Transmision Sur, or ATS Project, in Peru is part of the Guaranteed Transmission System, or (Sistema Garantizado de Transmisión) which includes all transmission line concessions
allocated by a bidding process by the government, and is comprised of:
| (i) |
one 500kV electric transmission line and two short 220kV electric transmission lines, which are linked to existing substations;
|
| (ii) |
three new 500kV substations; and
|
| (iii) |
three existing substations (two existing 220kV substations and one existing 550/220kV substation), through the development of new transformers, line reactors, series reactive compensation and
shunt reactions in some substations.
|
Pursuant to the initial concession agreement, the Ministry of Energy, on behalf of the Peruvian Government, granted ATS a concession to construct, develop, own, operate and maintain the
ATS Project. The initial concession agreement became effective on July 22, 2010 and will expire 30 years after COD, which took place in January 2014. ATS is obliged to provide the service of transmission of electric energy through the
operation and maintenance of the electric transmission line, according to the terms of the contract and the applicable law.
The laws and regulations of Peru establish the key parameters of the concession contract, the price indexation mechanism, the rights and obligations of the operator and the procedure
that has to be followed in order to fix the applicable tariff, which occurs through a regulated bidding process. Once the bidding process is complete and the operator is granted the concession, the pricing of the power transmission
service is established in the concession agreement. ATS has a 30-year concession agreement with fixed-price tariff base denominated in U.S. dollars that is adjusted annually after COD of each line, in accordance with the U.S. Finished
Goods Less Food and Energy Index published by the U.S. Department of Labor.
F-65
Quadra 1 & Quadra 2
Transmisora Mejillones, or Quadra 1, is a 49-miles transmission line project and Tranmisora Baquedano, or Quadra 2, is a 32-miles transmission line project, each connected to the Sierra
Gorda substations.
Both projects have concession agreements with Sierra Gorda SCM. The agreements are denominated in U.S. dollars and are indexed mainly to CPI. The concession agreements each have a
21-year term that began on COD, which took place in April 2014 and March 2014 for Quadra 1 and Quadra 2, respectively.
Quadra 1 and Quadra 2 belong to the Northern Interconnected System (SING), one of the two interconnected systems into which the Chilean electricity market is divided and structured for
both technical and regulatory purposes.
As part of the SING, Quadra 1 and Quadra 2 and the service they provide are regulated by several regulatory bodies, in particular: the Superintendent’s office of Electricity and Fuels
(Superintendencia de Electricidad y Combustibles, SEC), the Economic Local Dispatch Center (Centro de Despacho Economico de Cargas, CDEC), the National Board of Energy (Comision Nacional de Energia, CNE) and the National Environmental
Board (Comision Nacional de Medio Ambiente, CONAMA) and other environmental regulatory bodies.
In all these concession arrangements, the operator has all the rights necessary to manage, operate and maintain the assets and the obligation to provide the services defined above,
which are clearly defined in each concession contract and in the applicable regulations in each country.
Helioenergy 1&2
The Helioenergy 1/2 project is located in Ecija, Spain. Abengoa started the construction of Helioenergy in 2010, and reached COD in 2011. Since COD, the projects have obtained good
generation results achieving systematically year after year results aligned or above the target productions defined.
Helioenergy relies on a Conventional parabolic trough Concentrating Solar Power system to generate electricity. Helioenergy evacuates its electricity through an aerial underground line
220 kV from the substation of the plant to a 220 kV line that ends in SET Villanueva del Rey (owned by Red Eléctrica de España), where the connection point of the plant is located.
Renewable energy plants in Spain, like Helionergy 1 and Helionergy 2, are regulated by the Government through a series of laws and rulings which guarantee the owners of the plants a
reasonable remuneration for their investments. Helionergy 1 and Helionergy 2 sell the power they produce into the wholesale electricity market, where offer and demand are matched and the pool price is determined, and also receive
additional payments from the Comision Nacional de los Mercados y de la Competencia, or CNMC, the Spanish state-owned regulator.
Helios 1&2
The Helios 1/2 project is a 100 MW Concentrating Solar Power facility known as Plataforma Solar Castilla la Mancha, located in the municipality of Arenas de San Juan, Puerto Lápice and
Villarta de San Juan, Spain. Helios 1 COD was reached in 2Q 2012, Helios 2 COD was reached in 3Q 2012. Since COD, the projects have obtained good generation results aligned or above the production targets.
Helios 1/2 relies on a Conventional parabolic trough Concentrating Solar Power system to generate electricity. The technology is identical to the one used at Solaben 2/3 and Solacor
1/2.
F-66
Renewable energy plants in Spain, like Helios 1 and Helios 2, are regulated by the Government through a series of laws and rulings which guarantee the owners of the plants a reasonable
remuneration for their investments. Helios 1 and Helios 2 sell the power they produce into the wholesale electricity market, where offer and demand are matched and the pool price is determined, and also receive additional payments from
the Comision Nacional de los Mercados y de la Competencia, or CNMC, the Spanish state-owned regulator.
Solnova 1,3&4
The Solnova 1/3/4 project is a 150 MW Concentrating Solar Power facility, part of the Sanlucar Solar Platform, located in the municipality of Sanlucar la Mayor, Spain. Solnova 1 COD was
reached in 2Q 2010, Solnova 3 COD was reached in 2Q 2010 and Solnova 4 COD was reached in 3Q 2010. Since COD, the projects have obtained good generation results achieving results aligned with the target production numbers.
Solnova 1/3/4 relies on a Conventional parabolic trough Concentrating Solar Power system to generate electricity. The technology is identical to the one used at Solaben 2/3 and Solacor
1/2.
Solnova 1/3/4 evacuates its electricity through an aerial-underground line 66 kV from the substation of the plant to a 220 kV line that ends in SET Casaquemada, where the connection
point of the plant is located.
Renewable energy plants in Spain, like Solnova 1, Solnova 3 and Solnova 4, are regulated by the Government through a series of laws and rulings which guarantee the owners of the plants
a reasonable remuneration for their investments. Solnova 1, Solnova 3 and Solnova 4 sell the power they produce into the wholesale electricity market, where offer and demand are matched and the pool price is determined, and also receive
additional payments from the Comision Nacional de los Mercados y de la Competencia, or CNMC, the Spanish state-owned regulator.
Honaine
The Honaine project is a water desalination plant located in Taffsout, Algeria, near three important cities: Oran, to the northeast, and Sidi Bel Abbés and Tlemcen, to the southeast.
Myah Bahr Honaine Spa, or MBH, is the vehicle incorporated in Algeria for the purposes of owning the Honaine project. Algerian Energy Company, SPA, or AEC, owns 49% and Sacyr Agua S.L., a subsidiary of Sacyr, S.A., owns the remaining
25.5% of the Honaine project.
AEC is the Algerian agency in charge of delivering Algeria’s large-scale desalination program. It is a joint venture set up in 2001 between the national oil and gas company, Sonatrach,
and the national gas and electricity company, Sonelgaz. Each of Sonatrach and Sonelgaz owns 50% of AEC.
The technology selected for the Honaine plant is currently the most commonly used in this kind of project. It consists of desalination using membranes by reverse osmosis. Honaine has a
capacity of seven M ft3 per day of desalinated water and it is under operation since July 2012. The project serves a population of 1.0 million.
The water purchase agreement is a U.S. dollar indexed 25-year take-or-pay contract with Sonatrach / Algérienne des Eaux, or ADE. The tariff structure is based upon plant capacity and
water production, covering variable cost (water cost plus electricity cost). Tariffs are adjusted monthly based on the indexation mechanisms that include local inflation, U.S. inflation and the exchange rate between the U.S. dollar and
local currency.
F-67
Skikda
The Skikda project is a water desalination plant located in Skikda, Algeria. Skikda is located 510 km east of Alger. Aguas de Skikda, or ADS, is the vehicle incorporated in Algeria for
the purposes of owning the Skikda project. AEC owns 49% and Sacyr Agua S.L. owns the remaining 16.83% of the Skikda project.
AEC is the Algerian agency in charge of delivering Algeria’s large-scale desalination program. It is a joint venture set up in 2001 between the national oil and gas company, Sonatrach,
and the national gas and electricity company, Sonelgaz. Each of Sonatrach and Sonelgaz owns 50% of AEC.
The technology selected for the Skikda plant is currently the most commonly used in this kind of project. It consists of the use of membranes to obtain desalinated water by reverse
osmosis. Skikda has a capacity of 3.5 M ft3 per day of desalinated water and is in operation since February 2009. The project serves a population of 0.5 million.
The water purchase agreement is a U.S. dollar indexed 25-year take-or-pay contract with Sonatrach / ADE. The tariff structure is based upon plant capacity and water production, covering
variable cost (water cost plus electricity cost). Tariffs are adjusted monthly based on the indexation mechanisms that include local inflation, U.S. inflation and the exchange rate between the U.S. dollar and local currency.
ATN 2
ATN 2, in Peru, is part of the Complementary Transmission System, or Sistema Complementario de Transmision, SCT, and is comprised of the following facilities:
(i) The approximately 130km, 220kV line from SE Cotaruse to Las Bambas;
(ii) The connection to the gate of Las Bambas Substation
(iii) The expansion of the Cotaruse 220kV substation (works assigned to Consorcio Transmantaro)
The Client is Las Bambas Mining Company, a company owned by a partnership conformed by a subsidiary of China Minmetals Corporation (62.5%), a wholly owned subsidiary of Guoxin
International Investment Co. Ltd (22.5%) and CITIC Metal Co. Ltd (15.0%). China Minmetals Corporation is the fifth largest metals company included in the Fortune Global 500 list.
Abengoa started the permitting phase of ATN2 Project in May 2011; and the plant reached COD during May 2015.
The ATN2 Project has a 18-year contract period, after that, ATN2 assets will remain as property of the SPV and therefore it is likely a new contract could be negotiated. The ATN2
Project has a fixed-price tariff base denominated in U.S. dollars, partially adjusted annually in accordance with the U.S. Finished Goods Less Food and Energy Index as published by the U.S. Department of Labor. The receipt of the tariff
base is independent from the effective utilization of the transmission lines and substations related to the ATN2 Project. The tariff base is intended to provide the ATN2 Project with consistent and predictable monthly revenues sufficient
to cover the ATN2 Project’s operating costs and debt service and to earn an equity return. Peruvian law requires the existence of a definitive concession agreement to perform electricity transmission activities where the transmission
facilities cross public land or land owned by third parties. On May 31, 2014, the Ministry of Energy granted the project a definitive concession agreement to the transmission lines of the ATN2 Project.
F-68
Kaxu
Kaxu Solar One, or Kaxu, is a 100 MW solar Conventional Parabolic Trough Project located in Paulputs in the Northern Cape Province of South Africa, approximately 30 km north east of the
small town of Pofadder. Atlantica, through ABY South Africa (Pty) Ltd., owns 51% of the Kaxu Project. The Project Company, named Kaxu Solar One (Pty) Ltd., is owned by a consortium composed by ABY South Africa (51%), Industrial
Development Corporation of South Africa (29%) and Kaxu Community Trust (20%).
The project reached COD in February 2015.
Kaxu has a 20-year PPA with Eskom SOC Ltd., or Eskom, under a take or pay contract for the purchase of electricity up to the contracted capacity from the facility. Eskom purchases all
the output of the Kaxu Plant under a fixed price formula in local currency subject to indexation to local inflation which protects the Company from potential devaluation over the long term. Being the project COD February 2015, the PPA
expires on February 2035.
Solaben 1&6
The Solaben 1&6 is a 100 MW Concentrated Solar Power facility part of the Extremadura Solar Platform, located in the municipality of Logrosán, Spain. Solaben 1/6 COD was reached on
September 1, 2013. Since COD, the projects have obtained good generation aligned with the target production figures.
Solaben 1&6 relies on a Conventional Parabolic through Concentrating Solar Power system to generate electricity. The technology is identical to the one used at Solaben 2/3 and
Solacor 1/2 projects.
Renewable energy plants in Spain, like Solaben 1 and Solaben 6, are regulated by the Government through a series of laws and rulings which guarantee the owners of the plants a
reasonable remuneration for their investments. Solaben 1 and Solaben 6 sell the power they produce into the wholesale electricity market, where offer and demand are matched and the pool price is determined, and also receive additional
payments from the Comisión Nacional de los Mercados y de la Competencia, or CNMC, the Spanish state-owned regulator.
Melowind
Melowind is an on-shore wind farm facility wholly owned by the Company, located in Uruguay with nominal installed capacity of 50 MW. Melowind has 20 wind turbines of 2.5 MW each. The
asset reached COD in November 2015. The wind farm is located in Cerro Largo, 200 miles north of the city of Montevideo. Nordex supplied the turbines.
Melowind is not expected to pay significant corporate taxes in the next 10 years due to the specific tax exemptions established by the Uruguayan government for renewable assets.
Melowind signed a 20-year PPA with UTE in 2015, for 100% of the electricity produced. UTE pays a fixed tariff under the PPA, which is denominated in U.S. dollars and is partially
adjusted every year based on a formula referring to U.S. CPI, the Uruguay’s Indice de Precios al Productor de Productos Nacionales and the applicable UYU/U.S. dollars exchange rate.
Melowind signed an agreement with Nordex, covering the maintenance tasks of the wind turbines. The scope of works of this agreement is complete, as it includes operation, scheduled and
unscheduled maintenance. In addition, Melowind signed a O&M agreement with Ingener covering the maintenance tasks of the civil works and electrical infrastructure.
F-69
Appendices
Appendix III-2
Projects subject to the application of IFRIC 12 interpretation based on the concession of services as of December 31, 2019
|
Project
name
|
Country
|
Status(1)
|
% of
Nominal
Share(2)
|
Period of
Concession(4)(5)
|
off-taker(7)
|
Financial/
Intangible(3)
|
Assets/
Investment
|
Accumulated
Amortization
|
Operating
Profit/
(Loss)(8)
|
Arrangement
Terms
(price)
|
Description of
the
Arrangement
|
|||||||||||
|
Renewable energy:
|
||||||||||||||||||||||
|
Solana
|
USA
|
(O)
|
100.0
|
30 Years
|
APS
|
(I)
|
1,916,268
|
(424,627)
|
47,344
|
Fixed price per MWh with annual increases of 1.84% per year
|
30-year PPA with APS regulated by ACC
|
|||||||||||
|
Mojave
|
USA
|
(O)
|
100.0
|
25 Years
|
PG&E
|
(I)
|
1,556,638
|
(312,544)
|
49,939
|
Fixed price per MWh without any indexation mechanism
|
25-year PPA with PG&E regulated by CPUC and CAEC
|
|||||||||||
|
Palmatir
|
Uruguay
|
(O)
|
100.0
|
20 Years
|
UTE, Uruguay
Administration
|
(I)
|
148,043
|
(43,967)
|
3,537
|
Fixed price per MWh in USD with annual increases based on inflation
|
20-year PPA with UTE, Uruguay state-owned utility
|
|||||||||||
|
Cadonal
|
Uruguay
|
(O)
|
100.0
|
20 Years
|
UTE, Uruguay
Administration
|
(I)
|
122,104
|
(43,987)
|
2,650
|
Fixed price per MWh in USD with annual increases based on inflation
|
20-year PPA with UTE, Uruguay state-owned utility
|
|||||||||||
|
Melowind
|
Uruguay
|
(O)
|
100.0
|
20 Years
|
UTE, Uruguay
Administration
|
(I)
|
136,421
|
(22,501)
|
3,826
|
Fixed price per MWh in USD with annual increases based on inflation
|
20-year PPA with UTE, Uruguay state-owned utility
|
F-70
|
Solaben 2
|
Spain
|
(O)
|
70.0
|
25 Years
|
Kingdom of
Spain
|
(I)
|
308,407
|
(63,275)
|
12,763
|
Regulated revenue
base(6)
|
Regulated revenue established by different laws and rulings in Spain
|
|||||||||||
|
Solaben 3
|
Spain
|
(O)
|
70.0
|
25 Years
|
Kingdom of
Spain
|
(I)
|
307,174
|
(65,072)
|
12,836
|
Regulated revenue
base(6)
|
Regulated revenue established by different laws and rulings in Spain
|
|||||||||||
|
Solacor 1
|
Spain
|
(O)
|
87.0
|
25 Years
|
Kingdom of
Spain
|
(I)
|
311,963
|
(70,393)
|
11,569
|
Regulated revenue
base(6)
|
Regulated revenue established by different laws and rulings in Spain
|
|||||||||||
|
Solacor 2
|
Spain
|
(O)
|
87.0
|
25 Years
|
Kingdom of
Spain
|
(I)
|
324,834
|
(72,228)
|
11,559
|
Regulated revenue
base(6)
|
Regulated revenue established by different laws and rulings in Spain
|
|||||||||||
|
Solnova 1
|
Spain
|
(O)
|
100.0
|
25 Years
|
Kingdom of
Spain
|
(I)
|
311,759
|
(89,172)
|
15,482
|
Regulated revenue
base(6)
|
Regulated revenue established by different laws and rulings in Spain
|
|||||||||||
|
Solnova 3
|
Spain
|
(O)
|
100.0
|
25 Years
|
Kingdom of
Spain
|
(I)
|
292,904
|
(80,829)
|
16,569
|
Regulated revenue
base(6)
|
Regulated revenue established by different laws and rulings in Spain
|
|||||||||||
|
Solnova 4
|
Spain
|
(O)
|
100.0
|
25 Years
|
Kingdom of
Spain
|
(I)
|
271,943
|
(74,523)
|
15,966
|
Regulated revenue
base(6)
|
Regulated revenue established by different laws and rulings in Spain
|
F-71
|
Helios 1
|
Spain
|
(O)
|
100.0
|
25 Years
|
Kingdom of
Spain
|
(I)
|
313,132
|
(66,794)
|
14,095
|
Regulated revenue
base(6)
|
Regulated revenue established by different laws and rulings in Spain
|
|||||||||||
|
Helios 2
|
Spain
|
(O)
|
100.0
|
25 Years
|
Kingdom of
Spain
|
(I)
|
304,945
|
(63,626)
|
14,346
|
Regulated revenue
base(6)
|
Regulated revenue established by different laws and rulings in Spain
|
|||||||||||
|
Helioenergy 1
|
Spain
|
(O)
|
100.0
|
25 Years
|
Kingdom of
Spain
|
(I)
|
303,316
|
(68,486)
|
14,927
|
Regulated revenue
base(6)
|
Regulated revenue established by different laws and rulings in Spain
|
|||||||||||
|
Helioenergy 2
|
Spain
|
(O)
|
100.0
|
25 Years
|
Kingdom of
Spain
|
(I)
|
304,083
|
(66,007)
|
16,130
|
Regulated revenue
base(6)
|
Regulated revenue established by different laws and rulings in Spain
|
|||||||||||
|
Solaben 1
|
Spain
|
(O)
|
100.0
|
25 Years
|
Kingdom of
Spain
|
(I)
|
303,392
|
(54,293)
|
12,603
|
Regulated revenue
base(6)
|
Regulated revenue established by different laws and rulings in Spain
|
|||||||||||
|
Solaben 6
|
Spain
|
(O)
|
100.0
|
25 Years
|
Kingdom of
Spain
|
(I)
|
300,209
|
(53,641)
|
11,730
|
Regulated revenue
base(6)
|
Regulated revenue established by different laws and rulings in Spain
|
|||||||||||
|
Kaxu
|
South Africa
|
(O)
|
51.0
|
20 Years
|
Eskom
|
(I)
|
543,761
|
(132,849)
|
53,040
|
Take or pay contract for the purchase of electricity up to the contracted capacity from the facility.
|
20-year PPA with Eskom SOC Ltd. With a fixed price formula in local currency subject to indexation to local inflation
|
F-72
|
Efficient natural gas:
|
||||||||||||||||||||||
|
ACT
|
Mexico
|
(O)
|
100.0
|
20 Years
|
Pemex
|
(F)
|
610,363
|
-
|
113,549
|
Fixed price to compensate both investment and O&M costs, established in USD and adjusted annually partially according to inflation and partially according to a mechanism
agreed in contract
|
20-year Services Agreement with Pemex, Mexican oil & gas state-owned company
|
|||||||||||
|
Electric transmission lines:
|
||||||||||||||||||||||
|
ATS
|
Peru
|
(O)
|
100.0
|
30 Years
|
Republic of
Peru
|
(I)
|
531,779
|
(104,201)
|
28,993
|
Tariff fixed by contract and adjusted annually in accordance with the US Finished Goods Less Food and Energy inflation index
|
30-year Concession Agreement with the Peruvian Government
|
|||||||||||
|
ATN
|
Peru
|
(O)
|
100.0
|
30 Years
|
Republic of Peru
|
(I)
|
356,876
|
(93,061)
|
5,680
|
Tariff fixed by contract and adjusted annually in accordance with the US Finished Goods Less Food and Energy inflation index
|
30-year Concession Agreement with the Peruvian Government
|
|||||||||||
|
Quadra I
|
Chile
|
(O)
|
100.0
|
21 Years
|
Sierra Gorda
|
(F)
|
41,237
|
-
|
5,716
|
Fixed price in USD with annual adjustments indexed mainly to US CPI
|
21-year Concession Contract with Sierra Gorda regulated by CDEC and the Superentendencia de Electricidad, among others
|
|||||||||||
F-73
|
Quadra II
|
Chile
|
(O)
|
100.0
|
21 Years
|
Sierra Gorda
|
(F)
|
55,157
|
-
|
6,638
|
Fixed price in USD with annual adjustments indexed mainly to US CPI
|
21-year Concession Contract with Sierra Gorda regulated by CDEC and the Superentendencia de Electricidad, among others
|
|||||||||||
|
ATN 2
|
Peru
|
(O)
|
100.0
|
18 Years
|
Las Bambas Mining
|
(F)
|
80,407
|
-
|
14,432
|
Fixed-price tariff base denominated in U.S. dollars with Las Bambas
|
18 years purchase agreement
|
|||||||||||
|
Water:
|
||||||||||||||||||||||
|
Skikda
|
Argelia
|
(O)
|
34.2
|
25 Years
|
Sonatrach & ADE
|
(F)
|
87,285
|
-
|
15,583
|
U.S. dollar indexed take-or-pay contract with Sonatrach / ADE
|
25 years purchase agreement
|
|||||||||||
|
Honaine
|
Argelia
|
(O)
|
25.5
|
25 Years
|
Sonatrach & ADE
|
(F)
|
N/A(9)
|
N/A(9)
|
N/A(9)
|
U.S. dollar
indexed take-
or-pay
contract with
Sonatrach /
ADE
|
25 years purchase
agreement
|
| (1) |
In operation (O), Construction (C) as of December 31, 2019.
|
| (2) |
Liberty Interactive Corporation agreed to invest $300 million in Class A membership interests in exchange for a share of the dividends and the taxable loss generated by Solana on October 2,
2013. Itochu Corporation holds 30% of the economic rights to each of Solaben 2 and Solaben 3. JGC Corporation holds 13% of the economic rights to each Solacor 1 and Solacor 2. Algerian Energy Company, SPA, or AEC, owns 49% and
Sacyr Agua, S.L., a subsidiary of Sacyr, S.A., owns the remaining 25.5% of the Honaine project. AEC owns 49% and Sacyr Agua S.L. owns the remaining 16.83% of the Skikda project. Industrial Development Corporation of South
Africa (29%) & Kaxu Community Trust (20%) for the Kaxu Project
|
| (3) |
Classified as concessional financial asset (F) or as intangible assets (I).
|
| (4) |
The infrastructure is used for its entire useful life. There are no obligations to deliver assets at the end of the concession periods, except for ATN and ATS.
|
| (5) |
Generally, there are no termination provisions other than customary clauses for situations such as bankruptcy or fraud from the operator, for example.
|
| (6) |
Sales to wholesale markets and additional fixed payments established by the Spanish government.
|
| (7) |
In each case the off-taker is the grantor.
|
| (8) |
Figures reflect the contribution to the consolidated financial statements of Atlantica Yield Plc. as of December 31, 2019.
|
| (9) |
Recorded under the equity method.
|
The Appendices are an integral part of the Notes to the consolidated financial statements.
F-74
Projects subject to the application of IFRIC 12 interpretation based on the concession of services as of December 31, 2018
|
Project
name
|
Country
|
Status(1)
|
% of
Nominal
Share(2)
|
Period of
Concession(4)(5)
|
off-taker(7)
|
Financial/
Intangible(3)
|
Assets/
Investment
|
Accumulated
Amortization
|
Operating
Profit/
(Loss)(8)
|
Arrangement
Terms
(price)
|
Description of
the
Arrangement
|
|||||||||||
|
Renewable energy:
|
||||||||||||||||||||||
|
Solana
|
USA
|
(O)
|
100.0
|
30 Years
|
APS
|
(I)
|
1,937,684
|
(372,638)
|
13,563
|
Fixed price per MWh with annual increases of 1.84% per year
|
30-year PPA with APS regulated by ACC
|
|||||||||||
|
Mojave
|
USA
|
(O)
|
100.0
|
25 Years
|
PG&E
|
(I)
|
1,556,435
|
(250,973)
|
56,100
|
Fixed price per MWh without any indexation mechanism
|
25-year PPA with PG&E regulated by CPUC and CAEC
|
|||||||||||
|
Palmatir
|
Uruguay
|
(O)
|
100.0
|
20 Years
|
UTE, Uruguay
Administration
|
(I)
|
148,030
|
(36,731)
|
5,070
|
Fixed price per MWh in USD with annual increases based on inflation
|
20-year PPA with UTE, Uruguay state-owned utility
|
|||||||||||
|
Cadonal
|
Uruguay
|
(O)
|
100.0
|
20 Years
|
UTE, Uruguay
Administration
|
(I)
|
122,045
|
(38,842)
|
3,553
|
Fixed price per MWh in USD with annual increases based on inflation
|
20-year PPA with UTE, Uruguay state-owned utility
|
|||||||||||
|
Melowind
|
Uruguay
|
(O)
|
100.0
|
20 Years
|
UTE, Uruguay
Administration
|
(I)
|
132,595
|
(13,205)
|
203
|
Fixed price per MWh in USD with annual increases based on inflation
|
20-year PPA with UTE, Uruguay state-owned utility
|
F-75
|
Solaben 2
|
Spain
|
(O)
|
70.0
|
25 Years
|
Kingdom of
Spain
|
(I)
|
315,226
|
(55,685)
|
12,729
|
Regulated revenue
base(6)
|
Regulated revenue established by different laws and rulings in Spain
|
|||||||||||
|
Solaben 3
|
Spain
|
(O)
|
70.0
|
25 Years
|
Kingdom of
Spain
|
(I)
|
314,022
|
(57,751)
|
13,367
|
Regulated revenue
base(6)
|
Regulated revenue established by different laws and rulings in Spain
|
|||||||||||
|
Solacor 1
|
Spain
|
(O)
|
87.0
|
25 Years
|
Kingdom of
Spain
|
(I)
|
318,987
|
(62,757)
|
12,510
|
Regulated revenue
base(6)
|
Regulated revenue established by different laws and rulings in Spain
|
|||||||||||
|
Solacor 2
|
Spain
|
(O)
|
87.0
|
25 Years
|
Kingdom of
Spain
|
(I)
|
332,131
|
(64,219)
|
11,936
|
Regulated revenue
base(6)
|
Regulated revenue established by different laws and rulings in Spain
|
|||||||||||
|
Solnova 1
|
Spain
|
(O)
|
100.0
|
25 Years
|
Kingdom of
Spain
|
(I)
|
318,821
|
(82,190)
|
14,604
|
Regulated revenue
base(6)
|
Regulated revenue established by different laws and rulings in Spain
|
|||||||||||
|
Solnova 3
|
Spain
|
(O)
|
100.0
|
25 Years
|
Kingdom of
Spain
|
(I)
|
299,539
|
(74,471)
|
15,913
|
Regulated revenue
base(6)
|
Regulated revenue established by different laws and rulings in Spain
|
|||||||||||
|
Solnova 4
|
Spain
|
(O)
|
100.0
|
25 Years
|
Kingdom of
Spain
|
(I)
|
278,104
|
(68,488)
|
17,710
|
Regulated revenue
base(6)
|
Regulated revenue established by different laws and rulings in Spain
|
F-76
|
Helios 1
|
Spain
|
(O)
|
100.0
|
25 Years
|
Kingdom of
Spain
|
(I)
|
320,154
|
(59,290)
|
12,061
|
Regulated revenue
base(6)
|
Regulated revenue established by different laws and rulings in Spain
|
|||||||||||
|
Helios 2
|
Spain
|
(O)
|
100.0
|
25 Years
|
Kingdom of
Spain
|
(I)
|
311,764
|
(56,234)
|
12,695
|
Regulated revenue
base(6)
|
Regulated revenue established by different laws and rulings in Spain
|
|||||||||||
|
Helioenergy 1
|
Spain
|
(O)
|
100.0
|
25 Years
|
Kingdom of
Spain
|
(I)
|
310,186
|
(61,812)
|
15,529
|
Regulated revenue
base(6)
|
Regulated revenue established by different laws and rulings in Spain
|
|||||||||||
|
Helioenergy 2
|
Spain
|
(O)
|
100.0
|
25 Years
|
Kingdom of
Spain
|
(I)
|
310,943
|
(59,180)
|
16,258
|
Regulated revenue
base(6)
|
Regulated revenue established by different laws and rulings in Spain
|
|||||||||||
|
Solaben 1
|
Spain
|
(O)
|
100.0
|
25 Years
|
Kingdom of
Spain
|
(I)
|
310,259
|
(46,470)
|
11,623
|
Regulated revenue
base(6)
|
Regulated revenue established by different laws and rulings in Spain
|
|||||||||||
|
Solaben 6
|
Spain
|
(O)
|
100.0
|
25 Years
|
Kingdom of
Spain
|
(I)
|
307,037
|
(45,922)
|
12,250
|
Regulated revenue
base(6)
|
Regulated revenue established by different laws and rulings in Spain
|
|||||||||||
|
Kaxu
|
South Africa
|
(O)
|
51.0
|
20 Years
|
Eskom
|
(I)
|
526,172
|
(101,943)
|
56,214
|
Take or pay contract for the purchase of electricity up to the contracted capacity from the facility.
|
20-year PPA with Eskom SOC Ltd. With a fixed price formula in local currency subject to indexation to local inflation
|
F-77
|
Efficient natural gas:
|
||||||||||||||||||||||
|
ACT
|
Mexico
|
(O)
|
100.0
|
20 Years
|
Pemex
|
(F)
|
635,393
|
-
|
90,193
|
Fixed price to compensate both investment and O&M costs, established in USD and adjusted annually partially according to inflation and partially according to a mechanism
agreed in contract
|
20-year Services Agreement with Pemex, Mexican oil & gas state-owned company
|
|||||||||||
|
Electric transmission lines:
|
||||||||||||||||||||||
|
ATS
|
Peru
|
(O)
|
100.0
|
30 Years
|
Republic of
Peru
|
(I)
|
531,677
|
(86,449)
|
26,801
|
Tariff fixed by contract and adjusted annually in accordance with the US Finished Goods Less Food and Energy inflation index
|
30-year Concession Agreement with the Peruvian Government
|
|||||||||||
|
ATN
|
Peru
|
(O)
|
100.0
|
30 Years
|
Republic of Peru
|
(I)
|
336,675
|
(81,518)
|
2,685
|
Tariff fixed by contract and adjusted annually in accordance with the US Finished Goods Less Food and Energy inflation index
|
30-year Concession Agreement with the Peruvian Government
|
|||||||||||
|
Quadra I
|
Chile
|
(O)
|
100.0
|
21 Years
|
Sierra Gorda
|
(F)
|
41,515
|
-
|
5,061
|
Fixed price in USD with annual adjustments indexed mainly to US CPI
|
21-year Concession Contract with Sierra Gorda regulated by CDEC and the Superentendencia de Electricidad, among others
|
|||||||||||
F-78
|
Quadra II
|
Chile
|
(O)
|
100.0
|
21 Years
|
Sierra Gorda
|
(F)
|
55,397
|
-
|
6,024
|
Fixed price in USD with annual adjustments indexed mainly to US CPI
|
21-year Concession Contract with Sierra Gorda regulated by CDEC and the Superentendencia de Electricidad, among others
|
|||||||||||
|
ATN 2
|
Peru
|
(O)
|
100.0
|
18 Years
|
Las Bambas Mining
|
(F)
|
81,883
|
-
|
12,027
|
Fixed-price tariff base denominated in U.S. dollars with Las Bambas
|
18 years purchase agreement
|
|||||||||||
|
Water:
|
||||||||||||||||||||||
|
Skikda
|
Argelia
|
(O)
|
34.2
|
25 Years
|
Sonatrach & ADE
|
(F)
|
89,770
|
-
|
14,446
|
U.S. dollar indexed take-or-pay contract with Sonatrach / ADE
|
25 years purchase agreement
|
|||||||||||
|
Honaine
|
Argelia
|
(O)
|
25.5
|
25 Years
|
Sonatrach & ADE
|
(F)
|
N/A(9)
|
N/A(9)
|
N/A(9)
|
U.S. dollar
indexed take-
or-pay
contract with
Sonatrach /
ADE
|
25 years purchase
agreement
|
| (1) |
In operation (O), Construction (C) as of December 31, 2018.
|
| (2) |
Liberty Interactive Corporation agreed to invest $300 million in Class A membership interests in exchange for a share of the dividends and the taxable loss generated by Solana on October 2,
2013. Itochu Corporation holds 30% of the economic rights to each of Solaben 2 and Solaben 3. JGC Corporation holds 13% of the economic rights to each Solacor 1 and Solacor 2. Algerian Energy Company, SPA, or AEC, owns 49% and
Sacyr Agua, S.L., a subsidiary of Sacyr, S.A., owns the remaining 25.5% of the Honaine project. AEC owns 49% and Sacyr Agua S.L. owns the remaining 16.83% of the Skikda project. Industrial Development Corporation of South
Africa (29%) & Kaxu Community Trust (20%) for the Kaxu Project
|
| (3) |
Classified as concessional financial asset (F) or as intangible assets (I).
|
| (4) |
The infrastructure is used for its entire useful life. There are no obligations to deliver assets at the end of the concession periods, except for ATN and ATS.
|
| (5) |
Generally, there are no termination provisions other than customary clauses for situations such as bankruptcy or fraud from the operator, for example.
|
| (6) |
Sales to wholesale markets and additional fixed payments established by the Spanish government.
|
| (7) |
In each case the off-taker is the grantor.
|
| (8) |
Figures reflect the contribution to the consolidated financial statements of Atlantica Yield Plc. as of December 31, 2018.
|
| (9) |
Recorded under the equity method.
|
The Appendices are an integral part of the Notes to the consolidated financial statements.
F-79
Appendix IV
Additional Information of Subsidiaries including material Non-controlling interest as of December 31, 2019
|
Subsidiary
name
|
Non-
controlling
interests
name
|
% of
non-
controlling
interests
held
|
Dividends
paid to
non-
controlling
interests
|
Profit/(Loss)
of non-
controlling
interests
in
Atlantica
consolidated
net result
2019
|
Non-
controlling
interests
in
Atlantica
consolidated
equity as
of
December 31,
2019
|
Non-
current
assets*
|
Current
Assets*
|
Non-
current
liabilities*
|
Current
liabilities*
|
Net
Profit
/(Loss)*
|
Total
Comprehensive
income*
|
||||||||||||||||||||
|
Kaxu Solar One (Pty) Ltd.
|
Industrial Development Corporation of South Africa (IDC)
|
29%
|
-
|
49
|
11,520
|
404,924
|
72,668
|
403,366
|
54,191
|
1,638
|
-
|
||||||||||||||||||||
|
|
Kaxu
Community
Trust
|
20%
|
|||||||||||||||||||||||||||||
|
Aguas de Skikda S.P.A.
|
Algerian Energy Company S.P.A.
|
49%**
|
4,116
|
8,473
|
53,215
|
85,668
|
29,363
|
19,945
|
7,726
|
12,477
|
-
|
||||||||||||||||||||
|
Atlantica Yield Energy Solutions Canada Inc.
|
Algonquin Power Co.
|
90%
|
20,332
|
-
|
69,050
|
98,066
|
5,789
|
-
|
5,788
|
25,910
|
-
|
* Stand-alone figures as of December 31, 2019
** Atlantica Yield Plc. owns 67% of the shares in Geida Skikda, S.L., which in its turn owns 51% of Aguas de Skikda S.P.A., so that indirectly Atlantica Yield Plc. owns 34.17% of Aguas
de Skikda S.P.A. The table only shows information related to the Non-Controlling interests of the SPV, Aguas de Skikda S.P.A.
F-80
Appendices
Appendix IV
Additional Information of Subsidiaries including material Non-controlling interest as of December 31, 2018
|
Subsidiary
name
|
Non-
controlling
interests
name
|
% of
non-
controlling
interests
held
|
Dividends
paid to
non-
controlling
interests
|
Profit/(Loss)
of non-
controlling
interests
in
Atlantica
consolidated
net result
2018
|
Non-
controlling
interests
in
Atlantica
consolidated
equity as
of
December 31,
2018
|
Non-
current
assets*
|
Current
Assets*
|
Non-
current
liabilities*
|
Current
liabilities*
|
Net
Profit
/(Loss)*
|
Total
Comprehensive
income*
|
|||||||||||||||||||||||||||||||
|
Kaxu Solar One (Pty) Ltd.
|
Industrial Development Corporation of South Africa (IDC)
|
29
|
%
|
-
|
1,085
|
9,004
|
423,792
|
82,232
|
471,548
|
16,010
|
(3,370
|
)
|
(4,962
|
)
|
||||||||||||||||||||||||||||
|
|
Kaxu Community Trust
|
20
|
%
|
|||||||||||||||||||||||||||||||||||||||
|
Aguas de Skikda S.P.A.
|
Algerian Energy Company S.P.A.
|
49
|
%**
|
4,461
|
8,701
|
52,595
|
87,451
|
28,857
|
25,337
|
7,218
|
13,217
|
-
|
||||||||||||||||||||||||||||||
* Stand-alone figures as of December 31, 2018
** Atlantica Yield Plc. owns 67% of the shares in Geida Skikda, S.L., which in its turn owns 51% of Aguas de Skikda S.P.A., so that indirectly Atlantica Yield Plc. owns 34.17% of Aguas
de Skikda S.P.A. The table only shows information related to the Non-Controlling interests of the SPV, Aguas de Skikda S.P.A.
F-81
Appendix V (Schedule I)
Condensed Financial Statements of Atlantica Yield plc
Condensed statements of financial position of Atlantica Yield Plc.
– Amounts in thousands of usd –
|
As of December 31,
|
||||||||
|
2019
|
2018
|
|||||||
|
Assets
|
||||||||
|
Investment in affiliates
|
1,909,066
|
1,883,964
|
||||||
|
Loans to affiliates
|
500,871
|
605,778
|
||||||
|
Cash and cash equivalents
|
66,013
|
106,734
|
||||||
|
Other assets
|
61,161
|
8,458
|
||||||
|
Total assets
|
2,537,111
|
2,604,934
|
||||||
|
Liabilities and Equity
|
||||||||
|
Borrowings
|
695,874
|
426,748
|
||||||
|
Notes and bonds
|
27,917
|
257,325
|
||||||
|
Amounts owed to affiliates
|
192,601
|
138,222
|
||||||
|
Other Liabilities
|
7,205
|
13,493
|
||||||
|
Total Liabilities
|
923,597
|
835,788
|
||||||
|
Common Stock
|
10,160
|
10,022
|
||||||
|
Additional paid-in capital
|
1,011,743
|
1,481,881
|
||||||
|
Distributable reserves
|
889,056
|
548,059
|
||||||
|
Other reserves
|
(637
|
)
|
-
|
|||||
|
Retained earnings
|
(296,808
|
)
|
(270,816
|
)
|
||||
|
Total shareholders’s equity
|
1,613,514
|
1,769,146
|
||||||
|
Total liabilities and equities
|
2,537,111
|
2,604,934
|
||||||
F-82
Condensed income statements of Atlantica Yield, Plc.
– Amounts in thousands of usd –
|
For the year ended December 31,
|
||||||||||||
|
2019
|
2018
|
2017
|
||||||||||
|
Income from
|
||||||||||||
|
Services
|
49,622
|
54,743
|
123,944
|
|||||||||
|
Other financial income
|
12,772
|
4,334
|
17,419
|
|||||||||
|
Total income
|
62,394
|
59,077
|
141,363
|
|||||||||
|
Expenses
|
||||||||||||
|
Other operating expenses
|
(26,120
|
)
|
(189,116
|
)
|
(21,173
|
)
|
||||||
|
Interests Credit entities
|
(46,781
|
)
|
(42,321
|
)
|
(46,292
|
)
|
||||||
|
Other financial expenses
|
(15,485
|
)
|
(12,083
|
)
|
(21,333
|
)
|
||||||
|
Total expenses
|
(88,386
|
)
|
(243,520
|
)
|
(88,798
|
)
|
||||||
|
Income/(Loss) before income taxes
|
(25,992
|
)
|
(184,443
|
)
|
52,565
|
|||||||
|
Income tax benefits/(expense)
|
-
|
-
|
-
|
|||||||||
|
Profit/(Loss) for the year
|
(25,992
|
)
|
(184,443
|
)
|
52,565
|
|||||||
F-83
Other comprehensive income statement of Atlantica Yield, Plc.
– Amounts in thousands of usd –
|
For the year ended December 31,
|
||||||||||||
|
2019
|
2018
|
2017
|
||||||||||
|
Profit/(loss) for the year
|
(25,992
|
)
|
(184,443
|
)
|
52,565
|
|||||||
|
Items that may be subject to transfer to income statement
|
||||||||||||
|
Change in fair value of cash flow hedges
|
(457
|
)
|
147
|
(13,666
|
)
|
|||||||
|
Net income/(expenses) recognized directly in equity
|
(457
|
)
|
147
|
(13,666
|
)
|
|||||||
|
Cash flow hedges
|
(180
|
)
|
(328
|
)
|
(32
|
)
|
||||||
|
Transfer to income statement
|
(180
|
)
|
(328
|
)
|
(32
|
)
|
||||||
|
Other comprehensive income/(loss) for the year
|
(637
|
)
|
(181
|
)
|
(13,698
|
)
|
||||||
|
Total comprehensive income/(loss) for the year
|
(26,629
|
)
|
(184,624
|
)
|
38,867
|
|||||||
F-84
Condensed cash flow statements of Atlantica Yield, Plc.
– Amounts in thousands of usd –
|
For the year ended December 31,
|
||||||||||||
|
2019
|
2018
|
2017
|
||||||||||
|
Cash Flow from operating activities
|
(48,502
|
)
|
(30,571
|
)
|
34,937
|
|||||||
|
Cash Flow—investing activities
|
||||||||||||
|
Decrease (increase) in investment and advance to affiliates
|
91,181
|
66,069
|
151,033
|
|||||||||
|
Net decrease (increase) in other assets
|
-
|
-
|
-
|
|||||||||
|
Cash (used for)/provided by investing activities
|
91,181
|
66,069
|
151,033
|
|||||||||
|
Cash Flow—financing activities
|
||||||||||||
|
Net increase/(decrease) in borrowings and other liabilities
|
45,601
|
56,000
|
(64,754
|
)
|
||||||||
|
Dividend paid to shareowner
|
(159,002
|
)
|
(133,289
|
)
|
(94,845
|
)
|
||||||
|
Capital increase and other
|
30,000
|
-
|
-
|
|||||||||
|
Cash from financing activities
|
(83,401
|
)
|
(77,289
|
)
|
(159,599
|
)
|
||||||
|
Increase (decrease) in cash and cash equivalents during the year
|
(40,721
|
)
|
(41,791
|
)
|
26,371
|
|||||||
|
Cash and cash equivalent at the beginning of the year
|
106,734
|
148,525
|
122,154
|
|||||||||
|
Cash and cash equivalent at the end of the year
|
66,013
|
106,734
|
148,525
|
|||||||||
F-85
Notes to the Condensed Financial Statements
Schedule I has been provided pursuant to the requirements of Rule 12- 04(a) of Regulation S-X, of the US Securities and Exchange Commission (SEC) which require condensed financial
information as to the financial position, change in financial position, results of operations of Atlantica Yield plc, other comprehensive income statement and cash flow statement as of the same dates and for the same periods for which
audited consolidated financial statements have been presented when the restricted net assets of consolidated subsidiaries exceed 25 percent of consolidated net assets as of the end of the most recently completed fiscal year.
Certain information and footnote disclosures normally included in financial statements prepared in accordance with International Financial Reporting Standards have been condensed or
omitted. The footnote disclosures contain supplemental information only and, as such, these statements should be read in conjunction with the notes to the accompanying consolidated financial statements.
Basis of Presentation.
| a) |
The presentation of Atlantica Yield plc stands alone condensed financial statement has been prepared using the same accounting policies as set out in the accompanying consolidated financial
statements except that, the Company records its investment in subsidiaries under the cost method of accounting and that financial income from credits to companies in the group are recorded under Income from services, given
that the company is a holding and this type of service is part of its primary activity. Such investments are presented on the statements of financial position as “Investment in and loans to affiliates” at cost less any
identified impairment loss.
|
| b) |
As of December 31, 2019, 2018 and 2017 there were no material contingencies, significant provisions of long-term obligations, mandatory dividend or redemption requirements of redeemable stocks
or guarantees of the Company, except for those which have been separately disclosed in the Consolidated Financial Statements, if any.
|
| c) |
For the year ended December 31, 2019 and 2018, no cash dividend has been declared to the Company by its consolidated subsidiaries or associated. For the year ended December 2017, cash dividend
of $10,383 thousand were declared to the Company by its consolidated subsidiaries or associates.
|
Reconciliation of the stand-alone to consolidated financial statements of Atlantica Yield Plc.
|
Profit/(Loss) Reconciliation
|
For the year ended December 31,
|
|||||||||||
| 2019 |
2018
|
2017
|
||||||||||
|
Stand-alone—IFRS profit/(loss) for the period
|
(25,992
|
)
|
(184,443
|
)
|
52,565
|
|||||||
|
Additional profit/(loss) if subsidiaries had been accounted for using the equity method of accounting as opposed to cost method
|
88,127
|
226,039
|
(164,369
|
)
|
||||||||
|
Consolidated IFRS profit/(loss) for the period attributable to Atlantica Yield plc
|
62,135
|
41,596
|
(111,804
|
)
|
||||||||
|
Equity Reconciliation
|
As of December 31,
|
|||||||||||
|
2019
|
2018
|
2017
|
||||||||||
|
Stand-alone—IFRS shareholders equity
|
1,613,514
|
1,769,146
|
2,087,059
|
|||||||||
|
Additional shareholders equity if subsidiaries had been accounted for using the equity method of accounting as opposed to cost method
|
101,342
|
(13,034
|
)
|
(191,606
|
)
|
|||||||
|
Consolidated IFRS shareholders equity
|
1,714,856
|
1,756,112
|
1,895,453
|
|||||||||
F-86