July 21, 2026 SECOND QUARTER 2026 FINANCIAL RESULTS .3
2 Disclaimers Cautionary Statement Regarding Forward-Looking Statements The following slides are part of a presentation by Synchrony Financial in connection with reporting quarterly financial results and should be read in conjunction with the earnings release and financial supplement included as exhibits to our Current Report on Form 8-K filed today and available on our website (www.investors.synchrony.com) and the SEC's website (www.sec.gov). All references to net earnings and net income are intended to have the same meaning. All comparisons are for the second quarter of 2026 compared to the second quarter of 2025, unless otherwise noted. This presentation contains certain forward-looking statements as defined in Section 27A of the Securities Act of 1933, as amended, and Section 21E of the Securities Exchange Act of 1934, as amended, which are subject to the "safe harbor" created by those sections. Forward-looking statements may be identified by words such as "expects," "intends," "anticipates," "plans," "believes," "seeks," "targets," "outlook," "estimates," "will," "should," "may," “aim,” “focus,” “goal,” “confident,” “trajectory,” "priorities," "designed," "consider," “opportunity” or words of similar meaning, but these words are not the exclusive means of identifying forward-looking statements. Forward-looking statements are based on management's current expectations and assumptions, and are subject to inherent uncertainties, risks and changes in circumstances that are difficult to predict. As a result, actual results could differ materially from those indicated in these forward-looking statements. Factors that could cause actual results to differ materially include global political, economic, business, competitive, market, regulatory and other factors and risks, such as: the impact of macroeconomic and geopolitical conditions, including factors impacting consumer confidence and economic growth in the United States, such as inflation, interest rates, tariffs (including retaliatory tariffs), energy prices, global conflicts and an economic downturn or recession, and whether industry trends we have identified develop as anticipated; the impact of changes made or influenced by the U.S. presidential administration and Congress on fiscal, monetary and regulatory policy, including with respect to constraints on the pricing of our credit products; the impact of the federal government shutdowns; retaining existing partners and attracting new partners, concentration of our revenue in a small number of partners, and promotion and support of our products by our partners; cyber-attacks or other security incidents or breaches; disruptions in the operations of our and our outsourced partners' computer systems and data centers; the financial performance of our partners; product, pricing, and policy changes related to the Consumer Financial Protection Bureau’s (the “CFPB”) final rule on credit card late fees, which was vacated in April 2025; the sufficiency of our allowance for credit losses and the accuracy of the assumptions or estimates used in preparing our financial statements, including those related to the CECL accounting guidance; higher borrowing costs and adverse financial market conditions impacting our funding and liquidity, and any reduction in our credit ratings; our ability to grow our deposits in the future; damage to our reputation; our ability to securitize our loan receivables, occurrence of an early amortization of our securitization facilities, and lower payment rates on our securitized loan receivables; changes in benchmark or market interest rates; effectiveness of our risk management processes and procedures, reliance on models which may be inaccurate or misinterpreted, and our ability to manage our credit risk; our ability to offset increases in our costs in retailer share arrangements; competition in the consumer finance industry; our concentration in the U.S. consumer credit market and susceptibility to market fluctuations and legislative and regulatory developments; our ability to successfully develop and commercialize new or enhanced products and services; our ability to realize the value of acquisitions, dispositions and strategic investments; reductions in interchange fees; fraudulent activity; failure of third-parties to provide various services that are important to our operations; international risks and compliance and regulatory risks and costs associated with international operations; alleged infringement of intellectual property rights of others and our ability to protect our intellectual property; litigation, regulatory actions and compliance issues; our ability to attract, retain and motivate key officers and employees; tax legislation initiatives or challenges to our tax positions and/or interpretations, and state sales tax rules and regulations; regulation, supervision, examination and enforcement of our business by governmental authorities, the impact of the Dodd-Frank Wall Street Reform and Consumer Protection Act and other legislative and regulatory developments and the impact of the CFPB’s regulation of our business, including new requirements and constraints the Company and the Bank are or will become subject to as a result of having $100 billion or more in total assets; impact of capital adequacy rules and liquidity requirements; restrictions that limit our ability to pay dividends and repurchase our common stock, and restrictions that limit the Bank’s ability to pay dividends to us; regulations relating to privacy, information security and data protection; use of third-party vendors and ongoing third-party business relationships; and failure to comply with anti-money laundering and anti-terrorism financing laws. For the reasons described above, we caution you against relying on any forward-looking statements, which should also be read in conjunction with the other cautionary statements that are included elsewhere in this presentation and in our public filings, including under the headings “Risk Factors Relating to Our Business” and “Risk Factors Relating to Regulation” in the Company's most recent Annual Report on Form 10-K. You should not consider any list of such factors to be an exhaustive statement of all the risks, uncertainties, or potentially inaccurate assumptions that could cause our current expectations or beliefs to change. Further, any forward-looking statement speaks only as of the date on which it is made, and we undertake no obligation to update or revise any forward-looking statement, including the 2026 outlook on slide 10 of this presentation, to reflect events or circumstances after the date on which the statement is made or to reflect the occurrence of unanticipated events, except as otherwise may be required by law.
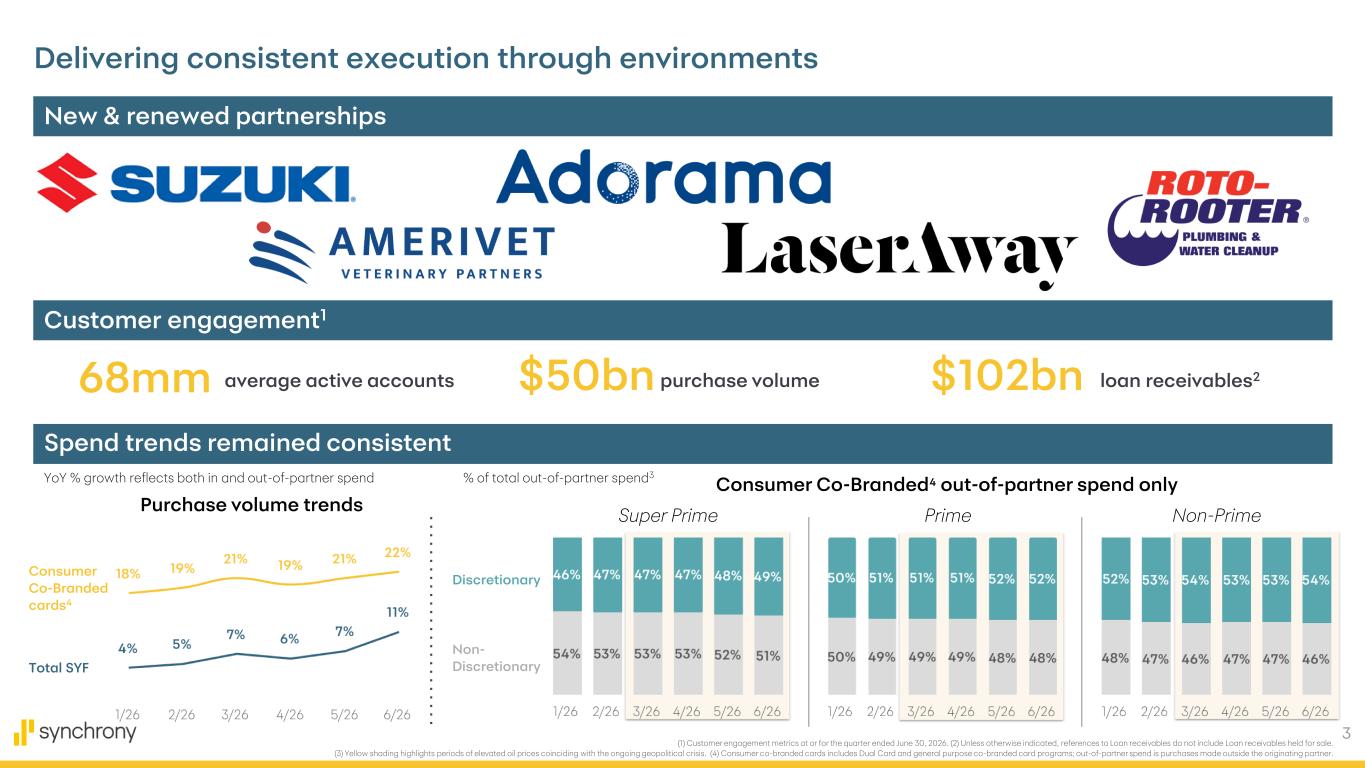
3 (1) Customer engagement metrics at or for the quarter ended June 30, 2026. (2) Unless otherwise indicated, references to Loan receivables do not include Loan receivables held for sale. (3) Yellow shading highlights periods of elevated oil prices coinciding with the ongoing geopolitical crisis. (4) Consumer co-branded cards includes Dual Card and general purpose co-branded card programs; out-of-partner spend is purchases made outside the originating partner. Delivering consistent execution through environments Customer engagement1 New & renewed partnerships 68mm average active accounts $50bn purchase volume $102bn loan receivables2 Spend trends remained consistent Super Prime Prime Non-Prime Discretionary Non- Discretionary Consumer Co-Branded cards4 Purchase volume trends % of total out-of-partner spend3YoY % growth reflects both in and out-of-partner spend Consumer Co-Branded4 out-of-partner spend only Total SYF
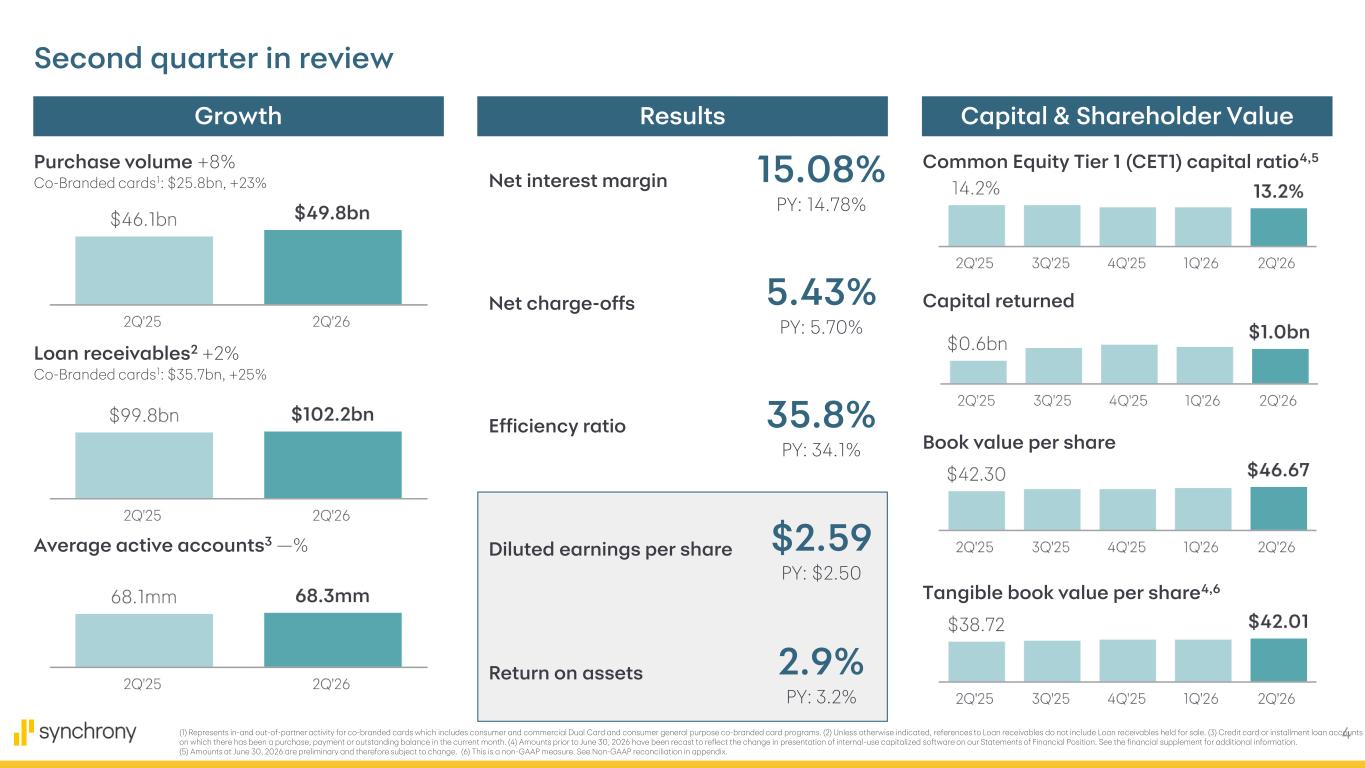
4 Net interest margin 15.08% PY: 14.78% Net charge-offs 5.43% PY: 5.70% Efficiency ratio 35.8% PY: 34.1% Diluted earnings per share $2.59 PY: $2.50 Return on assets 2.9% PY: 3.2% Second quarter in review Growth (1) Represents in-and out-of-partner activity for co-branded cards which includes consumer and commercial Dual Card and consumer general purpose co-branded card programs. (2) Unless otherwise indicated, references to Loan receivables do not include Loan receivables held for sale. (3) Credit card or installment loan accounts on which there has been a purchase, payment or outstanding balance in the current month. (4) Amounts prior to June 30, 2026 have been recast to reflect the change in presentation of internal-use capitalized software on our Statements of Financial Position. See the financial supplement for additional information. (5) Amounts at June 30, 2026 are preliminary and therefore subject to change. (6) This is a non-GAAP measure. See Non-GAAP reconciliation in appendix. Results Capital & Shareholder Value Loan receivables2 +2% Co-Branded cards1: $35.7bn, +25% Book value per share Tangible book value per share4,6 Average active accounts3 —% Common Equity Tier 1 (CET1) capital ratio4,5 Capital returned Purchase volume +8% Co-Branded cards1: $25.8bn, +23%
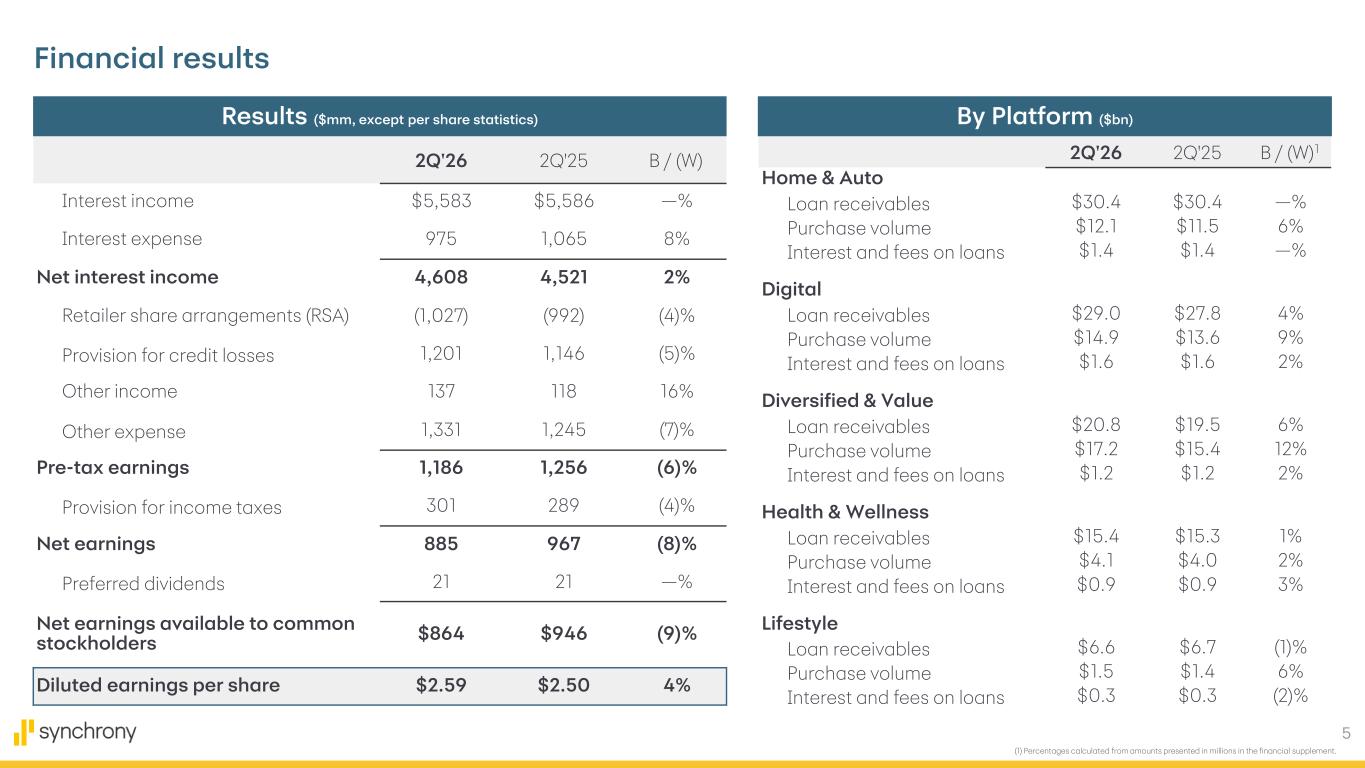
5 (1) Percentages calculated from amounts presented in millions in the financial supplement. Financial results Results ($mm, except per share statistics) By Platform ($bn) 2Q'26 2Q'25 B / (W) Interest income $5,583 $5,586 —% Interest expense 975 1,065 8% Net interest income 4,608 4,521 2% Retailer share arrangements (RSA) (1,027) (992) (4)% Provision for credit losses 1,201 1,146 (5)% Other income 137 118 16% Other expense 1,331 1,245 (7)% Pre-tax earnings 1,186 1,256 (6)% Provision for income taxes 301 289 (4)% Net earnings 885 967 (8)% Preferred dividends 21 21 —% Net earnings available to common stockholders $864 $946 (9)% Diluted earnings per share $2.59 $2.50 4% 2Q'26 2Q'25 B / (W)1 Home & Auto Loan receivables $30.4 $30.4 —% Purchase volume $12.1 $11.5 6% Interest and fees on loans $1.4 $1.4 —% Digital Loan receivables $29.0 $27.8 4% Purchase volume $14.9 $13.6 9% Interest and fees on loans $1.6 $1.6 2% Diversified & Value Loan receivables $20.8 $19.5 6% Purchase volume $17.2 $15.4 12% Interest and fees on loans $1.2 $1.2 2% Health & Wellness Loan receivables $15.4 $15.3 1% Purchase volume $4.1 $4.0 2% Interest and fees on loans $0.9 $0.9 3% Lifestyle Loan receivables $6.6 $6.7 (1)% Purchase volume $1.5 $1.4 6% Interest and fees on loans $0.3 $0.3 (2)%
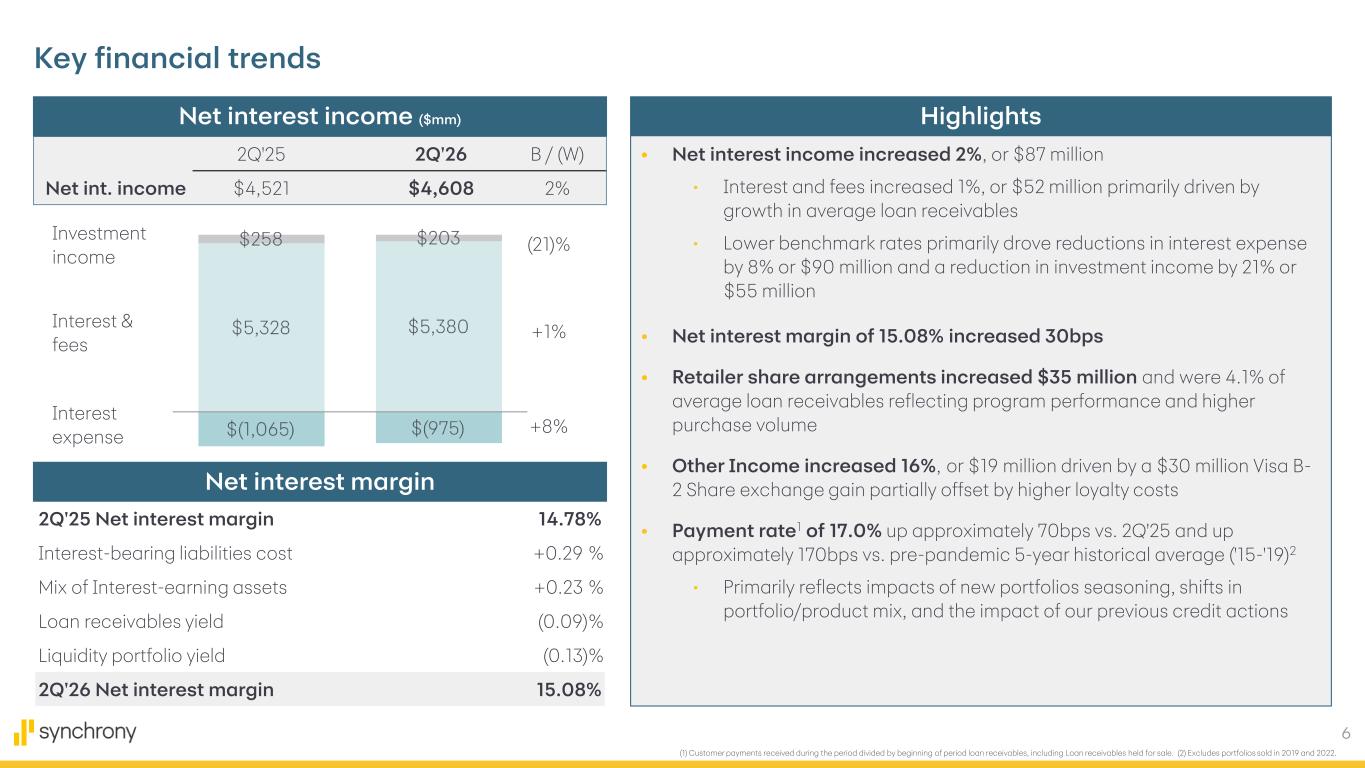
6 2Q'25 2Q'26 B / (W) Net int. income $4,521 $4,608 2% Key financial trends Net interest income ($mm) Highlights (21)% +1% +8% 2Q'25 Net interest margin 14.78% Interest-bearing liabilities cost +0.29 % Mix of Interest-earning assets +0.23 % Loan receivables yield (0.09)% Liquidity portfolio yield (0.13)% 2Q'26 Net interest margin 15.08% Net interest margin • Net interest income increased 2%, or $87 million • Interest and fees increased 1%, or $52 million primarily driven by growth in average loan receivables • Lower benchmark rates primarily drove reductions in interest expense by 8% or $90 million and a reduction in investment income by 21% or $55 million • Net interest margin of 15.08% increased 30bps • Retailer share arrangements increased $35 million and were 4.1% of average loan receivables reflecting program performance and higher purchase volume • Other Income increased 16%, or $19 million driven by a $30 million Visa B- 2 Share exchange gain partially offset by higher loyalty costs • Payment rate1 of 17.0% up approximately 70bps vs. 2Q'25 and up approximately 170bps vs. pre-pandemic 5-year historical average ('15-'19)2 • Primarily reflects impacts of new portfolios seasoning, shifts in portfolio/product mix, and the impact of our previous credit actions (1) Customer payments received during the period divided by beginning of period loan receivables, including Loan receivables held for sale. (2) Excludes portfolios sold in 2019 and 2022. Investment income Interest & fees Interest expense
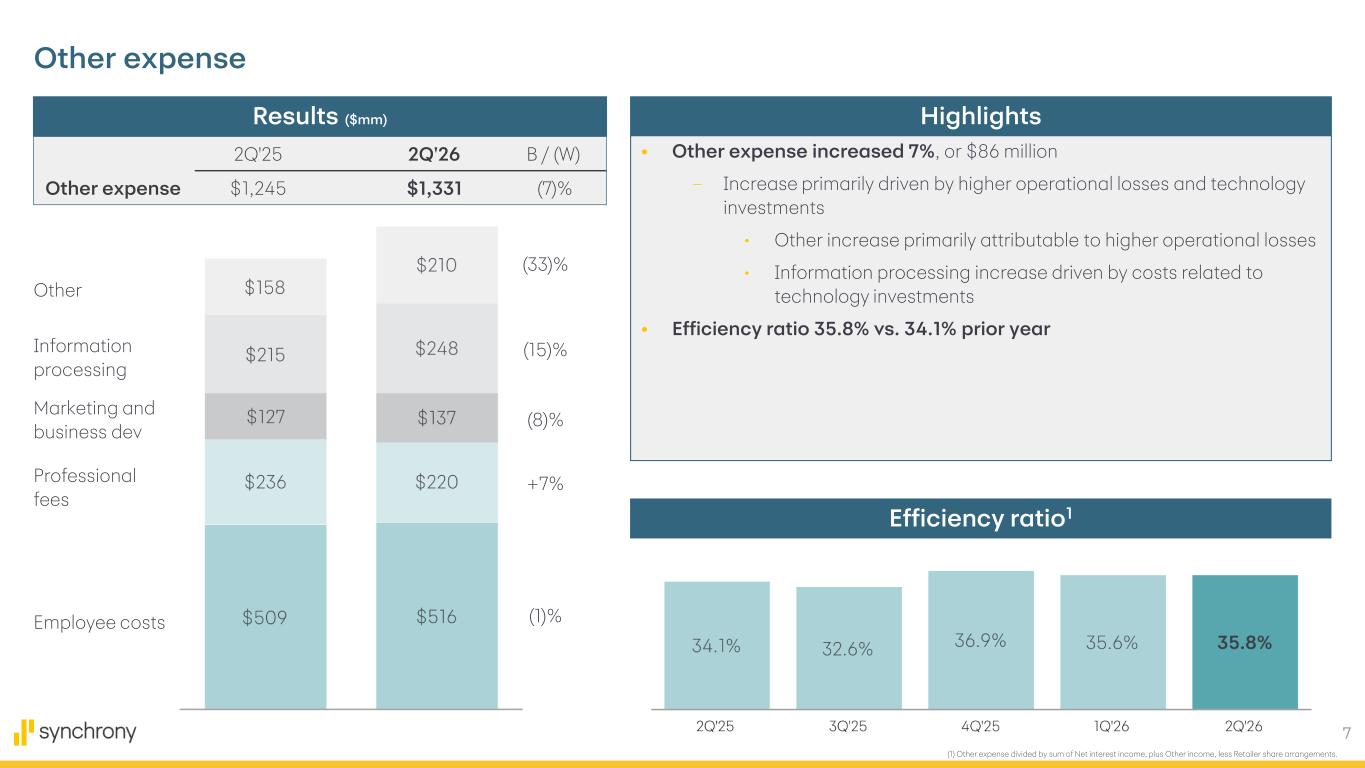
7 (1) Other expense divided by sum of Net interest income, plus Other income, less Retailer share arrangements. 2Q'25 2Q'26 B / (W) Other expense $1,245 $1,331 (7)% Other expense Marketing and business dev Professional fees Results ($mm) Highlights Employee costs +7% (8)% (1)% (15)% Other Efficiency ratio1 (33)% • Other expense increased 7%, or $86 million – Increase primarily driven by higher operational losses and technology investments • Other increase primarily attributable to higher operational losses • Information processing increase driven by costs related to technology investments • Efficiency ratio 35.8% vs. 34.1% prior year Information processing
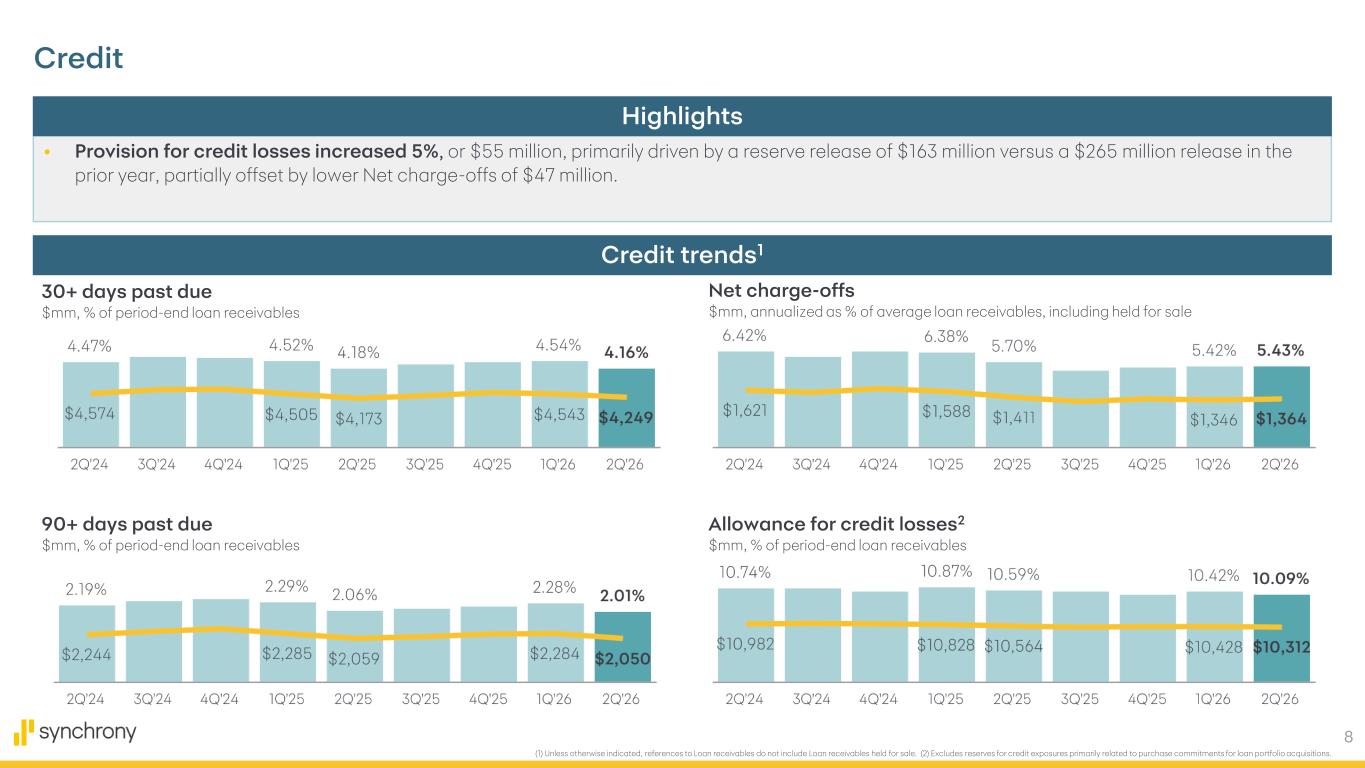
8 • Provision for credit losses increased 5%, or $55 million, primarily driven by a reserve release of $163 million versus a $265 million release in the prior year, partially offset by lower Net charge-offs of $47 million. (1) Unless otherwise indicated, references to Loan receivables do not include Loan receivables held for sale. (2) Excludes reserves for credit exposures primarily related to purchase commitments for loan portfolio acquisitions. Highlights Credit 30+ days past due $mm, % of period-end loan receivables 90+ days past due $mm, % of period-end loan receivables Net charge-offs $mm, annualized as % of average loan receivables, including held for sale Allowance for credit losses2 $mm, % of period-end loan receivables Credit trends1
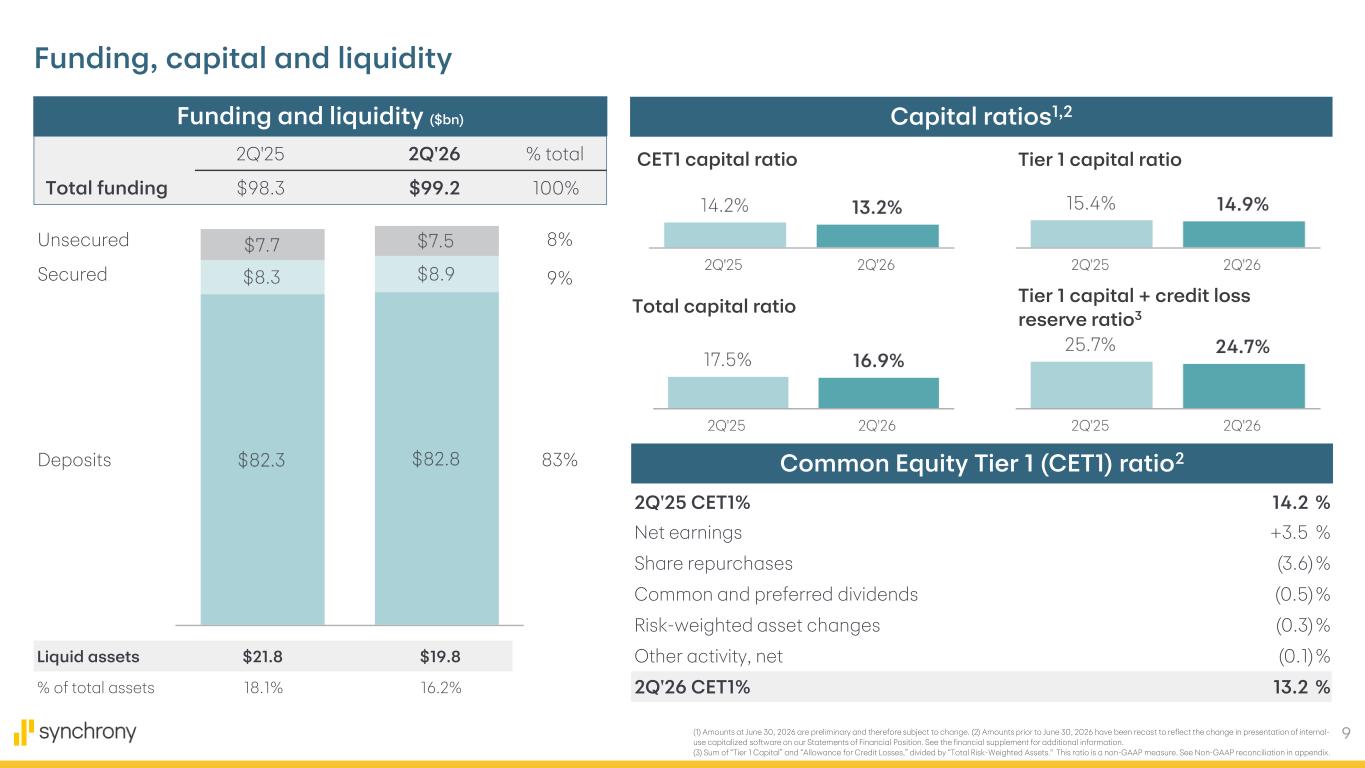
9 2Q'25 CET1% 14.2 % Net earnings +3.5 % Share repurchases (3.6)% Common and preferred dividends (0.5)% Risk-weighted asset changes (0.3)% Other activity, net (0.1)% 2Q'26 CET1% 13.2 % Funding, capital and liquidity Funding and liquidity ($bn) Common Equity Tier 1 (CET1) ratio2 (1) Amounts at June 30, 2026 are preliminary and therefore subject to change. (2) Amounts prior to June 30, 2026 have been recast to reflect the change in presentation of internal- use capitalized software on our Statements of Financial Position. See the financial supplement for additional information. (3) Sum of “Tier 1 Capital” and “Allowance for Credit Losses,” divided by “Total Risk-Weighted Assets." This ratio is a non-GAAP measure. See Non-GAAP reconciliation in appendix. Unsecured Secured Deposits 9% 8% 83% Capital ratios1,2 CET1 capital ratio Tier 1 capital ratio Total capital ratio Tier 1 capital + credit loss reserve ratio3 Liquid assets $21.8 $19.8 % of total assets 18.1% 16.2% 2Q'25 2Q'26 % total Total funding $98.3 $99.2 100%
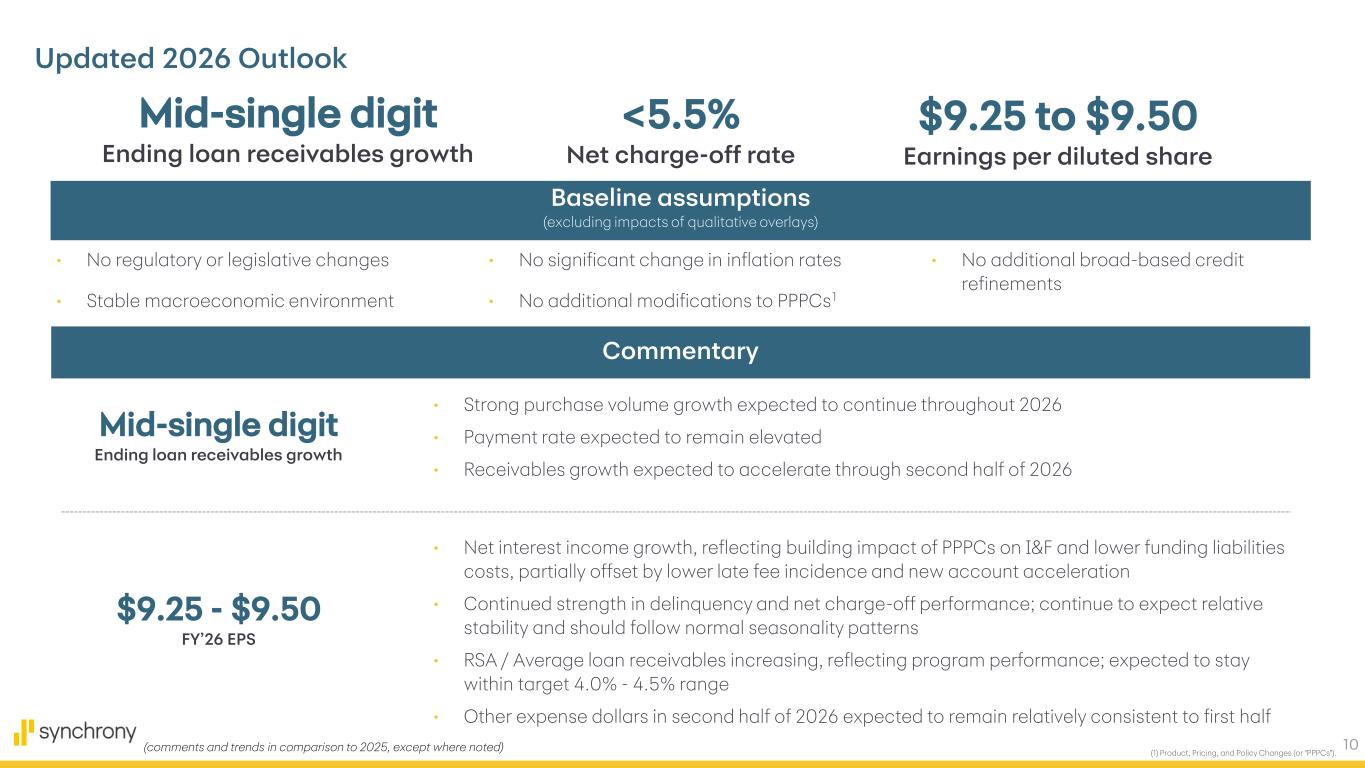
10 Updated 2026 Outlook (comments and trends in comparison to 2025, except where noted) Commentary Baseline assumptions (excluding impacts of qualitative overlays) • No additional broad-based credit refinements • No regulatory or legislative changes • Stable macroeconomic environment • No significant change in inflation rates • No additional modifications to PPPCs1 Mid-single digit Ending loan receivables growth $9.25 - $9.50 FY’26 EPS • Strong purchase volume growth expected to continue throughout 2026 • Payment rate expected to remain elevated • Receivables growth expected to accelerate through second half of 2026 • Net interest income growth, reflecting building impact of PPPCs on I&F and lower funding liabilities costs, partially offset by lower late fee incidence and new account acceleration • Continued strength in delinquency and net charge-off performance; continue to expect relative stability and should follow normal seasonality patterns • RSA / Average loan receivables increasing, reflecting program performance; expected to stay within target 4.0% - 4.5% range • Other expense dollars in second half of 2026 expected to remain relatively consistent to first half Mid-single digit Ending loan receivables growth $9.25 to $9.50 Earnings per diluted share <5.5% Net charge-off rate (1) Product, Pricing, and Policy Changes (or "PPPCs").

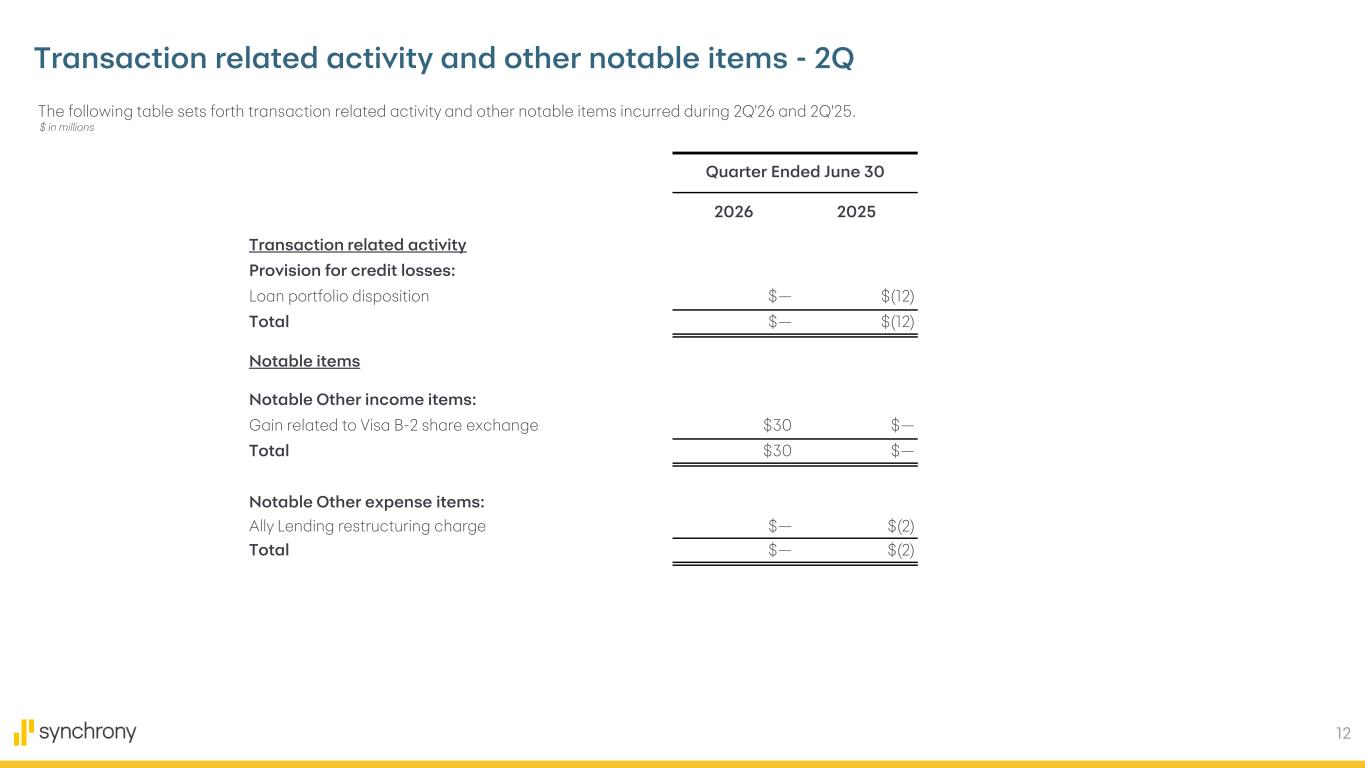
12 The following table sets forth transaction related activity and other notable items incurred during 2Q'26 and 2Q'25. Transaction related activity and other notable items - 2Q $ in millions Quarter Ended June 30 2026 2025 Transaction related activity Provision for credit losses: Loan portfolio disposition $— $(12) Total $— $(12) Notable items Notable Other income items: Gain related to Visa B-2 share exchange $30 $— Total $30 $— Notable Other expense items: Ally Lending restructuring charge $— $(2) Total $— $(2)
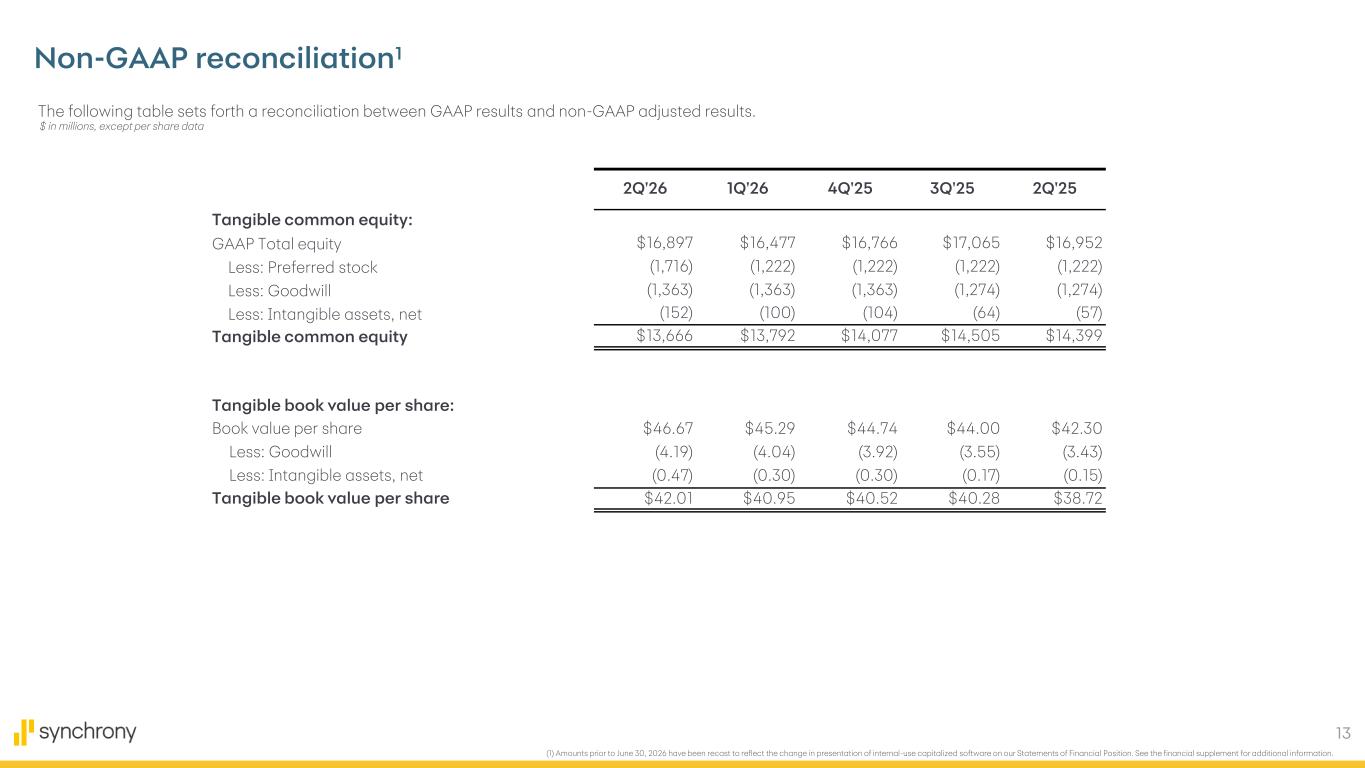
13 The following table sets forth a reconciliation between GAAP results and non-GAAP adjusted results. Non-GAAP reconciliation1 2Q'26 1Q'26 4Q'25 3Q'25 2Q'25 Tangible common equity: GAAP Total equity $16,897 $16,477 $16,766 $17,065 $16,952 Less: Preferred stock (1,716) (1,222) (1,222) (1,222) (1,222) Less: Goodwill (1,363) (1,363) (1,363) (1,274) (1,274) Less: Intangible assets, net (152) (100) (104) (64) (57) Tangible common equity $13,666 $13,792 $14,077 $14,505 $14,399 Tangible book value per share: Book value per share $46.67 $45.29 $44.74 $44.00 $42.30 Less: Goodwill (4.19) (4.04) (3.92) (3.55) (3.43) Less: Intangible assets, net (0.47) (0.30) (0.30) (0.17) (0.15) Tangible book value per share $42.01 $40.95 $40.52 $40.28 $38.72 $ in millions, except per share data (1) Amounts prior to June 30, 2026 have been recast to reflect the change in presentation of internal-use capitalized software on our Statements of Financial Position. See the financial supplement for additional information.
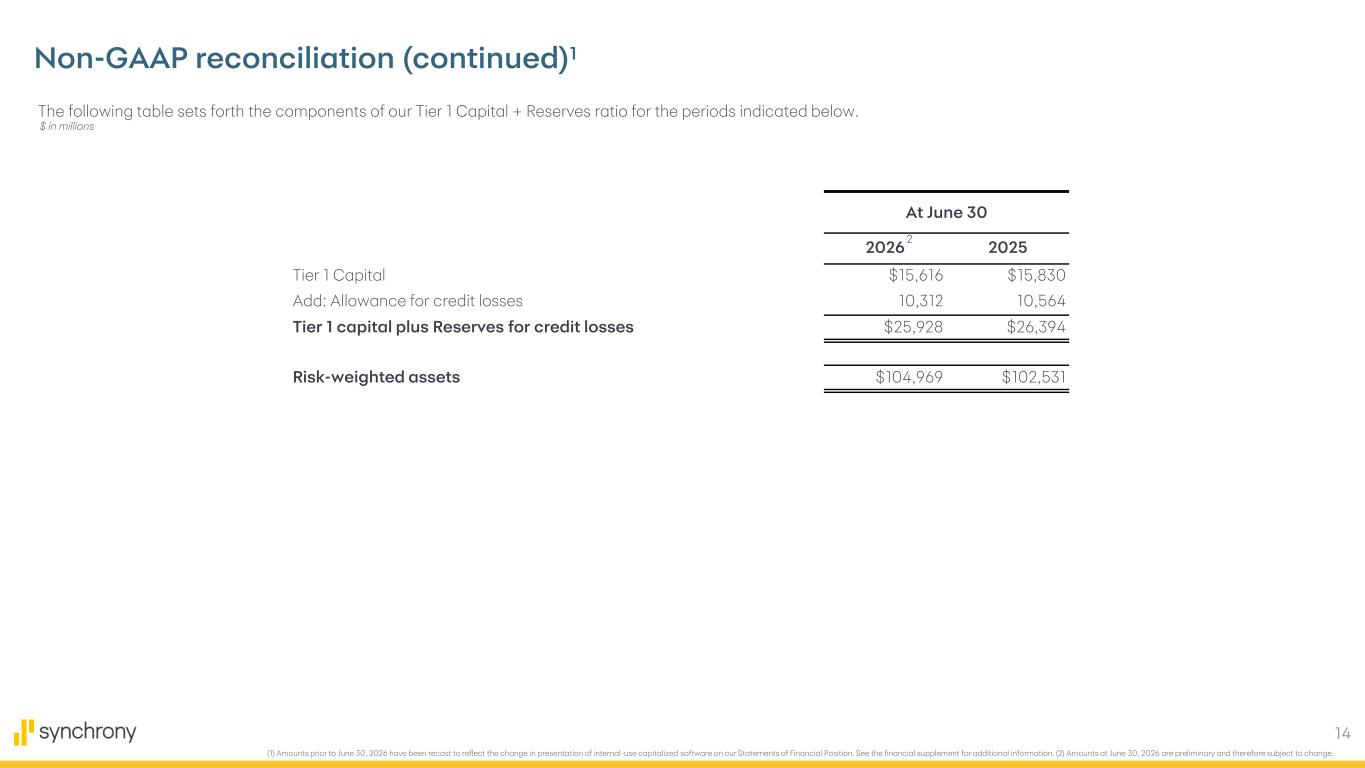
14 $ in millions Non-GAAP reconciliation (continued)1 At June 30 2026 2025 Tier 1 Capital $15,616 $15,830 Add: Allowance for credit losses 10,312 10,564 Tier 1 capital plus Reserves for credit losses $25,928 $26,394 Risk-weighted assets $104,969 $102,531 The following table sets forth the components of our Tier 1 Capital + Reserves ratio for the periods indicated below. 2 (1) Amounts prior to June 30, 2026 have been recast to reflect the change in presentation of internal-use capitalized software on our Statements of Financial Position. See the financial supplement for additional information. (2) Amounts at June 30, 2026 are preliminary and therefore subject to change.