KIMBALL ELECTRONICS REPORTS Q4 RESULTS WITH SOLID FINISH TO THE FISCAL YEAR;
COMPANY PROVIDES GUIDANCE FOR FISCAL 2026
JASPER, Ind., August 13, 2025 -- (BUSINESS WIRE) -- Kimball Electronics, Inc. (Nasdaq: KE) today announced financial results for the fourth quarter and fiscal year ended June 30, 2025.
“I’m encouraged by the results for the fourth quarter and solid finish to the fiscal year. Q4 came in better than expected, as sales increased sequentially, margins improved, and working capital management drove our sixth consecutive quarter of positive cash flow which was used to pay down debt. Our balance sheet is now in a position of competitive strength with ample liquidity to weather an unpredictable environment, while providing dry powder for opportunistic investments.
In total, fiscal 2025 was a year of ‘controlling what we could control’. I’m proud of our team as we made significant progress positioning the Company for a return to profitable growth with a record number of wins for future business, adjusting the cost structure and aligning the portfolio to demand trends, and intensifying our focus as a medical CMO. We expect fiscal 2026 to be another step forward in the journey which will unfold over time.”
Richard D. Phillips
Chief Executive Officer
Fourth Quarter 2025 Highlights
•Net sales totaled $380.5 million, a 2% sequential increase compared to Q3
•Operating income of $16.5 million, or 4.3% of net sales
•Adjusted operating income of $19.6 million, or 5.2% of net sales
•Inventory of $273.5 million, a reduction of $23.1 million in the quarter
•Cash generated from operating activities of $78.1 million, the sixth consecutive quarter of positive cash flow
•Borrowings on credit facilities of $147.5 million, a $31.3 million decrease from Q3
•Cash and cash equivalents of $88.8 million and borrowing capacity of $291.7 million
•Cash Conversion Days of 85, the lowest result in three years
•Invested $3.0 million to repurchase 162,000 shares of common stock
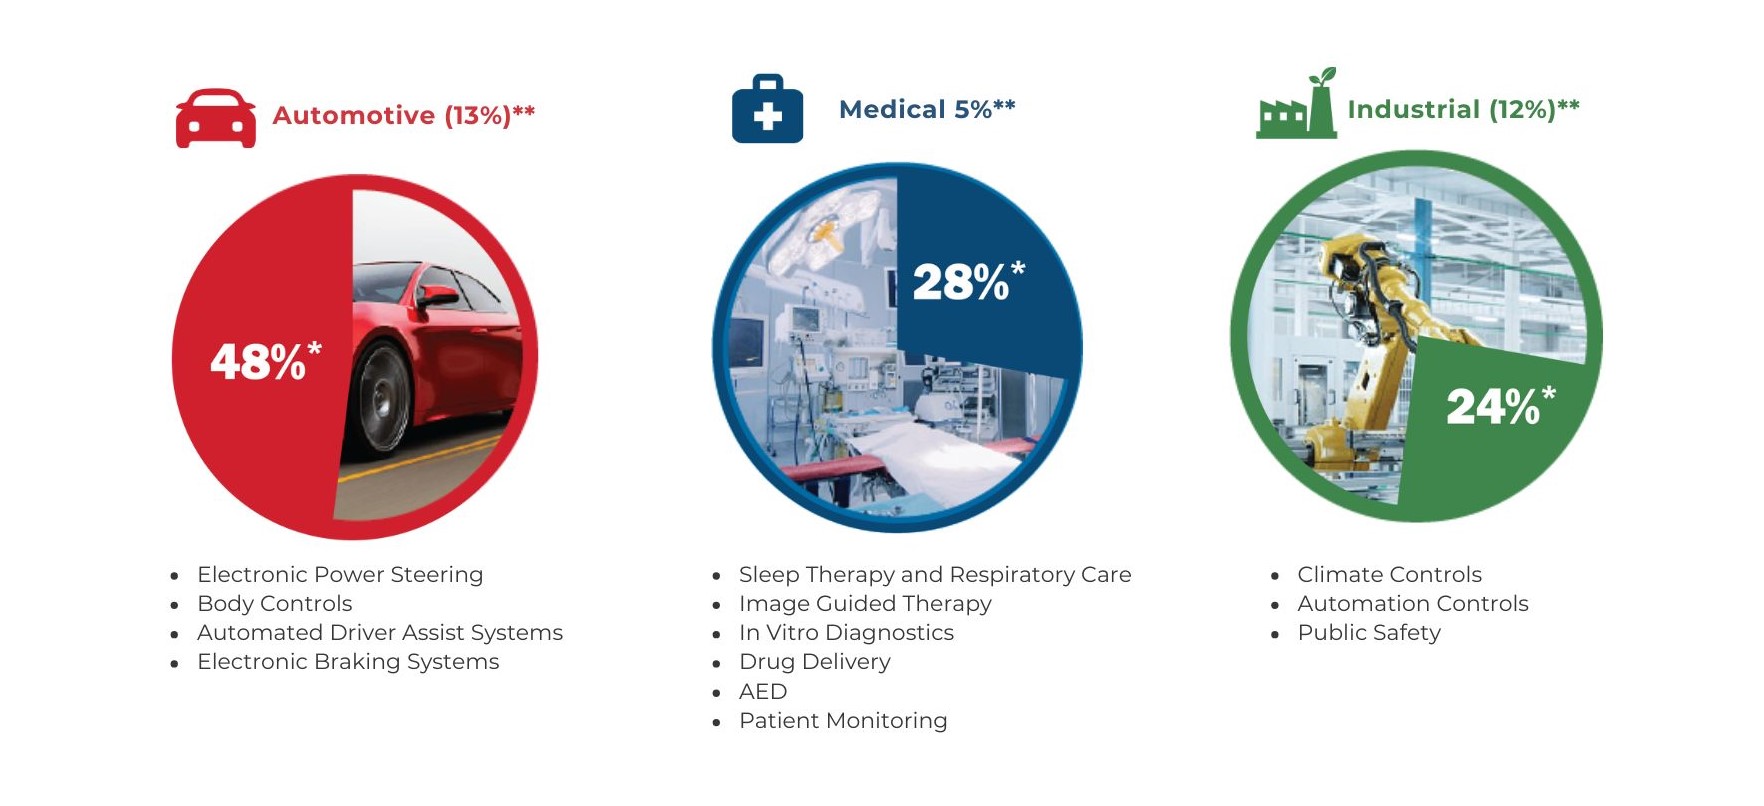
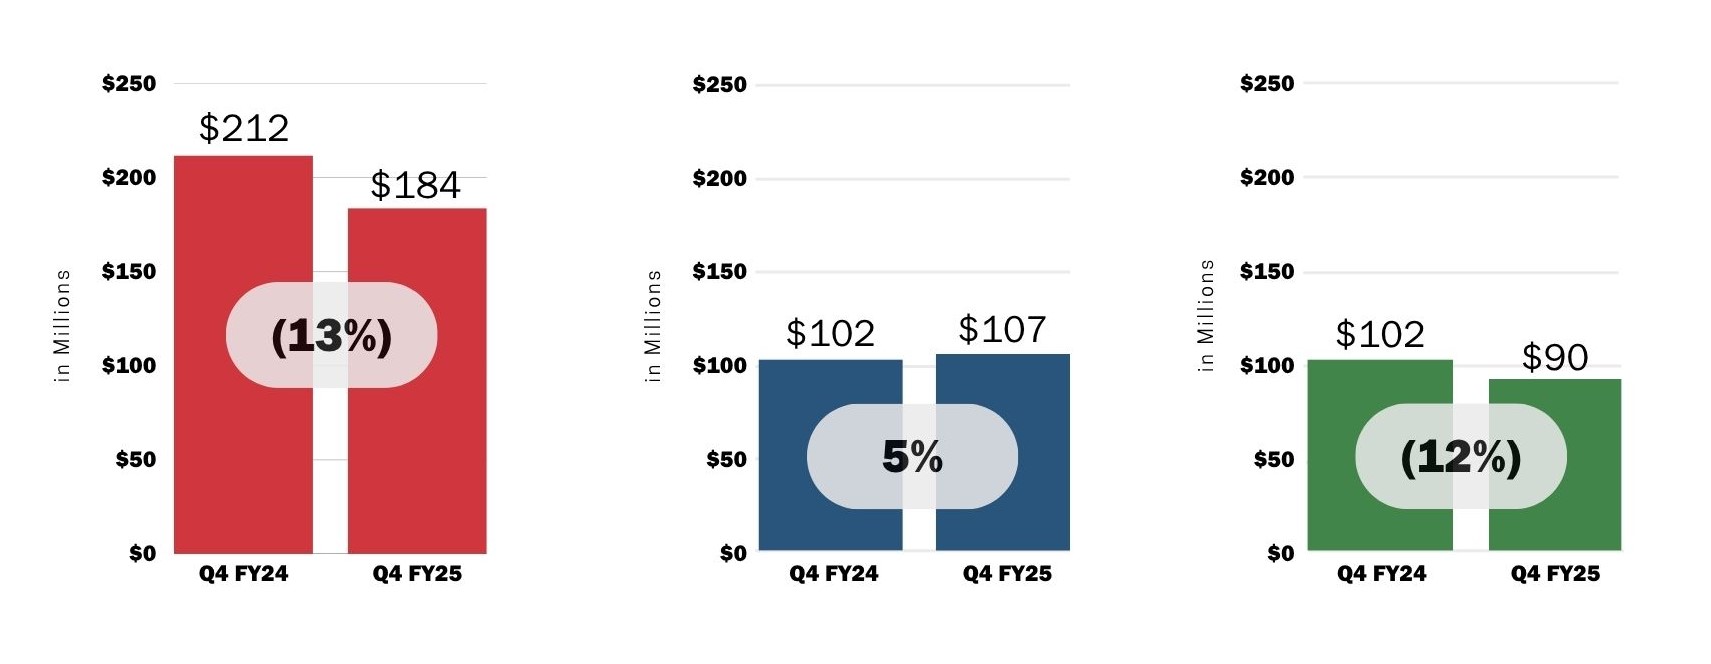
Net Sales By Vertical Market For The Fourth Quarter Of Fiscal 2025
Sales in the medical vertical market increased 5% compared to the fourth quarter of fiscal 2024, while sales in automotive decreased 13% and industrial, excluding Automation, Test and Measurement, decreased 12%.
*Percentage of net sales. AT&M excluded from all amounts, percentages, and periods. **Percentage changes compared to Q4 of fiscal 2024.
FISCAL YEAR 2025 HIGHLIGHTS
•Net sales totaled $1,486.7 million, the third highest annual revenue total for the Company
•Operating income of $45.5 million, or 3.1% of net sales; adjusted operating income of $61.3 million, or 4.1% of net sales
•Inventory reduced $64.6 million, or 19%, in the fiscal year
•Debt paid down by $147.3 million, or 50%, year-over-year; the lowest level of debt in 3 years
•Cash generated from operating activities of $183.9 million, a record result for annual cash flow
•Invested $12.0 million to repurchase 653,000 shares of common stock
“Fiscal 2026 will be a year of transition. We expect modest top line growth in our medical and industrial businesses, but it will be offset by a decline in automotive, with a full year impact from the loss of the braking program in Reynosa. Margins are estimated to be in line with FY25, but it’s important to note that when top line growth returns, enhancements to our cost structure should support margin improvement. Capital expenditures will be heavily weighted toward our new facility in Indianapolis, with the balance supporting growth, automation, and maintenance.”
Jana T. Croom
Chief Financial Officer
FISCAL YEAR 2026 GUIDANCE
•Net sales of $1,350 - $1,450 million, a 2% to 9% decrease compared to fiscal 2025
•Adjusted operating income of 4.0% - 4.25% of net sales, compared to 4.1% of net sales in fiscal 2025
For those unable to participate in the live webcast, the call will be archived at investors.kimballelectronics.com.
Forward-Looking Statements
Certain statements contained within this release are considered forward-looking, including our guidance, under the Private Securities Litigation Reform Act of 1995. The statements may be identified by the use of words such as “expect,” “should,” “goal,” “predict,” “will,” “future,” “optimistic,” “confident,” and “believe.” Undue reliance should not be placed on these forward-looking statements. These statements are based on current expectations of future events and thus are inherently subject to uncertainty. If underlying assumptions prove inaccurate or known or unknown risks or uncertainties materialize, actual results could vary materially from our expectations and projections. These forward-looking statements are subject to risks and uncertainties including, without limitation, global economic conditions, geopolitical environment and conflicts such as the war in Ukraine, global health emergencies, availability or cost of raw materials and components, tariffs and other trade barriers, foreign exchange rate fluctuations, and our ability to convert new business opportunities into customers and revenue. Additional cautionary statements regarding other risk factors that could have an effect on the future performance of the company are contained in its Annual Report on Form 10-K for the year ended June 30, 2024.
Non-GAAP Financial Measures
This press release contains non-GAAP financial measures. The non-GAAP financial measures contained herein include constant currency growth, net sales excluding Automation, Test & Measurement, adjusted selling and administrative expenses, adjusted operating income, adjusted net income, adjusted diluted EPS, and ROIC. Reconciliations of the reported GAAP numbers to these non-GAAP financial measures are included in the Reconciliation of Non-GAAP Financial Measures section below. Management believes these measures are useful and allow investors to meaningfully trend, analyze, and benchmark the performance of the company’s core operations. The company’s non-GAAP financial measures are not necessarily comparable to non-GAAP information used by other companies.
About Kimball Electronics, Inc.
Kimball Electronics is a global, multifaceted manufacturer offering Electronics Manufacturing Services (EMS) and Contract Manufacturing Organization (CMO) solutions to customers around the world. From our operations in the United States, China, Mexico, Poland, Romania, and Thailand, our teams are proud to provide manufacturing services for a variety of industries. Recognized for a reputation of excellence, we are committed to a high-performance culture that values quality, reliability, value, speed, and ethical behavior. Kimball Electronics, Inc. (Nasdaq: KE) is headquartered in Jasper, Indiana.
To learn more about Kimball Electronics, visit www.kimballelectronics.com.
Lasting relationships. Global success.
Contact:
Andrew D. Regrut
Treasurer and Investor Relations Officer
812.827.4151
Investor.Relations@kimballelectronics.com
Financial highlights for the fourth quarter and fiscal year ended June 30, 2025 are as follows:
Three Months Ended
Fiscal Year Ended
June 30,
June 30,
(Amounts in Thousands, except EPS)
2025
2024
2025
2024
Net Sales
$
380,472
$
430,158
$
1,486,727
$
1,714,510
Operating Income
$
16,474
$
19,608
$
45,535
$
49,277
Adjusted Operating Income (non-GAAP) (1)
$
19,638
$
22,694
$
61,267
$
81,496
Operating Income %
4.3
%
4.6
%
3.1
%
2.9
%
Adjusted Operating Income (non-GAAP) %
5.2
%
5.3
%
4.1
%
4.8
%
Net Income
$
6,581
$
7,543
$
16,984
$
20,511
Adjusted Net Income (non-GAAP) (1)
$
8,438
$
9,688
$
28,156
$
41,295
Diluted EPS
$
0.26
$
0.30
$
0.68
$
0.81
Adjusted Diluted EPS (non-GAAP) (1)
$
0.34
$
0.38
$
1.12
$
1.64
(1)Beginning in the first quarter of fiscal year 2025, adjusted results exclude stock compensation expense. Prior reported periods have been revised accordingly. A reconciliation of GAAP and non-GAAP financial measures is included below.
Net Sales by Vertical Market for Q4 and Full Year Fiscal 2025:
Three Months Ended
Fiscal Year Ended
June 30,
June 30,
(Amounts in Millions)
2025
*
2024
*
Percent Change
2025
*
2024
*
Percent Change
Automotive
$
183.7
48
%
$
211.7
49
%
(13)
%
$
737.9
49
%
$
826.4
48
%
(11)
%
Medical
107.2
28
%
102.2
24
%
5
%
396.2
27
%
425.7
25
%
(7)
%
Industrial excluding AT&M (1)
89.6
24
%
101.5
24
%
(12)
%
350.5
24
%
416.7
24
%
(16)
%
Net Sales excluding AT&M (1)
$
380.5
100
%
$
415.4
97
%
(8)
%
$
1,484.6
100
%
$
1,668.8
97
%
(11)
%
AT&M (1)
—
—
%
14.8
3
%
(100)
%
2.1
—
%
45.7
3
%
(95)
%
Total Net Sales
$
380.5
100
%
$
430.2
100
%
(12)
%
$
1,486.7
100
%
$
1,714.5
100
%
(13)
%
*As a percent of Total Net Sales
(1)Sales from our Automation, Test, and Measurement business (AT&M), which was divested effective July 31, 2024, were previously included in the Industrial vertical
–Automotive includes electronic power steering, body controls, automated driver assist systems, and electronic braking systems
–Medical includes sleep therapy and respiratory care, image guided therapy, in vitro diagnostics, drug delivery, AED, and patient monitoring
–Industrial includes climate controls, automation controls, and public safety
Condensed Consolidated Statements of Income
(Unaudited)
Three Months Ended
(Amounts in Thousands, except Per Share Data)
June 30, 2025
June 30, 2024
Net Sales
$
380,472
100.0
%
$
430,158
100.0
%
Cost of Sales
349,991
92.0
%
393,420
91.5
%
Gross Profit
30,481
8.0
%
36,738
8.5
%
Selling and Administrative Expenses
13,163
3.5
%
15,890
3.6
%
Restructuring Expense
1,971
0.5
%
764
0.2
%
Asset Impairment (Gain on Disposal)
(1,127)
(0.3)
%
476
0.1
%
Operating Income
16,474
4.3
%
19,608
4.6
%
Interest Income
196
0.1
%
155
—
%
Interest Expense
(2,776)
(0.7)
%
(5,380)
(1.3)
%
Non-Operating Income (Expense), net
(1,177)
(0.4)
%
(918)
(0.2)
%
Other Income (Expense), net
(3,757)
(1.0)
%
(6,143)
(1.5)
%
Income Before Taxes on Income
12,717
3.3
%
13,465
3.1
%
Provision for Income Taxes
6,136
1.6
%
5,922
1.3
%
Net Income
$
6,581
1.7
%
$
7,543
1.8
%
Earnings Per Share of Common Stock:
Basic
$
0.27
$
0.30
Diluted
$
0.26
$
0.30
Average Number of Shares Outstanding:
Basic
24,552
25,064
Diluted
24,840
25,246
(Unaudited)
Fiscal Year Ended
(Amounts in Thousands, except Per Share Data)
June 30, 2025
June 30, 2024
Net Sales
$
1,486,727
100.0
%
$
1,714,510
100.0
%
Cost of Sales
1,382,323
93.0
%
1,574,253
91.8
%
Gross Profit
104,404
7.0
%
140,257
8.2
%
Selling and Administrative Expenses
50,270
3.4
%
66,626
4.0
%
Other General Expense (Income)
—
—
%
(892)
(0.1)
%
Restructuring Expense
10,990
0.7
%
2,386
0.1
%
Goodwill Impairment
—
—
%
5,820
0.3
%
Asset Impairment (Gain on Disposal)
(2,391)
(0.2)
%
17,040
1.0
%
Operating Income
45,535
3.1
%
49,277
2.9
%
Interest Income
771
0.1
%
638
—
%
Interest Expense
(14,745)
(1.0)
%
(22,839)
(1.3)
%
Non-Operating Income (Expense), net
(5,332)
(0.4)
%
(1,877)
—
%
Other Income (Expense), net
(19,306)
(1.3)
%
(24,078)
(1.4)
%
Income Before Taxes on Income
26,229
1.8
%
25,199
1.5
%
Provision for Income Taxes
9,245
0.7
%
4,688
0.3
%
Net Income
$
16,984
1.1
%
$
20,511
1.2
%
Earnings Per Share of Common Stock:
Basic
$
0.68
$
0.82
Diluted
$
0.68
$
0.81
Average Number of Shares Outstanding:
Basic
24,782
25,079
Diluted
25,017
25,278
Condensed Consolidated Statements of Cash Flows
Fiscal Year Ended
(Unaudited)
June 30,
(Amounts in Thousands)
2025
2024
Net Cash Flow provided by Operating Activities
$
183,937
$
73,217
Net Cash Flow used for Investing Activities
(14,700)
(46,521)
Net Cash Flow (used for) provided by Financing Activities
(160,874)
8,974
Effect of Exchange Rate Change on Cash, Cash Equivalents, and Restricted Cash
2,325
(755)
Net Increase in Cash, Cash Equivalents, and Restricted Cash
10,688
34,915
Cash, Cash Equivalents, and Restricted Cash at Beginning of Period
78,779
43,864
Cash, Cash Equivalents, and Restricted Cash at End of Period
$
89,467
$
78,779
(Unaudited)
Condensed Consolidated Balance Sheets
June 30, 2025
June 30, 2024
(Amounts in Thousands)
ASSETS
Cash and cash equivalents
$
88,781
$
77,965
Receivables, net
222,623
282,336
Contract assets
71,812
76,320
Inventories
273,500
338,116
Prepaid expenses and other current assets
36,027
44,682
Assets held for sale
6,861
27,587
Property and Equipment, net
264,804
269,659
Goodwill
6,191
6,191
Other Intangible Assets, net
2,427
2,994
Other Assets, net
104,286
82,069
Total Assets
$
1,077,312
$
1,207,919
LIABILITIES AND SHARE OWNERS’ EQUITY
Current portion of long-term debt
$
17,400
$
59,837
Accounts payable
218,805
213,551
Advances from customers
35,867
30,151
Accrued expenses
46,489
63,189
Liabilities held for sale
—
8,594
Long-term debt, less current portion
129,650
235,000
Long-term income taxes payable
—
3,255
Other long-term liabilities
59,217
53,881
Share Owners’ Equity
569,884
540,461
Total Liabilities and Share Owners’ Equity
$
1,077,312
$
1,207,919
Other Financial Metrics
(Unaudited)
(Amounts in Millions, except CCD)
At or For the
Three Months Ended
June 30,
March 31,
June 30,
2025
2025
2024
Depreciation and Amortization
$
9.6
$
9.2
$
9.5
Cash Conversion Days (CCD) (1)
85
99
100
Open Orders (2)
$
702
$
642
$
714
(1)Cash Conversion Days (“CCD”) are calculated as the sum of Days Sales Outstanding plus Contract Asset Days plus Production Days Supply on Hand less Accounts Payable Days and less Advances from Customers Days. CCD, or a similar metric, is used in our industry and by our management to measure the efficiency of managing working capital.
(2)Open Orders are the aggregate sales price of production pursuant to unfulfilled customer orders.
Select Financial Results of Automation, Test and Measurement
(Unaudited)
(Amounts in Millions)
Three Months Ended
Fiscal Year Ended
June 30,
June 30,
2025
2024
2025
2024
Net Sales
$
—
$
14.8
$
2.1
$
45.7
Operating Income (Loss) (1)
$
1.1
$
2.0
$
2.0
$
(22.2)
(1)Includes gain on sale of $1.1 million for the three months ended June 30, 2025 and $2.4 million for fiscal year 2025 following the close of the sale on July 31, 2024. Includes goodwill impairment of $5.8 million and asset impairment of $17.0 million for the year ended June 30, 2024. Each period also includes allocated corporate overhead expenses.
Reconciliation of Non-GAAP Financial Measures
(Unaudited, Amounts in Thousands, except Per Share Data)
Three Months Ended
Fiscal Year Ended
June 30,
June 30,
2025
2024
2025
2024
Net Sales Growth (vs. same period in prior year)
(12)
%
(13)
%
(13)
%
(6)
%
Foreign Currency Exchange Impact
1
%
—
%
1
%
—
%
Constant Currency Growth
(13)
%
(13)
%
(14)
%
(6)
%
Selling and Administrative Expenses, as reported
$
13,163
$
15,890
$
50,270
$
66,626
Stock Compensation Expense
(1,991)
(1,750)
(6,519)
(7,185)
SERP
(329)
(96)
(614)
(680)
Adjusted Selling and Administrative Expenses
$
10,843
$
14,044
$
43,137
$
58,761
Operating Income, as reported
$
16,474
$
19,608
$
45,535
$
49,277
Stock Compensation Expense
1,991
1,750
6,519
7,185
SERP
329
96
614
680
Legal Settlements (Recovery)
—
—
—
(892)
Restructuring Expense
1,971
764
10,990
2,386
Goodwill Impairment
—
—
—
5,820
Asset Impairment (Gain on Disposal)
(1,127)
476
(2,391)
17,040
Adjusted Operating Income
$
19,638
$
22,694
$
61,267
$
81,496
Net Income, as reported
$
6,581
$
7,543
$
16,984
$
20,511
Stock Compensation Expense, After-Tax
1,510
1,327
4,944
5,449
Legal Settlements (Recovery), After-Tax
—
—
—
(676)
Restructuring Expense, After-Tax
1,474
580
8,314
1,810
Goodwill Impairment, After-Tax
—
—
—
4,414
Asset Impairment (Gain on Disposal), After-Tax
(1,127)
238
(2,086)
9,787
Adjusted Net Income
$
8,438
$
9,688
$
28,156
$
41,295
Diluted Earnings per Share, as reported
$
0.26
$
0.30
$
0.68
$
0.81
Stock Compensation Expense
0.06
0.05
0.19
0.22
Legal Settlements (Recovery)
—
—
—
(0.03)
Restructuring Expense
0.06
0.02
0.33
0.07
Goodwill Impairment
—
—
—
0.18
Asset Impairment (Gain on Disposal)
(0.04)
0.01
(0.08)
0.39
Adjusted Diluted Earnings per Share
$
0.34
$
0.38
$
1.12
$
1.64
Fiscal Year Ended
June 30,
2025
2024
Operating Income
$
45,535
$
49,277
Goodwill Impairment
—
5,820
SERP
614
680
Restructuring Expense
10,990
2,386
Asset Impairment (Gain on Disposal)
(2,391)
17,040
Legal Settlements (Recovery)
—
(892)
Stock Compensation Expense
6,519
7,185
Adjusted Operating Income (non-GAAP)
$
61,267
$
81,496
Tax Effect
24,508
17,297
After-tax Adjusted Operating Income
$
36,759
$
64,199
Average Invested Capital (1)
$
693,144
$
782,093
ROIC
5.3
%
8.2
%
(1) Average invested capital is computed using Share Owners’ equity plus current and non-current debt less cash and cash equivalents averaged for the last five quarters.