WITH STRONG SALES GROWTH IN THE MEDICAL VERTICAL; COMPANY RAISES ITS GUIDANCE FOR FISCAL 2026
JASPER, Ind., February 4, 2026 -- (BUSINESS WIRE) -- Kimball Electronics, Inc. (Nasdaq: KE) today announced financial results for the second quarter ended December 31, 2025.
“I’m pleased with the results for the second quarter and our updated guidance for fiscal 2026. Sales in Q2 were in line with expectations, highlighted by another quarter of strong double-digit year-over-year growth in the medical vertical, margins improved compared to the same period last year, and cash from operations was positive for the eighth consecutive quarter.
Our focus as a medical CMO continues to gain momentum as we leverage our unique capabilities in the industry. We expect top-line growth in medical to outpace our other two verticals as we balance our portfolio across the markets we serve. Our recent announcement to rebrand as Kimball Solutions, and the grand opening of the new medical manufacturing facility in Indianapolis, reflects this strategy and our expanded offering of capabilities and services.”
Richard D. Phillips
Chief Executive Officer
Second Quarter 2026 Highlights
•Revenue of $341.3 million, a 5% decrease compared to Q2 of fiscal 2025
•Sales in the medical vertical increased 15% year-over-year
•Operating income of $10.8 million, or 3.2% of net sales
•Adjusted operating income of 4.5%, up 80 bps year-over-year
•Cash from operations of $6.9 million, the eighth consecutive quarter of positive operating cash generation
•Debt of $154.2 million and borrowing capacity of $285.1 million
•Cash Conversion Days of 91, a 16-day improvement compared to the same period last year
•Invested $4.3 million to repurchase 149,000 shares of common stock
•Company increases guidance for fiscal 2026 sales and adjusted operating income
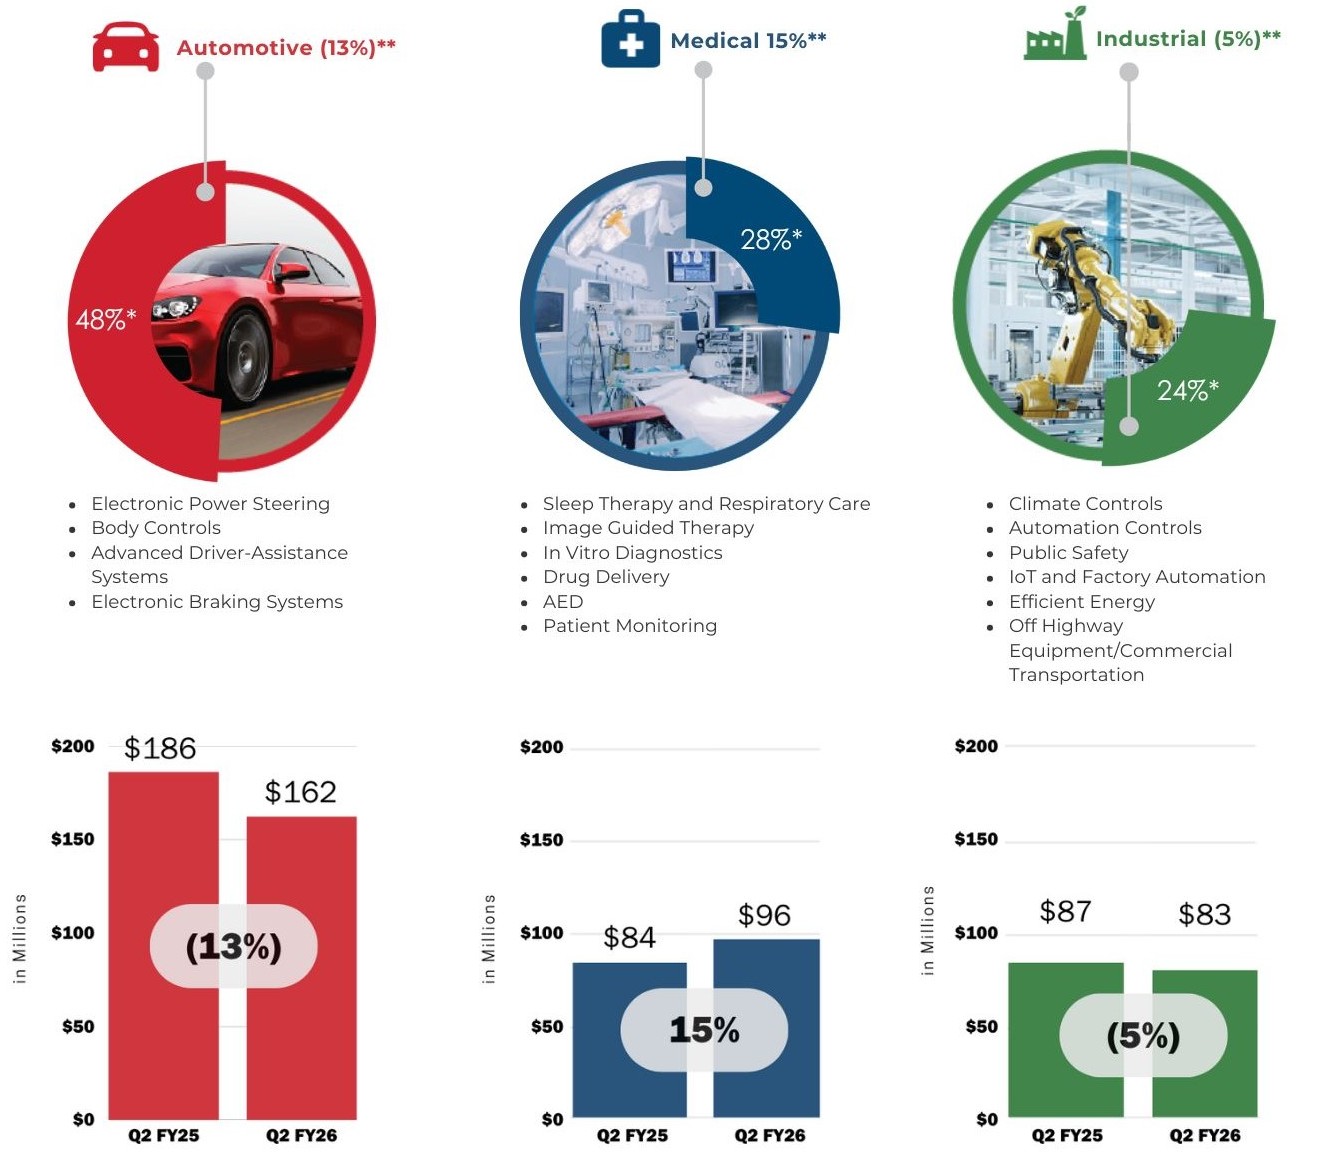
Net Sales by Vertical Market For Q2 Fiscal 2026
Sales in the medical vertical market increased 15% compared to the second quarter of fiscal 2025, while sales in automotive decreased 13% and industrial decreased 5%.
*Percentage of net sales.
**
Percentage changes compared to Q2 of fiscal 2025.
AT&M excluded from all amounts, percentages, and periods.
FISCAL YEAR 2026 GUIDANCE
As part of today’s announcement, the Company increased its guidance for net sales and adjusted operating income in fiscal year 2026:
•Net sales are now expected to be in the range of $1,400 - $1,460 million, compared to the previous guidance of $1,350 - $1,450 million
•Adjusted operating income is estimated to be 4.2% - 4.5% of net sales versus the prior estimate of 4.0% - 4.25%
•The guidance for capital expenditures did not change with a range of $50 - $60 million
For those unable to participate in the live webcast, the call will be archived at investors.kimballelectronics.com.
Forward-Looking Statements
Certain statements contained within this release are considered forward-looking, including our guidance, under the Private Securities Litigation Reform Act of 1995. The statements may be identified by the use of words such as “expect,” “should,” “goal,” “predict,” “will,” “future,” “optimistic,” “confident,” and “believe.” Undue reliance should not be placed on these forward-looking statements. These statements are based on current expectations of future events and thus are inherently subject to uncertainty. If underlying assumptions prove inaccurate or known or unknown risks or uncertainties materialize, actual results could vary materially from our expectations and projections. These forward-looking statements are subject to risks and uncertainties including, without limitation, global economic conditions, geopolitical environment and conflicts such as the war in Ukraine, global health emergencies, availability or cost of raw materials and components, tariffs and other trade barriers, foreign exchange rate fluctuations, and our ability to convert new business opportunities into customers and revenue. Additional cautionary statements regarding other risk factors that could have an effect on the future performance of the company are contained in its Annual Report on Form 10-K for the year ended June 30, 2025.
Non-GAAP Financial Measures
This press release contains non-GAAP financial measures. The non-GAAP financial measures contained herein include constant currency growth, net sales excluding Automation, Test & Measurement, adjusted selling and administrative expenses, adjusted operating income, adjusted net income, adjusted diluted EPS, and ROIC. Reconciliations of the reported GAAP numbers to these non-GAAP financial measures are included in the Reconciliation of Non-GAAP Financial Measures section below. Management believes these measures are useful and allow investors to meaningfully trend, analyze, and benchmark the performance of the company’s core operations. The company’s non-GAAP financial measures are not necessarily comparable to non-GAAP information used by other companies.
About Kimball Electronics, Inc.
Kimball Electronics is a global, multifaceted manufacturer offering Electronics Manufacturing Services (EMS) and Contract Manufacturing Organization (CMO) solutions to customers around the world. From our operations in the United States, China, Mexico, Poland, Romania, and Thailand, our teams are proud to provide manufacturing services for a variety of industries. Recognized for a reputation of excellence, we are committed to a high-performance culture that values quality, reliability, value, speed, and ethical behavior. Kimball Electronics, Inc. (Nasdaq: KE) is headquartered in Jasper, Indiana.
To learn more about Kimball Electronics, visit www.kimballelectronics.com.
Lasting relationships. Global success.
Contact:
Andrew D. Regrut
Vice President, Investor Relations, Strategic Development, and Treasurer
812.827.4151
Investor.Relations@kimballelectronics.com
Financial highlights for the second quarter and year-to-date period ended December 31, 2025 are as follows:
Three Months Ended
Six Months Ended
December 31,
December 31,
(Amounts in Thousands, except EPS)
2025
2024
2025
2024
Net Sales
$
341,280
$
357,392
$
706,883
$
731,648
Operating Income
$
10,767
$
8,230
$
25,221
$
17,345
Adjusted Operating Income (non-GAAP)
$
15,308
$
13,333
$
32,842
$
25,923
Operating Income %
3.2
%
2.3
%
3.6
%
2.4
%
Adjusted Operating Income (non-GAAP) %
4.5
%
3.7
%
4.6
%
3.5
%
Net Income
$
3,637
$
3,432
$
13,723
$
6,586
Adjusted Net Income (non-GAAP)
$
6,925
$
7,354
$
19,175
$
12,881
Diluted EPS
$
0.15
$
0.14
$
0.55
$
0.26
Adjusted Diluted EPS (non-GAAP)
$
0.28
$
0.29
$
0.77
$
0.51
Net Sales by Vertical Market for Q2 Fiscal 2026:
Three Months Ended
Six Months Ended
December 31,
December 31,
(Amounts in Millions)
2025
*
2024 (2)
*
Percent Change
2025
*
2024 (2)
*
Percent Change
Automotive
$
162.3
48
%
$
186.3
52
%
(13)
%
$
326.7
46
%
$
368.0
50
%
(11)
%
Medical
96.3
28
%
84.0
23
%
15
%
197.9
28
%
173.8
24
%
14
%
Industrial excluding AT&M (1)
82.7
24
%
87.1
25
%
(5)
%
182.3
26
%
187.7
26
%
(3)
%
Net Sales excluding AT&M (1)
$
341.3
100
%
$
357.4
100
%
(5)
%
$
706.9
100
%
$
729.5
100
%
(3)
%
AT&M (1)
—
—
%
—
—
%
—
%
—
—
%
2.1
—
%
(100)
%
Total Net Sales
$
341.3
100
%
$
357.4
100
%
(5)
%
$
706.9
100
%
$
731.6
100
%
(3)
%
*As a percent of Total Net Sales
(1)Sales from our Automation, Test, and Measurement business (AT&M), which was divested effective July 31, 2024, were previously included in the industrial vertical
(2)Beginning in the first quarter of fiscal year 2026, sales to customers related to commercial transportation, previously included in the automotive vertical, are now reflected in the industrial vertical; prior periods have been recast to conform to current period presentation
–Automotive includes electronic power steering, body controls, advanced driver-assistance systems, and electronic braking systems
–Medical includes sleep therapy and respiratory care, image guided therapy, in vitro diagnostics, drug delivery, AED, and patient monitoring
–Industrial includes climate controls, automation controls, public safety, IoT and factory automation, efficient energy, off highway equipment, and commercial transportation
Condensed Consolidated Statements of Income
(Unaudited)
Three Months Ended
(Amounts in Thousands, except Per Share Data)
December 31, 2025
December 31, 2024
Net Sales
$
341,280
100.0
%
$
357,392
100.0
%
Cost of Sales
313,412
91.8
%
333,965
93.4
%
Gross Profit
27,868
8.2
%
23,427
6.6
%
Selling and Administrative Expenses
14,862
4.4
%
10,526
3.0
%
Restructuring Expense
1,817
0.5
%
4,671
1.3
%
Asset Impairment
422
0.1
%
—
—
%
Operating Income
10,767
3.2
%
8,230
2.3
%
Interest Income
375
0.1
%
253
0.1
%
Interest Expense
(2,095)
(0.6)
%
(4,241)
(1.2)
%
Non-Operating Income (Expense), net
(2,063)
(0.7)
%
(768)
(0.2)
%
Other Income (Expense), net
(3,783)
(1.2)
%
(4,756)
(1.3)
%
Income Before Taxes on Income
6,984
2.0
%
3,474
1.0
%
Provision (Benefit) for Income Taxes
3,347
0.9
%
42
—
%
Net Income
$
3,637
1.1
%
$
3,432
1.0
%
Earnings Per Share of Common Stock:
Basic
$
0.15
$
0.14
Diluted
$
0.15
$
0.14
Average Number of Shares Outstanding:
Basic
24,606
24,870
Diluted
24,823
24,968
(Unaudited)
Six Months Ended
(Amounts in Thousands, except Per Share Data)
December 31, 2025
December 31, 2024
Net Sales
$
706,883
100.0
%
$
731,648
100.0
%
Cost of Sales
650,179
92.0
%
684,621
93.6
%
Gross Profit
56,704
8.0
%
47,027
6.4
%
Selling and Administrative Expenses
27,952
3.9
%
23,953
3.2
%
Restructuring Expense
3,233
0.5
%
6,993
1.0
%
Asset Impairment (Gain on Disposal)
298
—
%
(1,264)
(0.2)
%
Operating Income
25,221
3.6
%
17,345
2.4
%
Interest Income
514
0.1
%
475
0.1
%
Interest Expense
(4,448)
(0.6)
%
(9,033)
(1.2)
%
Non-Operating Income (Expense), net
(3,304)
(0.6)
%
(2,429)
(0.4)
%
Other Income (Expense), net
(7,238)
(1.1)
%
(10,987)
(1.5)
%
Income Before Taxes on Income
17,983
2.5
%
6,358
0.9
%
Provision (Benefit) for Income Taxes
4,260
0.6
%
(228)
—
%
Net Income
$
13,723
1.9
%
$
6,586
0.9
%
Earnings Per Share of Common Stock:
Basic
$
0.56
$
0.26
Diluted
$
0.55
$
0.26
Average Number of Shares Outstanding:
Basic
24,603
24,924
Diluted
24,878
25,098
Condensed Consolidated Statements of Cash Flows
Six Months Ended
(Unaudited)
December 31,
(Amounts in Thousands)
2025
2024
Net Cash Flow provided by Operating Activities
$
14,943
$
74,932
Net Cash Flow used for Investing Activities
(24,368)
(1,214)
Net Cash Flow used for Financing Activities
(2,142)
(97,255)
Effect of Exchange Rate Change on Cash, Cash Equivalents, and Restricted Cash
623
(722)
Net Decrease in Cash, Cash Equivalents, and Restricted Cash
(10,944)
(24,259)
Cash, Cash Equivalents, and Restricted Cash at Beginning of Period
89,467
78,779
Cash, Cash Equivalents, and Restricted Cash at End of Period
$
78,523
$
54,520
(Unaudited)
Condensed Consolidated Balance Sheets
December 31, 2025
June 30, 2025
(Amounts in Thousands)
ASSETS
Cash and cash equivalents
$
77,853
$
88,781
Receivables, net
213,994
222,623
Contract assets
79,521
71,812
Inventories
281,699
273,500
Prepaid expenses and other current assets
32,214
36,027
Assets held for sale
6,610
6,861
Property and Equipment, net
276,433
264,804
Goodwill
6,191
6,191
Other Intangible Assets, net
2,182
2,427
Other Assets, net
106,774
104,286
Total Assets
$
1,083,471
$
1,077,312
LIABILITIES AND SHARE OWNERS’ EQUITY
Current portion of long-term debt
$
24,112
$
17,400
Accounts payable
218,830
218,805
Advances from customers
28,439
35,867
Accrued expenses
41,995
46,489
Long-term debt, less current portion
129,700
129,650
Other long-term liabilities
61,233
59,217
Share Owners’ Equity
579,162
569,884
Total Liabilities and Share Owners’ Equity
$
1,083,471
$
1,077,312
Other Financial Metrics
(Unaudited)
(Amounts in Millions, except CCD)
At or For the
Three Months Ended
December 31,
September 30,
December 31,
2025
2025
2024
Depreciation and Amortization
$
9.3
$
9.1
$
9.1
Cash Conversion Days (CCD) (1)
91
83
107
Open Orders (2)
$
557
$
593
$
564
(1)Cash Conversion Days (“CCD”) are calculated as the sum of Days Sales Outstanding plus Contract Asset Days plus Production Days Supply on Hand less Accounts Payable Days and less Advances from Customers Days. CCD, or a similar metric, is used in our industry and by our management to measure the efficiency of managing working capital.
(2)Open Orders are the aggregate sales price of production pursuant to unfulfilled customer orders.
Select Financial Results of Automation, Test and Measurement
(Unaudited)
(Amounts in Millions)
Three Months Ended
Six Months Ended
December 31,
December 31,
2025
2024
2025
2024
Net Sales
$
—
$
—
$
—
$
2.1
Operating Income (Loss) (1)
$
(0.4)
$
—
$
(0.4)
$
0.8
(1)Amounts include gain (loss) on sale adjustments following the close of the sale on July 31, 2024: ($0.4 million) in the three and six months ended December 31, 2025 and $1.3 million for the six months ended December 31, 2024.
Reconciliation of Non-GAAP Financial Measures
(Unaudited, Amounts in Thousands, except Per Share Data)
Three Months Ended
Six Months Ended
December 31,
December 31,
2025
2024
2025
2024
Net Sales Growth (vs. same period in prior year)
(5)
%
(15)
%
(3)
%
(15)
%
Foreign Currency Exchange Impact
2
%
—
%
2
%
—
%
Constant Currency Growth
(7)
%
(15)
%
(5)
%
(15)
%
Selling and Administrative Expenses, as reported
$
14,862
$
10,526
$
27,952
$
23,953
Stock Compensation Expense
(2,217)
(501)
(3,780)
(2,573)
SERP
(85)
69
(310)
(276)
Adjusted Selling and Administrative Expenses
$
12,560
$
10,094
$
23,862
$
21,104
Operating Income, as reported
$
10,767
$
8,230
$
25,221
$
17,345
Stock Compensation Expense
2,217
501
3,780
2,573
SERP
85
(69)
310
276
Restructuring Expense
1,817
4,671
3,233
6,993
Asset Impairment (Gain on Disposal)
422
—
298
(1,264)
Adjusted Operating Income
$
15,308
$
13,333
$
32,842
$
25,923
Net Income, as reported
$
3,637
$
3,432
$
13,723
$
6,586
Stock Compensation Expense, After-Tax
1,681
380
2,866
1,951
Restructuring Expense, After-Tax
1,287
3,542
2,360
5,303
Asset Impairment (Gain on Disposal), After-Tax
320
—
226
(959)
Adjusted Net Income
$
6,925
$
7,354
$
19,175
$
12,881
Diluted Earnings per Share, as reported
$
0.15
$
0.14
$
0.55
$
0.26
Stock Compensation Expense
0.07
0.01
0.12
0.07
Restructuring Expense
0.05
0.14
0.09
0.21
Asset Impairment (Gain on Disposal)
0.01
—
0.01
(0.03)
Adjusted Diluted Earnings per Share
$
0.28
$
0.29
$
0.77
$
0.51
Twelve Months Ended
December 31,
2025
2024
Operating Income, as reported
$
53,411
$
30,522
Goodwill Impairment
—
5,820
SERP
648
649
Restructuring Expense
7,230
9,379
Asset Impairment (Gain on Disposal)
(829)
15,776
Legal Settlements (Recovery)
—
(892)
Stock Compensation Expense
7,726
6,096
Adjusted Operating Income
$
68,186
$
67,350
Tax Effect
23,836
17,019
After-tax Adjusted Operating Income
$
44,350
$
50,331
Average Invested Capital (1)
$
657,074
$
756,966
ROIC
6.7
%
6.6
%
(1) Average invested capital is computed using Share Owners’ equity plus current and non-current debt less cash and cash equivalents averaged for the last five quarters.