
| |
| |
| (State or other jurisdiction of incorporation or organization) |
(I.R.S. Employer Identification No.) |
| Title of each class |
Trading Symbol(s) |
Name of exchange on which registered | ||
| |
|
|


No

No 
![]() |
Accelerated filer ![]() |
Non-accelerated filer ![]() |
![]() |
![]() |


| ITEM 11. |
|
1 |
||||||
| ITEM 12. |
28 |
|||||||
| PART IV |
||||||||
| ITEM 15. |
30 |
|||||||
| 33 |
| • | the Company made available to our general partner the services of its employees who acted as the executive officers of our general partner; and |
| • | our general partner paid administrative fees to the Company to cover the services provided to us by the executive officers of our general partner who were employees of the Company. For 2019, such fees totaled approximately $1.0 million. |
| • | Nicholas J. DeIuliis, Chairman and Chief Executive Officer (“CEO” or “Chief Executive Officer”) |
| • | Donald W. Rush, Chief Financial Officer |
| • | Chad A. Griffith, President and Chief Operating Officer |
| • | Timothy C. Dugan, Former Chief Operating Officer* |
| Compensation Element |
Form of Compensation |
Performance Criteria/Formula |
Purpose | ||||||||||||||||
| Base Salary |
• Cash |
Individual performance and experience in the role are the primary factors in determining base salaries. |
To provide fixed compensation to attract and retain key executives and offset the cyclicality in the Company’s business that impacts variable pay. | ||||||||||||||||
| • Cash |
For the Company’s 2019 STIC, the formula was: |
|
To provide incentives to | ||||||||||||||||
| employees to achieve | |||||||||||||||||||
| Short Term Incentive |
Performance Measure |
Individual Performance |
Total Result |
|
Adjusted EBITDAX per share and individual | ||||||||||||||
| Compensation Program (“STIC”) |
Adjusted EBITDAX/ Share |
+ |
Capped at 20% of Total STIC Payout |
= |
190% + Individual Performance |
performance goals for the year and to reward employees for the | |||||||||||||
| achievement of those goals. | |||||||||||||||||||
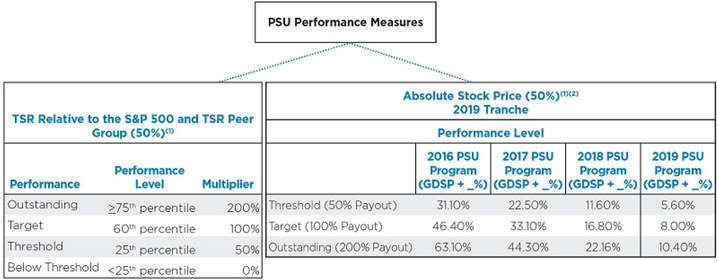
| • 2016, 2017, 2018 and 2019 PSUs (vesting 1/5 per year for five years) |
• PSUs represented generally 55% of the LTIC in each of the 2016-2019 programs • For the PSU awards granted in 2019 for the 2019 – 2023 performance period, the LTIC formula was as follows: |
To create a strong incentive for key management members to achieve long-term performance objectives | |||||||||||||||||
| Performance Measure (2019 PSUs) |
Weight |
Total Units Earned (2019 Tranche) |
and strategic plan, and to align management’s interests with those of the Company’s shareholders. | ||||||||||||||||
| Relative TSR (TSR Peer Group) Absolute Stock Price |
50% 50% |
100% |
Equity awards also are intended to retain executive | ||||||||||||||||
| • For the PSU awards granted in 2018 for the 2018 – 2022 performance period, the LTIC formula was as follows: |
talent. All equity awards settle in stock. | ||||||||||||||||||
| Performance Measure (2018 PSUs) |
Weight |
Total Units Earned (2019 Tranche) |
|||||||||||||||||
| Relative TSR (S&P 500) Absolute Stock Price |
50% 50% |
0% |
|||||||||||||||||
| Long-Term Incentive Compensation |
• For the PSU awards granted in 2017 for the 2017 – 2021 performance period, the LTIC formula was as follows: |
||||||||||||||||||
| Program (“LTIC”) |
Performance Measure (2017 PSUs) |
Weight |
Total Units Earned (2019 Tranche) |
||||||||||||||||
| Relative TSR (S&P 500) Absolute Stock Price |
50% 50% |
0% |
|||||||||||||||||
| • For the PSU awards granted in 2016 for the 2016 – 2020 performance period, the LTIC formula was as follows: |
|||||||||||||||||||
| Performance Measure (2016 PSUs) |
Weight |
Total Units Earned (2019 Tranche) |
|||||||||||||||||
| Relative TSR (S&P 500) Absolute Stock Price |
50% 50% |
132.4% |
|||||||||||||||||
| • 2019 RSUs (vesting 1/3 per year for three years) |
• RSUs represented generally 45% of the 2019 LTIC • RSUs have time-based vesting |
||||||||||||||||||
| Compensation Element |
Form of Compensation |
Performance Criteria/Formula |
|
Purpose | ||||
| Partnership Phantom Units |
• 2019 Phantom Units (vesting 1/3 per year for three years) |
• Phantom Units have time-based vesting |
|
To incentivize management members who have significant responsibilities for the Partnership. | ||||
| Other Agreements and Benefits |
• Retirement Benefits |
|
To attract and retain key | |||||
| • Change in Control Severance Agreements (“CIC Agreements”) |
|
management members and for CIC Agreements, to motivate executives to take actions that are in the best interests of the Company. | ||||||
| Perquisites |
Examples of the Company’s perquisites include: |
|
|
To provide a competitive compensation package. | ||||
| • Vehicle Allowance • Occasional Event Tickets |
|
|
||||||
| Named Executive |
Salaries at Year-End 2018 |
Salaries at Year-End 2019 | ||||
| Nicholas J. DeIuliis (Chief Executive Officer) |
$ | 800,000 |
$800,000 | |||
| Donald W. Rush (Chief Financial Officer) |
$ | 435,969 |
$440,000 | |||
| Chad A. Griffith (Chief Operating Officer) (1) |
$ | 250,000 |
$325,000 | |||
| Timothy C. Dugan (Former Chief Operating Officer) |
$ | 460,163 |
$450,000 | |||
| (1) | Mr. Griffith was promoted to the positions of Chief Operating Officer of the Company and the general partner in July 2019 and the Compensation Committee approved an increase to his base salary. |
| Adjusted EBITDAX/Share |
Performance Level |
EBITDAX Score | ||
| $5.23/share |
Maximum |
200% | ||
| (based on $1,055M Adjusted EBITDAX) |
||||
| $4.84/share |
Target |
100% | ||
| (based on $975M Adjusted EBITDAX) |
||||
| $4.72/share |
Threshold |
70% | ||
| (based on $951M Adjusted EBITDAX) |

| Quantitative Measures |
Performance Results | |
| Achieve a Cash Return on PP&E Invested (Cash Return/Average Gross PP&E (Property, Plant & Equipment)) of 10% (1) |
Achieved Cash Return on PP&E Invested of 10% | |
| Stock buyback activity |
Achieved 12.9 million shares repurchased, rendering a rate of return of more than 25%. | |
| Increase net asset value (“NAV”) per share (1) by 10% by year-end 2019 (without regard to changes in commodity pricing), as determined using consistent NAV per share methodology. |
The Company remains committed to maximizing NAV per share and staying focused on creating and protecting the Company’s long-term value. The Company has effectively done this by creating a strong balance sheet with manageable debt maturities, building a hedge book that protects its margins, and embedding flexibility in its development plan in order to adjust activity levels up and down as market conditions dictate. Additionally, in light of the increasingly deteriorating market conditions during 2019, the Company prioritized the generation of free cash flow by reducing the pace of its development plan and implementing various cost savings programs for capital spending, operating expenses, and selling, general, and administrative (“SG&A”) (including organizational changes that are expected to reduce SG&A cash spend in 2020 by approximately $30 million (2) when compared to 2018). This flexibility, coupled with the increasingly volatile gas markets and industry outlook, makes NAV difficult to measure and calculate at any given point in time. The decisions the Company made in 2019 are expected to maximize the Company’s NAV per share in the long-term. | |
| Qualitative Measures |
Performance Results | |
| Assist operations team in achieving their performance metrics of completions efficiency (Marcellus Shale and Utica Shale), drilling efficiency (Marcellus Shale and Utica Shale), and Safety and Environmental. |
Achieved by: • Improved cycle times, reduced costs, and minimized environmental footprint. • Reduced Marcellus drilling costs per lateral foot by 13% and increased Marcellus lateral lengths by 33%. • Improved drilling efficiency by over 100% since last Southwestern Pennsylvania (“SWPA”) Utica well was drilled in 2017. • Improved SWPA Utica frac efficiency 131% year-over-year and improved Marcellus efficiency 14% year-over-year. • Introduced casings in Marcellus wells to reduce risk and enhance safety. • Notice of Violations decreased from 47 in 2018 to 46 in 2019. • No safety violations in 2019 as designated by federal and state regulations. | |
| At least 25% of all new hires will be diverse (that is, women and minorities) and at least 25% of all candidates interviewed will be diverse. |
Achieved 32% diversity with all new hires and approximately 25% of all candidates interviewed were diverse. |
| (1) | See “ Calculation of Non-GAAP Financial Measures non-GAAP reconciliations and an explanation of NAV per share. |
| (2) | See “ Calculation of Non-GAAP Financial Measures |
| Named Executive |
Target Opportunity Percentages (% of Base Salary) |
Target Payout Opportunity |
EBITDAX Payout |
Individual Performance Payout |
Total Payout |
||||||||||||||||
| Nicholas J. DeIuliis (Chief Executive Officer) |
120 |
% | $ 960,000 |
$ | 1,824,000 |
$ 384,000 |
$ | 2,208,000 |
|||||||||||||
| Donald W. Rush (Chief Financial Officer) |
60 |
% | $ 264,000 |
$ | 501,600 |
$ 105,600 |
$ | 607,200 |
|||||||||||||
| Chad A. Griffith (Chief Operating Officer) |
60 |
% | $ 195,000 |
$ | 370,500 |
$ 78,000 |
$ | 448,500 |
|||||||||||||
(i) |
Relative TSR: |
| • | 2016 PSU Program, 2017 PSU Program and 2018 PSU Program st of the year prior to the grant date; dividends are included). |
| • | 2019 PSU Program st of the year prior to the grant date; dividends are included). |
(ii) |
Absolute Stock Price Appreciation: |

| Named Executive |
Aggregate Dollar Value of 2019 PSU Awards |
|||
| Nicholas J. DeIuliis (Chief Executive Officer) |
$ | 2,750,000 |
||
| Donald W. Rush (Chief Financial Officer) |
$ | 748,000 |
||
| Chad A. Griffith (Chief Operating Officer) |
$ | 171,875 |
||
| (1) | Mr. Griffith was promoted to the positions of Chief Operating Officer of the Company and the general partner in July 2019, but did not receive additional long-term incentive awards at that time. |
| PSU Program |
Performance Metric |
Results |
Units Earned |
Weighting |
Total Units Earned (2019 Tranche Only) |
|||||||||||||
| 2016 PSU Program |
Relative TSR |
35.3 rd percentile |
64.7 |
% | 50 |
% | ||||||||||||
| Absolute Stock Price |
$8.64 (compared to maximum performance of $8.58) |
200.0 |
% | 50 |
% | 132.4 |
% | |||||||||||
| 2017 PSU Program |
Relative TSR |
6.0 th percentile |
0.0 |
% | 50 |
% | ||||||||||||
| Absolute Stock Price |
$8.64 (compared to threshold performance of $19.73) |
0.0 |
% | 50 |
% | 0.0 |
% | |||||||||||
| 2018 PSU Program |
Relative TSR |
4.8 th percentile |
0.0 |
% | 50 |
% | ||||||||||||
| Absolute Stock Price |
$8.64 (compared to threshold performance of $16.10) |
0.0 |
% | 50 |
% | 0.0 |
% | |||||||||||
| 2019 PSU Program |
Relative TSR |
83.3 rd percentile |
200.0 |
% | 50 |
% | ||||||||||||
| Absolute Stock Price |
$8.64 (compared to threshold performance of $13.79) |
0.0 |
% | 50 |
% | 100.0 |
% | |||||||||||
| Named Executive |
PSU Program |
2019 PSU Tranche (at target) |
Target Payout (%) |
Payout Amounts (# of shares) |
||||||||||
| Nicholas J. DeIuliis (Chief Executive Officer) |
2016 Program |
96,010 |
132.4 |
% | 127,118 |
|||||||||
| 2017 Program |
45,000 |
0.0 |
% | 0 |
||||||||||
| 2018 Program |
48,245 |
0.0 |
% | 0 |
||||||||||
| 2019 Program |
45,304 |
100.0 |
% | 45,304 |
||||||||||
| Donald W. Rush (Chief Financial Officer) |
2016 Program |
1,200 |
132.4 |
% | 1,589 |
|||||||||
| 2017 Program |
748 |
0.0 |
% | 0 |
||||||||||
| 2018 Program |
8,546 |
0.0 |
% | 0 |
||||||||||
| 2019 Program |
12,323 |
100.0 |
% | 12,323 |
||||||||||
| Chad A. Griffith (Chief Operating Officer) |
2018 Program |
584 |
0.0 |
% | 0 |
|||||||||
| 2019 Program |
2,831 |
100.0 |
% | 2,831 |
||||||||||
| Timothy C. Dugan (Former Chief Operating Officer) |
2016 Program |
22,402 |
132.4 |
% | 29,661 |
|||||||||
| 2017 Program |
14,250 |
0.0 |
% | 0 |
||||||||||
| 2018 Program |
15,277 |
0.0 |
0 |
|||||||||||
| Named Executive |
Aggregate Dollar Value of RSU Awards |
|||
| Nicholas J. DeIuliis (Chief Executive Officer) |
$ 2,250,000 |
|||
| Donald W. Rush (Chief Financial Officer) |
$ 612,000 |
|||
| Chad A. Griffith (Chief Operating Officer) |
$ 140,625 |
|||
| (1) | Mr. Griffith was promoted to the positions of Chief Operating Officer of the Company and the general partner in July 2019, but did not receive additional long-term incentive awards at that time. |
| Named Executive |
Multiple of Base Salary and Incentive Pay |
|||
| Nicholas J. DeIuliis (Chief Executive Officer) |
2.5 |
|||
| Donald W. Rush (Chief Financial Officer) |
1.5 |
|||
| Chad A. Griffith (Chief Operating Officer) |
1.5 |
|||
| (1) | References to PSUs are at target and exclude any PSUs that may be earned for a Missed Year. |
| Named Executive |
Ownership Guideline (Multiple of Base Salary) |
Percentage Compliance with Ownership Guideline (1) |
||||||
| Nicholas J. DeIuliis (Chief Executive Officer) |
5.5 |
306 |
% | |||||
| Donald W. Rush (Chief Financial Officer) |
3.5 |
121 |
% | |||||
| Chad A. Griffith (Chief Operating Officer) |
3.5 |
53 |
% (2) | |||||
| (1) | Based on the Company’s 200-day average rolling stock price per share ended December 31, 2019 of $8.135. |
| (2) | Pursuant to the Company’s guidelines, Mr. Griffith, who was promoted on July 30, 2019, will have until July 30, 2024 to comply with the stock ownership guidelines. |
| • | Net Asset Value. |
| • | Definitions. |
| depletion and amortization, and exploration. Adjusted EBITDAX consolidated is defined as EBITDAX after adjusting for the discrete items listed below. Although EBIT, EBITDAX, and adjusted EBITDAX consolidated are not measures of performance calculated in accordance with generally accepted accounting principles, management believes that they are useful to an investor in evaluating the Company because they are widely used to evaluate a company’s operating performance. The Company excludes stock-based compensation from adjusted EBITDAX because the Company does not believe it accurately reflects the actual operating expense incurred during the relevant period and may vary widely from period to period irrespective of operating results. Investors should not view these metrics as a substitute for measures of performance that are calculated in accordance with generally accepted accounting principles. In addition, because all companies do not calculate EBIT, EBITDAX, or adjusted EBITDAX consolidated identically, the presentation here may not be comparable to similarly titled measures of other companies. Investors should not view these metrics as a substitute for measures of performance that are calculated in accordance with generally accepted accounting principles. |
| • | Adjusted EBITDAX for STIC |
| Adjusted EBITDAX Attributable to Company Shareholders |
|||||
| ($ in Thousands) |
December 31, 2019 |
||||
| Net Income |
$ | 31,948 |
|||
| Add: Interest Expense |
151,379 |
||||
| Less: Interest Income |
(1,949 |
) | |||
| Add: Income Taxes |
27,736 |
||||
| Earnings Before Interest & Taxes (EBIT) from Continuing Operations |
$ | 209,114 |
|||
| Add: Depreciation, Depletion & Amortization |
508,463 |
||||
| Add: Exploration Expense |
44,380 |
||||
| Earnings Before Interest, Taxes, and DD&A (EBITDAX) from Continuing Operations |
$ | 761,957 |
|||
| Adjustments: |
|||||
| Unrealized Gain on Commodity Derivative Instruments |
(306,325 |
) | |||
| Loss on Certain Asset Sales and Abandonments |
3,564 |
||||
| Severance Expense |
3,317 |
||||
| Stock Based Compensation |
38,425 |
||||
| Loss on Debt Extinguishment |
7,614 |
||||
| Impairment of Proved Property |
327,400 |
||||
| Impairment of Unproved Property |
119,429 |
||||
| Net Impact of Shaw Event |
2,146 |
||||
| Adjustment to get STIC to Target Payout |
10,358 |
||||
| Total Pre-tax Adjustments |
$ | 205,928 |
|||
| ADJUSTED EBITDAX CONSOLIDATED TTM |
$ |
967,885 |
|||
| • | Adjusted EBITDAX per Share for STIC |
| • | Achieved Cash Return on PP&E Invested |
| For the Year Ended December 31, 2019 |
||||||||||||||||||||||||||||||||||||||||
| Dollars in millions |
Stand-alone |
(1) |
+ |
CNX Gathering |
= |
Company |
+ |
Partnership |
= |
Total Company |
||||||||||||||||||||||||||||||
| Cash From Operations (2) |
$ | 763.5 |
+ |
$ | 10.9 |
= |
$ | 774.4 |
+ |
$ | 206.2 |
(2 |
) |
= |
$ | 980.6 |
||||||||||||||||||||||||
| Interest Expense |
$ | 121.1 |
+ |
$ | — |
= |
$ | 121.1 |
+ |
$ | 30.3 |
= |
$ | 151.4 |
||||||||||||||||||||||||||
| Cash Return |
$ | 884.6 |
+ |
$ | 10.9 |
= |
$ | 895.5 |
+ |
$ | 236.5 |
= |
$ | 1,132.0 |
||||||||||||||||||||||||||
| PP&E Invested |
$ | 9,269.4 |
+ |
$ | 46.1 |
= |
$ | 9,315.5 |
+ |
$ | 1,302.6 |
= |
$ | 10,572.0 |
||||||||||||||||||||||||||
| Cash Return/PP&E Invested |
10 |
% | ||||||||||||||||||||||||||||||||||||||
| • | SG&A Cash Spend. |
| Name and Principal Position (1) (a) |
Year (b) |
Salary ($) (c) |
Bonus ($) (d) |
Stock Awards ($) (2) (e) |
Option Awards ($) (f) |
Non-Equity Incentive Plan Compensation ($) (3) (g) |
Change in Pension Value and Nonqualified Deferred Compensation Earnings ($) (4) (h) |
All Other Compensation ($) (5) (i) |
Total ($) (j) |
|||||||||||||||||||||||||||
| Nicholas J. DeIuliis (6) |
2019 |
$ | 800,000 |
$ | — |
$ | 5,901,570 |
$ | — |
$ | 2,208,000 |
$ | 4,792,836 |
$ | 39,031 |
(7) |
$ | 13,741,437 |
||||||||||||||||||
| Chief Executive Officer |
2018 |
$ | 800,000 |
$ | — |
$ | 7,042,130 |
$ | — |
$ | 2,376,000 |
$ | — |
$ | 54,378 |
$ | 10,272,508 |
|||||||||||||||||||
| Donald W. Rush (6) |
2019 |
$ | 439,830 |
$ | — |
$ | 1,978,865 |
$ | — |
$ | 607,200 |
$ | 7,515 |
$ | 30,622 |
(8) |
$ | 3,064,032 |
||||||||||||||||||
| Chief Financial Officer |
2018 |
$ | 427,600 |
$ | — |
$ | 1,447,648 |
$ | — |
$ | 733,000 |
$ | — |
$ | 36,425 |
$ | 2,644,673 |
|||||||||||||||||||
| Chad A. Griffith (6) |
2019 |
$ | 278,557 |
$ | — |
$ | 712,276 |
$ | — |
$ | 448,500 |
$ | — |
$ | 20,400 |
(9) |
$ | 1,459,733 |
||||||||||||||||||
| Chief Operating Officer |
2018 |
$ | 210,237 |
$ | 50,000 |
$ | 135,453 |
$ | $ | 220,000 |
$ | $ | 12,615 |
$ | 628,305 |
|||||||||||||||||||||
| Timothy C. Dugan |
2019 |
$ | 450,430 |
$ | — |
$ | — |
$ | — |
$ | — |
$ | 22,576 |
$ | 131,553 |
(10) |
$ | 604,559 |
||||||||||||||||||
| Former Chief Operating Officer |
2018 |
$ | 453,340 |
$ | — |
$ | 2,380,003 |
$ | — |
$ | 688,000 |
$ | — |
$ | 33,091 |
$ | 3,554,434 |
|||||||||||||||||||
| (1) | None of the named executives were executive officers of the general partner prior to January 2018. |
| (2) | These values represent the aggregate grant date fair value of PSU and RSU awards, and in the case of Messrs. Rush and Griffith, also Partnership phantom units ($373,629 and $343,419, respectively), granted to the named executives in 2019 under the CNX Resources Corporation Equity Incentive Plan (the “Company EIP”) and the CNXM LTIP. The values are based on the aggregate grant date fair value of the awards computed in accordance with SEC rules and Financial Accounting Standards Board (“FASB”) Accounting Standards Codification (“ASC”) Topic 718, “Compensation-Stock Compensation” (“FASB ASC Topic 718”), which awards were granted on January 31, 2019. The amounts reported in this column reflect the accounting cost for these awards, and do not correspond to the actual economic value that may be received by the named executives. For example, in order for the 2019 PSUs to vest even with a 50% payout, certain threshold TSR and Absolute Stock Price (“ASP”) levels must be attained. |
| (3) | Includes cash incentives earned and paid by the Company in the applicable year under the STIC. |
| (4) | The amounts for 2019 reflect the actuarial increase in the present value of the named executives’ benefits under the SERP and the Defined Contribution Restoration Plan (the “New Restoration Plan”) through December 31, 2019. As it relates to Mr. DeIuliis, the value shown assumes a normal retirement age of 65 for the SERP benefit, despite the fact that Mr. DeIuliis would not be eligible to receive the normal retirement benefit until 2033. If Mr. DeIuliis was to retire earlier, his benefit would be age reduced pursuant to the provisions of the SERP. The amounts shown were determined primarily using the interest rate assumptions and mortality assumptions (the latter for Mr. DeIuliis only) set forth in the financial statements of the Company’s applicable Annual Reports on Form 10-K (Note 16 in the Company Form 10-K for the 2019 amount). Values may fluctuate significantly from year to year depending on several factors, including age, years of service, average annual earnings and the assumptions used to determine the present value, such as the discount rate. Finally, for Mr. DeIuliis in 2019, almost half of the increase in the stated value is attributable to the following factors, which were beyond our control: changes in interest rates and the passage of time. |
| (5) | On April 6, 2009, the Company filed a Current Report on Form 8-K stating that it would no longer provide tax gross-ups to its officers, as defined under Section 16 of the Exchange Act, in connection with Company-maintained perquisite programs. |
| (6) | Messrs. DeIuliis, Rush, and Griffith did not receive any additional compensation from the Company in connection with their respective service on the Board of Directors in 2019. |
| (7) | Mr. DeIuliis’ personal benefits for 2019 include: a vehicle allowance, occasional event tickets, one commercial airline ticket for his spouse to attend a Company event and a physical exam. Mr. DeIuliis had his spouse accompany him on three one-way chartered airplane flights related to business functions. The total in column (i) includes $16,800 in employer matching contributions made by the Company under its 401(k) plan. |
| (8) | Mr. Rush’s personal benefits for 2019 include: a vehicle allowance, occasional event tickets, and luncheon and city club dues. The total in column (i) includes $16,800 in employer matching contributions made by the Company under its 401(k) plan. |
| (9) | Mr. Griffith’s personal benefits for 2019 include: city club dues and occasional event tickets. The total in column (i) includes $15,554 in matching contributions made by the Company under its 401(k) plan. |
| (10) | Mr. Dugan’s personal benefits for 2019 include: a vehicle allowance and a physical exam. Total in column (i) includes $16,800 in matching contributions made by the Company under its 401(k) plan and a $100,000 severance payment. |
| Estimated Possible Payouts Under Non-Equity Incentive Plan Awards (STIC) (1) |
Estimated Future Payouts Under Equity Incentive Plan Awards (PSUs) (2) |
All Other Stock Awards: Number of Shares of Stock or |
Grant Date Fair Value of Stock and Option |
|||||||||||||||||||||||||||||||||||||
| Name |
Grant Date |
Threshold ($) |
Target ($) |
Maximum ($) |
Threshold (#) |
Target (#) |
Maximum (#) |
Units (#) |
Awards (5) ($) |
|||||||||||||||||||||||||||||||
| Nicholas J. DeIuliis |
— |
480,000 |
960,000 |
2,400,000 |
— |
— |
— |
— |
— |
|||||||||||||||||||||||||||||||
| 1/31/2019 |
— |
— |
— |
113,262 |
226,524 |
453,048 |
— |
3,651,567 |
||||||||||||||||||||||||||||||||
| 1/31/2019 |
(3) |
— |
— |
— |
— |
— |
— |
185,338 |
2,250,003 |
|||||||||||||||||||||||||||||||
| Donald W. Rush |
— |
132,000 |
264,000 |
660,000 |
— |
— |
— |
— |
— |
|||||||||||||||||||||||||||||||
| 1/31/2019 |
— |
— |
— |
30,808 |
61,615 |
123,230 |
— |
993,234 |
||||||||||||||||||||||||||||||||
| 1/31/2019 |
(3) |
— |
— |
— |
— |
— |
— |
50,412 |
612,002 |
|||||||||||||||||||||||||||||||
| 1/31/2019 |
(4) |
— |
— |
— |
— |
— |
— |
23,598 |
373,629 |
|||||||||||||||||||||||||||||||
| Chad A. Griffith |
— |
97,500 |
195,000 |
487,500 |
— |
— |
— |
— |
— |
|||||||||||||||||||||||||||||||
| 1/31/2019 |
— |
— |
— |
7,079 |
14,158 |
28,316 |
— |
228,227 |
||||||||||||||||||||||||||||||||
| 1/31/2019 |
(3) |
— |
— |
— |
— |
— |
— |
11,584 |
140,630 |
|||||||||||||||||||||||||||||||
| 1/31/2019 |
(4) |
— |
— |
— |
— |
— |
— |
21,690 |
343,419 |
|||||||||||||||||||||||||||||||
| Timothy C. Dugan |
— |
510,000 |
1,020,000 |
2,550,000 |
— |
— |
— |
— |
— |
|||||||||||||||||||||||||||||||
| (1) | Awards were made pursuant to the STIC under the Company’s Executive Annual Incentive Plan. Actual incentive plan payments are based on the Company’s fiscal 2019 performance and are set forth in the “Non-Equity Incentive Plan Compensation” column of the Summary Compensation Table. |
| (2) | These columns report the number of PSUs that may be earned pursuant to the awards originally granted under the Company EIP. The amounts reflect threshold (50%), target (100%), and maximum (200%) performance levels. |
| (3) | RSU grants were made under the Company EIP. |
| (4) | Partnership phantom unit grants were made under the CNXM LTIP. |
| (5) | The values set forth in this column reflect the aggregate grant date fair value of awards computed in accordance with FASB ASC Topic 718. The values set forth in this table may not correspond to the actual values that will be realized by the named executives. |
| Option Awards |
Stock Awards |
|||||||||||||||||||||||||||||||||||||||
| Name (a) |
Number of Securities Underlying Unexercised Options (#) (Exercisable) (b) |
Number of Securities Underlying Unexercised Options (#) (Unexercisable) (c) |
Equity Incentive Plan Awards: Number of Securities Underlying Unexercised Unearned Options (#) (d) |
Option Exercise Price (e) |
Option Expiration Date (f) |
Number of Shares or Units of Stock That Have Not Vested (#) (14) (g) |
Market Value of Shares or Units of Stock That Have Not Vested ($) (2) (h) |
Equity Incentive Plan Awards: Number of Unearned Shares, Units or Other Rights That Have Not Vested (#) (1) (i) |
Equity Incentive Plan Awards: Market or Payout Value of Unearned Shares, Units or Other Rights That Have Not Vested ($) (2) (j) |
|||||||||||||||||||||||||||||||
| Nicholas J. DeIuliis |
41,106 |
(3) |
— |
— |
43.722 |
2/16/20 |
— |
— |
— |
— |
||||||||||||||||||||||||||||||
| 175,619 |
(4) |
— |
— |
39.003 |
6/15/20 |
— |
— |
— |
— |
|||||||||||||||||||||||||||||||
| 39,475 |
(5) |
— |
— |
42.085 |
2/23/21 |
— |
— |
— |
— |
|||||||||||||||||||||||||||||||
| 61,077 |
(6) |
— |
— |
31.012 |
3/01/22 |
— |
— |
— |
— |
|||||||||||||||||||||||||||||||
| 795,563 |
(8) |
— |
— |
6.874 |
1/29/26 |
— |
— |
— |
— |
|||||||||||||||||||||||||||||||
| — |
— |
— |
— |
— |
185,338 |
(7) |
$ | 1,640,241 |
— |
— |
||||||||||||||||||||||||||||||
| — |
— |
— |
— |
— |
127,118 |
(9) |
$ | 1,124,994 |
— |
— |
||||||||||||||||||||||||||||||
| — |
— |
— |
— |
— |
45,304 |
(10) |
$ | 400,940 |
— |
— |
||||||||||||||||||||||||||||||
| — |
— |
— |
— |
— |
— |
— |
490,635 |
$ | 4,342,120 |
|||||||||||||||||||||||||||||||
| Donald W. Rush |
9,944 |
(8) |
— |
— |
6.874 |
1/29/26 |
— |
— |
— |
— |
||||||||||||||||||||||||||||||
| — |
— |
— |
— |
— |
50,412 |
(7) |
$ | 446,146 |
— |
— |
||||||||||||||||||||||||||||||
| — |
— |
— |
— |
— |
1,589 |
(9) |
$ | 14,063 |
— |
— |
||||||||||||||||||||||||||||||
| — |
— |
— |
— |
— |
12,323 |
(10) |
$ | 109,059 |
— |
— |
||||||||||||||||||||||||||||||
| — |
— |
— |
— |
— |
21,304 |
(11) |
$ | 341,290 |
— |
— |
||||||||||||||||||||||||||||||
| — |
— |
— |
— |
— |
— |
— |
65,281 |
$ | 577,737 |
|||||||||||||||||||||||||||||||
| Chad A. Griffith |
10,136 |
(8) |
— |
— |
6.874 |
1/29/26 |
— |
— |
— |
— |
||||||||||||||||||||||||||||||
| — |
— |
— |
— |
— |
16,804 |
(7) |
$ | 148,715 |
— |
— |
||||||||||||||||||||||||||||||
| — |
— |
— |
— |
— |
2,831 |
(10) |
$ | 25,054 |
— |
— |
||||||||||||||||||||||||||||||
| — |
— |
— |
— |
— |
19,581 |
(11) |
$ | 313,688 |
— |
— |
||||||||||||||||||||||||||||||
| — |
— |
— |
— |
— |
— |
— |
12,207 |
$ | 108,032 |
|||||||||||||||||||||||||||||||
| Timothy C. Dugan |
185,632 |
(8) |
— |
— |
6.874 |
1/29/26 |
— |
— |
— |
— |
||||||||||||||||||||||||||||||
| — |
— |
— |
— |
— |
29,660 |
(9) |
$ | 262,491 |
81,991 |
725,620 |
||||||||||||||||||||||||||||||
| (1) | This column shows the aggregate number of unvested PSUs for which the performance period had not lapsed as of December 31, 2019. The performance period for the PSU awards granted in 2019 is January 1, 2019 through December 31, 2023, vesting 20% per year (with the 2020 through 2023 tranches remaining outstanding). The performance period for 2018 is January 1, 2018 through December 31, 2022, vesting 20% per year (with the 2020 through 2022 tranches remaining outstanding). The performance period for the PSU awards granted in 2017 is January 1, 2017 through December 31, 2021, vesting 20% per year (with the 2020 and 2021 tranches remaining outstanding). The performance period for the PSU awards granted in 2016 is January 1, 2016 through December 31, 2020, vesting 20% per year (with the 2020 tranche remaining outstanding). The amounts presented for the 2019 PSU award are based on achieving performance goals at the target level. The amounts presented for the 2018 and 2017 PSU awards are based on achieving performance goals at the threshold performance. The amounts presented for the 2016 awards are based on achieving performance goals at the maximum level. |
| (2) | The market values for RSUs and PSUs were determined by multiplying the closing market price per share for the Company’s common stock on December 31, 2019 ($8.85) by the number of shares relating to such awards. The market values for phantom units were determined by multiplying the closing market price per unit for the Partnership’s phantom units on December 31, 2019 ($16.02) by the number of units relating to such awards. |
| (3) | Options granted February 16, 2010 that vested and became exercisable in three equal annual installments (subject to rounding), beginning on the first anniversary of the grant date. |
| (4) | Represents 100% of the shares underlying performance options granted on June 15, 2010, which shares were determined to be vested on February 10, 2011 by the Compensation Committee for the performance period ended December 31, 2010, on February 16, 2012 by the Compensation Committee for the performance period ended December 31, 2011, on January 28, 2013 by the Compensation Committee for the performance period ended December 31, 2012, and on January 28, 2014 by the Compensation Committee for the performance period ended December 31, 2013. |
| (5) | Options granted February 23, 2011 that vested and became exercisable in three equal annual installments (subject to rounding) beginning on the first anniversary of the grant date. |
| (6) | Options granted February 29, 2012 that vested and became exercisable in three equal annual installments (subject to rounding) beginning on the first anniversary of the grant date. |
| (7) | RSUs granted on January 31, 2017, January 31, 2018, and January 31, 2019 that vest in three equal annual installments (subject to rounding) beginning on the first anniversary of the grant date. |
| (8) | Options granted January 29, 2016 that vested and became exercisable in three equal annual installments (subject to rounding) beginning on the first anniversary of the grant date. |
| (9) | The performance period for the 2019 tranche of the 2016 PSU awards was January 1, 2019 through December 31, 2019. The amounts are based on actual performance results for the period and vested in January 2020 when the Compensation Committee certified performance. |
| (10) | The performance period for the 2019 tranche of the 2019 PSU awards was January 1, 2019 through December 31, 2019. The amounts are based on actual performance results for the period and vested in January 2020 when the Compensation Committee certified performance. |
| (11) | Phantom units granted on January 31, 2019 that vest in three equal annual installments (subject to rounding) beginning on the first anniversary of the grant date. |
| Option Awards |
Stock Awards (1) |
|||||||||||||||
| Number of Shares Acquired on Exercise |
Value Realized on Exercise |
Number of Shares Acquired on Vesting |
Value Realized on Vesting |
|||||||||||||
| Name |
(#) |
($) |
(#) |
($) |
||||||||||||
| Nicholas J. DeIuliis |
— |
— |
528,046 |
$ | 5,849,357 |
|||||||||||
| Donald W. Rush |
— |
— |
92,466 |
$ 812,625 |
||||||||||||
| Chad A. Griffith |
— |
— |
3,385 |
$41,260 |
||||||||||||
| Timothy C. Dugan |
— |
— |
174,764 |
$1,829,626 |
||||||||||||
| Name |
Company Plan Name |
Number of Years Credited Service (#) |
Present Value of Accumulated Benefit (1) ($) |
Payments During Last Fiscal Year ($) | ||||||||
| Nicholas J. DeIuliis |
Supplemental Retirement Plan |
20 |
$ | 10,964,187 |
— | |||||||
| Donald W. Rush |
New Restoration Plan |
— |
(2) |
$ | 68,182 |
— | ||||||
| Chad A. Griffith |
N/A |
— |
$ | — |
— | |||||||
| Timothy C. Dugan |
New Restoration Plan |
— |
(2) |
$ | 203,702 |
— | ||||||
| (1) | The accumulated benefits included in this column were computed through December 31, 2019 using the assumptions stated in the financial statements included in Note 16 of the Company Form 10-K. The table above excludes benefits relating to the Pension Plan, which was assumed by CONSOL Energy Inc. in connection with the separation of CONSOL Energy Inc. from the Company in November 2017 (the “Separation”). |
| (2) | Years of service are not included as service is not a factor in the calculation of benefits for the New Restoration Plan. |
| Executive Benefits and Payments Upon Termination |
Retirement (1) |
Termination Not for Cause/ Reduction in Force (1)(2) |
Termination For Cause |
Death |
Disability (1) |
Change in Control Termination (1)(2) |
||||||||||||||||||
| Compensation: |
||||||||||||||||||||||||
| Base Salary |
— |
— |
— |
— |
— |
$ | 2,000,000 |
|||||||||||||||||
| Short-Term Incentive (3) |
— |
— |
— |
$ | 960,000 |
— |
$ | 4,765,833 |
||||||||||||||||
| Severance Pay Plan (4) |
— |
$ | 384,615 |
— |
— |
— |
— |
|||||||||||||||||
| Long-Term Incentive Compensation: (5) |
||||||||||||||||||||||||
| Options: Unvested |
— |
— |
— |
— |
— |
— |
||||||||||||||||||
| RSUs: Unvested |
$ | 1,640,241 |
— |
— |
— |
— |
$ | 1,640,241 |
||||||||||||||||
| PSUs: Unvested |
$ | 1,603,797 |
— |
— |
$ | 1,603,797 |
— |
$ | 1,603,797 |
|||||||||||||||
| Benefits and Perquisites: |
||||||||||||||||||||||||
| Outplacement service |
— |
— |
— |
— |
— |
$ | 25,000 |
|||||||||||||||||
| Continuation of medical/drug/dental benefits (6) |
— |
— |
— |
— |
— |
$ | 38,417 |
|||||||||||||||||
| 401(k) payment |
— |
— |
— |
— |
— |
$ | 42,000 |
|||||||||||||||||
| Supplemental Retirement Plan (7) |
— |
— |
— |
— |
— |
$ | 21,711,879 |
|||||||||||||||||
| 280G Tax Gross-up (8) |
— |
— |
— |
— |
— |
$ | 13,337,030 |
|||||||||||||||||
| TOTAL |
$ |
3,244,038 |
$ |
384,615 |
— |
$ |
2,563,797 |
— |
$ |
45,164,197 |
||||||||||||||
| Executive Benefits and Payments Upon Termination |
Retirement |
Termination Not for Cause/ Reduction in Force (2) |
Termination For Cause |
Death |
Disability |
Change in Control Termination (2) |
||||||||||||||||||
| Compensation: |
||||||||||||||||||||||||
| Base Salary |
— |
— |
— |
— |
— |
$ | 660,000 |
|||||||||||||||||
| Short-Term Incentive (3) |
— |
— |
— |
$ | 264,000 |
— |
$ | 665,000 |
||||||||||||||||
| Severance Pay Plan (4) |
— |
$ | 118,462 |
— |
— |
— |
— |
|||||||||||||||||
| Long-Term Incentive Compensation: (5)(9) |
||||||||||||||||||||||||
| Options: Unvested |
— |
— |
— |
— |
— |
— |
||||||||||||||||||
| RSUs: Unvested |
— |
$ | 446,146 |
— |
$ | 446,146 |
— |
$ | 446,146 |
|||||||||||||||
| PSUs: Unvested |
— |
$ | 436,234 |
— |
$ | 436,234 |
$ | 436,234 |
$ | 436,234 |
||||||||||||||
| Partnership Phantom Units |
— |
$ | 378,040 |
— |
$ | 378,040 |
$ | 378,040 |
$ | 378,040 |
||||||||||||||
| Benefits and Perquisites: |
||||||||||||||||||||||||
| Outplacement service |
— |
— |
— |
— |
— |
$ | 25,000 |
|||||||||||||||||
| Continuation of medical/drug/dental benefits (6) |
— |
— |
— |
— |
— |
$ | 17,488 |
|||||||||||||||||
| 401(k) payment |
— |
— |
— |
— |
— |
$ | 25,200 |
|||||||||||||||||
| New Restoration Plan |
— |
— |
— |
— |
— |
$ | 0 |
|||||||||||||||||
| 280G Tax Reduction (8) |
— |
— |
— |
— |
— |
$ | (268,136 |
) | ||||||||||||||||
| TOTAL |
— |
$ |
1,378,882 |
— |
$ |
1,524,420 |
$ |
814,274 |
$ |
2,384,972 |
||||||||||||||
| Executive Benefits and Payments Upon Termination |
Retirement |
Termination Not for Cause/ Reduction in Force (2) |
Termination For Cause |
Death |
Disability |
Change in Control Termination (2) |
||||||||||||||||||
| Compensation: |
||||||||||||||||||||||||
| Base Salary |
— |
— |
— |
— |
— |
$ | 487,500 |
|||||||||||||||||
| Short-Term Incentive (3) |
— |
— |
— |
$ | 195,000 |
— |
$ | 292,500 |
||||||||||||||||
| Severance Pay Plan (4) |
— |
$ | 50,000 |
— |
— |
— |
— |
|||||||||||||||||
| Long-Term Incentive Compensation: (5)(9) |
||||||||||||||||||||||||
| Options: Unvested |
— |
— |
— |
— |
— |
— |
||||||||||||||||||
| RSUs: Unvested (10) |
$ | 10,372 |
$ | 148,715 |
— |
$ | 148,715 |
— |
$ | 148,715 |
||||||||||||||
| PSUs: Unvested |
— |
$ | 115,811 |
— |
$ | 115,811 |
$ | 115,811 |
$ | 115,811 |
||||||||||||||
| Partnership Phantom Units |
— |
$ | 347,474 |
— |
$ | 347,474 |
$ | 347,474 |
$ | 347,474 |
||||||||||||||
| Benefits and Perquisites: |
||||||||||||||||||||||||
| Outplacement service |
— |
— |
— |
— |
— |
$ | 25,000 |
|||||||||||||||||
| Continuation of medical/drug/dental benefits (6) |
— |
— |
— |
— |
— |
$ | 22,689 |
|||||||||||||||||
| 401(k) payment |
— |
— |
— |
— |
— |
$ | 25,200 |
|||||||||||||||||
| New Restoration Plan |
— |
— |
— |
— |
— |
— |
||||||||||||||||||
| 280G Tax Reduction (8) |
— |
— |
— |
— |
— |
$ | (321,188 |
) | ||||||||||||||||
| TOTAL |
$ |
10,372 |
$ |
662,000 |
$ |
— |
$ |
807,000 |
$ |
463,285 |
$ |
1,143,701 |
||||||||||||
| * | Applicable footnotes follow the last table in this section. |
| (1) | Under the terms of Mr. DeIuliis’ 2019 RSU and PSU award agreements, he would be entitled to amounts shown under Long-Term Incentive Compensation if he retired from the Company. For purposes of this table, it should be assumed that such amounts would similarly be paid to him if his employment terminated for any reason other than cause. |
| (2) | If a change in control occurred and the named executive’s employment did not terminate, the named executive would be entitled only to the payments and benefits shown under Long-Term Incentive Compensation. The narrative following these tables contains a description of events that constitute a change in control, which include the Transaction that resulted in the first trigger occurring with respect to Messrs. DeIuliis’ and Rush’s agreements and for which, if a qualifying termination occurred as specifically defined under their respective CIC Agreements (i.e., in connection with Southeastern’s acquisition of more than 25% of the beneficial ownership of the Company’s common stock), they would also be entitled to the cash amounts under the “Change in Control Termination” column. |
| (3) | In the event of death, Messrs. DeIuliis, Rush, and Griffith would be entitled to the short-term incentive award. In the event of a qualifying termination in connection with a change in control, each of Messrs. DeIuliis, Rush, and Griffith, pursuant to his CIC Agreement, would be entitled to a pro-rated payment of his short-term incentive awards based upon the length of service during the year in which the termination occurred. Assuming a maximum payout for 2019 and a change in control at year-end, each of Messrs. DeIuliis, Rush, and Griffith would receive, in addition to the amount shown in the table, the amounts set forth in the Grants of Plan-Based Awards – 2019 non-equity incentive plan awards. |
| (4) | The Severance Pay Plan for Salaried Employees provides one week of severance for every year of service with a minimum of 8 weeks and up to a maximum of 25 weeks in the event that employment is involuntarily terminated because of a reduction in workforce. As of December 31, 2019, Messrs. DeIuliis, Rush, and Griffith were entitled to 25 weeks, 14 weeks, and 8 weeks, respectively, of severance. |
| (5) | The values for long-term incentive compensation represent the value of the unvested RSUs, PSUs, and phantom units, which would accelerate and vest depending on the termination event or change in control. The value of the unvested RSUs, PSUs and phantom units was calculated using a closing market price per share of $8.85 on December 31, 2019 for the Company (assumes target payout for the 2018 PSUs (as to the 2020 through 2022 tranches for Mr. Griffith) and the 2019 PSUs (as to the 2020 through 2023 tranches)), in the case of Company RSUs and PSUs, and $16.02 per unit for the Partnership on December 31, 2019 in the case of Partnership phantom units. The 2019 tranche of the PSU awards was not included because the performance period for such awards ended on December 31, 2019. With respect to Messrs. DeIuliis and Rush, the 2020 through 2022 tranches of the PSU awards were not included because they vested in connection with the Transaction (although they continue to be subject to the attainment of the applicable performance goals). |
| (6) | In the event of a qualifying termination in connection with a change in control, as of December 31, 2019, Mr. DeIuliis, pursuant to his CIC Agreement, would be entitled to the continuation of medical, dental, and vision coverage for a period of 30 months, and Messrs. Rush and Griffith would be entitled to 18 months. |
| (7) | In the event of a termination for cause, no benefit is payable. Benefits vest immediately in the event of termination due to disability, death or change in control. Further, the SERP pays an unreduced benefit in the event of incapacity retirement or disability, and accordingly, Mr. DeIuliis would receive $14,195,108 in such a case. |
| (8) | This calculation is an estimate for disclosure purposes only. Note that actual payments for Messrs. Rush and Griffith would be reduced pursuant to the terms of their CIC Agreements by the amounts shown in the above tables under “280G Tax Reduction.” Payments on an actual change of control may differ based on factors such as transaction price, timing of employment termination and payments, methodology for valuing stock options, changes in compensation, reasonable compensation analyses and the value of the covenant not to compete. Assumptions used in this Amendment include : |
| • | Marginal federal, Pennsylvania state and FICA-HI (Medicare) tax rates of 37%, 3.07% and 2.35%, respectively; |
| • | Stock options are assumed to become fully vested and/or exercisable and are valued in accordance with Rev. Proc. 98-34 and Q&A 24(c) of Code Section 280G based on expected life of the option; and |
| • | The Company did not attribute any value to non-competition covenants or take the position that any part of the value of the performance-based equity and long-term incentive plans provided to the applicable named executive was reasonable compensation for services prior to the change of control, which would have reduced the estimated excise tax gross-up payment, if any. |
| (9) | The amounts shown assume the Compensation Committee exercised its discretion in connection with a termination without cause and vested the awards. Note that the PSUs do not include an accelerated vesting term related to a reduction in force. |
| (10) | In the case of Mr. Griffith, his 2017 RSU award provides for vesting in the event of an Incapacity Retirement (as defined in the award agreement) and which is assumed herein to have occurred. |
| • | a lump sum cash payment equal to a multiple of base pay plus a multiple of short-term incentive pay (the multiple, in each case, for Mr. DeIuliis, 2.5; and for Messrs. Rush and Griffith, 1.5); |
| • | a pro-rated payment of his short-term incentive pay for the year in which his termination of employment occurs; |
| • | for a specified period (for Mr. DeIuliis, 30 months; and for Messrs. Rush and Griffith, 18 months), the continuation of medical, dental, and vision coverage (or monthly reimbursements in lieu of continuation); |
| • | a lump sum cash payment equal to the total amount that the executive would have received under the 401(k) plan as a match if he was eligible to participate in the 401(k) plan for a specified period after his termination date (for Mr. DeIuliis, 30 months; and for Messrs. Rush and Griffith, 18 months) and he contributed the maximum amount to the plan for the match; |
| • | a lump sum cash payment equal to the difference between the present value of his accrued pension benefits at his termination date under the qualified defined benefit plan (which, as described in the “Pension Benefits Table – 2019” |
| • | a lump sum cash payment of $25,000 in order to cover the cost of outplacement assistance services and other expenses associated with seeking other employment; and |
| • | any amounts earned, accrued or owing but not yet paid as of his termination date, payable in a lump sum, and any benefits accrued or earned in accordance with the terms of any applicable benefit plans and programs. |
(a) |
been convicted of, or has pleaded guilty or nolo contendere to, any felony or any misdemeanor involving fraud, embezzlement or theft; or |
(b) |
wrongfully disclosed material confidential information of the Company or any subsidiary (including CNX Gas), has intentionally violated any material express provision of the Company’s code of conduct for executives and management employees (as then in effect) or has intentionally failed or refused to perform any of his material assigned duties for the Company (or CNX Gas in the case of Mr. DeIuliis), and any such failure or refusal has been demonstrably and materially harmful to the Company (or CNX Gas in the case of Mr. DeIuliis). |
(i) |
the acquisition by any individual, entity or group of beneficial ownership of more than 25% of the combined voting power of the then outstanding voting stock of the Company; provided, however, that the following acquisitions will not constitute a change in control: (A) any issuance of voting stock of the Company directly from the Company that is approved by the then incumbent Company Board of Directors, (B) any acquisition by the Company (or any subsidiaries) of voting stock of the Company, (C) any acquisition of voting stock of the Company by any employee benefit plan (or related trust) sponsored or maintained by the Company or any subsidiary of the Company, (D) any acquisition of voting stock of the Company by an underwriter holding securities of the Company in connection with a public offering thereof, or (E) any acquisition of voting stock of the Company by any person pursuant to a transaction that complies with clauses (A), (B) and (C) of (iii) below; or |
(ii) |
individuals who constitute the Company Board of Directors as of the agreement date (or in the case of Mr. DeIuliis, individuals who constitute the CNX Gas Board of Directors other than at a time when the Company and/or its subsidiaries beneficially own more than 50% of the total voting stock of CNX Gas) cease for any reason to constitute at least a majority of the Company Board of Directors; provided, however, that any individual becoming a director subsequent to such date whose election, or nomination for election by the Company’s shareholders (or CNX Gas’s shareholders, in the case of Mr. DeIuliis) was approved by a vote of at least two-thirds of the directors then comprising the incumbent Company Board of Directors are deemed to have then been a member of the incumbent Company Board of Directors, but excluding any individual whose initial assumption of office occurs as a result of an actual or threatened election contest with respect to the election or removal of directors or other actual or threatened solicitation of proxies or consents by or on behalf of a person other than the Company Board of Directors; |
(iii) |
consummation of a reorganization, merger or consolidation of the Company or a direct or indirect wholly owned subsidiary of the Company, a sale or other disposition of all or substantially all of the assets of the Company, or other transaction involving the Company, unless, in each case, immediately following such transaction, (A) all or substantially all of the individuals and entities who were the beneficial owners of voting stock of the Company immediately prior to such transaction beneficially own, directly or indirectly, more than 50% of the combined voting power or securities of the then outstanding shares of voting stock or securities of the entity resulting from such transaction or any direct or indirect parent corporation thereof, (B) no person other than the Company beneficially owns 25% or more of the combined voting power of the then outstanding shares of voting stock of the entity resulting from such transaction or any direct or indirect parent corporation thereof and (C) at least a majority of the members of the Board of the entity resulting from such transaction or any direct or indirect parent corporation thereof were members of the incumbent Company Board of Directors at the time of the execution of the initial agreement or of the action of the Company Board of Directors providing for such transaction; |
(iv) |
approval by the shareholders of the Company of a complete liquidation or dissolution of the Company, except pursuant to a transaction that complies with clauses (A), (B) and (C) of (iii) above; or |
(v) |
in the case of Mr. DeIuliis’ CIC Agreement, other than a time when the Company and/or its subsidiaries beneficially own less than 50% of the total voting stock of CNX Gas, a Company change in control (as described in clauses (i) through (iv) above). |
| • | a material adverse change in position; |
| • | a material reduction in annual base salary or target bonus or a material reduction in employee benefits; |
| • | material adverse change in circumstances as determined in good faith by the executive, including a material change in the scope of business or other activities for which the executive was responsible for prior to the change in control, which has rendered the executive unable to carry out, has materially hindered his performance of, or has caused him to suffer a material reduction in, any of the authorities, powers, functions, responsibilities or duties attached to the position he held immediately prior to the change in control, as determined by him; |
| • | the liquidation, dissolution, merger, consolidation or reorganization of the Company (or CNX Gas, in the case of Mr. DeIuliis) or transfer of substantially all of the Company’s (or CNX Gas’s, in the case of Mr. DeIuliis) business or assets unless the successor assumes all duties and obligations of the Company (or CNX Gas, in the case of Mr. DeIuliis) under the applicable CIC Agreement; or |
| • | the relocation of the executive’s principal work location to a location that increases his normal commute by 50 miles or more or that |
| requires travel increases by a material amount. |
| • | any one person (other than the Company, any trustee or other fiduciary holding securities under an employee benefit plan of the Company, and any corporation owned, directly or indirectly, by the shareholders of the Company in substantially the same proportions as their ownership of Company stock), or more than one person acting as a group, is or becomes the beneficial owner of shares that, together with the shares held by that person or group, possess more than 50% of the total fair market value or total voting power of the Company’s shares; |
| • | a majority of members of the Company’s Board of Directors is replaced during any 12-month period by directors whose appointment or election is not endorsed by a majority of the members of the Company’s Board of Directors prior to the date of the appointment or election; or |
| • | the sale of all or substantially all of the Company’s assets. |
(i) |
any “person” or “group” within the meaning of Sections 13(d) and 14(d)(2) of the Exchange Act, other than the general partner, CNX Gathering, the Company, Noble Energy, Inc. (“Noble”) or an affiliate of the general partner, CNX Gathering, the Company or Noble (as determined immediately prior to such event), shall become the beneficial owner, by way of merger, acquisition, consolidation, recapitalization, reorganization or otherwise, of more than 50% of the combined voting power of the equity interests in the general partner, the Partnership or CNX Gathering; |
(ii) |
the limited partners of the Partnership approve, in one or a series of transactions, a plan of complete liquidation of the Partnership; |
(iii) |
the sale or other disposition by either the general partner or the Partnership of all or substantially all of the general partner’s or the Partnership’s assets, respectively, in one or more transactions to any person other than the general partner, the Partnership, CNX Gathering, the Company, Noble or an affiliate of the general partner, the Partnership, CNX Gathering, the Company or Noble; or |
(iv) |
a transaction resulting in a person other than the general partner, CNX Gathering, the Company, Noble or an affiliate of the general partner, CNX Gathering, the Company, or Noble (as determined immediately prior to such event) being the sole general partner of the Partnership. |
| Compensation Feature |
Dollar Value of Board Compensation (2019) | |
| Annual cash retainer – Board Member |
$60,000 | |
| Annual cash retainer – Audit Committee Chair |
$25,000 | |
| Annual equity award – Phantom Units (1) |
$90,000 |
| Fees Earned or Paid in Cash |
Stock Awards |
Non-Equity Incentive Plan Compensation |
Change in Pension Value and Nonqualified Deferred Compensation Earnings |
All Other Compensation |
Total |
|||||||||||||||||||
| Name (1) |
($) |
($) |
($) |
($) |
($) |
($) |
||||||||||||||||||
| Raymond T. Betler |
60,000 |
90,000 |
(2) |
— |
— |
— |
150,000 |
|||||||||||||||||
| John E. Jackson |
60,000 |
90,000 |
(2) |
— |
— |
— |
150,000 |
|||||||||||||||||
| Angela A. Minas |
85,000 |
90,000 |
(2) |
— |
— |
— |
175,000 |
|||||||||||||||||
| Hayley F. Scott |
243,581 |
98,583 |
(3) |
139,790 |
— |
14,615 |
(4) |
496,569 |
||||||||||||||||
| Stephen W. Johnson |
238,969 |
— |
— |
1,168,880 |
(5) |
15,838 |
(4) |
1,423,687 |
||||||||||||||||
| (1) | Messrs. DeIuliis, Rush, Griffith and Dugan (who served on the Board of Directors until February 8, 2019) and Ms. Scott did not receive any additional compensation for their service on the Board of Directors in 2019, and it is the policy of the Company and general partner not to pay employees for services on the Company’s or the general partner’s Boards of Directors. Messrs. DeIuliis’, Rush’s, Griffith’s and Dugan’s compensation is included in the above executive compensation tables. Ms. Scott and Mr. Johnson (who served on the Board of Directors until February 2019) are not named executives of the general partner and, for this reason, their compensation is included in this table. |
| (2) | These values are based on the aggregate grant date fair value of awards computed in accordance with FASB ASC Topic 718. The grant date fair value of the phantom unit awards is computed based upon the closing price per unit of the Partnership’s common units on the date of grant. A discussion of the relevant assumptions made in the valuation of these awards is provided in Note 10 of the Original Form 10-K. The values reflect the awards’ fair market value at the date of grant, and do not correspond to the actual value that will be recognized by the directors. As of December 31, 2019, the following directors held unvested phantom units: Mr. Betler 6,247, Mr. Griffith 21,690, Mr. Jackson 6,247, Ms. Minas 6,247, and Mr. Rush 23,598. |
| (3) | This value represents the aggregate grant date fair value of PSU and RSU awards granted to Ms. Scott in 2019 under the Company EIP which were $60,998 and $37,585, respectively. Such values are based on the aggregate grant date fair value of the awards computed in accordance with FASB ASC Topic 718 and were granted on January 31, 2019. For the 2019 PSUs, the grant date fair value is computed based upon a Monte Carlo simulation for both the TSR component and the ASP component, which results in a valuation of 133% of the January 31, 2019 Company stock price of $12.14 per share. The TSR fair value component was determined using four primary input assumptions for an asset projection: the risk-free rate (2.43%), the dividend yield for the Company (0%), the volatility of returns (48%), and the initial TSR performance for the Company and the comparator group. The grant date fair value of the TSR portion was $15.04. The ASP fair value component requires three primary input assumptions for an asset projection: the risk-free rate (2.43%), the dividend yield (0%) for the Company, and the volatility of returns (48%). The grant date fair value of the ASP portion was $17.19. The value of the awards in the “Stock Awards” column on the January 31, 2019 grant date for FASB ASC Topic 718 purposes assumes that the highest level of the conditions will be achieved (resulting in no additional expense in the future). For the 2019 PSUs, the value of the awards, as reported in the table, does not change assuming that the highest level of performance conditions will be achieved. A discussion of the valuation of these PSU and RSU awards is provided in Note 17 of the Company Form 10-K. As of December 31, 2019, Ms, Scott held 6,375 PSUs (at target) and 4,863 RSUs, and the amounts of PSUs and RSUs held by Messrs. DeIuliis, Rush, Griffith and Dugan are set forth in the Outstanding Equity Awards at Fiscal Year-End – 2019 table. |
| (4) | The value set forth in this column for Ms. Scott represents matching contributions made by the Company under its 401(k) Plan, and the value set forth in this column for Mr. Johnson represents a vehicle allowance and $14,338 in matching contributions made by the Company under its 401(k). |
| (5) | This amount reflects the actuarial increase in the present value of Mr. Johnson’s benefits under the Supplemental Retirement Plan (SERP) through December 31, 2019. The amount shown was determined primarily using the interest rate assumptions and mortality assumptions set forth in the financial statements of the Company Form 10-K (Note 16). Values may fluctuate significantly from year to year depending on several factors, including age, years of service, average annual earnings and the assumptions used to determine the present value, such as the discount rate. |
ITEM 12. |
SECURITY OWNERSHIP OF CERTAIN BENEFICIAL OWNERS AND MANAGEMENT AND RELATED STOCKHOLDER MATTERS |
| • | beneficial owners of more than five percent of the Partnership’s common units known to the Partnership based upon information filed with the SEC; and |
| • | each director, each named executive, and all directors and executive officers of the Partnership as a group, as of March 9, 2020 (except as otherwise indicated below). |
| Name and Address of Beneficial |
Amount and Nature of |
Percent |
||||||
| Owner |
Beneficial Ownership (1) |
of Class |
||||||
| CNX Resources Corporation (2) |
||||||||
| 1000 CONSOL Energy Drive Canonsburg, Pennsylvania 15317 |
47,692,198 |
53.1 |
% | |||||
| Tortoise Capital Advisors, L.L.C. (3) |
||||||||
| 5100 W 115th Place, Leawood, KS 66211 |
6,358,161 |
7.1 |
% | |||||
| Clearbridge Investments, LLC (4) |
||||||||
| 620 8th Avenue New York, NY 10018 |
4,475,386 |
5.0 |
% | |||||
| CNX Midstream Partners LP Common Units Beneficially Owned (1) |
Percent of Class |
CNX Resources Corporation Common Stock Beneficially Owned (1)(5) |
Percent of Class |
|||||||||||||
| Nicholas J. DeIuliis (6) |
20,100 |
* |
2,792,904 |
1.5 |
% | |||||||||||
| Donald W. Rush |
5,929 |
* |
110,850 |
* |
||||||||||||
| Chad A. Griffith |
5,174 |
* |
20,740 |
* |
||||||||||||
| Timothy C. Dugan (7) |
419,650 |
* |
- |
* |
||||||||||||
| Hayley F. Scott |
- |
* |
8,204 |
* |
||||||||||||
| Angela A. Minas |
46,654 |
* |
- |
* |
||||||||||||
| Raymond T. Betler |
12,459 |
* |
- |
* |
||||||||||||
| John E. Jackson |
32,054 |
* |
- |
* |
||||||||||||
| All directors and executive officers as a group |
542,020 |
* |
2,932,698 |
1.6 |
% |
| * | Indicates less than one percent (1%) ownership. |
| (1) | As of March 9, 2020, there were 89,799,224 common units of the Partnership outstanding. As of March 9, 2020, there were 187,035,851 shares of the Company’s common stock outstanding. |
| (2) | Based on a Schedule 13D/A filed by jointly the Company, CNX Gas, and CNX Gas Company LLC, a Virginia limited liability company (collectively, “CNX”), on January 31, 2020. Each of the Company, CNX Gas, and CNX Gas Company LLC is deemed to be the beneficial owner of 47,692,198 Partnership common units, and has sole voting and dispositive power with respect to 0 Partnership common units and shared voting and dispositive power with respect to 47,692,198 Partnership common units. |
| (3) | Based on a Schedule 13G/A filed by Tortoise Capital Advisors, L.L.C. (“TCA”) on February 14, 2020. TCA acts as an investment adviser to certain investment companies registered under the Investment Company Act of 1940. TCA, by virtue of investment advisory agreements with these investment companies, has all investment and voting power over securities owned of record by these investment companies. TCA also acts as an investment adviser to certain managed accounts. Under contractual agreements with these managed account clients, TCA, with respect to the securities held in these client accounts, has investment and voting power with respect to certain of these client accounts, and has investment power but no voting power with respect to certain other of these client accounts. TCA is deemed to be the beneficial owner of 6,358,161 Partnership common units, and has sole voting and dispositive power with respect to 511,544 Partnership common units and shared voting and dispositive power with respect to 5,846,617 Partnership common units. On April 8, 2020, TCA filed a Schedule 13G reporting that its aggregate beneficial ownership of Partnership common units was less than 5% (specifically 2.3%). |
| (4) | Based on a Schedule 13G filed by Clearbridge Investments, LLC on February 14, 2020. Clearbridge Investments, LLC is deemed to be the beneficial owner of 4,475,386 Partnership common units, and has sole voting and dispositive power with respect to 4,475,386 Partnership common units and shared voting and dispositive power with respect to 0 Partnership common units. |
| (5) | Includes the Company’s shares of common stock issuable pursuant to options that are currently exercisable (or may become exercisable on or before May 8, 2020) as follows: Mr. DeIuliis, 1,240,500, Mr. Rush, 9,944, Mr. Griffith, 10,136, and Mr. Dugan, 185,632. For Mr. DeIuliis, also includes 390,780 shares underlying RSUs that may be settled on or before May 8, 2020. |
| (6) | Includes 5,699 Partnership common units and 65,421 shares of the Company’s common stock held in trusts for his children. |
| (7) | Information for Mr. Dugan, who departed from the Company and the Partnership as of December 31, 2019, is as of such date. |
| Plan Category |
Number of securities to be issued upon exercise of outstanding options, warrants and rights (a) |
Weighted average exercise price of outstanding options, warrants and rights (b) |
Number of securities remaining available for future issuance under equity compensation plans (excluding securities reflected in column (a)) (c) |
|||||||||
| Equity compensation plans approved by security holders |
174,465 |
(1) |
— |
5,149,141 |
||||||||
| Equity compensation plans not approved by security holders |
— |
— |
— |
|||||||||
| TOTAL |
174,465 |
(1) |
— |
5,149,141 |
||||||||
| This total is comprised of unvested phantom units outstanding under the CNXM LTIP. |
ITEM 15. |
EXHIBITS AND FINANCIAL STATEMENT SCHEDULES |
| Exhibit Number |
Exhibit Description |
Form |
SEC File Number |
Exhibit |
Filing Date |
|||||||||||||||
| 3.1* |
|
S-1 |
333-198352 |
3.1 |
8/25/2014 |
|||||||||||||||
| 3.2* |
|
8-K |
001-36635 |
3.1 |
1/3/2018 |
|||||||||||||||
| 3.3* |
|
8-K |
001-36635 |
3.2 |
1/3/2018 |
|||||||||||||||
| 4.1* |
|
8-K |
001-36635 |
4.1 |
3/16/2018 |
|||||||||||||||
| 4.2* |
|
10-K |
001-36635 |
4.2 |
2/10/2020 |
|||||||||||||||
| 10.1* |
|
8-K |
001-36635 |
10.1 |
10/3/2014 |
|||||||||||||||
| 10.2* |
|
8-K |
001-36635 |
10.2 |
10/3/2014 |
|||||||||||||||
| 10.3* |
|
8-K |
001-36635 |
10.1 |
12/7/2016 |
|||||||||||||||
| 10.4* |
|
10-K |
001-36635 |
10.15 |
2/7/2018 |
|||||||||||||||
| 10.5* |
|
8-K |
001-36635 |
10.2 |
1/3/2018 |
|||||||||||||||
| 10.6* |
|
10-Q |
001-36635 |
10.1 |
8/2/2018 |
|||||||||||||||
| 10.7* |
|
10-Q |
001-36635 |
10.2 |
8/2/2018 |
|||||||||||||||
| 10.8* |
|
10-Q |
001-36635 |
10.3 |
8/2/2018 |
|||||||||||||||
| 10.9* |
|
8-K |
001-36635 |
10.1 |
3/12/2018 |
|||||||||||||||
| 10.10* |
|
8-K |
001-36635 |
10.1 |
3/16/2018 |
|||||||||||||||
| 10.11* |
|
8-K |
001-36635 |
10.1 |
4/30/2019 |
|||||||||||||||
| 10.12* |
|
10-K |
001-36635 |
10.10 |
2/7/2018 |
|||||||||||||||
| 10.13* |
|
8-K |
001-36635 |
10.1 |
1/3/2018 |
|||||||||||||||
| 10.14*# |
|
8-K |
001-36635 |
10.1 |
1/22/2015 |
|||||||||||||||
| 10.15*# |
|
10-K |
001-36635 |
10.12 |
2/7/2018 |
|||||||||||||||
| 10.16*# |
|
10-K |
001-36635 |
10.16 |
2/7/2019 |
|||||||||||||||
| 10.17*# |
|
10-K |
001-36635 |
10.17 |
2/7/2019 |
|||||||||||||||
| 10.18*# |
|
8-K |
001-36635 |
10.7 |
10/3/2014 |
|||||||||||||||
| 21.1* |
|
10-K |
001-36635 |
21.1 |
2/10/2020 |
|||||||||||||||
| 23.1* |
|
10-K |
001-36635 |
23.1 |
2/10/2020 |
|||||||||||||||
| 24.1* |
|
10-K |
001-36635 |
24.1 |
2/10/2020 |
|||||||||||||||
| 31.1* |
|
10-K |
001-36635 |
31.1 |
2/10/2020 |
| 31.2* |
|
10-K |
001-36635 |
31.2 |
2/10/2020 |
|||||||||||||||
| 31.3† |
|
|||||||||||||||||||
| 31.4† |
|
|||||||||||||||||||
| 32.1* |
|
10-K |
001-36635 |
32.1 |
2/10/2020 |
|||||||||||||||
| 32.2* |
|
10-K |
001-36635 |
32.2 |
2/10/2020 |
|||||||||||||||
| 101.INS* |
XBRL Instance Document - the instance document does not appear in the interactive data file because its XBRL tags are embedded within the inline XBRL document. |
10-K |
001-36635 |
101 |
2/10/2020 |
|||||||||||||||
| 101.SCH* |
XBRL Taxonomy Extension Schema Document |
10-K |
001-36635 |
101 |
2/10/2020 |
|||||||||||||||
| 101.CAL* |
XBRL Taxonomy Extension Calculation Linkbase Document |
10-K |
001-36635 |
101 |
2/10/2020 |
|||||||||||||||
| 101.DEF* |
XBRL Taxonomy Extension Definition Linkbase Document |
10-K |
001-36635 |
101 |
2/10/2020 |
|||||||||||||||
| 101.LAB* |
XBRL Taxonomy Extension Labels Linkbase Document |
10-K |
001-36635 |
101 |
2/10/2020 |
|||||||||||||||
| 101.PRE* |
XBRL Taxonomy Extension Presentation Linkbase Document |
10-K |
001-36635 |
101 |
2/10/2020 |
|||||||||||||||
| 104† |
Cover Page Interactive Data File (formatted as Inline XBRL with applicable taxonomy extension information contained in Exhibits 101) |
|||||||||||||||||||
| * |
Incorporated by reference into this Form 10-K/A as indicated. |
|||||||||||||||||||
| † |
Filed herewith. |
|||||||||||||||||||
| # |
Compensatory plan or arrangement |
| CNX MIDSTREAM PARTNERS LP | ||
| By: CNX MIDSTREAM GP LLC, its general partner | ||
| By: |
/s/ Nicholas J. DeIuliis | |
| Nicholas J. DeIuliis | ||
| Chief Executive Officer and Director (Principal Executive Officer) | ||