---Unofficial translation for convenience purposes---
|
Unofficial English translation of certain sections of the Company’s 2025 Annual Report, for convenience purposes only.
The complete and binding report is the official Hebrew Annual Report published by the Company on the Tel Aviv Stock Exchange website.
In case of any discrepancy, the official and full Hebrew report shall prevail.
This unofficial translation does not constitute an offer, advice or invitation to make any transaction in the Company’s securities.
|
OPC ENERGY LTD.
Report of the Board of Directors on the State of the Company’s Affairs
for the year ended December 31, 2025
The Board of Directors of OPC Energy Ltd. (hereinafter – “the Company”) is pleased to present herein the Report of the Board of Directors regarding the activities of the
Company and its investee companies (hereinafter together – “the Group”), as at December 31, 2025 and for the year then ended (“the Period of the Report” or “the Year of the Report”).
Except for the data audited in the Company’s consolidated financial statements as at December 31, 2025 (hereinafter – “the Financial Statements”) that is included in this
report below, the data appearing in the Report of the Board of Directors has not been audited (or reviewed) by the Company’s auditing CPAs.
---Unofficial translation for convenience purposes---
OPC Energy Ltd.
Report of the Board of Directors
| 1. |
Executive Summary1
|
| A. |
Brief description of the areas of activity
|
The Company is a public company the securities of which are listed for trading on the Tel‑Aviv Stock Exchange Ltd. (hereinafter – “the Stock Exchange”). As at
the date of the report, the Group is engaged in the generation and supply of electricity and energy in three main activity areas (that constitute reportable segments in the financial statements), as briefly described below:
| (1) |
Israel (by means of OPC Power Israel Ltd.2) (OPC Israel) – as part of this area of activities, the Group is engaged in the generation and supply of electricity and energy, mainly to private customers and
to Noga Electricity System Management Ltd. (“the System Operator”), as well as in initiation, development, construction and operation of natural‑gas fired power plants and renewable generation facilities in Israel;
|
| (2) |
Energy transition in the U.S. (by means of the CPV Group3) – as part of this area of activities4, the Group is engaged in the operation of natural gas-fired power plants in the U.S., which
efficiently and reliably supply electricity to the grid.
|
| (3) |
Renewable Energy in the U.S. (by means of the CPV Group) – as part of this area of activities5, the Group is engaged in initiation, development, construction and operation of renewable generation facilities in the U.S.
(mainly solar and wind) and supply of electricity from renewable sources to customers.
|
| 1 |
The Executive Summary below is presented solely for convenience and it is not a substitute for reading the full detail (including with reference to the matters referred to in the Summary) as stated in this
report with all its parts (including warnings relating to “forward‑looking” information as it is defined in the Securities Law, 1968 (“the Securities Law”), definitions or explanations with respect to the indices for measurement of the
results and including the information included by means of reference, as applicable). This Summary includes estimates, plans and assessment of the Company, which constitute “forward‑looking” information regarding which there is no certainty
they will materialize and the readers are directed to the detail presented in the relevant sections.
|
| 2 |
As at the date of the report, the Company holds directly 80% of the shares of OPC Israel while the other 20% is held by Veridis Power Plants Ltd. (“Veridis”).
|
| 3 |
As at the date of the report, the Company holds indirectly about 70.69% of the shares of CPV and as at the approval date of the report the Company holds, indirectly, about 71.09% (after the investment commitment in the first quarter of
2026 and acquisition by the Company of an immaterial amount). The remaining interest is held, indirectly, by three institutional financial investors from Israel.
|
| 4 |
As at the date of the report, all the power plants operating in this area are held by associated companies at various holding rates (which are not consolidated in the
CPV Group’s financial statements and, in turn, are also not consolidated in the Company’s financial statements). Subsequent to the date of the report, a transaction was completed for acquisition of the remaining 11% in the Shore power
plant, and starting from this date the project is 100% held by the CPV Group and is consolidated in the Company’s financial statements. As at the approval date of the report, an agreement was signed for acquisition of the remaining interest
in the Maryland power plant, which subject to the completion thereof, which is expected in the second quarter of 2026, will also be consolidated in the Company’s financial statements.
|
| 5 |
Which is consolidated by a company held by the CPV Group at the rate of about 66.7% (starting from November 2024) and that constitutes an associated company (which is not consolidated in the CPV Group’s financial statements and, in turn,
is also not consolidated in the Company’s financial statements).
|
2
---Unofficial translation for convenience purposes---
OPC Energy Ltd.
Report of the Board of Directors
| 1. |
Executive Summary1 (Cont.)
|
| A. |
Brief description of the areas of activity (Cont.)
|
In addition, through the CPV Group, the Group is involved in additional activities in the U.S. which, as of the date of the report, in accordance with IFRS,
do not constitute reportable segments in the financial statements):
| (1) |
Initiation, development and construction of highly‑efficient natural gas-fired projects with integration of future carbon‑capture potential6 7;
|
| (2) |
Retail activities, which are intended to supplement the generation activities of the CPV Group.
|
| B. |
Main financial parameters (in millions of shekels)
|
|
For the
|
For the
|
||||||||||||||||||||||||
|
Year Ended
|
Three Months Ended
|
||||||||||||||||||||||||
|
December 31
|
December 31
|
||||||||||||||||||||||||
|
2025
|
2024
|
%
|
2025
|
2024
|
%
|
||||||||||||||||||||
| Consolidated |
EBITDA after proportionate consolidation
|
1,591
|
1,208
|
32
|
%
|
336
|
228
|
47
|
%
|
||||||||||||||||
|
Net income
|
457
|
197
|
132
|
%
|
124
|
123
|
1
|
%
|
|||||||||||||||||
|
Adjusted net income (loss)
|
373
|
115
|
225
|
%
|
62
|
(47
|
)
|
234
|
%
|
||||||||||||||||
|
FFO (Funds From Operations)
|
1,295
|
718
|
80
|
%
|
468
|
154
|
204
|
%
|
|||||||||||||||||
|
Israel
|
EBITDA
|
611
|
639
|
(4
|
)%
|
89
|
98
|
(9
|
)%
|
||||||||||||||||
|
FFO (Funds From Operations)
|
494
|
420
|
18
|
%
|
100
|
45
|
122
|
%
|
|||||||||||||||||
|
|
|||||||||||||||||||||||||
| U.S. |
EBITDA after proportionate consolidation
|
1,005
|
589
|
71
|
%
|
255
|
137
|
86
|
%
|
||||||||||||||||
|
FFO (Funds From Operations)
|
855
|
339
|
152
|
%
|
373
|
111
|
236
|
%
|
|||||||||||||||||
|
EBITDA after proportionate consolidation – Energy Transition
|
1,099
|
588
|
87
|
%
|
252
|
141
|
79
|
%
|
|||||||||||||||||
|
EBITDA after proportionate consolidation – Renewable Energies
|
105
|
112
|
(6
|
)%
|
25
|
28
|
(11
|
)%
|
|||||||||||||||||
| * |
EBITDA, EBITDA after proportionate consolidation, adjusted net income and FFO (Funds From Operations) are non‑IFRS financial measures – for definitions and the manner of their calculation – see Sections 4A(3) and 4B below.
|
| 6 |
Some of the projects in this area are being developed by associated companies. Regarding the Basin Ranch power plant, which is presently under construction, as at the date of the report the project is held by an associated company.
Subsequent to the date of the report, a transaction was completed for acquisition of the remaining 30% in the project, and starting from this date it is 100% held by the CPV Group and is consolidated in the Company’s financial statements.
|
| 7 |
It is noted that the carbon capture process constitutes an additional separate component of the natural gas projects under development/construction, which are subject to separate uncertainty and risks and is expected to be developed or
executed (if ultimately executed) according to a different timetable.
|
3
---Unofficial translation for convenience purposes---
OPC Energy Ltd.
Report of the Board of Directors
| 1. |
Executive Summary1 (Cont.)
|
As detailed in the above table, 2025 was characterized by an improvement of the financial parameters compared with 2024.
The consolidated EBITDA after proportionate consolidation increased by about 32%, mainly as a result of a sharp increase of about 71% in
the EBITDA after proportionate consolidation in the United States, primarily due to an increase in the energy margins and the capacity prices in the PJM market, as well as due to an increase in the holding rates in the Maryland and Shore power
plants. In Israel the EBITDA was relatively stable declining by about 4%, mainly due to planned maintenance work and upgrades at the Rotem power plant and restriction of operational availability at the Zomet power plant.
The adjusted net income in 2025 also rose sharply by about 225% over 2024, driven primarily by the increase in EBITDA after
proportionate consolidation due to an increase in the holding rates in the Maryland and Shore power plants offset by higher depreciation and financing expenses.
In 2025, the FFO (Funds From Operations) climbed by about 80% mostly due to the sharp rise in the consolidated EBITDA after
proportionate consolidation, primarily in the U.S., as stated above.
Main developments in 2025 and thereafter
|
Israel
|
Hadera 2 project in advanced development (combined cycle) with a capacity of 850 megawatts – on August 10, 2025, the government of Israel approved National
Infrastructures Plan 20B (NIP 20B) regarding construction of an additional power plant in Hadera. The Company is taking action to sign the project agreements (construction, equipment and financing) and to obtain the required approvals and
permits. For details – see Section 6A(2) below.
|
|
|
Ramat Beka project in advanced development (solar with a capacity of 550 megawatts with integrated storage of 3,850 megawatts/hr.) – in January 2026, the plan
was approved by the National Infrastructures Committee and it is awaiting final approval. The Company is taking action to sign the project agreements (construction, equipment and financing) and to obtain the required approvals and
permits. For details – see Section 6A(2) below.
|
||
|
Intel project in initial development (combined cycle with a capacity of 600 megawatts) – in March 2025, government consent was received for advancement of the
plan on the National Infrastructures Committee. The Company is taking action to obtain the necessary approvals and permits for advancement of the project and is carrying on negotiations with respect to signing of a binding PPA agreement
with Intel. For details see Section 6A(3) below.
|
||
|
Continuing increase in the pipeline of projects under development in the area of renewable energy – in addition to the Ramat Beka project, as at the approval
date of the report the portfolio of the pipeline projects in the renewable energy area with integrated storage is estimated at about 0.5 gigawatts and 2.5 gigawatt-hours. For details see Section 6A(3) below.
|
4
---Unofficial translation for convenience purposes---
OPC Energy Ltd.
Report of the Board of Directors
| 1. |
Executive Summary1 (Cont.)
|
Main developments in 2025 and thereafter (Cont.)
|
Israel (Cont.)
|
Corporate financing in Israel – in 2025, OPC Israel signed bank financing agreements, in the aggregate amount of NIS 700 million, on terms similar to those of
the agreements it signed in 2024. The loans were used for refinancing long‑term debt in OPC Israel and the Company’s share is mainly for repayment of its debentures. For details see Section 7A(2) below.
|
|
|
Update of the structure of the electricity tariff for consumers of Israel Electric Company – in December 2025, the Electricity Authority published a decision
regarding update of the structure of the electricity tariff, which provides, among other things, that assuming a shekel/dollar exchange rate of 3.3 in 2026 the tariff will be 28.90 agurot and it will be for three‑years (2026–2028) subject
to updates and after being linked to the relevant indices. For details – see Section 2A below.
|
||
|
Performance of upgrading and planned maintenance work at the Rotem power plant and limitation of the availability at the Zomet power plant – in the fourth
quarter of 2025, the Rotem power plant was shut down for planned upgrades and maintenance work. In addition, in 2025 the operating availability of the Zomet power plant was limited, and from this date the power plant is operating partially.
For details – see Section 4C(1) below.
|
||
|
Natural gas activities with carbon capture potential in the U.S.
|
Financial close and start of construction of the Basin Ranch power plant in Texas (a combined cycle power plant with a capacity of 1.35 gigawatts) – in October
2025, the financial close was completed for the project with an estimated aggregate construction cost of about $1.8 – $2.0 billion, wherein the project was granted a subsidized loan from the Texas Energy Fund, in the amount of about $1.1
billion, and the CPV Group received a corporate loan from Bank Leumi, in the amount of about $300 million, for financing part of the shareholders’ equity. For details – see Section 6B(1) below.
|
|
|
Acquisition of the remaining rights (30%) in the Basin Ranch power plant for an aggregate consideration of about $371 million – further to the signing of the
agreement from October 2025, in February 2026 the acquisition was completed and starting from this date the project will be consolidated in the CPV Group’s and the Company’s financial statements. In this regard, after the date of the report
the corporate loan from Bank Leumi was increased by about $130 million. For details – see Section 6B(1) below.
|
||
|
The CPV Group is taking action with respect to accelerated advancement of the Shay flagship project in the PJM market (combined cycle with a capacity of 2.1
gigawatts in West Virginia – share of CPV 70%). For details – see Section 6B(2) below.
|
5
---Unofficial translation for convenience purposes---
OPC Energy Ltd.
Report of the Board of Directors
1. Executive Summary1 (Cont.)
Main developments in 2025 and thereafter (Cont.)
|
Energy Transition in the U.S.
|
Execution of the strategy to increase the holdings and obtain control over natural gas‑fired power plants: (1) acquisition of the remaining rights (11%) in the
Shore power plant (a combined cycle power plant with a capacity of 725 megawatts in PJM) in January 2026, in exchange for an immaterial amount; and (2) signing of an agreement, which as at the approval date of the report had not yet been
completed, for acquisition of the remaining interest (25%) in the Maryland power plant (combined cycle with a capacity of 745 megawatts in PJM) in exchange for sale of the rights (10%) in the Three Rivers power plant (combined cycle with a
capacity of 1,258 megawatts in PJM) and payment of an immaterial amount. In addition, a non‑binding memorandum of understanding for examination of a potential transaction to increase the holdings in additional active power plants in
exchange for certain rights in the CPV Group, as will be discussed by the parties.
|
|
|
Refinancing of the Shore power plant – in February 2025, the refinancing transaction for the Shore power plant was completed, such that the margin was updated to
3.75% and $80 million were invested in Shore by the partners (the CPV Group’s share – about $72 million). For details – see Section 7A(5) below.
|
||
|
Refinancing of the Fairview power plant (combined cycle with a capacity of 1,050 megawatts in PJM) – in October 2025, a transaction was completed for revision of
the financing terms such that the margin was reduced to 2.5% and a dividend was distributed to the partners, in the aggregate amount of about $217 million (the CPV Group’s share – about $54 million).
|
||
|
Refinancing of the Valley power plant (combined cycle with a capacity of 720 megawatts in New York) – in February 2026, a refinancing transaction was completed
whereby the margin was reduced to 2.75%, the cash sweep rate was reduced from 100% to a leverage‑based mechanism as is customary in the TLB market, and a dividend was distributed to the partners / shareholders’ loans were repaid, in the
amount of about $100 million (the CPV Group’s share – about $50 million). For additional details – see Section 7A(6) below.
|
||
|
Capacity auctions and regulatory processes in PJM – two capacity auctions for the period from June 1, 2026 through May 31, 2028 were published at a price of
about $330 for megawatts/day, which reflects the ceiling for the price range that was approved by the FERC. In February 2026, PJM submitted a request to FERC for approval of extension of the maximum and minimum limits (collar) for two
additional capacity auctions from June 1, 2028 through May 31, 2030, which as at the approval date of the report had not yet been approved. At the same time, in the PJM regulatory processes are being considered with the goal of assuring a
balance between supply and demand and maintaining reliability of the electricity grid, in light of the new significant additional energy demand expected to enter the market, particularly existence of emergency capacity auctions (Reliability
Backstop Auctions) up to September 2026 that will include capacity prices for a period of up to 15 years. For details – see Section 3C below.
|
6
---Unofficial translation for convenience purposes---
OPC Energy Ltd.
Report of the Board of Directors
1. Executive Summary1 (Cont.)
Main developments in 2025 and thereafter (Cont.)
|
Renewable Energies in the U.S.
|
Commercial operation of the Backbone project (a solar project with a capacity of 179 megawatts) – in December 2025, construction of the Backbone project was
completed and the amount of about $120 million was received from the project’s tax partner. For details – see Section 5E below.
|
|
|
Investment agreement with the tax partner in the Rogues Wind project (a wind project under construction with a capacity of 114 megawatts) – in August 2025, a
binding investment agreement was signed with a tax partner for investment in the Rogues Wind project, the aggregate amount of about $163 million.
|
||
|
Legislation of the “One Big Beautiful Bill” and change of the tax benefit arrangements in the energy area, including reduction of the benefits for renewable
energies, and update of the U.S. income tax guidelines regarding the Safe Harbor rules for purposes of entitlement to tax benefits for the renewables – for details – see Section 3D below. As at the approval date of the report, the CPV
Group assured compliance with the Safe Harbor rules for the projects in the scope of 1.9 gigawatts.
|
||
|
Group headquarters
|
Raising of capital – in 2025, the Company completed a capital raise with gross proceeds of about NIS 2,090 million. The proceeds of the issuances was earmarked
mainly for provision of part of the share of the CPV Group in the shareholders’ equity required for construction of the Basin Ranch power plant and the continued growth and development of the Company’s business.
|
|
|
Increase of the investment commitment in the CPV Group – in March 2026, a process was completed of increase of the investment commitment of the Company and the
other partners in the CPV Group in connection with the financial close of the Basin Ranch power plant and transactions for increasing the holdings in the natural gas‑fired power plants, in the aggregate amount of about $502 million. For
details – see Note 23A(2) to the financial statements.
|
||
|
Credit rating for the Company of A1.il with a stable rating outlook – in May 2025, Midroog determined an initial rating of A1.il with a stable rating outlook for
the Company and its debentures. In addition, in May 2025 S&P Maalot raised the Company’s credit rating to ilA with a stable rating outlook and the credit rating of its debentures to ilA+. For details – see Section 7B below.
|
||
|
Issuance of debentures by means of expansion of the debentures (Series D) – in November 2025, the Company made an additional issuance of debentures (Series D) by
way of an expansion of an existing series, in the amount of NIS 500 million (gross) in order to refinance existing debts and for use in current ongoing business activities. For details – see Section 7A(13) below.
|
||
|
Early partial redemption (prepayment) of the debentures (Series B) – on September 30, 2025, the Company made an early partial prepayment of the debentures
(Series B), in the total amount of about NIS 302 million.
|
7
---Unofficial translation for convenience purposes---
OPC Energy Ltd.
Report of the Board of Directors
1. Executive Summary1 (Cont.)
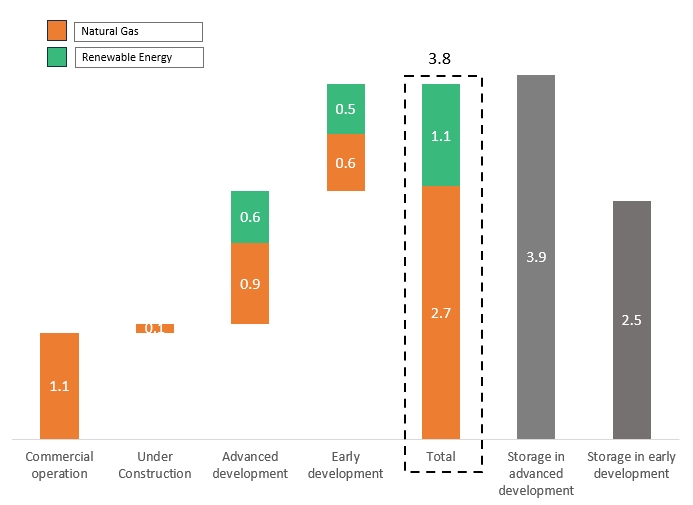
Portfolio of about 15.1 GW and about 6.4 GWh of storage (for details – see Section 6 below)
United States (1)
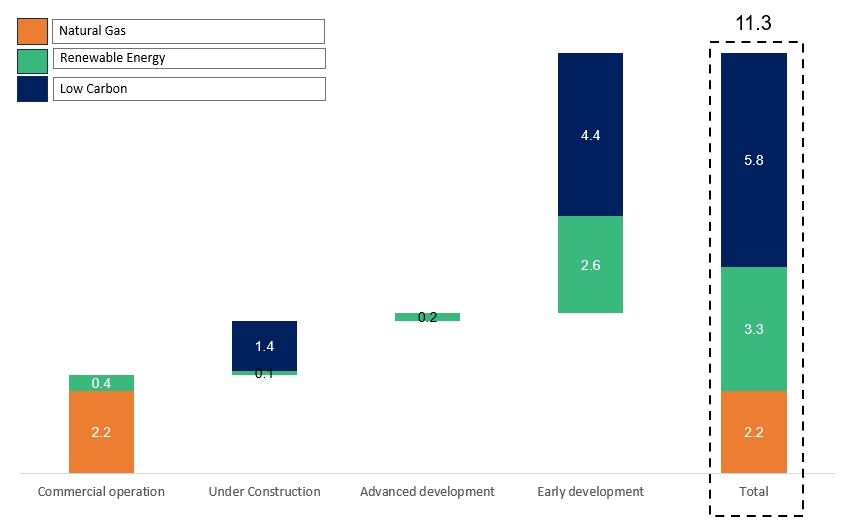
| (1) |
The projects are presented according to the CPV’s Group relative ownership interest in each project.
|
| (2) |
The Basin Ranch (under construction) and Shore (active) power plants are presented at 100%, which is the rate of ownership of the CPV Group as at the approval date of the report.
|
8
---Unofficial translation for convenience purposes---
OPC Energy Ltd.
Report of the Board of Directors
| 1. |
Executive Summary1 (Cont.)
|
Portfolio of about 15.1 GW and about 6.4 GWh of storage (for details – see Section 6 below) (Cont.)
Israel
That stated with respect to the development stages, capacities and/or expectations regarding construction of the development
(pipeline) projects in Israel and in the U.S. constitutes “forward‑looking” information as it is defined in the Securities Law, 1968 (“the Securities Law”), which is based on the Company’s estimates at the approval date of the report and regarding
which there is no certainty they will be realized. Ultimately, there could be changes in the characteristics of the projects and/or delays or changes due to regulatory, operating, commercial factors and/or realization of one or more of the risk
factors to which the Company is exposed, as stated in Part A of the Periodic Report. Advancement of the pipeline projects (or any one of them) is subject to the discretion of the Company’s competent organs and existence (fulfillment) of additional
conditions, as stated in Part A of the Periodic Report.
For definitions of the development stages – see Section 6 below.
9
---Unofficial translation for convenience purposes---
OPC Energy Ltd.
Report of the Board of Directors
| 2. |
Main Developments in the Business and Regulatory Environment in Israel
|
| A. |
Electricity tariff for consumers of Israel Electric Company
|
| 1. |
Structure of the tariff of the generation component
|
The Electricity Authority determines, among other things, the tariffs including the electricity generation component tariff that is
collected by Israel Electric Company (“the generation component”) in the year of the report, based on the cost principle and the other factors provided in the Electricity Sector Law. In this regard, the generation component is based on, among other
things, the Electric Company’s fuel costs, which for 2025 are composed mainly of the natural‑gas costs (and coal at a diminishing rate), the costs involved with acquiring electricity from private generators, the Electric Company’s capital costs,
operating costs and the policies of the Electric Company with respect to classification of costs between the generation component and system costs8.
As at the date of the report, most of the Company’s revenues in Israel derives from agreements covering sale of electricity, primarily
to industrial and commercial consumers, as well as to household consumers via agreements with marketing entities, where the balance of the weighted‑average period9 of the agreements with the industrial and commercial consumers is about 8
years and with the entities that market to household consumers it is about 6 years. In general, in the undertakings with the private customers, as stated, the Company collects the TAOZ tariff10 from the consumer (which is impacted
primarily by the generation component tariff) less a discount relating to the generation component. The price of the electricity changes based on the season (summer, winter and transition) and the charge hour – the hourly demand brackets (peak and
low). In general, the electricity tariffs in Israel in the summer and the winter are higher than those in the transition seasons and, accordingly, the Company’s revenues are impacted by seasonality.
Therefore, the results of the Group’s activities in Israel are materially impacted by changes in the generation component tariff in such
a manner that an increase in the generation component has a positive impact on the Group’s results, and vice‑versa11.
| 8 |
System costs are costs collected from all the consumers in the economy. These costs include services for balancing the system, collection services, accompanying arrangements in the electricity sector and administrative costs (“the system
costs”). It is noted that the electricity tariff that is published by the Electricity Authority includes a number of components, including, transmission infrastructure, distribution infrastructure, a system component and a generation
component. To the best of the Company’s knowledge, except for the generation component (which is usually collected with a certain discount and which remains with the private electricity generators or suppliers), all the rest of the
components are collected at the same rate that is published by the Electricity Authority and are transferred directly to Israel Electric Company.
|
| 9 |
The average balance of the period does not include agreements for short periods that are signed from time to time, for a period of up to about 3 months. The agreements include the possibility of early termination and “exit” points that
are customary in agreements of this type.
|
| 10 |
A burden and time‑of‑use tariff, which is determined by the Electricity Authority and which is based on various electricity prices in accordance with the season of the year and different time brackets during the 24‑hour period.
|
| 11 |
That stated regarding the impact of changes in the generation component on the Company’s results, is subject to changes, among other things, as a result of determination of the periodic generation component and/or the manner of its
application between the hourly demand hours’ brackets, operational factors and/or existence of one or more of the risk factors to which the Company is exposed, as stated in Section 19.2 of Part A of the Periodic Report.
|
10
---Unofficial translation for convenience purposes---
OPC Energy Ltd.
Report of the Board of Directors
| 2. |
Main Developments in the Business and Regulatory Environment in Israel (Cont.)
|
| A. |
Electricity tariff for consumers of Israel Electric Company (Cont.)
|
| 1. |
Structure of the tariff of the generation component (Cont.)
|
Decision of the Electricity Authority regarding the structure of the generation component tariff
In December 2025, the Electricity Authority published a decision regarding the matter of “Update of the Tariff Structure for Electricity
for Consumers of Israel Electric Company”, in the framework of which it was determined, among other things, that update of the tariff will be made automatically every six months and the structure of the generation component will change such that
starting from January 1, 2026 the generation component will be split into a fixed component and a variable component based on the tariff costs for 2025 less non‑recurring adjustments. Regarding the tariffs for the starting point of each of the two
components, a linkage and advancement mechanism was provided that conforms to the costs that compose it and their characteristics. The variable component is linked to the exchange rate of the dollar, the CPI, the carbon emissions tax cost and the
price of coal and the fixed component is linked to the CPI and the risk‑free inflation‑adjusted interest rate. The tariff will be a three‑year tariff (2026–2028), where during the period the tariff will be linked to relevant indices and prices, as
stated. It is noted that in the Company’s estimation, in general, in the present format for the generation component, a change of 1 agura per kilowatt hour in the generation component has an impact of about NIS 30 million on the EBITDA in Israel.
It is further noted that in the Company’s estimation, based on past experience and assuming the said update mechanism in the next three years, the generation component tariff is relatively stable over the long run with respect to the relative
volatility that characterizes the electricity prices in the U.S.12
| 2. |
Update of the tariff of the generation component for 2025–2026
|
In January 2025, a decision of the Electricity Authority entered into effect regarding update of the generation tariff for 2025, whereby
the weighted‑average generation component was updated to 29.39 agurot per kilowatt hour – a decline of about 2.4% in the generation component with reference to the average that prevailed in 2024 and about 2.2% compared with the generation component
in effect at the end of 2024, this being mainly as a result of a decrease in the Electric Company’s generation cost due to a reduction in the use of coal and a forecasted decline in the Electric Company’s natural‑gas price. In addition, there was a
non‑recurring recognition of surplus receipts from sale of the Eshkol power plant, which led to a reduction in the generation component.
In December 2025, the generation component for 2026 was set (subject to a periodic update as stated above) at 28.90 agurot per kilowatt hour (assuming a
shekel/dollar exchange rate of U.S.$1 = NIS 3.3), a decline of 1.66% compared with the average generation component for 2025.
| 12 |
The Company’s estimates regarding the impact of changes in the generation component on the EBITDA and the relative stability of the generation component are “forward‑looking” information as it is defined
in the Securities Law, regarding which there is no certainty it will materialize. Ultimately, the impact might be different due to, among other things. the market conditions, changes impacting the components of the tariff, regulatory
changes/factors that impact the electricity market and/or the final arrangements that will be determined if they enter into effect, which are not dependent on the Company.
|
11
---Unofficial translation for convenience purposes---
OPC Energy Ltd.
Report of the Board of Directors
| 2. |
Main Developments in the Business and Regulatory Environment in Israel (Cont.)
|
| A. |
Electricity tariff for consumers of Israel Electric Company (Cont.)
|
| 2. |
Update of the tariff of the generation component for 2025–2026
|
Set forth below is data regarding the annual weighted‑average generation component (the prices are denominated in agurot per kilowatt hour):
|
Period
|
2025
|
2024
|
Change
|
|||||||||
|
January–December average
|
29.39
|
30.10
|
(2.4
|
%)
|
||||||||
|
October–December average
|
29.39
|
30.07
|
(2.2
|
%)
|
||||||||
In the Company’s estimation, a significant impact on its results due to the above‑mentioned Hearing is not expected13.
| 3. |
The natural gas price and carbon emissions tax
|
Natural gas serves as the main raw material for generation of electricity in the area of activities (usually, with diesel oil as a
backup). For purposes of its activities, the Group has signed long‑term agreements14 for acquisition of natural gas for the active power plants, where most of the gas purchased from the Karish Tanin reserve (which is held by Energean)
and from the Tamar Group.
The price of the natural gas determined as part of the said agreements is denominated in or linked to the dollar (subject to a minimum
graduated dollar price), as applicable in accordance with each agreement, and is also linked to the weighted‑average generation component (subject to a minimum price) in such a manner that if the natural‑gas price pursuant to the agreements stands
at the minimum price, a decline in the generation component will not trigger a decrease in the cost of the natural gas. It is noted that the purchase price of the natural gas is not impacted by the seasonality of the TAOZ tariff or the hourly
demand brackets. In light of that stated, in the Company’s estimation, the Group’s natural gas cost in Israel is (relatively) stable over time, compared with the relative volatility characterizing the natural‑gas prices in the U.S.
| 13 |
The Company’s estimates with respect to the impact of the Decision is “forward‑looking” information as it is defined in the Securities Law, for which there is no certainty of their realization.
Ultimately, the impacts could be different due to, among other things, the market conditions, changes impacting the components of the tariffs, regulator changes/factors that impact the electricity market and/or final arrangements that
will be determined, should they enter into effect, which do not depend on the Company.
|
| 14 |
The Energean agreements are in effect up to 2033 and 2038 for the Rotem and Hadera power plants, respectively, and the Tamar agreements are in effect up to 2028 for
the Rotem and Gat power plants and 2029 for the Hadera power plant. There is an option to extend the said agreements for a period of up to two years on the terms provided in the agreements.
|
12
---Unofficial translation for convenience purposes---
OPC Energy Ltd.
Report of the Board of Directors
| 2. |
Main Developments in the Business and Regulatory Environment in Israel (Cont.)
|
| A. |
Electricity tariff for consumers of Israel Electric Company (Cont.)
|
| 3. |
The natural gas price and carbon emissions tax (Cont.)
|
In September 2024, the amendment to the Excise Tax on Fuel Order (“the Amended Order”) took effect, such that starting from January 1,
2025 the excise tax rate imposed on natural gas will increase in a graduated manner from 2025 and up to 2030 (in 2025 increased from NIS 19 per ton to NIS 33 per ton, in 2026 will increase to NIS 54 per ton and gradually up to a maximum excise tax
of NIS 192 in 2030, CPI linked). The said increase is expected to raise the Group’s natural‑gas cost in Israel, where in the Company’s estimation part of this impact could decline due to, among other things, an increase in the Group’s revenues in
Israel, if and to the extent there is an increase in the generation component and subject to the expected impact of such an increase on the natural‑gas price, which is linked to the generation component. As at the approval date of the report, the
Company is unable to estimate the full impact of the Amended Order on its results over time due to the uncertainty embedded in the manner of determination of the tariff, in general, and the generation component, in particular, over the long run and
on the manner of the further application of the decision, as well as in light of the possible impacts of conclusion of significant natural gas agreements in the economy. Regarding 2026, the Company estimates that the Amended Order is not expected
to have a significant impact on its results15.
| 4. |
Capacity revenues
|
In addition to the revenues from sale of energy, some of the active power plants in Israel, mainly the Zomet power plant, are entitled
to capacity revenues that are paid by the System Operator. The capacity tariff in the Zomet and Gat power plants is fixed (based on tariff approvals for each power plant, and broken down by the hourly‑demand brackets as determined by the System
Operator) and is linked to the CPI (and with respect to Gat – also including an annual ceiling).
15 That stated above with respect to the Company’s estimates regarding the relative stability of the gas price
in the area of activities in Israel and/or regarding the Company’s estimate with respect to the impact of the amended Excise Tax Order and the possibility of the reduction of its scope, constitutes “forward‑looking” information as it is defined
in the Securities Law, which is based on the Company’s estimates as at the date of the report. Ultimately, the gas price could be impacted by various factors, and the impacts of the amended Excise Tax Order might not have a positive impact on the
generation component that will be reflected in the Company’s revenues – this being due to, among other things (and as applicable), certain operative factors, the terms of the gas agreements, factors relating to the gas suppliers with which the
Company has contracted (particularly Energean), disruptions in the supply of natural gas, regulatory changes, items impacting the generation component and the Company’s revenues, including, macro‑economic factors, or the occurrence of one or more
of the risk fact to which the Company is exposed, as stated in Section 19 of the Part A of the Periodic Report.
13
---Unofficial translation for convenience purposes---
OPC Energy Ltd.
Report of the Board of Directors
| 2. |
Main Developments in the Business and Regulatory Environment in Israel (Cont.)
|
| A. |
Electricity tariff for consumers of Israel Electric Company (Cont.)
|
| 5. |
Supply to customers
|
As part of implementation of the reform in the electricity sector in Israel, in recent years the Electricity Authority has taken action
to advance the competition in the supply market by means of entry and integration of private suppliers and acceleration of the transition of consumers to receipt of services from those suppliers. Based on the Report of the Israeli Economic Sector
for 2025, the market share of the private suppliers reached about 35% of the economy’s entire consumption, where most of the undertakings are mainly with customers having significant electricity consumption (mostly industrial and commercial
consumers with high‑ and medium‑voltage connections). Regarding consumers with low‑voltage connections, including, among others, most of the household consumers, as at June 2025, only 9% are serviced by private suppliers. It is noted that in order
to increase the ability to transfer household consumers to private electricity suppliers, starting from January 2024 household consumers that do not have a “smart” meter are permitted to contract with a private supplier. At the present time, the
Company supplies private electricity consumers (indirectly through PPA agreements with two marketers), while in the Company’s estimation, up to the end of 2026 the scope of the sales to household consumers through the said marketers is expected to
continue to rise.
In addition, as part of the continuing optimization and diversity of the mix of the Company’s customers in Israel, including from the
standpoint of the future projects being developed by the Company, as detailed in Section 6A below, during the past year the Company contracted with a number of server farms, including examination of significant expansion of the undertakings with
these consumers and/or with additional server farms16.
| B. |
Security, Political and Geopolitical Developments in Israel
|
Commencing from 2023, Israel has been characterized by significant geopolitical and defense instability, along with considerable regional
escalation – due to both internal political events and the events occurring on October 7, 2023, as well as the defense/security issues arising from the outbreak of the “Iron Swords” war in the Gaza Strip. During 2024–2025, the combat and tensions
increased in certain areas, particularly in the northern part of the State as well as with the Houthis group in Yemen and with the country of Iran, where on June 12, 2025 a broad‑scoped military confrontation started between Israel and Iran (the
“Rising Lion” military operation). On June 24, 2025, a ceasefire was declared with Iran and in October 2025 an agreement was signed for a ceasefire in the Gaza Strip.
16 The Company’s estimates with respect to the developments in the electricity market, including regarding the
scope of the Company’s sales and its customer portfolio, constitutes “forward‑looking” information as it is defined in the Securities Law, and there is no certainty regarding its realization in the short run or in the long run, and which depends
on, among other things, the scope of the activities of the marketers through which the Company operates, the extent of the transition of household consumers to private suppliers, changes in the market conditions or the competition therein, the
composition of the consumption of the Company’s customers, PPA agreement execution and/or or the occurrence of one or more of the risk fact to which the Company is exposed.
14
---Unofficial translation for convenience purposes---
OPC Energy Ltd.
Report of the Board of Directors
| 2. |
Main Developments in the Business and Regulatory Environment in Israel (Cont.)
|
| B. |
Security, Political and Geopolitical Developments in Israel (Cont.)
|
The fighting that started in 2026, following the combat that took place in the period of the report, had varying external impacts that
included, among other things, disruptions in the shipping routes due to attacks on commercial and transport vessels and contraction (sometimes even significant) of the activities of the foreign airline companies in Israel. From time to time, these
events impacted (and may continue to impact, as stated below) the arrival of equipment and foreign work teams in Israel (including those needed for purposes of maintenance and construction at the Group’s activity sites in Israel). The said fighting
and the “Rising Lion” military operation did not have a material impact on the activities in Israel in the period of the report.
Subsequent to the date of the report, on February 28, 2026, there was a significant escalation in the regional geopolitical situation
upon the outbreak of an additional serious military confrontation between Israel and the United States versus Iran, which according to the reporting also includes attacks by Iran on additional Middle‑Eastern countries (the “Lion’s Roar” Operation).
As a consequence of the “Lion’s Roar” military operation, among other things, Israeli airspace was closed and a general emergency situation was announced for the Israeli home front in such a manner that significantly limits the activities
(traffic/movement) in public areas – this being together with a large mobilization of military reserves.
The above‑mentioned events involve significant uncertainty and could impact the macro‑economic environment, including an adverse impact
on the strength of the Israeli economy. The said military/defense situation and/or a worsening thereof could negatively affect the Company’s activities in Israel as well as the activities of its customers and suppliers in Israel, and could also
have an unfavorable effect on the results of the Company’s operations, its generation capacity and the cost of the capital and financing sources required for the Group’s activities. During the “Lion’s Roar” Operation, all the natural gas rigs
(platforms) were shut down (including the Karish reservoir) for varying periods of time (as at the date of the report – only for several days), while at the approval date of the report the Tamar reservoir is operating whereas the Karish and
Leviathan reservoirs have not yet resumed their operations. As at the approval date of the report, the operation of the Tamar reservoir has supplied all the Company’s natural‑gas needs. Nonetheless, some of the gas was purchased at a price higher
than the alternative price from the Karish reservoir with only an immaterial impact as at the approval date of the report. The Company is preparing for a possible continuation of the impact of the military operation on the natural gas platforms,
including temporary use of diesel oil at the Company’s power plants, as necessary. In addition, in light of the emergency situation announced in the Israeli economy there has been a certain decline in demand, however the full extent of the impacts
on the Company’s customers (if any) has not yet been ascertained. Furthermore, force majeure notifications have been received from suppliers and contractors along with limited availability of foreign work
teams and experts at the activity sites in Israel, including at the Sorek 2 site (which is undergoing acceptance tests) and the Hadera site (which is performing unplanned maintenance).
As at the approval date of the report, taking into account the close succession of the “Lion’s Roar” Operation following the preceding
events, there is no complete certainty regarding the full impacts and consequences of the said Operation on the Group’s activities, if any, and at this point the Group is not able to assess them.
For additional details – see Section 6.1.1 of Part A of the Periodic Report.
15
---Unofficial translation for convenience purposes---
OPC Energy Ltd.
Report of the Board of Directors
| 3. |
Main Developments in the Business and Regulatory Environment in the U.S.
|
| A. |
Electricity and natural gas prices
|
The results of the activities of the CPV Group are impacted to a significant extent by the electricity prices in effect in the areas in
which the Group’s power plants operate. The main factors impacting the electricity prices are demand for electricity, available generation (supply) and the natural gas price in the area in which the power plant operates.
Electricity supply and demand trends
The electricity prices in the U.S. are continuing to be impacted by supply and demand trends in the activity markets of the CPV Group’s
power plants, particularly the PJM and ERCOT markets (the location of the Basin Ranch power plant which is under construction).
In the year of the report, electricity demand continued to rise, with an expectation of significant further growth. This trend is driven
primarily by ongoing electrification in transportation, real estate and industry sectors, expansion of industrial activities – particularly due to increased energy requirements in the data center sector following the transition to cloud computing
and the growth in artificial intelligence (AI) applications, as well as an increase in the demand for electricity in energy‑intensive industries, such as, cryptocurrency mining. In the United States, available generation capacity is expanding as
new natural gas, solar, and wind installations more than offset the retirement of older, less efficient, and more polluting conventional power plants, particularly coal-fired facilities17. Nevertheless, according to the U.S. Energy
Information Administration’s Annual Energy Outlook 2025 projections of electricity demand and generation capacity through 2035, long-term energy trends indicate a rising power demand and shifts in the generation sources that will entail significant
additional investments in new generation and infrastructures in order to meet the future needs18.
It is noted that in June 2025, the PJM region recorded a record demand for electricity, which reached about 160 gigawatts – the highest level recorded in the
last decade. The exceptional increase in the demand stemmed from a combination of weather conditions (extreme heat wave and high humidity) that triggered an increase in electricity consumption for air conditioning, along with structural trends as
detailed above. Per PJM’s most recent load forecast, the summer peak is projected to reach 222 GW in 2036, an increase of over 60 GW in 10 years, driven in large part by the rising energy demand from data centers19.
17 Americas Generation Capacity 2025 Update from April 2025:
(https://www.publicpower.org/system/files/documents/Americas-Electricity-Generation-Capacity-2025- Update.pdf)
18 U.S. Energy Information Administration’s Annual Energy Outlook 2025 from April 2025
(https://www.eia.gov/outlooks/aeo)
19 Source: “PJM Load Forecast Report 2026” dated January 14, 2026.
16
---Unofficial translation for convenience purposes---
OPC Energy Ltd.
Report of the Board of Directors
| 3. |
Main Developments in the Business and Regulatory Environment in the U.S. (Cont.)
|
| A. |
Electricity and natural gas prices (Cont.)
|
Electricity supply and demand trends (Cont.)
In the estimation of the CPV Group, this record demand, together with the unusual winter demand recorded in January 2025 along with the demand forecasted for
the winter of 202619, emphasize PJM’s need to system‑wide preparations in order to, among other things, cope with extreme weather conditions, additional investments in generation and storage capability along with a re‑examination of the
availability and reliability resources at times of record‑high demand.
It is further noted that the peak summer demand for electricity in the ERCOT system reached over 83 GW in 202520. Based on the forecasts published
by ERCOT as at the approval date of the report, the summer peak is projected to reach 126 GW by 2031, reflecting an average annual growth rate of 13.6%) in the demand for energy from 2026 to 203021.
Fluctuations
In general, in the United States, the electricity prices are impacted by the demand for electricity and the prices of natural gas, which are generally high in
periods in which the weather is cold or hot compared with the annual average and depending on the weather (usually in the summer and winter seasons).
In connection with renewable energy projects, in wind projects the wind speeds tend to be higher in the winter and lower in the summer, whereas in solar
projects the radiation from the sun tends to be higher in the spring and summer months and lower in the fall and winter months.
Natural gas prices
With respect to the “energy transition” activities, in general, the price of natural gas is significant in determination of the price of
the electricity, as gas-fired generation is frequently the marginal (price-setting) resource in most of the competitive wholesale markets in which the CPV Group operates. Accordingly, in the existing production mix, over time, to the extent the
natural‑gas prices are higher in a continuing manner, the marginal energy prices will also be higher, and would be expected to have a positive impact on the energy margins of the CPV Group due to the high efficiency of the power plants it owns
compared with other power plants operating in the relevant activity markets (the impact could be different between the projects taking into account their characteristics and the area (region) in which they are located or in cases of sharp
fluctuations in the natural gas prices, for example, upon the occurrence of extreme weather events)22.
20 Source: “ERCOT Monthly Operational Overview for August 2025, dated September 22, 2025.
21 Source: Report “Capacity, Demand and Reserves (CDR) in ERCOT Region, 2026-2030”, dated December 19, 2025.
It should be noted that the foregoing regarding trends in the electricity market, growth in demand, or consumption forecasts constitutes forward-looking
information based on the assessments of the CPV Group in accordance with publicly available data, which may change due to factors that are not under its control.
22 That stated constitutes merely a general estimate that could be subject to changes due to projects characteristics or factors and events that are not under the control of the CPV Group.
17
---Unofficial translation for convenience purposes---
OPC Energy Ltd.
Report of the Board of Directors
| 3. |
Main Developments in the Business and Regulatory Environment in the U.S. (Cont.)
|
| A. |
Electricity and natural gas prices (Cont.)
|
Natural gas prices (Cont.)
Set forth below are the average natural gas prices in each of the main markets in which the power plants of the CPV Group operate (the
prices are denominated in dollars per MMBtu)*:
|
For the Year Ended
|
For the Three Months Ended
|
|||||||||||||||||||||||
|
Region
|
December 31
|
December 31
|
||||||||||||||||||||||
|
(Power Plant)
|
2025
|
2024
|
Change
|
2025
|
2024
|
Change
|
||||||||||||||||||
|
Texas Eastern M‑3 (Shore, Valley – 70%)
|
3.69
|
2.07
|
78
|
%
|
3.66
|
2.37
|
54
|
%
|
||||||||||||||||
|
Transco Zone 5 North (Maryland)
|
3.70
|
2.51
|
47
|
%
|
3.76
|
2.38
|
58
|
%
|
||||||||||||||||
|
Dominion South Pt (Valley – 30%)
|
2.78
|
1.67
|
66
|
%
|
2.96
|
1.97
|
50
|
%
|
||||||||||||||||
|
Algonquin City Gate (Towantic)
|
6.23
|
3.03
|
106
|
%
|
7.37
|
4.42
|
67
|
%
|
||||||||||||||||
|
Texas Eastern M‑3 and Texas
|
||||||||||||||||||||||||
|
Eastern M‑2 (Fairview)**
|
3.03
|
1.71
|
77
|
%
|
3.66
|
1.99
|
84
|
%
|
||||||||||||||||
|
Chicago City Gate (Three Rivers)
|
3.25
|
2.12
|
53
|
%
|
3.36
|
2.21
|
52
|
%
|
||||||||||||||||
|
Waha (Basin Ranch)***
|
0.58
|
0.05
|
1,060
|
%
|
(0.94
|
)
|
0.65
|
(245
|
)%
|
|||||||||||||||
| * |
Source: The Day‑Ahead prices at gas Midpoints as reported in Platt’s Gas Daily. It is clarified that the actual gas prices of the power plants of the CPV Group could be significantly different.
|
| ** |
Commencing from the third quarter of 2025, Fairview has started acquiring natural gas that is priced based on the Texas Eastern M‑3 transmission region. The above table presents Fairview’s combined gas price, which constitutes the gas
price up to June 2025 based on the Texas Eastern M‑2 transmission region, and starting from July 2025 the gas price based on the Texas Eastern M‑3 transmission region. For additional details – see Appendix A below.
|
| *** |
The Basin Ranch project is under construction. For details – see Section 6B(1) below.
|
In the estimation of the CPV Group, the significant increase in the natural gas prices in the period of the report and in the fourth
quarter of 2025, compared with the corresponding periods last year, is mainly due to the weather conditions described above, which led to a significant rise in demand for natural gas and an increase in the prices in the regions in which the CPV
Group’s power plants operate.
Regarding the distribution region for natural gas in Waha Texas, which is expected to serve as the supply source for the Basin Ranch
power plant, which as noted in under construction, is characterized by variable levels of production of natural gas as a function of the desired levels of production of the crude oil by the producers, which are impacted by the competitive
environment in the fuel market (the natural gas constitutes a by‑product), and transmission and transport limitations of natural gas from the region. The corresponding periods last year were characterized by a significant surplus supply of natural
gas against the background of the scope of the fuel production and transport limitations as stated (which were resolved in part in the period of the report due to operation of a new natural gas pipeline in the region) and, in turn, low price‑levels
compared with the other power plants of the CPV Group. Therefore, the rate of increase of the natural gas prices in the period of the report compared with the corresponding period last year, when measured against the other power plants of the
CPV Group, is unusually high. In the fourth quarter of 2025, against the background of the significant supply surpluses of natural gas, negative gas prices were recorded, which led to a sizable decrease in the natural‑gas prices compared with the
corresponding period last year. It is noted that the Basin Ranch project has signed Netback gas agreements and fixed‑price agreements for sale of electricity. These arrangements hedge the electricity margins for a substantial portion of the Basin
Ranch power plant’s capacity thereby limiting the project’s exposure to gas price volatility. For details – see Section 6B(1), below.
18
---Unofficial translation for convenience purposes---
OPC Energy Ltd.
Report of the Board of Directors
| 3. |
Main Developments in the Business and Regulatory Environment in the U.S. (Cont.)
|
| A. |
Electricity and natural gas prices (Cont.)
|
Electricity prices
The following table summarizes the average electricity prices in each of the regions in which the power plants in the area of energy
transition activities of the CPV Group are active (the prices are denominated in dollars per megawatt hour)*:
|
For the
|
For the
|
|||||||||||||||||||||||
|
Year Ended
|
Three Months Ended
|
|||||||||||||||||||||||
|
Region
|
December 31
|
December 31
|
||||||||||||||||||||||
|
(Power Plant)
|
2025
|
2024
|
Change
|
2025
|
2024
|
Change
|
||||||||||||||||||
|
PJM West (Shore, Maryland)
|
50.24
|
33.83
|
49
|
%
|
57.89
|
34.71
|
67
|
%
|
||||||||||||||||
|
New York Zone G (Valley)
|
62.37
|
37.64
|
66
|
%
|
68.18
|
46.26
|
47
|
%
|
||||||||||||||||
|
Mass Hub (Towantic)
|
67.98
|
41.47
|
64
|
%
|
78.80
|
54.49
|
45
|
%
|
||||||||||||||||
|
PJM AEP Dayton (Fairview)
|
45.13
|
30.73
|
47
|
%
|
48.52
|
32.48
|
49
|
%
|
||||||||||||||||
|
PJM ComEd (Three Rivers)
|
36.64
|
25.55
|
43
|
%
|
37.36
|
24.58
|
52
|
%
|
||||||||||||||||
|
ERCOT West Hub (Basin Ranch)**
|
33.73
|
28.94
|
17
|
%
|
34.34
|
25.18
|
36
|
%
|
||||||||||||||||
| * |
Based on Day‑Ahead prices as published by the relevant ISO.
|
| ** |
The Basin Ranch power plant, the construction of which commenced in October 2025. For details – see Section 6B(1) below.
|
It is noted that the actual electricity prices of the power plants of the CPV Group could be higher or lower than the regional price
shown in the above table due to the existence of a Power Basis (the difference between the power plant’s specific electricity price and the regional price). The Power Basis is a function of transmission constraints, local cost of electricity
generation, local demand for electricity, loss of electricity in the transmission lines and additional factors.
The following table presents the average Power Basis data for each power plant (the prices are denominated in dollars for megawatts per
hour):
|
Power Plant
|
For the Year Ended December 31
|
|||||||
|
2025
|
2024
|
|||||||
|
Shore
|
(8.47
|
)
|
(6.25
|
)
|
||||
|
Maryland
|
4.90
|
3.59
|
||||||
|
Fairview
|
(3.11
|
)
|
(2.18
|
)
|
||||
|
Valley
|
(1.33
|
)
|
(1.00
|
)
|
||||
|
Towantic
|
(4.44
|
)
|
(2.77
|
)
|
||||
|
Three Rivers
|
(2.00
|
)
|
(1.01
|
)
|
||||
In the period of the report and in the fourth quarter of 2025, there was a significant increase in the electricity prices compared with
the corresponding periods last year, which in the estimation of the CPV Group derives mainly from an increase in the natural‑gas prices due to lower‑than‑average temperatures in the first and fourth quarters of 2025 along with higher‑than‑average
temperatures in the second and third quarters of 2025 in the areas in which the power plants of the CPV Group are located. In addition, as detailed above the demand for electricity continued to rise in the activity areas of the CPV Group’s power
plants.
19
---Unofficial translation for convenience purposes---
OPC Energy Ltd.
Report of the Board of Directors
| 3. |
Main Developments in the Business and Regulatory Environment in the U.S. (Cont.)
|
| A. |
Electricity and natural gas prices (Cont.)
|
Electricity margin in the operating markets of the CPV Group (Spark Spread)
Spark Spread is the difference between the price of the electricity in the relevant area (zone) and the price of the natural gas used for
generation of the electricity in the relevant area (zone) (it is clarified that RGGI is not included in calculation of the Spark Spread but rather in the energy margin as detailed in Section 4D(3) below).
The Spark Spread is calculated based on the following formula:
Spark Spread ($/MWh) = price of the electricity ($/MWh) – [the gas price ($/MMBtu) x thermal conversion ratio (heat rate) (MMBtu/MWh)]
Set forth below are the average Spark Spread margins for each of the main markets in which the power plants of the CPV Group are
operating (the prices are denominated in dollars per megawatt/hour)*:
|
For the
|
For the
|
|||||||||||||||||||||||
|
Year Ended
|
Three Months Ended
|
|||||||||||||||||||||||
|
December 31
|
December 31
|
|||||||||||||||||||||||
|
Power Plant23
|
2025
|
2024
|
Change
|
2025
|
2024
|
Change
|
||||||||||||||||||
|
Shore
|
24.78
|
19.55
|
27
|
%
|
32.64
|
18.36
|
78
|
%
|
||||||||||||||||
|
Maryland
|
24.71
|
16.51
|
50
|
%
|
31.95
|
18.29
|
75
|
%
|
||||||||||||||||
|
Valley
|
38.79
|
24.19
|
60
|
%
|
44.38
|
30.74
|
44
|
%
|
||||||||||||||||
|
Towantic
|
27.49
|
21.78
|
26
|
%
|
30.90
|
25.76
|
20
|
%
|
||||||||||||||||
|
Fairview
|
25.45
|
19.62
|
30
|
%
|
24.73
|
19.55
|
27
|
%
|
||||||||||||||||
|
Three Rivers
|
15.52
|
11.77
|
32
|
%
|
15.52
|
10.22
|
52
|
%
|
||||||||||||||||
|
Basin Ranch**
|
29.96
|
28.62
|
5
|
%
|
40.45
|
20.96
|
93
|
%
|
||||||||||||||||
| * |
Based on electricity prices as shown in the above table, with assuming a thermal conversion ratio (heat rate) of 6.9 MMBtu/MWh for Maryland, Shore and Valley, and a thermal conversion ratio of 6.5 MMBtu/MWh for Three Rivers, Fairview,
Towantic and Basin Ranch. It is clarified that the actual energy margins of the power plants of the CPV Group could be significantly different due to, among other things, the existence of Power Basis and a different breakdown in the scope
of the electricity sold in the peak and off‑peak hours in CPV’s power plants and that shown above (which was calculated in the above table based on the assumption of generation in all the hours of the 24‑hour period).
|
| ** |
The Basin Ranch power plant is under construction. For details – see Section 6B(1) below.
|
In the period of the report and in the fourth quarter of 2025, there was a significant increase in the electricity margins (Spark Spread)
in all the active power plants of the CPV Group, compared with the corresponding periods last year, stemming from a combination of unusual weather conditions – temperatures lower than the average in the first and fourth quarters of 2025, along with
temperatures higher than the average in the second and third quarters of 2025, plus a continuing increase in the demand for electricity in the areas in which the power plants of the CPV Group are located.
23 For additional details regarding the energy margin of the CPV Group – see Section 4D(3) below.
20
---Unofficial translation for convenience purposes---
OPC Energy Ltd.
Report of the Board of Directors
| 3. |
Main Developments in the Business and Regulatory Environment in the U.S. (Cont.)
|
| A. |
Electricity and natural gas prices (Cont.)
|
Electricity margin in the operating markets of the CPV Group (Spark Spread) (Cont.)
The electricity margins in the ERCOT market were impacted, to a moderate degree, by natural‑gas price trends. This is primarily because
electricity pricing in the ERCOT West Hub region is not directly linked to natural gas prices in the WAHA region, which experienced significant impacts, as stated above, from surplus supply and transmission constraints in the corresponding periods
last year.
CPV Group uses hedging strategies for its natural gas-fired power plants that are intended to reduce the fluctuations of the CPV Group’s electricity margin
resulting from changes in the natural gas and electricity prices in the energy market. For details regarding hedging agreements related to the electricity margin at CPV Group’s active power plants – see Section 4D(3) below. Regarding the Netback
gas agreements and fixed-price electricity sales, which hedge a significant portion of the Basin Ranch power plant’s capacity – see Section 6B(1), below).
For the EOX Company’s 2026-2028 electricity and natural gas price forecast details – see Appendix A below.
| B. |
Carbon Emissions Tax – Regional Greenhouse Gas Initiative (RGGI)
|
The RGGI regulation applies to 4 of the 6 power plants of the CPV Group in the Energy Transition segment: Maryland, Shore, Valley and
Towantic. For additional details regarding the RGGI regulation – see Section 8.1.4B of Part A of the Periodic Report.
Set forth below is a summary of the prices of the gas‑emission quotas (carbon emission tax) from the RGGI auctions. In general, the auctions take place four
times a year, in March, June, September and December.
|
Average for
|
Average for
|
|||||||||||||||||||||||
|
the year ended
|
the three months ended
|
|||||||||||||||||||||||
|
December 31
|
December 31
|
|||||||||||||||||||||||
|
2025
|
2024
|
Change
|
2025
|
2024
|
Change
|
|||||||||||||||||||
|
Price of carbon emission tax in the RGGI auctions ($ per short ton / 2,000 pounds)*
|
20.42
|
19.42
|
5
|
%
|
22.25
|
25.75
|
(14
|
)%
|
||||||||||||||||
|
|
||||||||||||||||||||||||
|
Cost of the carbon emission tax (in terms of gas cost) ($ per MMBtu)**
|
1.22
|
1.16
|
5
|
%
|
1.32
|
1.53
|
(14
|
)%
|
||||||||||||||||
| * |
The prices of the carbon emissions tax are presented under the assumption that the price of the auction that is held prior to a certain quarter represents the price of the carbon emissions tax for the subsequent quarter. For example, the
auction held in December 2025 will represent the price for the first quarter of 2026. It is noted that the actual price of the carbon emissions tax could be different than the auction prices as a result of transactions made in the secondary
market.
|
| ** |
The cost of the carbon emissions tax (in terms of gas cost) is calculated under the assumption of emissions of carbon dioxide with a reference (ratio) of 119 lbs./MMBtu. It is noted that the actual carbon dioxide emissions ratio varies
between the different power plants, and in the estimation of the CPV Group a ratio of 119 lbs./MMBtu is a representative ratio for natural gas-fired power plants.
|
21
---Unofficial translation for convenience purposes---
OPC Energy Ltd.
Report of the Board of Directors
| 3. |
Main Developments in the Business and Regulatory Environment in the U.S. (Cont.)
|
| B. |
Carbon Emissions Tax – Regional Greenhouse Gas Initiative (RGGI) (Cont.)
|
During the reporting period, the RGGI prices remained relatively stable, with only a moderate increase compared to the corresponding
period last year. It is noted that from time to time, usually for short periods, the RGGI market could experience price volatility stemming mainly from regulatory factors and supply and demand with respect to emissions’ permits.
| C. |
Capacity revenues
|
Capacity is an additional significant income component of the CPV Group’s active power plants that operate in the PJM, NYISO and ISO‑NE
markets, wherein an increase in the capacity prices has a favorable impact on CPV’s results, and vice‑versa. The extent of the impact on the overall results changes as a function of the energy margins, which is the most significant component of
the gross profit (margin for generation of the electricity and the sale thereof), this taking into account the fact that the weight of the capacity component is usually lower than the weight of the energy margin component.
PJM market
In the PJM market, the capacity payments vary between the market’s sub‑regions, as a function of local supply and demand and transmission capabilities. In
general, the capacity auctions are made once a year for an annual supply period (June – May) in a format of three years in advance. Due to regulatory delays, the current schedule includes an auction once every six months, with the goal of returning
to annual auctions in 2027 – subject to regulatory changes. Set forth below are the capacity tariffs in the sub‑regions that are relevant to the CPV Group’s power plants and in the general market (the prices are denominated in dollars per megawatt
per day).
|
Sub-region
|
CPV Power Plants
|
(3)2027/2028
|
(2)2026/2027
|
(1)2025/2026
|
2024/2025
|
2023/2024
|
||||||
|
PJM RTO
|
333.44
|
329.17
|
269.92
|
28.92
|
34.13
|
|||||||
|
PJM COMED
|
Three Rivers
|
333.44
|
329.17
|
269.92
|
28.92
|
34.13
|
||||||
|
PJM MAAC
|
Fairview, Maryland, Maple Hill
|
333.44
|
329.17
|
269.92
|
49.49
|
49.49
|
||||||
|
PJM EMAAC
|
Shore
|
333.44
|
329.17
|
269.92
|
54.95
|
49.49
|
Source: PJM
| (1) |
Estimated additional revenues for the CPV Group for the period of the auction compared with the corresponding period last year of about $98 million24.
|
| (2) |
Estimated additional revenues for the CPV Group for the period of the auction compared with the corresponding period last year of about $18 million24.
|
| (3) |
Estimated additional revenues for the CPV Group for the period of the auction compared with the corresponding period last year of about $2 million24.
|
| 24 |
That stated in this section with respect to the estimate of the CPV Group constitutes “forward‑looking” information as it is defined in the Securities Law, regarding which there is no certainty it will be
realized. Ultimately, the revenues of the CPV Group from capacity could change (even significantly) as a result of, among other things, regulatory changes, operational factors, regulatory arrangements applicable to capacity regarding
fines or bonuses, changes in the business environment and/or the occurrence of one or more of the risk factors the CPV Group is exposed to.
|
22
---Unofficial translation for convenience purposes---
OPC Energy Ltd.
Report of the Board of Directors
3. Main Developments in the Business and Regulatory Environment in the U.S. (Cont.)
| C. |
Capacity revenues (Cont.)
|
It is noted that the capacity prices set in the 2026/2027 and 2027/2028 auctions, as shown above, were determined in accordance with the ceiling prices
approved by PJM and confirmed by the FERC or for these two capacity auctions (with the necessary adjustments). In addition, the capacity coefficients for combined cycle gas plants were updated which led to a decrease in the availability capacity
that is provided for sale by the CPV Group’s natural‑gas power plants of this type from about 96% to about 79% (in the 2025/2026 auction) and from about 79% to about 74% (in the 2026/2027 auction and thereafter). It is further noted that based on
PJM publications, the theoretical prices derived from the results of the auctions, had it not been for the said ceiling, would have been about $389 and about $530 per megawatt/day, respectively.
Subject to additional changes in the timetables, if any, as at the approval date of the report, the next PJM capacity auction for the 2028/2029 capacity
year is planned for June 2026.
The significant increase in the capacity tariffs in the latest auctions, as shown in the table above, relates to, among other things, a continuing increase
in electricity demand, anticipated growth in future demand, higher reserve requirements, and a decline in the aggregate supply due to a change in the methods used to calculate capacities and demand capability of PJM’s generation sources.
Critical Issue Fast-Track Process (CIFP) – in January 2026, the PJM Council published a letter whereby it determined that the results of the latest
capacity auctions reflect a continually increasing disparity between supply and demand, which requires taking corrective measures in order to maintain the reliability of the system, against the background of a quick increase in energy demand,
including new large load connections. Accordingly, in January 2026, PJM’s management was directed to advance an accelerated process (CIFP) and to examine a series of interim steps, subject to regulatory approvals, including improvement of the
demand forecasts, advancements of avenues for accelerated connection of new generation (including a “Bring Your Own Generation” model), expansion of demand‑related response mechanisms, operation of an RBP emergency mechanism for procurement of
additional capacity as a reliability back‑up for the 2027/2028 period, examination of extension of maximum ceilings and minimum floors (collar) for two additional auctions, and broad examination of investment incentives and market design. For
additional details – see Section 1.2.1.8A of Part A of the Periodic Report.
At the end of February 2026, PJM filed a request at FERC to extend the administrative price collars for the 2028/2029 and 2029/2030 capacity auctions. The tariff revisions
will require FERC approval to be implemented, which as at the date of the report had not yet been received.
Separately, in the “Statement of Principles regarding PJM” document published by authorities in the Federal government and by a number state governors, PJM
was called on to comply with the Reliability Backstop Auction (an emergency capacity auction for purposes of backing up the system’s reliability) no later than September 2026 for new resources, including long‑term reliability contracts covering a
period of up to about 15 years. Pursuant to the results of the latest auction, the minimum requirement for additional available capacity in the PJM market, in order to ensure the system’s reliability, is estimated at about 6.5 gigawatts.
Nonetheless, in light of the continuing rise in the demand for electricity, the scope of the new capacity in the PJM market in the upcoming years could well be considerably higher.
At this stage, these measures are under review, and there is no certainty regarding the manner of their implementation, their scope, or their timetable.
Therefore, their long-term impact on the availability market and on the results of future tenders cannot be fully assessed.
23
---Unofficial translation for convenience purposes---
OPC Energy Ltd.
Report of the Board of Directors
| 3. |
Main Developments in the Business and Regulatory Environment in the U.S. (Cont.)
|
| C. |
Capacity revenues (Cont.)
|
NYISO market
Similar to the PJM market, in the NYISO market capacity payments are made in the framework of a central mechanism for acquisition of capacity. In the NYISO
market, there are a number of submarkets, wherein there could be various capacity demands as a function of local supply and demand and transmission capability. NYISO makes seasonal auctions every spring for the upcoming summer (the months of May
through October) and in the fall for the upcoming winter (the months of November through April). In addition, there are supplemental monthly auctions for the balance of the capacity not sold in the seasonal auctions. The power plants are
permitted to assure the capacity tariffs in the seasonal auction, the monthly auction or through bilateral sales.
Set forth below are the capacity prices determined in the seasonal auctions in the NYISO market (the prices are denominated in dollars per megawatt per
day):
|
Sub-Area
|
CPV
Power
Plants
|
Winter
2025/2026
|
Summer
2025
|
Winter 2024/2025
|
Summer
2024
|
|
NYISO
Rest of the Market
|
–
|
89.83
|
153.26
|
66.30
|
168.91
|
|
Lower Hudson Valley
|
Valley
|
89.83
|
153.26
|
66.30
|
168.91
|
Source: NYISO – Converted from dollars for kilowatt per month to dollars for megawatt per day.
It is noted that the Valley power plant is located in Area G (Lower Hudson Valley) and the actual capacity prices for the Valley power plants are impacted
by the seasonal auctions, the monthly auctions and the SPOT prices, with variable capacity prices every month, as well as bilateral agreements with energy suppliers in the market.
24
---Unofficial translation for convenience purposes---
OPC Energy Ltd.
Report of the Board of Directors
| 3. |
Main Developments in the Business and Regulatory Environment in the U.S. (Cont.)
|
| C. |
Capacity revenues (Cont.)
|
ISO‑NE market
The Towantic power plant, which operates in this market, participated for the first time in a capacity auction for 2018–2019 at a price of $313.97 MW/day
and determination of the tariff for seven years in respect of 725 megawatts linked to the Handy-Whitman Price Index, which applied up to May 2025.
In general, ISO‑NE executes forward auctions for a period of one year, commencing from June 1, three years from the year of the auction. In addition, there
are supplementary monthly and annual auctions for the balance of the capacity not sold in the forward auctions. The power plants are permitted to guarantee the capacity payments in the forward auctions, the supplementary auctions or through
bilateral sales. For details regarding the planned reform in the capacity market – see Section 8.1.2.1C of Part A of the Periodic Report.
Set forth below are the capacity payments determined in the sub‑regions that are relevant to the Towantic power plant (the prices are denominated in dollars
per megawatt per day):
|
Sub-Region
|
CPV Power Plants
|
2027/2028
|
2026/2027
|
2025/2026
|
|
ISO-NE
Rest of the Market
|
Towantic
|
117.70
|
85.15
|
85.15
|
Source: NE‑ISO – the Company’s processing in order to convert from dollars for kilowatt per month to dollars for megawatt per day.
It is noted that the actual capacity prices for the Towantic power plant are impacted by forward auctions, supplementary annual auctions, monthly auctions
with capacity prices that change every month and bilateral agreements with energy suppliers in the market.
| D. |
Changes in the government’s policies (including with respect to Customs duty (tariffs)) and legislation of the One Big Beautiful Bill in the U.S. – the commencement of the new Trump administration has introduced recent policy
changes that have created uncertainty along with significant opportunities in the U.S. energy sector. Since January 2025, orders and directives have been issued and legislation has been enacted supporting reduction of the government’s
support in the area of renewable energy, including matters related to eligibility for tax incentives (ITC and PTC), among other things, as detailed below and in Section 8.1.3.1 of Part A of the Periodic Report.
|
Furthermore, President Trump has imposed tariffs (some of which have been updated and are expected to continue to be updated later on) on imported equipment
and raw materials (including, steel and solar panels) into the U.S., and is carrying on negotiations with respect to new trade agreements with foreign countries, in such a manner that there is uncertainty regarding the full extent of the impacts
of the said orders or new trade agreements on the costs of the equipment for the projects. It is noted that the said update of the tariffs leads to an increase in the equipment costs (both in the areas of renewable‑energy and natural‑gas) and to
disruptions in the supply chain and could, ultimately, lead to an increase in the construction or maintenance costs of projects25.
| 25 |
That stated in this Section above constitutes “forward‑looking” information, as it is defined in the Securities Law, which is based solely on the Company’s estimates as at the approval date of the
report, which are subject to uncertainty and changes that are not under the Company’s control. The policies (present or additional) of the U.S. government could have a negative impact (even a significant one) on advancement and/or
benefits with respect to renewable energy projects and the costs of equipment, services and shipping for the projects and power plants in the U.S. In addition, such changes could have macro impacts on the Company’s activity markets.
|
25
---Unofficial translation for convenience purposes---
OPC Energy Ltd.
Report of the Board of Directors
| 3. |
Main Developments in the Business and Regulatory Environment in the U.S. (Cont.)
|
| D. |
Changes in the government’s policies (including with respect to Customs duty (tariffs)) and legislation of the One Big Beautiful Bill in the U.S (Cont.)
|
On February 20, 2026, the U.S. Supreme Court ruled that the President does not have general authority to impose the said tariffs and,
therefore, their future validity and scope are not certain at this stage. Along with that stated, various sectorial tariffs are continuing to apply, including tariffs at a rate of up to 50% on certain categories of steel, aluminum and their
products.
On July 4, 2025, a comprehensive federal law known as the “One Big Beautiful Bill” (hereinafter in this Section – “the Law”) was passed
into law, which includes, among other things, legislative changes in all that relating to the set of federal tax benefits, which are mainly relevant to the renewable energy activities of the CPV Group in the U.S. regarding the entitlement to ITC
and PTC. For details regarding the Law, the “safe harbor” rules and U.S. income tax (IRS) provisions regarding the term “start of the construction” in the framework of these items – see Section 8.1.3.1 of Part A of the Periodic Report.
In the estimation of the CPV Group, as at the approval date of the report: (A) regarding the activities of the CPV Group in the natural
gas area, including future potential for addition of carbon capture, the said directives should have a positive impact on the general sentiment, the business environment and the feasibility of the investments; and (B) regarding the activities of
the CPV Group in the renewable energies area, the Law and the said directives are not expected to have a negative impact on its active projects, its projects under construction, projects in the advanced development stage and some of the projects
in the initial development stage, which in the estimation of the CPV Group should be entitled to tax benefits under the new legislation. Concerning projects in the initial development stage that will not be entitled to tax benefits under the new
legislation, in the estimation of the CPV Group as at the approval date of the report, continuing demand for electricity from renewable energy should support an increase in the electricity prices along with a possible decline in the equipment
prices and possible changes in government policies, could fully or partly compensate for the impact of cancellation of the tax benefits and, thus, reduce the impact of the Law on the economic worthwhileness of the said projects. Nonetheless,
there could be delays in the development of projects in such a manner that the Law could have an unfavorable impact on the projected start dates of the construction26. For additional details – see Section 6C(2) below.
The CPV Group is continuing to monitor the changes being advanced by the Trump Administration and to examine their impacts. For
additional details – see Sections 8.1.3.1 and 8.1.4O of Part A of the Periodic Report.
| 26 |
That stated above regarding the absence of a negative impact of the new legislation on the list of projects in the advanced development stage, and relating to the demand for renewable energies and an
increase in prices (and scope), a decline in the equipment prices and/or reduction of the impacts of the Law on renewable energy projects, constitutes “forward‑looking” information as it is defined in the Securities Law, which is based
on the estimates of the CPV Group as at the approval date of the report and on an assumption regarding high demand for renewable energies on the part ofsignificant consumers, and regarding which there is no certainty they will be
realized or the manner of their realization. As part of the process of internalizing the legislation (including updates, if any, or changes in other regulations) there could be changes in the sector the results of which will be
different than the said estimates, including changes that could have a significant negative impact, including on projects of the CPV Group in the area. As at the approval date of the report, the said estimates are subject to changes
(including due to specific circumstances of the projects on the list of the awaiting projects of the CPV Group).
|
26
---Unofficial translation for convenience purposes---
OPC Energy Ltd.
Report of the Board of Directors
| 4. |
Analysis of the results of operations for the Year Ended December 31, 2025 (in millions of NIS)
|
| A. |
Consolidated statement of income
|
|
For the Year Ended
|
||||||||
|
Section
|
December 31
|
|||||||
|
*2025
|
2024
|
|||||||
|
Revenues from sales and provision of services (1)
|
3,002
|
2,779
|
||||||
|
Cost of sales and provision of services (without depreciation and amortization) (2)
|
(2,263
|
)
|
(1,931
|
)
|
||||
|
Depreciation and amortization
|
(232
|
)
|
(317
|
)
|
||||
|
Gross profit
|
507
|
531
|
||||||
|
Share in earnings of associated companies
|
523
|
166
|
||||||
|
Compensation for lost revenues
|
16
|
44
|
||||||
|
Administrative and general expenses
|
(365
|
)
|
(263
|
)
|
||||
|
Business development expenses
|
(14
|
)
|
(45
|
)
|
||||
|
Gain on loss of control in the renewable energies segment in the U.S.
|
–
|
259
|
||||||
|
Other income (expenses), net
|
95
|
(56
|
)
|
|||||
|
Operating income
|
762
|
636
|
||||||
|
Financing expenses, net
|
(218
|
)
|
(252
|
)
|
||||
|
Loss from extinguishment of financial liabilities
|
–
|
(49
|
)
|
|||||
|
Income before taxes on income
|
544
|
335
|
||||||
|
Taxes on income expenses
|
(87
|
)
|
(138
|
)
|
||||
|
Net income for the year (3)
|
457
|
197
|
||||||
|
Attributable to:
|
||||||||
|
The Company’s shareholders
|
346
|
111
|
||||||
|
Holders of non‑controlling interests
|
111
|
86
|
||||||
| * |
Commencing from November 2024, as a result of deconsolidation of CPV Renewable and transition to the equity method of accounting, the Company has discontinued consolidation in the consolidated financial statements of the results of the
renewable energy segment in the U.S.
|
27
---Unofficial translation for convenience purposes---
OPC Energy Ltd.
Report of the Board of Directors
| 4. |
Analysis of the results of operations for the Year Ended December 31, 2025 (in millions of NIS) (Cont.)
|
| A. |
Consolidated statement of income (Cont.)
|
(1) Changes in revenues:
|
Revenues
|
For the
|
Board’s Explanations
|
|||||||
|
Year Ended
|
|||||||||
|
December 31
|
|||||||||
|
2025
|
2024
|
||||||||
|
Revenues in Israel
|
|||||||||
|
Revenues from sale of energy to private customers
|
1,271
|
1,368
|
A decrease, in the amount of about NIS 68 million, stemming from a decline in the consumption of customers compared with last year, among other
things in light of the “Rising Lion” operation and an additional decline, of about NIS 47 million, stemming from a decrease in the tariff for the generation component compared with the corresponding period last year.
|
||||||
|
Revenues from sale of energy to the System Operator and to other suppliers
|
181
|
165
|
|||||||
|
Revenues in respect of capacity payments
|
143
|
171
|
Most of the decrease compared with last year stems from a decline in the availability of the Zomet power plant. For additional details – see
Section 4C(1) below.
|
||||||
|
Revenues from sale of energy at cogeneration tariff
|
76
|
83
|
|||||||
|
Revenues from sale of steam
|
57
|
57
|
|||||||
|
Other revenues
|
2
|
23
|
Most of the decrease derives from discontinuance of the consolidation of Gnrgy at the end of second quarter of 2024.
|
||||||
|
Total revenues from sale of energy and others in Israel (without infrastructure services)
|
1,730
|
1,867
|
|||||||
|
Revenues from private customers in respect of infrastructure services
|
591
|
445
|
The increase stems mainly from an average increase in the tariffs at the rate of 40%.
|
||||||
|
Total revenues in Israel
|
2,321
|
2,312
|
|||||||
|
Revenues in the U.S.
|
|||||||||
|
Revenues from sale of electricity from renewable energy
|
–
|
195
|
The decrease derives mainly from discontinuance of consolidation of the renewable energies segment in November 2024, and transition to the
equity method of accounting.
|
||||||
|
Revenues from sale of electricity (Retail) activities
|
470
|
145
|
The increase stems mainly from an increase in the scope of the retail activities.
|
||||||
|
Revenues from provision of services and others
|
211
|
127
|
Most of the increase stems from a transition to the equity method of accounting in the renewable energies area and an increase in revenues from
provision of asset‑management services (which were previously eliminated in the consolidation).
|
||||||
|
Total revenues in the U.S.
|
681
|
467
|
|||||||
|
Total revenues
|
3,002
|
2,779
|
|||||||
28
---Unofficial translation for convenience purposes---
OPC Energy Ltd.
Report of the Board of Directors
| 4. |
Analysis of the results of operations for the Year Ended December 31, 2025 (in millions of NIS) (Cont.)
|
| A. |
Consolidated statement of income (Cont.)
|
| (2) |
Changes in the consolidated cost of sales and provision of services (not including depreciation and amortization):
|
|
Cost of Sales and
Provision of Services
|
For the
Year Ended
|
Board’s Explanations
|
|||||||
|
December 31
|
|||||||||
|
2025
|
2024
|
||||||||
|
Cost of sales in Israel
|
|||||||||
|
Natural gas and diesel oil
|
596
|
645
|
Most of the decrease is against the background of planned upgrading and maintenance work at the Rotem power plant in the fourth quarter of 2025.
|
||||||
|
Expenses in respect of acquisition of energy
|
274
|
320
|
Most of the decrease stems from a decline in customer consumption compared with the corresponding period last year due to, among other things,
the “Rising Lion” operation and the impact of planned and unplanned maintenance at the power plants in the period of the report and in the corresponding period last year.
|
||||||
|
Cost of transmission of gas
|
52
|
55
|
|||||||
|
Salaries and related expenses
|
43
|
46
|
|||||||
|
Operating expenses
|
117
|
120
|
|||||||
|
Other expenses
|
–
|
18
|
Most of the decrease stems from discontinuance of the consolidation of Gnrgy at the end of the second quarter of 2024.
|
||||||
|
Total cost of sales in Israel without infrastructure services
|
1,082
|
1,204
|
|||||||
|
Expenses in respect of infrastructure services
|
591
|
445
|
For details – see the explanation of the change in the revenues in respect of infrastructure services.
|
||||||
|
Total cost of sales in Israel
|
1,673
|
1,649
|
|||||||
|
Cost of sales and services in the U.S.
|
|||||||||
|
Cost of sales in respect of sale of electricity from renewable energy
|
–
|
60
|
The decrease stems from discontinuance of consolidation of the renewable energies segment in November 2024 and transition to the equity method
of accounting.
|
||||||
|
Cost of sales in respect of sale of electricity (Retail) and others
|
436
|
130
|
The increase stems mainly from an increase in the scope of the retail activities.
|
||||||
|
Cost of sales in respect of provision of services and others
|
154
|
92
|
Most of the increase stems from a transition to the equity method of accounting in the renewable energies area and an increase in costs related
to the provision of asset‑management services (which were previously eliminated in the consolidation).
|
||||||
|
Total cost of sales and provision of services in the U.S.
|
590
|
282
|
|||||||
|
Total cost of sales and provision of services
|
2,263
|
1,931
|
|||||||
29
---Unofficial translation for convenience purposes---
OPC Energy Ltd.
Report of the Board of Directors
| 4. |
Analysis of the results of operations for the Year Ended December 31, 2025 (in millions of NIS) (Cont.)
|
| A. |
Consolidated statement of income (Cont.)
|
| (3) |
Consolidated net income and consolidated adjusted net income
|
| 1. |
Definitions
|
Adjusted net income or loss – net income or loss in accordance with IFRS plus or minus other expenses and income, events of a non‑recurring nature,
such as, impairment losses and reversals and transactions that are not in the ordinary course of business.
It is emphasized that the said adjusted net income or loss item in this report is not an item that is recognized under IFRS or other generally accepted
accounting standards as an index for measuring financial performances and should not be considered as a substitute for income or loss or other terms provided pursuant to IFRS. It is possible that the Company’s definitions of adjusted income or
loss are different than those used by other companies. Nonetheless, the Company believes that the adjusted income or loss provides useful information to management and investors by eliminating certain sections that management believes do not
constitute an indication of the Company’s regular and ongoing business activities.
30
---Unofficial translation for convenience purposes---
OPC Energy Ltd.
Report of the Board of Directors
| 4. |
Analysis of the results of operations for the Year Ended December 31, 2025 (in millions of NIS) (Cont.)
|
| A. |
Consolidated statement of income (Cont.)
|
| (3) |
Consolidated net income and consolidated adjusted net income (Cont.)
|
| 2. |
Analysis of the change (in millions of New Israeli Shekels)
|
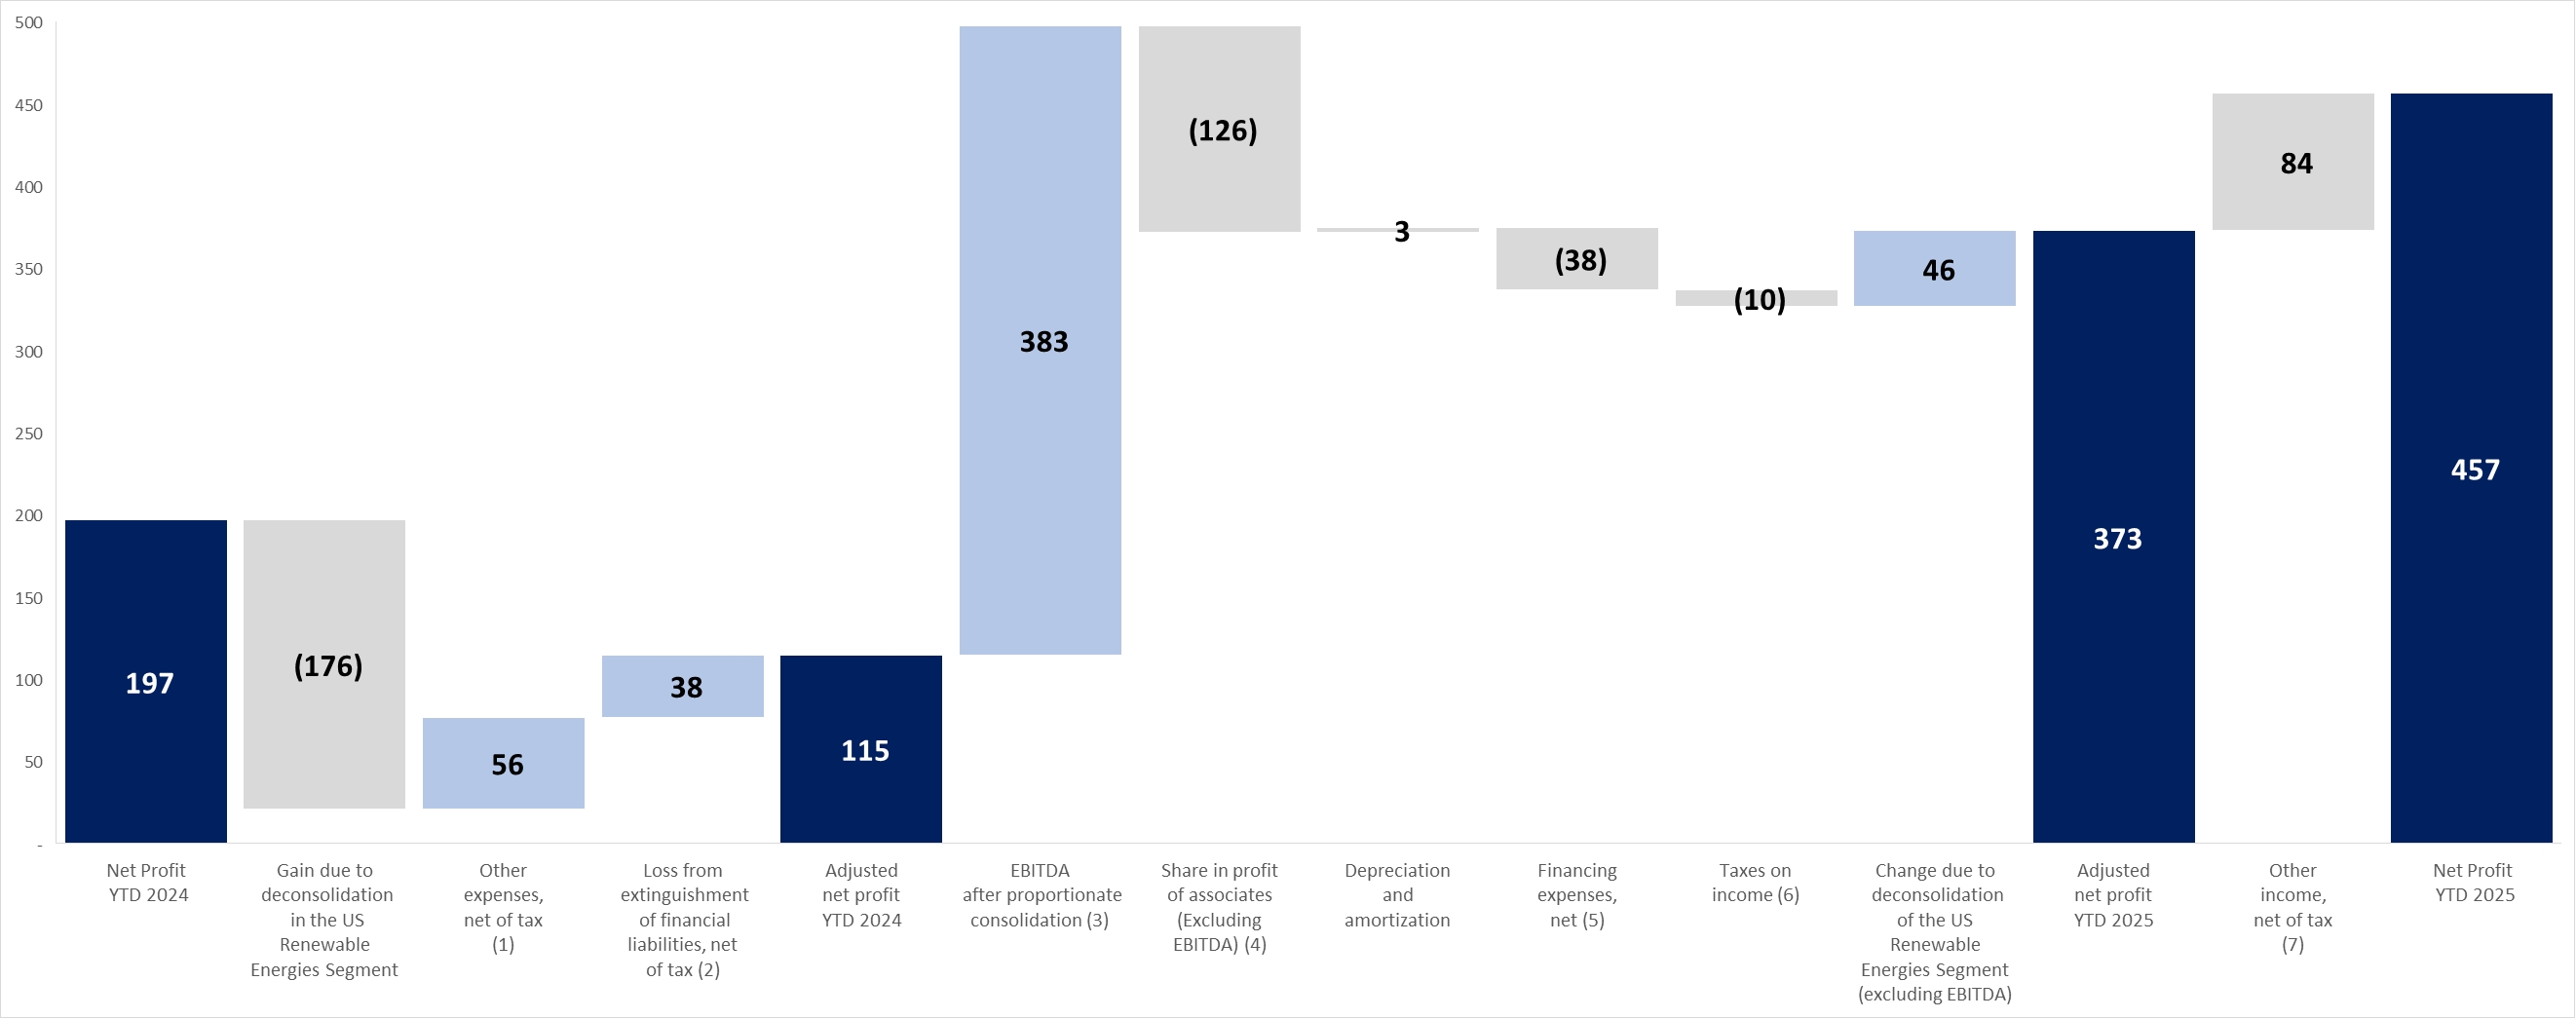
| (1) |
Mainly, a loss from impairment in value of the investment in Gnrgy in the corresponding period last year, in the amount of about NIS 21 million, of which there was an impairment loss in Hadera 2, in the amount of about NIS 31 million,
in light of the government’s original decision to reject the plan.
|
| (2) |
Including non‑recurring financing expenses in respect of repayment of the project credit in Zomet and Gat, in the amount of about NIS 49 million (about NIS 38 million, net of tax).
|
| (3) |
For an analysis of the change in the EBITDA after proportionate consolidation in the various segments in the period of the report compared with the corresponding period last year, see Sections B - E below.
|
| (4) |
Most of the increase stems from additional depreciation and financing expenses, in the amount of about NIS 172 million, due to increase in the rate of holdings in the Shore and Maryland power plants in the fourth quarter of 2024 and in
the beginning of the second quarter of 2025. This increase was partly offset, in the amount of about NIS 30 million, as a result of translation of the results of the associated companies from dollars into shekels (the Company’s functional
currency), due to a decline in the average shekel/dollar exchange rate in the period of the report compared with the corresponding period last year.
|
| (5) |
Most of the increase stems from an increase in the financing expenses as a result of the impact of the changes in the shekel/dollar exchange rate, in the amount of about NIS 83 million: (A) an increase in the financing expenses in the
period of the report, in the amount of about NIS 39 million; and (B) a decrease in the financing income, in the amount of about NIS 44 million, recognized in the corresponding period last year. On the other hand, there was an increase in
the financing income of about NIS 36 million due to an increase in interest on bank deposits and a decrease in financing expenses of about NIS 15 million mainly due to a decline in the expenses stemming from linkage differences in respect
of the debentures (Series B).
|
| (6) |
The increase in the tax expenses derives mainly from higher taxable income compared with the corresponding period last year.
|
| (7) |
(A) Cancellation of an impairment loss recognized by Hadera 2 in the third quarter of 2025, in the amount of about NIS 31 million, in light of plan approval by the government and (B) income, in the amount of about $15 million
(about NIS 51 million), in respect of development fees for the Basin Ranch power plant.
|
31
---Unofficial translation for convenience purposes---
OPC Energy Ltd.
Report of the Board of Directors
| 4. |
Analysis of the results of operations for the Year Ended December 31, 2025 (in millions of NIS) (Cont.)
|
| B. |
EBITDA, FFO (Funds From Operations) and net cash flows after debt service
|
| 1. |
Definitions
|
| – |
EBITDA indices
|
“EBITDA in the consolidated financial statements”27: net income (loss) for the period before depreciation and amortization,
financing expenses or income, net, taxes on income and other income (expenses), net.
“EBITDA after proportionate consolidation”: – “EBITDA in the consolidated financial statements” less the share of the income (loss) of associated
companies and plus a proportionate consolidation of the EBITDA of the associated companies based on the rate of the holdings of the CPV Group therein.
| – |
“FFO” (Funds From Operations) – with respect to active projects – cash flows from current operating activities for the period (including changes in working capital) and less investments in property, plant and equipment and
periodic maintenance costs that are not included in the operating activities and less net interest payments. With respect to the rest of the Group’s activities – cash flows from current operating activities for the period (including
changes in working capital) and less net interest payments (to the extent they do not relate to projects under construction). It is clarified that investments in property, plant and equipment (under construction and/or in development)
including the net interest payments in respect thereof, are not included in FFO.
|
| – |
“Net cash flows after service of debt” – the “FFO” less/plus payment of principal in respect of financial debt or taking out of project debt and non‑project debt (loans and/or debentures), and after adjustments for a change in
other credit from banks and a change in cash, including cash restricted for debt service and deposits.
|
The said non‑IFRS measures are not recognized as indices for measurement of financial performances and are not intended to be considered
a replacement for gross profit or loss and operating income, cash flows from operation activities or other terms relating to operating performances or liquidity indices in accordance with IFRS.
It is noted that the EBITDA indices are not intended to present an approximate of the free cash flows from the Group’s operating activities or to present
cash available for distribution of dividends or other uses (particularly in light of provisions of the project financing agreements for some of the Group’s power plants), since such cash may be used for debt service, capital investments, working
capital and other liabilities. Moreover, the EBITDA indices are characterized by restrictions that limit the use thereof as indices for analyzing the Company’s profitability, since they do not take into account certain income and expenses
deriving from the Company’s business that could have a material impact on its net income or loss, such as depreciation expenses, financing expenses or income and taxes on income.
| 27 |
It is clarified that income in respect of lost profits is included in EBITDA in the consolidated statements.
|
32
---Unofficial translation for convenience purposes---
OPC Energy Ltd.
Report of the Board of Directors
| 4. |
Analysis of the results of operations for the Year Ended December 31, 2025 (in millions of NIS) (Cont.)
|
| B. |
EBITDA, FFO (Funds From Operations) and net cash flows after debt service (Cont.)
|
| 1. |
Definitions (Cont.)
|
The Company believes that the data items “EBITDA after proportionate consolidation” and “FFO”28 provide useful and transparent information to
investors when reviewing the Company’s operating performances and current cash flows and when comparing such performances to performances of other companies in the same sector or in other industries (having different capital structures, different
levels of debt and/or different income tax rates) as well as when comparing performances between periods. It is noted that the “EBITDA after proportionate consolidation” data item also serves the Company’s management when analyzing the Company’s
performances.
The data item “net cash flows after debt service” provides additional information regarding the Group’s net cash flows that are available for its use for
purposes of growth and making of new investments, along with distribution of dividends to the shareholders (subject to compliance with the provisions of law, the trust certificates and non‑project financing agreements and in accordance with the
Company’s dividend distribution policy29).
| 28 |
It is noted that other companies might define EBITDA and FFO indices differently.
|
29 Pursuant to the Company’s dividend distribution policy, which was adopted by a decision of the Company’s Board of Directors in July 2017, it
was determined that the Company will distribute, subject to the provisions of law and the discretion of the Board of Directors, an annual dividend at the rate of at least 50% of the net after‑tax income. In 2024, the Company’s Board of Directors
decided to suspend implementation of the dividend distribution policy for a period of two years, in light of the Company’s growth strategy and the targets for expansion of its activities, while taking into account its business needs and
preservation of its financial strength. In the decision of the Company’s Board of Directors in March 2026, the suspension of the dividend distribution policy was extended for an additional at least two years, that is, up to March 2028, where at
the end of this period the Board of Directors will consider restarting of the said policy and the conformance thereof to the circumstances as they will be.
33
---Unofficial translation for convenience purposes---
OPC Energy Ltd.
Report of the Board of Directors
| 4. |
Analysis of the results of operations for the Year Ended December 31, 2025 (in millions of NIS) (Cont.)
|
| B. |
EBITDA, FFO (Funds From Operations) and net cash flows after debt service (Cont.)
|
| 2. |
Calculation of EBITDA
|
EBITDA calculations in the consolidated statement, including EBITDA after proportionate consolidation (in millions of NIS):
|
For the Year Ended
|
||||||||
|
December 31
|
||||||||
|
2025
|
2024
|
|||||||
|
Revenues from sales and provision of services
|
3,002
|
2,779
|
||||||
|
Cost of sales (without depreciation and amortization)
|
(2,263
|
)
|
(1,931
|
)
|
||||
|
Share in income of associated companies
|
523
|
166
|
||||||
|
Compensation for lost revenues
|
16
|
44
|
||||||
|
Administrative and general expenses (without depreciation and
|
||||||||
|
amortization)
|
(348
|
)
|
(247
|
)
|
||||
|
Business development expenses
|
(14
|
)
|
(45
|
)
|
||||
|
Consolidated EBITDA
|
916
|
766
|
||||||
|
Elimination of the share in income of associated companies
|
(523
|
)
|
(166
|
)
|
||||
|
Plus – Group’s share of the proportionate EBITDA of associated
|
||||||||
|
companies in the Energy Transition segment
|
1,093
|
592
|
||||||
|
Plus – Group’s share of the proportionate EBITDA of activities
|
||||||||
|
in the renewable energies segment in the U.S.*
|
105
|
16
|
||||||
|
EBITDA after proportionate consolidation
|
1,591
|
1,208
|
||||||
| * |
Due to completion of an investment transaction in the area of renewable energies in the U.S. in November 2024, starting from this date the data of this segment is calculated on the basis of a proportionate consolidation (instead of a
full consolidation up to that time) where the CPV Group’s share is about 66.7%.
|
34
---Unofficial translation for convenience purposes---
OPC Energy Ltd.
Report of the Board of Directors
| 4. |
Analysis of the results of operations for the Year Ended December 31, 2025 (in millions of NIS) (Cont.)
|
| B. |
EBITDA, FFO (Funds From Operations) and net cash flows after debt service (Cont.)
|
Set forth below is a breakdown of the EBITDA after proportionate consolidation data broken down by subsidiaries (on a consolidated basis) and the associated
companies (on a proportionate basis, based on the rate of the holdings of the CPV Group therein) as well as FFO and cash flows after service of debt data (in NIS millions):
|
For the year ended
|
For the year ended
|
|||||||||||||||||||||||||
|
Main projects in operation
|
Basis of
|
December 31, 2025
|
December 31, 2024
|
|||||||||||||||||||||||
|
presentation
|
Net cash
|
Net cash
|
||||||||||||||||||||||||
|
in the
|
EBITDA
|
flows
|
EBITDA
|
flows
|
||||||||||||||||||||||
|
Company’s
|
after
|
after
|
after
|
after
|
||||||||||||||||||||||
|
financial
|
proportionate
|
debt
|
proportionate
|
debt
|
||||||||||||||||||||||
|
statements
|
consolidation
|
FFO
|
service
|
consolidation
|
FFO
|
service
|
||||||||||||||||||||
|
Total operating projects in Israel and accompanying business activities (1) (2)
|
Consolidated
|
622
|
629
|
581
|
670
|
557
|
485
|
|||||||||||||||||||
|
Business development costs, headquarters in Israel and other costs (3)
|
Consolidated
|
(11
|
)
|
(135
|
)
|
(98
|
)
|
(31
|
)
|
(137
|
)
|
(73
|
)
|
|||||||||||||
|
Total Israel (4)
|
611
|
494
|
483
|
639
|
420
|
412
|
||||||||||||||||||||
|
Total operating projects (5)
|
Associated
|
1,098
|
819
|
334
|
592
|
385
|
388
|
|||||||||||||||||||
|
Other expenses
|
Consolidated
|
1
|
(10
|
)
|
(12
|
)
|
(4
|
)
|
(14
|
)
|
(14
|
)
|
||||||||||||||
|
Total energy transition in the U.S.
|
1,099
|
809
|
322
|
588
|
371
|
374
|
||||||||||||||||||||
|
Total operating projects (6)
|
Associated
|
125
|
69
|
11
|
142
|
74
|
14
|
|||||||||||||||||||
|
Business development and other costs
|
Associated
|
(20
|
)
|
(24
|
)
|
(24
|
)
|
(30
|
)
|
(23
|
)
|
(23
|
)
|
|||||||||||||
|
Total renewable energy in the U.S.
|
105
|
45
|
(13
|
)
|
112
|
51
|
(9
|
)
|
||||||||||||||||||
|
Total activities as part of the “others” segment (7)
|
Consolidated
|
(18
|
)
|
(26
|
)
|
(9
|
)
|
(22
|
)
|
(22
|
)
|
(22
|
)
|
|||||||||||||
|
Headquarters in the United States (8) (9) (10)
|
Consolidated
|
(181
|
)
|
27
|
27
|
(89
|
)
|
(61
|
)
|
(61
|
)
|
|||||||||||||||
|
Total United States
|
1,005
|
855
|
327
|
589
|
339
|
282
|
||||||||||||||||||||
|
Company headquarters (not allocated to the segments) (4) (8)
|
Consolidated
|
(25
|
)
|
(54
|
)
|
(76
|
)
|
(20
|
)
|
(41
|
)
|
(37
|
)
|
|||||||||||||
|
Total consolidated (11)
|
1,591
|
1,295
|
734
|
1,208
|
718
|
657
|
||||||||||||||||||||
| (1) |
The accompanying business activities in Israel include mainly virtual supply activities through OPC Israel, and sale/purchase of natural gas, including with third parties through OPC Natural Gas.
|
| (2) |
In the period of the report and in the corresponding period last year, the EBITDA of the active projects in Israel included non‑recurring events. For additional details – see Section 4C(1) below.
|
| (3) |
For purposes of comparison, the FFO and cash‑flow data after debt service for the activities in Israel were updated in the comparative data, such that the financial data for the headquarters in Israel includes payments of interest and
principal of the project credit in Zomet and Gat up to the early repayment date and refinancing of corporate credit in Israel during the third quarter of 2024.
|
| (4) |
Not including intercompany activities between the headquarters and the subsidiaries in Israel.
|
| (5) |
For details regarding active projects in the Energy Transition segment in the U.S. – see Section 4D(2) below.
|
| (6) |
Due to completion of the transaction for investment in the area of renewable energies in the U.S. in November 2024, the data of this segment in the U.S. is calculated from this date on the basis of proportionate consolidation where the
share of the CPV Group is 66.7%.
|
| (7) |
Includes mainly business development and other costs in the area of initiation and development of high‑efficiency natural gas-fired power plants, with future carbon capture potential, and the results of the retail activities in the
U.S.
|
| (8) |
After elimination of management fees between the CPV Group and the Company, in the amounts of about NIS 35 million and about NIS 32 million for the years ended December 31, 2025 and 2024, respectively.
|
| (9) |
Most of the change in the EBITDA in 2025 compared with 2024, in the amount of about NIS 115 million, relates to changes in the fair value of a profit participation plan for employees of the CPV Group, which fully vested in January 2026
(at the end of five years from the acquisition date of the CPV Group), and is expected to be completed at the end of the first quarter of 2026, in the amount of about $70 million (about NIS 223 million). In addition, the CPV Group intends
to adopt a new remuneration plan with terms substantially similar to those of the prior plan (with certain adjustments). For additional details – see Note 16C to the financial statements.
|
| (10) |
Most of the change in the FFO stems from development fees in the Basin Ranch power plant that were received in the fourth quarter of 2025.
|
| (11) |
In the year of the report, the consolidated FFO without adjustments for changes in the working capital was about NIS 1,171 million (last year – about NIS 682 million).
|
35
---Unofficial translation for convenience purposes---
OPC Energy Ltd.
Report of the Board of Directors
| 4. |
Analysis of the results of operations for the Year Ended December 31, 2025 (in millions of NIS) (Cont.)
|
| C. |
Analysis of the change in EBITDA and the generation data – Israel segment (Cont.)
|
| (1) |
Set forth below is an analysis of the change in EBITDA in the Israel segment in the period of the report compared with the corresponding period last year (in NIS millions):
|
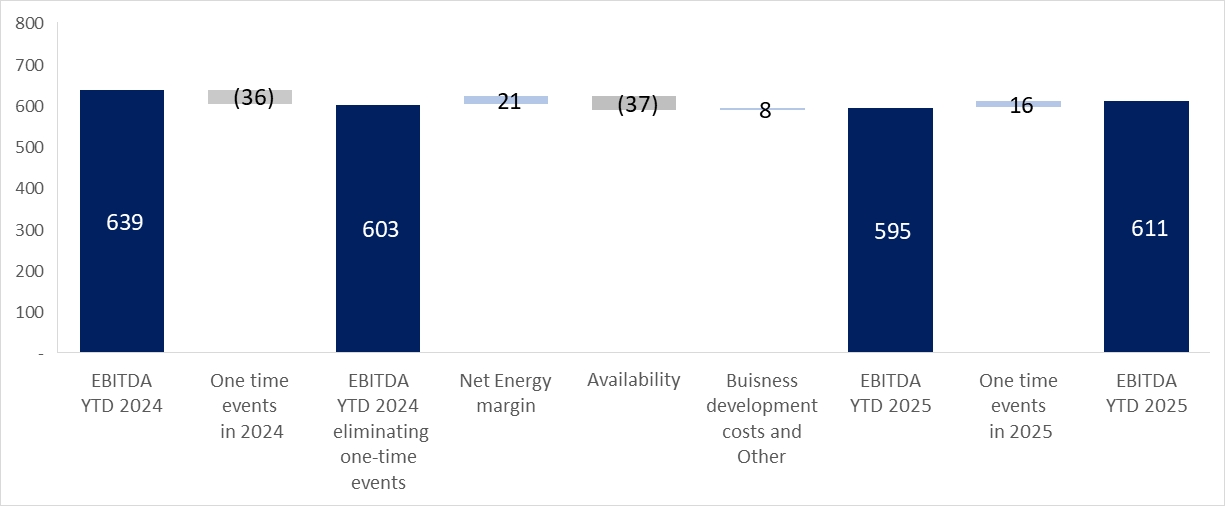
Energy margin – the increase stems mainly from optimization of the trade receivables, in the amount of about NIS 31 million, and a decline in the natural‑gas price, in
the amount of about NIS 21 million, mainly due to the weakening of the dollar against the shekel. On the other hand, there was a decrease of about NIS 31 million as a result of a decline in the generation component tariff.
Availability (operational) – (A) Zomet power plant – for purposes of reducing the risk of an operating failure due to a technical defect discovered and in coordination
with the contractor, as part of the process of clarifying and repairing the defect in 2025, the availability of the power plant was partially limited and maintenance work was performed along with gradual replacement of the generation units (for
details – see Section 4C(2) below). These factors had a negative impact on the power plant’s availability and, in turn, on its financial results. As at the approval date of the report, the Company estimates that the process of clarification and
repair of the defect, including replacement of the generation units, is expected to be mostly completed by the end of 2026, and it also estimates that the said partial capacity, which is expected to be 65%–70% of the power plant’s
capacity (similar to the capacity in 2025), will negatively affect the EBITDA in 202630. (B) Rotem power plant - During the fourth quarter of 2025, the Rotem power plant was shut down for planned upgrading and maintenance work, at an
estimate cost of about NIS 133 million. As a result, Rotem’s operating results were negatively impacted. (C) In the corresponding period last year the Rotem, Hadera and Gat power plants were shut down for various periods of time for purposes of
planned and unplanned maintenance work that had a negative impact on their results in the corresponding period last year.
30 The aforesaid regarding rectification of the defect (including the duration thereof) and/or the estimate of
the scope of the partial capacity and its impact constitutes “forward-looking” information as defined in the Securities Law. In practice, delays or difficulties may occur in completing the examination and/or the required rectifications beyond
the aforementioned timelines and/or additional operational limitations/shutdowns (full or partial) may occur, inter alia, as a result of technical factors, operational failures, factors related to the contractor, the transportation of equipment
and/or the performance of work, and accordingly may affect the availability (capacity) of the station in such a manner that could increase the scope of the partial capacity limitation, the removal of capacity limitations and the completion of
the rectification, the duration of the rectification and/or the impact of the availability limitation on the Company’s EBITDA. For further details regarding the implications of the availability limitation, see Section 7.13 of Part A of the
Periodic Report
36
---Unofficial translation for convenience purposes---
OPC Energy Ltd.
Report of the Board of Directors
| 4. |
Analysis of the results of operations for the Year Ended December 31, 2025 (in millions of NIS) (Cont.)
|
| C. |
Analysis of the change in EBITDA and the generation data – Israel segment (Cont.)
|
| (1) |
Set forth below is an analysis of the change in EBITDA in the Israel segment in the period of the report compared with the corresponding period last year (in NIS millions): (Cont.)
|
Non‑recurring events – (A) In 2025, mainly insurance compensation for lost profits at the Gat and Hadera power plants in prior years, in the
aggregate amount of about NIS 16 million; (B) in 2024, mainly in respect of compensation from the construction contractor of the Zomet power plant, in the amount of about NIS 26 million (about $7 million); in respect of lost profits caused by a
delay in the date of the commercial operation and non‑recurring compensation from the insurers of Hadera power plant, in the amount of about NIS 18 million (about $5 million) in connection with lost profits preceding the commercial operation.
| (2) |
Set forth below is detail regarding the generation at the power plants in the Israel segment:
|
|
For the Year Ended December 31, 2025
|
For the Year Ended December 31, 2024
|
|||||||||||||||||||||||||||||||||||
|
Actual
|
Actual
|
|||||||||||||||||||||||||||||||||||
|
Potential
|
Net
|
Actual
|
calculated
|
Potential
|
Net
|
Actual
|
calculated
|
|||||||||||||||||||||||||||||
|
electricity
|
electricity
|
generation
|
availability
|
electricity
|
electricity
|
generation
|
availability
|
|||||||||||||||||||||||||||||
|
Capacity
|
generation
|
generation
|
percentage
|
percentage
|
generation
|
generation
|
percentage
|
percentage
|
||||||||||||||||||||||||||||
|
(MW)
|
(GWh)
|
(GWh)
|
(%)
|
(%)
|
(GWh)
|
(GWh)
|
(%)
|
(%)
|
||||||||||||||||||||||||||||
|
Rotem (A)
|
466
|
3,736
|
3,073
|
82.3
|
%
|
83.7
|
%
|
3,736
|
3,332
|
89.2
|
%
|
95.1
|
%
|
|||||||||||||||||||||||
|
Hadera (B)
|
144
|
1,019
|
970
|
95.2
|
%
|
96.1
|
%
|
1,048
|
943
|
90.0
|
%
|
92.6
|
%
|
|||||||||||||||||||||||
|
Gat (C)
|
75
|
620
|
503
|
81.1
|
%
|
91.6
|
%
|
616
|
397
|
64.4
|
%
|
64.4
|
%
|
|||||||||||||||||||||||
|
Zomet (C)
|
396
|
3,171
|
291
|
9.2
|
%
|
67.1
|
%
|
3,268
|
428
|
13.1
|
%
|
83.6
|
%
|
|||||||||||||||||||||||
Definitions:
| – |
The generation potential is the net generation capability adjusted for temperature and humidity.
|
| – |
The actual net generation in the period.
|
| – |
The actual generation percentage is the net electricity generated divided by the generation potential.
|
Significant operating events31:
| A. |
During the fourth quarter of 2025, the Rotem power plant was shut down for planned upgrading and maintenance work.
|
| B. |
In 2026, a planned shutdown is anticipated for part of the power plant for purposes of upgrading and maintenance work that is expected to last for about a month. In addition, Hadera is taking action to repair the technical defect found
in the power plant proximate to the approval date of the report, where at this stage and up to completion of the repair, generation of the electricity at the power plant is continuing while utilizing most of the generation capability.
Hadera is taking action to repair the defect in the upcoming months, where the said event is not expected to have a significant long‑term impact on Hadera’s results, taking into account the insurance coverage under the power plant’s
policy.
|
| C. |
In 2026, a planned shutdown is anticipated for the power plant for purposes of upgrading and maintenance work that is expected to last for about a month.
|
| D. |
The generation potential presented in the above table does not include the temporary generation limitation that applied in the period of the report to each of the generation units. In addition, in the period of the report some of the
generation units were replaced due to the maintenance work. For details – see Section 4C(1) above.
|
31That stated regarding expected maintenance. completion thereof (including repair of the defect at Hadera,
its impact and/or the insurance coverage) and/or the period of time required for the completion thereof constitutes “forward‑looking” information as it is defined in the Securities Law, regarding which there is no certainty it will materialize.
Ultimately, maintenance, as stated (and unplanned maintenance that could be caused), could continue beyond the expected date, this being as a result of, among other things, operating factors, technical breakdowns, constraints relating to
maintenance and equipment contractors and the timetables for receipt (arrival) of the relevant equipment. Delays and/or failures in completion of the maintenance have a negative impact on the power plant’s operating results.
37
---Unofficial translation for convenience purposes---
OPC Energy Ltd.
Report of the Board of Directors
| 4. |
Analysis of the results of operations for the Year Ended December 31, 2025 (in millions of NIS) (Cont.)
|
| D. |
Analysis of the change in EBITDA, the generation data, energy hedges and capacity – Energy Transition segment in the U.S.
|
| (1) |
Set forth below is an analysis of the change in the EBITDA after proportionate consolidation in the Energy Transition segment in the period of the report compared with the corresponding period last year (in millions of NIS):
|
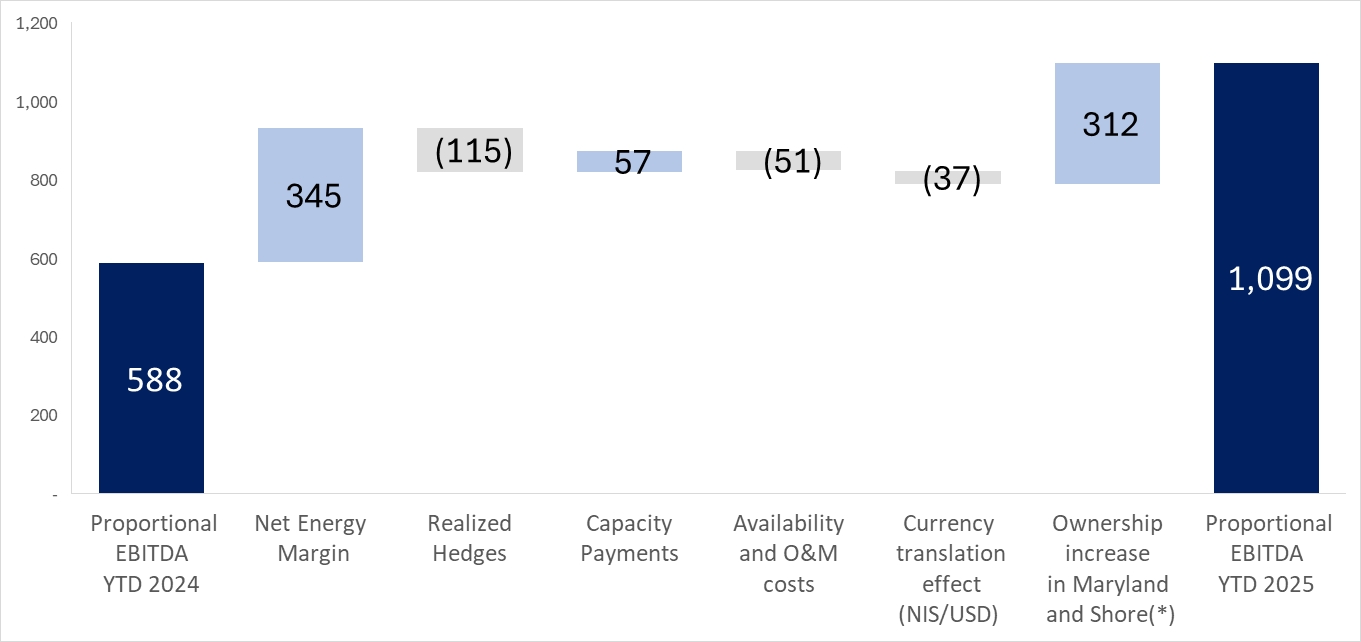
Energy and hedging margins – as detailed in Section 3A above, in the period of the report there was a significant increase in
the electricity margins compared with the corresponding period last year and, accordingly, there was an increase in the energy margins of the CPV Group (without the impact of the increase in the holdings in the Maryland and Shore power plants),
which was partly offset by hedges realized at a lower margin in the period of the report compared with the corresponding period last year.
Capacity revenues – most of the increase stems from an increase in the capacity tariff in the PJM market starting from June
2025. This increase was partly offset by a decrease in the capacity tariff of the Towantic power plant starting from June 2025 – this being as a result of conclusion of the fixed-rate (of seven years) wherein the capacity tariff was fixed in
advance from Towantic’s operation date. For details – see Section 3C above.
Operating and capacity expenses (operational) – most of the increase stems from planned maintenance work at the Valley power
plant in the fourth quarter of 2025.
Increase in the rate of holdings – reflects the impact of the increase in the holdings in the fourth quarter of 2024 in the
Maryland and Shore power plants and in the beginning of the second quarter of 2025 in the Shore power plant. It is noted that subsequent to the date of the report, a transaction was completed for acquisition of the remaining 11% of the Shore
power plant, and after its completion the CPV Group holds 100% of the ownership rights in Shore.
38
---Unofficial translation for convenience purposes---
OPC Energy Ltd.
Report of the Board of Directors
| 4. |
Analysis of the results of operations for the Year Ended December 31, 2025 (in millions of NIS) (Cont.)
|
| D. |
Analysis of the change in EBITDA, the generation data, energy hedges and capacity – Energy Transition segment in the U.S. (Cont.)
|
| (2) |
Analysis of the Group’s share in the proportionate EBITDA, FFO and net cash flows after service of project debt of associated companies by project in the Energy Transition segment (in millions of NIS):
|
|
For the year ended December 31, 2025
|
Fairview
|
Towantic
|
Maryland*
|
Shore*
(1)
|
Valley
|
Three
Rivers
|
Total
|
|||||||||||||||||||||
|
Rate of holdings of the CPV Group
|
25%
|
26%
|
75%
|
89%
|
50%
|
10%
|
||||||||||||||||||||||
|
Revenues from sales of energy
|
275
|
310
|
766
|
520
|
528
|
91
|
2,490
|
|||||||||||||||||||||
|
Cost of natural gas
|
127
|
199
|
321
|
275
|
198
|
49
|
1,169
|
|||||||||||||||||||||
|
Carbon emissions tax (RGGI)
|
–
|
36
|
117
|
86
|
70
|
–
|
309
|
|||||||||||||||||||||
|
Cost of sales – other expenses (without depreciation and amortization)
|
2
|
4
|
17
|
14
|
9
|
1
|
47
|
|||||||||||||||||||||
|
Gain (loss) on realization of transactions hedging the electricity margins
|
3
|
(14
|
)
|
(37
|
)
|
19
|
(24
|
)
|
9
|
(44
|
)
|
|||||||||||||||||
|
Net energy margin
|
149
|
57
|
274
|
164
|
227
|
50
|
921
|
|||||||||||||||||||||
|
Revenues from capacity payments
|
40
|
63
|
100
|
118
|
58
|
19
|
398
|
|||||||||||||||||||||
|
Other income
|
3
|
24
|
24
|
17
|
3
|
3
|
74
|
|||||||||||||||||||||
|
Gross profit
|
192
|
144
|
398
|
299
|
288
|
72
|
1,393
|
|||||||||||||||||||||
|
Fixed costs (without depreciation and amortization)
|
15
|
22
|
51
|
67
|
79
|
14
|
248
|
|||||||||||||||||||||
|
Administrative and general expenses (without depreciation and amortization)
|
5
|
5
|
10
|
12
|
8
|
2
|
42
|
|||||||||||||||||||||
|
Loss from revaluation of unrealized hedging transactions
|
(1
|
)
|
–
|
(1
|
)
|
–
|
–
|
(3
|
)
|
(5
|
)
|
|||||||||||||||||
|
Group’s share in EBITDA after proportionate consolidation in the Energy Transition segment
|
171
|
117
|
336
|
220
|
201
|
53
|
1,098
|
|||||||||||||||||||||
|
Group’s share in FFO
|
140
|
99
|
293
|
78
|
167
|
42
|
819
|
|||||||||||||||||||||
|
Group’s share in net cash flows after service of project debt
|
(3)271 |
|
105
|
135
|
(2)(223) |
|
16
|
30
|
334
|
|||||||||||||||||||
| (1) |
At the Shore power plant – gas transmission costs (totaling in the period of the report of about NIS 46 million) are classified in accordance with IFRS 16 as depreciation expenses and, accordingly, are not included in the EBITDA.
|
| (2) |
The net cash flows after service of the project debt in Shore includes partial repayment of debt that was made as part of the refinancing made in February 2025. For additional details – see Section 7A(5) below.
|
| (3) |
The net cash flows after debt service in Fairview include additional project financing as part of the financing agreement amendment in the fourth quarter of 2025, as detailed in Section 7A(3) below, which was distributed as a dividend
to the partners in the project. The CPV Group’s share amounted to about $54 million (about NIS 179 million).
|
| (4) |
The financing agreements for the CPV Group include “cash sweep” mechanisms, in which all or part of the free cash flows of the projects is designated for repayment of loan principal on a current basis along with a predetermined minimum
repayment schedule for each long‑term loan. This mechanism allows for faster repayments if certain events occur and also places restrictions on distributions to shareholders.
|
| (*) |
In line with the Company’s strategy to gain control over some of the active power plants of the CPV Group, transactions were completed in the fourth quarter of 2024 and in the second quarter of 2025 that led to an increase in the rates
of holdings in the Maryland power plant (from 25% to 75%) and the Shore power plant (from 38% to 89%) as at the date of the report and to 100% after the date of the report.
|
39
---Unofficial translation for convenience purposes---
OPC Energy Ltd.
Report of the Board of Directors
| 4. |
Analysis of the results of operations for the Year Ended December 31, 2025 (in millions of NIS) (Cont.)
|
| D. |
Analysis of the change in EBITDA, the generation data, energy hedges and capacity – Energy Transition segment in the U.S. (Cont.)
|
| (2) |
Analysis of the Group’s share in the proportionate EBITDA, FFO and net cash flows after service of project debt of associated companies by project in the Energy Transition segment (in millions of NIS): (Cont.)
|
|
For the year ended December 31, 2024
|
Fairview
|
Towantic
|
Maryland
|
Shore
(1)
|
Valley
|
Rivers
|
Total
|
|||||||||||||||||||||
|
Rate of holdings of the CPV Group
|
25%
|
26%
|
75%
|
68
|
50%
|
10%
|
||||||||||||||||||||||
|
Revenues from sales of energy
|
206
|
217
|
185
|
155
|
352
|
61
|
1,176
|
|||||||||||||||||||||
|
Cost of natural gas
|
91
|
98
|
73
|
73
|
127
|
36
|
498
|
|||||||||||||||||||||
|
Carbon emissions tax (RGGI)
|
–
|
41
|
33
|
47
|
80
|
–
|
201
|
|||||||||||||||||||||
|
Cost of sales – other expenses (without depreciation and amortization)
|
2
|
4
|
8
|
6
|
7
|
2
|
29
|
|||||||||||||||||||||
|
Gain (loss) on realization of transactions hedging the electricity margins
|
21
|
(12
|
)
|
(3
|
)
|
14
|
47
|
17
|
84
|
|||||||||||||||||||
|
Net energy margin
|
134
|
62
|
68
|
43
|
185
|
40
|
532
|
|||||||||||||||||||||
|
Revenues from capacity payments
|
18
|
122
|
16
|
19
|
58
|
4
|
237
|
|||||||||||||||||||||
|
Other income
|
4
|
6
|
9
|
6
|
3
|
2
|
30
|
|||||||||||||||||||||
|
Gross profit
|
156
|
190
|
93
|
68
|
246
|
46
|
799
|
|||||||||||||||||||||
|
Fixed costs (without depreciation and amortization)
|
14
|
21
|
28
|
28
|
76
|
13
|
180
|
|||||||||||||||||||||
|
Administrative and general expenses (without depreciation and amortization)
|
5
|
4
|
5
|
5
|
8
|
2
|
29
|
|||||||||||||||||||||
|
Gain (loss) from revaluation of unrealized hedging transactions
|
10
|
(1
|
)
|
(1
|
)
|
(6
|
)
|
–
|
–
|
2
|
||||||||||||||||||
|
Group’s share in proportionate EBITDA in the Energy Transition segment
|
147
|
164
|
59
|
29
|
162
|
31
|
592
|
|||||||||||||||||||||
|
Group’s share in FFO
|
106
|
157
|
21
|
18
|
68
|
15
|
385
|
|||||||||||||||||||||
|
Net cash flows after service of project debt
|
(2)289
|
|
65
|
8
|
17
|
(1
|
)
|
10
|
388
|
|||||||||||||||||||
| (1) |
At the Shore power plant – gas transmission costs (totaling in the corresponding period last year about NIS 22 million) are classified in accordance with IFRS 16 as depreciation expenses and, accordingly, are not included in the
EBITDA.
|
| (2) |
The net cash flows after debt service in Fairview include additional project financing as part of a refinancing made in the third quarter of 2024 which was distributed as a dividend to the partners in the project. The CPV Group’s share
amounted to about NIS 246 million.
|
| (3) |
It is noted that the increase in the rates of holdings in the Shore power plant (from about 37.5% to about 68.8%) and in the Maryland power plant (from about 25% to about 75%) in the fourth quarter of 2024, did not have a significant
impact on the results of the Energy Transition segment in the U.S. in 2024.
|
40
---Unofficial translation for convenience purposes---
OPC Energy Ltd.
Report of the Board of Directors
| 4. |
Analysis of the results of operations for the Year Ended December 31, 2025 (in millions of NIS) (Cont.)
|
| D. |
Analysis of the change in EBITDA, the generation data, energy hedges and capacity – Energy Transition segment in the U.S. (Cont.)
|
| (3) |
Additional details regarding energy hedges and guaranteed capacity payments in the Energy Transition segment in the U.S.
|
As part of its policy for management of the exposures, the CPV Group is in the practice, from time to time, of entering into hedging
agreements, which are designed to reduce the fluctuations in the electricity margins. In addition, the capacity revenues for the nominal capacity of the natural gas-fired power plants are determined for certain future periods, as detailed in
Section 3A above.
Set forth below is the scope of the hedging for 2026 as at the date of the report32:
|
2026
|
|
|
Expected generation (MWh) *
|
12,126,000
|
|
Net scope of the hedged energy margin (% of the expected generation of the power plants) **
|
73%
|
|
Net hedged energy margin (millions of $)
|
≈ 165
(≈ NIS 570 million)
|
|
Net hedged energy margin ($/MWh)
|
18.6
|
|
Net market prices of energy margin ($/MWh) ***
|
19.4
|
| * |
The expectation for the generation including adjustments in respect of planned and unplanned maintenance work, including the Fairview power plant. Loss of the said generation is expected to be mostly covered by insurance. For
additional details – see Section 4 below.
|
| ** |
Pursuant to the policy for hedging electricity margins as at the date of the report, in general the CPV Group seeks to hedge about 50% of the scope of the expected generation. The actual hedge rate could ultimately be different,
depending on the market factors.
|
| *** |
The net energy margin is the energy margin (Spark Spread) plus/minus Power Basis less carbon tax (RGGI) and other variable costs. For details regarding the manner of calculation of the electricity margin (Spark Spread) – see Section 3A
above. The market prices of the net energy margin are based on future contracts for electricity and natural gas.
|
32 The estimated percentages and the actual hedged energy margins could change due to the execution of new hedges, capacity sales, changes in
market conditions, or modifications to the CPV Group’s hedging policy. That stated in this Section with respect to the energy margin and availability receipts constitutes “forward‑looking” information as it is
defined in the Securities Law, which may change due to, among other things, operating factors and availability of the power plant, market conditions, regulatory changes and/or occurrence of one or more of the risk factors as stated in
Section 19 of Part A of the Periodic Report.
41
---Unofficial translation for convenience purposes---
OPC Energy Ltd.
Report of the Board of Directors
| 4. |
Analysis of the results of operations for the Year Ended December 31, 2025 (in millions of NIS) (Cont.)
|
| D. |
Analysis of the change in EBITDA, the generation data, energy hedges and capacity – Energy Transition segment in the U.S. (Cont.)
|
| (3) |
Additional details regarding energy hedges and guaranteed capacity payments in the Energy Transition segment in the U.S. (Cont.)
|
Set forth below is the scope of the secured capacity revenues for 2026 as at the date of the report:
|
2026
|
|
|
Scope of the secured capacity revenues (% of the power plant’s capacity)
|
88%
|
|
Capacity receipts (millions of $)
|
≈ 151
(≈ NIS 521 million)
|
| (*) |
Most of the non‑guaranteed capacity receipts relates to the Valley power plant that operates in the NYISO market. For details regarding the capacity auctions in this market – see Section 3C above.
|
It is noted that the data detailed in the above tables includes the increase in the holdings in the Shore power plant, at the rate of
about 11%, which was completed in January 2026, as well as the increase in the holdings in the Maryland power plant, at the rate of about 25%, and sale of the rights in the Three Rivers power plant, which as at the date of the report is held at
the rate of 10%. Completion of the exchange transaction is expected to take place in the second quarter of 2026 and is subject to conditions that have not yet been fulfilled and there is no certainty regarding their fulfillment.
42
---Unofficial translation for convenience purposes---
OPC Energy Ltd.
Report of the Board of Directors
| 4. |
Analysis of the results of operations for the Year Ended December 31, 2025 (in millions of NIS) (Cont.)
|
| D. |
Analysis of the change in EBITDA, the generation data, energy hedges and capacity – Energy Transition segment in the U.S. (Cont.)
|
| (4) |
Set forth below is detail regarding the generation of the power plants in the Energy Transition segment in the U.S.
|
|
For the Year Ended December 31, 2025
|
For the Year Ended December 31, 2024
|
|||||||||||||||||||||||||||||||||||
|
Potential
|
Net
|
Actual
|
Actual
|
Potential
|
Net
|
Actual
|
Actual
|
|||||||||||||||||||||||||||||
|
electricity
|
electricity
|
generation
|
availability
|
electricity
|
electricity
|
generation
|
availability
|
|||||||||||||||||||||||||||||
|
Capacity
|
generation
|
generation
|
percentage
|
percentage
|
generation
|
generation
|
percentage
|
percentage
|
||||||||||||||||||||||||||||
|
(MW)
|
(GWh)
|
(GWh)
|
(%)
|
(%)
|
(GWh)
|
(GWh)
|
(%)
|
(%)
|
||||||||||||||||||||||||||||
|
Energy transition projects (natural gas)
|
||||||||||||||||||||||||||||||||||||
|
Shore
|
725
|
6,115
|
3,828
|
60.6
|
%
|
87.7
|
%
|
6,130
|
3,612
|
56.9
|
%
|
92.4
|
%
|
|||||||||||||||||||||||
|
Maryland
|
745
|
6,439
|
4,718
|
73.3
|
%
|
95.9
|
%
|
5,958
|
3,628
|
56.3
|
%
|
90.3
|
%
|
|||||||||||||||||||||||
|
Valley (A)
|
720
|
5,302
|
4,725
|
77.7
|
%
|
83.5
|
%
|
5,838
|
5,002
|
82.1
|
%
|
89.1
|
%
|
|||||||||||||||||||||||
|
Towantic (B)
|
805
|
5,700
|
4,812
|
67.1
|
%
|
78.5
|
%
|
6,521
|
5,593
|
77.7
|
%
|
89.9
|
%
|
|||||||||||||||||||||||
|
Fairview (C)
|
1,050
|
8,758
|
7,513
|
81.5
|
%
|
87.1
|
%
|
8,601
|
7,610
|
82.1
|
%
|
88.5
|
%
|
|||||||||||||||||||||||
|
Three Rivers
|
1,258
|
9,911
|
6,456
|
60.1
|
%
|
85.2
|
%
|
9,792
|
6,366
|
59.9
|
%
|
76.9
|
%
|
|||||||||||||||||||||||
Definitions
| – |
The potential generation is the gross generation capability during the period after planned maintenance and less the electricity used for the power plant’s internal purposes.
|
| – |
The net generation of electricity is the gross generation during the period less the electricity used for the power plant’s internal purposes.
|
| – |
The actual generation percentage is the quantity of the net electricity generated in the facilities compared with the maximum quantity that can be generated in the period.
|
Significant operating events
| A. |
A decrease in the power plant’s capacity stemming mainly from performance of planned maintenance work in the fourth quarter of 2025.
|
| B. |
In the second quarter of 2025, planned maintenance was performed at the power plant, as part of which a significant item of equipment was replaced. The said item is insured under the insurance policy covering the power plant, and as at
the date of the report, a cash compensation was received that covers most of the costs required for its replacement and installation.
|
| C. |
In December 2025, as part of planned maintenance work, a malfunction occurred in one of the generation units, as a result of which the power plant’s generation capacity was temporarily limited to about 50% of its full capacity. In the
estimation of the CPV Group, as at the approval date of the report, the power plant is expected to return to full operation in 202733. As at the approval date of the report, Fairview has submitted a claim under the power
plant’s insurance policy, both in respect of the direct costs to repair the damage and for loss of the expected profits.
|
| 33 |
That said regarding the expectation of return to the power plant’s full activities and/or the results of the claim under the insurance policy constitutes “forward‑looking” information regarding which there is
no certainty it will be realized. Ultimately, there could be delays or breakdowns due to operational factors, delays or breakdowns in the course of performance of the work and/or delays in arrival of conforming equipment. It is noted that
in the usual course of things, extended maintenance (planned or unplanned) has a negative impact on the power plant’s results. In addition, as at the approval date of the report there is no certainty regarding the insurance compensation
in accordance with the claim and the timing date thereof.
|
43
---Unofficial translation for convenience purposes---
OPC Energy Ltd.
Report of the Board of Directors
| 4. |
Analysis of the results of operations for the Year Ended December 31, 2025 (in millions of NIS) (Cont.)
|
| E. |
Analysis of the change in EBITDA after proportionate consolidation – Renewable Energies segment in the U.S.
|
Set forth below is an analysis of the change in the EBITDA after proportionate consolidation in the renewable energies segment in the
period of the report compared with the corresponding period last year (in millions of NIS):
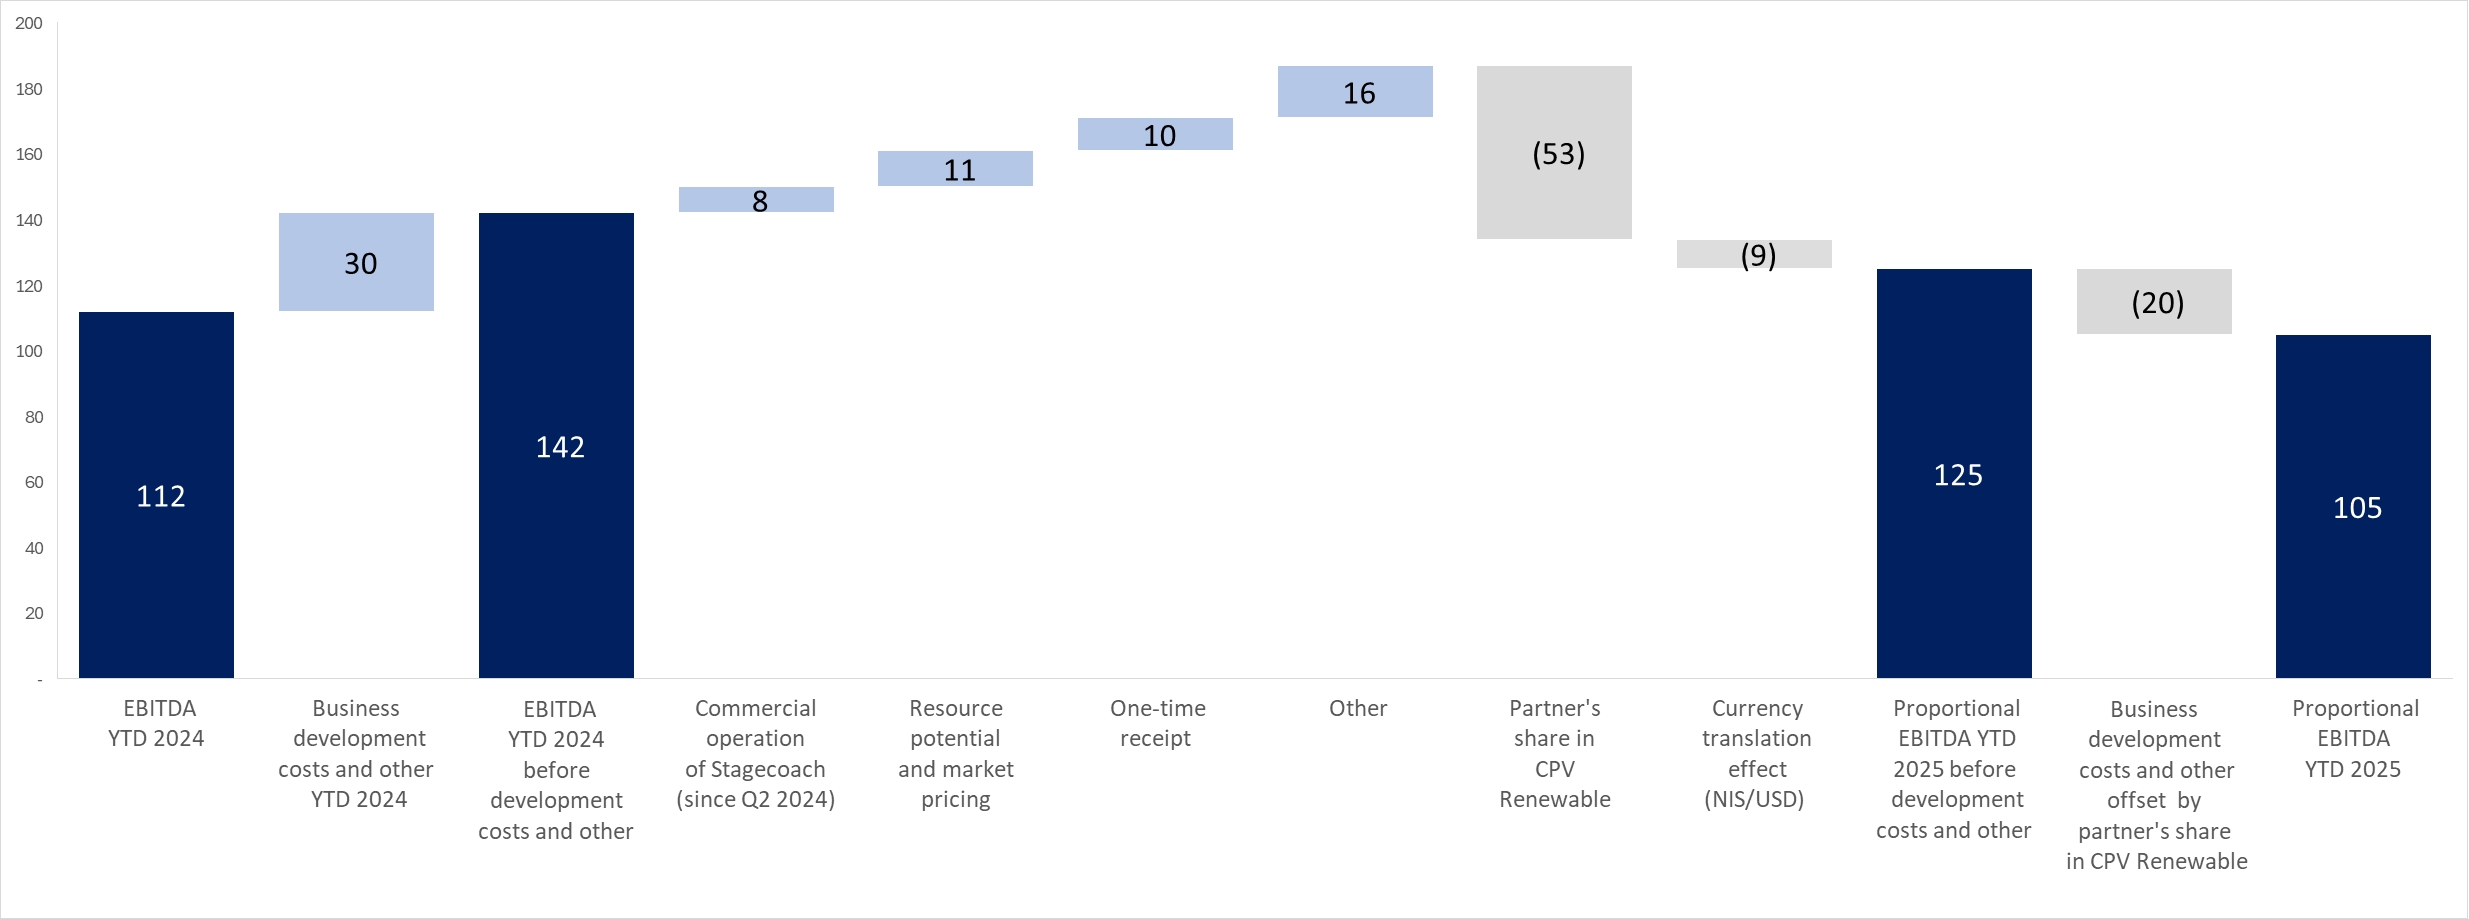
Entry of a partner in CPV Renewable – as a result of completion of the investment transaction in the area of renewable energies
in the U.S. in November 2024, starting from this date this segment’s data is calculated on the basis of a proportionate consolidation, where the share of the CPV Group is 66.7%.
44
---Unofficial translation for convenience purposes---
OPC Energy Ltd.
Report of the Board of Directors
| 5. |
Analysis of the results of operations for the Three Months Ended December 31, 2025 (in millions of NIS)
|
| A. |
Consolidated statement of income
|
|
For the Three Months Ended
|
||||||||
|
Section
|
December 31
|
|||||||
|
*2025
|
2024
|
|||||||
|
Revenues from sales and provision of services (1)
|
746
|
589
|
||||||
|
Cost of sales and provision of services (without depreciation and amortization) (2)
|
(620
|
)
|
(438
|
)
|
||||
|
Depreciation and amortization
|
(52
|
)
|
(72
|
)
|
||||
|
Gross profit
|
74
|
79
|
||||||
|
Share in earnings of associated companies
|
100
|
16
|
||||||
|
Compensation for lost revenues
|
16
|
–
|
||||||
|
Administrative and general expenses
|
(70
|
)
|
(72
|
)
|
||||
|
Business development expenses
|
(4
|
)
|
(12
|
)
|
||||
|
Gain on loss of control in the renewable energies segment in the U.S.
|
–
|
259
|
||||||
|
Other income (expenses), net
|
76
|
(6
|
)
|
|||||
|
Operating income
|
192
|
264
|
||||||
|
Financing expenses, net
|
(55
|
)
|
(52
|
)
|
||||
|
Income before taxes on income
|
137
|
212
|
||||||
|
Taxes on income
|
(13
|
)
|
(89
|
)
|
||||
|
Net income for the period (3)
|
124
|
123
|
||||||
|
Attributable to:
|
||||||||
|
The Company’s shareholders
|
92
|
28
|
||||||
|
Holders of non‑controlling interests
|
32
|
95
|
||||||
| * |
Commencing from November 2024, as a result of exit from the consolidation of CPV Renewable and transition to the equity method of accounting, the Company has discontinued consolidation in the consolidated financial statements of the
results of the renewable energy segment in the U.S.
|
45
---Unofficial translation for convenience purposes---
OPC Energy Ltd.
Report of the Board of Directors
| 5. |
Analysis of the results of operations for the Three Months Ended December 31, 2025 (in millions of NIS) (Cont.)
|
| A. |
Consolidated statement of income (Cont.)
|
(1) Changes in revenues:
|
Revenues
|
For the Three
|
Board’s Explanations
|
|||||||
|
Months Ended
|
|||||||||
|
December 31
|
|||||||||
|
2025
|
2024
|
||||||||
|
Revenues in Israel
|
|||||||||
|
Revenues from sale of energy to private customers
|
285
|
247
|
An increase, in the amount of about NIS 25 million, stemming mainly from an increase in the consumption of customers, compared with the
corresponding quarter last year.
|
||||||
|
Revenues from sale of energy to the System Operator and to other suppliers
|
23
|
19
|
|||||||
|
Revenues in respect of capacity payments
|
33
|
44
|
Most of the decrease compared with the corresponding quarter last year stems from a decline in the availability of the Zomet power plant. For
additional details – see Section 4C(1) above.
|
||||||
|
Revenues from sale of energy at cogeneration tariff
|
20
|
41
|
The decrease is due to optimization in light of maintenance at the Rotem power plant in the fourth quarter of 2025
|
||||||
|
Revenues from sale of steam
|
13
|
13
|
|||||||
|
Total revenues from sale of energy and others in Israel (without infrastructure services)
|
374
|
364
|
|||||||
|
Revenues from private customers in respect of infrastructure services
|
158
|
113
|
The increase derives mainly from the increase in the average tariffs at a rate of about 40%.
|
||||||
|
Total revenues in Israel
|
532
|
477
|
|||||||
|
Revenues in the U.S.
|
|||||||||
|
Revenues from sale of electricity from renewable energy
|
–
|
31
|
The decrease stems from discontinuance of the consolidation of the renewable energies segment in November 2024 and transition to the equity method
of accounting.
|
||||||
|
Revenues from sale of electricity from (Retail)
|
139
|
63
|
The increase stems mainly from an increase in the scope of the retail activities.
|
||||||
|
Revenues from provision of services and others
|
75
|
18
|
Most of the increase stems from a transition to the equity method of accounting in the renewable energies area and an increase in revenues from
provision of asset‑management services (which were previously eliminated in the consolidation).
|
||||||
|
Total revenues in the U.S.
|
214
|
112
|
|||||||
|
Total revenues
|
746
|
589
|
|||||||
46
---Unofficial translation for convenience purposes---
OPC Energy Ltd.
Report of the Board of Directors
| 5. |
Analysis of the results of operations for the Three Months Ended December 31, 2025 (in millions of NIS) (Cont.)
|
| A. |
Consolidated statement of income (Cont.)
|
| (2) |
Changes in the cost of sales and provision of services (not including depreciation and amortization):
|
|
Cost of Sales and
Provision of Services
|
For the Three
Months Ended
|
Board’s Explanations
|
|||||||
|
December 31
|
|||||||||
|
2025
|
2024
|
||||||||
|
Cost of sales in Israel
|
|||||||||
|
Natural gas and diesel oil
|
94
|
150
|
Most of the decrease is against the background of planned upgrading and maintenance work at the Rotem power plant in the fourth quarter of 2025.
|
||||||
|
Expenses in respect of acquisition of energy
|
138
|
40
|
Most of the stems from planned upgrading and maintenance work performed at the Rotem power plant in the fourth quarter of 2025.
|
||||||
|
Cost of transmission of gas
|
14
|
14
|
|||||||
|
Salaries and related expenses
|
10
|
13
|
|||||||
|
Operating expenses
|
29
|
33
|
|||||||
|
Total cost of sales in Israel without infrastructure services
|
285
|
250
|
|||||||
|
Expenses in respect of infrastructure services
|
158
|
113
|
For details – see the explanation of the change in the revenues in respect of infrastructure services.
|
||||||
|
Total cost of sales in Israel
|
443
|
363
|
|||||||
|
Cost of sales and services in the U.S.
|
|||||||||
|
Cost of sales in respect of sale of electricity from renewable energy
|
–
|
7
|
|||||||
|
Cost of sales in respect of sale of electricity (Retail)
|
127
|
46
|
The increase stems mainly from an increase in the scope of the retail activities.
|
||||||
|
Cost of sales in respect of provision of services and others
|
50
|
22
|
Most of the increase stems from a transition to the equity method of accounting in the renewable energies area and an increase in costs related to
the provision of asset‑management services (which were previously eliminated in the consolidation).
|
||||||
|
Total cost of sales and provision of services in the U.S.
|
177
|
75
|
|||||||
|
Total cost of sales and provision of services
|
620
|
438
|
|||||||
47
---Unofficial translation for convenience purposes---
OPC Energy Ltd.
Report of the Board of Directors
| 5. |
Analysis of the results of operations for the Three Months Ended December 31, 2025 (in millions of NIS) (Cont.)
|
| A. |
Consolidated statement of income (Cont.)
|
| (3) |
Consolidated net income and consolidated adjusted net income
|
Analysis of the change (in millions of NIS)
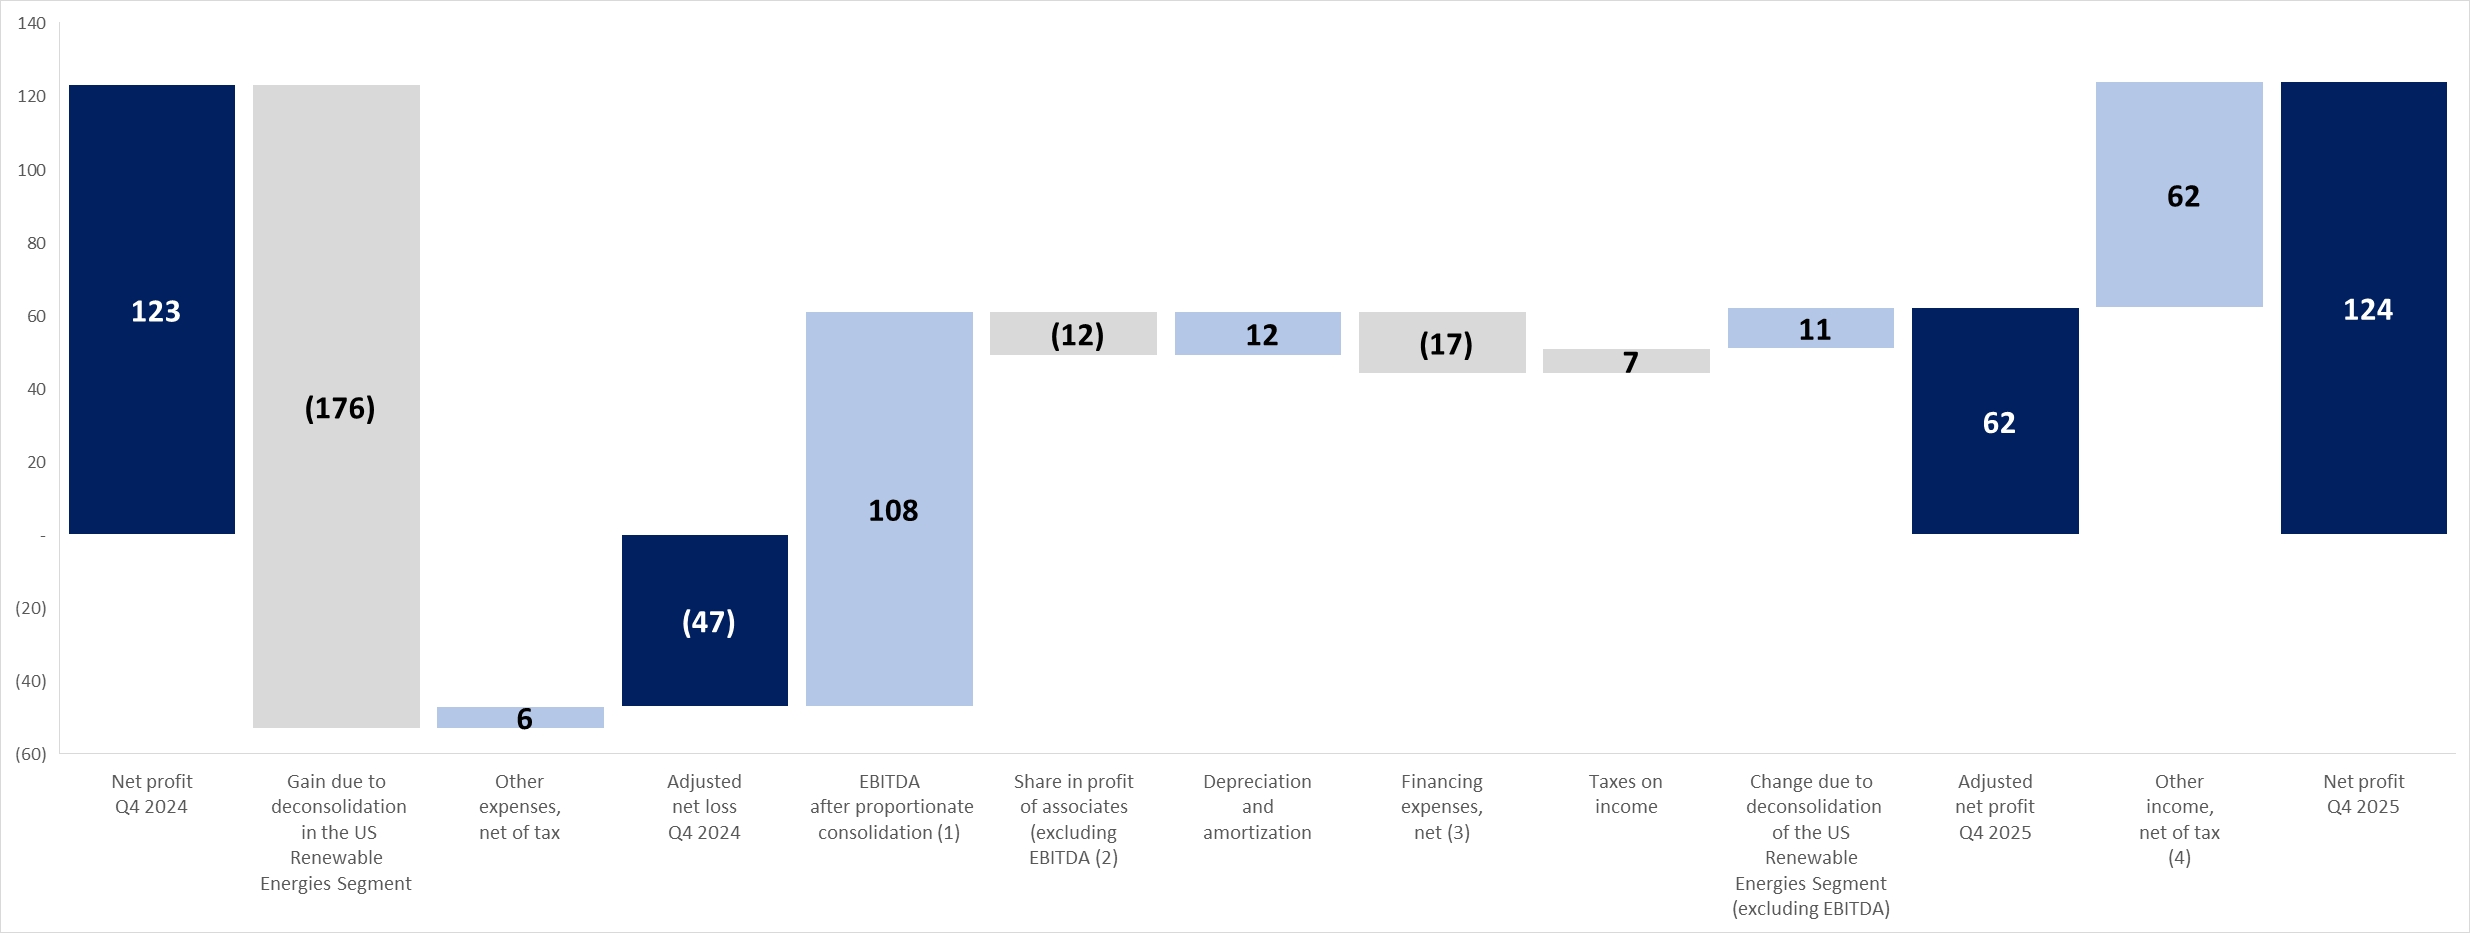
| (1) |
For an analysis of the change in the EBITDA after proportionate consolidation in the various segments in the fourth quarter of 2025 compared with the corresponding quarter last year – see Sections B – E below.
|
| (2) |
Most of the increase stems from additional depreciation and financing expenses, in the amount of about NIS 29 million, due to increase in the rate of holdings in the Shore and Maryland power plants in the fourth quarter of 2024 and in
the beginning of the second quarter of 2025. This increase was partly offset, in the amount of about NIS 14 million, due to the impact of translation of the results of the associated companies included from dollars into shekels (the
Company’s functional currency), against the background of a decline in the average shekel/dollar exchange rate in the period of the report compared with the corresponding period last year.
|
| (3) |
Most of the increase derives from an increase in the financing expenses as a result of changes in the shekel/dollar exchange rate, in the amount of about NIS 19 million.
|
| (4) |
Mainly in respect of revenues from development fees and development of the Basin Ranch power plant.
|
48
---Unofficial translation for convenience purposes---
OPC Energy Ltd.
Report of the Board of Directors
| 5. |
Analysis of the results of operations for the Three Months Ended December 31, 2025 (in millions of NIS) (Cont.)
|
| B. |
EBITDA, FFO (Funds From Operations) and net cash flows after debt service
|
| 1. |
Calculation of EBITDA
|
EBITDA in the consolidated statement and EBITDA after proportionate consolidation (in millions of NIS)
|
For the
|
||||||||
|
Three Months Ended
|
||||||||
|
December 31
|
||||||||
|
2025
|
2024
|
|||||||
|
Revenues from sales and provision of services
|
746
|
589
|
||||||
|
Cost of sales and provision of services (without depreciation and amortization)
|
(620
|
)
|
(438
|
)
|
||||
|
Share in income of associated companies
|
100
|
16
|
||||||
|
Compensation for lost revenues
|
16
|
-
|
||||||
|
Administrative and general expenses (without depreciation and amortization)
|
(66
|
)
|
(68
|
)
|
||||
|
Business development expenses
|
(4
|
)
|
(12
|
)
|
||||
|
Consolidated EBITDA
|
172
|
87
|
||||||
|
Elimination of the share in income of associated companies
|
(100
|
)
|
(16
|
)
|
||||
|
Plus – Group’s share of the proportionate EBITDA of associated companies in the Energy Transition segment
|
239
|
141
|
||||||
|
Plus – Group’s share of the EBITDA after proportionate consolidation of activities of the Renewable Energies segment in the U.S.*
|
25
|
16
|
||||||
|
EBITDA after proportionate consolidation
|
336
|
228
|
||||||
| * |
Due to completion of the transaction for investment in the area of renewable energies in the U.S. in November 2024, the data of this segment in the U.S. is calculated from this date on the basis of proportionate consolidation (instead
of a full consolidation) where the share of the CPV Group is 66.7%.
|
49
---Unofficial translation for convenience purposes---
OPC Energy Ltd.
Report of the Board of Directors
| 5. |
Analysis of the results of operations for the Three Months Ended December 31, 2025 (in millions of NIS) (Cont.)
|
| B. |
EBITDA, FFO (Funds From Operations) and net cash flows after debt service
|
| 2. |
Breakdown of EBITDA after proportionate consolidation, FFO and cash flows after debt service by segments (in millions of NIS)
|
Set forth below is a breakdown of the EBITDA after proportionate consolidation data broken down by the subsidiaries (on a consolidated basis) and the
associated companies (on a proportionate basis, based on the rate of the holdings of the CPV Group therein) as well as FFO data and cash flow after project debt service (in millions of NIS):
|
For the
|
For the
|
||||||||||||||||||||||||
|
three months ended
|
three months ended
|
||||||||||||||||||||||||
|
Main projects in operation
|
Basis of
|
December 31, 2025
|
December 31, 2024
|
||||||||||||||||||||||
|
presentation
|
Net cash
|
Net cash
|
|||||||||||||||||||||||
|
in the
|
EBITDA
|
flows
|
EBITDA
|
flows
|
|||||||||||||||||||||
|
Company’s
|
after
|
after
|
after
|
after
|
|||||||||||||||||||||
|
financial
|
proportionate
|
debt
|
proportionate
|
debt
|
|||||||||||||||||||||
|
statements
|
consolidation
|
FFO
|
service
|
consolidation
|
FFO
|
service
|
|||||||||||||||||||
|
Total operating projects in Israel and accompanying business activities (1) (2)
|
Consolidated
|
91
|
128
|
116
|
106
|
72
|
61
|
||||||||||||||||||
|
Business development costs, headquarters in Israel and other costs
|
Consolidated
|
(2
|
)
|
(28
|
)
|
39
|
(8
|
)
|
(27
|
)
|
(28
|
)
|
|||||||||||||
|
Total Israel (3)
|
89
|
100
|
155
|
98
|
45
|
33
|
|||||||||||||||||||
|
Total operating projects (4)
|
Associated
|
244
|
294
|
362
|
141
|
114
|
63
|
||||||||||||||||||
|
Other costs
|
Consolidated
|
8
|
11
|
9
|
–
|
(12
|
)
|
(12
|
)
|
||||||||||||||||
|
Total energy transition in the U.S.
|
252
|
305
|
371
|
141
|
102
|
51
|
|||||||||||||||||||
|
Total operating projects (5)
|
Associated
|
29
|
5
|
–
|
38
|
15
|
8
|
||||||||||||||||||
|
Business development and other costs
|
Associated
|
(4
|
)
|
3
|
3
|
(10
|
)
|
10
|
10
|
||||||||||||||||
|
Total renewable energy in the U.S.
|
25
|
8
|
3
|
28
|
25
|
18
|
|||||||||||||||||||
|
Total activities as part of the “others” segment (6)
|
Consolidated
|
(6
|
)
|
(7
|
)
|
(2
|
)
|
(4
|
)
|
(4
|
)
|
(4
|
)
|
||||||||||||
|
Headquarters in the United States (7) (8) (9)
|
Consolidated
|
(16
|
)
|
67
|
67
|
(28
|
)
|
(12
|
)
|
(12
|
)
|
||||||||||||||
|
Total United States
|
255
|
373
|
439
|
137
|
111
|
53
|
|||||||||||||||||||
|
Company headquarters (not allocated to the segments) (7)
|
Consolidated
|
(8
|
)
|
(5
|
)
|
91
|
(7
|
)
|
(2
|
)
|
(2
|
)
|
|||||||||||||
|
Total consolidated (10)
|
336
|
468
|
685
|
228
|
154
|
84
|
|||||||||||||||||||
| (1) |
The accompanying business activities in Israel include mainly virtual supply activities through OPC Israel, and sale/purchase of natural gas, including with third parties through OPC Natural Gas.
|
| (2) |
In the current quarter, the EBITDA of the active projects in Israel includes non‑recurring events. For details – see Section 5C(1) below.
|
| (3) |
Not including intercompany activities between the Company, the headquarters in Israel and the subsidiaries in Israel.
|
| (4) |
For details regarding active projects in the Energy Transition segment in the U.S. – see Section 5D(2) below.
|
| (5) |
Due to completion of the transaction for investment in the area of renewable energies in the U.S. in November 2024, the data of this segment in the U.S. is calculated from this date on the basis of proportionate consolidation (instead
of a full consolidation) where the share of the CPV Group is 66.7%.
|
| (6) |
Includes mainly business development and other costs in the area of initiation and development of high‑efficiency natural gas-fired power plants, with future carbon capture potential, and the results of the retail activities in the
U.S.
|
| (7) |
After elimination of management fees between the CPV Group and the Company, in the amounts of about NIS 9 million and about NIS 8 million for the fourth quarter 2025 and 2024, respectively.
|
| (8) |
Most of the change in the EBITDA in the fourth quarter of 2025 compared with the corresponding quarter last year, in the amount of about NIS 12 million relates to changes in the fair value of a profit participation plan for employees
of the CPV Group. For additional details – see Section 4B(2) above.
|
| (9) |
Most of the change in the FFO stems from development fees in the Basin Ranch power plant that were received in the fourth quarter of 2025.
|
| (10) |
In the fourth quarter of 2025, the consolidated FFO without adjustments for changes in the working capital was about NIS 321 million (in the corresponding period last year – about NIS 94 million).
|
50
---Unofficial translation for convenience purposes---
OPC Energy Ltd.
Report of the Board of Directors
| 5. |
Analysis of the results of operations for the Three Months Ended December 31, 2025 (in millions of NIS) (Cont.)
|
| C. |
Analysis of the change in EBITDA – Israel segment
|
Set forth below is an analysis of the change in the EBITDA in the Israel segment in the fourth quarter of 2025 compared with the corresponding quarter last
year (in NIS millions):
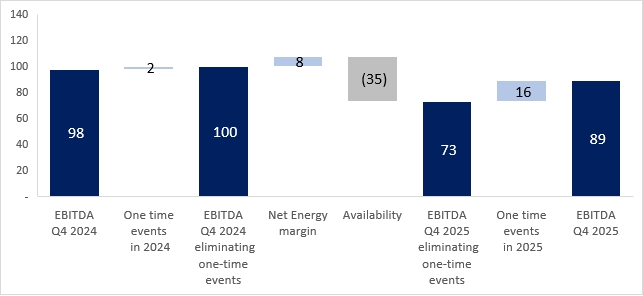
Availability (operational) – mainly in light of performance of planned upgrading and maintenance work at the Rotem power plant
in the fourth quarter of 2025 and limitation of the capacity and continued performance of maintenance work at Zomet, as detailed in Section 4C(1) above.
One‑time events – in the fourth quarter of 2025, mainly in respect of insurance compensation in respect of lost profits at the
Gat and Hadera power plants in respect of prior years.
51
---Unofficial translation for convenience purposes---
OPC Energy Ltd.
Report of the Board of Directors
| 5. |
Analysis of the results of operations for the Three Months Ended December 31, 2025 (in millions of NIS) (Cont.)
|
| D. |
Analysis of the change in EBITDA after proportionate consolidation – Energy Transition segment in the U.S.
|
| (1) |
Set forth below is an analysis of the change in the EBITDA after proportionate consolidation in the Energy Transition segment in the fourth quarter of 2025 compared with the corresponding quarter last year (in millions of NIS):
|
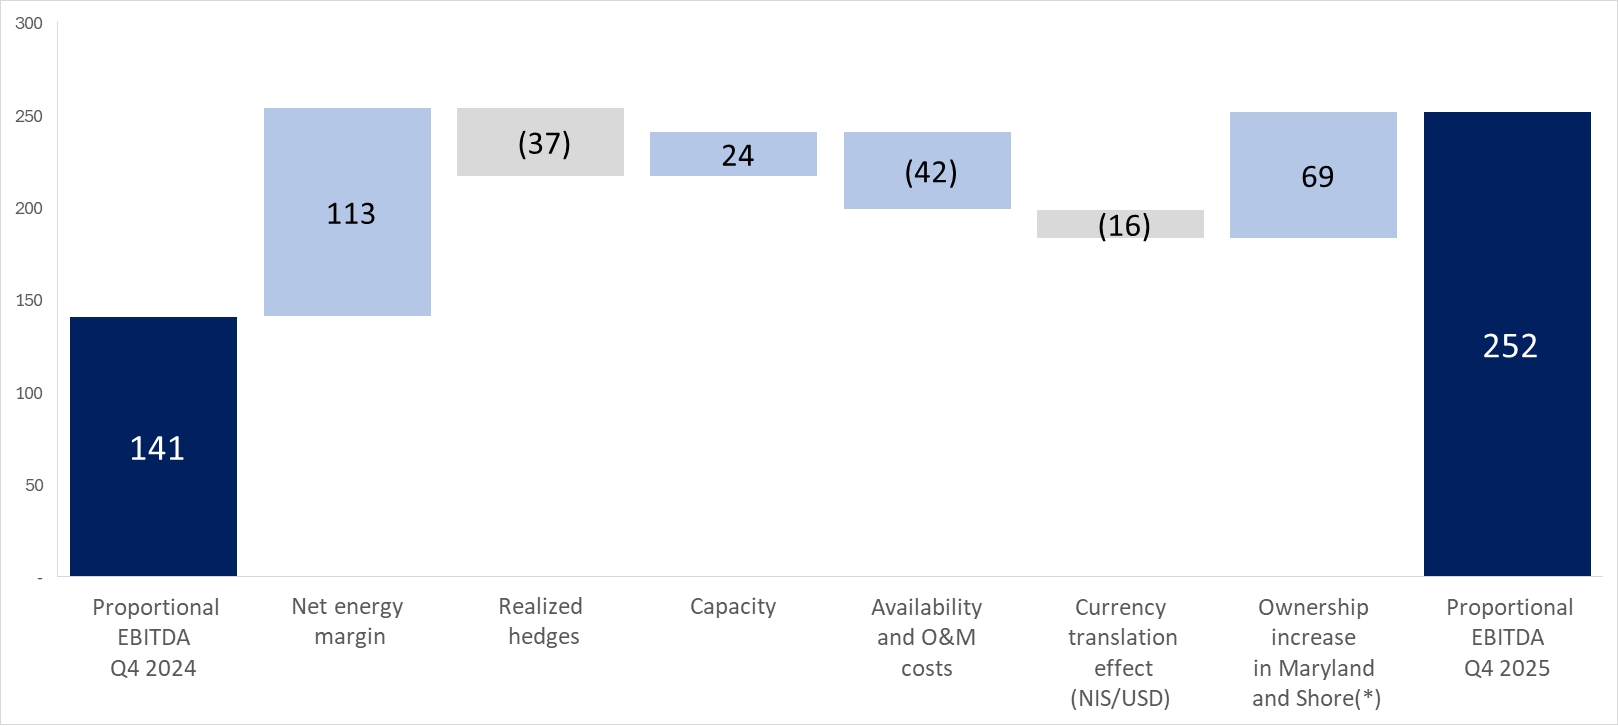
For details – see Section 4D(1) above.
52
---Unofficial translation for convenience purposes---
OPC Energy Ltd.
Report of the Board of Directors
| 5. |
Analysis of the results of operations for the Three Months Ended December 31, 2025 (in millions of NIS) (Cont.)
|
| D. |
Analysis of the change in EBITDA after proportionate consolidation – Energy Transition segment in the U.S. (Cont.)
|
| (2) |
Analysis of the Group’s share in the proportionate EBITDA, FFO (Funds From Operations) and net cash flows after service of project debt of associated companies in the Energy Transition segment (in millions of NIS):
|
|
For the three months ended December 31, 2025
|
Fairview
|
Towantic
|
Maryland*
|
Shore*aa(1)
|
Valley
|
Three Rivers
|
Total
|
|||||||||||||||||||||
|
Rate of holdings of the CPV Group
|
25%
|
26%
|
75%
|
89%
|
50%
|
10%
|
||||||||||||||||||||||
|
Revenues from sales of energy
|
44
|
80
|
213
|
150
|
97
|
20
|
604
|
|||||||||||||||||||||
|
Cost of natural gas
|
21
|
59
|
81
|
80
|
29
|
11
|
281
|
|||||||||||||||||||||
|
Carbon emissions tax (RGGI)
|
–
|
7
|
28
|
29
|
10
|
–
|
74
|
|||||||||||||||||||||
|
Cost of sales – other expenses (without depreciation and amortization)
|
1
|
1
|
5
|
4
|
2
|
–
|
13
|
|||||||||||||||||||||
|
Gain (loss) on realization of transactions hedging the electricity margins
|
(2
|
)
|
(5
|
)
|
(27
|
)
|
(1
|
)
|
(8
|
)
|
2
|
(41
|
)
|
|||||||||||||||
|
Net energy margin
|
20
|
8
|
72
|
36
|
48
|
11
|
195
|
|||||||||||||||||||||
|
Revenues from capacity payments
|
9
|
5
|
35
|
42
|
13
|
7
|
111
|
|||||||||||||||||||||
|
Other income
|
–
|
12
|
6
|
6
|
1
|
1
|
26
|
|||||||||||||||||||||
|
Gross profit
|
29
|
25
|
113
|
84
|
62
|
19
|
322
|
|||||||||||||||||||||
|
Fixed costs (without depreciation and amortization)
|
6
|
8
|
11
|
18
|
31
|
3
|
77
|
|||||||||||||||||||||
|
Administrative and general expenses (without depreciation and amortization)
|
1
|
1
|
2
|
3
|
2
|
1
|
10
|
|||||||||||||||||||||
|
Income (loss) from revaluation of unrealized hedging transactions
|
–
|
1
|
(1
|
)
|
–
|
–
|
(1
|
)
|
(1
|
)
|
||||||||||||||||||
|
Group’s share in EBITDA after proportionate consolidation in the Energy Transition segment
|
22
|
17
|
99
|
63
|
29
|
14
|
244
|
|||||||||||||||||||||
|
Group’s share in FFO
|
28
|
52
|
112
|
42
|
42
|
18
|
294
|
|||||||||||||||||||||
|
Group’s share in free cash flows after service of project debt
|
(2)207 |
54
|
61
|
20
|
(1
|
)
|
21
|
362
|
||||||||||||||||||||
| (1) |
At the Shore power plant – gas transmission costs (totaling in the fourth quarter of 2025 about NIS 12 million) are classified in accordance with IFRS 16 as depreciation expenses and, accordingly, are not included in the EBITDA.
|
| (2) |
The free cash flows after debt service in Fairview include additional project financing, as part of the financing agreement amendment in the fourth quarter of 2025, as detailed in Section 7A(3) below, which was distributed as a
dividend to the project’s partners, where the share of the CPV Group amounted to about $54 million (about NIS 179 million).
|
| (3) |
The CPV Group’s financing agreements include “cash sweep” mechanisms, in which all or part of the free cash flows of the projects is designated for repayment of loan principal on a current basis along with a predetermined minimum
repayment schedule for each long‑term loan. This mechanism allows for faster repayments if certain events occur and also places restrictions on distributions to shareholders.
|
| * |
In line with the Company’s strategy to gain control over some of the active power plants of the CPV Group, transactions were completed in the fourth quarter of 2024 and in the second quarter of 2025 that led to an increase in the rates
of holdings in the Maryland power plant (from 25% to 75%) and the Shore power plant (from 38% to 89%) as at the date of the report and to 100% after the date of the report.
|
53
---Unofficial translation for convenience purposes---
OPC Energy Ltd.
Report of the Board of Directors
| 5. |
Analysis of the results of operations for the Three Months Ended December 31, 2025 (in millions of NIS) (Cont.)
|
| D. |
Analysis of the change in EBITDA after proportionate consolidation – Energy Transition segment in the U.S. (Cont.)
|
| (2) |
Analysis of the Group’s share in the proportionate EBITDA, FFO (Funds From Operations) and net cash flows after service of project debt of associated companies in the Energy Transition segment (in millions of NIS):
|
|
For the three months ended December 31, 2024
|
Fairview
|
Towantic
|
Maryland
|
(1)Shore
|
Valley
|
Three Rivers
|
Total
|
|||||||||||||||||||||
|
Rate of holdings of the CPV Group
|
25%
|
26%
|
75%
|
68%
|
50%
|
10%
|
||||||||||||||||||||||
|
Revenues from sales of energy
|
51
|
72
|
65
|
33
|
93
|
13
|
327
|
|||||||||||||||||||||
|
Cost of natural gas
|
25
|
39
|
25
|
16
|
32
|
8
|
145
|
|||||||||||||||||||||
|
Carbon emissions tax (RGGI)
|
–
|
11
|
12
|
15
|
15
|
–
|
53
|
|||||||||||||||||||||
|
Cost of sales – other expenses (without depreciation and amortization)
|
–
|
1
|
3
|
1
|
2
|
–
|
7
|
|||||||||||||||||||||
|
Gain (loss) on realization of transactions hedging the electricity margins
|
3
|
(7
|
)
|
(2
|
)
|
7
|
2
|
5
|
8
|
|||||||||||||||||||
|
Net energy margin
|
29
|
14
|
23
|
8
|
46
|
10
|
130
|
|||||||||||||||||||||
|
Revenues from capacity payments
|
5
|
33
|
7
|
5
|
13
|
1
|
64
|
|||||||||||||||||||||
|
Other income
|
1
|
2
|
4
|
2
|
1
|
1
|
11
|
|||||||||||||||||||||
|
Gross profit
|
35
|
49
|
34
|
15
|
60
|
12
|
205
|
|||||||||||||||||||||
|
Fixed costs (without depreciation and amortization)
|
4
|
6
|
15
|
8
|
25
|
4
|
62
|
|||||||||||||||||||||
|
Administrative and general expenses (without depreciation and amortization)
|
1
|
1
|
2
|
1
|
2
|
1
|
8
|
|||||||||||||||||||||
|
Gain (loss) from revaluation of unrealized hedging transactions
|
3
|
4
|
(1
|
)
|
–
|
–
|
–
|
6
|
||||||||||||||||||||
|
Group’s share in EBITDA after proportionate consolidation in the Energy Transition segment
|
33
|
46
|
16
|
6
|
33
|
7
|
141
|
|||||||||||||||||||||
|
Group’s share in FFO
|
16
|
49
|
17
|
14
|
13
|
5
|
114
|
|||||||||||||||||||||
|
Group’s share in free cash flows after service of project debt
|
19
|
27
|
6
|
13
|
(2
|
)
|
–
|
63
|
||||||||||||||||||||
| (1) |
At the Shore power plant – gas transmission costs (totaling in the fourth quarter of 2024 about NIS 6 million) that are classified in accordance with IFRS 16 as depreciation expenses and, accordingly, are not included in the EBITDA.
|
| (2) |
It is noted that the increase in the rates of holdings in the Shore power plant (from about 37.5% to about 68.8%) and in the Maryland power plant (from about 25% to about 75%) in the fourth quarter of 2024, did not have a significant
impact on the results of the Energy Transition segment in the U.S. in 2024.
|
54
---Unofficial translation for convenience purposes---
OPC Energy Ltd.
Report of the Board of Directors
| 5. |
Analysis of the results of operations for the Three Months Ended December 31, 2025 (in millions of NIS) (Cont.)
|
| E. |
Renewable energies segment in the U.S.
|
| (1) |
Set forth below is an analysis of the change in the EBITDA after proportionate consolidation in the activities in the renewable energies segment in the U.S. in the fourth quarter of 2025 compared with the corresponding quarter last
year (in millions of NIS):
|
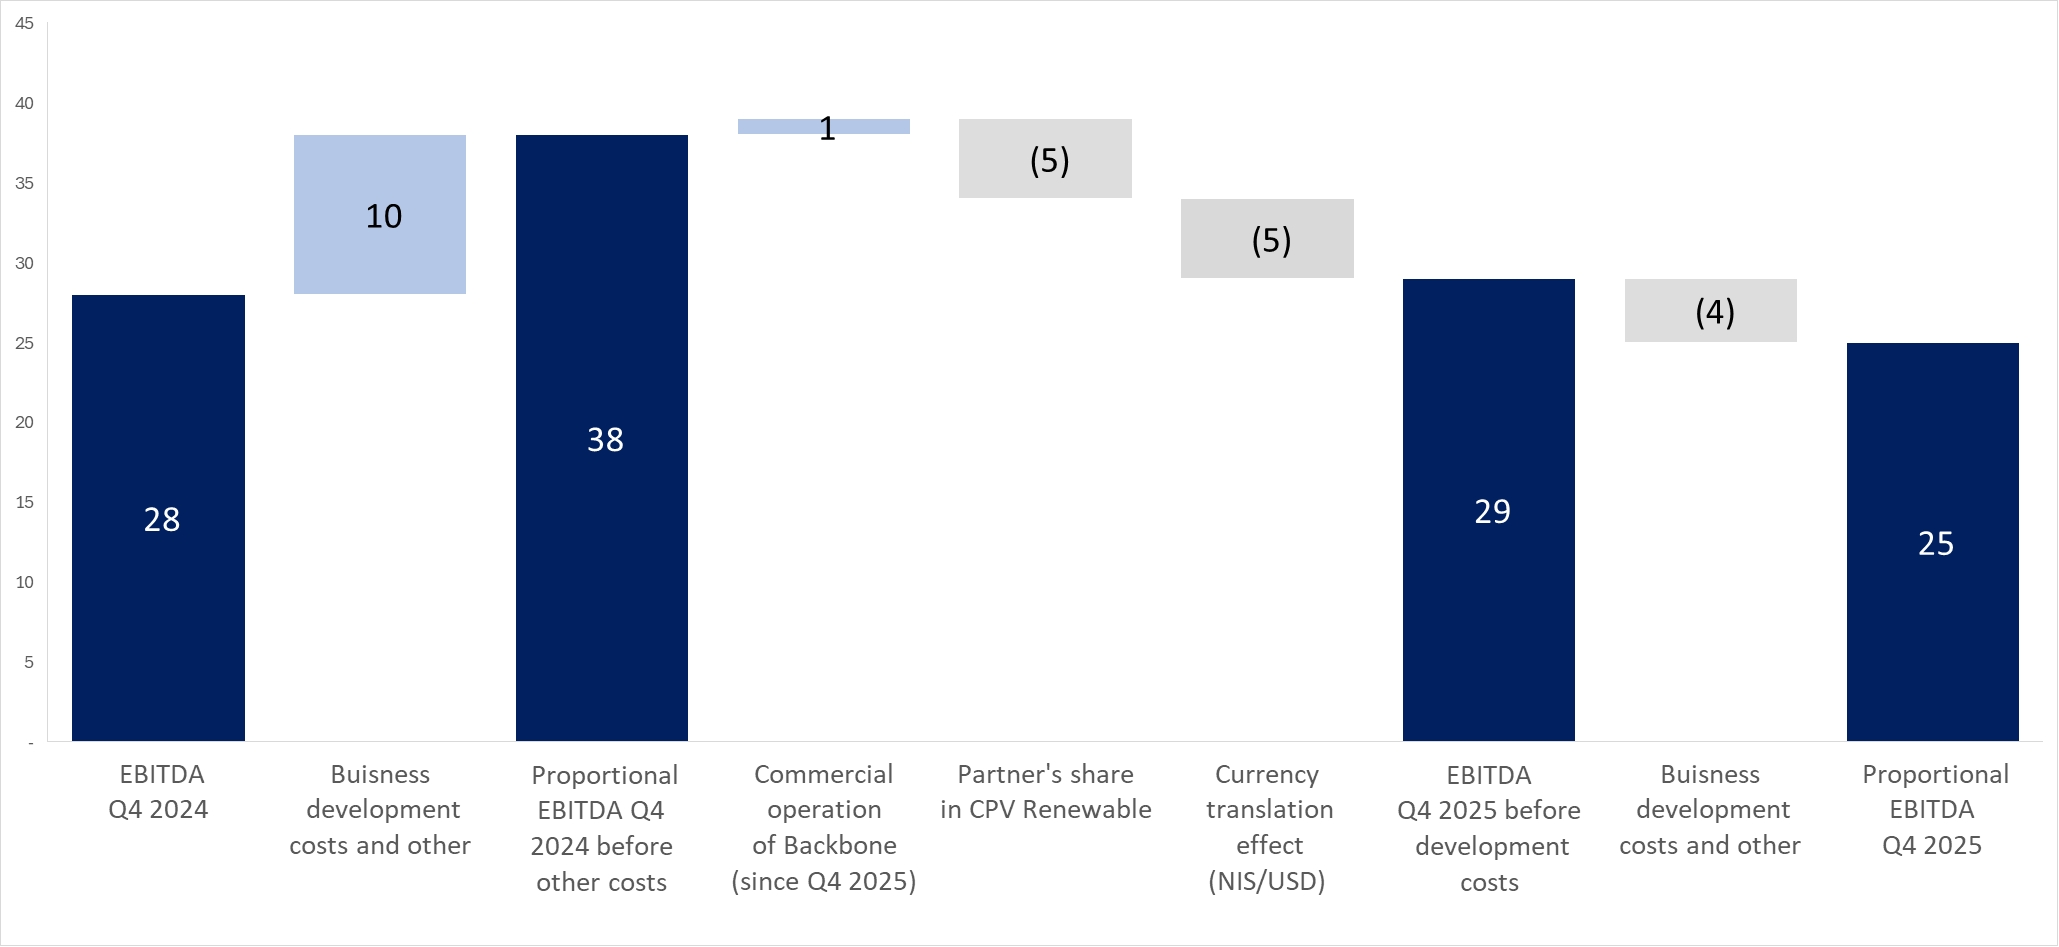
Entry of a partner in CPV Renewable – as a result of completion of the investment transaction in the area of renewable energies in the U.S. in
November 2024, starting from this date this segment’s data is calculated on the basis of a proportionate consolidation, where the share of the CPV Group is 66.7%.
Commercial operation of Backbone – in December 2025, construction of the Backbone solar power plant located in the state of Maryland was
completed (the PJM market), with an installed capacity of about 179 megawatts and a construction cost that totaled about $328 million and its commercial operation commenced. The project has an investment agreement with a tax partner, in the
amount of about $120 million, which had been provided in full as at the date of the report. Also, the project has a commercial agreement for sale of about 81% of the energy generated and the renewable energy certificates for 10 years from the
commercial operation date. The EBITDA expected in the first full year of the project’s operation is estimated at about $16 million (about NIS 55 million)34.
In addition, in the fourth quarter of 2025 work commenced to expand the project in a scope of an additional 36 megawatts, at an anticipated construction
cost of about $56 million. Completion of the expansion work is expected to take place in 2026. With respect to expansion of the project, there is a binding investment agreement with a tax partner on terms similar to the project’s agreement. The
EBITDA expect ed in the first full year of operation of the expansion of the project is estimated at about $4 million (a NIS 14 million)34.
34 That stated above in connection with the expected commercial operation of the expansion of the Backbone
project constitutes “forward‑looking” information as it is defined in the Securities Law, regarding which there is no certainty it will materialize. Ultimately, there could be delays and/or breakdowns with respect to completion of the project’s
construction and operation deriving from, among other things, operating factors, completion of the construction and connection work, technical breakdowns and/or the occurrence of one or more of the risk factors the CPV Group is exposed to. It
is noted that a delay in the commercial operation beyond the expected date, as stated above, could have an unfavorable impact on liabilities to third parties and its entitlement to benefits.
55
---Unofficial translation for convenience purposes---
OPC Energy Ltd.
Report of the Board of Directors
6. Initiation and Construction Projects
| A. |
Israel segment – projects under construction and pipeline projects (held at 100% ownership by OPC Israel35:
|
| 1. |
Main details with reference to construction projects (the data presented in the table below is in respect of 100% for each project):
|
| 35 |
That stated in connection with projects that have not yet reached operation, including with reference to the development stages, expected operation/construction date, the anticipated technologies,
regulation, quota or commercial format, capacity and project characteristics, undertakings in the project agreements (financing, equipment, construction), receipt of relevant approvals and/or the costs involved in the projects,
including the anticipated cost of the investment and costs of agreements, is “forward‑looking” information, as it is defined in the Securities Law, which is based on, among other things, the Company’s estimates as at the approval date
of the report and regarding which there is no certainty it will be realized (in whole or in part). Completion of the said projects (or any one of them) may not occur or may occur in a manner different than that stated above, among other
things due to dependency on various factors, including those that are not under the Company’s control, including completion of the construction and connection work, assurance of connection to the network and output of electricity from
the project sites and/or connection to the infrastructures (including the electricity grid and gas infrastructures), receipt of permits, completion of planning processes and licensing, application of relevant regulation, obtaining a
quota and/or formulation of a commercial format, completion of construction work, final costs in respect of development, construction, equipment and acquisition of rights in land, the proper functioning of the equipment, force majeure events and/or the terms of undertakings with main suppliers (including lenders), and there is no certainty they will be fulfilled, the
manner of their fulfillment, the extent of their impact or what their final terms will be. Ultimately technical, operational or other delays and/or breakdowns and/or an increase in expenses and/or other changes could be caused, this
being as a result of, among other things, factors as stated above or as a result of occurrence of one or more of the risk factors the Company is exposed to, including construction risks (including force majeure events, the War and its impacts), regulatory, licensing or planning risks, environmental factors, macro‑economic changes, delays in receipt of permits,
delays/problems regarding performance of acceptance tests or assurance of connection to the networks and infrastructures, delays and increased costs due relating to the supply chain, factors relating to main suppliers and financing
costs, changes in raw‑material prices and etc. For additional details regarding risk factors – see Section 19 of Section A of the Periodic Report. Accordingly, there is no certainty regarding actual execution of development and
construction projects (or any of them). It is further clarified that delays in completion of the projects beyond the date originally planned for this or a failure to enter them into operation for whatever reason, involve an increase in
costs or loss of expenses and payments (including by force of agreements the projects have signed) and/or impact the ability of the Company and the Group companies to comply with their obligations to third parties (including under
guarantees provided), including authorities, conditions of permits, lenders, consumers, suppliers and others, in connection with the projects, and/or cause a charge for additional costs, payment of compensation (including foreclosure of
guarantees or deposits) or starting of proceedings (including under guarantees provided).
|
56
---Unofficial translation for convenience purposes---
OPC Energy Ltd.
Report of the Board of Directors
6. Initiation and Construction Projects (Cont.)
| A. |
Israel segment – projects under construction and pipeline projects (held at 100% ownership by OPC Israel35: (Cont.)
|
| 1. |
Main details with reference to construction projects (the data presented in the table below is in respect of 100% for each project): (Cont.)
|
|
Power
|
Date/
|
Total
|
||||||||||||||
|
plants/
|
expectation
|
Total
|
construction
|
|||||||||||||
|
facilities
|
of the start
|
expected
|
cost as at
|
|||||||||||||
|
for
|
of the
|
Main
|
construction
|
December 31,
|
||||||||||||
|
generation
|
Capacity
|
commercial
|
customer/
|
cost
|
2025
|
|||||||||||
|
of energy
|
Status
|
(megawatts)
|
Location
|
Technology
|
operation
|
consumer
|
(NIS millions)
|
(NIS millions)
|
||||||||
|
OPC Sorek 2 Ltd. (“Sorek 2”)
|
Acceptance tests after completion of the construction
|
≈ 87
|
On the premises of the Sorek B seawater desalination facility
|
Powered by natural gas, cogeneration
|
2026
|
Yard consumers and the System Operator
|
36≈ 230
|
≈ 222
|
The timetables and construction costs of Sorek 2 were negatively impacted by the defense situation and the war in Israel, as detailed in Section 2B above. For additional details – see
Section 7.15.1.2 of Part A of the Periodic Report.
Regarding development and construction activities with respect to facilities for generation of electricity located on the yards (premises) of the consumers, as at the approval date of the report,
facilities have been operated with an aggregate capacity of about 45 megawatts (of which about 10 megawatts are in various test‑run and operation stage) and additional facilities with an aggregate capacity of about 10 megawatts are in various
stages of construction with an expectation of commercial operation in 2026. As at the date of the report, the total construction costs of the said capacity (about 55 megawatts) are estimated at about NIS 17537 million. For additional
details– see Section 7.3.10 of Part A of the Periodic Report. It is noted that as at the approval date of the report, the Company is carrying on a process wherein it is examining possibilities for sale of the said activities, however a decision
has not yet been formulated by the Company regarding this matter, including in connection with the terms of the sale, and there is no certainty regarding the results of this examination, the timing thereof or its conditions.
36 Not including a charge for headquarters costs and financing for the Company and the headquarters in Israel.
37 Not including a charge for headquarters costs and financing.
57
---Unofficial translation for convenience purposes---
OPC Energy Ltd.
Report of the Board of Directors
6. Initiation and Construction Projects (Cont.)
| A. |
Israel segment – projects under construction and pipeline projects (held at 100% ownership by OPC Israel35: (Cont.)
|
| 2. |
Main details with reference to projects in the advanced development stage38 in Israel39:
|
|
Total
|
Additional
|
|||||||||||
|
Expected
|
expected
|
developments
|
||||||||||
|
Capacity
|
construction
|
construction
|
Expected
|
in the
|
||||||||
|
Project
|
(megawatts)
|
Location
|
date
|
cost
|
regulation
|
project
|
||||||
|
Ramat Beka (photovoltaic with integrated storage)
|
About 550 megawatts plus storage capacity estimated at up to about 3,850 megawatt-hours40.
|
Local Industrial Council Naot Hovav (the land will be leased from Israel Lands Administration for a period of 24 years and 11 months).
|
Up to the end of 2026
|
About NIS 4.3 billion.
|
Decision No. 71101 – Bilateral Market Regulation for Generation and Storage Facilities Connected to or Integrated in the Transmission Grid
Content: From January 1, 2026, renewable energy generation facilities with integrated storage (which are required to comply
with a storage capacity to installed generation capacity ratio that does not exceed 7) that will receive tariff approval up to June 1, 2027 or up a total quota of 2,000 megawatts.
Main conditions: Signing of capacity transactions with virtual suppliers, which will give the supplier a right to purchase
energy at the half‑hour market price “SMP” in every hour up to a ceiling of the capacity certificate the supplier acquired from the generator. The capacity stated in the capacity certificate for a renewable energy facility with integrated
storage of 4 and 5 hours of unloading, will receive tariff approval as part of the first quota of the regulation, at the rates of 60% and 67%, respectively, up to 2036.
|
The Company is taking action to sign project agreements (construction, equipment and financing) and to obtain all the required approvals and permits: (1) in March
2025, after receipt of government consent for advancement of a plan for construction of the project by the National Infrastructures Committee, the plan was deposited. In January 2026, the plan was approved by the National Infrastructures
Committee and is awaiting final approval which is expected to be received in the upcoming weeks; (2) in December 2024, the Group signed an agreement for supply of solar panels for the project with an international supplier; (3) in January
2026, the Group signed an EPC agreement for a substation and a switching station which were intended to conform the electricity that will be generated in the project to the grid. In addition, the Company is taking action to sign
additional project agreements, including an agreement with the construction contractor of the photovoltaic facilities, in an estimated scope of about NIS 500 million; (4) the Group is negotiating with Bank Hapoalim regarding provision of
financing for construction of the project; (5) as at the date of the report, the Group paid Israel Lands Authority about NIS 275 million (20% of the total consideration in respect of the main areas), the balance (80%), in the amount of
about NIS 1.2 billion is expected to be paid within 90 days from the final approval of the project which, as noted, is expected to be received in the upcoming weeks.
|
|
38
|
Natural gas projects which, in the Company’s estimation, are in a period of up to about two years or up to about three years before the start of construction (taking into account the
projects’ characteristics, such as relevant regulation, required regulatory approvals, commercial arrangements for sale of energy from the facility, etc.) are considered projects in advanced development. Renewable energy projects which,
in the Company’s estimation, are expected to reach construction within about two years, taking into account, among other things, the relevant regulation, connection to the electricity grid, statutory plans and required regulatory
approvals, are considered projects in advanced development.
|
|
39
|
“Forward‑looking” information – for details see footnote 35 above.
|
|
40
|
As at the approval date of the report, the Company is making a technical feasibility examination along with economic optimization based on the possibility of increasing the solar
capacity up to 600 megawatts plus storage capacity estimated at up to 4,200 megawatts per hour. If the said increase is made, the expected cost of the project is about NIS 4.6 billion. That stated in
this table regarding the Ramat Beka project is forward‑looking” information – see footnote 35 above.
|
58
---Unofficial translation for convenience purposes---
OPC Energy Ltd.
Report of the Board of Directors
6. Initiation and Construction Projects (Cont.)
| A. |
Israel segment – projects under construction and pipeline projects (held at 100% ownership by OPC Israel35: (Cont.)
|
| 2. |
Main details with reference to projects in the advanced development stage in Israel33:
|
|
Total
|
Additional
|
|||||||||||
|
Expected
|
expected
|
developments
|
||||||||||
|
Capacity
|
construction
|
construction
|
Expected
|
in the
|
||||||||
|
Project
|
(megawatts)
|
Location
|
date
|
cost
|
regulation
|
project
|
||||||
|
Hadera 2 project (natural gas combined cycle)41
|
About 850 megawatts
|
Hadera adjacent to the Hadera power plant
|
Up to the end of 2026
|
About NIS 4.8 to NIS 5.2 billion.
|
Decision No. 69407 – Regulation for Conventional Generation Units
Content: Four generation units that will reach a financial close up to the end of June 2027 (as at the approval date of the
report, 2 units had reported on a financial close in accordance with this regulation, and to the best of the Company’s knowledge there are two additional plans that are under consideration for Hadera 2).
Main conditions: A capacity tariff was set that will apply for 25 years from the date of the financial close in the following
manner: financial close up to June 2026 will receive a capacity tariff of 3.31 agurot, up to December 2026, 3.18 agurot and up to June 2027 3.05 agurot. Sale of energy at the half‑hour “SMP” market price, with a future possibility
(contingent on regulatory approval) of transition to a model of sale of capacity to virtual suppliers (similar to that stated above with respect to the Ramat Beka project).
|
The Company is taking action to sign project agreements (construction, equipment and financing) and is advancing the obtaining of all the required approvals and
permits (including assurance of connection to the grid): (1) on August 10, 2025, the Israeli government approved National Infrastructure Plan 20B (NIP 20B) (a plan for construction of the Hadera 2 power plant for generation of electricity
through use of natural gas); (2) as at the approval date of the report, the Company has signed a binding agreement for supply of equipment with the main equipment supplier for an aggregate consideration constituting about 20% of the
project’s estimated cost, which is to be paid on payment dates some of which occurred as at the approval date of the report. For details – see Section 7.15.3.1 of Part A of the Periodic Report; (3) the Group is carrying on negotiations
with Bank Leumi L’Israel in connection with provision of financing for construction of the project; and (4) the Company is carrying on negotiations with Infinia for acquisition of the rights in the project’s lands (and the lands of the
Hadera power plant) in exchange for an aggregate consideration of about NIS 450 million – this being in place of the option agreement and the lease agreements, where as at the approval date of the report there is no certainty regarding
completion of the said transaction.
|
For additional information regarding Ramat Beka and the Hadera 2 – see Sections 7.3.12.2 and 7.3.12.1, respectively, of Part A of the Periodic Report.
41 The information regarding the Hadera 2 project in this table includes “forward‑looking” information – for details see footnote 35 above.
59
---Unofficial translation for convenience purposes---
OPC Energy Ltd.
Report of the Board of Directors
6. Initiation and Construction Projects (Cont.)
| A. |
Israel segment – projects under construction and pipeline projects (held at 100% ownership by OPC Israel35: (Cont.)
|
| 3. |
Main details with reference to projects in the initial development stage42 in Israel43:
|
|
Additional
|
||||||
|
Project
|
Technology
|
Location
|
details
|
|||
|
Intel
|
Natural gas combined cycle (about 450 to 650 megawatts, in the Company’s estimation as at the approval date of the report about 600 megawatts).
|
Kiryat Gat (land leased from Intel)
|
On March 3, 2024, OPC Power Plants signed a non‑binding memorandum of understanding with Intel Electronics (“Intel”), an existing customer of the Group, whereby OPC
Power Plants will construct and operate a power plant (“the Project”), which will supply electricity to Intel’s facilities, including expansion of the facilities presently being constructed, for a period of 20 years starting from the
operation date (“the Memorandum of Understanding”).
The parties are taking action to advance the development and planning of the project and to sign detailed agreements, while during the period of the report there was
advancement with respect to, among other things, receipt of a planning study, approval of access to the land and planning recommendation from the Planning Administration, and in March 2025 government consent was received for advancement
of the plan by the National Infrastructures Planning Board. In addition, the Company is carrying on negotiations with Intel for signing a PPA agreement in connection with the project. As at the approval date of the report, the Company
estimates that projected construction cost of the project will be in the range of about NIS 4.0 – 4.5 billion (depending on the size of the project), and subject to completion of the planning and development processes the project is
expected to reach the construction stage in the second half of 2027.
|
|
42
|
Natural gas projects with respect to which there is a tie to (right in) the land (or that are in the midst of processes for the formulation
thereof) and/or government consent has been received for approval of a National Infrastructure Plan and the Group is taking action to obtain the permits and approvals required for their construction, are considered projects in initial
development. Renewable energy projects with respect to which the Group has a tie to (right in) the land, and the Group is taking action to obtain the permits and approvals required for their construction, are considered projects in
initial development.
|
| 43 |
That stated above and below regarding the Intel project and solar and storage projects with integrated storage includes “forward‑looking” information – for details see footnote 35 above.
|
60
---Unofficial translation for convenience purposes---
OPC Energy Ltd.
Report of the Board of Directors
6. Initiation and Construction Projects (Cont.)
| A. |
Israel segment – projects under construction and pipeline projects (held at 100% ownership by OPC Israel35: (Cont.)
|
| 3. |
Main details with reference to projects in the initial development stage42 in Israel43: (Cont.)
|
|
Additional
|
||||||
|
Project
|
Technology
|
Location
|
details
|
|||
|
Solar and storage projects with integrated storage
|
Photovoltaic with integrated storage
|
Rural areas – kibbutzim and communities
|
The Company has signed agreements with holders of rights in lands (communities located in the periphery – kibbutzim and joint communities) that hold rights in
potential land sites for solar projects with integrated storage. As at the approval date of the report, agreements had been signed for construction of solar facilities estimated at a cumulative about 0.5 gigawatts and about 2,500
megawatts per hour of storage. In August 2025, the government’s consent was received for advancement of a plan estimated at about 0.15 gigawatts and about 0.75 gigawatts per hour of storage by the National Infrastructures Planning Board.
|
For additional details regarding the Intel project and solar projects with integrated storage – see Sections 7.3.12.3 and 7.3.12.4, respectively of Part A of the Periodic
Report.
61
---Unofficial translation for convenience purposes---
OPC Energy Ltd.
Report of the Board of Directors
6. Initiation and Construction Projects (Cont.)
| B. |
Development and construction of natural gas (with potential for carbon capture) in the U.S.44:
|
| 1. |
Main details regarding the Basin Ranch power plant that is in the construction stage (which is held as at the approval date of the report at the rate of 100% by the CPV Group (1))45
|
44 Projects in the construction and development stage are held at holding rates of 100% or 70% by the CPV Group, where a project that is not
wholly owned is developed under joint development agreements with the equipment manufacturer and the partner in some of the projects is GE Vernova, and the CPV Group will also likely sign joint development agreements, as stated, with respect to
additional projects. It is noted that potential carbon capture is a separate component that is subject to various development stages than development of the natural‑gas power plant and it is not included under the characteristics of the projects
below. It is further noted that as at the approval date of the report, there is no certainty regarding development of the carbon capture component or the timing thereof.
The information with respect to projects under construction and development projects of the CPV Group, including regarding
the expected commercial structure, the expected date of construction / commercial operation, the expected construction cost, characteristics (including capacity), ownership structure, financial results, entitlement to benefits, and carbon
capture potential includes “forward‑looking” information, as it is defined in the Securities Law, regarding which there is no certainty it will materialize (in whole or in part). The information is based on, among other things, the estimates of
the CPV Group as at the approval date of the report, regarding which there is no certainty they will be realized and that might not be realized due to various factors, such as: regulatory changes, changes in government/regulatory policies
applicable to the projects, as stated, or changes in legislation or regulation (and changes impacting the main suppliers of the projects, and including changes in the area of energy or import tariffs into the U.S. due to the policies of the
present administration in the U.S.), delays in receipt of permits, an increase in the construction or financing costs, delays in performance of the construction work and/or technical or operational breakdowns, difficulties or delays in signing
an agreement for connection to the grid (including an increase in the connection‑related costs) or connection of the project to the transmission or other infrastructures, an increase in costs due to the commercial terms with the main suppliers
(such as equipment and the construction contractor), difficulties in signing commercial agreements for sale of the project’s potential revenues, terms of the commercial agreements, conditions in the energy market, unforeseen expenses,
macro‑economic changes, weather events, delays and an increase in costs relating to supply chains, transport (shipping), increases in raw‑material prices, etc. Completion of the projects pursuant to the said estimates is subject to existence of
conditions which, as at the approval date of the report, have not yet occurred (in whole or in part) and, therefore, there is no certainty regarding their completion in accordance with that stated (if at all). Delays in the construction or
commercial operation could also negatively impact projects, as stated, and the ability of companies in the CPV Group to comply with their obligations to third parties in connection with the project (including with respect to collaterals
provided in favor of third parties, as stated (including financiers) and/or loss of payments made in the course of development and construction). For additional details regarding the risk factors involved
in the activities of the CPV Group – see Section 8.21 to Part A of the Periodic Report.
45 The information presented below, the projected commercial operation date, the expected construction cost,
the expected commercial format and signing of hedge agreements, the total senior financing and/or the expected results of the activities for the first full calendar year (revenues, EBITDA, and cash flows after service of the senior debt)
constitutes “forward‑looking” information, as it is defined in the Securities Law, regarding which there is no certainty it will materialize (in whole or in part), including due to factors as stated in footnote 44 above. A delay or other
difficulties (particularly significant ones) relating to completion of the project in accordance with that stated are expected to have an unfavorable impact on the CPV Group and the Company. See footnote 44 above.
62
---Unofficial translation for convenience purposes---
OPC Energy Ltd.
Report of the Board of Directors
6. Initiation and Construction Projects (Cont.)
| B. |
Development and construction of natural gas (with potential for carbon capture) in the U.S.44:
|
| 1. |
Main details regarding the Basin Ranch power plant that is in the construction stage (which is held as at the approval date of the report at the rate of 100% by the CPV Group (1))45
|
|
Expectation for the first
|
||||||||||||||||||||
|
full year of operation
|
||||||||||||||||||||
|
Expected
|
Total
|
Cash flows
|
||||||||||||||||||
|
start
|
Total
|
construction
|
after
|
|||||||||||||||||
|
of the
|
Expected
|
expected
|
cost as at
|
Total
|
service of
|
|||||||||||||||
|
Capacity
|
commercial
|
commercial
|
Regulated
|
construction
|
December 31
|
senior
|
senior
|
|||||||||||||
|
Project
|
(MW)
|
Location
|
operation
|
structure
|
market
|
cost
|
2025
|
financing
|
EBITDA
|
debt
|
||||||||||
|
CPV Basin Ranch Holdings, LLC (“Basin Ranch”)
|
1,350
|
Ward County, Texas
|
2029
|
Sale of electricity in the ERCOT market (energy only), where the project is expected to sign commercial agreements to hedge about 75% of the power plant’s capacity for a period of 7 years
from the commercial operation date46
|
ERCOT - West
|
NIS 5.7-6.4 billion ($1.8-2.0 billion)
|
NIS 1.1 billion ($0.36 billion)
|
≈ NIS 3.5 billion
(≈ $1.1 billion)
|
≈ NIS 1.0 billion
(≈ $0.275 billion)
|
≈ NIS 0.9 billion
(≈ $0.25 billion)
|
||||||||||
| (1) |
In February 2026, upon completion of a transaction for acquisition of the remaining 30% of the ownership rights in the project from the remaining partner in the project (GE Vernova) and from the date of its completion, the CPV Group
holds 100% of the project and it will be consolidated in the Company’s financial statements, starting from the first quarter of 2026. The total scope of the transaction is estimated at about $371 million (about NIS 1.2 billion). This
amount includes the shareholders’ equity required in respect of the rights being acquired, in the amount of about $228 million (of which the amount of about NIS 58 million was paid as an advance deposit on the signing date of the
agreement in October 2025), performance guarantees, in the amount of about $63 million, and the balance, in the amount of about $80 million, that is to be paid to the seller in four equal annual payments in 2026–2029. The sources for
completion of the transaction included debt granted directly to the CPV Group by Bank Leumi, in the amount of about $130 million (for details – see Section 7A(9) below), frameworks for letters of credit provided, in the amount of about
$63 million and a combination of cash from the activities of the CPV Group and investment of capital by the partners (stakeholders) in the CPV Group.
|
| (2) |
For additional details regarding provision of sources for the project’s financial close in October 2025 – see Section 7A(8) below.
|
46 As at the approval date of the report, hedging of the exposure to market prices is expected by means of: gas agreements of the Netback type
(which includes a pricing mechanism whereby the gas price paid by the generator of the electricity derives from the electricity price) and agreements for sale of electricity at a fixed price. In addition, as at the approval date of the report, a
substantial portion of the agreements has been signed and some of them are expected to be signed up to the commercial operation date.
63
---Unofficial translation for convenience purposes---
OPC Energy Ltd.
Report of the Board of Directors
6. Initiation and Construction Projects (Cont.)
| B. |
Development and construction of natural gas (with potential for carbon capture) in the U.S.44:
|
| 2. |
Set forth below is a summary of the pipeline (awaiting) natural gas project with carbon capture potential in the U.S.47, as at the approval date of the report48:
|
|
Regulated
|
Capacity
|
Rate of
|
Share of the
|
|||||||||
|
Project
|
Location
|
market
|
Status
|
(megawatts)
|
holdings
|
CPV Group
|
||||||
|
Shay (1)
|
West Virginia
|
PJM
|
Initial
|
2,100
|
70%
|
1,470
|
||||||
|
Oregon
|
Ohio
|
PJM
|
Initial
|
1,475
|
100%
|
1,475
|
||||||
|
Walker
|
Ohio
|
PJM
|
Initial
|
1,450
|
100%
|
1,450
|
||||||
|
Total
|
5,025
|
4,395
|
| (1) |
Pursuant to the Group’s strategy, advancement of natural‑gas projects with carbon capture potential is continuing with the goal of meeting the anticipated increase in electricity demand and maintaining grid reliability, while focusing
on, at this stage, the Shay project. As at the approval date of the report, the CPV Group has accelerated its advancement of the project’s development, including the processes for licensing and PJM grid interconnection, and has secured
significant equipment. In this regard, the CPV Group has signed an agreement for major electrical equipment and is expected to enter into a turbine (slot) reservation agreement with global equipment suppliers (which is also a partner in
the project). These undertakings (agreements) include payment of non‑refundable advance deposits, in the total amount of millions of dollars. In the estimation of the CPV Group, the initial estimate of the cost of the power plant (100%)
is about $4 billion49. In addition, possible commercial and regulatory formats are being considered, including “Gas Net Back” arrangements, subsidized financing plans and regulatory initiations for encouraging the increase
available capacity in the PJM market, to the extent they will be applicable, as detailed in Section 3C above. At this stage, the said alternatives are in the examination stage, some of which merely preliminary examination, and there is no
certainty regarding the manner of their implementation or their feasibility. The Group intends to advance commencement of construction of the project, subject to completion of all the development processes, particularly finalizing the
commercial format, within a period of about two years50.
|
47 The information stated above regarding the projects in the development stage of the CPV Group, the scope
thereof and their additional characteristics, such as, carbon capture potential and the stages of development of the project constitute “forward‑looking” information as it is defined in the Securities Law, and regarding which there is no
certainty it will be realized, including due to the stages of development that have not yet been completed (as described in Section 10.8A of Part A of the Periodic Report) and/or a lack of certainty regarding the feasibility of assimilating the
carbon capture technology in the development projects of the CPV Group and/or relevant costs. In addition, advancement of the projects, as stated, is subject to uncertainty and conditions, as noted in footnote 44 above.
48 In general, regarding natural gas with future carbon capture potential, the CPV Group views projects that have an expectation of connection
to the grid within three years and a commercial format has been formulated for the project, as projects in the advanced development stage, and projects for which a tie to (a right in) the land exists and there is an expectation of an agreement
for connection to the grid of more than three years or a connection expectation has not yet been formulated, as projects in the initial stage.
That stated regarding the stage of development is impacted by, among other things, the scope of the project, its location, the anticipated activity market,
the relevant ISO, regulation and policies of the federal and local governments, and could change based on a given project’s specific characteristics, as well as due to the project’s relevant external circumstances.
49 Not including financing expenses in the construction period.
50 That stated regarding the Shay project, including in connection with an expected undertaking in an
agreement for reserving generation capacity, constitutes “forward‑looking” information, regarding which there is no certainty it will materialize. For details – see footnote 44 above. As at the approval date of the report, there is no certainty
regarding fulfillment of the conditions for advancement of the project.
64
---Unofficial translation for convenience purposes---
OPC Energy Ltd.
Report of the Board of Directors
6. Initiation and Construction Projects (Cont.)
| C. |
Renewable energies segment in the U.S. – projects under construction and development projects (100% held by CPV Renewable which is held at the rate of 66.7% by the CPV Group51:
|
| 1. |
Main details regarding a project under construction using wind technology (the data presented in the table below are in respect of 100% of each project)52:
|
|
Project
|
Capacity
(megawatts)
|
Location
|
Expected
commercial
operation
date
|
Commercial
structure
|
Regulated
market
after
the PPA
period
|
Total
expected
construction
cost net
for 100%
of the project
(NIS
millions)
|
Tax
equity
(NIS
millions)
|
Total
construction
cost
as at
December 31,
2025
(NIS
millions)
|
Expectation for a first full calendar year
in the period of the PPA agreements |
|||||||||||||
|
Revenues36
(NIS
millions)
|
EBITDA53
(NIS
millions)
|
Cash flows
after tax
partner
(NIS
millions)
|
||||||||||||||||||||
|
CPV Rogues Wind, LLC (“Rogues”)
|
114
|
Pennsylvania
|
2026
|
Long-term PPA54 (including green certificates)
|
PJM MAAC
|
≈ 1,164
(≈ $365 million)
|
≈ 520
(≈ $163 million)55
|
≈ 962
(≈ $302 million)
|
≈ 82
(≈ $24 million)
|
≈ 63
(≈ $18 million)
|
≈ 51
(≈ $15 million)
|
|||||||||||
|
51
|
For details regarding expansion of the Backbone project, which is in the construction stage – see Section 5E.
|
|
52
|
Details with respect to the scope of the investments in the United States were translated from dollars and presented in NIS based on the currency rate of exchange on December 31, 2025 –
$1 = NIS 3.19. The information presented below in this report regarding projects under construction and development, including with respect to the expected commercial structure, the projected commercial
operation date, the expected construction cost, an undertaking with a tax partner (if relevant) and/or the expected results of the activities for the first full calendar year (revenues, EBITDA, investments of the tax partner and cash
flows after the tax partner, as applicable) includes “forward‑looking” information, as it is defined in the Securities Law, regarding which there is no certainty it will materialize (in whole or in part), including due to factors that
are not under the control of the CPV Group. The information is based on, among other things, estimates of the CPV Group as at the approval date of the report, the realization of which is not certain, and which might not be realized
due to factors, such as: regulatory changes or legislative changes (including changes impacting main suppliers of the projects and/or import of equipment and including regulatory/legislative changes in the area of energy or import
tariffs due to changes in the government’s policies), delays in receipt of permits, an increase in the construction costs, delays in execution of the construction work and/or technical or operational malfunctions, problems or delays
regarding signing an agreement for connection to the network or connection of the project to transmission or other infrastructures, an increase in costs due to the commercial conditions in the agreements with main suppliers (such as
equipment suppliers and contractors), problems signing commercial agreements sale for of the potential revenues from the project, terms of the commercial agreements, conditions of the energy market, an increase in the financing
expenses, unforeseen expenses, macro‑economic changes, weather events, delays and an increase in costs related to the supply chain, transport and an increase in raw‑material prices, etc. Completion of the projects in accordance with
the said estimates is subject to the fulfillment of conditions which as at the approval date of the report had not yet been fulfilled (fully or partly) and, therefore, there is no certainty they will be completed in accordance with
that stated, if at all. Construction delays could even impact the ability to comply with liabilities of the project and the CPV Group to third parties in connection with the projects (including based on guarantees provided in favor of
those third parties) or to detract from the entitlement to tax benefits or to trigger forfeiture of guarantees and advance payments.
|
|
53
|
It is clarified that the expected revenues and the EBITDA presented in the above table do not include the tax benefits, even though the project is expected to comply with conditions for
their receipt.
|
|
54
|
In April 2021, the project signed an agreement for sale of all the electricity (as amended from time to time) and the environmental consideration (including Renewable Energy
Certificates (RECs), benefits relating to availability and accompanying services), the terms of which were improved in 2024. The agreement was signed for a period of 10 years starting from the commercial operation date. The CPV Group
has provided collateral for assurance of its obligations under the agreement, which includes execution of certain payments to the other party if certain milestones (including the commencement date of the activities) in the project are
not completed in accordance with the timetable determined.
|
|
55
|
The project is located on a former coal mine and, therefore, it is expected to be entitled to enlarged tax benefits of 40% in accordance with the IRA Law. In August 2025, the CPV Group
signed an agreement with a tax partner (Equity Tax) in an ITC format in respect of about 40% of the cost of the project and use of the tax credits that are available to the project (subject to appropriate regulatory arrangements) on
terms that are customary for agreements of this type (including provision of a guarantee by the CPV Group for certain liabilities).
|
65
---Unofficial translation for convenience purposes---
OPC Energy Ltd.
Report of the Board of Directors
6. Initiation and Construction Projects (Cont.)
| C. |
Renewable energies segment in the U.S. – projects under construction and development projects (100% held by CPV Renewable which is held at the rate of 66.7% by the CPV Group51:
|
| 2. |
Set forth below is a summary of the scope of the pipeline projects (in megawatts) in the United States as at the approval date of the report56.
|
|
Advanced
|
Initial
|
|||||||||||
|
Renewable energy
|
development57
|
development
|
Total
|
|||||||||
|
PJM market
|
||||||||||||
|
Solar
|
70
|
1,540
|
1,610
|
|||||||||
|
Wind
|
–
|
130
|
130
|
|||||||||
|
Total PJM market (2)
|
70
|
1,670
|
1,740
|
|||||||||
|
Other markets
|
||||||||||||
|
Solar
|
240
|
1,050
|
1,290
|
|||||||||
|
Wind
|
–
|
1,200
|
1,200
|
|||||||||
|
Total other markets
|
240
|
2,250
|
2,490
|
|||||||||
|
Total renewable energy (1)
|
310
|
3,920
|
4,230
|
|||||||||
|
Share of the CPV Group (66.67%)
|
205
|
2,610
|
2,815
|
|||||||||
56 The information presented in the report regarding the backlog (pipeline) of development projects of the CPV
Group, including with respect to the scope of the backlog, status of the projects and/or their characteristics (capacity, technology, integration possibilities with carbon capture potential, expected construction date, etc.), and assessments
regarding entitlement to benefits and/or potential compliance with the safe harbor rules, constitutes “forward‑looking” information as it is defined in the Securities Law. For details – see footnote 55 above.
57 In general, in the area of renewable energies, the CPV Group views projects that in its estimation are in a period of up to two to three
years to the start of the construction as projects in the advanced development stage (there is no certainty the development projects, including projects in the advanced stage, will be executed) – this being based on the expectation of a
connection agreement to the grid within two to three years depending on the status of the connection request and assessment of the viability (commercial/project etc.) of reaching construction within two years. Also, the CPV Group views projects
wherein there is a tie to (a right in) the land together with an expectation of connection to the grid of more than two years or where a connection agreement has not yet been formulated and the CPV Group is taking action to advance the approvals
required for construction of the project, as projects in the initial development stage.
That stated regarding the development stage is impacted by, among other things, potential compliance with the safe harbor rules under the legislation in the
U.S. (including additional regulatory changes and stricter regulations applying to renewable energy), the scope of the project and the technology, and could change based on specific characteristics of a certain project, as well as from the
external circumstances that are relevant to the project, such as the anticipated activities’ market or additional regulatory circumstances. In general, projects that are designated to operate in the PJM market could be impacted by the connection
processes as described in Section 8.1.2.1(A) of Part A to the Periodic Report for 2024, and their progress could be delayed as a result of these proposed processes. It is clarified that in the early development stages (in particular), the scope
of the projects and their characteristics are subject to changes, if and to the extent they reach advanced stages.
66
---Unofficial translation for convenience purposes---
OPC Energy Ltd.
Report of the Board of Directors
6. Initiation and Construction Projects (Cont.)
| C. |
Renewable energies segment in the U.S. – projects under construction and development projects (100% held by CPV Renewable which is held at the rate of 66.7% by the CPV Group: (Cont.)
|
| 2. |
Set forth below is a summary of the scope of the pipeline projects (in megawatts) in the United States as at the approval date of the report56. (Cont.)
|
| (1) |
As at the approval date of the report, all the advanced development projects and certain projects in the initial development, with an aggregate scope of about 1.9 gigawatts (in terms of 100% – the share of the CPV Group is about 1.3
gigawatts), are expected to comply with the Safe Harbor rules (lenient threshold conditions that must be complied with in order to receive the tax benefits, ITC and PTC). As at the approval date of the report, the CPV Group has invested
and is expected to make additional investments in an aggregate scope estimated at tens of millions of dollars in the said projects, particularly procurement of equipment. For additional details regarding the policies of the U.S.
government with respect to renewable energies and legislation of the “One Big Beautiful Bill” law in the U.S., which gradually cancels the tax benefits and provides directives and dates and in connection with the Safe Harbor rules – see
Section 3D above.
|
| (2) |
It is noted that the process with respect to requests for connection to the grid in the PJM market (Interconnection Queue(, which constitutes a significant milestone in a project’s development stages, lengthy can be and could continue
on average 2–3 years, and in the estimation of the CPV Group delays in this process have occurred and may continue to cause delays in the timetables for development of certain projects, taking into account, among other things, the
required costs for upgrading the network and their position in the connection process and in the costs of the connection process in a case where upgrades are necessary58.
|
58 That stated above in connection with the impacts of the processes with respect to the connection agreements
of PJM on the projects of the CPV Group, includes “forward‑looking” information as it is defined in the Securities Law. For details – see footnote 55 above.
67
---Unofficial translation for convenience purposes---
OPC Energy Ltd.
Report of the Board of Directors
7. Adjusted financial debt, net
| A. |
Compositions of the adjusted financial debt, net59
|
The Company defines “net financial debt” as loans from banks and financial institutions, debentures and interest payable less cash and
cash equivalents, including deposits and restricted cash that are intended for debt service and less/plus the fair value of derivative financial instruments used for hedging the principal and/or interest. The “adjusted net financial debt”
includes the “net financial debt” of the Company and its consolidated subsidiaries and the “net financial debt” of its associated companies in the U.S. on the basis of the rate of the holdings of the CPV Group in these companies.
The Company defines “leverage ratio” as “adjusted financial debt, net” divided by “EBITDA after proportionate consolidation” for the 12
months that preceded the measurement date. For purposes of calculation of the leverage ratio, debt in respect of projects under construction (that do not yet generate EBITDA) is not included in the calculation. Regarding projects the construction
of which has been completed and/or active projects that were acquired during the period of the report, a representative annual EBITDA is taken into account.
Set forth below is detail of the Group’s leverage ratio:
|
As at December 31, 2025(1)(2)
|
As at December 31, 2024(3)
|
||
|
2.9
|
5.2
|
| (1) |
After elimination of debt under construction in respect of the Basin Ranch power plant in the U.S. of about NIS 231 million, and for the Rogues Wind project, in the amount of about NIS 245 million, as detailed in the following table.
With reference to the Backbone project, the construction of which has been completed and acquisition of additional holdings in the Shore power plant in the U.S. in 2025, the representative EBITDA was calculated as follows: Shore based on
the rate of holdings as at the date of the report with respect to the actual results in 2025; and Backbone based on the representative EBITDA for the first full year of operation.
|
| (2) |
As at December 31, 2025, the adjusted financial debt, net, includes a cash balance of about NIS 2,261 million, in the headquarters company, as detailed in the following table, the source of which is, among other things, issuances of
capital made during 2025 that are being used for financing of part of the shareholders’ equity required for construction of the Basin Ranch power plant, as well as for continued growth and development of the Company’s business.
|
| (3) |
After elimination of debt under construction in the Renewable Energies segment in the U.S. of about NIS 132 million, as detailed in the following table. With reference to acquisition of additional holdings in some of the power plants
in the Energy Transition segment in the U.S. (“the Additional Acquisitions”) and regarding loss of control in the Renewable Energies segment (“the Loss of Control”), the representative EBITDA was calculated as follows: Maryland and Shore
based on the rate of holdings with respect to the actual results in 2024 for the Additional Acquisitions adjusted for a full year, and the renewable energy activities based on the rate of holdings with respect to the actual results in
2024, taking into account the decline in the rate of holdings in the period prior to the Loss of Control.
|
| 59 |
It is clarified that these are indices that are not defined in accordance with IFRS and are not audited, however Company management believes that they are capable of assisting investors in understating the Company’s financial position
and its results. It is noted that different companies are likely to define these indices differently.
|
68
---Unofficial translation for convenience purposes---
OPC Energy Ltd.
Report of the Board of Directors
| 7. |
Adjusted financial debt, net (Cont.)
|
| A. |
Compositions of the adjusted financial debt, net (Cont.)
|
The following table details the financial debt, net, as at December 31, 2025 (in millions of NIS)60:
|
Gross debt
|
||||||||||||||||||||||||||
|
Debt
|
Cash and cash
|
Derivative
|
||||||||||||||||||||||||
|
Method of
|
(including
|
equivalents
|
financial
|
|||||||||||||||||||||||
|
presentation
|
interest
|
and deposits
|
instruments
|
|||||||||||||||||||||||
|
in the
|
payable
|
Weighted-
|
Final
|
(including
|
for hedging
|
|||||||||||||||||||||
|
Company’s
|
and
|
average
|
repayment
|
restricted cash
|
principal
|
|||||||||||||||||||||
|
financial
|
deferred
|
interest
|
date of
|
used for debt
|
and/or
|
Net
|
||||||||||||||||||||
|
Name of project
|
statements
|
expenses)
|
rate
|
the loan
|
service) (1)
|
interest
|
debt
|
|||||||||||||||||||
|
Hadera
|
Consolidated
|
548
|
4.9%
|
|
2037
|
68
|
41
|
439
|
||||||||||||||||||
|
Headquarters and others in Israel (2)
|
Consolidated
|
2,300
|
6.3%–6.4%
|
|
2033
|
220
|
–
|
2,080
|
||||||||||||||||||
|
Total Israel
|
2,848
|
6.1%
|
|
288
|
41
|
2,519
|
||||||||||||||||||||
|
Active renewable energy
projects
|
Associated (66.7%)
|
502
|
5.3%
|
|
2026–2030
|
12
|
4
|
486
|
||||||||||||||||||
|
Financing of construction of Rogues Wind
|
Associated (66.7%)
|
249
|
5.1%
|
2029
|
2
|
2
|
245
|
|||||||||||||||||||
|
Renewable energies headquarters
|
Associated (66.7%)
|
–
|
–
|
85
|
–
|
(85
|
)
|
|||||||||||||||||||
|
Total renewable energy
|
751
|
5.3%
|
99
|
6
|
646
|
|||||||||||||||||||||
|
Fairview (3) (Cash Sweep 32%)
|
Associated (25%)
|
539
|
6.2%
|
2030–2031
|
13
|
(1
|
)
|
527
|
||||||||||||||||||
|
Towantic (Cash Sweep 8%)
|
Associated (26%)
|
179
|
7.9%
|
2029
|
30
|
(3
|
)
|
152
|
||||||||||||||||||
|
Maryland (4) (Cash Sweep 53%)
|
Associated (75%)
|
625
|
5.8%
|
|
2028
|
62
|
3
|
560
|
||||||||||||||||||
|
Shore (5) (Cash Sweep 96%)
|
Associated (89%)
|
821
|
7.8%
|
2030–2032
|
7
|
(5
|
)
|
819
|
||||||||||||||||||
|
Valley (6) (Cash Sweep 100%)
|
Associated (50%)
|
459
|
9.8
|
|
|
May 2026 |
101
|
–
|
358
|
|||||||||||||||||
|
Three Rivers (Cash Sweep 37%)
|
Associated (10%)
|
202
|
5.2%
|
2028
|
15
|
8
|
179
|
|||||||||||||||||||
|
Total energy transition (7)
|
2,825
|
7.2%
|
|
228
|
2
|
2,595
|
||||||||||||||||||||
|
Basin Ranch loan (8) TEF
|
Associated (70%)
|
421
|
3.0%
|
|
2045
|
190
|
–
|
231
|
||||||||||||||||||
|
Headquarters and others – U.S. (9)
|
Consolidated
|
489
|
7.1
|
|
2032
|
886
|
–
|
(397
|
)
|
|||||||||||||||||
|
Total U.S.
|
4,486
|
1,403
|
8
|
3,075
|
||||||||||||||||||||||
|
Total energy headquarters (11)
|
1,890
|
2.5%–6.2%
(weighted-average 3.1%)
|
2028–2034
|
2,261
|
–
|
(371
|
)
|
|||||||||||||||||||
|
Total
|
9,224
|
3,952
|
49
|
5,223
|
||||||||||||||||||||||
| (1) |
Includes restricted cash, in the amount of about NIS 40 million in Hadera, about NIS 157 million in the Energy Transition segment and about NIS 482 million in the headquarters in the U.S. designated for the construction of the Basin
Ranch power plant.
|
| (2) |
For details regarding an undertaking in financing agreements with additional entities in 2025 for provision of loans in the cumulative amount of NIS 700 million on terms similar to the financing agreements of the prior entities – see
Note 14B(1) to the Financial Statements.
|
| (3) |
In February 2025, Fairview’s financing agreement was amended such that the interest margin on the long‑term loan was reduced from 3.5% to 3.0%. In October 2025, the financing agreement was amended again such that the long‑term loan
principal (Term Loan B) increased from about $491 million to about $700 million (the share of the CPV increased from about $52 million (NIS 172 million)) and the interest margin on the loan was reduced from 3.0% to 2.5%. Upon completion
of the transaction, the amount of about $217 million (NIS 717 million) was distributed as a dividend to the partners holding the project, where the share of the CPV is about $54 million (NIS 179 million).
|
| (4) |
In March 2025, Maryland’s financing agreement was amended, such that the interest‑rate margin on the long‑term loan was reduced from 3.75% to 3.25%.
|
60 In addition, the Group has a liability to holders of non‑controlling interests, the balance of which as at December 31, 2025 is about
NIS 440 million.
69
---Unofficial translation for convenience purposes---
OPC Energy Ltd.
Report of the Board of Directors
| 7. |
Adjusted financial debt, net (Cont.)
|
| A. |
Compositions of the adjusted financial debt, net (Cont.)
|
| (5) |
On February 4, 2025, Shore completed an undertaking in a new financing agreement in the framework of which the interest margin on the long‑term loan was updated to 3.75% and for purposes of its completion, the amount of about $80
million (NIS 286 million) was granted to Shore by all of its equity holders (CPV’s share – about $72 million).
|
| (6) |
Subsequent to the date of the report, in February 2026, Valley completed an undertaking in a new financing agreement, wherein the interest margin on the loan was significantly reduced to 2.75% and the Cash Sweep rate was updated from
100% to a gradual mechanism based on a leverage ratio, such that if the leverage ratio declines, the Cash Sweep rate will be gradually reduced from a rate of 75% to 50% and down to a rate of 25%. Upon completion of the new financing
agreement in the aggregate amount of about $425 million (of which about $325 million is in respect of a long‑term Term Loan), about $100 million was used for repayment of shareholders’ loans and distribution of dividends, where the share
of the CPV Group is about $50 million.
|
| (7) |
The rate (%) of the Cash Sweep mechanism is in accordance with the estimate of the CPV Group and it could change from time to time based on the provisions of the financing agreements of the projects.
|
| (8) |
On October 28, 2025, an agreement was signed and entered into effect for financing the Basin Ranch power plant with Texas Energy Fund (TEF), whereby debt will be provided in the aggregate amount of about $1.1 billion (about NIS 3.5
billion), where the amount of the debt presented in the table above represents the balance that has been withdrawn as at the date of the report (for details – see Note 14B(4) to the financial statements. It is noted that pursuant to the
terms of the TEF loan, on the date of the financial close the CPV Group provided a commitment for the shareholders’ equity required for the project (proportionately (pro rata) to the holdings on the date of the financial close), in the
aggregate cash amount of about $470 million, of which about $300 million was provided by means of a loan from Bank Leumi and about $170 million (which includes recognition of development investments and payments made prior to the
financial close in the amount of about $67 million), was provided by the Company by means of a bridge loan for equity with reference to the balance of the amount required. Subsequent to the date of the report, upon completion of the
process of investment in equity together with the additional limited partners that are stakeholders in the CPV Group, the bridge loan was converted into equity. The Company used part of the monies raised in the equity issuance made in
June 2025 for this purpose.
|
In addition, additional collaterals relating to the project were provided by the holders of the rights in the project as part of the financial closing of the
TEF loan, where as at the approval date of the report the share of the CPV Group in the said collaterals was provided by means of letters of credit, in the amount of about $232 million (upon completion of acquisition of the share of the partner
in the project, as detailed in Section 6B(1) above).
| (9) |
In October 2025, the CPV Group signed an agreement for financing part of the shareholders’ equity provided for construction of the Basin Ranch power plant, in the amount of about $300 million, which was increased in February 2026 (upon
completion of acquisition of the partner in the project), to the aggregate amount of about $430 million. For additional details – see Note 14B(3) to the financial statements.
|
| (10) |
As part of some of the financing agreements, financial covenants were determined for the projects. As at the date of the report, all the companies in the Group (including the associated companies) are in compliance with all the
financial covenants. For additional details regarding financial covenants of the subsidiaries – see Note 14B(7) to the financial statements.
|
| (11) |
Includes balances of debt and cash in the Company and cash in ICG Energy Inc.
|
| (12) |
On September 30, 2025, the Company made partial early repayment (debt prepayment), in the amount of about NIS 256 million, of the par value of the debentures (Series B). The amount of the redemption in respect of the partial early
repayment (debt prepayment), including linkage differences, is about NIS 302 million.
|
| (13) |
In November 2025, the Company made an expansion of the debentures (Series D), in the amount of about NIS 458 million par value. The proceeds from the issuance amounted to about NIS 500 million (gross), which was designated for purposes
of refinancing existing debts and current business activities.
|
| (14) |
As at the approval date of the report, the Company is examining the possibility of taking out additional long‑term debt, as well as refinancing (including early redemption) and existing long‑term debt to extend the weighted average
maturity. As at the approval date of the report, there is no certainty regarding the above, the timing thereof or its terms, which are subject to market conditions and the discretion of the Company’s competent organs.
|
70
---Unofficial translation for convenience purposes---
OPC Energy Ltd.
Report of the Board of Directors
| 7. |
Adjusted financial debt, net (Cont.)
|
| A. |
Compositions of the adjusted financial debt, net (Cont.)
|
The following table details the adjusted financial debt, net, as at December 31, 2024 (in millions of NIS):
|
Method of
presentation
in the
Company’s
financial
statements
|
Debt
(including
interest
payable
and deferred
expenses)
|
Cash and cash
equivalents
and deposits
(including
restricted cash used
for debt service)
|
Derivative
financial
instruments
for hedging
principal
and/or interest
|
Net
debt
|
|||||||||||||
|
Hadera
|
Consolidated
|
585
|
72
|
44
|
469
|
||||||||||||
|
Headquarters and others – Israel
|
Consolidated
|
1,649
|
16
|
–
|
1,633
|
||||||||||||
|
Total Israel
|
2,234
|
88
|
44
|
2,102
|
|||||||||||||
|
Active renewable energy projects
|
Associated (66.7%)
|
323
|
5
|
16
|
302
|
||||||||||||
|
Financing construction of renewable energy projects
|
Associated (66.7%)
|
426
|
69
|
9
|
348
|
||||||||||||
|
Renewable energies headquarters
|
Associated (66.7%)
|
–
|
216
|
–
|
(216
|
)
|
|||||||||||
|
Total renewable energy
|
749
|
290
|
25
|
434
|
|||||||||||||
|
Fairview
|
Associated (25%)
|
482
|
–
|
2
|
480
|
||||||||||||
|
Towantic
|
Associated (26%)
|
215
|
9
|
(1
|
)
|
207
|
|||||||||||
|
Maryland
|
Associated (75%)
|
891
|
80
|
15
|
796
|
||||||||||||
|
Shore
|
Associated (69%)
|
1,114
|
235
|
–
|
879
|
||||||||||||
|
Valley
|
Associated (50%)
|
686
|
104
|
–
|
582
|
||||||||||||
|
Three Rivers
|
Associated (10%)
|
252
|
14
|
17
|
221
|
||||||||||||
|
Total energy transition
|
3,640
|
442
|
33
|
3,165
|
|||||||||||||
|
Headquarters and others – U.S.
|
Consolidated
|
–
|
264
|
–
|
(264
|
)
|
|||||||||||
|
Total U.S.
|
4,389
|
996
|
58
|
3,335
|
|||||||||||||
|
Total Energy headquarters
|
1,891
|
664
|
–
|
1,227
|
|||||||||||||
|
Total
|
8,514
|
1,748
|
102
|
6,664
|
|||||||||||||
| B. |
Financial covenants
|
The Company and its investee companies are subject to financial covenants provided in their financing agreements and trust
certificates. As at the date of the report, the Company and its investee companies were in compliance with all the financial covenants provided. For details regarding the covenants for violation, relating to significant loans and debentures – see
Notes 14B(6) and 15C to the financial statements61.
In May 2025, Midroog determined an initial rating of A1.il with a stable rating outlook for the Company and its debentures (Series B, C
and D). In addition, in May 2025, S&P Maalot raised the Company’s credit rating to ilA with a stable rating outlook and of its debentures to ilA+, due to an improvement in the business profile and the financial ratios.
61 For a description of the main provisions of material loans of the Company and the investee companies – see Note 14 to the annual Financial
Statements.
71
---Unofficial translation for convenience purposes---
OPC Energy Ltd.
Report of the Board of Directors
| 7. |
Adjusted financial debt, net (Cont.)
|
Movement in the adjusted financial debt, net, for the period ended December 31, 2025 (in NIS millions):
FFO – NIS 1,295 million
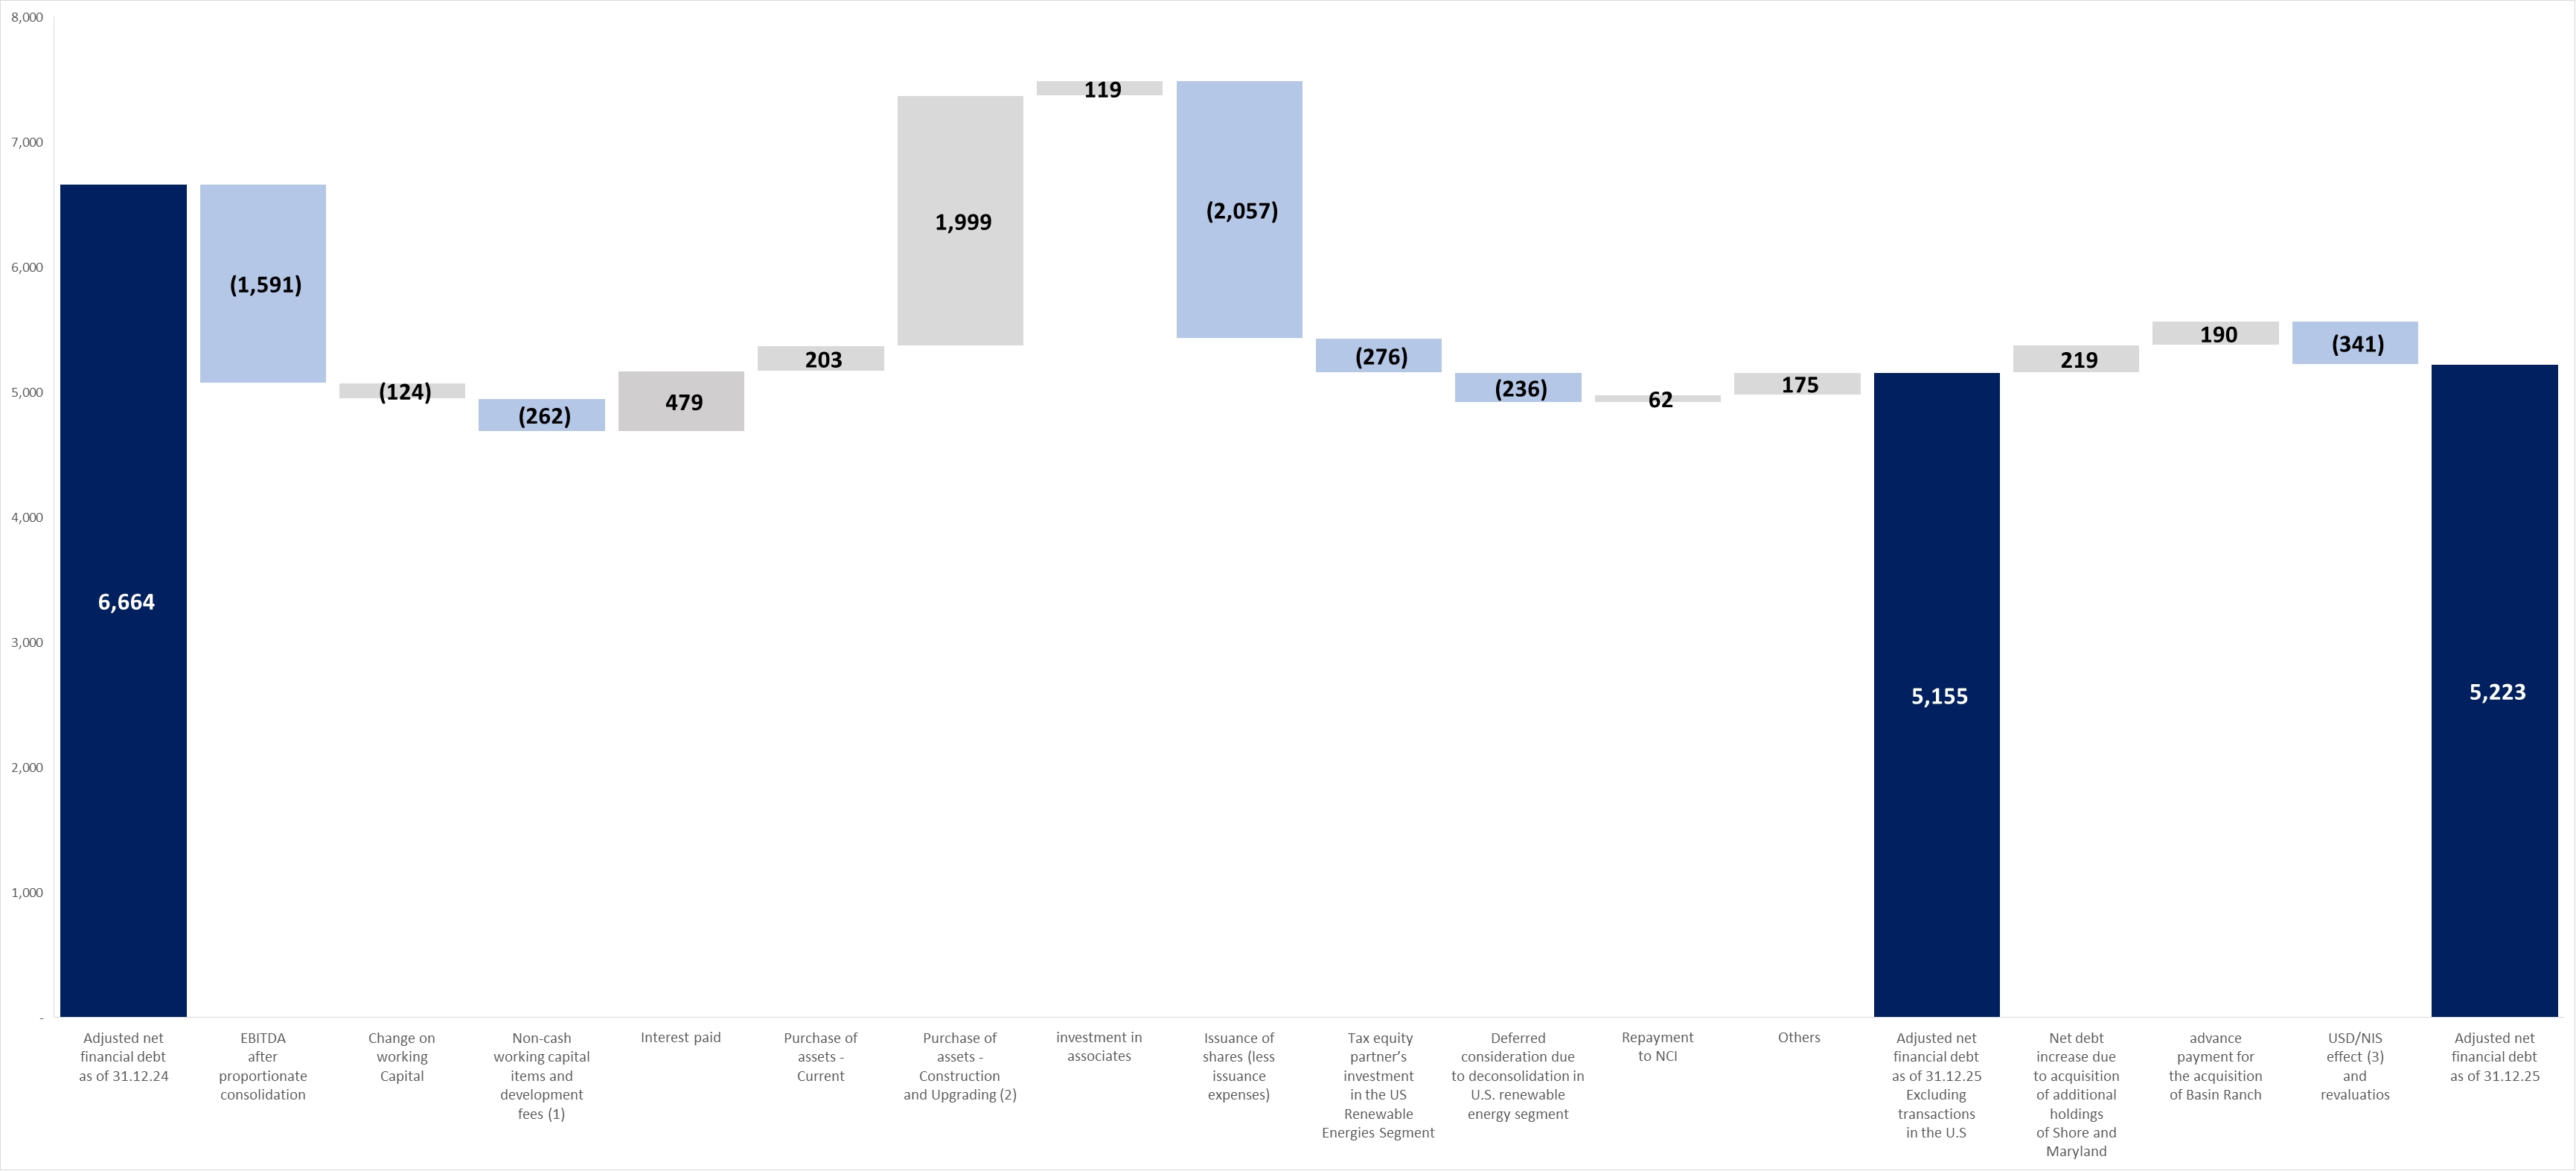
| (1) |
Includes mainly adjustments in respect of the fair value of the profit participation plan for employees of the CPV Group, in the amount of about NIS 141 million, where the date of its payment is in the first quarter of 2026, as
detailed in Section 4B above.
|
| (2) |
Includes an amount of about NIS 68 million for upgrade works carried out at the Rotem power plant in the fourth quarter of 2025, as detailed in Section 4C(1) above.
|
| (3) |
Mainly in respect of translation of the net financial debt of the U.S., which is denominated in dollars, into shekels.
|
72
---Unofficial translation for convenience purposes---
OPC Energy Ltd.
Report of the Board of Directors
8. Financial Position as at December 31, 2025 (in millions of NIS)
|
Category
|
12/31/2025
|
12/31/2024
|
Board’s Explanations
|
||||||
|
Current Assets
|
|||||||||
|
Cash and cash equivalents
|
2,913
|
962
|
For details – see Section 9 below.
|
||||||
|
Trade receivables
|
437
|
293
|
An increase, in the amount of about NIS 68 million, stems from an increase in the balances of receivables from customers in Israel mainly due to an increase in customer consumption, an
increase in the tariff for infrastructure services and an increase in the balances of receivables from customers in the U.S., in the amount of about NIS 76 million, mainly due to an increase in sales of electricity (Retail).
|
||||||
|
Receivables and debit balances
|
206
|
90
|
An increase, in the amount of about NIS 110 million, stems from reclassification of a short‑term loan to Valley. The balance of the loan was paid after the date of the report as part of
the refinancing of Valley.
|
||||||
|
Total current assets
|
3,556
|
1,345
|
|||||||
73
---Unofficial translation for convenience purposes---
OPC Energy Ltd.
Report of the Board of Directors
8. Financial Position as at December 31, 2025 (in millions of NIS) (Cont.)
|
Category
|
12/31/2025
|
12/31/2024
|
Board’s Explanations
|
||||||
|
Non-Current Assets
|
|||||||||
|
Long-term deposits and restricted cash
|
522
|
60
|
Most of the increase stems from deposit of restricted cash designated for construction of the Basin Ranch power plant. For additional details – see Section 6B(1)
above.
|
||||||
|
Long-term receivables and debit balances
|
377
|
162
|
Most of the increase, in the amount of about NIS 201 million, stems from an advance deposit in respect of acquisition of the remaining interest (30%) in the Basin Ranch power plant, an
increase, in the amount of about NIS 121 million, relating to the balance of the development fees receivable from the Basin Ranch power plant. On the other hand, there was a decrease of about NIS 110 million from reclassification of a
subordinated loan to Valley from long‑term to short‑term.
|
||||||
|
Investments in associated companies
|
5,186
|
5,320
|
Most of the decrease derives from a decline in shekel/dollar exchange rate, in the amount of about NIS 713 million, dividends distributed to the CPV Group by associated companies, in the
amount of about NIS 482 million, and an other comprehensive loss from associated companies, in the amount of about NIS 265 million, stemming mainly from transactions hedging the electricity margins. The said decrease was offset by an
investment in Shore, in the amount of about NIS 318 million, for purposes of refinancing the project debt, an investment in the Basin Ranch power plant, in the amount of about NIS 641 million, and the income of associated companies, in
the amount of about NIS 523 million. For additional details regarding the results of associated companies – see Sections 4D and 4E above.
|
||||||
|
Long-term derivative financial instruments
|
42
|
44
|
|||||||
|
Property, plant and equipment
|
4,402
|
4,238
|
Most of the increase stems from an increase, in the amount of about NIS 363 million, in respect of investments in Israel. On the other hand there was a decrease of about NIS 214 million
deriving from depreciation expenses.
|
||||||
|
Right-of use assets and long-term deferred expenses
|
636
|
637
|
|||||||
|
Intangible assets
|
266
|
261
|
|||||||
|
Total non-current assets
|
11,431
|
10,722
|
|||||||
|
Total assets
|
14,987
|
12,067
|
|||||||
74
---Unofficial translation for convenience purposes---
OPC Energy Ltd.
Report of the Board of Directors
8. Financial Position as at December 31, 2025 (in millions of NIS) (Cont.)
|
Category
|
12/31/2025
|
12/31/2024
|
Board’s Explanations
|
||||||
|
Current Liabilities
|
|||||||||
|
Loans and credit from banks and financial institutions (including current maturities)
|
131
|
82
|
Most of the increase stems from update of the current maturities of the loans of OPC Israel.
|
||||||
|
Current maturities of debt from holders of non-controlling interests
|
–
|
14
|
|||||||
|
Current maturities of debentures
|
244
|
212
|
|||||||
|
Trade payables
|
404
|
213
|
Most of the increase stems from an increase in the balance with the System Operator deriving mostly from timing differences and seasonality and a rise in the tariff for infrastructure
services.
|
||||||
|
Payables and other credit balances
|
369
|
123
|
Most of the increase, in the amount of about NIS 220 million, stems from reclassification of current maturities of liabilities in respect of a profit participation plan for employees of
the CPV Group and due to an increase in the said liability as a result of an increase in the fair value of the plan.
|
||||||
|
Total current liabilities
|
1,148
|
644
|
|||||||
75
---Unofficial translation for convenience purposes---
OPC Energy Ltd.
Report of the Board of Directors
8. Financial Position as at December 31, 2025 (in millions of NIS) (Cont.)
|
Category
|
12/31/2025
|
12/31/2024
|
Board’s Explanations
|
||||||
|
Non-Current Liabilities
|
|||||||||
|
Long-term loans from banks and financial institutions
|
3,203
|
2,150
|
Most of the increase derives from taking out a loan, in the amount of NIS 700 million, in OPC Israel in the period of the report and a loan taken out from Bank Leumi
by the CPV Group, in the amount of about NIS 495 million (about $150 million) for financing the Basin Ranch power plant.
|
||||||
|
Long-term debt from holders of non-controlling interests
|
440
|
500
|
Most of the decrease in the amount of about NIS 60 million, stems from repayment of loans from holders of non‑controlling interests in OPC Israel.
|
||||||
|
Debentures
|
1,626
|
1,663
|
Most of the decrease, in the amount of about NIS 515 million, derives from repayment of debentures, including a partial early repayment, in the amount of about NIS 302 million of the
debentures (Series B). On the other hand, there was an increase of about NIS 500 million (gross) stemming from expansion of the debentures (Series D).
|
||||||
|
Long-term lease liabilities
|
21
|
31
|
|||||||
|
Long-term derivative financial instruments
|
3
|
–
|
|||||||
|
Other long-term liabilities
|
15
|
115
|
See explanation in the “other payables and credit balances” section above.
|
||||||
|
Liabilities for deferred taxes
|
524
|
543
|
|||||||
|
Total non-current liabilities
|
5,832
|
5,002
|
|||||||
|
Total liabilities
|
6,980
|
5,646
|
|||||||
|
Total equity
|
8,007
|
6,421
|
Most of the increase stems from issuance of shares, net, in the amount of about NIS 2,057 million, and the net income, in the amount of about NIS 457 million. On the other hand, there was
a decrease as the result of an other comprehensive loss, in the amount of about NIS 926 million (deriving mainly from a sharp decline in a translation reserve shekel/dollar exchange rate).
|
||||||
76
---Unofficial translation for convenience purposes---
OPC Energy Ltd.
Report of the Board of Directors
9. Liquidity and sources of financing
Set forth below is an analysis of significant changes in the cash flows in the period of the report compared with the corresponding
period last year (in NIS millions):
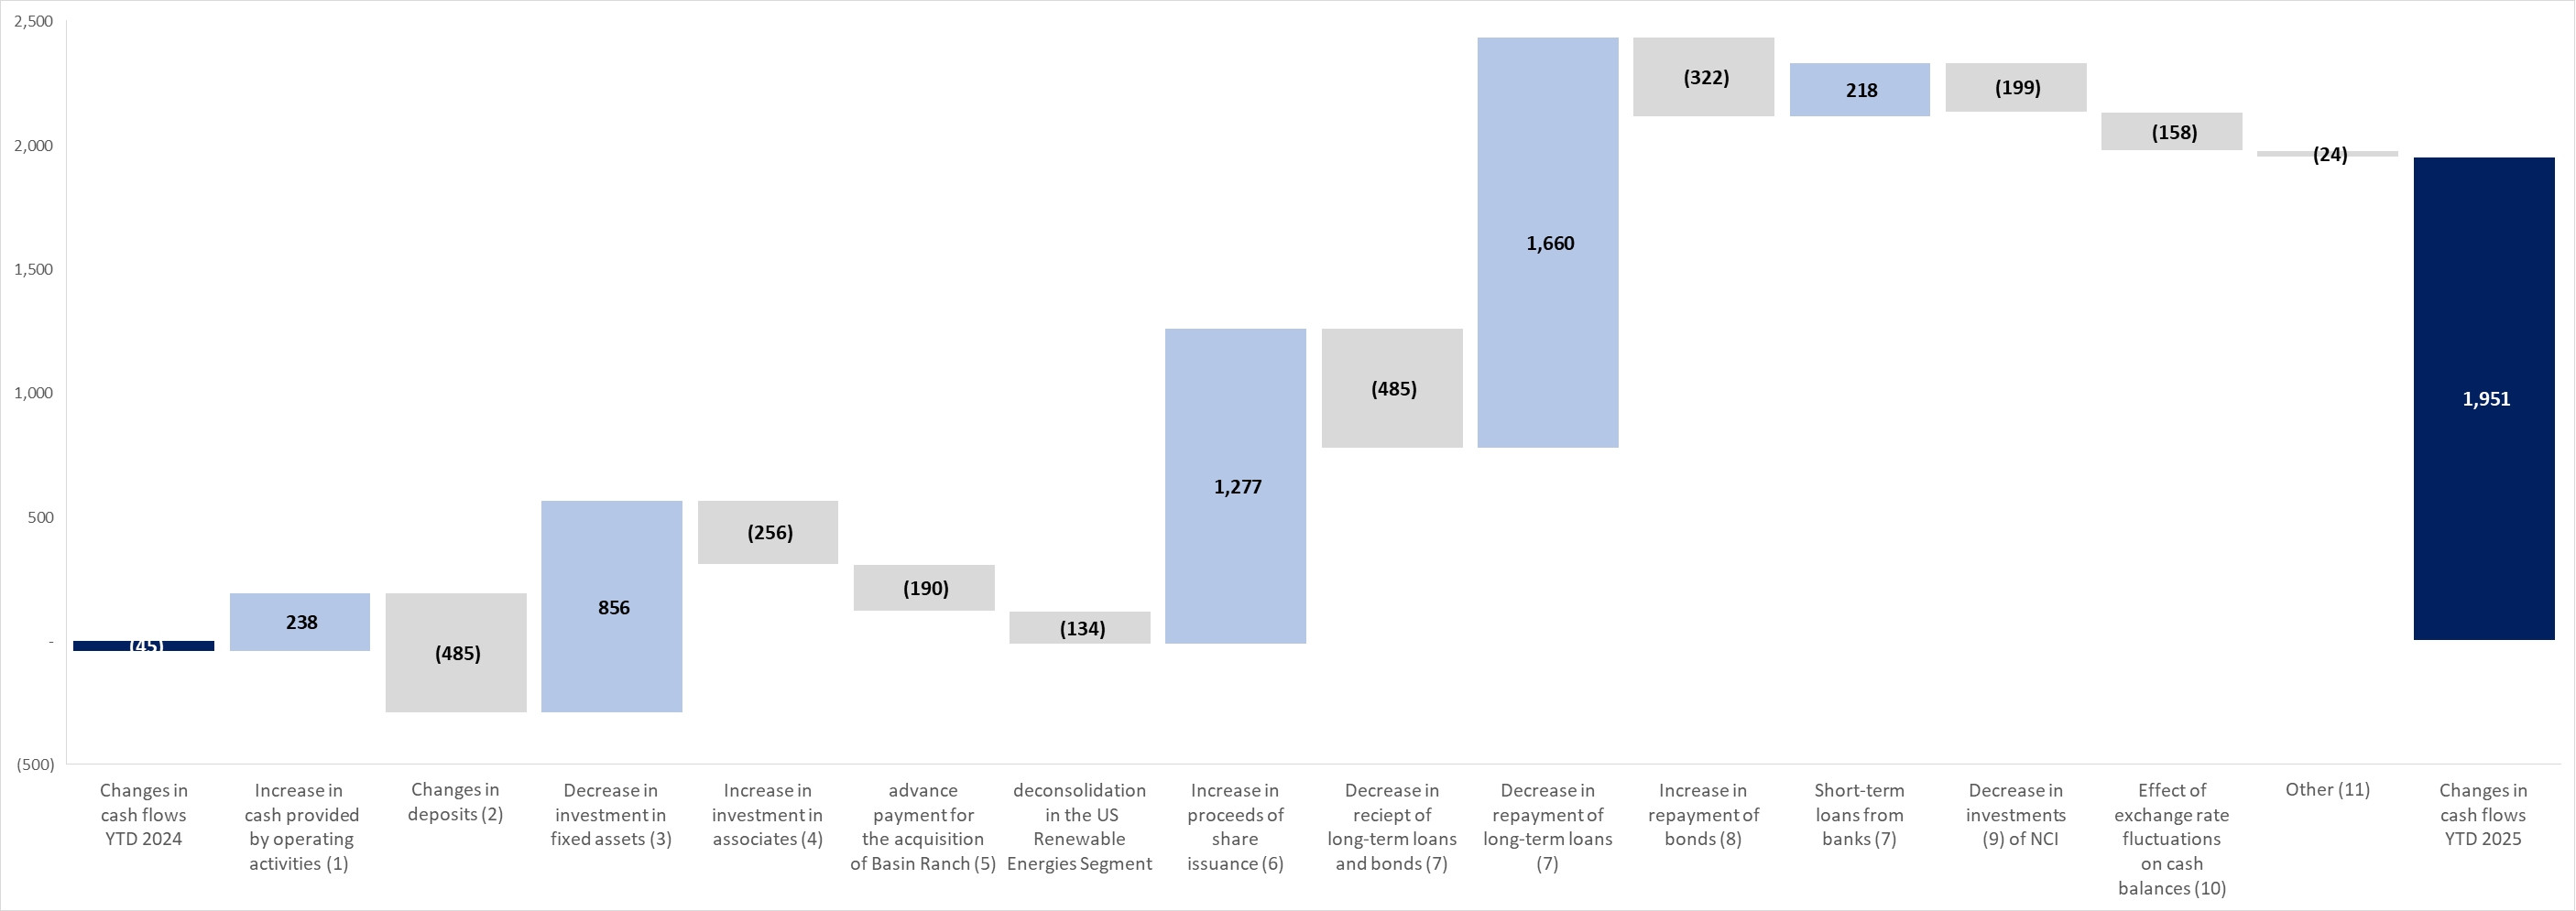
77
---Unofficial translation for convenience purposes---
OPC Energy Ltd.
Report of the Board of Directors
9. Liquidity and sources of financing (Cont.)
| (1) |
Most of the increase in the cash flows provided by operating activities stems from an increase in dividends from associated companies in the U.S., in the amount of about NIS 99 million, a decrease, in the amount of about NIS 52
million, in the tax payments, mainly as a result of transition to the equity method of accounting in CPV Renewable in the corresponding period last year, and a receipt in respect of development fees from the Basin Ranch power plant, in
the amount of about NIS 92 million (about $29 million).
|
| (2) |
Most of the increase derives from deposit of restricted cash designated for construction of the Basin Ranch power plant. For additional details regarding the project – see Section 6B(1) above.
|
| (3) |
Most of the decrease stems from exit from the consolidation of CPV Renewable in the fourth quarter of 2024 and, as a result, transition to the equity method of accounting.
|
| (4) |
Most of the increase stems from: (A) an increase in the rate of holdings in the Shore Power plant and an additional investment in the Shore power plant in the period of the report as part of a refinancing executed in February 2025;
(B) investments in the Basin Ranch power plant; and (C) acquisition of additional rights in the Shore and Maryland power plants, in the corresponding period last year.
|
| (5) |
For additional details regarding acquisition of the remaining interest in the Basin Ranch power plant – see Section 6B(1) above.
|
| (6) |
For additional details regarding an issuance of shares in the period of the report and in the corresponding period last year – see Note 18B to the financial statements.
|
| (7) |
For additional details – see Notes 14 and 15 to the financial statements.
|
| (8) |
For additional details regarding a partial early redemption (prepayment) of the debentures (Series B) – see Note 15 to the financial statements.
|
| (9) |
The decline stems from a decrease in the investments of the non‑controlling interests in the U.S. and repayment of loans to non‑controlling interests in Israel. For additional details – see Note 23D and 23A(3) to the financial
statements.
|
| (10) |
The decrease stems mainly from the impact of the sharp decline in the shekel/dollar exchange rate on the balances of the cash and cash equivalents in the period of the report.
|
| (11) |
Includes mainly: (A) interest paid, in the amount of about NIS 47 million, and a decrease in the investments of the tax partner, in the amount of about NIS 152 million – this being due to the exit of CPV Renewable from the
consolidation in the fourth quarter of 2024; and (B) an increase in receipts due to repayment of partnership capital, in the amount of about NIS 52 million.
|
78
---Unofficial translation for convenience purposes---
OPC Energy Ltd.
Report of the Board of Directors
9. Liquidity and sources of financing (Cont.)
Set forth below is an analysis of significant changes in the cash flows in the fourth quarter of 2025 compared with the corresponding
period last year (in NIS millions):
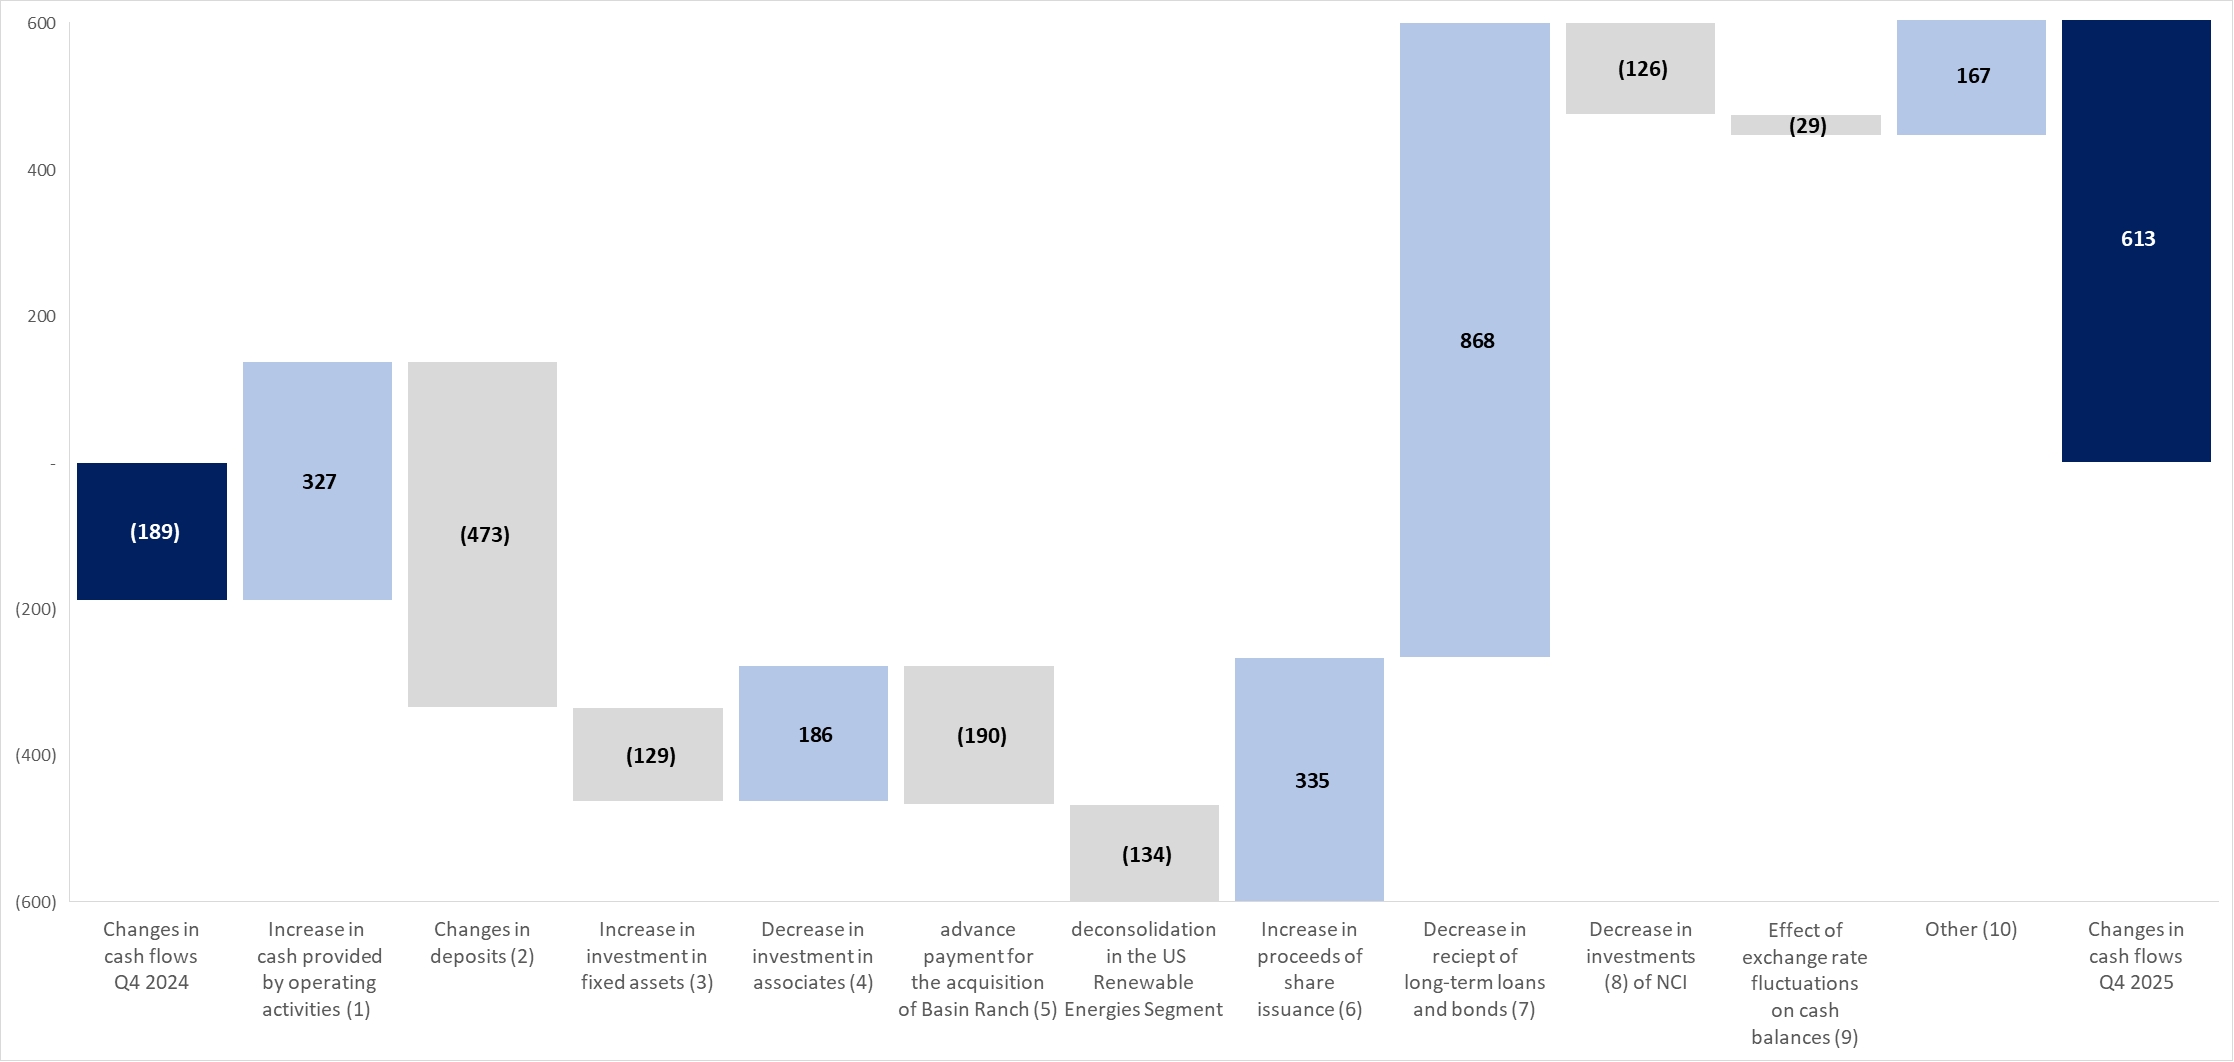
| (1) |
Most of the increase in the cash flows provided by operating activities stems from an increase in the cash‑basis income, in the amount of about NIS 83 million, an increase in dividends from associated companies in the U.S., in the
amount of about NIS 101 million and, on the other hand, a decrease, in the amount of about NIS 56 million, in the tax payments, mainly as a result of transition to the equity method of accounting for CPV Renewable in the corresponding
period last year and a receipt in respect of initiation and development fees from the Basin Ranch power plant, in the amount of about NIS 92 million (about $29 million).
|
| (2) |
Most of the increase derives from deposit of restricted cash designated for construction of the Basin Ranch power plant. For additional details regarding the project – see Section 6B(1) above.
|
| (3) |
Most of the increase stems from an increase in investments in Israel (particularly upgrading and maintenance work performed at the Rotem power plant in the fourth quarter of 2025 and advance payment in respect of main equipment of
Hadera 2).
|
| (4) |
Most of the decrease stems from acquisition of additional rights in the Shore and Maryland power plants in the corresponding quarter last year and, on the other hand, investments in the Basin Ranch power plant in the fourth quarter of
2025.
|
| (5) |
For additional details regarding acquisition of the remaining interest in the Basin Ranch power plant – see Section 6B(1) above.
|
| (6) |
For additional details regarding an issuance of shares in the fourth quarter of 2025 – see Note 18B to the financial statements.
|
| (7) |
For additional details – see Notes 14 and 15 to the financial statements.
|
| (8) |
The decrease derives from a decline in the investments of the non‑controlling interests in the U.S. – see Note 23A(3) to the financial statements.
|
| (9) |
The decrease stems mainly from the sharp decline in the shekel/dollar exchange rate on the balances of cash and cash equivalents in the fourth quarter of 2025.
|
| (10) |
Includes mainly an increase in receipts from repayment of partnership capital in Fairview as part of the amendment of the financing agreement in the fourth quarter of 2025, and distribution of cash balances to the project’s partners.
|
For additional details – see the statements of cash flow in the Company’s consolidated financial statements.
79
---Unofficial translation for convenience purposes---
OPC Energy Ltd.
Report of the Board of Directors
9. Liquidity and sources of financing (Cont.)
As at December 31, 2025 and December 31, 2024, the Group’s working capital (current assets less current liabilities) amounted to about
NIS 2,408 million and about NIS 701 million, respectively.
As at December 31, 2025, there were no warning signs pursuant to Regulation 10(B)(14) of the Securities Regulations (Periodic and
Immediate Reports), 1970, that require publication of a forecasted statement of cash flows by the Company.
10. Debentures (Series B, C and D)
As at the approval date of the report, the Company has three series of debentures it issued (Series B, Series C and Series D). For
details regarding the said debentures, including regarding financial covenants and the manner of compliance therewith – see Note 15 to the Financial Statements.
Set forth below are additional details regarding the Company’s debentures (Series B, Series C and Series D):
|
Name of trustee
|
Reznik Paz Nevo Trustees Ltd.
|
|
|
Name of the party responsible for the series of liability certificates with the trustee
|
Michal Avatlon and/or Hagar Shaul
|
|
|
Contact information
|
Name: Yossi Reznik
|
|
|
Address: 14 Yad Harutzim St., Tel‑Aviv
Telephone: 03–6389200
Fax: 03–6389222
E–mail: Yossi@rpn.co.il
|
||
|
Rating of the debentures since the issuance date
|
In May 2025, Midroog determined an initial rating of A1.il with a stable rating outlook for the Company and its debentures (Series B, C and D). In addition, in May
2025, S&P Maalot raised the Company’s credit rating to ilA+, due to an improvement in the business profile and the financial ratios.
|
|
|
Pledged assets
|
None.
There is a future commitment that the Company will not create a general current lien on its assets and rights, existing and future, in favor of any third party
without the conditions stipulated in the trust certificate being fulfilled.
|
|
|
Is the series material
|
Series B, C and D are material.
|
As at the date of the report, the Company is in compliance with all the conditions of the Company’s debentures (Series B, Series C and
Series D) and the trust certificates. The Company was not required to take any action in accordance with the request of the trustees for the said debentures.
80
---Unofficial translation for convenience purposes---
OPC Energy Ltd.
Report of the Board of Directors
| 11. |
Impacts of changes in the macro‑economic environment on the Group’s activities and its results
|
Changes in the macro‑economic environment, which are characterized by inflation, changes in the currency exchange rates, particularly the dollar against
the shekel and changes in interest rates, could impact the Group’s activities in different ways, including, an impact on the electricity generation component (and as a result an impact on the Company’s natural gas revenues and costs) and other
index‑linked revenues, an increase in fixed expenses (including wages), maintenance costs, project construction costs – both in Israel and in the U.S., equipment acquisition costs and financing expenses in respect of loans and debentures the
Group companies are liable for that bear variable interest and/or are linked to the CPI. In addition, a change in the interest rate could impact the economic feasibility of projects under construction, the discount rates used for examining value
(including impairment of value) of active projects, projects under construction or in the development stage and cash‑generating units to which goodwill was allocated, financing costs in respect of taking out of new debt and the fair value of a
liability in respect of a profit‑sharing plan in the CPV Group.
Set forth below is disclosure regarding the main impacts of changes in the currency exchange rates, inflation (Consumer Price Index) and interest rates on
the Group’s activities62. Taking into account the complexity of an analysis of the impacts of the said factors, particularly since some of them are indirect (and not direct) impacts and the existence of reciprocal relationships between
the various macro‑economic parameters, the Company is not able to estimate the impacts of the changes in the said macro‑economic parameters on the Company’s overall results.
Currency (particularly the dollar)
The Group is exposed to changes in the currency exchange rates, particularly the exchange rate of the dollar.
The Company’s activities in Israel are exposed to a change in the exchange rate of the dollar, directly and indirectly, due to the linkage of a significant
part of its revenues to the generation tariff (which is impacted, in part, by changes in the exchange rate of the dollar), while on the other hand acquisitions of the natural gas, some of which are linked to the dollar exchange rate and/or are
denominated based on the dollar exchange rate, are also linked to the generation tariff (which, as noted is impacted in part by changes in the dollar exchange rate) and include dollar floor prices.
Therefore, the structure of the Company’s activities in Israel includes a partial natural (intrinsic) hedge – even though strengthening of the dollar
increases the cost of the natural gas purchased by the Company, the structure of the revenues should reduce the said exposure. Nonetheless, it is pointed out that the generation component, which is impacted by various parameters and is subject to
changes (including by force of regulation) is updated, generally, once a year (in 2026–2028 once every six months in accordance with a predetermined linkage mechanism), and accordingly differences are possible, including timing differences,
between the impact of a strengthening of the rate of the dollar on the current gas cost and its impact on the revenues and, in turn, on Company’s gross margin for that period. Timing differences, as stated, could have a negative effect on the
Company’s current profit and cash flows – at least in the short run.
62 The disclosure stated in this Section below is based on the Company’s estimates in accordance with assumptions and analyses made as at the
date of the report only. Ultimately, the impacts of macro‑economic events could be different than that stated, as a result of, among other things, the type and scope of the macro‑economic events, the impact thereof on third parties related to the
Company and/or changes in the relevant regulatory policies. In addition, the Company’s estimates regarding the impacts of the said factors on its results might not materialize, in whole or in part, as a result of, among other things, regulatory
policies, market conditions, operating factors and changes in the Company’s undertakings and/or due to one or more of the risk factors the Company is exposed to, as stated in Section 19 of Part A of the Periodic Report.
81
---Unofficial translation for convenience purposes---
OPC Energy Ltd.
Report of the Board of Directors
| 11. |
Impacts of changes in the macro‑economic environment on the Group’s activities and its results (Cont.)
|
Currency (particularly the dollar) (Cont.)
It is noted that where the gas price is equal to or lower than the floor price, the Company is exposed to a larger extent to changes in the dollar/shekel
exchange rate and to reductions in the generation component since the natural (built‑in) protection, as stated above, is fully or partly compromised, and that stated could have a negative impact on the Company’s profits.
In addition, from time to time the Company signs significant construction and maintenance contracts that are denominated in different currencies,
particularly the dollar and the euro.
It is noted that from time to time, and based on business considerations and risk‑management policies, the Company makes use of forward contracts on the
exchange rates for hedging part of the currency exposures as detailed above.
With reference to the Company’s investment in the CPV Group, which operates in the U.S. with a dollar functional currency, in general a weakening of the
dollar rate has a negative impact on the (dollar) value of the Company’s investment and on the Company’s net income and shareholders’ equity, due to translation of the results of the CPV Group from dollars into shekels (which is the operational
currency of the Company). On the other hand, from time to time there could be a need to raise financing in Israel in shekels in order to finance the activities of the CPV Group, particularly for the benefit of expected investments in the backlog
of construction and pipeline projects of the CPV Group. Accordingly, a strengthening of the dollar exchange rate could lead to an increase in the financing requirements in order to realize these needs.
Set forth below is data with reference to the currency exchange rate:
|
Dollar/shekel exchange rate*
|
2025
|
2024
|
Change
|
|||||||||
|
On December 31
|
3.190
|
3.647
|
(12.5
|
)%
|
||||||||
|
On September 30
|
3.306
|
3.710
|
(10.9
|
)%
|
||||||||
|
Average January – December
|
3.453
|
3.699
|
(6.7
|
)%
|
||||||||
|
Average October – December
|
3.249
|
3.692
|
(12.0
|
)%
|
||||||||
| * |
The dollar/shekel exchange rate shortly before the approval date of the report (on March 9, 2026) is 3.115.
|
Consumer Price Index (CPI) (inflation)
The Group is exposed to changes in the CPI. Regarding its activities in Israel, the Company is exposed to changes in the CPI, directly and indirectly,
mainly due to linkage of a significant part of its revenues to the generation component (which is impacted partly by a change in the CPI), and due to the fact that most of its capacity revenues are linked to the CPI. On the other hand, purchases
of the natural gas are partly linked to the generation tariff. Also, part of the Company’s capital costs and investments and part63 of the Hadera financing agreement are linked to the CPI, directly or indirectly. Furthermore, the
Company is exposed to changes in the CPI with respect to the terms of the Company’s debentures (Series B). An increase in the CPI increases the Company’s liabilities and financing costs.
| 63 |
In order to reduce part of the exposure to changes in the CPI relating to the Hadera financing agreement, in June 2019 the Group entered into transactions with a bank to hedge part of the exposure to the CPI.
|
82
---Unofficial translation for convenience purposes---
OPC Energy Ltd.
Report of the Board of Directors
| 11. |
Impacts of changes in the macro‑economic environment on the Group’s activities and its results (Cont.)
|
Consumer Price Index (CPI) (inflation) (Cont.)
Therefore, the structure of the Company’s activities includes a partial natural (intrinsic) hedge – despite the fact that an increase in the CPI increases
the Company’s costs (including the financing costs) and investments, the structure of the revenues should reduce the said exposure, such that the Company’s profits could be positively affected by an increase in the CPI. Nonetheless, it is noted
that the generation component is impacted by various parameters and is subject to changes (including by force of regulation), generally, once a year (in 2026–2028 once every six months in accordance with a predetermined linkage mechanism), and,
accordingly, differences are possible between the impact of inflation of the Company’s costs and its impact of the revenues and, accordingly, on the Company’s gross margin for that period.
Interest rate (mainly shekel and dollar)
The Group has loans and liabilities bearing variable interest that are based on prime or SOFR plus a margin. An increase in the variable interest rates
could cause an increase in the Group’s financing costs. In addition, an increase in the interest rates could trigger an increase in the financing costs in respect of new debt taken out by the Group (for purposes of refinancing and/or growth).
Furthermore, an increase in the interest rates could impact the discount rates for projects (active, under construction and in development) and could also lead to a lack of economic feasibility of continued development and/or acquisition of
projects and a slowdown in the Company’s growth processes, along with changes in the fair value of assets, particularly the existence of signs of impairment of value of assets and/or recording of impairment losses in the financial statements.
In order to reduce the exposure to changes in the interest rates in Israel, the Group makes use of a mix of loans (including credit frameworks) and
debentures in such a manner that part of the loans and the debentures bear fixed interest and part of them bear variable interest.
In the CPV Group, most of the long‑term loans and credit frameworks bear variable interest (mainly SOFR) and have exposure to changes in the interest
rates. In order to reduce part of the exposure to interest risk, the CPV Group enters into transactions for swaps of variable dollar interest for fixed dollar interest (IRS) with respect to a significant part of the balances of its long‑term
loans. In addition, due to the project financing conditions of the associated companies (cash sweep mechanisms), there is a significant decline in the scope of the debt in the Energy Transition segment and, accordingly, in the exposure of the
CPV Group to an increase in the interest rate of the time of refinancing.
Set forth below are details regarding changes in the interest in the period of the report and thereafter:
In Israel, in November 2025, Bank of Israel decided to lower the interest by 0.25% and to set it at 4.25%. In January 2026, Bank of Israel decided to make
another interest rate reduction of 0.25% and to set it at 4.00%. Pursuant to the latest forecast published by Bank of Israel, the interest rate is expected to decline to an average of 3.50% in the fourth quarter of 2026.
In the U.S., in September, October and December 2025, the U.S. Federal Reserve Bank decided to lower the interest by 0.25% (in each decision) to the level
of 3.50%–3.75%, where this rate prevailed as at the date of the report. Pursuant to the latest projection published by the U.S. Federal Reserve Bank, the interest rate is expected to decline to an average in the range of 2.9%–3.6% during 2026.
83
---Unofficial translation for convenience purposes---
OPC Energy Ltd.
Report of the Board of Directors
| 11. |
Impacts of changes in the macro‑economic environment on the Group’s activities and its results (Cont.)
|
Interest rate (mainly shekel and dollar) (Cont.)
It is noted that the changes and the geopolitical tensions in and outside of Israel also have an impact on the macro‑economic environment, including on
Bank of Israel’s policy decisions (among other things with respect to the circumstances of the war), as detailed in Section B2. above, and events of this type could have an impact on inflationary aspects and interest rates.
Set forth below is data relating to the Consumer Price Index (CPI) in Israel and in the U.S., interest rates of Bank of Israel and interest rates of the
U.S. Federal Reserve Bank:
|
Bank of
|
||||||||||||||||
|
Israel
|
Federal
|
|||||||||||||||
|
Israeli
|
U.S.
|
Interest
|
interest
|
|||||||||||||
|
CPI
|
CPI
|
Rate
|
rate
|
|||||||||||||
|
On March 9, 2026
|
117.5
|
325.2
|
4.00
|
%
|
3.50%–3.75
|
%
|
||||||||||
|
On December 31, 2025
|
117.3
|
324.1
|
4.25
|
%
|
3.50%–3.75
|
%
|
||||||||||
|
On September 30, 2025
|
118.5
|
324.0
|
4.5
|
%
|
4.00%–4.25
|
%
|
||||||||||
|
On December 31, 2024
|
115.1
|
315.5
|
4.5
|
%
|
4.25%–4.50
|
%
|
||||||||||
|
On September 30, 2024
|
115.2
|
314.8
|
4.5
|
%
|
4.75%–5.00
|
%
|
||||||||||
|
On December 31, 2023
|
111.3
|
307.1
|
4.75
|
%
|
5.25%–5.50
|
%
|
||||||||||
|
Change in 2025
|
1.9
|
%
|
2.7
|
%
|
(0.25
|
)%
|
(0.75
|
)%
|
||||||||
|
Change in 2024
|
3.4
|
%
|
2.7
|
%
|
(0.25
|
)%
|
(1.0
|
)%
|
||||||||
|
Change in the fourth quarter of 2025
|
(1.0
|
)%
|
0
|
%
|
(0.25
|
)%
|
(0.50
|
)%
|
||||||||
|
Change in the fourth quarter of 2024
|
(0.1
|
)%
|
0.2
|
%
|
0
|
%
|
(0.50
|
)%
|
||||||||
For details with respect to credit linked to the CPI or the prime interest rate – see this Section below and Note 14B to the financial statements.
For additional details regarding the Group’s policies for management of the financial risks and sensitivity analyses, including changes in the CPI and
interest – see Note 21 to the financial statements.
84
---Unofficial translation for convenience purposes---
OPC Energy Ltd.
Report of the Board of Directors
| 11. |
Impacts of changes in the macro‑economic environment on the Group’s activities and its results (Cont.)
|
Interest and linkage bases
Set forth below are tables detailing the adjusted financial debt as at December 31, 2025 and 2024 (in millions of NIS) in Israel broken down into debt
bearing unlinked fixed interest / fixed debt, debt bearing fixed interest linked to the CPI and debt bearing prime interest:
|
As at
December 31, 2025
|
Total
debt
|
Debt bearing
unlinked
fixed interest/
fixed debt
|
Debt bearing
fixed interest
linked to the CPI
|
Debt bearing
prime interest
|
Weighted-
average
interest as of
December 31
2025
|
|||||||||||||||||||||||||||
|
Total
|
Interest
|
Total
|
Interest
|
Total
|
Interest
|
|||||||||||||||||||||||||||
|
The Company (debentures)
|
1,889
|
1,364
|
4.4
|
%
|
525
|
2.8
|
%
|
–
|
–
|
3.9
|
%
|
|||||||||||||||||||||
|
OPC Israel (bank)
|
2,300
|
–
|
–
|
–
|
–
|
2,300
|
6.25%–6.4
|
%
|
6.25%–6.4
|
%
|
||||||||||||||||||||||
|
Hadera (bank)
|
548
|
459
|
5.3
|
%
|
89
|
3.5
|
%
|
–
|
–
|
4.9
|
%
|
|||||||||||||||||||||
|
As at
December 31, 2024
|
Total
debt
|
Debt bearing
unlinked
fixed interest/
fixed debt
|
Debt bearing
fixed interest
linked to the CPI
|
Debt bearing
prime interest
|
Weighted-
average
interest as of
December 31
2024
|
|||||||||||||||||||||||||||
|
Total
|
Interest
|
Total
|
Interest
|
Total
|
Interest
|
|||||||||||||||||||||||||||
|
The Company (debentures)
|
1,891
|
969
|
3.3
|
%
|
922
|
2.8
|
%
|
–
|
–
|
3.0
|
%
|
|||||||||||||||||||||
|
OPC Israel (bank)
|
1,649
|
–
|
–
|
–
|
–
|
1,649
|
6.3%–6.4
|
%
|
6.3%–6.4
|
%
|
||||||||||||||||||||||
|
Hadera (bank)
|
585
|
484
|
5.3
|
%
|
101
|
3.5
|
%
|
–
|
–
|
4.9
|
%
|
|||||||||||||||||||||
85
---Unofficial translation for convenience purposes---
OPC Energy Ltd.
Report of the Board of Directors
| 11. |
Impacts of changes in the macro‑economic environment on the Group’s activities and its results (Cont.)
|
Interest and linkage bases (Cont.)
Set forth below are tables detailing the adjusted financial debt as at December 31, 2025 and 2024 (in millions of NIS) in Israel broken down into debt
bearing fixed interest and debt bearing SOFR interest. The debt includes the net financial debt of the associated companies in the U.S. based on the rate of holdings of the CPV Group in these companies:
|
As at
December 31, 2025
|
Rate of
holdings
of the
CPV
Group
|
Total
debt
|
Interest
margin
on
long-
term
loans
|
Fixed debt
|
Debt bearing
SOFR interest
|
Weighted-
average
interest as at
December 31
2025
|
||||||||||||||||||||||||||
|
Total
|
Interest
|
Total
|
Interest
|
|||||||||||||||||||||||||||||
|
Active renewable energy
|
1.24
|
%
|
||||||||||||||||||||||||||||||
|
projects
|
66.7
|
%
|
502
|
2.85
|
%
|
333
|
5.1
|
%
|
169
|
5.9
|
%
|
5.3
|
%
|
|||||||||||||||||||
|
Financing of construction of
|
1.50
|
%
|
||||||||||||||||||||||||||||||
|
Rogues Wind
|
66.7
|
%
|
249
|
1.75
|
%
|
202
|
5.0
|
%
|
47
|
5.6
|
%
|
5.1
|
%
|
|||||||||||||||||||
|
Fairview*
|
25
|
%
|
539
|
2.50
|
%
|
269
|
6.0
|
%
|
270
|
6.4
|
%
|
6.2
|
%
|
|||||||||||||||||||
|
Towantic
|
26
|
%
|
179
|
3.75
|
%
|
129
|
8.0
|
%
|
50
|
7.7
|
%
|
7.9
|
%
|
|||||||||||||||||||
|
Maryland
|
75
|
%
|
625
|
3.25
|
%
|
385
|
5.1
|
%
|
240
|
6.9
|
%
|
5.8
|
%
|
|||||||||||||||||||
|
Shore
|
89
|
%
|
821
|
3.75
|
%
|
417
|
7.8
|
%
|
404
|
7.8
|
%
|
7.8
|
%
|
|||||||||||||||||||
|
Valley*
|
50
|
%
|
459
|
5.50
|
%
|
–
|
–
|
459
|
9.8
|
%
|
9.8
|
%
|
||||||||||||||||||||
|
Three Rivers
|
10
|
%
|
202
|
3.75
|
%
|
173
|
4.7
|
%
|
29
|
7.9
|
%
|
5.2
|
%
|
|||||||||||||||||||
|
Basin Ranch
|
70
|
%
|
421
|
–
|
421
|
3.0
|
%
|
–
|
–
|
3.0
|
%
|
|||||||||||||||||||||
|
CPV Group
|
100
|
%
|
489
|
3.08
|
%
|
–
|
–
|
489
|
7.1
|
%
|
7.1
|
%
|
||||||||||||||||||||
| (*) |
For details regarding an undertaking in a new financing agreement after the date of the report, including reduction of the interest margin on the loan to 2.75% – see Section 7A(6) above.
|
|
As at
December 31, 2024
|
Rate of
holdings
of the
CPV
Group
|
Total
debt
|
Interest
margin
on
long-
term
loans
|
Fixed debt
|
Debt bearing
SOFR interest
|
Weighted-
average
interest as at
December 31
2024
|
||||||||||||||||||||||||||
|
Total
|
Interest
|
Total
|
Interest
|
|||||||||||||||||||||||||||||
|
Active renewable energy
|
1.13
|
%
|
||||||||||||||||||||||||||||||
|
projects
|
66.7
|
%
|
322
|
1.73
|
%
|
238
|
3.5
|
%
|
84
|
6.0
|
%
|
4.2
|
%
|
|||||||||||||||||||
|
Financing of construction of
|
2.10
|
%
|
||||||||||||||||||||||||||||||
|
renewable energy projects
|
66.7
|
%
|
425
|
2.85
|
%
|
178
|
6.9
|
%
|
247
|
6.2
|
%
|
6.5
|
%
|
|||||||||||||||||||
|
Fairview
|
25
|
%
|
481
|
3.50
|
%
|
243
|
7.2
|
%
|
238
|
8.1
|
%
|
7.6
|
%
|
|||||||||||||||||||
|
Towantic
|
26
|
%
|
213
|
3.75
|
%
|
156
|
8.0
|
%
|
57
|
8.4
|
%
|
8.1
|
%
|
|||||||||||||||||||
|
Maryland
|
75
|
%
|
893
|
3.75
|
%
|
497
|
5.6
|
%
|
396
|
7.9
|
%
|
6.6
|
%
|
|||||||||||||||||||
|
Shore
|
69
|
%
|
1,096
|
3.75
|
%
|
803
|
4.1
|
%
|
293
|
8.4
|
%
|
5.2
|
%
|
|||||||||||||||||||
|
Valley
|
50
|
%
|
687
|
5.50
|
%
|
–
|
–
|
687
|
10.4
|
%
|
10.4
|
%
|
||||||||||||||||||||
|
Three Rivers
|
10
|
%
|
252
|
3.75
|
%
|
212
|
4.6
|
%
|
40
|
8.4
|
%
|
5.2
|
%
|
|||||||||||||||||||
86
---Unofficial translation for convenience purposes---
OPC Energy Ltd.
Report of the Board of Directors
| 12. |
Material Valuations
|
Annual examination of impairment of value of goodwill created in respect of acquisition of the Gat power plant
Further to that stated in Note 11 to the financial statements regarding the balance of the goodwill created in respect of acquisition of the Gat power
plant and an annual examination of impairment of value, as at the date of the report the Company performed a valuation for determination of the recoverable amount of the cash generating unit included in the Rotem, Hadera and Gat power plants
(“the Cash Generating Units”) for purposes of an annual impairment of value of the goodwill examination (“the Valuation”). The Valuation was performed at the level of the Cash Generating Unit since this is the lowest level at which the goodwill
is monitored for internal management purposes.
Details of the valuation:
|
Subject matter of the Valuation
|
Determination of the recoverable amount of the Cash Generating Units for purposes of an annual impairment of value of goodwill examination in
accordance with the provisions of IAS 36.
|
||
|
Date of the Valuation
|
Effective date of the valuation: December 31, 2025.
Approval date of the valuation: March 11, 2026.
|
||
|
Book value attributed to a Cash‑Generating Unit as at the date of the Valuation
|
Total of the Cash‑Generating Unit – about NIS 2.7 billion.
|
||
|
Recoverable amount of the Rotem power plant as determined pursuant to the Valuation
|
Only the Rotem power plant– about NIS 4.9 billion.
The recoverable amount of the Rotem power plant alone exceeds the book value of the entire Cash‑Generating Unit and, therefore, it is not
necessary to recognize a loss from impairment of value in the Company’s books.
|
||
|
Identity of the appraiser and its characteristics
|
The valuation was performed by the Company.
|
||
|
Valuation model
|
The recoverable amount of the cash generating unit was determined as follows: for the Rotem power plant only based on the value in use using the
DCF (discounting of cash flows) method.
|
||
|
The assumptions based on which the appraiser performed the Valuation
|
Set forth below are the main assumptions that were used in determination of the use value of the Rotem power plant:
|
||
| – | Forecast years – represent the period between 2026 and 2043, and are based on an estimate of the economic life of the power plant and its value at the end of the forecast period. | ||
| – | Forecast of the generation component and natural gas prices that are not backed by an agreement – based on market forecasts received from external independent information sources. | ||
| – | Long-term annual inflation rate of 2.2%. | ||
| – | Weighted‑average cost of capital (WACC) – 7% which was determined by an external, independent appraiser. | ||
87
---Unofficial translation for convenience purposes---
OPC Energy Ltd.
Report of the Board of Directors
| 12. |
Material Valuations (Cont.)
|
Annual examination of impairment of value of goodwill created in respect of acquisition of the Gat power plant (Cont.)
Details of the valuation: (Cont.)
|
Sensitivity analysis for changes in the main parameters
|
An increase of 1% in the WACC (about NIS 490 million).
A decrease of 5% in the generation component tariff (about NIS 395 million).
|
|
|
Examination of attachment of the valuation
|
Notwithstanding that the valuation meets the quantitative thresholds for “Very Significant Valuations”, as determined in the Position of the
Securities Authority 105‑23 “Parameters for Examination of the Significance of the Valuation”, since here a periodic examination of impairment of value of goodwill is involved without there having been signs of impairment, and in the
Company’s estimation, based on sensitivity analyses performed by it, as at the date of the report, whereby every possible reasonable change in the key assumptions used in determination of the recoverable amount of the cash‑generating unit
would not lead to recognition of a significant loss from impairment of value, instead of attaching the Valuation it is permissible to disclose the Valuation as a “Significant Valuation” pursuant to Regulation 8(I) of the Securities
Regulations (Periodic and Immediate Reports), 197064.
|
64 After an examination, as stated, in accordance with that stated in Section 3 of the Clarification to a Legal Position No. 23‑105 “Parameters
for Examination of the Significance of Valuations: Questions and Answers”.
88
---Unofficial translation for convenience purposes---
OPC Energy Ltd.
Report of the Board of Directors
| 12. |
Material Valuations (Cont.)
|
Discontinuance of consolidation of the renewable energies segment in the U.S. and transition to the equity method of accounting
Further to that stated in Note 23 to the financial statements regarding a transaction involving entry of an investor into CPV Renewable Power LP (“CPV
Renewable”), discontinuance of consolidation in the Company’s financial statements and transition to application of the equity method of accounting, as at the completion date of the transaction, in November 2024, an initial valuation was
performed to determine the fair value of the assets and liabilities of CPV Renewable, by means of an independent, external appraiser (EY). The valuation was finished in the fourth quarter of 2025, without there having been a significant impact on
the financial statements.
Details of the valuation:
|
Subject matter of the Valuation
|
Allocation of the fair value of the investment in CPV Renewable on the date of the transition from consolidation to significant influence to the
share of the CPV Group in the identifiable assets and liabilities of CPV Renewable.
|
|
|
Date of the Valuation
|
Effective date of the valuation: October 31, 2024.
Approval date of the valuation: March 8, 2026.
|
|
|
Value of the identifiable assets and liabilities and the amount of the goodwill as at the date of the
valuation
|
The fair value of CPV Renewable amounts to about NIS 3.4 billion (about $892 million), the share of the CPV Group (66.7%) amounts to about NIS 2.2
billion (about $595 million).
|
|
|
Identity of the appraiser and its characteristics
|
The valuation was performed by a team headed by Mr. Guy Feibish, CPA, partner in the area of valuations and economic models (VME) of the
international firm of Certified Public Accountants EY (Ernst & Young).
Mr. Feibish is a Certified Public Accountant (CPA) in Israel and holds a bachelor’s degree (BA) in economics with specialization in accounting
from Ben‑Gurion University in the South, Beer Sheva.
As part of his position, Mr. Feibish runs projects for leading public and private companies in their areas of activities – in and outside of
Israel, and accompanies domestic and foreign transactions, directs complicated valuations having a range of targets, including financial reporting, taxation, regulatory compliance and raising of capital, in a variety of sectors,
including, real estate, retail, industry, energy and communications. In addition, as part of his position, Mr. Feibish accompanies companies in planning and assimilation of business strategy and processes. Also, Mr. Feibish has experience
in issuance of economic opinions for purposes of legal proceedings and/or commercial disputes.
|
89
---Unofficial translation for convenience purposes---
OPC Energy Ltd.
Report of the Board of Directors
12. Material Valuations (Cont.)
Discontinuance of consolidation of the renewable energies segment in the U.S. and transition to the equity method of accounting (Cont.)
|
Valuation model
|
The fair value of the projects was estimated using the following methodology:
A. With reference to projects in commercial operation or under construction – using the DFC (discounted cash flows) method by discounting the
future cash flows of each project, at the after‑tax weighted‑average cost of capital (WACC).
B. With reference to the projects in interim and advanced development stages – based on an estimate of the fair value per kilowatt and the
probability rates with respect to realization depending on the stage of the development.
C. With reference to pipeline projects in initial development stage – based on cost.
|
||
|
Assumptions according to which the appraiser performed the valuation
|
Set forth below are the main assumptions used in determination of the fair value of the projects:
|
||
| – | The weighted‑average cost of capital (WACC) – was calculated for each significant active and under construction project separately and ranged between about 6.25% and about 7%. | ||
| – | Market prices and capacity – the market prices (electricity, capacity, RECs, etc.) are based on PPA agreements and market forecasts received from external and independent information
sources, taking into account the relevant area (region) and market for each project as well as the relevant regulation. |
||
| – | Forecast years – represent the period between 2024 and 2054, and are based on an estimate of the economic life of the power plants and their value at the end of the forecast period. |
||
| – | Estimate of the construction cost of the projects and the entitlement to tax benefits in respect of projects under construction (ITC or PTC, as applicable). | ||
| – | A long‑term rate of inflation of 2.2%. | ||
90
---Unofficial translation for convenience purposes---
OPC Energy Ltd.
Report of the Board of Directors
Corporate Governance
13. Directors having Accounting and Financial Expertise
As at the date of this report, seven of the members of the Company’s Board of Directors have accounting and financial expertise. For
details regarding the directors Aviad Kaufman, Antoin Bonaire, Robert Rosen, Yosef Tene, Sarit Sagiv, Shirly Mashkif and Itay Makov who were classified as directors with accounting and financial expertise – see Regulation 26 of Chapter D
(Additional Details regarding the Company).
The Board of Directors determined that the minimum number of directors having accounting and financial expertise in accordance with
Section 92(A)(12) of the Companies Law, 1999, is two – this being taking into account the type of the Company, its size, the scope of its activities and the complexity of its activities.
14. Independent Directors
In addition to the external directors Yosef Tene and Shirly Mashkif, the directors Sarit Sagiv and Itay Makov, serve as independent
directors of the Company.
As at the date of the report, the Company’s Articles of Association do not include a provision regarding the required proportion of
the independent directors.
91
---Unofficial translation for convenience purposes---
OPC Energy Ltd.
Report of the Board of Directors
15. Internal Auditor
|
Name of the Internal Auditor
|
Mr. Eyal Baasch (“the Internal Auditor”).
|
|
|
Education and professional experience
|
Certified Internal Auditor (C.I.A.); Certified Risk Management Auditor (CRMA).
Bachelor’s degree in Social Sciences (Extended Economics) – Hebrew University in Jerusalem; Master’s degree in Business Administration (MBA) (specialization in
accounting and finance) from the College of Management.
Since 2012 he is a partner in the area of risk management and economics in the Office of Rosenbloom – Holzman, CPAs. Possesses extensive professional experience in
the area of internal auditing.
|
|
|
Start date of service
|
August 13, 2024.
|
|
|
Compliance with legal requirements
|
To the best of the Company’s knowledge, according to the declaration of the Internal Auditor, the Internal Auditor meet the requirements of Section 146(B) of the
Companies Law and the provisions of Section 8 of the Internal Audit Law, 1992 (“the Internal Audit Law”).
|
|
|
Employment format
|
The Internal Auditor provides the Company internal audit services and he is not an employee of the Company in a full‑time position. In addition, he does not hold an
additional position in the Company aside from his service as the Internal Auditor.
|
|
|
Manner of appointment
|
The appointment of the Internal Auditor was approved by the Board of Directors on August 13, 2024, after a recommendation of the Audit Committee on August 11, 2024.
The Company’s Audit Committee and Board of Directors examined his qualifications, education and experience in internal auditing.
|
|
|
The party to whom the Internal Auditor reports
|
The Chairman of the Board of Directors.
|
|
|
Other relationships the Internal Auditor has with the Company
|
To the best of the Company’s knowledge, the Internal Auditor does not hold securities of the Company.
The Internal Auditor is not an interested party in the Company or a relative of an interested party in the Company and is not a relative of the auditing CPA or a
party on its behalf.
|
92
---Unofficial translation for convenience purposes---
OPC Energy Ltd.
Report of the Board of Directors
15. Internal Auditor (Cont.)
|
The work plan
|
The audit work plan for 2025, which was approved by the Audit Committee, is for one year. The work plan of the Company and
its subsidiaries was determined based on, among others, the following considerations: coverage of the Company’s main areas of activity, risk centers and exposures known to the Internal Auditor and to management; a risks’ survey for
purposes of the internal audit work that was performed by the Internal Auditor, potential for savings and efficiency; recurring items and monitoring correction of deficiencies; and implementation of recommendations.
The audit work plan is submitted for analysis and approval by the Company’s Audit Committee and Board of Directors. The
Internal Auditor has discretion to recommend a variance from the work plan to management and the Audit Committee, where necessary.
Audit reports were submitted to the Audit Committee and management. The Company’s Board of Directors received an update
regarding the audit reports.
Meetings of the Audit Committee were held to discuss the audit reports on the following dates: August 10, 2025;
November 16, 2025; December 30, 2025 and March 9, 2026.
During 2025, the Internal Auditor performed audits of the CPV Group, this being in place of monitoring the existence and
appropriateness of the work of the party providing internal audit services in the CPV Group as was done up to 2024 (inclusive). The audit plan, including with respect to the CPV Group, is submitted to the Board of Directors of the CPV
Group and to the Company’s Audit Committee and is reported to the Company’s Board of Directors. During the period of the report, no material transactions (as defined in the Fourth Addendum to the Reporting Regulations) were examined.
In the estimation of the Board of Directors, the scope, nature and continuity of the activities of the Internal Auditor and
the internal audit work plan are reasonable under the circumstances of the manner, and they are sufficient to achieve the Company’s internal audit goals.
|
93
---Unofficial translation for convenience purposes---
OPC Energy Ltd.
Report of the Board of Directors
15. Internal Auditor (Cont.)
|
Performance of the audit and the professional standards
|
Based on information provided to the Company, performance of the internal audit is made in accordance with the generally
accepted professional standards in and outside of Israel and in accordance with Section 4(B) of the Internal Audit Law.
The Board of Directors relied on the confirmations of the Internal Auditor regarding his compliance with the requirements
of the said generally accepted professional standards. In addition, the audit reports are submitted in writing and are discussed at the meetings of the Audit Committee, where as part of the discussion the Internal Auditor reports with
respect to the manner of his performance, the policies and procedures applied and the findings. The Board of Directors is satisfied, based on the reports of the Internal Auditor, that the internal audit is in compliance with all the
requirements provided in the said standards.
|
|||
|
Access to information
|
The Internal Auditor had free access to information, as stated in Section 9 of the Internal Audit Law, including constant
and direct access to the Company’s information systems, including financial data.
|
|||
|
Remuneration
|
The remuneration of the Internal Auditor in respect of services provided in 2025 amounted to about NIS 271 thousand, this
being based on a work scope of 1,085 audit hours (including 400 work hours in respect of the CPV Group).
|
|||
|
Set forth below is detail regarding the scope of the investments made, distinguishing between hours invested in internal
auditing with respect to the Company and the investee companies:
|
||||
|
The
Company
|
Investee
companies
in Israel
|
CPV*
|
Total
|
|
| 235 | 450 | 400 |
1,085
|
|
|
* As stated, in 2025 an audit plan was implemented in the CPV Group by the Internal Auditor, in such a manner that rendered
superfluous the activities of the provider of external internal audit services in the CPV Group.
In the opinion of the Board of Directors, the remuneration for the internal audit is reasonable and does not impact or
adversely affect use of his professional judgment in performance of the audit.
The remuneration of the Internal Auditor is a function of the total number of work hours as provided in the annual work
plan that is approved by the Company’s Audit Committee and Board of Directors.
|
||||
94
---Unofficial translation for convenience purposes---
OPC Energy Ltd.
Report of the Board of Directors
| 16. |
Details regarding the auditing CPAs
|
| 16.1 |
The Company’s auditing CPAs are KPMG Somekh Chaikin (“the Auditor”).
|
| 16.2 |
The fee is determined in negotiations between the Company’s management and the Auditor, based on the scope of the work, nature of the work, past experience and market conditions and is approved by the Company’s Board of Directors after
the Balance Sheet Committee has examined the scope of its work and his fee and has submitted its recommendations to the Board of Directors. The fee is in respect of an audit and review of three quarterly reviewed reports and one audited
annual report. In addition, the fee includes tax services in connection with preparation of the Company’s annual tax report.
|
| 16.3 |
Set forth below is the Auditor’s fee (in NIS millions):
|
|
For the Year Ended December 31
|
||||||||||||||
|
2025
|
2024
|
|||||||||||||
|
Audit services (1)
|
Other services (2)
|
Audit services (1)
|
Other services (2)
|
|||||||||||
|
7.3
|
0.9
|
12.1
|
0.8
|
|||||||||||
| (1) |
Audit services including
services related to the audit and tax services related to the audit. Of the said amount for 2025 and 2024, the amounts of about NIS 5 million and about NIS 10 million, respectively, are in respect of audits of CPV. The decrease in fees is mainly due to the deconsolidation of the renewable energy segment as of November 2024 and the transition to the equity method of
accounting. The fees of the auditing CPAs, as stated, were determined in accordance with negotiations carried on by the management of the CPV Group and were approved by CPV’s competent organs.
|
| (2) |
Other services include mainly tax consulting services in Israel. It is noted that most of the tax services in the U.S. are not provided by the Auditor.
|
95
---Unofficial translation for convenience purposes---
OPC Energy Ltd.
Report of the Board of Directors
| 17. |
Contributions policy
|
In addition to the Company’s regular contributions’ policy as stated below, upon the outbreak of the “Rising Lion” operation, the
Company’s Board of Directors approved an increase in the contributions’ budget of about NIS 2 million, for recipients relating to restoration and support due to events relating to the war. In this framework, the Company contributed NIS 1 million
for restoration of the Soroka Medical Center in Beer Sheva65.
The Company has a policy for making contributions that places emphasis on activities in the periphery and non-profit organizations
that operate in the field of education. The Group’s expenses in respect of contributions in the year of the report amounted to about NIS 3 million (including the contribution to Soroka as stated above).
Set forth below is detail of contributions in the year of the report of more than NIS 50 thousand and indication of the relationship
to the recipient of the contribution (in NIS thousands):
|
Recipient of the
|
Amount of the
|
Relationship to the
|
|||
|
Contribution
|
Contribution
|
Recipient of the Contribution
|
|||
|
“Password for Every Student” Society
|
1,000
|
“Password for Every Student” also receives contributions from parties related to the Company’s controlling shareholder,
including corporations in which officers serving as directors of the Company hold positions (including from the Israel Corporation Group and its controlling shareholders). The Company’s CEO is a representative of the project’s Steering
Committee without compensation.
|
|||
|
“Rahashei Lev” Society
|
150
|
It is noted that as the Company was informed, commencing from November 2022, the daughter of Mr. Yosef Tena, an external director of the Company, is employed by the
Tel‑Aviv Medical Center in the name of Sorosky.
|
|||
|
Droma Tzafona Tikum Olam Ltd.
|
100
|
It is noted that the Company’s CEO serves as a director of the public benefit company.
|
|||
|
“Running to Give” Society
|
50
|
It is noted that a relative of the Company’s CEO serves as Chairman of the Society without compensation.
|
|||
|
Yair Caspi
|
Giora Almogy
|
|
Chairman of the Board of Directors
|
CEO
|
Date: March 11, 2026
65 The Company was informed that parties related directly or indirectly to the Company’s controlling shareholder also contributed (as well as
other parties in the economy) to restoration of the Soroka Hospital. Increase of the contributions’ budget, including making of the above‑mentioned contributions, was approved by the Company’s Board of Directors after approval of the
Contributions Committee (the members of which are members of the Audit Committee).
96
---Unofficial translation for convenience purposes---
OPC Energy Ltd.
Report of the Board of Directors
Appendix A
Additional Information regarding the Natural‑Gas Power Plants in the U.S.
EOX Forecast of Natural Gas and Electricity Prices for the Years 2026–2028
As additional background with respect to the activities of the Energy Transition Segment in the U.S. and in order to assist regarding accessibility to additional available external data,
presented below are forecasts of electricity and natural gas prices (Mid-Market) in the regions in which the power plants of the CPV Group in the Energy Transition segment in the U.S. operate, and in the region of the planned activities of the
Basin Ranch power plant, which is under construction, which were prepared by the EOX Company66 and it is based on future market prices of electricity and natural gas.
The data in the tables below reflect forecasts of the electricity and natural gas prices as received from EOX, where with reference to the forecast of the electricity prices the information was
processed by the CPV Group in the following manner:
| – |
In the peak hours, electricity is sold in the maximum scope;
|
| – |
Sale of the balance of the electricity is made in the off‑peak hours.
|
| – |
The scope of the generation of each power plant was estimated separately on the basis of the historical generation data while taking into generation forecasts.
|
The electricity margin appearing in the table below is calculated based on the following formula:
Electricity margin ($/MWh) = the electricity price ($/MWh) – [the gas price ($/MMBTU) X the thermal conversion ratio* (heat rate) (MMBtu/MWh)]
| * |
Assumption of a thermal conversion ratio (heat rate) of 6.9 MMBtu/MWh for Maryland, Shore and Valley, and a thermal conversion ratio (heat rate) of 6.5 MMBtu/MWh for Three Rivers, Towantic, Fairview and Basin Ranch.
|
It should be noted that there may be material differences between the actual electricity and natural gas prices at CPV Group’s power plants and the prices presented in the table below, due, among
other things, to the existence of bid–ask spreads, power basis, and the like. Accordingly, the actual electricity margins of CPV Group’s power plants may differ materially from the margins presented in the table below.
The data included in this Appendix below is based on forecasts of electricity and gas prices made by EOX – a market consulting company that provides information and data
services in the area of the Company’s activities in the U.S. in the Energy Transition segment, and it is presented as additional background and in order to assist accessibility to available external data regarding the area of activities. It is
clarified and emphasized that in light of the fact these are market forecasts, quite naturally the Company is not able to make (and did not make) an independent examination of the forecasts or the underlying data. It is clarified that there are
additional entities that provide similar information services that might provide forecasts that differ from these prices. The Company does not undertake to update data as stated.
In addition, it is emphasized that forecasts are involved regarding which there is no certainty with respect to the accuracy or actual viability thereof. The electricity and
natural gas prices (in the market, in general, and of the power plants of the CPV Group, in particular) might be different, even significantly, from that presented as a result of various factors, including, macro‑economic factors, regulatory
changes, political and/or geopolitical events (including global events) that impact the supply and demand of natural gas and electricity, weather events, events relating to the electricity sector in the U.S. (demand, supply, availability of power
plants, operational events, proper functioning of the electricity grid, transmission infrastructures) and/or failures in (problems with) the assumptions and estimates that form the basis of the forecast.
66 EOX is a subsidiary of a commodity broker, OTC Global Holdings, which publishes forward prices for the electricity and natural gas markets
based on trading data in the futures markets. The futures prices are an objective way of estimating the future expectation with respect to electricity and natural gas prices since they represent transactions with entities operating in these
markets involving buying and selling futures contracts at specific prices.
97
---Unofficial translation for convenience purposes---
OPC Energy Ltd.
Report of the Board of Directors
Appendix A (Cont.)
Appendix A
Additional Information regarding the Natural‑Gas Power Plants in the U.S.
EOX Forecast of Natural Gas and Electricity Prices for the Years 2026–2028
|
Power Plant
|
2026
|
2027
|
2028
|
|||||||||
|
Fairview
|
||||||||||||
|
Gas price (Texas Eastern M3)
|
3.71
|
4.05
|
3.97
|
|||||||||
|
Electricity price (AEP Dayton (AD))
|
51.53
|
55.80
|
54.80
|
|||||||||
|
Electricity margin
|
27.40
|
29.45
|
28.98
|
|||||||||
|
Towantic
|
||||||||||||
|
Gas price (Algonquin City Gate)
|
6.15
|
6.03
|
5.66
|
|||||||||
|
Electricity price (Mass Hub)
|
73.34
|
70.35
|
64.69
|
|||||||||
|
Electricity margin
|
33.39
|
31.14
|
27.93
|
|||||||||
|
Maryland
|
||||||||||||
|
Gas price (Transco Zone 5)
|
4.62
|
4.72
|
4.45
|
|||||||||
|
Electricity price (PJM West Hub)
|
60.71
|
65.03
|
63.66
|
|||||||||
|
Electricity margin
|
28.85
|
32.47
|
32.94
|
|||||||||
|
Shore
|
||||||||||||
|
Gas price (Texas Eastern M3)
|
3.71
|
4.05
|
3.97
|
|||||||||
|
Electricity price (PJM West Hub)
|
60.71
|
65.03
|
63.66
|
|||||||||
|
Electricity margin
|
35.09
|
37.06
|
36.26
|
|||||||||
|
Valley
|
||||||||||||
|
Gas price (Texas Eastern M3 – 70%, Dominion South Pt – 30%)
|
3.46
|
3.75
|
3.65
|
|||||||||
|
Electricity price (New York Zone G)
|
69.35
|
69.18
|
63.79
|
|||||||||
|
Electricity margin
|
45.45
|
43.32
|
38.64
|
|||||||||
|
Three Rivers
|
||||||||||||
|
Gas price (Chicago City Gate)
|
3.51
|
3.79
|
3.65
|
|||||||||
|
Electricity price (PJM ComEd)
|
44.96
|
48.50
|
47.35
|
|||||||||
|
Electricity margin
|
22.16
|
23.85
|
23.60
|
|||||||||
|
Basin Ranch (under construction)
|
||||||||||||
|
Gas price (Waha)
|
1.01
|
3.00
|
2.95
|
|||||||||
|
Electricity price (ERCOT West Pk)
|
54.14
|
60.56
|
61.59
|
|||||||||
|
Electricity margin
|
47.56
|
41.06
|
42.41
|
|||||||||
98
---Unofficial translation for convenience purposes---
OPC Energy Ltd.
Report of the Board of Directors
Set forth below is gross (raw) data as included in the forecast of EOX (without processing)
|
East NY ZnG OPk
|
East NY ZnG Pk
|
PJM
ComEd OPk |
PJM
ComEd Pk |
AEP-
Dayton OPk |
AEP-
Dayton Pk |
PJM West
OPk |
PJM West
Pk |
Contract Date
|
|
112.11
|
128.56
|
37.23
|
51.78
|
49.99
|
60.90
|
67.66
|
83.64
|
01/01/2026
|
|
95.01
|
107.49
|
33.83
|
45.25
|
44.74
|
53.09
|
54.07
|
65.52
|
01/02/2026
|
|
54.40
|
64.02
|
27.73
|
35.48
|
40.89
|
46.49
|
44.82
|
51.94
|
01/03/2026
|
|
44.45
|
49.96
|
22.55
|
36.74
|
40.38
|
48.72
|
42.87
|
53.37
|
01/04/2026
|
|
39.12
|
50.89
|
24.24
|
42.10
|
34.35
|
50.75
|
35.89
|
55.19
|
01/05/2026
|
|
41.72
|
63.93
|
28.90
|
53.42
|
34.99
|
58.37
|
36.78
|
62.98
|
01/06/2026
|
|
61.51
|
91.94
|
42.15
|
80.31
|
46.72
|
80.92
|
48.37
|
91.96
|
01/07/2026
|
|
50.30
|
76.60
|
35.52
|
64.19
|
39.09
|
69.07
|
40.95
|
78.03
|
01/08/2026
|
|
38.07
|
52.17
|
30.38
|
51.72
|
36.46
|
56.49
|
37.97
|
60.66
|
01/09/2026
|
|
42.24
|
51.22
|
29.71
|
45.79
|
42.69
|
54.76
|
45.49
|
58.59
|
01/10/2026
|
|
56.42
|
64.28
|
27.36
|
47.17
|
43.74
|
55.89
|
46.20
|
59.99
|
01/11/2026
|
|
82.85
|
95.63
|
39.60
|
53.77
|
54.15
|
63.90
|
59.12
|
71.52
|
01/12/2026
|
|
117.94
|
128.91
|
58.46
|
71.22
|
69.80
|
80.94
|
82.43
|
95.63
|
01/01/2027
|
|
92.61
|
113.13
|
46.04
|
58.47
|
58.27
|
68.94
|
69.99
|
83.06
|
01/02/2027
|
|
57.80
|
67.48
|
26.60
|
40.57
|
44.43
|
51.77
|
48.07
|
58.10
|
01/03/2027
|
|
44.86
|
51.32
|
26.67
|
40.10
|
41.52
|
51.31
|
43.98
|
56.63
|
01/04/2027
|
|
40.39
|
49.49
|
23.49
|
40.99
|
34.83
|
51.77
|
36.84
|
57.39
|
01/05/2027
|
|
40.21
|
59.80
|
24.26
|
54.17
|
35.35
|
60.79
|
36.71
|
65.57
|
01/06/2027
|
|
53.93
|
95.17
|
36.98
|
83.90
|
45.84
|
87.70
|
47.96
|
98.21
|
01/07/2027
|
|
49.20
|
75.24
|
33.11
|
72.57
|
41.85
|
70.97
|
43.91
|
80.19
|
01/08/2027
|
|
39.10
|
52.33
|
31.69
|
47.98
|
37.33
|
56.12
|
38.84
|
61.27
|
01/09/2027
|
|
41.83
|
49.76
|
33.09
|
48.22
|
45.65
|
54.53
|
49.03
|
59.75
|
01/10/2027
|
|
53.85
|
61.95
|
26.50
|
45.91
|
46.03
|
55.54
|
48.05
|
60.66
|
01/11/2027
|
|
79.47
|
92.86
|
37.75
|
53.46
|
51.74
|
65.17
|
56.96
|
72.31
|
01/12/2027
|
|
98.26
|
112.07
|
57.05
|
69.85
|
71.65
|
80.52
|
81.23
|
92.94
|
01/01/2028
|
|
91.45
|
102.06
|
47.77
|
63.45
|
63.82
|
70.30
|
73.34
|
83.11
|
01/02/2028
|
|
52.01
|
60.09
|
30.94
|
42.17
|
43.62
|
49.34
|
48.78
|
57.26
|
01/03/2028
|
|
41.43
|
49.27
|
25.58
|
38.54
|
37.87
|
48.97
|
41.01
|
54.52
|
01/04/2028
|
|
37.87
|
48.78
|
16.17
|
34.48
|
35.41
|
49.88
|
38.09
|
55.56
|
01/05/2028
|
|
39.31
|
56.30
|
20.82
|
47.43
|
35.02
|
57.76
|
37.14
|
63.02
|
01/06/2028
|
|
53.68
|
82.95
|
33.36
|
84.27
|
42.50
|
87.33
|
45.89
|
93.09
|
01/07/2028
|
|
49.55
|
74.23
|
29.76
|
74.09
|
38.91
|
76.11
|
42.16
|
82.01
|
01/08/2028
|
|
37.53
|
52.54
|
26.23
|
48.90
|
35.10
|
54.94
|
37.79
|
60.09
|
01/09/2028
|
|
40.45
|
44.09
|
31.29
|
46.24
|
40.93
|
51.70
|
43.72
|
56.72
|
01/10/2028
|
|
45.52
|
53.93
|
31.63
|
42.45
|
42.40
|
53.62
|
46.56
|
59.65
|
01/11/2028
|
|
72.96
|
88.92
|
40.76
|
51.63
|
52.08
|
64.04
|
58.24
|
71.51
|
01/12/2028
|
99
---Unofficial translation for convenience purposes---
OPC Energy Ltd.
Report of the Board of Directors
|
Waha
|
Transco
Zn5 Dlvd
|
Chicago
CG
|
Algonquin
CG
|
Dominion
S Pt
|
Texas
Eastern M-3
|
ERCOT
West OPk
|
ERCOT
West Pk
|
Mass Hub
OPk
|
Mass Hub
Pk
|
Contract Date
|
|
0.93
|
8.09
|
4.70
|
16.18
|
3.99
|
7.63
|
48.84
|
52.85
|
134.48
|
145.34
|
01/01/2026
|
|
1.14
|
6.10
|
4.00
|
13.15
|
3.21
|
5.90
|
56.27
|
55.39
|
116.93
|
125.67
|
01/02/2026
|
|
-0.52
|
3.60
|
2.93
|
5.71
|
2.64
|
2.86
|
36.79
|
34.85
|
62.59
|
69.23
|
01/03/2026
|
|
-0.57
|
3.61
|
2.96
|
3.31
|
2.53
|
2.67
|
36.65
|
39.20
|
44.15
|
50.72
|
01/04/2026
|
|
-0.20
|
3.95
|
2.92
|
2.84
|
2.41
|
2.58
|
4168
|
46.32
|
38.58
|
49.00
|
01/05/2026
|
|
0.33
|
3.98
|
3.09
|
3.38
|
2.53
|
2.71
|
44.81
|
St%
|
41.37
|
63.54
|
01/06/2026
|
|
1.30
|
4.22
|
3.31
|
4.07
|
2.82
|
3.10
|
59.66
|
78.42
|
58.47
|
91.20
|
01/07/2026
|
|
1.61
|
4.23
|
3.37
|
4.03
|
2.85
|
3.16
|
75.49
|
137.48
|
46.37
|
74.53
|
01/08/2026
|
|
1.36
|
3.80
|
3.25
|
3.02
|
2.52
|
2.60
|
5147
|
6173
|
40.85
|
49.72
|
01/09/2026
|
|
1.29
|
3.79
|
3.30
|
3.06
|
2.38
|
2.54
|
43.35
|
47.87
|
42.87
|
47.24
|
01/10/2026
|
|
2.15
|
3.87
|
3.E9
|
4.90
|
2.97
|
3.29
|
45.98
|
46.30
|
59.13
|
67.18
|
01/11/2026
|
|
3.32
|
6.17
|
4.61
|
10.11
|
3.76
|
5.51
|
56.41
|
51.E9
|
99.10
|
107.96
|
01/12/2026
|
|
3.95
|
8.63
|
5.33
|
14.50
|
4.02
|
8.17
|
77.64
|
72.06
|
126.79
|
137.11
|
01/01/2027
|
|
3.52
|
7.39
|
4.96
|
1297
|
3.71
|
7.41
|
7205
|
70.87
|
101.45
|
115.46
|
01/02/2027
|
|
2.61
|
4.59
|
3.49
|
6.41
|
3.13
|
3.40
|
42.72
|
46.93
|
60.27
|
71.24
|
01/03/2027
|
|
2.26
|
3.88
|
3.22
|
3.89
|
2.82
|
2.99
|
43.66
|
46.95
|
45.61
|
51.91
|
01/04/2027
|
|
2.21
|
3.89
|
3.12
|
3.23
|
2.65
|
2.87
|
44.05
|
48.01
|
39.65
|
47.21
|
01/05/2027
|
|
2.61
|
3.86
|
3.23
|
3.36
|
2.70
|
2.99
|
48.08
|
53.93
|
38.03
|
58.01
|
01/06/2027
|
|
3.09
|
4.01
|
3.43
|
4.32
|
2.88
|
3.16
|
73 93
|
89.16
|
53.88
|
93.03
|
01/07/2027
|
|
3.10
|
3.86
|
3.48
|
4.12
|
2.82
|
3.07
|
78.85
|
132.93
|
48.50
|
73.35
|
01/08/2027
|
|
2.89
|
3.62
|
3.39
|
3.07
|
2.56
|
2.72
|
53.42
|
E2.53
|
39.80
|
50.79
|
01/09/2027
|
|
2.97
|
3.59
|
3.47
|
3.31
|
2.54
|
2.85
|
47.30
|
48.45
|
44.42
|
49.12
|
01/10/2027
|
|
3.10
|
3.77
|
3.71
|
4.69
|
2.94
|
3.42
|
44.51
|
46.97
|
54.00
|
64.06
|
01/11/2027
|
|
3.69
|
5.56
|
4.63
|
8.53
|
3.67
|
5.61
|
56.43
|
63.94
|
84.44
|
101.89
|
01/12/2027
|
|
4.11
|
8.82
|
5.39
|
14.06
|
4.09
|
8.55
|
83.54
|
76.22
|
118.66
|
127.85
|
01/01/2028
|
|
3.65
|
7.48
|
5.00
|
12.36
|
3.71
|
7.60
|
80.95
|
74.02
|
108.55
|
118.08
|
01/02/2028
|
|
2.47
|
4.16
|
3.47
|
5.22
|
3.10
|
3.60
|
47.10
|
47.17
|
51.36
|
55.68
|
01/03/2028
|
|
2.13
|
3.54
|
3.06
|
3.66
|
2.63
|
2.81
|
42.33
|
46.87
|
39.29
|
47.58
|
01/04/2028
|
|
2.19
|
3.59
|
2.94
|
3.08
|
2.40
|
2.68
|
4143
|
44.86
|
34.89
|
4436
|
01/05/2028
|
|
2.36
|
3.47
|
3.03
|
3.19
|
2.54
|
2.79
|
48.83
|
53.14
|
35.30
|
52.14
|
01/06/2028
|
|
2.87
|
3.49
|
3.22
|
3.60
|
2.55
|
2.81
|
73 19
|
94.31
|
46.50
|
82.35
|
01/07/2028
|
|
3.03
|
3.35
|
3.29
|
3.43
|
2.62
|
2.76
|
74.64
|
126.00
|
43.19
|
72.43
|
01/08/2028
|
|
2.87
|
3.27
|
3.23
|
2.93
|
2.37
|
2.56
|
55.05
|
1E2.17
|
35.04
|
47.91
|
01/09/2028
|
|
2.82
|
3.22
|
3.27
|
3.21
|
2.41
|
2.70
|
49.96
|
49.09
|
39.95
|
45.28
|
01/10/2028
|
|
3.14
|
3.63
|
3.51
|
4.61
|
2.75
|
3.30
|
46.77
|
48.32
|
47.02
|
56.82
|
01/11/2028
|
|
3.74
|
5.42
|
4.44
|
8.52
|
3.45
|
5.51
|
54.59
|
E2.73
|
75.30
|
90.66
|
01/12/2028
|