---Unofficial translation for convenience purposes---
OPC ENERGY LTD.
Report of the Board of Directors regarding the Company’s Matters
for the three months ended March 31, 2026
The Board of Directors of OPC Energy Ltd. (hereinafter – “the Company”) is pleased to present herein the Report of the Board of
Directors regarding the activities of the Company and its investee companies (hereinafter together – “the Group”), as at March 31, 2026 and for the three months then ended (“the Period of the Report”).
Except for the data reviewed in the Company’s consolidated financial statements as at March 31, 2026 (hereinafter – “the Interim
Statements”) that is included in this report below, the data appearing in the Report of the Board of Directors has not been audited or reviewed by the Company’s auditing CPAs.
This Report of the Board of Directors is submitted on the assumption that the interim reports and all parts of
the Company’s Periodic Report for 2025, which was published on March 12, 2026 (Reference No.: (2026‑01‑021904) (“the Periodic Report for 2025”), are before the reader and references to the Company’s reports include the information presented therein
by means of reference.
1
---Unofficial translation for convenience purposes---
OPC Energy Ltd.
Report of the Board of Directors
| 1. |
Executive Summary1
|
| A. |
Brief description of the areas of activity
|
The Company is a public company the securities of which are listed for trading on the Tel‑Aviv Stock Exchange
Ltd.
For details regarding the Group’s activity segments in the Period of the Report – see Section 1A of the Report
of the Board of Directors that is included in the Periodic Report for 2025 (“the Report of the Board of Directors for 2025”) and Note 25 to the financial statements as at December 31, 2025 that are included in the Periodic Report for 2025 (“the
Annual Financial Statements”).
| B. |
Change in the Company’s presentation currency from the shekel to the U.S. dollar
|
Starting from January 1, 2026, the Company presents all its financial results, including its financial
statements, in U.S. dollars (“the Dollar”)2. The comparative data was translated for comparison purposes while using the same translation rules (translation into the presentation currency pursuant to the provisions of IAS 21). For
additional details – see Note 2B to the Interim Statements.
| 1 |
The executive summary below is presented solely for convenience and it is not a substitute for reading the full detail (including with reference to the matters referred to in the summary) as stated in this
report with all its parts (including warnings relating to “forward‑looking” information as it is defined in the Securities Law, 1968 (“the Securities Law”), definitions or explanations with respect to the indices for measurement of the
results and including the information included by means of reference, as applicable). This summary includes estimates, plans and assessment of the Company, which constitute “forward‑looking” information regarding which there is no certainty
they will materialize and the readers are directed to the detail presented in the relevant sections.
|
| 2 |
It is noted that the Company’s presentation currency does not impact its functional currency and the functional currency of its significant subsidiaries. Accordingly, as at the date of the report, the functional currency of the Company
and the companies operating in Israel (OPC Power and its subsidiaries) continues to be the shekel whereas the functional currency of the companies operating in the United States (ICG and its subsidiaries and the CPV Group) continues to be
the Dollar.
|
2
---Unofficial translation for convenience purposes---
OPC Energy Ltd.
Report of the Board of Directors
| 1. |
Executive Summary1 (Cont.)
|
| C. |
Main financial parameters (in millions of dollars)
|
|
For the
|
||||
|
Three Months Ended
|
||||
|
March 31
|
||||
|
2026
|
2025
|
%
|
||
|
Consolidated
|
EBITDA after proportionate consolidation
|
124
|
113
|
10%
|
|
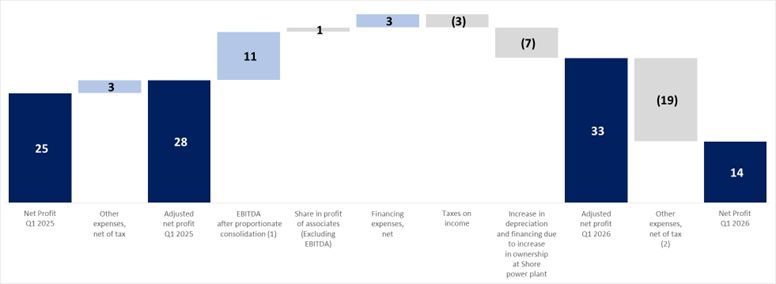
Net income
|
14
|
25
|
(44%)
|
|
|
Adjusted net income
|
33
|
28
|
18%
|
|
|
FFO
|
(21)
|
89
|
(124%)
|
|
|
Adjusted FFO
|
75
|
69
|
9%
|
|
|
Israel
|
EBITDA
|
44
|
38
|
16%
|
|
FFO
|
24
|
53
|
(55%)
|
|
|
Adjusted FFO
|
27
|
29
|
(7%)
|
|
|
U.S.
|
EBITDA after proportionate consolidation
|
83
|
77
|
8%
|
|
FFO
|
(34)
|
41
|
(183%)
|
|
|
Adjusted FFO
|
53
|
48
|
10%
|
|
|
EBITDA after proportionate consolidation –
Energy Transition
|
88
|
77
|
14%
|
|
|
EBITDA after proportionate consolidation –
Renewable Energies
|
11
|
7
|
57%
|
|
| * |
EBITDA, EBITDA after proportionate consolidation, adjusted net income, FFO and adjusted FFO (Funds From Operations) are non‑IFRS financial measures – for definitions and the manner of their calculation – see Sections 4B and 4A(3) below.
|
As detailed in the above table, in the first quarter of 2026, the EBITDA after
proportionate consolidation increased by about 10% over the corresponding quarter last year, as a result of an increase of 8% in the EBITDA after proportionate consolidation in the United States, primarily due to an increase in the energy margins
and the capacity prices in the PJM market and an increase in the holding rates in the Shore power plant, as well as due to an increase of about 16% in the EBITDA in Israel mainly against the background of the increase in the energy margins and due
to the impacts of the translation on the results of the activities in Israel to the presentation currency (the dollar), which weakened significantly against the shekel (which is the functional currency in Israel).
In the first quarter of 2026, the consolidated Adjusted Net Income rose by about 18%
compared with the corresponding quarter last year, against the background of the increase in the adjusted EBITDA.
In the first quarter of 2026, the consolidated adjusted FFO rose by about 9% compared with
the corresponding quarter last year, primarily due to the increase in the adjusted EBITDA.
3
---Unofficial translation for convenience purposes---
OPC Energy Ltd.
Report of the Board of Directors
| 1. |
Executive Summary1 (Cont.)
|
| D. |
Main developments in the first quarter of 2026 and thereafter
|
|
Israel
|
Hadera expansion project in advanced development (combined cycle) with a capacity of 850 megawatts – in February 2026, the
Company signed a binding agreement for acquisition of the main equipment and a maintenance agreement with GE and is taking action to complete the undertaking in the other project agreements (equipment, construction, and financing) and to
complete receipt of all the required approvals and permits and to reach the financial closing (some of which had received as at the approval date of the report) by the end of the second quarter of 2026. For details – see Section 5A(2)
below.
|
|
Ramat Beka project in advanced development (solar with a capacity of about 550 megawatts with integrated storage of about 3,850
megawatt-hours) – in March 2026, the approved plan was published by the government in the Official Records. The Company is taking action to complete the undertaking in the project agreements (construction, equipment and financing)
and to obtain all the required approvals and permits, and it expects to make the payment to Israel Lands Authority for the project’s areas by the end of the second quarter of 2026. For details – see Section 5A(2) below.
|
|
|
Expansion of activities in the area of supply of electricity to Data Centers – undertaking in a long‑term PPA agreement with a
leading consumer in the area with a capacity that could gradually reach about 460 megawatts in the upcoming years.
|
|
|
Natural gas activities with carbon capture potential in the U.S.
|
Acquisition of the remaining rights (30%) in the Basin Ranch – in February 2026 the acquisition was completed and starting from
this date the project is consolidated in the CPV Group’s and the Company’s financial statements. In this regard, the corporate loan of the CPV Group from Bank Leumi was increased by about $300 million to about $430 million. For details –
see Section 5B(1) below.
|
|
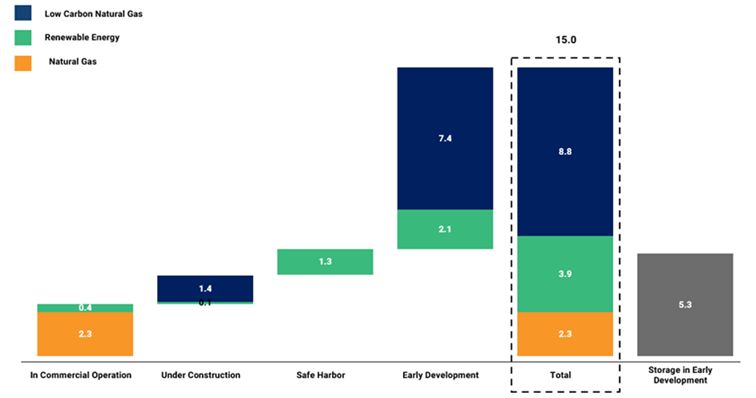
Increase in the pipeline (backlog) of natural gas projects to about 8.7 gigawatts (the share of the CPV Group – about 7.4 gigawatts)
alongside the continued accelerated development of the Shay Project in the PJM market (combined cycle with a capacity of 2.1 gigawatts in West Virginia – the share of CPV is 70%), which is being advanced in licensing and
grid interconnection processes and is expected to enter into an interconnection agreement in early 2027. In addition, a slot reservation agreement for significant equipment has been signed and CPV Group is evaluating and taking actions to
position the project to meet the eligibility requirements for participation in the RBP mechanism. For further details, see Section 5B(2) below.
|
4
---Unofficial translation for convenience purposes---
OPC Energy Ltd.
Report of the Board of Directors
| 1. |
Executive Summary1 (Cont.)
|
| D. |
Main developments in the first quarter of 2026 and thereafter (Cont.)
|
|
Energy Transition in the U.S.
|
Execution of the strategy to increase the holdings and obtain control over natural gas‑fired power plants: (1) in January
2026, acquisition of the remaining rights (11%) in the Shore power plant (a combined cycle power plant with a capacity of 725 megawatts in PJM); and (2) in May 2026, acquisition of the remaining interest (25%) in the Maryland power plant
(combined cycle with a capacity of 745 megawatts in PJM) in exchange for sale of the rights (10%) in the Three Rivers power plant (combined cycle with a capacity of 1,258 megawatts in PJM) with payment of an immaterial amount.
|
|
Refinancing of the Valley power plant (combined cycle with a capacity of 720 megawatts in New York) – in February 2026, a
refinancing transaction was completed whereby the margin was reduced to 2.75%, the cash sweep rate was reduced from 100% to a leverage‑based mechanism as is customary in the TLB market, and a dividend was distributed to the partners /
shareholders’ loans were repaid, in the amount of about $100 million (the CPV Group’s share – about $50 million). For additional details – see Section 6A(3) below.
|
|
|
Capacity auctions and regulatory processes in PJM – in April 2026, FERC approved the extension of the maximum and minimum limits
(collar) for two additional capacity auctions in the period from June 1, 2028 through May 31, 2030. In addition, in April 2026 PJM published an initial proposal for an emergency procurement for acquisition of additional available capacity
through a Reliability Backstop Procurement (“RBP”), in order to provide a response to the expected shortage of capacity deriving from an increase in the demand for electricity. The proposal includes procurement processes of about
15 gigawatts for capacity contracts for periods of up to 15 years. The RBP design has not yet been formulated and is subject to, among other things, regulatory approvals. For details – see Section 3C below.
|
|
|
Renewable Energies in the U.S.
|
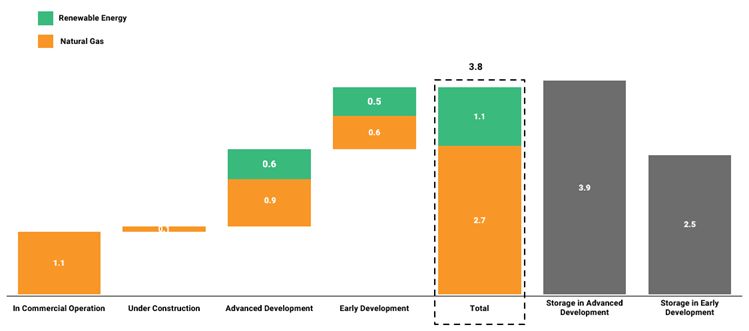
As at the approval date of the report, the CPV Group took action in an attempt to assure compliance with Safe Harbor conditions for projects in the scope of
1.9 gigawatts (share of the CPV Group – about 1.3 gigawatts). For details – see Section 5C(2) below.
|
|
U.S.
headquarters
|
Long‑term incentive plan for employees of the CPV Group – as part of the plan, which was granted in 2021 and vested over a
period of five years, in March 2026 profit participation units were exercised that were granted to employees of the CPV Group, in the amount of about $70 million. In addition, a new long‑term incentive plan was approved for employees of the
CPV Group with vesting periods up to the beginning of 2031. For details – see Note 7F to the Interim Statements.
|
5
---Unofficial translation for convenience purposes---
OPC Energy Ltd.
Report of the Board of Directors
| 1. |
Executive Summary1 (Cont.)
|
| D. |
Main developments in the first quarter of 2026 and thereafter (Cont.)
|
|
Group
headquarters
|
Raising of capital – in March 2026, the Company completed a capital raise with gross proceeds of about $257 million (about
NIS 800 million). The proceeds of the issuances were designated for the continued growth and development of the Company’s business.
|
|
Increase of the investment commitment in the CPV Group – in March 2026, a process was completed of increase of the investment
commitment of the Company and the other partners in the CPV Group in connection with the financial close of the Basin Ranch power plant and transactions for increasing the holdings in the natural gas‑fired power plants, in the aggregate
amount of about $502 million. For details – see Note 23A(3) to the Annual Financial Statements.
|
|
|
Improvement of the credit rating – in May 2026, Midroog affirmed the credit rating of the Company and of its debentures at the
level of A1.il and updated the rating outlook from stable to positive in light of the strengthening of the Company’s financial profile. For details – see Section 6C below.
|
|
|
Early partial redemption (prepayment) of the debentures (Series B) – in May 2026, the Company’s Board of Directors decided to make a partial early prepayment of
the debentures (Series B), in the total amount of about $70 million (about NIS 200 million), to be executed in the beginning of June 2026.
|
6
---Unofficial translation for convenience purposes---
OPC Energy Ltd.
Report of the Board of Directors
| 1. |
Executive Summary1 (Cont.)
|
| E. |
Portfolio of about 18.83 GW and about 11.7 GWh of storage (for details – see Section 5 below)
|
United States (1)(2)
| (1) |
The projects in the United States that are held by associated companies are presented according to the CPV’s Group relative ownership interest in each project.
|
| (2) |
The Maryland and Three Rivers power plants are presented based on the share of the CPV Group as at the approval date of the report (which is 100% and 0%, respectively).
|
| 3 |
The data included in this report relating to the capacity of the renewable‑energy projects using solar technology is in MWdc.
|
7
---Unofficial translation for convenience purposes---
OPC Energy Ltd.
Report of the Board of Directors
| 1. |
Executive Summary1 (Cont.)
|
| E. |
Portfolio of about 18.83 GW and about 11.7 GWh of storage (for details – see Section 5 below) (Cont.)
|
Israel
That stated with respect to the development stages, capacities and/or expectations regarding
construction of the development (pipeline) projects in Israel and in the U.S. constitutes “forward‑looking” information as it is defined in the Securities Law, 1968 (“the Securities Law”), which is based on the Company’s estimates at the approval
date of the report and regarding which there is no certainty they will be realized. Ultimately, there could be changes in the characteristics of the projects and/or delays or changes due to regulatory, operating, commercial factors and/or
realization of one or more of the risk factors to which the Company is exposed, as stated in Part A of the Periodic Report for 2025. Advancement of the pipeline projects (or any one of them) is subject to the discretion of the Company’s competent
organs and existence (fulfillment) of additional conditions, as stated in Part A of the Periodic Report for 2025.
For definitions of the development stages – see Section 5 below.
8
---Unofficial translation for convenience purposes---
OPC Energy Ltd.
Report of the Board of Directors
| 2. |
Main Developments in the Business and Regulatory Environment in Israel
|
| A. |
Update of electricity tariffs
|
In December 2025, the generation component for 2026 was set (subject to a periodic update, as detailed in
Section 2A(1) of the Report of the Board of Directors for 2025) at 28.90 agurot per kilowatt hour (assuming a shekel/dollar exchange rate of U.S.$1 = NIS 3.3), a decline of 1.66% compared with the average generation component for 2025.
Set forth below is data regarding the weighted‑average annual generation component (the prices are
denominated in agurot per kilowatt hour):
|
Period
|
2026
|
2025
|
Change
|
|
January–March average
|
28.90
|
29.39
|
(2.4%)
|
In the Company’s estimation, update of the tariff for 2026 is not expected to have a significant impact on its
results4.
| B. |
Security, Political and Geopolitical Instability in Israel
|
Further to that stated in Section 2B of the Report of the Board of Directors for 2025 and
Section 6.1.1 of Part A of the Periodic Report for 2025, on February 28, 2026, there was a significant escalation in the regional geopolitical situation upon the outbreak of an additional serious military confrontation between Israel and the United
States versus Iran, which also included attacks by Iran on additional Middle‑Eastern countries (the “Roaring Lion” Operation). As a consequence of the “Roaring Lion” military operation, among other things, Israeli airspace was closed and a general
emergency situation was announced for the Israeli home front in such a manner that significantly limits the activities (traffic/movement) in public areas – this being together with a large mobilization of military reserves.
During the “Roaring Lion” Operation, all the gas rigs were shut down (including the Karish
reserve) for varying time periods and temporary use of diesel oil was made in the Company’s power plants, where as at the approval date of the report the three gas reservoirs had returned to full activities. The shutdown of the Tamar gas reserve
lasted only several days at the beginning of the “Roaring Lion” Operation such that upon its operation, all of the Company’s gas needs were supplied, while some of the gas was purchased at a price higher than the alternative price from the Karish
reserve with only an insignificant impact as at the approval date of the report.
Furthermore, due to the emergency situation declared in the Israeli economy, there was a
certain decline in demand for a short period of time, the impact of which was not significant. Also, force majeure notifications were received from suppliers and contractors along with limited availability
of foreign work teams and experts on the Company’s activity sites in Israel, including on the Sorek 2 site (which is undergoing acceptance tests).
| 4 |
The Company’s estimates with respect to the impact of the Decision is “forward‑looking” information as it is defined in the Securities Law, for which there is no certainty of their realization.
Ultimately, the impacts could be different due to, among other things, the market conditions, changes impacting the components of the tariffs, regulator changes/factors that impact the electricity market.
|
9
---Unofficial translation for convenience purposes---
OPC Energy Ltd.
Report of the Board of Directors
| 2. |
Main Developments in the Business and Regulatory Environment in Israel (Cont.)
|
| B. |
Security, Political and Geopolitical Instability in Israel (Cont.)
|
On April 8, 2026, a temporary ceasefire was announced with Iran, while the marine blockade
continued in the Strait of Hormuz with respect to movement of oil and natural gas tankers (containers). On April 17, 2026, a temporary ceasefire was announced with Lebanon, where as at the approval date of the report the attacks of the Hezbollah
organization from Lebanon are continuing and, accordingly, the restrictions relating to the emergency situation in the northern part of Israel were reinstated to a certain extent.
As at the approval date of the report the “Lion’s Roar” Operation did not
have a significant impact on the business activities and/or the financial results. Nonetheless, as at the approval date of the report there is a significant concern that the combat with Iran will be rekindled and the fighting in Lebanon will
continue.
It is noted that the above‑mentioned events involve significant uncertainty and could
impact the macro‑economic and geopolitical environment in both Israel and the U.S., including an adverse impact on the strength of the Israeli economy, as well as on the global economic activities (for a short or even possibility a long period of
time). A rekindling of the fighting and/or a worsening of the security/defense situation could negatively affect the Company’s activities, mainly in Israel, including the activities of its customers and suppliers in Israel, and could also have an
unfavorable effect on the results of the Company’s operations, the availability and cost of capital and financing sources required for the Group’s activities. For additional details regarding the possible impacts of the security/defense and
geopolitical situations and the related risk factors – see Sections 6.1 and 19.1 of the Part A of the Periodic Report for 2025.
For additional details regarding the structure and manner of determination of the
electricity tariff for customers of Israel Electric Company, the price of natural gas and the carbon tax, availability/capacity revenues and supply to customers, as well as with respect to the Government’s decision concerning advancement of the
construction of Data Centers – see Section 2A of the Report of the Board of Directors for 2025 and Section 7.3 of Part A of the Periodic Report for 2025.
| 3. |
Main Developments in the Business and Regulatory Environment in the U.S.
|
| A. |
Electricity and natural gas prices
|
The results of the activities of the CPV Group are impacted to a significant extent by the
electricity prices in effect in the areas in which the Group’s power plants operate. The main factors impacting the electricity prices are demand for electricity, available generation (supply) and the natural gas price in the area in which the
power plant operates.
For more information regarding the trend of the supply and demand of electricity in the
U.S, including in the PJM and ERCOT markets and with respect to fluctuations of the gas and electricity prices, along with the factors affecting it – see Section 3A of the Report of the Board of Directors for 2025.
10
---Unofficial translation for convenience purposes---
OPC Energy Ltd.
Report of the Board of Directors
| 3. |
Main Developments in the Business and Regulatory Environment in the U.S. (Cont.)
|
| A. |
Electricity and natural gas prices (Cont.)
|
Natural gas prices
|
Set forth below are the average natural gas prices in each of the main markets in which the power plants of the CPV Group operate (the prices are denominated in dollars per MMBtu)*:
|
|
For the three months ended
|
|||||
|
Region
|
March 31
|
||||
|
(Power Plant)
|
2026
|
2025
|
Change
|
||
|
Texas Eastern M‑3 (Shore, Valley – 70%)
|
9.61
|
6.42
|
50%
|
||
|
Transco Zone 5 North (Maryland)
|
8.36
|
6.06
|
38%
|
||
|
Dominion South Pt (Valley – 30%)
|
4.73
|
3.74
|
26%
|
||
|
Algonquin City Gate (Towantic)
|
14.08
|
11.83
|
19%
|
||
|
Texas Eastern M‑3 and Texas Eastern M‑2 (Fairview)**
|
9.61
|
3.83
|
151%
|
||
|
Chicago City Gate (Three Rivers)
|
5.34
|
4.00
|
34%
|
||
|
Waha (Basin Ranch)***
|
(1.09)
|
1.81
|
(160%)
|
||
| * |
Source: The Day‑Ahead prices at gas Midpoints as reported in Platt’s Gas Daily. It is clarified that the actual gas prices of the power plants of the CPV Group could be significantly different.
|
| ** |
Commencing from the third quarter of 2025, Fairview has started acquiring natural gas that is priced based on the Texas Eastern M‑3 transmission region. Accordingly, the comparison between the gas prices in the first quarter of 2026 and
the corresponding quarter last year reflects prices from two different transmission regions – Texas Eastern M-‑3 compared with Texas Eastern M-‑2, respectively. For additional details – see Appendix A below.
|
| *** |
The Basin Ranch project is under construction. For details – see Section 5B(1) below.
|
In the estimation of the CPV Group, the significant increase in the natural gas prices in
the Period of the Report is mainly due to the continuing cold weather conditions in the United States, including with respect to the corresponding period last year, which led to a significant rise in demand for natural gas and an increase in the
prices in the regions in which the CPV Group’s power plants operate. Nonetheless, the inventory levels of the natural gas in the U.S. have remained historically high, which moderated the impact of the winter weather conditions on future gas prices.
Regarding the Fairview power plant, the unusual increase in the natural gas prices also stems from transition to the Texas Eastern M‑3 transmission region, which is more significantly impacted by high demand for natural gas under cold weather
conditions than the Texas Eastern M‑2 transmission region.
Regarding the natural gas distribution region in Waha Texas, which is expected to serve as
a source for supply to the Basin Ranch power plant, which is presently under construction, the region is affected by different market dynamics and different weather conditions, and similar price increases have not been recorded therein. Production
of natural gas in this region constitutes a by‑product of oil production, and the high demand for oil led to high levels of gas production, along with limitations on the transmission capacity outside of the Waha basin which, in turn, caused a
surplus local supply of gas and downward pressure on prices.
11
---Unofficial translation for convenience purposes---
OPC Energy Ltd.
Report of the Board of Directors
| 3. |
Main Developments in the Business and Regulatory Environment in the U.S. (Cont.)
|
| A. |
Electricity and natural gas prices (Cont.)
|
Electricity prices
The following table summarizes the average electricity prices in each of the regions in
which the power plants in the area of energy transition activities of the CPV Group are active (the prices are denominated in dollars per megawatt hour)*:
|
For the Three Months Ended
|
|||||
|
Region
|
March 31
|
||||
|
(Power Plant)
|
2026
|
2025
|
Change
|
||
|
PJM West (Shore, Maryland)
|
97.42
|
53.90
|
81%
|
||
|
New York Zone G (Valley)
|
119.58
|
88.85
|
35%
|
||
|
Mass Hub (Towantic)
|
117.36
|
102.78
|
14%
|
||
|
PJM AEP Dayton (Fairview)
|
70.66
|
47.91
|
47%
|
||
|
PJM ComEd (Three Rivers)
|
51.13
|
35.24
|
45%
|
||
|
ERCOT West Hub (Basin Ranch)**
|
39.42
|
35.24
|
12%
|
||
| * |
Based on Day‑Ahead prices as published by the relevant ISO.
|
| ** |
The Basin Ranch power plant, the construction of which commenced in October 2025. For details – see Section 5B(1) below.
|
It is noted that the actual electricity prices of the power plants of the CPV Group could
be higher or lower than the regional price shown in the above table due to the existence of a Power Basis (the difference between the power plant’s specific electricity price and the regional price). The Power Basis is a function of transmission
constraints, local cost of electricity generation, local demand for electricity, loss of electricity in the transmission lines and additional factors. For details regarding the Power Basis data – see Section 3A to the Report of the Board of
Directors for 2025.
In the Period of the Report, there was a significant increase in the electricity prices
compared with the corresponding period last year, which in the estimation of the CPV Group derives mainly from an increase in the natural‑gas prices in the areas in which the power plants of the CPV Group are located, as detailed above.
12
---Unofficial translation for convenience purposes---
OPC Energy Ltd.
Report of the Board of Directors
| 3. |
Main Developments in the Business and Regulatory Environment in the U.S. (Cont.)
|
| A. |
Electricity and natural gas prices (Cont.)
|
Spark Spreads in the operating markets of the CPV Group
Spark Spread represents the difference between the price of the electricity in the relevant
area (zone) and the price of the natural gas used for generation of the electricity in the relevant area (zone) (it is clarified that RGGI is not included in calculation of the Spark Spread but rather in the Energy Margin as detailed in
Section 4D(3) below).
The Spark Spread is calculated based on the following formula:
Spark Spread ($/MWh) = price of the electricity ($/MWh) – [the gas price ($/MMBtu) x
thermal conversion ratio (heat rate) (MMBtu/MWh)]
Set forth below are the average Spark Spread margins for each of the main markets in which
the power plants of the CPV Group are operating (the prices are denominated in dollars per megawatt/hour)*:
|
For the Three Months Ended
|
|||
|
March 31
|
|||
|
Power Plant5
|
2026
|
2025
|
Change
|
|
Shore
|
31.11
|
9.60
|
224%
|
|
Maryland
|
39.74
|
12.09
|
229%
|
|
Valley
|
63.37
|
50.10
|
26%
|
|
Towantic
|
25.84
|
25.89
|
0%
|
|
Fairview**
|
8.20
|
23.02
|
(64%)
|
|
Three Rivers
|
16.42
|
9.24
|
78%
|
|
Basin Ranch***
|
46.51
|
19.47
|
139%
|
| * |
Based on electricity prices as shown in the above table, with assuming a thermal conversion ratio (heat rate) of 6.9 MMBtu/MWh for Maryland, Shore and Valley, and a thermal conversion ratio of 6.5 MMBtu/MWh for Three Rivers, Fairview,
Towantic and Basin Ranch. It is clarified that the actual energy margins of the power plants of the CPV Group could be significantly different due to, among other things, the existence of Power Basis and a different breakdown in the scope
of the electricity sold in the peak and off‑peak hours in CPV’s power plants and that shown above (which was calculated in the above table based on the assumption of generation in all the hours of the 24‑hour period).
|
| ** |
Commencing from the third quarter of 2025, Fairview has started acquiring natural gas that is priced based on the Texas Eastern M‑3 transmission region. Accordingly, the above table presents the electricity margin in the Period of the
Report, which is calculated on the basis of the gas price in the Texas Eastern M‑3 transmission region, compared with the electricity margin in the corresponding period last year, which is calculated on the basis of the gas price in the
Texas Eastern M‑2 transmission region.
|
| *** |
The Basin Ranch power plant is under construction. For details – see Section 5B(1) below.
|
In the Period of the Report, there was a significant increase in the Spark Spreads in most
of the active power plants of the CPV Group, compared with the corresponding period last year, stemming from a combination of unusual weather conditions – temperatures lower than the average, as stated above, plus a continuing increase in the
demand for electricity in the areas in which the power plants of the CPV Group are located.
5 For additional details regarding the energy margin of the CPV Group – see
Section 4D(3) below.
13
---Unofficial translation for convenience purposes---
OPC Energy Ltd.
Report of the Board of Directors
| 3. |
Main Developments in the Business and Regulatory Environment in the U.S. (Cont.)
|
| A. |
Electricity and natural gas prices (Cont.)
|
Spark Spreads in the operating markets of the CPV Group (Cont.)
Regarding the Towantic power plant, which operates in the ISO‑NE market, no increase was
recorded in the electricity margins compared with the corresponding period last year, this being mainly due a change in market rules in the ISO‑NE market, which shifts some of the fluctuations in the energy prices, which derive from unusual demand,
to the ancillary service market (that is, an increase in other income against the spark spread margin – for additional details, see the breakdown of the EBITDA data in Section 4D(2) below). Regarding the Fairview power plant, the decline derives
mainly from to the transition to the Texas Eastern M‑3 natural gas transmission region, as noted above.
It is noted that hedging programs in the CPV Group’s natural gas-fired power plants are
intended to reduce the fluctuations of the CPV Group’s electricity margin resulting from changes in the natural gas and electricity prices in the energy market. For details regarding hedging agreements related to the electricity margin at CPV
Group’s active power plants – see Section 4D(3) below. Regarding the Gas Netback agreements and fixed-price electricity sales, which hedge a significant portion of the Basin Ranch power plant’s net energy margin – see Section 5B(1), below).
For details regarding the Company’s forecasted electricity and natural gas forward market
prices (received from EOX) up to the end of 2026 and for 2027 and 2028 – see Appendix A below.
| B. |
Carbon Emissions Tax – Regional Greenhouse Gas Initiative (RGGI)
|
The RGGI regulation applies to the Maryland, Shore, Valley and Towantic power plants (which
belong to the Energy Transition segment of the CPV Group). For additional details regarding the RGGI regulation – see Section 8.1.4B of Part A of the Periodic Report for 2025.
Set forth below are details regarding the prices of the carbon‑emission allowances (carbon emission tax) from
the RGGI auctions. In general, the auctions take place four times a year, in March, June, September and December.
|
Average for the
|
|||
|
Three Months Ended
|
|||
|
March 31
|
|||
|
2026
|
2025
|
Change
|
|
|
Price of carbon emission tax in the RGGI auctions
($ per short ton / 2,000 pounds)*
|
26.73
|
20.05
|
33%
|
|
Cost of the carbon emission tax (in terms of gas cost)
($ per MMBtu)**
|
1.59
|
1.19
|
33%
|
| * |
The prices of the carbon emissions tax are presented under the assumption that the price of the auction that is held prior to a certain quarter represents the price of the carbon emissions tax for the subsequent quarter. For example, the
auction held in December 2025 represents the price for the first quarter of 2026. It is noted that the actual price of the carbon emissions tax could be different than the auction prices as a result of transactions made in the secondary
market.
|
| ** |
The cost of the carbon emissions tax (in terms of gas cost) is calculated under the assumption of emissions of carbon dioxide with a reference (ratio) of 119 MMBtu/lbs. It is noted that the actual carbon dioxide emissions ratio varies
between the different power plants, and in the estimation of the CPV Group a ratio of 119 MMBtu/lbs. is a representative ratio for natural gas-fired power plants.
|
14
---Unofficial translation for convenience purposes---
OPC Energy Ltd.
Report of the Board of Directors
| 3. |
Main Developments in the Business and Regulatory Environment in the U.S. (Cont.)
|
| B. |
Carbon Emissions Tax – Regional Greenhouse Gas Initiative (RGGI) (Cont.)
|
It is noted that from time to time, usually for short periods, the RGGI
market could experience price volatility stemming mainly from regulatory factors and supply and demand with respect to emissions’ permits.
| C. |
Capacity revenues
|
Capacity is an additional significant income component of the CPV Group’s active power
plants that operate in the PJM, NYISO and ISO‑NE markets, where normally an increase in the capacity prices has a favorable impact on CPV’s results, and vice‑versa. The extent of the impact on the overall results changes as a function of the energy
margins, which is the most significant component of the gross profit (margin for generation of the electricity and the sale thereof).
PJM market
In the PJM market, the capacity payments vary between the market’s sub‑regions, as a function of local supply
and demand and transmission capabilities. In general, the capacity auctions are made once a year for an annual supply period (June – May) in a format of three years in advance. Due to regulatory delays, the current schedule includes an auction once
every six months, with the goal of returning to annual auctions in 2027 – subject to regulatory changes. Set forth below are the capacity tariffs in the sub‑regions that are relevant to the CPV Group’s power plants and in the general market (the
prices are denominated in dollars per megawatt per day).
|
Sub-region
|
CPV Power Plants
|
(3)2027/2028
|
(2)2026/2027
|
(1)2025/2026
|
2024/2025
|
|
PJM RTO
|
Three Rivers, Backbone
|
333.44
|
329.17
|
269.92
|
28.92
|
|
PJM MAAC
|
Fairview, Maryland,
Maple Hill
|
333.44
|
329.17
|
269.92
|
49.49
|
|
PJM EMAAC
|
Shore
|
333.44
|
329.17
|
269.92
|
54.95
|
|
Source: PJM
|
| (1) |
Reflects estimated additional revenues for the CPV Group for the period of the auction compared with the corresponding period last year of about $98 million6.
|
| (2) |
Reflects estimated additional revenues for the CPV Group in the 2026/2027 auction compared with the 2025/2026 auction of about $18 million6.
|
| (3) |
Reflects estimated additional revenues for the CPV Group in the 2027/2028 auction compared with the 2026/2027 auction of about $2 million6.
|
| 6 |
That stated in this section with respect to the estimates of the CPV Group constitutes “forward‑looking” information as it is defined in the Securities Law, regarding which there is no certainty it will be
realized. Ultimately, the revenues of the CPV Group from capacity could change (even significantly) as a result of, among other things, regulatory changes, operational factors, regulatory arrangements applicable to capacity regarding fines
or bonuses, changes in the business environment and/or the occurrence of one or more of the risk factors the CPV Group is exposed to.
|
15
---Unofficial translation for convenience purposes---
OPC Energy Ltd.
Report of the Board of Directors
| 3. |
Main Developments in the Business and Regulatory Environment in the U.S. (Cont.)
|
| C. |
Capacity revenues (Cont.)
|
It is noted that the capacity prices set in the 2026/2027 and 2027/2028 auctions, as shown above, were
determined in accordance with the ceiling prices approved by PJM and approved by FERC for these two capacity auctions (with the necessary adjustments). In addition, the unforced capacity (UCAP) relative to installed capacity (ICAP) for combined
cycle gas plants were updated which led to a decrease in the UCAP that is provided for sale by the CPV Group’s natural‑gas power plants of this type from about 96% to about 79% (in the 2025/2026 auction) and from about 79% to about 74% (in the
2026/2027 auction and thereafter). It is further noted that based on PJM publications, the theoretical prices derived from the results of the auctions, had it not been for the said ceiling, would have been about $389 per megawatt/day and about $530
per megawatt/day, respectively. In April 2026, FERC approved PJM’s request to extend the maximum and minimum limits (collar) of $325 per megawatt/day and $175 per megawatt/day (adjusted for the UCAP to ICAP ratio), respectively, for two additional
capacity auctions for the 2028/2029 and 2029/2030 periods.
Subject to additional changes in the timetables, if any, as at the approval date of the report, the next PJM
capacity auction for the 2028/2029 capacity year is planned for June 2026.
The significant increase in the capacity tariffs in the latest auctions, as shown in the table above, relates
to, among other things, a continuing increase in electricity demand, anticipated growth in future demand, higher reserve requirements, and a decline in the aggregate supply due to a change in the methods used to calculate capacities and demand
capability of PJM’s generation sources.
Reliability Backstop Procurement (RBP) – in April 2026, PJM published an initial RBP7 proposal
for an emergency procurement of additional available capacity, for the purpose of providing a response to an anticipated capacity deficiency stemming from an increase in the demand for electricity. The proposal includes procurement in an initial
scope of about 15 gigawatts and is based on a two‑stage format:
| – |
Stage 1 – Bilateral arrangements between generators and consumers, facilitated by PJM, which is expected to take place between September 2026 and March 2027; and
|
| – |
Stage 2 – Centralized procurement led by PJM, which is expected to begin in March 2027, for the balance of the available capacity that is not secured though the bilateral stage. The centralized procurement is expected to include
contracts for capacity only for periods of up to 15 years, where the eligibility is expected to be limited solely to new resources, including new-build generation, upgrades, conversions and demand response solutions, which are expected to
reach commercial operation by June 1, 2031.
|
PJM has started a formal process with the interested parties and is expected to submit a proposal to FERC in
June 2026. As at the approval date of the report, the final RBP, its scope and timetables have not yet been finally formulated, and they are subject to, among other things, regulatory approvals and changes. Accordingly, in the estimation of the CPV
Group, at this stage it is not possible to assess the impact of the RBP on the market, particularly its impact with respect to future capacity tariffs.
| 7 |
For further details, see PJM’s publication dated April 16, 2026: https://www.pjm.com/-/media/DotCom/committees-groups/cifp-rbp/2026/20260416/20260416-item-05---pjm-reliability-backstop-procurement-proposal---paper.pdf
|
16
---Unofficial translation for convenience purposes---
OPC Energy Ltd.
Report of the Board of Directors
| 3. |
Main Developments in the Business and Regulatory Environment in the U.S. (Cont.)
|
| C. |
Capacity revenues (Cont.)
|
The CPV Group is examining and taking action with respect to some of its development projects, particularly the
Shay project (as detailed in Section 5B(2) below), to position them as projects that may meet the eligibility conditions for participation in the RBP – to the extent this procurement is implemented, and taking into account changes that could be
made thereto prior to its final formulation. It is clarified that participation in the RBP, if ultimately advanced, could involve provision of collaterals in significant amounts, which could be impacted by, among other things, the number of
projects and the length of the availability period.
In addition, on May 6, 2026, PJM published a document8 whereby it examines possible future reforms in
the capacity (availability) market. For additional details regarding the latest developments in the PJM capacity market – see Section 3C of the Report of the Board of Directors for 2025 and Section 8.1.2.1A of Part A of the Periodic Report for
2025.
NYISO market
For details regarding capacity auctions in the NYISO market – see Section 3C of the Report of the Board of
Directors for 2025.
Set forth below are the capacity prices determined in the seasonal auctions in the NYISO market (the prices are
denominated in dollars per megawatt per day):
|
Sub-Area
|
CPV Power
Plants
|
Summer 2026
|
Winter 2025/2026
|
Summer 2025
|
Winter 2024/2025
|
|
NYISO
Rest of the Market
|
–
|
174.46
|
89.83
|
153.26
|
66.30
|
|
Lower Hudson Valley
|
Valley
|
174.46
|
89.83
|
153.26
|
66.30
|
Source: NYISO – Converted from dollars for kilowatt per month to dollars for megawatt per day.
It is noted that the Valley power plant is located in Area G (Lower Hudson Valley) and the actual capacity
prices for the Valley power plants are impacted by the seasonal auctions, the monthly auctions and the SPOT prices, with variable capacity prices every month, as well as bilateral agreements with energy suppliers in the market.
| 8 |
For further details, see PJM’s publication dated May 6, 2026:
https://www.pjm.com/-/media/DotCom/library/reports-notices/special-reports/2026/20260506-powering-reliability-through-market-design.pdf
|
17
---Unofficial translation for convenience purposes---
OPC Energy Ltd.
Report of the Board of Directors
| 3. |
Main Developments in the Business and Regulatory Environment in the U.S. (Cont.)
|
| C. |
Capacity revenues (Cont.)
|
ISO‑NE market
For details regarding capacity auctions in the ISO‑NE market and a planned reform in the structure of the
capacity market – see Section 3C of the Report of the Board of Directors for 2025 and Section 8.1.2.1C of Part A of the Periodic Report.
Up to May 2025, the tariff applicable for the Towantic power plant was $313.97 MW/day (linked to the
Handy-Whitman Price Index from 2019).
Set forth below are the capacity payments determined in the sub‑regions that are relevant to the Towantic power
plant (the prices are denominated in dollars per megawatt per day):
|
Sub-Region
|
CPV Power Plants
|
2027/2028
|
2026/2027
|
2025/2026
|
|
ISO-NE
Rest of the Market
|
Towantic
|
117.70
|
85.15
|
85.15
|
Source: ISO-NE – the Company’s processing in order to convert from dollars for kilowatt per month to dollars for
megawatt per day.
It is noted that as at the approval date of the report the actual capacity prices for the Towantic power plant
are impacted by forward auctions, supplementary annual auctions, monthly auctions with capacity prices that change every month and bilateral agreements with energy suppliers in the market.
| D. |
Changes in the government’s policies and legislation of the One Big Beautiful Bill in the U.S. – for additional information regarding the impacts of the changes in the federal policies of the U.S. government, including with
respect to reduction of the government’s support of renewable energies, changes in the federal tax benefits, imposition of tariffs and the uncertainty created thereby, as well as the impacts of legislation of the One Big Beautiful Bill on
the activities of the CPV Group in the areas of natural gas and renewable energies – see Section 3D of the Report of the Board of Directors for 2025 and Section 8.1.3.1 of Part A of the Periodic Report for 2025. For additional details
regarding the possible impact on development projects, including on the forecasted start dates of the construction and the feasibility of the projects – see also Section 5C(2) below.
|
18
---Unofficial translation for convenience purposes---
OPC Energy Ltd.
Report of the Board of Directors
| 4. |
Analysis of the results of operations for the Three Months Ended March 31, 2026 (in millions of dollars)
|
| A. |
Consolidated statement of income
|
|
Section
|
For the Three Months Ended
|
|
|
March 31
|
||
|
*2026
|
2025
|
|
|
Revenues from sales and provision of services (1)
|
317
|
183
|
|
Cost of sales and provision of services (without depreciation and amortization) (2)
|
(245)
|
(139)
|
|
Depreciation and amortization
|
(24)
|
(17)
|
|
Gross profit
|
48
|
27
|
|
Share in earnings of associated companies
|
34
|
38
|
|
Administrative and general expenses
|
(23)
|
(15)
|
|
Business development expenses
|
(2)
|
(1)
|
|
Other expenses, net
|
(17)
|
(3)
|
|
Operating income
|
40
|
46
|
|
Financing expenses, net
|
(20)
|
(13)
|
|
Income before taxes on income
|
20
|
33
|
|
Income tax expenses
|
(6)
|
(8)
|
|
Net income for the period (3)
|
14
|
25
|
|
Attributable to:
|
||
|
The Company’s shareholders
|
12
|
18
|
|
Holders of non‑controlling interests
|
2
|
7
|
| * |
Starting from January and February 2026, the Company has commenced consolidating the Shore and Basin Ranch (under construction) power plants, respectively, in its financial
statements. For additional details – see Notes 6A and 6B to the Interim Statements.
|
19
---Unofficial translation for convenience purposes---
OPC Energy Ltd.
Report of the Board of Directors
| 4. |
Analysis of the results of operations for the Three Months Ended March 31, 2026 (in millions of dollars) (Cont.)
|
| A. |
Consolidated statement of income (Cont.)
|
(1) Changes in revenues:
|
Revenues
|
For the Three
|
Board’s Explanations
|
|
|
Months Ended
|
|||
|
March 31
|
|||
|
2026
|
2025
|
||
|
Revenues in Israel
|
|||
|
Revenues from sale of energy to private customers
|
96
|
78
|
An increase, in the amount of about $22 million, compared with the corresponding period last year,
stems mainly from an increase of about $10 million relating to an increase in customer consumption, and an increase of about $12 million due to a sharp drop in the average shekel/dollar exchange rate.
|
|
Revenues from sale of energy to the System Operator and to other suppliers
|
15
|
14
|
|
|
Revenues in respect of capacity payments
|
10
|
9
|
|
|
Revenues from sale of energy at cogeneration tariff
|
3
|
5
|
|
|
Revenues from sale of steam
|
4
|
4
|
|
|
Total revenues from sale of energy and others in Israel (without infrastructure services)
|
128
|
110
|
|
|
Revenues from private customers in respect of infrastructure services
|
53
|
36
|
An increase, in the amount of about $17 million, compared with the corresponding period last year,
stems mainly from an average increase in the tariffs at the rate of about 15%.
|
|
Total revenues in Israel
|
181
|
146
|
|
|
Revenues in the U.S.
|
|||
|
Revenues from generation and sale of electricity (Energy Transition)
|
84
|
–
|
The increase stems from the first‑time consolidation of the Shore power plant starting from January
2026.
|
|
Revenues in respect of capacity payments (Energy Transition)
|
14
|
–
|
The increase stems from the first‑time consolidation of the Shore power plant starting from January
2026.
|
|
Realization of derivatives for hedging electricity prices (Energy Transition)
|
(30)
|
–
|
The increase stems from the first‑time consolidation of the Shore power plant starting from January
2026.
|
|
Revenues from sale of electricity (Retail) activities
|
56
|
25
|
The increase stems mainly from an increase in the scope of the retail activities.
|
|
Revenues from provision of services and others
|
12
|
12
|
|
|
Total revenues in the U.S.
|
136
|
37
|
|
|
Total revenues
|
317
|
183
|
|
20
---Unofficial translation for convenience purposes---
OPC Energy Ltd.
Report of the Board of Directors
| 4. |
Analysis of the results of operations for the Three Months Ended March 31, 2026 (in millions of dollars) (Cont.)
|
| A. |
Consolidated statement of income (Cont.)
|
| (2) |
Changes in the consolidated cost of sales and provision of services:
|
|
Cost of Sales and
Provision of Services
|
For the Three
Months Ended
|
Board’s Explanations
|
|
|
March 31
|
|||
|
2026
|
2025
|
||
|
Cost of sales in Israel
|
|||
|
Natural gas and diesel oil
|
51
|
47
|
|
|
Expenses in respect of acquisition of energy
|
12
|
7
|
|
|
Cost of transmission of gas
|
4
|
4
|
|
|
Salaries and related expenses
|
4
|
2
|
|
|
Operating expenses
|
7
|
8
|
|
|
Total cost of sales in Israel without infrastructure services
|
78
|
68
|
|
|
Expenses in respect of infrastructure services
|
53
|
36
|
For details – see the explanation of the change in the revenues in respect of infrastructure services.
|
|
Total cost of sales in Israel
|
131
|
104
|
|
|
Cost of sales and services in the U.S.
|
|||
|
Cost of natural gas including RGGI (Energy Transition)
|
73
|
–
|
The increase stems from the first‑time consolidation of the Shore power plant starting from January 2026.
|
|
Operating expenses
(Energy Transition)
|
5
|
–
|
The increase stems from the first‑time consolidation of the Shore power plant starting from January 2026.
|
|
Realization of derivatives for hedging gas prices (Energy Transition)
|
(33)
|
-
|
The increase stems from the first‑time consolidation of the Shore power plant starting from January 2026.
|
|
Cost of sales in respect of sale of electricity (Retail)
|
58
|
24
|
The increase stems mainly from an increase in the scope of the retail activities.
|
|
Cost of sales in respect of provision of services and others
|
11
|
11
|
|
|
Total cost of sales and provision of services in the U.S.
|
114
|
35
|
|
|
Total cost of sales and provision of services
|
245
|
139
|
|
21
---Unofficial translation for convenience purposes---
OPC Energy Ltd.
Report of the Board of Directors
| 4. |
Analysis of the results of operations for the Three Months Ended March 31, 2026 (in millions of dollars) (Cont.)
|
| A. |
Consolidated statement of income (Cont.)
|
| (3) |
Consolidated net income and consolidated adjusted net income
|
| 1. |
Definitions
|
Adjusted net income or loss – net income or loss in accordance with IFRS plus or minus other expenses
and income, events of a non‑recurring nature, such as, impairment losses and reversals and transactions that are not in the ordinary course of business.
It is emphasized that the said adjusted net income or loss item in this report is not an item that is
recognized under IFRS or other generally accepted accounting standards as an index for measuring financial performances and is not intended to be considered as a substitute for income or loss or other terms provided pursuant to IFRS. It is possible
that the Company’s definitions of adjusted income or loss are different than those used by other companies. Nonetheless, the Company believes that the adjusted income or loss provides useful information to management and investors by excluding
certain items that management believes do not constitute an indication of the Company’s regular and ongoing business activities.
22
---Unofficial translation for convenience purposes---
OPC Energy Ltd.
Report of the Board of Directors
| 4. |
Analysis of the results of operations for the Three Months Ended March 31, 2026 (in millions of dollars) (Cont.)
|
| A. |
Consolidated statement of income (Cont.)
|
| (3) |
Consolidated net income and consolidated adjusted net income (Cont.)
|
| 2. |
Analysis of the change (in millions of dollars)
|
| (1) |
For an analysis of the change in the EBITDA after proportionate consolidation in the various segments in the Period of the Report compared with the corresponding period last year, see Sections B - E below.
|
| (2) |
Stems mainly from a loss, in the amount of about $12 million (after taxes), resulting from reclassification of balances of capital reserves and other comprehensive income (mostly in respect of hedging the electricity margin) to the
statement of profit and loss due to the initial consolidation of the Shore power plant and a loss of a non‑recurring nature in associated companies.
|
23
---Unofficial translation for convenience purposes---
OPC Energy Ltd.
Report of the Board of Directors
| 4. |
Analysis of the results of operations for the Three Months Ended March 31, 2026 (in millions of dollars) (Cont.)
|
| B. |
EBITDA, FFO (Funds From Operations) and net cash flows after debt service
|
| 1. |
Definitions
|
| – |
EBITDA indices
|
“EBITDA in the consolidated financial statements”9: net income (loss) for the period
before depreciation and amortization, financing expenses or income, net, taxes on income and other income (expenses), net.
“EBITDA after proportionate consolidation”: – “EBITDA in the consolidated financial statements” less the
share of the income (loss) of associated companies and plus a proportionate consolidation of the EBITDA of the associated companies based on the rate of the holdings of the CPV Group therein.
| – |
“FFO” (Funds From Operations) – with respect to active projects – cash flows from current operating activities for the period (including changes in working capital) and less investments in property, plant and equipment and
periodic maintenance costs that are not included in the operating activities and less net interest payments. With respect to the rest of the Group’s activities – cash flows from current operating activities for the period (including changes
in working capital) and less net interest payments (to the extent they do not relate to projects under construction). It is clarified that investments in property, plant and equipment (under construction and/or in development) including the
net interest payments in respect thereof, are not included in FFO.
|
| – |
“Adjusted FFO” – the “FFO” less the impacts of changes in working capital and receipts or payments of a non‑recurring nature or that are not in the ordinary course of business.
|
| – |
“Net cash flows after service of debt” – the “FFO” less/plus payment of principal in respect of financial debt or taking out of project debt and non‑project debt (loans and/or debentures), and after adjustments for a change in
other credit from banks and a change in cash, including cash restricted for debt service and deposits.
|
The said non‑IFRS measures are not recognized as indices for measurement of financial
performances and are not intended to be considered a replacement for gross profit or loss and operating income, cash flows from operating activities or other terms relating to operating performances or liquidity indices in accordance with IFRS.
It is noted that the EBITDA indices are not intended to present an approximate of the free cash flows from the
Group’s operating activities or to present cash available for distribution of dividends or other uses (particularly in light of provisions of the project financing agreements for some of the Group’s power plants), since such cash may be used for
debt service, capital investments, working capital and other liabilities. Moreover, the EBITDA indices are characterized by restrictions that limit the use thereof as indices for analyzing the Company’s profitability, since they do not take into
account certain income and expenses deriving from the Company’s business that could have a material impact on its net income or loss, such as depreciation expenses, financing expenses or income and taxes on income.
| 9 |
It is clarified that income in respect of lost profits is included in EBITDA in the consolidated statements.
|
24
---Unofficial translation for convenience purposes---
OPC Energy Ltd.
Report of the Board of Directors
| 4. |
Analysis of the results of operations for the Three Months Ended March 31, 2026 (in millions of dollars) (Cont.)
|
| B. |
EBITDA, FFO (Funds From Operations) and net cash flows after debt service (Cont.)
|
| 1. |
Definitions (Cont.)
|
The Company believes that the data items “EBITDA after proportionate consolidation” and “FFO”10
(including the adjusted) provide useful and transparent information to investors when reviewing the Company’s operating performances and current cash flows and when comparing such performances to performances of other companies in the same sector
or in other industries (having different capital structures, different levels of debt and/or different income tax rates) as well as when comparing performances between periods. It is noted that the “EBITDA after proportionate consolidation” data
item also serves the Company’s management when analyzing the Company’s performances.
The data item “net cash flows after debt service” provides additional information regarding the Group’s net
cash flows that are available for its use for purposes of growth and making of new investments, along with distribution of dividends to the shareholders (subject to compliance with the provisions of law, the trust certificates and non‑project
financing agreements and in accordance with the Company’s dividend distribution policy11).
| 10 |
It is noted that other companies might define EBITDA and FFO indices differently.
|
| 11 |
Pursuant to the Company’s dividend distribution policy, which was adopted by a decision of the Company’s Board of Directors in July 2017, it was determined that the Company will distribute, subject to the provisions of law and the
discretion of the Board of Directors, an annual dividend at the rate of at least 50% of the net after‑tax income. In 2024, the Company’s Board of Directors decided to suspend implementation of the dividend distribution policy for a period
of two years, in light of the Company’s growth strategy and the targets for expansion of its activities, while taking into account its business needs and preservation of its financial strength. In the decision of the Company’s Board of
Directors in March 2026, the suspension of the dividend distribution policy was extended for an additional at least two years, that is, at least up to March 2028, where at the end of this period the Board of Directors will consider
restarting of the said policy and the conformance thereof to the circumstances as they will be.
|
25
---Unofficial translation for convenience purposes---
OPC Energy Ltd.
Report of the Board of Directors
| 4. |
Analysis of the results of operations for the Three Months Ended March 31, 2026 (in millions of dollars) (Cont.)
|
| B. |
EBITDA, FFO (Funds From Operations) and net cash flows after debt service (Cont.)
|
| 2. |
Calculation of EBITDA
|
EBITDA calculations in the consolidated statement, including EBITDA after proportionate consolidation (in
millions of dollars):
|
For the
|
||
|
Three Months Ended
|
||
|
March 31
|
||
|
Revenues from sales and provision of services
|
317
|
183
|
|
Cost of sales (without depreciation and amortization)
|
(245)
|
(139)
|
|
Share in income of associated companies
|
34
|
38
|
|
Administrative and general expenses (without depreciation and
amortization)
|
(22)
|
(14)
|
|
Business development expenses
|
(2)
|
(1)
|
|
Consolidated EBITDA
|
82
|
67
|
|
Elimination of the share in income of associated companies
|
(34)
|
(38)
|
|
Plus – Group’s share of the proportionate EBITDA of associated companies in the Energy Transition segment
|
65
|
77
|
|
Plus – Group’s share of the proportionate EBITDA of activities
in the Renewable Energies segment in the U.S.
|
11
|
7
|
|
EBITDA after proportionate consolidation
|
124
|
113
|
| * |
Starting from January and February 2026, the Company has commenced consolidating the Shore and Basin Ranch (under construction) power plants, respectively, in its financial
statements. For additional details – see Notes 6A and 6B to the Interim Statements.
|
26
---Unofficial translation for convenience purposes---
OPC Energy Ltd.
Report of the Board of Directors
| 4. |
Analysis of the results of operations for the Three Months Ended March 31, 2026 (in millions of dollars) (Cont.)
|
| B. |
EBITDA, FFO (Funds From Operations) and net cash flows after debt service (Cont.)
|
Set forth below is a breakdown of the EBITDA after proportionate consolidation data broken down by subsidiaries
(on a consolidated basis) and the associated companies (on a proportionate basis, based on the rate of the holdings of the CPV Group therein) as well as FFO and cash flows after service of debt data (in millions of dollars):
|
Main projects in operation
|
For the three months ended
|
For the three months ended
|
|||||
|
Basis of
|
March 31, 2026
|
March 31, 2025
|
|||||
|
presentation
|
|||||||
|
in the
|
EBITDA
|
EBITDA
|
|||||
|
Company’s
|
after
|
Net cash
|
after
|
Net cash
|
|||
|
financial
|
proportionate
|
flows after
|
proportionate
|
flows after
|
|||
|
statements
|
consolidation
|
FFO(6)
|
debt service
|
consolidation
|
FFO(6)
|
debt service
|
|
|
Total operating projects in Israel and accompanying business activities (1)
|
Consolidated
|
45
|
36
|
33
|
38
|
61
|
57
|
|
Business development costs, headquarters in Israel and other costs
|
Consolidated
|
(1)
|
(12)
|
(18)
|
–
|
(8)
|
(9)
|
|
Total Israel (2)
|
44
|
24
|
15
|
38
|
53
|
48
|
|
|
Total operating projects (3)
|
Associated + consolidated
|
88
|
49
|
74
|
77
|
51
|
(37)
|
|
Other expenses
|
Consolidated
|
–
|
(1)
|
(1)
|
–
|
(1)
|
(1)
|
|
Total energy transition in the U.S.
|
88
|
48
|
73
|
77
|
50
|
(38)
|
|
|
Total operating projects
|
Associated
|
12
|
7
|
3
|
9
|
6
|
–
|
|
Business development and other costs
|
Associated
|
(1)
|
(1)
|
(1)
|
(2)
|
(1)
|
(1)
|
|
Total renewable energy in the U.S.
|
11
|
6
|
2
|
7
|
5
|
(1)
|
|
|
Total activities as part of the “others” segment (4)
|
Consolidated
|
(6)
|
(10)
|
(5)
|
(2)
|
(2)
|
(2)
|
|
Headquarters in the United States (5) (6)
|
Consolidated
|
(10)
|
(78)
|
(78)
|
(5)
|
(12)
|
(12)
|
|
Total United States
|
83
|
(34)
|
(8)
|
77
|
41
|
(53)
|
|
|
Company headquarters (not allocated to the segments) (5)
|
Consolidated
|
(3)
|
(11)
|
(49)
|
(2)
|
(5)
|
(1)
|
|
Total consolidated
|
124
|
(21)
|
(42)
|
113
|
89
|
(6)
|
|
| (1) |
The accompanying business activities in Israel include mainly virtual supply activities through OPC Israel, and sale/purchase of natural gas, including with third parties through OPC Natural Gas.
|
| (2) |
Not including intercompany activities between the headquarters and the subsidiaries in Israel.
|
| (3) |
For details regarding active projects in the Energy Transition segment in the U.S. – see Section 4D below.
|
| (4) |
Includes mainly business development and other costs in the area of initiation and development of high‑efficiency natural gas-fired power plants, with future carbon capture potential, and the results of the retail activities in the
U.S.
|
| (5) |
After elimination of management fees between the CPV Group and the Company, in the amounts of about $3 million and about $2 million for the periods ended March 31, 2026 and 2025, respectively.
|
| (6) |
Set forth below are additional details regarding the FFO (in millions of dollars):
|
27
---Unofficial translation for convenience purposes---
OPC Energy Ltd.
Report of the Board of Directors
| 4. |
Analysis of the results of operations for the Three Months Ended March 31, 2026 (in millions of dollars) (Cont.)
|
| B. |
EBITDA, FFO (Funds From Operations) and net cash flows after debt service (Cont.)
|
|
For the three months ended March 31, 2026
|
For the three months ended March 31, 2025
|
|||||||
|
Working
|
Working
|
|||||||
|
capital
|
Other
|
Adjusted
|
capital
|
Other
|
Adjusted
|
|||
|
FFO
|
changes
|
changes*
|
FFO
|
FFO
|
changes
|
changes
|
FFO
|
|
|
Israel
|
24
|
3
|
–
|
27
|
53
|
(24)
|
–
|
29
|
|
U.S.
|
(34)
|
17
|
70
|
53
|
41
|
7
|
–
|
48
|
|
Company headquarters
|
(11)
|
6
|
–
|
(5)
|
(5)
|
(3)
|
–
|
(8)
|
|
Total consolidated
|
(21)
|
26
|
70
|
75
|
89
|
(20)
|
–
|
69
|
| * |
In respect of a payment in the amount of about $70 million, as part of exercise of participation units by employees of the CPV Group upon conclusion of the long‑term remuneration plan from 2021. For details regarding approval of a new
long‑term remuneration plan – see Note 7F to the Interim Statements.
|
28
---Unofficial translation for convenience purposes---
OPC Energy Ltd.
Report of the Board of Directors
| 4. |
Analysis of the results of operations for the Three Months Ended March 31, 2026 (in millions of dollars) (Cont.)
|
| C. |
Analysis of the change in EBITDA and the generation data – Israel segment (Cont.)
|
| (1) |
Set forth below is an analysis of the change in EBITDA in the Israel segment in the Period of the Report compared with the corresponding period last year (in millions of dollars):
|
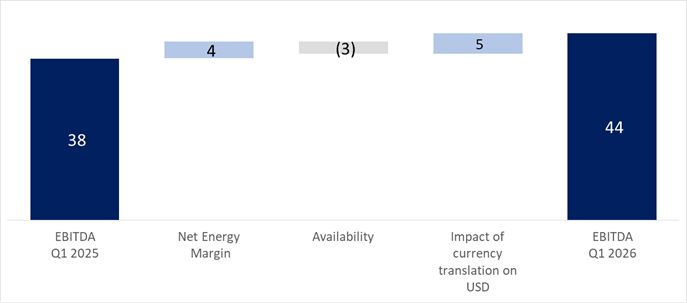
Energy margin – the increase stems mainly from a decline in the natural‑gas price against the background of the weakening
of the dollar against the shekel and from optimization of customers, offset by a decline in the generation component.
Availability (operational) – (A) Zomet power plant – for details regarding a technical defect found in the power plant, its
partial availability and the gradual replacement of the generation units – see Section 4C(1) of the Report of the Board of Directors for 2025. That stated had a negative impact on the power plant’s availability in the Period of the Report and,
accordingly on its financial results. As at the approval date of the report, the process of repair of the defect, including completion of replacement of the generation units, had started and in the Company’s estimation, is expected to be mostly
completed by the end of 2026. Therefore, in the Company’s estimation the said partial availability, is expected to be about 65%–70% of the power plant’s capacity (about the same as the capacity in 2025), and is expected to unfavorably impact the
EBITDA in Israel in 202612. (B) Hadera power plant – further to that stated in Section 4C(1) of the Report of the Board of Directors for 2025, in the Period of the Report, a defect was found at the Hadera power plant. As at the approval
date of the report, the power plant had returned to regular operation, and the said event did not have a significant impact on its financial results. In addition, as at the approval date of the report, the Company is considering submission of an
insurance claim in respect of that stated.
| 12 |
That stated in this Section regarding repair of the defect and the duration of the period of its repair, including the expected scope of the partial availability, constitutes “forward‑looking” information as it
is defined in the Securities Law, which is based on the Company’s estimates as at the approval date of the report and regarding which there is no certainty it will materialize. Ultimately, there could be difficulties or delays in completion
of the repair, its success and/or execution of the necessary repairs and replacement of the units and there could also be additional breakdowns or shutdowns due to, among other things, technical and operational factors and other factors
relating to the contractor, transport of the equipment, performance of the work (including due to the security/defense situation in Israel). Continuation or a failure of the repair has a negative impact on the power plant’s results. For
additional details – see Section 7.11.1 of Part A of the Periodic Report for 2025.
|
29
---Unofficial translation for convenience purposes---
OPC Energy Ltd.
Report of the Board of Directors
| 4. |
Analysis of the results of operations for the Three Months Ended March 31, 2026 (in millions of dollars) (Cont.)
|
| C. |
Analysis of the change in EBITDA and the generation data – Israel segment (Cont.)
|
| (2) |
Set forth below is detail regarding the generation at the power plants in the Israel segment:
|
|
For the Three Months Ended March 31, 2026
|
For the Three Months Ended March 31, 2025
|
||||||||
|
Actual
|
Actual
|
||||||||
|
Potential
|
Net
|
Actual
|
calculated
|
Potential
|
Net
|
Actual
|
calculated
|
||
|
electricity
|
electricity
|
generation
|
availability
|
electricity
|
electricity
|
generation
|
availability
|
||
|
Capacity
|
generation
|
generation
|
percentage
|
percentage
|
generation
|
generation
|
percentage
|
percentage
|
|
|
(MW)
|
(GWh)
|
(GWh)
|
(%)
|
(%)
|
(GWh)
|
(GWh)
|
(%)
|
(%)
|
|
|
Rotem
|
466
|
963
|
923
|
95.8%
|
99.6%
|
961
|
926
|
96.4%
|
99.3%
|
|
Hadera (A)
|
144
|
256
|
226
|
88.0%
|
89.2%
|
257
|
233
|
90.6%
|
90.8%
|
|
Gat (B)
|
75
|
155
|
92
|
59.7%
|
95.7%
|
154
|
143
|
92.9%
|
100.0%
|
|
Zomet (C)
|
396
|
765
|
54
|
7.1%
|
55.5%
|
782
|
73
|
9.3%
|
67.5%
|
Definitions:
| – |
The generation potential is the net generation capability adjusted for temperature and humidity.
|
| – |
The actual net generation in the period.
|
| – |
The actual generation percentage is the net electricity generated divided by the generation potential.
|
Operating events in the Period of the Report and thereafter13:
| A. |
For details – see Section 4C(1).
|
| B. |
As part of management of the electricity sector in Israel at the time of the “Lion’s Roar” military operation, the Gat power plant was operated partially, in accordance with the instructions of the System Operator. That stated did not
have a significant impact on the Company’s results.
|
| C. |
The generation potential presented in the above table does not include the temporary generation limitation that continued in the Period of the Report – as detailed in Section 4C(1) above.
|
| 13 |
That stated regarding existing or expected maintenance. Completion thereof (including repair of the defect at Hadera, its impact and/or the insurance coverage) and/or the period of time required for the
completion thereof constitutes “forward‑looking” information as it is defined in the Securities Law, regarding which there is no certainty it will materialize. Ultimately, maintenance, as stated (and unplanned maintenance that could be
caused), could continue beyond the expected date, this being as a result of, among other things, operating factors, technical breakdowns, constraints relating to maintenance and equipment contractors and the timetables for receipt (arrival)
of the relevant equipment (including the impact of the security/defense situation in Israel). Delays and/or failures in completion of the maintenance have a negative impact on the relevant power plant’s operating results.
|
30
---Unofficial translation for convenience purposes---
OPC Energy Ltd.
Report of the Board of Directors
| 4. |
Analysis of the results of operations for the Three Months Ended March 31, 2026 (in millions of dollars) (Cont.)
|
| D. |
Analysis of the change in EBITDA, the generation data, energy hedges and capacity – Energy Transition segment in the U.S.
|
| (1) |
Set forth below is an analysis of the change in the EBITDA after proportionate consolidation in the Energy Transition segment in the Period of the Report compared with the corresponding period last year (in millions of dollars):
|
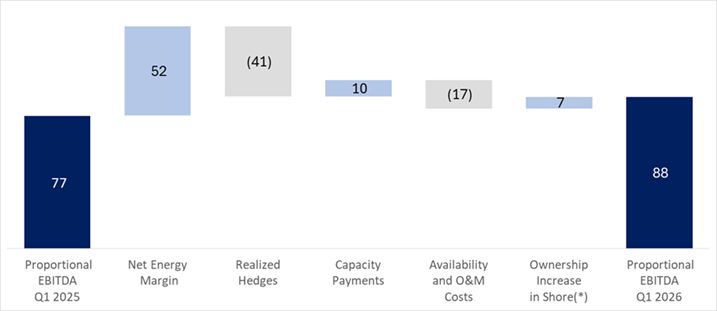
Energy and hedging margins – as detailed in Section 3A above, in the Period of the
Report there was an increase in the electricity margins compared with the corresponding period last year and, accordingly, there was an increase in the energy margins of the CPV Group (without the impact of the increase in the holdings in the Shore
power plant), which was partly offset by energy hedges.
Revenues from capacity payments – most of the increase stems from an increase in the
capacity tariff in the PJM market starting from June 2025. This increase was partly offset by a decrease in the capacity tariff of the Towantic power plant starting from June 2025 – this being as a result of conclusion of the fixed-rate (of seven
years) wherein the capacity tariff was fixed in advance from Towantic’s operation date. For details – see Section 3C above.
Operating and capacity expenses (operational) – most of the increase stems from
planned maintenance work at the Maryland power plant in March 2026 and an operating breakdown in one of the generation units at the Fairview power plant, as detailed in Section 4D(4), below.
Increase in the rate of holdings in the Shore power plant – reflects the impact of
the increase in the holdings at the rate of 20% in the second quarter of 2025, and an additional about 11% starting from January 2026. For additional details – see Note 6B to the Interim Statements.
31
---Unofficial translation for convenience purposes---
OPC Energy Ltd.
Report of the Board of Directors
| 4. |
Analysis of the results of operations for the Three Months Ended March 31, 2026 (in millions of dollars) (Cont.)
|
| D. |
Analysis of the change in EBITDA, the generation data, energy hedges and capacity – Energy Transition segment in the U.S. (Cont.)
|
| (2) |
Analysis of the Group’s share in the proportionate EBITDA, FFO and net cash flows after service of project debt of associated companies by project in the Energy Transition segment (in millions of dollars):
|
|
Three months ended March 31, 2026
|
Associates
|
Consolidated
|
||||||
|
Fairview (1)
|
Towantic
|
Maryland
|
Valley
|
Three
Rivers
|
Total
associates
|
Shore
(2)
|
Total
|
|
|
Rate of holdings of the CPV Group in the project:
|
25%
|
26%
|
75%
|
50%
|
10%
|
100%
|
||
|
Revenues from sales of energy
|
13
|
43
|
106
|
83
|
11
|
256
|
82
|
338
|
|
Cost of natural gas
|
10
|
34
|
72
|
28
|
6
|
150
|
64
|
214
|
|
Carbon emissions tax (RGGI)
|
–
|
4
|
6
|
7
|
–
|
17
|
9
|
26
|
|
Cost of sales – other expenses (excluding depreciation and amortization)
|
–
|
–
|
1
|
1
|
–
|
2
|
1
|
3
|
|
Gain (loss) on realization of transactions hedging the electricity margins
|
3
|
–
|
(16)
|
(20)
|
1
|
(32)
|
3
|
(29)
|
|
Net energy margin
|
6
|
5
|
11
|
27
|
6
|
55
|
11
|
66
|
|
Revenues from capacity payments
|
2
|
2
|
10
|
4
|
2
|
20
|
14
|
34
|
|
Other income
|
–
|
5
|
2
|
–
|
–
|
7
|
3
|
10
|
|
Gross profit
|
8 |
12
|
23
|
31
|
8
|
82
|
28
|
110
|
|
Fixed costs (excluding depreciation and amortization)
|
1
|
1
|
6
|
5
|
1
|
14
|
4
|
18
|
|
Administrative and general expenses (excluding depreciation
|
||||||||
|
and amortization)
|
–
|
–
|
1
|
–
|
–
|
1
|
1
|
2
|
|
Loss from revaluation of unrealized hedging transactions
|
(1)
|
(1)
|
–
|
–
|
–
|
(2)
|
–
|
(2)
|
|
Group’s share in EBITDA after proportionate consolidation
|
6
|
10
|
16
|
26
|
7
|
65
|
23
|
88
|
|
Group’s share in FFO
|
4
|
1
|
13
|
18
|
6
|
42
|
7
|
49
|
|
Group’s share in net cash flows after service of project debt (4)
|
–
|
–
|
11
|
(3)58
|
5
|
74
|
–
|
74
|
| (1) |
For details regarding an operational outage at the Fairview power plant in the Period of the Report – see Section 4D(4) below.
|
| (2) |
At the Shore power plant – gas transmission costs (totaling about $4 million) are classified in accordance with IFRS 16 as depreciation expenses and, accordingly, are not included in the EBITDA.
|
| (3) |
The net cash flows after debt service in Valley include taking out of additional project financing as part of the refinancing agreement in the first quarter of 2026, which was used for repayment of shareholders’ loans and distribution of
a dividend, where the CPV Group’s share amounted to about $50 million. For additional details – see Section 6A(3) below.
|
| (4) |
It is noted that the financing agreements of the CPV Group include “cash sweep” mechanisms, in which all or part of the free cash flows of the projects is designated for repayment of loan principal on a current basis along with a
predetermined minimum repayment schedule for each long‑term loan. This mechanism allows for faster repayments if certain events occur and also places restrictions on distributions to shareholders.
|
| (*) |
In line with the Company’s strategy to gain control over some of the active power plants of the CPV Group, various transactions were completed in the second quarter of 2025 and in the first quarter of 2026, for increasing the holdings in
the Shore power plant (from 68% to 100% as at the date of the report). In May 2026, a transaction was completed for increasing the holdings in the Maryland power plant (from 75% to 100% as at the date of the report).
|
32
---Unofficial translation for convenience purposes---
OPC Energy Ltd.
Report of the Board of Directors
| 4. |
Analysis of the results of operations for the Three Months Ended March 31, 2026 (in millions of dollars) (Cont.)
|
| D. |
Analysis of the change in EBITDA, the generation data, energy hedges and capacity – Energy Transition segment in the U.S. (Cont.)
|
| (2) |
Analysis of the Group’s share in the proportionate EBITDA, FFO and net cash flows after service of project debt of associated companies by project in the Energy Transition segment (in millions of dollars): (Cont.)
|
|
Three months ended March 31, 2025
|
Associates
|
||||||
|
Three
|
|||||||
|
Fairview
|
Towantic
|
Maryland
|
Shore (1)
|
Valley
|
Rivers
|
Total
|
|
|
Rate of holdings of the CPV Group in the project:
|
25%
|
26%
|
75%
|
69%
|
50%
|
10%
|
|
|
Revenues from sales of energy
|
26
|
38
|
54
|
32
|
63
|
7
|
220
|
|
Cost of natural gas
|
14
|
29
|
35
|
26
|
27
|
4
|
135
|
|
Carbon emissions tax (RGGI)
|
–
|
3
|
9
|
3
|
6
|
–
|
21
|
|
Cost of sales – other expenses (excluding depreciation and amortization)
|
–
|
–
|
1
|
1
|
–
|
–
|
2
|
|
Gain (loss) on realization of transactions hedging the electricity margins
|
1
|
(1)
|
6
|
7
|
(5)
|
2
|
10
|
|
Net energy margin
|
13
|
5
|
15
|
9
|
25
|
5
|
72
|
|
Revenues from capacity payments
|
1
|
9
|
2
|
2
|
3
|
–
|
17
|
|
Other income
|
–
|
1
|
2
|
1
|
–
|
–
|
4
|
|
Gross profit
|
14
|
15
|
19
|
12
|
28
|
5
|
93
|
|
Fixed costs (excluding depreciation and amortization)
|
1
|
1
|
2
|
2
|
5
|
1
|
12
|
|
Administrative and general expenses (excluding depreciation and amortization)
|
–
|
–
|
1
|
1
|
1
|
–
|
3
|
|
Loss from revaluation of unrealized hedging transactions
|
(1)
|
–
|
–
|
–
|
–
|
–
|
(1)
|
|
Group’s share in EBITDA after proportionate consolidation
|
12
|
14
|
16
|
9
|
22
|
4
|
77
|
|
Group’s share in FFO
|
9
|
10
|
10
|
–
|
19
|
3
|
51
|
|
Net cash flows after service of project debt
|
4
|
8
|
2
|
(2)(56)
|
4
|
1
|
(37)
|
| (1) |
At the Shore power plant – gas transmission costs (totaling about $3 million) are classified in accordance with IFRS 16 as depreciation expenses and, accordingly, are not included in the EBITDA.
|
| (2) |
The net cash flows after service of the project debt in Shore includes partial repayment of debt that was made as part of the refinancing made in February 2025. For additional details – see Section 6A(5) of the Report of the Board of
Directors for 2025.
|
33
---Unofficial translation for convenience purposes---
OPC Energy Ltd.
Report of the Board of Directors
| 4. |
Analysis of the results of operations for the Three Months Ended March 31, 2026 (in millions of dollars) (Cont.)
|
| D. |
Analysis of the change in EBITDA, the generation data, energy hedges and capacity – Energy Transition segment in the U.S. (Cont.)
|
| (3) |
Additional details regarding energy hedges and guaranteed capacity payments in the Energy Transition segment in the U.S.
|
As part of its policy for the management of the exposures, the CPV Group is in the
practice, from time to time, of entering into hedging agreements, which are designed to reduce the fluctuations in the electricity margins. In addition, the capacity revenues for the nominal capacity of the natural gas-fired power plants are
determined for certain future periods, as detailed in Section 3A above.
Set forth below is the scope of the hedging for the rest of 2026 as at the date of the
report14:
|
April–December
2026
|
|
|
Expected generation (MWh) *
|
9,488,000
|
|
Net scope of the hedged energy margin (% of the expected generation of the power plants) **
|
71%
|
|
Net hedged energy margin (millions of $)
|
≈ 122
|
|
Net hedged energy margin ($/MWh)
|
18.2
|
|
Net market prices of energy margin ($/MWh) ***
|
19.0
|
| * |
The expectation for the generation including adjustments in respect of planned and unplanned maintenance work. It is noted that the lost profits due to the outage in the Fairview
power plant is expected to be mostly covered by insurance (the insurance proceeds were not recognized in the Period of the Report in accordance with generally accepted accounting principals). For details regarding the outage – see
Section 4D(4) below and details regarding the results of the activities of the Fairview power plant in the Period of the Report (in respect of 50%) – see Section 4D(2) above.
|
| ** |
Pursuant to the policy for hedging electricity margins as at the date of the report, in general the CPV Group seeks to hedge about 50% of the expected generation. The actual hedge rate could ultimately be different, depending on the
market factors.
|
| *** |
The net energy margin is the energy margin (Spark Spread) plus/minus Power Basis less carbon tax (RGGI) and other variable costs. For details regarding the manner of calculation of the electricity margin (Spark Spread) – see Section 3A
above. The market prices of the net energy margin are based on future contracts for electricity and natural gas.
|
14 The estimated percentages and the actual hedged energy margins could change due to the execution
of new hedges, capacity sales, changes in market conditions, or modifications to the CPV Group’s hedging policy. That stated in this Section with respect to the scope of the hedge, the energy margin, generation
expectation, hedging policy and the scope and amount of the availability receipts, constitutes “forward‑looking” information as it is defined in the Securities Law, which may change due to, among other things, operating factors and availability
of the power plant, market conditions, regulatory changes and/or occurrence of one or more of the risk factors as stated in Section 19 of Part A of the Periodic Report.
34
---Unofficial translation for convenience purposes---
OPC Energy Ltd.
Report of the Board of Directors
| 4. |
Analysis of the results of operations for the Three Months Ended March 31, 2026 (in millions of dollars) (Cont.)
|
| D. |
Analysis of the change in EBITDA, the generation data, energy hedges and capacity – Energy Transition segment in the U.S. (Cont.)
|
| (3) |
Additional details regarding energy hedges and guaranteed capacity payments in the Energy Transition segment in the U.S. (Cont.)
|
Set forth below is the scope of the secured capacity revenues for the rest of 2026 as at
the date of the report:
|
April–
December
2026
|
|
|
Scope of the secured capacity revenues (% of the power plant’s capacity)(*)
|
91%
|
|
Capacity receipts (millions of $)
|
≈ 118
|
| (*) |
Most of the non‑secured capacity revenues relate to the Valley power plant that operates in the NYISO market. For details regarding the capacity auctions in this market – see
Section 3C above.
|
It is noted that the data detailed in the above tables includes the increase in the
holdings in the Maryland power plant, at the rate of about 25%, and sale of the rights in the Three Rivers power plant, which as at the date of the report is held at the rate of 10%. The exchange transaction was completed in May 2026.
35
---Unofficial translation for convenience purposes---
OPC Energy Ltd.
Report of the Board of Directors
| 4. |
Analysis of the results of operations for the Three Months Ended March 31, 2026 (in millions of dollars) (Cont.)
|
| D. |
Analysis of the change in EBITDA, the generation data, energy hedges and capacity – Energy Transition segment in the U.S. (Cont.)
|
| (4) |
Set forth below is detail regarding the generation of the power plants in the Energy Transition segment in the U.S.
|
|
For the Three Months Ended March 31, 2026
|
For the Three Months Ended March 31, 2025
|
||||||||
|
Potential
|
Net
|
Actual
|
Actual
|
Potential
|
Net
|
Actual
|
Actual
|
||
|
electricity
|
electricity
|
generation
|
availability
|
electricity
|
electricity
|
generation
|
availability
|
||
|
Capacity
|
generation
|
generation
|
percentage
|
percentage
|
generation
|
generation
|
percentage
|
percentage
|
|
|
(MW)
|
(GWh) (1)
|
(GWh) (2)
|
(%) (3)
|
(%)
|
(GWh)
|
(GWh)
|
(%)
|
(%)
|
|
|
Energy transition projects (natural gas)
|
|||||||||
|
Shore (A)
|
725
|
1,583
|
937
|
59.2%
|
96.4%
|
1,476
|
778
|
49.1%
|
92.6%
|
|
Maryland (B)
|
745
|
1,620
|
816
|
50.2%
|
72.2%
|
1,620
|
1,066
|
65.8%
|
98.9%
|
|
Valley
|
720
|
1,555
|
1,414
|
91.0%
|
95.7%
|
1,555
|
1,438
|
92.6%
|
99.6%
|
|
Towantic
|
805
|
1,741
|
1,517
|
83.2%
|
99.5%
|
1,741
|
1,459
|
80.0%
|
99.9%
|
|
Fairview (C)
|
1,050
|
2,324
|
886
|
38.9%
|
47.6%
|
2,324
|
2,127
|
93.2%
|
100.0%
|
|
Three Rivers
|
1,258
|
2,717
|
1,761
|
66.5%
|
99.3%
|
2,717
|
1,615
|
61.0%
|
97.9%
|
Definitions
| – |
The potential generation is the gross generation capability during the period after planned maintenance and less the electricity used for the power plant’s internal purposes.
|
| – |
The net generation of electricity is the gross generation during the period less the electricity used for the power plant’s internal purposes.
|
| – |
The actual generation percentage is the quantity of the net electricity generated in the facilities compared with the maximum quantity that can be generated in the period.
|
Significant operating events
| A. |
Subsequent to the period of the report, execution of the planned maintenance work commenced at the power plant.
|
| B. |
Mainly due to performance of planned maintenance work in the period of the report, which as at the date of the report had been completed.
|
| C. |
In December 2025, as part of planned maintenance work, an operational malfunction occurred in one of the step‑up transformers for a generating unit, as a result of which the power plant’s generation capacity was temporarily limited to
about 50% of its full capacity. In the estimation of the CPV Group, as at the approval date of the report, the power plant is expected to return to full operation in 202715. As at the approval date of the report, Fairview has
submitted a claim under the power plant’s insurance policy, both in respect of the direct costs to repair the damage and for loss of the expected profits.
|
| 15 |
That said regarding the expectation of return to the power plant’s full activities and/or the results of the claim under the insurance policy constitutes “forward‑looking” information regarding which there is
no certainty it will be realized. Ultimately, there could be delays or breakdowns due to operational factors, delays or breakdowns in the course of performance of the work and/or delays in arrival of conforming equipment. It is noted that
in the usual course of things, extended maintenance (planned or unplanned) has a negative impact on the power plant’s results. In addition, as at the approval date of the report there is no certainty regarding the insurance compensation in
accordance with the claim and the timing date thereof.
|
36
---Unofficial translation for convenience purposes---
OPC Energy Ltd.
Report of the Board of Directors
| 4. |
Analysis of the results of operations for the Three Months Ended March 31, 2026 (in millions of dollars) (Cont.)
|
| E. |
Analysis of the change in EBITDA after proportionate consolidation – Renewable Energies segment in the U.S.
|
| (1) |
Set forth below is an analysis of the change in the EBITDA after proportionate consolidation in the renewable energies segment in the Period of the Report compared with the corresponding period last year (in millions of dollars):
|
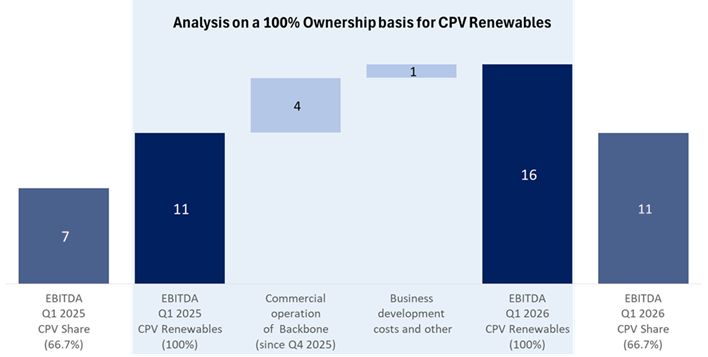
37
---Unofficial translation for convenience purposes---
OPC Energy Ltd.
Report of the Board of Directors
| 5. |
Projects Under Construction and Development Projects
|
| A. |
Israel segment – projects under construction and pipeline projects (held at 100% ownership by OPC Israel)16:
|
| 1. |
Main details with reference to construction projects (the data presented in the table below is in respect of 100% for each project):
|
|
Date/expectation
of the start
of the commercial
operation
|
Total construction
cost as at
March 31, 2026
|
|||||||
|
Power plants/ facilities
for generation of energy
|
Capacity
(MW)
|
Main
customer
|
Total expected
construction cost
|
|||||
|
Status
|
Location
|
Technology
|
||||||
|
OPC Sorek 2 Ltd. (“Sorek 2”)
|
Acceptance tests after completion of the construction
|
≈ 87
|
On the premises of the Sorek B seawater desalination facility
|
Powered by natural gas, cogeneration
|
2026
|
Yard consumers and the System Operator
|
17≈ $80 million (≈ NIS 0.25 billion)
|
≈ $72 million (≈ NIS 0.23 billion)
|
The timetables for operation and the construction costs of Sorek 2 were negatively impacted by, among other things, the defense situation and the war
in Israel, as detailed in Section 2B above (including their impact on the facilities of the project’s consumer). For additional details – see Section 7.15.1.2 of Part A of the Periodic Report for 2025.
| 16 |
Details regarding the scope of the investments in Israel were translated from NIS into $ based on the rate of exchange on March 31, 2026. That stated in connection with projects that have not yet reached
operation, including with reference to the development stages, expected operation/construction date, the anticipated technologies, regulation, quota or commercial format, capacity and project characteristics, undertakings in the project
agreements (financing, equipment, construction and gas, as applicable), receipt of relevant approvals (including permits and connection surveys) and/or regarding the costs involved in the projects, including the anticipated cost of the
investment and costs of agreements, is “forward‑looking” information, as it is defined in the Securities Law, which is based on, among other things, the Company’s estimates as at the approval date of the report and regarding which there
is no certainty it will be realized (in whole or in part). Completion of the said projects (or any one of them) may not occur or may occur in a manner different than that stated above, among other things due to dependency on various
factors, including those that are not under the Company’s control, including completion of the construction and connection work, assurance of connection to the network and output of electricity from the project sites and/or connection to
the infrastructures (including the electricity grid and gas infrastructures), receipt of permits, completion of planning processes and licensing, application of relevant regulation, obtaining a quota and/or formulation of a commercial
format, completion of construction work, final costs in respect of development, construction, equipment and acquisition of rights in land, the proper functioning of the equipment, force majeure events and/or the terms of undertakings with main suppliers (including lenders), and there is no certainty they will be fulfilled, the manner of their fulfillment, the extent
of their impact or what their final terms will be. Ultimately technical, operational or other delays and/or breakdowns (including as a result of events as stated relating to the project’s consumer, if relevant) and/or an increase in
expenses and/or other changes could be caused, this being as a result of, among other things, factors as stated above or as a result of occurrence of one or more of the risk factors the Company is exposed to, including construction risks
(including force majeure events, the defense/security situation and its impacts), regulatory, licensing or planning risks, environmental
factors, macro‑economic changes, delays in receipt of permits, delays/problems regarding performance of acceptance tests or assurance of connection to the networks and infrastructures, delays and increased costs due relating to the supply
chain, factors relating to main suppliers and financing costs, changes in raw‑material prices and etc. For additional details regarding risk factors – see Section 19 of Part A of the Periodic Report. Accordingly, there is no certainty
regarding actual execution of development and construction projects (or any of them). It is further clarified that delays in completion of the projects beyond the date originally planned for this or a failure to enter them into operation
for whatever reason, involve an increase in costs or loss of expenses and payments (including by force of agreements the projects have signed) and/or impact the ability of the Company and the Group companies to comply with their
obligations to third parties (including under guarantees provided), including authorities, conditions of permits, lenders, consumers, suppliers and others, in connection with the projects, and/or cause a charge for additional costs,
payment of compensation (including forfeiture of guarantees or advance payments) or starting of proceedings (including under guarantees provided).
|
17 Not including a charge for headquarters costs and financing for the Company and the
headquarters in Israel.
38
---Unofficial translation for convenience purposes---
OPC Energy Ltd.
Report of the Board of Directors
| 5. |
Projects Under Construction and Development Projects (Cont.)
|
| A. |
Israel segment – projects under construction and pipeline projects (held at 100% ownership by OPC Israel(16: (Cont.)
|
| 2. |
Main details regarding projects in advanced development in Israel18 19:
|
|
Expected
construct-
ion
date
|
Total
expected
construction
cost
|
Additional
developments
in the project
|
||||
|
Capacity
(MW)
|
Expected
regulation
|
|||||
|
Project
|
Location
|
|||||
|
Ramat Beka (photovoltaic with integrated storage)
|
About 550 megawatts plus storage capacity estimated at a capacity of up to about 3,850 megawatt-hours20.
|
Proximate to the areas of the Local Industrial Council Naot Hovav (the land will be leased from Israel Lands Administration for a period of 24 years and 11 months).
|
Up to the end of 2026 (payment expected for lease of the project’s areas by the end of the second quarter of 2026).
|
About $1.4 billion (About NIS 4.3 billion).
|
Decision No. 71101 – Bilateral Market Regulation for Generation and Storage Facilities Connected to or Integrated in the Transmission Grid
Applicability: From January 1, 2026, renewable energy generation facilities with integrated storage (which are required to comply with a storage capacity to installed
generation capacity ratio that does not exceed 7) that will receive tariff approval up to June 1, 2027 or up a total quota of 2,000 megawatts.
Main conditions: Signing of capacity transactions with virtual suppliers, which will give the supplier a right to purchase energy at the half‑hour market price “SMP” in
every hour up to a ceiling of the capacity certificate the supplier acquired from the generator. The capacity stated in the capacity certificate for a renewable energy facility with integrated storage of 4 and 5 hours of discharge, will
receive tariff approval as part of the first quota of the regulation, at the rates of 60% and 67%, respectively, up to 2036.
|
The Company is taking action to sign the project agreements (construction, equipment, solar, storage and financing) and to obtain all the required approvals and permits (including for connection to the grid):
(1) on March 16, 2026, the approved plan was published by the government in the Official Lists; (2) in December 2024, the Group signed an agreement for supply of solar panels for the project with a capacity of 500 megawatts with an
international supplier with an estimated scope of about $50 million (NIS 160 million) where the Company is trying to increase the capacity of the panels under the supply agreement; (3) in January 2026, the Group signed an EPC agreement for
a substation and a switching station which were intended to conform the electricity that will be generated in the project to the grid in the estimated scope of about $98 million (about NIS 310 million); (4) in April 2026, the Group signed
an agreement with a photovoltaic construction contractor in the amount of about $158 million (about NIS 500 million); (5) the Group is negotiating with Bank Hapoalim regarding provision of financing for construction of the project in an
estimated financial scope of up to 85% of the estimated cost of the project (for additional details – see Section 7.18.4.2 of Part A of the Periodic Report for 2025) which is subject to changes based on the final terms that will be
formulated (if formulated) with the bank; (6) as at the date of the report, the Group paid Israel Lands Authority about $75 million (about NIS 275 million) constituting 20% of the total consideration in respect of the main areas), the
balance (80%), in the amount of about $0.37 billion (about NIS 1.1 billion) is expected to be paid in mid‑June 2026 (90 days from the final approval as stated above); (7) the Company is taking action to advance signing of a procurement,
construction and maintenance agreement for the storage facility, the financial scope of which is estimated at about one‑quarter of the estimated cost of the project.
|
| 18 |
Natural gas projects which in the Company’s estimation are in a period of up to two to three years until start of the construction (considering the characteristics of the project, such as, relevant regulation, required regulatory
approvals, commercial arrangements for sale of the energy from the facility, etc.), are considered projects in advanced development. Renewable energy projects which in the Company’s estimation are expected to reach construction within about
two years, considering, among other things, relevant regulation, connection to the electricity grid, statutory plan and required regulatory approvals, are considered projects in advanced development.
|
| 19 |
“Forward‑looking” information – for details see footnote 16 above.
|
|
20
|
As at the approval date of the report, the Company is conducting technical feasibility along with economic optimization regarding
the possibility of increasing the solar capacity up to 600 megawatts plus storage capacity estimated at up to 4,200 megawatt-hours. If the said increase is made, the estimated cost of the project is expected to be about $1.45 billion
(about NIS 4.6 billion). That stated in the table regarding the Ramat Beka project is “forward‑looking” information – see footnote 16 above.
|
39
---Unofficial translation for convenience purposes---
OPC Energy Ltd.
Report of the Board of Directors
| 5. |
Projects Under Construction and Development Projects (Cont.)
|
| A. |
Israel segment – projects under construction and pipeline projects (held at 100% ownership by OPC Israel)16: (Cont.)
|
| 2. |
Main details regarding projects in advanced development in Israel18 19:
|
|
Expected
construction
date
|
Total expected
construction
cost
|
Additional
developments
in the project
|
||||
|
Capacity
(MW)
|
Expected
regulation
|
|||||
|
Project
|
Location
|
|||||
|
OPC Hadera Expansion Ltd. (“Hadera Expansion”) (natural gas combined cycle)21
|
About 850
|
Hadera adjacent to the Hadera power plant
|
In the second half of 2026 (a final investment decision is expected by the end of the second quarter of 2026).
|
About $1.5 – $1.6 billion (about NIS 4.8 to NIS 5.2 billion based on completion of acquisition of the land).
|
Decision No. 69407 – Regulation for Conventional Generation Units
Applicability: Four generation units that will reach a financial close up to the end of June 2027 (as at the approval date of the report, 2 units had reported on a
financial close in accordance with this regulation, and to the best of the Company’s knowledge there are two additional power plants competing in addition to Hadera Expansion).
Main conditions: A capacity tariff was set that will apply for 25 years from the date of the financial close in the following manner: financial close up to June 2026 will
receive a capacity tariff of 3.31 agurot, up to December 2026, 3.18 agurot and up to June 2027 3.05 agurot. Sale of energy at the half‑hour “SMP” market price, with a future possibility (contingent on regulatory approval) of transition to a
model of sale of capacity to virtual suppliers (similar to that stated above with respect to the Ramat Beka project).
|
The Company is taking action to sign project agreements (construction, equipment and financing) and to obtain all the required approvals and permits (some of which had been received as at the approval date of
the report). In this regard: (1) on August 10, 2025, the Israeli government approved National Infrastructure Plan 20B (NIP 20B) (a plan for construction of the Hadera Expansion power plant for generation of electricity through use of
natural gas); (2) as at the approval date of the report, the Company signed a binding equipment supply agreement with the main equipment supplier. Also, the Company is negotiating with an EPC contractor regarding an agreement that is usual
for projects of this type22, the total consideration for which, together with the consideration in respect of the main equipment supply agreement constitutes about 60% of the estimated cost of the project. It is noted that as at
the approval date of the report, part of the consideration for the main equipment supply agreement had been paid (for details – see Section 7.15.3.1 of Part A to the Periodic Report for 2025); (3) the Company signed a long-term maintenance
agreement with the main equipment supplier; (4) the Group is carrying on negotiations with Bank Leumi L’Israel Ltd. (“Bank Leumi”) in connection with provision of financing for construction of the project as detailed below; (5) the Company
is carrying on advanced negotiations with Infinia for acquisition of the rights in the project’s lands (and the lands of the Hadera power plant) in exchange for an aggregate consideration of about $142 million (about NIS 450 million) – this
being in place of the option agreement and the lease agreements, where as at the approval date of the report there is no certainty regarding completion of the said transaction; (6) in April 2026, the Company received a commitment from the
System Operator for connection of the power plant. To the best of the Company’s knowledge, as at the approval date of the report a conditional generation license for the project was approved by the Electricity Authority and was transferred
for signing by the Minister of Energy; (7) in March 2026 a building permit was received on conditions, the ultimate completion of which is subject to additional conditions including settlement of the payment for the Betterment Levy that was
received from the City of Hadera, in the amount of about $67 million (about NIS 194 million). For additional details – see Note 8B to the Interim Statements; and (8) negotiations with a gas supplier for signing of a gas agreement for
purposes of supply of gas to the power plant in a scope that is expected to include all of the power plant’s gas needs23 in accordance with usual arrangements in gas agreements in Israel for a supply period of several years from
the date of the commercial operation. For the needs of the Hadera Expansion power plant, the monetary scope of the gas agreement is expected to amount to an estimated $1.3 billion (NIS 4.2 billion).
|
21 That stated in this table regarding the Hadera Expansion
project includes “forward‑looking” information – for details see footnote 16 above.
22 Such as timetables, various guarantees, liability limits for the contractor and other relevant
provisions for construction and operation of the project.
23 In addition, in this framework discussions were also held regarding acquisition of additional
gas quantities intended for the future needs of the Group’s other power plants in Israel.
40
---Unofficial translation for convenience purposes---
OPC Energy Ltd.
Report of the Board of Directors
For additional information regarding the Ramat Beka and the Hadera Expansion projects – see Sections 7.3.12.1 and 7.3.12.2, respectively, of Part A of the
Periodic Report for 2025.
Additional details regarding negotiations with respect to signing of a financing agreement for the Hadera Expansion project
As shown in the above table, as at the approval date of the financial statements, Hadera Expansion (in this Section – “the Borrower”), which is a
subsidiary of OPC Israel, is carrying on negotiations with Bank Leumi24 (in this Section – “the Lender”), for purposes of signing a financing agreement in connection with construction of the Hadera Expansion project, pursuant to the main
updated conditions as at the approval date of the report as detailed below (subject to signing a binding agreement and its final terms).
The anticipated amount of the credit that will be provided to the Borrower is expected to be an amount reflecting up to 85% (in the Company’s
estimation as at the date of the report about 80% to 85%) of the project’s cost as it is shown in the above table (in this Section – “the Loan Amount”). The Loan Amount is to be provided for an initial period of 6 years, where in the project’s
construction period the Borrower will have the right to repay it in exchange for payment of economic damage (if any) plus a customary penalty, and in the period after the commercial operation and up to the final repayment of the loan in exchange
for payment of economic damage (if any) without the addition of an early repayment penalty. If the Borrower chooses not to repay the Loan Amount at the end of 6 years, the Loan Amount will be provided for an additional period of up to 4 years, up
to the final repayment date of the loan at the end of 10 years. The Loan Amount will be provided in NIS, where the interest payments are to be made in quarterly installments starting from the end of the 6 years (up to that time the interest will be
accrued to the principal) and up to the final repayment date of the loan, and the loan principal is to be paid in unequal quarterly installments (as determined by the parties) starting from the end of 6 years and up to the final repayment of the
loan: in the second half of 2032 – about 1.3%; in 2033 – about 2.4%; in 2034 – about 2.25%; in 2035 – about 3.45%; in the first half of 2036 – about 2.2%; and on June 30, 2036 – repayment of the balance of the principal (about 88.4%). The interest
on the Loan Amount is based on the prime interest rate plus an interest margin of 0%–0.7%. The Borrower is also negotiating with respect to the terms of an additional credit frameworks that might be included (wholly or partly) as part of the Loan
Amount, including a VAT framework, a guarantee framework and a hedging framework. Commissions will also be paid as is customary in agreements of this type, including an “upfront” commission, management commissions and commitment fees.
In addition, as part of conditions being formulated in the negotiations, the credit will be backed by a full shareholders’ guarantee of OPC Israel with
reference to the Borrower’s liabilities under the financing agreement, and particularly in connection with provision of the project’s shareholders’ equity, where the shareholders’ equity itself will be provided pro rata to withdrawal of the senior
debt. Furthermore, as part of the terms being examined in the framework of the negotiations with respect to financing agreement, various provisions are included, such as: (A) provision of collaterals as in customary in Israel for senior debt
(including placing a lien on the project and the rights therein); (B) a commitment to comply with financial covenants – in the construction period a minimum LLCR coverage ratio as a condition for each withdrawal and a minimum coverage ratio (1.05x)
for equity injections by the shareholders (where non‑investment of capital, as stated, will constitute an event of default), and in the operation period compliance with the financial covenants applicable to OPC Israel, which as at the approval date
of the agreement are as detailed in Note 7C to the Interim Statements; (C) conditions for distribution of a dividend – prohibition against distribution of a dividend up to the end of 6 years without the consent of the Lender, and thereafter
compliance with the dividend distribution conditions applicable to OPC Israel, as detailed in Note 14B(1) to the annual financial statements and compliance with an historical coverage ratio for the succeeding calendar year, as defined in the
agreement along with additional customary provisions (including the start date of the commercial operation); and (D) grounds for demanding immediate repayment, commitments and representations, as is customary.
It is clarified that the said conditions are not mandatory and they relate to the principal conditions with respect to which the negotiations are being
carried on as at the approval date of the report. Provision of the financing is subject to completion of the negotiations between the parties and formulation of an outline for the financing and the final conditions, which could be different than
that stated above, signing of a binding agreement and usual preconditions. As at the approval date of the report, there is no certainty regarding the signing of a binding agreement, its final conditions and/or its signing date, if signed.
24 It is noted that the Borrower has the possibility of joining additional lenders in a syndication framework in accordance with the conditions provided.
41
---Unofficial translation for convenience purposes---
OPC Energy Ltd.
Report of the Board of Directors
| 5. |
Projects Under Construction and Development Projects (Cont.)
|
| 3. |
For details regarding a description of the main developments in the initial development projects in Israel25 – see Section 6A(3) to the Report of the Board of Directors for 2025.
|
Further to that stated in Section 6C(1) of the Report of the Board of Directors for 2025 and Section 7.3.10 pf
Part A of the Periodic Report for 2025 regarding the activities of facilities for generation of energy located on the consumers’ premises, particularly in connection with a process utilized by the Company to examine the possibility of selling the
said activities, as at the approval date of the report, the Company is continuing to advance the said process, and in its estimation, subject to performance of due diligence and other examinations and formulation of appropriate conditions with a
potential purchaser, the gain that may arise from the said transaction, if completed, could total up to tens of millions of NIS. As at the approval date of the report, the Company is carrying on a process as stated regarding which there is no
certainty it will ripen into negotiations for a binding agreement or with respect to the terms, timing and/or closing of a binding agreement (if formulated), including that the gain may differ materially from the above. Accordingly, as at the
approval date of the report there is no certainty regarding advancement of the sale process or its completion.
25 Natural gas projects with respect to which there is a connection (easement) to the land (or that
are in the process of formulation thereof) and/or the government’s consent has been received for advancement of approval of a National Infrastructures Plan and the Group is taking action to obtain the required permits and approvals, are considered
projects in initial development. Renewable energy projects with respect to which there is a connection (easement) to the land and the Group is endeavoring to obtain the required permits and approvals for their construction, are considered projects
in initial development.
42
---Unofficial translation for convenience purposes---
OPC Energy Ltd.
Report of the Board of Directors
| 5. |
Projects Under Construction and Development Projects (Cont.)
|
| B. |
Development and construction of natural gas (with potential for carbon capture) in the U.S.26:
|
| 1. |
Main details regarding the Basin Ranch power plant that is in the construction stage (which is held as at the date of the report at the rate of 100% by the CPV Group (1))27:
|
26 The information with respect to projects under construction and
development projects of the CPV Group, including regarding the expected commercial structure, the expected date of construction / commercial operation, the expected construction cost, characteristics (including capacity), ownership structure,
financial results, entitlement to benefits, and carbon capture potential includes “forward‑looking” information, as it is defined in the Securities Law, regarding which there is no certainty it will materialize (in whole or in part). The
information is based on, among other things, the estimates of the CPV Group as at the approval date of the report, regarding which there is no certainty they will be realized and that might not be realized due to various factors, such as:
regulatory changes, changes in government/regulatory policies applicable to the projects, as stated, or changes in legislation or regulation (and changes impacting the main suppliers of the projects, and including changes in the area of energy or
import tariffs into the U.S. due to the policies of the present administration in the U.S.), delays in receipt of permits, an increase in the construction or financing costs, delays in performance of the construction work and/or technical or
operational breakdowns, difficulties or delays in signing an agreement for connection to the grid (including an increase in the connection‑related costs) or connection of the project to the transmission or other infrastructures, an increase in
costs due to the commercial terms with the main suppliers (such as equipment and the construction contractor), difficulties in signing commercial agreements for sale of the project’s potential revenues, terms of the commercial agreements,
conditions in the energy market, unforeseen expenses, macro‑economic changes, weather events, delays and an increase in costs relating to supply chains, transport (shipping), increases in raw‑material prices, etc. Completion of the projects
pursuant to the said estimates is subject to existence of conditions which, as at the approval date of the report, have not yet occurred (in whole or in part) and, therefore, there is no certainty regarding their completion in accordance with
that stated (if at all). Delays in the construction or commercial operation could also negatively impact projects, as stated, and the ability of companies in the CPV Group to comply with their obligations to third parties in connection with the
project (including with respect to collaterals provided in favor of third parties, as stated (including financiers) and/or loss of payments made in the course of development and construction). For
additional details regarding the risk factors involved in the activities of the CPV Group – see Section 8.21 to Part A of the Periodic Report.
27 The information presented below, the projected commercial
operation date, the expected construction cost, the expected commercial format and signing of hedge agreements, the total senior financing and/or the expected results of the activities for the first full calendar year (revenues, EBITDA, and cash
flows after service of the senior debt) constitutes “forward‑looking” information, as it is defined in the Securities Law, regarding which there is no certainty it will materialize (in whole or in part), including due to factors as stated in
footnote 26 above. A delay or other difficulties (particularly significant ones) relating to completion of the project in accordance with that stated are expected to have an unfavorable impact on the CPV Group and the Company. See
footnote 26 above.
43
---Unofficial translation for convenience purposes---
OPC Energy Ltd.
Report of the Board of Directors
| 5. |
Projects Under Construction and Development Projects (Cont.)
|
| B. |
Development and construction of natural gas (with potential for carbon capture) in the U.S.26: (Cont.)
|
| 1. |
Main details regarding the Basin Ranch power plant that is in the construction stage (which is held as at the approval date of the report at the rate of 100% by the CPV Group (1))27 (Cont.)
|
|
Expectation for the first
|
||||||||||
|
full year of operation
|
||||||||||
|
Expected
start of the
commercial
operation
|
Total
expected
construction
cost
|
Total
construction
cost as at
March 31, 2026
|
||||||||
|
Expected
commercial
structure
|
Total
senior
financing
|
Cash flows
after service of
senior debt
|
||||||||
|
Capacity
(MW)
|
Regulated
market
|
|||||||||
|
Project
|
Location
|
EBITDA
|
||||||||
|
CPV Basin Ranch Holdings, LLC (“Basin Ranch”)
|
1,350
|
Ward County, Texas
|
2029
|
Sale of electricity in the ERCOT market (energy only), where the project is expected to sign commercial agreements to hedge about 75% of the power plant’s capacity for a period of 7 years
from the commercial operation date28
|
ERCOT - West
|
$1.8-$2.0 billion
|
≈ $0.5 billion
|
≈ $1.1 billion
|
≈ $0.275 billion
|
≈ $0.25 billion
|
| (1) |
In February 2026, upon completion of a transaction for acquisition of the remaining 30% of the ownership rights in the project, from the remaining partner in the project, the total amount of which is estimated at about $371 million, the
CPV Group holds 100% of the project and it is consolidated in its financial statements (and accordingly in the Company’s financial statements). The sources for completion of the transaction included debt granted directly to the CPV Group by
Bank Leumi, in the amount of about $130 million (for details – see Section 6A(6) below), frameworks for letters of credit provided, in the amount of about $63 million and a combination of cash from the activities of the CPV Group and
investment of capital by the partners (stakeholders) in the CPV Group. For additional details regarding the transaction – see Section 6B(1) of the Report of the Board of Directors for 2025.
|
| (2) |
For additional details regarding provision of sources for the project’s financial closing in October 2025 – see Section 7A(8) of the Report of the Board of Directors for 2025.
|
28 As at the approval date of the report, hedging of the exposure to market prices
is expected by means of: gas agreements of the Netback type (which includes a pricing mechanism whereby the gas price paid by the generator of the electricity derives from the electricity price) and agreements for sale of electricity at a fixed
price. In addition, as at the approval date of the report, a substantial portion of the agreements has been signed and some of them are expected to be signed up to the commercial operation date.
44
---Unofficial translation for convenience purposes---
OPC Energy Ltd.
Report of the Board of Directors
| 5. |
Projects Under Construction and Development Projects (Cont.)
|
| B. |
Development and construction of natural gas (with potential for carbon capture) in the U.S.26: (Cont.)
|
| 2. |
Set forth below is a summary of the natural gas project pipeline with carbon capture potential in the U.S.29, as at the approval date of the report:
|
|
Regulated
|
Capacity
|
Rate of
|
Share of the
|
|||
|
Project
|
Location
|
market
|
Status30
|
(megawatts)
|
holdings31
|
CPV Group
|
|
Shay (1)
|
West Virginia
|
PJM
|
Initial
|
2,100
|
70%
|
1,470
|
|
Walker (2) (4)
|
Ohio
|
PJM
|
Initial
|
1,450
|
70%
|
1,015
|
|
Four additional
projects (3) (4)
|
Ohio, Pennsylvania
and West Virginia
|
PJM
|
Initial
|
5,130
|
70%–100%
|
4,915
|
|
Total
|
8,680
|
7,400
|
||||
| (1) |
Pursuant to the Group’s strategy, expansion of the project pipeline is continuing along with advancement of natural‑gas projects with carbon capture potential, with the goal of meeting the anticipated increase in electricity demand and
maintaining grid reliability, with a significant focus, at this stage, on the Shay project. As of the approval date of the report, CPV Group is continuing accelerated advancement of the project’s development, including the processes for
licensing and PJM grid interconnection studies, and has secured significant equipment. In this regard, the CPV Group has signed an agreement with a main supplier of electrical equipment and has signed a turbine (slot) reservation agreement
(assuring the supply date of the equipment) with a global gas equipment supplier (which is also a partner in the project). These undertakings (agreements) include payment of non‑refundable advance payments totaling tens of millions of
dollars. In the estimation of the CPV Group, the initial estimate of the cost of the power plant (100%) is about $4 billion32.
|
29 It is noted that potential carbon capture is a separate component that is subject to various
development stages than the development stages for a natural gas power plant and it is not included under the characteristics of the projects below. It is further noted that as at the signing date of the report there is no certainty regarding
development of the carbon capture component or the timing thereof. The information stated above regarding the projects in the development stage of the CPV Group, the scope thereof, cost estimates and additional
characteristics, constitute “forward‑looking” information as it is defined in the Securities Law, and regarding which there is no certainty it will be realized, including due to the stages of development that have not yet been completed, and/or a
lack of certainty regarding the feasibility of assimilating the carbon capture technology in the development projects of the CPV Group and/or relevant costs. In addition, advancement of the projects, as stated, is subject to uncertainty and
conditions, as noted in footnote 26 above.
30 In general, regarding natural gas with future carbon capture potential, the CPV Group views
projects that have an expectation of connection to the grid within three years and a commercial format has been formulated for the project, as projects in the advanced development stage, and projects for which a tie to (a right in) the land exists
and there is an expectation of an agreement for connection to the grid of more than three years or a connection expectation has not yet been formulated, as projects in the initial stage.
That stated regarding the stage of development is impacted by, among other things, the scope of the project, its
location, the anticipated activity market, the relevant ISO, regulation and policies of the federal and local governments, and could change based on a given project’s specific characteristics, as well as due to the project’s relevant external
circumstances.
31 The projects in development are held at rate of 100% or 70% by the CPV Group, where a project
that is not wholly owned is developed under a joint development agreement with a leading equipment manufacturer and who is a partner in some of the projects. The CPV Group could also sign joint development agreements, as stated, with reference to
additional projects.
32 Not including financing expenses in the construction period.
45
---Unofficial translation for convenience purposes---
OPC Energy Ltd.
Report of the Board of Directors
| 5. |
Projects Under Construction and Development Projects (Cont.)
|
| B. |
Development and construction of natural gas (with potential for carbon capture) in the U.S.26: (Cont.)
|
| 2. |
Set forth below is a summary of the pipeline (awaiting) natural gas projects with carbon capture potential in the U.S.29, as at the approval date of the report: (Cont.)
|
| (1) |
(Cont.)
|
The Shay project is included in the pipeline (backlog) of Transition Cycle 2 projects of the PJM market (a
structured process for examination of projects for purposes of connection thereof to the grid)33. To the best of the knowledge of the CPV Group, the Shay project is the largest project included in the Transition Cycle 2 (which includes
about 278 projects in the process of examination for connection to the grid with a total combined capacity of about 23 gigawatts, of which natural gas-fired generation projects account for about 8 GW) and the timetables for the signing of its
agreement for connection to the grid, if signed, is early 2027. It is noted that in June 2026, the results of the next stage of the Transition Cycle 2 are expected to be received, as a result of which, and to the extent the project is advanced in
the process, the CPV Group will be required to deposit additional collaterals, the amount of which is impacted by, among other things, an estimate of the required costs of upgrading the grid.
In addition, possible commercial and regulatory formats are being considered, including “Gas Net Back”
arrangements, financing plans in general including subsidized ones, particularly with the Department of Energy (DOE) and regulatory initiations for encouraging the increase of available capacity in the PJM market, to the extent they will be
applied, mainly the RBP, as detailed in Section 3C above. The CPV Group is examining and is taking action to position Shay as a project that may meet the eligibility conditions to participate in the RBP, to the extent this mechanism is ultimately
implemented and given the possibility that there could be changes thereto before it is finally formulated. At this stage, the said alternatives are in the examination stage, some of which merely preliminary examination, and there is no certainty
regarding the manner of their implementation or their feasibility. The Group intends to advance commencement of construction of the project, subject to completion of all the development processes, particularly finalizing the commercial format, in
2027–202834.
| (2) |
Further to that stated in Section 8.14.6 to Part A of the Periodic Report for 2025, in April 2026, the CPV Group entered into a joint development agreement with a manufacturer and supplier of main equipment for power plants (and the
partner in the Shay project) for the Walker project, under which CPV Group will hold 70% of the rights in the project and the partner will hold the other 30% of the rights in the project and will bear the development costs, in the format
that was provided in the agreement.
|
| (3) |
Includes: (A) 3 projects using combined cycle gas turbine (CCGT) technology with carbon capture potential that are wholly‑owned by the CPV Group with a combined capacity of about 4.4 gigawatts; and (B) the Shay expansion project using
open‑cycle (Peaker) technology, with no possibility for future connection to a carbon capture facility, with a capacity of about 725 megawatts, which is included in the joint development agreement covering the Shay project, which is held at
the rate of 70% by the CPV Group.
|
| (4) |
In April 2026, the application window for interconnection requests to the PJM grid under the New Cycle 1 — closed, with a total of approximately 220 GW of proposed generation capacity. Based on PJM’s interconnection process timeline,
the initial Phase I results are expected in late 2026.
|
| 33 |
For additional details – see Section 8.10A of Part A of the Periodic Report for 2025.
|
|
34
|
That stated regarding the Shay project, constitutes “forward‑looking” information, regarding which there is no
certainty it will materialize. For details – see footnote 26 above. As at the approval date of the report, there is no certainty regarding fulfillment of the conditions for advancement of the project.
|
46
---Unofficial translation for convenience purposes---
OPC Energy Ltd.
Report of the Board of Directors
| 5. |
Projects Under Construction and Development Projects (Cont.)
|
| C. |
Renewable energies segment in the U.S. – projects under construction and development projects (100% held by CPV Renewable which is held at the rate of 66.7% by the CPV Group35:
|
| 1. |
Main details regarding a project under construction using wind technology (the data presented in the table below are in respect of 100% of each project)36:
|
|
Regulated
market
after
the PPA
period
|
Total
construction
cost as at
March 31,
2026
|
Expectation for a first full calendar year
in the period of the PPA
|
|||||||||
|
Expected
commercial
operation
date
|
Total expected
construction
cost net for 100%
of the project
|
||||||||||
|
Cash flows
after tax
partner
|
|||||||||||
|
Capacity
(MW)
|
Commercial
structure
|
Tax
equity
|
|||||||||
|
Project
|
Location
|
Revenues
|
EBITDA37
|
||||||||
|
CPV Rogues Wind, LLC (“Rogues”)
|
114
|
Pennsylvania
|
2026
|
Long-term PPA38 (including green certificates)
|
PJM MAAC
|
≈ $365 million
|
≈ $163 million39
|
≈ $322 million
|
≈ $24 million
|
≈ $18 million
|
≈ $15 million
|
35 The information presented below in this report regarding projects under construction and development,
including with respect to the expected commercial structure, the projected commercial operation date, the expected construction cost, an undertaking with a tax partner (if relevant) and/or the expected results of the activities for the first full
calendar year (revenues, EBITDA, investments of the tax partner and cash flows after the tax partner, as applicable) includes “forward‑looking” information, as it is defined in the Securities Law, regarding which there is no certainty it will
materialize (in whole or in part), including due to factors that are not under the control of the CPV Group. The information is based on, among other things, estimates of the CPV Group as at the approval date of the report, the realization of
which is not certain, and which might not be realized due to factors, such as: regulatory changes or legislative changes (including changes impacting main suppliers of the projects and/or import of equipment and including regulatory/legislative
changes in the area of energy or import tariffs due to changes in the government’s policies), delays in receipt of permits, an increase in the construction costs, delays in execution of the construction work and/or technical or operational
malfunctions, problems or delays regarding signing an agreement for connection to the network or connection of the project to transmission or other infrastructures, an increase in costs due to the commercial conditions in the agreements with main
suppliers (such as equipment suppliers and contractors), problems signing commercial agreements sale for of the potential revenues from the project, terms of the commercial agreements, conditions of the energy market, an increase in the financing
expenses, unforeseen expenses, macro‑economic changes, weather events, delays and an increase in costs related to the supply chain, transport and an increase in raw‑material prices, etc. Completion of the projects in accordance with the said
estimates is subject to the fulfillment of conditions which as at the approval date of the report had not yet been fulfilled (fully or partly) and, therefore, there is no certainty they will be completed in accordance with that stated, if at all.
Construction delays could even impact the ability to comply with liabilities of the project and the CPV Group to third parties in connection with the projects (including based on guarantees provided in favor of those third parties) or to detract
from the entitlement to tax benefits or to trigger forfeiture of guarantees and advance payments.
36 For details regarding the expansion of the Backbone project, which is in the construction stage – see Section 5E of the Report of the
Board of Directors for 2025.
37 It is clarified that the expected revenues and the EBITDA presented in the above table do not include the tax benefits, even though the
project is expected to comply with conditions for their receipt.
38 In April 2021, the project signed an agreement for sale of all the electricity (as amended from time to time) and the environmental
consideration (including Renewable Energy Certificates (RECs), benefits relating to availability and accompanying services), the terms of which were improved in 2024. The agreement was signed for a period of 10 years starting from the commercial
operation date. The CPV Group has provided collateral for assurance of its obligations under the agreement, which includes execution of certain payments to the other party if certain milestones (including the commencement date of the activities) in
the project are not completed in accordance with the timetable determined.
39 The project is located on a former coal mine and, therefore, it is expected to be entitled to enlarged tax benefits of 40% in accordance
with the IRA Law. In August 2025, the CPV Group signed an agreement with a tax partner (Equity Tax) in an ITC format in respect of about 40% of the cost of the project and use of the tax credits that are available to the project (subject to
appropriate regulatory arrangements) on terms that are customary for agreements of this type (including provision of a guarantee by the CPV Group for certain liabilities). Subsequent to the date of the report, upon the project reaching the stage of
mechanical completion, part of the total amount of the investment (about 20%) was received. The remaining amount (about 80%) is expected to be received upon the commercial operation of the project (as defined in the agreement).
47
---Unofficial translation for convenience purposes---
OPC Energy Ltd.
Report of the Board of Directors
| 5. |
Projects Under Construction and Development Projects (Cont.)
|
| C. |
Renewable energies segment in the U.S. – projects under construction and development projects (100% held by CPV Renewable which is held at the rate of 66.7% by the CPV Group35: (Cont.)
|
| 2. |
Set forth below is a summary of the pipeline projects (in megawatts) in the US as at the approval date of the report40.
|
|
Renewable energy
|
Advanced
|
Initial
|
||
|
development41
|
Safe harbor (1)
|
development
|
Total
|
|
|
PJM market
|
||||
|
Solar
|
70
|
760
|
1,030
|
1,860
|
|
Wind
|
–
|
–
|
130
|
130
|
|
Total PJM market (3)
|
70
|
760
|
1,160
|
1,990
|
|
Other markets
|
||||
|
Solar
|
–
|
250
|
1,030
|
1,280
|
|
Wind
|
–
|
900
|
950
|
1,850
|
|
Total other markets
|
–
|
1,150
|
1,980
|
3,130
|
|
Total renewable energy (1)
|
70
|
1,910
|
3,140
|
5,120
|
|
Share of the CPV Group (66.67%)
|
50
|
1,270
|
2,090
|
3,410
|
40 The information presented in the report regarding the backlog
(pipeline) of development projects of the CPV Group, including with respect to the scope of the backlog, status of the projects and/or their characteristics (capacity, technology, expected construction date, etc.), and assessments regarding
entitlement to benefits and/or potential compliance with the Safe Harbor rules, constitutes “forward‑looking” information as it is defined in the Securities Law. For details – see footnote 35 above.
41 In general, in the area of renewable energies, the CPV Group views projects that in its
estimation are in a period of up to two to three years to the start of the construction as projects in the advanced development stage (there is no certainty the development projects, including projects in the advanced stage, will be executed) –
this being based on the expectation of a connection agreement to the grid within two to three years depending on the status of the connection request and assessment of the viability (commercial/project etc.) of reaching construction within two
years. Also, the CPV Group views projects wherein there is a tie to (a right in) the land together with an expectation of connection to the grid of more than two years or where a connection agreement has not yet been formulated and the CPV Group is
taking action to advance the approvals required for construction of the project, as projects in the initial development stage.
That stated regarding the development stage is impacted by, among other things, potential compliance with the
safe harbor rules under the legislation in the U.S. (including additional regulatory changes and stricter regulations applying to renewable energy), the scope of the project and the technology, and could change based on specific characteristics of
a certain project, as well as from the external circumstances that are relevant to the project, such as the anticipated activities’ market or additional regulatory circumstances. In general, projects that are designated to operate in the PJM market
could be impacted by the connection processes as described in Section 8.1.2.1(A) of Part A to the Periodic Report for 2025, and their progress could be delayed as a result of these proposed processes. It is clarified that in the early development
stages (in particular), the scope of the projects and their characteristics are subject to changes, if and to the extent they reach advanced stages.
48
---Unofficial translation for convenience purposes---
OPC Energy Ltd.
Report of the Board of Directors
| 5. |
Projects Under Construction and Development Projects (Cont.)
|
| C. |
Renewable energies segment in the U.S. – projects under construction and development projects (100% held by CPV Renewable which is held at the rate of 66.7% by the CPV Group35: (Cont.)
|
| 2. |
Set forth below is a summary of the scope of the pipeline projects (in megawatts) in the United States as at the approval date of the report40. (Cont.)
|
| (1) |
Safe Harbor – threshold conditions that must be complied with in order to receive ITC and PTC tax benefits as detailed in Section 8.1.3.1 of Part A of the Periodic Report for 2025. As at the approval date of the report, the CPV Group has
invested and is expected to make additional investments in an aggregate scope estimated at tens of millions of dollars in respect of assurance of compliance of the said projects with the threshold conditions, particularly procurement of
equipment42.
|
| (2) |
In addition, the CPV Group is advancing battery energy storage system (BESS) projects at an early stage of development, adjacent to its renewable energy project pipeline, with an aggregate storage capacity of approximately 7,500
megawatt-hours, of which the CPV Group’s share is approximately 5,000 megawatt-hours, and on the premises of Shore in the Energy Transition segment, with a storage capacity of approximately 340 megawatt-hours.
|
| (3) |
For additional details regarding the process with respect to requests for connection to the grid in the PJM market (Interconnection Queue) – see Section 6C(2)(ii) to the Report of the Board of Directors for 202543.
|
42 For additional details regarding the policies of the U.S. government with respect to renewable
energies and legislation of the “One Big Beautiful Bill” law in the U.S., which gradually cancels the tax benefits and provides directives and dates and in connection with the Safe Harbor rules, and the impacts thereof on the activities of the CPV
Group, particularly in the area of renewable energies – see Section 3D of the Report of the Board of Directors for 2025 and Section 8.1.3.1 of Part A of the Periodic Report for 2025.
43 That stated above in connection with the impacts of the
processes with respect to the connection agreements of PJM on the projects of the CPV Group, includes “forward‑looking” information as it is defined in the Securities Law. For details – see footnote 35 above.
49
---Unofficial translation for convenience purposes---
OPC Energy Ltd.
Report of the Board of Directors
| 6. |
Adjusted financial
debt, net
|
| A. |
Compositions of the adjusted financial debt, net44
|
The Company defines “net financial debt” as loans from banks and financial institutions,
debentures and interest payable less cash and cash equivalents, including deposits and restricted cash that are intended for debt service and less/plus the fair value of derivative financial instruments used for hedging the principal and/or
interest. The “adjusted net financial debt” includes the “net financial debt” of the Company and its consolidated subsidiaries and the “net financial debt” of its associated companies in the U.S. on the basis of the rate of the holdings of the
CPV Group in these companies.
The Company defines “leverage ratio” as “adjusted financial debt, net” divided by “EBITDA
after proportionate consolidation” for the 12 months that preceded the measurement date. For purposes of calculation of the leverage ratio, debt in respect of projects under construction (that do not yet generate EBITDA) is not included in the
calculation. Regarding projects the construction of which has been completed and/or active projects that were acquired during the Period of the Report, a representative annual EBITDA is taken into account.
Set forth below is detail of the Group’s leverage ratio:
|
As at March 31, 2026(1)
|
As at December 31, 2025(2)
|
|
2.8
|
3.1
|
| (1) |
After elimination of debt under construction in respect of the Basin Ranch power plant in the U.S. of about $151 million, and for the Rogues Wind project, in the amount of about $117 million, as detailed in the following table. With
reference to the Backbone project, the construction of which was completed in the fourth quarter of 2025 and acquisition of additional holdings in the Shore power plant in the 12 months preceding the date of the report, the representative
EBITDA was calculated as follows: Shore based on the rate of holdings as at the date of the report with respect to the actual results in the said period; and Backbone based on the representative EBITDA for the first full year of operation.
|
| (2) |
For details – see Section 7A of the Report of the Board of Directors for 2025. It is noted that as at December 31, 2025 the said data item was calculated in shekels (the Company’s presentation currency up to that time) and accordingly
the leverage ratio was 2.9.
|
| 44 |
It is clarified that these are indices that are not defined in accordance with IFRS and are not audited, however Company management believes that they are capable of assisting investors in understating the Company’s financial position
and its results. It is noted that different companies are likely to define these indices differently.
|
50
---Unofficial translation for convenience purposes---
OPC Energy Ltd.
Report of the Board of Directors
| 6. |
Adjusted financial
debt, net (Cont.)
|
| A. |
Compositions of the adjusted financial debt, net (Cont.)
|
The following table details the financial debt, net, as at March 31, 2026 (in millions of
dollars)45:
|
Name of project
|
Gross debt
|
Cash and cash
equivalents
and deposits
(including
restricted cash
used for debt
service) (1)
|
Derivative
financial
instruments
for hedging
principal
and/or
interest
|
||||
|
Method of
presentation
in the
Company’s
financial
statements
|
Debt
(including
interest
payable and
deferred
expenses)
|
||||||
|
Weighted-
average
interest
rate
|
Final
repayment
date of
the loan
|
||||||
|
Net
debt
|
|||||||
|
Hadera
|
Consolidated
|
170
|
4.9%
|
2037
|
30
|
13
|
127
|
|
Headquarters and others in Israel
|
Consolidated
|
721
|
6.0%–6.2%
|
2033
|
37
|
–
|
684
|
|
Total Israel
|
891
|
5.9%
|
67
|
13
|
811
|
||
|
Active renewable energy projects
|
Associated (66.7%)
|
153
|
5.4%
|
2026–2030
|
6
|
2
|
145
|
|
Financing of construction of Rogues Wind
|
Associated (66.7%)
|
118
|
5.1%
|
2029
|
–
|
1
|
117
|
|
Renewable energies headquarters
|
Associated (66.7%)
|
–
|
–
|
56
|
–
|
(56)
|
|
|
Total renewable energy (2)
|
271
|
5.3%
|
62
|
3
|
206
|
||
|
Fairview (Cash Sweep 50%)
|
Associated (25%)
|
164
|
6.1%
|
2030–2031
|
1
|
–
|
163
|
|
Towantic (Cash Sweep 7%)
|
Associated (26%)
|
56
|
7.9%
|
2029
|
2
|
(1)
|
55
|
|
Maryland (Cash Sweep 50%)
|
Associated (75%)
|
194
|
5.7%
|
2028
|
28
|
1
|
165
|
|
Shore (3) (Cash Sweep 100%)
|
Consolidated
|
289
|
7.6%
|
2030–2032
|
2
|
(1)
|
288
|
|
Valley (4) (Cash Sweep 89%)
|
Associated (50%)
|
157
|
6.3%
|
2033
|
13
|
–
|
144
|
|
Three Rivers (8) (Cash Sweep 0%)
|
Associated (10%)
|
62
|
5.2%
|
2028
|
4
|
2
|
56
|
|
Total energy transition (5)
|
922
|
6.6%
|
50
|
1
|
871
|
||
|
Basin Ranch loan (6) TEF
|
Consolidated
|
256
|
3.0%
|
2045
|
105
|
–
|
151
|
|
Headquarters and others – U.S. (7)
|
Consolidated
|
225
|
6.8%
|
2032
|
281
|
–
|
(56)
|
|
Total U.S.
|
1,674
|
498
|
4
|
1,172
|
|||
|
Total energy headquarters (8)
|
553
|
2.5%–6.2% (weighted-average 4.0%)
|
2028–2034
|
883
|
–
|
(330)
|
|
|
Total
|
3,118
|
1,448
|
17
|
1,653
|
|||
45 In addition, the Group has a liability to holders of non‑controlling interests, the balance of
which as at March 31, 2026 is about $155 million.
51
---Unofficial translation for convenience purposes---
OPC Energy Ltd.
Report of the Board of Directors
| 6. |
Adjusted
financial debt, net (Cont.)
|
| A. |
Compositions of the adjusted financial debt, net (Cont.)
|
| (1) |
Includes restricted cash, in the amount of about $13 million (about NIS 40 million) in Hadera, about $19 million in the Energy Transition segment and about $153 million in the headquarters in the U.S. designated for the construction of
the Basin Ranch power plant.
|
| (2) |
As at the approval date of the report, CPV Renewables is carrying on negotiations with a bank for refinancing in the area of renewable energies in the U.S., whereby the parties intend to sign a financing agreement (in this Section – “the
Financing Agreement”) that is expected to include main components, as follows:
|
| A. |
A long‑term loan, in the amount of about $250 million, the purpose of which is repayment of the project loans: (1) a financing agreement for the Mountain Wind projects (active projects); (2) a financing agreement for the Stagecoach,
Maple Hill and Backbone projects (active projects); (3) an agreement for financing construction of the Rogues Wind project (as at the approval date of the report – a project under construction, expected to be active on the date of the
financial closing with a bank); where the difference, net of transaction costs (which are expected to total an immaterial amount), will be distributed as a dividend to CPV Renewables. The loan will bear interest that is to be paid quarterly
starting from December 31, 2026, bearing interest at the SOFR rate plus a margin of 1.8%–2.4%. The loan principal is to be repaid quarterly starting from March 31, 2027 based on the following repayment schedule:2027–2029: 2.5% per year;
2030: 7.5% per year; 2031: 10% per year; and December 31, 2031: repayment of the balance of the loan principal (75%).
|
| B. |
Credit frameworks for provision of guarantees and letters of credit, in the aggregate amount of about $180 million, of which about $60 million for provision of collaterals for active projects (mainly in place of existing frameworks
provided as part of the project financing) and an additional amount of about $120 million for provision of collaterals for development projects (mainly in place of existing frameworks provided by the Company and/or by the CPV Group in the
form of a company guarantee, as detailed in Note 7B to the Interim Statements). In addition, a credit framework for additional uses as will be agreed to by the parties, in the amount of about $100 million, backed by a company guarantee. The
validity of the credit frameworks will be concurrent mainly with a long‑term loan and will bear a commission at the rate of 1.2%–1.8%, depending on the type of the LC or guarantee.
|
| C. |
As part of the financing agreement, CPV Renewables will undertake to compliance, on a quarterly basis, with financial covenants: (A) minimum shareholders’ equity of about $350 million; and (B) a ratio of net financial debt to EBITDA that
does not exceed 8.0X (as the said terms are defined in the financing agreement).
|
| D. |
In addition, the financing agreement is expected to include limitations on distribution of dividends, as is customary in agreements of this type, including minimum shareholders’ equity of $500 million and a ratio of net financial debt to
EBITDA that does not exceed 7.0X (as the said terms are defined as part of the financial covenants that will be included in the financing agreement).
|
| E. |
As part of the financing agreement, CPV Renewables will undertake to various conditions, limitations, commitments and grounds for repayment, as is customary in agreements of this type, including: restrictions on liens (except for
permissible liens), provision of collaterals as will be determined in the detailed agreement, limitations on taking out debt (except for permissible debt), restrictions on selling of assets (particularly active assets), limitations on
change of control over the borrower (including with respect to a company in the CPV Group), restrictions on a change in the area of activities, obligations to hold minimum operating cash balances and the like.
|
| F. |
The financing agreement is expected to include commissions as is customary in agreements of this type, where early repayment commissions of the long‑term loan (except in respect of economic harm, if any), will be determined at gradually
decreasing levels over the period of the loan, such that after a number of years, as determined, an early repayment commission will no longer apply.
|
52
---Unofficial translation for convenience purposes---
OPC Energy Ltd.
Report of the Board of Directors
| 6. |
Adjusted
financial debt, net (Cont.)
|
| A. |
Compositions of the adjusted financial debt, net (Cont.)
|
| (2) |
(Cont.)
|
It is clarified that as at the signing date of the report, the financing agreement had not yet been signed, and
the signing thereof is subject to negotiations, formulation of detailed agreed‑to terms and approval by the relevant competent authorities of the parties. Accordingly, as at the signing date of the report there is no certainty regarding actually
signing a final financing agreement and/or with respect to the terms of the financing agreement, which could be significantly different than that stated.
| (3) |
In May 2026, Shore’s financing agreement was amended such that the interest margin on the long‑term loan (and the revolving credit framework) was reduced from 3.75% to 3.25%.
|
| (4) |
In the Period of the Report, Valley completed an undertaking in a new financing agreement, wherein the interest margin on the loan was significantly reduced to 2.75% and the Cash Sweep rate was updated from 100% to a gradual mechanism
based on a leverage ratio, such that if the leverage ratio declines, the Cash Sweep rate will be gradually reduced from a rate of 75% to 50% and down to a rate of 25%. Upon completion of the new financing agreement in the aggregate amount
of about $425 million (of which about $325 million is in respect of a long‑term Term Loan), about $100 million was used for repayment of shareholders’ loans and distribution of dividends, where the share of the CPV Group is about $50
million.
|
| (5) |
The rate (%) of the Cash Sweep mechanism is in accordance with the estimate of the CPV Group and it could change from time to time based on the provisions of the financing agreements of the projects.
|
| (6) |
The amount of the debt presented in the table above represents the liability value of the TEF loan. For additional details regarding the book value of the TEF loan, including accounting adjustments made – see Note 9A to the Interim
Statements.
|
| (7) |
In October 2025, the CPV Group signed an agreement with Bank Leumi for financing part of the shareholders’ equity provided for construction of the Basin Ranch power plant, in the amount of about $300 million, which was increased in
February 2026 (upon completion of acquisition of the partner in the project), to the aggregate amount of about $430 million. For additional details – see Note 7A(1) to the Interim Statements.
|
| (8) |
In April 2026, Three Rivers completed an undertaking in a new financing agreement, as part of which a dividend was distributed to the project’s partners (in an amount that is not material to the CPV Group). Pursuant to the terms of the
asset‑exchange agreement under which the CPV Group acquired the balance of the holdings in the Maryland power plant in exchange for, among other things, sale of all its holdings in the Three Rivers power plant, as detailed in Note 6C to the
Interim Statements, the said proceeds of the dividend were taken into account as part of adjustment of the transaction price. In May 2026, upon completion of the exchange transaction, Three Rivers ceased to be an associated company of the
Company.
|
| (9) |
Includes balances of debt and cash in the Company and cash in ICG Energy Inc.
|
| (10) |
In May 2026, the Company’s Board of Directors approved a partial early repayment (debt prepayment), of the debentures (Series B), in the total amount of about $70 million (about NIS 200 million), to be executed in June 2026.
|
| (11) |
As at the approval date of the report, the Company is examining the possibility of taking out additional long‑term debt, particularly refinancing of existing long‑term debt and extending the weighted average maturity in OPC Israel,
in the amount of about $70 million (about NIS 200 million), on terms substantially similar to those detailed in Note 14B(1) of the annual financial statements. As at the approval date of the report, there is no certainty regarding the
said refinancing, the timing thereof or its final terms.
|
53
---Unofficial translation for convenience purposes---
OPC Energy Ltd.
Report of the Board of Directors
| 6. |
Adjusted
financial debt, net (Cont.)
|
| A. |
Compositions of the adjusted financial debt, net (Cont.)
|
The following table details the adjusted financial debt, net, as at December 31, 2025
(in millions of dollars):
|
Project
|
Method of
|
Debt
|
Cash and cash
|
Derivative
|
|
|
presentation
|
(including
|
equivalents
|
financial
|
||
|
in the
|
interest
|
and deposits
|
instruments
|
||
|
Company’s
|
payable
|
(including
|
for hedging
|
||
|
financial
|
and deferred
|
restricted cash used
|
principal
|
Net
|
|
|
statements
|
expenses)
|
for debt service)
|
and/or interest
|
debt
|
|
|
Hadera
|
Consolidated
|
172
|
22
|
13
|
137
|
|
Headquarters and others – Israel
|
Consolidated
|
721
|
68
|
–
|
653
|
|
Total Israel
|
893
|
90
|
13
|
790
|
|
|
Active renewable energy projects
|
Associated (66.7%)
|
157
|
3
|
1
|
153
|
|
Financing construction of Rogues Wind
|
Associated (66.7%)
|
78
|
–
|
1
|
77
|
|
Renewable energies headquarters
|
Associated (66.7%)
|
–
|
26
|
–
|
(26)
|
|
Total renewable energy
|
235
|
29
|
2
|
204
|
|
|
Fairview
|
Associated (25%)
|
169
|
4
|
–
|
165
|
|
Towantic
|
Associated (26%)
|
56
|
9
|
(1)
|
48
|
|
Maryland
|
Associated (75%)
|
196
|
20
|
1
|
175
|
|
Shore
|
Associated (89%)
|
257
|
2
|
(2)
|
257
|
|
Valley
|
Associated (50%)
|
144
|
32
|
–
|
112
|
|
Three Rivers
|
Associated (10%)
|
63
|
4
|
3
|
56
|
|
Total energy transition
|
885
|
71
|
1
|
813
|
|
|
Basin Ranch TEF loan
|
Associated (70%)
|
132
|
60
|
–
|
72
|
|
Headquarters and others – U.S.
|
Consolidated
|
153
|
278
|
–
|
(125)
|
|
Total U.S.
|
1,405
|
438
|
3
|
964
|
|
|
Total Energy headquarters
|
592
|
709
|
–
|
(117)
|
|
|
Total
|
2,890
|
1,237
|
16
|
1,637
|
|
| B. |
Interest and linkage bases
|
For additional information regarding interest and linkage bases – see Section 11 of the
Report of the Board of Directors for 2025.
| C. |
Financial covenants
|
The Company and its investee companies are subject to financial covenants provided in their
financing agreements and trust certificates. As at the date of the report, the Company and its investee companies were in compliance with all the financial covenants provided. For details regarding the covenants the breach of which would constitute
an event of default, relating to significant loans and debentures – see Note 7C to the Interim Statements46.
In May 2026, Midroog affirmed the rating of the Company and the rating of its debentures
(Series B, C and D) at the level of A1.il and updated the rating outlook from stable to positive. The change in the rating outlook reflects the strengthening of the Company’s financial profile, against the background of a significant strengthening
of the equity base along with a continuing improvement in the results of the natural gas sector in the United States.
46 For a description of the main provisions of material loans of the Company and the investee
companies – see Note 14 to the Annual Statements.
54
---Unofficial translation for convenience purposes---
OPC Energy Ltd.
Report of the Board of Directors
| 6. |
Adjusted
financial debt, net (Cont.)
|
Movement in the adjusted financial debt, net, for the period ended March 31, 2026 (in
millions of dollars):
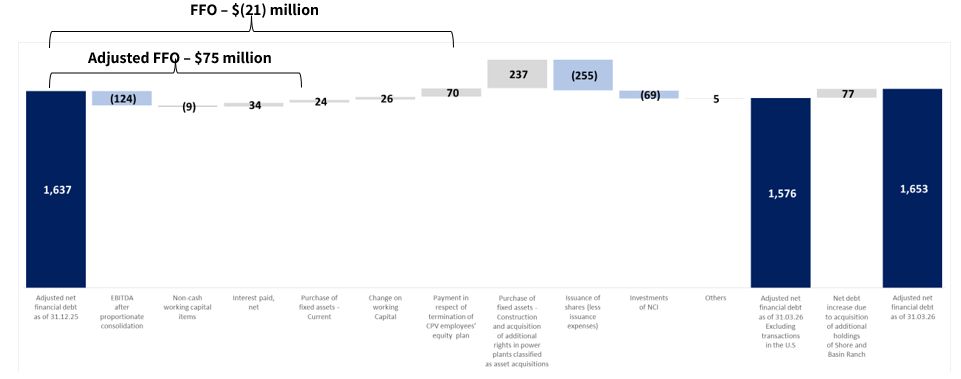
55
---Unofficial translation for convenience purposes---
OPC Energy Ltd.
Report of the Board of Directors
| 7. |
Financial Position as at March 31, 2026 (in millions
of dollars)
|
|
Category
|
3/31/2026
|
12/31/2025
|
Board’s Explanations
|
|
Current Assets
|
|||
|
Cash and cash equivalents
|
1,158
|
913
|
For details – see Section 8 below.
|
|
Trade receivables
|
122
|
137
|
|
|
Receivables and debit balances
|
40
|
64
|
Most of the decrease stems from repayment of a loan to the associated company Valley as part of refinancing of the project debt.
|
|
Total current assets
|
1,320
|
1,114
|
|
|
Non-Current Assets
|
|||
|
Long-term deposits and restricted cash
|
165
|
164
|
|
|
Long-term receivables and debit balances
|
31
|
118
|
Most of the decrease stems from completion of a transaction for acquisition of the balance of the rights in the Basin Ranch project and the initial consolidation thereof, in the framework
of which an advance deposit, in the amount of about $58 million, was classified as part of the assets and liabilities consolidated, and an intercompany balance relating to development fees receivable from the project was cancelled, in the
amount of about $38 million.
|
|
Investments in associated companies
|
1,348
|
1,626
|
Most of the decrease, in the amount of about $348 million, derives from the initial consolidation of the Shore and Basin Ranch power plants (for additional details – see Notes 6A and 6B to
the Interim Statements) and dividends distributed to the CPV Group by associated companies, in the amount of about $32 million. This decrease was partly offset by an investment, prior to the consolidation, in the Basin Ranch power plant, in
the amount of about $65 million and income of associated companies, in the amount of about $34 million. For additional details regarding the results of associated companies – see Section 4D and Section 4E above.
|
|
Long-term derivative financial instruments
|
13
|
13
|
|
|
Property, plant and equipment
|
2,398
|
1,380
|
Most of the increase, in the amount of about $951 million, stems from the initial consolidation of the Shore and Basin Ranch power plants. For additional details – see Notes 6A and 6B to
the Interim Statements.
|
|
Right-of use assets and long-term deferred expenses
|
332
|
200
|
Most of the increase, in the amount of about $133 million, stems from the initial consolidation of the Shore power plant.
|
|
Intangible assets
|
84
|
83
|
|
|
Total non-current assets
|
4,371
|
3,584
|
|
|
Total assets
|
5,691
|
4,698
|
|
56
---Unofficial translation for convenience purposes---
OPC Energy Ltd.
Report of the Board of Directors
| 7. |
Financial Position as at March 31, 2026 (in millions
of dollars) (Cont.)
|
|
Category
|
3/31/2026
|
12/31/2025
|
Board’s Explanations
|
|
Current Liabilities
|
|||
|
Loans and credit from banks and financial institutions (including current maturities)
|
67
|
41
|
Most of the increase, in the amount of about $25 million, stems from the initial consolidation of the Shore power plant.
|
|
Current maturities of debentures
|
77
|
76
|
|
|
Trade payables
|
103
|
127
|
|
|
Payables and other credit balances
|
90
|
115
|
Most of the decrease, in the amount of about $70 million, stems from a payment in connection with the conclusion of the 2021 profit‑sharing plan of the CPV Group.
|
|
Total current liabilities
|
337
|
359
|
|
|
Non-Current Liabilities
|
|||
|
Long-term loans from banks and financial institutions
|
1,506
|
1,004
|
Most of the increase, in the amount of about $410 million, derives from the initial consolidation of the Shore and Basin Ranch power plants, an increase, in the amount
of about $68 million, stems from a withdrawal in the framework of a financing agreement with Bank Leumi by the CPV Group, and an increase, in the amount of about $42 million, from a withdrawal as part of the TEF loan in the Basin Ranch
project.
|
|
Long-term debt from holders of non-controlling interests
|
155
|
138
|
|
|
Debentures
|
475
|
510
|
Most of the decrease, in the amount of about $38 million, derives from repayment of debentures.
|
|
Long-term lease liabilities
|
162
|
7
|
Most of the increase, in the amount of about $161 million, derives from the initial consolidation of the Shore power plant.
|
|
Other long-term liabilities
|
67
|
6
|
Most of the increase, in the amount of about $54 million, derives from the initial consolidation of the Basin Ranch power plant.
|
|
Liabilities for deferred taxes
|
169
|
164
|
|
|
Total non-current liabilities
|
2,534
|
1,829
|
|
|
Total liabilities
|
2,871
|
2,188
|
|
|
Total equity
|
2,820
|
2,510
|
Most of the increase stems from issuance of shares, net, in the amount of about $255 million (about NIS 795 million), and from capital investments of the holders of non‑controlling interest
in the CPV Group, in the amount of about $54 million.
|
57
---Unofficial translation for convenience purposes---
OPC Energy Ltd.
Report of the Board of Directors
| 8. |
Liquidity and sources of financing
|
Set forth below is an analysis of significant changes in the cash flows in the first
quarter of 2026 compared with the corresponding period last year (in millions of dollars):
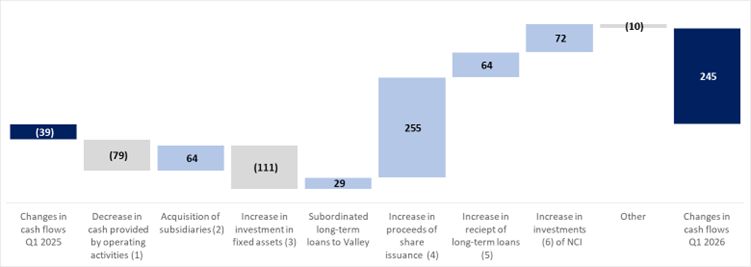
| (1) |
Most of the decrease in the cash flows provided by operating activities stems from a payment, in the amount of about $70 million, to employees of the CPV Group relating to exercise of participation units as part of conclusion of a
long‑term equity remuneration plan from 2021.
|
| (2) |
For additional details regarding the initial consolidation of the Basin Ranch and Shore power plants – see Notes 6A and 6B to the Interim Statements.
|
| (3) |
Most of the increase stems from an increase in respect of investments in the Basin Ranch project.
|
| (4) |
For additional details regarding an issuance of shares in the Period of the Report – see Note 7D to the Interim Statements.
|
| (5) |
Most of the increase stems from a withdrawal of a loan in the framework of a financing agreement of the CPV Group with Bank Leumi, as detailed in Note 7A(1) to the Interim Statements.
|
| (6) |
The increase derives from an increase in the investments of the non‑controlling interests in the United States. For additional details – see Note 23A(3) to the annual financial statements and Note 10C to the Interim Statements.
|
For additional details – see the condensed interim statements of cash flow in the Company’s Interim
Statements.
As at March 31, 2026, March 31, 2025 and December 31, 2025, the Group’s working capital
(current assets less current liabilities) amounted to about $983 million, about $107 million and about $755 million, respectively.
As at March 31, 2026, there were no warning signs pursuant to Regulation 10(B)(14) of the
Securities Regulations (Periodic and Immediate Reports), 1970, that require publication of a forecasted statement of cash flows by the Company.
58
---Unofficial translation for convenience purposes---
OPC Energy Ltd.
Report of the Board of Directors
| 9. |
Additional Events in the Company’s Areas of Activities in the Period of the Report and Thereafter
|
| A. |
Examination of opportunities to expand the Company’s activities in the area of generation and supply of electricity from renewable energies in the United States – further to the that stated in Section 8.1.3.3 of Part A of the
Periodic Report for 2025 with respect to the Company’s estimates regarding the demand for electricity from renewable energies in the United States, the Company is examining and may continue to examine from time to time, opportunities for
expansion of its activities in the area of generation and supply of electricity from renewable energies by means of acquisition of platforms, which includes projects in various stages (active, under construction and various stages of
development) in the area of renewable energies in the United States and/or in additional geographic areas (other than Israel and the United States), which will be consistent with the Company’s strategy in its area of activities.
|
| B. |
Expansion of the Company’s activities in the area of solutions for supply of electricity to data centers in Israel, signing a PPA agreement – further to the that stated in Section 7.3 of Part A of the Periodic Report for 2025 with
respect to developments regarding the matter of advancement of data centers in Israel and that stated in Section 18.1 regarding the Company’s intention to expand its undertakings with customers in the area, as at the date of the report the
Company is advancing various possibilities for optimal utilization of the Company’s sites and facilities in favor of undertakings with projects of data centers, including development of new power plants and various solutions for supply of
electricity to projects, as stated.
|
In this framework, in May 2026 the Company (through a subsidiary in Israel) signed an
amendment to an electricity supply agreement (PPA) with an existing customer of the Company (the “Customer”) which, among other things, has activities in the area of data centers, regarding its extension and expansion of the capacity in such a
manner that it could (gradually) reach about 460 megawatts in the upcoming years for, among other things, data centers the Customer operates and/or intends to operate in the future. The extended period of the electricity supply is nineteen (19)
years (subject to early termination arrangements and exit points) and it includes commitments and arrangements that are customary in the Company’s agreements of this type based on the characteristics of the consumption and the undertaking. In
addition, as part of the agreement also regulates the sale of green certificates up to a defined quantity, including arrangements for determination of the price. It is clarified that as at the approval date of the report, there is no certainty
regarding the electricity capacity that will be sold under the agreement, which will be derived in accordance with the operation of the relevant data centers, the timing and the actual operation of which, as well as consumption of the electricity
that will actually be made by the Customer, is not certain and is not under the Company’s control.
| C. |
Notification of a labor dispute at the Zomet power plant – further to the that stated in Section 9.4 of Part A of the Periodic Report for 2025 with respect to negotiations for drafting a final collective bargaining agreement for
Zomet further to the notification that employees are joining together to take collective action, as at the approval date of the report a notification of a labor dispute was filed against the background of the existence of open issues in the
framework of the negotiations. Zomet intends to continue the negotiations and has set a goal of reaching consents and formulating a collective agreement, however there is no certainty that steps will not be taken by the employees that have
joined together as part of the process. In the Company’s assessment, such actions are not expected to have a significant impact on the Company’s activities.
|
59
---Unofficial translation for convenience purposes---
OPC Energy Ltd.
Report of the Board of Directors
| 10. |
Debentures (Series B, C and D)
|
In the Period of the Report, there were no significant changes in the details of the
outstanding series of debentures the Company issued and that were offered to the public pursuant to a prospectus, the details of the trustees for the debentures, the terms for calling the debentures for immediate repayment, the Company’s compliance
with the said terms and the collaterals for the debentures.
As at the date of the report, the Company is in compliance with all the conditions of the
debentures (Series B, Series C and Series D) and the trust certificates. The Company was not required to take any action in accordance with the request of the trustees for the said debentures.
For additional details regarding the credit rating of the Company and of its debentures –
see Section 6C above.
| 11. |
Impacts of changes in the macro‑economic environment on the Group’s activities and its results
|
For details – see Section 11 of the Report of the Board of Directors for 2025.
Set forth below is data with reference to the currency exchange rate:
|
Dollar/shekel exchange rate*
|
2026
|
2025
|
Change
|
|
At the end of the prior year
|
3.190
|
3.647
|
(12.5%)
|
|
As at March 31
|
3.165
|
3.718
|
(14.9%)
|
|
Average January – March
|
3.122
|
3.613
|
(13.6%)
|
| * |
The dollar/shekel exchange rate shortly before the approval date of the report (on May 15, 2026) is 2.916.
|
Set forth below are details regarding changes in the interest in the Period of the Report and thereafter:
|
Changes in the interest
|
Interest rate
|
||
|
rate in the period of the
|
on the approval
|
||
|
Country
|
report and thereafter
|
date of the report
|
Interest forecast
|
|
Israel
|
January 2026 – reduction of 0.25% to 4.00%
|
4.00%
|
About 3.5%–3.75% on average for the four quarters ending with the first quarter of 2027, based on the forecast of Bank of Israel.
|
|
U.S.
|
The have been no changes
|
3.50%–3.75%
|
Average range of about 3.1%–3.6% during 2026, based on the forecast of the U.S. Federal Reserve Bank.
|
60
---Unofficial translation for convenience purposes---
OPC Energy Ltd.
Report of the Board of Directors
| 11. |
Impacts of changes in the macro‑economic environment on the Group’s activities and its results (Cont.)
|
Interest rate (mainly shekel and dollar) (Cont.)
It is noted that the changes and the geopolitical tensions in and outside of Israel also have an impact on the
macro‑economic environment, including on Bank of Israel’s policy decisions (among other things with respect to the circumstances of the war), as detailed in Section 2B above, and events of this type could have an impact on inflationary aspects and
interest rates.
Set forth below is data relating to the Consumer Price Index (CPI) in Israel and in the U.S., interest rates of
Bank of Israel and interest rates of the U.S. Federal Reserve Bank:
|
Bank of
|
||||
|
Israel
|
Federal
|
|||
|
Israeli
|
U.S.
|
Interest
|
interest
|
|
|
CPI
|
CPI
|
Rate
|
rate
|
|
|
On May 16, 2026
|
119.5
|
333.0
|
4.00%
|
3.50%–3.75%
|
|
On March 31, 2026
|
117.7
|
326.8
|
4.00%
|
3.50%–3.75%
|
|
On December 31, 2025
|
117.8
|
324.1
|
4.25%
|
3.50%–3.75%
|
|
On March 31, 2025
|
115.4
|
319.1
|
4.5%
|
4.25%–4.50%
|
|
On December 31, 2024
|
115.1
|
315.5
|
4.5%
|
4.25%–4.50%
|
|
Change in the first quarter of 2026
|
(0.1%)
|
0.8%
|
(0.25%)
|
0%
|
|
Change in the first quarter of 2025
|
0.3%
|
1.1%
|
0%
|
0%
|
For details with respect to credit linked to the CPI or the prime interest rate – see Section 11 to the Report of the Board of Directors for
2025 and Note 14B to the annual financial statements.
For additional details regarding the Group’s policies for management of the financial risks and sensitivity
analyses, including changes in the CPI and interest – see Note 21 to the annual financial statements.
| 12. |
Corporate Governance
|
For details – see Sections 13–15 of the Report of the Board of Directors for 2025.
Notice of an Extraordinary General Meeting of the shareholders – proximate to the publication date of this
report, the Company is publishing a notice convening an Extraordinary General Meeting of the shareholders, to be held on June 25, 2026, whereat decisions will be made regarding the following:
| 1. |
Reappointment of Ms. Shirli Mashkif as an external director of the Company for an additional period of service of three years commencing from July 1, 2026, regarding which she will be entitled to the service conditions for the Company’s
directors, including directors’ fees in accordance with her classification as an expert director.
|
| 2. |
Appointment of Ms. Ruth Ralbag as an external director of the Company for an initial period of service of three years commencing from July 1, 2026, regarding which she will be entitled to the service conditions for the Company’s
directors, including directors’ fees in accordance with her classification as an expert director.
|
61
---Unofficial translation for convenience purposes---
OPC Energy Ltd.
Report of the Board of Directors
| 13. |
Contributions policy
|
The Company has a policy for making contributions that places emphasis on activities in
the periphery and non-profit organizations that operate in the field of education. The Group’s expenses in respect of contributions in the Period of the Report and up to the approval date thereof, amounted to about NIS 2.7 million, of which about
NIS 1 million was contributed to rehabilitation and support channels (targets) due to event relating to the war.
Set forth below is detail of contributions in the Period of the Report of more than NIS 50
thousand and indication of the relationship to the recipient of the contribution (in NIS thousands):
|
Recipient of the
|
Amount of the
|
Relationship to the
|
|
Contribution
|
Contribution
|
Recipient of the Contribution
|
|
“Password for Every Student” Society
|
1,000
|
“Password for Every Student” also receives contributions from parties related to the Company’s controlling shareholder,
including corporations in which officers serving as directors of the Company hold positions (including from the Israel Corporation Group and its controlling shareholders). The Company’s CEO is a representative of the project’s Steering
Committee without compensation.
|
|
“Rahashei Lev” Society
|
150
|
For the sake of good order, it is noted that as the Company was informed, commencing from November 2022, the daughter of Mr. Joseph Tenne, an external director of the
Company, is employed by the Tel Aviv Sourasky Medical Center.
|
|
“Running to Give” Society
|
50
|
For the sake of good order, it is noted that a relative of the Company’s CEO serves as Chairman of the Society without compensation.
|
|
Yair Caspi
|
Giora Almogy
|
|
Chairman of the Board of Directors
|
CEO
|
Date: May 19, 2026
62
---Unofficial translation for convenience purposes---
OPC Energy Ltd.
Report of the Board of Directors
Appendix A
Additional Information regarding the Natural‑Gas Power Plants in the U.S.
EOX Forecast of Natural Gas and Electricity Prices up to the end of 2026 and for the Years 2027–2028
As additional background with respect to the activities of the Energy Transition Segment in the U.S. and in order to assist regarding accessibility to
additional available external data, presented below are forecasts of electricity and natural gas prices (Mid-Market) in the regions in which the power plants of the CPV Group in the Energy Transition segment in the U.S. operate, and in the region
of the planned activities of the Basin Ranch power plant, which is under construction, which were prepared by the EOX Company47 and it is based on future market prices of electricity and natural gas.
The data in the tables below reflect forecasts of the electricity and natural gas prices as received from EOX, where with reference to the forecast of
the electricity prices the information was processed by the CPV Group in the following manner:
| – |
In the peak hours, electricity is sold in the maximum scope;
|
| – |
Sale of the balance of the electricity is made in the off‑peak hours.
|
| – |
The scope of the generation of each power plant was estimated separately on the basis of the historical generation data while taking generation forecasts into account.
|
The electricity margin appearing in the table below is calculated based on the following formula:
Electricity margin ($/MWh) = the electricity price ($/MWh) – [the gas price ($/MMBTU) X the thermal conversion ratio* (heat rate) (MMBtu/MWh)]
| * |
Assumption of a thermal conversion ratio (heat rate) of 6.9 MMBtu/MWh for Maryland, Shore and Valley, and a thermal conversion ratio (heat rate) of 6.5 MMBtu/MWh for Towantic, Fairview and Basin Ranch.
|
It should be noted that there may be material differences between the actual electricity and natural gas prices at CPV Group’s power plants and the
prices presented in the table below, due, among other things, to the existence of bid–ask spreads, power basis, and the like. Accordingly, the actual electricity margins of CPV Group’s power plants may differ materially from the margins presented
in the table below.
The data included in this Appendix below is based on forecasts of electricity and gas prices made by EOX – a market consulting
company that provides information and data services in the area of the Company’s activities in the U.S. in the Energy Transition segment, and it is presented as additional background and in order to assist accessibility to available external data
regarding the area of activities. It is clarified and emphasized that in light of the fact these are market forecasts, quite naturally the Company is not able to make (and did not make) an independent examination of the forecasts or the underlying
data. It is clarified that there are additional entities that provide similar information services that might provide forecasts that differ from these prices. The Company does not undertake to update data as stated.
In addition, it is emphasized that forecasts are involved regarding which there is no certainty as to their accuracy or actual
realization. The electricity and natural gas prices (in the market, in general, and of the power plants of the CPV Group, in particular) might be different, even significantly, from that presented as a result of various factors, including,
macro‑economic factors, regulatory changes, political and/or geopolitical events (including global events) that impact the supply and demand of natural gas and electricity, weather events, events relating to the electricity sector in the U.S.
(demand, supply, availability of power plants, operational events, proper functioning of the electricity grid, transmission infrastructures) and/or failures in (problems with) the assumptions and estimates that form the basis of the forecast.
47 EOX is a subsidiary of a commodity broker, OTC Global Holdings, which publishes forward prices
for the electricity and natural gas markets based on trading data in the futures markets. The futures prices are an objective way of estimating the future expectation with respect to electricity and natural gas prices since they represent
transactions with entities operating in these markets involving buying and selling futures contracts at specific prices.
63
---Unofficial translation for convenience purposes---
OPC Energy Ltd.
Report of the Board of Directors
Appendix A (Cont.)
Appendix A
Additional Information regarding the Natural‑Gas Power Plants in the U.S.
EOX Forecast of Natural Gas and Electricity Prices up to the end of 2026 for the Years 2027–2028
|
Power Plants (Rate of Holdings)48
|
For the
|
||
|
nine-month
|
|||
|
period
|
|||
|
April
|
|||
|
through
|
|||
|
December
|
|||
|
2026
|
2027
|
2028
|
|
|
Fairview (25%)
|
|||
|
Gas price (Texas Eastern M3)
|
2.85
|
4.41
|
4.23
|
|
Electricity price (AEP Dayton (AD))
|
53.37
|
56.26
|
55.65
|
|
Electricity margin
|
34.88
|
27.60
|
28.12
|
|
Towantic (26%)
|
|||
|
Gas price (Algonquin City Gate)
|
4.48
|
7.04
|
6.17
|
|
Electricity price (Mass Hub)
|
63.64
|
78.56
|
70.42
|
|
Electricity margin
|
34.54
|
32.81
|
30.30
|
|
Maryland (100%)
|
|||
|
Gas price (Transco Zone 5)
|
3.97
|
4.96
|
4.73
|
|
Electricity price (PJM West Hub)
|
65.00
|
68.62
|
67.30
|
|
Electricity margin
|
37.63
|
34.38
|
34.66
|
|
Shore (100%)
|
|||
|
Gas price (Texas Eastern M3)
|
2.85
|
4.41
|
4.23
|
|
Electricity price (PJM West Hub)
|
65.00
|
68.62
|
67.30
|
|
Electricity margin
|
45.37
|
38.19
|
38.08
|
|
Valley (50%)
|
|||
|
Gas price (Texas Eastern M3 – 70%, Dominion South Pt – 30%)
|
2.71
|
3.97
|
3.85
|
|
Electricity price (New York Zone G)
|
62.86
|
75.50
|
68.84
|
|
Electricity margin
|
44.19
|
48.08
|
42.27
|
|
Basin Ranch (under construction) (100%)
|
|||
|
Gas price (Waha)
|
(0.43)
|
2.47
|
2.44
|
|
Electricity price (ERCOT West Pk)
|
44.11
|
52.12
|
55.94
|
|
Electricity margin
|
46.91
|
36.10
|
40.07
|
48 The rate of holdings of the CPV Group in the project, as at the approval date of the report.
64
---Unofficial translation for convenience purposes---
OPC Energy Ltd.
Report of the Board of Directors
Set forth below is gross (raw) data as included in the forecast of EOX (without processing)
|
Mass Hub
OPk
|
Mass Hub
Pk
|
East NY ZnG
OPk
|
East NY
ZnG Pk
|
AEP-
Dayton
OPk
|
AEP-
Dayton Pk
|
PJM West
OPk
|
PJM West
Pk
|
Contract Date |
| 47.03 |
54.14 |
47.41 |
56.54 |
39.84 |
51.81 |
43.82 |
65.06 |
01/03/2026 |
| 41.86 |
48.73 |
41.61 |
47.63 |
41.29 |
53.35 |
43.69 |
62.16 |
01/04/2026 |
| 36.19 |
43.29 |
36.74 |
56.71 |
32.76 |
54.48 |
35.71 |
64.25 |
01/05/2026 |
| 40.84 |
57.97 |
39.99 |
62.20 |
32.83 |
59.88 |
35.73 |
70.18 |
01/06/2026 |
| 53.08 |
89.88 |
54.12 |
92.84 |
42.38 |
81.41 |
46.42 |
98.82 |
01/07/2026 |
| 40.93 |
68.23 |
43.80 |
70.15 |
37.53 |
69.81 |
40.56 |
82.26 |
01/08/2026 |
| 37.32 |
48.29 |
38.30 |
50.80 |
33.84 |
58.68 |
36.75 |
66.22 |
01/09/2026 |
| 38.86 |
46.27 |
39.59 |
48.78 |
41.58 |
56.96 |
45.81 |
64.31 |
01/10/2026 |
| 64.05 |
70.84 |
60.08 |
69.84 |
46.73 |
58.43 |
50.64 |
65.48 |
01/11/2026 |
| 139.71 |
149.57 |
115.88 |
130.87 |
62.47 |
67.49 |
70.63 |
80.30 |
01/12/2026 |
| 175.62 |
182.79 |
159.30 |
164.83 |
73.27 |
84.59 |
101.14 |
109.40 |
01/01/2027 |
| 143.93 |
163.00 |
129.01 |
150.32 |
61.76 |
71.16 |
85.69 |
94.93 |
01/02/2027 |
| 61.36 |
75.75 |
54.44 |
72.57 |
42.96 |
51.95 |
47.85 |
60.05 |
01/03/2027 |
| 43.63 |
48.86 |
43.38 |
48.96 |
40.51 |
50.80 |
44.20 |
57.64 |
01/04/2027 |
| 33.68 |
43.94 |
35.21 |
44.39 |
32.30 |
51.27 |
35.90 |
57.71 |
01/05/2027 |
| 37.15 |
55.38 |
39.96 |
57.76 |
33.83 |
58.22 |
36.16 |
64.39 |
01/06/2027 |
| 53.64 |
90.88 |
53.89 |
93.30 |
43.52 |
86.28 |
46.51 |
99.05 |
01/07/2027 |
| 44.21 |
72.95 |
45.15 |
74.98 |
38.29 |
71.81 |
41.34 |
83.20 |
01/08/2027 |
| 38.46 |
48.05 |
37.82 |
49.79 |
34.26 |
56.89 |
36.70 |
62.95 |
01/09/2027 |
| 40.71 |
48.07 |
38.53 |
48.96 |
41.15 |
55.73 |
45.92 |
62.11 |
01/10/2027 |
| 59.88 |
67.46 |
52.11 |
65.63 |
46.26 |
57.36 |
49.56 |
63.51 |
01/11/2027 |
| 104.31 |
113.91 |
91.58 |
105.56 |
61.27 |
71.49 | 67.65 |
79.68 |
01/12/2027 |
| 130.00 |
146.19 |
112.02 |
135.24 |
69.02 |
81.54 | 94.21 |
104.00 |
01/01/2028 |
| 119.27 |
127.49 |
104.44 |
116.18 |
62.13 |
70.91 | 85.42 |
93.59 |
01/02/2028 |
| 55.06 |
66.55 |
52.29 |
70.45 |
42.28 |
49.69 | 47.75 |
58.08 |
01/03/2028 |
| 42.41 |
4735 |
41.02 |
48.59 |
37.75 |
50.52 | 41.34 |
56.51 |
01/04/2028 |
| 35.89 |
41.72 |
35.34 |
45.48 |
35.07 |
49.67 | 38.31 |
55.83 |
01/05/2028 |
| 36.94 |
52.44 |
37.88 |
56.10 |
33.92 |
58.15 | 36.30 |
63.53 |
01/06/2028 |
| 52.20 |
91.41 |
55.57 |
91.31 |
42.49 |
86.75 | 46.34 |
96.87 |
01/07/2028 |
| 45.87 |
72.84 |
48.94 |
73.82 |
38.94 |
75.39 | 42.29 |
84.64 |
01/08/2028 |
| 36.58 |
48.67 |
35.49 |
52.73 |
33.40 |
56.18 |
36.49 |
61.51 |
01/09/2028 |
| 44.54 |
50.43 |
41.41 |
48.75 |
42.55 |
57.18 |
45.75 |
61.99 |
01/10/2028 |
| 51.71 |
61.38 |
46.79 |
57.95 |
43.09 |
58.18 |
47.65 |
64.46 |
01/11/2028 |
| 91.01 |
105.17 |
84.90 |
102.93 |
57.72 |
68.76 |
64.38 |
76.45 |
01/12/2028 |
65
---Unofficial translation for convenience purposes---
OPC Energy Ltd.
Report of the Board of Directors
| Waha |
Transco
Zn5 Dlvd
|
Chicago
CG
|
Texas
Eastern M-
2
|
Algonquin
CG
|
Dominion
S Pt
|
Texas
Eastern M-
3
|
ERCOT
West OPk
|
ERCOT
West Pk
|
Contract Date |
| -2.93 |
2.64 |
2.52 |
2.20 |
2.62 |
2.20 |
2.22 |
14.90 |
19.87 |
01/03/2026 |
| -3.30 |
3.26 |
2.63 |
2.12 |
2.47 |
2.12 |
2.19 |
24.53 |
22.01 |
01/04/2026 |
| -2.85 |
3.58 |
2.47 |
1.95 |
2.19 |
1.94 |
2.06 |
31.47 |
32.09 |
01/05/2026 |
| -1.77 |
3.54 |
2.59 |
2.10 |
3.25 |
2.08 |
2.25 |
34.96 |
38.44 |
01/06/2026 |
| -0.79 |
3.87 |
2.83 |
2.38 |
3.92 |
2.34 |
2.64 |
46.57 |
66.55 |
01/07/2026 |
| -0.48 |
3.79 |
2.89 |
2.39 |
3.43 |
2.37 |
2.67 |
60.19 |
102.54 |
01/08/2026 |
| -0.28 |
3.47 |
2.85 |
2.10 |
2.45 |
2.08 |
2.21 |
42.95 |
53.06 |
01/09/2026 |
| 0.53 |
3.56 |
2.87 |
2.07 |
2.42 |
2.05 |
2.21 |
36.55 |
36.20 |
01/10/2026 |
| 1.82 |
3.68 |
3.34 |
2.71 |
5.21 |
2.68 |
3.00 |
39.39 |
38.23 |
01/11/2026 |
| 3.24 |
6.94 |
4.59 |
3.89 |
14.96 |
3.77 |
6.38 |
49.92 |
42.24 |
01/12/2026 |
| 3.93 |
10.89 |
5.49 |
4.51 |
19.52 |
4.28 |
11.06 |
71.13 |
55.06 |
01/01/2027 |
| 3.46 |
9.39 |
5.03 |
4.06 |
17.17 |
3.84 |
9.56 |
67.21 |
53.25 |
01/02/2027 |
| 2.28 |
4.36 |
3.26 |
3.05 |
6.61 |
2.94 |
3.34 |
35.95 |
36.92 |
01/03/2027 |
| 1.64 |
3.55 |
2.94 |
2.63 |
3.41 |
2.60 |
2.75 |
35.76 |
35.69 |
01/04/2027 |
| 1.65 |
3.63 |
2.84 |
2.43 |
2.98 |
2.44 |
2.62 |
39.26 |
38.44 |
01/05/2027 |
| 1.92 |
3.64 |
2.93 |
2.50 |
3.22 |
2.53 |
2.80 |
42.50 |
41.80 |
01/06/2027 |
| 2.42 |
3.86 |
3.14 |
2.65 |
4.20 |
2.67 |
3.07 |
65.99 |
71.58 |
01/07/2027 |
| 2.43 |
3.78 |
3.19 |
2.64 |
4.07 |
2.65 |
3.05 |
78.41 |
110.66 |
01/08/2027 |
| 2.20 |
3.42 |
3.14 |
2.40 |
2.93 |
2.34 |
2.59 |
48.98 |
51.39 |
01/09/2027 |
| 2.29 | 3.40 |
3.24 |
2.36 |
3.07 |
2.33 |
2.61 |
40.95 |
38.19 |
01/10/2027 |
| 2.28 |
3.62 |
3.57 |
2.93 |
5.53 |
2.93 |
3.27 |
40.86 |
38.98 |
01/11/2027 |
| 3.09 |
6.01 |
4.75 |
4.01 |
11.76 |
3.92 |
6.20 |
58.96 |
53.00 |
01/12/2027 |
| 3.70 |
10.15 |
5.62 |
4.64 |
15.31 |
4.44 |
9.77 |
83.23 |
62.69 |
01/01/2028 |
| 3.02 |
8.47 |
5.02 |
4.05 |
13.28 |
3.87 |
8.49 |
79.30 |
59.93 |
01/02/2028 |
| 1.66 |
4.09 |
3.29 |
3.13 |
6.50 |
3.03 |
3.38 |
42.53 |
38.19 | 01/03/2028 |
| 1.35 |
3.54 |
2.95 |
2.50 |
3.74 |
2.51 |
2.82 |
40.87 |
36.97 | 01/04/2028 |
| 1.41 |
3.59 |
2.85 |
2.41 |
3.18 |
2.37 |
2.69 |
38.63 |
40.47 |
01/05/2028 |
| 1.68 |
3.51 |
2.94 |
2.53 |
3.32 |
2.52 |
2.83 |
47.46 |
44.62 |
01/06/2028 |
| 2.45 |
3.57 |
3.18 |
2.69 |
3.92 |
2.63 |
2.90 |
72.29 |
83.50 |
01/07/2028 |
| 2.62 |
3.50 |
3.24 |
2.67 |
3.79 |
2.63 |
2.85 |
73.69 |
109.86 |
01/08/2028 |
| 2.44 |
3.36 |
3.18 |
2.35 |
3.11 |
2.38 |
2.66 |
53.06 |
52.42 |
01/09/2028 |
| 2.52 |
3.31 |
3.28 |
2.30 |
3.38 |
2.38 |
2.80 |
46.87 |
39.52 |
01/10/2028 |
| 2.82 |
3.34 |
3.59 |
2.92 |
4.85 |
2.92 |
3.35 |
44.19 |
39.26 |
01/11/2028 |
| 3.61 |
6.35 |
4.65 |
3.84 |
9.69 |
3.75 |
6.30 |
56.22 |
55.77 |
01/12/2028 |