Earnings Before Interest, Taxes, Depreciation and Amortization for Real Estate (EBITDAre)
16
Funds from Operations
17
Market Capitalization, Debt Ratios and Liquidity
18
Additional Disclosures
19
Leasing Data
Tenant Concentration - Top Twenty-Five Tenants
20
Leasing Activity
21
Leases Executed But Not Yet Rent Commenced
22
Retail Portfolio Lease Expiration Schedules
23
Property Data
Property Status Report
25
Property Acquisitions and Dispositions
28
Development, Redevelopment and Anchor Repositioning Projects
29
Debt Schedules
Debt Summary
31
Mortgage Debt Summary
32
Debt Maturity Schedule
33
Urban Edge Properties
For additional information:
12 East 49th Street
Mark Langer, EVP and
New York, NY 10017
Chief Financial Officer
212-956-0082
FOR IMMEDIATE RELEASE:
Urban Edge Properties Reports Fourth Quarter and Full Year 2024 Results
-- Provides 2025 Earnings Outlook --
-- Board Raises Quarterly Cash Dividend by 12% --
NEW YORK, NY, February 12, 2025 - Urban Edge Properties (NYSE: UE) (the "Company") today announced its results for the quarter and year ended December 31, 2024 and provided its initial outlook for full year 2025.
"The fourth quarter capped an outstanding 2024 for Urban Edge," said Jeff Olson, Chairman and CEO. "FFO as Adjusted increased by 8% for the year to $1.35 per share, allowing us to achieve our three-year earnings target - announced at our April 2023 Investor Day - one year ahead of plan. Growth was driven by new rent commencements, record leasing activity and accretive capital recycling. As a result of our higher earnings and taxable income, we are increasing our dividend by 12%. Looking ahead, we are excited about our prospects to continue to meaningfully grow earnings and cash flow.”
Financial Results(1)(2)
(in thousands, except per share amounts)
4Q24
4Q23
FY 2024
FY 2023
Net income attributable to common shareholders
$
30,121
$
221,235
$
72,563
$
248,497
Net income per diluted share
0.24
1.88
0.60
2.11
Funds from Operations ("FFO")
45,350
45,676
186,732
184,438
FFO per diluted share
0.35
0.37
1.48
1.51
FFO as Adjusted
44,061
37,916
169,720
153,050
FFO as Adjusted per diluted share
0.34
0.31
1.35
1.25
Net income for the year ended December 31, 2024 decreased as compared to 2023 primarily driven by the $217.4 million, or $1.85 per share, gain on sale of real estate recognized in the fourth quarter of 2023 related to two properties and one property parcel. FFO as Adjusted for the year ended December 31, 2024 increased by 8% per share as compared to 2023 and benefited from accretive capital recycling, increased net operating income ("NOI") from rent commencements on new leases, lower levels of uncollected rents and higher non-cash revenues.
Same-Property Operating Results Compared to the Prior Year Period(1)(3)
4Q24
FY 2024
Same-property NOI growth
6.6
%
4.3
%
Same-property NOI growth, including properties in redevelopment
7.4
%
5.1
%
Increases in same-property NOI metrics for the quarter and year ended December 31, 2024 were driven by rent commencements on new leases and higher net recovery income.
Leasing and Occupancy Results(1)
•Increased same-property portfolio leased occupancy to 96.6%, up 30 basis points compared to September 30, 2024 and 80 basis points compared to December 31, 2023.
•Increased consolidated portfolio leased occupancy to 96.8%, up 50 basis points compared to September 30, 2024 and 90 basis points compared to December 31, 2023.
1
•Increased retail shop leased occupancy to 90.9%, up 50 basis points compared to September 30, 2024, and 320 basis points compared to December 31, 2023.
•Executed 29 new leases, renewals and options totaling 402,000 sf during the quarter. New leases totaled 123,000 sf, of which 117,000 sf was on a same-space basis and generated an average cash spread of 44%. New leases, renewals and options totaled 396,000 sf on a same-space basis and generated an average cash spread of 21%.
•Executed 165 new leases, renewals and options totaling 2,396,000 sf during the year. New leases totaled 485,000 sf, of which 335,000 sf was on a same-space basis and generated an average cash spread of 26%. New leases, renewals and options totaled 2,018,000 sf on a same-space basis and generated an average cash spread of 12%.
•As of December 31, 2024, the Company signed leases that have not yet rent commenced that are expected to generate an additional $25 million of future annual gross rent, representing approximately 9% of 2024 NOI. Approximately $7.8 million of this amount is expected to be recognized in 2025.
Acquisition and Disposition Activity
During 2024, the Company acquired $243 million of assets at a 7.2% capitalization rate and sold $109 million of non-core assets at a 5.2% capitalization rate.
As previously announced, on October 29, 2024, the Company acquired The Village at Waugh Chapel for a purchase price of $126 million, representing an initial capitalization rate of 6.6%. The grocery-anchored center is located in Gambrills, MD, a highly educated and affluent trade area that sits within 20 miles of Washington, D.C., Baltimore and Annapolis. The shopping center aggregates 382,000 sf with national tenants including Safeway, Marshalls, HomeGoods, and T.J. Maxx, as well as several high-quality outparcels highlighted by Chick-fil-A and Chipotle. Shop spaces account for approximately 150,000 sf of leasable area and offer strong growth opportunities through in-place contractual rent increases and the re-leasing of below-market spaces.
The acquisition was funded through the assumption of a $60 million, 3.76% interest-only mortgage with a remaining term of approximately seven years, as well as proceeds from equity issuances under the Company's ATM program and asset sales. The Company expects to earn a first-year levered return of approximately 9%.
On October 29, 2024, the Company sold a single-tenant, Home Depot property located in Union, NJ for $71 million, reflecting a 5.4% capitalization rate. The outstanding $44.5 million mortgage encumbering the property was assumed by the buyer at closing. This transaction resulted in a $23.3 million gain and was structured as part of a Section 1031 exchange with the acquisition of The Village at Waugh Chapel, allowing for the deferral of capital gains resulting from the sale for tax purposes.
The Company is currently under contract to sell a portion of its Bergen Town Center East property, located in Paramus, NJ, to a multi-family developer for a price of $25 million.
Financing Activity
During the quarter, the Company borrowed $65 million under its line of credit and subsequently repaid $15 million of the balance. As of December 31, 2024, there was an outstanding balance of $50 million on the Company's line of credit.
On November 21, 2024, the Company refinanced the mortgage secured by its property, Brick Commons, with a new 7-year, $50 million loan bearing interest at a fixed rate of 5.2%. A portion of the proceeds from the refinancing were used to pay off the previous mortgage on the property, which had an outstanding balance of $46.8 million.
As of December 31, 2024, the Company has limited debt maturities coming due through December 31, 2026 including $23.7 million in 2025 and $116 million in 2026, aggregating $139.7 million, which represents approximately 9% of outstanding debt.
Development and Redevelopment
The Company commenced five redevelopment projects with estimated aggregate costs of $8.2 million during the quarter and has $162.6 million of active redevelopment projects underway, with estimated remaining costs to complete of $89.5 million. The active redevelopment projects are expected to generate an approximate 15% unleveraged yield. The Company also stabilized one redevelopment project with the rent commencement of T.J. Maxx at The Outlets at Montehiedra. The project had total costs of $4.8 million.
The Company also reached an agreement with Macy's at Sunrise Mall to terminate its lease with an effective date of March 31, 2025, further advancing our plans for the property.
Balance Sheet and Liquidity(1)(4)(5)
Balance sheet highlights as of December 31, 2024 include:
•Total liquidity of approximately $809 million, consisting of $91 million of cash on hand and $718 million available under the Company's $800 million revolving credit agreement, including undrawn letters of credit.
2
•Mortgages payable of $1.58 billion, with a weighted average term to maturity of 4.7 years, all of which is fixed rate or hedged.
•$50 million drawn on our $800 million revolving credit agreement that matures on February 9, 2027, with two six-month extension options.
•Total market capitalization of approximately $4.47 billion comprised of 131.8 million fully-diluted common shares valued at $2.83 billion and $1.63 billion of debt.
•Net debt to total market capitalization of 35%.
2025 Outlook
The Company announced its outlook for full-year 2025 performance including anticipated net income of $0.32 to $0.37 per diluted share, FFO of $1.36 to $1.41 per diluted share, and FFO as Adjusted of $1.37 to $1.42 per diluted share. A reconciliation of net income to FFO and FFO as Adjusted, the assumptions related to the 2025 outlook, and a reconciliation bridging 2024 FFO per diluted share to the 2025 estimates can be found on page 4 of this press release.
Dividend
On February 11, 2025, the Board of Trustees declared a regular quarterly dividend of $0.19 per common share, resulting in an indicated annual rate of $0.76 per share, an annual increase of $0.08 per share or 12%, over the prior annual rate. The dividend will be payable on March 31, 2025 to common shareholders of record on March 14, 2025.
Earnings Conference Call Information
The Company will host an earnings conference call and audio webcast on February 12, 2025 at 8:30am ET. All interested parties can access the earnings call by dialing 1-877-407-9716 (Toll Free) or 1-201-493-6779 (Toll/International) using conference ID 13750364. The call will also be webcast and available in listen-only mode on the investors page of our website: www.uedge.com. A replay will be available at the webcast link on the investors page for one year following the conclusion of the call. A telephonic replay of the call will also be available starting February 12, 2025 at 11:30am ET through Wednesday, February 26, 2025 at 11:59pm ET by dialing 1-844-512-2921 (Toll Free) or 1-412-317-6671 (Toll/International) using conference ID 13750364.
(1) Refer to "Non-GAAP Financial Measures" and "Operating Metrics" for definitions and additional detail. Reported consolidated portfolio leased occupancy excludes the impact of Sunrise Mall. Including Sunrise Mall, consolidated portfolio leased occupancy was 91.7% at December 31, 2024.
(2) Refer to page 7 for a reconciliation of net income to FFO and FFO as Adjusted for the quarter and year ended December 31, 2024.
(3) Refer to page 8 for a reconciliation of net income to NOI and Same-Property NOI for the quarter and year ended December 31, 2024.
(4) Net debt as of December 31, 2024 is calculated as total consolidated debt of $1.6 billion less total cash and cash equivalents, including restricted cash, of $91 million.
(5) Refer to page 18 for the calculation of market capitalization as of December 31, 2024.
3
2025 Earnings Guidance
The Company's 2025 earnings guidance anticipates net income of $0.32 to $0.37 per diluted share, FFO of $1.36 to $1.41 per diluted share, and FFO as Adjusted of $1.37 to $1.42 per diluted share. Below is a summary of the underlying assumptions and a reconciliation of the range of estimated earnings, FFO and FFO as Adjusted per diluted share.
The Company's full year outlook is based on the following assumptions:
•Same-property NOI growth, including properties in redevelopment, of 3.0% to 4.0%.
•Recurring G&A expenses ranging from $35 million to $37 million.
•Interest and debt expense ranging from $78.5 million to $80.5 million.
•Excludes items that impact FFO comparability, including gains and/or losses on extinguishment of debt, transaction, severance, litigation, or any one-time items outside of the ordinary course of business.
Guidance 2025E
Per Diluted Share(1)
(in thousands, except per share amounts)
Low
High
Low
High
Net income
$
41,200
$
47,700
$
0.32
$
0.37
Less net (income) loss attributable to noncontrolling interests in:
Operating partnership
(2,200)
(2,600)
(0.02)
(0.02)
Consolidated subsidiaries
1,000
1,000
0.01
0.01
Net income attributable to common shareholders
40,000
46,100
0.31
0.35
Adjustments:
Rental property depreciation and amortization
135,100
135,100
1.04
1.04
Limited partnership interests in operating partnership
2,200
2,600
0.02
0.02
FFO Applicable to diluted common shareholders
$
177,300
$
183,800
$
1.36
$
1.41
Adjustments to FFO:
Transaction, severance, litigation and other expenses
1,000
1,000
0.01
0.01
FFO as Adjusted applicable to diluted common shareholders
$
178,300
$
184,800
$
1.37
$
1.42
(1) Amounts may not foot due to rounding.
The following table is a reconciliation bridging our 2024 FFO per diluted share to the Company's estimated 2025 FFO per diluted share:
Per Diluted Share(1)
Low
High
2024 FFO applicable to diluted common shareholders
$
1.48
$
1.48
2024 Items impacting FFO comparability(2)
(0.14)
(0.14)
2025 Items impacting FFO comparability
(0.01)
(0.01)
Same-property NOI growth, including redevelopment
0.06
0.07
Acquisitions net of dispositions NOI growth
0.01
0.01
Interest and debt expense
(0.02)
—
Recurring general and administrative
(0.01)
0.01
Straight-line rent and non-cash items
(0.01)
—
Lease termination and other income
(0.01)
(0.01)
2025 FFO applicable to diluted common shareholders
$
1.36
$
1.41
(1) Amounts may not foot due to rounding.
(2) Includes adjustments to FFO for fiscal year 2024 which impact comparability. See "Reconciliation of Net Income to FFO and FFO as Adjusted" on page 7 for more information.
The Company is providing a projection of anticipated net income solely to satisfy the disclosure requirements of the Securities and Exchange Commission ("SEC"). The Company's projections are based on management’s current beliefs and assumptions about the Company's business, and the industry and the markets in which it operates; there are known and unknown risks and uncertainties associated with these projections. There can be no assurance that our actual results will not differ from the guidance set forth on this page. The Company assumes no obligation to update publicly any forward-looking statements, including its 2025 earnings guidance, whether as a result of new information, future events or otherwise. Please refer to the “Forward-Looking Statements” disclosures on page 10 of this document and “Risk Factors” disclosed in the Company's annual and quarterly reports filed with the SEC for more information.
4
Non-GAAP Financial Measures
The Company uses certain non-GAAP performance measures, in addition to the primary GAAP presentations, as we believe these measures improve the understanding of the Company's operational results. We continually evaluate the usefulness, relevance, limitations, and calculation of our reported non-GAAP performance measures to determine how best to provide relevant information to the investing public, and thus such reported measures are subject to change. The Company's non-GAAP performance measures have limitations as they do not include all items of income and expense that affect operations, and accordingly, should always be considered as supplemental financial results. Additionally, the Company's computation of non-GAAP metrics may not be comparable to similarly titled non-GAAP metrics reported by other real estate investment trusts ("REITs") or real estate companies that define these metrics differently and, as a result, it is important to understand the manner in which the Company defines and calculates each of its non-GAAP metrics. The following non-GAAP measures are commonly used by the Company and investing public to understand and evaluate our operating results and performance:
•FFO: The Company believes FFO is a useful, supplemental measure of its operating performance that is a recognized metric used extensively by the real estate industry and, in particular REITs. FFO, as defined by the National Association of Real Estate Investment Trusts ("Nareit") and the Company, is net income (computed in accordance with GAAP), excluding gains (or losses) from sales of depreciable real estate and land when connected to the main business of a REIT, impairments on depreciable real estate or land related to a REIT's main business, earnings from consolidated partially owned entities and rental property depreciation and amortization expense. The Company believes that financial analysts, investors and shareholders are better served by the presentation of comparable period operating results generated from FFO primarily because it excludes the assumption that the value of real estate assets diminishes predictably. FFO does not represent cash flows from operating activities in accordance with GAAP, should not be considered an alternative to net income as an indication of our performance, and is not indicative of cash flow as a measure of liquidity or our ability to make cash distributions.
•FFO as Adjusted: The Company provides disclosure of FFO as Adjusted because it believes it is a useful supplemental measure of its core operating performance that facilitates comparability of historical financial periods. FFO as Adjusted is calculated by making certain adjustments to FFO to account for items the Company does not believe are representative of ongoing core operating results, including non-comparable revenues and expenses. The Company's method of calculating FFO as Adjusted may be different from methods used by other REITs and, accordingly, may not be comparable to such other REITs.
•NOI: The Company uses NOI internally to make investment and capital allocation decisions and to compare the unlevered performance of our properties to our peers. The Company believes NOI is useful to investors as a performance measure because, when compared across periods, NOI reflects the impact on operations from trends in occupancy rates, rental rates, operating costs and acquisition and disposition activity on an unleveraged basis, providing perspective not immediately apparent from net income. The Company calculates NOI using net income as defined by GAAP reflecting only those income and expense items that are incurred at the property level, adjusted for non-cash rental income and expense, impairments on depreciable real estate or land, and income or expenses that we do not believe are representative of ongoing operating results, if any. In addition, the Company uses NOI margin, calculated as NOI divided by total property revenue, which the Company believes is useful to investors for similar reasons.
•Same-property NOI: The Company provides disclosure of NOI on a same-property basis, which includes the results of properties that were owned and operated for the entirety of the reporting periods being compared, which total 65 properties for the quarters and years ended December 31, 2024 and 2023. Information provided on a same-property basis excludes properties under development, redevelopment or that involve anchor repositioning where a substantial portion of the gross leasable area ("GLA") is taken out of service and also excludes properties acquired, sold, or that are in the foreclosure process during the periods being compared. As such, same-property NOI assists in eliminating disparities in net income due to the development, redevelopment, acquisition, disposition, or foreclosure of properties during the periods presented, and thus provides a more consistent performance measure for the comparison of the operating performance of the Company's properties. While there is judgment surrounding changes in designations, a property is removed from the same-property pool when it is designated as a redevelopment property because it is undergoing significant renovation or retenanting pursuant to a formal plan that is expected to have a significant impact on its operating income. A development or redevelopment property is moved back to the same-property pool once a substantial portion of the NOI growth expected from the development or redevelopment is reflected in both the current and comparable prior year period, generally one year after at least 80% of the expected NOI from the project is realized on a cash basis. Acquisitions are moved into the same-property pool once we have owned the property for the entirety of the comparable periods and the property is not under significant development or redevelopment. The Company has also provided disclosure of NOI on a same-property basis adjusted to include redevelopment properties. Same-
5
property NOI may include other adjustments as detailed in the Reconciliation of Net Income to NOI and same-property NOI included in the tables accompanying this press release.
•EBITDAre and Adjusted EBITDAre: EBITDAre and Adjusted EBITDAre are supplemental, non-GAAP measures utilized by us in various financial ratios. The White Paper on EBITDAre, approved by Nareit's Board of Governors in September 2017, defines EBITDAre as net income (computed in accordance with GAAP), adjusted for interest expense, income tax (benefit) expense, depreciation and amortization, losses and gains on the disposition of depreciated property, impairment write-downs of depreciated property and investments in unconsolidated joint ventures, and adjustments to reflect the entity's share of EBITDAre of unconsolidated joint ventures. EBITDAre and Adjusted EBITDAre are presented to assist investors in the evaluation of REITs, as a measure of the Company's operational performance as they exclude various items that do not relate to or are not indicative of our operating performance and because they approximate key performance measures in our debt covenants. Accordingly, the Company believes that the use of EBITDAre and Adjusted EBITDAre, as opposed to income before income taxes, in various ratios provides meaningful performance measures related to the Company's ability to meet various coverage tests for the stated periods. Adjusted EBITDAre may include other adjustments not indicative of operating results as detailed in the Reconciliation of Net Income to EBITDAre and Adjusted EBITDAre included in the tables accompanying this press release. The Company also presents the ratio of net debt (net of cash) to annualized Adjusted EBITDAre as of December 31, 2024, and net debt (net of cash) to total market capitalization, which it believes is useful to investors as a supplemental measure in evaluating the Company's balance sheet leverage. The presentation of EBITDAre and Adjusted EBITDAre is consistent with EBITDA and Adjusted EBITDA as presented in prior periods.
The Company believes net income is the most directly comparable GAAP financial measure to the non-GAAP performance measures outlined above. Reconciliations of these measures to net income have been provided in the tables accompanying this press release.
Operating Metrics
The Company presents certain operating metrics related to our properties, including occupancy, leasing activity and rental rates. Operating metrics used by the Company are useful to investors in facilitating an understanding of the operational performance for our properties.
Recovery ratios represent the percentage of operating expenses recuperated through tenant reimbursements. This metric is presented on a same-property and same-property including redevelopment basis and is calculated by dividing tenant expense reimbursements (adjusted to exclude any ancillary income) by the sum of real estate taxes and property operating expenses.
Occupancy metrics represent the percentage of occupied gross leasable area based on executed leases (including properties in development and redevelopment) and include leases signed, but for which rent has not yet commenced. Same-property portfolio leased occupancy includes properties that have been owned and operated for the entirety of the reporting periods being compared, which total 65 properties for the quarters and years ended December 31, 2024 and 2023. Occupancy metrics presented for the Company's same-property portfolio exclude properties under development, redevelopment or that involve anchor repositioning where a substantial portion of the gross leasable area is taken out of service and also excludes properties acquired within the past 12 months or properties sold, and properties that are in the foreclosure process during the periods being compared.
Executed new leases, renewals and exercised options are presented on a same-space basis. Same-space leases represent those leases signed on spaces for which there was a previous lease.
The Company occasionally provides disclosures by tenant categories which include anchors, shops and industrial/self-storage. Anchors and shops are further broken down by local, regional, and national tenants. We define anchor tenants as those who have a leased area of >10,000 sf. Local tenants are defined as those with less than five locations. Regional tenants are those with five or more locations in a single region. National tenants are defined as those with five or more locations and operate in two or more regions.
6
Reconciliation of Net Income to FFO and FFO as Adjusted
The following table reflects the reconciliation of net income to FFO and FFO as Adjusted for the quarters and years ended December 31, 2024 and 2023. Net income is considered the most directly comparable GAAP measure. Refer to "Non-GAAP Financial Measures" on page 5 for a description of FFO and FFO as Adjusted.
Quarter Ended December 31,
Year Ended December 31,
(in thousands, except per share amounts)
2024
2023
2024
2023
Net income
$
31,506
$
231,919
$
75,442
$
259,876
Less net (income) loss attributable to noncontrolling interests in:
Operating partnership
(1,571)
(10,688)
(3,978)
(11,899)
Consolidated subsidiaries
186
4
1,099
520
Net income attributable to common shareholders
30,121
221,235
72,563
248,497
Adjustments:
Rental property depreciation and amortization
37,127
31,105
149,009
107,695
Limited partnership interests in operating partnership
1,571
10,688
3,978
11,899
Gain on sale of real estate
(23,469)
(217,352)
(38,818)
(217,708)
Real estate impairment loss(2)
—
—
—
34,055
FFO Applicable to diluted common shareholders
45,350
45,676
186,732
184,438
FFO per diluted common share(1)
0.35
0.37
1.48
1.51
Adjustments to FFO:
Transaction, severance and litigation expenses
248
315
1,402
2,039
Loss (gain) on extinguishment of debt(3)
4
1,396
(21,423)
(41,144)
Tax impact of Shops at Caguas debt refinancing
—
—
—
16,302
Impact of property in foreclosure(4)
—
1,139
2,276
3,060
Termination fees and non-cash adjustments(5)
(1,541)
(603)
848
(847)
Income tax refund related to prior periods
—
—
—
(684)
Tenant bankruptcy settlement income
—
(7)
(115)
(114)
Litigation settlement income
—
(10,000)
—
(10,000)
FFO as Adjusted applicable to diluted common shareholders
$
44,061
$
37,916
$
169,720
$
153,050
FFO as Adjusted per diluted common share(1)
$
0.34
$
0.31
$
1.35
$
1.25
Weighted Average diluted common shares(1)
129,701
122,063
126,095
122,064
(1) Weighted average diluted shares used to calculate FFO per share and FFO as Adjusted per share for the quarter ended December 31, 2023 and years ended December 31, 2024 and December 31, 2023 are higher than the GAAP weighted average diluted shares as a result of the dilutive impact of LTIP and OP units which may be redeemed for our common shares.
(2) During the year ended December 31, 2023, the Company recognized an impairment charge reducing the carrying value of Kingswood Center, an office and retail property located in Brooklyn, NY.
(3) The gain on extinguishment of debt for the year ended December 31, 2024 relates to the mortgage debt forgiven in the foreclosure settlement of Kingswood Center.
(4) In April 2023, the Company notified the lender of its mortgage secured by Kingswood Center that the cash flows generated by the property are insufficient to cover the debt service and that the Company is unwilling to fund future shortfalls. As such, the Company defaulted on the loan and adjusted for the default interest incurred for the second quarter of 2023. In the third quarter of 2023, the Company determined it was appropriate to exclude the operating results of Kingswood Center from FFO as Adjusted as the property was in the foreclosure process. In June of 2024, the foreclosure process was completed and the lender took possession of the property.
(5) Includes the acceleration and write-off of lease intangibles related to tenant bankruptcies and terminations, net of termination payments, and write-offs and reinstatements of receivables arising from the straight-lining of rents for tenants moved to and from the cash basis of accounting.
7
Reconciliation of Net Income to NOI and Same-Property NOI
The following table reflects the reconciliation of net income to NOI, same-property NOI and same-property NOI including properties in redevelopment for the quarters and years ended December 31, 2024 and 2023. Net income is considered the most directly comparable GAAP measure. Refer to "Non-GAAP Financial Measures" on page 5 for a description of NOI and same-property NOI.
Quarter Ended December 31,
Year Ended December 31,
(Amounts in thousands)
2024
2023
2024
2023
Net income
$
31,506
$
231,919
$
75,442
$
259,876
Depreciation and amortization
37,483
31,460
150,389
108,979
Interest and debt expense
19,583
22,515
81,587
74,945
General and administrative expense
9,645
9,167
37,474
37,070
Loss (gain) on extinguishment of debt
4
1,396
(21,423)
(41,144)
Real estate impairment loss
—
—
—
34,055
Income tax expense (benefit)
664
(10)
2,386
17,800
Interest income
(639)
(1,397)
(2,667)
(3,037)
Non-cash revenue and expenses
(4,825)
(3,837)
(11,999)
(11,610)
Other expense (income)
424
(9,775)
897
(9,097)
Gain on sale of real estate
(23,469)
(217,352)
(38,818)
(217,708)
NOI
70,376
64,086
273,268
250,129
Adjustments:
Sunrise Mall net operating loss
52
501
1,733
2,427
Tenant bankruptcy settlement income and lease termination income
(160)
(183)
(1,762)
(1,428)
Non-same property NOI and other(1)
(14,891)
(12,445)
(56,403)
(43,287)
Same-property NOI
$
55,377
$
51,959
$
216,836
$
207,841
NOI related to properties being redeveloped
5,681
4,902
22,668
20,017
Same-property NOI including properties in redevelopment
$
61,058
$
56,861
$
239,504
$
227,858
(1) Non-same property NOI includes NOI related to properties being redeveloped and properties acquired, disposed, or that are in the foreclosure process during the periods being compared.
8
Reconciliation of Net Income to EBITDAre and Adjusted EBITDAre
The following table reflects the reconciliation of net income to EBITDAre and Adjusted EBITDAre for the quarters and years ended December 31, 2024 and 2023. Net income is considered the most directly comparable GAAP measure. Refer to "Non-GAAP Financial Measures" on page 5 for a description of EBITDAre and Adjusted EBITDAre.
Quarter Ended December 31,
Year Ended December 31,
(Amounts in thousands)
2024
2023
2024
2023
Net income
$
31,506
$
231,919
$
75,442
$
259,876
Depreciation and amortization
37,483
31,460
150,389
108,979
Interest and debt expense
19,583
22,515
81,587
74,945
Income tax expense (benefit)
664
(10)
2,386
17,800
Gain on sale of real estate
(23,469)
(217,352)
(38,818)
(217,708)
Real estate impairment loss
—
—
—
34,055
EBITDAre
65,767
68,532
270,986
277,947
Adjustments for Adjusted EBITDAre:
Transaction, severance and litigation expenses
248
315
1,402
2,039
Loss (gain) on extinguishment of debt
4
1,396
(21,423)
(41,144)
Tenant bankruptcy settlement income
—
(7)
(115)
(114)
Impact of property in foreclosure(1)
—
(325)
(561)
(641)
Termination fees and non-cash adjustments(2)
(1,541)
(770)
1,295
(1,014)
Litigation settlement income
—
(10,000)
—
(10,000)
Adjusted EBITDAre
$
64,478
$
59,141
$
251,584
$
227,073
(1) Adjustment reflects the operating income for Kingswood Center, excluding interest and debt expense and depreciation and amortization expense that is already adjusted for the purposes of calculating EBITDAre. See footnote 4 on page 7 for additional information.
(2) Includes the acceleration and write-off of lease intangibles related to tenant bankruptcies and terminations, net of termination payments, and write-offs and reinstatements of receivables arising from the straight-lining of rents for tenants moved to and from the cash basis of accounting. The adjustment to EBITDAre in calculating Adjusted EBITDAre is inclusive of the portion attributable to the noncontrolling interest in Sunrise Mall.
9
ADDITIONAL INFORMATION
For a copy of the Company’s supplemental disclosure package, please access the "Investors" section of our website at www.uedge.com. Our website also includes other financial information, including our Annual Report on Form 10-K, Quarterly Reports on Form 10-Q, Current Reports on Form 8-K, and any amendments to those reports.
The Company uses, and intends to continue to use, the “Investors” page of its website, which can be found at www.uedge.com, as a means of disclosing material nonpublic information and of complying with its disclosure obligations under Regulation FD, including, without limitation, through the posting of investor presentations that may include material nonpublic information. Accordingly, investors should monitor the “Investors” page, in addition to following the Company's press releases, SEC filings, public conference calls, presentations and webcasts. The information contained on, or that may be accessed through, our website is not incorporated by reference into, and is not a part of, this document.
ABOUT URBAN EDGE
Urban Edge Properties is a NYSE listed real estate investment trust focused on owning, managing, acquiring, developing, and redeveloping retail real estate in urban communities, primarily in the Washington, D.C. to Boston corridor. Urban Edge owns 75 properties totaling 17.4 million square feet of gross leasable area.
FORWARD-LOOKING STATEMENTS
Certain statements contained herein constitute forward-looking statements as such term is defined in Section 27A of the Securities Act of 1933, as amended, and Section 21E of the Securities Exchange Act of 1934, as amended. Forward-looking statements are not guarantees of future performance. They represent our intentions, plans, expectations and beliefs and are subject to numerous assumptions, risks and uncertainties. Our future results, financial condition, business and targeted occupancy may differ materially from those expressed in these forward-looking statements. You can identify many of these statements by words such as “approximates,” “believes,” “expects,” “anticipates,” “estimates,” “intends,” “plans,” “would,” “may” or other similar expressions in this press release. Many of the factors that will determine the outcome of forward-looking statements are beyond our ability to control or predict and include, among others: (i) macroeconomic conditions, including geopolitical conditions and instability, which may lead to rising inflation and disruption of, or lack of access to, the capital markets, as well as potential volatility in the Company’s share price; (ii) the economic, political and social impact of, and uncertainty relating to, epidemics and pandemics; (iii) the loss or bankruptcy of major tenants; (iv) the ability and willingness of the Company’s tenants to renew their leases with the Company upon expiration and the Company’s ability to re-lease its properties on the same or better terms, or at all, in the event of non-renewal or in the event the Company exercises its right to replace an existing tenant; (v) the impact of e-commerce on our tenants’ business; (vi) the Company’s success in implementing its business strategy and its ability to identify, underwrite, finance, consummate and integrate diversifying acquisitions and investments; (vii) changes in general economic conditions or economic conditions in the markets in which the Company competes, and their effect on the Company’s revenues, earnings and funding sources, and on those of its tenants; (viii) increases in the Company’s borrowing costs as a result of changes in interest rates, rising inflation, and other factors; (ix) the Company’s ability to pay down, refinance, hedge, restructure or extend its indebtedness as it becomes due and potential limitations on the Company’s ability to borrow funds under its existing credit facility as a result of covenants relating to the Company’s financial results; (x) potentially higher costs associated with the Company’s development, redevelopment and anchor repositioning projects, and the Company’s ability to lease the properties at projected rates; (xi) the Company’s liability for environmental matters; (xii) damage to the Company’s properties from catastrophic weather and other natural events, and the physical effects of climate change; (xiii) the Company’s ability and willingness to maintain its qualification as a REIT in light of economic, market, legal, tax and other considerations; (xiv) information technology security breaches; (xv) the loss of key executives; and (xvi) the accuracy of methodologies and estimates regarding our environmental, social and governance (collectively, our Corporate Responsibility or “CR”) metrics, goals and targets, tenant willingness and ability to collaborate towards reporting CR metrics and meeting CR goals and targets, and the impact of governmental regulation on our CR efforts. For further discussion of factors that could materially affect the outcome of our forward-looking statements, see “Risk Factors” in Part I, Item 1A, of the Company's Annual Report on Form 10-K for the year ended December 31, 2024.
We claim the protection of the safe harbor for forward-looking statements contained in the Private Securities Litigation Reform Act of 1995 for any forward-looking statements included in this press release. You are cautioned not to place undue reliance on forward-looking statements, which speak only as of the date of this press release. All subsequent written and oral forward-looking statements attributable to us or any person acting on our behalf are expressly qualified in their entirety by the cautionary statements contained or referred to in this section. We do not undertake any obligation to release publicly any revisions to our forward-looking statements to reflect events or circumstances occurring after the date of this press release.
10
URBAN EDGE PROPERTIES
ADDITIONAL DISCLOSURES
As of December 31, 2024
Basis of Presentation
The information contained in the Supplemental Disclosure Package does not purport to disclose all items required by GAAP and is unaudited. This Supplemental Disclosure Package should be read in conjunction with the Company's Annual Report on Form 10-K for the year ended December 31, 2024. The results of operations of any property acquired are included in the Company's financial statements since the date of acquisition, although such properties may be excluded from certain metrics disclosed in this Supplemental Disclosure Package.
Non-GAAP Financial Measures and Forward-Looking Statements
For additional information regarding non-GAAP financial measures and forward-looking statements, please see pages 5 and 10 of this Supplemental Disclosure Package.
11
URBAN EDGE PROPERTIES
SUMMARY FINANCIAL RESULTS AND RATIOS
For the quarter and year ended December 31, 2024
(in thousands, except per share, sf, rent psf and financial ratio data)
Quarter ended
Year ended
Summary Financial Results
December 31, 2024
December 31, 2024
Total revenue
$
116,367
$
444,966
General & administrative expenses (G&A)
$
9,645
$
37,474
Recurring G&A(1)
$
9,397
$
36,072
Net income attributable to common shareholders
$
30,121
$
72,563
Earnings per diluted share
$
0.24
$
0.60
Adjusted EBITDAre(2)
$
64,478
$
251,584
Funds from operations (FFO)
$
45,350
$
186,732
FFO per diluted common share
$
0.35
$
1.48
FFO as Adjusted
$
44,061
$
169,720
FFO as Adjusted per diluted common share
$
0.34
$
1.35
Total dividends paid per share
$
0.17
$
0.68
Stock closing price low-high range (NYSE)
$20.94 to $23.60
$15.93 to $23.60
Weighted average diluted shares used in EPS computations(3)
129,701
121,432
Weighted average diluted common shares used in FFO computations(3)
129,701
126,095
Summary Property, Operating and Financial Data
# of Total properties / # of Retail properties
75 / 74
Gross leasable area (GLA) sf - retail portfolio(4)(5)
16,064,000
Weighted average annual rent psf - retail portfolio(4)(5)
$
20.79
Consolidated portfolio leased occupancy at end of period(6)
91.7
%
Consolidated retail portfolio leased occupancy at end of period(5)
96.8
%
Same-property portfolio leased occupancy at end of period(7)
96.6
%
Same-property physical occupancy at end of period(7)(8)
94.3
%
Same-property NOI growth(7)
6.6
%
4.3
%
Same-property NOI growth, including redevelopment properties
7.4
%
5.1
%
NOI margin(9)
63.8
%
64.3
%
Same-property expense recovery ratio(10)
83.7
%
83.5
%
Same-property, including redevelopment, expense recovery ratio(10)
81.5
%
81.8
%
New, renewal and option rent spread - cash basis(11)
20.8
%
12.5
%
New, renewal and option rent spread - GAAP basis(11)
26.7
%
18.2
%
Net debt to total market capitalization(12)
34.5
%
34.5
%
Net debt to Adjusted EBITDAre(12)
6.0
x
6.1
x
Adjusted EBITDAre to interest expense(2)
3.5
x
3.3
x
Adjusted EBITDAre to fixed charges(2)
2.9
x
2.7
x
(1) Recurring G&A for the quarter and year ended December 31, 2024 excludes $0.2 million and $1.4 million of transaction, severance and litigation expenses, respectively.
(2) See computation on page 16.
(3) Weighted average diluted shares used to calculate FFO per share and FFO as Adjusted per share for the year ended December 31, 2024 are higher than the GAAP weighted average diluted shares as a result of the dilutive impact of LTIP and OP units which may be redeemed for our common shares.
(4) GLA - retail portfolio excludes 1.2 million square feet for Sunrise Mall and 58,000 square feet of self-storage.
(5) Our retail portfolio includes shopping centers and malls (excluding Sunrise Mall) and excludes self-storage.
(6) Excluding Sunrise Mall, consolidated portfolio leased occupancy was 96.8%.
(7) See "Non-GAAP Financial Measures" on page 5 for the definition of same-property and same-property including redevelopment.
(8) Physical occupancy includes tenants that have access to their leased space and includes dark and paying tenants.
(9) Excludes the impact of Sunrise Mall. Including Sunrise Mall, NOI margin for the quarter and year ended December 31, 2024 is 63.2%.
(10) Excluding internal management fee expense, same-property recovery ratios for the quarter and year ended December 31, 2024 are 89.1% and 88.9%, respectively (86.6% and 87.1% including properties in redevelopment). Excluding the impact of outlet centers and malls, same-property recovery ratios for the quarter and year ended December 31, 2024 are 88.2% and 87.7%, respectively (86.6% and 86.4% including properties in redevelopment).
(11) See computation on page 21.
(12) See computation for the quarter ended December 31, 2024 on page 18. Net debt to annualized Adjusted EBITDAre was 6.0x and 6.2x for the quarter and year ended December 31, 2024, respectively, excluding non-recurring lease termination income of $0.2 million and $1.6 million, respectively.
12
URBAN EDGE PROPERTIES
CONSOLIDATED BALANCE SHEETS
As of December 31, 2024 and 2023
(in thousands, except share and per share amounts)
December 31,
December 31,
2024
2023
ASSETS
Real estate, at cost:
Land
$
660,198
$
635,905
Buildings and improvements
2,791,728
2,678,076
Construction in progress
289,057
262,275
Furniture, fixtures and equipment
11,296
9,923
Total
3,752,279
3,586,179
Accumulated depreciation and amortization
(886,886)
(819,243)
Real estate, net
2,865,393
2,766,936
Operating lease right-of-use assets
65,491
56,988
Cash and cash equivalents
41,373
101,123
Restricted cash
49,267
73,125
Tenant and other receivables
20,672
14,712
Receivables arising from the straight-lining of rents
61,164
60,775
Identified intangible assets, net of accumulated amortization of $65,027 and $51,399, respectively
109,827
113,897
Deferred leasing costs, net of accumulated amortization of $22,488 and $21,428, respectively
27,799
27,698
Prepaid expenses and other assets
70,554
64,555
Total assets
$
3,311,540
$
3,279,809
LIABILITIES AND EQUITY
Liabilities:
Mortgages payable, net
$
1,569,753
$
1,578,110
Unsecured credit facility
50,000
153,000
Operating lease liabilities
62,585
53,863
Accounts payable, accrued expenses and other liabilities
89,982
102,997
Identified intangible liabilities, net of accumulated amortization of $50,275 and $46,610, respectively
177,496
170,411
Total liabilities
1,949,816
2,058,381
Commitments and contingencies
Shareholders’ equity:
Common shares: $0.01 par value; 500,000,000 shares authorized and 125,450,684 and 117,652,656 shares issued and outstanding, respectively
1,253
1,175
Additional paid-in capital
1,149,981
1,011,942
Accumulated other comprehensive income
177
460
Accumulated earnings
126,670
137,113
Noncontrolling interests:
Operating partnership
65,069
55,355
Consolidated subsidiaries
18,574
15,383
Total equity
1,361,724
1,221,428
Total liabilities and equity
$
3,311,540
$
3,279,809
13
URBAN EDGE PROPERTIES
CONSOLIDATED STATEMENTS OF INCOME
For the quarters and years ended December 31, 2024 and 2023
(in thousands, except per share amounts)
Quarter Ended December 31,
Year Ended December 31,
2024
2023
2024
2023
REVENUE
Rental revenue
$
116,298
$
106,253
$
444,465
$
406,112
Other income
69
10,329
501
10,810
Total revenue
116,367
116,582
444,966
416,922
EXPENSES
Depreciation and amortization
37,483
31,460
150,389
108,979
Real estate taxes
16,509
16,909
68,651
64,889
Property operating
21,588
18,811
78,776
68,563
General and administrative
9,645
9,167
37,474
37,070
Real estate impairment loss
—
—
—
34,055
Lease expense
3,493
3,164
13,169
12,634
Total expenses
88,718
79,511
348,459
326,190
Gain on sale of real estate
23,469
217,352
38,818
217,708
Interest income
639
1,397
2,667
3,037
Interest and debt expense
(19,583)
(22,515)
(81,587)
(74,945)
(Loss) gain on extinguishment of debt
(4)
(1,396)
21,423
41,144
Income before income taxes
32,170
231,909
77,828
277,676
Income tax (expense) benefit
(664)
10
(2,386)
(17,800)
Net income
31,506
231,919
75,442
259,876
Less net (income) loss attributable to noncontrolling interests in:
Operating partnership
(1,571)
(10,688)
(3,978)
(11,899)
Consolidated subsidiaries
186
4
1,099
520
Net income attributable to common shareholders
$
30,121
$
221,235
$
72,563
$
248,497
Earnings per common share - Basic:
$
0.24
$
1.88
$
0.60
$
2.11
Earnings per common share - Diluted:
$
0.24
$
1.88
$
0.60
$
2.11
Weighted average shares outstanding - Basic
124,945
117,548
121,324
117,506
Weighted average shares outstanding - Diluted
129,701
117,641
121,432
117,597
14
URBAN EDGE PROPERTIES
SUPPLEMENTAL SCHEDULE OF NET OPERATING INCOME
For the quarters and years ended December 31, 2024 and 2023
(in thousands)
Quarter Ended December 31,
Percent Change
Year Ended December 31,
Percent Change
2024
2023
2024
2023
Composition of NOI(1)
Property rentals
$
80,793
$
76,054
$315,018
$
293,018
Tenant expense reimbursements
31,170
26,928
118,654
104,321
Rental revenue deemed uncollectible
(521)
(317)
(1,151)
(2,370)
Total property revenue
111,442
102,665
8.5%
432,521
394,969
9.5%
Real estate taxes
(16,509)
(16,908)
(68,650)
(64,887)
Property operating
(21,953)
(19,296)
(80,586)
(70,477)
Lease expense
(2,604)
(2,375)
(10,017)
(9,476)
Total property operating expenses
(41,066)
(38,579)
6.4%
(159,253)
(144,840)
10.0%
NOI(1)
$
70,376
$
64,086
9.8%
$
273,268
$
250,129
9.3%
NOI margin (NOI / Total property revenue)
63.2
%
62.4
%
63.2
%
63.3
%
Same-property NOI(1)(2)
Property rentals
$
63,059
$
59,950
$
245,956
$
237,153
Tenant expense reimbursements
24,878
22,125
95,592
88,495
Rental revenue deemed uncollectible
(699)
(161)
(1,110)
(1,098)
Total property revenue
87,238
81,914
340,438
324,550
Real estate taxes
(13,258)
(12,927)
(53,770)
(52,243)
Property operating
(16,381)
(14,419)
(60,408)
(54,084)
Lease expense
(2,222)
(2,609)
(9,424)
(10,382)
Total property operating expenses
(31,861)
(29,955)
(123,602)
(116,709)
Same-property NOI(1)(2)
$
55,377
$
51,959
6.6%
$
216,836
$
207,841
4.3%
NOI related to properties being redeveloped(2)
5,681
4,902
22,668
20,017
Same-property NOI including properties in redevelopment(1)
$
61,058
$
56,861
7.4%
$
239,504
$
227,858
5.1%
Same-property physical occupancy
94.3
%
92.5
%
94.3
%
92.5
%
Same-property leased occupancy
96.6
%
95.8
%
96.6
%
95.8
%
Number of properties included in same-property analysis
65
65
(1) NOI excludes non-cash revenue and expenses and includes lease termination income which is adjusted out for the purposes of calculating same-property NOI. Refer to page 8 for a reconciliation of net income to NOI and same-property NOI.
(2) Excludes NOI related to properties acquired, disposed, or that are in the foreclosure process in the comparative periods, and Sunrise Mall.
15
URBAN EDGE PROPERTIES
EARNINGS BEFORE INTEREST, TAXES, DEPRECIATION and AMORTIZATION for REAL ESTATE (EBITDAre)
For the quarters and years ended December 31, 2024 and 2023
(in thousands)
Quarter Ended December 31,
Year Ended December 31,
2024
2023
2024
2023
Net income
$
31,506
$
231,919
$
75,442
$
259,876
Depreciation and amortization
37,483
31,460
150,389
108,979
Interest expense
18,448
21,469
77,265
70,820
Amortization of deferred financing costs
1,135
1,046
4,322
4,125
Income tax expense (benefit)
664
(10)
2,386
17,800
Gain on sale of real estate
(23,469)
(217,352)
(38,818)
(217,708)
Real estate impairment loss
—
—
—
34,055
EBITDAre
65,767
68,532
270,986
277,947
Adjustments for Adjusted EBITDAre:
Transaction, severance and litigation expenses
248
315
1,402
2,039
Loss (gain) on extinguishment of debt
4
1,396
(21,423)
(41,144)
Tenant bankruptcy settlement income
—
(7)
(115)
(114)
Impact of property in foreclosure(1)
—
(325)
(561)
(641)
Termination fees and non-cash adjustments(2)
(1,541)
(770)
1,295
(1,014)
Litigation settlement income
—
(10,000)
—
(10,000)
Adjusted EBITDAre
$
64,478
$
59,141
$
251,584
$
227,073
Interest expense
$
18,448
$
21,469
$
77,265
$
70,820
Adjusted EBITDAre to interest expense
3.5
x
2.8
x
3.3
x
3.2
x
Fixed charges
Interest expense
$
18,448
$
21,469
$
77,265
$
70,820
Scheduled principal amortization
3,838
4,250
14,528
19,724
Total fixed charges
$
22,286
$
25,719
$
91,793
$
90,544
Adjusted EBITDAre to fixed charges
2.9
x
2.3
x
2.7
x
2.5
x
(1) Adjustment reflects the operating income for Kingswood Center for the year ended December 31, 2024, excluding $2.8 million of interest and debt expense and $0.8 million of depreciation and amortization expense, which is already adjusted for the purposes of calculating EBITDAre. See footnote 4 on page 7 for additional information.
(2) Includes the acceleration and write-off of lease intangibles related to tenant bankruptcies and terminations, net of termination payments, and write-offs and reinstatements of receivables arising from the straight-lining of rents for tenants moved to and from the cash basis of accounting. The adjustment to EBITDAre in calculating Adjusted EBITDAre is inclusive of the portion attributable to the noncontrolling interest in Sunrise Mall.
16
URBAN EDGE PROPERTIES
FUNDS FROM OPERATIONS
For the quarter and year ended December 31, 2024
(in thousands, except per share amounts)
Quarter Ended
December 31, 2024
Year Ended
December 31, 2024
(in thousands)
(per share)(1)
(in thousands)
(per share)(1)
Net income
$
31,506
$
0.24
$
75,442
$
0.60
Less net (income) loss attributable to noncontrolling interests in:
Operating partnership
(1,571)
(0.01)
(3,978)
(0.03)
Consolidated subsidiaries
186
—
1,099
0.01
Net income attributable to common shareholders
30,121
0.23
72,563
0.58
Adjustments:
Rental property depreciation and amortization
37,127
0.29
149,009
1.18
Limited partnership interests in operating partnership(2)
1,571
0.01
3,978
0.03
Gain on sale of real estate
(23,469)
(0.18)
(38,818)
(0.31)
FFO applicable to diluted common shareholders
45,350
0.35
186,732
1.48
Adjustments to FFO:
Transaction, severance and litigation expenses
248
—
1,402
0.01
Loss (gain) on extinguishment of debt(3)
4
—
(21,423)
(0.17)
Impact of property in foreclosure(4)
—
—
2,276
0.02
Non-cash adjustments(5)
(1,541)
(0.01)
848
0.01
Tenant bankruptcy settlement income
—
—
(115)
—
FFO as Adjusted applicable to diluted common shareholders
$
44,061
$
0.34
$
169,720
$
1.35
Weighted average diluted shares used to calculate EPS
129,701
121,432
Assumed conversion of OP and LTIP Units to common shares
—
4,663
Weighted average diluted common shares - FFO
129,701
126,095
(1) Individual items may not add up due to total rounding.
(2) Represents earnings allocated to LTIP and OP unitholders for unissued common shares, which have been excluded for purposes of calculating earnings per diluted share for the periods presented because they are anti-dilutive.
(3) The gain on extinguishment of debt for the year ended December 31, 2024 relates to the mortgage debt forgiven in the foreclosure settlement of Kingswood Center.
(4) In April 2023, the Company notified the lender of its mortgage secured by Kingswood Center that the cash flows generated by the property are insufficient to cover the debt service and that the Company is unwilling to fund future shortfalls. As such, the Company defaulted on the loan and adjusted for the default interest incurred for the second quarter of 2023. In the third quarter of 2023, the Company determined it was appropriate to exclude the operating results of Kingswood Center from FFO as Adjusted as the property was in the foreclosure process. In June of 2024, the foreclosure process was completed and the lender took possession of the property.
(5) Includes the acceleration and write-off of lease intangibles related to tenant terminations and bankruptcies and write-offs and reinstatements of receivables arising from the straight-lining of rents for tenants moved to and from the cash basis of accounting.
17
URBAN EDGE PROPERTIES
MARKET CAPITALIZATION, DEBT RATIOS AND LIQUIDITY
As of December 31, 2024
(in thousands, except share amounts and market price)
December 31, 2024
Closing market price of common shares
$
21.50
Basic common shares
125,450,684
OP and LTIP units
6,386,837
Diluted common shares
131,837,521
Equity market capitalization
$
2,834,507
Total consolidated debt(1)
$
1,633,820
Cash and cash equivalents including restricted cash
(90,640)
Net debt
$
1,543,180
Net Debt to annualized Adjusted EBITDAre(2)
6.0
x
Total consolidated debt(1)
$
1,633,820
Equity market capitalization
2,834,507
Total market capitalization
$
4,468,327
Net debt to total market capitalization at applicable market price
34.5
%
Cash and cash equivalents including restricted cash
$
90,640
Available under unsecured credit facility(3)
717,865
Total liquidity
$
808,505
(1) Total consolidated debt excludes unamortized debt issuance costs of $14.1 million.
(2) Net debt to Adjusted EBITDAre is calculated based on fourth quarter 2024 annualized Adjusted EBITDAre.
(3) Availability is net of letters of credit issued. As of December 31, 2024, the Company had obtained seven letters of credit aggregating $32.1 million which were provided to mortgage lenders and other entities to secure its obligations for certain capital requirements. As of December 31, 2024, the Company had $50 million of outstanding borrowings under the unsecured line of credit.
18
URBAN EDGE PROPERTIES
ADDITIONAL DISCLOSURES
(in thousands)
Quarter Ended December 31,
Year Ended December 31,
Rental revenue:
2024
2023
2024
2023
Property rentals
$
85,699
$
79,945
$
327,123
$
304,772
Tenant expense reimbursements
31,120
26,625
118,493
103,709
Rental revenue deemed uncollectible
(521)
(317)
(1,151)
(2,369)
Total rental revenue
$
116,298
$
106,253
$
444,465
$
406,112
Quarter Ended December 31,
Year Ended December 31,
Composition of Property Rentals:
2024
2023
2024
2023
Minimum rent
$
79,351
$
74,595
$
309,652
$
287,952
Non-cash revenues(1)
4,906
3,898
12,221
11,868
Percentage rent
1,282
1,275
3,604
3,638
Lease termination income(1)
160
177
1,646
1,314
Total property rentals
$
85,699
$
79,945
$
327,123
$
304,772
Quarter Ended December 31,
Year Ended December 31,
Certain Non-Cash Items:
2024
2023
2024
2023
Straight-line rents(2)
$
163
$
901
$
2,552
$
3,687
Amortization of below-market lease intangibles, net(2)
4,743
2,997
9,669
8,181
Lease expense GAAP adjustments(3)
(81)
(60)
(223)
(258)
Amortization of deferred financing costs(4)
(1,135)
(1,046)
(4,322)
(4,125)
Capitalized interest(4)
2,853
2,830
10,553
11,209
Share-based compensation expense(5)
(2,852)
(1,788)
(10,431)
(7,811)
Capital Expenditures:(6)
Development and redevelopment costs
$
33,566
$
19,537
$
78,230
$
83,397
Maintenance capital expenditures
9,811
10,257
26,650
27,487
Leasing commissions
1,090
1,432
5,074
4,741
Tenant improvements and allowances
1,075
1,376
5,222
4,840
Total capital expenditures
$
45,542
$
32,602
$
115,176
$
120,465
Tenant and Other Receivables:
As of December 31, 2024
Tenant and other receivables billed
$
26,325
Revenue deemed uncollectible
(5,653)
Tenant and other receivables deemed collectible
$
20,672
(1) Amounts are excluded from the calculation of NOI and same-property NOI with the exception of lease termination income which is included in portfolio NOI and excluded from the calculation of same-property NOI. See page 8 for a reconciliation of net income to NOI and same-property NOI.
(2) Amounts included in the financial statement line item "Rental revenue" on the consolidated statements of income.
(3) Amounts consist of amortization of below-market ground lease intangibles and straight-line lease expense, and are included in the financial statement line item "Lease expense" on the consolidated statements of income.
(4) Amounts included in the financial statement line item "Interest and debt expense" on the consolidated statements of income.
(5) Amounts included in the financial statement line item "General and administrative" on the consolidated statements of income.
(6) Amounts presented on a cash basis.
19
URBAN EDGE PROPERTIES
TENANT CONCENTRATION - TOP TWENTY-FIVE TENANTS
As of December 31, 2024
Tenant
Number of stores
Square feet
% of total square feet
Annualized base rent ("ABR")
% of total ABR
Weighted average ABR per square foot
Average remaining term of ABR(1)
The TJX Companies(2)
28
873,159
5.0%
$
18,373,109
5.6%
$
21.04
4.1
Walmart
6
872,522
5.0%
9,989,075
3.1%
11.45
8.1
Kohl's
9
855,561
4.9%
9,648,520
3.0%
11.28
5.6
Best Buy
9
409,641
2.4%
9,533,005
2.9%
23.27
5.3
Lowe's Companies
6
976,415
5.6%
8,946,256
2.7%
9.16
4.9
The Home Depot
5
538,742
3.1%
8,925,418
2.7%
16.57
11.5
Burlington
9
468,606
2.7%
8,548,539
2.6%
18.24
4.9
PetSmart
12
278,451
1.6%
7,418,818
2.3%
26.64
4.1
ShopRite
5
361,053
2.1%
6,826,508
2.1%
18.91
10.0
BJ's Wholesale Club
4
454,297
2.6%
6,182,571
1.9%
13.61
5.3
LA Fitness
7
337,334
2.0%
5,784,897
1.8%
17.15
5.5
The Gap(3)
14
208,937
1.2%
5,717,296
1.8%
27.36
4.3
Dick's Sporting Goods(4)
7
278,683
1.6%
5,666,353
1.7%
20.33
2.2
Target Corporation
4
476,146
2.8%
5,565,180
1.7%
11.69
7.9
Amazon(5)
3
145,279
0.8%
5,036,444
1.5%
34.67
6.1
Ahold Delhaize (Stop & Shop)
3
212,216
1.2%
3,952,820
1.2%
18.63
5.9
Bob's Discount Furniture
5
202,172
1.2%
3,860,671
1.2%
19.10
4.8
Nordstrom
3
106,720
0.6%
3,476,434
1.1%
32.58
6.9
AMC
1
85,000
0.5%
3,267,502
1.0%
38.44
5.0
Ulta
8
83,679
0.5%
3,070,549
0.9%
36.69
4.2
24 Hour Fitness
1
53,750
0.3%
2,700,000
0.8%
50.23
7.0
Five Below
10
93,578
0.5%
2,674,129
0.8%
28.58
5.2
Staples
6
128,355
0.7%
2,637,951
0.8%
20.55
1.9
DSW
6
117,766
0.7%
2,590,693
0.8%
22.00
5.1
Anthropologie
1
31,450
0.2%
2,531,725
0.8%
80.50
3.8
Total/Weighted Average
172
8,649,512
49.8%
$
152,924,463
46.8%
$
17.68
5.7
(1) In years excluding tenant renewal options. The weighted average is based on ABR.
(2) Includes Marshalls (16), T.J. Maxx (5), HomeGoods (3), HomeSense (3), and Sierra Trading Post (1).
(3) Includes Old Navy (10), Gap (3) and Banana Republic (1).
(4) Includes Dick's Sporting Goods (4), Golf Galaxy (2), and Public Lands (1).
(5) Includes Whole Foods (2) and Amazon Fresh (1).
Note: Amounts shown in the table above include all retail properties, including those in redevelopment. Amounts are presented on a cash basis other than tenants in free rent periods which are shown at their initial cash rent. The table excludes executed leases that have not yet rent commenced.
20
URBAN EDGE PROPERTIES
LEASING ACTIVITY
For the quarter and year ended December 31, 2024
Quarter Ended
December 31, 2024
Year Ended December 31, 2024
Year Ended December 31, 2023
GAAP(2)
Cash(1)
GAAP(2)
Cash(1)
GAAP(2)
Cash(1)
New leases
Number of new leases executed
16
16
79
79
64
64
Total square feet
123,429
123,429
485,153
485,153
486,201
486,201
Number of same space leases
13
13
55
55
49
49
Same space square feet
117,036
117,036
334,972
334,972
418,322
418,322
Prior rent per square foot
$
17.51
$
18.66
$
21.28
$
22.23
$
21.32
$
22.43
New rent per square foot
$
29.12
$
26.95
$
31.34
$
27.95
$
29.64
$
27.86
Same space weighted average lease term (years)
10.6
10.6
12.3
12.3
9.7
9.7
Same space TIs per square foot
N/A
$
42.37
N/A
$
30.27
N/A
$
26.12
Rent spread
66.3
%
44.4
%
47.3
%
25.7
%
39.0
%
24.2
%
Renewals & Options
Number of leases executed
13
13
86
86
110
110
Total square feet
278,757
278,757
1,910,688
1,910,688
1,519,738
1,519,738
Number of same space leases
13
13
84
84
110
110
Same space square feet
278,757
278,757
1,682,610
1,682,610
1,519,738
1,519,738
Prior rent per square foot
$
21.19
$
21.19
$
17.90
$
17.94
$
22.10
$
22.10
New rent per square foot
$
23.94
$
23.75
$
19.92
$
19.60
$
24.35
$
23.95
Same space weighted average lease term (years)
5.1
5.1
5.6
5.6
5.8
5.8
Same space TIs per square foot
N/A
$
—
N/A
$
0.10
N/A
$
3.07
Rent spread
13.0
%
12.1
%
11.3
%
9.3
%
10.2
%
8.4
%
Total New Leases and Renewals & Options
Number of leases executed
29
29
165
165
174
174
Total square feet
402,186
402,186
2,395,841
2,395,841
2,005,939
2,005,939
Number of same space leases
26
26
139
139
159
159
Same space square feet
395,793
395,793
2,017,582
2,017,582
1,938,060
1,938,060
Prior rent per square foot
$
20.10
$
20.44
$
18.46
$
18.65
$
21.93
$
22.17
New rent per square foot
$
25.47
$
24.69
$
21.82
$
20.98
$
25.49
$
24.80
Same space weighted average lease term (years)
6.7
6.7
6.7
6.7
6.6
6.6
Same space TIs per square foot
N/A
$
12.53
N/A
$
5.11
N/A
$
8.05
Rent spread
26.7
%
20.8
%
18.2
%
12.5
%
16.2
%
11.9
%
(1) Rents are not calculated on a straight-line (GAAP) basis. Previous/expiring rent is the rent at expiry. New rent is the rent paid at commencement.
(2) Rents are calculated on a straight-line (GAAP) basis.
21
URBAN EDGE PROPERTIES
LEASES EXECUTED BUT NOT YET RENT COMMENCED
As of December 31, 2024
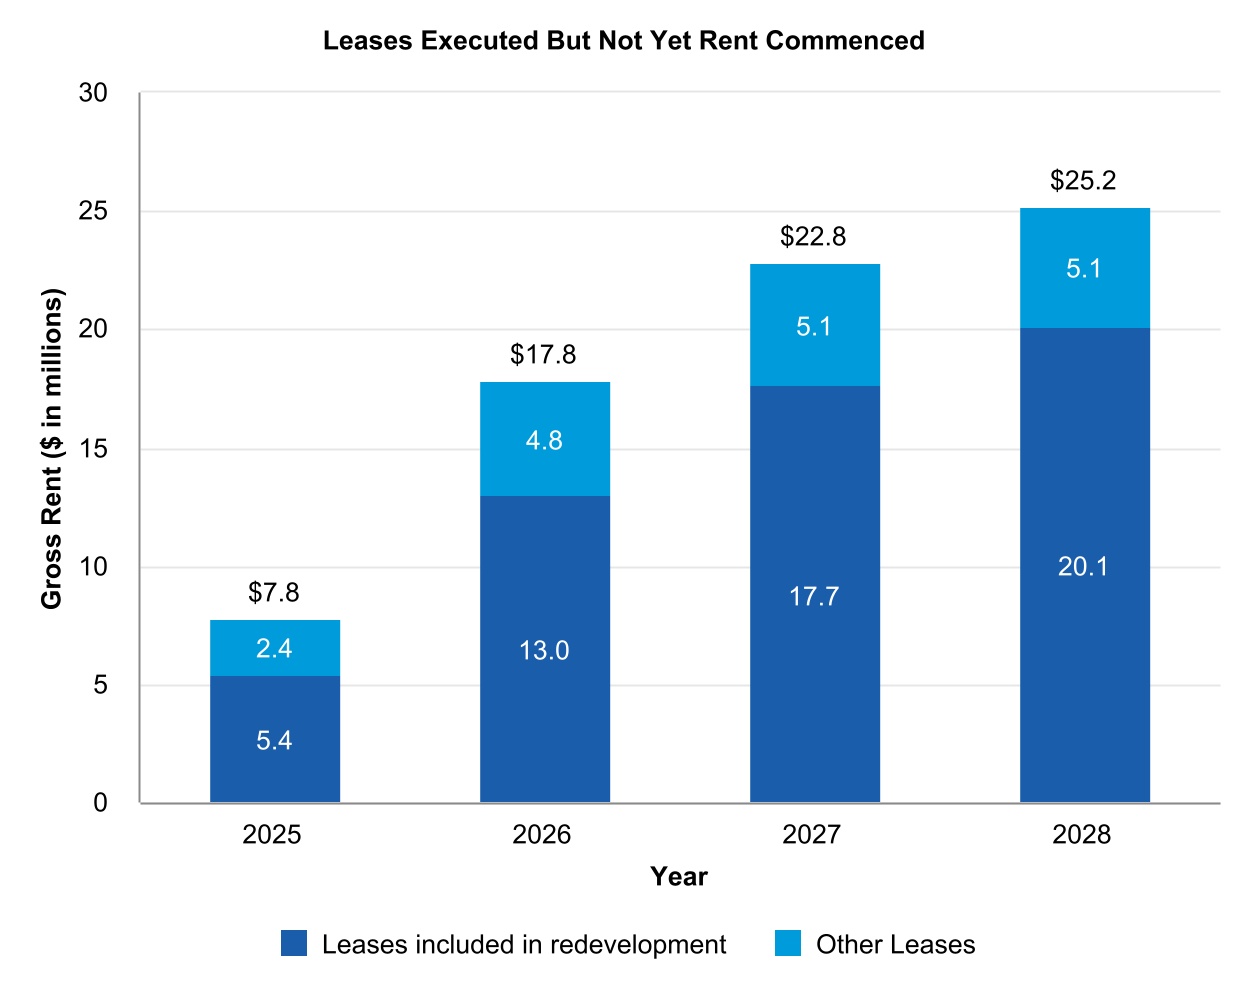
The Company has signed leases that have not yet rent commenced that are expected to generate an additional $25.2 million of future annual gross rent, representing approximately 9% of NOI generated for the year ended December 31, 2024. Approximately $20.1 million of this amount pertains to leases included in Active Development, Redevelopment and Anchor Repositioning Projects on page 29. National and regional tenants represent approximately 90% of the leased but not yet rent commenced pipeline. The below table illustrates the incremental gross rent expected to be recognized in the next four years, in the respective periods, from commencement of these leases.
Gross rents illustrated in the table above and their impact on same-property metrics in the respective years, based on the full year 2024 property pools, are as follows:
(in thousands)
2025
2026
2027
2028
Same-property
$
6,100
$
13,100
$
14,100
$
14,100
The below table summarizes the changes in annualized gross rent from leases executed but not yet rent commenced since September 30, 2024:
(in thousands)
Annualized Gross Rent
Leases executed but not yet rent commenced as of September 30, 2024
$
23,800
Less: Leases commenced during the fourth quarter
(2,100)
Plus: Leases executed during the fourth quarter
3,500
Leases executed but not yet rent commenced as of December 31, 2024
$
25,200
22
URBAN EDGE PROPERTIES
RETAIL PORTFOLIO LEASE EXPIRATION SCHEDULE
As of December 31, 2024
ANCHOR TENANTS (SF>=10,000)
SHOP TENANTS (SF<10,000)
TOTAL TENANTS
Year(1)
# of leases
Square Feet
% of Total SF
Weighted Avg ABR PSF(2)
# of leases
Square Feet
% of Total SF
Weighted Avg ABR PSF(2)
# of leases
Square Feet
% of Total SF
Weighted Avg ABR PSF(2)
M-T-M
2
86,000
0.6%
$
6.99
36
99,000
3.5%
$
26.25
38
185,000
1.2%
$
17.30
2025
11
371,000
2.8%
16.60
65
178,000
6.3%
39.16
76
549,000
3.4%
23.92
2026
23
744,000
5.6%
20.48
102
311,000
11.0%
40.17
125
1,055,000
6.6%
26.29
2027
29
1,035,000
7.8%
13.11
112
339,000
12.0%
37.15
141
1,374,000
8.6%
19.04
2028
28
945,000
7.1%
20.69
80
275,000
9.7%
42.31
108
1,220,000
7.6%
25.57
2029
61
2,507,000
18.9%
21.24
99
333,000
11.8%
43.31
160
2,840,000
17.7%
23.83
2030
41
2,178,000
16.5%
12.05
50
194,000
6.9%
42.48
91
2,372,000
14.8%
14.54
2031
20
1,267,000
9.6%
13.88
37
136,000
4.8%
34.23
57
1,403,000
8.7%
15.85
2032
11
331,000
2.5%
16.89
48
161,000
5.7%
35.02
59
492,000
3.1%
22.82
2033
22
722,000
5.5%
18.78
39
137,000
4.8%
39.19
61
859,000
5.3%
22.03
2034
21
857,000
6.5%
18.74
46
165,000
5.8%
38.32
67
1,022,000
6.4%
21.90
2035
14
696,000
5.3%
18.63
34
135,000
4.8%
35.16
48
831,000
5.2%
21.31
Thereafter
23
1,240,000
9.3%
18.60
25
107,000
3.8%
38.37
48
1,347,000
8.2%
20.17
Subtotal/Average
306
12,979,000
98.0%
$
17.22
773
2,570,000
90.9%
$
38.82
1,079
15,549,000
96.8%
$
20.79
Vacant
12
259,000
2.0%
N/A
101
256,000
9.1%
N/A
113
515,000
3.2%
N/A
Total/Average
318
13,238,000
100.0%
N/A
874
2,826,000
100.0%
N/A
1,192
16,064,000
100.0%
N/A
(1) Year of expiration excludes tenant renewal options.
(2) Weighted average annual base rent per square foot is calculated by annualizing tenants' base cash rent, including ground rent, and excludes tenant reimbursements and concessions and storage rent.
Note: Amounts shown in the table above include both current leases and signed leases that have not commenced on vacant spaces for all retail properties (excludes Sunrise Mall and includes properties in redevelopment) and excludes 58,000 sf of self-storage space.
23
URBAN EDGE PROPERTIES
RETAIL PORTFOLIO LEASE EXPIRATION SCHEDULE ASSUMING EXERCISE OF ALL OPTIONS
As of December 31, 2024
ANCHOR TENANTS (SF>=10,000)
SHOP TENANTS (SF<10,000)
TOTAL TENANTS
Year(1)
# of leases
Square Feet
% of Total SF
Weighted Avg ABR PSF(2)
# of leases
Square Feet
% of Total SF
Weighted Avg ABR PSF(2)
# of leases
Square Feet
% of Total SF
Weighted Avg ABR PSF(2)
M-T-M
2
86,000
0.6%
$
6.99
36
99,000
3.5%
$
26.25
38
185,000
1.2%
$
17.30
2025
9
234,000
1.8%
19.55
45
116,000
4.1%
43.37
54
350,000
2.2%
27.44
2026
6
110,000
0.8%
23.82
63
159,000
5.6%
46.85
69
269,000
1.7%
37.43
2027
3
34,000
0.3%
19.58
61
125,000
4.4%
42.92
64
159,000
1.0%
37.93
2028
4
212,000
1.6%
19.67
44
131,000
4.6%
42.47
48
343,000
2.1%
28.38
2029
15
423,000
3.2%
19.38
49
144,000
5.1%
45.97
64
567,000
3.5%
26.13
2030
9
236,000
1.8%
20.91
32
109,000
3.9%
42.43
41
345,000
2.1%
27.71
2031
8
251,000
1.9%
22.63
35
106,000
3.8%
41.20
43
357,000
2.2%
28.15
2032
7
264,000
2.0%
18.96
37
120,000
4.2%
38.66
44
384,000
2.4%
25.12
2033
16
455,000
3.4%
29.76
27
88,000
3.1%
55.95
43
543,000
3.4%
34.01
2034
19
578,000
4.4%
22.54
46
169,000
6.0%
43.41
65
747,000
4.7%
27.26
2035
11
258,000
1.9%
20.76
26
98,000
3.5%
44.86
37
356,000
2.2%
27.39
Thereafter
197
9,838,000
74.3%
23.38
272
1,106,000
39.1%
49.07
469
10,944,000
68.1%
25.98
Subtotal/Average
306
12,979,000
98.0%
$
22.99
773
2,570,000
90.9%
$
45.58
1,079
15,549,000
96.8%
$
26.73
Vacant
12
259,000
2.0%
N/A
101
256,000
9.1%
N/A
113
515,000
3.2%
N/A
Total/Average
318
13,238,000
100.0%
N/A
874
2,826,000
100.0%
N/A
1,192
16,064,000
100.0%
N/A
(1) Year of expiration includes tenant renewal options.
(2) Weighted average annual base rent per square foot is calculated by annualizing tenants' base cash rent, including ground rent, and excludes tenant reimbursements and concessions and storage rent and is adjusted for assumed exercised options using option rents specified in the underlying leases. Weighted average annual base rent for leases whose future option rent is based on fair market value or CPI is reported at the last stated option rent in the respective lease.
Note: Amounts shown in table above include both current leases and signed leases that have not commenced on vacant spaces for all retail properties (excludes Sunrise Mall and includes properties in redevelopment) and excludes 58,000 sf of self-storage space.
24
URBAN EDGE PROPERTIES
PROPERTY STATUS REPORT
As of December 31, 2024
(dollars in thousands, except per sf amounts)
Property
Total Square Feet (1)
Percent Leased(1)
Weighted Average ABR PSF(2)
Mortgage Debt(6)
Major Tenants
RETAIL PORTFOLIO:
California:
Walnut Creek (Mt. Diablo)(4)
7,000
100.0%
$69.90
—
Sweetgreen
Walnut Creek (Olympic)
31,000
100.0%
80.50
—
Anthropologie
Connecticut:
Newington Commons
189,000
90.0%
9.50
$15,719
Walmart, Staples
Maryland:
Goucher Commons
155,000
92.5%
26.61
—
Sprouts, HomeGoods, Five Below, Ulta, Kirkland's, DSW, Golf Galaxy
Rockville Town Center
98,000
100.0%
16.41
—
Regal Entertainment Group
The Village at Waugh Chapel(5)
382,000
97.9%
24.09
$55,071
Safeway, LA Fitness, Marshalls, Home Goods, T.J. Maxx
Wheaton (leased through 2060)(3)
66,000
100.0%
18.35
—
Best Buy
Woodmore Towne Centre
712,000
98.8%
18.44
$117,200
Costco, Wegmans, At Home, Best Buy, LA Fitness, Nordstrom Rack
Massachusetts:
Cambridge (leased through 2033)(3)
48,000
100.0%
28.32
—
PetSmart, Central Rock Gym
Gateway Center(5)
640,000
100.0%
9.72
—
Costco, Target, Home Depot, Total Wine
Shoppers World(5)
752,000
99.8%
22.50
—
T.J. Maxx, Marshalls, Home Sense, Sierra Trading, Public Lands, Golf Galaxy, Nordstrom Rack, Hobby Lobby, AMC, Kohl's, Best Buy
The Shops at Riverwood
79,000
100.0%
25.80
$20,958
Price Rite, Planet Fitness, Goodwill
Wonderland Marketplace
140,000
100.0%
14.22
—
Big Lots, Planet Fitness, Marshalls, Get Air
Missouri:
Manchester Plaza
131,000
100.0%
12.09
$12,500
Pan-Asia Market, Academy Sports, Bob's Discount Furniture
New Hampshire:
Salem (leased through 2102)(3)
39,000
100.0%
10.61
—
Fun City
New Jersey:
Bergen Town Center - East(8)
253,000
92.1%
22.56
—
Lowe's, Best Buy, REI
Bergen Town Center - West
1,018,000
95.5%
33.58
$290,000
Target, Whole Foods Market, Burlington, Marshalls, Nordstrom Rack, Saks Off 5th, HomeGoods, H&M, Bloomingdale's Outlet, Nike Factory Store, Old Navy, Kohl's, World Market (lease not commenced)
Briarcliff Commons
180,000
100.0%
25.03
$30,000
Uncle Giuseppe's, Kohl's
Brick Commons
277,000
100.0%
22.06
$50,000
ShopRite, Kohl's, Marshalls, Old Navy
Brunswick Commons
427,000
100.0%
16.17
$63,000
Lowe's, Kohl's, Dick's Sporting Goods, P.C. Richard & Son, T.J. Maxx, LA Fitness
Carlstadt Commons (leased through 2050)(3)
78,000
98.3%
21.69
—
Food Bazaar
Garfield Commons
298,000
100.0%
16.38
$38,886
Walmart, Burlington, Marshalls, PetSmart, Ulta
Greenbrook Commons
170,000
98.3%
20.00
$31,000
BJ's Wholesale Club, Aldi
Hackensack Commons
275,000
100.0%
26.29
$66,400
The Home Depot, 99 Ranch, Staples, Petco
Hanover Commons
343,000
100.0%
23.30
$60,155
The Home Depot, Dick's Sporting Goods, Saks Off Fifth, Marshalls
Heritage Square(5)
87,000
100.0%
31.19
—
HomeSense, Sierra Trading Post, Ulta
Hudson Commons
236,000
100.0%
14.33
—
Lowe's, P.C. Richard & Son
25
URBAN EDGE PROPERTIES
PROPERTY STATUS REPORT
As of December 31, 2024
(dollars in thousands, except per sf amounts)
Property
Total Square Feet (1)
Percent Leased(1)
Weighted Average ABR PSF(2)
Mortgage Debt(6)
Major Tenants
Hudson Mall
381,000
73.5%
17.57
—
Marshalls, Big Lots, Retro Fitness, Staples, Old Navy
Kearny Commons
123,000
100.0%
25.33
—
LA Fitness, Marshalls, Ulta
Kennedy Commons
62,000
100.0%
15.67
—
Food Bazaar
Lodi Commons
43,000
100.0%
20.94
—
Dollar Tree
Ledgewood Commons(5)
447,000
99.3%
15.30
$50,000
Walmart, Ashley Furniture, At Home, Barnes & Noble, Burlington, DSW, Marshalls, Old Navy, Ulta
Manalapan Commons
200,000
93.7%
23.44
—
Best Buy, Raymour & Flanigan, PetSmart, Avalon Flooring, Atlantic Health (lease not commenced), Nordstrom Rack (lease not commenced)
Marlton Commons
214,000
100.0%
17.50
$36,024
ShopRite, Kohl's, PetSmart
Millburn
104,000
89.5%
29.93
$21,525
Trader Joe's, CVS, PetSmart
Montclair
18,000
100.0%
32.00
$7,250
Whole Foods Market
Paramus (leased through 2033)(3)
63,000
100.0%
49.97
—
24 Hour Fitness
Plaza at Cherry Hill
417,000
80.7%
13.86
—
Aldi, Total Wine, LA Fitness, Raymour & Flanigan, Guitar Center
Plaza at Woodbridge
293,000
96.7%
21.54
$50,905
Best Buy, Raymour & Flanigan, Lincoln Tech, UFC Gym, national grocer (lease not commenced)
Rockaway River Commons
189,000
96.8%
15.40
$26,215
ShopRite, T.J. Maxx
Rutherford Commons (leased through 2099)(3)
196,000
100.0%
13.98
$23,000
Lowe's
Stelton Commons (leased through 2039)(3)
56,000
100.0%
21.99
—
Staples, Party City
Tonnelle Commons
410,000
100.0%
23.29
$95,286
BJ's Wholesale Club, Walmart, PetSmart
Totowa Commons
272,000
100.0%
21.49
$50,800
The Home Depot, Staples, Tesla (lease not commenced), Lidl (lease not commenced), Boot Barn (lease not commenced)
Town Brook Commons
231,000
98.7%
14.45
$29,610
Stop & Shop, Kohl's
West Branch Commons
279,000
98.7%
16.74
—
Lowe's, Burlington
West End Commons
241,000
100.0%
11.89
$23,717
Costco, The Tile Shop, La-Z-Boy, Petco, Da Vita Dialysis
Woodbridge Commons
225,000
100.0%
14.04
$22,100
Walmart, Dollar Tree, Advance Auto Parts
New York:
Amherst Commons
311,000
98.1%
11.35
—
BJ's Wholesale Club, Burlington, LA Fitness, Bob's Discount Furniture, Ross (lease not commenced)
Bruckner Commons(5)
335,000
82.0%
43.76
—
ShopRite, Burlington, BJ's Wholesale Club (lease not commenced)
Shops at Bruckner(5)
113,000
100.0%
39.72
$37,350
Aldi, Marshalls, Five Below, Old Navy
Burnside Commons
100,000
91.4%
17.90
—
Bingo Wholesale
Cross Bay Commons
44,000
95.8%
41.62
—
Northwell Health
Dewitt (leased through 2041)(3)
46,000
100.0%
19.36
—
Best Buy
Forest Commons
165,000
89.5%
26.49
—
Western Beef, Planet Fitness, Advance Auto Parts, NYC Public School
Bob's Discount Furniture, Ross Dress for Less, Marshalls, Petco, Wren Kitchen
Wyomissing (leased through 2065)(3)
76,000
100.0%
14.83
—
LA Fitness, PetSmart
South Carolina:
Charleston (leased through 2063)(3)
45,000
100.0%
15.96
—
Best Buy
Virginia:
Norfolk (leased through 2069)(3)
114,000
100.0%
7.79
—
BJ's Wholesale Club
Puerto Rico:
Shops at Caguas
356,000
96.6%
33.46
$81,504
Sector Sixty6, Forever 21, Old Navy
The Outlets at Montehiedra(5)
531,000
97.1%
24.21
$73,551
The Home Depot, Marshalls, Caribbean Cinemas, Old Navy, Ralph's Food Warehouse, T.J. Maxx, Burlington (lease not commenced)
Total Retail Portfolio
16,064,000
96.8%
$20.79
$1,583,820
Sunrise Mall(4)(5)(7)
1,228,000
25.6%
7.35
—
Macy's, Dick's Sporting Goods
Total Urban Edge Properties
17,292,000
91.7%
$20.52
$1,583,820
(1) Percent leased is expressed as the percentage of gross leasable area subject to a lease, excluding temporary tenants. The Company also excludes 58,000 sf of self-storage from the report above.
(2) Weighted average annual base rent per square foot including ground leases and executed leases for which rent has not commenced is calculated by annualizing tenants' current base rent (excluding any free rent periods), and excluding tenant reimbursements, concessions and storage rent. Excluding the ground leases where the Company is the lessor, the weighted average annual base rent per square foot for our retail portfolio is $23.32 per square foot.
(3) The Company is a lessee under a ground or building lease. The total square feet disclosed for the building will revert to the lessor upon lease expiration.
(4) We own 95% of Walnut Creek (Mt. Diablo) and 82.5% of Sunrise Mall with the remaining portions in each case owned by joint venture partners.
(5) Not included in the same-property pool for the purposes of calculating same-property metrics for the quarters ended December 31, 2024 and 2023.
(7) A portion of the property is under a ground lease through 2069.
(8) A portion of the property is classified as held for sale as of December 31, 2024.
27
URBAN EDGE PROPERTIES
PROPERTY ACQUISITIONS AND DISPOSITIONS
For the year ended December 31, 2024
(dollars in thousands)
2024 Property Acquisitions:
Date Acquired
Property Name
City
State
GLA
Price
2/8/2024
Heritage Square
Watchung
NJ
87,000
$
34,000
4/5/2024
Ledgewood Commons
Roxbury Township
NJ
448,000
83,250
10/29/2024
The Village at Waugh Chapel
Gambrills
MD
382,000
125,600
2024 Property Dispositions:
Date Disposed
Property Name
City
State
GLA
Price
3/14/2024
Hazlet
Hazlet
NJ
95,000
$
8,700
4/26/2024
Lodi
Lodi
NJ
127,000
29,200
10/29/2024
Union (Vauxhall)
Union
NJ
232,000
71,000
28
URBAN EDGE PROPERTIES
DEVELOPMENT, REDEVELOPMENT AND ANCHOR REPOSITIONING PROJECTS
As of December 31, 2024
(in thousands, except square footage data)
Active Projects
Estimated Gross Cost(1)
Incurred as of 12/31/24
Target Stabilization(2)
Description and Status
Bruckner Commons (Phase A)(5)
$
51,300
$
21,200
2Q27
Retenanting a portion of the former Kmart box with BJ's Wholesale Club
Bruckner Commons (Phase B)(5)
18,400
1,700
4Q26
Redeveloping Toys "R" Us box with 20,000 sf of retail and restaurant pads
The Outlets at Montehiedra (Phase C)(5)
12,600
10,000
1Q25
Demising and retenanting former Kmart box with Ralph's Food Warehouse and Urology Hub
Hudson Mall(3)
9,700
7,000
2Q26
Retenanting former Toys "R" Us box
Manalapan Commons (Phase B)(3)
7,500
2,800
3Q25
Backfilling vacant Bed Bath & Beyond with 25,000± sf national apparel retailer and remaining 12,000± sf
The Outlets at Montehiedra (Phase E)(5)
7,400
4,600
2Q25
Backfilling Tiendas Capri with 33,000 sf Burlington
Marlton Commons(3)
7,300
5,700
2Q25
Redeveloping Friendly's with new 11,000± sf multi-tenant pad (First Watch, Cava, and Mattress Firm executed)
Totowa Commons (Phase A)(3)
5,700
1,500
4Q25
Backfilling former Bed Bath & Beyond box with Tesla
Brick Commons(3)
5,300
4,800
2Q25
Replacing Santander Bank with two quick service restaurants (Shake Shack and First Watch executed)
Walnut Creek(3)
3,500
2,600
3Q25
Retenanting former Z Gallerie with Sweetgreen (open) and Ronbow
Bergen Town Center (Phase E)(3)
3,400
1,600
4Q25
Backfilling vacant Midas space with First Watch
Amherst Commons(3)
3,100
2,800
1Q25
Backfilling vacant anchor with Ross and Bob's Discount Furniture
Totowa Commons (Phase B)(3)
3,100
600
1Q26
Retenanting vacant Marshalls with 27,000 sf Lidl and 18,000 sf Boot Barn
Bergen Town Center (Phase D)(3)
2,700
700
1Q25
Backfilling former Neiman Marcus with World Market
Yonkers Gateway Center (Phase B)(3)
2,600
2,000
3Q25
Relocating Red Wing Shoes, adding Dave's Hot Chicken into vacant shop space and expanding Best Buy in former Red Wing Shoes
Plaza at Woodbridge (Phase A)(3)
2,400
100
1Q26
Retenanting 17,000± sf of former Bed Bath & Beyond with national grocer
The Outlets at Montehiedra (Phase B)(5)
2,200
200
1Q26
Developing new 6,000± sf pad for Texas Roadhouse
Huntington Commons (Phase D)(3)
2,200
2,000
2Q25
Retenanting former bank pad with Starbucks and Yoga Six
Broomall Commons(5)
1,800
—
1Q26
Backfilling vacant anchor with Picklr
Bergen Town Center (Phase C)(3)
1,700
300
3Q25
Backfilling vacant restaurant space with Ani Ramen and retenanting former Qdoba with Bluestone Lane (open)
Woodmore Towne Centre (Phase A)(3)
1,700
500
3Q26
New pad for free standing Bank of America
Manalapan Commons (Phase A)(3)
1,600
300
2Q25
Backfilling vacant A.C. Moore space with 18,000 sf Atlantic Health
Ledgewood Commons
1,500
—
3Q26
Developing new restaurant pad for Tommy's Tavern + Tap
Newington Commons(3)
1,400
—
1Q26
Backfilling former Staples with Bob's Discount Furniture
Plaza at Cherry Hill (Phase C)(3)
1,400
100
1Q26
Backfilling vacant space with 10,000 sf Big Blue Swim
Plaza at Woodbridge (Phase B)(3)
1,100
—
4Q27
Expanding existing ExtraSpace self-storage by 13,000± sf in vacant space
Total
$
162,600
(4)
$
73,100
(1) Estimated gross cost includes the allocation of internal costs such as labor, interest and taxes.
(2) Target Stabilization reflects the first quarter in which at least 80% of the expected NOI from the project has commenced. A project achieving Target Stabilization is classified as Completed whether or not all costs have been expended and remains listed as a Completed project for one year in the table on page 30. The Target Stabilization date is an estimate and is subject to change resulting from uncertainties inherent in the development process and not wholly under the Company's control.
(3) Results from these properties are included in our same-property metrics for the quarter ended December 31, 2024.
(4) The estimated, unleveraged yield for total Active Projects is 15% based on total estimated project costs and the incremental, unleveraged NOI directly attributable to the projects unless otherwise noted. The incremental, unleveraged NOI for Active Projects excludes NOI generated outside the project scope such as the impact on future lease rollovers or on the long-term value of the property. The unleveraged yield for projects related to vacant spaces is based on the total NOI directly attributable to the project and the estimated project costs.
(5) Results from these properties are included in our same-property including redevelopment metrics for the quarter ended December 31, 2024.
29
URBAN EDGE PROPERTIES
DEVELOPMENT, REDEVELOPMENT AND ANCHOR REPOSITIONING PROJECTS
As of December 31, 2024
(in thousands, except square footage data)
Completed Projects
Estimated Gross Cost(1)
Incurred as of 12/31/24
Stabilization(2)
Description and status
The Outlets at Montehiedra (Phase D)(6)
$
4,800
$
4,500
4Q24
Retenanted 24,000 sf of vacant Kmart box with T.J. Maxx
Burnside Commons(3)
6,900
6,900
3Q24
Retenanted anchor vacancy with Bingo Wholesale
Kingswood Crossing (Phase A)(3)
3,100
3,100
3Q24
Backfilled 21,000 sf vacancy with Visiting Nurse Service of NY
Huntington Commons (Phase B)(3)
13,300
12,500
2Q24
Backfilled the relocated Marshalls box with Burlington, as well as additional center repositioning and renovations
Yonkers Gateway Center (Phase A)(3)
1,600
1,600
1Q24
Retenanted end cap space with Wren Kitchens
Total
$
29,700
(4)
$
28,600
Future Redevelopment(5)
Location
Opportunity
Bergen Town Center(3)
Paramus, NJ
Improvements to common areas and enhancements to merchandising mix
Brunswick Commons(3)
East Brunswick, NJ
Develop new pad
Hudson Mall(3)
Jersey City, NJ
Reposition mall with retail and amenity upgrades and consideration of alternate uses
The Plaza at Cherry Hill(3)
Cherry Hill, NJ
Renovate exterior of center and common areas and upgrade tenancy
Sunrise Mall
Massapequa, NY
Redevelop mall including consideration of alternate uses
(1) Estimated gross cost includes the allocation of internal costs such as labor, interest and taxes.
(2) Stabilization reflects the first quarter in which at least 80% of the expected NOI from the project has commenced. A project achieving Stabilization is classified as Completed whether or not all costs have been expended and remains listed as a Completed project for one year in the table above.
(3) Results from these properties are included in our same-property metrics for the quarter ended December 31, 2024.
(4) The estimated unleveraged yield for Completed projects is 16% based on total estimated project costs and the incremental, unleveraged NOI directly attributable to the projects unless otherwise noted. The incremental, unleveraged NOI for Completed projects excludes NOI generated outside the project scope such as the impact on future lease rollovers or on the long-term value of the property. The unleveraged yield for projects related to vacant spaces as a result of bankruptcy is based on the total NOI directly attributable to the project and the estimated project costs.
(5) The Company has identified future redevelopment opportunities which are, or will soon be, in planning phases and as such, may not ultimately become active projects. Proceeding with these investments is subject to many factors outside of the Company's control, and it is possible that municipal or other approvals may delay or suspend our ability to proceed with such plans. The execution of these projects is discretionary and we are under no obligation to fund these projects.
(6) Results from these properties are included in our same-property including redevelopment metrics for the quarter ended December 31, 2024.
30
URBAN EDGE PROPERTIES
DEBT SUMMARY
As of December 31, 2024 and 2023
(in thousands)
December 31, 2024
December 31, 2023
Secured fixed rate debt
$
1,532,915
$
1,462,766
Secured variable rate debt
50,905
127,969
Unsecured variable rate debt
50,000
153,000
Total debt
$
1,633,820
$
1,743,735
% Secured fixed rate debt
93.8
%
83.9
%
% Secured variable rate debt
3.1
%
7.3
%
% Unsecured variable rate debt
3.1
%
8.8
%
Total
100
%
100
%
Secured mortgage debt
$
1,583,820
$
1,590,735
Unsecured debt(1)
50,000
153,000
Total debt
$
1,633,820
$
1,743,735
% Secured mortgage debt
96.9
%
91.2
%
% Unsecured mortgage debt
3.1
%
8.8
%
Total
100
%
100
%
Weighted average remaining maturity on secured mortgage debt
4.7 years
5.0 years
Weighted average remaining maturity on unsecured debt
3.1 years
4.1 years
Total market capitalization (see page 18)
$
4,468,327
% Secured mortgage debt
35.4
%
% Unsecured debt
1.1
%
Total debt : Total market capitalization
36.5
%
Weighted average interest rate on secured mortgage debt(2)
5.04
%
5.01
%
Weighted average interest rate on unsecured debt(2)
5.47
%
6.56
%
Total debt
5.05
%
5.14
%
Note: All amounts and calculations exclude unamortized debt issuance costs on mortgages payable.
(1) As of December 31, 2024, there was $50 million outstanding on our unsecured $800 million line of credit which has a maturity date of February 9, 2027 with two six-month extension options. Borrowings under the agreement bear interest at the Secured Overnight Financing Rate ("SOFR") plus an applicable margin of 1.03% to 1.50% and an annual facility fee of 15 to 30 basis points based on our current leverage ratio. At December 31, 2024, the applicable margin was 1.03% over SOFR. As of December 31, 2024, the Company had obtained seven letters of credit aggregating $32.1 million which were provided to mortgage lenders and other entities to secure its obligations for certain capital requirements. The letters of credit remain undrawn but have reduced the amount available under the facility commensurate with their face values.
(2) Weighted average interest rate is calculated based on balances outstanding at the respective dates.
31
URBAN EDGE PROPERTIES
MORTGAGE DEBT SUMMARY
As of December 31, 2024 and 2023
(dollars in thousands)
Property
Maturity Date
Rate
December 31, 2024
December 31, 2023
Percent of Mortgage Debt at December 31, 2024
Hudson Commons(1)
11/15/24
—
%
$
—
$
26,930
—
%
Gun Hill Commons(1)
12/1/24
—
%
—
23,696
—
%
West End Commons
12/10/25
3.99
%
23,717
24,196
1.5
%
Town Brook Commons
12/1/26
3.78
%
29,610
30,229
1.9
%
Rockaway River Commons
12/1/26
3.78
%
26,215
26,763
1.7
%
Hanover Commons
12/10/26
4.03
%
60,155
61,324
3.8
%
Tonnelle Commons
4/1/27
4.18
%
95,286
97,115
6.0
%
Manchester Plaza
6/1/27
4.32
%
12,500
12,500
0.8
%
Millburn Gateway Center
6/1/27
3.97
%
21,525
22,015
1.4
%
Plaza at Woodbridge(2)
6/8/27
5.26
%
50,905
52,278
3.2
%
Totowa Commons
12/1/27
4.33
%
50,800
50,800
3.2
%
Woodbridge Commons
12/1/27
4.36
%
22,100
22,100
1.4
%
Brunswick Commons
12/6/27
4.38
%
63,000
63,000
4.0
%
Rutherford Commons
1/6/28
4.49
%
23,000
23,000
1.5
%
Kingswood Center(3)
2/6/28
—
%
—
69,054
—
%
Hackensack Commons
3/1/28
4.36
%
66,400
66,400
4.2
%
Marlton Commons
12/1/28
3.86
%
36,024
36,725
2.3
%
Union (Vauxhall)(4)
12/10/28
—
%
—
45,202
—
%
Yonkers Gateway Center(5)
4/10/29
6.30
%
50,000
23,148
3.2
%
Ledgewood Commons
5/5/29
6.03
%
50,000
—
3.2
%
The Shops at Riverwood
6/24/29
4.25
%
20,958
21,326
1.3
%
Shops at Bruckner
7/1/29
6.00
%
37,350
37,817
2.4
%
Greenbrook Commons(6)
9/1/29
6.03
%
31,000
25,065
2.0
%
Huntington Commons
12/5/29
6.29
%
43,704
43,704
2.8
%
Bergen Town Center
4/10/30
6.30
%
290,000
290,000
18.1
%
The Outlets at Montehiedra
6/1/30
5.00
%
73,551
75,590
4.6
%
Montclair(7)
8/15/30
3.15
%
7,250
7,250
0.5
%
Garfield Commons
12/1/30
4.14
%
38,886
39,607
2.5
%
The Village at Waugh Chapel(8)
12/1/31
3.76
%
55,071
—
3.5
%
Brick Commons(9)
12/10/31
5.20
%
50,000
47,683
3.2
%
Woodmore Towne Centre
1/6/32
3.39
%
117,200
117,200
7.4
%
Newington Commons
7/1/33
6.00
%
15,719
15,920
1.0
%
Shops at Caguas
8/1/33
6.60
%
81,504
82,000
5.1
%
Briarcliff Commons
10/1/34
5.47
%
30,000
—
1.9
%
Mount Kisco Commons(10)
11/15/34
6.40
%
10,390
11,098
0.7
%
Total mortgage debt
5.04
%
$
1,583,820
$
1,590,735
100
%
Unamortized debt issuance costs
(14,067)
(12,625)
Total mortgage debt, net
$
1,569,753
$
1,578,110
(1)The Company paid off the loan prior to maturity on January 2, 2024.
(2)Bears interest at one month SOFR plus 226 bps. The variable component of the debt is hedged with an interest rate cap agreement to limit SOFR to a maximum of 3%, which expires July 1, 2025.
(3)On June 27, 2024, the property was foreclosed on and the lender took possession, discharging the Company of all assets and liabilities associated with it. As a result, the Company recognized a $21.7 million gain on extinguishment of debt in the second quarter of 2024.
(4)On October 29, 2024, the Company sold the property and the outstanding $44.5 million mortgage was assumed by the buyer at closing.
(5)On March 28, 2024, the Company refinanced the mortgage secured by Yonkers Gateway Center with a new 5-year, $50 million fixed rate loan.
(6)The Company paid off the previous variable rate loan in January 2024. On August 29, 2024, the Company obtained a new 5-year, $31 million fixed rate loan.
(7)Bears interest at SOFR plus 257 bps. The fixed and variable components of the debt are hedged with an interest rate swap agreement, fixing the rate at 3.15%, which expires at the maturity of the loan.
(8)On October 29, 2024, the Company assumed the mortgage in connection with the acquisition of The Village at Waugh Chapel. The mortgage payable balance includes a $4.9 million debt mark-to-market discount.
(9)On November 21, 2024, the Company refinanced the mortgage secured by Brick Commons with a new 7-year, $50 million fixed rate loan.
(10) Mortgage payable balance includes a $0.6 million debt mark-to-market discount.
32
URBAN EDGE PROPERTIES
DEBT MATURITY SCHEDULE
As of December 31, 2024
(dollars in thousands)
Year
Amortization
Balloon Payments
Revolving Credit Facilities(1)
Premium/(Discount) Amortization
Total
Weighted Average Interest rate at maturity
Percent of Debt Maturing
2025
$
13,886
$
23,261
$
—
$
(774)
$
36,373
4.3%
2.2
%
2026
14,505
111,228
—
(774)
124,959
4.0%
7.6
%
2027
10,629
306,781
—
(774)
316,636
4.5%
19.4
%
2028
9,559
122,402
50,000
(773)
181,188
4.7%
11.1
%
2029
8,163
224,990
—
(773)
232,380
6.0%
14.2
%
2030
5,566
391,042
—
(773)
395,835
5.9%
24.2
%
2031
3,741
110,000
—
(713)
113,028
4.5%
6.9
%
2032
3,986
117,200
—
(60)
121,126
3.5%
7.4
%
2033
2,986
78,094
—
(60)
81,020
6.5%
5.0
%
Thereafter
1,333
30,000
—
(58)
31,275
5.5%
1.9
%
Total
$
74,354
$
1,514,998
$
50,000
$
(5,532)
$
1,633,820
5.1%
100
%
Unamortized debt issuance costs
(14,067)
Total outstanding debt, net
$
1,619,753
(1)Our $800 million revolving credit facility matures on February 9, 2027, plus two six-month extensions at our option, to February 9, 2028.