Earnings Before Interest, Taxes, Depreciation and Amortization for Real Estate (EBITDAre)
17
Funds from Operations
18
Market Capitalization, Debt Ratios and Liquidity
19
Additional Disclosures
20
Leasing Data
Tenant Concentration - Top Twenty-Five Tenants
21
Leasing Activity
22
Leases Executed but Not Yet Rent Commenced
23
Retail Portfolio Lease Expiration Schedules
24
Property Data
Property Status Report
26
Property Acquisitions and Dispositions
29
Development, Redevelopment and Anchor Repositioning Projects
30
Debt Schedules
Debt Summary
32
Mortgage Debt Summary
33
Debt Maturity Schedule
34
Urban Edge Properties
For additional information:
12 East 49th Street
Mark Langer, EVP and
New York, NY 10017
Chief Financial Officer
212-956-0082
FOR IMMEDIATE RELEASE:
Urban Edge Properties Reports Third Quarter 2025 Results
-- Raises Mid-Point Guidance for Full-Year 2025 FFO as Adjusted --
NEW YORK, NY, October 29, 2025 - Urban Edge Properties (NYSE: UE) (the "Company") today announced its results for the quarter ended September 30, 2025 and updated its outlook for full-year 2025.
"Urban Edge delivered a strong third quarter, building on the momentum we have achieved in 2025," said Jeff Olson, Chairman and CEO. "Our team's continued execution resulted in over 340,000 sf of leasing transactions in the quarter, generating cash spreads of 21%, while we further advanced key growth initiatives. With the favorable operating results, we are again raising our outlook for the full year, increasing our FFO as Adjusted guidance by $0.01 per share at the mid-point, reflecting expected annual growth of 6% versus last year."
"We are also excited to announce the $39 million acquisition of Brighton Mills Shopping Center, a 91,000 sf, high quality grocery-anchored center less than one mile from Harvard Business School, that further expands our footprint in the Boston area - a growth market for us that now represents over 10% of our asset value. The transaction continues our successful capital recycling efforts, with the purchase being funded through a 1031 exchange with previously announced sales."
Financial Results(1)(2)
(in thousands, except per share amounts)
3Q25
3Q24
YTD 2025
YTD 2024
Net income attributable to common shareholders
$
14,935
$
9,080
$
81,111
$
42,442
Net income per diluted share
0.12
0.07
0.64
0.35
Funds from Operations ("FFO")
51,951
43,935
141,188
141,382
FFO per diluted share
0.40
0.34
1.08
1.13
FFO as Adjusted
47,478
44,685
140,651
125,659
FFO as Adjusted per diluted share
0.36
0.35
1.08
1.01
The increase in net income, FFO and FFO as Adjusted for the three months ended September 30, 2025 were driven by rent commencements on new leases, higher net recovery revenue, and growth from acquisitions completed in 2024. FFO for the three months ended September 30, 2025 also included higher non-cash revenue of $4.2 million, or $0.03 per diluted share, for the write-off of below-market lease intangibles related to tenants in bankruptcy. The increase in net income for the nine months ended September 30, 2025 was primarily driven by a $49.7 million, or $0.39 per diluted share, gain on sale of real estate related to three non-core dispositions during the second quarter of 2025. FFO as Adjusted for the nine months ended September 30, 2025 increased as compared to the prior year driven by rent commencements on new leases, higher net recovery revenue, and growth from acquisitions.
Same-Property Operating Results Compared to the Prior Year Period(3)
3Q25
YTD 2025
Same-property Net Operating Income ("NOI") growth
4.1
%
4.6
%
Same-property NOI growth, including properties in redevelopment
4.7
%
5.4
%
Increases in same-property NOI metrics for the three and nine months ended September 30, 2025 were driven by rent commencements on new leases from our signed but not open pipeline and higher net recovery revenue.
1
Operating Results(1)
•The Company reported shop leased occupancy of 92.5%, an increase of 210 basis points compared to September 30, 2024 and flat compared to June 30, 2025.
•Same-property portfolio leased occupancy was 96.6%, a decrease of 20 basis points compared to September 30, 2024 and June 30, 2025.
•Consolidated portfolio leased occupancy was 96.3%, flat compared to September 30, 2024 and a decrease of 20 basis points compared to June 30, 2025.
•The Company executed 31 new leases, renewals and options totaling 347,000 sf during the quarter. New leases totaled 82,000 sf, of which 76,000 sf was on a same-space basis and generated an average cash spread of 61.0%. New leases, renewals and options totaled 341,000 sf on a same-space basis and generated an average cash spread of 20.6%.
•As of September 30, 2025, signed leases that have not yet rent commenced are expected to generate an additional $21.5 million of future annual gross rent, representing approximately 7% of current annualized NOI.
Acquisition Activity
On October 23, 2025, the Company acquired Brighton Mills Shopping Center, located in Allston, Massachusetts, for a gross purchase price of $39 million. The grocery-anchored shopping center, aggregating 91,000 sf, is located less than one mile from Harvard Business School's main campus in an area that has seen extensive growth driven by Harvard's expansion and several new multi-family developments in the immediate area. The dense trade area has a 3-mile population of 449,000 people with average household incomes of $174,000. The transaction was funded using proceeds from the sales of Kennedy Commons and MacDade Commons in June 2025 via a 1031 exchange.
Financing Activity
On August 4, 2025, the Company obtained a $123.6 million, 4-year non-recourse mortgage secured by Shoppers World with a swapped fixed interest rate of 5.12%. A portion of the proceeds were used to pay off the $90 million outstanding balance on its line of credit which had an interest rate of 5.48%, with the remaining proceeds expected to be used to fund capital developments, acquisition opportunities and for general corporate purposes.
As of September 30, 2025, the Company has limited debt maturities coming due through 2026 including one $23.3 million mortgage maturing in December 2025 and $114.2 million of mortgages maturing in December 2026, collectively aggregating $137.5 million, which represents approximately 8% of outstanding debt.
On October 27, 2025, the Company completed the modification of its $80.4 million mortgage loan secured by the Shops at Caguas. The modification resulted in a reduced fixed interest rate of 6.15% and a new maturity date of January 2031, with a three-year extension option to January 2034. Prior to the modification, the loan was bearing interest at a fixed rate of 6.6%, maturing in August 2033. The modification provides annual interest savings of approximately $0.4 million.
Leasing, Development and Redevelopment
During the quarter, the Company executed 82,000 sf of new leases including leases with a national off-price retailer, HomeGoods and Cava, adding strong value-oriented retailers to its centers while continuing to upgrade food offerings through shop leasing.
The Company activated three redevelopment projects totaling $8.4 million and stabilized one redevelopment project totaling $1.4 million with the rent commencement of Bob's Discount Furniture at Newington Commons. The completed projects over the last 12 months total $48.6 million of investment with an expected average yield of approximately 17%.
As of September 30, 2025, the Company has $149.1 million of active redevelopment projects underway, with estimated remaining costs to complete of $72.5 million. The active redevelopment projects are expected to generate an approximate 15% yield.
Balance Sheet and Liquidity(1)(4)(5)(6)
Balance sheet highlights as of September 30, 2025 include:
•Total liquidity of approximately $913 million, consisting of $145 million of cash on hand and $768 million available under the Company's $800 million revolving credit agreement, including undrawn letters of credit.
•Mortgages payable of $1.65 billion, with a weighted average term to maturity of 4.1 years, all of which is fixed rate or hedged.
•No outstanding balance on our $800 million revolving credit agreement that matures on February 9, 2027, with two six-month extension options.
2
•Total market capitalization of approximately $4.36 billion, comprised of 132.6 million fully-diluted common shares valued at $2.71 billion and $1.65 billion of debt.
•Net debt to total market capitalization of 34%.
2025 Outlook
Based on the results for the first nine months of the year, the Company has raised its 2025 full-year guidance ranges for net income and FFO and updated its range for FFO as Adjusted, estimating net income of $0.73 to $0.75 per diluted share, FFO of $1.43 to $1.45 per diluted share and FFO as Adjusted of $1.42 to $1.44 per diluted share. The updated range for FFO as Adjusted now implies a mid-point of $1.43 per diluted share, a $0.01 increase from the previous mid-point of $1.42 per diluted share. A reconciliation of the range of estimated earnings, FFO and FFO as Adjusted, as well as the assumptions used in our guidance can be found on page 4 of this release.
Earnings Conference Call Information
The Company will host an earnings conference call and audio webcast on October 29, 2025 at 8:30am ET. All interested parties can access the earnings call by dialing 1-877-407-9716 (Toll Free) or 1-201-493-6779 (Toll/International) using conference ID 13755609. The call will also be webcast and available in listen-only mode on the investors page of our website: www.uedge.com. A replay will be available at the webcast link on the investors page for one year following the conclusion of the call. A telephonic replay of the call will also be available starting October 29, 2025 at 11:30am ET through November 12, 2025 at 11:59pm ET by dialing 1-844-512-2921 (Toll Free) or 1-412-317-6671 (Toll/International) using conference ID 13755609.
(1) Refer to "Non-GAAP Financial Measures" and "Operating Metrics" for definitions and additional details. Reported consolidated occupancy excludes the impact of Sunrise Mall. Including Sunrise Mall, consolidated portfolio leased occupancy was 89.8% at September 30, 2025.
(2) Refer to page 8 for a reconciliation of net income to FFO and FFO as Adjusted for the three and nine months ended September 30, 2025.
(3) Refer to page 9 for a reconciliation of net income to NOI and Same-Property NOI for the three and nine months ended September 30, 2025.
(4) Net debt as of September 30, 2025 is calculated as total consolidated debt of $1.6 billion less total cash and cash equivalents, including restricted cash, of $145 million.
(5) Refer to page 19 for the calculation of market capitalization as of September 30, 2025.
(6) Availability under the revolving credit agreement is net of letters of credit issued. The Company obtained eight letters of credit aggregating $32.2 million which have reduced the available balance commensurate with their face values but remain undrawn and no separate liability has been recorded.
3
2025 Earnings Guidance
The Company has raised its 2025 full-year guidance ranges for net income and FFO and updated its range for FFO as Adjusted, estimating net income of $0.73 to $0.75 per diluted share, FFO of $1.43 to $1.45 per diluted share and FFO as Adjusted of $1.42 to $1.44 per diluted share. Below is a summary of the Company's 2025 outlook, assumptions used in its forecasting, and a reconciliation of the range of estimated earnings, FFO, and FFO as Adjusted per diluted share.
Previous Guidance
Revised Guidance
Net income per diluted share
$0.70 - $0.74
$0.73 - $0.75
Net income attributable to common shareholders per diluted share
$0.67 - $0.71
$0.70 - $0.72
FFO per diluted share
$1.37 - $1.41
$1.43 - $1.45
FFO as Adjusted per diluted share
$1.40 - $1.44
$1.42 - $1.44
The Company's 2025 full-year FFO outlook is based on the following assumptions:
•Same-property NOI growth, including properties in redevelopment, of 5.0% to 5.5%, reflecting an increase from the previous assumption of 4.25% to 5.0%.
•Acquisitions of $39 million and dispositions of $66 million, reflecting activity completed year-to-date.
•Recurring G&A expenses ranging from $34.5 million to $35.0 million, reflecting a decrease on the high end from the previous assumption of $34.5 million to $35.5 million.
•Interest and debt expense ranging from $78.5 million to $79.5 million, reflecting a decrease on the high end from the previous assumption of $78.5 million to $80.5 million.
•Excludes items that impact FFO comparability, including gains and/or losses on extinguishment of debt, transaction, severance, litigation, and other one-time items outside of the ordinary course of business.
Guidance 2025E
Per Diluted Share(1)
(in thousands, except per share amounts)
Low
High
Low
High
Net income
$
96,000
$
98,600
$
0.73
$
0.75
Less net (income) loss attributable to noncontrolling interests in:
Operating partnership
(5,200)
(5,300)
(0.04)
(0.04)
Consolidated subsidiaries
1,000
1,000
0.01
0.01
Net income attributable to common shareholders
91,800
94,300
0.70
0.72
Adjustments:
Rental property depreciation and amortization
138,900
138,900
1.06
1.06
Gain on sale of real estate
(49,700)
(49,700)
(0.38)
(0.38)
Limited partnership interests in operating partnership
5,200
5,300
0.04
0.04
FFO Applicable to diluted common shareholders
186,200
188,800
1.43
1.45
Adjustments to FFO:
Transaction, severance, litigation expenses and other, net
4,700
4,700
0.04
0.04
Gain on extinguishment of debt
(300)
(300)
—
—
Non-cash adjustments
(4,700)
(4,700)
(0.04)
(0.04)
FFO as Adjusted applicable to diluted common shareholders
$
185,900
$
188,500
$
1.42
$
1.44
(1) Amounts may not foot due to rounding.
4
The following table is a reconciliation bridging 2024 FFO per diluted share to the Company's estimated 2025 FFO per diluted share:
Per Diluted Share(1)
Low
High
2024 FFO applicable to diluted common shareholders
$
1.48
$
1.48
2024 Items impacting FFO comparability(2)
(0.14)
(0.14)
2025 Items impacting FFO comparability(2)
—
—
Same-property NOI growth, including redevelopment
0.10
0.11
Acquisitions net of dispositions NOI growth
0.01
0.01
Recurring general and administrative
—
0.01
Straight-line rent and non-cash items
(0.01)
(0.01)
Lease termination and other income
(0.01)
(0.01)
2025 FFO applicable to diluted common shareholders
$
1.43
$
1.45
(1) Amounts may not foot due to rounding.
(2) Includes adjustments to FFO for fiscal year 2024 and expected adjustments for fiscal year 2025 which impact comparability. See "Reconciliation of net income to FFO and FFO as Adjusted" on page 8 for actual adjustments year-to-date and our fourth quarter 2024 Supplemental Disclosure Package for 2024 adjustments.
The Company is providing a projection of anticipated net income solely to satisfy the disclosure requirements of the Securities and Exchange Commission ("SEC"). The Company's projections are based on management’s current beliefs and assumptions about the Company's business, and the industry and the markets in which it operates; there are known and unknown risks and uncertainties associated with these projections. There can be no assurance that actual results will not differ from the guidance set forth above. The Company assumes no obligation to update publicly any forward-looking statements, including its 2025 earnings guidance, whether as a result of new information, future events or otherwise. Please refer to the “Forward-Looking Statements” disclosures on page 11 of this document and “Risk Factors” disclosed in the Company's annual and quarterly reports filed with the SEC for more information.
5
Non-GAAP Financial Measures
The Company uses certain non-GAAP performance measures, in addition to the primary GAAP presentations, as we believe these measures improve the understanding of the Company's operational results. We continually evaluate the usefulness, relevance, limitations, and calculation of our reported non-GAAP performance measures to determine how best to provide relevant information to the investing public, and thus such reported measures are subject to change. The Company's non-GAAP performance measures have limitations as they do not include all items of income and expense that affect operations, and accordingly, should always be considered as supplemental financial results. Additionally, the Company's computation of non-GAAP metrics may not be comparable to similarly titled non-GAAP metrics reported by other real estate investment trusts ("REITs") or real estate companies that define these metrics differently and, as a result, it is important to understand the manner in which the Company defines and calculates each of its non-GAAP metrics. The following non-GAAP measures are commonly used by the Company and investing public to understand and evaluate our operating results and performance:
•FFO: The Company believes FFO is a useful, supplemental measure of its operating performance that is a recognized metric used extensively by the real estate industry and, in particular REITs. FFO, as defined by the National Association of Real Estate Investment Trusts ("Nareit") and the Company, is net income (computed in accordance with GAAP), excluding gains (or losses) from sales of depreciable real estate and land when connected to the main business of a REIT, impairments on depreciable real estate or land related to a REIT's main business, earnings from consolidated partially owned entities and rental property depreciation and amortization expense. The Company believes that financial analysts, investors and shareholders are better served by the presentation of comparable period operating results generated from FFO primarily because it excludes the assumption that the value of real estate assets diminishes predictably. FFO does not represent cash flows from operating activities in accordance with GAAP, should not be considered an alternative to net income as an indication of our performance, and is not indicative of cash flow as a measure of liquidity or our ability to make cash distributions.
•FFO as Adjusted: The Company provides disclosure of FFO as Adjusted because it believes it is a useful supplemental measure of its core operating performance that facilitates comparability of historical financial periods. FFO as Adjusted is calculated by making certain adjustments to FFO to account for items the Company does not believe are representative of ongoing core operating results, including non-comparable revenues and expenses. The Company's method of calculating FFO as Adjusted may be different from methods used by other REITs and, accordingly, may not be comparable to such other REITs.
•NOI: The Company uses NOI internally to make investment and capital allocation decisions and to compare the unlevered performance of our properties to our peers. The Company believes NOI is useful to investors as a performance measure because, when compared across periods, NOI reflects the impact on operations from trends in occupancy rates, rental rates, operating costs and acquisition and disposition activity on an unleveraged basis, providing perspective not immediately apparent from net income. The Company calculates NOI using net income as defined by GAAP reflecting only those income and expense items that are incurred at the property level and through the Company's captive insurance program, adjusted for non-cash rental income and expense, impairments on depreciable real estate or land, and income or expenses that we do not believe are representative of ongoing operating results, if any. In addition, the Company uses NOI margin, calculated as NOI divided by total property revenue, which the Company believes is useful to investors for similar reasons.
•Same-property NOI: The Company provides disclosure of NOI on a same-property basis, which includes the results of properties that were owned and operated for the entirety of the reporting periods being compared, which total 65 and 63 properties for the three and nine months ended September 30, 2025 and 2024, respectively. Information provided on a same-property basis excludes properties under development, redevelopment or that involve anchor repositioning where a substantial portion of the gross leasable area ("GLA") is taken out of service and also excludes properties acquired, sold, or that are in the foreclosure process during the periods being compared, and results of our captive insurance program. As such, same-property NOI assists in eliminating disparities in net income due to the development, redevelopment, acquisition, disposition, or foreclosure of properties and results of our captive insurance program during the periods presented, and thus provides a more consistent performance measure for the comparison of the operating performance of the Company's properties. While there is judgment surrounding changes in designations, a property is removed from the same-property pool when it is designated as a redevelopment property because it is undergoing significant renovation or retenanting pursuant to a formal plan that is expected to have a significant impact on its operating income. A development or redevelopment property is moved back to the same-property pool once a substantial portion of the NOI growth expected from the development or redevelopment is reflected in both the current and comparable prior year period, generally one year after at least 80% of the expected NOI from the project is realized on a cash basis. Acquisitions are moved into the same-property pool once we have owned the property for the entirety of the comparable periods and the property is not under significant development or redevelopment. The Company has also provided disclosure of NOI on a same-property basis adjusted to include
6
redevelopment properties. Same-property NOI may include other adjustments as detailed in the Reconciliation of Net Income to NOI and same-property NOI included in the tables accompanying this press release.
•EBITDAre and Adjusted EBITDAre: EBITDAre and Adjusted EBITDAre are supplemental, non-GAAP measures utilized by us in various financial ratios. The White Paper on EBITDAre, approved by Nareit's Board of Governors in September 2017, defines EBITDAre as net income (computed in accordance with GAAP), adjusted for interest expense, income tax (benefit) expense, depreciation and amortization, losses and gains on the disposition of depreciated property, impairment write-downs of depreciated property and investments in unconsolidated joint ventures, and adjustments to reflect the entity's share of EBITDAre of unconsolidated joint ventures. EBITDAre and Adjusted EBITDAre are presented to assist investors in the evaluation of REITs, as a measure of the Company's operational performance as they exclude various items that do not relate to or are not indicative of our operating performance and because they approximate key performance measures in our debt covenants. Accordingly, the Company believes that the use of EBITDAre and Adjusted EBITDAre, as opposed to income before income taxes, in various ratios provides meaningful performance measures related to the Company's ability to meet various coverage tests for the stated periods. Adjusted EBITDAre may include other adjustments not indicative of operating results as detailed in the Reconciliation of Net Income to EBITDAre and Adjusted EBITDAre included in the tables accompanying this press release. The Company also presents the ratio of net debt (net of cash) to annualized Adjusted EBITDAre as of September 30, 2025, and net debt (net of cash) to total market capitalization, which it believes is useful to investors as a supplemental measure in evaluating the Company's balance sheet leverage. The presentation of EBITDAre and Adjusted EBITDAre is consistent with EBITDA and Adjusted EBITDA as presented in prior periods.
The Company believes net income is the most directly comparable GAAP financial measure to the non-GAAP performance measures outlined above. Reconciliations of these measures to net income have been provided in the tables accompanying this press release.
Operating Metrics
The Company presents certain operating metrics related to our properties, including occupancy, leasing activity and rental rates. Operating metrics used by the Company are useful to investors in facilitating an understanding of the operational performance for our properties.
Recovery ratios represent the percentage of operating expenses recuperated through tenant reimbursements. This metric is presented on a same-property and same-property including redevelopment basis and is calculated by dividing tenant expense reimbursements (adjusted to exclude any ancillary income) by the sum of real estate taxes and property operating expenses.
Occupancy metrics represent the percentage of occupied gross leasable area based on executed leases (including properties in development and redevelopment) and include leases signed, but for which rent has not yet commenced. Same-property portfolio leased occupancy includes properties that have been owned and operated for the entirety of the reporting periods being compared, which total 65 and 63 properties for the three and nine months ended September 30, 2025 and 2024, respectively. Occupancy metrics presented for the Company's same-property portfolio exclude properties under development, redevelopment or that involve anchor repositioning where a substantial portion of the gross leasable area is taken out of service and also excludes properties acquired within the past 12 months or properties sold, and properties that are in the foreclosure process during the periods being compared.
Executed new leases, renewals and exercised options are presented on a same-space basis. Same-space leases represent those leases signed on spaces for which there was a previous lease.
The Company occasionally provides disclosures by tenant categories which include anchors, shops and industrial/self-storage. Anchors and shops are further broken down by local, regional and national tenants. We define anchor tenants as those who have a leased area of >10,000 sf. Local tenants are defined as those with less than five locations. Regional tenants are those with five or more locations in a single region. National tenants are defined as those with five or more locations and operate in two or more regions.
7
Reconciliation of Net Income to FFO and FFO as Adjusted
The following table reflects the reconciliation of net income to FFO and FFO as Adjusted for the three and nine months ended September 30, 2025 and 2024. Net income is considered the most directly comparable GAAP measure. Refer to "Non-GAAP Financial Measures" on page 6 for a description of FFO and FFO as Adjusted.
Three Months Ended September 30,
Nine Months Ended September 30,
(in thousands, except per share amounts)
2025
2024
2025
2024
Net income
$
15,541
$
9,467
$
84,716
$
43,936
Less net (income) loss attributable to noncontrolling interests in:
Consolidated subsidiaries
230
163
721
913
Operating partnership
(836)
(550)
(4,326)
(2,407)
Net income attributable to common shareholders
14,935
9,080
81,111
42,442
Adjustments:
Rental property depreciation and amortization
36,413
34,305
105,446
111,882
Limited partnership interests in operating partnership
836
550
4,326
2,407
Gain on sale of real estate
(233)
—
(49,695)
(15,349)
FFO Applicable to diluted common shareholders
51,951
43,935
141,188
141,382
FFO per diluted common share(1)
0.40
0.34
1.08
1.13
Adjustments to FFO:
Transaction, severance, litigation expenses and other, net(2)
363
773
4,538
1,154
Tenant bankruptcy settlement income
(3)
(105)
(11)
(115)
Non-cash adjustments(3)
(4,833)
82
(4,741)
2,389
Gain on extinguishment of debt
—
—
(323)
(21,427)
Impact of property in foreclosure
—
—
—
2,276
FFO as Adjusted applicable to diluted common shareholders
$
47,478
$
44,685
$
140,651
$
125,659
FFO as Adjusted per diluted common share(1)
$
0.36
$
0.35
$
1.08
$
1.01
Weighted Average diluted common shares(1)
130,742
128,186
130,621
124,889
(1) Weighted average diluted shares used to calculate FFO per share and FFO as Adjusted per share for the three and nine months ended September 30, 2025 and 2024 are higher than the GAAP weighted average diluted shares as a result of the dilutive impact of LTIP and OP units which may be redeemed for our common shares.
(2) Includes $0.8 million of transaction costs, $0.1 million of severance expense and $0.6 million of other income for the three months ended September 30, 2025. Includes $3.0 million of severance expense, $2.1 million of transaction costs and $0.6 million of other income for the nine months ended September 30, 2025.
(3) Includes the acceleration and write-off of lease intangibles related to high-risk tenants, terminations and bankruptcies, net of reinstatements for tenants moved back to accrual basis accounting.
8
Reconciliation of Net Income to NOI and Same-Property NOI
The following table reflects the reconciliation of net income to NOI, same-property NOI and same-property NOI including properties in redevelopment for the three and nine months ended September 30, 2025 and 2024. Net income is considered the most directly comparable GAAP measure. Refer to "Non-GAAP Financial Measures" on page 6 for a description of NOI and same-property NOI.
Three Months Ended September 30,
Nine Months Ended September 30,
(in thousands)
2025
2024
2025
2024
Net income
$
15,541
$
9,467
$
84,716
$
43,936
Depreciation and amortization
36,831
34,653
106,628
112,906
Interest and debt expense
19,374
19,531
58,666
62,004
General and administrative expense
8,976
9,415
30,224
27,829
Gain on extinguishment of debt
—
—
(323)
(21,427)
Other (income) expense
(40)
226
882
473
Income tax expense
600
518
1,862
1,722
Gain on sale of real estate
(233)
—
(49,695)
(15,349)
Interest income
(824)
(679)
(2,098)
(2,028)
Non-cash revenue and expenses
(7,761)
(3,633)
(13,795)
(7,174)
NOI
72,464
69,498
217,067
202,892
Adjustments:
Sunrise Mall net operating loss
134
687
769
1,681
Tenant bankruptcy settlement income and lease termination income
(98)
(1,555)
(167)
(1,602)
Non-same property NOI and other(1)
(9,863)
(8,451)
(36,950)
(30,246)
Same-property NOI
$
62,637
$
60,179
$
180,719
$
172,725
NOI related to properties being redeveloped
6,590
5,927
19,317
16,987
Same-property NOI including properties in redevelopment
$
69,227
$
66,106
$
200,036
$
189,712
(1) Non-same property NOI includes NOI related to properties being redeveloped and properties acquired, disposed, or that are in the foreclosure process during the periods being compared, and results of the Company's captive insurance program.
9
Reconciliation of Net Income to EBITDAre and Adjusted EBITDAre
The following table reflects the reconciliation of net income to EBITDAre and Adjusted EBITDAre for the three and nine months ended September 30, 2025 and 2024. Net income is considered the most directly comparable GAAP measure. Refer to "Non-GAAP Financial Measures" on page 6 for a description of EBITDAre and Adjusted EBITDAre.
Three Months Ended September 30,
Nine Months Ended September 30,
(in thousands)
2025
2024
2025
2024
Net income
$
15,541
$
9,467
$
84,716
$
43,936
Depreciation and amortization
36,831
34,653
106,628
112,906
Interest and debt expense
19,374
19,531
58,666
62,004
Income tax expense
600
518
1,862
1,722
Gain on sale of real estate
(233)
—
(49,695)
(15,349)
EBITDAre
72,113
64,169
202,177
205,219
Adjustments for Adjusted EBITDAre:
Transaction, severance, litigation expenses and other, net(1)
363
773
4,538
1,154
Gain on extinguishment of debt
—
—
(323)
(21,427)
Non-cash adjustments(2)
(4,833)
82
(4,741)
2,836
Impact of property in foreclosure
—
—
—
(561)
Tenant bankruptcy settlement income
(3)
(105)
(11)
(115)
Adjusted EBITDAre
$
67,640
$
64,919
$
201,640
$
187,106
(1) Includes $0.8 million of transaction costs, $0.1 million of severance expense and $0.6 million of other income for the three months ended September 30, 2025. Includes $3.0 million of severance expense, $2.1 million of transaction costs and $0.6 million of other income for the nine months ended September 30, 2025.
(2) Includes the acceleration and write-off of lease intangibles related to high-risk tenants, terminations and bankruptcies, net of reinstatements for tenants moved back to accrual basis accounting. The adjustment to EBITDAre in calculating Adjusted EBITDAre is inclusive of the portion attributable to the noncontrolling interest in Sunrise Mall.
10
ADDITIONAL INFORMATION
For a copy of the Company’s supplemental disclosure package, please access the "Investors" section of our website at www.uedge.com. Our website also includes other financial information, including our Annual Report on Form 10-K, Quarterly Reports on Form 10-Q, Current Reports on Form 8-K, and any amendments to those reports.
The Company uses, and intends to continue to use, the “Investors” page of its website, which can be found at www.uedge.com, as a means of disclosing material nonpublic information and of complying with its disclosure obligations under Regulation FD, including, without limitation, through the posting of investor presentations that may include material nonpublic information. Accordingly, investors should monitor the “Investors” page, in addition to following the Company's press releases, SEC filings, public conference calls, presentations and webcasts. The information contained on, or that may be accessed through, our website is not incorporated by reference into, and is not a part of, this document.
ABOUT URBAN EDGE
Urban Edge Properties is a NYSE listed real estate investment trust focused on owning, managing, acquiring, developing, and redeveloping retail real estate in urban communities, primarily in the Washington, D.C. to Boston corridor. Urban Edge owns 73 properties totaling 17.2 million square feet of gross leasable area.
FORWARD-LOOKING STATEMENTS
Certain statements contained herein constitute forward-looking statements as such term is defined in Section 27A of the Securities Act of 1933, as amended (the "Securities Act"), and Section 21E of the Securities Exchange Act of 1934, as amended (the "Exchange Act"). Forward-looking statements are not guarantees of future performance. They represent our intentions, plans, expectations and beliefs and are subject to numerous assumptions, risks and uncertainties. Our future results, financial condition, business and targeted occupancy may differ materially from those expressed in these forward-looking statements. You can identify many of these statements by words such as “approximates,” “believes,” “expects,” “anticipates,” “estimates,” “intends,” “plans,” “would,” “may” or other similar expressions in this press release. Many of the factors that will determine the outcome of forward-looking statements are beyond our ability to control or predict and include, among others: (i) macroeconomic conditions, including geopolitical conditions and instability, and international trade disputes, including any related tariffs, which may lead to rising inflation, adverse impacts to supply chain, and disruption of, or lack of access to, the capital markets, as well as potential volatility in the Company’s share price; (ii) the economic, political and social impact of, and uncertainty relating to, epidemics and pandemics; (iii) the loss or bankruptcy of major tenants; (iv) the ability and willingness of the Company’s tenants to renew their leases with the Company upon expiration and the Company’s ability to re-lease its properties on the same or better terms, or at all, in the event of non-renewal or in the event the Company exercises its right to replace an existing tenant; (v) the impact of e-commerce on our tenants’ business; (vi) the Company’s success in implementing its business strategy and its ability to identify, underwrite, finance, consummate and integrate diversifying acquisitions and investments; (vii) changes in general economic conditions or economic conditions in the markets in which the Company competes, and their effect on the Company’s revenues, earnings and funding sources, and on those of its tenants; (viii) increases in the Company’s borrowing costs as a result of changes in interest rates, rising inflation, and other factors; (ix) the Company’s ability to pay down, refinance, hedge, restructure or extend its indebtedness as it becomes due and potential limitations on the Company’s ability to borrow funds under its existing credit facility as a result of covenants relating to the Company’s financial results; (x) potentially higher costs associated with the Company’s development, redevelopment and anchor repositioning projects, and the Company’s ability to lease the properties at projected rates; (xi) the Company’s liability for environmental matters; (xii) damage to the Company’s properties from catastrophic weather and other natural events, and the physical effects of climate change; (xiii) the Company’s ability and willingness to maintain its qualification as a REIT in light of economic, market, legal, tax and other considerations; (xiv) information technology security breaches; (xv) the loss of key executives; and (xvi) the accuracy of methodologies and estimates regarding our environmental, social and governance (collectively, our Corporate Responsibility or “CR”) metrics, goals and targets, tenant willingness and ability to collaborate towards reporting CR metrics and meeting CR goals and targets, and the impact of governmental regulation on our CR efforts. For further discussion of factors that could materially affect the outcome of our forward-looking statements, see “Risk Factors” in Part I, Item 1A, of the Company's Annual Report on Form 10-K for the year ended December 31, 2024 and the other documents filed by the Company with the Securities and Exchange Commission (the "SEC").
We claim the protection of the safe harbor for forward-looking statements contained in the Private Securities Litigation Reform Act of 1995 for any forward-looking statements included in this press release. You are cautioned not to place undue reliance on forward-looking statements, which speak only as of the date of this press release. All subsequent written and oral forward-looking statements attributable to us or any person acting on our behalf are expressly qualified in their entirety by the cautionary statements contained or referred to in this section. We do not undertake any obligation to release publicly any revisions to our forward-looking statements to reflect events or circumstances occurring after the date of this press release.
11
URBAN EDGE PROPERTIES
ADDITIONAL INFORMATION
As of September 30, 2025
Basis of Presentation
The information contained in the Supplemental Disclosure Package does not purport to disclose all items required by GAAP and is unaudited. This Supplemental Disclosure Package should be read in conjunction with the Company's Annual Report on Form 10-K for the year ended December 31, 2024 and Quarterly Report on Form 10-Q for the quarter ended September 30, 2025. The results of operations of any property acquired are included in the Company's financial statements since the date of acquisition, although such properties may be excluded from certain metrics disclosed in this Supplemental Disclosure Package.
Non-GAAP Financial Measures and Forward-Looking Statements
For additional information regarding non-GAAP financial measures and forward-looking statements, please see pages 6 and 11 of this Supplemental Disclosure Package.
12
URBAN EDGE PROPERTIES
SUMMARY FINANCIAL RESULTS AND RATIOS
For the three and nine months ended September 30, 2025 (unaudited)
(in thousands, except per share, sf, rent psf and financial ratio data)
Three Months Ended
Nine Months Ended
Summary Financial Results
September 30, 2025
September 30, 2025
Total revenue
$
120,126
$
352,375
General & administrative expenses (G&A)
$
8,976
$
30,224
Recurring G&A(1)
$
8,092
$
25,165
Net income attributable to common shareholders
$
14,935
$
81,111
Earnings per diluted share
$
0.12
$
0.64
Adjusted EBITDAre(2)
$
67,640
$
201,640
Funds from operations (FFO)
$
51,951
$
141,188
FFO per diluted common share
$
0.40
$
1.08
FFO as Adjusted
$
47,478
$
140,651
FFO as Adjusted per diluted common share
$
0.36
$
1.08
Total dividends paid per share
$
0.19
$
0.57
Stock closing price low-high range (NYSE)
$18.54 to $21.21
$16.30 to $21.61
Weighted average diluted shares used in EPS computations(3)
125,803
125,869
Weighted average diluted common shares used in FFO computations(3)
130,742
130,621
Summary Property, Operating and Financial Data
# of Total properties / # of Retail properties
72 / 71
Gross leasable area (GLA) sf - retail portfolio(4)(5)
15,795,000
Weighted average annual rent psf - retail portfolio(4)(5)
$
21.41
Consolidated portfolio leased occupancy at end of period(6)
96.3
%
Consolidated retail portfolio leased occupancy at end of period(5)
96.3
%
Same-property portfolio leased occupancy at end of period(7)
96.6
%
97.1
%
Same-property physical occupancy at end of period(7)(8)
94.7
%
95.2
%
Same-property NOI growth(7)
4.1
%
4.6
%
Same-property NOI growth, including redevelopment properties
4.7
%
5.4
%
NOI margin(9)
65.4
%
64.8
%
Same-property expense recovery ratio(10)
85.6
%
87.4
%
Same-property, including redevelopment, expense recovery ratio(10)
84.2
%
85.7
%
New, renewal and option rent spread - cash basis(11)
20.6
%
14.0
%
New, renewal and option rent spread - GAAP basis(11)
25.2
%
17.7
%
Net debt to total market capitalization(12)
34.4
%
34.4
%
Net debt to Adjusted EBITDAre(12)
5.6
x
5.6
x
Adjusted EBITDAre to interest expense(2)
3.7
x
3.7
x
Adjusted EBITDAre to fixed charges(2)
3.1
x
3.0
x
(1) Recurring G&A excludes $0.8 million of transaction costs and $0.1 million of severance expense for the three months ended September 30, 2025 and $3.0 million of severance expense and $2.1 million of transaction costs for the nine months ended September 30, 2025.
(2) See computation on page 17.
(3) Weighted average diluted shares used to calculate FFO per share and FFO as Adjusted per share for three and nine months ended September 30, 2025 are higher than the GAAP weighted average diluted shares as a result of the dilutive impact of LTIP and OP units which may be redeemed for our common shares.
(4) GLA - retail portfolio excludes 1.2 million square feet for Sunrise Mall and 58,000 sf of self-storage.
(5) Our retail portfolio includes shopping centers and malls (excluding Sunrise Mall) and excludes self-storage.
(6) Excludes the impact of Sunrise Mall. Including Sunrise Mall, consolidated portfolio leased occupancy was 89.8%.
(7) See "Non-GAAP Financial Measures" on page 6 for the definition of same-property and same-property including redevelopment.
(8) Physical occupancy includes tenants that have access to their leased space and includes dark and paying tenants.
(9) Excludes the impact of Sunrise Mall. Including Sunrise Mall, NOI margin for the three and nine months ended September 30, 2025 was 65.1% and 64.3%, respectively.
(10) Excluding the impact of outlet centers and malls, same-property recovery ratio for the three and nine months ended September 30, 2025 was 89.7% and 91.9%, respectively (88.5% and 90.7% including properties in redevelopment).
(11) See computation on page 22.
(12) See computation for the quarter ended September 30, 2025 on page 19.
13
URBAN EDGE PROPERTIES
CONSOLIDATED BALANCE SHEETS
As of September 30, 2025 (unaudited) and December 31, 2024
(in thousands, except share and per share amounts)
September 30,
December 31,
2025
2024
ASSETS
Real estate, at cost:
Land
$
647,633
$
660,198
Buildings and improvements
2,822,238
2,791,728
Construction in progress
300,372
289,057
Furniture, fixtures and equipment
12,906
11,296
Total
3,783,149
3,752,279
Accumulated depreciation and amortization
(923,769)
(886,886)
Real estate, net
2,859,380
2,865,393
Operating lease right-of-use assets
60,486
65,491
Cash and cash equivalents
77,796
41,373
Restricted cash
66,998
49,267
Tenant and other receivables
24,226
20,672
Receivable arising from the straight-lining of rents
62,933
61,164
Identified intangible assets, net of accumulated amortization of $66,760 and $65,027, respectively
87,280
109,827
Deferred leasing costs, net of accumulated amortization of $21,871 and $22,488, respectively
30,977
27,799
Prepaid expenses and other assets
57,985
70,554
Total assets
$
3,328,061
$
3,311,540
LIABILITIES AND EQUITY
Liabilities:
Mortgages payable, net
$
1,632,163
$
1,569,753
Unsecured credit facility
—
50,000
Operating lease liabilities
57,822
62,585
Accounts payable, accrued expenses and other liabilities
88,789
89,982
Identified intangible liabilities, net of accumulated amortization of $57,487 and $50,275, respectively
163,686
177,496
Total liabilities
1,942,460
1,949,816
Commitments and contingencies
Shareholders’ equity:
Common shares: $0.01 par value; 500,000,000 shares authorized and 125,813,674 and 125,450,684 shares issued and outstanding, respectively
1,256
1,253
Additional paid-in capital
1,160,653
1,149,981
Accumulated other comprehensive (loss) income
(738)
177
Accumulated earnings
136,067
126,670
Noncontrolling interests:
Operating partnership
69,794
65,069
Consolidated subsidiaries
18,569
18,574
Total equity
1,385,601
1,361,724
Total liabilities and equity
$
3,328,061
$
3,311,540
14
URBAN EDGE PROPERTIES
CONSOLIDATED STATEMENTS OF INCOME
For the three and nine months ended September 30, 2025 and 2024 (unaudited)
(in thousands, except per share amounts)
Three Months Ended September 30,
Nine Months Ended September 30,
2025
2024
2025
2024
REVENUE
Rental revenue
$
119,196
$
112,262
$
351,200
$
328,167
Other income
930
165
1,175
432
Total revenue
120,126
112,427
352,375
328,599
EXPENSES
Depreciation and amortization
36,831
34,653
106,628
112,906
Real estate taxes
16,791
17,667
49,731
52,142
Property operating
18,070
18,422
58,333
57,188
General and administrative
8,976
9,415
30,224
27,829
Lease expense
3,320
3,433
9,981
9,676
Other expense
1,680
—
4,350
—
Total expenses
85,668
83,590
259,247
259,741
Gain on sale of real estate
233
—
49,695
15,349
Interest income
824
679
2,098
2,028
Interest and debt expense
(19,374)
(19,531)
(58,666)
(62,004)
Gain on extinguishment of debt
—
—
323
21,427
Income before income taxes
16,141
9,985
86,578
45,658
Income tax expense
(600)
(518)
(1,862)
(1,722)
Net income
15,541
9,467
84,716
43,936
Less net (income) loss attributable to noncontrolling interests in:
Operating partnership
(836)
(550)
(4,326)
(2,407)
Consolidated subsidiaries
230
163
721
913
Net income attributable to common shareholders
$
14,935
$
9,080
$
81,111
$
42,442
Earnings per common share - Basic:
$
0.12
$
0.07
$
0.65
$
0.35
Earnings per common share - Diluted:
$
0.12
$
0.07
$
0.64
$
0.35
Weighted average shares outstanding - Basic
125,729
123,359
125,643
120,109
Weighted average shares outstanding - Diluted
125,803
123,471
125,869
120,222
15
URBAN EDGE PROPERTIES
SUPPLEMENTAL SCHEDULE OF NET OPERATING INCOME
For the three and nine months ended September 30, 2025 and 2024
(in thousands)
Three Months Ended September 30,
Percent Change
Nine Months Ended September 30,
Percent Change
2025
2024
2025
2024
Composition of NOI(1)
Property rentals
$
81,099
$
80,097
$
242,609
$
234,225
Tenant expense reimbursements
30,809
29,259
96,801
87,484
Rental revenue deemed uncollectible
(515)
(618)
(2,027)
(630)
Total property revenue
111,393
108,738
2.4%
337,383
321,079
5.1%
Real estate taxes
(16,791)
(17,667)
(49,730)
(52,141)
Property operating
(18,372)
(18,908)
(59,232)
(58,633)
Lease expense
(2,435)
(2,665)
(7,353)
(7,413)
Other expense
(1,331)
—
(4,001)
—
Total property operating expenses
(38,929)
(39,240)
(0.8)%
(120,316)
(118,187)
1.8%
NOI(1)
$
72,464
$
69,498
4.3%
$
217,067
$
202,892
7.0%
NOI margin (NOI / Total property revenue)(2)
65.1
%
63.9
%
64.3
%
63.2
%
Same-property NOI(1)(3)
Property rentals
$
69,606
$
67,469
$
200,268
$
193,322
Tenant expense reimbursements
27,516
25,835
83,456
75,893
Rental revenue deemed uncollectible
(393)
(417)
(1,772)
(445)
Total property revenue
96,729
92,887
281,952
268,770
Real estate taxes
(15,383)
(15,311)
(43,614)
(43,656)
Property operating
(16,695)
(15,185)
(51,604)
(45,883)
Lease expense
(2,014)
(2,212)
(6,015)
(6,506)
Total property operating expenses
(34,092)
(32,708)
(101,233)
(96,045)
Same-property NOI(1)(3)
$
62,637
$
60,179
4.1%
$
180,719
$
172,725
4.6%
NOI related to properties being redeveloped(3)
6,590
5,927
19,317
16,987
Same-property NOI including properties in redevelopment(1)
$
69,227
$
66,106
4.7%
$
200,036
$
189,712
5.4%
Same-property physical occupancy
94.7
%
94.2
%
95.2
%
94.1
%
Same-property leased occupancy
96.6
%
96.8
%
97.1
%
96.8
%
Number of properties included in same-property analysis
65
63
(1) NOI excludes non-cash revenue and expenses and includes lease termination income which is adjusted out for the purposes of calculating same-property NOI. Refer to page 9 for a reconciliation of net income to NOI and same-property NOI.
(2) Includes the impact of Sunrise Mall. Excluding Sunrise Mall, NOI margin for the three and nine months ended September 30, 2025 was 65.4% and 64.8%, respectively.
(3) Excludes NOI related to properties acquired, disposed, or that are in the foreclosure process in the comparative periods, Sunrise Mall, and results of the company's captive insurance program.
16
URBAN EDGE PROPERTIES
EARNINGS BEFORE INTEREST, TAXES, DEPRECIATION and AMORTIZATION for REAL ESTATE (EBITDAre)
For the three and nine months ended September 30, 2025 and 2024
(in thousands)
Three Months Ended September 30,
Nine Months Ended September 30,
2025
2024
2025
2024
Net income
$
15,541
$
9,467
$
84,716
$
43,936
Depreciation and amortization
36,831
34,653
106,628
112,906
Interest expense
18,110
18,401
55,062
58,817
Amortization of deferred financing costs
1,264
1,130
3,604
3,187
Income tax expense
600
518
1,862
1,722
Gain on sale of real estate
(233)
—
(49,695)
(15,349)
EBITDAre
72,113
64,169
202,177
205,219
Adjustments for Adjusted EBITDAre:
Transaction, severance, litigation expenses and other, net(1)
363
773
4,538
1,154
Gain on extinguishment of debt
—
—
(323)
(21,427)
Non-cash adjustments(2)
(4,833)
82
(4,741)
2,836
Tenant bankruptcy settlement income
(3)
(105)
(11)
(115)
Impact of property in foreclosure
—
—
—
(561)
Adjusted EBITDAre
$
67,640
$
64,919
$
201,640
$
187,106
Interest expense
$
18,110
$
18,401
$
55,062
$
58,817
Adjusted EBITDAre to interest expense
3.7
x
3.5
x
3.7
x
3.2
x
Fixed charges
Interest expense
$
18,110
$
18,401
$
55,062
$
58,817
Scheduled principal amortization
3,963
3,545
11,335
10,690
Total fixed charges
$
22,073
$
21,946
$
66,397
$
69,507
Adjusted EBITDAre to fixed charges
3.1
x
3.0
x
3.0
x
2.7
x
(1) Includes $0.8 million of transaction costs, $0.1 million of severance expense and $0.6 million of other income for the three months ended September 30, 2025. Includes $3.0 million of severance expense, $2.1 million of transaction costs and $0.6 million of other income for the nine months ended September 30, 2025.
(2) Includes the acceleration and write-off of lease intangibles related to high-risk tenants, terminations and bankruptcies, net of reinstatements for tenants moved back to accrual basis accounting. The adjustment to EBITDAre in calculating Adjusted EBITDAre is inclusive of the portion attributable to the noncontrolling interest in Sunrise Mall.
17
URBAN EDGE PROPERTIES
FUNDS FROM OPERATIONS
For the three and nine months ended September 30, 2025
(in thousands, except per share amounts)
Three Months Ended September 30, 2025
Nine Months Ended September 30, 2025
(in thousands)
(per share)(1)
(in thousands)
(per share)(1)
Net income
$
15,541
$
0.12
$
84,716
$
0.65
Less net (income) loss attributable to noncontrolling interests in:
Consolidated subsidiaries
230
—
721
0.01
Operating partnership
(836)
(0.01)
(4,326)
(0.03)
Net income attributable to common shareholders
14,935
0.11
81,111
0.63
Adjustments:
Rental property depreciation and amortization
36,413
0.28
105,446
0.81
Limited partnership interests in operating partnership(2)
836
0.01
4,326
0.03
Gain on sale of real estate
(233)
—
(49,695)
(0.38)
FFO applicable to diluted common shareholders
51,951
0.40
141,188
1.08
Adjustments to FFO:
Transaction, severance, litigation expenses and other, net(3)
363
—
4,538
0.03
Non-cash adjustments(4)
(4,833)
(0.04)
(4,741)
(0.04)
Gain on extinguishment of debt
—
—
(323)
—
Tenant bankruptcy settlement income
(3)
—
(11)
—
FFO as Adjusted applicable to diluted common shareholders
$
47,478
$
0.36
$
140,651
$
1.08
Weighted average diluted shares used to calculate EPS
125,803
125,869
Assumed conversion of OP and LTIP Units to common shares
4,939
4,752
Weighted average diluted common shares - FFO
130,742
130,621
(1) Individual items may not add up due to total rounding.
(2) Represents earnings allocated to LTIP and OP unitholders for unissued common shares, which have been included for purposes of calculating earnings per diluted share for the periods presented because they are dilutive.
(3) Includes $0.8 million of transaction costs, $0.1 million of severance expense and $0.6 million of other income for the three months ended September 30, 2025. Includes $3.0 million of severance expense, $2.1 million of transaction costs and $0.6 million of other income for the nine months ended September 30, 2025.
(4) Includes the acceleration and write-off of lease intangibles related to high-risk tenants, terminations and bankruptcies, net of reinstatements for tenants moved back to accrual basis accounting.
18
URBAN EDGE PROPERTIES
MARKET CAPITALIZATION, DEBT RATIOS AND LIQUIDITY
As of September 30, 2025
(in thousands, except share amounts and market price)
September 30, 2025
Closing market price of common shares
$
20.47
Basic common shares
125,813,674
OP and LTIP units
6,768,984
Diluted common shares
132,582,658
Equity market capitalization
$
2,713,967
Total consolidated debt(1)
$
1,646,464
Cash and cash equivalents including restricted cash
(144,794)
Net debt
$
1,501,670
Net Debt to annualized Adjusted EBITDAre(2)
5.6
x
Total consolidated debt(1)
$
1,646,464
Equity market capitalization
2,713,967
Total market capitalization
$
4,360,431
Net debt to total market capitalization at applicable market price
34.4
%
Cash and cash equivalents including restricted cash
$
144,794
Available under unsecured credit facility(3)
767,835
Total liquidity
$
912,629
(1) Total consolidated debt excludes unamortized debt issuance costs of $14.3 million.
(2) Net debt to Adjusted EBITDAre is calculated based on third quarter 2025 annualized Adjusted EBITDAre.
(3) Availability is net of letters of credit issued. The Company obtained eight letters of credit aggregating $32.2 million which were provided to mortgage lenders and other entities to secure its obligations for certain capital requirements. As of September 30, 2025, the Company has no outstanding borrowings under its unsecured line of credit.
19
URBAN EDGE PROPERTIES
ADDITIONAL DISCLOSURES
(in thousands)
Three Months Ended September 30,
Nine Months Ended September 30,
Rental Revenue:
2025
2024
2025
2024
Property rentals
$
88,934
$
83,661
$
256,640
$
241,424
Tenant expense reimbursements
30,777
29,219
96,587
87,373
Rental revenue deemed uncollectible
(515)
(618)
(2,027)
(630)
Total rental revenue
$
119,196
$
112,262
$
351,200
$
328,167
Three Months Ended September 30,
Nine Months Ended September 30,
Composition of Property Rentals:
2025
2024
2025
2024
Minimum rent
$
80,018
$
77,482
$
240,331
$
230,301
Non-cash revenues(1)
7,839
3,669
14,043
7,315
Percentage rent
982
1,060
2,110
2,322
Lease termination income(1)
95
1,450
156
1,486
Total property rentals
$
88,934
$
83,661
$
256,640
$
241,424
Three Months Ended September 30,
Nine Months Ended September 30,
Certain Non-Cash Items:
2025
2024
2025
2024
Straight-line rents(2)
$
706
$
886
$
1,870
$
2,389
Amortization of below-market lease intangibles, net(2)
7,133
2,783
12,173
4,926
Lease expense GAAP adjustments(3)
(78)
(36)
(248)
(142)
Amortization of deferred financing costs(4)
(1,264)
(1,130)
(3,604)
(3,187)
Capitalized interest(4)
3,388
2,393
9,160
7,700
Share-based compensation expense(5)
(2,726)
(2,716)
(8,999)
(7,579)
Capital Expenditures:(6)
Development and redevelopment costs
$
19,117
$
18,060
$
45,841
$
44,664
Maintenance capital expenditures
7,824
6,033
21,821
16,839
Leasing commissions
1,319
941
4,124
3,984
Tenant improvements and allowances
2,639
893
6,461
4,147
Total capital expenditures
$
30,899
$
25,927
$
78,247
$
69,634
(1) Amounts are excluded from the calculation of NOI and same-property NOI with the exception of lease termination income which is included in portfolio NOI and excluded from the calculation of same-property NOI. See page 9 for a reconciliation of net income to NOI and same-property NOI.
(2) Amounts included in the financial statement line item "Rental revenue" on the consolidated statements of income.
(3) Amounts consist of amortization of below-market ground lease intangibles and straight-line lease expense, and are included in the financial statement line item "Lease expense" on the consolidated statements of income.
(4) Amounts included in the financial statement line item "Interest and debt expense" on the consolidated statements of income.
(5) Amounts included in the financial statement line item "General and administrative" on the consolidated statements of income.
(6) Amounts presented on a cash basis.
20
URBAN EDGE PROPERTIES
TENANT CONCENTRATION - TOP TWENTY-FIVE TENANTS
As of September 30, 2025
Tenant
Number of stores
Square feet
% of total square feet
Annualized base rent ("ABR")
% of total ABR
Weighted average ABR per square foot
Average remaining term of ABR(1)
The TJX Companies(2)
28
873,159
5.1%
$
18,663,686
5.7%
$
21.37
4.4
Burlington
11
532,514
3.1%
9,828,699
3.0%
18.46
4.6
Kohl's
9
855,561
5.0%
9,807,066
3.0%
11.46
5.3
Best Buy
9
412,305
2.4%
9,533,005
2.9%
23.12
5.2
Lowe's Companies
6
976,415
5.7%
9,271,256
2.8%
9.50
4.9
The Home Depot
5
538,742
3.2%
9,189,305
2.8%
17.06
12.3
Walmart
5
780,788
4.6%
9,098,422
2.8%
11.65
7.1
ShopRite
5
361,053
2.1%
6,826,508
2.1%
18.91
9.7
PetSmart
11
237,034
1.4%
6,531,901
2.0%
27.56
4.5
Dick's Sporting Goods(3)
10
299,811
1.8%
6,499,997
2.0%
21.68
6.3
BJ's Wholesale Club
4
454,297
2.7%
6,340,989
1.9%
13.96
4.6
Amazon(4)
4
183,923
1.1%
6,059,412
1.9%
32.95
6.2
The Gap(5)
14
208,937
1.2%
5,780,106
1.8%
27.66
3.6
Target Corporation
4
476,146
2.8%
5,565,190
1.7%
11.69
7.1
LA Fitness
6
271,496
1.6%
5,375,443
1.6%
19.80
5.2
Bob's Discount Furniture
6
226,221
1.3%
4,716,422
1.4%
20.85
6.6
Nordstrom
4
132,460
0.8%
4,327,307
1.3%
32.67
6.7
Ahold Delhaize (Stop & Shop)
3
212,216
1.2%
3,952,820
1.2%
18.63
5.1
AMC
1
85,000
0.5%
3,267,502
1.0%
38.44
4.3
Ulta
8
83,679
0.5%
3,070,549
0.9%
36.69
3.5
24 Hour Fitness
1
53,750
0.3%
2,700,000
0.8%
50.23
6.3
Five Below
10
93,578
0.5%
2,694,682
0.8%
28.80
4.4
DSW
6
117,766
0.7%
2,630,519
0.8%
22.34
4.4
Anthropologie
1
31,450
0.2%
2,531,725
0.8%
80.50
3.0
Planet Fitness
5
101,046
0.6%
2,495,296
0.8%
24.69
5.3
Total/Weighted Average
176
8,599,347
50.4%
$
156,757,807
47.8%
$
18.23
5.8
(1) In years excluding tenant renewal options. The weighted average is based on ABR.
(2) Includes Marshalls (16), T.J. Maxx (5), HomeGoods (3), HomeSense (3), and Sierra Trading Post (1).
(3) Includes Dick's Sporting Goods (4), Golf Galaxy (2), Foot Locker (2) Public Lands (1), and Champs (1).
(4) Includes Whole Foods (2) and Amazon Fresh (2).
(5) Includes Old Navy (10), Gap (3), and Banana Republic (1).
Note: Amounts shown in the table above include all retail properties, including those in redevelopment. Amounts are presented on a cash basis other than tenants in free rent periods which are shown at their initial cash rent. The table excludes executed leases that have not yet rent commenced.
21
URBAN EDGE PROPERTIES
LEASING ACTIVITY
For the three and nine months ended September 30, 2025
Three Months Ended September 30, 2025
Nine Months Ended September 30, 2025
Year Ended December 31, 2024
GAAP(2)
Cash(1)
GAAP(2)
Cash(1)
GAAP(2)
Cash(1)
New Leases
Number of new leases executed
11
11
44
44
79
79
Total square feet
81,801
81,801
288,121
288,121
485,153
485,153
Number of same space leases
9
9
31
31
55
55
Same space square feet
76,007
76,007
168,294
168,294
334,972
334,972
Prior rent per square foot
$
17.57
$
18.31
$
22.58
$
23.14
$
21.28
$
22.23
New rent per square foot
$
32.02
$
29.49
$
34.90
$
32.00
$
31.34
$
27.95
Same space weighted average lease term (years)
9.8
9.8
9.6
9.6
12.3
12.3
Same space TIs per square foot
N/A
$
39.92
N/A
$
42.80
N/A
$
30.27
Rent spread
82.3
%
61.0
%
54.6
%
38.3
%
47.3
%
25.7
%
Renewals & Options
Number of leases executed
20
20
71
71
86
86
Total square feet
264,724
264,724
974,202
974,202
1,910,688
1,910,688
Number of same space leases
20
20
71
71
84
84
Same space square feet
264,724
264,724
974,202
974,202
1,682,610
1,682,610
Prior rent per square foot
$
18.56
$
18.56
$
20.28
$
20.28
$
17.90
$
17.94
New rent per square foot
$
20.36
$
20.24
$
22.44
$
22.14
$
19.92
$
19.60
Same space weighted average lease term (years)
6.8
6.8
5.5
5.5
5.6
5.6
Same space TIs per square foot
N/A
$
—
N/A
$
0.31
N/A
$
0.10
Rent spread
9.7
%
9.1
%
10.7
%
9.2
%
11.3
%
9.3
%
Total New Leases and Renewals & Options
Number of leases executed
31
31
115
115
165
165
Total square feet
346,525
346,525
1,262,323
1,262,323
2,395,841
2,395,841
Number of same space leases
29
29
102
102
139
139
Same space square feet
340,731
340,731
1,142,496
1,142,496
2,017,582
2,017,582
Prior rent per square foot
$
18.34
$
18.50
$
20.62
$
20.70
$
18.46
$
18.65
New rent per square foot
$
22.96
$
22.30
$
24.27
$
23.59
$
21.82
$
20.98
Same space weighted average lease term (years)
7.5
7.5
6.1
6.1
6.7
6.7
Same space TIs per square foot
N/A
$
8.91
N/A
$
6.57
N/A
$
5.11
Rent spread
25.2
%
20.6
%
17.7
%
14.0
%
18.2
%
12.5
%
(1) Rents are not calculated on a straight-line (GAAP) basis. Previous/expiring rent is the rent at expiry. New rent is the rent paid at commencement.
(2) Rents are calculated on a straight-line (GAAP) basis.
22
URBAN EDGE PROPERTIES
LEASES EXECUTED BUT NOT YET RENT COMMENCED
As of September 30, 2025
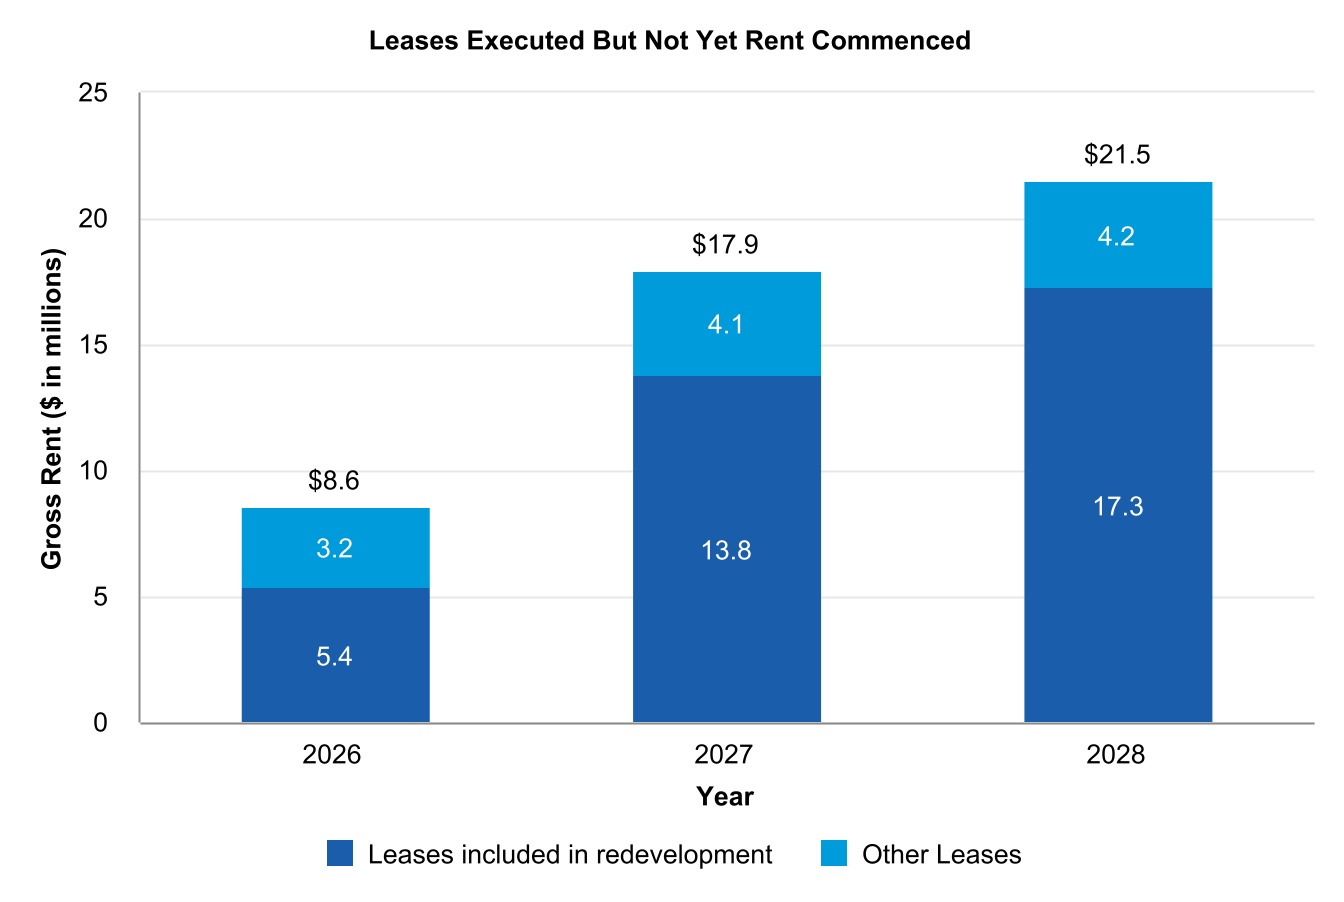
The Company has signed leases that have not yet rent commenced that are expected to generate an incremental $21.5 million of future annual gross rent, representing approximately 7% of annualized NOI as of September 30, 2025. Approximately $17.3 million of this amount pertains to leases included in Active Redevelopment Projects on page 30. National and regional tenants represent approximately 96% of the leased but not yet rent commenced pipeline. We expect to recognize approximately $0.3 million of these future gross rents in the fourth quarter of 2025. The below table illustrates the incremental gross rent expected to be recognized in the next three years, in the respective periods, from commencement of these leases.
Gross rents illustrated in the table above and their impact on same-property metrics in the respective years, based on the current 2025 same-property pool, are as follows:
(in thousands)
2025(1)
2026
2027
2028
Same-property
$
300
$
7,600
$
12,400
$
13,500
(1) Remainder of 2025.
The below table summarizes the changes in annualized gross rent from leases executed but not yet rent commenced since June 30, 2025:
(in thousands)
Annualized Gross Rent
Leases executed but not yet rent commenced as of June 30, 2025
$
23,800
Less: Leases commenced during the third quarter
(5,600)
Plus: Leases executed during the third quarter
3,300
Leases executed but not yet rent commenced as of September 30, 2025
$
21,500
23
URBAN EDGE PROPERTIES
RETAIL PORTFOLIO LEASE EXPIRATION SCHEDULE
As of September 30, 2025
ANCHOR TENANTS (SF>=10,000)
SHOP TENANTS (SF<10,000)
TOTAL TENANTS
Year(1)
# of leases
Square Feet
% of Total SF
Weighted Avg ABR PSF(2)
# of leases
Square Feet
% of Total SF
Weighted Avg ABR PSF(2)
# of leases
Square Feet
% of Total SF
Weighted Avg ABR PSF(2)
M-T-M
—
—
—%
$
—
25
73,000
2.6%
$
28.75
25
73,000
0.5%
$
28.75
2025
2
44,000
0.3%
15.61
16
39,000
1.4%
39.44
18
83,000
0.5%
26.81
2026
11
220,000
1.7%
24.44
82
234,000
8.4%
40.86
93
454,000
2.9%
32.90
2027
28
1,036,000
8.0%
13.26
115
351,000
12.6%
37.19
143
1,387,000
8.8%
19.32
2028
28
945,000
7.3%
20.71
86
279,000
10.0%
43.33
114
1,224,000
7.7%
25.87
2029
60
2,436,000
18.7%
21.40
105
352,000
12.7%
43.77
165
2,788,000
17.7%
24.23
2030
45
2,315,000
17.8%
13.11
61
228,000
8.2%
44.12
106
2,543,000
16.1%
15.89
2031
26
1,529,000
11.7%
15.63
57
205,000
7.4%
37.35
83
1,734,000
11.0%
18.20
2032
11
331,000
2.5%
16.89
49
160,000
5.8%
35.43
60
491,000
3.1%
22.93
2033
22
722,000
5.5%
18.81
39
137,000
4.9%
39.56
61
859,000
5.4%
22.12
2034
21
828,000
6.4%
20.34
44
161,000
5.8%
38.64
65
989,000
6.3%
23.32
2035
16
714,000
5.5%
19.67
46
176,000
6.3%
38.18
62
890,000
5.6%
23.33
Thereafter
32
1,524,000
11.8%
18.17
42
179,000
6.4%
37.53
74
1,703,000
10.7%
20.21
Subtotal/Average
302
12,644,000
97.2%
$
17.68
767
2,574,000
92.5%
$
39.72
1,069
15,218,000
96.3%
$
21.41
Vacant
11
369,000
2.8%
N/A
94
208,000
7.5%
N/A
105
577,000
3.7%
N/A
Total/Average
313
13,013,000
100.0%
N/A
861
2,782,000
100.0%
N/A
1,174
15,795,000
100.0
%
N/A
(1) Year of expiration excludes tenant renewal options.
(2) Weighted average annual base rent per square foot is calculated by annualizing tenants' base cash rent, including ground rent, and excludes tenant reimbursements and concessions and storage rent.
Note: Amounts shown in the table above include both current leases and signed leases that have not commenced on vacant spaces for all retail properties (excludes Sunrise Mall and includes properties in redevelopment) and excludes 58,000 sf of self-storage space.
24
URBAN EDGE PROPERTIES
RETAIL PORTFOLIO LEASE EXPIRATION SCHEDULE ASSUMING EXERCISE OF ALL OPTIONS
As of September 30, 2025
ANCHOR TENANTS (SF>=10,000)
SHOP TENANTS (SF<10,000)
TOTAL TENANTS
Year(1)
# of leases
Square Feet
% of Total SF
Weighted Avg ABR PSF(2)
# of leases
Square Feet
% of Total SF
Weighted Avg ABR PSF(2)
# of leases
Square Feet
% of Total SF
Weighted Avg ABR PSF(2)
M-T-M
—
—
—%
$
—
25
73,000
2.6%
$
28.75
25
73,000
0.5%
$
28.75
2025
2
44,000
0.3%
15.61
14
37,000
1.3%
39.65
16
81,000
0.5%
26.59
2026
5
92,000
0.7%
23.20
59
141,000
5.1%
49.02
64
233,000
1.5%
38.82
2027
6
100,000
0.8%
17.28
66
145,000
5.2%
41.84
72
245,000
1.6%
31.82
2028
5
229,000
1.8%
19.34
47
132,000
4.7%
44.29
52
361,000
2.3%
28.46
2029
14
364,000
2.8%
23.00
54
155,000
5.6%
47.07
68
519,000
3.3%
30.19
2030
12
381,000
2.9%
18.37
35
118,000
4.2%
42.70
47
499,000
3.2%
24.13
2031
6
216,000
1.7%
18.83
39
117,000
4.2%
41.39
45
333,000
2.1%
26.76
2032
4
160,000
1.2%
22.83
38
123,000
4.4%
38.17
42
283,000
1.8%
29.50
2033
14
318,000
2.4%
30.14
24
71,000
2.6%
59.93
38
389,000
2.5%
35.58
2034
20
641,000
4.9%
23.39
45
168,000
6.0%
42.90
65
809,000
5.1%
27.44
2035
11
184,000
1.4%
23.36
23
90,000
3.2%
46.13
34
274,000
1.7%
30.84
Thereafter
203
9,915,000
76.3%
23.72
298
1,204,000
43.4%
50.00
501
11,119,000
70.2%
26.57
Subtotal/Average
302
12,644,000
97.2%
$
23.42
767
2,574,000
92.5%
$
46.66
1,069
15,218,000
96.3%
$
27.35
Vacant
11
369,000
2.8%
N/A
94
208,000
7.5%
N/A
105
577,000
3.7%
N/A
Total/Average
313
13,013,000
100.0%
N/A
861
2,782,000
100.0%
N/A
1,174
15,795,000
100.0%
N/A
(1) Year of expiration includes tenant renewal options.
(2) Weighted average annual base rent per square foot is calculated by annualizing tenants' base cash rent, including ground rent, and excludes tenant reimbursements and concessions and storage rent and is adjusted for assumed exercised options using option rents specified in the underlying leases. Weighted average annual base rent for leases whose future option rent is based on fair market value or CPI is reported at the last stated option rent in the respective lease.
Note: Amounts shown in table above include both current leases and signed leases that have not commenced on vacant spaces for all retail properties (excludes Sunrise Mall and includes properties in redevelopment) and excludes 58,000 sf of self-storage space.
25
URBAN EDGE PROPERTIES
PROPERTY STATUS REPORT
As of September 30, 2025
(dollars in thousands, except per sf amounts)
Property
Total Square Feet (1)
Percent Leased(1)
Weighted Average ABR PSF(2)
Mortgage Debt(6)
Major Tenants
RETAIL PORTFOLIO:
California:
Walnut Creek (Mt. Diablo)(4)
7,000
100.0%
$70.56
—
Sweetgreen
Walnut Creek (Olympic)
31,000
100.0%
80.50
—
Anthropologie
Connecticut:
Newington Commons
189,000
90.0%
10.52
$15,559
Walmart, Bob's Discount Furniture
Maryland:
Goucher Commons
155,000
100.0%
26.49
—
Sprouts, HomeGoods, Five Below, Ulta, Kirkland's, DSW, Golf Galaxy, La-Z-Boy (lease not commenced)
Rockville Town Center
98,000
100.0%
13.34
—
Regal Entertainment Group
The Village at Waugh Chapel(5)
382,000
95.1%
24.48
$55,605
Safeway, Marshalls, HomeGoods, T.J. Maxx, LA Fitness
Wheaton (leased through 2060)(3)
66,000
100.0%
18.35
—
Best Buy
Woodmore Towne Centre
712,000
98.5%
18.57
$117,200
Costco, Wegmans, At Home, Best Buy, LA Fitness, Nordstrom Rack
Massachusetts:
Cambridge (leased through 2033)(3)
48,000
100.0%
28.58
—
PetSmart, Central Rock Gym
Gateway Center
640,000
99.6%
9.65
—
Costco, Target, Home Depot, Total Wine, Boot Barn (lease not commenced)
Shoppers World
752,000
100.0%
22.99
$123,600
T.J. Maxx, Marshalls, HomeSense, Sierra Trading, Public Lands, Golf Galaxy, Nordstrom Rack, Hobby Lobby, AMC, Kohl's, Best Buy
The Shops at Riverwood
79,000
100.0%
27.31
$20,675
Price Rite, Planet Fitness, Goodwill
Wonderland Marketplace
140,000
100.0%
14.30
—
Planet Fitness, Marshalls, Burlington, Get Air
Missouri:
Manchester Plaza
131,000
100.0%
12.18
$12,500
Pan-Asia Market, Academy Sports, Bob's Discount Furniture
New Hampshire:
Salem (leased through 2102)(3)
39,000
100.0%
10.82
—
Fun City
New Jersey:
Bergen Town Center - East(5)
209,000
100.0%
20.40
—
Lowe's, Best Buy
Bergen Town Center - West
1,005,000
96.0%
33.89
$288,622
Target, Whole Foods Market, Burlington, Marshalls, Nordstrom Rack, Saks Off 5th, HomeGoods, H&M, Bloomingdale's Outlet, Nike Factory Store, Old Navy, Kohl's, World Market
Briarcliff Commons
180,000
100.0%
25.12
$30,000
Uncle Giuseppe's, Kohl's
Brick Commons
281,000
100.0%
22.62
$50,000
ShopRite, Kohl's, Marshalls, Old Navy
Brunswick Commons
427,000
100.0%
16.17
$63,000
Lowe's, Kohl's, Dick's Sporting Goods, P.C. Richard & Son, T.J. Maxx, LA Fitness
Carlstadt Commons (leased through 2050)(3)
78,000
98.3%
21.74
—
Food Bazaar
Garfield Commons
298,000
100.0%
16.75
$38,324
Walmart, Burlington, Marshalls, PetSmart, Ulta
Greenbrook Commons
170,000
100.0%
20.20
$31,000
BJ's Wholesale Club, Aldi
Hackensack Commons
275,000
100.0%
26.44
$66,400
The Home Depot, 99 Ranch, Staples, Petco
Hanover Commons
343,000
100.0%
23.84
$59,245
The Home Depot, Dick's Sporting Goods, Saks Off Fifth, Marshalls
Heritage Square
87,000
100.0%
31.74
—
HomeSense, Sierra Trading Post, Ulta
Hudson Commons
236,000
96.1%
14.46
—
Lowe's, P.C. Richard & Son, Boot Barn (lease not commenced)
Hudson Mall
359,000
80.8%
21.11
—
Marshalls, Retro Fitness, Staples, Old Navy, Burlington (lease not commenced), national off-price retailer (lease not commenced)
Bob's Discount Furniture, Ross Dress for Less, Marshalls, Petco, Wren Kitchen
Wyomissing (leased through 2065)(3)
76,000
100.0%
16.56
—
LA Fitness, PetSmart
South Carolina:
Charleston (leased through 2063)(3)
45,000
100.0%
15.96
—
Best Buy
Virginia:
Norfolk (leased through 2069)(3)
114,000
100.0%
8.56
—
BJ's Wholesale Club
Puerto Rico:
Shops at Caguas
356,000
96.7%
32.78
$80,380
Sector Sixty6, Old Navy, Foot Locker
The Outlets at Montehiedra(5)
538,000
97.4%
24.54
$71,959
Ralph's Food Warehouse, The Home Depot, Marshalls, Caribbean Cinemas, Old Navy, T.J. Maxx, Burlington
Total Retail Portfolio
15,795,000
96.3%
$21.41
$1,646,464
Sunrise Mall(4)(5)(7)
1,228,000
5.1%
20.27
—
Dick's Sporting Goods
Total Urban Edge Properties
17,023,000
89.8%
$21.40
$1,646,464
(1) Percent leased is expressed as the percentage of gross leasable area subject to a lease, excluding temporary tenants. The Company excludes 58,000 sf of self-storage from the report above.
(2) Weighted average annual base rent per square foot including ground leases and executed leases for which rent has not commenced is calculated by annualizing tenants' current base rent (excluding any free rent periods), and excluding tenant reimbursements, concessions and storage rent. Excluding the ground leases where the Company is the lessor, the weighted average annual base rent per square foot for our retail portfolio is $23.97 per square foot.
(3) The Company is a lessee under a ground or building lease. The total square feet disclosed for the building will revert to the lessor upon lease expiration.
(4) We own 95% of Walnut Creek (Mt. Diablo) and 82.5% of Sunrise Mall with the remaining portions in each case owned by joint venture partners.
(5) Not included in the same-property pool for the purposes of calculating same-property metrics for the quarters ended September 30, 2025 and 2024.
(7) A portion of the property is under a ground lease through 2069.
28
URBAN EDGE PROPERTIES
PROPERTY ACQUISITIONS AND DISPOSITIONS
For the nine months ended September 30, 2025
(dollars in thousands)
2025 Property Acquisitions:
Date Acquired
Property Name
City
State
GLA
Price
None.
2025 Property Dispositions:
Date Disposed
Property Name
City
State
GLA
Price
4/25/2025
Bergen Town Center East(1)
Paramus
NJ
44,000
$
25,000
6/9/2025
Kennedy Commons
North Bergen
NJ
62,000
$
23,200
6/23/2025
MacDade Commons
Glenolden
PA
102,000
$
18,000
(1) Sold a portion of the property.
29
URBAN EDGE PROPERTIES
DEVELOPMENT, REDEVELOPMENT AND ANCHOR REPOSITIONING PROJECTS
As of September 30, 2025
(in thousands, except square footage data)
Active Projects
Estimated Gross Cost(1)
Incurred as of 9/30/25
Target Stabilization(2)
Description and Status
Bruckner Commons (Phase A)(5)
$
51,300
$
35,900
2Q27
Retenanting a portion of the former Kmart box with BJ's Wholesale Club
Bruckner Commons (Phase B)(5)
18,400
3,100
4Q26
Redeveloping Toys "R" Us box with 20,000 sf of retail and restaurant pads
Hudson Mall (Phase A)(3)
11,500
8,700
2Q26
Retenanting former Toys "R" Us box with Burlington
Yonkers Gateway Center (Phase C)(3)
8,400
1,000
1Q27
Redemising multiple suites for national grocer and Hallmark relocation
Manalapan Commons (Phase B)(3)
7,500
5,700
2Q26
Backfilling vacant Bed Bath & Beyond with Nordstrom Rack (open) and Fidelity
Bergen Town Center (Phase F)(3)
7,500
400
2Q27
Developing new 10,000± sf pad full service restaurant
Totowa Commons (Phase A)(3)
5,700
5,500
4Q25
Backfilling former Bed Bath & Beyond box with Tesla (open)
Kingswood Crossing (Phase A)(3)
5,300
4,400
4Q26
Adding 17,000± sf Emblem Health
Millburn Gateway Center(3)
3,900
100
3Q27
Retenanting portion of vacant Motion Fitness with Barry's Bootcamp and small shops
Bergen Town Center (Phase G)(3)
3,600
600
4Q26
Adding Capon's Burgers and Tatte Bakery & Cafe
Bergen Town Center (Phase E)(3)
3,400
3,200
4Q25
Backfilling vacant Midas space with First Watch (open)
Hudson Mall (Phase B)(3)
3,100
100
2Q27
Retenanting former Big Lots with national off-price retailer
Totowa Commons (Phase B)(3)
3,100
1,000
1Q26
Retenanting vacant Marshalls with 27,000 sf Lidl and 18,000 sf Boot Barn
Plaza at Woodbridge (Phase A)(3)
2,700
1,500
1Q26
Retenanting 17,000± sf of former Bed Bath & Beyond with Trader Joe's and national off-price retailer
Yonkers Gateway Center (Phase B)(3)
2,600
2,300
4Q25
Relocating Red Wing Shoes, adding Dave's Hot Chicken into vacant shop space and expanding Best Buy in former Red Wing Shoes
The Outlets at Montehiedra (Phase B)(5)
2,200
1,300
1Q26
Developing new 6,000± sf pad for Texas Roadhouse
Broomall Commons(5)
1,800
100
3Q26
Backfilling vacant anchor with Picklr
Woodmore Towne Centre (Phase A)(3)
1,700
500
3Q26
New pad for free standing Bank of America
Ledgewood Commons(3)
1,500
100
3Q26
Developing new restaurant pad for Tommy's Tavern + Tap
Plaza at Cherry Hill (Phase C)(3)
1,400
900
1Q26
Backfilling vacant space with 10,000 sf Big Blue Swim
Bergen Town Center (Phase G)(3)
1,400
100
3Q26
Retenanting vacancy with Adidas
Plaza at Woodbridge (Phase B)(3)
1,100
100
4Q27
Expanding existing ExtraSpace self-storage by 13,000± sf in vacant space
Total
$
149,100
(4)
$
76,600
(1) Estimated gross cost includes the allocation of internal costs such as labor, interest and taxes.
(2) Target Stabilization reflects the first quarter in which at least 80% of the expected NOI from the project has commenced. A project achieving Target Stabilization is classified as Completed whether or not all costs have been expended and remains listed as a Completed project for one year in the table on page 31. The Target Stabilization date is an estimate and is subject to change resulting from uncertainties inherent in the development process and not wholly under the Company's control.
(3) Results from these properties are included in our same-property metrics for the quarter ended September 30, 2025.
(4) The estimated, unleveraged yield for total Active Projects is 15% based on total estimated project costs and the incremental, unleveraged NOI directly attributable to the projects unless otherwise noted. The incremental, unleveraged NOI for Active Projects excludes NOI generated outside the project scope such as the impact on future lease rollovers or on the long-term value of the property. The unleveraged yield for projects related to vacant spaces is based on the total NOI directly attributable to the project and the estimated project costs.
(5) Results from these properties are included in our same-property including redevelopment metrics for the quarter ended September 30, 2025.
30
URBAN EDGE PROPERTIES
DEVELOPMENT, REDEVELOPMENT AND ANCHOR REPOSITIONING PROJECTS
As of September 30, 2025
(in thousands, except square footage data)
Completed Projects
Estimated Gross Cost(1)
Incurred as of 9/30/25
Stabilization(2)
Description
Newington Commons(3)
$
1,400
$
1,400
3Q25
Backfilled former Staples with Bob's Discount Furniture
Marlton Commons(3)
7,300
6,900
2Q25
Redeveloped Friendly's with new 11,000± sf multi-tenant pad (First Watch, Cava, and Mattress Firm)
Brick Commons(3)
5,300
5,300
2Q25
Replaced Santander Bank with two quick service restaurants (Shake Shack and First Watch)
The Outlets at Montehiedra (Phase E)(6)
5,000
5,000
2Q25
Backfilled Tiendas Capri with 33,000 sf Burlington
Walnut Creek(3)
3,300
3,300
2Q25
Retenanted former Z Gallerie with Sweetgreen and Ronbow
Huntington Commons (Phase D)(3)
2,200
2,200
2Q25
Retenanted former bank pad with Starbucks and Yoga Six
The Outlets at Montehiedra (Phase C)(6)
10,800
10,600
1Q25
Demised and retenanted former Kmart box with Ralph's Food Warehouse and Urology Hub
Amherst Commons(3)
3,100
3,000
1Q25
Backfilled vacant anchor with Ross Dress for Less and Bob's Discount Furniture
Bergen Town Center (Phase D)(3)
2,300
2,300
1Q25
Backfilled former Neiman Marcus with World Market
Bergen Town Center (Phase C)(3)
1,700
800
1Q25
Backfilled vacant restaurant spaces with Ani Ramen and Bluestone Lane
Manalapan Commons (Phase A)(3)
1,600
1,500
1Q25
Backfilled vacant A.C. Moore space with 18,000 sf Atlantic Health
The Outlets at Montehiedra (Phase D)(6)
4,600
4,600
4Q24
Retenanted 24,000 sf of vacant Kmart box with T.J. Maxx
Total
$
48,600
(4)
$
46,900
Future Redevelopment(5)
Location
Opportunity
Brunswick Commons(3)
East Brunswick, NJ
Develop new pad
Hudson Mall(3)
Jersey City, NJ
Reposition mall with retail and amenity upgrades and consideration of alternate uses
The Plaza at Cherry Hill(3)
Cherry Hill, NJ
Renovate exterior of center and common areas and upgrade tenancy
Sunrise Mall
Massapequa, NY
Redevelop mall including consideration of alternate uses
(1) Estimated gross cost includes the allocation of internal costs such as labor, interest and taxes.
(2) Stabilization reflects the first quarter in which at least 80% of the expected NOI from the project has commenced. A project achieving Stabilization is classified as Completed whether or not all costs have been expended and remains listed as a Completed project for one year in the table above.
(3) Results from these properties are included in our same-property metrics for the quarter ended September 30, 2025.
(4) The estimated unleveraged yield for Completed projects is 17% based on total estimated project costs and the incremental, unleveraged NOI directly attributable to the projects unless otherwise noted. The incremental, unleveraged NOI for Completed projects excludes NOI generated outside the project scope such as the impact on future lease rollovers or on the long-term value of the property. The unleveraged yield for projects related to vacant spaces as a result of bankruptcy is based on the total NOI directly attributable to the project and the estimated project costs.
(5) The Company has identified future redevelopment opportunities which are, or will soon be, in planning phases and as such, may not ultimately become active projects. Proceeding with these investments is subject to many factors outside of the Company's control, and it is possible that municipal or other approvals may delay or suspend our ability to proceed with such plans. The execution of these projects is discretionary and we are under no current obligation to fund these projects.
(6) Results from these properties are included in our same-property including redevelopment metrics for the quarter ended September 30, 2025.
31
URBAN EDGE PROPERTIES
DEBT SUMMARY
As of September 30, 2025 and December 31, 2024
(in thousands)
September 30, 2025
December 31, 2024
Secured fixed rate debt
$
1,646,464
$
1,532,915
Secured variable rate debt
—
50,905
Unsecured variable rate debt
—
50,000
Total debt
$
1,646,464
$
1,633,820
% Secured fixed rate debt
100.0
%
93.8
%
% Secured variable rate debt
—
%
3.1
%
% Unsecured variable rate debt
—
%
3.1
%
Total
100
%
100
%
Secured mortgage debt
$
1,646,464
$
1,583,820
Unsecured debt(1)
—
50,000
Total debt
$
1,646,464
$
1,633,820
% Secured mortgage debt
100.0
%
96.9
%
% Unsecured debt
—
%
3.1
%
Total
100
%
100
%
Weighted average remaining maturity on secured mortgage debt
4.1 years
4.7 years
Weighted average remaining maturity on unsecured debt
N/A
3.1 years
Total market capitalization (see page 19)
$
4,360,431
% Secured mortgage debt
37.8
%
% Unsecured debt
—
%
Total debt: Total market capitalization
37.8
%
Weighted average interest rate on secured mortgage debt(2)
5.03
%
5.04
%
Weighted average interest rate on unsecured debt(2)
—
%
5.47
%
Total debt
5.03
%
5.05
%
Note: All amounts and calculations exclude unamortized debt issuance costs on mortgages payable.
(1) As of September 30, 2025, there were no outstanding borrowings under our unsecured $800 million line of credit. The agreement has a maturity date of February 9, 2027 with two six-month extension options. Borrowings under the agreement bear interest at the Secured Overnight Financing Rate ("SOFR") plus an applicable margin of 1.03% to 1.50% and an annual facility fee of 15 to 30 basis points based on our current leverage ratio. At September 30, 2025, the applicable margin was 1.03% over SOFR. As of September 30, 2025, the Company had obtained eight letters of credit issued under the line of credit aggregating $32.2 million which were provided to mortgage lenders and other entities to secure its obligations for certain capital requirements. The letters of credit remain undrawn but have reduced the amount available under the facility commensurate with their face values.
(2) Weighted average interest rate is calculated based on balances outstanding at the respective dates.
32
URBAN EDGE PROPERTIES
MORTGAGE DEBT SUMMARY
As of September 30, 2025 and December 31, 2024
(dollars in thousands)
Property
Maturity Date
Rate
September 30, 2025
December 31, 2024
Percent of Mortgage Debt at
September 30, 2025
West End Commons
12/10/2025
3.99
%
$
23,345
$
23,717
1.4
%
Town Brook Commons
12/1/2026
3.78
%
29,129
29,610
1.8
%
Rockaway River Commons
12/1/2026
3.78
%
25,790
26,215
1.6
%
Hanover Commons
12/10/2026
4.03
%
59,245
60,155
3.6
%
Tonnelle Commons
4/1/2027
4.18
%
93,862
95,286
5.7
%
Manchester Plaza
6/1/2027
4.32
%
12,500
12,500
0.8
%
Millburn Gateway Center
6/1/2027
3.97
%
21,143
21,525
1.3
%
Plaza at Woodbridge(1)
6/8/2027
—
%
—
50,905
—
%
Totowa Commons
12/1/2027
4.33
%
50,800
50,800
3.1
%
Woodbridge Commons
12/1/2027
4.36
%
22,100
22,100
1.3
%
Brunswick Commons
12/6/2027
4.38
%
63,000
63,000
3.8
%
Rutherford Commons
1/6/2028
4.49
%
23,000
23,000
1.4
%
Hackensack Commons
3/1/2028
4.36
%
66,400
66,400
4.0
%
Marlton Commons
12/1/2028
3.86
%
35,480
36,024
2.2
%
Yonkers Gateway Center
4/10/2029
6.30
%
50,000
50,000
3.0
%
Ledgewood Commons
5/5/2029
6.03
%
50,000
50,000
3.0
%
Shops at Riverwood
6/24/2029
4.25
%
20,675
20,958
1.3
%
Shops at Bruckner
7/1/2029
6.00
%
36,978
37,350
2.2
%
Shopper's World(2)
8/15/2029
5.12
%
123,600
—
7.5
%
Greenbrook Commons
9/1/2029
6.03
%
31,000
31,000
1.9
%
Huntington Commons
12/5/2029
6.29
%
43,704
43,704
2.7
%
Bergen Town Center
4/10/2030
6.30
%
288,622
290,000
17.6
%
The Outlets at Montehiedra
6/1/2030
5.00
%
71,959
73,551
4.4
%
Montclair(3)
8/15/2030
3.15
%
7,238
7,250
0.4
%
Garfield Commons
12/1/2030
4.14
%
38,324
38,886
2.3
%
The Village at Waugh Chapel(4)
12/1/2031
3.76
%
55,605
55,071
3.4
%
Brick Commons
12/10/2031
5.20
%
50,000
50,000
3.0
%
Woodmore Towne Centre
1/6/2032
3.39
%
117,200
117,200
7.1
%
Newington Commons
7/1/2033
6.00
%
15,559
15,719
0.9
%
Shops at Caguas
8/1/2033
6.60
%
80,380
81,504
4.9
%
Briarcliff Commons
10/1/2034
5.47
%
30,000
30,000
1.8
%
Mount Kisco Commons(5)
11/15/2034
6.40
%
9,826
10,390
0.6
%
Total mortgage debt
5.03
%
$
1,646,464
$
1,583,820
100.0
%
Total unamortized debt issuance costs
(14,301)
(14,067)
Total mortgage debt, net
$
1,632,163
$
1,569,753
(1)The Company paid off the loan prior to maturity on June 26, 2025.
(2)Bears interest at SOFR plus 170 bps. The variable component of the debt is hedged with an interest rate swap agreement, fixing the rate at 5.12%, which expires at the maturity of the loan.
(3)Bears interest at SOFR plus 257 bps. The fixed and variable components of the debt are hedged with an interest rate swap agreement, fixing the rate at 3.15%, which expires at the maturity of the loan.
(4)The mortgage payable balance includes unamortized debt mark-to-market discount of $4.4 million.
(5)The mortgage payable balance includes unamortized debt mark-to-market discount of $0.6 million.
33
URBAN EDGE PROPERTIES
DEBT MATURITY SCHEDULE
As of September 30, 2025
(dollars in thousands)
Year
Amortization
Balloon Payments
Revolving Credit Facilities(1)
Premium/(Discount) Amortization
Total
Weighted Average Interest rate at maturity
Percent of Debt Maturing
2025(2)
$
4,056
$
23,258
$
—
$
(193)
$
27,121
4.2%
1.6
%
2026
16,543
111,228
—
(774)
126,997
4.1%
7.7
%
2027
13,611
259,526
—
(774)
272,363
4.3%
16.5
%
2028
13,539
122,402
—
(773)
135,168
4.4%
8.2
%
2029
12,402
348,590
—
(773)
360,219
5.7%
21.9
%
2030
6,668
372,252
—
(773)
378,147
5.8%
23.0
%
2031
3,741
110,000
—
(713)
113,028
4.5%
6.9
%
2032
3,986
117,200
—
(60)
121,126
3.5%
7.4
%
2033
2,986
78,094
—
(60)
81,020
6.5%
4.9
%
Thereafter
1,333
30,000
—
(58)
31,275
5.5%
2.0
%
Total
$
78,865
$
1,572,550
$
—
$
(4,951)
$
1,646,464
5.0%
100
%
Unamortized debt issuance costs
(14,301)
Total outstanding debt, net
$
1,632,163
(1) Our $800 million revolving credit facility matures on February 9, 2027, plus two six-month extensions at our option, to February 9, 2028.