REGISTRATION STATEMENT PURSUANT TO SECTION 12(b) OR (g) OF THE SECURITIES EXCHANGE ACT OF 1934
OR
☒
ANNUAL REPORT PURSUANT TO SECTION 13 OR 15(d) OF THE SECURITIES EXCHANGE ACT OF 1934
For the fiscal year ended December 31, 2024
OR
☐
TRANSITION REPORT PURSUANT TO SECTION 13 OR 15(d) OF THE SECURITIES EXCHANGE ACT OF 1934
OR
☐
SHELL COMPANY REPORT PURSUANT TO SECTION 13 OR 15(d) OF THE SECURITIES EXCHANGE ACT OF 1934
Date of event requiring this shell company report ………………………….
Commission file number 001-38965
INTERCORP FINANCIAL SERVICES INC.
(Exact name of Registrant as specified in its charter)
INTERCORP FINANCIAL SERVICES INC.
(Translation of Registrant’s name into English)
REPUBLIC OF PANAMA
(Jurisdiction of incorporation or organization)
Intercorp Financial Services Inc.
Torre Interbank, Av. Carlos Villarán 140
La Victoria
Lima13, Peru
(Address of principal executive offices)
Michela Casassa Ramat
Intercorp Financial Services Inc.
Torre Interbank, Av. Carlos Villarán 140
La Victoria
Lima13, Peru
Telephone: (511) 219-2000 ext. 22110
E-mail: mcasassa@intercorp.com.pe
(Name, telephone, e-mail and/or facsimile number and address of company contact person)
Securities registered or to be registered pursuant to Section 12(b) of the Act:
Title of each class
Trading
Symbol(s)
Name of each exchange on which registered
Common Shares
IFS
NYSE and Lima
Securities registered or to be registered pursuant to Section 12(g) of the Act:
None
(Title of Class)
Securities for which there is a reporting obligation pursuant to Section 15(d) of the Act:
None
(Title of Class)
Indicate the number of outstanding shares of each of the issuer’s classes of capital or common stock as of the close of the period covered by the annual report:
Common shares outstanding as of December 31, 2024: 113,288,457
Indicate by check mark if the registrant is a well-known seasoned issuer, as defined in Rule 405 of the Securities Act.
☒Yes ☐ No
If this report is an annual or transition report, indicate by check mark if the registrant is not required to file reports pursuant to Section 13 or 15 (d) of the Securities Exchange Act of 1934.
☐ Yes ☒No
Indicate by check mark whether the registrant (1) has filed all reports required to be filed by Section 13 or 15(d) of the Securities Exchange Act of 1934 during the preceding 12 months (or for such shorter period that the registrant was required to file such reports), and (2) has been subject to such filing requirements for the past 90 days.
☒Yes ☐ No
Indicate by check mark whether the registrant has submitted electronically every Interactive Data File required to be submitted pursuant to Rule 405 of Regulation S-T (§232.405 of this chapter) during the preceding 12 months (or for such shorter period that the registrant was required to submit such files)
☒Yes☐ No
Indicate by check mark whether the registrant is a large accelerated filer, an accelerated filer, a non-accelerated filer, or an emerging growth company. See definition of “large accelerated filer,” “accelerated filer,” and “emerging growth company” in Rule 12b-2 of the Exchange Act.
Large accelerated filer☒
Accelerated filer ☐
Non-accelerated filer ☐
Emerging growth company ☐
If an emerging growth company that prepares its financial statements in accordance with U.S. GAAP, indicate by check mark if the registrant has elected not to use the extended transition period for complying with any new or revised financial accounting standards† provided pursuant to Section 13(a) of the Exchange Act. ☐
† The term “new or revised financial accounting standard” refers to any update issued by the Financial Accounting Standards Board to its Accounting Standards Codification after April 5, 2012.
Indicate by check mark whether the registrant has filed a report on and attestation to its management’s assessment of the effectiveness of its internal control over financial reporting under Section 404(b) of the Sarbanes-Oxley Act (15 U.S.C. 7262(b)) by the registered public accounting firm that prepared or issued its audit report. ☒
If securities are registered pursuant to Section 12(b) of the Act, indicate by check mark whether the financial statements of the registrant included in the filing reflect the correction of an error to previously issued financial statements. ☐
Indicate by check mark whether any of those error corrections are restatements that required a recovery analysis of incentive-based compensation received by any of the registrant’s executive officers during the relevant recovery period pursuant to §240.10D-1(b). ☐
Indicate by check mark which basis of accounting the registrant has used to prepare the financial statements included in this filing:
U.S. GAAP ☐
International Financial Reporting Standards as issued
Other ☐
by the International Accounting Standards Board
☒
If “Other” has been checked in response to the previous question, indicate by check mark which financial statement item the registrant has elected to follow.
☐ Item 17 ☐ Item 18
If this is an annual report, indicate by check mark whether the registrant is a shell company (as defined in Rule 12b-2 of the Exchange Act).
☐ Yes ☒ No
(APPLICABLE ONLY TO ISSUERS INVOLVED IN BANKRUPTCY PROCEEDINGS DURING THE PAST FIVE YEARS)
Indicate by check mark whether the registrant has filed all documents and reports required to be filed by Sections 12, 13 or 15(d) of the Securities Exchange Act of 1934 subsequent to the distribution of securities under a plan confirmed by a court. ☐ Yes ☐ No
All references to “we”, “us”, “our company”, and “IFS” in this Annual Report on Form 20-F are to Intercorp Financial Services Inc., a corporation (sociedad anónima) organized under the laws of the Republic of Panama (“Panama”).
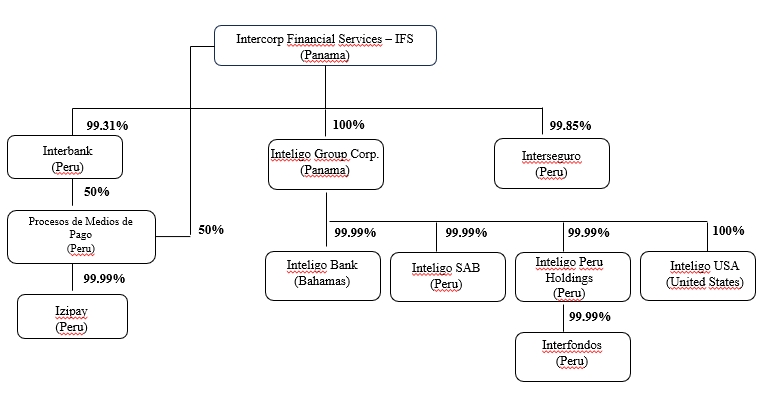
In this Annual Report on Form 20-F, we refer to and the discussion of our business includes the business of our principal subsidiaries as follows: (i) in our banking segment: Banco Internacional del Perú, S.A.A.—Interbank, an open-stock corporation (sociedad anónima abierta) organized under the laws of Peru, as “Interbank”; (ii) in our insurance segment: Interseguro Compañía de Seguros, S.A., a corporation (sociedad anónima) organized under the laws of Peru, as “Interseguro”; (iii) in our wealth management segment: Inteligo Group Corp., a corporation (sociedad anónima) organized under the laws of Panama, as “Inteligo”; Inteligo Bank Ltd., a corporation organized under the laws of The Bahamas, as “Inteligo Bank”; Inteligo Sociedad Agente de Bolsa S.A., a corporation (sociedad anónima) organized under the laws of Peru, as “Inteligo SAB”; Inteligo USA Inc., a corporation organized under the laws of New York, as “Inteligo USA,” and Interfondos S.A. Sociedad Administradora de Fondos, a corporation organized under the laws of Peru, as “Interfondos SAFM” or “Interfondos”; and (iv) Procesos de Medios de Pago S.A., a corporation (sociedad anónima) organized under the laws of Peru, as “PMP” and its subsidiary Izipay S.A.C., a closed-stock corporation (sociedad anónima cerrada) organized under the laws of Peru, as “Izipay,” both of which are IFS’ consolidated subsidiaries since April 2022. Except otherwise provided, references to Izipay shall include PMP.
In this Annual Report on Form 20-F, we also refer to our parent company, Intercorp Perú Ltd. (“Intercorp Peru” or “Intercorp”), a holding company for a group of companies operating mainly in Peru under the name “Intercorp”. Intercorp Peru’s main subsidiaries include our company and Intercorp Retail Inc. (“Intercorp Retail”). Intercorp Retail acts as a holding company for the retail and real estate operations of Intercorp Peru in Peru. Through its subsidiary, InRetail Peru Corp., whose shares are listed on the Lima Stock Exchange under the symbol “INRETC1,” Intercorp Retail has controlling stakes in (i) Supermercados Peruanos S.A. (“Supermercados Peruanos”), an operating supermarket chain that consolidates other operating companies, primarily operating under the: “Plaza Vea,” “Vivanda,” “MASS” and “Makro” brands, (ii) InRetail Pharma S.A., a holding company consisting of a chain of pharmacies operating under the “Inkafarma” and “MiFarma” brands with a distribution and marketing business as well as manufacturing some pharmaceutical products and (iii) InRetail Real Estate Corp., an owner, developer and operator of shopping malls under the “Real Plaza” brand. Intercorp Retail also controls directly (a) Tiendas Peruanas S.A., a department store chain operating under the “Oechsle” brand that started operations in 2009, (b) Financiera Oh! S.A., a consumer finance company that started operations in 2010, and (c) Homecenters Peruanos S.A. (“Homecenters Peruanos”), a home improvement company operating under the “Promart” brand. Our parent company Intercorp Peru also controls the following companies involved in the private education and healthcare businesses under the following brands: “Innova Schools,” “Zegel,” “UTP,” “IDAT” and “Aviva”.
1
SUMMARY OF RISK FACTORS
An investment in our common shares is subject to a number of risks, including risks relating to the nature of our business as a holding company of banking, insurance, financial institutions, and payments institutions, our operations in Peru and our common shares. The following list summarizes some, but not all, of these risks. Please read the information in the section entitled “Risk Factors” for a more thorough description of these and other risks.
Risks Relating to Our Businesses
•
We are a holding company and all of our operations are conducted through our subsidiaries. Our ability to pay corporate expenses and to pay dividends, if any, to holders of our common shares depends on the ability of our subsidiaries to pay dividends and make other distributions to us.
•
As a holding company, our right to receive any distribution of assets of our subsidiaries will be effectively subordinated to the rights of our subsidiaries’ creditors, and holders of our common shares may have limited recourse against our subsidiaries’ assets in case of our liquidation.
•
Our subsidiaries are subject to extensive regulation and supervision, and changes in existing regulations or the implementation of future regulations may have a material adverse effect on our financial condition and results of operations.
•
Enhanced ESG and climate change disclosure may impose additional costs on us or our subsidiaries.
•
The operations of our subsidiaries require the maintenance of banking, insurance and other licenses and any non-compliance with applicable licenses and operating obligations could have a material adverse effect on our business, financial condition and results of operations.
•
Under certain circumstances, the SBS, the SMV, the Superintendency of Banks of Panama or the Central Bank of The Bahamas, as applicable, may intervene in our subsidiaries’ operations in order to prevent, control and reduce the effects of a failure of our operations.
•
The adoption of new international banking and insurance guidelines may cause our subsidiaries to require additional capital and could cause their cost of funds to increase, which could have a material adverse effect on our financial condition and results of operations.
•
We are subject to regulatory capital requirements imposed by the SBS, and failure to comply with these requirements could have a material adverse effect on our financial condition and results of operations.
•
Our subsidiaries face intense competition from other banking, insurance and financial institutions, and from other players including providers of emerging financial technologies and failure to compete successfully could have a material adverse effect on our financial condition and results of operations.
•
The failure of our subsidiaries to effectively anticipate or adapt to emerging technologies or changes in customer behavior could have a material adverse effect on our financial conditions and results of operations.
•
The banking and insurance markets are exposed to macroeconomic shocks that could have a material adverse effect on our financial condition and results of operations.
•
We could sustain losses if Interbank’s asset quality declines.
•
Reduced diversification in Interbank’s loan portfolio could have a material adverse effect on our financial condition and results of operations.
•
Interbank’s provisions for loan losses may not be adequate to cover the future losses to its loan portfolio or other assets, which could have a material adverse effect on our financial condition and results of operations.
2
•
Interbank may be unable to realize the collateral or guarantees securing its loans to cover the outstanding principal and interest balance of those loans, which may adversely affect our results of operations and financial condition.
•
Our financial results may be negatively affected by changes to International Financial Reporting Standards ("IFRS Accounting Standards").
•
Our financial results may be negatively affected by investment losses.
•
Interest rate changes could have a material adverse effect on our financial condition and results of operations.
•
Interseguro is exposed to the impact of changes in interest rates on other comprehensive income.
•
Actual mortality and morbidity rates and other factors may differ from those assumed in the calculation of technical reserves and may have a material adverse effect on Interseguro’s financial condition and results of operations.
•
Interbank may not be able to obtain the funding required to support growth and implement its strategy.
•
A reduction in our subsidiaries’ credit ratings could increase their cost of borrowing funds and make their ability to raise new funds and renew maturing debt more difficult.
•
Interseguro’s failure to underwrite and price insurance premiums accurately for the products it offers would have a material adverse effect on its financial condition and results of operations.
•
Interbank’s and Interseguro’s reliance on Peruvian sovereign and global bonds in their respective investment portfolios leaves us vulnerable to a default on such debt.
•
Interseguro may suffer losses in its investment portfolio because of risks associated with its real estate investments.
•
Tax exemptions applicable to a substantial portion of Interseguro’s investment earnings could be changed in the future.
•
We and our subsidiaries are dependent on key personnel.
•
Interruption, mismanagement or failure in our subsidiaries’ information technology systems may adversely affect their operations.
•
Cybersecurity events could negatively affect our reputation or results of operations and may result in litigation.
•
Our subsidiaries are susceptible to fraud, unauthorized transactions and operational errors.
•
Our existing insurance coverage may be insufficient and future coverage may be difficult or expensive to obtain.
•
Our subsidiaries' employees could join labor unions and our subsidiaries could be subject to organized labor actions, including work stoppages that could have a material adverse effect on their business.
•
Our trademarks and trade names may be misappropriated or challenged by others.
•
Any failure to comply with anti-corruption, anti-bribery, anti-money laundering and anti-terrorist financing and antitrust laws and regulations could damage our reputation or expose us to penalties.
•
We and our subsidiaries are subject to litigation and other legal, administrative and regulatory proceedings.
•
Legal restrictions on our clients may reduce the demand for our services.
•
Our risk management structure may not be fully effective.
3
•
Implementation of tax laws related to the global minimum tax may increase our subsidiaries’ tax liabilities, and, as a result, have a material and adverse effect on us.
•
Disruptive innovation by fintechs and insurtechs may result in increased competition, and as a result, have a material and adverse effect on our subsidiaries.
•
Transition to a low-carbon economy may have a material and adverse effect on our subsidiaries’ results of operations.
•
Public health crises and epidemics/pandemics could adversely affect our and our subsidiaries’ business, financial condition and results of operations.
Risks Relating to Peru
•
Economic, social and political developments in Peru, including political instability, social unrest, inflation and unemployment, could have a material adverse effect on our businesses.
•
Fluctuations in the value of the sol could have a material adverse effect on our financial condition and results of operations.
•
A downgrade in Peru’s credit ratings may affect the perception of Peru and its economy and consequently adversely affect us.
•
Potential exchange controls implemented by the Peruvian government could adversely affect our ability to pay dividends and have a material adverse effect on our financial condition and results of operations.
•
Increased inflation in Peru could have an adverse effect on the Peruvian long-term credit market as well as the Peruvian economy generally and, therefore, on our financial condition and results of operations.
•
The stability of the Peruvian financial system depends on public confidence in Peruvian banking and financial institutions.
•
The Peruvian economy could be adversely affected by economic developments in regional or global markets.
•
A decline in the prices of certain commodities in the international markets could have a material adverse effect on our financial condition and results of operations.
•
The market volatility generated by distortions in the international financial markets may affect the Peruvian capital markets and the Peruvian banking system.
•
The operations of Interbank, Interseguro, Interfondos, Inteligo SAB and Izipay could be adversely affected by earthquakes, floodings or other natural disasters.
•
Corruption and ongoing high profile corruption investigations may hinder the growth of the Peruvian economy and have a negative impact on our business and operations.
•
Changes in tax laws may increase our tax liabilities and, as a result, have a material and adverse effect on us.
•
The dollarization of the Peruvian economy hampers monetary policy, which in turn may have an effect on our business.
•
The 2026 general elections in Peru may result in political and electoral uncertainty in Peru.
Risks Relating to the Common Shares
•
There may be a lack of liquidity and market for our common shares.
•
The price of our common shares may be volatile.
•
We may raise additional capital in the future through the issuance of equity securities, which may result in dilution of the interests of our shareholders.
4
•
The significant share ownership of our controlling shareholder may conflict with the interests of the holders of our common shares and may have an adverse effect on the future market price of our shares.
•
Holders of our common shares may have fewer and less well-defined rights than shareholders of a company organized in other jurisdictions, such as the United States.
•
Holders of our common shares may have difficulty enforcing judgments against us, our officers and directors.
•
Judgments of Peruvian courts with respect to our common shares will be payable only in soles.
•
We are subject to different corporate disclosure and accounting standards than those holders of our common shares may be familiar with in the United States.
•
We could be considered a passive foreign investment company ("PFIC") for U.S. federal income tax purposes, which could result in adverse U.S. tax consequences for U.S. investors.
•
One or more of our subsidiaries could be classified as a PFIC for U.S. federal income tax purposes.
•
If we are unable to maintain effective internal control over financial reporting in the future, our results of operations and the price of our common shares could be adversely affected.
•
The requirements of being a public company may strain our resources, divert management’s attention and affect our ability to attract and retain qualified board members or executive officers.
•
Our status as a foreign private issuer allows us to follow alternate standards to the corporate governance standards of the NYSE, which may limit the protections afforded to investors.
•
If securities or industry analysts do not actively follow our business, or if they publish unfavorable research about our business, the price and trading volume of our common shares could decline.
•
Future offerings of debt or preferred securities may limit our operating and financial flexibility and may materially adversely affect the market price of, and dilute the value of, the common shares.
•
Peruvian corporations, including our subsidiaries, may be jointly and severally liable for any unpaid Peruvian capital gains tax related to the transfer of the common shares.
5
FORWARD-LOOKING STATEMENTS
This Annual Report on Form 20-F contains forward-looking statements. All statements other than statements of historical facts included in this Annual Report on Form 20-F regarding our business, financial condition, results of operations and certain of our plans, objectives, assumptions, projections, expectations or beliefs and statements regarding other future events or prospects are forward-looking statements. These statements include, without limitation, those concerning: our strategy and our ability to achieve it; expectations regarding sales, profitability and growth; our possible or assumed future results of operations; capital expenditures and investment plans; adequacy of capital; and financing plans. In addition, this Annual Report on Form 20-F includes forward-looking statements relating to our potential exposure to various types of market risks, such as macroeconomic risk, Peru specific risks, foreign exchange rate risk, interest rate risks and other risks related to our financial performance. The words “aim,” “may,” “will,” “expect,” “is expected to,” “anticipate,” “believe,” “future,” “continue,” “help,” “estimate,” “plan,” “schedule,” “intend,” “should,” “would be,” “seeks,” “estimates,” “shall,” or the negative or other variations thereof, as well as other similar expressions regarding matters that are not historical facts, are or may indicate forward–looking statements.
We have based these forward-looking statements on our management’s current views with respect to future events and financial performance. These views reflect the best judgment of our management but involve a number of risks and uncertainties which could cause actual results to differ materially from those predicted in our forward–looking statements and from past results, performance or achievements. Although we believe that the estimates reflected in the forward-looking statements are reasonable, such estimates may prove to be incorrect. By their nature, forward-looking statements involve risk and uncertainty because they relate to events and depend on circumstances that will occur in the future. There are a number of factors that could cause actual results and developments to differ materially from those expressed or implied by these forward-looking statements. These factors include, among other things:
•
our holding company structure;
•
economic, business and political developments in Peru and globally, including corruption scandals involving the Peruvian government and related political instability;
•
economic and geopolitical developments in regional or global markets, including the new administration of the United States, Russia’s continued invasion of Ukraine and the military conflict between Israel and Hamas, as well as between Israel and Iran and Hezbollah;
•
the financial market volatility and market turmoil generated by trade policies, bank failures or similar developments in the United States and other regions;
•
health epidemics and pandemics and other outbreaks, government measures to contain the spread of these pandemics or outbreaks, their effects on the economy of Peru, and their impact on global and regional economic growth prospects, creditworthiness, counter-party risk, as well as any logistical, operational or labor disruptions, among others;
•
protests and social unrest in Peru against government economic policies, violent crime, corruption scandals and social inequality;
•
changes in Peruvian, Panamanian and Bahamian and other foreign laws and regulations including the adoption of new capital requirements for banks or insurance companies, as well as interest rate caps for banks;
•
the dollarization of the Peruvian economy;
•
increased competition in the Peruvian financial services and insurance markets;
•
increased inflation;
•
exchange rate instability and government measures to control foreign exchange rates;
•
developments affecting the purchasing power of middle-income consumers or consumer spending generally;
•
changes in interest rates;
•
downturns in the capital markets and changes in capital markets in general that affect policies or attitudes towards lending to Peru or Peruvian companies or securities issued by Peruvian companies;
6
•
our ability to keep up with technological changes and integrate new businesses into our operations;
•
the inability to obtain the capital we need for further expansion of our businesses;
•
the inability to attract and retain key personnel;
•
any future acquisitions may not bring anticipated benefits;
•
changes in tax laws;
•
severe weather, adverse climate changes and natural disasters (including El Niño and La Niña);
•
changes and volatility in regional or global markets;
•
dependence on sovereign debt in our investment portfolios;
•
credit and other risks of lending, such as increases in defaults of borrowers, and increases in the provision for loan losses;
•
increased costs of funding or inability of our subsidiaries to obtain additional debt or equity financing on attractive terms or at all;
•
a deterioration in the quality of our assets;
•
our provisions for impairment losses or the provisions from impairment losses of our subsidiaries may be inadequate;
•
changes to accounting standards;
•
changes in actuarial assumptions upon which our annuity business is based;
•
failure to adequately price insurance premiums;
•
decreases in the spread between investment yields and implied interest rates in annuities;
•
dependence on information technology (“IT”) systems and cybersecurity risks; and
•
other risks and uncertainties described in “Item 3. Key Information—Risk Factors.”
We urge holders of our common shares to read the sections of this Annual Report on Form 20-F entitled “Item 3. Key Information—Risk Factors”, “Item 4. Information on the Company— Business Overview” and “Item 5. Operating and Financial Review and Prospects” for a more complete discussion of the factors that could affect our future performance and the industries in which we operate. Additionally, new risks and uncertainties can emerge from time to time, and it is not possible for us to predict all future risks and uncertainties, nor can we assess their potential impact. Accordingly, holders of our common shares should not place undue reliance on forward-looking statements as a prediction of actual results.
All forward-looking statements included in this Annual Report on Form 20-F are based on information available to us on the date of this Annual Report on Form 20-F. We undertake no obligation to update publicly or revise any forward-looking statement, whether as a result of new information, future events or otherwise, except as may be required by applicable law. All other written and oral forward-looking statements attributable to us or persons acting on our behalf are expressly qualified in their entirety by the cautionary statements contained throughout this Annual Report on Form 20-F.
7
PRESENTATION OF FINANCIAL INFORMATION
Our audited annual consolidated financial statements as of December 31, 2024 and 2023 and for each of the three years ended December 31, 2024, 2023 and 2022 included in this Annual Report on Form 20-F have been prepared in soles and in accordance with IFRS Accounting Standards as issued by the International Accounting Standards Board (“IASB”) and audited by Tanaka, Valdivia & Asociados Sociedad Civil de Responsabilidad Limitada, PCAOB ID 1315, Lima, Peru, a member firm of Ernst & Young Global Limited (“EY Peru”).
For a description of our significant accounting policies, see Note 3 to our audited annual consolidated financial statements.
For regulatory purposes, including regulations of the Banco Central de Reserva del Perú (the “Central Reserve Bank of Peru” or “BCRP”) and regulations and the reporting requirements of the Superintendencia del Mercado de Valores (the “SMV”), our Peruvian subsidiaries, Interbank and Interseguro, also prepare in Spanish and make available to shareholders statutory financial statements as prescribed by the Peruvian Superintendency of Banks, Insurance and Private Pension Fund Administrators (Superintendencia de Banca, Seguros y Administradoras de Fondos de Pensiones, or “SBS”), hereinafter “SBS GAAP”.
We have included in this Annual Report on Form 20-F certain information reported by the SBS for the Peruvian banking and insurance sectors as a whole as well as for individual financial institutions in Peru, including Interbank and Interseguro, which report to the SBS in SBS GAAP. The information under SBS GAAP has been presented for comparative market purposes. All statements in this Annual Report on Form 20-F regarding our relative market position and financial performance vis-à-vis the financial services and insurance sectors in Peru are based, out of necessity, on information obtained from the SBS and the SMV. With respect to comparative banking information, we typically compare ourselves against certain peer banks or against the system as a whole. With respect to comparative insurance information, we typically compare ourselves against the industry as a whole. Statements in this Annual Report on Form 20-F regarding our relative market position and financial performance, however, do not include information relating to Inteligo as Inteligo is not regulated by and does not report to the SBS or the SMV.
Certain comparative financial information related to our compound annual growth rate (“CAGR”) included in this Annual Report on Form 20-F has been prepared based on information reported pursuant to SBS GAAP, except for Inteligo. Compound Annual Growth Rate (“CAGR”) is calculated by (i) dividing the value of a variable on year X (ending value) by the value of this same variable on year Y (beginning value), then (ii) raising this to an exponent of one divided by (X-Y) and (iii) subtracting one from the result. In addition, our Peruvian subsidiaries pay dividends to us on the basis of the SBS GAAP financial statements as further described in this Annual Report on Form 20-F. See “Item 8 Financial Information—Consolidated Statements and Other Financial Information—Dividends and dividends policy” and “Item 3. Key Information—Risk Factors—We are a holding company and all of our operations are conducted through our subsidiaries. Our ability to pay dividends to holders of our common shares depends on the ability of our subsidiaries to pay dividends and make other distributions to us.”
IFRS Accounting Standards differs in certain significant respects from SBS GAAP. Consequently, information presented in this Annual Report on Form 20-F in accordance with SBS GAAP or based on information from the SBS or SMV may not be comparable with our financial information prepared in accordance with IFRS Accounting Standards. Unless otherwise indicated, all financial information provided in this Annual Report on Form 20-F has been prepared in accordance with IFRS Accounting Standards.
Change in Accounting Policies and Estimates
Generally, we have only adopted standards, interpretations or amendments that were effective in each year. Therefore, standards, interpretations or amendments that become effective in 2025 or later have not been early adopted.
On January 1, 2024, we adopted the following standards, interpretations, or amendments: (i) in connection with lease liability in a sale and leaseback, amendments to IFRS 16 "Leases," (ii) in connection with classification of liabilities as current or non-current, amendments to IAS 1 "Presentation of Financial Statements” and (iii) in connection with supplier finance arrangements, amendments to IAS 7 "Statements of Cash Flows" and IFRS 7"Financial instruments: Disclosures". Such standards, interpretations or amendments have not had a significant impact on our consolidated financial statements. See Note 3.2 to our audited annual consolidated financial statements.
On January 1, 2023, we adopted the following standards, interpretations, or amendments: (i) IFRS 17 "Insurance Contracts", (ii) in connection with the definition of Accounting Estimates, an amendment to IAS 8 “Accounting Policies, Changes in Accounting Estimates and Errors,” (ii) in connection with the disclosure of Accounting Policies, amendments to IAS 1 “Presentation of Financial Statements” and IFRS Practice Statement 2 “Making Materiality Judgements,” (iii) in connection with Deferred Tax related to Assets and Liabilities arising from a Single Transaction, amendments to IAS 12 “Income Taxes,” and (iv) in connection
8
with the International Tax Reform – Pillar Two Model Rules, amendments to IAS 12 “Income Taxes.” Such standards, interpretations or amendments, except for IFRS 17, have not had a significant impact on our consolidated financial statements.
On January 1, 2022, we adopted the following standards, interpretations, or amendments: (i) in connection with costs of fulfilling a contract, an amendment to IAS 37 “Provisions, Contingent Liabilities and Contingent Assets,” (ii) amendments to IFRS 3 “Business Combinations,” (iii) in connection with proceeds before intended use of property, plant and equipment, an amendment to IAS 16 “Property, Plant and Equipment,” (iv) in connection with a subsidiary as a first time adopter, an amendment to IFRS 1 “First-time Adoption of International Financial Reporting Standards,” and (v) in connection with fees in the “10 per cent” test for derecognition of financial liabilities, an amendment to IFRS 9 “Financial Instruments.” Such standards, interpretations or amendments have not had a significant impact on our consolidated financial statements.
Currency Translation
The term “sol” and the symbol “S/” refer to the legal currency of Peru, and the term “U.S. dollar” and the symbol “U.S.$” refer to the legal currency of the United States.
We have translated some of the soles amounts contained in this Annual Report on Form 20-F into U.S. dollars for convenience purposes only. Unless otherwise indicated or the context otherwise requires, the rate used to translate soles amounts to U.S. dollars as of December 31, 2024 was S/3.764 = U.S.$1.00, which was the exchange rate reported for December 31, 2024 by the SBS. The Federal Reserve Bank of New York does not report a noon buying rate for soles. The U.S. dollar equivalent information presented in this Annual Report on Form 20-F is provided solely for convenience of investors and should not be construed as implying that the soles or other currency amounts represent, or could have been or could be converted into, U.S. dollars at such rates or at any other rate.
Effect of Rounding
Certain figures included in this Annual Report on Form 20-F and in our consolidated financial statements have been rounded for ease of presentation. Percentage figures included in this Annual Report on Form 20-F have not in all cases been calculated on the basis of such rounded figures but on the basis of such amounts prior to rounding. For this reason, percentage amounts in this Annual Report on Form 20-F may vary from those obtained by performing the same calculations using the figures in our consolidated financial statements. Certain numerical figures shown as totals in some tables may not be an arithmetic aggregation of the figures that preceded them due to rounding.
Market and Industry Data
In this Annual Report on Form 20-F, unless otherwise indicated, all macroeconomic data relating to Peru is based on information published by the SBS, the Central Reserve Bank of Peru, the Peruvian Ministry of the Economy and Finance (Ministerio de Economía y Finanzas, or “MEF”), and the Peruvian National Institute of Statistics and Information Processing (Instituto Nacional de Estadística e Informática, or “INEI”). References in this Annual Report on Form 20-F to “GDP” refer to real gross domestic product, except for GDP per capita and penetration ratios of loan products.
References in this Annual Report on Form 20-F to “peer countries” in Latin America refer to Brazil, Chile, Colombia and Mexico. Certain information about peer countries in Latin America have been derived from the Economist Intelligence Unit (“EIU”), the Chilean Superintendency of Banks and Financial Institutions (Superintendencia de Bancos e Instituciones Financieras, or “SBIF”), the Central Bank of Brazil (Banco Central do Brasil), the Colombian Financial Superintendency (Superintendencia Financiera de Colombia), and the Mexican Commission for Banking and Securities (Comisión Nacional Bancaria y de Valores). References in this Annual Report on Form 20-F to the “four largest banks in Peru” or the “four largest Peruvian banks” refer to Banco de Crédito del Perú (“BCP”), BBVA Continental, Interbank and Scotiabank Perú S.A.A.
Unless otherwise indicated, statistical information in this Annual Report on Form 20-F relating to our Peruvian subsidiaries Interbank and Interseguro, regarding market share, ranking, and other measures, as well as information on other Peruvian financial institutions and the Peruvian financial system generally, has been derived from reports and information published by the SBS, the SMV, the Central Reserve Bank of Peru, the Association of Peruvian Banks (Asociación de Bancos del Perú, or “ASBANC”) or from other publicly available sources and industry publications.
9
Socioeconomic levels are determined based on the data collected by INEI in their national annual survey Encuesta Nacional de Hogares (“ENAHO”). INEI assigns a score to each household based on their ranking on the following four factors: (i) characteristics of the household living space, (ii) level of living space overcrowding, (iii) level of education of household head and (iv) ownership of durable goods/properties; and then groups them in five socioeconomic segments (A, B, C, D, E).
Other market share information and other statistical information and quantitative statements in this Annual Report on Form 20-F regarding our market position relative to our competitors, except where otherwise indicated, is not based on published statistical data or information obtained from independent third parties. Rather, such information and statements reflect management estimates based upon our internal records and surveys, statistics published by providers of industry data, information published by our competitors, and information published by trade and business organizations and associations and other sources within the industry in which we operate. We have not independently verified any data produced by third parties or industry or general publications, although we believe such data and publications are reliable. In addition, while we believe our internal data and surveys to be reliable, such data and surveys have not been verified by any independent sources.
Loan Portfolio Data
Unless otherwise indicated, references in this Annual Report on Form 20-F to performing loans refer to loans in compliance with their original contractual obligations. References to past-due loans refer to overdue loans defined as follows: commercial loans are considered past-due once amortization payments are 15 days overdue; loans to micro-businesses are considered past-due once amortization payments are 30 days overdue; and in the case of consumer, mortgage and leasing loans, the amortization portion of a coupon is considered past-due once 30 days overdue and the total amount of the loan is considered past-due once an amortization payment is 90 days overdue. For IFRS 7 and IFRS 9 disclosure purposes, the entire loan balance is considered past due when debtors have failed to make a payment when contractually due. Past-due loans do not include refinanced and restructured loans. References to total gross loans include total loans outstanding, including past-due loans, refinanced loans and restructured loans, and references to total net loans refer to gross loans plus accrued interest less allowances for loan losses and deferred interest.
Interbank has rescheduled loans, and such rescheduling has involved modifying payment schedules, granting grace periods, and lowering interest rates, among other measures. As showed in the audited financial statements in Note 29.1 (d.7), there were three types of rescheduling: (1) reschedules due to the Covid-19 pandemic, (2) reschedules due to the “Reactiva Peru” program, a credit guarantee program launched by the Peruvian government (“Reactiva Peru”), and (3) rescheduling due to local political and social conflicts.
Changes in Operating Segments
During the second quarter of 2024, we changed the reporting structure of IFS’s operating segments compared with that presented in our annual report on Form 20-F for the year ended December 31, 2023 (the “2023 Form 20-F”), mainly as a consequence of the elimination of the payments segment, since its revenues and income do not meet the thresholds established by IFRS 8 "Operating Segments", as those represent less than 10% of IFS consolidated results. Therefore, since the second quarter 2024, the results of the businesses that previously comprised the payments segment ceased being reported separately to the board and Izipay, our payments subsidiary, was reclassified under “Holding, Other Subsidiaries and Eliminations”. For additional information on our current segments, see “Item 4. Information on the Company-Business Overview” and Note 27 to our audited annual consolidated financial statements.
In order to make the information as of and for the years ended December 31, 2023 and 2022 comparable with the information as of and for the year ended December 31, 2024, as required by IFRS 8 “Information by business segments”, figures as of and for the years ended December 31, 2023 and 2022 were recast in conformity with the new operating segment reporting structure.
Certain Financial Definitions and Conventions
We present return on assets, or “ROA”, return on equity or “ROE”, net interest margin or “NIM”, risk adjusted net interest margin or “risk adjusted NIM”, cost of risk and efficiency ratio in this Annual Report on Form 20-F. We define our ROA as net profit for the period divided by average total assets; our ROE as net profit for the period divided by average total equity; NIM as (x) net interest and similar income divided (y) average interest earning assets; risk adjusted NIM as net interest margin after impairment loss on loans, net of recoveries; cost of risk is defined as impairment loss on loans, net of recoveries divided by average gross loans. Efficiency ratio as the division of (x) salaries and employee benefits plus administrative expenses plus depreciation and amortization by (y) net interest and similar income plus other income, plus net premiums earned.
We present average balances and nominal average interest rates in this Annual Report on Form 20-F. Except as otherwise indicated, average balances are based on quarterly balances. Nominal average interest rates have been calculated by dividing interest earned on assets or paid on liabilities by the corresponding average balances on such assets or liabilities.
10
Non-GAAP Financial Measures
In this Annual Report on Form 20-F, we present adjusted net profit, adjusted ROE and adjusted ROA, which are non-GAAP financial measures. A non-GAAP financial measure does not have a standardized meaning prescribed by IFRS Accounting Standards. A non-GAAP financial measure is generally defined as a numerical measure of an issuer’s historical or future financial performance, financial position or cash flows that: (i) excludes amounts, or is subject to adjustments that have the effect of excluding amounts, that are included in the most directly comparable measure calculated and presented in accordance with IFRS Accounting Standards in the statement of income, balance sheet or statement of cash flows (or equivalent statements) of the issuer; or (ii) includes amounts, or is subject to adjustments that have the effect of including amounts, that are excluded from the most directly comparable measure so calculated and presented.
We believe that the presentation of these non-GAAP measures provides additional useful information to investors regarding our performance and trends related to our results of operations. Accordingly, we believe that when non-GAAP financial information is viewed with IFRS Accounting Standards' financial information, investors are provided with a more meaningful understanding of our ongoing operating performance and financial results.
ROE is calculated by dividing net profit for the year by average total equity. ROA is calculated by dividing net profit for the year by average total assets. Adjusted net profit is defined as net profit excluding non-operating and/or non-recurring gain or losses.
For the years ended December 31, 2024 and 2023, we did not make adjustments to our net profit, ROE or ROA. For the year ended December 31, 2022, we made adjustments to our net profit, to ROE and to ROA, as we defined our adjusted net profit (used for the calculation of adjusted ROE and adjusted ROA) as net profit excluding the gain recognized as a result of the step acquisition of Izipay, which management believes is non-recurring in nature. See Note 1(b) to our Audited Annual Consolidated Financial Statements.
We believe that the adjustment to our net profit provided useful metrics because by excluding the fair value adjustment of the 50% ownership interest held by Interbank in Izipay before the acquisition of the remaining 50% equity interest in Izipay in April 2022, it deducted from our net profit pre-acquisition effects that our management believes to be non-operating and/or non-recurring in nature and in so doing, allows us to better assess the performance of our operating activities. Adjusted net income, adjusted ROE and adjusted ROA do not have a standardized meaning and are not recognized measures under IFRS Accounting Standards. Adjusted net income, adjusted ROE and adjusted ROA should not each be considered by itself or as a substitute for net income or other measures of operating performance. Our definition of adjusted net income, adjusted ROE and adjusted ROA may differ from those used by other companies.
For a discussion on the non-GAAP financial measures and reconciliation of these measures to IFRS Accounting Standards' financial measures, see “Item 4. Information on the Company—Business Overview—Non-GAAP Financial Measures” and “Item 5. Operating and Financial Review and Prospects—Operating Results.”
There may be limits in the usefulness of these measures to investors. As a result, we encourage readers to consider the consolidated financial statements and other financial information contained in this Annual Report on Form 20-F in their entirety, and not to rely on any single financial measure.
11
PART I
ITEM 1. IDENTITY OF DIRECTORS, SENIOR MANAGEMENT AND ADVISERS
Not Applicable.
ITEM 2. OFFER STATISTICS AND EXPECTED TIMETABLE
Not Applicable.
ITEM 3. KEY INFORMATION
A.
[RESERVED]
B.
Capitalization and Indebtedness
Not Applicable.
C.
Reasons for the Offer and Use of Proceeds
Not Applicable.
D.
Risk Factors
An investment in our common shares involves a high degree of risk. In addition to the other information contained in this Annual Report on Form 20-F, holders of our common shares should carefully consider the following risk factors before purchasing our common shares. If any of the possible events described below occurs, our businesses, financial condition, results of operations or prospects could be materially and adversely affected. As a result, the market prices of our common shares could decline and holders of our common shares could lose all or part of their investment. The risks and uncertainties below are those known to us and that we currently believe may materially affect us and our common shares. We may face additional risks and uncertainties not currently known to us or which as of the date of this Annual Report on Form 20-F we might not consider significant, which may also adversely affect our businesses.
Risks Relating to Our Businesses
We are a holding company and all of our operations are conducted through our subsidiaries. Our ability to pay corporate expenses and to pay dividends, if any, to holders of our common shares depends on the ability of our subsidiaries to pay dividends and make other distributions to us.
As a holding company, all of our operations are conducted through our subsidiaries. Accordingly, our ability to pay corporate expenses and to pay dividends, if any, to holders of our common shares, depends on our receipt of dividends and other distributions from our subsidiaries.
There are various regulatory restrictions in Peru and other jurisdictions that may limit our subsidiaries’ ability to pay dividends or make other payments to us, such as their obligations to maintain minimum regulatory capital and minimum liquidity. See “—Public health crises and epidemics/pandemics could adversely affect our and our subsidiaries’ business, financial condition and results of operations”.
In addition, some of our Peruvian subsidiaries pay dividends to us on the basis of the SBS GAAP financial statements, which differ from IFRS Accounting Standards. For example, for the year ended December 31, 2024, Interseguro had a net profit of S/201.9 million under IFRS Accounting Standards and of S/376.3 million under SBS GAAP, which resulted in a dividend payment to us of S/125.0 million in 2025. Therefore, there is no assurance that the differences in accounting treatment will not render the opposite result, namely that lower or no dividends would be payable to us by any of our Peruvian subsidiaries under SBS GAAP than what it would appear to be able to pay under IFRS Accounting Standards, or that dividends will continue to be payable under SBS GAAP in the future.
Furthermore, our subsidiaries may incur indebtedness or enter into other arrangements containing terms that may restrict or prohibit the payment of dividends, the making of other distributions, or the making of loans to us. We cannot assure holders of our common shares that the agreements governing the future indebtedness of our subsidiaries will permit them to provide us with sufficient dividends, distributions or the making of loans to fund dividend payments.
12
To the extent our subsidiaries do not have funds available or are otherwise restricted from paying dividends to us, our ability to pay dividends to our shareholders will be adversely affected.
As a holding company, our right to receive any distribution of assets of our subsidiaries will be effectively subordinated to the rights of our subsidiaries’ creditors, and holders of our common shares may have limited recourse against our subsidiaries’ assets in case of our liquidation.
As a holding company, our right to receive any distribution of assets of our subsidiaries upon any subsidiary’s liquidation or reorganization or otherwise will be subject to the prior claims of creditors of that subsidiary, except to the extent that any claims by us as a creditor of such subsidiary may be recognized as such. Accordingly, holders of our common shares will have rights that will effectively be subordinated to all existing and future indebtedness of our subsidiaries, and, in the event of any claim against us, our shareholders may have recourse only against our assets, and not those of our subsidiaries, for payments. The only significant assets that we currently hold are our equity interests in our subsidiaries.
Our subsidiaries are subject to extensive regulation and supervision, and changes in existing regulations or the implementation of future regulations may have a material adverse effect on our financial condition and results of operations.
Interbank and Interseguro are subject to extensive regulation and supervision by the SBS. The SBS also oversees all of Interbank’s and Interseguro’s subsidiaries and their operations. Interbank is also subject to regulation and oversight by the Central Reserve Bank of Peru, which, together with the SBS, have general administrative responsibilities over banks and other financial institutions, including the authority to set loan loss provisions, limits on interest rates and fees, regulatory capital requirements and other minimum capital adequacy and reserve requirements. In addition, banks are required to provide the SBS, on a periodic basis, with all information necessary to allow for its evaluation of the bank’s financial performance. Similarly, insurance companies are required to periodically provide the SBS, with all information necessary for the SBS to evaluate the company’s management, measure systems, solvency, profitability and liquidity.
Similarly, Inteligo’s subsidiaries are regulated by governmental entities and other financial services regulators in The Bahamas, Panama and Peru. Inteligo Bank is subject to the regulation and supervision of the Central Bank of The Bahamas. Additionally, Inteligo Bank’s asset management activities and securities custody and trading activities are subject to supervision by the Securities Commission of The Bahamas. Inteligo Bank holds licenses from the Securities Commission of The Bahamas for dealing in securities as agent or principal, arranging deals, managing securities and advising on securities. Inteligo Bank is licensed to undertake all securities-related activities ancillary to its banking business. Inteligo Bank and its branch are subject to regulation by the Superintendency of Banks of Panama (Superintendencia de Bancos de Panamá). Inteligo Bank is also subject to regulation by the Securities Commission of Panama (Superintendencia del Mercado de Valores de Panama) since June 18, 2021, when it obtained its investment advisory license. On January 3, 2022, Inteligo Bank began its operations under such license. Inteligo SAB and Interfondos are subject to the regulation and supervision of the SMV in Peru. Also, Interbank and Interseguro are subject to the regulations of the SMV. PMP and Izipay are mainly subject to the regulations of the Central Reserve Bank of Peru. In addition, IFS, Interbank, Interseguro, Inteligo Bank and Inteligo SAB are subject to other regulations, such as the U.S. Foreign Account Tax Compliance Act (“FATCA”), which could increase compliance costs and, in case of non-compliance could result in liability, additional costs or sanctions imposed by the U.S. Internal Revenue Service.
Changes in the regulation and/or supervision of Interbank, Interseguro, Inteligo and/or Izipay or the implementation of future regulations could have a material adverse effect on our financial condition and results of operations by restricting our existing operations, limiting the expansion of our business and requiring extensive system and operating changes that may be difficult or costly to implement. For example, the SBS and the Central Reserve Bank of Peru regulate, and have in the past changed, capital structure and deposit reserve requirements, interest paid on deposit reserves, the amount of deposit reserves for which no interest is payable, rules regarding provisions for loan losses and legal lending limits applicable to Peruvian commercial banks. Furthermore, Interbank could be required to increase its level of provisions in response to pro-cyclical provisioning requirements or be required to increase capital levels in response to pro-cyclical buffers that could be activated by regulators under certain favorable macroeconomic conditions. As an example, additional changes in the regulation and supervision of our subsidiaries were imposed as a result of the COVID-19 pandemic and as a result of social unrest, which Interbank complied with, but we cannot predict whether and to what extent new laws and regulations will be imposed in case of other periods of crisis.
Moreover, changes in consumer protection regulation and protection of personal data may also affect our business. In March 2021, the Peruvian Congress approved Law No. 31143 under which (i) the Central Reserve Bank of Peru will semi-annually establish caps on interest rates (including default interest rates) that banks can charge to consumers and small businesses, and (ii) in cases of default, the debtor shall only pay interest which may not be capitalized and may not be charged with commissions or additional expenses. Since its approval, such new regulation limiting the interest that can be charged to clients of banking entities, such as Interbank, has negatively impacted its financial results. In addition, Interbank could be subject to limits on fees or commissions charged to clients. If legislation or governmental or regulatory action is enacted limiting the amount of ATM fees or
13
surcharges that Interbank may receive or on its ability to charge overdraft or other fees, it could adversely impact our financial results. Furthermore, during 2022, Legislative Decree No. 1531 amended the Peruvian Banking and Insurance Law (Ley General del Sistema Financiero y del Sistema de Seguros y Orgánica de la Superintendencia de Banca y Seguros), approved by Law No. 26702 (as amended, the “Peruvian Banking and Insurance Law”) to more closely align the Peruvian regulatory framework and its regulations applicable to the companies of the financial system to the Basel Committee’s 2011 agreement regarding the overall design of the capital and liquidity reform package (now referred to as “Basel III”), including changes related to the composition of the effective equity (which changes to effective equity came into effect as of January 1, 2023). Interbank has already implemented most of these requirements, with no adverse effect to its financial condition or operations, but as it continues to implement such additional requirements imposed by Legislative Decree No. 1531 and the other resolutions aimed at adapting the regulatory framework of the financial system more generally to the Basel III principles, we cannot guarantee that no such effects will impact its financial condition or results of operations. Similarly, in September 2024, Legislative Decree No. 1646 amended the Peruvian Banking and Insurance Law mainly to adjust lending limits based on concentration risk according to international standards to safeguard the solvency and stability of the Peruvian financial system. This legislation is expected to come into effect in June 2025 and be implemented in stages and subject to further regulations to be approved by the SBS. Likewise, also in September 2024, Legislative Decree No. 1665 amended Law No. 29440 (the Payments and Securities Settlement Systems Law) to grant new regulatory and sanctioning powers to the Central Reserve Bank of Peru (e.g., imposition of fines, and suspensions and cancellations of licenses, as the governing body of the Peruvian Payments and Securities Settlement Systems System), among other regulatory changes.
Since 1998, Interseguro has been subjected to strict local regulations that required significant changes in reserve requirements. For example, in March 2018, changes by the SBS to mortality tables used for calculating reserves for new annuities resulted in a higher reserve requirement, which in turn could adversely affect Interseguro’s results of operations or could result in lowered implied interest rates on Interseguro’s annuities. New legislation or regulations applicable to the insurance industry may adversely affect Interseguro’s ability to underwrite and price risks accurately as well as affect its revenues and net income. For example, whereas retirees formerly had to choose between remaining with their pension fund or choosing an annuity, since 2016 a law has allowed retirees to withdraw 95.5% of their capital accumulated in cash upon retirement, which has resulted in a significant reduction of annuities sold by Peruvian insurance companies, including Interseguro. In addition, considering that the SBS regulates the types of and limits on eligible investments that insurance companies, such as Interseguro, are allowed to make, in case the SBS enacts new regulations that further restricts such eligible investments, Interseguro could be compelled to liquidate current investments on less favorable terms than if they were held to maturity and restrict Interseguro from making investments that its management deems to be beneficial. Likewise, at the end of 2022, in order to adjust the fair value of real estate investments, the SBS established new requirements for valuation specialists or entities requiring capacitation in specific valuation matters that are not lectured in Peru, which created hurdles to such valuations and increased operating costs. Any failure to comply with these new requirements may increase costs and result in potential sanctions by the SBS. Moreover, in the past and as a response to the COVID-19 pandemic, the Peruvian government permitted companies to suspend employee contracts without pay in certain cases until the end of the COVID-19 pandemic, which caused these companies to stop making the corresponding monthly contribution to the pension funds of their worker, affecting the private pension system. In addition, the Peruvian government eased pension fund regulations, including measures permitting extraordinary withdrawals of funds from the private pension system, which in turn reduced pension funds collected by Interseguro. In September 2024, the Peruvian government enacted Law No. 32123, which established a reform of the Peruvian pension system. This law is expected to become effective in July 2025 and to limit extraordinary withdrawals of funds from the private pension system, which in turn may potentially reduce the demand for Interseguro’s annuities. Furthermore, Interseguro may face competition from private pension funds (Pension Funds Administrators, or “AFPs”) and Peruvian commercial banks, which could be allowed to offer annuities in the future. While this law provides insurance companies with the opportunity to manage private pension funds, any adverse impact on Interseguro resulting from increased competition or reform of the private pension system could have a material adverse effect on our financial condition and results of operations.
The Bahamas has repealed and replaced the Commercial Entities Economic Substance Requirements Act, 2018 with the Commercial Entities (Substance Requirements) Act, 2023 which requires substantial economic presence in The Bahamas for certain Bahamas incorporated or registered entities that conduct relevant activities. A relevant activity includes the business of banking as conducted by Inteligo Bank. Inteligo Bank has made the appropriate registration and it is exempt from the main substance requirements of the Commercial Entities (Substance Requirements) Act, 2023 due to its asserted tax residency outside of The Bahamas. If The Bahamas in the future changes such regulation such that Inteligo Bank is no longer considered to be exempt from the substance requirements, it would have to enhance its economic and business presence in The Bahamas in order to comply with the Commercial Entities (Substance Requirements) Act, 2023, which increased presence may result in increased costs—financial, compliance or otherwise, which could impact Inteligo Bank’s profitability and our results of operations.
We cannot predict whether and to what extent new laws and regulations, or changes to existing laws and regulations, affecting our subsidiaries’ business may be adopted in the future, the timing of any such adoption and what effect such events would have on our financial condition and results of operations.
14
Enhanced ESG and climate change disclosure may impose additional costs on us or our subsidiaries.
In recent years, various guidelines and regulations have been issued recommending or requiring companies to adopt policies and procedures with the purpose of enhancing the approach to environmental, governance and social (ESG) matters. In March 2024, the SEC adopted rules aimed at enhancing and standardizing climate-related disclosures. The rules require registrants to include certain climate-related information in their registration statements and annual reports, including data regarding greenhouse gas emissions and information regarding climate-related risks and opportunities and related financial impacts, governance and strategy. Several lawsuits have been filed against such rules and, unless they prevail, we would be subject to certain of these requirements commencing with the fiscal year ending on December 31, 2025. On April 4, 2024, the SEC voluntarily stayed the rules, pending judicial review, and on March 27, 2025, the SEC dropped the defense of the rules in court.
Although the SEC’s climate rules proposed in 2024 did not prosper, we cannot rule out future attempts to enact rules requiring climate-related disclosures. The adoption of new guidelines and regulations on ESG matters could limit our business or the businesses of our subsidiaries, restrict our ability or the ability of our subsidiaries to recruit new customers, increase compliance requirements or result in higher operating or funding costs, among other effects in the future that we cannot predict now, given the still-developing and evolving regulatory environment related to ESG matters.
The operations of our subsidiaries require the maintenance of banking, insurance and other licenses and any non-compliance with applicable licenses and operating obligations could have a material adverse effect on our business, financial condition and results of operations.
All banks and insurance companies established in Peru require certain authorizations issued by the SBS in order to operate in Peru. In addition, all brokerage firms operating in Peru require certain authorizations issued by the SMV in order to operate in Peru.Service providers (such as Izipay), collecting agents or processing agents in the payment industry are not required to obtain prior licenses. However, recent regulations imposed certain obligations to such entities (including anti-money laundering (“AML”) obligations) and required that they register with the Central Reserve Bank of Peru; furthermore, the Central Reserve Bank of Peru has established minimum quality levels for such entities. In The Bahamas and Panama, all banks require a license to operate. Governmental authorities, such as the SBS or the Central Reserve Bank of Peru, the Central Bank of The Bahamas, or the Superintendency of Banks of Panama, have general administrative responsibilities over banks and other financial institutions, including authority to set loan loss provisions, limits on fees, regulatory capital requirements and other minimum capital adequacy and reserve requirements. In addition, banks are generally required to provide the relevant banking supervisory agency, on a periodic basis, with all information that is necessary to allow for its evaluation of a bank’s financial performance. Insurance companies are regulated and supervised by the SBS which has the ability, among other things, to set reserve requirements for insurance companies. Similarly, the SMV and the Securities Commission of The Bahamas have general administrative responsibilities over brokerage firms, including the authority to set minimum capital requirements.
Our subsidiaries currently have the required licenses or applicable registrations in order to conduct their operations in their corresponding jurisdictions for all of their operations. Although we believe our subsidiaries are currently in compliance with their respective existing material license and reporting obligations, there is no assurance that our subsidiaries will be able to maintain the necessary licenses in the future. We can offer no assurance that future changes to existing laws and regulations, or stricter interpretation or enforcement of existing laws and regulations, will not impair our ability to comply with such laws and regulations and thus with the terms of our licenses.
The loss of a license, a breach of the terms of a license by any of our subsidiaries or the failure to obtain any further required licenses in the future could have a material adverse effect on our business, financial condition and results of operations. If any of our subsidiaries loses its licenses or is required to seek additional licenses, then such subsidiary will be unable to perform its operations as it is currently authorized and as it is currently doing.
Under certain circumstances, the SBS, the SMV, the Superintendency of Banks of Panama or the Central Bank of The Bahamas, as applicable, may intervene in our subsidiaries’ operations in order to prevent, control and reduce the effects of a failure of our operations.
Under the Peruvian Banking and Insurance Law and the regulations thereunder, the SBS may intervene in Interbank’s and Interseguro’s operations upon the occurrence of any of the following events:
•
Interbank or Interseguro suspends payment of its obligations or is unable to pay its obligations as they come due;
•
Interbank or Interseguro breaches any of their respective commitments to the SBS under a surveillance regime (régimen de vigilancia) imposed by the SBS;
15
•
Interbank’s regulatory capital is less than 50% of the minimum regulatory capital required under the Peruvian Banking and Insurance Law;
•
Interbank or Interseguro experiences a deficit or reduction of more than 50% of its regulatory capital during the preceding 12-month period; or
•
Interseguro experiences a deficit or reduction of the regulatory capital of more than 50% of its solvency equity.
In the event of an intervention, the SBS has the power to institute measures, such as limiting the decisions that could be taken at a shareholders’ meeting, suspending our normal activities and segregating certain of Interbank’s or Interseguro’s assets and liabilities for transfer to third parties, among others. Furthermore, the SBS has the power under the Peruvian Banking and Insurance Law to declare the wind-up or liquidation of any bank or insurance company if an intervention extends for longer than 45 days, which period may be extended one time for another 45 days at the sole discretion of the SBS, and/or upon the occurrence of a wind-up or liquidation pursuant to the Peruvian General Corporations Law (Ley General de Sociedades). For further detail, see “Item 4. Information on the Company—Business Overview—Regulation and Supervision—The Peruvian Financial and Insurance Systems — Intervention by the SBS and Liquidation”.
Under Peruvian capital markets laws and the regulations thereunder, the SMV may revoke the license of Inteligo SAB and/or Interfondos, among others, upon the occurrence of (i) significant irregularities that put the companies at risk to carry out their operations as permitted by law or (ii) significant violations of the law, statutes and regulations promulgated by the SMV.
Under Bahamian banking regulations, the Central Bank of The Bahamas may intervene in Inteligo Bank’s operations upon the occurrence of any of the following events:
•
Inteligo Bank carries on its business in a manner detrimental to the public interest or the interests of its depositors or other creditors; or
•
Inteligo Bank contravenes the provisions of Bahamian banking law or any other law, order or regulation made thereunder, or any term or condition subject to which its license was issued, either in The Bahamas or elsewhere.
In addition, under Bahamian securities laws and regulations, the Securities Commission of the Bahamas may revoke Inteligo Bank’s registration and license to deal in securities, arrange deals, manage securities and/or advise on securities for noncompliance with laws and regulations.
Under Law Decree 9 of 1998, as amended, the Superintendency of Banks of Panama may seize administrative and operating control of the branch of Inteligo Bank in Panama, based on any of the following grounds:
•
upon a reasoned request of Inteligo Bank itself;
•
if Inteligo Bank cannot continue operations without endangering the interests of the depositors;
•
as a consequence of the evaluation of the report submitted by an appointed advisor;
•
non-compliance with the corrective measures ordered by the Superintendency of Banks of Panama;
•
if Inteligo Bank carries out its operations in an illegal, negligent or fraudulent manner;
•
if Inteligo Bank has suspended payment on its obligations; or
•
if the Superintendency of Banks of Panama confirms that the capital adequacy, solvency or liquidity of Inteligo Bank has deteriorated so as to require action by the Superintendency of Banks of Panama.
The adoption of new international banking and insurance guidelines may cause our subsidiaries to require additional capital and could cause their cost of funds to increase, which could have a material adverse effect on our financial condition and results of operations.
In December 2009, the Basel Committee announced its intention to issue a new framework related to the regulation, supervision and risk management of the banking industry. This was followed by the Basel III principles, which revises and strengthens the three pillars established by Basel II.
16
Starting in 2011, the SBS issued different regulations to schedule additional capital requirements to be implemented in Peru, which, although not completely consistent with Basel III, included requirements to cover concentration, interest rate and systemic risk, as well as certain pro-cyclical capital requirements. In March 2022, the Peruvian government issued Legislative Decree 1531, which revised the regulatory capital definition rules in the Peruvian Banking and Insurance Law. This legislative decree became effective on January 1, 2023, aiming at a better alignment with the standards established by Basel III. Consistent with certain aspects of Basel III, the SBS issued in 2022, SBS Resolution No. 03953-2022 and SBS Resolution No. 03954-2022 in order to update the methodologies for calculating the individual and sector concentration risk buffers (including regional and economic sector concentration) eliminating the capital buffer requirement for risk appetite and maintaining the requirement for measuring the interest rate risk of the banking book. Legislative Decree No. 1531 and SBS Resolution No. 03954-2022 aligned the capital conservation buffer in the Peruvian regulation, to the Basel III principles.
In February 2016, the SBS issued SBS Resolution No. 975-2016 (as amended from time to time), which aimed to improve the quality of the total regulatory capital (patrimonio efectivo) and align Peruvian regulations towards Basel III. This resolution changed the conditions that subordinated debt must meet in order to be considered in the calculation of additional capital and the calculation methodology applicable to risk-weighted assets. In December 2022, as part of the implementation of the Basel III standards, the SBS issued SBS Resolution No. 03950-2022, which replaced the regulations applicable to subordinated debt related to its computation at the different levels and sublevels of the regulatory capital. This resolution became effective on January 1, 2023 and is applicable to subordinated debt incurred or created from the date of its effectiveness. However, as established in this new regulation, subordinated debt incurred or created prior to its effectiveness is still considered in the calculation of regulatory capital. Although the main changes became effective on January 1, 2023, other relevant regulation were also passed by the SBS by end of 2022 to implement the aforementioned law and provided certain adequacy periods until 2026. We cannot assure whether the implementation and further supervision of the above-mentioned new regulations may result in increased costs, financial, compliance or otherwise, which could impact our profitability and our results of operations. For further details, see “Item 4. Information on the Company—Business Overview—Regulation and Supervision—The Peruvian Financial and Insurance Systems”. As of the date of this Annual Report on Form 20-F, Interbank is fully compliant with applicable capital regulatory requirements. While Interbank expects to continue to be in compliance with current and upcoming capital requirements, Interbank’s assumptions with respect to compliance may turn out to be incorrect, and, consequently, have a material adverse effect on its financial condition and results of operations.
With respect to Interseguro, Solvency II, a new regulatory framework for the European insurance industry implemented in early 2016, is under consideration by international regulatory bodies, which could result in the SBS raising solvency ratio requirements for insurance companies in Peru in the future.
With respect to Inteligo Bank, The Central Bank of The Bahamas has adopted a Basel Implementation Program and has effectively implemented Pillar I and Pillar II of the Basel II framework. The Pillar I framework focuses on the capital adequacy ratio requirements and Pillar II focuses on the internal capital adequacy assessment processes (“ICAAP”) (the guidelines in relation to the ICAAP were released in August 2016). The Central Bank of The Bahamas published its Capital Adequacy Guidelines for the Management of Capital and the Calculation of Capital Adequacy on August 24, 2022 (the “capital adequacy guidelines”), and The Bahamas Capital Regulations 2022 came into effect on July 15, 2022 (the “capital regulations”). The capital regulations include changes to the methodology for the calculation of risk-weighted assets and Tier 1 capital that could adversely impact Inteligo Bank’s capital adequacy ratio. The capital regulations and capital adequacy guidelines simplify the Bahamian Basel III framework while remaining consistent with the proportionality principles set out by the Basel Committee. The regulations set a new capital ratio limit and introduced changes to the credit and operational risk equivalent assets and deductions of high-risk assets from the capital base. Inteligo Bank’s capital ratio as of December 31, 2024, under the new regulations, was 19,3%, while it would amount to 25.5% under the previous regulations. In any case, Inteligo Bank’s capital ratio remains well above the regulatory limit of 12%. Additional changes to this framework could require Inteligo Bank to make revisions to its capital structure and investment which could have an adverse effect on the profitability of Inteligo Bank.
Furthermore, following completion of the capital framework, in 2023, the Central Bank of The Bahamas informed through its quarterly letter that it is in the process of amending the regulations and guidelines to its liquidity framework. The latest update on the Basel III implementation was given in The Central Bank of The Bahamas’ 2022 third quarter report of the Bank Supervision Department, which stated that adoption and implementation of the Basel principles continued to progress along with related amendments to other legislation and guidelines that would be impacted by the new capital regulations. Moreover, in 2022, new credit risk guidelines and guidelines for internal auditors and audit committees were published by the Central Bank of The Bahamas. While as of the date of this Annual Report on Form 20-F, we believe such guidelines do not materially impact Inteligo Bank’s operations, we cannot make any assurances that the Central Bank of The Bahamas or other government authorities will not make further adjustments to applicable banking regulations which could materially and adversely affect Inteligo Bank’s financial condition and results of operations.
17
We cannot predict whether and to what extent new guidelines, laws and regulations, or changes to existing guidelines, laws and regulations, affecting our subsidiaries’ business may be adopted in the future, the timing of any such adoption and what effect such events would have on our financial condition or results of operations.
We are subject to regulatory capital requirements imposed by the SBS, and failure to comply with these requirements could have a material adverse effect on our financial condition and results of operations.
Pursuant to existing applicable regulations, there are minimum capital requirements for financial services holding companies on a fully consolidated basis, which the SBS evaluates on an annual basis. Pursuant to Oficio N° 61578-2024-SBS, after assessing the perimeter for purposes of consolidated supervision of Intecorp's Financial Group (Grupo Financiero), SBS limited such scope to us and our subsidiaries, plus Financiera Oh! This change took effect beginning with the consolidated regulatory information submitted to SBS as of December 2024.
If we fail to comply with these requirements, SBS may request us to take certain corrective actions to ensure compliance. If we fail to take such actions, SBS could suspend or revoke Interbank’s, Interseguro’s and Financiera Oh!'s licenses to operate in Peru, which would have a material adverse effect on our financial condition and results of operations. For further details, see “—The operations of our subsidiaries require the maintenance of banking, insurance and other licenses and any non-compliance with applicable licenses and operating obligations could have a material adverse effect on our business, financial condition and results of operations.”
Our subsidiaries face intense competition from other banking, insurance and financial institutions, and from other players including providers of emerging financial technologies and failure to compete successfully could have a material adverse effect on our financial condition and results of operations.
The banking market in Peru is highly competitive. Interbank has experienced strong competition from local and foreign banks and other financial entities, including new entrants attracted by Peru’s low banking penetration and financial inclusion, as well as from department stores that offer credit cards, from emerging financial technology companies that offer digital banking and other services both on a regulated and unregulated basis, and from the local and international capital markets that lend to commercial customers. In addition, competition may also be influenced by means of legal regulations. For example, Supreme Decree No. 217-2024-EF, issued in November 2024, exceptionally authorized the Banco de la Nación (an state-owned institution) to provide credit lines to microfinance companies, which were to be used exclusively to grant loans to micro and small entrepreneurs for the construction and/or improvement of housing. Competition may reduce the average interest rates that Interbank can charge its customers, increase the average rates Interbank must pay on its deposits, and may negatively affect its loan growth and place pressure on margins. Some of Interbank’s competitors may have access to greater resources and be more successful in the development of products and services that compete directly with Interbank’s products and services. If Interbank’s competitors are successful in developing products and services that are more effective or less expensive than the products and services offered by it, Interbank may be unable to compete successfully. Even if Interbank’s products and services prove to be more effective than those developed by other competitors, such other competitors may be more successful in marketing their products and services because of their greater financial resources or marketing strategies, among other factors. Interbank may not be able to grow or maintain its market share if it is not able to match its competitors’ pricing or keep pace with their development of new products, services and technological innovation and developments, and the integration of these into Interbank’s operations. Any adverse impact on Interbank resulting from increased competition could have a material adverse effect on its financial condition and results of operations.
Likewise, if Izipay’s competitors are successful in developing market share growth strategies, reduce their customer fees, or gain more customers, then Izipay may be unable to maintain its market and its net income could be threatened. Moreover, if Izipay’s competitors develop a low-cost POS technology or new technologies and gain efficiency, it could negatively affect Izipay’s operating results.
The Peruvian insurance market, particularly the annuity and life insurance sectors, is also highly competitive. Interseguro’s principal competitors are large insurance companies that may have greater resources and offer a wider range of products. These insurance companies may have better access to independent brokers who sell insurance to customers. Under the new regulation which established a reform of the Peruvian pension system, Interseguro may also face competition from AFPs, which could in the future be allowed to offer annuities, which in turn may adversely affect Interseguro’s ability to underwrite and price risks accurately and thus affect our business profitability.
Similarly, if Inteligo Bank’s competitors are successful in developing products and services that are more effective or less expensive than the products and services offered by Inteligo Bank, it may be unable to compete successfully. Even if Inteligo Bank’s products and services prove to be more effective than those developed by other competitors, such other competitors may be more successful in marketing their products and services because of their greater financial resources or marketing strategies, and other factors. Competitors may also dedicate greater resources to, and be more successful in, the development of products and services that
18
may compete directly with Inteligo Bank’s products and services. Inteligo Bank competes in a global market for wealth management services, including wealth management divisions of global banks. Such competition would adversely affect the acceptance of Inteligo Bank’s products and/or lead to adverse changes in the investing habits of Inteligo Bank’s customer base. Inteligo Bank may not be able to grow or maintain its market share if it is not able to keep pace with its competitors’ development of new products and services. Any adverse impact on Inteligo Bank resulting from increased competition could have a material adverse effect on our financial condition and results of operations.
The failure of our subsidiaries to effectively anticipate or adapt to emerging technologies or changes in customer behavior could have a material adverse effect on our financial conditions and results of operations.
The failure of our subsidiaries to effectively anticipate or adapt to emerging technologies or changes in customer behavior, including among younger customers, could delay or prevent our access to new digital-based markets. Furthermore, the widespread adoption of new technologies, including payment systems, could require substantial expenditures to modify or adapt our existing products and services as we continue to grow our digital capabilities. As a result, our subsidiaries’ customers may choose to conduct business or offer products on alternative or emerging platforms. Such new technologies could negatively impact our investments in infrastructure, equipment and personnel, or if our subsidiaries do not properly anticipate trends, render our existing investments in digital platforms moot. If our subsidiaries fail to adapt quickly, or at all, to changes in technologies or changes in customer behavior, it may have an adverse impact on our subsidiaries resulting from increased competition, which could have a material adverse effect on our financial condition and results of operations.
The banking and insurance markets are exposed to macroeconomic shocks that could have a material adverse effect on our financial condition and results of operations.
Interbank’s business is particularly sensitive to economic and market conditions that affect Interbank’s customers. Although there is limited basis on which to evaluate how Interbank’s business and earnings may perform in the event of an economic crisis, such as a recession or a significant devaluation of the sol, and Interbank’s historical loan loss experience may not be indicative of the performance of Interbank’s loan portfolio in the future, periods of economic contraction could adversely affect Interbank’s customers by limiting their access to jobs. As a result, Interbank’s loan portfolio may become increasingly vulnerable to macroeconomic shocks that could negatively impact the household income of Interbank’s customers and result in increased loan losses which, in turn, could result in higher delinquencies and reduce the number of borrowers eligible for Interbank’s loans. An increase in delinquencies, for instance, could result in a deterioration of Interbank’s risk profile, which could adversely affect Interbank’s business, financial condition and results of operations. Any increase in the number of delinquencies or defaults would result in higher levels of nonperforming assets and provisions for loan losses, which could adversely affect Interbank’s results of operations and financial condition.
In addition, Interbank’s commercial clients could be negatively affected by global and local macroeconomic trends. As a result, our provisions for loan losses, in particular related to credit cards and/or loans granted to certain sectors of the Peruvian economy, have significantly increased during slowdowns of the Peruvian economy. Additionally, in part due to the de-dollarization policy sponsored by the Peruvian government there is a mismatch between our dollar denominated deposits and sol denominated loans. See “Item 5. Operating and Financial Review and Prospects—Depreciation and Appreciation of the sol”.
In the event of a macroeconomic shock, the value of Interseguro’s investments may also suffer losses, including in its investment property. In addition, the amount of savings available to potential annuity holders may be negatively impacted by unemployment or a decline in wages. A macroeconomic shock may also negatively impact wealth generation in Peru and, in turn, impact the demand for our wealth management services.
We could sustain losses if Interbank’s asset quality declines.
Our earnings are significantly affected by Interbank’s ability to properly originate, underwrite and service loans. We could sustain losses if Interbank incorrectly assesses the creditworthiness of its borrowers or fails to detect or respond to deterioration in asset quality in a timely manner. Problems with asset quality could cause our net interest and similar income to decrease and our provisions for loan losses to increase, which could adversely affect our financial condition and results of operations.
Reduced diversification in Interbank’s loan portfolio could have a material adverse effect on our financial condition and results of operations.
While loan portfolio risk associated with lending to certain economic sectors or clients in certain market segments can be mitigated through adequate diversification policies, Interbank’s pursuit of opportunities in which it can charge higher interest rates may reduce diversification of the loan portfolio and expose Interbank to greater credit risk. Reduced diversification could expose Interbank to greater risks in the event of a decline in asset quality. In addition, given the relatively small size of the Peruvian economy,
19
Interbank’s lending diversification is by necessity lower than that of banks with operations in larger economies. Moreover, certain concentrations of borrowers’ commercial sectors may be unavoidable in Peru—principally the natural resources, fishing, agriculture and mining sectors—and deteriorations in such sectors could have a material adverse effect on Interbank’s deposits, loan performance and other businesses.
Furthermore, as of December 31, 2023 and 2024, retail banking loans accounted for approximately 56.0% and 52.5% of Interbank’s loan portfolio, respectively. Higher than average exposure to retail banking could be accompanied by greater credit risk due to higher risk profiles compared, particularly, to loans to large corporate customers. Given the recent growth of Interbank’s loan portfolio, historical loss experience may not be indicative of future doubtful loan experience. If there are outbreaks of pandemics or contagious diseases in the future, such as the COVID-19 pandemic, Interbank’s retail and commercial clients may be impacted and our risk profile may deteriorate, which could adversely affect our business, financial condition and results of operations.
Interbank’s provisions for loan losses may not be adequate to cover the future losses to its loan portfolio or other assets, which could have a material adverse effect on our financial condition and results of operations.
Interbank records allowances for impairment losses on loans and other assets. The amount of allowances recorded is based on Interbank’s current assessment of and expectations concerning various factors affecting the quality of its loan portfolio. These factors include, among other things, Interbank’s borrowers’ financial condition, repayment abilities and repayment intentions, the realizable value of any collateral, the prospects for support from any guarantor, Peru’s economy, government macroeconomic policies, interest rates and the legal and regulatory environment. Many of these factors are beyond Interbank’s control. In addition, as these factors evolve, the models Interbank uses to determine the appropriate level of allowance for impairment losses on loans and other assets may require recalibration, which can lead to increased allowances.
Additionally, as a consequence of other factors that have arisen and may arise in the future, including, for example, political, economic, social and climate uncertainties, and the effects of new laws allowing the withdrawal of CTS deposits and AFP funds (which have generated excess liquidity), we have had to increase, and may have to further increase in the future, our monitoring of the performance results of our retail and commercial clients and make subsequent adjustments of expected loss to our model, which in turn creates a certain level of uncertainty in the estimation of expected losses on loans. See “Item 4. Information on the Company—Business Overview—Selected Statistical Information—Classification of Our Loan Portfolio” and “Item 5. Operating and Financial Review and Prospects—Operating Results—Impairment Loss on Loans, Net of Recoveries.”
Interbank may be unable to realize the collateral or guarantees securing its loans to cover the outstanding principal and interest balance of those loans, which may adversely affect our results of operations and financial condition.
Interbank grants loans that are secured by collateral, including real estate and other assets that are generally located in Peru. The value of collateral may significantly fluctuate or decline due to factors beyond our control, including, for example, economic and political conditions in Peru. An economic slowdown may lead to a downturn in the Peruvian real estate market, which may, in turn, result in declines in the value of real estate securing loans to levels below the principal balances of those loans. Any decline in the value of the collateral securing loans may result in reduced recoveries from collateral realization and have an adverse impact on our results of operations and financial condition.
Interbank may also not have recent information on the value of collateral, which may result in an inaccurate assessment for impairment losses of its loans, which may materially and adversely affect its results of operations and financial conditions.
Interbank also grants loans on the basis of guarantees from relatives, affiliates or associated persons of borrowers. To the extent that guarantors encounter financial difficulties due to economic conditions, personal or business circumstances, or otherwise, Interbank’s ability to enforce such guarantees may be impaired.
In addition, Interbank may face difficulties in enforcing its rights as secured creditors against borrowers, collateral or guarantees. In particular, timing delays and procedural problems in realizing against collateral, as well as insolvency laws or judicial interpretations of the law that may be protective of debtors, may make it difficult to foreclose on collateral, realize against guarantees or enforce judgments in our favor, which could materially and adversely affect our results of operations and financial condition.
Our financial results may be negatively affected by changes to IFRS Accounting Standards.
We report our results and financial position in accordance with IFRS Accouting Standards as issued by the IASB. Changes to IFRS Accounting Standards thereof may cause our future reported results and financial position to differ from current expectations, or historical results to differ from those previously reported due to the adoption of new accounting standards on a retrospective basis. We monitor potential accounting changes and, when possible, we determine their potential impact and disclose significant future changes in our financial statements that we expect because of those changes. As of December 31, 2024, the new and
20
amended standards and interpretations that have been issued, but not yet effective, are not expected to have potential impact on our consolidated financial statements. See Note 3.5 to our consolidated financial statements.
Our financial results may be negatively affected by investment losses.
The investment activities of our subsidiaries are subject to factors beyond their control, and losses from their exposures could result in a material adverse effect on our financial condition and results of operations.
As part of its treasury operations, Interbank trades various financial instruments and other assets, including debt, equity, fixed income, currency and related derivatives, as both agent and principal, and derives a proportion of its non-financial income from trading profits. Interbank has established position limits for sol and foreign currency-denominated securities in accordance with its overall risk management policy and with the SBS requirements. However, Interbank is exposed to numerous factors that are beyond its control, including overall market trading activity, interest rate levels, the credit risk of its counterparties and general market volatility. For example, in 2022, 2023 and 2024 the volatility of our investment portfolio increased due to global factors such as the Ukraine-Russia and the Israel-Hamas-Iran-Hezbollah conflicts and the interest rate increases by the Federal Reserve of the United States. For further information, see “—The Peruvian economy could be adversely affected by economic developments in regional or global markets.” In addition, a significant part of Interbank’s trading is related to customer transactions, and Interbank could be exposed to a number of risks related to the movement of market prices in the underlying instruments, including the risk of unfavorable market price movements relative to its long or short positions, a decline in the market liquidity of the related instruments, volatility in market prices, interest rates or foreign currency exchange rates relating to these positions, and the risk that the instruments with which Interbank chooses to hedge certain positions do not track the fair value of those positions. Furthermore, potential swings in economic policy as a result of the new administration of the United States may impact capital markets dynamics, which in turn may have a detrimental impact in investments results. Also, the imposition of tariffs or other trade barriers by the United States could adversely affect Peru's export-driven economy, leading to reduced trade volumes, lower foreign exchange earnings, and potential disruptions in key industries. If Interbank incurs any further losses from these exposures, it could reduce Interbank’s trading profits or cause it to suffer losses from trading activities, either of which could have a material adverse effect on our financial condition and results of operations.
Inteligo Bank is exposed to similar investment and trading risks as Interbank.
Interseguro is exposed to the risk of a decrease in the value of its investments due to volatility in market conditions, real estate prices, equity values and interest rates, among other factors, many of which are beyond Interseguro’s control. In addition, as a holder of a large portfolio of debt investments and fixed income securities, Interseguro is exposed to the risk that the issuers of its fixed income securities may default.
Furthermore, in all of our segments, our investments may be subject to impairment, due to mark-to-market which could cause volatility in our financial condition and results of operations.
Interest rate changes could have a material adverse effect on our financial condition and results of operations.
Interbank’s and Inteligo’s financial condition and results of operations depend to a large extent on their financial margin, which in turn depends on their ability to charge interest on interest-earning assets, such as loans to customers, that is higher than the interest they pay on interest-bearing liabilities, such as deposits. Changes in interest rates, could influence not only the interest we receive on loans and securities and the amount of interest we pay on deposits and borrowings, but such changes could also adversely affect our ability to originate loans and obtain deposits. We cannot control or predict with certainty changes in interest rates since market interest rates are sensitive to many factors beyond our control, including the interest rate policies of the Central Reserve Bank of Peru and the U.S. Federal Reserve. In recent years, inflation rates throughout the world significantly increased to levels not seen in the last two decades. In response to concerns about inflation, the United States Federal Reserve raised, and may again rise, interest rates.
Interbank’s primary sources of funds are retail deposits with no specific or contractual maturity, and a substantial portion of the loans it originates have a longer term. The difference in maturities between deposits and loans could magnify the effect of any interest rate mismatch, as well as pose a liquidity risk if Interbank were not able to obtain funding as its liabilities mature. This, in turn, may lead to a reduction in Interbank’s net interest margin, which could have a significant adverse effect on its results. Furthermore, if interest rates were to increase, this could reduce the demand for credit and Interbank’s ability to generate credit for their clients, particularly retail clients, as well as contribute to an increase in the default rate.
In connection with the phase-out of the London Interbank Offered Rate (“LIBOR”) as a reference rate, in June 2023, the United States Federal Reserve, in conjunction with the Alternative Reference Rates Committee, chose the Secured Overnight Financing Rate (SOFR), and specifically Term SOFR, as the recommended risk-free reference rate for the United States (calculated
21
based on repurchase agreements backed by treasury securities). Prior to the discontinuation of LIBOR, our subsidiaries amended substantially all of their LIBOR-based financing arrangements to transition them to successor rates, primarily Term SOFR. We cannot predict the future performance of Term SOFR and other successor rates, and we cannot assure you any other similar reforms and changes, any establishment of alternative reference rates or any other reforms to these rates that may be enacted will not affect financial markets generally or the businesses or profitability of our subsidiaries, their financial condition or results of operations specifically. Finally, as a result of such or similar transitions, our subsidiaries may be subject to disputes (including with their customers) related thereto, which could have an adverse effect on their results of operations.
Interseguro faces interest rate risk as a result of the potential variation in interest rates when it reinvests debt instruments to cover its obligations. Interseguro may reinvest when the term of its investments differs from that of its obligations. Interseguro tries to match the cash flows of its obligations with the maturities of its portfolio, but the shortage of instruments with the appropriate maturity profile may result in mismatches with its obligations and, as a result, expose it to interest rate risk.
As a result of the above, the evolution of interest rates could have a material adverse effect on our business, financial condition or results of operations.
Interseguro is exposed to the impact of changes in interest rates on other comprehensive income.
Interseguro estimates its liability for insurance contracts under IFRS Accounting Standards on the basis of our business measurement models and discount rates, which are based on a risk-free rate (i.e. interest rates), and the market volatility associated with them. See Note 3.4(d) to our audited annual consolidated financial statements. Such volatility in interest rates is reflected in Interseguro’s financial position, under other comprehensive income and, depending on the market situation, could have a material adverse effect on our financial position. See Note 29.5(a.1) to our audited annual consolidated financial statements.
Actual mortality and morbidity rates and other factors may differ from those assumed in the calculation of technical reserves and may have a material adverse effect on Interseguro’s financial condition and results of operations.
Actual mortality and morbidity rates may differ from those assumed in the initial calculation of annuity reserves at the time of the issuance of the policy and their periodic adjustments. If Interseguro’s assumptions differ materially from actual mortality and morbidity rates, Interseguro could be required to make payments under its annuities for a longer period of time than originally estimated, and existing reserves could fall short of actual payments. Accordingly, future changes in mortality and morbidity rates could have a material adverse effect on Interseguro`s financial condition and results of operations.
Interbank may not be able to obtain the funding required to support growth and implement its strategy.
Interbank’s strategy to grow its loan portfolio requires it to continue to have an active funding strategy. Interbank’s access to funding depends on many factors, including factors beyond our control, such as public health crises and epidemics, pandemics or outbreaks of highly infectious or contagious diseases, any credit crunch or other conditions in global capital markets and investors’ perceptions of the risks of investing in Peru and emerging markets generally. The 2008 and 2009 global financial and economic crisis, the debt crisis in Europe and general market volatility, for example, had a negative impact on the liquidity of global financial markets. Similarly, pandemics, conflicts, interest rate increases by the Federal Reserve of the United States, trade wars, and other global factors such as the Ukraine-Russia and the Israel-Hamas-Iran-Hezbollah conflicts have caused significant disruption and volatility in the financial markets globally, causing equity levels to fluctuate sharply, which may reoccur or continue to worsen in the future. In the case of similar events, any equity or debt financing, if available at all, may be on terms that are not favorable to Interbank. If access to funding is limited, Interbank may not be able to implement its strategy, which could have a material adverse effect on our financial condition and results of operations.
A reduction in our subsidiaries’ credit ratings could increase their cost of borrowing funds and make their ability to raise new funds and renew maturing debt more difficult.
Our subsidiaries’ credit ratings are an important component of their respective liquidity profile. Among other factors, Interbank’s credit ratings are based on its financial strength, the credit quality and concentrations in its loan portfolio, the level and volatility of its earnings, its capital adequacy, the quality of management, the liquidity of its statement of financial position, the availability of a significant base of core retail and commercial deposits and its ability to access a broad array of funding sources. In addition, our subsidiaries’ lenders may be sensitive to the risk of a ratings downgrade, which could increase the cost of refinancing their existing obligations, raising funds in the capital markets and borrowing funds from private lenders, and could in turn have a material adverse effect on our financial condition and results of operations. Although our subsidiaries’ credit ratings have remained relatively stable over time, our creditors may be sensitive to changes in our credit ratings, and/or outlook. The risk of a future ratings downgrade could increase the cost of refinancing our existing obligations, raising funds in the capital markets and borrowing funds from private lenders, and could in turn have a material adverse effect on our financial condition and results of operations.
22
Interseguro’s failure to underwrite and price insurance premiums accurately for the products it offers would have a material adverse effect on its financial condition and results of operations.
Interseguro’s financial condition and results of operations depend on its ability to underwrite insurance policies and set premium rates accurately. Interseguro must generate sufficient premiums to offset claim losses and cover operating and underwriting expenses to make a profit. In order to price insurance policies accurately, Interseguro must collect and analyze a substantial volume of data, develop, test and apply appropriate rating formulae, closely monitor changes in trends in a timely fashion and project both severity and frequency of loss with reasonable accuracy. If Interseguro fails to assess accurately the risks that it assumes or does not reinsure an appropriate level of risk, it may fail to establish adequate premium rates, which could reduce income and have a material adverse effect on its financial condition and results of operations.
Interbank’s and Interseguro’s reliance on Peruvian sovereign and global bonds in their respective investment portfolios leaves us vulnerable to a default on such debt.
A substantial portion of our investment portfolio consists of Peruvian sovereign and global bonds and Central Reserve Bank of Peru certificates of deposit, which represented 56.7% of our investment portfolio (before accrued interest) as of December 31, 2024. A default on Peruvian sovereign debt could have a material adverse effect on our financial condition and results of operations.
Interseguro may suffer losses in its investment portfolio because of risks associated with its real estate investments.
Interseguro’s investment portfolio includes real estate investments located solely in Peru. As of December 31, 2024, Interseguro’s investments in real estate projects totaled S/1,381.8 million, which represented 9.2% of Interseguro’s total investment portfolio. Real estate investments are relatively illiquid, and Interseguro’s ability to vary its portfolio of properties in response to changes in economic and other conditions is limited. If Interseguro wants or needs to sell a property, it may not be able to do so in the desired time period or on favorable terms, which could have a material adverse effect on our financial condition and results of operations.
Furthermore, Interseguro is exposed to risk in respect of its real estate investments that are under development, including delays in receiving zoning permits, construction delays, changes in regulation or lack of demand.
Interseguro’s investment properties are carried at fair value, which could result in the value of such investment properties declining if market conditions deteriorate. As a result, we could suffer an adverse impact on our financial condition and results of operations.
Tax exemptions applicable to a substantial portion of Interseguro’s investment earnings could be changed in the future.
Interseguro pays no income tax, primarily because its investment earnings in respect of its life insurance technical reserves are entirely exempt from income tax. Future changes in tax laws or regulations limiting or eliminating the current tax exemption could have an adverse effect on our financial condition and results of operations.
We and our subsidiaries are dependent on key personnel.
Our development, operation and growth have depended significantly upon the efforts and experience of our and our subsidiaries’ board of directors, senior management and key personnel. Most of the members of our senior management have held management positions with other major financial institutions in the United States, Latin America and Europe. Although we currently expect our and our subsidiaries’ board of directors and other senior managers to remain in their positions, the loss of their services, or our inability to attract and retain qualified personnel to replace them, could have a material adverse effect on our financial condition and results of operations.
Interruption, mismanagement or failure in our subsidiaries’ information technology systems may adversely affect their operations.
Our success and the success of our subsidiaries depend on the efficient and uninterrupted operation of our subsidiaries’ computer and communications hardware systems and our applications, including systems and applications that support the operation of Interbank’s financial stores, ATMs, Interbank Agente (correspondent agents), mobile applications and website, as well as the infrastructure components that support our operations (communication devices, networking, etc.). Our subsidiaries’ computer and communications systems and operations could be damaged or interrupted by fire, flood, power loss, telecommunications failure, sabotage, computer viruses, cyberattacks, physical or electronic break-ins, acts of war, terrorist attacks and similar events or disruptions. Any of these events could cause system interruptions, delays and losses of critical data and could prevent our subsidiaries from operating at optimal levels or at all.
23
Any failure, interruption or breach in security of our subsidiaries’ information systems could result in failures or interruptions in their risk management, general ledger, deposit servicing, loan organization and/or other important operations, as applicable. Although our subsidiaries have developed back-up systems and a disaster recovery center, and may continue some of their operations in case of emergency, if their information systems fail, even for a short period of time, then they may be unable to serve some or all of their customers’ needs on a timely basis. Likewise, a temporary shutdown of our subsidiaries’ information systems, such as the intermittent interruptions experienced on Interbank’s operating systems on October 30 and 31, 2024, which were promptly addressed and effectively contained, could result in additional costs for information retrieval and verification. In the current competitive landscape, if financial or insurance institutions fail to update and develop their existing information systems as effectively as their competitors, such failure may result in a loss of the competitive advantages that such institutions believe their information systems provide. Furthermore, such institutions may not have adequate insurance coverage or insurance limits to be compensated for losses from a major interruption.
If our subsidiaries experience a data security breach and confidential customer information is disclosed to or accessed by third parties, their customers could be adversely affected. The collection of data and processing of transactions require our subsidiaries to receive and store a large amount of personally identifiable data. This type of data is subject to legislation and regulation in various jurisdictions, including Peru. Data security breaches suffered by well-known companies and institutions have attracted a substantial amount of media attention, prompting U.S. state and federal legislative proposals addressing data privacy and security. Our Peruvian subsidiaries are subject to requirements to protect the personally identifiable information that they process in connection with their services. Our Peruvian subsidiaries may become exposed to potential liabilities with respect to the data that they collect, manage and process, and may incur legal costs if their information security policies and procedures are not effective or if they are required to defend their methods of collection, processing and storage of personal data. In this regard, on October 30, 2024, a third party alleged to have accessed certain confidential information from a group of Interbank’s customers to extort Interbank. However, the event did not compromise the security of Interbank’s computer and communications hardware systems or Interbank’s applications and did not affect the financial products and transactions of Interbank’s clients, and Interbank acted promptly to verify there were no other consequences.
In addition, our current strategy involves significant investments to expand and develop our IT, applications and systems in order to unify and simplify them, and increase the volume of transactions and operations performed online by our personnel and clients. We have also contracted with a third-party provider to ensure the stability and security of our systems and IT infrastructure and to also bear the risk of the failure of that third party. However, there can be no assurance that such strategy or its implementation will be successful, or whether it will result in failures, shutdowns or damage to our business and operations.
Moreover, additional regulations or new requirements may emerge related to cybersecurity controls and data quality, as well as contractual commitments in accordance with standards established by the Information Security and Cybersecurity Management regulation (the “Reglamento para la Gestión de la Seguridad de la Información y la Ciberseguridad”), approved by SBS Resolution No. 504-2021 (as amended by SBS Resolutions No. 1515-2021, 3240-2023 and 2286-2024). Any failure or perceived failure by financial and insurance institutions to comply with such obligations may result in governmental enforcement actions and regulatory penalties, which could have an adverse effect on our reputation. Moreover, in November 2021, the SBS approved amendments to the Plan Business Continuity regulation (the “Reglamento para la Gestión de la Continuidad del Negocio”), approved by SBS Resolution No. 877-2020 (amended by SBS Resolutions No. 1536-2020, 3601-2021 and 3955-2022) aimed to manage the enterprise and business unit levels, with business units identifying, measuring, monitoring, managing, and reporting these and other operational risks at a more detailed level. Failure to comply with these rules could result in a loss a material effect on results of operations and financial losses.
The occurrence of any failures or interruptions in our subsidiaries’ IT systems, or the failure of our subsidiaries to adequately address them if they do occur, as well as data security breaches incurred by our subsidiaries, could have a material adverse effect on our reputation, financial condition and results of operations, including as a result of facing significant fines, customer notice obligations or costly litigation, maintaining or upgrading their IT systems, or performing other IT services on a timely basis.
Cybersecurity events could negatively affect our reputation or results of operations and may result in litigation.
Information security risks have increased in recent years due to the proliferation of new technologies and the increasing sophistication and number of cyberattack activities as well as the growing connectivity of equipment and systems to the internet. Data security breaches suffered by numerous companies and institutions around the world have attracted considerable amount of media attention and are leading different regulators to strengthen the legislation requirements for addressing data security and privacy issues. Our subsidiaries depend on a variety of internet-based data processing applications, communication and information exchange platforms, and networks as part of their operations and digital strategy.
In recent years, cybersecurity risks have increased significantly mainly due to remote working arrangements and the increased use of digital channels by the clients of our subsidiaries. In this regard, we and our subsidiaries have implemented additional
24
cybersecurity measures to prevent, detect, and respond to these risks. These measures mainly focus on strengthening the security of devices used by our employees working remotely, improving the connection and authentication methods used in remote connections, managing the risk of third parties that are part of our subsidiaries’ operation more rigorously, increasing the frequency of their cybersecurity awareness programs, and improving the capability of their cybersecurity threat detection, response, and intelligence procedures.
Although we and our subsidiaries continue to assess and strive to improve the effectiveness and security of our systems by adopting industry-recognized and suggested security standards, as well as those mandated by Peruvian laws and regulations, given the current cybersecurity dynamics, we cannot guarantee to holders of our common shares that all of our systems are free from vulnerabilities or that the measures adopted will be successful in preventing cyberattacks scenarios. In the event of a cyberattack, we or our subsidiaries may suffer disruptions to business operations, experience response costs and losses, and may be subject to litigation and reputational harm. A cyberattack could have a material adverse effect on our or our subsidiaries’ business, financial condition, and results of operations. For further information on the cybersecurity protections and details of the information technology units of our subsidiaries, please refer to “Item 4. Information on the Company—Business Overview—Information Technology Unit” for each of our three business segments and “Item 16K. Cybersecurity.”
Our subsidiaries are susceptible to fraud, unauthorized transactions and operational errors.
Our subsidiaries are susceptible to, among other things, fraud or bad faith by employees or outsiders, unauthorized transactions by employees and other operational errors (including clerical or record keeping errors and errors resulting from faulty computer or telecommunications systems). Given a high volume of transactions that may occur at a financial institution, errors could be repeated or compounded before they are discovered and remedied. In addition, a number of transactions are not fully automated, which may further increase the risk that human error or employee tampering could result in losses that may be difficult to detect quickly or at all.
While our subsidiaries maintain a system of internal controls designed to monitor and control operational risk, losses from the failure of their system of internal controls to discover and rectify such risks could have a material adverse effect on our reputation, our financial condition and results of operations.
Our existing insurance coverage may be insufficient and future coverage may be difficult or expensive to obtain.
Although we believe that our insurance policies provide adequate coverage for the risks inherent in our businesses, these insurance policies typically exclude certain risks and are subject to certain thresholds and limits. We cannot assure holders of our common shares that our properties, equipment, inventories and other assets will not suffer damage due to unforeseen events or that the proceeds available from our insurance policies will be sufficient to protect us from all possible loss or damage resulting from such events. Our subsidiaries renew our insurance policies on an annual basis. The cost of coverage may increase to an extent that we may choose to reduce our policy limits or agree to certain exclusions from our coverage. Among other factors, adverse political developments, security concerns and natural disasters may materially adversely affect available insurance coverage and result in increased premiums for available coverage and additional exclusions from coverage. As a result, our insurance coverage may prove to be inadequate for events that may cause significant disruption to our operations, which could have a material adverse effect on our financial condition and results of operations.
Our subsidiaries' employees could join labor unions and our subsidiaries could be subject to organized labor actions, including work stoppages that could have a material adverse effect on their business.
Even though the employees of our subsidiaries are not unionized and have not entered into any collective bargaining agreement, nothing prevents them from doing so in the future. Conflicts with the employees of our subsidiaries and organized labor actions such as work disruptions or stoppages or requirements to increase employee salaries and/or benefits as a result of future collective bargaining agreements, governmental regulations or policies or otherwise could cause us to suffer a material adverse effect on our financial condition and results of operations.
Our trademarks and trade names may be misappropriated or challenged by others.
We own the material trademark and trade name rights used in connection with our brands and businesses and the marketing and sale of their respective products and services. We believe our brand names and related intellectual property are important to our continued success. We attempt to protect our trademarks and trade names by exercising our rights under applicable trademark and copyright laws. Any infringement of our intellectual property rights would likely result in a commitment of our time and resources to protect these rights through litigation or otherwise, which could be expensive and time-consuming. If we were to fail to protect our intellectual property rights for any reason, it could have a material adverse effect on our financial condition and results of operations.
25
Any failure to comply with anti-corruption, anti-bribery, anti-money laundering and anti-terrorist financing and antitrust laws and regulations could damage our reputation or expose us to penalties.
We are subject to various international and local regulations, including anti-corruption, anti-bribery, AML, anti-terrorist financing, and antitrust laws in jurisdictions such as the Bahamas, Panama, Peru, the United States, and other countries where we operate. Additionally, regulatory frameworks govern our transactions with sanctioned countries, individuals, and entities. Non-compliance with these laws could lead to substantial economic fines, regulatory sanctions, or enforcement actions.
To mitigate these risks, we have implemented a compliance framework across our subsidiaries, which includes policies and procedures such as:
•
A "know-your-customer" (KYC) client identification program;
•
Ongoing monitoring of the Office of Foreign Assets Control (OFAC), local and international sanctions lists;
•
Continuous transaction monitoring and enhanced due diligence for high-risk clients;
•
An antitrust policy; and
•
Internal controls and quality assurance programs.
Our AML program is based on the laws and regulations of the Bahamas, Panama, Peru, the United States, and international best practices, including the recommendations of the Financial Action Task Force (FATF). We also conduct due diligence on financial institutions to ensure their AML policies align with our standards.
While these measures significantly reduce the risk of money laundering and terrorist financing, they cannot entirely eliminate it. Despite our best efforts, illicit activities may evade detection. When subsidiaries identify suspicious activities, they report them to the relevant authorities and add the entities involved to an internal "blacklist" to prevent future transactions and mitigate reputational risks. However, there is no guarantee that these measures will always be effective in preventing third parties from using our subsidiaries or correspondent banks for illicit purposes. Should any subsidiary be associated with illegal activities, such as money laundering or terrorist financing, it could damage our reputation and result in penalties, sanctions, or inclusion on official "blacklists". Such outcomes could materially and adversely affect our business, financial condition, and operations, limiting our ability to grow and maintain client and partner relationships.
In addition, we adhere to applicable anti-bribery and anti-corruption regulations, particularly in dealings with government officials and other high-risk stakeholders. While we have not faced fines, penalties, or significant business or reputational impact due to alleged violations, there is no assurance that our internal policies and procedures will detect or prevent all instances of fraud, inappropriate practices, or legal violations by employees, directors, officers, partners, agents, or service providers. Despite our ongoing efforts to maintain compliance, we may, in the future, uncover instances where we failed to meet regulatory or internal standards. If any associated party engages in fraudulent or unethical activities, we could face enforcement actions by Peruvian or foreign authorities (including the U.S. Department of Justice), resulting in fines, penalties, sanctions, and reputational damage. These consequences could adversely affect our business, financial condition, and operational results.
Thus, while we remain vigilant and proactive in mitigating these risks, compliance challenges and potential exposure to legal and reputational harm remain inherent to our operations.
We and our subsidiaries are subject to litigation and other legal, administrative and regulatory proceedings.
We and our subsidiaries are regularly party to litigation and other legal proceedings relating to claims resulting from operations in the normal course of business. The interpretation and enforcement of certain provisions of existing or any additional agreements we may enter into in the future may result in disputes among us and customers or third-parties. Litigation is subject to inherent uncertainties, and unfavorable rulings may occur. We cannot assure holders of our common shares that the legal, administrative and regulatory proceedings in which we and our subsidiaries are involved will not materially and adversely affect our ability to conduct our respective business in the manner that we and they expect or otherwise adversely affect our respective results of operations and financial position should an unfavorable ruling occur.
Legal restrictions on our clients may reduce the demand for our services.
We may be materially affected not only by regulations applicable to us, but also by regulations and changes in enforcement practices applicable to our clients. Our business could be affected by, among other things, existing and proposed tax legislation, antitrust and competition policies, corporate governance initiatives, consumer protection laws, data use regulation and other governmental regulation and policies, and changes in the interpretation or enforcement of existing laws and rules, that affect our
26
clients’ businesses and the financial markets. For example, a focus on tax compliance and changes in enforcement practices could lead to asset outflows from our private banking businesses, including at our subsidiary Inteligo.
Our risk management structure may not be fully effective.
Our objective is to fully incorporate the risk management process into all of our activities and the activities of our subsidiaries, developing and implementing methodologies, models and other tools for the measurement and control of risks, and looking to improve them in order to mitigate the risks that we identify. However, there may be limitations to this risk management framework in foreseeing and mitigating all the risks to which we or our subsidiaries are subject, including credit, market and operational risks, among others, or those to which we may, in the future, become subject. If our risk management structure is not completely effective in adequately preventing or mitigating risks, we could suffer material unexpected losses, adversely affecting our financial condition and operating results.
Implementation of tax laws related to the global minimum tax may increase our subsidiaries’ tax liabilities, and, as a result, have a material and adverse effect on us.
In 2021, the Organization for Economic Cooperation and Development (“OECD”) published the draft Global Anti-Base Erosion Model Rules aimed at ensuring that multinational enterprises would be subject to a global minimum 15% tax rate. Jurisdictions around the world, including those jurisdictions in which our subsidiaries operate, are implementing changes to their tax regimes to align with global minimum tax rules. For example, The Government of The Bahamas released a document entitled “Green Paper on Corporate Income Tax Strategies for The Bahamas” (the “Green Paper”) in 2023, which stated purpose was to provide the options under consideration for a new corporate income tax regime to support its implementation of the OECD’s global minimum tax rules. The Green Paper outlined a few options, including a statutory 15% corporate income tax rate for in-scope multinational enterprises. In February 2024, the Prime Minister of The Bahamas communicated that The Bahamas would move forward with implementing a Qualified Domestic Minimum Top-Up Tax in accordance with the OECD’s global minimum tax rules. On August 12, 2024, the Government of The Bahamas released its draft Domestic Minimum Top-Up Tax Bill, 2024 for public consultation. The bill was passed on November 28, 2024 by the Parliament of The Bahamas and is deemed to have come into force retroactively on January 1, 2024 (the “Act”) and pursuant to the terms provided in the Act. The Act introduces a Domestic Minimum Top-Up Tax (DMTT) on Multinational Enterprises (MNEs) in accordance with the OECD’s Pillar Two Framework. This new legislation may result in an increase in tax liabilities for Inteligo Bank, which could have a material adverse impact on its business, financial condition, and results of operations.
It is worth mentioning that the DMTT will not apply to Inteligo Bank for the fiscal year ended 31 December 2024, considering the specific provisions in number 2 of the Section “Short Title and Commencement” of the Act. According to the Act, there is no requirement for either the Income Inclusion Rule (IIR) or the Undertaxed Profit Rule (UTPR) to be applicable to the Bahamian entities within the MNE Intercorp Group for 2024. Therefore, since neither of these rules are triggered for Inteligo Bank, the DMTT will not be applicable for the year 2024.
In addition, on December 21, 2024, Spain adopted the Income Inclusion Rule (IIR) and Qualified Domestic Minimum Top-Up Tax (QDMTT) of the OECD's global minimum tax rules for taxable years beginning on December 31, 2023. Spain has also adopted the undertaxed payment/profit rule (UTPR) of the OECD’s global minimum tax rules for taxable years beginning on or after December 31, 2024. The UTPR would apply to multinational groups with annual consolidated revenue of at least EUR 750 million.
Disruptive innovation by fintechs and insurtechs may result in increased competition, and as a result, have a material and adverse effect on our subsidiaries.
Although most fintech and insurtech companies are still in their early stages, and the level of adoption is relatively low compared to the traditional financial system, they represent a disruptive force that is transforming the financial and insurance landscape.
Failure by our subsidiaries to effectively anticipate or adapt to emerging technologies or changes in customer behavior could delay or prevent our access to new digital-based markets. Furthermore, the widespread adoption of new technologies, including payment systems, could require substantial expenditures to modify or adapt our existing products and services as we continue to grow our digital capabilities. As a result, our subsidiaries’ customers may choose to conduct business or offer products on alternative or emerging platforms. Such new technologies could negatively impact our investments in infrastructure, equipment, and personnel, or if our subsidiaries do not properly anticipate trends, render our existing investments in digital platforms moot. If our subsidiaries fail to adapt quickly, or at all, to changes in technologies or changes in customer behavior, it may have an adverse impact on our subsidiaries resulting from increased competition, which could have a material adverse effect on our financial condition and results of operations.
Transition to a low-carbon economy may have a material and adverse effect on our subsidiaries’ results of operations.
27
The shift towards a lower-carbon economy can create challenges and potential financial losses to us or our subsidiaries if not managed effectively. In the case of Interbank, borrowers in high-emitting sectors might face financial difficulties due to regulatory changes, technological disruptions, or changing consumer preferences. This could lead to loan defaults, impacting banks' asset quality and profitability. Inteligo can face stranded assets in its investments in companies or assets heavily reliant on fossil fuels, which value could decrease as the transition progresses. In general, we might face higher operational costs due to regulatory changes not only related to climate risk disclosure or carbon pricing, but also to capital requirements related to climate risks, increasing compliance costs and potentially restricting lending activities. The overall impact can lead to decreased profitability and shareholder value.
Public health crises and epidemics/pandemics could adversely affect our and our subsidiaries’ business, financial condition and results of operations.
Interbank’s business is dependent upon the willingness and ability of the customers to conduct banking and other financial transactions. The spread of a highly infectious or contagious disease could cause severe disruptions and volatility in the world economy, which could in turn disrupt the business, activities, and operations of Interbank’s customers, as well as its business and operations. For example, strong measures to mitigate the COVID-19 contagion were taken by governments all around the world, which included closed international borders and severe mobility restrictions (quarantines). There remains considerable uncertainty as to the effects of future public health epidemics on the global and Peruvian economies.
To the extent outbreaks of pandemic or contagious diseases adversely affect our business and financial results, it may also have the effect of heightening many of the other risks described in this section, such as those relating to Interbank’s high level of indebtedness, its need to generate sufficient cash flows to service its indebtedness and its ability to comply with the financial covenants contained in the agreements that govern its indebtedness.
Risks Relating to Peru
Economic, social and political developments in Peru, including political instability, social unrest, persistent inflation and unemployment, could have a material adverse effect on our businesses.
Substantially all of the operations and customers of our subsidiaries are located in Peru. Accordingly, our financial condition and results of operations are dependent on the level of economic activity in Peru. Our financial condition and results of operations could be affected by changes in economic conditions (both domestic and international), policies of the Peruvian government (which has exercised and continues to exercise substantial influence over many aspects of the private sector) and by other economic and political developments in Peru, including devaluation, currency exchange controls, limits on interest rates, seizure of private property, financial regulation, inflation, economic downturns, corruption scandals, social unrest and terrorism, among others.
Historically, Peru’s GDP growth rates and external surplus, reflect, in part, the strength of Peru’s economic fundamentals. However, ongoing deterioration of the global economy, rising inflation and fuel prices may adversely affect Peru’s economy. In addition, an economic contraction or weak economic growth in Peru’s trading partners may have an adverse effect on Peru’s economy. Despite Peru’s ongoing economic growth and stabilization, social and political tensions and high levels of poverty and unemployment continue. The combination of these factors may be exacerbated by political events, which may lead to intensified economic, social and/or political crises, sparking a wave of protests and social unrest.
Furthermore, Peru has experienced political instability that has included a succession of regimes with differing economic policies and programs, followed by periods of stability. Beginning in 2018, Peru has suffered a series of government institutional crises due to, among other things, several corruption and political scandals involving prominent political figures, which have resulted in resignations and impeachment of various presidents since then.
Peru’s most recent presidential elections took place in April 2021. Following a run-off between the top contenders, José Pedro Castillo Terrones (Partido Político Nacional Perú Libre), a far-left candidate, and Keiko Sofia Fujimori Higuchi (Fuerza Popular), a center-right candidate, on June 6, 2021, Pedro Castillo was elected as Peru’s president and sworn in as President on July 28, 2021.
On December 7, 2022, Mr. Castillo announced his intention to dissolve the Peruvian Congress and to intervene in, among others, the Peruvian judicial branch and Superior Court. Mr. Castillo’s actions were deemed to constitute an attempted coup, which led to his impeachment and arrest. According to the Peruvian Constitution, Mr. Castillo was succeeded by his then vice-president, Dina Boluarte.
Furthermore, on early 2024, the Peruvian Prosecutor’s Office informed the beginning of preliminary investigations to President Boluarte for an alleged illicit enrichment, which led to the filing of motions intending to impeach the President, but the motions did not obtain the required votes to being admitted to debate in the Congress. Moreover, the mass violent protests in several regions of the country following former President Castillo’s impeachment in December 2022, together with the political uncertainty
28
over the past years have raised concerns about the ability of the government to implement long-term and consistent economic and social policies required to combat social and economic issues in the future. The government’s failure to address and alleviate these concerns could result in rating agencies downgrading Peru’s sovereign debt rating, which in turn could affect our rating and materially impact our business and operations.
On the other hand, the Peruvian Congress approved modifications to the Peruvian Constitution which include the return to bicameralism (replaced by a unicameral Congress in 1993) and parliamentary re-election (which was prohibited by referendum in 2018).
In the past, previous governments have imposed controls on prices, exchange rates, local and foreign investment and international trade, restricted the ability of companies to dismiss employees, expropriated private sector assets and prohibited the remittance of profits to foreign investors. Former President Vizcarra was known for pursuing business-friendly and open-market economic policies, which remained in place during former President Sagasti’s term, while former President Castillo was known for having proposed certain tax, fiscal, financial and economic restrictions in line with his party’s left-leaning agenda. President Boluarte has also pursued business-friendly and open-market economic policies. However, any future policies that might be implemented by the Peruvian government and/or the next president and/or any action taken by the Peruvian Congress could impact interest rates and currency volatility, as well as adversely and materially affect the Peruvian economy, which could have a material adverse effect on our financial condition and results of operations. See “—Potential exchange controls implemented by the Peruvian government could adversely affect our ability to pay dividends and have a material adverse effect on our financial condition and results of operations.” In addition, economic, social and political developments in the region may have an adverse effect on Peru’s economy.
There can be no assurance that Peru will not face continued or new economic, political or social problems in the future or that these problems will not adversely affect our business, financial condition and results of operations. Future government policies to pre-empt or respond to social unrest could include, among other things, declarations of state of national emergency, expropriation, nationalization, suspension of the enforcement of creditors’ rights and new taxation policies.
Fluctuations in the value of the sol could have a material adverse effect on our financial condition and results of operations.
In recent years, the sol has maintained a relatively stable value vis-à-vis U.S. dollars, with periods when it even experienced a revaluation. Despite this stability, this trend could be altered by a heightened perception of political risk, changes in economic fundamentals, or a prolonged or significant downturn in key macroeconomic indicators. Consequently, there is no guarantee that the pace of change of the national exchange rate will remain homogeneous.
As the Peruvian banking system is still partially dollarized, with 27.5% of gross loans and 38.9% of deposits denominated in U.S. dollars as of December 31, 2024, devaluation of the sol against the U.S. dollar could have a negative impact on the ability of Interbank’s clients to repay loans and make premium payments.
We are exposed to currency mismatch risks. Within our insurance segment, a similar adverse effect could occur on Interseguro’s local debt holdings denominated in foreign currency. Despite any devaluation, and absent any change in foreign exchange regulations, Interbank and Interseguro would be required to continue to repay dollar-denominated deposits in U.S. dollars. In addition, while we seek to manage the gap between Interbank’s and Interseguro’s foreign currency-denominated assets and liabilities, by matching, for example, the volumes and maturities of Interbank’s sol-denominated loans against Interbank’s sol-denominated deposits, we may not be successful in doing so. Therefore, any significant devaluation of the sol against the U.S. dollar could have a material adverse effect on our financial condition and results of operations. In addition, a devaluation of the sol against the U.S. dollar would decrease the dollar value of any dividends paid to us by our subsidiaries, and, as a result, our ability to pay dividends could be materially and adversely affected. An appreciation of the sol could also have an adverse impact on our results of operations as reported in soles, as Inteligo’s operations are denominated in U.S. dollars, but our reporting currency is in soles.
A downgrade in Peru’s credit ratings may affect the perception of Peru and its economy and consequently adversely affect us.
In December 2022 and January 2023, S&P, Fitch and Moody’s changed Peru’s credit outlook to negative from stable due to higher political risk. In April 2024, S&P downgraded Peru’s credit rating from BBB to BBB-.However, in April, September, and November 2024, S&P, Moody’s, and Fitch, respectively, changed Peru’s credit outlook back to stable. We cannot predict whether Peru’s credit ratings will be further downgraded and what the effects of any such downgrades may be on Peru’s economy, which could have a material adverse effect on our business, financial condition and results of operations. If either or all of S&P, Moody’s, and Fitch further downgrade Peru’s credit ratings, it is likely that our credit rating would also be downgraded. An increase in the perceived risks associated with investments in Peru may adversely affect the Peruvian economy in general and may discourage foreign investment in Peru.
29
Potential exchange controls implemented by the Peruvian government could adversely affect our ability to pay dividends and have a material adverse effect on our financial condition and results of operations.
Since 1991, the Peruvian economy has undergone a major transformation from a highly protected and regulated system to a free market economy. During this period, protectionist and interventionist laws and policies have been dismantled gradually to create a liberal economy dominated by the private sector. The Peruvian economy has, in general, responded well to this transformation, growing at an average annual rate of 3.5% during the period from 2010 to 2024. Exchange controls and restrictions on remittances of profits, dividends and royalties have ceased. Prior to 1991, Peru exercised control over the foreign exchange markets by imposing multiple exchange rates and placing restrictions on the possession and use of foreign currencies. Currently, foreign exchange rates are determined by market conditions, with regular open-market operations by the Central Reserve Bank of Peru in the foreign exchange market to reduce volatility in the value of Peru’s currency against the U.S. dollar.
There can be no assurance that the Peruvian government will not institute restrictive exchange rate policies in the future. Any such restrictive exchange rate policy could have a material adverse effect on our subsidiaries’ business, financial condition and results of operations and adversely affect their ability to repay debt or other obligations and therefore restrict their access to international financing.
Volatility in exchange rates may also result in significant competitive benefits to certain of our subsidiaries’ competitors who incur a greater part of their costs in other currencies than our subsidiaries’ do or increase our subsidiaries’ hedging costs and limit our subsidiaries’ ability to hedge their exchange rate exposure.
Any dividends paid to us by Interbank, Interseguro, Inteligo SAB and Izipay will be paid in soles. Peruvian law does not impose any restrictions on the ability of companies having operations in Peru to transfer foreign currencies from Peru to other countries, except for restrictions applicable to companies that have been convicted or have admitted to and/or acknowledged committing crimes against the Peruvian public administration or money laundering or equivalent crimes, as set forth in Law No. 30737 (a law that provides for the compensation of the governmental entity in cases of corruption and other crimes) and Urgency Decree No. 003-2017 (Urgency Decree to Ensure Continuity of Public Utility Investment Projects and Safeguard Compensation to the State in Cases of Corruption), which restricts the transfer of both local and foreign currency abroad. Except for the restrictions set forth in such regulations, companies having operations in Peru may freely transfer foreign currency from Peru to other countries. If the Peruvian government were to implement restrictive exchange rate controls in the future, we might be obligated to seek an authorization from the Peruvian government to make dividend payments. We cannot assure holders of our common shares that such an authorization would be obtained. Any such exchange rate restrictions or the failure to obtain such an authorization could materially and adversely affect our ability to pay our shareholders.
Increased inflation in Peru could have an adverse effect on the Peruvian long-term credit market as well as the Peruvian economy generally and, therefore, on our financial condition and results of operations.
In the past, Peru has suffered through periods of high and hyper-inflation, which has materially undermined the Peruvian economy and the government’s ability to create conditions that support economic growth. In response to increased inflation, the Central Reserve Bank of Peru, which sets the Peruvian basic interest rate, may increase or decrease the basic interest rate in an attempt to control inflation or foster economic growth. Increases in the base interest rate could adversely affect our results of operations, increasing the cost of certain funding. Additionally, a return to a high inflation environment would also undermine Peru’s foreign competitiveness, with negative effects on the level of economic activity and employment, while increasing our operating costs and adversely impacting our operating margins. As of December 31, 2024, the rate of inflation was 1.97%, compared to 3.24% in the year ended December 31, 2023, and, in its latest estimate, as inflation rates improved in 2023, the BCRP reduced the reference rate four times, from 7.50% to 6.75%, and seven times in 2024, bringing it to 5.00%. As of December 31, 2024, the Central Reserve Bank of Peru has estimated Peru’s inflation to be within its target range in 2025.
The stability of the Peruvian financial system depends on public confidence in Peruvian banking and financial institutions.
Financial institutions, including Interbank and Interseguro, depend on public confidence in the Peruvian financial system. In the event of adverse developments affecting Peru’s economic, political or social conditions or if a bank faces liquidity problems, the general public may withdraw deposits and savings from the troubled bank or from banks generally, thereby precipitating a liquidity crisis, as occurred in Peru in the late 1990s.
If depositors withdraw significant holdings from banks generally, including Interbank, there would be a substantial adverse impact on the manner in which financial institutions, including Interbank and Interseguro, conduct their business, on their ability to operate as financial intermediaries and on their financial condition, which could have a material adverse effect on our financial condition and results of operations.
30
The Peruvian economy could be adversely affected by economic developments in regional or global markets.
Financial and securities markets in Peru are influenced by economic and market conditions in regional or global markets. Although economic conditions vary from country to country, investors’ perceptions of the events occurring in one country may adversely affect cash flows and securities from issuers in other countries, including Peru. Peru’s economy continues to be affected by events in the economies of its major regional partners and in developed economies that are trading partners or that affect the global economy.
Starting in 2020, Brexit and regional developments in China and other Asian countries, as well as the market turmoil generated by the bank failures in the United States, and the emergency sale of Credit Suisse in early 2023, contributed to increased volatility and uncertainty in a number of financial markets. In addition, the announcement of rate increases by the U.S. Federal Reserve, the trade war between the United States and China, and, while our direct exposure to Russia is limited, Russia’s large-scale continued military invasion of Ukraine, the military conflict between Israel and Hamas as well as Iran and Hezbollah, among other factors, had, in the past, and may have, in the future, an impact on the Peruvian economy by adding inflationary pressures, including in respect of high food and energy prices. Moreover, the high inflation combined with the interest rate increase by the Federal Reserve of the United States impacted our liquidity in the capital markets.
Any interruption to the recovery of the developed economies, the continued effects of the global crises, a worsening or resurgence of the debt crisis in Europe, a new geopolitical tension in Europe resulting in economic and/or financial crisis, or new bank failures in the United States, Peru or other countries, or a combination of the above, could affect the Peruvian economy, and consequently, materially adversely affect our business. Our business is particularly sensitive to economic and market conditions which affect products of various export industries, including textile, fishing, and agriculture. In addition, we are active in the real estate sector, which can also be highly sensitive to macroeconomic developments. Although we have relatively little exposure to the mining sector, a decline in commodity prices could negatively affect the Peruvian economy as a whole. Any increase in the number of delinquencies or defaults would result in higher levels of non-performing assets and provisions for loan losses, which could have a material adverse effect on our financial condition and results of operations.
An additional source of risk are the economic and foreign policies that may be enacted by the new administration of the United States . We cannot assure you that investors’ interest in Peru, or the Peruvian economy will not be negatively affected by the policies of the new administration of the United States. Furthermore, the imposition of tariffs or other trade barriers by the United States could adversely affect Peru's export-driven economy, leading to reduced trade volumes, lower foreign exchange earnings, and potential disruptions in key industries.
During February and March 2025, the U.S. government-imposed tariffs on the import of its trading partners (some of which were subsequently delayed), which, in some cases, resulted in the adoption of retaliatory tariffs. The U.S. government imposed a 10% tariff on Peru imports. These and other policies of the new administration-including fiscal, regulatory, industrial or foreign policies-could slow U.S. or global economic growth (especially, if they give rise to trade wars), increase inflation, affect interest rates or otherwise increase financial and macroeconomic instability, any of which could adversely affect our business, financial condition and results of operations.
Additionally, adverse developments in regional or global markets or an increase in the perceived risks associated with investing in emerging markets in the future could adversely affect the Peruvian economy and, as a result, adversely affect our businesses.
A decline in the prices of certain commodities in the international markets could have a material adverse effect on our financial condition and results of operations.
Peru’s exports are highly concentrated in the mining industry; copper and gold exports share of total exports was around 50% of all shipments as of December 31, 2024. Peruvian trade responds significantly to fluctuations in metal prices, especially copper. In 2024, Peru’s trade surplus increased to a record of U.S.$23.8 billion from U.S.$17.7 billion in 2023, due to an increase of 12.4% in exports, an increase of 4.5% in imports and positive terms of trade. The average copper price for 2024 was U.S.$4.15 per pound, 4% higher than the average of U.S.$3.85 per pound in 2023, while oil prices fell 1.3% over the same period (to U.S.$76.6 per barrel). In addition to changes in prices, Peru is also vulnerable to fluctuations in foreign demand, especially from China and the United States, Peru’s main trading partners. The European Union is also an important buyer of Peruvian goods, especially of non-traditional ones. Consequently, lower growth than forecasted from these countries would pose risks to Peru’s economic growth as it may impact exports and foreign direct investment.
Decreases in commodity prices may have a negative impact on government finances, and consequently regional and local governments may lower their spending on social programs that primarily benefit rural communities. This may result in decreased support for the central government, which could manifest itself through political unrest. In recent years, several provinces have
31
experienced protests, primarily driven by groups opposing private investments, particularly in mining projects. Lower commodity prices could also affect private investment, consumption, and, consequently, the financial system, leading to, for example, lower credit demand, deteriorating asset quality and currency depreciation.
The market volatility generated by distortions in the international financial markets may affect the Peruvian capital markets and the Peruvian banking system.
The global financial and economic crisis of 2008 and 2009, and more recently, the COVID-19 pandemic and the market turmoil generated by the bank failures in the United States and the emergency sale of Credit Suisse, adversely affected and increased the volatility of the performance of the Lima Stock Exchange. The Lima Stock Exchange was downgraded from an “emerging market” to “frontier market” in September 2020. Similar or other unanticipated events may affect trading activity in the Peruvian capital markets. In recent years, the Lima Stock Exchange has experienced increased participation from local and international retail investors that react rapidly to the effects from international markets. The general index of the Lima Stock Exchange increased by 1.0% in 2022, by 21.7% in 2023 and by 11.56% in 2024. Volatility in the international markets may adversely affect the Peruvian capital markets and could therefore impact our ability to raise funds from local capital markets at a level necessary to fund our operations.
Although the Peruvian banking system has not experienced any significant liquidity problems in recent years, primarily because the major source of funds for local banks, including Interbank, is represented by the deposit base, future market volatility may affect do so. The occurrence of such volatility could have a material adverse effect on our financial condition and results of operations.
The operations of Interbank, Interseguro, Interfondos, Inteligo SAB and Izipay could be adversely affected by earthquakes, floodings or other natural disasters.
Peru is affected by El Niño and La Niña. El Niño is, an oceanic and atmospheric phenomenon that causes a warming of temperatures in the Pacific Ocean, resulting in heavy rains off the coast of Peru and various other effects in other parts of the world. La Niña has the opposite effect of El Niño. The effects of El Niño, which typically occurs every two to seven years, include flooding and the destruction of fish populations and agriculture, and it accordingly can have a negative impact on Peru’s economy. For example, in early 2017, El Niño adversely affected agricultural production, transportation services, tourism and commercial activity, caused widespread damage to infrastructure and displaced people and resulted in a 1.5% drop in GDP growth in 2017 relative to 2016 figures. The Peruvian government estimated that El Niño caused U.S.$2.8 billion in damages in affected regions in the first half of 2017. In particular, El Niño has affected and could in the future affect our loan activity and asset quality, as loan agreements typically allow borrowers to extend payments for a certain amount of time due to El Niño and it could ultimately affect their payment capacity when the extensions run out. Most recently, on March 15, 2022, heavy rainfall led to floods and landslides in the town of Retamas, La Libertad, which caused the destruction of many homes and caused several deaths. In 2023, the phenomenon of El Niño returned and buffeted some sectors of the economy, including the fishing, agricultural and textiles sectors. In 2024, however, the dissipation of El Niño was a favorable development. As of the date of this annual report, there is a surveillance status for coastal El Niño effects. However, we cannot assure you that another destructive El Niño or La Niña will not occur in the future, and it is in fact expected that El Niño and La Niña will continue to affect the country from time to time.
Peru is also located in an area that experiences seismic activity and occasionally is affected by earthquakes. For example, in 2007, an earthquake with a magnitude of 7.9 on the Richter scale struck the central coast of Peru, severely damaging the region south of Lima, and on May 26, 2019, an earthquake with a magnitude of 8.0 struck a remote part of the Amazon in Peru, resulting in collapsed buildings, power failures and two reported deaths. Although Interbank’s, Interseguro’s, Inteligo’s and Izipay’s headquarters and financial stores in Peru have not been materially affected by an earthquake, a major earthquake could damage the infrastructure necessary to their operations.
Although we have in place insurance policies against damage caused by an earthquake and other natural disasters, accidents and other similar events (including coverage for losses due to resulting business interruption), the occurrence of an earthquake in particular and any other natural disasters in general could adversely affect our results of operations and financial condition and we may be subject to further requirements from the SBS in order to provide temporary measures for the victims of the natural disasters, such as re-scheduling their credit payments. Further, any natural disaster would increase the probability of Interseguro having to pay the corresponding indemnification to customers under insurance policies that Interseguro sold, which would negatively affect its operating margins.
Corruption and ongoing high profile corruption investigations may hinder the growth of the Peruvian economy and have a negative impact on our business and operations.
Starting in 2018, Peru has suffered a series of government institutional crises due to, among other things, several corruption scandals involving prominent political figures, which have resulted in resignations and impeachment of various presidents since then, including most recently former President Jose Pedro Castillo in December 2022 following an attempted coup, as well as
32
investigations of certain members of the judicial system and the public ministry who are now facing prosecution. See “—Economic, social and political developments in Peru, including political instability, inflation and unemployment, could have a material adverse effect on our businesses”.
In addition, several corruption scandals regarding authorities at municipal, regional and national government levels are also ongoing, and former and current government officials have been detained. Relatedly, Peruvian authorities are currently conducting several high-profile corruption investigations relating to the activities of certain Brazilian companies and their Peruvian partners in the construction and infrastructure sectors, which have resulted in suspension or delay of important infrastructure projects, which were otherwise operational and permitted. Although the international judicial cooperation agreement between Peru and Brazil has been suspended, current and future collaboration agreements between Peruvian authorities and certain companies involved (such as Odebrecht S.A. or Ingenieros Civiles y Contratistas Generales S.A. (ICCGSA)) and/or their former officers may give rise to additional investigations and/or corruption scandals. In recent years, similar corruption scandals have taken place in the majority of Peruvian public institutions, with the involvement of political authorities at municipal, regional and national government levels, and former government officials have been detained. In the first quarter of 2024, the Peruvian prosecutor’s office initiated preliminary investigations against President Dina Boluarte for her alleged irregular possession of a collection of luxury watches and jewelry. In addition, further developments have occurred in relation to criminal judicial procedures against three former Presidents of Peru. Alejandro Toledo Manrique was sentenced (in first instance) to 20 years in prison, while oral trials of Ollanta Humala Tasso and Martin Vizcarra Cornejo have begun.
These investigations have resulted in suspension or delay of infrastructure projects and adversely affected economic growth in Peru.
We cannot predict how these or future corruption scandals or investigations may affect the Peruvian economy, hinder the growth of the Peruvian economy and indirectly have a material adverse effect on our business, financial condition and results of operations.
Changes in tax laws may increase our tax liabilities and, as a result, have a material and adverse effect on us.
The Peruvian government regularly implements changes to its tax regulations and interpretations. Potential changes may include modifications in the taxable events, the taxable bases or the tax rates, or the enactment of temporary taxes that, in some cases, could become permanent taxes. The Peruvian government has introduced several changes related, among others, to thin capitalization rules (which prevents companies from deducting interest for tax purposes when certain thresholds are exceeded) and to the general anti-avoidance rule or GAAR (which entitles the tax and customs national superintendency to challenge the taxation of certain transactions with a substance-over-form criteria).
The effects of any tax reform that could be proposed in the future and any other changes that could result from the enactment of additional reform or changes in interpretation have not been, and cannot be, quantified. Any changes to the Peruvian tax regime or interpretation thereof may result in an increase of our and our subsidiaries’ tax liabilities and/or overall compliance costs, which could have a material adverse impact on our business, financial condition and results of operations. Furthermore, such political uncertainty, or actual policies implemented by the Peruvian government, could also impact interest rates and currency volatility, as well as adversely and materially affect the Peruvian economy, which could have a material adverse effect on our financial condition and results of operations.
The dollarization of the Peruvian economy hampers monetary policy, which in turn may have an effect on our business.
Dollarization generally refers to the degree to which the U.S. dollar has displaced the local currencyin the economy. Despite the positive effect that it may have on reducing cross-border transaction costs and preserving purchasing power, the dollarization of the Peruvian economy has also hampered monetary policy by undermining the Central Reserve Bank of Peru’s ability to control the money supply. Despite the government’s policies and efforts to “solarize” the economy, which have been adopted in the past, the high degree of dollarization of the economy affects the Peruvian financial system by forcing the Central Reserve Bank of Peru to establish high levels of reserve requirements in U.S. dollars while also adding a risk to participating banks’ statements of financial position, including Interbank. An appreciation of the U.S. dollar poses a risk to us and a systemic risk to the Peruvian financial system because of the levels of U.S. dollar-denominated assets and liabilities in the Peruvian financial system. This risk comes from the potential imbalance that a bank’s clients may experience when borrowing in U.S. dollars and earning in soles. As a result, the SBS has been enacting rules aimed to make banks capable of identifying clients with potential imbalances and establishing reserves if necessary.
Under the Peruvian Banking and Insurance Law, all financial institutions regulated by the SBS (except for small-business development non-bank institutions) are required to maintain a legal reserve (encaje) for certain obligations. The Central Reserve Bank of Peru may require additional and marginal reserves. The exact level and method of calculation of the reserve
33
requirement is set by the Central Reserve Bank of Peru, which has issued different sets of regulations for foreign and local currency-denominated obligations of banks. We cannot assure you that the Central Reserve Bank of Peru will not increase the base rate or impose additional requirements in the future, or that such changes in the regulatory environment will not have an adverse effect on our business, financial condition or results of operations.
The 2026 general elections in Peru may result in political and electoral uncertainty in Peru.
Peru is scheduled to hold general elections in April 2026 to elect a new President and a new Congress. The outcome of these elections could result in significant changes in the country's political and economic policies. Historically, both pre-electoral and electoral periods in Peru have been marked by heightened political uncertainty and volatility.
In this context, there is an increased risk that Congress may adopt populist measures aimed at gaining public support, which could include unsustainable fiscal policies, regulatory overreach, or other short-term political initiatives. Such actions, combined with broader electoral dynamics, may lead to shifts in regulatory, fiscal, or economic policies that could undermine investor confidence, weaken macroeconomic stability, and negatively impact the overall business environment.
These developments could pose risks to the Peruvian economy and adversely affect the performance of our operations. Additionally, a new administration may pursue policies that are detrimental to the Peruvian economy and/or negatively affect our businesses in general, and our results of operations.
Risks Relating to the Common Shares
There may be a lack of liquidity and market for our common shares.
An active and liquid market for our common shares may not be maintained. Active, liquid trading markets generally result in lower price volatility and respond more efficiently to orders from investors to purchase or sell securities. Liquidity of a securities’ market is often a function of the volume of the underlying shares that are publicly-held by unrelated parties. Our common shares are listed on the Lima Stock Exchange, which is generally a less liquid trading market than the New York Stock Exchange (“NYSE”). Moreover, on March 31, 2023, IFS’ shareholders approved the creation of a share repurchase program for an amount of up to U.S.$100 million of our common shares (the “2023 Repurchase Program”). Thereafter, on March 31, 2025, IFS' shareholders approved a new share repurchase program for an amount of up to U.S.$100 million of our common shares which will begin after the 2023 Repurchase Program exhausts its U.S.$100 million limit or after the 2023 Repurchase Program is terminated by the Board of Directors and is expected to reduce the amount of our common shares available for trading. See "Item 16E Purchases of Equity Securities by the Issuer and Affiliated Purchasers" for details on the share repurchase programs.
In addition, investing in securities traded in emerging market countries, such as Peru, frequently involves a greater degree of risk when compared to investments in securities of issuers located in international securities markets with more stable economic, political and/or regulatory conditions and are generally considered being more speculative in nature.
These factors affect the ability of holders of our common to sell common shares at a desirable price and time, which could have a material adverse effect on the price of our common shares. In the event an active and liquid market for our common shares does not develop or is not maintained, the market price of our common shares that could be negatively impacted.
The price of our common shares may be volatile.
The trading price of our common shares may fluctuate substantially and may be higher or lower than the price holders of our common shares pay, depending on many factors, some of which are beyond our control and may not be related to our operating performance. These fluctuations could cause holders of our common shares to lose part or all of their investment in our common shares. The factors that could cause fluctuations include, but are not limited to, the following:
•
overall price and volume fluctuations affecting the stock exchanges on which our common shares are listed, including financial market volatility as a result of Russia’s continued large-scale military invasion of Ukraine or the military conflicts between Israel and Hamas;
•
financial market volatility and market turmoil associated with the failure of two U.S. banks and the emergency sale of Credit Suisse or similar developments in the financial industry;
•
significant volatility in the market price and trading volume of banking or insurance company securities generally, which are not necessarily related to the operating performance of these companies;
34
•
actual or anticipated changes in our earnings, fluctuations in our operating results or the failure to meet the expectations of financial market analysts and investors;
•
risks relating to the global economy and the economies of the United States, Peru and the other countries in which we operate;
•
investors’ perceptions of the banking and insurance industries in general and our company in particular;
•
potential differences between our actual financial condition and results of operations and those expected by investors;
•
additions or departures of key management personnel;
•
announcements by us or our competitors of significant acquisitions, divestitures, strategic partnerships, joint ventures or capital commitments;
•
increase in interest rates in Peru and the United States;
•
reputational issues;
•
the operating and stock performance of comparable companies;
•
general economic conditions and trends;
•
catastrophic events;
•
changes in accounting standards, policies, guidance, interpretation or principles;
•
regulatory changes;
•
loss of external funding sources; or
•
sales of large blocks of our stock or sales by insiders.
We may raise additional capital in the future through the issuance of equity securities, which may result in dilution of the interests of our shareholders.
We may need to raise additional capital and may opt for obtaining such capital through the public or private placement of common shares or securities convertible into our common shares. Our articles of incorporation do not provide for preemptive rights for our shareholders in the event of a public or private equity raise, or financing through the issuance of securities convertible into our common shares, such additional funds may dilute the percentage interests of investors in our common shares.
The significant share ownership of our controlling shareholder may conflict with the interests of the holders of our common shares and may have an adverse effect on the future market price of our shares.
As of December 31, 2024, our controlling shareholder (Intercorp Peru) owned, directly and indirectly, 72.47% of our outstanding capital stock (including treasury stock). Any disposition by Intercorp Peru of any of our common shares that it beneficially owns or the perception by the market that such actions may occur, would negatively affect the trading price of our common shares.
In addition, Intercorp Peru has and will continue to have the ability to elect a majority of the members of our board of directors and thus determine our business strategies, as well as determine the outcome of actions that require shareholder approval, including the approval of mergers and other extraordinary transactions and the payment of dividends. The controlling shareholder of Intercorp Peru may have interests that differ from those of the holders of our common shares and may take actions that may have an adverse effect to their interests. The concentration of ownership may also delay, prevent or deter a change in control of our company; hence, could deprive our shareholders of an opportunity to receive a premium for their common shares as part of a sale of our company and might ultimately affect the market price of our common shares.
In addition, we and our subsidiaries engage in numerous related party transactions with companies controlled by Intercorp Peru as well as other affiliated companies. Peruvian, Panamanian and Bahamian laws regulate the amount of credit exposure
35
our subsidiaries are permitted to enter into in our related parties’ transactions; notwithstanding, conflicts of interest may arise in the future. See “Item 7. Major Shareholders and Related Party Transactions—Related Party Transactions.”
Holders of our common shares may have fewer and less well-defined rights than shareholders of a company organized in other jurisdictions, such as the United States.
We are a sociedad anónima (corporation) organized under the laws of Panama. Our corporate affairs are governed by our organizational documents and the laws of Panama. Under such documents and laws, our shareholders, and therefore holders of our common shares, may have fewer or less well-defined rights than they might have as shareholders of a corporation incorporated in other jurisdictions, such as in the United States.
Holders of our common shares may have difficulty enforcing judgments against us, our officers and directors.
We are a corporation organized under the laws of Panama, and the majority of our subsidiaries’ operations are in Peru. Substantially all of our directors, officers and certain of the experts named herein reside outside the United States, and all or substantial portions of our assets are located outside the United States. As a result, it may not be possible for holders of our securities to effect service of process within the United States upon such persons or upon us, including with respect to matters arising under the federal securities laws of the United States, or to enforce against such persons or against us judgments of courts of the United States predicated upon the civil liability provisions of the federal securities laws of the United States or other laws of the United States or any State thereof.
We have been advised by our Peruvian counsel that any final and conclusive judgment for a fixed and final sum obtained against us in any foreign court having jurisdiction in respect of any suit, action or proceeding against us for the enforcement of any obligations assumed under our outstanding securities or this Annual Report on Form 20-F would, upon request, will be deemed valid and enforceable in Peru through an exequatur judiciary proceeding (which does not involve the reopening of the case), provided that (a) there is a treaty in effect between the country where said foreign court sits and Peru regarding the recognition and enforcement of foreign judgments or, (b) in the absence of such a treaty, the original judgment is recognized by Peruvian Courts (Cortes de la República del Perú) under such exequatur proceeding, subject to the provisions of the Peruvian Civil Code and the Peruvian Civil Procedure Code, providedfurther, that the following conditions and requirements are met: (i) the foreign judgment does not resolve matters under the exclusive jurisdiction of Peruvian Courts, (ii) such foreign court had jurisdiction under its own conflicts of law rules and under general principles of international law on jurisdiction, (iii) the defendant was adequately served and was guaranteed due process under the laws of the jurisdiction of the issuing court, (iv) the foreign judgment has the status of res judicata in the jurisdiction of the court rendering such judgment, (v) there is no pending litigation in Peru between the same parties for the same dispute, which shall have been initiated before the commencement of the proceeding that concluded with such foreign judgment, (vi) the foreign judgment is not incompatible with another judgment that fulfills the requirements of recognition and enforceability established by Peruvian law unless such foreign judgment was rendered first, (vii) the foreign judgment is not contrary to public order (orden público) or good morals (buenas costumbres), (viii) it has not been proven that such foreign court denies enforcement of Peruvian judgments or engages in a review of the merits thereof, (ix) the judgment has been (a) duly apostilled by the competent authority of the jurisdiction of the issuing court, in case of jurisdictions that are parties to the Hague Apostille Convention and has not opposed Peru’s accession thereto, or (b) certified by Peruvian consular authorities, in case of jurisdictions that are not parties to the Hague Apostille Convention, or then being a signatory country, opposed Peru’s accession thereto and is accompanied by a certified and officially translated copy of such judgment into Spanish, and (x) the applicable court taxes and filing fees have been paid.
We have been advised by our Panamanian counsel that there is uncertainty as to the enforceability in original actions in Panamanian courts of liabilities predicated solely on the U.S. federal securities laws and as to the enforceability in Panamanian courts of judgments of U.S. courts obtained in actions predicated upon the civil liability provisions of the federal securities laws of the United States. There is no existing treaty between the United States and Panama for the reciprocal enforcement of foreign judgments of courts outside Panama, including without limitation, judgments of U.S. courts. Panamanian courts, however, have enforced judgments rendered in the United States based on legal principles of reciprocity and comity. We have been advised by our Panamanian counsel that judgments rendered by foreign courts may only be recognized and enforced by the courts of Panama in the event that the Supreme Court of Panama validates such judgment by the issuance of a writ of exequatur. Subject to a writ of exequatur, any final judgment rendered by any U.S. court will be recognized, conclusive and enforceable in the courts of Panama without reconsideration of the merits, provided that: (i) such foreign court grants reciprocity to the enforcement of judgments of the courts of Panama; (ii) the party against which the judgment was rendered was personally served (service by mail not being sufficient) in such action within such foreign jurisdiction; (iii) the judgment arises out of a personal action against the defendant; (iv) the obligation in respect of which the judgment was rendered is lawful in Panama and does not contradict the public policy of Panama; (v) the judgment is properly authenticated by diplomatic or consular officers of Panama or pursuant to the 1961 Hague Convention on the Legalization of Documents; and (vi) a copy of the final judgment is translated into Spanish by a licensed translator in Panama. We have no reason to believe that any of our obligations relating to the shares would be contrary to Panamanian law.
36
The laws of Peru and Panama may not be as favorable to the interests of holders of our common shares as the laws of jurisdictions with which they are familiar. The application of these laws, or any conflict among them, could call into question what and how the laws of each jurisdiction should apply.
In addition, our articles of incorporation contain a general indemnification provision for our officers and directors for any loss, change or payment arising out of any claim or right of action, both individually and on our behalf, against any of them. Directors and officers and their successors and their property will be compensated for and kept safe, during the time devoted to the Company in relation to any of the affairs thereof, from any action, costs, charges, losses, damages and expenses which any of them may incur or sustain by reason of any act or omission done in the performance of their duties, and none of them will be liable for the acts, neglect or omissions of others, even if his signature or action has been provided as internal or external requirement. The indemnity provision does not cover any damage or loss resulting from malice or inexcusable negligence on the part of any of our officers or directors.
Judgments of Peruvian courts with respect to our common shares will be payable only in soles.
If proceedings are brought in the courts of Peru seeking to enforce our obligations in respect of our common shares, we will not be required to discharge our obligations in a currency other than soles. Under Peruvian exchange control limitations, an obligation in Peru to pay amounts denominated in a currency other than soles may be satisfied in Peruvian currency only at the exchange rate, as determined by the Central Reserve Bank of Peru, in effect on the date the judgment is obtained, and such amounts are then adjusted to reflect exchange rate variations through the effective payment date. The then prevailing exchange rate may not afford non-Peruvian investors with full compensation for any claim arising out of or related to our obligations under our common shares.
We are subject to different corporate disclosure and accounting standards than those holders of our common shares may be familiar with in the United States.
As a corporation organized under the laws of Panama, our corporate affairs are governed by the laws of Panama. In addition, as our common shares are listed on the Lima Stock Exchange and the majority of our subsidiaries’ operations are in Peru, we follow Panamanian and most Peruvian practices concerning corporate governance and intend to continue to do so. Financial reporting and securities disclosure requirements in Panama and Peru differ in certain significant respects from those required in the United States. There are also material differences among IFRS Accounting Standards, SBS GAAP and U.S. GAAP. Accordingly, the information about us available to holders of our common shares will not be the same as the information available to holders of shares issued by a U.S. company.
In addition, the Peruvian Securities Market Law, which governs open or publicly listed companies, such as us, imposes disclosure requirements that are more limited than those in the U.S. in certain important respects. Although Peruvian law imposes restrictions on insider trading and price manipulation, applicable Peruvian laws are different from those in the United States, and the Peruvian securities markets are not as highly regulated and supervised as the U.S. securities markets.
We could be considered a PFIC for U.S. federal income tax purposes, which could result in adverse U.S. tax consequences for U.S. investors.
Based on our current expectations regarding the value and nature of our assets, the sources and nature of our income, relevant market and shareholder data and our current business plans, we believe that we will not be treated as a passive foreign investment company, or PFIC, for U.S. federal income tax purposes with respect to our 2024 and current taxable years, and we do not anticipate becoming a PFIC in the future. Characterization as a PFIC could result in adverse U.S. tax consequences to holders of our common shares if they are U.S. investors. Certain elections may be available to mitigate the consequences if we are treated as a PFIC for U.S. federal income tax purposes. See “Item 10. Additional Information—Taxation—United States Federal Income Tax Considerations—Passive Foreign Investment Companies” included elsewhere in this Annual Report on Form 20-F.
One or more of our subsidiaries could be classified as a PFIC for U.S. federal income tax purposes.
As discussed in more detail in “Taxation—United States Federal Income Tax Considerations,” U.S. investors may face unique U.S. tax issues from indirectly owning interests in a PFIC that may result in adverse U.S. tax consequences to them. See “Item 10. Additional Information—Taxation—United States Federal Income Tax Considerations—Passive Foreign Investment Companies” included elsewhere in this Annual Report on Form 20-F.
37
If we are unable to maintain effective internal control over financial reporting in the future, our results of operations and the price of our common shares could be adversely affected.
Pursuant to Section 404 of the Sarbanes-Oxley Act of 2002, our management is required to report on, and our independent registered public accounting firm to attest to, the effectiveness of our internal control over financial reporting.
The rules governing the standards that must be met for management to assess our internal control over financial reporting are complex and require significant documentation, testing and possible remediation. We can provide no assurance that from time to time we will not identify concerns that could require remediation. Any failure to implement required new or improved controls, or difficulties encountered in their implementation, could harm our operating results or cause us to fail to meet our reporting obligations in the future. If we are unable to conclude that we have effective internal control over financial reporting, or if our independent registered public accounting firm is unable to provide us with an unqualified opinion regarding the effectiveness of our internal control over financial reporting in subsequent years as required by Section 404, investors could lose confidence in the reliability of our financial statements, which could result in a decrease in the value of our common shares.
Failure to comply with Section 404 could also potentially subject us to sanctions or investigations by the SEC, the NYSE or other regulatory authorities.
The requirements of being a public company may strain our resources, divert management’s attention and affect our ability to attract and retain qualified board members or executive officers.
As a public company, we incur significant legal, accounting and other expenses that we did not incur as a private company, including costs associated with public company reporting requirements, such as those to comply with the Sarbanes-Oxley Act of 2002, as amended, and related rules implemented by the SEC. The expenses incurred by public companies generally for reporting and corporate governance purposes have been increasing and we expect these rules and regulations to increase our legal and financial compliance costs and to make some activities more time consuming and costly. These laws and regulations could also make it more difficult or costly for us to obtain certain types of insurance, including director and officer liability insurance, and we may be forced to accept reduced policy limits and coverage or incur substantially higher costs to obtain the same or similar coverage. These laws and regulations could also make it more difficult for us to attract and retain qualified persons to serve on our board of directors, our board committees or as our executive officers and may divert management’s attention. Furthermore, if we are unable to satisfy our obligations as a public company, we could be subject to delisting of our common shares, fines, sanctions and other regulatory action and potentially civil litigation which may adversely affect us.
Our status as a foreign private issuer allows us to follow alternate standards to the corporate governance standards of the NYSE, which may limit the protections afforded to investors.
We are a “foreign private issuer” within the meaning of the NYSE corporate governance standards. Under NYSE rules, a foreign private issuer may elect to comply with the practices of its home country and not comply with certain corporate governance requirements applicable to U.S. companies with securities listed on the exchange. We currently follow certain Panamanian and most Peruvian practices concerning corporate governance and intend to continue to do so. Accordingly, holders of our common shares do not have the same protections afforded to shareholders of companies that are subject to all of the NYSE corporate governance requirements.
For example, the NYSE listing standards provide that the board of directors of a U.S. listed company must have a majority of independent directors at the time the company ceases to be a “controlled company”. The listing standards for the NYSE also require that U.S. listed companies, at the time they cease to be “controlled companies,” have a nominating/corporate governance committee and a compensation committee (in addition to an audit committee). Each of these committees must consist solely of independent directors and must have a written charter that addresses certain matters specified in the listing standards. Under both Panamanian and Peruvian law, companies may, but are not required to, form special governance committees, which may be composed partially or entirely of non-independent directors. In addition, NYSE rules require the independent non-executive directors of U.S. listed companies to meet on a regular basis without management being present. There is no similar requirement under Peruvian and Panamanian law.
The NYSE’s listing standards also require U.S. listed companies to adopt and disclose corporate governance guidelines. In December 2013, the SMV published the new Code of Good Governance for Peruvian Companies. Although we have implemented most of these measures, those principles are not mandatory and therefore we are not legally required to comply with the corporate governance guidelines but are required to disclose whether or not we are in compliance. We are fully compliant with Panamanian corporate law and are part of the Index of Good Corporate Governance (Índice de Buen Gobierno Corporativo) maintained by the Lima Stock Exchange.
38
If securities or industry analysts do not actively follow our business, or if they publish unfavorable research about our business, the price and trading volume of our common shares could decline.
The trading market for our common shares depends, in part, on the research and reports that securities or industry analysts publish about us or our business. If one or more of the analysts who covers us downgrades our common shares or publishes unfavorable research about our business, the price of our common shares would likely decline. If one or more of these analysts ceases coverage of our company or fails to publish reports on us regularly, demand for our common shares could decrease, which could cause the price and trading volume of our common shares to decline.
Future offerings of debt or preferred securities may limit our operating and financial flexibility and may materially adversely affect the market price of, and dilute the value of, the common shares.
If we decide to issue debt or preferred securities in the future or otherwise incur indebtedness, it is possible that these debt or preferred securities or indebtedness will be governed by an indenture or credit agreement or other instrument containing covenants restricting our operating flexibility and limiting our ability to make distributions to holders of the common shares. Additionally, any convertible or exchangeable securities that we issue in the future may have rights, preferences and privileges, including with respect to distributions, more favorable than those of the common shares and may result in dilution to holders of the common shares. Because our decision to issue securities in any future offering or otherwise incur indebtedness will depend on market conditions and other factors beyond our control, we cannot predict or estimate the amount, timing or nature of our future offerings or financings, any of which could materially reduce the market price of the common shares and dilute the value of the common shares.
Peruvian corporations, including our subsidiaries, may be jointly and severally liable for any unpaid Peruvian capital gains tax related to the transfer of the common shares.
Peruvian corporations, including our subsidiaries, may be jointly and severally liable for any unpaid Peruvian capital gains tax related to the transfer of shares issued by their foreign holding company.
In accordance with Peruvian income tax laws and regulations, in the case of the direct or indirect transfer by a non-Peruvian resident of shares issued by a Peruvian corporation, the Peruvian corporation whose shares were directly or indirectly transacted will be jointly liable with the non-Peruvian transferor for any unpaid capital gain tax obligations (plus accrued interest and penalties) arising from such sale/purchase, if during any of the 12 months preceding the transaction, inter alia, (i) the non-Peruvian transferor held an indirect or direct interest of more than 10% in the equity of the Peruvian corporation that issued the shares being directly or indirectly transferred, (ii) the non-Peruvian transferor and the Peruvian corporation that issued the shares being transferred consolidate financial statements, (iii) the non-Peruvian transferor and Peruvian corporation have had common directors / managers / or administrators that have power of decision in the financial, operational or commercial agreements, or (iv) the non-Peruvian transferor has dominant influence on the decisions of the administrative bodies of the Peruvian corporation, or vice versa. If such a transfer were to occur and the resulting Peruvian capital gains tax were not paid by the transferor, it could have a material adverse effect on our business, financial condition or results of operations.
ITEM 4. INFORMATION ON THE COMPANY
A.
History and Development of the Company
Our legal name is Intercorp Financial Services Inc. and we are organized as a corporation (sociedad anónima) under the laws of Panama since 2006. Our principal executive offices are located at Av. Carlos Villarán 140, 5th Floor, Urbanización Santa Catalina, La Victoria, Lima 13, Peru. Our telephone number is +(511) 615-9011. Our website is www.ifs.com.pe.
We are the majority owner and controlling shareholder of our subsidiaries, Interbank, Interseguro, Inteligo -which comprise our banking, insurance and wealth management segments- and Izipay, our payment services subsidiary. We are responsible for coordinating, supervising and establishing their strategy and management policies. In 2007, we conducted an initial public offering of our common shares publicly in Peru and privately outside of Peru. Our parent company is Intercorp Peru, a holding company for a group of companies operating mainly in Peru under the name “Intercorp”. Intercorp Peru’s main subsidiaries include our company and Intercorp Retail. Intercorp Retail acts as a holding company for the retail and real estate operations of Intercorp Peru in Peru. As of December 31, 2024, Intercorp Peru owned, directly and indirectly, 72.47% of IFS’ capital stock (including treasury stock).
Interbank is an open-stock corporation (sociedad anónima abierta). Interbank was incorporated in Lima, Peru in 1897 and formerly conducted business under the names “Banco Internacional del Perú S.A.” and “Interbank”. In August 1994, as part of the government’s privatization efforts, 91% of Interbank’s share capital was acquired by Corporación Interbank, which subsequently transferred its holdings in Interbank to Intercorp Peru, a limited liability company organized under the laws of the Commonwealth of The Bahamas. After Interbank’s acquisition by Intercorp Peru in 1994, Interbank began conducting business under the name
39
“Interbank” as part of a rebranding and modernization effort, and has become a leading universal bank in Peru. As of December 31, 2024, IFS held 99.31% of the capital stock of Interbank.
Interseguro is a corporation (sociedad anónima) that was incorporated in 1998 by Intercorp Peru, pursuant to an agreement between Intercorp Peru and The Bankers Trust Company (“Bankers Trust”) (at the time the controlling shareholder of Consorcio Nacional de Seguros S.A., the largest insurer in Chile) to benefit from the expansion of the insurance business in Peru. In connection with the sale of Bankers Trust to Deutsche Bank AG in 1999, Bankers Trust’s interest in Interseguro was sold to a group of Chilean investors, and in 2000 Intercorp Peru acquired the portion of Interseguro that it did not own.
On May 31, 2017, we entered into a share purchase agreement with Sura Asset Management Company (“SUAM”) and “Grupo Wiese” to acquire 100% of the capital stock of Seguros Sura S.A. (“Seguros Sura”) and Hipotecaria Sura Empresa Administradora Hipotecaria S.A. (“Hipotecaria Sura”) (the “Sura Acquisition”) for an initial base price of U.S.$268 million. The transaction became effective on November 2, 2017 and the approval by SBS was granted on September 28, 2017. This merger consolidated Interseguro’s leadership in the annuities market, as well as strengthened its position in credit life insurance.
Inteligo was incorporated under the laws of the Republic of Panama in 2006. Inteligo Bank is a corporation that was incorporated in 1995 in The Bahamas and formerly conducted business under the names of Interbank Overseas Ltd. and Blubank Ltd. Inteligo SAB is a corporation (sociedad anónima) that started operations in 1993. On July 18, 2014, the board of directors of IFS approved the acquisition of Inteligo, effective on August 1, 2014. This reorganization entailed the acquisition of 100% of Intercorp Peru’s shares in Inteligo by IFS in exchange for 19.5 million IFS common shares. Inteligo SAB is organized under the laws of Peru, and is licensed by the SMV to operate in Peru and conduct brokerage, custody, portfolio management and advisory services.
Interfondos is a corporation (sociedad anónima) that started operations in 1994. It is organized under the laws of Peru and is licensed by the SMV to operate in Peru and conduct mutual funds and investment funds management services.
In January 2019, we announced the consolidation of our wealth management activities at Inteligo by transferring Interbank’s mutual funds subsidiary, Interfondos, to Inteligo, where asset management is the core business.
In July 2019 we, together with Interbank, Intercorp Peru and a non-related shareholder conducted an SEC-registered initial public offering as a result of which IFS sold 1,150,000 newly-issued common shares and 2,418,754 treasury common shares (including shares sold by Interbank), Intercorp Peru sold 2,531,246 common shares and the non-related shareholder sold 3,000,000 common shares. In addition, the underwriters partially exercised their option to purchase 1,350,000 additional shares, which resulted in the purchase of 1,186,841 newly-issued common shares.
While Interbank has owned 50% of PMP and its subsidiary Izipay for more than a decade, in April 2022, we acquired the remaining 50% ownership interest of PMP and its subsidiary Izipay, consolidating such subsidiaries into our corporate group and consolidating our payments ecosystem.
Since 2008, we have delivered returns for our shareholders supported by a strong bottom-line generation. In 2022, we paid U.S.$202.0 million in dividends based on 2021 results. In 2023, we paid U.S.$136.2 million in dividends based on 2022 results. In April 2024, we paid U.S.$115.4 million in dividends based on 2023 results. In 2025, we intend to pay U.S.$115 million in dividends based on 2024 results. In addition, our market capitalization has increased from U.S.$1.2 billion in 2007 to U.S.$3.4 billion as of December 31, 2024, based on a price of U.S.$29.34 per share, as reported by the NYSE on the same date.
On March 31, 2023, IFS’ shareholders approved the creation of the 2023 Repurchase Program, and on March 31, 2025, a new program was approved for up to U.S.$100 million of our common shares, which will begin after the 2023 Repurchase Program exhausts its U.S.$100 million limit or after the 2023 Repurchase Program is terminated by the Board of Directors. For details on the repurchases, see “Item 16E – Purchases of Equity Securities by the Issuer and Affiliated Purchasers.”
We also continue to make significant digital and physical infrastructure capital expenditure investments in our different segments. For a description of our capital expenditures, see “Item 5. Operating and Financial Review and Prospects—Liquidity and Capital Resources—Capital Expenditures Program”.
The SEC maintains an Internet site that contains reports, proxy and information statements, and other information regarding issuers that file electronically with the SEC. The materials included in this Annual Report on Form 20-F may be downloaded at the SEC’s website: http://www.sec.gov. Any filings we make are also available to the public over the Internet at the SEC’s website and at our website at https://www.ifs.com.pe. (This URL and other URLs in this Annual Report on Form 20-F are intended to be inactive textual references only. None are intended to be active hyperlinks to websites. Any information which might be accessible through a hyperlink referenced from any URL referenced in this report, is not and shall not be deemed to be incorporated into this Annual Report on Form 20-F).
40
Recent Developments
On March 31, 2025, IFS held its Annual Shareholders Meeting, and, among others, the following matters were approved:
•
A new share repurchase program for an amount of up to U.S.$100 million of our common shares, which will begin after the 2023 Repurchase Program exhausts its U.S.$100 million limit or after the 2023 Repurchase Program is terminated by the Board of Directors. For details on the repurchases, see “Item 16E – Purchases of Equity Securities by the Issuer and Affiliated Purchasers;”
•
The 2025 dividend policy, mandating the distribution to shareholders of a minimum 20% of the net profits of the Company;
•
The new board of directors of the Company comprised of the members below:
o
Mr. Carlos Rodríguez-Pastor Pesivale, as President (re-elected);
o
Mr. Fernando Martín Zavala Lombardi (re-elected);
o
Mrs. Lucía Cayetana Aljovín Gazzani (re-elected);
o
Mr. Hugo Antonio Santa María Guzmán (re-elected);
o
Mr. Felipe Morris Guerinoni (re-elected);
o
Mr. Guillermo Martínez Barros (re-elected); and
o
Mr. Alejandro Christian Sandoval Zavala.
For information on the members of the board of directors, see “Item 6. Directors, Senior Management and Employees.”
B.
Business Overview
Overview
IFS is a leading provider of banking, insurance, wealth management services and payments for retail customers and commercial clients in Peru. Our purpose is centered around building financial well-being together. We are committed to (i) becoming the leading digital financial platform, with a clear strategic focus on key businesses such consumer financing, wealth management and life insurance; (ii) placing the customer at the center of our decisions, offering a comprehensive suite of services backed by a superior digital experience and analytics as our competitive advantages; and (iii) fostering a unified approach, leveraging the best talent, innovation and a collaborative mindset. We manage our business in three segments, banking, insurance and wealth management, which complement each other and represent diversified sources of revenue. Our banking segment operates through our subsidiary Interbank, which is the second largest provider of consumer loans in Peru, according to the SBS. Interbank provides retail banking and commercial banking products, and services to individuals, large companies, and small and medium enterprises. Complementing our banking segment, our subsidiary Izipay also contributes by generating an end-to-end digital ecosystem of financial services and technology solutions, enabling consumers, individuals entrepreneurs, micro-mercants, and small and medium-sized enterprises (SMEs) in Peru to make and process payments in a safe seamless, digital, mobile-first, and affordable manner. Our insurance segment operates through our subsidiary Interseguro, which is the leading provider of annuities in Peru by premiums and one of the leading life insurance companies in the country according to the SBS. Interseguro provides a wide range of retirement, savings, life, unemployment and other insurance products to retail customers. Finally, our wealth management segment operates mainly through our subsidiaries Inteligo Bank, Inteligo SAB and Interfondos, which together provide wealth management, private banking, financing, brokerage, advisory and other investment services mainly to high-net-worth individuals.
As of December 31, 2024, Interbank’s digital platform and distribution network provide to its 5.6 million customers, as well a potential market of more than 34.4 million Peruvians (total population of Peru), including an employed population of 18 million and 3.4 million businesses, with access to its products and services and a distinctive and convenient customer experience.
Our key strategic priority is to achieve digital excellence for our customers by providing them with a world-class, flexible and secure digital platform. We believe our digital transformation is vital to our continued growth and profitability, and for this reason we have been investing in developing the capabilities necessary to offer digital products and services to our customers. As of December 31, 2024, 81.9% of a total 3.6 million monthly active retail customers are digital customers (customers who do not use
41
our branches)—that is 2.9 million retail customers. We have also streamlined our physical presence by reducing the number of branches by approximately 48% since its peak in 2016, focusing on educating our customers in the use of our digital platform. We have substantially increased migration of low-value-added transactions to more efficient digital channels, and we have increased sales of products to existing customers, as well as increased new customer acquisition of which 51.9% are being acquired digitally or “born-digitally” as of December 31, 2024.
The following table shows the evolution of our reported net profit, dividends, ROE and ROA and our adjusted net profit, adjusted ROE and adjusted ROA (if any), from 2022 through 2024:
For the year ended December 31,
2024
2024
2023
2022
(U.S. $ in millions)(3)
(S/ in millions)
Net profit
347.4
1,307.5
1,079.3
1,678.1
Adjusted net profit(1)
—
—
—
1,455.6
Dividends declared for the year(2)
115.4
420.1
427.4
511.8
ROE
—
12.6
%
11.3
%
19.1
%
Adjusted ROE(1)
—
—
—
16.7
%
ROA
—
1.4
%
1.2
%
1.9
%
Adjusted ROA(1)
—
—
—
1.7
%
(1)
Adjusted net profit, adjusted ROA and adjusted ROE for the year ended December 31, 2022 exclude other income of S/222.5 million from the fair value adjustment of the 50% ownership interest held by Interbank in Izipay before the acquisition of the remaining 50% equity interest in Izipay in April 2022 (See Note 1(b) to our Audited Annual Consolidated Financial Statements). Adjusted net profit, adjusted ROA and adjusted ROE are non-GAAP financial measures and should not be considered in isolation or as a substitute for net profit, ROA or ROE, or other performance measures. See “Presentation of Financial Information—Non-GAAP financial measures” and “Item 4. Information on the Company—Business Overview—Non-GAAP Financial Measures.” We did not adjust net profit, ROA or ROE for the years ended December 31, 2024 and 2023, respectively.
(2)
Dividends are declared and paid in U.S. dollars. Except for declaration and payment of extraordinary dividends, dividends declared for fiscal year 2024 are expected to be paid in May 2025, dividends declared in 2023 and 2022 were paid in 2024 and 2023, respectively; and amounted to U.S.$115.4 million and U.S.$136.2 million, respectively. See “Item 8. Financial Information—Consolidated Statements and Other Financial Information—Dividends and dividends policy”.
(3)
Amounts stated in U.S. dollars as of and for the year ended December 31, 2024 have been translated from soles at the exchange rate of S/3.764 = U.S.$1.00.
As of December 31, 2024, we had total assets of S/95.5 billion (approximately U.S.$25.4 billion), total gross loans of S/51.0 billion (approximately U.S.$13.5 billion), total deposits and obligations of S/53.8 billion (approximately U.S.$14.3 billion) and shareholders’ equity of S/11.0 billion (approximately U.S.$2.9 billion).
For the year ended December 31, 2024, our consolidated net profit was S/1,307.5 million as compared to S/1,079.3 million in 2023. Net profit improved in 2024 mainly due to a decrease of S/261.6 million in impairment loss on loans, a S/233.8 million increase in other income, and a S/112.1 million decrease in interest and similar expenses. These effects were partially offset by a S/150.0 million increase in other expenses, a S/38.8 million increase in income tax, and a reduction of S/35.5 million in fee income from financial services.
During the second quarter of 2024, we changed the reporting structure of IFS’s operating segments compared with that presented in our annual report on Form 20-F for the year ended December 31, 2023 (the “2023 Form 20-F”), mainly as a consequence of the elimination of the payments segment, as its revenues and income do not meet the thresholds established by IFRS 8 "Operating Segments", as those represent less than 10% of IFS consolidated results. Therefore, since the second quarter of 2024, the results of the businesses that previously comprised the payments segment ceased being reported separately to the board and Izipay was reclassified under “Holding, Other Subsidiaries and Eliminations”. In order to make the information as of and for the years ended December 31, 2023 and 2022 comparable with the information as of and for the year ended December 31, 2024, as required by IFRS 8 “Information by business segments”, figures as of and for the years ended December 31, 2023 and 2022 were recast in conformity with the new operating segment reporting structure. See Note 27 of our Audited Annual Consolidated Financial Statements.
We operate the following three business segments: banking, insurance and wealth management. In addition, “Holding, Other Subsidiaries and Eliminations” includes those items that have not been allocated to an operating segment. It includes Izipay, among others.
Banking
Interbank is the second largest provider of consumer loans (retail loans other than mortgages) in Peru with a 21.0% market share in terms of total gross consumer loans outstanding as of December 31, 2024, according to the SBS. Interbank is the
42
largest provider (among non-government owned banks) of payroll deduction loans to public sector employees with a 21.2% market share as of December 31, 2024, according to the SBS. Additionally, it is the second largest bank in Peru in terms of total consumer loans, the third in total deposit and loans to mid-sized companies, and the fourth in terms of outstanding retail mortgages, commercial lending and total assets, according to the SBS. Interbank has built one of the most convenient and extensive retail banking distribution networks in Peru including: online banking, mobile applications, 149 financial stores, 1,750 ATMs and 7,501 correspondent agents (including its external network of agents), as of December 31, 2024. Moreover, we believe Interbank has developed state-of-the-art and user-friendly digital platforms to better serve its client’s needs.
As of and for the year ended December 31, 2024, Interbank represented 77.0% of our total assets.
For the 2024 fiscal year, Interbank declared a dividend of S/420.2 million (or, approximately U.S.$111.6 million) of which S/417.3 million (or, approximately U.S.$110.9 million) are expected to be paid to IFS, which represents 65.6% of total dividends to be received by IFS.
With a focus on maintaining a balanced portfolio, Interbank has a higher percentage of retail loans, which account for 52.5% of its total loan portfolio, compared to the banking system of 39.4% as of December 31, 2024.
Interbank’s CAGR in gross loans, and deposits and obligations between 2020 and 2024 was 1.9% and 3.5%, respectively. For the year ended December 31, 2024, Interbank reported a profit of S/1,007.4 million attributed to a decrease of S/262.1 million in impairment loss on loans, net of recoveries, and increases of S/40.2 million in net interest and similar income and of S/18.7 million in other income. These effects where partially offset by an increase of S/107.1 million in other expenses, and S/48.7 million in income tax, and a decrease of S/21.5 million in fee income from financial services, net. For the year ended December 31, 2024, Interbank’s ROE was 12.2%.
Izipay, acquired by us in 2022, serves to complement our three operating segments, but specially our banking segment. Izipay is a payments company and provider of products and services related to payments acquirer, a correspondent bank and a credit cards processor. Moreover, it provides financial services and technology solutions that enable consumers, individual entrepreneurs, micro-merchants, SMEs, in Peru, to make and/or process payments in a safe, seamless, digital, mobile first and affordable manner. Izipay’s technology solutions allow it to (i) be a full acquirer company, with a complete set of payment solutions through Point-of-Sale (“POS”) devices and e-commerce, (ii) provide a digital platform with proprietary solutions for business management such as self-check-out, split payments, product and inventory management, business reports, anti-fraud system and CRM, among others.
Insurance
Interseguro is the leading provider of annuities (excluding private annuities) in Peru, with a 30.5% market share as measured by total premiums collected during 2024, according to the SBS, and is one of the leading life insurance companies in Peru. Also, Interseguro offers private annuities as well as low premium retail insurance products, including credit life, mandatory traffic accident insurance (“SOAT”), car insurance and credit card protection insurance, through a comprehensive multi-channel distribution platform which includes Interseguro’s sales force, which is a key component of Interseguro’s sales. Interseguro also distributes through Interbank, brokers and its own digital channels.
According to the SBS, in 2024, Interseguro was the largest insurance company measured by long term reserves, driven both by organic growth and the acquisition of Seguros Sura in November 2017, which both improved its ROE and doubled its asset size.
As of and for the year ended December 31, 2024, Interseguro represented 16.9% of our total assets.
For the 2024 fiscal year, Interseguro declared a dividend of S/125.0 million (or, approximately U.S.$33.2 million), which represents 19.6% of total dividends to be received by IFS. For the year ended December 31, 2024, Interseguro’s net profit was S/376.3 million under SBS GAAP and its ROE was 41.6%.
Wealth management
Inteligo is a provider of wealth management services, which includes banking, financing, brokerage and investing activities for high-net-worth individuals through three operating subsidiaries: Inteligo Bank, Inteligo SAB (brokerage) and Interfondos (mutual funds).
As of and for the year ended December 31, 2024, Inteligo represented 4.5% of our total assets.
For the 2024 fiscal year, our subsidiaries in the wealth management segment declared a combined dividend of U.S.$25.0 million, which represents 14.8% of total dividends to be received by IFS.
43
Inteligo’s CAGR in assets under management was 7.0% between 2020 and 2024. In addition, for the year ended December 31, 2024, Inteligo’s net profit was S/137.3 million and ROE was 14.2%.
The following tables provide certain financial and other information about our three business segments for the period indicated.
As of and for the year ended December 31, 2024
Assets
Equity
Net Profit/(Loss)
(S/ in millions)
%
(S/ in millions)
%
(S/ in millions)
%
Banking
73,500.2
77.0
%
8,872.9
80.8
%
1,007.4
77.0
%
Insurance
16,175.9
16.9
%
557.6
5.1
%
201.9
15.4
%
Wealth management
4,316.0
4.5
%
1,044.1
9.5
%
137.3
10.5
%
Holding, other subsidiaries and eliminations(1)
1,511.7
1.6
%
503.9
4.6
%
(39.1
)
(3.0
%)
Total
95,503.8
100.0
%
10,978.6
100.0
%
1,307.5
100.0
%
(1)
Holding and other subsidiaries, as well as consolidation adjustments and elimination of intercompany transactions.
As of and for the year ended December 31, 2024
(S/ in millions)
Net Profit/ (Loss)
Average total assets
ROA
Average total equity
ROE
Banking
1,007.4
71,854.9
1.4
%
8,263.6
12.2
%
Insurance
201.9
15,713.5
1.3
%
485.0
41.6
%
Wealth management
137.3
4,334.3
3.2
%
966.1
14.2
%
Holding, other subsidiaries and eliminations(1)
(39.1
)
1,524.9
—
688.1
—
Total
1,307.5
93,427.6
1.4
%
10,402.8
12.6
%
(1)
Holding and other subsidiaries, as well as consolidation adjustments and elimination of intercompany transactions.
The following table provides relevant information about dividends declared by each of our subsidiaries:
SBS GAAP
IFRS
Interbank
Interseguro
Inteligo Bank
For the year ended December 31,
2024
2023
2022
2024
2023
2022
2024
2023
2022
(S/ in millions)
(U.S.$ in millions)
Net profit for the period(1)
933.7
900.5
1,171.7
376.3
315.1
202.8
31.3
7.6
(35.4
)
Dividends declared(2)
420.2
405.2
585.8
125.0
150.0
100.0
21.9
7.5
—
Payout ratio
45.0
%
45.0
%
50.0
%
33.2
%
47.6
%
49.3
%
70.0
%
98.7
%
—
(1)
For Interbank and Interseguro this information is calculated using SBS GAAP. This table is presented in this manner because Interbank and Interseguro pay dividends to us based on SBS GAAP and Inteligo pays dividends to us on the basis of IFRS Accounting Standards. The information is derived from stand-alone information from each entity.
(2)
Represents dividends for the fiscal year which are declared and paid in the following year.
44
The following tables provide certain financial and other information about our consolidated business:
As of and for the year ended December 31,
2024
2024
2023
2022
(U.S.$ in millions)(1) (2)
(S/ in millions)(2)
Financial Position and Income Statement Items
Total assets
25,372.9
95,503.8
89,624.8
87,482.1
Total gross loans
13,394.1
50,415.4
48,249.2
47,025.4
Total deposits and obligations
14,284.8
53,768.0
49,188.2
48,530.7
Total equity, net
2,916.7
10,978.6
10,008.1
9,426.2
Net profit (attributable to IFS’ shareholders)
345.4
1,300.1
1,072.7
1,668.0
Other Information
Adjusted net profit (attributable to IFS’ shareholders)(3)
—
—
—
1,455.6
As of and for the year ended December 31,
2024
2023
2022
Profitability Ratios
Net interest margin(4)
5.1
%
5.3
%
5.0
%
Risk adjusted NIM(5)
2.9
%
3.0
%
4.0
%
Efficiency ratio(6)
35.8
%
36.2
%
34.6
%
ROA
1.4
%
1.2
%
1.9
%
Adjusted ROA(3)
—
—
1.7
%
ROE
12.6
%
11.3
%
19.1
%
Adjusted ROE(3)
—
—
16.7
%
2024
2023
2022
Asset Quality and Capitalization
Past-due-loans as a % of total gross loans(7)
2.6
%
3.4
%
3.0
%
Cost of risk(8)
3.5
%
4.1
%
1.8
%
Core equity Tier 1 ratio of Interbank(9)
12.3
%
11.8
%
12.0
%
As of and for the year ended December 31,
2024
2023
2022
Distribution Network and Customers
Financial stores
149.0
153.0
164.0
ATMs
1,750.0
1,666.0
1,554.0
Correspondent agents (includes external network)
7,501.0
7,163.0
5,672.0
Number of digital customers(10)
2,916,486.0
2,498,568.0
2,175,532.0
Percentage of digital users(10)(11)
81.9
%
75.3
%
70.9
%
(1)
Amounts stated in U.S. dollars as of and for the year ended December 31, 2024 have been translated from soles at the exchange rate of S/3.764 = U.S.$1.00.
(2)
Except for percentages and ratios and distribution and customer data.
(3)
Adjusted net profit, adjusted ROA and adjusted ROE for the year ended December 31, 2022 exclude other income of S/222.5 million from the fair value adjustment of the 50% ownership interest held by Interbank in Izipay before the acquisition of the remaining 50% equity interest in Izipay in April 2022 (See Note (b) to our Audited Annual Consolidated Financial Statements). Adjusted net profit, adjusted ROE and adjusted ROA are non-GAAP financial measures and should not be considered in isolation or as a substitute for net profit, ROE or ROA, or other performance measures. See “Presentation of Financial Information—Non-GAAP financial measures” and “Item 4. Information on the Company—Business Overview—Non-GAAP Financial Measures.” We did not adjust net profit, ROA or ROE for the years ended December 31, 2024 and 2023, respectively.
(4)
Net interest margin is defined as (x) net interest and similar income divided by (y) average interest-earning assets. See “Item 4. Information on the Company—Selected Statistical Information.”
(5)
Risk adjusted net interest margin is defined as net interest margin after impairment loss on loans, net of recoveries.
(6)
Efficiency ratio for years 2024, 2023 and 2022 is calculated by dividing (x) salaries and employee benefits plus administrative expenses plus depreciation and amortization by (y) net interest and similar income plus net fee income from financial services plus other income plus insurance income.
(7)
At end of period. See “Presentation of Financial Information—Loan Portfolio Data”.
(8)
Cost of risk is defined as impairment loss on loans, net of recoveries divided by average gross loans.
(9)
Calculated for Interbank only pursuant to SBS regulations.
(10)
In the month of December for each full year.
(11)
Percentage of digital users over total clients that interact with Interbank.
45
Non-GAAP Financial Measures
In this Annual Report on Form 20-F, we use adjusted net profit, adjusted ROE and adjusted ROA. These measures are not calculated in accordance with IFRS Accounting Standards and we collectively refer to these as non-GAAP financial measures. For more information, see “Presentation of Financial Information—Non-GAAP Financial Measures”.
The table below presents adjusted net profit, adjusted ROE and adjusted ROA on a consolidated basis and for each of our three business segments, if any, as of and for the year ended December 31, 2022. We did not adjust net profit, ROA or ROE for the years ended December 31, 2024 and 2023.
As of December 31, 2022
Net profit
Adjustment(1)
Adjusted Net Profit
Average total assets
ROA
Adjusted ROA
Average total equity
ROE
Adjusted average total equity
Adjusted ROE
Banking
1,374.1
—
1,374.1
67,172.4
2.0
%
2.0
%
6,937.6
19.8
%
6,937.6
19.8
%
Insurance
255.5
—
255.5
14,219.9
1.8
%
1.8
%
276.4
92.4
%
276.4
92.4
%
Wealth Management
(141.4
)
—
(141.4
)
5,275.1
(2.7
%)
(2.7
%)
1,037.5
(13.6
%)
1,037.5
(13.6
%)
Holding, other subsidiaries and eliminations
189.9
(222.5
)
(32.6
)
783.0
—
—
521.4
—
521.4
—
Total
1,678.1
(222.5
)
1,455.6
87,450.3
1.9
%
1.7
%
8,772.8
19.1
%
8,772.8
16.7
%
(1)
Adjusted net profit of the holding, other subsidiaries and elimination segment, for the year ended December 31, 2022, is calculated excluding other income of S/222.5 million from the fair value adjustment of the 50% ownership interest held by Interbank in Izipay before the acquisition of the remaining 50% equity interest in Izipay in April 2022 (See Note 1(b) to our Audited Annual Consolidated Financial Statements). Adjusted net profit is a non-GAAP financial measure and should not be considered in isolation or as a substitute for net profit, or other performance measures. See “Presentation of Financial Information – Non-GAAP financial measures.”
The following table reflects the reconciliation, if any, of adjusted net profit, adjusted ROE and adjusted ROA on a consolidated basis as of and for the year ended December 31, 2024, 2023 and 2022.
For the year ended December 31,
2024
2023
2022
(S/ in millions)
Net profit (A)
1,307.5
1,079.3
1,678.1
Gain on the fair value adjustment on the previously held ownership by Interbank in Izipay prior to acquiring control(1) (B)
—
—
(222.5
)
Adjusted net profit (D) = (A) + (B)
—
—
1,455.6
Average total equity (E)
10,402.8
9,533.4
8,772.8
ROE (A) / (E)
12.6
%
11.3
%
19.1
%
Adjusted average total equity (F)
—
—
8,728.3
Adjusted ROE (D) / (F)
—
—
16.7
%
Average total assets (G)
93,427.6
88,562.9
87,450.3
ROA (A) / (G)
1.4
%
1.2
%
1.9
%
Adjusted ROA (D) / (G)
—
—
1.7
%
(1)
Management believes to be non-operating and/or non-recurring in nature.
Market Opportunity
We believe that the potential growth of the Peruvian economy, the increase in private investment, the expanding middle class, the growth of private wealth creation in Peru, the low penetration of financial services and the well-capitalized and profitable Peruvian financial system offer significant opportunities to accelerate digital adoption and growth in deposits and loans, enabling us to efficiently acquire and serve more clients, while providing distinctive and convenient customer service and greater access and inclusion to financial services to previously underserved Peruvians.
Solid macroeconomic fundamentals
In 2022, Peru’s GDP increased 2.7% (compared to growth rates of 7.3% in Colombia, 2.4% in Chile, 3.9% in Mexico, 2.9% in Brazil, 2.2% in Ecuador, 4.9% in Uruguay, 0.1% in Paraguay, 3.5% in Bolivia and 5.0% in Argentina). For the year ended December 31, 2023, Peru’s GDP contracted by 0.6% (compared to growth rates of 0.6% in Colombia, 2.9% in Brazil, and 3.2% in Mexico). In 2024, Peru’s GDP increased 3.3% (compared to growth rates of 1.7% in Colombia, 2.5% in Chile, 1.5% in Mexico, 3.8% in Brazil, 0.3% in Ecuador, 3.2% in Uruguay, 4.3% in Paraguay, 2.1% in Bolivia and (1.8%) in Argentina).
46
The Peruvian government’s prudent management of the economy, conservative fiscal policy, coupled with the Central Reserve Bank of Peru’s cautious management of inflation and international reserves have contributed to economic development, increased internal consumption and strong macroeconomic fundamentals, including low levels of public debt, low inflation, a controlled fiscal deficit and high levels of international reserves. However, 2023 was a challenging year marked by sustained high inflation, low economic growth, and disruptions due to weather and political factors, resulting in a GDP contraction of 0.6%. 2024 was a year of recovery, with GDP growing by 3.3% due to a recovery in various sectors and improved drivers of private investment and consumption. In its most recent forecast as of March 31, 2025, the BCRP has estimated for Peru a real GDP growth of 3.2% for 2025, as compared to the 3.3% increase registered in 2024 due to dynamism of investments and consumption.
Peru’s strong track record of macroeconomic policy credibility, consistency and ability to adapt to changes helped it to achieve investment grade ratings of Baa1 by Moody’s Investor Service (“Moody’s”), BBB by Fitch Ratings Ltd. (“Fitch”) and BBB by Standard & Poor’s Rating Services (“S&P”) as of December 31, 2022. In December 2022 and January 2023, S&P, Fitch and Moody’s changed Peru’s credit outlook to negative from stable due to higher political risk. In April 2024, S&P downgraded Peru’s credit rating from BBB to BBB-. However, in April, September, and November 2024, S&P, Moody’s, and Fitch, respectively, changed Peru’s credit outlook back to stable.
Evolution of the middle class and affluent population
The core of our customer base is Peru’s middle class and affluent population. According to statistics published by each INEI and the World Bank over the years, since 2010, poverty rate in Peru has decreased, with spikes in certain years. For example, in 2023, the poverty rate increased to 29.0%, attributed to economic slowdown, reaching similar levels to 2010 (30.8%) after a historical low of 20.2% in 2019. In terms of the GDP per capita, it was U.S.$7,906.6 and U.S.$8,470.1 for 2023 and 2024 respectively, and in both cases higher than the one reported for the previous year. For 2024, Peru had a total population of 34.0 million, and according to the Peruvian Association of Market Research Companies (Asociación Peruana de Empresas de Investigación de Mercados - APEIM), Peru’s middle and upper socioeconomic segments (segments A, B and C) have significantly expanded and represented 37.7% of the population in 2024 compared to 34.4% in 2013. We believe that a growing middle class and affluent population creates a greater need for financial services, particularly for increasingly sophisticated banking. The growth of these socioeconomic segments can support growth and profitability across our business.
Low financial services penetration
We believe that growth potential in Peru’s financial services sector continues to be significant. Despite the sustained recent growth of 1.9% CAGR in total gross loans between 2020 and 2024, banking penetration in Peru, measured as the ratio of loans-to-GDP, was 32.4% as of December 31, 2024, according to the SBS and the Central Reserve Bank of Peru. This represents a decline over the 35.0% registered as of December 31, 2023 and is mainly explained by an increase in the GDP, while gross loans of the system remained stable. Similarly, according to industry sources, insurance penetration in Peru, measured as the ratio of premiums-to-GDP as of December 31, 2024, is estimated to be 2.1%, which is lower than the average ratio of 3.1% for the group of peer countries in Latin America and Chile.
Well-capitalized financial system
As a result of sound regulation and prudent management, the Peruvian financial system is well-capitalized, according to figures published by the SBS. Gross loans in the Peruvian banking system (measured in soles) have grown at a CAGR of 1.9% between December 31, 2020 and December 31, 2024, while the system’s asset quality has remained within healthy levels with a ratio of past-due loans as a percentage of total gross loans of 3.8% and a ratio of impairment provisions for loans as a percentage of past-due loans of 3.7% as of December 31, 2024, according to the SBS. Capitalization of the Peruvian banking system has consistently been well above regulatory requirements with a total capital ratio of 17.3% as of December 31, 2024, according to the SBS. Interbank’s capitalization ratio was 12.3% and Interseguro’s regulatory solvency ratio was 125.2%, according to the SBS as of December 31, 2024. Furthermore, Peru’s banking industry has been historically profitable, with a 15.3% ROE for the year ended December 31, 2024.
Development of new technologies on expanding financial services
The ongoing digital revolution presents a significant opportunity to enhance productivity and financial inclusion through the adoption of advanced technologies. As outlined by the International Monetary Fund (IMF), Peru has made strides in embracing digital technologies. These advancements include expanding access to internet services, improving the digital payment ecosystem, and enhancing the use of artificial intelligence (AI) in various industries. These recent technological developments are transforming the financial landscape, providing Peruvian banks with significant opportunities to innovate and expand. Banks can now leverage big data, cloud computing, and artificial intelligence to offer personalized and efficient financial services, tailored to individual customer needs.
47
This digital shift enables banks to streamline their operations, reduce costs, and provide faster, more convenient services, such as 24/7 customer support, rapid loan approvals, and contextual banking solutions.
Furthermore, the adoption of AI and automation can improve operational efficiency, allowing banks to enhance credit risk assessment and fraud detection capabilities. As financial inclusion grows through digital wallets and other innovations, banks can reach previously underserved populations, expanding their market reach across geographic and income segments. This trend is poised to support formalization of the economy, as more individuals gain access to formal financial services, providing banks with an unprecedented opportunity to grow their customer base and offer a broader range of financial products and services.
Competitive Strengths
We have established a premier financial group with leading market positions in each of our primary business segments. We believe that our market share, focus on targeted and profitable segments, scale and highly recognized and trusted brands, combined with adoption of innovative technologies, a well-structured digital platform and increasing integration across our business segments, strongly position us to capitalize on the future expansion of the Peruvian economy.
Leading financial services provider focused on key businesses
We target profitable businesses in Peru. We have highly recognized and trusted brands in each of our segments (Interbank in banking, Interseguro in insurance and Inteligo in wealth management), complemented by Izipay's brand as a payments services provider. Within our banking segment, Interbank focuses on having a balanced portfolio, with 52.5% of its loan portfolio constituting retail loans, compared to 39.4% for the Peruvian banking system, as of December 31, 2024, according to the SBS. Interbank is the second largest provider of consumer loans among banks in Peru, with a 21.0% market share as measured by gross consumer loans as of December 31, 2024, compared with 26.0% for BCP, 14.2% for Scotiabank and 18.4% for BBVA. Interbank is also the largest privately-owned bank provider of payroll deduction loans to public sector employees, with a 21.2% market share by payroll deduction loans, in each case as of December 31, 2024. Additionally, it is the third largest bank in loans to mid-sized companies, with an 11% market share as of the same date.
Interbank has significantly reduced the cost of risk of its retail banking products in the last year. We believe this reduction allows Interbank to take advantage of market opportunities for growth at reasonable risk and with high profit margins. Interbank has a balanced consumer loan portfolio where two of our most profitable products are credit cards and personal loans. Additionally, we carry payroll deduction loans, which traditionally have low non-performing loan ratios. Historically, Interbank has observed low delinquency rates on its payroll deduction loans, which reduces its consumer loans portfolio’s overall credit risk exposure.
Interbank’s commercial banking business serves a range of clients spanning large corporates, mid-corporates and small-sized and medium-sized enterprises (“SMEs”). Interbank continues to focus on increasing its market share in mid-corporates and SMEs while maintaining its large corporate business with a profit-oriented approach. We believe that these segments can provide additional growth opportunities in the coming years. Moreover, Interbank’s overall commercial loan portfolio provides us with a lower risk component that balances its total loan portfolio.
Complementing our strategy, we believe Izipay is built on a strong foundation designed to boost our payments ecosystem and differentiate us from our competitors. We believe that our competitive strengths include (i) our payments platform connecting merchants and consumers enables Izipay to offer unique end-to-end product experiences while gaining valuable insights into how customers use our platform as well as providing for digital and POS transactions while being both technology and platform agnostic; (ii) our national scale which helps us to drive organic growth; and (iii) the building and strengthening of the brand Izipay. During the year ended December 31, 2024, Izipay processed S/65.3 billion in monetary transactions
We believe that Interseguro provides us with a fast-growing and profitable business. In our insurance segment, Interseguro is the leading provider of annuities in Peru, with a market share of total annuities (excluding private annuities) of 30.5% as measured by premiums collected for the year ended December 31, 2024, according to the SBS. We focus on the middle class and affluent population in Peru, a segment we believe is substantially underpenetrated in insurance services. During April 2016, the Peruvian Congress enacted a law that allowed retirees to withdraw up to 95.5% of their accumulated capital in cash in their mandatory pension account upon retirement, resulting in a significant reduction of retirement annuities sold by Peruvian insurance companies, including Interseguro. In this context, to keep its position as a leading provider in annuities, in 2016, Interseguro launched its private annuities product which allows retirees to receive a fixed income either for life or a fixed period. As of the date of this Annual Report on Form 20-F, most of the customers of private annuities and their funds originate from retirees who choose to buy a product from an insurance company rather than from a private pension fund. Interseguro is also a leading provider of life insurance, and we believe this market provides an additional opportunity for growth. Finally, the company’s digital channels are taking a leading role inside the company’s structure.
48
Within our wealth management segment, we believe Inteligo is well positioned to capture an increasing share of the number of high-net-worth clients. Inteligo’s CAGR in assets under management was 8.5% between December 31, 2019 and December 31, 2024. We believe that both Inteligo’s position as a provider of tailored wealth management services and its ability to provide its customers with both local and international investment products may help increase its share of wallet among high-net-worth individuals, while delivering high levels of growth and profitability.
Track record of sustained growth supported by our strong and growing market share and high profitability
Our strong track record of growth is supported by our increased market share, improvements in efficiency, and high profitability across our business segments. At Interbank, we have gained significant market share over time. Our market share in total gross loans has increased from 9.4% in 2007 to 13.9% in 2024, while our market share in total deposits has grown from 9.3% in 2007 to 13.9% in 2024. Interbank has a higher exposure to retail banking because it believes that it presents significant growth opportunities and higher profitability, however, Interbank is also interested in having a balanced portfolio, therefore increasing its commercial banking loans. In retail banking, Interbank’s outstanding retail loans, including consumer and mortgage loans, decreased 2.2% between December 31, 2023 and December 31, 2024, as compared to the 1.0% increase registered for the Peruvian banking system, according to the SBS, as the focus in 2024 was mainly in lower-risk segments. In commercial banking, Interbank’s outstanding commercial loans increased 12.8% between December 2023 and December 2024, as compared to the 0.4% decrease registered for the Peruvian banking system, according to the SBS. Interbank’s market share was 21.0% in consumer loans in December 2024, the second largest in the market. In the same period, Interbank has held a strong position across retail products, with market share of 19.1% and 18.5% of total retail loans in Peru as of December 31, 2023 and December 31, 2024, respectively, according to the SBS. With respect to mortgage loans in Peru, Interbank’s market share increased from 15.5% as of December 31, 2023 to 15.9% as of December 31, 2024, according to the SBS. Interbank’s annualized ROE for the year ended December 31, 2024 was 12.2% and its annualized ROA for the year ended December 31, 2024 was 1.4% below the banking system.
We believe that Interbank’s growing market share and strong profitability throughout economic cycles result from its resilient business model. From 2019 to 2023, Interbank maintained an average annual return on equity (ROE) of 14.6% (and, excluding the year 2020, which was impacted by the COVID-19 pandemic, the average ROE would be 18.3%) and an average annual return on assets (ROA) of 1.5%. As of December 31, 2024, we achieved an annualized ROE of 12.2% and an annualized ROA of 1.4%. This performance underscores our ability to thrive despite fluctuating market conditions. The upward trajectory of the quarterly ROE demonstrates our resilience to changes and sustained performance in diverse economic scenarios. The evolution of our ROE from the fourth quarter of 2023 to the fourth quarter of 2024 was the following: 6.8% during the fourth quarter of 2023, 7.1% during the first quarter of 2024, 11.1% during the second quarter of 2024, 14.4% during the third quarter of 2024, and 16.0% during the fourth quarter of 2024.
Law No. 31658 created the micro, small and medium enterprises (“MSME”) promotion program (“Impulso MYPERU”), through which the national government guarantees loans granted to micro, small and medium enterprises, and also awards borrowers with a track record of timely payments, with a discount over the final principal payments or over the aggregate principal amount of the financing. Interbank’s outstanding commercial loans increased by 12.8% from December 31, 2023 to December 31, 2024, compared to a 0.4% decrease registered for the national banking system during the same period, according to the SBS. Consequently, Interbank’s market share of commercial banking as of December 31, 2024 increased to 10.9% from 9.6% compared to the same period in 2023.
Interseguro has mantained its positioning in the industry as the leader in annuities by premiums (excluding private annuities), with market shares in a range of 27%-32% for the last five years (30.5% in 2024). Additionally, during the same period, Interseguro’s market share in the individual life insurance policies in Peru has grown from 11.7% in 2020 to 16.7% in 2024. During the period spanning from 2020 to 2024, Interseguro’s ROE averaged 20.7% compared to 16.1% for the Peruvian insurance industry, both according to the SBS. Interseguro’s ROE was 27.9% for the year ended December 31, 2024, according to the SBS.
Inteligo’s assets under management grew at a CAGR of 8.5% between 2019 and 2024. Net profit declined between December 31, 2019 and December 31, 2024, due to negative mark-to-market valuation of the proprietary portfolio. Inteligo’s ROE was 14.2% for the year ended December 31, 2024.
Digital financial services platform with rapidly increasing levels of adoption
Interbank is working hard to reshape the banking space in Peru, creating a new digital experience driven on convenience and simplicity. Interbank believes its digital platform is key to develop primary banking relationships, increasing its customers’ interactions with Interbank and providing new business opportunities to build on consumer loyalty and cross-sell services, as well as accelerate new customer acquisition and inclusion of previously underserved segments of the population, including individuals, entrepreneurs and micro-business.
49
Interbank's digital experience is defined as "everything you need in a single app". Interbank has made relevant progress in its journey towards becoming more digital, and remains focused on developing the necessary capabilities to meet its customers' needs. Interbank has a broad and evolving range of digital products and services for existing and new clients, enabling them to get the products and services they want, when they want them, and how they want them. In 2023 and 2024, our efforts have been focused on improving our mobile application, “UX Experience.”
Interbank believes its digital proposition is one of its competitive advantages and it has driven an increase in its market share. The migration of customer interaction from physical channels, like financial stores and contact centers to digital channels, continued to grow in 2024. In December 2024, 81.9% of the customers who interacted with Interbank did so digitally, up from 75.3%in December 2023. Similarly, as of December 31, 2024, we have identified 2.9 million customers as digital customers, as compared to 2.5 million customers or an increase of 16.7% compared to 2023. Furthermore, digital customer acquisition, or clients that were ‘born-digitally’, reached approximately 45,264 users as of December 31, 2024, or 59% of new individual retail clients.
In January 2020, Interbank, in collaboration with BBVA and Scotiabank, launched Plin, which consists of a shared directory to enable person to person (“P2P”) and QR code payment solution which interacts with multiple financial institutions and serves as a bridge between the banked and the unbanked through cell phones, as services may be conveniently accessed through our app. These payments are offered around-the-clock and are commission-free to all enrolled customers. In 2024, the amount of total monthly active users in Plin grew from 3.9 million to 4.7 million. As of December 31, 2024, our share of Plin monthly active users increased from 48.7% to 50.5%.
The Central Reserve Bank of Peru has encouraged an integration between Plin and Yape, a digital wallet available in Peru, initiated in April 2023, and has increased digital payments and financial inclusion while reducing cash dependency. This interoperability between banks and wallets is part of BCRP’s efforts to promote digital financial inclusion of more Peruvians into the financial system. The number of monetary transactions sent through Plin, plataform operated by Interbank, has increased to 50.1 million in December of 2024 compared to 29.1 million in December of 2023.
In line with our digital strategy, our digital sales accounted for 68.6% and 62.2% of total sales that took place in the months of December 2024 and December 2023, respectively. Additionally, the number of digital self-service retail customers increased significantly, representing 79.7% of our monthly active users as of December 2024, compared to 74.1% as of December 2023.
In commercial banking, Interbank developed its digital capabilities for SME and corporate clients, by (a) enhancing our value-added proposition and features in its digital platforms and (b) improving the performance and cybersecurity of its systems. Interbank also believe that the upgrades to core platforms for business banking during 2024 should enhance its performance and allow it to create and launch new products and features on a faster basis.
In May 2023, Interbank combined Tunki with the payment solutions of Izipay to launch IzipayYa, a solution targeting micro-merchants with interoperable QR codes and same-day availability of cash. IzipayYa aims to be the preferred solution for merchants for their payment collections through a comprehensive value proposition designed specifically for this segment.
As part of Interbank’s digital transformation, the bank have introduced new technologies and processes which enable it to improve time-to-market of new solutions. Interbank has also made significant changes in the way it works. It increased the number of teams working within an agile framework on a number of projects, ranging from applications, digital products, new features in its digital platforms, and it is currently exploring different solutions targeting new customer segments and piloting new initiatives. For example, Interbank has an innovation lab called “LaBentana”, which focuses on innovation and development of new ideas and pilot initiatives, using design thinking methodologies developed together with the consulting firm IDEO.
In 2023 and 2024, Interbank focused on two key aspects of the business: (i) increasing the number of active clients (those that receive at least one payment during that month), and (ii) increasing the amount of funds in clients’ checking accounts thus increasing deposits and improving its revenue sources.
Pursuing Interbank’s first main goal, it focused on acquiring and retaining high-value merchants through both a simplified and secure onboarding while building brand awareness through social media content strategy, reaching an average of 7 million monthly viewers, with an interaction average with such channels of seven times per viewer, according to TikTok analytics.
Pursuing Interbank’s second goal of increasing deposits, it focused on streamlining its tools and systems, aiming at the simple use of money by its clients. In 2023, Interbank focused its product development efforts to meet demands that are specific to the merchant segments such as the universal QR code that accepts payments from all digital wallets in Peru. These actions boosted the balance in its digital wallets and commercial accounts.In 2024, Interbank worked together with Izipay to generate synergies across
50
companies to improve our value proposition for our clients. These actions boosted the balance in our digital wallets and commercial accounts.
In 2024, Interbank received Euromoney awards for “Best Bank”, “Best Digital Bank”, and “Best Bank for Corporate Responsibility”. These honors resulted from the bank's commitment to digitalization, which has experienced rapid customer adoption.
Convenient and innovative nationwide omni-channel distribution network with a distinctive customer-oriented approach
We believe that Interbank’s convenient and innovative nationwide retail distribution network together with a dedicated sales force and financial advisors, allows it to better reach its customers, and this combination has differentiated Interbank from its competitors. Interbank has one of the most convenient and extensive retail banking distribution networks in Peru and is currently present in almost all of Peru’s regions. Its focus on digital transformation allows it to help its customers to interact with the bank in an easier and more efficient way and allows customers to migrate from the use of physical infrastructure to digital platforms. For instance, Interbank has shifted monetary transactions operated through its branches to digital channels. Total monetary transactions have been increasing at a CAGR of 8.5% from 2020 to 2024 driven by monetary transactions through Interbank’s mobile and internet banking channels, which have increased at a 19.5% CAGR for the corresponding period, even though monetary transactions through its financial stores have been decreasing at a CAGR of 14.6% from 2020 to 2024. Interbank believes this optimization of its distribution footprint has enabled it to reach its clients more efficiently, allowing them to perform transactions when and how they want to, at lower marginal costs for Interbank.
Interbank has built a convenient omni-channel distribution network in Peru, serving over 5.4 million customers. As of December 31, 2024, Interbank had 149 financial stores and operated one of the largest ATM network in Peru with 1,750 ATMs, which includes one of the largest out-of-branch ATM network (under its Global Net brand). Interbank has the largest number of financial stores inside supermarkets in Peru. Moreover, with the intention of providing underserved customers with more convenient services, Interbank operates a network of correspondent agents, called Interbank Agentes. The correspondent agent concept consists of providing third-party commercial establishments with low-cost electronic terminals which allow Interbank’s customers to perform basic cash-based operations such as cash withdrawals, credit card and bill payments, and deposits at a lower marginal cost to Interbank relative to transactions performed in its financial stores. As of December 31, 2024, Interbank had 7,501 correspondent agents (including its external network).
Since 2013 and in line with Interbank’s strategy, it has implemented a profitability model for financial stores and ATMs which ranks them according to certain profitability metrics relevant to each distribution channel. This has allowed Interbank to identify the less profitable units in order to close them and to prioritize new openings in more strategic locations with higher demand for value-added financial services. As a result, the number of financial stores has decreased by 45% to 149 as of December 31, 2024 from 272 in 2017, while the productivity of financial stores, measured as the volume of retail deposits sold per branch, has increased. Likewise, Interbank’s market share in retail deposits by individuals grew from 12.6% as of December 31, 2017 to 14.6% as of December 31, 2024.
Interseguro offers and sells its annuities and individual life insurance products through its own dedicated sales force to ensure the delivery of high-quality service and advice to customers. Interseguro’s specialized sales force is trained to provide a differentiated service for various customer types. As of December 31, 2024, Interseguro employed 95 agents exclusively dedicated to selling annuities and 695 agents to selling life insurance products. Interseguro’s sales force provides customers a hybrid model that includes both in-person assistance and fully digital operations. Prior to the pandemic, sales in annuities and life insurance products were only conducted in-person, but digitalization of these sales was accelerated due to COVID-19.
In addition to its own sales force and digital channels, Interseguro leverages the retail distribution capabilities of Interbank, Intercorp and Intercorp Retail to offer simple, low-cost premium insurance products, such as SOAT, travel insurance, vehicle insurance, life insurance, card protection, credit protection and low-cost health insurance.
Inteligo has developed a proprietary financial advisory model that has been a key pillar in sustaining its growth. The model considers the financial objectives of its customers and emphasizes risk analysis and ongoing monitoring with portfolio rebalancing. Along with this, Inteligo has been able to successfully serve its customer base in order to deliver tailored products and advice.
Izipay has built and developed a well-recognized trusted brand. Izipay’s communication and marketing efforts play an important role in building brand visibility, usage and overall preference among customers. Also, Interbank’s and Intercorp Retail existing clients represent a sizable opportunity to cross-sell products and services with relatively low incremental marketing and advertising expenses for those entities. We believe that Izipay’s range of services, many of which can be used for both business and personal needs, represents an opportunity to further increase engagement with its existing clients. Our subsidiaries plan to continually invest in product development to maintain and increase the attractiveness of their products and services.
51
Prudent risk management resulting in high asset quality, strong liquidity and high investment returns
Risk management has been and remains a primary focus of our operations and at the center of our culture. Our experienced risk management teams focus on monitoring and managing risks across all business areas, including credit, market, liquidity and operational risks, among others. We believe our risk management expertise has allowed us to achieve strong asset quality and high investment returns. Our prudent management has allowed us to build up sufficient capital to allow us to grow strategically, invest in opportunities and pay dividends to our shareholders.
Interbank’s underwriting procedures are based on strong analytics and proprietary models. Additionally, Interbank’s investments in technology and improvements in its ability to process and apply data have enriched its risk models and enhanced their accuracy and predictiveness. Interbank’s credit risk policies are approved by its risk committee and board of directors. The deterioration of the macroeconomic conditions in Peru in 2023 led to higher provision requirements as well as lower provision recoveries, an increase in non-performing loans and a slowdown in the origination of new loans due to more stringent lending requirements that Interbank has put in place. Interbank’s loan provisions have also been impacted amidst higher risk in consumer loans as confirmed by expert judgment. During the last two years, the expert judgement for the constitution of provisions considered the possible impact of the “El Niño” event and the political and economic uncertainty in Peru in such analysis. This trend peaked in the fourth quarter of 2023, as 2024 had a lower cost of risk and a healthier loan portfolio, accelerated by liquidity events such as pension fund withdrawals, and better payment behavior from clients, generating a positive declining trend in terms of cost of risk going from 4.3% as of December 31, 2023 to 3.6% as of December 31, 2024. As Interbank’s concentration in consumer loans decreased during 2024, Interbank’s past-due loans as a percentage of total gross loans ratio as of December 31, 2024 was 2.7%, lower than the 3.8% average of the three largest banks in Peru, according to data from the SBS. The past-due loans ratio showed quarter-to-quarter improvement, decreasing from 4.5% as of December 31, 2023 to 2.7% as of December 31, 2024. In comparison, the Peruvian banking system’s ratio decreased from 4.3% as of December 31, 2023 to 3.7% as of December 31, 2024. As of December 31, 2024, Interbank’s past-due loans coverage ratio was 95%, as compared to the average for the Peruvian banking system of 92%, according to the SBS.
Interbank’s total capital ratio, which is calculated as its regulatory capital divided by its risk-weighted assets, stood at 15.9% as compared to 17.3% for the Peruvian banking system, as of December 31, 2024, according to the SBS, and its risk-weighted asset density (calculated by dividing risk-weighted assets over total assets) decreased to 87.8% as of December 31, 2024 from 93.1% as of December 31, 2023, as a consequence of lower capital requirements for credit risk. The SBS requires a higher weighting for our assets than that required by Basel III or other regulators, therefore our risk-weighted assets density is higher than that of the Latin American region and other developed markets. The minimum total capital ratio required by Peruvian banking regulations was 9.5% as of December 31, 2024. In addition, financial institutions must meet additional capital requirements related to conservation, economic cycle and market concentration risk buffers and an additional capital requirement which depends on certain levels of loan concentration in each institution (individual, sectorial and geographical). Interbank’s total additional capital requirement for buffers and additional risks were about of 2.2%. Additionally, Interbank’s core equity (“Tier 1”) ratio was 12.3% as of December 31, 2024, above the regulatory requirement. As part of the implementation of the Basel III standards, the SBS has issued several regulations to increase gradually the minimum total capital ratio for financial institutions in Peru until 2026, and Interbank expects to be in compliance with such regulations.
Interseguro’s investment team and its investment management approach have achieved a 6.1% investment return for the year ended December 31, 2024, while maintaining prudent levels of risk and following the SBS risk guidelines. Accordingly, Interseguro’s investment strategy was focused on identifying and reducing potential risks in the portfolio and looking for assets of solid companies with strong credit metrics.
Inteligo’s lending services are offered through Inteligo Bank to complement its wealth management business. The decision to make loans to wealth management customers only results in Inteligo’s loan portfolio being fully collateralized by its customers’ assets. Regarding the management of capital, Inteligo Bank’s capitalization ratio, which is calculated as Inteligo Bank’s regulatory capital divided by its risk-weighted assets, was 19.3% as of December 31, 2024, above the minimum capitalization ratio required by the Central Bank of Bahamas of 12%.
Izipay demands a letter of guarantee from payment facilitators, so as to partially cover payment defaults. By doing so, Izipay prevents merchants that are listed by OFAC in its Specially Designated Nationals and Blocked Persons List, as well as any merchants that have breached competition, fraud or brand recognition rules enforced by the Peruvian Antitrust Authority (Instituto Nacional de Defensa de la Competencia y de la Protección de la Propiedad Intelectual – “Indecopi”) from signing up to its services.
52
Diversified funding base with strength in retail deposits
IFS has a competitive funding structure. We have access to diverse sources of funding, including deposits and debt securities placed in local and international capital markets. The majority of Interbank’s funding comes from low-cost customer deposits, which demonstrates its customers’ trust in the Interbank franchise and enables it to achieve attractive lending spreads. At Interbank, as of December 31, 2024, 81.5% of its total funding base was comprised of deposits. Interbank’s deposit base is broad and diversified, which provided Interbank with an average cost of funding of 3.6% for the year ended December 31, 2024 and 4.0% for the year ended December 31, 2023.
Interbank has been a significant player in the Peruvian banking industry with a market share of demand, savings, and term deposits of 10.3%, 15.6%, and 14.7%, respectively, as of December 31, 2024, according to SBS. Moreover, our strategic focus on retail has allowed Interbank to gain market share in retail deposits by individuals over the years reaching 14.6% as of December 31, 2024 as compared to 12.8% as of December 31, 2016, providing Interbank with a healthy funding base.
Interbank’s competitive advantage in the retail segment, over the last two years, was attributable to an increase in its clients’ liquidity as a result of (i) partial cash withdrawals from deposits for compensation for service time (compensación por tiempos de servicio) systemwide and the private pension system, (ii) commercial deposits related to unused funds from the Reactiva Perú program, and (iii) the widespread adoption of a “savings” mindset, all as a result of the effects of the COVID-19 pandemic.
Experienced management team with proven ability to foster a merit-based culture and a highly motivated work force
We believe that the strength of our senior and middle management team has enhanced and remains a key driver of our successful business model. To achieve our transformational goals, we strive to introduce new capabilities as required to excel in today’s world. We benefit from an experienced, diverse and talented management team. Most of the members of our senior management have held management positions with other major financial institutions in the United States, Latin America and Europe, bringing relevant knowledge and experience to our company.
Interbank is committed to fostering a culture rooted in values that prioritize attracting, developing, and retaining highly qualified personnel. We believe that a merit-based culture that emphasizes teamwork is essential for maintaining a motivated workforce that delivers high-quality service. Interbank has been consistently recognized by the Great Place to Work Institute. Interbank’s most recent rankings highlighted our achievements: #1 Great Place to Work for diversity and inclusion in Peru in 2024 #2 for women in Peru in 2024, #5 overall in 2024, #9 for sustainable management in 2024, #2 for work-from-home policies in 2023, and #2 for millennials in 2022. Additionally, we secured second place in Merco Talento 2024, a ranking that evaluates the attract and retain top talent.
Similarly, Interseguro was selected as the eleventh best company to work for Peru in the large-size category (2024) by the Peruvian Great Place to Work Institute. Inteligo’s three subsidiaries located in Peru (Inteligo SAB, Inteligo Peru Holdings and Interfondos) participated together under the name “Inteligo Group Peru” and Inteligo Group Peru was selected as the third best company to work for in Peru in the category of companies with less than 250 employees in 2024. Inteligo Bank’s branch in Panama began participating in the Great Place to Work Institute survey in 2014 and since 2015 has been ranked among the top 10 companies in Panama.
Similarly, Izipay, as a financial services and payments technology platform that enables digital payments and simplifies commerce experiences, competes for top talent in Peru and the region. We believe that a strong culture focused on employee experiences that enables advancement, learning, and individual career insights is essential to the successful acquisition, development, and retention of diverse talent. To that end, since its acquisition, we have implemented programs at Izipay focused on inclusive hiring practices, enriched virtual new hire experiences, individual coaching and mentorship programs, and ongoing learning opportunities.
Increasingly integrated business platform with synergy potential supported by a strong parent group
Since the introduction of our insurance, wealth management, and payments operations alongside our banking operations, we have strived to share and leverage key resources and capabilities across all three segments, which has resulted in enhanced revenues.
Our banking operations remain our core competency, binding together all our operations and thriving through our payments ecosystem. Our insurance and wealth management operations are also expected to continue supporting our growth. We believe that our ongoing efforts to better integrate our three segments, combined with our focus on digital transformation, our existing distribution channels, experience and knowledge of our customer base and the Peruvian market, is a significant competitive advantage.
53
Furthermore, our parent company, Intercorp Peru, is one of Peru’s largest economic conglomerates, with activities spanning financial services, retail, education and real estate, among others. In 2024 and 2023, Intercorp Peru’s businesses generated U.S.$10,800 million and U.S.$10,400 million in revenue, respectively. We believe that being part of this group gives us a competitive edge, because of the group’s deep knowledge of the Peruvian consumer, extensive focus and know-how in the Peruvian retail market, highly visible in-country presence and rapid decision-making capabilities. Intercorp provides significant synergy and cross-selling opportunities for IFS. Also, with the acquisition of the remaining 50% equity interest in Izipay in April 2022, we expanded our capacity to cross-sell products and services and benefit from synergies across all our segments, providing a unique value proposition to our customers.
Analytical excellence as a tool to become the company with the deepest knowledge of Peruvians
We aim to have the deepest understanding of Peruvians, both individuals and companies, as we believe that a deep knowledge of our current and potential customers’ characteristics and adapting to their behavior is important to better serve them by offering the best solutions according to their needs and risk profile.
In 2024, our Analytics Center of Excellence (“ACoE”) focused on enhancing our knowledge in data, advanced analytics, and analytical technological tools in order to capitalize on these capabilities across all our business segments.
Our analytics vision is to anticipate needs and offer solutions through contextual, personalized and real-time experiences for each customer and potential customer, at scale. We are building upon three pillars to execute our aspiration:
•
Governed and easily available data in a hybrid data hub from diverse and non-traditional data sources that provide rich insights, dashboards for decision making and data streaming capabilities for timely activation.
•
Advanced analytics to anticipate preferences, needs and risk, including real-time decisioning. These analytical efforts include a special focus on better understanding the self-employed segment of the population, which constitutes a significant opportunity for financial services given the current low penetration levels. We are working on alternative risk profile models for new customer acquisition.
•
Personalized and real time delivery of communications and campaigns through end-to-end contextual journey orchestration, allowing us to substantially improve our effectiveness and efficiency.
Technological evolution is a key strategic enabler; therefore, our strategy is powered by a robust and consolidated cloud-based data infrastructure, equipped with automated and reusable variables, model processing, machine-learning operations (“MLOps”) and world class marketing technological tools for real-time data activation. Additionally, we prioritized compliance with Artificial Intelligence and personal data local policies and international best practices. For instance, we have reinforced our investments in cybersecurity, as we believe it is fundamental to provide a secure platform to be able to continue with our digital transformation.
The “ACoE” is at the fore front of our transformation, establishing a shared vision, best practices, governance and attracting and developing highly skilled transformational analytical talent that can accelerate our journey towards becoming a fully data-driven organization. This involves designing and communicating an attractive value proposition for talent, as well as ongoing upskilling and training.
We are confident that our focus on analytical excellence allows us to better serve Peruvians and accelerate value-creation.
Attracting and retaining skilled workers with a unique values-based culture, focused on the employee development.
At Interbank, our organizational culture is built on six core values: integrity, collaboration, courage, innovation, passion for service, and sense of humor. These values foster a work environment that inspires, differentiates us, and strengthens employees’ sense of pride. Coupled with a culture that recognizes performance, this has positioned Interbank among the best companies in Peru and Latin America, as recognized by the Great Place to Work Institute, including in categories such as Women, Diversity, and Inclusion. Additionally, we continue to be one of the best companies to attract and retain talent in Peru, according to Merco.
At Interbank, we strongly believe in talent development because it is essential to our vision. For this reason, we constantly focus on initiatives that empower our employees with the tools they need to take ownership of their growth through our “Evoluciona” model, which is structured around three pillars: Experience (70%), Support (20%), and Learning (10%). This framework ensures that employees have access to the necessary resources to support their development.
Each year, we offer more than 50 training programs, delivering approximately 1,500 courses, which have been accessed and completed a total of 37,000 times. As of December 31, 2024, we have successfully trained 100% of our employees in regulatory
54
courses and over 90% in strategic learning programs designed to empower their skills and capabilities, dedicating a total of 84,000 hours to their learning. On average, each employee dedicates 16 hours per year to training, reinforcing their knowledge and preparing them for future challenges.
To implement initiatives that support these internal objectives, we provide learning opportunities, checkpoints, and training tools focused on upskilling and reskilling across the pillars of Data, Digital, and Power Skills. This includes programs such as “Upskilling by Coursera”, “Programa de desarrollo de Líderes”, “Beca 23”, “Banking 1.0", which seeks to reinforce leaders' and employees' understanding of key banking business topics.
Additionally, as part of our journey to cultivate a digital mindset, we have launched events like the Digital Summit, to inspire about digital trends.
Strategy
Our purpose is centered around building financial well-being together, by providing profitable solutions and exceptional support to empower our customers to achieve their financial goals and secure a prosperous future. We strive to (i) become the leading digital financial platform, with a clear strategic focus on key businesses such as payments, consumer financing, wealth management and life insurance; (ii) place the customer at the center of our decisions, offering a comprehensive suite of services backed by digital experience and analytics as our competitive advantages; and (iii) fostering a unified approach, leveraging the best talent, innovation and a collaborative mindset, as we believe that together, we are stronger.
To achieve these goals, we continue working on five main pillars:
•
promoting a culture of innovation and collaboration to uncover new revenue opportunities by accelerating existing businesses, driving transformation, and exploring new market niches, all while capitalizing on synergies across our diverse operations;
•
developing a resilient, secure and scalable technology platform for current and future growth;
•
becoming an AI-driven organization enhancing our risk and commercial management skills, with deep understanding of Peruvians and consumer preferences;
•
attracting and developing the best talent within our remote-first framework within an agile organization; and
•
becoming a leader in sustainable operations within our segments in Peru.
Grow with strategic focus on key businesses
We have built a financial platform centered around areas that we believe can leverage our unique capabilities, combined with significant growth and profitability potential, through the following four main subsidiaries: Interbank, a universal bank with strategic focus on retail banking; Interseguro, an insurance company focused on life and annuities; Inteligo, an advisory firm for the emerging wealthy; and Izipay, the cornerstone of our payments ecosystem.
Interbank is a bank with a strong retail market share and key focus in consumer finance. It aims to enhance its value proposition accross customer segments with ongoing improvements to products such as accounts, payments and financing solutions, alongside the development of digital features and new products to meet different customer needs, including Interbank Benefit loyalty program, payment and merchant financing solutions, and the digital savings account Piggybank. By working together with LaBentana, our innovation lab, we strive to ensure customer-oriented products that drive value and innovation. Additionally, Interbank has a goal to grow its retail deposits at a faster pace than that of the Peruvian banking system while optimizing its physical distribution channels, which has contributed to a decrease in number of financial stores. Moreover, its expertise and digital strategy in retail banking has allowed us to identify and address key customer demands, while increasing profitability, growing customer base, driving cross-selling and boosting operating leverage.
Within commercial banking, Interbank aims to be the preferred bank for Peruvian businesses with a strong focus on profitability. Its value proposition for commercial clients is based on (i) delivering customer oriented digital solutions, (ii) building long lasting relationships, (iii) developing expertise in key sectors, and (iv) enabling fast-decision-making. Interbank seeks to create value for its customers by becoming their transactional bank, connecting and collaborating with their suppliers, customers, employees and communities, co-creating products and services within their ecosystem. We believe that leveraging synergies with Izipay is key to increasing transactional volumes and building primary banking relationships.With the aim of providing the best self-service and automated credit experience for commercial clients, Interbank offers a 100% digital journey focused on cash management solutions such as Cuenta Negocios, merchant financing, sustainable loans, and easy and transparent ways of managing payments, such as Cuenta Sueldo and through Izipay.
55
Izipay is a key player to our goal of creating a powerful profitable payments ecosystem in Peru, facilitating financial transactions between consumers, merchants and the bank. Izipay is a payments company and provider of products and services related to payments acquirer, a correspondent bank and a credit cards processor. Izipay is the leader in the physical card payment business in Peru. Izipay is growing its core business by (i) increasing adoption of our digital payment methods supported on its innovative capabilities, (ii) developing new value-added services (VAS) that can strengthen our relationship with merchants while providing additional revenue streams, and (iii) leveraging synergies with our other segments.
We strive to provide solutions to address the payment needs of people and companies by creating a payment ecosystem that seeks to build a strong bond with our customers, focusing on five pillars: (i) growing number of customers and transactional volumes by extending merchant coverage and improving customer experience, (ii) replacing cash by banking unbanked Peruvians, through our open APIs that allow partners to access our account opening and basic financial-transaction services, (iii) scaling up e-commerce initiatives such as those related to marketplace and our Buy Now Pay Later solution, “Divídelo,” (iv) creating new consumer finance product offerings, and (v) offering financing and aggregated services to merchants.
Moreover, our payments ecosystem benefits from having strong solutions on both ends of the market. On the retail customer side, Izipay has a strong market share, as well as knowledge of the traditional and digital card payments. On the merchant side, Izipay strengthens our value proposition for small merchantsthrough IzipayYa. It also complements Interbank’s financing solution, while our shared directory Plin allows us to interact with customers from other banks and serves as a bridge between retail customers and small merchants. This wholesome ecosystem also allows us to scale up our other initiatives such as our e-commerce solutions, our marketplace Shopstar and the Buy Now, Pay Later solution Divídelo.
In our insurance segment, Interseguro is strategically focused on life and annuities insurance, which has had a fast growth in recent years. During the year ended December 31, 2024, the premiums earned from life and annuities insurance customers represented 91.0% of Interseguro’s total premiums earned, compared to the average of 54.3% of life insurance premiums earned over total premiums earned in the industry in 2024, according to data from SBS. Interseguro directs its efforts towards an end-to-end experience in its customers’ journey, from the issuance of an insurance policy to the after-sale services offering to clients. In this context, Interseguro’s digital offering is gaining relevance. For example, in 2024, digital life insurance sales represented 22% of total life insurance sales, compared to 0% in 2019. As another example, digital mandatory auto insurance (Seguro Obligatorio de Accidentes de Tránsito, or “SOAT”) policies accounted for 84.2% of total SOAT sales in December 2024. Additionally, after-sale offerings are expected to become a virtual self-service experience, with the aim of ensuring customers a simple and positive interaction with us, leading to positive developments in digital indicators.
In our wealth management segment, Inteligo’s primary focus is to preserve and enhance the wealth created through people’s careers and lifetime. The approach is focused on its value proposition, offering digital onboarding and products and services by segment, with a 360-degree view of its customers. To acquire depth knowledge of the needs of its customers, Inteligo cultivates a culture of closeness with them, while also leveraging the wide array of financial products that can be offered through its subsidiaries, as well as through IFS’ platform. In this context, we have been able to achieve good financial results through a low-intensity capital business model uniting cost efficiencies and diversified sources of revenues over the years, as we complement our products and services across all IFS’ business segments.
We aim to become the preferred option for our individual, commercial and merchant customers and build financial well-being together and growth by understanding and anticipating their needs, as well as by offering financial solutions that can be deployed at every contact point with the clients, including in-person and digitally, in real time. We believe that maintaining a trustworthy and transparent relationship with our customers, together with the superior, simple, mobile, agile and personalized experience that we offer, brings us closer to this goal. Our highly recognized and trusted brands in each of our segments (Interbank in banking, Interseguro in insurance and Inteligo in wealth management) are a testament to our focus on this objective. Our subsidiaries are leaders in their respective industries and, by focusing on our strengths, values and solid relationships, we plan to continue evolving and growing.
Develop a powerful and profitable payments ecosystem
In May 2023, Tunki plus Izipay combined to launch IzipayYa, a solution targeting small merchants with interoperable QR codes and same-day availability of cash. IzipayYa aims to be the preferred solution for merchants for their payment collections through a comprehensive value proposition designed specifically for this segment. As of December 31, 2024, the number of merchants using IzipayYa reached more than 1 million compared to approximately 747 thousand merchants that used our Tunki solution as of December 31, 2023.
Plin is a P2P and QR code payment solution which interacts with multiple financial institutions and serves as a bridge between the banked and the unbanked through cell phones, as services may be conveniently accessed through the Interbank app. These payments are offered around-the-clock and are commission-free to all enrolled customers. Interbank is currently one of nine financial
56
institutions that are Plin’s partners. The integration between Plin and Yape, a digital wallet available in Peru, initiated in April 2023, and has increased digital payments and financial inclusion while reducing cash dependency. This interoperability between banks and wallets is part of Central Reserve Bank of Peru’s efforts to promote digital financial inclusion of more Peruvians into the financial system. The number of monetary transactions sent through Plin, platform operated by Interbank, has increased to 50.1 million in December 31, 2024 compared to 29.1 million in December 31, 2023 (pre-interoperability). Thus, we are creating value and primary banking relationships through the positioning of Plin as (i) a single app (not a separate app) that allows our customers to manage all their payments and caters to multiple segments, (ii) a solution backed by Interbank, to provide a more robust value proposition, and (iii) a simple option for our customers, offering a simple and quick experience to assist them with their daily payments.
We have also been working on our merchant financing solution with fast disbursements enabling small merchants to access the working capital loans they need to grow their businesses efficiently. Our value proposition includes digital solutions, phone-based sales, and in-branch offerings with convenient repayment options, tailor-made credit and flexible T&Cs, all while fostering financial inclusion.
Divídelo is the name of our Buy Now, Pay Later solution which is already connected to over 120 e-commerce businesses in Peru and growing.
Shopstar is an online marketplace aiming to become the preferred e-commerce option for IFS customers and a sandbox to evaluate some of our initiatives such asDivídelo. It was created from the insight that many of our customers were not comfortable buying on e-commerce but would be willing to try it in a platform that was supported by Interbank. As of December 31, 2024, Shopstar had approximately 121 thousand users.
Furthermore, we believe Izipay can strengthen our strategic and competitive positioning in Peru´s payments landscape, opening new sources of growth and monetization. Moreover, it offers significant potential for merchant financing and additional services for merchants, complementing its value proposition through synergies with our banking business and its products suite. We are currently developing and testing Izipay solutions for our banking merchant clients, including merchant financing, providing valuable cross-selling opportunities and strengthening customer loyalty.
Create the best digital experience based on operational excellence
We want to deliver a seamless and superior experience to our customers, while becoming more relevant to them. We believe that acting on these goals can allow us to more effectively serve our customers, enabling them to get what they want, when they want it, and how they want it. We believe that the key to ensure that our customers will have the best experience when interacting with us is to create unique experiences throughout their customer journey, including customer acquisition, on-boarding, customer development to earn loyalty, and during retention stages. We have been implementing various initiatives to improve the customer relationship cycle.
We seek to build entirely digital solutions for the customer journey and accelerate the growth of our customer base by creating innovative and distinctive tools that deliver financial solutions to people, small merchants and all types of business in an accessible and efficient way, throughout all our business segments.
At Interbank, we have built a seamless digital customer journey with teams dedicated to improve each step of the customer experience. We believe that a strong on-boarding leads to higher engagement from customers while an increase in engagement can create a tangible higher NPS and lower churn.
Within retail banking, Interbank is focused on expanding the products and self-service interactions, continuing to foster the adoption of digital channels by customers, adding new features according to their needs, and ensuring that interactions with them are safe and secure.
With this purpose, several high impact digital solutions have been developed based on customer preferences and needs. These solutions have been designed together with our innovation lab LaBentana based on deep understanding and research, through a co-creation process with our banking customers. We have decided to make all solutions available in our Interbank App, which we strongly believe to be our most valuable channel in our relationship with our customers going forward, considering the decrease of in-person interaction. Over the year 2024, the percentage of financial transactions performed on Interbank’s branches over the number of total transactions has continued to decrease, declining 21.6% compared with the percentage of transactions performed in-person during the year 2023. In contrast, retail digital sales have increased and accounted for 68.6% as of December 2024.
Through our banking physical channels, we continue to focus on providing a superior customer experience and are improving productivity and efficiency through digital processes, tools and more advanced analytics. Additionally, we continue to invest in educating our banking customers to encourage the use of digital and other channels. Deposits, withdrawals, bills and credit cards
57
payments are being redirected to other more convenient and cost-efficient channels.As a result, the number of Interbank’s express branches reached 22 as of December 31, 2024, an increase of 37.5% compared to December 31, 2023.
Within commercial banking, Interbank is working on a radical simplification of its products and processes together with digitalizing each point of contact with the bank. Moreover, one of the most important points of contact for its clients is the post sales division, where inquiries, claims and any operational issues that customers might have, are addressed through channels such as our proprietary virtual chatbot, Commercial AVI.
Regarding commercial banking cash management platform, it has three types of client groups based on sales volume, which allows us to employ different strategies accordingly. For large corporations, efforts are focused on generation of fees from cash management and corporate finance; for medium-sized companies on growth, productivity and cash management; and for small companies on sustainable growth and productivity with strong support from analytics and collection. For small businesses, since its introduction in August 2018, Interbank’s Cuenta Negocios, an account that can be opened 100% digitally, has grown to 202,967 accounts as of December 31, 2024.
Izipay’s approach is focused on providing a best in-class customer experience and expanding our value proposition for merchants and consumers by partnering with merchants to grow and expand their business online and in-store, and providing consumers with simple, secure, and flexible ways to manage and move money across different markets, merchants, and platforms and simplifying their shopping experiences. The investment in software development allowed us to add additional functionalities to our payment gateway, Punto Web 2.0, which now accepts transactions with Debit/Credit cards, QR, and Apple Pay. Additionally, we added the capability for merchants to accept contactless payments (via physical cards and digital wallets) for all the network brands within the Izipay mobile application. Lastly, we integrated QR functionality into the IzipayYa application.
At Interseguro, we want to be the preferred and most convenient digital insurance company, using active listening mechanisms to improve customer experience and be characterized as a data driven organization to gain a competitive advantage against our peers. In this sense, the digital journey started with the launch of the online sale of SOAT in 2016 and continued with the sale of new digital products such as travel insurance, car insurance and individual life insurance.
At Inteligo, we specialize in providing wealth management services, with a focus on delivering innovative digital solutions that cater to the evolving needs of our clients. Recently, we launched a digital platform that integrates client onboarding, financial planning, advisory, and execution services, thereby offering a comprehensive digital journey for our customers. Our value proposition is centered around providing what we believe to be the best possible investment advice. To achieve this, we maintain strong, ongoing relationships with our clients to gain a deep understanding of their financial needs and objectives. In addition to our expertise in understanding client needs, we believe that our ability to respond swiftly to changing market dynamics is a key differentiator. Our organizational structure is designed to be horizontal, fostering collaboration across teams and encouraging an entrepreneurial mindset that facilitates agile decision-making and the rapid deployment of solutions.
As part of our digital product offering, we have developed a suite of innovative tools to enhance the client experience. Notable examples of these products include: (i) Erni App, a digital solution specifically designed to address client needs within our mutual fund business, which seeks to provide an accessible and user-friendly platform for managing investments. As of December 31, 2024, 27% of our customer base was registered in Erni and more than 33% were monthly active users. And (ii) Octopus, our proprietary digital distribution platform, which enables us to deliver automated, data-driven insights across multiple channels, enhancing our clients' investment decision-making process and overall user experience. During 2024, we delivered approximately 6,500 insights to Inteligo Bank’s clients. We are actively expanding the scope and depth of insights generation and plan to include Interfondos and Inteligo SAB in this initiative.
We strive to continue to focus on our digital transformation to enhance efficiency through the automation of internal processes and the use of technology. Our goal is to be more efficient while utilizing fewer resources in our customer interaction.
Developing resilient, secure and scalable technology
To achieve all of the above, we believe that building a scalable, flexible, trustworthy, stable and secure technological platform is essential. We believe that we have deployed the key initial investments necessary to scale our platform and are committed to continue to improve it by maintaining and updating our current levels of investment in technology.
Interbank’s IT strategy is focused on working in collaboration with open technological platforms to transform our operations supporting the digital approach. Its focus is based on four main areas of work: (i) resilience, (ii) world class end to end security, (iii) modern architecture and (iv) modular IT architecture and lightweight banking mobile application. Our modular and lightweight digital banking solutions display our evolution in digital banking which accelerates time to market and accessibility. What
58
we refer to ‘resilience’ is maintaining up-to-date critical core applications and high performance and stability of Interbank’s technological platforms. Interbank’s ‘world-class end to end security’ goal is to have the adequate equipment, processes and tools that allow us to operate in a safe environment with a comprehensive security approach. Interbank’s “modern architecture” refers to the upgrading of the main applications towards cloud native versions and the evolution of the cloud operation governance model, as well as laying the foundation to safely scale artificial intelligence at Interbank.
In this context, Interbank invests in the update of core applications while additional effort and resources are invested in the digitalization and transformation of processes and channels in order to provide an entirely digital experience to all customers. Moreover, Interbank has increased the number of teams within its agile digital solutions framework, allowing it to substantially decrease time-to-market and to develop more innovative ideas.
Additionally, during the years 2022, 2023 and 2024, Interbank and our other subsidiaries have bolstered our investments in cybersecurity as we believe security is essential for our platform to continue to enable our digital transformation. General-purpose technologies have also been implemented to our operations to mitigate cybersecurity risks and these controls are evolving and being aligned with industry trends.
Interseguro's IT strategy focuses on allowing the future scalability of our business while adopting a continuous modernization of our platform. In 2024, we completed the migration of 100% of our systems to Google Cloud.
We strongly believe that our IT strategy can allow us to deliver high standards of cybersecurity and compete with high performing players in the region, including financial incumbents and digital disruptors.
Develop an AI-driven organization
Interbank’s analytics vision is to have a fully deployed online customer management system which relies on real-time data, cloud processing, automated and reusable variables, real-time decision and actions, and an integrated infrastructure to support these new processes.
Our advanced analytics capabilities are being enriched with new sources of data and new tools that technology offers, such as cloud, real-time decision, machine learning, deep learning, artificial and continuous intelligence and big data. Interbank aims to have a deep understanding of the habits of Peruvians, both individuals and companies, as it believes that a deep knowledge of our current and potential customers’ characteristics and adapting to their behavior is important to better serve them, and to offer them the best solutions according to their needs and risk profile.
In this context, at Interbank, we focus on three strategic areas: (i) marketing analytics, (ii) risk, and (iii) collections all of these empowered by the adoption of artificial intelligence.
In marketing analytics, Interbank aims to anticipate the needs of our customers with personalized and timely solutions. We are focused on improving time-to-market, as well as increasing the number of personalized offers with further customer engagement.
Secondly, the ability to assess customers’ risk profile in the correct manner, together with a balanced portfolio approach, has allowed Interbank to grow in a healthy manner. The bank is focused on improving its assessment, through more and better models and using as much information as possible. Furthermore, we have been able to deliver contextual credit offers digitally in real and near real time which allows us to maximize the relationship with strong credit customers, while generating a sense of togetherness and loyalty.
Finally, Interbank also applies advanced analytics to improve its debt collection process, creating an efficient, digital and empathetic experience. As for example, machine learning models have allowed the bank to improve contestability and response, as well as the contact with its customers. This has been important to develop a self-service environment that gives our banking customers flexibility in an easy and empathetic manner.
Investments in technology represent the pillar of this strategic initiative, and Interbank is working in a variety of areas to achieve this goal, including data and infrastructure, advanced marketing analytics, and risk profiling and pricing models, as well as improving our CRM capabilities, including contextual marketing. With the support of its team of data scientists, Interbank centrally designs and distributes most of its sales campaigns, has substantially improved its campaign effectiveness and is currently employing real-time decision making on certain campaigns. This combination of investments has helped make the bank more dynamic and able to approach customers in real time, by offering easy-to-understand information and agile and transparent processes that generate trust in us.
59
These efforts also include different actions undertaken to have a better understanding of the self-employed segment of the population, which constitute a significant opportunity for financial services given the current low penetration levels. In addition, Interbank is working on alternative risk profile models for new customer acquisition using new sources and non-traditional sources of data.
Through analytics, we are working to become the digital ally in hearts and minds of Peruvians, as well as to establish best practices and governance around the use of data and analytics initiatives, promoting a data-driven mindset throughout the platform. Such initiatives are assisted by the Analytics Center of Excellence (AcoE), which was implemented at the beginning of 2023.
During 2024, IFS focused on testing use cases and exploring the potential value of generative artificial intelligence within the organization. By the end of the year, we had developed several proof-of-concept initiatives, with the vast majority centered on enhancing customer experience, alongside efforts to optimize internal processes and drive revenue growth. Additionally, in 2024, we laid the foundation for training and fostering a culture that facilitates the adoption of generative AI, aiming for a significant portion of these pilots to transition to production in 2025.
Promoting a unique working environment to capture and retain the best talent worldwide working within an agile organization
We believe that a motivated workforce leads to high-quality customer service, which leads to satisfied customers and better results. Our commitment to fostering a motivated workforce and performance-based culture is demonstrated by recently being ranked among the top Peruvian and Latin American companies in all our core segments by the Great Place to Work Institute and recently also in the specific rankings for women and millennials.
At Interbank, teams are dedicated to nurturing a culture based on six core values, which we believe is one of the most important drivers to lead high-quality teams who develop in a safe environment. Moreover, it allows the teams to cultivate an innovative culture, and as a result, the creation and improvement of our products and services. We also believe that diversity makes us stronger and enhances our innovation. For this purpose, Interbank has introduced a series of initiatives such as Expo Analytics, #LaFerIA, LaBentana Talks, as well as Innovation Day at Intercorp Peru level. In addition, training programs including the Agile Academy, Tribk, and the Commercial Trainee program have also been created, as well as Summer and Global internships.
Our overarching goal is to attract and retain the best talent worldwide, as it is considered the main pillar. At Interbank, this is possible because of its flexible remote work framework ERES, which is considered a competitive advantage in the context of digital financial services and which allows us to stay connected while achieving our goals wherever we are. Our ERES framework has allowed us to attract regional talent in key positions, being an advantage to achieve our strategy.
Furthermore, Interbank continues building on the pillars of our corporate culture: leadership, horizontality and growth. They help us promote an environment of transparency, openness, and personal and professional development, especially in aspects such as data, digital and soft skills. Additionally, it aims for a balance between organizational agility and culture to generate more value in business and engagement in our teams.
Interbank is also focused on developing new capabilities in response to our digital transformation goals, by refreshing and upgrading the skills and abilities of its workforce, through programs such as Level Up. This program provides talent with training in new and different skills so they can be ready to have new and transformational roles in our group.
Interbank, Interseguro, Inteligo and Izipay continue their efforts to attract, develop and retain highly qualified personnel and to maintain a performance-based culture that emphasizes teamwork to keep a motivated workforce that delivers high-quality service and strong results.
Our Approach to Sustainability
Sustainability is key to how we conduct our business, and we recognize that sustainability is not only an engine for growth but also a differentiating attribute in our relationship with our stakeholders. The responsible management of sustainability matters is central to our culture and anchored on our purpose: “Building together financial well-being”.
We recognize the vital role we play in the transition to a more sustainable world. We also recognize the great opportunity to positively impact the climate in which we develop our activities. In this sense, to strengthen our business model and with a long-term view in mind, we seek to consolidate ourselves as an institution that incorporates responsible business practices into our operations and in our relationship with our stakeholders to promote the sustainable development of Peru. Sustainability is a
60
company-wide responsibility. Our vision and principles are put into practice in our daily operations and activities. Our sustainability strategy considers the major global challenges, macro trends, and our business goals.
We incorporate our sustainability vision into our management and culture, through a set of corporate policies and standards, ongoing management of social and environmental risks and opportunities, and active engagement with our various stakeholders. Thus, we are expanding our offering of financial solutions to support our customers making positive social and environmental impacts as well as supporting our customers in the transition to a less carbon-intensive economy. These solutions aim to serve individuals, entrepreneurs, and large corporations.
Our responsible business model
At IFS, our responsible business model is ingrained into our purpose of building together financial well-being. We believe that the well-being of our business aligns with that of our clients and community in general, and that the only way Peruvians will be able to truly develop is if they have a prosperous country, now and in the long-term.
We acknowledge the key role that the financial sector plays in the transition to a more sustainable economy, thus we incorporate environmental, social and governance criteria in the way we approach our business. Furthermore, we know that operating as a responsible business is a driver of growth and a differentiating attribute in our relationship with our stakeholders.
At IFS, each subsidiary is responsible for identifying sustainability-related opportunities and risks. Even though our sustainability strategy is embedded in each subsidiary’s daily operations, each of them operates independently while in coordination with the general guidelines issued by our Chief Sustainability Officer and Board of Directors.
Our Sustainability Policy, updated by the Board of Directors in 2024, includes the following principles: ethics and integrity, human rights, development and inclusion, service and innovation, environmental and climate commitment, and partnership and public engagement.
Pursuant to IFS’ Sustainability Policy, the Board of Directors supervises the application and implementation of such policy within each subsidiary. For such purposes, the following governance measures were put into place:
•
The Chief Sustainability Officer (CSO), appointed in March 2022, is responsible for overseeing the implementation of the sustainability strategy in coordination with all four subsidiaries to ensure their alignment with the Sustainability Policy, and the alignment with any with other related guidelines established by the IFS Board of Directors. The CSO presents the results of this strategy once a year to the Board of Directors.
•
One Sustainability Leader at each subsidiary is responsible for the management and implementation of the Sustainability Policy and guidelines in each of them with the permanent support of the Chief Sustainability Officer and the subsidiary`s Board of Directors, as well as IFS` Board of Directors.
•
An Executive Sustainability Committee, composed by IFS CEO and by each of the four CEOs, one per subsidiary, is responsible for deciding strategic priorities, allocating resources, assigning responsibilities and overseeing the implementation of initiatives at executive level.
Our 2024 sustainability journey
Environmental Dimension
We aim to identify both the direct and indirect impacts of our activities and proactively work to prevent, mitigate, and correct any adverse effects. Our main initiatives during 2024 focused on:
•
Strengthening our Sustainable Finance strategy: We kept building towards a strong sustainable finance strategy that focuses on our commercial clients' climate transition, by offering new financial instruments. As of December 31, 2024, our sustainable finance portfolio totals US$339 million, which includes green loans and sustainability linked loans, of which more than 51.8% represents sustainable agriculture activities and projects.
•
Reducing our carbon footprint: We aim to reduce our carbon emissions and have set Science-Based Targets (SBTi) for 2030 in our banking segment for Scope 1 and 2 emissions. We are also implementing initiatives to improve energy efficiency, water conservation, and waste management in order to achieve our decarbonization goals.
•
Initial steps in climate risk management: We conducted a qualitative assessment of climate-related risks, considering NGFS Climate Scenariosand focusing on credit risk. The credit risk analysis included a collection of sector and geographic exposure data, along with an in-depth review of the sectors to gauge the financial consequences of both physical and transition risks.
61
Finally, disclosure of climate change opportunities and risks is essential in our effort to be transparent with our stakeholders. Therefore, in 2024, we made significant progress by publishing our inaugural Climate Report, aligned with the Task Force on Climate-related Financial Disclosures (TCFD) recommendations.
Social
We aim to promote financial inclusion, advance gender equality, and support initiatives that reduce social disparities. Our main initiatives during 2024 focused on:
•
Fostering an Inclusive Workplace: We prioritized a diverse and inclusive work environment, promoting gender equality and implementing programs such as GoWomen, Inspira, and Sin Fronteras to empower employees from diverse backgrounds. Annually, we conduct sociodemographic diagnoses to inform our Diversity, Equity, and Inclusion (DEI) strategies.
•
Building towards Financial Inclusion: We expanded access to financial services through initiatives like IzipayYa, a free mobile payment app empowering over 1 million microentrepreneurs, and Vida Cash, an accessible life insurance product designed for the informal sector, requiring no paperwork or prior financial knowledge.
•
Leveraging Analytics for Sustainable Growth: We kept working through Interbank´s Analytics Center of Excellence (ACoE) to create the tools to understand the financial behavior of Peruvians, aiming to drive both financial inclusion and sustainable growth.
Governance
Our corporate governance dimension, guided by ESG principles and policies, enables our responsible business strategy. Our main initiatives during 2024 focused on:
•
Strong Corporate Governance: We approved a new Occupational Health and Safety policy, ensuring the well-being of our employees. Additionally, we updated our Sustainability Policy and revised the Corporate Governance Guidelines, all aligned with best practices and international standards. We believe these updates promote strong board composition, independence, and diversity, fostering a more sustainable and responsible organization.
•
Transparency and Accountability: We remained committed to transparency and accountability, reporting our sustainability performance according to international standards such as GRI, SASB, and TCFD.
Our commitment to sustainability has led to a significant improvement in our 2024 S&P Global’s Corporate Sustainability Assessment score, reaching 69, an increase of 8 points compared to 2023. This has led to our inclusion in the Dow Jones Sustainability MILA Index, recognizing us among the top 7 banks in Peru, Mexico, Chile, and Colombia.
Banking Segment
Overview
Interbank provides retail and commercial banking services to more than 5.5 million total customers as of December 31, 2024, which includes more than 5.0 million retail customers and approximately 100 thousand commercial clients. It is the third largest bank in Peru in terms of total assets and deposits, and the fourth largest in terms of loans, with market shares of 13.5%, 13.5% and 13.9%, respectively, as of December 31, 2024 according to the SBS. Interbank is focused on fast-growing and highly profitable retail banking businesses, such as credit card financing, payroll deduction loans to public employees and mortgages, as well as on increasing our commercial banking business, focused on Peruvian corporates and medium-size companies, where Interbank’s market share has increased to 10.9% as of December 31, 2024, compared to 9.6% as of the same date in 2023.
Given this focus, 52.5% of Interbank’s gross loans as of December 31, 2024 correspond to retail banking, compared to 39.4% for the Peruvian banking system, according to the SBS. Interbank is the second largest provider of consumer loans, the leading player among private banks in payroll deduction loans to public sector employees and the third largest bank in retail deposits in Peru. As part of its strategy, Interbank has one of the most convenient and extensive retail banking distribution networks in Peru which is currently present in 23 of Peru’s 25 regions. Interbank has one of the most convenient and extensive ATM network nationwide and one of the largest out of branch ATM networks in Peru. Interbank’s digital platform, including its mobile app, is regularly used by its customers, and as of December 31, 2024, 81.9% of our monthly active retail customers were engaged through digital channels and our ATM networks only.
62
The commercial banking line of business represents 47.5% of Interbank’s gross loans as of December 31, 2024. Interbank focuses on high margin and fee generating products such as leasing, structured finance, cash management, trade finance and factoring in its commercial lending business. These products and services are attractive not only for the financial margins they offer, but also for the fee income they generate. In addition, these products and services enhance customer loyalty and provide significant cross-selling opportunities.
For the years ended December 31, 2024, 2023 and 2022, Interbank’s net results were a net profit of S/1,007.4 (U.S.$267.6 million), S/856.1 million (U.S.$228.7 million) and S/1,374.1 million (U.S.$360.3 million), respectively. As of December 31, 2024, 2023 and 2022, Interbank had shareholders’ equity of S/8,872.9 (U.S.$2,357.3 million), S/8,056.7 million (U.S.$2,172.2 million) and S/7,478.8 million (U.S.$1,960.9 million), respectively. Interbank’s ROE and ROA for the year ended December 31, 2024 were 12.2% and 1.4%, respectively. Interbank’s ROE for the years ended December 31, 2023 and 2022 was 11.2% and 19.8%, respectively, and ROA for the years ended December 31, 2023 and 2022 was 1.3% and 2.0%, respectively.
Business Lines
Interbank has three business lines: (1) retail banking, (2) commercial banking and (3) treasury and institutional.
Retail Banking
Interbank’s retail banking business line provides a variety of financial products and services to individuals including retail loans and retail deposits. Interbank’s retail banking strategy consists of providing the best customer experience through convenient, agile and friendly service. Interbank’s key objectives include increasing its market share in its core products through acquiring new clients, increasing its share of wallet and cross-selling products to its existing customers. Interbank seeks to meet the financial service needs of Peru’s growing middle class. After some years of high risk volatility in retail banking, Interbank believes the retail banking sector presents significant opportunities for growth at reasonable risk.
As of December 31, 2024, retail loans represented 52.5% of Interbank’s total loan portfolio outstanding as compared to 39.4% for the Peruvian banking system under SBS GAAP. Furthermore, Interbank’s strategy also seeks to continue capturing low-cost funding through a stable and diversified deposit base. The following charts show Interbank’s and the Peruvian banking system’s retail gross loans breakdown according to the SBS as of December 31, 2024.
Source: SBS.
63
Retail Loans
Retail loans consist of consumer and mortgage loans. Interbank classifies its consumer loans into three categories: (1) credit cards and (2) payroll deduction and (3) personal loans.
Consumer Loans
(1)
Credit cards. Interbank offers its retail customers two major credit cards: VISA and American Express. Interbank has an exclusivity agreement with American Express for its Centurion line of credit cards in Peru. Interbank also offers credit cards with different value propositions catering to each customer segment.
Interbank launched its benefits hub in August 2024. Clients can now enjoy our entire value proposition in one place through the Interbank application. Interbank reached 77,000 active customers per day using this new development as of December 31, 2024. Another milestone was reached in November 2024, when Interbank doubled its market share for issued credit cards in Hiraoka, a major retail seller of electronics and technology in Peru, to 31% based on a commercial agreement.
In November 2019, the SBS issued SBS Resolution No. 5570-2019 which became effective in January 2021. This resolution establishes that the non-revolving financing portion of credit card loans must be presented for regulatory considerations as loans instead of credit card loans. Under SBS GAAP figures, this resulted in a significant reduction to Interbank’s credit card loan balances, market share and a change in its retail loans portfolio mix.
(2)
Payroll deduction loans. Payroll deduction loans to public sector employees such as police officers, teachers and army employees, Interbank ranks first among private banks in Peru in terms of payroll deduction loans to public sector employees, with a market share of 21.2% as of December 31, 2024 as compared to 21.7% as of December 31, 2023.
The risk of default under payroll deduction loans is low, because the employer deducts the loan payments from the employee’s salary and makes payments directly to Interbank. Additionally, these payroll deduction loans are legally required to be insured by an insurance company against the death and disability of the borrower. Interseguro provides substantially all of the insurance policies for these loans although customers are free to purchase insurance from other providers.
(3)Personal loans. Personal loans include cash loans, student loans, and collateralized cash loans. Cash loans have a term of up to 60 months and a grace period of up to two months. In addition, collateralized cash loans allow customers to include savings accounts or real estate as collateral, have a term of up to 60 months and a grace period of up to two months.
Mortgage Loans
Interbank offers fixed rate mortgage loans with a typical term of 20 years and a typical down payment of 10% denominated in either U.S. dollars or soles.
Interbank’s mortgage loans outstanding grew at a CAGR of 8.1% between December 31, 2020 and December 31, 2024 compared to a CAGR of 6.7% for the Peruvian banking system in the same period. Between December 31, 2023 and December 31, 2024, Interbank’s growth in mortgage loans outstanding was 7.5%, compared to 5.1% for the Peruvian banking system over the same period. For 2023, Interbank’s growth in mortgage loans outstanding was 5.9% with respect to 2022, as compared to 5.1% for the Peruvian banking system over the same period. For 2024, Interbank’s mortgage loan balances amounted to S/10.6 million, of which 95% were denominated in soles and the remaining 5% in U.S. dollars.
Interbank also provides residential construction loans to real estate developers. Although these loans are reported within the commercial banking portfolio, they are managed together with retail banking mortgages because of the synergies between the businesses. Financing real estate projects provides Interbank with an opportunity to market mortgage loans to home buyers.
In 2001, the Peruvian government launched the Nuevo Crédito Mivivienda program, a social initiative to promote the construction of low-income housing, of which Interbank is an active participant. During 2024, the Nuevo Crédito Mivivienda program disbursed 1,381 outstanding loans, mainly to develop multi-family buildings. The Nuevo Crédito Mivivienda program provides direct funding to match each loan underwritten by banks, as well as credit risk coverage for up to two-thirds of any realized loss. Furthermore, the program subsidizes part of the down payment to the end customer to promote real estate acquisition in the country. In addition, by the end of 2023 the Peruvian government launched the Credit Risk Coverage Service (Cobertura de Riesgo Crediticio – CRC), which allows banks to offer own funding home loans with the possibility to maintain credit risk coverage of up to two-thirds of any realized loss.
Retail Deposits
64
Interbank offers a wide range of sol, U.S. dollar and euro denominated transactional, savings and investment accounts through one of the largest distribution networks, as measured by total financial stores, ATMs and correspondent agents. These products satisfy key consumer needs and position Interbank as an attractive financial institution for retail customers.
Transactional accounts
Within retail deposits, Interbank offers transactional accounts with different interest rates, maintenance fees and options for accessing funds.
Cuenta Sueldo is a payroll account into which an employer may deposit an accountholder’s salary on a regular basis. These payroll accounts provide debit cards for employees and discounts at restaurants and retailers, among other benefits. Interbank offers these payroll account services to employers in conjunction with other commercial banking products, and also markets directly to employees.
Cuenta Simple is used by customers for their everyday banking needs and does not have a maintenance fee. Transactions are free of charge for up to a certain number of monthly transactions through physical channels. In addition, all transactions and transfers performed through online banking and other electronic devices are free of charge. This transactional account is of low cost for Interbank as most of the transactions are conducted through electronic channels. Customers are also able to receive incoming wire transfers in this account.
Savings accounts
Interbank offers savings accounts with a variety of interest rates, maintenance charges and options for alternative access channels, such as ATM cards, and free online and mobile access.
Cuenta Millonaria is Interbank’s flagship savings account, which may be denominated in soles or U.S. dollars. The Cuenta Millonaria account allows accountholders to participate in sweepstakes to win prizes such as apartments, cars, courses of studies, among other prizes. Cuenta Millonaria also offers an interest rate and free unlimited transactions through electronic channels.
Cuenta Super Tasa offers special interest rates based on clients’ account balances and free unlimited transactions through electronic channels.
Alcancía Virtual is a digitally-enabled feature of a transactional or payroll account in either soles or U.S. Dollars, which encourages Interbank’s customers to save. This virtual piggy bank allows customers to easily transfer or “swipe” in certain amounts from other accounts to their piggy bank, as well as to create up to 3 different categories in order to organize their savings. The funds allocated to the piggy bank are not subject to maintenance fees and benefit from higher rates than those applied to the associated transactional account. Amounts in customers’ piggy bank do not show as funds available for ATM withdrawals or for debit card purchases. As such, money deposited in piggy bank accounts improve Interbank’s funding base. Customers retain full flexibility to transfer any funds in their piggy bank account to their transactional accounts through mobile banking or online banking.
Investment accounts
Interbank offers time deposits, certificates of deposit (“CDs”) and CTS accounts denominated in soles, U.S. dollars, and euros (only for time deposits), to customers who may or may not have a checking or savings account with Interbank.
Interbank offers time deposits and CDs, with maturities ranging from 31 days to one year. Time deposits with maturities of 31 days or more may be opened with a minimum initial balance of S/2,000, U.S.$1,000, or EUR 1,000. Time deposits with maturities ranging from five years to 10 years are only offered in soles and can be opened with a minimum initial balance of S/50,000.
CTS accounts are severance accounts that employers must open for the benefit of their employees pursuant to Peruvian law. Employers must deposit into these accounts twice a year (in May and November) an amount equal to one half of an employee’s month salary. Employees may withdraw from their CTS account any amount exceeding the sum of such employee’s four months’ salary calculated based on the most recent monthly salary.
Commercial Banking
Interbank’s commercial banking is organized in three business units: (1) corporate; (2) medium-size businesses and (3) small businesses.
As of December 31, 2024, Interbank was the fourth largest bank in terms of commercial loans outstanding, with a total commercial loan portfolio amounting to S/23.2 billion, representing a 10.9% market share, while its past-due loan ratio stood at 2.0%, the lowest among the largest four banks in Peru.
65
The following charts show Interbank’s and the Peruvian banking system’s commercial gross loans breakdown according to the SBS as of December 31, 2024:
Source: SBS.
According to the SBS, in general terms, corporate loans are loans offered to companies with annual sales exceeding S/200.0 million in the previous two years; large loans are offered to companies with annual sales between S/20.0 million and S/200.0 million in the previous two years, medium loans are offered to companies with a total debt in the Peruvian financial system above S/300,000 in the last six months that cannot be classified as corporate or large companies; small size loans are offered to companies with a total debt in the Peruvian financial system between S/20,000 and S/300,000 in the last six months; micro-company loans are offered to companies with total debt in the Peruvian financial system no higher than S/20,000 in the last six months. Additionally, in 2024, the Impulso MyPeru program had a significant impact on financing medium-sized and small business banking. This programme was a government-backed initiative aimed at providing accessible loans to businesses that may face difficulties in obtaining traditional financing from commercial banks.
Corporate Banking
Interbank’s corporate banking unit is primarily responsible for providing services to companies with annual sales exceeding S/200.0 million or are part of a large economic group. Interbank’s corporate banking unit provides investment banking, structured finance and other sophisticated banking products to meet the needs of its target clients. Furthermore, Interbank focuses on developing a relationship with each client and promoting fee-related and low-risk products, such as supply chain financing, collections, transfers and foreign exchange services, all tailored to meet the particular requirements of each client.
Medium-Size Business Banking
Interbank’s medium-size business banking unit offers many of the same products as those of the corporate banking unit mainly to medium-size enterprises with annual sales between S/5.0 million and S/200.0 million. The unit primarily provides Interbank’s clients with working capital loans secured by accounts receivable and other products, including financing for medium and long-term investment programs. Medium-size businesses also constitute an important source of deposits.
Medium-size enterprises in Peru generally do not have access to financing through local or international capital markets or to term loans from foreign banks. Interbank expects to capitalize on the significant growth opportunities in this sector and to profit from the margins that it offers when taking into account the reasonable degree of risk involved. We believe that this sector can continue growing along with the Peruvian economy.
Small Business Banking
Interbank’s small business banking unit serves companies with annual sales between S/500,000 and S/5.0 million. Interbank offers working capital loans, fixed asset financing, revolving lines of credit and transactional accounts to small businesses. Interbank has invested in building an experienced team and developing a strong IT platform, with online and automated processes to better serve these customers.
66
Main Commercial Banking Products
Medium-Term Loans. Interbank offers term loans, which are loans with tenors over 1 year. These loans are usually collateralized with mortgages and/or other assets in order to secure the credit facility. Furthermore, Interbank earns structuring fees from these transactions.
Leasing. Interbank provides financial leasing including commercial real estate, vehicles, machinery and other goods. At the end of the term of a leasing agreement, the customer has the option to purchase the leased assets.
In recent years, the growth in Interbank’s leasing business has been driven by economic growth and related private sector investments. We expect this trend to continue in the future. Furthermore, Interbank is actively pursuing leasing and financing opportunities for machinery and equipment to grow its leasing business.
Cuenta Negocios. The only 100% digital current-account for businesses in the Peruvian market. This account can be opened by customers following a very simple process, with no physical documentation required. Cuenta Negocios is the principal client acquisition tool in Interbank’s commercial banking business. It also supports many other of Interbank’s products, such as factoring.
Cash management. Interbank offers products and services that strengthen its relationship with clients, build loyalty and reduce costs by using electronic channels and by increasing fee income. Services managed by this unit include collection services (automated trade bill collection), automated payments (payroll and payments to suppliers) and digital banking and cash management. Interbank earns fees from cash management services by charging its clients a fixed fee and a variable fee based on the volume and frequency of the transactions.
Trade finance. Interbank provides short-term loans for trade, funded with internal resources or with credit lines from foreign banks. In addition, the trade finance unit offers medium-term credit lines using funds granted by international commercial banks and foreign governmental institutions. The trade finance unit also earns fees by providing customers with letters of credit, international collection and foreign exchange services.
Interbank intends to take advantage of the growing importance of China in Peru’s foreign trade activities by facilitating trade and investment between the two countries. In 2007, Interbank established a commercial representative office in China in order to provide financial services to Peruvian and Chinese companies wishing to trade in either market.
Supply Chain Financing. Interbank’s electronic factoring products enable Interbank’s clients to pay in advance and at a discount to their suppliers. Interbank has a 100% digital-platform for the onboarding of new providers. New customers can also open a Cuenta Negocios during that same process.
Treasury and Institutional
The main activities of Interbank’s treasury and institutional business line include treasury and institutional banking, as well as securitization services through Internacional de Titulos Sociedad Titulizadora S.A. (“Intertítulos”).
Treasury
Interbank is an active participant in the money and foreign exchange trading markets in Peru. Its money market desk plays an active role in the sol and foreign currency short-term money markets. In addition, the money market desk participates in the auction of certificates of deposit issued by the Central Reserve Bank of Peru. Interbank’s proprietary trading activities focus on foreign exchange trading and short-term investments in securities, which primarily include certificates of deposit of the Central Reserve Bank of Peru, Peruvian global bonds and sovereign debt instruments.
Institutional Banking
Interbank’s institutional banking unit serves primarily non-profit public and private organizations, international entities, educational institutions, nongovernmental organizations and local financial institutions. As of December 31, 2024, the institutional banking unit had more than 760 clients, S/7.3billion in current account deposits and S/5.8 billion in time deposits, accounting for 17.3% of Interbank’s total deposits.
Interbank’s institutional banking unit is strategically important as it provides the bank with a stable and low-cost deposit base, as well as opportunities for fee income generation. Its clients require mainly transactional products, such as digital banking, collection services, automated payroll payment services and investment management. Interbank’s strategy is focused on building
67
customer loyalty with these clients by offering customized services at competitive rates and by providing high-quality customer service.
Securitization Services
In addition, Interbank provides securitization services through its wholly-owned subsidiary, Intertítulos, which is regulated by the SMV. Intertítulos, acting as a trustee, enables its clients to issue securities in order to obtain funds directly from financial markets.
Distribution Channels
Interbank has built and developed one of the best omni-channel platforms that combine physical and digital presence, serving over 5.4 million customers as well as non-customers across Peru.
In terms of physical presence, Interbank has developed a highly convenient network. As of December 31, 2024, Interbank had 149 financial stores and operated 1,750 ATMs, one of the largest ATM network in Peru and the largest out-of-branch ATM network. Interbank has the largest number of financial stores within retail locations in Peru. Interbank has 58 financial stores in the aggregate across Plaza Vea, Vivanda and shopping malls, as of December 31, 2024. Moreover, with the intention of offering greater convenience as well as providing underserved customers with greater access to financial services, Interbank operates a network of 7,501 correspondent agents (includes external network) as of December 31, 2024, known as Interbank Agente.
In terms of online channels, Interbank provides any customer or non-customer with the option to have a completely digital experience with the bank, from acquisition and onboarding to the use of its financial products. Its website has a strong commercial focus and manages the bank’s digital acquisition of new customers. Its online banking and mobile application give customers immediate access to its day-to-day transactions and after-sales services and uses those interactions to capture cross-sell opportunities. Furthermore, Interbank has developed other channels that serve specific segments or customer needs. For example, a separate website that serves customers under the Interbank Benefit loyalty program, and “Cuenta Sueldo” is a mobile application for payroll account customers that gives access to discounts and benefits.
The following table shows the number of monetary transactions of each distribution channel:
Number of transactions in December, in millions of soles
2020
2021
2022
2023
2024
CAGR 2020-2024
Financial stores
1.5
1.2
1.0
0.9
0.8
(14.6
%)
Off-branch
18.5
25.4
31.5
30.9
27.0
9.9
%
ATMs
5.6
6.0
7.0
6.4
5.4
(0.9
%)
Correspondent agents
3.4
4.0
3.6
2.9
2.2
(9.9
%)
Mobile banking
9.4
15.3
20.8
21.5
19.2
19.5
%
Other
0.1
0.1
0.1
0.1
0.2
12.2
%
Total
20.0
26.6
32.5
31.8
27.8
8.5
%
The following table shows the percentage of use of each distribution channel, reflecting a transition from the use of traditional channels (branches, ATMs and correspondent agents) to mobile banking:
In December, Percentage of total
2020
2021
2022
2023
2024
Financial stores
7.5
%
4.5
%
3.1
%
2.9
%
2.9
%
Off-branch
92.5
%
95.5
%
96.9
%
97.1
%
97.1
%
ATMs
28.1
%
22.6
%
21.5
%
20.3
%
19.5
%
Correspondent agents
16.9
%
14.9
%
11.1
%
9.0
%
8.0
%
Mobile banking
47.1
%
57.6
%
63.9
%
67.5
%
69.1
%
Other
0.5
%
0.4
%
0.3
%
0.3
%
0.6
%
Total general
100
%
100
%
100
%
100
%
100.0
%
Financial Stores
As of December 31, 2024, Interbank had 149 financial stores in Peru. After peaking 290 financial stores in 2016, the number of financial stores decreased mainly due to the success in transferring basic transactions from the stores to more efficient channels, the use of online banking and mobile applications, and process improvements. However, Interbank maintains the fifth largest network of financial stores among Peruvian banks, covering 23 of Peru’s 25 regions. A large number of the financial stores are located in convenient, high traffic areas, such as supermarkets and shopping malls, to maximize client coverage.
68
In May 2013, Interbank introduced “Imagine” financial stores, a concept jointly developed with IDEO, a design and innovation consulting firm. “Imagine” fosters a more pleasant and inviting environment to Interbank’s customers and is designed to educate customers on the use of electronic channels in order to migrate low value transactions to more efficient channels, while continuing to capture new customers and exploit cross-selling opportunities. Imagine has set new service standards in the industry and many of its elements have been adopted by Interbank’s main competitors.
In July 2020, Interbank introduced an evolution of the “Imagine” concept, “Xperience”. “Xperience” enables customer to perform digital transaction in stores and also reinforces the role of digital education. This concept was developed into two store models, “Express” and “Universal”. “Express” stores are located inside retailers and they are the first cashless stores, focused on education and new customer acquisition. “Universal” stores transform Interbank financial stores by creating a physical-digital area at the entrance of the store that is specifically dedicated to offer digital solutions to its customers and non-customers. These new stores have offered new and existing customers an assisted onboarding process onto its digital channels.
The following chart illustrates Interbank’s financial stores evolution according to the SBS.
ATMs
Interbank’s strategy is to offer its customers increased convenience.As of December 31, 2024, had one of the largest ATM network in Peru with 1,750 ATMs located across the country. This allowed Interbank to place ATMs in higher convenience locations, invest in renewing and updating its equipment, and continue to grow year over year in monetary transactions kept growing year-over-year in this channel. The reduction of the network in 2019, responds to Interbank’s decision to discontinue the operation of 359 coin-dispensing ATMs, migrating those transactions to more efficient channels like regular ATMs or correspondent agents.
As of December 31, 2024, 1,750 ATMs make up one of the largest out-of-branch networks in Peru, as reported by ASBANC. The ATM channel is one of the largest channels in Peru in terms of monetary transactions, with a 19% share and has advanced features, including cardless withdrawals, and the ability to receive cash deposits, bill and credit card payments in cash or via debit card, as well as disburse payroll advances. To offer this increased convenience in an efficient way, Interbank operates under the Global Net brand which is also a business line that provides ATM services to other financial institutions in Peru and acquires ATM transactions for all major global brands, including Visa, MasterCard, American Express, JCB, Union Pay, Diners and Discovery.
The following chart illustrates the evolution in number of Interbank’s ATMs according to ASBANC.
69
Correspondent Agents
This channel operates under the Interbank Agente brand and consists of providing traditional merchants, for example, warehouses, pharmacies, low-cost electronic terminals that allow customers to carry out basic cash transactions, such as withdrawals, deposits and utility bill payments. In order to accelerate and broaden geographic coverage, Interbank incorporated external correspondent agents, which currently represent 64% of the total correspondent agents, expanding its network from more than 5,698 as of December 31, 2022 to 7,501 as of December 31, 2024. We believe that Interbank’s focus on migrating low-value cash transactions from stores to more efficient channels contributed to have 2.2 million transactions in this channel.
The following chart illustrates the evolution of Interbank’s correspondent agents according to Interbank’s information.
Mobile Banking
Interbank has developed a robust digital ecosystem that allows its customers to fulfil their financial needs and goals with a 100% digital experience. Its objective is to provide a journey which does not require physical contact so that its clients do not need to physically visit a branch or contact the call center, unless the customer chooses to do so. Interbank offers digital banking to its new and existing customers through its website and its mobile application. In December 2024, Interbank had more than 3.5 million monthly active users and registered over 19.2 million monetary transactions as well as 201.5 million non-monetary transactions. Its mobile application was the highest rated in the Google Play Store among the four largest banks in Peru. In addition to its website and mobile banking channels, Interbank has also developed other digital solutions that address specific customer segments or needs such as Interbank Benefit, a loyalty program, and Cuenta Sueldo APP, where our payroll account customers can access special discounts and benefits. Furthermore, in 2019, Interbank launched Crédito por Convenio APP, which services Interbank’s public sector payroll deduction loan customers.
Interbank’s website provides general information about the bank and its products and services and has a commercial orientation, allowing non-customers to acquire credit cards and loans or open a savings or transactional account.
Interbank’s mobile banking is available to existing customers and its services include: (i) transactions: account balance and transaction inquiries, transfers between accounts to Interbank and other local and international banks, credit card, bills and loan payments, mutual fund investments and cardless ATM withdrawal requests; (ii) after-sales services: lock your card, enable or disable card usage online or abroad, turn on notifications for card usage, mobile transactions and/or ATM withdrawals and divide card transactions into installments; (iii) product cross-sell: credit cards, credit card line extension, pre-approved loans, savings accounts and insurance products; and (iv) personal financial management tools: view your credit score and tips to improve it, spending, creating a budget. Furthermore, as part of its strategy to enhance the digital experience and incentivize its customers to migrate to digital channels, Interbank has digital-only services, such as access to the loyalty program “Interbank Benefit”, the digital savings account “Piggy Bank”, the personal financial management tool Mis Finanzas and a personalized credit score based on customers’ financial behavior.
Increased monthly usage of digital solutions among customers is key to Interbank’s strategy as mobile banking customers interact monthly more than eight times the amount that branch customers do, have lower transactional costs and have a better net promoter score and churn indicators as of December 31, 2024.
Furthermore, in December 2024, 81.9% of Interbank’s retail customers that interacted with the bank through any channel were digital customers, that is, customers that also access Interbank’s services though internet and mobile banking, while monetary transactions in this channel decreased by 10.6%, mainly in the Interbank App, from December 2023 to December 2024.
70
Contact Center
Interbank seeks to prioritize the self-service of its clients, offering the help of service advisors 24/7 who can meet the needs of customers. Interbank’s strategy focuses on delivering first contact solutions, generating value in each contact.
Additionally, we seek to generate value in each touch point, with products and benefits to improve customers’ experience and thus their relationship with the bank. In May 2020, Interbank launched their service bot “AVI” offered through the WhatsApp platform. During 2024, Interbank focused on continuing to grow this channel, reaching 388,037 average monthly interactions, approximately 260,296 of which were self-assisted in December 2024, compared to 92,553 self-assisted interactions in December 2023.
Interbank has a state-of-the-art contact center, which managed an average of over 595,275 assisted interactions per month in 2024, answering inquiries from clients, offering assistance and information, and selling new products to customers. Interbank has a dedicated telephone sales force of 210 employees as of December 31, 2024, which sells credit cards and short loans. The dedicated sales force is a key resource for customer acquisition and for Interbank’s up-selling and cross-selling campaigns.
Special provisions as a result of social unrest and climate phenomenon
On December 7, 2022, Peruvian former President Pedro Castillo announced his intention to dissolve the Peruvian Congress and to intervene in, among others, the Peruvian judicial branch and Superior Court. Mr. Castillo’s actions were deemed to constitute an attempted coup, which led to his impeachment and arrest. According to the Peruvian Constitution, Mr. Castillo was succeeded by his then vice-president, Dina Boluarte. Following Mr. Castillo’s impeachment, a wave of protests in support of Mr. Castillo erupted across the country, which led President Boluarte to declare a state of emergency across several regions in Peru on December 12, 2022. Protests continued until March 2023.
In that context, the SBS approved a series of measures to reschedule retail loans that had been affected by the protests and social unrest in Peru, similar to those implemented to minimize the impact of the COVID-19 pandemic. Pursuant to Oficio Multiple N° 54961-2022, issued on December 22, 2022, the SBS established exceptional measures applicable to retail loans, allowing financial institutions to amend contractual conditions without characterizing them as refinanced loans as long as the amended loan complied with certain loan characteristics.
Additionally, through Oficio Múltiple N° 11235-2023, issued on March 10, 2023, the SBS established exceptional measures applicable to credit card loans, allowing these to be subject to the provisions set forth in Oficio Multiple N° 54961-2022, Oficio Múltiple N° 03583-2023 and Oficio Múltiple N° 09702-2023, subject to certain conditions. Pursuant to these provisions, financial institutions were also allowed to offer extensions or grace periods as alternatives for minimum payments on credit card loans. The aforementioned rules were repealed in April 2023 by Oficio Multiple N° 17305-2023, but did not affect loans that had already been rescheduled thereunder.
Lastly, the excess liquidity generated by measures during 2024, such as the withdrawal of CTS deposits and pension funds, has led to an improvement in the risk rating scoring (“BURO”), which has affected the regular behavior and performance of expected credit losses in the retail client segment. Under these circumstances, it has been necessary to enhance the monitoring of the expected loss model outcomes and to record subsequent adjustments to the calculations. These adjustments aim to neutralize the temporary improvements in credit scoring and ensure a more accurate risk estimation, considering the current uncertainty in loan performance.
Information Technology Unit
Interbank invests in new technology and the maintenance of its existing equipment and infrastructure aiming to improve the value proposition to its customers, increase its efficiency and support business growth. The Information Technology Unit focuses on assuring 24-hour service availability, enhancing the timeliness of data processing, guaranteeing data protection and anti-fraud security, updating and maintaining hardware platforms and software systems, developing contingency plans and implementing technology projects aligned with the business strategy. Interbank’s IT system processes credit cards, savings accounts, personal and commercial loans, and electronic transactions such as peer to peer and QR Code payments.
To comply with business and regulatory requirements, Interbank has strengthened its IT governance model by incorporating best practices for IT quality assurance, risk evaluation, project management and dividing responsibilities within the teams that operate the technology and the teams that develop new solutions. It has also strengthened its business continuity program through increased redundancy programs and upgraded hardware and software components. This model includes establishing operating partnerships with various leading word-class IT vendors.
71
The increase in transactions served by Interbank has been steady, with a 56% increment observed when comparing transactions in December 2024 against transactions in December 2023. Interbank continued making significant investments to upgrade its data centers and central technology platforms to provide a stable and secure environment for Interbank’s growing operations, a better understanding of cost drivers, and improve its processes. In December 2024, Interbank renewed the data center outsourcing contract with Kyndryl for a 5 year period.
During 2024, Interbank piloted programs aimed at incorporating AI Tools into its software development and IT operations processes, with the objective of generating efficiencies, minimizing risks and improving time to market through automation. Practices like DevSecOps and Platform Engineering are being adopted by the software development teams.
Interbank’s IT strategy is focused on projects and platforms that add tangible value to the customer and help accelerate the bank’s digital transformation. This includes customer-facing applications that provide a seamless digital experience to internal and external customers through all its channels. Interbank also invests in back-end and core applications to keep them up to date.
Our IT investments are aimed at deepening the understanding of the customer to achieve service levels that exceed their expectations, providing solutions to their needs and enabling a commercial platform with contextual and real time offerings. To provide this, and foster a data-driven culture, Interbank has invested in making governed data available and developing AI capabilities as well as monitoring and enhancing the decision-making process across different business units.
Interbank IT unit fully utilizes the new technologies that allow the flexibility, scalability and availability required to fulfill customer demands. APIs, micro services and multicloud environments have been implemented since 2018 to reach these objectives. A close relationship with fintechs also helps Interbank to leverage some capabilities and creates opportunities to learn about the way to approach different solutions. Our operation model based on an agile framework allow us to adopt a hybrid model where technology teams can work remotely or on bank’s premises achieving optimal levels of effectiveness and efficiency. This hybrid model combines remote work with in-person spaces to ensure proper alignment and team integration and will continue throughout 2025, allowing also to incorporate international talent into the teams.
Insurance Segment
Overview
Interseguro is an insurance company that caters to Peru’s growing middle class and is focused on annuities and life insurance, which is the fastest growing insurance market segment in Peru, driven by individuals seeking life protection with savings options. Interseguro has been the leader in the Peruvian annuities (excluding private annuities) segment since 2010, with market shares in terms of premiums of 30.5% and 27.9% for the years ended December 31, 2024 and 2023, respectively.
For the four-year period ended December 31, 2024, Interseguro’s ROE averaged 21.8% compared to 17.1% for the Peruvian insurance industry. For the year ended December 31, 2024, Interseguro’s premiums increased 18.2% as compared to 2023, according to the SBS, related to higher sales as a result of a growing market in private annuities, individual life and retail insurance products. As of December 31, 2024, Interseguro was the fifth largest consolidated insurance company in Peru. In addition, in terms of the size of its portfolio, Interseguro was the second largest insurance company in Peru as of December 31, 2024.
Interseguro intends to leverage its leading position in annuities, as well as Intercorp Peru’s and Interbank’s retail distribution capacity, and its own sales force, particularly those specializing in life insurance products, to continue capturing growth opportunities in the insurance industry. In addition, Interseguro expects to continue developing new products to satisfy increasing demand for insurance products by middle class families in Peru.
Interseguro offers a range of annuity products:
•
Retirement annuities: offered to members of the Peruvian private pension system who choose to convert their pension personal account into an annuity provided by a life insurance company.
•
Disability annuities: available to members of the Peruvian private pension system who have been declared permanently or partially disabled.
•
Survivorship annuities: offered to beneficiaries of deceased members of the system.
While the demand for these three types of annuities has slowed in recent years, growing by 5% in 2024, Interseguro has also introduced private annuities. These are sold to any owner of private funds and are not restricted to members of the pension system and their accumulated capital. In 2024, the demand for this type of annuities grew by 109%, increasing our market share from 11% in 2023 to 14% in 2024.
72
Beyond annuities, Interseguro offers traditional life insurance products, which are sold through both, commercial agents and digitally. These products have experienced double-digit growth on average over the past five years, driven by low insurance penetration in Peru. This growth has led to an increase of market share from 10.3% to 16.7%.
Moreover, Interseguro offers products in alliance with Interbank, which aim to address contextual needs of their current clients, such as credit card protection and credit life insurance. Furthermore, Interseguro offers low-cost premium retail insurance products, mainly sold through digital channels, including SOAT, car insurance and travel insurance.
For the years ended December 31, 2024, and 2023, Interseguro’s net results were net profit of S/201.9 (U.S.$53.6 million) and S/292.1 million (U.S.$78.7 million), respectively. As of December 31, 2024 and 2023, Interseguro had shareholders’ equity of S/557.6 million (U.S.$148.1 million) and S/438.1 million (U.S.$115.2 million), respectively. Interseguro’s ROE for the years ended December 31, 2024 and 2023 was 41.6% and 86.2%, respectively, while ROA was 1.3% and 2.0%, respectively.
For the years ended December 31, 2024 and 2023, Interseguro’s net profit under SBS GAAP were S/376.3 million and S/315.1 million, respectively. The increase in Interseguro’s net profit under SBS GAAP for the year ended December 31, 2024 as compared to 2023 was primarily a result of S/206.8 million increase in gross premiums. According to the SBS, as of December 31, 2024, Interseguro had shareholders’ equity of S/1,425 million as compared to S/1,338 million for 2023. Interseguro’s ROE under SBS GAAP for the year ended December 31, 2024 was 27.9%, as compared to 25.6% for the year ended December 31, 2023.
Interseguro’s Business Lines
Interseguro has three business lines: (1) annuities, (2) retail insurance and (3) individual life.
The following chart shows Interseguro’s and the Peruvian insurance system’s breakdown by life insurance premiums plus collections according to the SBS as of December 31, 2024:
Interseguro
Source: SBS.
73
Insurance system
Source: SBS.
The following chart shows Interseguro’s gross premiums and collections, according to the SBS for the periods indicated.
Gross Premiums and collections (S/ in Millions)
Source: SBS.
(1)
Excluding gross premiums from disability and survivorship.
74
Annuities
An annuity is a type of insurance policy that, in exchange for an initial lump sum payment, provides regular monthly payments. Interseguro offers three types of annuities by currency: soles, U.S. dollars and soles indexed to CPI, adjusted by 2% per year.
There are also two groups of annuities: (i) Regular Retirement Annuities are the annuities sold under the Peruvian private pension system, and (ii) Private Annuities which include the Renta Privada product. In Peru, employees may choose to deposit their cumulative contributions in the public or the private pension system. Under the private pension system, upon retirement, a retiree has the option of converting the capital accumulated into a personal account maintained with an AFP, collecting 95.5% of their accumulated capital or converting the capital into an annuity offered by an insurance company, such as Interseguro.
In 2016, following the enactment of Law No. 30425, retirees are allowed to withdraw up to 95.5% of their accumulated capital in cash upon retirement. As a result, there was a significant reduction of annuities sold by Peruvian insurance companies, including Interseguro. In order to maintain the leadership in annuities, Interseguro launched Private Annuities. This product allows retirees to receive a fixed income either for life or temporarily. Interseguro was the first insurance company to introduce this type of product to the market in response to the new law. As of the date of this Annual Report on Form 20-F, most of the clients of Private Annuities and their funds originate from retirees that choose to withdraw the 95.5% of their pension funds.
In addition to Regular Retirement Annuities and Private Annuities, Interseguro also offers disability annuities to members of the Peruvian private pension system who have been declared permanently or partially disabled before reaching retirement age and thus unable to access a sufficient pension and survivorship annuities for beneficiaries of deceased members of the system.
The following table shows Interseguro’s Annuity Gross Premiums by type from 2020 to 2024.
Annuities Gross Premiums (S/ in Millions)
Source: Company information.
Interseguro’s annuities products include:
Regular Retirement Annuities
Retirement. The retirement annuity product is directed to members of the Peruvian private pension system who are 65 years of age or older and retiring, although the Peruvian Law allows some exceptions for early retirement. This product represented 0.5% of annuities sold by Interseguro for the year ended December 31, 2024 as compared to 0.4% for the year ended December 31, 2023 and 0.3% for the year ended December 31, 2022.
75
Private Annuities
Private Annuities. The Private Annuities product was launched in 2016 allowing the recovery of Interseguro’s premiums and collections from the effects of the Law No. 30425, enacted in 2016. This product can be sold to any owner of private funds and is not restricted to members of the system and their accumulated capital. The annuity can have any duration and the lump sum invested can be partially or totally repaid at the end of the annuity, if it has one. As of the date of this Annual Report on Form 20-F, most of the clients and their funds come from retirees that chose to withdraw 95.5% of their accumulated capital. Private Annuities represented 48.7% of annuities sold by Interseguro for the year ended December 31, 2024 as compared to 32.4% and 26.9% for the years ended December 31, 2023 and 2022, respectively.
Disability and Survivorship Annuities
Disability and Survivorship. Under Peruvian law there is a mandatory insurance coverage for all members of the pension system paid monthly in addition to their contribution. In case a member has been declared permanently or partially disabled, or deceased while having legal beneficiaries, this insurance completes the accumulated capital as if the individual had worked until retirement age, allowing a better pension when applying for the retirement. While this insurance is not an annuity, it is closely related to the one we describe next. Disability and survivorship represented 1.2% of annuities sold by Interseguro for the year ended December 31, 2024 as compared to 1.6% and 1.3% for the years ended December 31, 2023 and 2022, respectively.
The SBS conducts a Dutch auction every two years inviting insurance companies to bid to determine which insurance company will be the provider for this insurance in a two-year period. Interseguro was successful in the 2015 auction, and as a result of the merger with Seguros Sura, they were also a provider for 2017. After some years of unsuccesful participation in the auction, Interseguro was awarded a fraction of the contract in 2024 for a two-year period.
Disability and Survivorship Annuities. The disability and survivorship annuity product is offered to members of the Peruvian private pension system who have been declared permanently or partially disabled and to beneficiaries of deceased members of the Peruvian private pension system. This annuity is offered in conjunction with the disability and survivorship mandatory insurance. Disability and survivorship annuity products accounted for 49.5% annuities sold by Interseguro for the year period ended December 31, 2024 as compared to 65.6% and 71.5% for the years ended December 31, 2023 and 2022, respectively.
All retirement annuities sold under the Peruvian private pension system offer monthly payments for the life of the policyholder and thus the initial lump sum is never recovered. A retiree’s joint choice of an insurance company, currency denomination and retirement modality is irrevocable.
Product differentiation is limited in the Peruvian annuities sector, as product features are regulated by the SBS. The market position of each insurance company is driven instead by its sales strategy and quality of service. Interseguro’s sales strategy, consisting of providing ongoing sales force training, and implementing innovative control and management mechanisms, has permitted Interseguro to be the market leader in the annuities sector.
For the year ended December 31, 2024, Interseguro’s market share by annuity premiums (including Private Annuities and excluding Previsional Insurance) was 18.9%, nearly 251 basis points higher than its next competitor’s market share.
Retail Insurance
Interseguro offers simple, low-cost premium products targeted to middle class families and sold mainly through Interbank financial stores, as well as digital channels. In 2016, Interseguro expanded its retail insurance portfolio with an online sale for the launch of the digital SOAT and in 2018, with travel insurance and vehicle insurance.
Interseguro offers the following retail insurance products:
Credit Life Insurance. The credit life insurance product protects against death or disability of the insured and is designed to pay the debt owed by a customer to the financial institution. This product is available for mortgages, credit cards and personal loans. Credit life insurance represented 64.5% of total retail insurance premiums assumed by Interseguro for the year ended December 31, 2024 as compared to 59.7% and 57.6% for the years ended December 31, 2023 and 2022, respectively.
Debit and Credit Card Protection Insurance. The debit and credit card protection insurance product protects the insured against financial loss, medical expenses for hospitalization or accidental death as a result of theft, assault and abduction. Debit and credit card protection insurance represented 14.8% of total retail insurance premiums assumed by Interseguro for the year ended December 31, 2024 as compared to 15.2% and 6.7% for the years ended December 31, 2023 and 2022, respectively.
76
SOAT (Seguro Obligatorio de Accidentes de Tránsito). The SOAT product protects against the risk of death or injury to occupants and third parties involved in an automobile accident. The SOAT product is mandatory, and coverage is limited to cover personal injury, excluding any physical damage to the vehicle. The SOAT product accounted for 13.7% of total retail insurance premiums assumed by Interseguro for the year ended December 31, 2024 as compared to 14.3% and 14.4% for the years ended December 31, 2023 and 2022, respectively.
Vehicle Insurance. The vehicle insurance coverage includes damage to vehicles due to traffic accidents, total loss, theft, fire, nature risks, strikes or vandalism and civil liability for occupants and third parties. Occupants’ damages such as permanent disability, healing expenses, funeral expenses and death are also covered. In addition, this insurance includes replacement drivers, cranes and mechanical assistance, among others. Vehicle Insurance represented 2.4%, 3.7% and 5.2% of total retail insurance premiums assumed by Interseguro for the years ended December 31, 2024, 2023 and 2022, respectively.
Loan Protection Insurance. The loan protection insurance covers a specific number of payments of a loan in case the insured loses his job. Loan protection insurance accounted for 0.8% of total retail insurance premiums assumed by Interseguro for the year ended December 31, 2024 as compared to 3.1% and 4.8% for the years ended December 31, 2023 and 2022, respectively.
Others. The other products category protects against personal accidents. Other products accounted for 3.9% of total retail insurance premiums assumed by Interseguro for the year ended December 31, 2024 as compared to 4.0% and 10.2% for the years ended December 31, 2023 and 2022, respectively.
Individual Life
Although the individual life insurance market remains relatively small in Peru, the market has grown at a CAGR of 13.8% between December 31, 2020, and December 31, 2024. For the year ended December 31, 2024, the individual life insurance market increased 25.3% as compared to 2023, primarily due to an aggressive growth of the three leading companies (with Interseguro being third) by S/377 million.
Interseguro offers a variety of individual life insurance products, providing a wide range of coverage for the length of a policyholder’s life. Most of Interseguro’s products also provide savings features.
Interseguro’s strategy in individual life insurance consists in adapting its products to the emerging Peruvian middle class, developing a highly trained sales force, achieving high standards of sales efficiency and leveraging digitalization to increase sales of life insurance (in 2024, digital sales accounted for 22% of total life insurance sales). For the year ended December 31, 2024, Interseguro positioned itself as the third largest participant in the individual life insurance market, with a 16.7% market share by individual life premiums, according to the SBS.
Sales Force
Interseguro markets its annuities and individual life insurance products through its own dedicated sales force both in Lima and across Peru’s provinces, without a third-party intermediary. Prior to the pandemic, sales in annuities and life insurance products were only conducted in-person, but digitalization of these sales was accelerated.
In annuities, Interseguro employed 95 agents, 46 in Lima and 49 outside of Lima as of December 31, 2024. Each salesperson receives training through a multiple-level program, which includes training in macroeconomic background, financial statement analysis, investment policy, marketing techniques and time management. In addition, Interseguro’s annuity sales agents specialize in the sale of different types of annuity products. As a result, Interseguro’s sales force is trained to satisfy each customer’s needs.
In life insurance, Interseguro employed 695 agents, 470 agents in Lima and 225 agents outside of Lima, as of December 31, 2024. We believe that training develops effective sales techniques and the skills to assess customer needs, which we believe is one of Interseguro’s critical competitive advantages. Interseguro has a specialized team focused on setting a training curriculum for each salesperson in the first three years with the company as well as in assigning a mentor to each new recruit.
As of December 31, 2024, Interseguro works with five brokers nationwide to offer SOAT. Interseguro also works with insurance brokers to sell SOAT to increase coverage in Peru with limited capital investment. As of December 31, 2024, the brokerage channel accounts for approximately 9.3% of Interseguro’s total SOAT sales.
Strategic Partners
Interseguro offers its retail insurance, such as credit life insurance, debit and credit card protection insurance, loan protection insurance and SOAT through non-traditional channels, including partnerships with Interbank and Intercorp Retail.
77
Through its partner companies, Interseguro reaches a large number of customers, offering a convenient and reliable payment mechanism. This distribution network represents one of Interseguro’s strongest competitive advantages, as it allows for a broad insurance product offering, mainly through 145 financial stores belonging to Interbank.
As of December 31, 2024, Interseguro's retail insurance premiums sold by strategic partners account for 80.3% of total retail sales:
Strategic Partners
Retail insurance premiums breakdown
Interbank
79.9%
Intercorp Retail (Plaza Vea and Oeschle)
0.4%
Investments and Investment Management
Investment Portfolio
Interseguro invests the insurance premiums yet to be paid out in claims in its investment portfolio, based on a policy of capital conservation and adequate diversification.
The main objective of Interseguro’s investment portfolio is to cover its future payment obligations, associated mainly with its annuities business, and, to a lesser extent, its life business. Interseguro maintains a conservative asset liability management approach, matching its obligations by currency and maturity. Interseguro’s portfolio focuses on investment grade fixed-income instruments in U.S. dollars, soles and inflation linked notes, mitigating interest rate, inflation, and currency risks. Interseguro’s obligations consist of technical obligations related to annuities that are sold at a fixed interest rate, thus Interseguro prioritizes the investments on fixed income securities that hedge such obligations. Based on Interseguro’s investment strategy, its portfolio shows asset sufficiency to cover insurance liabilities at a currency, duration, inflation and interest rate levels that hedge against volatility in these factors.
Given that the Peruvian market offers a limited range of long-term investment instruments, Interseguro has sought to increase its investments outside of Peru and explore alternative investments in the local market, such as real estate projects.
Interseguro is required to comply with the following investment management principles according to the SBS:
•
Security Principle. Based on the protection and preservation of the economic value of assets over time.
•
Liquidity Principle. Consist of the availability of an asset to be converted into cash at the required time and without significantly affecting its value.
•
Diversification Principle. Based on the set of assets that contribute to the diversification of the risk factors of the portfolio and reduction of the potential impact of adverse effects.
•
Parity Principle. Parity between the characteristics of the asset and the obligations that it supports. These features include the term or horizon, the degree of liquidity or enforceability, currency, volatility in valuation, predictability and timing of flows, among others.
•
Profitability Principle. Based on generation of returns that would cover at least the commitments offered to policyholders.
Additionally, as established by the investment regulation of insurance companies, Interseguro must meet its technical obligations. As part of the coverage of the technical obligation proceeds, Interseguro must follow the investment management principles established in the regulation and comply with the eligibility requirements of its investments by type of assets.
Regarding the investment eligibility, to consider an asset as eligible, it must not be affected or be subject to any precautionary measure. The custody agreements of the eligible investment must not contain any clause that allows use of such assets as collateral to back other company obligations and that there are no other measures that limit the free transfer of the assets. Furthermore, eligible investments must comply with certain investment limits, by issuer, economic group, asset and foreign issuers. In addition, assets rated in categories below the investment grade cannot be considered as an eligible investment.
78
Interseguro’s investment management complies with the limits and requirements indicated in the regulation in order to minimize non-eligible investments and comply with the coverage of its technical reserves, minimum solvency capital required and guaranty fund.
As of December 31, 2024, Interseguro’s investments amounted to S/15,026.5 million, of which S/12,286.2 million and S/818.5 million were fixed income securities, and equity securities and fund investments, respectively, as compared to S/14,051.4 million, of which S/12,018.2 million and S/735.0 million were fixed income securities, and equity securities and fund investments, respectively, in 2023. As of December 31, 2024, investments in real estate projects were S/1,381.8 million (approximately U.S.$367.2 million) as compared to S/1,298.2 million (approximately U.S.$350.5 million) for 2023.
The following tables present a breakdown of Interseguro’s investment portfolio by type of investment as of the dates indicated.
Investments by Type
Book Value as of December 31,
2024
2023
2022
S/ in millions
%
S/ in millions
%
S/ in millions
%
Fixed Income
12,826.2
85.4
%
12,018.2
85.5
%
10,544.5
83.8
%
Corporate Bonds
5,613.7
37.4
%
4,926.7
35.1
%
4,327.2
34.4
%
Peruvian Sovereign Bonds
4,013.9
26.7
%
3,785.7
26.9
%
3,126.2
24.8
%
Foreign Bonds
3,198.5
21.3
%
3,305.8
23.5
%
3,091.1
24.6
%
Equity and Funds
818.5
5.4
%
735.0
5.2
%
750.5
6.0
%
Equity
572.8
3.8
%
611.9
4.4
%
670.9
5.3
%
Funds
245.7
1.6
%
123.1
0.9
%
79.6
0.6
%
Real Estate
1,381.8
9.2
%
1,298,2
9.2
%
1,287.7
10.2
%
Total
15,026.5
100.0
%
14,051.4
100.0
%
12,582.8
100.0
%
The following tables present a breakdown of Interseguro’s investment portfolio by currency as of the dates indicated.
Investments by Currency
Book Value as of December 31,
2024
2023
2022
Portfolio
S/ in millions
%
S/ in millions
%
S/ in millions
%
Sol(1)
10,488.6
69.5
%
9,592.0
68.3
%
8,542.6
67.9
%
U.S. dollar
4,577.9
30.5
%
4,459.3
31.7
%
4,040.2
32.1
%
Total
15,026.5
100.0
%
14,051.3
100.0
%
12,582.8
100.0
%
(1)
Real estate investments are measured in soles.
The following tables present a breakdown of Interseguro’s investment portfolio by rating as of the dates indicated.
79
Investments by Rating(1)
As of December 31,
2024
2023
2022
(S/ in millions)
%
(S/ in millions)
%
(S/ in millions)
%
AAA
934.4
23.9
%
931.7
28.5
%
836.9
27.1
%
AA+ to AA-
2,848.6
73.0
%
2,238.9
68.4
%
2,221.0
72.0
%
A+ to A-
120.7
3.1
%
102.0
3.1
%
25.7
0.8
%
Total Local Ratings
3,903.8
100.0
3,272.6
100.0
3,040.6
100.0
AAA
0.0
0.0
%
0.0
0.0
%
0.0
0.0
%
AA+ to AA-
31.3
0.3
%
25.5
0.3
%
26.4
0.4
%
A+ to A-
509.1
4.7
%
507.2
5.8
%
477.3
6.4
%
BBB+
739.4
6.8
%
2,758.2
31.5
%
2,383.4
31.9
%
BBB
5,498.1
50.5
%
2,896.9
33.1
%
2,710.0
36.3
%
BBB-
3,420.7
31.4
%
1,798.9
20.6
%
1,252.4
16.8
%
BB+
0.0
0.0
%
454.9
5.2
%
262.0
3.5
%
BB
595.0
5.5
%
0.0
0.0
%
0.0
0.0
%
BB-
101.0
0.9
%
94.6
1.1
%
349.5
4.7
%
B
0.0
0.0
%
209.2
2.4
%
0.0
0.0
%
CCC+
0.0
0.0
%
0.0
0.0
%
0.0
0.0
%
Total Foreign Rating
10,894.7
100.0
8,745.4
100.0
7,461.0
100.0
(1)
Includes only credit rated fixed-income investments.
In regards to fixed income, Interseguro prioritizes the investment in local bonds and foreign bonds with a higher risk rating of AA- and BBB-, respectively.
The following table presents a breakdown of Interseguro’s investment portfolio by maturity as of the dates indicated.
Investments by Maturity
Book Value as of December 31,
2024
2023
2022
S/ in millions
S/ in millions
S/ in millions
Maturity
0-5 years
1,168.4
690.6
467.6
6-10 years
4,073.2
2,030.8
1,264.0
11-20 years
6,409.6
6,076.8
5,445.1
21+ years
2,971.8
3,220.0
3,367.9
No maturity(1)
2,345.3
2,033.2
2,038.2
Total
16,968.3
14,051.3
12,582.8
(1)
Real-estate and equity investments.
Fixed-Income
In regards to fixed income, Interseguro prioritizes the investment in local bonds and foreign bonds with a risk rating higher than AA- and BBB-, respectively.
As of December 31, 2024, Interseguro’s fixed-income investments represented 85.4% of its total portfolio, of which 37.4% were corporate bonds, 26.7% were Peruvian sovereign bonds, and 21.3% were foreign bonds. As of December 31, 2023, Interseguro’s fixed-income investments represented 85.5% of its total portfolio, of which 35.1% were corporate bonds, 26.9% were Peruvian sovereign bonds, and 23.5% were foreign bonds. As of December 31, 2022, Interseguro’s fixed-income investments represented 83.8% of its total portfolio, of which 38.4% were corporate bonds, 24.8% were Peruvian sovereign bonds, and 20.5% were foreign bonds.
80
As of December 31, 2024, 100% of bonds with local ratings and 89.4% of bonds with international ratings had investment grade status.
Equity and Funds
Substantially all of Interseguro’s equity and funds portfolio is invested in companies with low beta and relatively stable and predictable cash flows. Interseguro’s equity and funds portfolio is invested across Latin America and the United States. As of December 31, 2024, Interseguro’s equity and funds portfolio represented 5.4% of its total portfolio, of which 59% was invested in foreign securities and 41% in local securities. As of December 31, 2023, Interseguro’s equity and funds portfolio represented 5.2% and of its total portfolio, of which 64% was invested in foreign securities and 36% in local securities. As of December 31, 2022, Interseguro’s equity and funds portfolio represented 6.0% and of its total portfolio, of which 63.3% was invested in foreign securities and 36.7% in local securities.
Real Estate
Interseguro’s investments in real estate are made across the different types of properties: office, industrial, retail and land for development. Real estate income derives from the appreciation of real estate property and from rental income from its tenants. Interseguro’s rental income comes primarily from Orquídeas (offices building) and Tabacalera (industrial asset). Tabacalera is an industrial property leased to Teleatento Peru S.A.C, which is a company dedicated to call centers. As of December 31, 2024, Interseguro’s investments in real estate projects represented 9.2% of its total portfolio, as compared to 9.2% and 10.2% for the years ended December 31, 2023 and 2022, respectively.
Reinsurance
Interseguro transfers risks to reinsurers in order to limit its maximum aggregate potential loss and minimize exposures on large particular individual risks. Reinsurance is placed with reinsurance companies based on its reinsurance policy, which is annually approved by Interseguro’s board of directors and its risk committee. Interseguro’s main reinsurers are four international reinsurance companies: Scor Global Life, Munich Re, Gen Re and Hannover.
Premiums ceded to reinsurers represented 2.3%, 1.6% and 1.3% of Interseguro’s premiums assumed for the years ended December 31, 2024, 2023 and 2022, respectively (these percentages do not include the reinsurance for the pension-related insurance (disability and survivorship)).
Interseguro also has catastrophe reinsurance that covers individual and group life insurance products, except annuities. These contracts are intended to limit Interseguro’s risk exposure in the event of low-probability but high-cost events, such as natural or man-made disasters.
Information Technology Unit
Interseguro’s IT unit is responsible for managing its technology infrastructure, telecommunications network and computer systems. The unit is also responsible for designing and implementing in-house solutions or third-party technological developments to support Interseguro’s operation.
Interseguro has undertaken investments in technology with the aim of providing a modern, stable and secure platform to support its rapidly expanding business and creating new capacities in data, analytics and artificial intelligence. In line with this, Interseguro completed the migration of all its systems to MS Cloud in 2024. Interseguro invested approximately S/1.6 million in projects for the year ended December 31, 2024 and approximately S/1.9 million and S/1.5 million in projects for each of the years ended December 31, 2023 and 2022, respectively. Interseguro plans to invest approximately S/45.0 million over the next three years in technology.
As a result of the COVID-19 pandemic, cybersecurity risks have increased primarily due to implementation of remote work policies. In response, Interseguro has implemented additional cybersecurity measures to prevent, detect, and respond to these enhanced cybersecurity risks. These measures focus primarily on the improvement of access management processes within the company, implementation of processes to supervise access to the company’s systems, implementation and updates of the company’s information security policies and procedures, and evaluation of new threats in cybersecurity.
Wealth Management Segment
Overview
Inteligo is a provider of wealth management services through Inteligo Bank, brokerage services through Inteligo SAB and mutual funds management services through Interfondos. Inteligo Bank primarily focuses on individuals with investable assets in
81
the range of U.S.$500,000 and U.S.$10.0 million, where Inteligo believes there is higher growth potential. Inteligo SAB and Interfondos focus on providing brokerage and mutual funds services to individuals with investable assets under U.S.$500,000. As of December 31, 2024, Inteligo had assets under management of S/27,460.8 million (U.S.$7,295.6 million) as compared to S/23,181.5 million (U.S.$6,250.1 million) in 2023. Inteligo’s assets under management grew at a CAGR of 8.5% between December 31, 2019 and December 31, 2024. Inteligo conducts various types of banking, trust, financing, brokerage and investing activities for high net worth individuals.
Inteligo SAB also provides sales and trading operations for individual and institutional customers primarily in the Peruvian capital markets. As of December 31, 2024, Inteligo SAB was the sixth largest broker by market share in equities trading, according to the SMV. Interfondos is the fourth largest mutual fund manager in Peru with a 16.45% market share based on assets under management, according to the SMV.
Inteligo’s result for the year ended December 31, 2024 was a net profit of S/137.3 million, as compared to S/36.2 million in 2023. As of December 31, 2024, Inteligo had shareholders’ equity of S/1,044.1 million as compared to S/920.9 million in 2023. Inteligo’s ROE for the year ended December 31, 2024 was 14.2% as compared to 4.0% in 2023.
Business Lines
Inteligo has three business lines: (1) financial advisory; (2) lending; and (3) portfolio investments.
Financial Advisory
Inteligo provides financial advisory services to high net worth individuals regarding investments, including equities, fixed income, structured products, alternative investments and managed accounts. Through its team of investment analysts, Inteligo designs financial strategies to satisfy the investment objectives of each client in the Peruvian and international financial markets. Furthermore, Inteligo provides regular updates to its clients on market conditions through reports from its in-house research team.
The strength of Inteligo’s financial advisory services has contributed to the growth of its fee income as a percentage of its revenues. Inteligo’s fee income from financial services, net increased from S/146.2 million for 2023 to S/171.0 million for 2024.
Lending
Inteligo offers lending services through Inteligo Bank to complement its wealth management business only to its existing clients. Most of the loans are categorized as consumer financing.
Inteligo Bank’s loan portfolio was fully collateralized by its clients’ assets as of December 31, 2024. Inteligo’s net loan portfolio totaled S/1,622.5 million as of December 31, 2024, increasing 6.8% from S/1,519.7 million, as of December 31, 2023. Inteligo’s net loan portfolio represented 37.6% of its total assets as of December 31, 2024 as compared to 34.7% for 2023.
Portfolio Investments
Inteligo manages a proprietary portfolio primarily composed of medium-term investments in fixed-income securities and private equity. Inteligo’s investment team uses third-party funds as well as individual fixed income and equity securities.
Inteligo’s investment portfolio as of December 31, 2024, totaled S/1,986.4 million, an increase of 7.1%, from S/1,855.1 million as of December 31, 2023, mainly explained by purchases of fixed income investments. In addition, Inteligo’s investment portfolio represented 46.0% of total assets as of December 31, 2024 as compared to 42.4% and 33.3% as of December 31, 2023 and 2022 respectively.
The following tables show the composition of Inteligo’s portfolio by asset class as of the dates indicated.
82
Investments by Asset Class
As of December 31,
2024
2023
2022
Asset Class
(S/ in millions)
Fixed income
240.3
254.0
210.6
Equity
456.1
436.9
217.7
Managed accounts (Fixed income)
576.7
524.0
263.4
Managed accounts (Long-Short)
126.5
127.2
108.1
Mutual funds & investment funds
586.9
512.9
898.4
Total
1,986.4
1,855.1
1,698.2
Investments by Maturity
As of December 31,
2024
2023
2022
Maturity
(S/ in millions)
0-5 years
62.1
147.4
149.5
6-10 years
456.2
404.9
203.9
11+ years
356.5
164.4
118.7
No maturity(1)
1,111.6
1,138.3
1,226.1
Total
1,986.4
1,855.1
1,698.2
(1)
Mutual Funds, equity and private equity investments.
Inteligo’s successful strategy is reflected by the strong growth of its assets under management which had a CAGR of 8.5% between December 31, 2019 and December 31, 2024. For the year ended December 31, 2024, Inteligo’s assets under management increased 18.5%, as compared to 2023. For the year ended December 31, 2023, Inteligo’s assets under management increased 8.7% as compared to 2022.
The following table shows the composition of Inteligo’s assets under management by asset class as of the dates indicated.
Assets under Management by Asset Class
As of December 31,
2024
2023
2022
Asset Class
(S/ in millions)
Fixed income
15,531
11,761
10,286
Equity
9,514
9,345
9,416
Alternative investments
2,415
2,075
1,615
Total
27,461
23,181
21,317
Inteligo’s net profit increased S/101.2 million between December 31, 2024 and December 31, 2023, due to positive mark-to-market valuation of the proprietary portfolio. For the year ended December 31, 2023, Inteligo’s net profit increased S/177.6 as compared to 2022.
Market Segmentation
Inteligo Bank primarily focuses on individuals with investable assets in the range of U.S.$500,000 and U.S.$10 million, where Inteligo believes there is higher growth potential. Inteligo SAB and Interfondos also focus on providing brokerage and mutual funds services to individuals with investable assets under U.S.$500,000. As of December 31, 2024, Inteligo Group had approximately 83,433 clients, respectively, as compared to approximately 72,735 clients, respectively, in 2023.
Inteligo’s strategy consists of establishing long-term relationships with its broad and profitable client base, segmenting its customers effectively and proactively providing financial advisory services. Inteligo’s committed advisory service, supported by a local investment team that possess extensive knowledge of its Peruvian clients’ preferences for financial products, and delivered through an experienced group of relationship managers is a key pillar of Inteligo’s success. Inteligo’s position further benefits from its leading brokerage operation in Peru through Inteligo SAB, an important mutual fund manager in Peru, Interfondos, and from being a part of one of Peru’s leading economic groups.
83
Financial Advisory Team
Inteligo serves its customers through its advisory team of approximately 76 people. Through its relationship managers, Inteligo establishes strong client relationships which result in a loyal and growing customer base. Inteligo’s experienced relationship managers team has acquired specialized product knowledge and deep understanding of its customers’ needs.
Information Technology Unit
Inteligo Bank implemented a new core system in 2020 to support its rapidly expanding operations. As of December 31, 2024, 2023, 2022 and 2021, Inteligo Bank had invested S/2.5 million, S/3.8 million, S/2.6 million and S/2.7 million, respectively, in the development of its technology platform, which will allow it to leverage its existing CRM platform and develop stronger business intelligence capabilities.
As a part of its cybersecurity strategy, Inteligo continued to strengthen its identification, protection, detection and action cybersecurity plans, which reduced the occurrence of attacks and mitigated the risk of cyber threats. This strategy is based on the cybersecurity framework of the National Institute of Standards and Technology (NIST), and other standards such as ISO 27000 and 27032. Inteligo’s cybersecurity strategy includes improvements to security on different fronts, including mobile devices, workstations, in the cloud and on premises. Inteligo uses updated technology such as behavior analysis and artificial intelligence, which allow its human resources to reduce time spent on threat detection and analysis.
84
COMPETITION
We face intense competition in all of our segments, which can affect our margins, growth and profitability.
Peruvian Banking System and Competition
During the 1990s, the Peruvian economy underwent a major transformation, from being a highly protected and regulated system prevailing in the 1980s to a free-market economy. During this period, protectionist and interventionist laws and policies were gradually dismantled to create a liberal economy dominated by the private sector. Similarly, the Peruvian financial industry underwent deep structural changes that resulted in a significant expansion of credit. From 1993 to 1998, performing loans in the Peruvian financial system grew at a five-year CAGR of 45.9%, and banking penetration in Peru, measured as the ratio of loans-to-GDP, rose from 10.2% to 26.4% according to the SBS.
In 1998, the rise in international interest rates that followed the Russian default led to large outflows of capital from Peru, resulting in a 15.8% depreciation of the sol. The strong depreciation of the sol, coupled with the strong dollarization of the Peruvian Banking system prevalent at that time (81% of the loans were denominated in U.S. dollars) led to a sharp deterioration of the Peruvian banking system’s loan portfolio quality and to a contraction in total loans. Past-due loans in the system peaked at 9.4% of total gross loans as of January 31, 2000, resulting in increased provisions and large capital losses for financial institutions.
However, from 2001 onwards, as macroeconomic conditions improved, the general banking industry indicators in Peru began also to improve and credit expanded.
From December 31, 2020 to December 31, 2024, the banking system in Peru continued to grow, but at a slower pace compared to prior years, with gross loans expanding at a four-year CAGR of 1.9%, according to the SBS. A significant part of the growth experienced by the Peruvian financial system since 2017 has been generated by the retail banking sector. Retail loans (including consumer loans and mortgages) grew at a four-year CAGR of 7.5% for the period ended December 31, 2024. As of December 31, 2024, approximately 39.4% of the Peruvian banking sector’s total loans were retail loans, higher than the 31.8% as of December 31, 2020.
According to the SBS, the total number of credit cards issued by the Peruvian banking system as of December 31, 2024 was approximately 6.3 million. For the period ended December 31, 2024, the Peruvian banking system’s credit card loans had a four-year CAGR of 3.0%, although credit cards loans decreased by 0.8% between December 31, 2023 and December 31, 2024.
Mortgage loans in the Peruvian banking system grew at a four-year CAGR of 6.7% for the period ended December 31, 2024 and 5.1% between December 31, 2023 to December 31, 2024. A responsible macroeconomic approach, high housing demand and the promotion of housing programs over the past five years have been the main drivers of mortgage loan growth in Peru and are expected to continue fueling mortgage lending.
Despite this growth, the Peruvian banking system remains underpenetrated in comparison to the banking systems from the group of peer countries in Latin America. As of December 31, 2024, Peru’s loans-to-GDP ratio was 32.4%, less than Chile's ratio of 32.9%. The Peruvian banking system is highly concentrated, with a small number of relatively large participants. The four largest banks accounted for 84.0% of total gross loans and 83.0% of total deposits in the system as of December 31, 2024. Furthermore, foreign banks play a significant role in the Peruvian financial system. As of December 31, 2024, BBVA and Scotiabank, two of the four largest banks in the system, which accounted for a combined 36.1% of total gross loans and 33.3% of total deposits, according to the SBS, were under foreign control. Although major global banks such as BNP Paribas, Standard Chartered, Intesa, BankBoston, HSBC and Deutsche Bank have ceased operations in Peru over the past 15 years, other foreign banks have entered or have shown interest in entering or increasing their exposure in the Peruvian market.
The Peruvian banking system’s net income CAGR from 2020 to 2024 was 48.7%, reaching S/10,325.4 million in 2024.
As of December 31, 2024, the banking system cost of risk and past due loan (“PDL”) ratio stood at 3.0% and 3.8%, respectively.
85
Innovation across Peru’s financial system has shifted banks to focus on digital transformation, as consumers increasingly prefer digital channels. According to ASBANC (Asociación de Bancos del Perú), Peru presents itself as a market with high potential for fintechs because of the substantial percentage of people and small/medium size enterprises that do not have access to the financial system. Fintech companies are not just competitors but can also act as potential strategic partners for banks; these companies have a suitable environment to mature for several reasons: a high level of mobile phone penetration; a rising use of digital services and the relatively low cost of technology.
Interbank is currently the third largest bank in Peru, as measured by total assets and by total deposits, and the fourth largest bank, as measured by gross loans, as of December 31, 2024, and has faced strong competition. This increased competition has affected the average interest rates that the Peruvian banking system has been able to charge its customers and to pay for deposits. Despite being the third largest bank in Peru, Interbank continues to be strongly positioned in the consumer sector, being the second largest bank in gross consumer loans as of December 31, 2024, according to the SBS.
The following tables show Interbank, the rest of the Peruvian banking system and their respective market shares as of December 31, 2024.
As of December 31, 2024
Assets
Total Gross Loans
Deposits
Balance
Market Share (%)
Rank
Balance
Market Share (%)
Rank
Balance
Market Share (%)
Rank
(S/ in millions)
(S/ in millions)
(S/ in millions)
BCP
196,864.9
39.2
%
1
119,567.7
34.0
%
1
134,808.7
36.2
%
1
BBVA
111,229.3
22.2
%
2
77,674.6
22.1
%
2
78,973.4
21.2
%
2
Interbank
73,239.5
14.6
%
3
48,848.5
13.9
%
4
50,438.0
13.5
%
3
Scotiabank
70,414.8
14.0
%
4
49,161.2
14.0
%
3
45,000.0
12.1
%
4
BanBif
21,853.4
4.4
%
5
14,542.2
4.1
%
5
15,660.3
4.2
%
5
Mibanco
16,663.8
3.3
%
6
12,131.7
3.5
%
6
10,843.7
2.9
%
6
Pichincha
10,881.4
2.2
%
7
8,380.0
2.4
%
7
7,932.4
2.1
%
7
Santander
10,165.7
2.0
%
8
5,664.0
1.6
%
8
6,534.4
1.8
%
8
Citibank
9,166.8
1.8
%
9
1,592.6
0.5
%
12
5,393.0
1.4
%
9
GNB
5,718.2
1.1
%
10
3,916.1
1.1
%
9
4,251.2
1.1
%
10
Falabella
5,007.5
1.0
%
11
3,491.3
1.0
%
10
3,369.2
0.9
%
11
Bank of China
2,687.8
0.5
%
12
213.4
0.1
%
17
2,361.3
0.6
%
12
ICBC
2,679.3
0.5
%
13
1,000.5
0.3
%
15
1,671.5
0.4
%
13
Banco BCI
2,535.8
0.5
%
14
1,448.2
0.4
%
13
1,404.9
0.4
%
15
Comercio
2,120.2
0.4
%
15
1,769.0
0.5
%
11
1,462.2
0.4
%
14
Ripley
1,845.2
0.4
%
16
1,360.4
0.4
%
14
1,333.9
0.4
%
16
Alfin
1,282.8
0.3
%
17
730.1
0.2
%
16
1,002.0
0.3
%
17
Total
544,356.4
100.0
%
351,491.4
100%
372,440.0
100.0
%
Source: SBS.
(1)
Gross consumer loans do not include mortgage loans.
86
The following table shows key industry metrics for the main banks by assets and the Peruvian banking system.
As of December 31, 2024
Gross Consumer Loans(1)
Balance
Market Share (%)
Rank
(S/ in millions)
BCP
18,636.0
26.0
%
1
Interbank
15,039.7
21.0
%
2
BBVA
13,235.2
18.4
%
3
Scotiabank
10,168.1
14.2
%
4
Pichincha
3,872.2
5.4
%
5
Falabella
3,486.6
4.9
%
6
BanBif
2,019.1
2.8
%
7
GNB
1,560.3
2.2
%
8
Comercio
1,403.9
2.0
%
9
Ripley
1,360.4
1.9
%
10
Alfin Banco
538.5
0.8
%
11
Mibanco
362.0
0.5
%
12
Santander
65.8
0.1
%
13
Citibank
0.0
0.0
%
14
ICBC
0.0
0.0
%
14
Bank of China
0.0
0.0
%
14
BCI
0.0
0.0
%
14
Total
71,747.9
100.0
%
87
2024
2023
2022
2021
2020
ROE
Interbank
11.8
%
12.3
%
17.6
%
19.1
%
4.3
%
BCP
22.2
%
20.7
%
21.6
%
15.9
%
4.5
%
BBVA
15.1
%
16.1
%
18.3
%
16.3
%
7.0
%
Scotiabank
8.4
%
6.4
%
13.7
%
10.1
%
2.6
%
Peruvian banking system
15.3
%
14.3
%
17.3
%
13.3
%
4.0
%
ROA
Interbank
1.3%
1.3
%
1.7
%
1.7
%
0.4
%
BCP
2.8%
2.6
%
2.5
%
1.6
%
0.5
%
BBVA
1.7%
1.9
%
1.9
%
1.5
%
0.7
%
Scotiabank
1.4%
1.0
%
1.9
%
1.3
%
0.3
%
Peruvian banking system
1.9%
1.8
%
2.0
%
1.4
%
0.4
%
Efficiency Ratio(1)
Interbank
40.1%
39.3
%
42.7
%
45.1
%
39.4
%
BCP
39.1%
38.6
%
40.4
%
44.7
%
40.9
%
BBVA
38.8%
38.2
%
39.1
%
39.3
%
40.4
%
Scotiabank
40.9%
42.5
%
38.7
%
42.7
%
41.0
%
Peruvian banking system
40.7%
40.8
%
42.5
%
46.6
%
43.4
%
Past-Due-Loan Ratio
Interbank
2.7%
3.5
%
3.0
%
3.6
%
3.4
%
BCP
3.6%
4.2
%
4.0
%
3.7
%
3.2
%
BBVA
3.7%
4.7
%
4.4
%
3.7
%
3.2
%
Scotiabank
4.3%
4.5
%
4.1
%
3.9
%
5.4
%
Peruvian banking system
3.8%
4.3
%
4.0
%
3.8
%
3.8
%
Coverage Ratio
Interbank
152.6%
148.7
%
163.9
%
132.8
%
202.3
%
BCP
162.5%
140.5
%
142.2
%
152.5
%
192.7
%
BBVA
142.4%
137.9
%
144.6
%
167.2
%
192.9
%
Scotiabank
182.8%
155.6
%
147.4
%
154.0
%
136.1
%
Peruvian banking system
156.1%
144.6
%
148.5
%
155.5
%
177.7
%
Total Capital Ratio
Interbank
16.2%
15.5
%
15.1
%
15.9
%
17.0
%
BCP
18.5%
17.5
%
14.4
%
14.9
%
14.9
%
BBVA
15.8%
15.6
%
14.0
%
14.1
%
13.7
%
Scotiabank
17.1%
14.9
%
14.0
%
14.7
%
16.5
%
Peruvian banking system
17.3%
16.5
%
14.5
%
14.9
%
15.5
%
Source: SBS.
(1)
Under SBS criteria.
Note: ROE calculated as net income for the period divided by the average of total equity at the end of the last five quarters. ROA calculated as net income for the period divided by the average of total assets at the end of the last five quarters.
The Peruvian banking system’s net profit was S/10,325.4 million in 2024, a increase of 11.9% compared to 2023 due to lower provisions. The following chart shows the evolution of the banking system’s net profit between 2020 and 2024.
88
Banking system’s Net Profit 2020 — 2024 (S/ in millions)
Source: SBS.
The following chart sets forth, for the metrics indicated below, the year-over-year performance as of December 31, 2024 for the four largest banks in Peru under SBS GAAP.
Total Net Profit CAGR (2020 - 2024) and
Year-Over-Year Performance by Net Profit (As of December 31, 2024 vs. As of December 31, 2023)
Source: SBS.
Note: Banks include international branches.
The banking system’s total loans have shown high growth in the past years, reaching a 1.9% four-year CAGR from 2020 to 2024. The following chart shows the evolution of the Peruvian banking system’s retail and commercial loans between 2020 and 2024 under SBS GAAP.
Banking system’s total loan 2020-2024 (S/ in billion)
Source: SBS.
89
The following chart sets forth the four-year CAGR from 2020 to 2024 and the year-over-year growth as of December 31, 2024 of total loans under SBS GAAP for the four largest banks in Peru.
Total Loans CAGR (2020 - 2024) and Year-Over-Year Growth (As of December 31, 2024 vs. As of December 31, 2023)
Source: SBS
Note: Banks include international branches.
The following chart sets forth the CAGR from 2020 to 2024 and the year-over-year growth as of December 31, 2024 of total deposits for the four largest banks in Peru. In 2024, the increase in deposits was primarily due to an increase in both retail and commercial deposits given the higher interest rate environment and the widespread adoption of a “savings” mindset.
90
Total Deposits CAGR (2020—2024) and Year-Over-Year Growth (As of December 31, 2024 vs. As of December 31, 2023)
Source: SBS.
Note: Banks include international branches.
Interbank’s past-due-loan ratio as of December 31, 2024 was the lowest among the four largest Peruvian banks, and the banking system’s average. The Banking System’s PDL ratio for 2022, 2023 and 2024 was 4.0%, 4.3% and 3.8%, respectively, while our PDL ratio was 3.0%, 3.5% and 2.7%, respectively. The Banking System coverage ratio for 2022, 2023 and 2024 was 148.5%, 144.6% and 156.1% while Interbank’s coverage ratio was 163.9%, 148.7% and 152.6%. The following chart sets forth the past-due-loan and coverage ratios, under the accounting standards prescribed by the SBS (“Peruvian GAAP”), for the four largest banks in Peru as of December 31, 2024.
Past-Due-Loan and Coverage Ratios (As of December 31, 2024)
Source: SBS.
Note: Banks include international branches.
As of December 31, 2024, Interbank’s past-due-loan ratio in retail and consumer loans was the first highest, respectively among the four largest Peruvian banks, due to our clients’ profile and the importance of credit cards in our portfolio. The following charts set forth the past-due-loan ratios in retail and consumer loans for the four largest banks in Peru as of December 31, 2024.
91
Retail Loans Past-Due-Loan Ratio (As of December 31, 2024)
Source: SBS.
Note: Banks include international branches.
Consumer Loans Past-Due-Loan Ratio (As of December 31, 2024)
Source: SBS.
Note: Banks include international branches.
Interbank had the lowest commercial past-due-loan ratio among the four largest Peruvian banks as of December 31, 2024. The following chart sets forth the commercial past-due-loan ratio for the four largest banks in Peru as of December 31, 2024.
92
Commercial Loans Past-Due-Loan Ratio (As of December 31, 2024)
Source: SBS.
Note: Banks include international branches.
Fintech Landscape
The fintech industry in Latin America has experienced remarkable growth in recent years, driven by increased venture capital investment, rising mobile phone penetration, and evolving consumer behavior. Fintechs have capitalized on mobile-first strategies, enhanced user experiences, and open banking regulations to disrupt traditional banking models. These innovations allow financial services to be delivered more efficiently and at lower costs, particularly to underserved populations. The increase of digital banks and fintech solutions has reshaped the financial ecosystem by offering a wide array of services, from digital wallets and payment platforms to lending and insurance solutions.
In Peru, the fintech sector has demonstrated significant potential for growth, with 237 fintech firms recorded by the end of 2024, an increase of 18 companies in the last ten years. The fintech ecosystem in Peru is diverse, covering segments such as digital wallets, lending, currency exchange, and crowdfunding. Digital wallets like Yape and Plin have become increasingly popular due to their interoperability, allowing seamless micropayments across financial institutions. Additionally, lending fintechs have seen substantial growth, offering unsecured loans with simplified approval processes to underserved small businesses and individuals.
The Central Reserve Bank of Peru is actively development innovation through different initiatives, which allows fintech firms to test new financial products in a controlled environment, and the development of a Central Bank Digital Currency (CBDC) aimed at promoting financial inclusion. As fintech continues to mature, it is expected to increase competition, lower costs, and enhance financial inclusion across the country.
Payments Landscape
Izipay operates in the highly-competitive and regulated payments industry, competing with a wide range of businesses, even smaller or younger companies and from all form of physical and electronic payments, given the payments industry increasing innovation, changing technologies and adapting to fast paced preference and needs of merchants and consumers.
Izipay’s payments acquirer line primarily competes with merchant acquirers, payment gateways, payment facilitators and other financial technology companies who provide businesses with merchant acquiring services and related services. In this segment, Izipay’s main competitors are: Niubiz, Culqi and Open Pay.
Izipay’s correspondent banking business line is primarily comprised by three group of players: Izipay, banks and other providers. Izipay offers correspondent services at merchants throughout Peru like pharmacies, libraries and mom-and-pop stores, with exclusive POS terminals leased to banks. Banks partner with merchants to have the POS terminals advertised in stores. Banks provide those services at their own branches and other providers that don’t offer the service for a single customer. In this segment, Izipay’s main competitors are: Full carga, Kasnet, Cyrus, Niubiz and the proprietary solutions of the banks themselves.
Our credit card and prepaid processing business line primarily competes with other third-party payment card processors, the card brands, core banking platform providers, independent software vendors and various other firms that provide products and
93
services to payment card issuers in Peru. Banks do not delegate debit card processing, they do it with their internal core system. Our primary competitor in this space is Unibanca.
Peruvian Insurance Industry and Competition
The Peruvian insurance industry is well-capitalized, with a solvency ratio (patrimonio efectivo / requerimientos patrimoniales) of 138.2% under Peruvian SBS GAAP as of December 31, 2024, and operates under a well-established regulatory framework. In the same period, Interseguro's solvency ratio was 125.2%.
Following the decline of the industry prior to the COVID-19 pandemic, insurance premiums grew at a four-year CAGR of 12.2% for the period ended December 31, 2024. Insurance premiums in Peru reached S/22.2 billion for the year ended December 31, 2024, representing a 9.5% year-over-year increase.
Life and annuities insurance premiums represented approximately 54.3% of total insurance premiums in Peru for the year ended December 31, 2024. In April 2016, a new regulation was approved in Peru, allowing pensioners to withdraw up to 95.5% of their retirement funds. While this measure had a negative impact on market size of annuities, it originated a potential market for private annuities, allowing life and annuities premiums to increase at a CAGR of 16.0% from 2020 to 2024.
The table below sets forth the number of members in the Peruvian private pension system as of December 31, 2024.
As of December 31, 2024
Age (years)
Number of Members (in thousands)
Percentage of Total
Less than 25
1,245
12.7%
26-35
2,789
28.5%
36-45
2,388
24.4%
46-55
1,893
19.3%
56-65
1,038
10.6%
More than 65
442
4.5%
Total
9,796
100.0%
Source: SBS
The chart below sets forth Peruvian insurance premiums for the periods indicated.
Insurance Premiums (S/ in Millions)
Source: SBS.
The chart below shows market share by annuities premiums from 2020 to 2024.
94
Market Share by Regulated Annuities Premiums
Source: SBS.
Note: Interseguro’s figures incorporate Seguros Sura starting November 2018.
As of December 31, 2024, a total of 17 companies comprised the Peruvian insurance industry. As of December 31, 2024, in terms of assets on a consolidated basis, the four largest insurance companies had an 80.9% market share, and the leading two insurance companies had a combined market share of 49.2%. The Peruvian insurance industry is largely represented by Peruvian companies with three of the six largest companies controlled by Peruvian economic groups.
The following table presents market shares by assets and premiums of the six largest insurance companies in Peru as of and for the year ended December 31, 2024.
Total Assets as of December 31, 2024
Total Net Premiums for the year ended December 31, 2024
Company
Life
Non-Life
(S/ in million)
Market Share (%)
(S/ in million)
Market Share (%)
Rimac
✓
✓
21,585
25.8%
6,209
28.0%
Pacífico Seguros
✓
✓
19,615
23.4%
5,373
24.2%
Interseguro
✓
✓
16,409
19.6%
1,353
6.1%
La Positiva(1)
✓
✓
10,092
12.1%
2,875
13.0%
Mapfre(1)
✓
✓
6,431
7.7%
2,893
13.0%
Protecta Security
✓
✓
4,420
5.3%
682
3.1%
Source: SBS
(1)
La Positiva consolidates La Positiva and La Positiva Vida. Mapfre consolidates Mapfre Peru and Mapfre Peru Vida.
The following chart sets forth the ROEs for Interseguro, its main competitors and the Peruvian insurance industry, from 2020 to 2024.
95
ROE
Source: SBS.
The following chart shows investment portfolio returns for Interseguro and the Peruvian insurance industry from 2020 to 2024.
Investment Portfolio Returns (2020-2024)
Source: SBS.
Note: Annual Investment portfolio returns calculated as return from investments for the period divided by the average of total investments at the last five quarters.
96
The following chart shows total investments under Peruvian SBS GAAP of the four largest life insurance companies in Peru as of December 31, 2024:
Investment portfolio (S/ in millions)
Source: SBS
Note: La Positiva consolidates La Positiva and La Positiva Vida.
Insurtech Landscape
The insurtech ecosystem in Latin America demonstrated remarkable resilience in 2024, closing the year with 502 startups in the region despite a challenging economic and financial context. Although annual investment in insurtech dropped by 38%, reaching U.S.$92 million, there was a strong recovery in the second half of the year, with a 156% increase in investment compared to the first semester of the year.
This growth has been driven by greater consolidation of insurtechs in areas like digital distribution, which represents 51% of the companies in the sector, while the remaining 49% focus on enabling and collaborating with traditional insurers. A key aspect has been the internationalization of these startups, especially in countries like Chile and Peru, which stand out as key markets for expansion. Furthermore, the trend toward digitalization and process automation in the insurance sector continues to rise, contributing to greater operational efficiency and improved customer experience.
Wealth Management Industry and Competition
Inteligo Bank operates in the highly-competitive and regulated wealth management industry, competing with independent advisors, global banks and Peruvian firms, such as its main competitor Credicorp Ltd. through its subsidiary Atlantic Security Bank (“ASB”). The Peruvian wealth management industry has also recently attracted several new participants, including representative offices of global banks such as JP Morgan, UBS, RBC, Credit Suisse, and Julius Baer, among others.
The following chart sets forth fee income for Inteligo Bank and ASB from 2021 to 2024.
97
Fee Income (S/millions)
The following chart sets forth net income in for Inteligo Bank and ASB from 2021 to 2024.
Net Income (S/. millions)
Source: Company information and Credicorp Ltd.’s quarterly reports.
Interfondos provides mutual fund management services in Peru. Interfondos has been the fourth largest mutual fund manager in Peru in each of the last five years according to the SMV. As of December 31, 2024, Interfondos had a 16.5% market share based on assets under management.
98
Inteligo SAB provides brokerage services, including sales and trading operations, in Peru’s domestic capital markets. As of December 31, 2024, the Peruvian brokerage industry consisted of 19 brokerage firms. Inteligo SAB has ranked among the largest equity trading platforms in the last five years in terms of trading volumes on the Lima Stock Exchange.
REGULATION AND SUPERVISION
The Peruvian Financial and Insurance Systems
A substantial part of our activities is conducted through Interbank and Interseguro, our banking and insurance subsidiaries, respectively, operating in Peru. A summary of the Peruvian financial and insurance regulatory framework is set forth below.
General Overview of the Peruvian Financial Regulatory Framework
Peruvian banking regulation follows the standards set by the Basel Committee on Banking Supervision. Peruvian banks and other Peruvian financial institutions are primarily governed by two banking regulatory authorities: the SBS and the Central Reserve Bank of Peru. The Peruvian Constitution establishes that the SBS’s main function and responsibility is to protect depositors of the Peruvian financial system, while the main function of the Central Reserve Bank of Peru is to preserve monetary stability. In addition, Peruvian banks are subject to certain regulations of the SMV.
The regulatory framework for the operation of the Peruvian financial and insurance sector is set in the Peruvian Banking and Insurance Law approved by Law No. 26702, which was enacted in December 1996. The Peruvian Banking and Insurance Law regulates Peruvian financial and insurance companies and private pension funds administrators. In accordance with the Peruvian Banking and Insurance Law, the SBS is responsible for issuing banking regulations and for monitoring the Peruvian banking financial and insurance sector. The SBS supervises and regulates financial institutions such as commercial banks, financial companies, financial leasing companies, small business financial companies, savings and loan corporations, financial services companies such as trust companies and investment banks, insurance companies, private pension fund administrators and savings and loans cooperatives (other financial institutions such as stock brokerage houses and mutual fund managers are subject to different legal frameworks and to the supervision of the SMV). The SBS became operational in 1931.
Financial and insurance institutions must seek the authorization of the SBS before initiating operations. The SBS has administrative and financial autonomy, and its head office is located in Lima. The current superintendent of the SBS, Sergio Espinosa Chiroque, assumed office in July 2024, succeeding María del Socorro Heysen Zegarra, who held the position for nearly eight years. Sergio Espinosa was ratified by the Congress by means of Legislative Resolution No. 022-2023-2024-CR.
In June 2011, the Basel Committee announced the issuance of the Basel III principles. The changes introduced have been designed to be implemented progressively. The SBS, by use of its regulatory attributes, has issued several regulations that seek to adapt the Peruvian financial system to the new Basel Capital Accords.
On December, 2021, SBS Resolution No. 03921-2021 amended requirements to cover market concentration risk and gave financial institutions a term of two years to adequate to new requirements. Consistent with certain aspects of Basel III, the SBS issued in 2022, SBS Resolution No. 03953-2022 and SBS Resolution No. 03954-2022 in order to update the methodologies for calculating the individual and sector concentration risk buffers (including regional and economic sector concentration) eliminating the capital buffer requirement for risk appetite and maintaining the requirement for measuring the interest rate risk of the banking book. Legislative Decree No. 1531 and SBS Resolution No. 03954-2022 aligned the capital conservation buffer in the Peruvian regulation, to the Basel III principles.
In March 2022, the Peruvian Banking and Insurance Law was amended by Legislative Decree No. 1531 (which became effective on January 1, 2023) to adapt the regulations applicable to the companies of the financial system, related to the composition of the effective equity to the Basel III principles (including but not limited to the alignment of the capital conservation buffer in the Peruvian regulation to the Basel III principles). In December 2022, the SBS approved six resolutions aimed at adapting the regulatory framework of the financial system more generally to the Basel III principles (including issuance of SBS Resolution No. 3950-2022, which amended the regulation applicable to subordinated debt of financial institutions (Reglamento de Deuda Subordinada Aplicable a las Empresas del Sistema Financiero) (the “Subordinated Debt Regulation Applicable to Financial Institutions”) in order to adjust the application of Basel III standards and to reflect recent amendments to the Peruvian Banking and Insurance Law and entered into effect on January 1, 2023, repealing the prior subordinated debt regulation, which had been approved by SBS Resolution No. 975-2016). Likewise, in September 2024, the Peruvian Banking and Insurance Law was further amended by Legislative Decree No. 1646, which amends the legislation on legal lending limits, among others, to adjust it to international standards. Legislative Decree No. 1646 will come into effect on June 1, 2025.
99
Peruvian banks, financial institutions and insurance companies are mainly regulated and supervised by the following administrative institutions:
The SBS
The SBS is the regulatory authority charged with the implementation and enforcement of the requirements contained in the Peruvian Banking and Insurance Law, and, more generally, with the regulation and supervision of all financial and insurance companies in Peru and, since July 2005, the private pension funds administrators.
Its objectives include: (i) protecting the public interest; (ii) safeguarding the financial stability of the institutions over which it has authority; and (iii) punishing violators of its regulations.
Its main responsibilities include: (i) reviewing and approving, with the assistance of the Central Reserve Bank of Peru, the establishment, organization and operations of the institutions it regulates and their subsidiaries; (ii) overseeing mergers, dissolutions and reorganizations of banks, financial institutions and insurance companies; (iii) supervising financial, insurance and related companies from which information on an individual or consolidated basis is required, through changes in ownership and management control (this supervision also applies to non-bank holding companies, such as us and Intercorp Peru); (iv) reviewing the by-laws and amendments thereto of these companies; (v) setting forth criteria governing the transfer of bank shares, when permitted by law, for valuation of assets and liabilities and for minimum capital requirements; (vi) controlling the Central de Riesgos (Bank Risk Assessment Center), to which all banks are legally required to provide information regarding all businesses and individuals with whom they deal without regard to the amount of credit risk (the information provided is made available to all banks to allow them to monitor individual borrowers’ overall exposure to Peru’s financial system); and (vii) supervising the anti-money laundering system through the financial intelligence unit (“UIF,” for its Spanish acronym).
The SBS enforces the Peruvian Banking and Insurance Law on an ongoing basis through periodic resolutions. The Peruvian Banking and Insurance Law provides for stringent loan loss reserve standards, brings asset risk weighing in line with the Basel Committee on Banking Supervision guidelines and includes the supervision of holding companies of financial institutions by the SBS.
For the foregoing purpose, the SBS requires banks, financial and insurance companies to report, on a periodic basis, all relevant information necessary for off-site evaluation of its financial performance. The relevant information for off-site evaluation includes audited financial statements on a consolidated basis, board of directors’ reports, auditor’s reports and any other reports which reflect the operation of a bank’s business. Under current practice, such reporting is required on a daily, weekly, monthly, quarterly and semi-annual basis, depending on the nature of the reported information.
The SBS is also responsible for conducting on-site examinations of banks on an annual basis, implementing the provisions of the Peruvian Banking and Insurance Law and other related legislation, examining all banking and insurance operations, and analyzing the relationship between assets, liabilities, net worth, profit and loss accounts and all other factors affecting a bank’s financial structure.
The SBS has the power to impose administrative sanctions on financial institutions and their directors and employees as a result of any violation of the Peruvian financial and insurance system rules. Sanctions vary from monetary fines to license cancellation. The SBS may also sanction directors and other officers of financial institutions for breach of regulations under the supervision of the SBS.
The Central Reserve Bank of Peru
The Central Reserve Bank of Peru was incorporated in 1922. Pursuant to the Peruvian Constitution, its primary role is to ensure the stability of the Peruvian monetary system and perform the functions common to a central or reserve bank, such as issuing bank notes, implementing governmental monetary policies, regulating the money supply, managing official gold and foreign exchange reserves and managing the interbank cash clearance system. The Central Reserve Bank of Peru exercises its power and authority independently and is responsible for its affairs in accordance with the government’s policies. The Central Reserve Bank of Peru is empowered to determine the inflation target and to adopt a monetary policy in accordance thereof and is also responsible for establishing mandatory minimum liquidity reserves. The Central Reserve Bank of Peru manages Peruvian international reserves and gathers and publishes data on its finances and is also the sole issuer of Peruvian currency.
The highest decision-making authority within the Central Reserve Bank of Peru is its seven-member Board of Directors. Each Director serves a five-year term. Of the seven Directors, four are selected by the Executive Power and three are selected by Congress. The Chairman of the Central Reserve Bank of Peru is one of the Executive Power nominees but must be approved by Congress.
100
The Central Reserve Bank of Peru Board of Directors develops and oversees monetary policy, establishes reserve requirements for entities within the financial system, and approves guidelines for the management of international reserves. All entities within the financial system are required to comply with the decisions of the Central Reserve Bank of Peru.
In addition, Law No. 29440 (as amended), designated the Central Reserve Bank of Peru as the Peruvian payment system regulatory authority. As such, it has the authority to issue regulation related to the functioning of the Peruvian payment systems. In that role, under Circular Letter No. 024-2022-BCRP, as amended, the Central Reserve Bank of Peru passed rules on the interoperability of payment services. Furthermore, in September 2024, Legislative Decree No. 1665 amended Law No. 29440 to grant new regulatory and sanctioning powers to the Central Reserve Bank of Peru and introduced other regulatory changes. See “— The Peruvian Payment’s System” for a discussion of applicable obligations to the entities participating in the Peruvian payment system.
The SMV
The SMV is the Peruvian securities market regulatory authority, attached to the Ministry of Economy and Finance (Ministerio de Economía y Finanzas). The main purpose of the SMV is promoting, overseeing and regulating the securities market, supervising and controlling all individuals and entities that intervene in such market, and enforcing compliance with the provisions of the Peruvian Securities Market Law and its regulations.
Pursuant to Article 29 of the Peruvian Banking and Insurance Law, the issued and outstanding shares of Peruvian banks must be registered with the SMV and listed with the BVL. Therefore, according to the Peruvian Securities Market Law and its regulations, listed companies such as banks and insurance companies are required to file with the SMV and the BVL, in Spanish and on a going forward basis, quarterly and annual financial reports.
In addition, these companies are required to disclose to the market in a timely manner (on the same day when the event occurs) all information that investors are reasonably likely to consider material. Specific regulations provide for specific parameters to determine what is considered material information (hechos de importancia).
In March 2014, regulations related to disclosure of material information were amended. By virtue of such regulations, issuers under supervision of the SMV are required to disclose all material information in connection with the issuer of registered securities (such as our common shares) and its activities or securities issued or secured by such issuer which may influence the liquidity or price of such securities.
Also, issuers whose securities are also traded in foreign markets must file with the SMV all information that is required to be disclosed to investors on such foreign market as soon as such information is delivered to foreign regulators.
Banking Regulation and Supervision
Banking regulations and capital adequacy in Peru take into account the recommendations of the Basel Committee. The SBS has adopted the principles and guidelines of Basel II and Basel III. Also, the SBS has mandated a minimum regulatory capital requirement for Peruvian banks and, in accordance with the amendments brought by Legislative Decree No. 1531 to the Peruvian Banking and Insurance Law. In 2022, the SBS also issued resolutions that follow the three objectives for Basel III (i.e., increased capital, establishment of liquidity standards and improvement in the quality of capital). Furthermore, in December 2023, the SBS published SBS Resolution No. 04221-2023, which introduced the new regulation for liquidity risk management incorporating the net stable funding ratio. We cannot provide any assurances as to whether or to what extent the SBS may adopt any pending Basel III standards, and whether these standards will be applied exactly as recommended by the Basel Committee.
Since August 2022, the SBS and the Peruvian government have issued several regulations focused on furthering Basel III compliance, including regulations or amendments to existing regulation related to subordinated debt (SBS Resolution N° 03950-2022), capital requirements (SBS Resolution N° 03951-2022, SBS Resolution N° 03952-2022 and SBS Resolution N° 03953-2022), capital requirements for credit risk market and operational risks (SBS Resolution N° 03954-2022, SBS Resolution N° 03955-2022, and SBS Resolution 1088-2024) and legal lending limits (Legislative Decree N° 1646 and its regulations approved by SBS Resolution No. 00975-2025).
Capital Adequacy Requirements—Basel III
Under the amended provisions of Article 199 of the Peruvian Banking and Insurance Law, and on an unconsolidated basis, the regulatory capital (patrimonio efectivo) may not be lower than 10% of its total weighted assets, the latter being defined as the sum of: (i) the regulatory capital allocated to cover market risks multiplied by the inverse of the overall limit (límite global), (ii) the regulatory capital allocated to cover operational risks multiplied by the inverse of the overall limit (límite global); and (iii) the total amount of credit risk-weighted assets. Notwithstanding the foregoing, according to SBS Resolution No. 03952-2022 (as amended from time to time), published on December 27, 2022, as amended by SBS Resolution No. 274-2024, the SBS established a gradual
101
implementation schedule (from 8.5% for January - March 2023 to 10% for March 2025 and onward).In addition, the amended provisions of Article 199 of the Peruvian Banking and Insurance Law established that (i) ordinary capital Tier 1 ordinary capital shall be equal or higher than 4.5% of its total weighted assets and (ii) Tier 1 Regulatory Capital shall be equal or higher than 6% of its total weighted assets.
According to the amended provisions of Articles 184 and 185 of the Peruvian Banking and Insurance Law (as amended by Legislative Decree No. 1531), regulatory capital is defined as the sum of: (i) Tier 1 Regulatory Capital; and Tier 2 Regulatory Capital.
Tier 1 Regulatory Capital is comprised of (i) the ordinary equity (which includes common stock and other paid-in capital instruments), capital premiums, dividends, unrealized gains, legal and voluntary reserves, donations and other elements as defined by the SBS and (ii) additional Tier 1 Regulatory Capital, which includes capital instruments, capital premiums and certain subordinated debt, premiums, of the above indicated instruments and other elements as defined by the SBS. Tier 1 ordinary capital is subject to, among others, the following deductions: losses of prior years and of the current year, unrealized losses, any provisions deficit, and goodwill resulting from corporate reorganizations and acquisitions, deferred tax assets, investments in Tier 1 Regulatory securities of other financial institutions, investment in own shares (treasury stock) and others as mandated by the SBS, and additional Tier 1 Regulatory Capital is subject to, among others, the following deductions: holdings, directly or indirectly, of equity and/or subordinated debt instruments eligible for additional Tier 1 Regulatory Capital, which have been issued by the company itself and which are held in treasury and investments in equity and/or subordinated debt instruments eligible for additional Tier 1 Regulatory Capital, issued by companies of the financial system or the insurance system, domestic or foreign and others as mandated by the SBS through general regulations.
Tier 2 Regulatory Capital consists of (i) equity and subordinated debt instruments, not included in Tier 1 Regulatory Capital, that meet the conditions set forth by the SBS, (ii) premiums of the above mentioned instruments, (iii) generic provisions up to 1.25% of the assets and contingencies weighted by credit risk when the standard method is used to determine the regulatory capital requirement for credit risk, and (iv) other elements as defined by the SBS. Tier 2 Regulatory Capital is subject to certain deductions under the law, such as: holdings, directly or indirectly, of equity and/or subordinated debt instruments eligible for additional Tier 2 Regulatory Capital, which have been issued by the company itself and which are held in treasury and investments in equity and/or subordinated debt instruments eligible for additional Tier 2 Regulatory Capital, issued by companies of the financial system or the insurance system, domestic or foreign and others as mandated by the SBS through general regulations.
Banks are required to prepare and submit to the SBS, within the first 15 days of each month, a report analyzing the bank’s assets for the previous month and the total amount of the bank’s regulatory capital. Foreign currency denominated assets are valued in soles at an average exchange rate published by the SBS in effect as of the date of such report. The SBS shall establish the periodicity, format and other pertinent conditions of the reports to be submitted by Peruvian banks. The aforementioned reports must include (i) the equity requirement; (ii) the positions affected by the different risks; (iii) financial statements and other matters considered relevant by the SBS.
As part of the implementation of the Basel III standards, the SBS issued SBS Resolution No. 03950-2022 in December 2022 regulating new dispositions applicable for subordinated debt, in order to update the form of computation in the different levels and sublevels of the regulatory capital, in accordance with the characteristics of each element. This resolution became effective on January 1, 2023 and is applicable to subordinated debt incurred or created as from such date. However, subordinated debt incurred or created prior to its enactment is still considered in the calculation of regulatory capital.
In addition, SBS Resolution No. 03950-2022 was enacted mainly to reflect the new composition of the regulatory capital. As a result, non-redeemable subordinated debt is taken into account for the computation of additional Tier 1 Regulatory Capital, as opposed to the previous treatment, which allowed its computation as either Tier 1 or Tier 2 Regulatory Capital. Similarly, redeemable subordinated debt becomes part of the computation of Tier 2 Regulatory Capital only.
In accordance with SBS Resolution No. 03952-2022 (as amended from time to time) (which amended the SBS Resolution No. 14354-2009) that became effective on January 1, 2023, the 1,000% factor for risk-weighted assets for intangibles (excluding goodwill), deferred tax assets that originate from operating losses and deferred tax assets that exceed the threshold of 10% of “adjusted total capital” were removed from the computation of regulatory capital. To replicate the deductions established by Basel III, deferred income tax assets net of deferred income tax liabilities (excluding those in connection with goodwill and other intangibles) arising from temporary differences that do not exceed the threshold of 10% of Tier 1 Regulatory Capital received a weighting factor of 250%.
102
Further Implementation of Basel III Principles
Consistent with certain aspects of Basel III, the SBS issued SBS Resolution No. 03953-2022 and SBS Resolution No. 03954-2022 in order to update the methodologies for calculating the individual and sector concentration risk buffers (including regional and economic sector concentration) eliminating the capital buffer requirement for risk appetite and maintaining the requirement for measuring the interest rate risk of the banking book. Legislative Decree No. 1531 and SBS Resolution No. 03954-2022 aligned the capital conservation buffer in the Peruvian regulation, to the Basel III principles.
Starting in August 2022, the SBS issued a series of regulations focused on Basel III compliance, in accordance with Legislative Decree No. 1531. Focused on the further adequate implementation of Basel III Principles in Peru, the SBS then issued:
•
Subordinated Debt Regulation (Reglamento de Deuda Subordinada), SBS Resolution No. 03950-2022;
•
Regulation for the Regulatory Capital Requirements for Additional Risks, SBS Resolution No. 03953-2022;
•
Regulation that amends the Regulation on Regulatory Capital Requirements for Credit Risk, SBS Resolution No. 03952-2022, as amended by SBS Resolution No. 274-2024;
•
Regulation on the Computation of Reserves, Earnings, Donations and Equity Instruments in Regulatory Capital, SBS Resolution No. 03951-2022;
•
Regulation of Requirement of Conservation, Economic Cycle and Market Concentration Risk Buffers, SBS Resolution No. 03954-2022; and
•
Regulation for the Regulatory Capital Requirement for Market Risk and for Operational Risk, SBS Resolution No. 03955-2022.
In December, 2022, Legislative Decree No. 1531 was further regulated by SBS Resolution No. 03950-2022, which approved the Subordinated Debt Regulation Applicable to Financial Institutions. The Subordinated Debt Regulation Applicable to Financial Institutions in line with Legislative Decree No. 1531, eliminated Tier 3 Regulatory Capital/Subordinated Debt (i.e., Hybrid Instruments) which were used to cover market risk losses and excluded non-redeemable Subordinated Debt from the computation of Tier 2 Regulatory Capital.
With regards to subordinated debt, the Subordinated Debt Regulation Applicable to Financial Institutions made a distinction between two types of subordinated debt: (i) “Tier 1 Non-redeemable Subordinated Debt” (computable to Tier 1 Regulatory Capital only as additional Tier 1 Regulatory Capital) and (ii) “Tier 2 Redeemable Subordinated Debt” (computable to Tier 2 Regulatory Capital). For the purposes of the regulation, non-redeemable debt means that its principal amount is not amortized and generates perpetual periodic return, while redeemable debt means that its principal amount will be redeemed within a specified period of time. Tier 1 Non-redeemable Subordinated Debt has no expiration date or step-up incentives for early redemption, although it may contain a redemption option after 5 years, subject to (A) there being no expectation that the option will be exercised; (B) (x) such debt being previously or simultaneously replaced with another security that meets the characteristics of Additional Tier 1 Regulatory Capital or an instrument that is part of the Ordinary Tier 1 Regulatory Capital or (z) the financial institution demonstrating that after the exercise of the redemption option, the effective Regulatory Capital is above the overall limit and requirement of Additional Regulatory Capital, such calculation being subjected to the review of SBS and approved or rejected at SBS’ discretion. Moreover, Tier 1 Non-redeemable Subordinated Debt must (a) be subordinated to the accounts deposits of all individuals and corporations that maintain banking accounts opened at the relevant financial institution, general creditors and Tier 2 Subordinated Debt creditors and (b) contain a mechanism to absorb losses on a pro rata and pari passu basis through conversion into common shares or temporary or permanent condonation until Ordinary Tier 1 Regulatory Capital between total risk-weighted assets and contingent capital reaches 6.0%. In the event of surveillance, intervention, or dissolution and liquidation of the financial institution, Tier 1 Non-redeemable Debt shall be used to absorb losses after the use of any Ordinary Tier 1 Regulatory Capital and Additional Tier 1 Regulatory Capital (in that order). Tier 2 Redeemable Subordinated Debt shall have a due date of no earlier than 5 years and no step-up benefits (readjustments to interest rate will not be considered as step-up provided that the implicit spread for the initial rate is not increased in respect to the final rate). It may include a redemption option at the issuer’s initiative only after 5 years and provided that (A) there being no expectation that the option will be exercised; (B) (x) such debt being previously or simultaneously replaced with another security that meets the characteristics of Tier 2 Regulatory Capital; or (z) the financial institution demonstrating that the Regulatory Capital is above the overall limit, buffer requirement and requirements of regulatory capital for additional risks, such calculation being subjected to the review of SBS and approved or rejected at SBS’ discretion. During the last 5-year period prior to maturity, a 20% annual discount factor is applied for purposes of computation as Tier 2 Regulatory Capital. In the event of surveillance, intervention, or dissolution and liquidation of the financial institution, Tier 2 Regulatory Capital shall be used to absorb losses after the use of any instruments eligible for Tier 1 Regulatory Capital, and instruments eligible for Tier 2 Regulatory Capital (in that order).
103
Subordinated Debt Regulation
In December 2022, Legislative Decree No. 1531 was further regulated by SBS Resolution No. 03950-2022, which approved the Subordinated Debt Regulation Applicable to Financial Institutions. The Subordinated Debt Regulation Applicable to Financial Institutions provided for two Ordinary Tier 1 Regulatory Capital: (i) Ordinary Tier 1 Regulatory Capital equal to or greater than 4.5% of total risk-weighted assets and contingent liabilities, and (ii) Effective Tier 1 Regulatory Capital which, in its entirety and considering ordinary capital and additional ordinary capital, must be equal to or greater than 6.0%. Moreover, the Subordinated Debt Regulation Applicable to Financial Institutions eliminated Tier 3 Regulatory Capital/Subordinated Debt (i.e., Hybrid Instruments) which were used to cover market risk losses and excluded non-redeemable Subordinated Debt from the computation of Tier 2 Regulatory Capital.
With regards to subordinated debt, the Subordinated Debt Regulation Applicable to Financial Institutions made a distinction between two types of subordinated debt: (i) “Tier 1 Non-redeemable Subordinated Debt” (computable to Tier 1 Regulatory Capital only as additional Tier 1 Regulatory Capital) and (ii) “Tier 2 Redeemable Subordinated Debt” (computable to Tier 2 Regulatory Capital). For the purposes of the regulation, non-redeemable debt means that its principal amount is not amortized and generates perpetual periodic return, while redeemable debt means that its principal amount will be redeemed within a specified period of time.
Regulation of Requirement of Conservation, Economic Cycle and Market Concentration Risk Buffers
Moreover, in December 2022, the SBS issued SBS Resolution No. 03954-2022, which approved the “Regulation for the Requirement of Conservation, Economic Cycle and Market Concentration Risk Buffers” (Reglamento para el Requerimiento de Colchones de Conservación, por Ciclo Económico y por Riesgo por Concentración de Mercado). This new regulation updated the methodologies for calculating the individual and sector concentration risk buffers, in compliance with the Basel III standards, and further regulated article 199 of the Peruvian Banking and Insurance Law. The Regulation for the Requirement of Conservation, Economic Cycle and Market Concentration Risk Buffers describes four types of risk buffers, to be gradually implemented, namely: (i) Capital Conservation Risk Buffer; (ii) Economic Cycle Risk Buffer; (iii) Market Conservation Risk Buffer; and (iv) Combined Risk Buffer.
The Capital Conservation Risk Buffer provides that companies have to accumulate a risk buffer (over the requirements set forth in article 199 of the Peruvian Banking and Insurance Law) to be used when losses have been incurred during periods of stress. The minimum risk buffer established amounts to 2.5% of total risk-weighted assets and contingent liabilities, which is determined based on the methodology described in the Regulation for the Requirement of Conservation, Economic Cycle and Market Concentration Risk Buffers. Non-compliance with the minimum requirement of risk buffers would result in the application of restrictions in connection with (i) the repurchase of shares that qualify as Tier 1 Regulatory Capital, and (ii) the distribution of profits to Tier 1 Regulatory Capital (e.g., dividends), except for distribution of stock dividends charged to the prior year's earnings (up to 60.0% for deficit less than or equal to 25.0%, 40.0% for deficit greater than 25.0% and less than or equal to 50.0%, 20.0% for deficit greater than 50.0% and less than or equal to 75.0%, deficit greater than 75.0% does not allow distribution).
The Economic Cycle Risk Buffer serves to counteract fluctuations in the economic cycle by recalibrating the marginal weighting factors of credit risk-weighted assets used for the calculation of this buffer based on the Additional Regulatory Capital Requirement Regulation. The operation aspects of the Economic Cycle Risk Buffer can be divided into “accumulation” and “de-accumulation”. Accumulation means that Ordinary Tier 1 Regulatory Capital must be maintained above the minimum requirements of Article 199 of the Peruvian Banking and Insurance Law, for the amount resulting from applying the calculation methodology chosen by the financial institution. In cases of non-compliance, restrictions will apply in connection with (i) the repurchase of shares that count towards Tier 1 Regulatory Capital and (ii) the distribution of profits to Tier 1 Regulatory Capital (e.g., dividends), except for distribution of dividends in shares. “De-accumulation” means that the buffer is no longer required and the requirement is equal to zero and accumulated Tier 1 Regulatory Capital can be used to cover the economic cycle buffer requirement. The calculations related to the Economic Cycle Risk Buffer shall be conducted (i) monthly when the rule is activated and the requirement is in force and (ii) at the time when the rule is deactivated and the requirement is not in force.
The Market Conservation Risk Buffer seeks to counteract negative effects on the stability of the system and Peru’s economic activity resulting from the potential financial deterioration of large, highly interconnected, difficult to substitute and highly complex companies. It employs, for the purposes of its calculation, a Market Concentration Risk Indicator that considers aspects related to size, interconnection, substitutability and financial infrastructure, and the complexity of the companies in the financial system. This Risk Buffer applies to (i) banks, (ii) investment banks, and (iii) Peruvian multiple operating companies that are part of a bank’s economic group.
Finally, the Combined Risk Buffer is the sum of the Conservation, Economic Cycle and Market Concentration Risk Buffer requirements. In addition to compliance with each individual buffer, the combined buffer requirement to be covered with
104
additional Ordinary Tier 1 Regulatory Capital must be met. The methodology for its calculation is as follows: (i) Ordinary Tier 1 Regulatory Capital (after covering the requirement set in Article 199 of the Peruvian Banking and Insurance Law) minus (ii) the portion of Ordinary Tier 1 Regulatory Capital that covers the Conservation, Economic Cycle and Market Concentration Risk Buffer. If a company fails to comply with the abovementioned requirements, it may continue its operations, however it may not (i) repurchase its shares that count towards Tier 1 Regulatory Capital or (ii) distribute profits to Tier 1 Regulatory Capital (e.g., dividends), except for distribution of dividends in shares.
As of the date of this Annual Report on Form 20-F, Interbank is in compliance with the additional regulatory capital requirements approved by the SBS.Interbank is evaluating the impact of such changes to the regulatory capital requirements on its financial results and condition. As of the date of this Annual Report on Form 20-F, Interbank is fully compliant with applicable capital regulatory requirements, and it expects to continue to comply with such regulatory capital requirements, and does not anticipate such regulatory changes to have a material impact on its solvency.
Liquidity Requirements of Basel III Principles
In December 2023, the SBS approved SBS Resolution No. 04221-2023 (as amended), which entered into effect on January 1, 2024, and established new regulations for liquidity risk management, including a new calculation of the liquidity coverage ratio. The liquidity ratio coverage is a ratio for financial institutions to ensure the maintenance of adequate levels of high-quality liquidity assets (ALAC, for its acronym in Spanish) that could easily be converted into cash to meet liquidity needs, for a 30-calendar day period, under a stress liquidity scenario. High-quality liquidity assets are defined as assets that are easily and immediately convertible into cash, with minimum or no loss of value during the stress period.
Pursuant to SBS Resolution No. 4221-2023 (as amended), the net stable funding ratio (RFNE for its acronym in Spanish) was introduced. This new ratio aims to ensure that financial institutions maintain a stable funding profile in relation to the composition of their assets and off-balance sheet (contingent) exposures. RFNE must be equal or greater than 100%. All provisions in relation to its application entered into effect on December 1, 2024. Furthermore, once the RFNE becomes applicable, financial institutions will have an adequacy period to comply with the aforementioned limit, as described below:
Period
RFNE Limit
From December 2024
80
%
From December 2025
90
%
From December 2026
100
%
Classification of the Loan Portfolio
According to SBS regulations, the provision for loan losses is calculated and recorded following SBS Resolution No. 11356-2008, as amended, which sets parameters to determine the calculation of provisions which is based on formulas and the use of specific percentages over the balances of loans and collateral received. For example, banks must consider certain criteria with respect to the borrower, including securities, credit category, borrower’s liquidity, borrower’s equity and outstanding debt, among others. Also, it requires constitution of generic provisions based on total loan portfolio, including generic provisions on not-impaired loans. The loan portfolio provisions which result from such classification differ materially from the loan portfolio provisions which would result had we applied IFRS Accounting Standards. For a discussion of our loan portfolio classification policies and the resulting provisions, see “Item 4. Information on the Company—Selected Statistical Information—Classification of our Loan Portfolio and—Impairment Allowance for Loans” and “Note 29.1 Credit Risk” to our audited annual consolidated financial statements. Similarly, SBS Resolution No. 6941-2008, as amended, sets parameters for managing the risk of over-indebtedness of retail debtors (understood as individuals or legal entities with direct and indirect consumer, microenterprise and/or housing mortgage loans). Its main provisions include the responsibility of companies and their board of directors in the management of the risk, as well as prudential measures to manage the risk of over-indebtedness.
Beginning on January 1, 2021, the SBS introduced a reporting rule under Peruvian GAAP whereby non-revolving credit card loans must be reported as other non-revolving consumer loans. This change resulted in a reduction in Interbank’s credit card loan balances and an increase in consumer loans in the same proportion as the credit card balances were reduced.
105
In December 2023, the SBS approved SBS Resolution N° 04345-2023 -as amended by SBS Resolution No. 04347-2024- (which is expected to come into effect in March 2026) to amend, among others, SBS Resolution No. 11356-2008 by including definitions and criteria for the management and classification of commitments. As a result, banks were instructed to prepare an adaptation plan, including the actions that will be taken and a schedule to implement them.
Risk of Over-Indebtedness by Consumer Banking Customers
According to SBS Resolution No. 6941-2008, as amended, banks and other financial entities must adopt a system to manage the risk of over-indebtedness that (a) allows the mitigation of such risk before and after making the loan, (b) permits the performance of a permanent monitoring of the portfolio to identify over-indebted borrowers and (c) includes the periodic evaluation of the control mechanisms being used and of the corrective actions or required improvements, as the case may be. The board of directors of such banks and other financial entities are responsible for (i) establishing and reviewing the policies and proceedings for the identification, measuring, treatment, control, reporting and monitoring of the risk from the level of indebtedness of its consumer banking customers and (ii) causing the management to adopt the necessary measures to monitor and control such risks. In addition, the board of directors must cause the bank and/or financial entity to have an organizational structure that guarantees total independence between the risk and the commercial divisions and that the incentive schemes for employees’ performance does not cause a conflict of interest with risk management policies.
Banks and financial entities that are not able to monitor, control and identify the risk of over-indebtedness are obliged to maintain a special loan loss reserve. Banks and financial entities that comply with the requirements described above are not required to maintain any such specific provision.
Legal Reserve Requirements
Pursuant to Article 67 of the Peruvian Banking and Insurance Law, all banks must create a legal reserve.
Each year a bank must allocate 10% of its net income to its legal reserve until its legal reserve is equal to 35% of its paid-in capital. Any subsequent increases in paid-in capital will imply a corresponding increase in the required level of the legal reserves to be funded as described above.
Lending Limits
Under Article 206 of the Peruvian Banking and Insurance Law, the total amount of direct and indirect credits and financings granted in favor of a person shall not exceed 10% of the bank’s regulatory capital. A person is defined for the purposes therein as a person or group of persons or entities representing a common or single risk.
The SBS has issued special regulations establishing the guidelines that must be followed by banks when determining legal reserves for legal proceedings for past-due loans and foreclosures.
For purposes of Peruvian Banking and Insurance Law, a single borrower includes an individual or an economic group. An economic group constituting a single or common risk, according to Peruvian Banking and Insurance Law, includes a person, such person’s close relatives and companies in which such person or close relatives have significant share ownership or decision-making capability. According to current regulations, shareholders who own or control directly or indirectly at least 4% of a company’s shares are considered to share common risk with such company. Significant decision-making capability is deemed to be present when, among others, a person or group can exercise material and ongoing influence upon the decisions of a company, when a person or company holds seats on the board of directors or has principal officers in another company, or when it can be assumed that one company or person is the beneficial recipient of credit facilities granted to another company.
The 10% limit indicated above may be raised to 15%, 20% and 30%, depending on the type of collateral securing the excess over each limit. For instance, the limit can be extended to 15% when the excess is secured by a mortgage; it may be raised to 20% when the excess is collateralized with securities listed in the Selective Index of the BVL (ISBVL); and it may be raised to 30% when the excess is secured with deposits that are maintained and pledged with the bank.
Other special lending limits must also be taken into account, such as lending to related parties or affiliates (30% of regulatory capital), to local banks (30%), and to foreign banks (from 5% for non-regulated banks to 30% for first category international banks, which may also be raised to 50% when backed by letters of credit). There are other limits that require banks to diversify their portfolio through different types of assets, benefiting liquid and low-risk assets.
106
Nonetheless, Legislative Decree No. 1646 (which is scheduled to come into effect in June 2025) will amend the lending limits described above based on concentration risk according to international standards to safeguard the solvency and stability of the Peruvian financial system. For instance, financings granted to related parties shall not exceed twenty-five percent (25%) of the bank’s Tier 1 Regulatory Capital. Additionally, the new rules introduce the concept of “large exposure”, which is applicable when direct and indirect credits and financings granted in favor of a person equals or exceeds 10% of the bank’s Tier 1 Regulatory Capital. According to Article 203 (as amended by Legislative Decree N° 1646), the SBS will regulate criteria for the calculation of, as well as limits to, the total amount of a bank’s large exposures.
In addition, according to Article 204 (as amended by Legislative Decree No. 1646), the total amount of direct and indirect credits and financings granted in favor of a person shall not exceed 15% of the bank’s Tier 1 Regulatory Capital if there is no collateral. Depending on the type of collateral securing the excess over each limit or whether the exposure is incurred in relation to foreign banking institutions, the limit may be raised to 25%. However, under no circumstances the exposure to a person or group of persons representing a common or single risk shall exceed 25% of the bank’s Tier 1 Regulatory Capital. Furthermore, the financing granted by a bank that must maintain a cushion for market concentration risk to another entity of the financial system that must maintain said cushion and to the members of the group of persons connected by single risk of the latter that are holding companies of its financial group or companies of the local financial system and abroad, may not exceed 15% of the lending bank’s Tier 1 Regulatory Capital.
Under Legislative Decree N° 1646, the SBS was granted a term of 180 days to issue the regulations needed to apply the amended Articles. On March 12, 2025, the SBS approved these regulations by means of SBS Resolution No. 00975-2025. This resolution amends the definition of “Economic Group”, “Control” and “Financial and Mixed Conglomerates”. Additionally, the regulations establish new criteria to define related party borrowings and groups of counterparties connected by single risk, as well as the calculation of lending limits set forth in the “new” articles 201, 202, 203 and 204 of the Peruvian Banking and Insurance Law. Such regulations will come into effect in June 2025.
Furthermore, SBS Resolution No. 00975-2025 includes a timetable to comply with the new limits. The first compliance period spans from June 2025 to December 2026, with subsequent periods measured annually until May 2030 and beyond.
Lending to Related Parties
The Peruvian Banking and Insurance Law regulates and limits transactions with related parties and affiliates of financial institutions, on an unconsolidated basis. In 2015, the SBS and the SMV enacted new regulations containing definitions of indirect ownership, related parties and economic groups, which serve as the basis for determining limits on transactions with related parties and affiliates. These regulations also provide the basis for the subsequent development of specific supervision standards of financial institutions and conglomerates formed by financial institutions.
Additionally, pursuant to Article 202 of the Peruvian Banking and Insurance Law, the aggregate amount of loans to related party borrowers may not exceed 30% of a bank’s regulatory capital (exceptionally, according to Circular B-2148-2005, as amended, the amount of loans to related parties may not exceed 50% of a bank’s regulatory capital if the excess of 30% is secured by credit letters from foreign financial institutions). For purposes of this test and in accordance with regulations of economic group, related party borrower includes any person or an affiliate of that person holding, directly or indirectly, 4% or more of a bank’s capital stock, directors, certain of the bank’s principal executive officers or other persons in more junior positions affiliated with the bank’s management.
All loans to related parties must be made on an arm’s-length basis with terms no more favorable than the best terms that Interbank would offer to the public.
In addition, under Article 201 of the Peruvian Banking and Insurance Law, the total amount of loans extended to directors, officers, employees or close relatives of any such persons may not exceed 7% of a bank’s regulatory capital. All loans made to any single such related party borrower may not exceed 0.35% of a bank’s regulatory capital (i.e., 5% of the overall 7% limit) per each person, including such person’s spouse and relatives. In addition, the Peruvian Banking and Insurance Law generally provides that banks may not extend credit to or guarantee the obligations of employees or members of the board of directors, except for home mortgage loans to employees and directors.
However, Legislative Decree No. 1646 (which will come into effect in June 2025), will amend Articles 201 and 202 previously described. Under the amended Article 202, the aggregate amount of financings (whether in the form of loans, investments, contingent financing or other modalities) to related party borrowers may not exceed 25% of a bank’s Tier 1 Regulatory Capital. Furthermore, the amended article grants authority to the SBS to establish the criteria for the global limit applicable to financing of related parties.
107
In addition, under the amended Article 201 of the Peruvian Banking and Insurance Law, the total amount of financings (whether in the form of loans, investments, contingent financing or other modalities) extended to directors, officers, employees or close relatives of any such persons may not exceed 10% of a bank’s Tier 1 Regulatory Capital. The aforementioned financings must be made on an arm’s-length basis with terms no more favorable than the best terms that we would offer to the public, except for home mortgage loans to employees.
Consumer Lending
As a general rule, interest rates within the Peruvian financial system are freely determined by the market. However, on March 18, 2021, the Peruvian Congress approved Law No. 31143 (Law that Protects Financial Consumers from Usury) which amended certain articles of the Central Reserve Bank of Peru’s organic law, the Peruvian Banking and Insurance Law and Law No. 28587 (Complementary Law to the Consumer Protection Law on Matters of Financial Services) in order to allow the Central Reserve Bank of Peru to establish maximum interest rates, exclusively, for the activities described in literal c) of Article 221 of the Peruvian Banking and Insurance Law, which include consumer lending and lending to small and micro enterprises. The application of interest rates above the aforementioned limit constitutes a criminal offense typified as usury under Article 214 the Peruvian criminal code. As of the date of this Annual Report on Form 20-F, the maximum interest rate is 112.98% for local currency operations and 93.86%for foreign currency operations.
Other changes brought upon by Law No. 31143 provide a wider protection to consumers include the prohibition to capitalize interests and impose penalties or other commissions (in addition to default interest charges) upon default of the consumer. Furthermore, it established that any commissions or expenses charged by financial institutions must involve the provision of services, additional and/or complementary to the operations contracted by users, effectively rendered and which costs are real and provable through a technical report previously reviewed and approved by the SBS.
Country Risk Reserve Requirements
SBS Resolution No. 7932-2015, enacted in December 2015, requires the funding of reserves to cover exposure to country risk, which is defined to include sovereign risk, transfer risk and expropriation or nationalization risk, all of which may affect operations with companies or individuals in foreign countries. The SBS has also established guidelines indicating the procedures and responsibilities necessary for coping with country risk.
Integral Risk Management
Integral risk management is a process intended to identify potential events that can affect banks and to manage those events according to their nature and risk level. In January 2017, the SBS enacted the SBS Resolution No. 272-2017, which replaced SBS Resolution No. 037-2008. SBS Resolution No. 272-2017 (as amended from time to time) contains guidelines for integral risk management of financial institutions and covers all kinds of risks that could affect a banking operation, such as operational, market, credit, AML, liquidity and reputational risks. Furthermore, it introduced various changes, focusing on corporate governance practices including the following: (i) two or more independent directors must be appointed when boards are integrated by six or more members, (ii) a remunerations committee must be formed and (iii) concepts such as ‘risk appetite’, ‘risk capacity’ and ‘risk limits’ have been modeled after the Principles for an Effective Risk Appetite Framework of the Financial Stability Board.
In addition, in January 2023, the SBS approved the SBS Resolution No. 00053-2023 (the Model Risk Management Regulation, as amended by SBS Resolution No. 03884-2024), which establishes minimum guidelines to mitigate the risks derived from the use of models used in the management of credit, market, liquidity, operational, and money laundering and terrorist financing risks of companies in the financial and insurance system. This regulation establishes the definition of model and model risks, the corporate governance framework for model risk management and the minimum guidelines for the development, validation, implementation, use and monitoring of models. Its application will be phased-in commencing in December 2023 through May 2026, given the need to properly implement at the operational level adequate tools to assess the risks that are intended to be managed with the models and the categorization of the models used.
Credit Risk
According to the Peruvian Banking and Insurance Law, as of July 1, 2009, financial institutions would have been allowed to use the IRB methodology instead of the standardized methodology for calculating their regulatory capital requirement for credit risk, after receiving prior approval from the SBS. However, regulations required for the full implementation of both standardized and IRB methodologies by Peruvian financial institutions were not enacted until November 4, 2009, with SBS Resolution No. 14354-2009.
Under SBS Resolution No. 14354-2009 (as amended from time to time), enacted in November 2009, financial institutions are allowed to use the standardized methodology and, with the prior approval of the SBS, IRB methodologies for
108
calculating their regulatory capital requirement for credit risk. Interbank has not decided if it will request approval from the SBS to adopt the IRB methodology.
In addition, according to SBS Resolution No. 3780-2011 (as amended from time to time), financial institutions are required to implement an organizational structure and certain procedures in connection with control on interest management and strategic needs procedures in order to adequately manage credit risk. SBS Resolution No. 8548-2012, enacted in November 2012, establishes new guidelines for calculation of risk weighted assets for personnel (planilla), credit card and mortgage exposure resulting in more capital requirements for credit risk.
Market Risk
Regulations for the supervision of market risks, enacted in May 1998, require banks to establish internal policies and procedures to monitor these risks, as well as market risk exposure limits. Regulations define market risk as the probability of loss derived from exposure to various classes of commodities, securities, foreign exchange, derivative operations or commercial assets that banks may hold in their portfolio, which may, or may not, be accounted for in their statements of financial position. In June 2009, the SBS enacted SBS Resolution No. 6328-2009 (as amended from time to time), which defines the methodology to be applied, and the requirements to be satisfied, to calculate the regulatory capital requirement for market risks under the standard methodology and the IRB methodology.
Operational Risk
SBS Resolution No. 2115-2009 (as amended), enacted in April 2009, defined the methodology to be applied, and the requirements to be satisfied, by financial institutions in calculating their regulatory capital requirement for operational risk under the IRB methodology, the alternative standardized methodology and the advanced methodologies. However, as the advanced methodologies approach was part of the Basel II principles, this alternative was eliminated as part of SBS Resolution No. 03955-2022’s updates in alignment with the Basel III principles because internal operational risk models had failed to adequately reflect the risks. The IRB methodology uses a bank’s gross operational margin as an “exposure indicator,” and its application does not require the prior approval by the SBS. Application of the alternative standardized methodology requires compliance with certain provisions included in SBS Resolution No. 2115-2009 (as amended from time to time) and prior approval from the SBS.
SBS Resolution No. 2116-2009 (as amended), enacted in April 2009, approved the guidelines for managing operational risk, and defined “operational risk” as the possibility of suffering losses due to inadequate procedures, failures of personnel, IT or external events, including, without limitation, legal risks (but excluding strategic and reputational risk). It also established that a bank’s board of directors is responsible for designing the general policies to manage operational risk and that a bank’s management is in charge of implementing such policies. Finally, it provided that each bank is obligated to create a database of all of such bank’s losses due to operational risk, classifying such losses by event.
SBS Resolution No. 00053-2023 (as amended), enacted in January 2023, introduced regulations on how to manage the risks that arise from the use of models to process information in financial institutions. Model risk is defined as the possibility of losses or adverse consequences arising from weaknesses in model development, validation, implementation, use and monitoring. The foregoing resolution further states that model risk can arise from inadequate specifications or methodologies, erroneous estimates, incorrect assumptions, calculation errors, inaccurate, inappropriate or incomplete data, inappropriate, improper or unforeseen use of the model, lack of understanding of the model’s limitations, and inadequate monitoring and/or controls. This regulation will be gradually implemented. Financial institutions within its scope, such as the bank, are required to provide the SBS with assessments of their models in accordance with the schedule determined by SBS.
Model Risk
SBS Resolution No. 00053-2023 (as amended), enacted in January 2023, introduced regulations on how to manage the risks that arise from the use of models to process information in financial institutions. Model risk is defined as the possibility of losses or adverse consequences arising from weaknesses in model development, validation, implementation, use and monitoring. The foregoing resolution further states that model risk can arise from inadequate specifications or methodologies, erroneous estimates, incorrect assumptions, calculation errors, inaccurate, inappropriate or incomplete data, inappropriate, improper or unforeseen use of the model, lack of understanding of the model’s limitations, and inadequate monitoring and/or controls. This regulation will be gradually implemented commencing in June 2024 through May 2026, given the need to properly implement at the operational level adequate tools to assess the risks that are intended to be managed with the models and the categorization of the models used. Financial institutions within its scope, such as the bank, are required to provide the SBS with assessments of their models in accordance with the schedule determined by SBS.
109
Management of Legal Proceedings
SBS Resolution No. 2451-2021, enacted in August 2021, established minimum procedures for the management, classification, reporting and creation of provisions in relation to legal proceedings. According to this resolution, financial institutions’ boards of directors must approve policies and procedures covering those matters and fulfilling certain minimum requirements as set forth in the resolution. Furthermore, financial institutions must submit reports to the SBS semi-annually with information on all current litigation matters and, in particular, adverse legal proceedings that are classified as “probable”.
The SBS can request, at any time, additional information on any specific litigation matter, make corrections to classifications and provisions when it considers that the legal proceedings present inconsistencies or are insufficiently sustained.
The resolution also amended the Accounting Manual for financial institutions with respect to the accounting treatment of provisions derived from legal proceedings depending on whether they are classified as “probable”, “remote” or “possible”.
Investments in Financial Instruments
Investment in financial instruments by Peruvian banks is restricted to those financial instruments listed in the Peruvian Banking and Insurance Law, such as equity instruments traded on a stock exchange, debt instruments (to the extent that certain requirements are satisfied), sovereign debt instruments and quotas in mutual and investment funds, among others.
Pursuant to SBS Resolution No. 7033-2012 (as amended from time to time), investments in financial instruments by Peruvian banks shall be classified into any of the following categories: (a) investments at fair value with changes in results (short-term), (b) investments available-for-sale, (c) investments until maturity (long-term) and (d) investments in subsidiaries and affiliates.
In July 2018, the SBS issued SBS Resolution No. 2610-2018, which became effective as of October 1, 2018, and amended the regulation on classification and valuation of investments approved by SBS Resolution No. 7033-2012 and its amendments. The main amendment contained in this resolution is the introduction of standard methodology for the identification of impairment of financial instruments classified as available-for-sale investments and held-to-maturity investments. The annex to this resolution has been amended by SBS Resolution No. 04034-2022, which became effective on December 31, 2022.
Reserve Requirements from the Central Reserve Bank of Peru
Under the Peruvian Banking and Insurance Law, all financial institutions regulated by the SBS (except for small-business development non-bank institutions) are required to maintain a legal reserve (encaje) for certain obligations. The Central Reserve Bank of Peru may require additional marginal reserves. The exact level and method of calculation of these reserve requirements is set by the Central Reserve Bank of Peru, which has issued different sets of regulations for foreign and local currency-denominated obligations of banks. The following liabilities, among others, are subject to the reserve requirement: demand and time deposits, savings accounts, certain obligations, securities, certain bonds and funds administered by the bank. Subject to certain requirements, the regulation excludes mid-term and long-term funding (i.e., more than two years) from foreign financial institutions, other central banks, governments or multilateral lending agencies. Since 2004, the Central Reserve Bank of Peru requires reserves on amounts due to foreign banks and other foreign financial institutions.
As of December 31, 2024, the minimum legal reserve requirement for local and foreign currency deposits was 5.50% and 9%, respectively. Local and foreign currency liabilities are subject to a marginal rate of 35% for funds that exceed a certain level set by the Central Reserve Bank of Peru. Local and foreign currency borrowings from certain foreign sources with an original maturity of two years or less are subject to the following special rates: (a) 9% special rate in local currency, and (b) (i) 35% in foreign currency from borrowings incurred from July 1, 2023, and (ii) 9% in foreign currency for borrowings incurred up to June 30, 2023. Financial institutions may satisfy the minimum reserve requirements with funds that they hold in vaults or that they have deposited in their accounts at the Central Reserve Bank of Peru.
Subject to certain requirements, the regulation excludes from the reserve requirement mid-term and long-term funding (i.e., liabilities with a minimum average maturity of more than two years, subject to other conditions) through the issuance of securities.
They must also keep at least 1.0% and 3.0% of their local and foreign currency deposited in the Central Reserve Bank of Peru, respectively. The Central Reserve Bank of Peru oversees compliance with the reserve requirements.
110
The Central Reserve Bank of Peru also establishes the interest rate payable on reserves that exceed the minimum legal reserve requirement applicable to both local and foreign currency deposits. The current applicable interest rate: (a) for local currency reserves, different from those described below, is the higher of 0.0% or the overnight deposits interest rate, minus 1.95%; and (b) for foreign currency deposits, is the higher of (i) 25.0% of the Chicago Mercantile Exchange (“CME”) Term SOFR for one month minus 10 basis points, and (ii) the CME Term SOFR rate for one month minus 50 basis points. The applicable interest rate is periodically revised by the Central Reserve Bank of Peru in accordance with monetary policy objectives. In the past, the Central Reserve Bank of Peru has on numerous occasions changed the deposit reserve requirements applicable to Peruvian commercial banks and both the rate of interest paid on deposit reserves and the amount of deposit reserves on which no interest is payable by the Central Reserve Bank of Peru.
Special provisions as a result of social unrest and climate phenomenon
On December 7, 2022, Peruvian former President Pedro Castillo announced his intention to dissolve the Peruvian Congress and to intervene in, among others, the Peruvian judicial branch and Superior Court. Mr. Castillo’s actions were deemed to constitute an attempted coup, which led to his impeachment and arrest. According to the Peruvian Constitution, Mr. Castillo was succeeded by his then vice-president, Dina Boluarte. Following Mr. Castillo’s impeachment, a wave of protests in support of Mr. Castillo erupted across the country, which led President Boluarte to declare a state of emergency across several regions in Peru on December 12, 2022. Protests continued until March 2023.
In that context, the SBS approved a series of measures to reschedule retail loans that had been affected by the protests and social unrest in Peru, similar to those implemented to minimize the impact of the COVID-19 pandemic. Pursuant to Oficio Múltiple N° 54961-2022, issued on December 22, 2022, the SBS established exceptional measures applicable to retail loans, allowing financial institutions to amend contractual conditions without characterizing them as refinanced loans as long as the amended loan complied with certain loan characteristics.
Additionally, through Oficio Múltiple No. 12174-2023, issued on March 15, 2023, the SBS established exceptional measures applicable to retail clients according to the geographic scope determined by each financial company and prior analysis of the level of impact on its portfolio of debtors, allowing the entities to amend the contractual conditions of the different types of loans for retail debtors, without such amendment being considered a refinancing provided certain criteria was complied with.
Due to the high uncertainty caused by the intensity of the “El Niño” phenomenon, in 2023 we had to increase our monitoring of the performance results of our retail and commercial clients and make subsequent adjustments of expected loss to our model, which in turn created a certain level of uncertainty in the estimation of expected losses on loans, which we may face in the future.
Lastly, the excess liquidity generated by measures during 2024, such as the withdrawal of CTS deposits and pension funds, has led to an improvement in the risk rating scoring (“BURO”), which has affected the regular behavior and performance of expected credit losses in the retail client segment. Under these circumstances, it has been necessary to enhance the monitoring of the expected loss model outcomes and to record subsequent adjustments to the calculations. These adjustments aim to neutralize the temporary improvements in credit scoring and ensure a more accurate risk estimation, considering the current uncertainty in loan performance.
Deposit Insurance Fund
Bank deposits are protected by the Fondo de Seguros de Depósito (Deposit Insurance Fund), against bank failure. Specifically, savings deposit by natural persons, savings deposit accounts maintained by non-profit entities and checking accounts are covered in full up to an amount that is revised quarterly by the SBS. The maximum coverage amount is S/121,000 per person per bank for the period March 2025 – May 2025.
The Deposit Insurance Fund was established in 1991 and was organized as a private corporation in 1996. The Deposit Insurance Fund’s governing body is led by a representative of the SBS. The additional members are appointed by the Central Reserve Bank of Peru (one member), the MEF (one member) and by the banks (three members). SBS provides the necessary administrative members and operational resources for the Deposit Insurance Fund.
The financial resources available to the Deposit Insurance Fund pursuant to the Peruvian Banking and Insurance Law include, among others, the original contribution from the Central Reserve Bank of Peru, insurance premiums paid by banks, unclaimed bank deposits (after 10 years) and fines imposed by the SBS for violations of the Peruvian Banking and Insurance Law.
In addition, the Deposit Insurance Fund may, in extraordinary situations, borrow funds with authorization from the Peruvian treasury, or it may borrow long-term government securities from the Peruvian treasury.
111
Changes in the regulation of the pension funds’ private administration system
Pursuant to Law No. 32123, enacted in September 2024, entities of the Peruvian financial system such as the bank will be able to participate directly in the private pension system by administering private pension funds. Currently, only AFPs are authorized to operate in Peru, and only four of them exist to cover the total demand. Thus, the new law seeks to increase the competition in the market in order to improve the conditions for pensioners in Peru. In order to participate in this market, entities of the financial system will need to follow the procedures and meet the requirements that the SBS will approve for such purposes. This reform will allow Interbank to potentially develop a new line of business by offering pension funds administration services to the public; however, it is still unclear when such regulation will be approved and what requirements will be demanded of entities of the financial system for them to participate.
Anti-Money Laundering Rules
Money laundering is considered a criminal act in Peru. A special legal framework was established in April 2002, which follows the 40 recommendations of the FATF, established by the G-7. Since then, this legal framework has been amended in order to improve and increase the efficiency of the Peruvian anti-money laundering system.
Money laundering includes a wide range of serious offenses such as tax evasion, terrorism, drug trafficking, corruption and other criminal activities. A special set of anti-money laundering rules applies specifically to banks, which includes specific rules for customer and employee due diligence and recordkeeping. In March 2008, the SBS enacted additional anti-money laundering provisions, pursuant to which, among other things, banks must establish a set of policies and procedures specifically aimed to prevent asset laundering and the financing of terrorist activities. In November 2008, the SBS modified the anti-money laundering provisions to include, among other changes, the obligations of Peruvian banks to verify that their branches and foreign subsidiaries comply with the anti-money laundering and terrorism financing provisions enacted by the SBS and with the recommendations of the FATF.
On February 17, 2011, the SBS modified current anti-money laundering provisions through SBS Resolution No. 2108-2011, as amended, in order to adapt these provisions to international standards established by the Financial Action Task Force of South America (Grupo de Acción Financiera de Sudamerica, or “GAFISUD”), in relation to due diligence in the identification of clients according to their risk and profile level, among other considerations. On May 14, 2015, and December 6, 2017, the SBS further amended and supplemented the aforementioned provisions through SBS Resolution No. 2660-2015 and SBS Resolution No. 4705-2017 (each as amended). SBS Resolution No. 2018-2011 was replaced by SBS Resolution No. 2891-2018, which became effective on October 1, 2018.
The government agency responsible for supervising the anti-money laundering system is the UIF, which was made part of the SBS in July 2007. The chairman of this agency is appointed by the chairman of the SBS. Additionally, Law No. 30424, enacted in April 2016 and which took effect on January 1, 2018, as amended, attributes criminal liability to legal entities when crimes related to money laundering, terrorist financing, bribery (including multinational bribery), tax fraud and customs offenses are committed on its behalf or for its benefit by any legal representative or de facto or de iure executive. Such regulation establishes that criminal liability will be exempted or mitigated if the legal entity has adopted an adequate and suitable prevention model following the criteria and minimum guidelines outlined in Law No. 30424. On January 9, 2019, Supreme Decree 002-2019-JUS (Reglamento de la Ley N° 30424) was enacted and took effect, setting forth further regulations and guidelines related to, among other things, the suitable prevention model to be implemented in accordance with Law No. 30424.
Disclosure of Material Information
All banks that are organized as corporations (the only exception being the Peruvian branches of foreign banks) are listed on the BVL. As a result, they are subject to the disclosure and reporting rules contained in the Peruvian Securities Market Law and the internal regulations of the SMV and the BVL. Banks are also subject to full disclosure and reporting obligations under the banking regulatory framework. See “Regulation and Supervision—The Peruvian Financial and Insurance Systems—The SMV”.
Intervention by the SBS and Liquidation
Pursuant to the Peruvian Banking and Insurance Law, the SBS has the power to interrupt the operations of a bank in order to prevent, or to control and reduce the effects of, a bank failure. Accordingly, the SBS may intervene in a bank’s business by adopting either a temporary surveillance regime or a definitive intervention regime (“Intervention”) depending on how critical the situation is deemed to be by the SBS. Intervention will be taken upon the occurrence of certain events, including (a) suspension of payments, (b) failure to comply with the restructuring plan during the surveillance regime, (c) regulatory capital is less than 50% of the minimum regulatory capital required (global limit) or (d) deficit or reduction of more than 50% of its regulatory capital in a 12-month period. Less drastic measures, such as (1) placing additional requirements, (2) ordering a capital increase or an asset divesture or (3) imposing a financial restructuring plan, may be also adopted by the SBS when the situation allows for them.
112
An Intervention may halt a bank’s operations for up to 45 days, and may be extended for a second period of up to 45 additional days, during which time the SBS may institute measures such as: (a) canceling losses by reducing reserves, capital and subordinated debt, (b) segregating certain assets and liabilities for transfer to another financial institution and (c) merging the intervened bank with another acquiring institution. After an Intervention, the SBS will proceed to dissolve and liquidate the bank unless the preceding option (c) was applied.
Beginning on the date on which a resolution of the SBS subjecting a bank to an Intervention regime is issued, and continuing until such Intervention is concluded (which period ends when the liquidation process begins), the Peruvian Banking and Insurance Law prevents any creditor of the bank from (a) initiating any judicial or administrative procedure for the collection of any amount owed by the bank, (b) enforcing any judicial decision rendered against the bank to secure payment of any of its obligations, (c) constituting a lien or attachment over any of the assets of the bank to secure payment of any of its obligations or (d) making any payment, advance or compensation or assuming any obligation on behalf of the bank, with the funds or assets that may belong to it and are held by third parties, except for (i) set-off compensation payments that are made between regulated entities of the Peruvian banking and financial sector and insurance industry and (ii) set-off of reciprocal obligations arising from repurchase agreements and operations with financial derivatives entered into with local or foreign financial and insurance institutions.
During liquidation, claims of bank creditors rank as follows:
First order—Labor claims:
•
1stEmployee remunerations.
•
2ndSocial benefits, contributions to the private and public pension system and other labor claims against the bank accrued until the date when the dissolution is declared, retirement pensions or the capital required to redeem those pensions or to secure them by purchasing annuities.
Second order—Claims for bank deposits and other types of saving instruments provided under the Peruvian Banking and Insurance Law, in the portion not covered by the Deposit Insurance Fund and the contributions and resources used by such Deposit Insurance Fund to cover the above-described claims for bank deposits and other types of saving instruments.
Third order—Taxes:
•
1stClaims by the Peruvian social security administration (Seguro Social de Salud del Perú EsSalud) related to health care benefits for which the bank is responsible as employer.
•
2ndTaxes.
Fourth order—Unsecured and non-privileged credits:
•
1stAll unsecured and non-privileged credits against the bank, ranked on the basis of (i) the date they were assumed or incurred by the bank whereby obligations assumed or incurred on an earlier date shall rank senior in right of payment to obligations assumed or incurred by the bank at a later date, and (ii) obligations assumed or incurred by the bank on a date that cannot be determined shall rank junior in right of payment to all the obligations comprised in (i) above and pari passu among themselves.
•
2ndThe legal interest on the bank’s obligations that may accrue during the liquidation.
•
3rdSubordinated debt.
Except for the first and second categories under unsecured and non-privileged credits, all claims within an order will be ranked pari passu among themselves. Each category of creditors will collect in the order indicated above, whereby distributions in one order will be subject to completing full distribution in the prior order. Any security interest created before the issuance of the resolution declaring the bank’s dissolution and the initiation of the liquidation process shall survive in order to guarantee the obligation it secures. The secured creditors shall retain the right to collect from the proceeds of the sale of the collateral, on a preferred basis (except with respect to labor claims, savings and deposits, which are privileged claims), subject to certain rules established under Article 119 of the Peruvian Banking and Insurance Law.
Peruvian banks are not subject to the regime of insolvency and bankruptcy otherwise applicable to Peruvian corporations in general.
113
Insurance Regulation and Supervision
Solvency Requirements and Regulatory Capital
Pursuant to the Peruvian Banking and Insurance Law, the SBS regulates the solvency margin of Peruvian insurance companies. The solvency margin is based upon calculations that take into account the annual amount of premiums and the medium burden of claims during a specified period (three latest annual periods) prior to the date on which calculation is made.
Insurance companies must also maintain a “solvency equity” (patrimonio de solvencia) which must be higher than (a) the solvency margin, or (b) the minimum capital required by law, or S/8,237,900 in accordance with Circular G-227-2025 for the period between April and June 2025. The required amount of solvency equity is recalculated at least monthly and is adjusted for inflation. If the insurance company has operations subject to credit risk, part of the solvency equity should be segregated for their coverage.
The Peruvian Banking and Insurance Law provides that insurance companies should have at all times a regulatory capital that should not be lower than the solvency equity detailed above.
Pursuant to Article 299 of the Peruvian Banking and Insurance Law, the regulatory capital intended to cover the operations of the insurance companies may consist of: (a) the insurance company's paid-in-capital, voluntary and legal reserves and premium for the issuance of shares; and (b) the computable portion of the subordinated debt that meets requirements established by the SBS.
In addition, Article 299 of the Peruvian Banking and Insurance Law sets forth the following procedure for the determination of the regulatory capital eligible to cover insurance risks: (a) adding the paid-in-capital, supplementary capital premium and the legal and voluntary reserves, if any; (b) adding the profits of previous fiscal years and the agreed capitalization of profits for the fiscal year in course; (c) subtracting the amount of investments in subordinated bonds and in shares of diverse nature made by insurance companies in other insurance companies engaged in different lines of business; (d) subtracting the losses of previous fiscal years and the fiscal year in course; and (e) subtracting the amount of goodwill resulting from the reorganization of the company, as well as from the acquisition of investments. Pursuant to SBS Resolution No. 3930-2017, the deduction referred to in (c) above shall be applied to: (i) any investment made in shares and instruments representing subordinated debt issued by Peruvian or foreign insurance companies, and (ii) any investment made in shares and instruments representing subordinated debt issued by its subsidiaries, holding companies and other companies with which corresponds to consolidate financial statements.
Furthermore, insurance companies shall maintain a guarantee reserve from its equity as a guarantee fund, in order to cover risks such as (a) insurance technical risks, and (b) credit risks of certain financial transactions specifically set forth in the Peruvian Banking and Insurance Law.
Reserves
The Peruvian Banking and Insurance Law provides that insurance companies shall constitute, on a monthly basis, the following technical reserves: (a) for claims, including those that took place and were not reported, past-due capital and income or benefits of the insured parties, with pending liquidation or payment; (b) mathematical, over life or income insurance; (c) for risks in course or non-accrued premiums; (d) for catastrophes and uncertain casualty risks; and (e) for risks of medical health or medical assistance insurance.
Article 67 of the Peruvian Banking and Insurance Law also requires that all insurance companies establish a legal reserve by setting aside 10% of adjusted income before taxes, until the reserve reaches at least 35% of their capital stock.
Under SBS GAAP following the adoption of new mortality tables in 2018 the SBS allowed the adjustment of technical reserves to be spread over 10 years. In contrast, our financial statements for the year ended December 31, 2018, under IFRS Accounting Standards, recorded a negative impact of S/144.8 million in our technical reserves due to the aggregate effect recorded in technical reserves on insurance policies issued prior to the date of adoption of the new mortality tables.
SBS Resolution No. 1143-2021 establishes the guidelines regarding the valuation and accounting record of the mathematical reserves for the insurance policies that grant long-term coverage (more than 1 year). As a result of the application of this regulation, Interseguro has recognized an impact for income/private insurance of S/35 million that is being reflected in accumulated results over the subsequent 14 quarters after its initial recognition in 2022.
114
Limit of Indebtedness
Insurance companies may only take credits, in the country or abroad, for a sum not exceeding an amount equivalent to its regulatory capital. In case such limit of indebtedness is surpassed, the insurance company shall submit to the SBS a program approved by its board of directors establishing the measures adopted to eliminate the excess within a term not exceeding three (3) months.
Investment Requirements
Pursuant to the Peruvian Banking and Insurance Law, the total amount of investments of a Peruvian insurance company shall cover the total amount of technical reserves at all times. For such purposes, technical reserves are defined as the sum of all obligations that an insurance company has vis-à-vis its insured clients plus the solvency equity, the guarantee fund and the regulatory capital for the economic cycle. The assets covering the technical reserves cannot be subject to any pledge, encumbrance or precautionary measure, which limits its free availability.
Peruvian insurance companies are allowed to invest in certain eligible assets such as instruments issued by the Peruvian Central Government, classified corporate bonds and shares, among others. However, in order to balance levels of risk, applicable regulations have imposed a number of limitations to insurance companies with respect to their investments (by issuer, economic group, type of instrument and nationality, among others). In general terms, no more than 15% of the total amount of an insurance company’s technical reserves may be invested in certain instruments (including, among others, stocks and bonds) issued by the same economic group, which may be reduced to 7% if certain additional conditions are met. The investment regulations further specify that investment policies of Peruvian insurance companies shall consider maximum limits by issuer (calculated over the regulatory capital of each company) depending on the type of investment and the insurance industry in which the company operates.
Pursuant to the Investment of Insurance Companies Regulation approved by SBS Resolution No. 1041-2016 (as amended), Interseguro has implemented a plan to reduce its exposure to related parties and comply with the limits established by Article 13 of the Reglamento de Supervisión Consolidada, approved by SBS Resolution No. 11823-2010 (as amended). In addition, Interseguro limits the amount of exposure to the credit risk in any of the issuers of the financial instruments, which it believes enable it to maintain adequate diversification of its financial investment portfolio.
Disclosure of Relevant Information
All insurance companies that are organized as corporations (the only exception being the Peruvian branches of foreign insurance companies) have their shares listed on the BVL. As a result, they are subject to the disclosure and reporting rules contained in the Peruvian Securities Market Law and the internal regulations of the BVL. Insurance companies are also subject to full disclosure and reporting obligations under the insurance regulatory framework. See “Regulation and Supervision—The Peruvian Financial and Insurance Systems—The SMV”.
Ownership Restrictions
The Peruvian Banking and Insurance Law establishes certain restrictions on the ownership of a bank and insurance company’s capital stock. Banks must have at least two unrelated shareholders at all times. Restrictions are placed on the ownership of shares of any bank or insurance company by persons that have committed certain crimes, as well as by public officials who have supervisory powers over banks or who are majority shareholders of an enterprise of a similar nature. All transfers of shares in a bank or insurance company must be reported to the SBS by the bank or insurance company.
Transfers involving the acquisition by any individual or corporation, whether directly or indirectly, of more than 10% of a bank or insurance company’s capital stock must receive prior authorization from the SBS. The SBS may deny authorization to such transfer of shares if the purchasers (or their shareholders in the case of legal persons) are legally disabled, have engaged in illegal activity in the areas of banking, finance, insurance or reinsurance, or if objections are raised on the basis of the purchaser’s moral fitness or financial solvency. The decision of the SBS on this matter is final and cannot be overturned in the courts. If a transfer is made without obtaining the prior approval of the SBS, the purchaser may be fined an amount equivalent to the value of the securities transferred. In addition, the purchaser will be required to sell the securities within 30 days, or the fine will double, and the purchaser is disqualified from exercising its voting rights at any shareholders’ meetings and to participate in the distribution of dividends. Foreign investors receive the same treatment as Peruvian nationals and are subject to the same limitations described above.
Risk Rating
The Peruvian Banking and Insurance Law and SBS Resolution No. 18400-2010, enacted in January 2011, require that all financial and insurance institutions be rated by at least two rating agencies (registered with the SBS) on a semiannual basis (updated in March and September, with information as of December 31 and June 30 of each year, respectively), in addition to the
115
SBS’s own assessment. Criteria to be considered in the rating include risk management and control procedures, loan quality, financial strength, profitability, liquidity and financial efficiency. Five risk categories are assigned, from “A,” lowest risk, to “E,” highest risk, allowing for subcategories within each letter.
Intervention by the SBS
Pursuant to the Peruvian Banking and Insurance Law, the SBS has the power to interrupt the operations of an insurance company to prevent, or to control and reduce, the effects of its failure. Accordingly, SBS intervention may be of two levels, depending on how critical the situation is: a temporary supervision regime or a definitive intervention regime prior to liquidating the bank or insurance company. Intervention will be taken upon the occurrence of certain events including: (1) suspension of payments; (2) failure to comply with the restructuring plan during the surveillance regime; (3) deficit or reduction of more than 50% of its regulatory capital in a 12-month period; or (4) deficit or reduction of its regulatory capital in excess of 50% of its solvency capital.
The intervention regime and the liquidation regime are the same as those described above for banking entities. See “Item 4. Information on the Company—Business Overview—Regulation and Supervision—The Peruvian Financial and Insurance System—Intervention by the SBS and Liquidation”. See “Item 4. Information on the Company—Business Overview—Regulation and Supervision—Investment Requirements” for a discussion of investment requirements and technical obligations.
The Peruvian Payment’s System
The payments ecosystem of our group has been complemented through PMP (in which Interbank holds 50%) even prior to the direct acquisition, on April 13, 2022, by IFS of the remaining 50% in such company. As a consequence of such acquisition, IFS now holds all interest in PMP’s wholly-owned subsidiary, Izipay, which is currently our payments processor and the payments facilitator for our subsidiaries operating in Peru. A summary of the Peruvian payment’s system regulatory framework is set forth below.
Payment processors provide technological services to merchants such as by: (a) capturing transactions through a physical network of terminals or payment platforms; and (ii) routing the transaction to the bank or card networks (such as VISA, or Mastercard) for validation (e-commerce). On the other hand, payment facilitators affiliate merchants to accept payment cards on behalf of an acquirer, specializing in the affiliation of merchants with low sales volume, offering them value-added services. PMP acts as payments processor, but it also provides the acquiring services (i.e. the acquirer is the agent in charge of affiliating merchants so that they accept card payments from consumers through a point of sale (physical or virtual), such as POS or website payment buttons).
General Overview
The regulatory authorities for the payment industry include the Central Reserve Bank of Peru; the Peruvian Antitrust Authority (Instituto Nacional de Defensa de la Competencia y de la Protección de la Propiedad Intelectual – “Indecopi”); the SBS and the Data Privacy Authority (Autoridad Nacional de Datos Personales). The Central Reserve Bank of Peru is the governing body of the Peruvian payment systems. The SBS regulates and oversees financial system companies and their financial transactions, including the issuance of cards. The Peruvian Antitrust Authority is the competition authority, which, among other duties, has the power to develop market research to identify potential opportunities for improvement related to the development of conditions of competition for a specific sector and issue recommendations. Finally, the Data Privacy Authority is responsible for the overview of compliance with the law on the processing of personal information.
The Central Reserve Bank of Peru is empowered to supervise and regulate payment systems and to determine when a payment agreement should be recognized as a payment system, and as such should be subject to the supervision and regulation of the Central Reserve Bank of Peru.
Law No. 29440 (as amended) (the “Payments and Settlement Law”) regulates the legal regime applicable to payment systems and securities settlement that have a systemic relevance, as well as to payment agreements (Acuerdos de Pago). If a payment system is recognized as such under the Payments and Settlement Law, the operator of the system will have to comply with applicable regulations, be supervised by the Peruvian Central Reserve Bank and subject to sanctions imposed by it.
The Central Reserve Bank of Peru has approved Circular No. 012-2010-BCRP (as amended) (the “Regulations for the Payment Systems”) which sets the criteria for a payment system to be considered subject to the provisions of the Payments and Settlement Law. Section 5 of the Regulations for the Payment Systems establishes that, in order for a payment agreement (Acuerdo de Pago) to be considered a payment system, the following characteristics shall be considered: (a) the value and number of funds transfer orders and (b) the interrelation of the payment agreement with other systems of importance for the transactions of the Peruvian financial system. As described, the criteria included in the Regulations for the Payment Systems is not quantifiable, but it includes general concepts to provide the Central Reserve Bank of Peru broad faculties to determine whether a payment system could have a
116
systematic relevance. Systemic relevance encompasses institutions whose stress or bankruptcy situation could have a significant negative impact on the financial system and cause a deep and prolonged economic recession.
The payment card system in Peru is regulated by the Central Reserve Bank of Peru, since it is recognized as a payment agreement. Currently, the only obligation of acquirers, as part of the payment card system in Peru, is to submit certain information about the nature and volume of their transactions, their functionality and risk control measures. Nonetheless, the Central Reserve Bank of Peru may, in the future, issue new rules, regulations, principles and standards within the payment card system. On the other hand, the participants in the issuing activity are regulated by the SBS in aspects related to security, the handling of fraudulent transactions and the minimum content of contracts between cardholders and card issuers.
As part of its operations, PMP has entered into license agreements with MasterCard and Visa, for which PMP is subject to specific rules and procedures for clearing and settlement of transactions.
Licensing
Service providers (including Izipay), collecting agents or processing agents in the payment industry are not required to obtain prior licenses such as pasarelas de pagos. However, recent regulations imposed certain obligations to such persons (including AML obligations) and required that they register with the Central Reserve Bank of Peru.
Regulation of Payment Services offered by Providers, Payment Agreements and Payment Systems
A special legal framework for the payment’s ecosystem was established in 2022 by the issuance of two key regulations passed by the Central Reserve Bank of Peru: Circular No. 024-2022-BCRP and Circular No. 027-2022-BCRP.
On October 2022, the Central Reserve Bank of Peru issued the Circular No. 024-2022-BCRP (as amended), approving the Interoperability Regulation of Payment Services offered by providers, payment agreements and payment systems. This regulation allows transactions to be made between all digital wallets that operate in Peru. Specifically, interoperability allows a user to perform a transfer or digital payment to any person or business, regardless of who operates the digital wallet, functionality or mobile application that is being used, or in which financial institution the user maintains its account.
Such regulation established certain deadlines for entities to start interoperating and meeting the regulation requirements. As of the date of this Annual Report on Form 20-F, all phases for interoperating are already in place.
In March 2024, the Central Reserve Bank of Peru issued Circular No. 0009-2024-BCRP (as amended by Circular No. 0005-2025-BCRP) approving the Regulation on the quality levels of Interoperable Payment Services provided by Providers, Payment Agreements, Payment Systems and Technology Providers. The purpose of the regulation is to set out the key performance indicators to be met by such regulated entities offering interoperable payment services, as well as certain guidelines applicable to Service Level Agreements.
Regulation of Payment Agreements with Cards
In addition, on November 2022, the Central Reserve Bank of Peru issued the Circular No. 027-2022-BCRP, approving the Regulation of Payment Agreements with Cards, which includes the recommendations made by the Indecopi, in order to strengthen competition and provide greater transparency of card payment services, which in turn shall benefit the final users. This regulation establishes the principles and standards that govern payment agreements with cards, the responsibilities and obligations of the administrator, the acquirers and payment facilitators, related to the disclosure on their web pages of exchange rates and discount rates. Likewise, such circular establishes that the entities involved in a payment agreement with cards must register with the Central Reserve Bank of Peru. The regulation became effective on January 1, 2023 and contemplated certain adequacy periods for entities already operating within the Peruvian payment’s ecosystem. As of the date, PMP is duly registered as acquiror and issuing entity, while Izipay is duly registered as payments facilitator, in both cases, before the Central Reserve Bank of Peru.
Anti-Money Laundering Rules
On June 2007, Law No. 29038 set a list of the entities required to comply with anti-money laundering rules, which include debit and/or credit cards processors (such as PMP). On February 2008, the SBS issued SBS Resolution No. 369-2018 establishing a simplified AML system (sistema acotado) which these entities are required to implement, including certain obligations such as the appointment of a compliance officer, the reporting of certain operations, and the implementation of a prevention system, among others.
The government agency responsible for supervising the anti-money laundering system is the UIF, which was made part of the SBS in July 2007. The chairman of this agency is appointed by the chairman of the SBS.
117
General Overview of the Bahamian Financial Regulatory Framework
The regulatory framework for the operation of the Bahamian bank and trust industry is set forth in the Central Bank of The Bahamas Act, 2020, as amended (the “BTCRA”), and the Banks and Trust Companies Regulation Act, 2020, as amended, and their related rules and regulations and any related guidance or notices issued by The Central Bank of The Bahamas. The Central Bank of The Bahamas licenses and supervises all of the banks and trust companies in The Bahamas. Its objectives include promoting and maintaining monetary stability and ensuring a sound financial system through the effective application of international regulatory and supervisory standards. All banks must adhere to the Central Bank of The Bahamas’ licensing and prudential requirements, ongoing supervisory programs and regulatory reporting requirements, and are subject to periodic onsite inspections. The regulatory framework for the securities industry in The Bahamas is set forth in the Securities Industry Act, 2024, as amended, and the Securities Industry Regulations, 2012. The relevant regulator for the securities industry is the Securities Commission of The Bahamas.
Licensing
Inteligo Bank has been granted a banking license by the Central Bank of The Bahamas and an International Banking License by the Superintendency of Banks of Panama. Under the BTCRA, the Central Bank of The Bahamas may revoke the license of a licensee if: in the opinion of the Central Bank of The Bahamas, the licensee (i) is carrying on its business in a manner detrimental to the public interest or the interests of its depositors or other creditors or (ii) contravening the provisions of Bahamian banking law or any other law, order or regulations made thereunder, or any term or condition subject to which the license was issued, either in The Bahamas or elsewhere; (iii) if Inteligo Bank has ceased to carry on its banking business; or (iv) if Inteligo Bank becomes bankrupt or goes into liquidation or is wound up or otherwise dissolved.
Inteligo Bank’s asset management activities and securities custody and trading activities are subject to supervision by the Securities Commission of The Bahamas. Inteligo Bank holds the following licenses from the Securities Commission of The Bahamas: Dealing as Agent or Principal; Arranging Securities; Managing Securities; and Advising on Securities. Inteligo Bank is licensed to undertake all securities related activities that are ancillary to its banking business.
Banking Regulation and Supervision
Banking regulations on capital adequacy and regulatory framework in The Bahamas take into account the recommendations of the Basel Committee. The Central Bank of The Bahamas has adopted a Basel Implementation Program (the “Program”) and has effectively implemented Pillar I, Pillar II and Pillar III of the Basel II framework. The Pillar I framework focuses on the capital adequacy ratio requirements. Pillar II focuses on the ICAAP (the guidelines in relation to the ICAAP were released in August of 2016), and Pillar III relates to Minimum Disclosures. The Central Bank of The Bahamas has rolled out the capital component of the Basel III framework and in 2017, began to implement other elements namely, the capital buffers, the leverage ratio, the net stable funding ratio and the liquidity coverage ratio. The Bahamas Capital Regulation, 2022 and the amended Guidelines for the Management of Capital and the Calculation of Capital Adequacy became effective on July 15, 2022. The Bahamas capital regulations include changes to the methodology for the calculation of risk-weighted assets and Tier 1 capital that could adversely impact Inteligo Bank’s capital adequacy ratio. In 2018, the Central Bank of The Bahamas published two discussion papers focused on minimum disclosures (Pillar III of the Basel II framework) and the net stable funding ratio and the liquidity coverage ratio (main components of Basel III), but following completion of the capital framework, its liquidity is still in the process of being amended.
Corporate Governance
The Guidelines for the Corporate Governance of Banks and Trust Companies Licensed to Do Business Within and From Within The Bahamas, issued by the Central Bank of The Bahamas, list the minimum standards that banks must adopt in respect of their corporate governance framework. Generally, the guidelines require the board of directors to develop and implement policies and procedures to ensure (i) the competence and independence of board members, (ii) proper management of strategic, business and process-level risks, (iii) compliance with applicable laws, regulations and guidelines, and (iv) ongoing reporting to the Central Bank of The Bahamas.
Limits on Large Exposures
Pursuant to the Banks and Trust Companies (Large Exposures) (Amendment) Regulations, 2012, no bank shall (i) incur exposures to any individual counterparty or group of connected parties which in the aggregate exceed 25% of the bank’s capital base, (ii) hold non-capital investments in securities of a single issuer which exceed 10% of the bank’s capital base, (iii) incur exposures to its related parties which in the aggregate exceed 15% of the bank’s capital base, (iv) incur exposures to related parties unless approved by the bank’s board of directors and negotiated on an arm’s length basis, or, (v) incur non-exempt large exposures which in the aggregate exceed 800% of its capital base. There are certain exemptions listed in the regulations, and the Central Bank of The Bahamas may also exempt a bank from the exposure limits outlined in the regulations in certain circumstances.
118
Classification of Impaired Assets
The Guidelines for the Management of Credit Risk, issued by the Central Bank of The Bahamas, provide the Central Bank of The Bahamas’ minimum requirements for the recognition, measurement and classification of impaired assets. An impaired asset is defined as a credit facility for which a significant increase in credit risk has occurred since the purchase or origination of the asset; or there is no longer reasonable assurance of timely collection of the full amount (e.g. principal and interest) without the bank’s realization of collateral, regardless of the number of days the exposure is past due. Banks are required to follow the requirements of the IFRS Accounting Standards relating to impaired assets, in particular International Accounting Standards 36 "Impairment of Assets" and IFRS 9.
Credit Risk
The Guidelines for the Management of Credit Risk, issued by the Central Bank of The Bahamas, require banks to have a written statement of their credit risk strategy and policies and procedures to implement the strategy. The strategy and policies should be approved by the board of directors and should be consistent with the bank’s degree of risk tolerance, the level of capital available for credit activities and credit management expertise. The Central Bank of The Bahamas endorses the Basel Committee’s Principles for the Management of Credit Risk (September 2000).
Market Risk
The Guidelines on the Management of Market Risk, issued by the Central Bank of The Bahamas, require banks that meet the stated threshold tests to establish sound policies and procedures for the management of market risk, to be supervised and controlled by the board of directors and senior management. Market risk is defined as the risk of losses in on and off-balance sheet positions arising from movements in market prices.
Operational Risk
The Guidelines for the Management of Operational Risk, issued by the Central Bank of The Bahamas, require senior management of a bank, under the approval of the board of directors, to develop and implement an operational risk management framework that explicitly recognizes operational risk as a distinct risk to the institution and aims to effectively manage it. Operational risk is defined as the risk of loss resulting from inadequate or failed internal processes, people and systems from external events. The guidelines are based upon the Principles for the Sound Management of Operational Risk, issued by the Basel Committee on Banking Supervision in 2011.
Country Risk
The Guidelines for the Management of Country Risk, issued by the Central Bank of The Bahamas, require banks to have a risk management process that focuses on the broadly defined concept of country risk and addresses certain minimum requirements listed therein. The guidelines reference the Basel Committee’s Core Principles for Effective Banking Supervision.
Anti-Money Laundering Laws and Regulations
Money laundering is a criminal act in The Bahamas. The laws of The Bahamas concerning money laundering and combatting the financing of terrorism are contained in the following legislation, as amended: (i) the Proceeds of Crime Act, 2018; (ii) the Anti-Terrorism Act, 2018; (iii) the Financial Transactions Reporting Act, 2018; (iv) the Financial Transaction Reporting Regulations, 2018; (v) the Financial Transactions Reporting (Wire Transfers) Regulations, 2018; (vi) the Financial Intelligence Unit Act, 2000; and (vii) the Financial Intelligence (Transactions Reporting) Regulations, 2001. The Guidelines for Licensees on the Prevention of Money Laundering & Countering the Financing of Terrorism, issued by the Central Bank of The Bahamas, apply specifically to banks and other licensees of the Central Bank of The Bahamas. The guidelines require banks to establish clear responsibilities and accountabilities to ensure that policies, procedures and controls which deter criminals from using their facilities for money laundering or the financing of terrorism, are implemented and maintained, thus ensuring that they comply with their obligations under the law. Banks must have in place sufficient controls and monitoring systems for timely detection and reporting of suspicious activities, proper verification of their customers’ identities, record keeping in accordance with applicable laws, and ongoing education and training for its employees.
The Bahamas has repealed and replaced the Commercial Entities Substance Requirements Act, 2018 with the Commercial Entities (Substance Requirements) Act, 2023 which requires substantial economic presence in The Bahamas for certain Bahamas incorporated or registered entities that conduct relevant activities. A relevant activity includes the business of banking as conducted by Inteligo Bank. Inteligo Bank has made the appropriate registration in order to seek exemption from the main substance requirements under this legislation as it considers itself to be tax resident in another jurisdiction, Panama, despite being a licensed bank in The Bahamas. As a tax resident in Panama, Inteligo Bank would be exempt from the main substance requirements of the
119
Commercial Entities (Substance Requirements) Act, 2023 due to asserted tax residency outside of The Bahamas. If Inteligo Bank is not considered to be tax resident in Panama, or does not fulfill the requirements of the applicable legislation, it will have to enhance its economic and business presence in The Bahamas in order to comply with the Commercial Entities (Substance Requirements) Act, 2023.
External Auditors
The Guidelines on the Relationship between External Auditors of Licensees and the Central Bank of The Bahamas, issued by the Central Bank of The Bahamas, require banks to inform the Central Bank of The Bahamas of the appointment of their external auditors. In addition to listing certain criteria to be used when appointing external auditors, the guidelines also provide examples of facts and matters of material significance that must be reported by an external auditor to the Central Bank of The Bahamas, such as material misstatements in financial statements or evidence of fraudulent activities. The guidelines take into account the aspects of the Basel Committee’s paper, The Relationship Between Banking Supervisors and Banks’ External Auditors (2002).
C.
Organizational Structure
The following chart presents our corporate structure, indicating our principal subsidiaries and respective ownership interests.
D.
Property, Plants and Equipment
We are based in Peru and our principal executive offices are located at Av. Carlos Villarán 140, Urbanización, Santa Catalina, La Victoria, Lima 13, Peru, which is owned by Interbank.
Our principal subsidiaries own or lease the following properties:
Interbank
Interbank owns its headquarters, the Interbank Tower, located at Av. Carlos Villarán 140, Urbanización, Santa Catalina, La Victoria, Lima 13, Peru (approximately 46,585 square meters). Although most of its financial store facilities are leased, Interbank owned 39 financial store facilities as of December 31, 2024.
120
Interseguro
Interseguro owns its administrative and commercial office, located at Av. Javier Prado 492, San Isidro, Lima, Peru (approximately 2,482 square meters). As of December 31, 2024, Interseguro leases 20 facilities in different provinces of Peru. Most of Interseguro’s facilities outside of Lima are subleased to Interbank.
Inteligo
Inteligo had four offices as of December 31, 2024. Inteligo owns its branch in Panama and leases the rest of the facilities where it operates. Inteligo Bank’s registered headquarters are located at Inteligo Bank— Balmoral Corporate Centre, Ground Floor, Unit B, Nassau, The Bahamas. Inteligo SAB’s and Interfondos’ registered headquarters are located at Av. Rivera Navarrete 501, San Isidro, Lima, Peru. Inteligo USA signed a lease agreement on September 19, 2024, and received the keys to a new office located at 801 Brickell Avenue, Suite 2320, Miami, FL 33131, on December 16, 2024.
Izipay
Izipay has 19 offices as of December 31, 2024. Izipay owns one administrative office, located at Calle Porta 111 Piso 7, Miraflores, Lima, Peru, and leases the rest of the facilities where it operates including its main offices at Av. Jorge Chávez 275 Piso 7, Miraflores, Lima, Peru.
SELECTED STATISTICAL INFORMATION
The following tables present certain selected statistical information and ratios for IFS for the periods indicated. The following information is included for analytical purposes and should be read in conjunction with the information included in “Item 5. Operating and Financial Review and Prospects” and our audited annual consolidated financial statements and notes thereto included elsewhere in this Annual Report on Form 20-F. The statistical information and discussion and analysis presented below for the fiscal years ended December 31, 2024, 2023 and 2022 reflect our consolidated financial position with our subsidiaries, Inteligo, Interbank, and Interseguro, for the fiscal years ended December 31, 2024, 2023 and 2022 and their results of operations for the fiscal years ended December 31, 2024, 2023 and 2022.
Average annual balances are based on five quarterly balances. Nominal average interest rates have been calculated by dividing interest earned on assets or paid on liabilities by the corresponding average annual balances on such assets or liabilities.
On January 1, 2024, we adopted the following standards, interpretations, or amendments: (i) in connection with lease liability in a sale and leaseback, amendments to IFRS 16 "Leases," (ii) in connection with classification of liabilities as current or non-current, amendments to IAS 1 “Presentation of Financial Statements” and (iii) in connection with supplier finance arrangements, amendments to IAS 7 "Statements of Cash Flows" and IFRS 7 "Financial instruments: Disclosures". See Note 3.2 to our audited annual consolidated financial statements.
On January 1, 2023, we adopted the following standards, interpretation, or amendments: (i) IFRS 17 "Insurance Contracts", (ii) in connection with the definition of Accounting Estimates, an amendment to IAS 8 “Accounting Policies, Changes in Accounting Estimates and Errors,” (iii) in connection with the disclosure of Accounting Policies, amendments to IAS 1 “Presentation of Financial Statements” and IFRS Practice Statement 2 “Making Materiality Judgements,” (iv) in connection with Deferred Tax related to Assets and Liabilities arising from a Single Transaction, amendments to IAS 12 “Income Taxes,” and (v) in connection with the International Tax Reform – Pillar Two Model Rules, amendments to IAS 12 “Income Taxes.” Such standards, interpretations or amendments have not had a significant impact on our consolidated financial statements.
On January 1, 2022, we adopted the following standards, interpretations, or amendments: (i) in connection with costs of fulfilling a contract, an amendment to IAS 37 “Provisions, Contingent Liabilities and Contingent Assets,” (ii) amendments to IFRS 3 “Business Combinations,” (iii) in connection with proceeds before intended use of property, plant and equipment, an amendment to IAS 16 “Property, Plant and Equipment,” (iv) in connection with a subsidiary as a first time adopter, an amendment to IFRS 1 “First-time Adoption of International Financial Reporting Standards,” and (v) in connection with fees in the “10 per cent” test for derecognition of financial liabilities, an amendment to IFRS 9 “Financial Instruments.” Such standards, interpretations or amendments have not had a significant impact on our consolidated financial statements.
Average Balance Sheets, Income Earned from Interest-Earning Assets, Interest Paid on Interest-Bearing Liabilities
The tables below set forth, by currency of denomination, average balances for IFS prepared on a consolidated basis, and, where applicable, interest earned on interest-earning assets and interest paid on interest-bearing liabilities for the periods indicated. Except as otherwise indicated, average balances, when used, have been classified by currency (soles or foreign currency (primarily
121
U.S. dollars)), regardless of the domestic or international origin of the relevant balances. In addition, unless otherwise set forth in this Annual Report on Form 20-F, such average balances are based on quarterly balances. Nominal average interest rates have been calculated by dividing interest earned on assets or paid on liabilities by the corresponding average balances on such assets or liabilities.
For the year ended December 31,
2024(1)
2023(1)
2022(1)
(S/ in millions, except for percentages)
Average Balance
Interest Earned
Nominal Average Rate
Average Balance
Interest Earned
Nominal Average Rate
Average Balance
Interest Earned
Nominal Average Rate
Interest-earning assets:
Cash and due from banks
Soles
3,875.4
64.8
1.7
%
2,933.4
48.1
1.6
%
3,539.6
55.9
1.6
%
Foreign Currency
8,448.1
307.9
3.6
%
8,776.0
319.0
3.6
%
10,412.5
119.5
1.1
%
Total
12,323.4
372.6
3.0
%
11,709.4
367.2
3.1
%
13,952.1
175.4
1.3
%
Investments
Soles
19,404.2
1,151.6
5.9
%
18,012.1
1,104.7
6.1
%
16,373.9
1,121.4
6.8
%
Foreign Currency
7,504.3
346.9
4.6
%
6,988.4
323.9
4.6
%
7,653.1
326.0
4.3
%
Total
26,908.6
1,498.5
5.6
%
25,000.4
1,428.7
5.7
%
24,027.1
1,447.4
6.0
%
Loans
Soles
35,619.5
4,113.5
11.5
%
34,567.2
4,303.2
12.4
%
33,385.0
3,587.3
10.7
%
Foreign Currency
14,026.0
1,044.7
7.4
%
13,836.4
1,021.4
7.4
%
12,630.0
661.2
5.2
%
Total
49,645.5
5,158.3
10.4
%
48,403.6
5,324.6
11.0
%
46,015.1
4,248.5
9.2
%
Total interest-earning assets
Soles
58,899.1
5,329.9
9.0
%
55,512.7
5,456.0
9.8
%
53,298.6
4,764.6
8.9
%
Foreign Currency
29,978.4
1,699.5
5.7
%
29,600.8
1,664.4
5.6
%
30,695.7
1,106.7
3.6
%
Total
88,877.5
7,029.4
7.9
%
85,113.4
7,120.4
8.4
%
83,994.2
5,871.3
7.0
%
Taxable interest income
—
5,411.0
—
—
5,460.0
—
—
4,261.2
—
Non-taxable interest income
—
1,709.4
—
—
1,660.4
—
—
1,610.1
—
Interest-bearing liabilities:
Deposits and obligations
Soles
32,049.5
(1,119.1
)
(3.5
%)
29,603.8
(1,315.6
)
(4.4
%)
28,143.4
(782.9
)
(2.8
%)
Foreign Currency
19,893.3
(463.5
)
(2.3
%)
19,465.3
(427.7
)
(2.2
%)
19,954.4
(158.4
)
(0.8
%)
Total
51,942.7
(1,582.7
)
(3.0
%)
49,069.0
(1,743.3
)
(3.6
%)
48,097.7
(941.3
)
(2.0
%)
Due to banks and correspondents(2)
Soles
6,458.0
(324.5
)
(5.0
%)
7,212.7
(366.2
)
(5.1
%)
7,231.3
(214.4
)
(3.0
%)
Foreign Currency
2,283.6
(157.9
)
(6.9
%)
1,590.9
(108.2
)
(6.8
%)
717.2
(20.5
)
(2.9
%)
Total
8,741.6
(482.4
)
(5.5
%)
8,803.6
(474.4
)
(5.4
%)
7,948.5
(234.8
)
(3.0
%)
Bonds, notes and other obligations
Soles
1,744.3
(9.7
)
(0.6
%)
1,497.7
(28.6
)
(1.9
%)
2,400.3
(169.2
)
(7.0
%)
Foreign Currency
4,022.9
(405.6
)
(10.1
%)
4,647.5
(346.1
)
(7.4
%)
5,643.0
(316.8
)
(5.6
%)
Total
5,767.1
(415.2
)
(7.2
%)
6,145.3
(374.7
)
(6.1
%)
8,043.2
(486.0
)
(6.0
%)
Total Interest-bearing liabilities:
Soles
40,251.8
(1,453.3
)
(3.6
%)
38,314.2
(1,710.4
)
(4.5
%)
37,775.0
(1,166.4
)
(3.1
%)
Foreign Currency
26,199.7
(1,027.0
)
(3.9
%)
25,703.7
(882.0
)
(3.4
%)
26,314.5
(495.7
)
(1.9
%)
Total
66,451.5
(2,480.3
)
(3.7
%)
64,017.9
(2,592.4
)
(4.0
%)
64,089.5
(1,662.1
)
(2.6
%)
(1)
As of and for the years ended December 31, 2024, 2023 and 2022, IFS did not maintain any of the following categories on its balance sheets: (i) federal funds sold, (ii) securities purchased with agreements to resell, (iii) federal funds purchased, (iv) securities sold under agreements to repurchase, or (v) commercial paper.
(2)
Includes inter-bank funds
122
The following tables set forth, by currency of denomination, average balances for our non-interest earning assets and non-interest bearing liabilities and shareholders’ equity for the periods indicated.
For the year ended December 31,
2024
2023
2022
(S/ in millions)
Average Balance
Average Balance
Average Balance
Impairment allowance for loans
Soles
(1,936.0
)
(2,058.2
)
(1,958.6
)
Foreign Currency
(90.2
)
(132.2
)
(83.6
)
Total
(2,026.2
)
(2,190.4
)
(2,042.3
)
Investment Property
Soles
1,343.0
1,279.5
1,255.5
Foreign Currency
—
—
—
Total
1,343.0
1,279.5
1,255.5
Property, furniture and equipment, net
Soles
821.5
793.2
809.1
Foreign Currency
—
—
—
Total
821.5
793.2
809.1
Accounts receivable and other assets, net
Soles
2,354.1
1,418.9
1,535.1
Foreign Currency
328.3
281.2
285.8
Total
2,682.5
1,700.1
1,820.8
Intangibles and goodwill, net
Soles
1,662.0
1,645.0
1,322.7
Foreign Currency
—
—
—
Total
1,662.0
1,645.0
1,322.7
Insurance contract assets
Soles
23.0
27.9
31.8
Foreign Currency
0.9
0.7
1.7
Total
24.0
28.6
33.5
Due from customers on acceptances
Soles
—
—
—
Foreign Currency
17.7
54.9
65.1
Total
17.7
54.9
65.1
Deferred Income Tax asset, net
Soles
25.6
139.7
191.5
Foreign Currency
—
—
—
Total
25.6
139.7
191.5
Total non-interest-earning assets:
Soles
4,293.4
3,245.9
3,187.0
Foreign Currency
256.8
204.6
269.0
Total
4,550.1
3,450.5
3,455.9
123
For the year ended December 31,
2024
2023
2022
(S/ in millions, except for percentages)
Average Balance
Average Balance
Average Balance
Non-interest-bearing liabilities:
Due from customers on acceptances
Soles
—
—
—
Foreign Currency
17.7
54.9
65.1
Total
17.7
54.9
65.1
Accounts payable, provisions and other liabilities
Soles
2,634.7
2,164.6
1,798.3
Foreign Currency
1,502.0
1,029.9
1,224.3
Total
4,136.7
3,194.5
3,022.6
Insurance contract liabilities
Soles
8,287.3
7,612.2
6,749.5
Foreign Currency
4,021.3
4,070.4
4,548.5
Total
12,308.6
11,682.5
11,301.5
Deferred Income Tax Liability, net
Soles
110.2
80.8
34.6
Foreign Currency
—
—
—
Total
110.2
80.8
34.6
Total non-interest-bearing liabilities:
Soles
11,032.3
9,857.6
8,582.4
Foreign Currency
5,541.0
5,155.1
5,837.9
Total
16,573.3
15,012.6
14,423.7
Changes in Net Interest and Similar Income and Net Interest and Similar Expense: Volume and Rate Analysis
The following table sets forth, by currency of denomination, changes in our interest revenue and expenses between changes in the average volume of interest-earning assets and interest-bearing liabilities and changes in their respective nominal interest rates from the year ended December 31, 2024 to the year ended December 31, 2023 and from the year ended December 31, 2023 to the year ended December 31, 2022. Volume and rate variances have been calculated based on movements in average quarterly balances and changes in nominal interest rates, average interest-earning assets and average interest-bearing liabilities. The net change
124
attributable to changes in both volume and rate has been allocated proportionately to the change due to volume and the change due to rate.
December 31, 2024/2023(1)
December 31, 2023/2022(1)
Increase (Decrease) Due to Changes in:
Increase (Decrease) Due to Changes in:
Rate
Volume
Net Change
Rate
Volume
Net Change
(S/ in millions)
Interest-earning assets:
Cash and due from banks(2)
Soles
0.9
15.7
16.6
2.2
(9.9
)
(7.8
)
Foreign Currency
0.8
(12.0
)
(11.2
)
259.0
(59.5
)
199.5
Total
1.7
3.8
5.5
261.2
(69.4
)
191.8
Investments
Soles
(35.8
)
82.6
46.8
(117.1
)
100.5
(16.6
)
Foreign Currency
(0.8
)
23.9
23.0
28.7
(30.8
)
(2.1
)
Total
(36.6
)
106.5
69.9
(88.4
)
69.7
(18.7
)
Loans
Soles
(311.2
)
121.5
(189.7
)
568.7
147.2
715.8
Foreign Currency
9.2
14.1
23.3
271.2
89.1
360.2
Total
(302.0
)
135.6
(166.3
)
839.8
236.2
1,076.1
Total interest-earning assets:
Soles
(346.1
)
219.9
(126.2
)
453.8
237.7
691.5
Foreign Currency
9.1
26.0
35.2
558.9
(1.3
)
557.7
Total
(336.9
)
245.9
(91.0
)
1,012.7
236.4
1,249.1
Interest-bearing liabilities: Deposits and obligations
Soles
281.9
(85.4
)
196.5
(467.8
)
(64.9
)
(532.7
)
Foreign Currency
(25.9
)
(10.0
)
(35.9
)
(280.1
)
10.7
(269.3
)
Total
256.0
(95.4
)
160.7
(747.9
)
(54.2
)
(802.1
)
Due to banks and correspondents
Soles
3.8
37.9
41.7
(152.8
)
0.9
(151.8
)
Foreign Currency
(1.8
)
(47.9
)
(49.7
)
(28.3
)
(59.4
)
(87.7
)
Total
1.9
(10.0
)
(8.0
)
(181.0
)
(58.5
)
(239.5
)
Bonds, notes and other obligations
Soles
20.3
(1.4
)
18.9
123.2
17.2
140.5
Foreign Currency
(122.4
)
63.0
(59.5
)
(103.7
)
74.1
(29.6
)
Total
(102.1
)
61.6
(40.5
)
19.5
91.4
110.9
Total Interest-bearing liabilities:
Soles
306.0
(48.8
)
257.1
(497.4
)
(46.7
)
(544.1
)
Foreign Currency
(150.1
)
5.1
(145.0
)
(412.1
)
25.5
(386.6
)
Total
155.8
(43.7
)
112.1
(909.4
)
(21.3
)
(930.7
)
(1)
As of and for the years ended December 31, 2024, 2023 and 2022, IFS did not maintain any of the following categories on its balance sheets: (i) federal funds sold, (ii) securities purchased with agreements to resell, (iii) federal funds purchased, (iv) securities sold under agreements to repurchase, or (v) commercial paper.
(2)
Includes inter-bank funds.
125
Interest-Earning Assets: Net Interest Margin and Yield Spread
The following table set forth for each of the periods indicated, by currency of denomination, our levels of average interest-earning assets, net interest income, gross yield, net interest margin and yield spread, all on a nominal basis.
For the year ended December 31,
2024
2023
2022
Average interest-earning assets
Soles
58,899.1
55,512.7
53,298.6
Foreign Currency
29,978.4
29,600.8
30,695.7
Total
88,877.5
85,113.4
83,994.3
Net interest income(1)
Soles
3,876.6
3,745.6
3,598.2
Foreign Currency
672.5
782.4
611.3
Total
4,549.1
4,528.0
4,209.6
Gross yield(2)
Soles
9.0
%
9.8
%
8.9
%
Foreign Currency
5.7
%
5.6
%
3.6
%
Total
7.9
%
8.4
%
7.0
%
Net interest margin(3)
Soles
6.6
%
6.7
%
6.8
%
Foreign Currency
2.2
%
2.6
%
2.0
%
Total
5.1
%
5.3
%
5.0
%
Yield spread(4)
Soles
5.4
%
5.4
%
5.9
%
Foreign Currency
1.7
%
2.2
%
1.7
%
Total
4.2
%
4.3
%
4.4
%
(1)
“Net interest income” is defined as interest and similar income less interest and similar expense.
(2)
“Gross yield” is defined as interest and similar income divided by average interest-earning assets.
(3)
“Net interest margin” is defined as net interest and similar income divided by average interest-earning assets.
(4)
“Yield spread”, on a nominal basis, represents the difference between gross yield on average interest-earning assets and average cost of interest-bearing liabilities.
Investment Portfolio
The following table sets forth our financial investment portfolio by type on the dates indicated. For more information on our financial investment portfolio as of December 31, 2024, 2023 and 2022, see Note 5 to our audited annual consolidated financial statements appearing elsewhere in this Annual Report on Form 20-F.
As of December 31,
2024
2023
2022
S/ in millions
%
S/ in millions
%
S/ in millions
%
Debt instruments measured at fair value through other comprehensive income
20,377.8
77.2
%
20,912.2
79.5
%
16,716.5
74.6
%
Investments at amortized cost
3,784.9
14.3
%
3,383.0
12.9
%
3,231.1
14.4
%
Investments at fair value through profit or loss
1,776.6
6.7
%
1,556.5
5.9
%
1,933.0
8.6
%
Equity instruments measured at fair value through other comprehensive income
458.3
1.7
%
444.9
1.7
%
512.9
2.3
%
Total
26,397.5
100.0
%
26,296.6
100.0
%
22,393.5
100.0
%
Plus: Accrued interest
460.4
425.4
394.1
Total investments, net
26,857.9
26,722.0
22,787.6
The following tables set forth the maturities of our financial investment portfolio as of December 31, 2024, before accrued interest.
126
Maturities of Investment Portfolio - Yields
1 year or less
Weighted Average Yield(1)
1-5 years
Weighted Average Yield(1)
5-10 years
Weighted Average Yield(1)
Over 10 years
Weighted Average Yield(1)
Total
Instruments measured at fair value through other comprehensive income:
Bonds
387.3
52.5
%
1,742.6
8.8
%
3,131.7
10.5
%
5,057.0
5.9
%
10,318.6
Peruvian sovereign and global Bonds
—
—
2,894.0
5.9
%
1,260.8
6.0
%
3,790.4
7.7
%
7,945.3
Negotiable bank certificates issued by the Central Reserve Bank of Peru
2,113.9
7.3
%
—
—
—
—
—
—
2,113.9
Total Instruments measured at fair value through other comprehensive income
2,501.2
59.9
%
4,636.6
14.7
%
4,392.5
16.5
%
8,847.5
13.6
%
20,377.8
Investments at amortized cost:
Peruvian sovereign Bonds
—
—
727.6
2.2
%
1,847.4
16.0
%
1,123.4
9.2
%
3,698.4
Total Investments at amortized cost
—
—
727.6
2.2
%
1,847.4
16.0
%
1,123.4
9.2
%
3,698.4
Total investments
2,501.2
59.9
%
5,364.2
16.9
%
6,239.9
32.5
%
9,970.9
22.8
%
24,076.2
%
9.5
%
20.4
%
23.7
%
37.9
%
91.5
%
(1)
The weighted average yield for each range of maturity is calculated by dividing the annual interest income by the book value of the debt securities.
Loan Portfolio
The following table sets forth our loans by type of loan, at the dates indicated.
As of December 31,
2024
2023
2022
S/ in millions
%
S/ in millions
%
S/ in millions
%
Loan Portfolio
Loans
38,456.7
76.3
%
35,789.1
74.2
%
35,977.7
76.5
%
Credit cards
5,386.4
10.7
%
6,023.8
12.5
%
6,239.3
13.3
%
Discounted notes
1,706.9
3.4
%
1,567.4
3.2
%
894.6
1.9
%
Leasing
1,584.4
3.1
%
1,495.3
3.1
%
1,174.5
2.5
%
Factoring receivables
1,411.0
2.8
%
1,244.8
2.6
%
1,011.5
2.2
%
Advances and overdrafts
101.8
0.2
%
14.6
0.0
%
38.8
0.1
%
Refinanced loans
449.4
0.9
%
462.0
1.0
%
322.9
0.7
%
Past-due and under legal collection loans
1,318.8
2.6
%
1,652.2
3.4
%
1,366.0
2.9
%
Total gross loans
50,415.4
100.0
%
48,249.2
100.0
%
47,025.4
100.0
%
Accrued interest from performing loans
569.4
—
657.4
—
527.6
—
Unearned interest and interest collected in advance
(25.1
)
—
(36.7
)
—
(22.1
)
—
Impairment allowance for loans
(1,730.2
)
—
(2,349.4
)
—
(2,027.9
)
—
Total direct loans, net
49,229.4
—
46,520.4
—
45,503.0
—
Loans by Classification
The following table shows the composition of our loan portfolio by classification for the periods indicated.
As of December 31,
2024
2023
2022
S/ in millions
%
S/ in millions
%
S/ in millions
%
Commercial loans
22,770.5
45.2
%
21,155.5
43.8
%
21,412.1
45.5
%
Consumer loans
15,036.4
29.8
%
16,325.5
33.8
%
14,967.8
31.8
%
Mortgage loans
10,571.3
21.0
%
9,834.4
20.4
%
9,286.9
19.7
%
Small and micro-business loans
2,037.2
4.0
%
933.8
1.9
%
1,358.5
2.9
%
Total direct gross loans(1)
50,415.4
100.0
%
48,249.2
100.0
%
47,025.4
100.0
%
(1)
Includes refinanced loans and past due and under legal collection loans for all periods reported.
127
Loans by Currency
The following table presents our loan portfolio divided by currency at the dates indicated.
As of December 31,
2024
2023
2022
S/ in millions
%
S/ in millions
%
S/ in millions
%
Foreign currency denominated
14,287.2
28.3
%
14,047.7
29.1
%
13,481.9
28.7
%
Sol denominated
36,128.2
71.7
%
34,201.4
70.9
%
33,543.5
71.3
%
Total gross loans
50,415.4
100.0
%
48,249.2
100.0
%
47,025.4
100.0
%
As of December 31, 2024, 2023 and 2022, we did not have foreign loans that exceeded 1% of our total consolidated assets.
Maturity Composition of Our Portfolio of Loans
The following tables set forth an analysis of our portfolio of loans as of December 31, 2024, 2023 and 2022 by type and by the time remaining to maturity. Loan amounts are presented before deduction of allowances for loan losses.
As of December 31, 2024(1)
1 month
1-3 months
3 months-1 year
1-5 years
More than 5 years but less than 15 years
More than 15 years
Past-due loans
Total
(S/ in millions)
Loans
1,790.3
2,975.4
10,360.5
17,247.7
5,709.8
373.0
1,318.8
39,775.4
Credit cards and other loans (1)
1,565.1
973.3
1,211.6
1,636.5
—
—
—
5,386.4
Leasing
44.0
148.0
544.7
844.0
3.8
—
—
1,584.4
Discounted notes
773.1
639.1
294.6
—
—
—
—
1,706.9
Factoring receivables
399.0
563.8
448.2
—
—
—
—
1,411.0
Advances and overdrafts
101.8
—
—
—
—
—
—
101.8
Refinanced loans
20.6
16.1
107.8
272.8
32.0
0.1
—
449.4
Total gross loans
4,693.9
5,315.7
12,967.4
20,000.9
5,745.6
373.1
1,318.8
50,415.4
As of December 31, 2023(1)
1 month
1-3 months
3 months-1 year
1-5 years
More than 5 years but less than 15 years
More than 15 years
Past-due loans
Total
(S/ in millions)
Loans
1,988.4
3,226.6
8,078.4
16,516.2
5,614.1
365.5
1,652.2
37,441.3
Credit cards and other loans (1)
1,350.9
1,397.7
1,335.3
1,939.7
—
—
—
6,023.8
Leasing
31.9
77.3
649.1
726.7
10.3
—
—
1,495.3
Discounted notes
630.8
590.7
344.9
1.0
—
—
—
1,567.4
Factoring receivables
437.6
472.7
334.5
—
—
—
—
1,244.8
Advances and overdrafts
14.6
—
—
—
—
—
—
14.6
Refinanced loans
7.4
16.5
88.9
316.9
26.6
5.7
—
462.0
Total gross loans
4,461.6
5,781.5
10,831.1
19,500.5
5,651.1
371.2
1,652.2
48,249.2
(2)
See Note 6(a) to our audited annual consolidated financial statements.
128
As of December 31, 2022(1)
1 month
1-3 months
3 months -1 year
1-5 years
More than 5 years but less than 15 years
More than 15 years
Past-due loans
Total
(S/ in millions)
Loans
2,979.8
3,432.0
7,688.4
16,061.5
5,522.5
293.5
1,366.0
37,343.7
Credit cards and other loans (1)
1,206.4
1,223.6
1,711.9
2,097.4
—
—
—
6,239.3
Leasing
73.4
60.2
475.6
554.7
10.7
—
—
1,174.5
Discounted notes
399.0
412.0
83.6
—
—
—
—
894.6
Factoring receivables
240.0
565.3
206.2
—
—
—
—
1,011.5
Advances and overdrafts
38.8
—
—
—
—
—
—
38.8
Refinanced loans
8.5
15.2
54.4
203.1
37.4
4.3
—
322.9
Total gross loans
4,945.9
5,708.3
10,220.2
18,916.6
5,570.6
297.9
1,366.0
47,025.4
(1)
Includes the balance of disbursements made by Interbank within the “Reactiva Perú” program. The balance of these loans as of December 31, 2024, 2023 and 2022 amounted to S/270.2 million, S/802.6 million and S/2,299.9 million, respectively.
Classification of Our Loan Portfolio - Analysis of Substandard and Past Due Loans
The following tables provide the classification of our loans as of December 31, 2024, 2023 and 2022, respectively, calculated under the requirements of IFRS 9:
As of December 31, 2024
Direct and indirect Loans
Stage 1
Stage 2
Stage 3
Total
(S/ in millions)
Not impaired
High grade
35,618.9
371.7
—
35,990.6
Standard grade
9,388.4
1,632.8
—
11,021.2
Sub-standard grade
2,977.4
1,714.9
—
4,692.3
Past due but not impaired
1,335.6
1,172.8
—
2,508.3
Impaired
Individually impaired
—
—
29.4
29.4
Collectively impaired
—
—
1,242.2
1,242.2
Total gross loans
49,320.3
4,892.2
1,271.6
55,484.1
Direct loan portfolio
44,558.1
4,609.6
1,247.7
50,415.4
Indirect loan portfolio
4,762.2
282.6
23.9
5,068.7
Total gross loans
49,320.3
4,892.2
1,271.6
55,484.1
As of December 31, 2023
Direct and indirect Loans
Stage 1
Stage 2
Stage 3
Total
(S/ in millions)
Not impaired
High grade
39,087.4
1,526.2
—
40,613.6
Standard grade
2,864.7
1,725.7
—
4,590.4
Sub-standard grade
1,370.3
1,481.9
—
2,852.2
Past due but not impaired
1,949.9
1,460.1
—
3,410.0
Impaired
Individually impaired
—
—
42.4
42.4
Collectively impaired
—
—
1,484.1
1,484.1
Total gross loans
45,272.3
6,193.9
1,526.5
52,992.6
Direct loan portfolio
41,248.0
5,490.5
1,510.7
48,249.2
Indirect loan portfolio
4,024.3
703.4
15.8
4,743.5
Total gross loans
45,272.3
6,193.9
1,526.5
52,992.6
129
As of December 31, 2022
Direct and indirect Loans
Stage 1
Stage 2
Stage 3
Total
(S/ in millions)
Not impaired
High grade
39,559.3
1,513.8
—
41,073.1
Standard grade
4,295.0
874.8
—
5,169.7
Sub-standard grade
778.7
1,000.3
—
1,779.0
Past due but not impaired
1,124.6
1,150.1
—
2,274.7
Impaired
Individually impaired
—
—
55.2
55.2
Collectively impaired
—
—
1,161.0
1,161.0
Total gross loans
45,757.5
4,539.0
1,216.2
51,512.7
Direct loan portfolio
41,798.1
4,037.2
1,190.1
47,025.4
Indirect loan portfolio
3,959.4
501.8
26.1
4,487.3
Total gross loans
45,757.5
4,539.0
1,216.2
51,512.7
Impairment Allowance for Loans
The following tables show the allocation for our impairment allowance for loans as of December 31, 2024, 2023 and 2022:
As of December 31,
2024
2023
2022
(S/ in millions)
%
(S/ in millions)
%
(S/ in millions)
%
Commercial loans
189.6
10.9
%
296.2
12.5
%
282.4
13.7
%
Consumer loans
1,372.9
78.7
%
1,862.4
78.7
%
1,622.4
78.6
%
Mortgage loans
93.8
5.4
%
87.2
3.7
%
61.6
3.0
%
Small and micro-business loans
88.2
5.1
%
121.5
5.1
%
96.9
4.7
%
Total(1)
1,744.4
100.0
%
2,367.4
100.0
%
2,063.4
100.0
%
(1)
Includes impairment allowance for indirect loans amounting to S/14.2 million as of December 31, 2024, S/17.9 million as of December 31, 2023 and S/35.5 million as of December 31, 2022. See Note 6(d.2) to our audited annual consolidated financial statements.
The following table shows the changes in our impairment allowance for loans for the periods indicated.
For the year ended December 31,
2024
2023
2022
(S/ in millions)
Balance as of January 1
2,367.4
2,063.4
2,105.2
Provision
1,720.2
1,981.8
830.6
Recoveries of written-off loans
179.7
138.9
155.1
Written-off loans and sales
(2,524.9
)
(1,813.7
)
(1,021.5
)
Translation result and others
2.1
(3.0
)
(6.0
)
Balance as of December 31,
1,744.4
2,367.4
2,063.4
Allowances for indirect loans
14.2
17.9
35.5
Allowances for direct loans
1,730.2
2,349.4
2,027.9
Total allowances for loan losses
1,744.4
2,367.4
2,063.4
Allowances for Loan Losses at end of Period as a Percentage of Total Loans
3.5
%
4.9
%
4.4
%
Ratios of Charge-Offs to Average Balance
Commercial loans
0.1
%
0.1
%
0.1
%
Consumer loans
4.4
%
3.2
%
1.8
%
Mortgage loans
0.0
%
0.0
%
0.0
%
Small and micro business loans
0.4
%
0.3
%
0.2
%
130
The ratio of allowances for loan losses to average loans was 3.5% in 2024 compared to 4.9% in 2023. The lower ratio was mainly explained by lower allowances for direct loans both in retail and commercial banking.
Lower allowances for direct loans were explained by improved payment behavior by clients and a shift in the loan portfolio towards lower risk products.
The following tables show the changes in our impairment allowance for loans (direct and indirect) by line of business for the period indicated.
For the Year Ended December 31, 2024
Commercial loans
Mortgage loans
Consumer loans
Small and micro-business loans
Total
(S/ in millions)
Balance as of January 1
296.2
87.2
1,862.4
121.5
2,367.4
Provision
(34.3
)
8.0
1,655.2
91.2
1,720.2
Recovery of written-off loans
4.3
—
165.1
10.3
179.7
Written-off loans and sales
(78.2
)
(1.8
)
(2,310.0
)
(134.9
)
(2,524.9
)
Translation result and others
1.6
0.3
0.2
—
2.1
Balance as of December 31
189.6
93.8
1,372.9
88.2
1,744.4
For the Year Ended December 31, 2023
Commercial loans
Mortgage loans
Consumer loans
Small and micro-business loans
Total
(S/ in millions)
Balance as of January 1
282.4
61.6
1,622.4
96.9
2,063.4
Provision
73.9
29.7
1,764.1
114.1
1,981.8
Recovery of written-off loans
5.2
—
123.7
10.0
138.9
Written-off loans and sales
(63.0
)
(3.6
)
(1,647.6
)
(99.6
)
(1,813.7
)
Translation result and others
(2.3
)
(0.5
)
(0.2
)
—
(3.0
)
Balance as of December 31
296.2
87.2
1,862.4
121.5
2,367.4
For the Year Ended December 31, 2022
Commercial loans
Mortgage loans
Consumer loans
Small and micro-business loans
Total
(S/ in millions)
Balance as of January 1
383.2
155.2
1,401.7
165.1
2,105.2
Provision
(34.1
)
(90.1
)
966.9
(12.1
)
830.6
Recovery of written-off loans
5.9
—
140.4
8.7
155.1
Written-off loans and sales
(68.4
)
(2.3
)
(886.2
)
(64.7
)
(1,021.5
)
Translation result and others
(4.4
)
(1.2
)
(0.4
)
—
(6.0
)
Balance as of December 31
282.4
61.6
1,622.4
96.9
2,063.4
Composition of Deposits and Obligations
The following tables provide information on the composition of our deposits obligations for the periods indicated.
131
As of December 31,
2024
2023
2022
(S/ in millions)
%
(S/ in millions)
%
(S/ in millions)
%
Demand deposits
Soles
8,252.0
15.3
%
8,202.7
16.7
%
7,467.3
15.4
%
Foreign currency
5,494.6
10.2
%
5,173.7
10.5
%
6,357.6
13.1
%
Total
13,746.7
25.6
%
13,376.4
27.2
%
13,824.8
28.5
%
Savings deposits
Soles
12,468.5
23.2
%
11,382.6
23.1
%
12,395.3
25.5
%
Foreign currency
6,943.2
12.9
%
6,373.5
13.0
%
8,516.4
17.5
%
Total
19,411.7
36.1
%
17,756.1
36.1
%
20,911.7
43.1
%
Time deposits
Soles
12,161.8
22.6
%
10,242.0
20.8
%
8,285.3
17.1
%
Foreign currency
7,729.3
14.4
%
7,046.6
14.3
%
4,581.4
9.4
%
Total
19,891.1
37.0
%
17,288.6
35.1
%
12,866.7
26.5
%
Others
Soles
568.8
1.1
%
593.5
1.2
%
695.6
1.4
%
Foreign currency
149.7
0.3
%
173.6
0.4
%
231.9
0.5
%
Total
718.5
1.3
%
767.1
1.6
%
927.5
1.9
%
Total deposits
Soles
33,451.1
62.2
%
30,420.8
61.8
%
28,843.5
59.4
%
Foreign currency
20,316.9
37.8
%
18,767.4
38.2
%
19,687.2
40.6
%
Total
53,768.0
100.0
%
49,188.2
100.0
%
48,530.7
100.0
%
As of December 31, 2024, 2023 and 2022, we did not have individual material deposits by foreign depositors that exceeded 10% of our total Deposits and Obligations.
132
The following table provides information on the composition of our domestic and foreign deposits, by average balances and average nominal rate, for the periods indicated.
For the year ended December 31,
2024
2023
2022
(S/ in millions)
Deposits in Domestic Offices
Demand deposits
Average balance
Soles
8,361.2
7,582.1
8,127.6
Foreign currency
4,192.5
4,294.4
4,552.9
Total
12,553.7
11,876.5
12,680.5
Average nominal rate
Soles
2.7
%
4.5
%
3.2
%
Foreign currency
1.5
%
1.6
%
0.5
%
Total
2.3
%
3.4
%
2.2
%
Savings deposits
Average balance
Soles
12,185.1
11,259.1
12,832.2
Foreign currency
6,571.9
7,375.7
8,562.4
Total
18,757.0
18,634.8
21,394.6
Average nominal rate
Soles
1.5
%
1.4
%
1.0
%
Foreign currency
0.6
%
0.8
%
0.4
%
Total
1.2
%
1.2
%
0.7
%
Time deposits
Average balance
Soles
10,917.2
10,129.6
6,469.5
Foreign currency
5,865.5
4,060.3
2,758.7
Total
16,782.7
14,189.9
9,228.2
Average nominal rate
Soles
5.5
%
7.1
%
4.6
%
Foreign currency
3.9
%
4.3
%
1.1
%
Total
5.0
%
6.3
%
3.6
%
Others
Average balance
Soles
585.9
632.9
714.1
Foreign currency
163.6
199.6
243.1
Total
749.5
832.5
957.1
Average nominal rate
Soles
6.9
%
6.8
%
6.6
%
Foreign currency
3.7
%
4.2
%
4.1
%
Total
6.2
%
6.2
%
6.0
%
Deposits in Foreign Offices
Demand deposits
Average balance
Soles
—
—
—
Foreign currency
926.4
1,269.1
2,004.8
Total
926.4
1,269.1
2,004.8
Average nominal rate
Soles
0.0
%
0.0
%
0.0
%
Foreign currency
0.0
%
0.0
%
0.0
%
Total
0.0
%
0.0
%
0.0
%
Time deposits
Average balance
Soles
—
—
—
Foreign currency
2,173.4
2,266.2
1,832.5
Total
2,173.4
2,266.2
1,832.5
Average nominal rate
Soles
0.0
%
0.0
%
0.0
%
Foreign currency
3.9
%
4.1
%
3.1
%
Total
3.9
%
4.1
%
3.1
%
133
Uninsured Deposits
Uninsured deposits are deposits that are in excess of local deposit insurance fund, see “Regulation and Supervision—Banking regulations and supervision - Deposit Insurance Fund”, calculated based on the respective local regulations, as well as deposits in uninsured accounts. As of December 31, 2024, 2023 and 2022 total estimated uninsured deposits were S/33,790.0 million, S/30,519.8 million, and S/30,520.7 million, respectively.
The table below, shows the maturity of estimated uninsured time deposits as of December 31, 2024.
For the year ended December 31, 2024
(S/ in millions)
Uninsured time deposits
Within 3 months
12,921.8
From 3 to 6 months
2,599.2
From 6 to 12 months
3,662.7
Over 12 months
703.1
Total uninsured time deposits
19,886.9
The following tables provide information on the maturity of our deposits for the periods indicated.
As of December 31, 2024
1 month
1-3 months
3 months-1 year
1-5 years
More than 5 years
Total
(S/ in millions)
Maturity of Deposits
Demand deposits
13,746.7
—
—
—
—
13,746.7
Saving deposits
19,411.7
—
—
—
—
19,411.7
Time deposits
7,744.9
5,179.6
6,263.4
413.0
290.2
19,891.1
Total
40,903.3
5,179.6
6,263.4
413.0
290.2
53,049.5
Percentage of Total
77.1
%
9.8
%
11.8
%
0.8
%
0.5
%
100.0
%
As of December 31, 2023
1 month
1-3 months
3 months-1 year
1-5 years
More than 5 years
Total
(S/ in millions)
Maturity of Deposits
Demand deposits
13,376.4
—
—
—
—
13,376.4
Saving deposits
17,756.1
—
—
—
—
17,756.1
Time deposits
6,131.7
3,890.6
6,458.1
512.3
296.0
17,288.6
Total
37,264.1
3,890.6
6,458.1
512.3
296.0
48,421.1
Percentage of Total
77.0
%
8.0
%
13.3
%
1.1
%
0.6
%
100.0
%
As of December 31, 2022
1 month
1-3 months
3 months-1 year
1-5 years
More than 5 years
Total
(S/ in millions)
Maturity of Deposits
Demand deposits
13,824.8
—
—
—
—
13,824.8
Saving deposits
20,911.7
—
—
—
—
20,911.7
Time deposits
2,797.7
1,973.3
6,788.7
1,023.5
283.5
12,866.6
Total
37,534.3
1,973.3
6,788.7
1,023.5
283.5
47,603.2
Percentage of Total
78.8
%
4.1
%
14.3
%
2.2
%
0.6
%
100.0
%
134
Short-Term Borrowings
The following tables provide information on the composition of our short-term borrowings for the periods indicated.
As of December 31,
2024
2023
2022
(S/in millions)
Average rate
(S/in millions)
Average rate
(S/ in millions)
Average rate
Inter-bank funds
—
—
119.7
6.8
%
30.0
7.5
%
Due to banks and correspondents
3,242.9
5.1
%
4,485.8
5.1
%
2,107.8
5.0
%
Bonds, notes and other obligations
—
—
—
—
—
—
Total
3,242.9
5.1
%
4,605.5
5.1
%
2,137.8
5.0
%
As of December 31,
2024
2023
2022
(S/in millions except for percentages)
Average balance
4,191.5
3,349.1
1,445.1
Maximum quarter-end balance
4,669.1
4,669.1
2,137.8
Weighted-average nominal interest rate
5.1
%
5.9
%
4.7
%
ETHICS AND CORPORATE COMPLIANCE
IFS is firmly committed to promoting a world-class culture of ethics within its subsidiaries, which serves as the foundation of our business operations and stakeholder relationships. Guided by our Corporate Code of Ethics, we promote ethical behavior and compliance with applicable laws, regulations, and international standards across our operations.
In April, 2024, we updated our Corporate Code of Ethics to reflect our evolving commitments and sustainability strategy. The revised code incorporates topics such as human rights, community, and environmental responsibility, reinforcing our commitment to integrity and driving a positive impact on society.
In 2024, we strengthened our commitment to human rights by updating our human rights risk assessment to align with global standards and emerging challenges. As part of this progress, we formalized a remediation protocol to address potential breaches of our Human Rights Policy, ensuring a structured response mechanism. Additionally, we integrated human rights considerations into our sustainability initiatives, further solidifying our position as an ESG-focused organization.
The Corporate Compliance Program is designed to prevent, detect through internal controls, and report inappropriate conduct, comply with laws and regulations, and mitigate reputational risk to maintain a sustainable business. IFS has a Corporate Compliance Policy based on local and US regulations, the best international practices, and our principles and values.
IFS conducts periodic risk assessments, as well as independent external and internal audits, to evaluate the effectiveness of its compliance program. Findings are presented to the board of directors to ensure proper oversight and accountability. The program is enhanced through mandatory training for all employees, including specialized sessions tailored for the board of directors, front-office staff, and compliance team members. This training aims to prevent misconduct and reinforce adherence to compliance policies. Additionally, a structured sanction program supports these efforts.
The Compliance Program is led by the Chief Compliance Officer (“CCO”), who reports directly to the board of directors, with a functional reporting line to the CEO and is responsible for overseeing the Compliance Program within the organization. Moreover, each subsidiary has a designated Compliance Officer who reports to the CCO and to their respective board of directors.
The Compliance Program has a risk-based approach, which focuses on mitigation of risks that could negatively affect our reputation. This proactive approach seeks to ensure that our resources are focused on the most critical areas of risk, allowing us to effectively prevent, detect, and address potential issues before they escalate. To support this, our program includes the following policies:
IFS has implemented a risk-based AML/ATF program focused on fostering a culture of prevention. This program is designed to foster compliance with regulations applicable to each subsidiary, as well as with international standards and best practices, including those set forth by the Financial Action Task Force (FATF).
The subsidiaries have implemented their policies and procedures in alignment with the IFS Corporate Compliance Policy and local regulation, approved by their respective boards of directors and reviewed on an annual basis. The program includes but is not limited to:
•
AML/AFT policy and procedures.
•
AML/CTF Risk assessment to evaluate exposures.
•
Due diligence protocols, including Customer Identification Program (“CIP”), Know Your Customer, and enhanced due diligence (EDD) procedures, which include monitoring the OFAC and International Sanctions List.
•
Know your employee, vendor, and counterparty policies to assess and mitigate risks.
•
Annual review of high-risk customers.
•
Mandatory training for all directors and employees to ensure understanding of compliance responsibilities.
In response to digital transformation, we strive to enhance our capabilities by incorporating technology and analytics to improve efficiency, automate processes, and optimize compliance efforts. These technologies allow us to more effectively prevent and detect money laundering and the financing of terrorism using customized risk models tailored to our specific risk profile and evolving regulatory landscape.
Additionally, the AML Compliance Officer of each subsidiary reviews and reports any suspicious transactions to their local regulatory authority when applicable.
Anti-Corruption Program
IFS is committed to conducting its business in accordance with world-class ethics and compliance standards. As part of this commitment, IFS prohibits its directors, officers and employees from making any political contribution on its behalf or its subsidiaries.
Our Anti-Corruption program is built upon a robust framework of policies and procedures designed to comply with the local and international anti-corruption laws, including the Foreign Corrupt Practices Act (“FCPA”).The program is tailored to IFS’s business model and risk profile, and it encompasses, among other elements, roles and responsibilities, a zero-tolerance policy towards bribery and corruption, guidelines on gifts, conflicts of interest, donations, and hiring and appointing employees, officers, and directors. Reporting mechanisms for violations and corresponding sanctions are integrated into the program.
The subsidiaries have implemented their respective Anti-Corruption programs in alignment with the IFS Corporate Compliance Policy and local anti-bribery regulations.
Insider Trading
The IFS insider trading policy prohibits directors, officers, and employees from engaging in the buying or selling of securities related to the company while in possession of material, non-public information. Moreover, it forbids these individuals from disclosing any sensitive, non-public information to others who might be influenced or encouraged to trade securities based on this undisclosed information. This policy helps ensure the integrity of our financial markets and upholds the highest standards of ethical conduct. For further information on our insider trading policies, please see “Item 16J. Insider Trading Policies.”
Consumer Data Privacy Program
In accordance with local regulations and international best practices, IFS is committed to ensuring that personal data is collected, used and processed in accordance with the purpose for which it was provided, with the consent of the clients.
This program complies with the legal framework set forth by Law No. 29733, Personal Data Protection Law, and its regulation approved by Supreme Decree No. 016-2024-JUS. In addition, subsidiaries subject to this law have implemented internal controls in accordance with the IFS Corporate Compliance Program, ensuring a unified approach to data protection across the organization.
136
To maintain accountability and uphold these standards, IFS and its subsidiaries have a sanction program for non-compliance with data protection laws, in order for violations to be promptly addressed and rectified.
Fiscal Transparency
O.C.D.E. Common Report Standard (“CRS”)
IFS and its subsidiaries are CRS compliant. In adherence to CRS requirements, IFS and its subsidiaries regularly report financial information to their respective tax authorities. This reporting is done periodically according to local regulation, ensuring that the companies disclose relevant financial data as required by the CRS guidelines. By doing so, we uphold our commitment to transparency and continue working to remain in compliance with global tax regulations.
U.S. Foreign Account Tax Compliance Act (“FATCA”)
IFS and its subsidiaries are committed to global tax transparency and regulatory compliance. As part of this commitment, IFS is FATCA compliant, and all subsidiaries are classified as Reporting Model 1. As part of the Expanded Affiliated Group, Intercorp serves as the lead entity responsible for ensuring that all FATCA reporting and compliance obligations are met across the subsidiaries.
Dodd Frank
As a counterparty to U.S. banks for operations with derivatives, must adhere to the Dodd Frank Protocol. Such requirements include the settlement of certain operations through a clearinghouse and adherence to the International Swaps and Derivatives Association (“ISDA”) standards to comply, where applicable, with Dodd Frank regulations.
Whistleblower Hotline
IFS and its subsidiaries have a confidential and independent reporting channel available 24/7, that allows employees and stakeholders to report concerns such as suspected misconduct, fraudulent practices, policy violations, or unethical or unlawful behavior. Reports can be submitted anonymously through the website, e-mail, or phone call. The hotline is managed by a third party and whistleblowers are protected under our Non-Retaliation Policy to ensure the confidentiality, anonymity, and data integrity of the complaint. Each subsidiary’s compliance team is responsible for managing the investigation and resolution of reported cases. For allegations involving sensitive matters or senior management, escalation protocols are in place, ensuring reports to be directed to the CEO of IFS, the Audit Committee and/or Board of Directors.
ITEM 4A. Unresolved Staff Comments
None.
ITEM 5. OPERATING AND FINANCIAL REVIEW AND PROSPECTS
A.
Operating Results
Factors Affecting Our Results of Operations
Substantially all of our operations are conducted in Peru. Accordingly, our results of operations and financial condition are dependent on economic conditions, consumer spending and investment levels in Peru. During the 1980s, Peru experienced a severe economic crisis and high levels of inflation. Beginning in the 1990s, however, the Peruvian government implemented a series of structural reforms, which helped stabilize the Peruvian economy and foster continued GDP growth, lower inflation and interest rates, more stable currency and significantly improved public finances. In recent years, the country’s economy has experienced a slowdown, mainly explained by lower domestic demand, as a result of a lower growth in private investment. This slowdown was intensified due to several factors, such as (i) a strong El Niño phenomenon; (ii) corruption scandals; and (iii) political instability, which have resulted in resignations and impeachment of various presidents, following an attempted coup, as well as investigations of certain members of the presidential and judicial systems and the public ministry who are now facing prosecution.
Despite the factors mentioned above, the Peruvian economy continued to outperform its peer countries in 2019, supported by solid macroeconomic fundamentals and strong fiscal and monetary policies. Moreover in 2020, Peru experienced an 11.0% GDP contraction as a result of the impact of the COVID-19 pandemic, and the mobility restrictions implemented by the Peruvian government to contain the spread of the pandemic, which in turn resulted in (i) lower employment, (ii) postponement of investment projects, and (iii) restricted access to goods and services. As a result of the reductions in private consumption and gross fixed investment, domestic demand decreased 9.8% during the year.
137
At the beginning of 2021, Peru continued to struggle from the effects of the pandemic but started to recover over time as targeted lockdowns decreased and were eventually lifted and the vaccination program accelerated. The recovery was mainly driven by domestic demand-oriented sectors, improved trade terms, higher private consumption, and the base effect of such improvements as compared to 2020. Nevertheless, such improved economic landscape was negatively affected by the uncertainty that arose in the run up to the April 2021 presidential and congressional elections. These political events contributed to a slowdown in GDP growth, volatility of the exchange rate and weakening of the local currency, which in turn also affected inflation. As a result of these factors, the Peruvian GDP grew 13.3% in 2021.
In 2022, political uncertainty and social unrest caused an economic deceleration that drove GDP growth to 2.7%. The most affected sectors included mining, tourism and agriculture. As a result, inflation increased to 8.5% for the year ended December 31, 2022. To curb inflation, the BCRP tightened its monetary policy by increasing the reference policy rate to 7.50% as of December 2022.
In 2023, GDP contracted by 0.6%. Some of the most important drivers were social conflicts and the El Niño weather phenomenon, which led to a contraction of GDP by almost two percentage points, according to the BCRP. In addition to these factors, the Peruvian economy was also affected by: (i) persistent high inflation (especially in the food sector) despite the economic slowdown (which started in the second half of 2023), (ii) real wages that remained below pre-pandemic levels, (iii) real interest rates at two-decade highs due to the BCRP’s effort to control inflation, (iv) political uncertainty, and (v) a decrease in new large projects which are usually drivers for private investment. In Peru, the weakness of domestic demand also had a role in reducing inflation. Domestic demand fell from a peak of 8.8% in June 2022 (highest in 26 years) to 3.2% in December 2023 due to the reversal of supply shocks in the agricultural sector in early 2023, the normalization of global supply chains and lower commodity prices. By the end of 2023, core inflation reached 2.9% (from 8.5% by the end of 2022), returning to the BCRP target range of between 1% - 3%, and the BCRP reference policy rate was reduced to 6.75% as of December 2023 (from 7.50% as of December 2022).
In 2024, the economy showed a recovery compared to 2023. The GDP grew 3.3%, mostly driven by a 3.8% increase in domestic demand and an increase in public investment, particularly in infrastructure, which contributed positively to economic growth. Additionally, primary sectors such as fishing, which benefited because of the open season this year, and the agricultural and livestock sector, which showed a 4.9% increase, had a strong performance. The reference rate decreased by 280 basis points, which is in line with reductions by the Federal Reserve, and inflation remained in line with the BCRP target range at 1.97%. The exchange rate also showed a stable performance. Finally, the economy received positive impacts due to private investment, mostly in infraestructure with projects such us the "Mega Puerto de Chancay", which represents an approximate investment of US$3.4 billion and aims to establish Peru as a key port hub in the South Pacific.
Public external debt as a percentage of Peruvian GDP
15.5
%
15.8
%
17.5
%
19.5
%
14.9
%
Net international reserves (U.S.$ in millions)
78,987
71,033
71,883
78,495
74,707
Sources: The Central Reserve Bank of Peru and INEI.
The Peruvian government’s conservative fiscal policy, coupled with the Central Reserve Bank of Peru’s responsible management of inflation and international reserves has helped Peru maintain its investment grade ratings by Moody’s (Baal), S&P (BBB-) and Fitch (BBB). Peru’s credit ratings are subject to periodic review and may be revised or lowered at any time.
Furthermore, in its most recent forecast as of March 31, 2025, the Central Reserve Bank of Peru has estimated real GDP growth of 3.2% for 2025, as compared to a 3.0% growth in 2024, a 0.6% decrease registered in 2023 and a 2.7% increase registered in 2022.
138
Interest Rates
In general, increases in prevailing interest rates result in more interest revenue from loans. An increase of prevailing interest rates may, however, adversely affect Interbank as a result of reduced overall demand for loans and greater risk of default by its clients. In addition, relatively high interest rates affect Interbank’s funding costs, and can adversely affect spreads on its loan portfolio if Interbank is unable to pass on the increased funding costs to its clients. On the other hand, a decrease in interest rates can reduce Interbank’s revenue from its loan portfolio. This revenue decrease may be offset by an increase in the volume of loans resulting from higher demand and/or a decrease in Interbank’s funding costs. As a result of the COVID-19 pandemic, on April 9, 2020, the Central Reserve Bank of Peru took several measures, such as reducing the reference interest rate by 200 basis points from 2.25% to 0.25%. This measure affected both interest income and interest expense.
In May 2021, the Central Reserve Bank of Peru set the methodology to determine maximum interest rates applicable to three types of loans: (i) ordinary consumer credit; (ii) consumer loans equivalent to two UIT (Unidad Impositiva Tributaria”) or less; and, (iii) credit for small and micro businesses, as ruled by Law 31143. Maximum interest rates are to be set at two times the average rate of consumer loans during the period between two and seven months prior to becoming effective. The interest rate cap was first effective for the period between May and October 2021 at a level of 83.4% for loans denominated in soles and 68.4% for loans denominated in U.S. dollars. For the period between November 2022 and April 2023, the interest rate cap was 87.9% for loans denominated in soles and 68.3% for loans denominated in U.S. dollars. For the period between May and October 2023, the interest rate cap was 96.32% for loans denominated in soles and 77.50% for loans denominated in U.S. dollars. For the period between November 2023 and April 2024, the interest rate cap was 101.86% for loans denominated in soles and 82.94% for loans denominated in U.S. dollars. For the period between May 2024 and October 2025, the interest rate cap is 109.8% for loans denominated in soles and 87.6% for loans denominated in U.S. dollars. The interest rate cap does not represent a major disruption to Interbank’s results.
Increases in interest rates negatively affect the value of Interseguro’s fixed income portfolio. However, higher rates allow Interseguro to reinvest new annuities at a higher yield. At the same time, increases in interest rates result in an increase in the discount rate Interseguro uses to calculate its reserve requirements, which has the effect of reducing Interseguro’s required technical reserves. Conversely, if interest rates fall, Interseguro’s portfolio will have a lower average interest rate, resulting in Interseguro having to record higher technical reserves.
Similar to Interbank, an increase in prevailing interest rates may adversely affect Inteligo as a result of reduced overall demand for loans, as well as lower interest margins if Inteligo is unable to pass on higher funding costs to its clients. On the other hand, a decrease in interest rates may reduce Inteligo’s revenue from its loan portfolio. Furthermore, a portion of Inteligo’s revenues corresponds to earnings from its investment portfolio and is therefore exposed to interest rates fluctuations that may affect revenue from fixed-income instruments.
Increases in interest rates result in additional interest income from Inteligo’s variable-rate investments, but may also result in capital losses on its fixed-rate investments.
Likewise, increases in interest rates in Izipay result in lower transactional volumes because of higher cost of debt for the customers. Also, in this context, Izipay’s funding strategy may be affected because of higher financial cost.
Inflation
Our performance may be impacted by inflation, because substantially all of our assets are not adjusted for the effects of inflation. During the 1980s, Peru experienced hyperinflation, negative economic growth and substantial currency devaluation. Inflation rates in Peru began to decrease in the 1990s and in the last 14 years Peru had one of the lowest average inflation rates in the region, partly due to the monetary policy implemented by the Central Reserve Bank of Peru and partly due to the conservative fiscal policy of the Peruvian government. In 2002, in order to maintain low inflation rates, the Central Reserve Bank of Peru established an annual inflation target of 2.5% within a range of one percentage point. In 2007, the target was lowered to 2%, within a range of one percentage point. The Central Reserve Bank of Peru has maintained its target inflation range ever since. The inflation rate in Peru, as measured by changes in the Metropolitan Lima consumer price index published by the INEI, was 12.2% in 2018, 1.9% in 2019, 2.0% in 2020, 6.4% in 2021, 8.5% in 2022, 3.2% in 2023 and 1.97% in 2024. In its most recent forecast as of December 20, 2024, the Central Reserve Bank of Peru has estimated Peru’s inflation to be 2.0% in 2025.
Depreciation and Appreciation of the sol
The sol floats freely against other currencies. Nevertheless, the Central Reserve Bank of Peru participates in the market (buying or selling soles) in order to avoid any large fluctuations in the exchange rate because of the effects that it could have on the Peruvian economy, which remains partly dollarized. Because a significant portion of our subsidiaries’ assets and liabilities are
139
denominated in U.S. dollars and our consolidated financial statements are prepared in soles, the results reflected in our consolidated financial statements are affected by fluctuations in the exchange rates between the sol and the U.S. dollar.
In 2015, the sol depreciated significantly against the U.S. dollar and remained relatively stable until the beginning of 2020. However, during 2020, the sol rapidly depreciated against the U.S. dollar as a result of the COVID-19 pandemic, which in 2021 and 2022 continued to depreciate due to political uncertainty in Peru, global market volatility and the rising inflation. In this context, any future changes in the value of the sol against the U.S. dollar and other foreign currencies could adversely affect our financial condition and results of operations to the extent that our subsidiaries maintain a gap between foreign denominated assets and liabilities.
The Peruvian government adopted a policy to encourage the de-dollarization of the Peruvian economy. This policy included promoting the development of a sol capital market and local currency yield curves. The proportion of outstanding loans in the banking system denominated in U.S. dollars has fallen from 51.0% as of December 31, 2011 to 27.5% as of December 31, 2024, according to figures published by the SBS. The percentage of deposits in the banking system denominated in U.S. dollars was approximately 47.3% as of December 31, 2011 compared to 39.1% as of December 31, 2024. Interbank’s proportion of loans in soles increased from 53.2% as of December 31, 2011 to 74.0% as of December 31, 2024, while deposits in soles increased from 56.8% as of December 31, 2011 to 65.9% as of December 31, 2024.
As of December 31, 2024, 69.5% of Interseguro’s investment portfolio was invested in soles and 30.5% was invested in U.S. dollars. According to Interseguro’s investment policy, it allocates the currency of its investment portfolio to mitigate potential currency volatility between its investment assets and its insurance liabilities.
Substantially all of Inteligo’s financial assets and liabilities are denominated in U.S. dollars.
Monetary Policy
From January 2017 to December 2020, the Central Reserve Bank of Peru (BCRP) decreased the reference rate from 4.25% to 0.25%. On March 19, 2020, it reduced its reference rate by 100 basis points to 1.25% and to 0.25% on April 9, 2020 as a result of the COVID-19 pandemic. However, in response to rising inflationary concerns, BCRP started tightening its monetary policy, similar to other monetary authorities around the world, from 0.25% in August 2021 to 7.50% in December 2022. In 2023, the BCRP decreased the rates to 7.00% and 6.75% as of November 30, 2023 and December 19, 2023, respectively. In 2024, the BCRP kept on gradually decreasing rates by 25 basis points until reaching a reference rate of 5.75% in May 2024. In August and September 2024, the BCRP further reduced the reference rate by 25 basis points cuts to reach 5.25%. In November 2024, the BCRP further lowered the reference interest rate 25 basis points. As of December 31, 2024, the reference interest rate was 5.00%. As of March 31, 2025, the reference interest rate was 4.75%.
Regulatory Changes
In April 2016, a new law entered in force which allows retirees to withdraw 95.5% of their pension funds as a one-time transaction. As a second stage of this law, in October 2016, retirees were allowed to withdraw their pension fund in several transactions whenever desired. This regulatory change resulted in a 36% yearly contraction for the Peruvian insurance system in purchases of regular and private annuities from 2015 to 2016, according to the SBS. Interseguro was negatively affected by the law, with annuities collected of S/337.8 million in 2016, a 38% reduction compared to 2015.
However, as of December 2022, the annuities market has continued to stabilize as a result of the introduction of private annuities, a type of annuity created to fill the vacuum left by the law. This product, pioneered by Interseguro in October 2016 and soon followed by other providers, helped the industry recover a portion of the lost market. In 2024, private annuities accounted for 10.9% of the premiums collected in 2024 for the insurance industry. For Interseguro, private annuities represented 49.4% of its S/667.7 million in collections in annuities as of December 31, 2024.
Subsequent Adjustments to the Expected Loss Model
Due to the risks and uncertainties originated by economic and political uncertainty in Peru, rising inflation, global financial market volatility (as discussed in our Annual Report on Form 20-F for the year ended December 31, 2022, filed with SEC on April 25, 2023) and the “El Niño” phenomenon (as discussed in our Annual Report on Form 20-F for the year ended December 31, 2023, filed with SEC on April 26, 2024) Interbank assessed whether to include a series of expert judgments with the purpose of calculating the expected loss pursuant to the requirement established by IFRS 9.
We adjusted our expected loss model to include in the calculation the effects of the uncertainty and risks generated by current events as of December 31, 2024. In connection with these adjustments, expert judgment was employed to capture the impact of governmental decisions in Peru regarding the withdrawal of CTS deposits and AFP funds on the loan portfolio.
140
Adoption of New Standards and Disclosures
Generally, we have only adopted standards, interpretations or amendments that were effective in each year. Therefore, standards, interpretations or amendments that become effective in 2025 or later have not been early adopted.
On January 1, 2024, we adopted the following standards, interpretations, or amendments: (i) in connection with lease liability in a sale and leaseback, amendments to IFRS 16 "Leases," (ii) in connection with classification of liabilities as current or non-current, amendments to IAS 1 "Presentation of Financial Statements” and (iii) in connection with supplier finance arrangements, amendments to IAS 7 "Statements of Cash Flows" and IFRS 7 "Financial instruments: Disclosures". See Note 3.2 to our audited annual consolidated financial statements.
On January 1, 2023, we adopted the following standards, interpretations, or amendments: (i) IFRS 17 "Insurance Contracts", (ii) in connection with the definition of Accounting Estimates, an amendment to IAS 8 “Accounting Policies, Changes in Accounting Estimates and Errors,” (iii) in connection with the disclosure of Accounting Policies, amendments to IAS 1 “Presentation of Financial Statements” and IFRS Practice Statement 2 “Making Materiality Judgements,” (iv) in connection with Deferred Tax related to Assets and Liabilities arising from a Single Transaction, amendments to IAS 12 “Income Taxes,” and (v) in connection with the International Tax Reform – Pillar Two Model Rules, amendments to IAS 12 “Income Taxes.” Such standards, interpretations or amendments have not had a significant impact on our consolidated financial statements.
On January 1, 2022, we adopted the following standards, interpretations, or amendments: (i) in connection with costs of fulfilling a contract, an amendment to IAS 37 “Provisions, Contingent Liabilities and Contingent Assets,” (ii) amendments to IFRS 3 “Business Combinations,” (iii) in connection with proceeds before intended use of property, plant and equipment, an amendment to IAS 16 “Property, Plant and Equipment,” (iv) in connection with a subsidiary as a first time adopter, an amendment to IFRS 1 “First-time Adoption of International Financial Reporting Standards,” and (v) in connection with fees in the “10 per cent” test for derecognition of financial liabilities, an amendment to IFRS 9 “Financial Instruments.” Such standards, interpretations or amendments have not had a significant impact on our consolidated financial statements.
Critical accounting estimates and judgments
In preparing our audited annual consolidated financial statements in accordance with International Financial Reporting Standards (IFRS), as issued by the IASB, we apply judgment and make estimates and assumptions that may involve significant uncertainty at the time they are made. We regularly reassess those estimates and assumptions, which encompass historical experience, expectations of the future and other pertinent factors, to determine their continuing relevance based on current conditions, and we update them as necessary.
We believe that the judgments, estimates and assumptions we have made are appropriate under the circumstances and that our audited annual consolidated financial statements fairly present, in all material respects, the financial positions of IFS as of December 31, 2024 and 2023 and the results of our operations and cash flows for the years ended December 31, 2024, 2023 and 2022 in accordance with IFRS.
For more information about our critical accounting estimates and judgments, see: Note 3.4 "Material accounting policies”; Note 3.6 "Significant accounting judgments, estimates and assumptions”; Note 29.1 "Credit Risk”; and Note 29.2 "Market Risk management” to our audited annual consolidated financial statements; and “Item 3. Key Information—Risk Factors” of this Annual Report on Form 20-F for more information.
Principal Line Items in Consolidated Income Statements
Below is a description of certain significant line items:
•
interest and similar income includes interest from our loan portfolio plus interest and dividends from our investment portfolio and is composed of the following line items: (i) interest on loan portfolio, (ii) interest on financial investments, (iii) interest on due from banks and inter-bank funds, (iv) dividends on financial investments, and (v) other interest and similar income. See Note 19(a) to our audited annual consolidated financial statements;
•
interest and similar expenses includes all financial expenses incurred to fund our operations and is composed of the following line items: (i) interest and fees on deposits and obligations, (ii) interest on bonds, notes and other obligations, (iii) interest and fees on obligations with financial institutions, (iv) deposit insurance fund fees, (v) interest on lease payments, and (vi) other interest and similar expenses. See Note 19(a) to our audited annual consolidated financial statements;
141
•
impairment loss on loans, net of recoveries includes provisions recognized as expense, net of recoveries. See Note 6(d.1) and (d.2) to our audited annual consolidated financial statements;
•
recovery (loss) due to impairment of financial investments includes impairment loss recognized as expense, net of recoveries. See Note 5(c) to our audited annual consolidated financial statements;
•
fee income from financial services, net includes primarily commissions and other fees we charge to our customers, net from related expenses, and is composed of the following line items: (i) accounts maintenance, carriage, transfers, and debit and credit card fees, (ii) income from services (“acquirer and card issuer roles”), (iii) funds management, (iv) banking services fees, (v) contingent loan fees, (vi) collection services, and (vii) brokerage and custody services. See Note 20(a) to our audited annual consolidated financial statements;
•
other income includes: (i) maintenance, installation and sale of POS equipment, (ii) gain from sale of written-off loans, (iii) profit from sale of property, furniture and equipment, (iv) services rendered to third parties; (v) income from ATM rentals, (vi) income from investments in associates, (vii) other technical income from insurance operations and (viii) other income. See Note 21(a) to our audited annual consolidated financial statements;
•
Result from insurance activities includes: (i) insurance service income, (ii) insurance service expense, (iii) reinsurance income and (iv) financial result of insurance operations. See Note 22 to our audited annual consolidated financial statements; and
•
other expenses include: (i) salaries and employee benefits, (ii) administrative expenses, (iii) depreciation and amortization, (iv) sundry technical insurance expenses and commission from insurance activities and (v) expenses related to rental income, (vi) cost of sale of POS equipment, (vii) administrative and tax penalties and (viii) provision for accounts receivable. See Notes 8(a), 9(a), 21(a), 23, and 24 to our audited annual consolidated financial statements.
142
Financial Condition as of December 31, 2024 Compared to December 31, 2023
The following table sets forth the principal components of our consolidated statement of financial position as of December 31, 2024 and December 31, 2023.
As of December 31, 2024
As of December 31, 2023
Change
(S/ in millions)
(S/ in millions)
%
Assets
Cash, due from banks and inter-bank funds
12,835.3
10,343.6
2,491.7
24.1
%
Financial investments
26,857.9
26,722.0
135.9
0.5
%
Loans, net of unearned interest
50,959.6
48,869.8
2,089.8
4.3
%
Impairment allowance for loans
(1,730.2
)
(2,349.4
)
619.3
(26.4
%)
Investment property
1,381.8
1,298.9
82.9
6.4
%
Property, furniture and equipment, net
814.4
804.8
9.6
1.2
%
Intangibles and goodwill, net
1,667.8
1,687.1
(19.4
)
(1.1
%)
Reinsurance contract assets
18.6
26.3
(7.7
)
(29.2
%)
Other assets
2,698.5
2,221.6
476.9
21.5
%
Total assets
95,503.8
89,624.8
5,879.0
6.6
%
Liabilities and equity
Deposits and obligations
53,768.0
49,188.2
4,579.8
9.3
%
Due to banks and correspondents and inter-bank funds
7,562.1
9,145.6
(1,583.6
)
(17.3
%)
Bonds, notes and other obligations
6,075.4
5,551.6
523.8
9.4
%
Insurance and reinsurance contract liabilities
12,524.3
12,207.5
316.8
2.6
%
Other liabilities
4,595.3
3,523.6
1,071.7
30.4
%
Total liabilities
84,525.2
79,616.7
4,908.5
6.2
%
Equity, net
Equity attributable to IFS’s shareholders
10,915.2
9,950.2
965.0
9.7
%
Non-controlling interest
63.4
57.9
5.5
9.5
%
Total equity, net
10,978.6
10,008.1
970.5
9.7
%
Total liabilities and equity net
95,503.8
89,624.8
5,879.0
6.6
%
Our assets were S/95,503.8 million as of December 31, 2024, a 6.6% increase from S/89,624.8 million as of December 31, 2023. This was mainly driven by a 24.1% increase in cash, due from banks and inter-bank funds, a 4.3% increase in loans, net of unearned interest, a 26.4% reduction in impairment allowance for loans, a 0.5% increase in financial investments and a 6.4% increase in investment property. These factors were partially offset by decreases of 29.2% and of 1.1% in reinsurance contract assets and intangibles and goodwill, net, respectively.
The increase in cash, due from bank and inter-banks funds was mainly due to higher lace funds and deposits at the BCRP. The increase in loans, net of unearned interest, showed a higher balance mostly driven by an increase in the commercial portfolio. The reduction in impairment allowances of loans is mostly explained by a lower exposure to higher risk segments in the banking business, as well as a recovery of the Peruvian economy, which in turn positively impacted the payment behavior.
Our liabilities reached S/84,525.2 million as of December 31, 2024, a 6.2% increase from S/79,616.7 million as of December 31, 2023. This was mainly driven by a 9.3% increase in deposits and obligations, and increases of 30.4% in other liabilities, 9.4% in bonds, notes and other obligations and 2.6% in insurance and reinsurance contract liabilities, which was partially offset by a 17.3% reduction in due to banks and correspondents and inter-bank funds.
Our net equity was S/10,978.6 million as of December 31, 2024, a 9.7% increase from S/10,008.1 million as of December 31, 2023, mainly as a result of higher retained earnings.
For more information of our liquidity, capital resources and commitments and obligations, see “Item 5. Operating and Financial Review and Prospects—Liquidity and Capital Resources.”
143
Results of Operations for the Year Ended December 31, 2024 Compared to the Year Ended December 31, 2023
The following table sets forth the principal components of our consolidated profit for the years ended December 31, 2024 and 2023.
For the year ended December 31,
2024
2023
Change
(S/ in millions)
(S/ in millions)
%
Interest and similar income
7,029.4
7,120.4
(91.0
)
(1.3
)%
Interest and similar expenses
(2,480.3
)
(2,592.4
)
112.1
(4.3
)%
Net interest and similar income
4,549.1
4,528.0
21.1
0.5
%
Impairment loss on loans, net of recoveries
(1,720.2
)
(1,981.8
)
261.6
(13.2
)%
Loss due to impairment of financial investments
(47.5
)
(7.5
)
(40.0
)
533.6
%
Net interest and similar income after impairment loss
2,781.4
2,538.7
242.7
9.6
%
Fee income from financial services, net
1,142.9
1,178.5
(35.5
)
(3.0
)%
Other income
791.6
557.8
233.8
41.9
%
Result from insurance activities
(169.8
)
(178.4
)
8.6
(4.8
%)
Total other expenses
(2,900.2
)
(2,750.2
)
(150.0
)
5.5
%
Income before translation result and income tax
1,646.0
1,346.5
299.5
22.2
%
Translation result
(24.1
)
8.4
(32.6
)
(386.5
%)
Income Tax
(314.4
)
(275.6
)
(38.8
)
14.1
%
Net profit for the year
1,307.5
1,079.3
228.2
21.1
%
Attributable profit to:
IFS’ shareholders
1,300.1
1,072.8
227.3
21.2
%
Non-controlling interest
7.4
6.5
0.8
12.8
%
Our net profit was S/1,307.5 million for the year ended December 31, 2024, a 21.1% increase as compared to 2023.
The higher net profit was mainly a result of a decrease of S/261.6 million in impairment loss on loans, a S/233.8 million increase in other income as well as a S/112.1 million decrease in interest and similar expenses. These effects were partially offset by a S/150.0 million increase in other expenses, as well as a S/38.8 million increase in income tax and a S/35.5 million decrease in fee income from financial services.
Net interest and similar income grew S/21.1 million, or 0.5%, mainly due to a decrease of S/112.1 million in interest and similar expenses, mostly related to the downward trend in interest rates in the market, as well as the efficient funding strategy in our banking business. These effects were partially offset by a S/91.0 million decrease in interest and similar income, which was in turn due to a change in the loan portfolio in our banking business.
Impairment loss on loans, net of recoveries decreased S/261.6 million, explained by lower provision requirements in both retail and commercial loan books, associated with the improvement of the macroeconomic outlook in Peru; as well as the change in the loan mix, as lower risk segments such us mortgages, payroll deductible loans and commercial loans, gained relevance. Also, 2024 shows a loss due to impairment of financial investments of S/47.5 million, which is mostly due to a one-off event in the first quarter in our insurance business, as a result of the rating downgrade of a fixed income investment.
Other income showed an increase of S/233.8 million, due to an improvement in the results in our Wealth Management business, from a S/40.2 million loss to a S/80.5 million profit, which in turn is explained by an increase in the mark-to-market valuation on the proprietary investments, an increase of S/127.3 million in net gain on foreign exchange transactions from our banking business and a S/55.1 million increase in investment property, mostly related to our insurance business.
Fee income from financial services showed a decrease of S/35.5 million. This decrease was mostly explained by a reduction of S/34.3 million in Izipay's business, which in turn was related to higher competition and tightening margins, and a S/21.5 million reduction in our banking business. These effects were partially offset by a S/24.7 million increase in fee income from our Wealth Management business, due to the important increase in assets under management (AuMs).
Income tax showed an increase of S/38.8 million, in turn related to an increase in income before translation result and income tax.
144
The moderate increase in other expenses of S/150 million was mostly attributed to higher expenses in our three businesses. The efficiency ratio was 37.4% as of December 31, 2024, compared to the 36.8% registered in 2023.
IFS’s ROE was 12.2% in 2024, higher than the 11.3% registered in 2023.
Results of Operations by Segment
The following table presents an overview of certain consolidated income statement data for each of our segments for the years ended December 31, 2024 and 2023.
Banking
Insurance
Wealth Management
Holding, other subsidiaries and eliminations
Consolidated
2024
2023
2024
2023
2024
2023
2024
2023
2024
2023
Interest and similar income
5,969.6
6,076.0
871.0
851.6
178.2
183.9
10.6
8.8
7,029.4
7,120.4
Interest and similar expenses
(2,217.2
)
(2,363.8
)
(153.5
)
(126.7
)
(108.5
)
(98.4
)
(1.1
)
(3.5
)
(2,480.3
)
(2,592.4
)
Net interest and similar income
3,752.4
3,712.2
717.5
724.9
69.7
85.6
9.5
5.3
4,549.1
4,528.0
Impairment loss on loans, net of recoveries
(1,719.9
)
(1,982.0
)
—
—
(0.3
)
0.2
—
—
(1,720.2
)
(1,981.8
)
Recovery (loss) due to impairment of financial investments
(1.0
)
—
(45.9
)
(7.9
)
(0.6
)
0.3
—
—
(47.5
)
(7.5
)
Net interest and similar income after impairment loss
2,031.5
1,730.2
671.6
717.1
68.8
86.1
9.5
5.3
2,781.4
2,538.7
Fee income from financial services, net
791.8
813.3
(10.6
)
(13.4
)
171.0
146.2
190.8
232.4
1,142.9
1,178.5
Other income
513.5
494.8
121.2
122.9
85.2
(40.2
)
71.7
(19.8
)
791.6
557.8
Result from insurance activities
—
—
(169.8
)
(178.4
)
—
—
—
—
(169.8
)
(178.4
)
Total other expenses
(2,057.0
)
(1,949.9
)
(401.2
)
(374.6
)
(175.5
)
(153.6
)
(266.5
)
(272.1
)
(2,900.2
)
(2,750.2
)
Income (loss) before translation result and income tax
1,279.9
1,088.5
211.3
273.6
149.5
38.5
5.4
(54.1
)
1,646.0
1,346.5
Translation result
(7.4
)
(16.0
)
(9.4
)
18.4
(2.1
)
0.8
(5.3
)
5.2
(24.1
)
8.4
Income tax
(265.1
)
(216.4
)
—
—
(10.1
)
(3.1
)
(39.2
)
(56.1
)
(314.4
)
(275.6
)
Net profit (loss) for the year
1,007.4
856.1
201.9
292.1
137.3
36.2
(39.1
)
(105.1
)
1,307.5
1,079.3
Attributable to:
IFS’ shareholders
1,007.4
856.1
201.9
292.1
137.3
36.2
(46.4
)
(111.6
)
1,300.1
1,072.7
Non-controlling interest
—
—
—
—
—
—
7.4
6.5
7.4
6.5
The discussion below covers each of our reported segments and corresponds to information before adjustments and eliminations for consolidation, as of and for the years ended December 31, 2024 and 2023, in accordance with IFRS Accounting Standards.
Banking
Interbank’s profits were S/1,007.4 million for the year ended December 31, 2024, which represented an increase of S/151.3 million, or 17.7%, compared to the profit for the year ended December 31, 2023.
The yearly performance was mainly attributed to a decrease of S/262.1 million in impairment loss on loans, net of recoveries, and increases of S/40.2 million in net interest and similar income and of S/18.7 million in other income. These effects where partially offset by an increase of S/107.1 million in other expenses, of S/48.7 million in income tax and a decrease of S/21.5 million in fee income from financial services, net.
Interbank’s ROE was 12.2% in 2024, representing a lower profitability compared to the 11.2% reported in 2023.
Interest and Similar Income
The following table presents the components of interest and similar income for our banking segment for the years ended December 31, 2024 and 2023.
145
For the year ended December 31,
2024
2023
Change
(S/ in millions)
(S/ in millions)
%
Interest and similar income
Interest on loan portfolio
5,063.9
5,230.9
(166.9
)
(3.2
%)
Interest on financial investments
566.6
525.6
40.9
7.8
%
Interest on due from banks and inter-bank funds
339.1
319.5
19.6
6.1
%
Total
5,969.6
6,076.0
(106.4
)
(1.8
%)
Nominal average rate
8.4
%
8.9
%
—
—
Interest and similar income decreased 1.8% due to a 3.2% decrease in interest on loan portfolio, partially offset by increases of 7.8% in interest on financial investments and in interest on due from banks and inter-bank funds.
Interest on loan portfolio decreased S/166.9 million, or 3.2%, due to a decrease of 70 basis points in the average rate, partially offset by a 4.2% increase in the average volume. The decrease in the average rate on loans was explained by a reduction of 120 basis points in the retail portfolio, partially offset by an increase of 10 basis points in the commercial portfolio. The average volume of loans increased 4.2% due to a 12.4% increase in the commercial portfolio, mostly driven by the Impulso MyPeru programme, and partially offset by a 2.3% decrease in retail loans. As a result, yield on loans decreased 80 basis points, from 11.3% to 10.5%.
Interest on financial investments increased S/40.9 million, or 7.8%, due to an increase of 5.9% in the average volume, while the average yield remained stable. The higher average volume was mostly explained by a higher mark-to-market valuation.
Interest on due from banks and inter-bank funds increased by S/19.6 million, or more than 6.1%, explained by a 10.1% increase in the average volume, partially offset by a 20 basis points reduction in the average yield.
As a result of the above, the nominal average yield on interest-earning assets contracted 50 basis points, from 8.9% in 2023 to 8.4% in 2024.
Interest and Similar Expenses
The following table presents the components of interest and similar expenses for our banking segment for the years ended December 31, 2024 and 2023.
For the year ended December 31,
2024
2023
Change
(S/ in millions)
(S/ in millions)
%
Interest and Similar Expenses
Interest and fees on deposits and obligations
(1,491.0
)
(1,657.6
)
166.6
(10.0
%)
Interests on bonds, notes and other obligations
(263.2
)
(249.4
)
(13.8
)
5.5
%
Interest and fees on obligations with financial institutions and others
(462.9
)
(456.8
)
(6.1
)
1.3
%
Total
(2,217.2
)
(2,363.8
)
146.6
(6.2
%)
Nominal average rate
3.6
%
4.0
%
—
—
Interest and similar expenses decreased 6.2% mainly due to a 10.0% decrease in interest and fees on deposits and obligations, partially offset by a 5.5% increase in interest on bonds, notes and other obligations, and a 1.3% increase in interest and fees on obligations with financial institutions and others.
Interest and fees on deposits and obligations decreased S/166.6 million, or 10.0%, explained by a 60 basis point decrease in the average cost, from 3.6% in 2023 to 3.0% in 2024, as a result of a continuous trend of lower rates in the market, as well as the efficient funding policy executed by the bank. The 7.4% increase in the average volume was explained by higher retail, commercial and institutional deposits. The increase in interest and fees on obligations with financial institutions and others was explained by a 2.5% increase in the average volume, while the average cost remained stable.
146
Interest on bonds, notes and other obligations increased mainly due to an increase of 80 basis points in the average cost, partially offset by a decrease of 8.7% in the average volume.
The average cost of funding decreased 40 basis points, from 4.0% in 2023 to 3.6% in 2024, in line with the continuouos trend of lower market rates and the strategy of efficient funding.
Impairment Loss on Loans, Net of Recoveries
The following table presents the components of impairment loss on loans, net of recoveries for our banking segment for the years ended December 31, 2024 and 2023.
For the year ended December 31,
2024
2023
Change
(S/ in millions)
(S/ in millions)
%
Impairment loss on loans, net of recoveries
(1,719.9
)
(1,982.0
)
262.1
(13.2
%)
Past-due loan ratio (at period end)
2.7
%
3.5
%
—
—
Provision expense as a percentage of average total loans
3.6
%
4.3
%
—
—
Coverage ratio(1)
140.2
%
156.8
%
—
—
Impairment allowance for loans
1,730.0
2,349.3
(619.3
)
(26.4
%)
(1)
Coverage ratio is calculated by dividing allowances for loan losses as a percentage of past due loans.
Impairment loss on loans, net of recoveries decreased S/262.1 million when compared to the previous year. The decrease in provision expenses was mainly due to lower provision requirements in both retail and commercial loan books, associated with the improvement of the macroeconomic outlook in Peru, as well as the change in the loan mix.
Interbank’s coverage ratio decreased from 156.8% for the year ended December 31, 2023 compared to 140.2% for the year ended December 31, 2024, as a result of the aforementioned factors.
Fee Income from Financial Services, Net
The following table presents the components of fee income from financial services, net for our banking segment for the years ended December 31, 2024 and 2023.
147
For the year ended December 31,
2024
2023
Change
(S/ in millions)
(S/ in millions)
%
Income
Maintenance and mailing of accounts, transfer fees and commissions on credit and debit card
761.0
752.8
8.2
1.1
%
Commissions for banking services
334.0
319.3
14.7
4.6
%
Fees from indirect loans
67.1
68.4
(1.3
)
(1.9
%)
Collection services fees
56.1
60.7
(4.7
)
(7.7
%)
Others
31.5
40.8
(9.3
)
(22.9
%)
Total
1,249.6
1,242.0
7.6
0.6
%
Expenses
Credit cards
(177.5
)
(199.5
)
22.0
(11.0
%)
Debtor’s life insurance premiums
(71.2
)
(71.8
)
0.6
(0.8
%)
Fees paid to foreign banks
(25.8
)
(26.3
)
0.5
(1.9
%)
Others
(183.3
)
(131.2
)
(52.1
)
39.7
%
Total
(457.8
)
(428.7
)
(29.1
)
6.8
%
Net
791.8
813.3
(21.5
)
(2.6
%)
The S/21.5 million decrease in net fee income from financial services for the year ended December 31, 2024 as compared to the year ended December 31, 2023, was mainly due to lower commissions from saving accounts and transfers, as well as insurance income and other fees. These effects where partially offset by an increase in credit card fees.
Other Income
The following table presents the components of other income for our banking segment for the years ended December 31, 2024 and 2023.
For the year ended December 31,
2024
2023
Change
(S/ in millions)
(S/ in millions)
%
Net gain on foreign exchange transactions
433.7
306.4
127.3
41.5
%
Net gain on sale of financial investments
13.0
(0.7
)
13.7
n.m
Net gains on financial assets at fair value through profit or loss
(8.2
)
80.7
(89.0
)
(110.2
%)
Other
75.1
108.3
(33.3
)
(30.7
%)
Other income
513.5
494.8
18.7
3.8
%
n.m. means not meaningful.
Other income increased by 18.7 million for the year ended December 31, 2024 as compared to the year ended December 31, 2023, mainly due to higher net gain on foreign exchange transactions, partially offset by lower net gain on financial assets at fair value through profit or loss.
Other Expenses
The following table presents the components of other expenses for our banking segment for the years ended December 31, 2024 and 2023.
148
For the year ended December 31,
2024
2023
Change
(S/ in millions)
(S/ in millions)
%
Salaries and employee benefits
(649.4
)
(621.8
)
(27.5
)
4.4
%
Administrative expenses
(1,021.9
)
(977.7
)
(44.1
)
4.5
%
Depreciation and amortization
(294.5
)
(271.5
)
(23.0
)
8.5
%
Other
(91.3
)
(78.8
)
(12.5
)
15.8
%
Total other expenses
(2,057.0
)
(1,949.9
)
(107.1
)
5.5
%
Other expenses increased by S/107.1 million for the year ended December 31, 2024 as compared to the year ended December 31, 2023, mainly as a result of higher salaries and employee benefits, administrative expenses and depreciation and amortization.
Our efficiency ratio was 38.9% for the year ended December 31, 2024 as compared to 37.3% recorded for the year ended December 31, 2023.
Income Before Translation Result and Income Tax
Income before translation result and income tax was S/1,279.9 million for the year ended December 31, 2024, representing a growth compared to the S/1,088.5 million gain recorded for the year ended December 31, 2023, for the reasons discussed above.
Insurance
Interseguro adopted for the first time in 2023 IFRS 17 “Insurance Contracts,” effective for annual periods beginning on or after January 1, 2023. IFRS 17 replaced IFRS 4 “Insurance Contracts” for annual periods starting on or after January 1, 2023.
Interseguro’s profit attributable to shareholders for the year ended December 31, 2024 was S/201.9 million compared to a S/292.1 million profit for the year ended December 31, 2023, a S/90.2 million decrease. This was mainly due to a S/38.0 million increase in losses due to impairment of financial investments, mostly explained by the rating downgrade of a fixed income investment. In addition, yearly results were negatively impacted by a S/26.6 million increase in other expenses, as well as a S/27.8 million decrease in translation results. These factors were partially offset by a positive development of S/8.6 million in insurance results.
Net Interest and Similar Income
The following table presents the components of net interest and similar income for our insurance segment for the years ended December 31, 2024 and 2023.
For the year ended December 31,
2024
2023
Change
(S/ in millions)
(S/ in millions)
%
Interest and similar income
871.0
851.6
19.3
2.3
%
Interest and similar expense
(153.5
)
(126.7
)
(26.8
)
21.1
%
Net interest and similar income
717.5
724.9
(7.4
)
(1.0
%)
Net interest and similar income decreased 1.0%, or S/7.4 million, mainly due to a S/26.8 million, or 21.1%, decrease in interest and similar expenses and a S/19.3 million, or 2.3%, increase in interest and similar income.
Other Income, Net
The following table presents the components of other income for our insurance segment for the years ended December 31, 2024 and 2023.
149
For the year ended December 31,
2024
2023
Change
(S/ in millions)
(S/ in millions)
%
Net gain (loss) on sale of financial investments
17.7
9.9
7.7
77.6
%
Net gain (loss) on financial assets at fair value through profit or loss
(34.7
)
19.1
(53.8
)
n.m
Rental income
71.1
66.0
5.1
7.8
%
Net gain on investment property valuation
60.3
7.1
53.1
n.m
Other
10.1
20.8
(10.7
)
(51.6
%)
Other income, net
121.2
122.9
(1.7
)
(1.4
%)
n.m. means not meaningful.
Other income decreased by S/1.7 million, or 1.4%, mainly due to an extraordinary loss on financial assets at fair value partially offset by an increase in net gain on investment property valuations.
Recovery (Loss) due to Impairment of Financial Investments
Recovery (loss) due to impairment of financial investments was S/45.9 in December 31, 2024, compared to S/7.9 million in the year December 31, 2023, an increase of S/38.0 million due to a one-off event in the first quarter of the year.
Insurance Results:
The following table presents the components of the insurance results for the year ended December 31, 2024 and 2023.
For the year ended December 31,
2024
2023
Change
(S/ in millions)
(S/ in millions)
%
Insurance income
753.4
710.9
42.5
6.0
%
Insurance expenses
(923.1
)
(889.3
)
(33.8
)
3.8
%
Total insurance results
(169.8
)
(178.4
)
8.6
(4.8
%)
150
Insurance Income:
The following table presents the components of the insurance income for the year ended December 31, 2024 and 2023.
For the year ended December 31,
2024
2023
Change
(S/ in millions)
(S/ in millions)
%
Annuities
293.9
277.3
16.6
6.0
%
Individual life
106.7
92.3
14.4
15.6
%
Retail insurance
352.8
341.3
11.5
3.4
%
Total insurance income
753.4
710.9
42.5
6.0
%
Insurance income was S/753.4 million in 2024, an increase of S/42.5million, or 6.0%. The yearly performance was mainly explained by increases of S/16.6 million in annuities and S/14.4 million in individual life, which in turn are related to the higher risk adjustment and best estimate liability (BEL) release, resulting from the fulfillment of certain cash flows estimates. The S/11.5 million increase in retail insurance was mainly explained by higher short-term insurance premiums.
Insurance Expenses:
The following table presents the components of the insurance expenses for the year ended December 31, 2024 and 2023.
For the year ended December 31,
2024
2023
Change
(S/ in millions)
(S/ in millions)
%
Annuities
(845.9
)
(845.6
)
(0.3
)
0.0
%
Individual life
18.3
30.7
(12.4
)
(40.4
%)
Retail insurance
(95.5
)
(74.3
)
(21.2
)
28.5
%
Total insurance expenses
(923.1
)
(889.2
)
(33.9
)
3.8
%
Insurance expenses were S/923.1 million in 2024, an increase of S/33.9 million, or 3.8%. The yearly increase was explained by an increase of S/21.2 million in retail insurance, due to an extraordinary loss component reversal in the last quarter of 2023. Another contributing factor was the decrease in individual life. The S/12.4 million decrease in individual life was due to adjustments of technical reserves of variable fee approach (VFA) insurance contracts. Annuities showed a stable result.
Other Expenses
The following table presents the components of other expenses for our insurance segment for the year ended December 31, 2024 and 2023.
For the year ended December 31,
2024
2023
Change
(S/ in millions)
(S/ in millions)
%
Salaries and employee benefits
(121.6
)
(104.7
)
(16.9
)
16.1
%
Administrative expenses
(74.3
)
(74.5
)
0.2
(0.3
%)
Depreciation and amortization
(22.1
)
(21.7
)
(0.4
)
2.0
%
Expenses related to rental income
(12.6
)
(6.1
)
(6.5
)
106.7
%
Other
(170.6
)
(167.6
)
(3.0
)
1.8
%
Total other expenses
(401.2
)
(374.6
)
(26.6
)
7.1
%
151
Other expenses increased by S/26.6 million for the year ended December 31, 2024, when compared to the year ended December 31, 2023, mainly due to increases of S/16.9 million in salaries and employee benefits, S/6.5 million in expenses related to rental income, S/3.0 million in other items and S/0.4 million in depreciation and amortization.
Wealth Management
Inteligo’s profits were S/137.3 million in 2024, representing an increase of S/101.1 million compared to 2023. This was mainly attributable to the recovery of the investment portfolio, from reported losses of S/40.2 million in 2023 to a profit of S/85.2 million in 2024, due to a mark-to-market profit on proprietary portfolio investments. Partially offsetting the annual improvement in other income, the company registered a 18.5% decrease in net interest and similar income, mainly as a result of higher interest expenses, and a 14.3% increase in other expenses.
From a business development perspective, Inteligo’s prospection process continued to show positive results in terms of new account openings and assets under management growth in private wealth management and mutual funds. Consequently, Inteligo’s AUM grew 18.5% on a yearly basis.
As a result, Inteligo’s ROE was 14.1% for the year ended December 31, 2024, an increase compared to the 9.9% reported for the year ended December 31, 2023.
Interest and Similar Income
The following table presents the components of interest and similar income for our wealth management segment for the years ended December 31, 2024 and 2023.
For the year ended December 31,
2024
2023
Change
(S/ in millions)
(S/ in millions)
%
Interest and similar income
Interest on loan portfolios
94.4
94.0
0.4
0.4
%
Interest on financial investments
57.6
51.6
6.0
11.6
%
Interest due from banks and inter-bank funds
26.2
38.3
(12.2
)
(31.7
%)
Total
178.2
183.9
(5.8
)
(3.1
%)
Nominal average rate
4.3
%
4.1
%
—
—
Interest and similar income decreased 3.1% mainly due to a S/12.2 million decrease in interest due from banks and inter-bank funds, partially offset by a S/6.0 million increase in interest on financial investments and a S/0.4 million increase in interest on loan portfolios. The decrease in interest due from bank and inter-bank funds was mainly due to lower market rates, which in turn impacted interest income from our deposits in other banks. The increase in interest on financial investment was mainly due to the increase in carry positions in the portfolio and the increase in interest on loan portfolios was mainly due to increases in balances of 6.8%.
Interest and Similar Expenses
The following table presents the components of interest and similar expenses for our wealth management segment for the years ended December 31, 2024 and 2023.
152
For the year ended December 31,
2024
2023
Change
(S/ in millions)
(S/ in millions)
%
Interest and similar expenses
Interest and fees on deposits and obligations
(101.1
)
(93.6
)
(7.5
)
8.1
%
Interests on bonds, notes and other obligations
(2.5
)
(0.7
)
(1.8
)
275.3
%
Interest and fees on obligations with financial institutions and others
(4.8
)
(4.1
)
(0.7
)
17.6
%
Total
(108.5
)
(98.4
)
(10.1
)
10.3
%
Nominal average rate
3.3
%
2.7
%
—
—
Interest and similar expenses increased S/10.1 million mainly due to a S/7.5 million increase in interest and fees on deposits and obligations, a S/1.8 million increase in interest on bonds, notes and other obligations and a S/0.7 million increase in interest and fees on obligations with financial institutions and others.
The increase in interest and fees on deposits and obligations is explained by interest expenses that belonged to deposits established in previous years, in which interest rates where at a higher level. The increase in interest on bonds, notes and other obligations and the increase and fees on obligations with financial institutions and others was mainly due to the change in the composition of the investment portfolio.
Impairment Loss on Loans, Net of Recoveries
Inteligo’s loan portfolio had no delinquencies for the years ended December 31, 2024 and 2023. Inteligo’s impairment gain on loans was S/0.3 million for the year ended December 31, 2024.
Recovery (Loss) due to Impairment of Financial Investments
For the year ended December 31, 2024, Inteligo’s impairment loss on financial investments was S/0.6 million, as compared to a S/0.3 million loss for the year ended December 31, 2023.
Fee Income from Financial Services, Net
The following table presents the components of fee income from financial services, net for our wealth management segment for the years ended December 31, 2024 and 2023.
For the year ended December 31,
2024
2023
Change
(S/ in millions)
(S/ in millions)
%
Income
Maintenance and mailing of accounts, transfer fees and commissions on credit and debit card
2.6
2.6
0.0
1.2
%
Funds management fees
159.0
137.3
21.8
15.8
%
Brokerage and custody services fees
10.2
6.8
3.4
51.1
%
Others
0.7
1.1
(0.4
)
(36.3
%)
Total
172.5
147.7
24.8
16.8
%
Expenses
Brokerage and custody services
(0.8
)
(0.7
)
(0.1
)
15.6
%
Others
(0.8
)
(0.8
)
0.0
(0.6
%)
Total
(1.5
)
(1.4
)
(0.1
)
6.9
%
Net
171.0
146.2
24.7
16.9
%
153
Fee income from financial services, net for the year ended December 31, 2024 was S/171.0 million, a S/24.7 million, or 16.9%, increase compared to the year ended December 31, 2023. This increase was mainly attributable to a S/21.8 million increase in funds management fees, which in turn reflects the 16.9% growth in total assets under management.
Other Income, net
The following table presents the components of other income for our wealth management segment for the years ended December 31, 2024 and 2023.
For the year ended December 31,
2024
2023
Change
(S/ in millions)
(S/ in millions)
%
Net gain (loss) on sale of financial investments
(4.1
)
(2.9
)
(1.3
)
44.1
%
Net gain (loss) on financial assets at fair value through profit or loss
91.0
(33.9
)
124.8
(368.7
%)
Other
(1.6
)
(3.5
)
1.8
(53.0
%)
Other Income
85.2
(40.2
)
125.4
(312.0
%)
Other income, net showed an increase, from negative S/40.2 million for the year ended December 31, 2023 to S/85.2 million for the year ended December 31, 2024, which represents an increase of S/125.4 million. This effect was mostly explained by an increase in the mark-to-market valuation of investments through the year.
Other Expenses
The following table presents the components of other expenses for our wealth management segment for the years ended December 31, 2024 and 2023.
For the year ended December 31,
2024
2023
Change
(S/ in millions)
(S/ in millions)
%
Salaries and employee benefits
(96.4
)
(89.5
)
(6.9
)
7.8
%
Administrative expenses
(49.6
)
(46.7
)
(3.0
)
6.4
%
Depreciation and amortization
(8.7
)
(15.0
)
6.3
(41.8
%)
Other
(20.7
)
(2.4
)
(18.3
)
n.m
Total Other Expenses
(175.5
)
(153.6
)
(21.9
)
14.3
%
n.m. means not meaningful.
Total other expenses increased by S/21.9 million, or 14.3%, for the year ended December 31, 2024 mainly due to extraordinary items, as well as increases in salaries and employee benefits and administrative expenses, and partially offset by a decrease in depreciation and amortization.
Inteligo’s efficiency ratio is calculated by dividing salaries and employee benefits plus administrative expenses plus depreciation and amortization by net interest and similar income plus net fee income from financial services plus other income. Our wealth management segment’s efficiency ratio showed a result of 47.5% for the year ended December 31, 2024 compared to 78.9% for the year ended December 31, 2023, mainly due to an increase in revenues, mostly driven by the other income increase.
154
Financial Condition as of December 31, 2023 Compared to December 31, 2022
The following table sets forth the principal components of our consolidated statement of financial position as of December 31, 2023 and December 31, 2022.
As of December 31, 2023
As of December 31, 2022
Change
(S/ in millions)
(S/ in millions)
%
Assets
Cash, due from banks and inter-bank funds
10,343.6
13,489.5
(3,145.9
)
(23.3
%)
Financial investments
26,722.0
22,787.6
3,934.4
17.3
%
Loans, net of unearned interest
48,869.8
47,530.9
1,339.0
2.8
%
Impairment allowance for loans
(2,349.4
)
(2,027.9
)
(321.6
)
15.9
%
Investment property
1,298.9
1,287.7
11.2
0.9
%
Property, furniture and equipment, net
804.8
791.4
13.4
1.7
%
Intangibles and goodwill, net
1,687.1
1,633.2
53.9
3.3
%
Reinsurance contract assets
26.3
34.1
(7.8
)
(22.8
%)
Other assets
2,221.6
1,955.6
266.1
13.6
%
Total assets
89,624.8
87,482.1
2,142.7
2.4
%
Liabilities and equity
Deposits and obligations
49,188.2
48,530.7
657.5
1.4
%
Due to banks and correspondents and inter-bank funds
9,145.6
7,130.7
2,015.0
28.3
%
Bonds, notes and other obligations
5,551.6
7,906.3
(2,354.7
)
(29.8
%)
Insurance and reinsurance contract liabilities
12,207.5
11,231.3
976.2
8.7
%
Other liabilities
3,523.6
3,256.9
266.8
8.2
%
Total liabilities
79,616.7
78,055.9
1,560.8
2.0
%
Equity, net
Equity attributable to IFS’s shareholders
9,950.2
9,372.5
577.8
6.2
%
Non-controlling interest
57.9
53.8
4.1
7.7
%
Total equity, net
10,008.1
9,426.3
581.9
6.2
%
Total liabilities and equity net
89,624.8
87,482.1
2,142.7
2.4
%
Our assets were S/89,624.8 million as of December 31, 2023, a 2.4% increase from S/87,482.1 million as of December 31, 2022. This was mainly driven by an increase of 17.3% in financial investments, 2.8% in loans, net of unearned interest and 13.6% in other assets. These factors were partially offset by a decrease of 23.3% in cash, due from banks and an increase of 15.9% in impairment allowance for loans.
The increase in financial investments resulted mainly from higher Central Reserve Bank of Peru Certificates of Deposits (“CDBCR”) and sovereign Bonds. The increase in loans, net of unearned interest was mainly the result of higher retail loans balances at Interbank, which was primarily due to increases in consumer loans and mortgages. This increase was partially offset by lower commercial loan balances due to decreases in short and medium-term lending. The decrease in cash, due from bank and inter-banks funds was mainly due to lower deposits at the Central Reserve Bank of Peru. And finally, the increase in impairment allowance for loans occurred mainly at Interbank.
Our liabilities reached S/79,616.7 million as of December 31, 2023, a 2.0% increase from S/78,055.9 million as of December 31, 2022. This was mainly driven by a 28.3% increase in due to banks and correspondents, 8.7% in insurance contract liabilities, and of 8.2% in other liabilities, partially offset by a decrease of 29.8% in bonds, notes and other obligations.
Our net equity was S/10,008.1 million as of December 31, 2023, a 6.2% increase from S/9,426.3 million as of December 31, 2022, mainly as a result of higher retained earnings.
For more information of our liquidity, capital resources and commitments and obligations, see “Item 5. Operating and Financial Review and Prospects—Liquidity and Capital Resources.”
155
Results of Operations for the Year Ended December 31, 2023 Compared to the Year Ended December 31, 2022
The following table sets forth the principal components of our consolidated profit for the years ended December 31, 2023 and 2022.
For the year ended December 31,
2023
2022
Change
(S/ in millions)
(S/ in millions)
%
Interest and similar income
7,120.4
5,871.3
1,249.1
21.3
%
Interest and similar expenses
(2,592.4
)
(1,661.7
)
(930.7
)
56.0
%
Net interest and similar income
4,528.0
4,209.2
318.4
7.6
%
Impairment loss on loans, net of recoveries
(1,981.8
)
(830.6
)
(1,151.3
)
138.6
%
Loss due to impairment of financial investments
(7.5
)
(12.8
)
5.3
(41.2
%)
Net interest and similar income after impairment loss
2,538.7
3,366.3
(827.6
)
(24.6
%)
Fee income from financial services, net
1,178.5
1,137.4
41.1
3.6
%
Other income
557.8
542.4
15.4
2.8
%
Result from insurance activities
(178.4
)
(252.9
)
74.5
(29.5
%)
Total other expenses
(2,750.2
)
(2,627.1
)
(123.0
)
4.7
%
Income before translation result and income tax
1,346.5
2,166.2
(819.7
)
(37.8
%)
Translation result
8.4
(25.5
)
33.9
(133.1
%)
Income Tax
(275.6
)
(462.5
)
186.9
(40.4
%)
Net profit for the year
1,079.3
1,678.2
(598.9
)
(35.7
%)
Attributable profit to:
IFS’ shareholders
1,072.8
1,668.1
(595.3
)
(35.7
%)
Non-controlling interest
6.5
10.1
(3.6
)
(35.3
%)
Our net profit was S/1,079.3 million for the year ended December 31, 2023, a 35.7% decrease as compared to 2022. The deterioration in net profit was mainly a result of increases of more than two-fold in impairment loss on loans and 4.7% in other expenses. These factors were partially offset by increases of 7.6% in net interest and similar income, 3.6% in net fee income from financial services, 2.8% in other income, in addition to an improvement in insurance and translation results.
Impairment loss on loans, net of recoveries increased from S/830.6 million as of December 31, 2022 to S/1,981.8 million as of December 31, 2023 mainly due to the deterioration of the macroeconomic outlook in Peru, social and climatic events that took place at the beginning of the year and provisions as a result of the impact to the retail and commercial portfolio caused by the “El Niño” phenomenon.
The increase in other expenses was mostly attributed to higher expenses across all our business, and the increase in administrative expenses was mainly related to marketing and credit card expenses, and IT services at Interbank.
The increase in net interest and similar was mainly due to an increase of 12.6% in our banking segment, partially offset by decreases of 10.6% and 18.4% million in our insurance and wealth management segments, respectively.
The increase in net fee income from financial services was mainly due to higher commissions across most products and services in our banking segment and higher fees from payments acquirer, where the number of merchants grew 25.0%. However, lower fees from funds management in our wealth management segment partially compensated the positive performance.
Our ROE was 11.3% in 2023, lower than the 19.1% reported in 2022, mainly due to increases in impairment loss on loans, net of recoveries and other expenses, which were partially compensated by increases in net interest and similar income, fee income from financial services, net, and other income.
156
Results of Operations by Segment
The following table presents an overview of certain consolidated income statement data for each of our segments for the years ended December 31, 2023 and 2022.
Banking
Insurance
Wealth Management
Holding, other subsidiaries and eliminations
Consolidated
2023
2022
2023
2022
2023
2022
2023
2022
2023
2022
Interest and similar income
6,076.0
4,774.4
851.6
940.9
183.9
155.1
8.8
0.9
7,120.4
5,871.3
Interest and similar expenses
(2,363.8
)
(1,476.9
)
(126.7
)
(130.0
)
(98.4
)
(50.3
)
(3.5
)
(4.4
)
(2,592.4
)
(1,661.7
)
Net interest and similar income
3,712.2
3,297.4
724.9
810.8
85.6
104.8
5.3
(3.5
)
4,528.0
4,209.6
Impairment loss on loans, net of recoveries
(1,982.0
)
(832.9
)
—
—
0.2
2.4
—
—
(1,981.8
)
(830.6
)
Recovery (loss) due to impairment of financial investments
—
(0.7
)
(7.9
)
—
0.3
(12.0
)
—
—
(7.5
)
(12.8
)
Net interest and similar income after impairment loss
1,730.2
2,463.8
717.1
810.8
86.1
95.2
5.3
(3.5
)
2,538.7
3,366.3
Fee income from financial services, net
813.3
797.7
(13.4
)
(7.2
)
146.2
163.3
232.4
183.5
1,178.5
1,137.4
Other income
494.8
475.4
122.9
45.9
(40.2
)
(244.5
)
(19.8
)
265.6
557.8
542.4
Result from insurance activities
—
—
(178.4
)
(252.9
)
—
—
—
—
(178.4
)
(252.9
)
Total other expenses
(1,949.9
)
(1,930.8
)
(374.6
)
(342.2
)
(153.6
)
(145.5
)
(272.1
)
(208.6
)
(2,750.2
)
(2,627.1
)
Income (loss) before translation result and income tax
1,088.5
1,806.1
273.6
254.5
38.5
(131.5
)
(54.1
)
237.0
1,346.5
2,166.2
Translation result
(16.0
)
(22.8
)
18.4
1.0
0.8
(7.1
)
5.2
3.5
8.4
(25.5
)
Income tax
(216.4
)
(409.2
)
—
—
(3.1
)
(2.8
)
(56.1
)
(50.5
)
(275.6
)
(462.5
)
Net profit (loss) for the year
856.1
1,374.1
292.1
255.5
36.2
(141.4
)
(105.1
)
190.0
1,079.3
1,678.1
Attributable to:
IFS’ shareholders
856.1
1,374.1
292.1
255.5
36.2
(141.4
)
(111.6
)
179.8
1,072.7
1,668.0
Non-controlling interest
—
—
—
—
—
—
6.5
10.1
6.5
10.1
The discussion below covers each of our reported segments and corresponds to information before adjustments and eliminations for consolidation, as of and for the years ended December 31, 2023 and 2022, in accordance with IFRS Accounting Standards.
Banking
Interbank’s net results were profit of S/856.1 million for the year ended December 31, 2023, compared to net profit of S/1,374.1 million for the year ended December 31, 2022. The main factors that contributed to this result were increases of more than two fold in impairment loss on loans, net of recoveries, and of 1.0% in other expenses.These factors were partially offset by increases of 12.6% in net interest and similar income, 4.1% in other income, and 2.0% in net fee income from financial services.
Interbank’s ROE was 11.2% for the year ended December 31, 2023, representing lower profitability compared to the 19.8% recorded for the year ended December 31, 2022.
157
Interest and Similar Income
The following table presents the components of interest and similar income for our banking segment for the years ended December 31, 2023 and 2022.
For the year ended December 31,
2023
2022
Change
(S/ in millions)
(S/ in millions)
%
Interest and similar income
Interest on loan portfolio
5,230.9
4,171.6
1,059.3
25.4
%
Interest on financial investments
525.6
447.5
78.1
17.5
%
Interest on due from banks and inter-bank funds
319.5
155.3
164.2
105.7
%
Total
6,076.0
4,774.4
1,301.6
27.3
%
Nominal average rate
8.9
%
7.2
%
—
—
Interest and similar income increased 27.3% due to a 25.4% increase in interest on loan portfolio, a 17.5% increase in interest on financial investment and a 105.7% increase in interest on due from banks and inter-bank funds.
Interest on loan portfolio grew S/1,059.3 million, or 25.4%, due to increases of 180 basis points in the nominal average rate and 5.7% in the average volume. The higher average rate on loans, from 9.4% in 2022 to 11.2% in 2023, was due to yield increases in the commercial and consumer portfolios, and mortgages to a lesser extent. The higher average volume of loans was attributed to growth of 13.4% in retail loans, partially offset by a 3.9% decrease in commercial loans. In the retail portfolio, the higher average volume was mainly due to increases of 17.3% in consumer loans and 7.2% in mortgages. The reduction in commercial loans was attributed to decreases of 7.3% in working capital loans and 4.8% in trade finance loans, partially offset by growth of 16.4% in leasing operations.
Interest on financial investments increased S/78.1 million, or 17.5%, due to growth of 60 basis points in the average yield and 4.6% in the average volume. The higher average yield, from 4.2% in 2022 to 4.8% in 2023, was due to higher returns on CDBCR and corporate bonds, partially offset by lower returns on sovereign bonds. The higher average volume was a result of increases in balances of CDBCR and sovereign bonds, partially compensated by lower positions in global and corporate bonds.
Interest on due from banks and inter-bank funds increased by S/164.2 million, or more than two-fold, explained by a 190 basis point increase in the nominal average rate, from 1.3% in 2022 to 3.2% in 2023, partially offset by a 14.2% decrease in the average volume.
As a result of the above, the nominal average yield on interest-earning assets expanded 170 basis points, from 7.2% for in 2022 to 8.9% in 2023.
Interest and Similar Expenses
The following table presents the components of interest and similar expenses for our banking segment for the years ended December 31, 2023 and 2022.
For the year ended December 31,
2023
2022
Change
(S/ in millions)
(S/ in millions)
%
Interest and Similar Expenses
Interest and fees on deposits and obligations
(1,657.6
)
(901.2
)
(756.4
)
83.9
%
Interests on bonds, notes and other obligations
(249.4
)
(358.3
)
108.9
(30.4
%)
Interest and fees on obligations with financial institutions and others
(456.8
)
(217.4
)
(239.4
)
110.1
%
Total
(2,363.8
)
(1,476.9
)
(886.9
)
60.0
%
Nominal average rate
4.0
%
2.5
%
—
—
158
Interest and similar expense increased 60.0% mainly due to an 83.9% increase in interest on deposits and obligations, and a 110.1% increase in interest on obligations with financial institutions and others, partially offset by a 30.4% decrease in interest on bonds, notes and other obligations.
Interest and fees on deposits and obligations increased S/756.4 million, or 83.9%, explained by a 160 basis point increase in the average cost, from 2.0% in 2022 to 3.6% in 2023, as a result of higher rates paid to institutional, commercial and retail deposits, associated with higher reference rates globally. The 3.0% increase in the average volume was explained by higher balances of institutional and retail deposits, partially compensated by lower balances of commercial deposits.
Interest and fees on obligations with financial institutions and others increased 110.1% for the year ended December 31, 2022 compared to December 31, 2023, as a result of a 250 basis point increase in the average cost, from 2.9% in 2022 to 5.4% in 2023, as well as an 11.8% increase in the average volume. The higher average cost was due to higher rates in funding provided by correspondent banks abroad and by the Central Reserve Bank of Peru, partially compensated by lower rates in inter-bank funds. The higher average volume was related to higher balances in funding from correspondent banks abroad, COFIDE and inter-bank funds, partially offset by lower funding provided by the Central Reserve Bank of Peru.
Interest on bonds, notes and other obligations decreased mainly due a 27.5% reduction in the average volume, attributable to the maturity and repayment of a senior international bond, as well as local subordinated bonds throughout the year.
The average cost of funding increased 150 basis points, from 2.5% in 2022 to 4.0% in 2023, in line with the higher average cost of deposits and on due to banks and correspondents.
Impairment Loss on Loans, Net of Recoveries
The following table presents the components of impairment loss on loans, net of recoveries for our banking segment for the years ended December 31, 2023 and 2022.
For the year ended December 31,
2023
2022
Change
(S/ in millions)
(S/ in millions)
%
Impairment loss on loans, net of recoveries
(1,982.0
)
(832.9
)
(1,149.1
)
138.0
%
Past-due loan ratio (at period end)
3.5
%
3.0
%
—
—
Provision expense as a percentage of average total loans
4.3
%
1.9
%
—
—
Coverage ratio(1)
156.8
%
173.5
%
—
—
Impairment allowance for loans
2,349.3
2,027.5
321.8
15.9
%
(1)
Coverage ratio is calculated by dividing allowances for loan losses as a percentage of past due loans.
Impairment loss on loans, net of recoveries increased S/1,149.1 million, or more than two-fold when compared to the previous year. The increase in provision expenses was mainly due to the deterioration of the macroeconomic outlook in Peru, social and climatic events that took place at the beginning of the year and provisions as a result of the impact to the retail and commercial portfolio caused by the “El Niño” phenomenon.
Interbank’s coverage ratio decreased from 173.5% for the year ended December 31, 2022 compared to 156.8% for the year ended December 31, 2023, as a result of the aforementioned factors.
159
Fee Income from Financial Services, Net
The following table presents the components of fee income from financial services, net for our banking segment for the years ended December 31, 2023 and 2022.
For the year ended December 31,
2023
2022
Change
(S/ in millions)
(S/ in millions)
%
Income
Maintenance and mailing of accounts, transfer fees and commissions on credit and debit card
752.8
707.3
45.5
6.4
%
Commissions for banking services
319.3
322.8
(3.5
)
(1.1
%)
Fees from indirect loans
68.4
70.0
(1.7
)
(2.4
%)
Collection services fees
60.7
61.0
(0.3
)
(0.5
%)
Others
40.8
48.3
(7.5
)
(15.5
%)
Total
1,242.0
1,209.4
32.6
2.7
%
Expenses
Credit cards
(199.5
)
(164.7
)
(34.7
)
21.1
%
Debtor’s life insurance premiums
(71.8
)
(97.4
)
25.6
(26.3
%)
Fees paid to foreign banks
(26.3
)
(24.9
)
(1.4
)
5.5
%
Others
(131.2
)
(124.7
)
(6.5
)
5.2
%
Total
(428.7
)
(411.7
)
(17.0
)
4.1
%
Net
813.3
797.7
15.6
2.0
%
The S/15.6 million, or 2.0%, increase in net fee income from financial services for the year ended December 31, 2023 as compared to the year ended December 31, 2022, was mainly due to higher commissions across most products and services.
Other Income
The following table presents the components of other income for our banking segment for the years ended December 31, 2023 and 2022.
For the year ended December 31,
2023
2022
Change
(S/ in millions)
(S/ in millions)
%
Net gain on foreign exchange transactions
306.4
380.2
(73.7
)
(19.4
%)
Net gain on sale of financial investments
(0.7
)
(12.3
)
11.6
(94.6
%)
Net gains on financial assets at fair value through profit or loss
80.7
(5.9
)
86.6
n.m.
Other
108.3
113.5
(5.2
)
(4.6
%)
Other income
494.8
475.4
19.3
4.1
%
n.m. means not meaningful.
Other income increased by 4.1% for the year ended December 31, 2023 as compared to the year ended December 31, 2022, mainly due to an increase in net gain on financial assets at fair value through profit or loss.
160
Other Expenses
The following table presents the components of other expenses for our banking segment for the years ended December 31, 2023 and 2022.
For the year ended December 31,
2023
2022
Change
(S/ in millions)
(S/ in millions)
%
Salaries and employee benefits
(621.8
)
(656.6
)
34.8
(5.3
%)
Administrative expenses
(977.7
)
(931.0
)
(46.8
)
5.0
%
Depreciation and amortization
(271.5
)
(257.2
)
(14.3
)
5.6
%
Other
(78.8
)
(86.0
)
7.2
(8.4
%)
Total other expenses
(1,949.9
)
(1,930.8
)
(19.1
)
1.0
%
Other expenses increased by 1.0% for the year ended December 31, 2023 as compared to the year ended December 31, 2022, mainly as a result of higher expenses in technology, as well as marketing expenses related to credit cards.
Our efficiency ratio was 37.3% for the year ended December 31, 2023 as compared to 40.4% recorded for the year ended December 31, 2022.
Income Before Translation Result and Income Tax
Income before translation result and income tax was S/1,088.5 million for the year ended December 31, 2023, representing a decline compared to the S/1,806.1 million gain recorded for the year ended December 31, 2022, for the reasons discussed above.
Insurance
Interseguro adopted for the first time IFRS 17 “Insurance Contracts,” effective for annual periods beginning on or after January 1, 2023. IFRS 17 replaced IFRS 4 “Insurance Contracts” for annual periods starting on or after January 1, 2023. We have applied IFRS 17 retrospectively and restated comparative information for 2022.
Interseguro’s profit attributable to shareholders for the year ended December 31, 2023 was S/292.1 million compared to a S/255.5 million profit for the year ended December 31, 2022 a S/77.0 million increase in other income, mostly explained by gains on financial assets at fair value, in addition to a S/74.5 million improvement in insurance results. These factors were partially offset by a decrease of S/85.5 million in net interest and similar income, as well as an increase of S/32.4 million in other expenses.
Net Interest and Similar Income
The following table presents the components of net interest and similar income for our insurance segment for the years ended December 31, 2023 and 2022.
For the year ended December 31,
2023
2022
Change
(S/ in millions)
(S/ in millions)
%
Interest and similar income
851.6
940.9
(89.2
)
(9.5
%)
Interest and similar expense
(126.7
)
(130.0
)
3.3
(2.6
%)
Net interest and similar income
724.9
810.8
(85.9
)
(10.6
%)
Net interest and similar income decreased 10.6%, or S/85.9 million, mainly due to a S/89.2 million decrease in interest and similar income, partially offset by a S/3.3 million decrease in interest and similar expense.
161
Other Income, Net
The following table presents the components of other income for our insurance segment for the years ended December 31, 2023 and 2022.
For the year ended December 31,
2023
2022
Change
(S/ in millions)
(S/ in millions)
%
Net gain (loss) on sale of financial investments
9.9
(1.6
)
11.6
n.m.
Net gain (loss) on financial assets at fair value through profit or loss
19.1
(87.1
)
106.2
n.m.
Rental income
66.0
65.5
0.4
0.7
%
Net gain on investment property valuation
7.1
19.1
(12.0
)
(62.9
%)
Other
20.8
49.9
(29.1
)
(58.3
%)
Other income, net
122.9
45.9
77.0
n.m.
n.m. means not meaningful.
Other income increased by S/77.0 million, mainly due to S/106.2 million increase in net gain on financial assets at fair value through profit or loss and S/11.6 million increase in net gain on sale of financial investments. These factors were partially offset by S/29.1 million reduction in other income and S/12.0 decrease in net gain on investment property valuation.
Recovery (Loss) due to Impairment of Financial Investments
Recovery (loss) due to impairment of financial investments was negligible for the year ended December 31, 2022, compared to S/7.9 million in the year December 31, 2023.
Insurance Results
The following table presents the components of the insurance results for the year ended December 31, 2023 and 2022.
For the year ended December 31,
2023
2022
Change
(S/ in millions)
(S/ in millions)
%
Insurance income
710.9
673.8
37.1
5.5
%
Insurance expenses
(889.3
)
(926.7
)
37.4
(4.0
%)
Total insurance results
(178.4
)
(252.9
)
74.5
(29.5
%)
Insurance Income
The following table presents the components of the insurance income for the year ended December 31, 2023 and 2022.
For the year ended December 31,
2023
2022
Change
(S/ in millions)
(S/ in millions)
%
Annuities
277.3
267.6
9.7
3.6
%
Individual life
92.3
76.2
16.1
21.2
%
Retail insurance
341.3
330.1
11.2
3.4
%
Total insurance income
710.9
673.8
37.1
5.5
%
162
Insurance income was S/710.9 million in 2023, an increase of S/37.1 million, or 5.5%. The yearly performance was mainly explained by growth of S/16.1 million in individual life, S/11.2 million in retail insurance and S/9.7 million in annuities.
Insurance Expenses
The following table presents the components of the insurance expenses for the year ended December 31, 2023 and 2022.
For the year ended December 31,
2023
2022
Change
(S/ in millions)
(S/ in millions)
%
Annuities
(845.6
)
(944.1
)
98.6
(10.4
%)
Individual life
30.7
74.5
(43.9
)
(58.8
%)
Retail insurance
(74.3
)
(57.1
)
(17.3
)
(30.2
%)
Total insurance expenses
(889.2
)
(926.7
)
37.4
(4.0
%)
Insurance expenses were S/889.2 million in 2023, a decrease of S/37.4 million, or 4.0%. The yearly decrease was explained by decreases in expenses of S/98.6 million in annuities, partially offset by increases of S/43.9 million in individual life and S/17.3 million in retail insurance.
Other Expenses
The following table presents the components of other expenses for our insurance segment for the year ended December 31, 2023 and 2022.
For the year ended December 31,
2023
2022
Change
(S/ in millions)
(S/ in millions)
%
Salaries and employee benefits
(104.7
)
(71.5
)
(33.2
)
46.5
%
Administrative expenses
(74.5
)
(61.0
)
(13.5
)
22.2
%
Depreciation and amortization
(21.7
)
(23.7
)
2.0
(8.5
%)
Expenses related to rental income
(6.1
)
(7.8
)
1.7
(22.3
%)
Other
(167.6
)
(178.2
)
10.6
(6.0
%)
Total other expenses
(374.6
)
(342.2
)
(32.4
)
9.5
%
Other expenses increase by S/32.4 million for the year ended December 31, 2023, when compared to the year ended December 31, 2022, mainly due to higher salaries and employee’s benefits, as well as increased administrative expenses. These factors were partially offset by a decrease in other expenses.
Wealth Management
Inteligo’s profit was S/36.2 million in 2023, a positive performance compared to the loss of S/141.4 million reported in 2022. This was mainly attributable to investment portfolio recovery, from reported losses of S/244.5 million in 2022 to S/40.2 million in 2023, due to a lower loss on proprietary portfolio investments held at fair value through profit and loss.
Inteligo’s ROE was 4.0% for the year ended December 31, 2023, a positive result compared to 2022. This was mainly attributable to the recovery of the proprietary portfolio, partially offset by a 18.4% decrease in net interest and similar income, mainly as a result of higher interest expenses, and a 10.5% contraction in net fee income from financial services, due to lower fees from funds management.
163
Interest and Similar Income
The following table presents the components of interest and similar income for our wealth management segment for the years ended December 31, 2023 and 2022.
For the year ended December 31,
2023
2022
Change
(S/ in millions)
(S/ in millions)
%
Interest and similar income
Interest on loan portfolios
94.0
77.4
16.7
21.5
%
Interest on financial investments
51.6
61.8
(10.2
)
(16.6
%)
Interest due from banks and inter-bank funds
38.3
15.9
22.4
140.7
%
Total
183.9
155.1
28.8
18.6
%
Nominal average rate
4.1
%
3.0
%
—
—
Interest and similar income increased 18.6% mainly due to increases of 140.7% and 21.5% in interest due from banks and inter-bank funds and interest on loan portfolios, partially offset by a decrease in interest on financial investments of 16.6%.
Interest on loan portfolios increased by S/16.7 million, mainly due to increase in the average rate despite a decrease in average loans outstanding. Interest on financial investments decreased by S/10.2 million, mainly due to lower dividends received from equity investments during 2022. Interest due from banks and inter-bank funds increased S/22.4 million, mainly attributable to an increase in the average rate of term deposits.
Interest and Similar Expenses
The following table presents the components of interest and similar expenses for our wealth management segment for the years ended December 31, 2023 and 2022.
For the year ended December 31,
2023
2022
Change
(S/ in millions)
(S/ in millions)
%
Interest and similar expenses
Interest and fees on deposits and obligations
(93.6
)
(43.9
)
(49.7
)
113.3
%
Interests on bonds, notes and other obligations
(0.7
)
(3.1
)
2.4
(78.3
%)
Interest and fees on obligations with financial institutions and others
(4.1
)
(3.4
)
(0.7
)
22.1
%
Total
(98.4
)
(50.3
)
(48.1
)
95.5
%
Nominal average rate
2.7
%
1.2
%
—
—
Interest and similar expenses decreased S/48.1 million mainly due to decreases of 113.3% in interest and similar expenses and 22.1% in interest and fees on obligations with financial institutions and others.
Interest and similar expenses increased S/49.7 million due to as a result of a higher interest expense on deposits, which was attributed to the increases in the reference interest rate of the US Federal Reserve. Interest on bonds, notes and other obligations decreased S/2.4 million primarily as a result of one-time expenses in 2022. Interest and fees on obligations with financial institutions and others increased S/0.7 million due to an increase in a line of loans in the second half of 2023.
Impairment Loss on Loans, Net of Recoveries
Inteligo’s loan portfolio had no delinquencies for the years ended December 31, 2023 and 2022. Inteligo’s impairment gain on loans was S/0.2 million for the year ended December 31, 2023.
164
Recovery (Loss) due to Impairment of Financial Investments
For the year ended December 31, 2023, Inteligo’s impairment loss on financial investments was S/0.3 million, as compared to a S/12.0 million loss for the year ended December 31, 2022.
Fee Income from Financial Services, Net
The following table presents the components of fee income from financial services, net for our wealth management segment for the years ended December 31, 2023 and 2022.
For the year ended December 31,
2023
2022
Change
(S/ in millions)
(S/ in millions)
%
Income
Maintenance and mailing of accounts, transfer fees and commissions on credit and debit card
2.6
2.9
(0.4
)
(12.9
%)
Funds management fees
137.3
154.1
(16.9
)
(10.9
%)
Brokerage and custody services fees
6.8
6.8
(0.1
)
(1.1
%)
Others
1.1
1.2
(0.1
)
(6.5
%)
Total
147.7
165.1
(17.4
)
(10.5
%)
Expenses
Brokerage and custody services
(0.7
)
(0.8
)
0.2
(18.5
%)
Others
(0.8
)
(0.9
)
0.1
(16.0
%)
Total
(1.4
)
(1.7
)
0.3
(17.2
%)
Net
146.2
163.3
(17.1
)
(10.5
%)
Fee income from financial services, net for the year ended December 31, 2023 was S/146.2 million, a S/17.1 million, or 10.5%, decrease compared to the year ended December 31, 2022. This decrease was mainly attributable to lower fund management fees and lower brokerage fees due to decreased trading volumes.
Other Income, net
The following table presents the components of other income for our wealth management segment for the years ended December 31, 2023 and 2022.
For the year ended December 31,
2023
2022
Change
(S/ in millions)
(S/ in millions)
%
Net gain (loss) on sale of financial investments
(2.9
)
(41.7
)
38.8
(93.1
%)
Net gain (loss) on financial assets at fair value through profit or loss
(33.9
)
(201.1
)
167.2
(83.2
%)
Other
(3.5
)
(1.6
)
(1.8
)
n.m.
Other Income
(40.2
)
(244.5
)
204.2
(83.6
%)
n.m. means not meaningful.
Other income, net increased to negative S/40.2 million for the year ended December 31, 2023, mainly attributable to positive mark-to-market valuations on investments.
165
Other Expenses
The following table presents the components of other expenses for our wealth management segment for the years ended December 31, 2023 and 2022.
For the year ended December 31,
2023
2022
Change
(S/ in millions)
(S/ in millions)
%
Salaries and employee benefits
(89.5
)
(84.0
)
(5.5
)
6.5
%
Administrative expenses
(46.7
)
(45.1
)
(1.5
)
3.4
%
Depreciation and amortization
(15.0
)
(15.0
)
0.0
(0.2
%)
Other
(2.4
)
(1.3
)
(1.1
)
86.2
%
Total Other Expenses
(153.6
)
(145.5
)
(8.1
)
5.6
%
Total other expenses increased by S/8.1 million, or 5.6%, for the year ended December 31, 2023 mainly due to higher salaries and employee’s benefits, as well as increased administrative expenses.
Inteligo’s efficiency ratio is calculated by dividing salaries and employee benefits plus administrative expenses plus depreciation and amortization by net interest and similar income plus net fee income from financial services plus other income. Our wealth management segment’s efficiency ratio showed a result of 78.9% for the year ended December 31, 2023 from a not meaningful result for the year ended December 31, 2022, mainly due to positive revenues.
B.
Liquidity and Capital Resources
Our primary source of liquidity is dividends received from our subsidiaries and an issuance of senior debt and our primary use of funds is the payment of dividends to our shareholders and interest payments associated with the indebtedness described below.
As of December 31, 2024, our outstanding indebtedness included the U.S.$300,000,000 aggregate principal amount of 4.125% senior notes due 2027 issued pursuant to the indenture, dated October 19, 2017 among the Registrant, The Bank of New York Mellon, as trustee, and The Bank of New York Mellon SA/NV, Luxembourg Branch, as Luxembourg transfer and paying agent.
The following discussion of liquidity and capital resources is on a segment basis. See “Item 8. Financial Information—Consolidated Statements and Other Financial Information—Dividends and dividends policy”.
Interbank
The following table presents Interbank’s primary sources of funds as of December 31, 2024 and 2023:
As of December 31, 2024
As of December 31, 2023
Change
(S/ in millions)
(S/ in millions)
%
Total deposits and obligations
51,144.4
46,053.6
5,090.7
11.1
%
Due to banks and correspondents and inter-bank funds
6,963.7
8,789.0
(1,825.3
)
(20.8
%)
Bonds, notes and other obligations
4,669.1
4,253.2
415.9
9.8
%
Total
62,777.2
59,095.8
3,681.4
6.2
%
In our banking segment, our primary sources of funds have traditionally consisted of deposits and obligations, which amounted to S/51,144.4 million as of December 31, 2024. Interbank’s deposits include retail and commercial deposits, generated mainly through its digital channels, financial stores distribution network, and its relationships with commercial clients.
166
Interbank is required to maintain deposits with the Central Reserve Bank of Peru, as legal reserve, in an amount determined by the percentage of deposits and other liabilities owed to its clients. For a description of the legal reserve (encaje) regulations, see “Item 4. Information on the Company—Business Overview—Regulation and Supervision—Banking Regulation and Supervision—Reserve Requirements from the Central Reserve Bank of Peru”.
At times, Interbank has utilized Peru’s short-term interbank loans market to satisfy liquidity needs. The Central Reserve Bank of Peru’s discount window, which makes short-term loans to banks at premium rates, is another potential short-term funding source; although, Interbank has used it infrequently. As part of Interbank’s liquidity management, it sometimes enters into repos on Central Reserve Bank of Peru certificates of deposit, which are a cost and tax efficient source of funds in Peruvian currency.
Amounts due to banks and correspondents and inter-bank funds (including both short and long-term amounts) decreased S/1,825.3 million, or 20.8%, to S/6,963.7 million as of December 31, 2024 from S/8,789.0 million as of December 31, 2023, mainly due to lower funding provided by the BCRP and interbank funds. This factor was partially offset by an increase in funding provided by COFIDE and correspondent banks abroad.
Interbank has issued senior, senior-subordinated, junior-subordinated, mortgage and leasing bonds in the Peruvian and international capital markets.
Outstanding Indebtedness of Interbank
As of December 31, 2024, Interbank’s outstanding indebtedness included the following:
•
U.S.$400.0 million principal amount of 3.250% senior notes due 2026 issued on October 4, 2019.
•
S/312.0 million principal amount of 5.000% senior notes due 2026 issued on October 1, 2019.
•
U.S.$300.0 million aggregate principal amount of 4.000% subordinated notes due 2030 issued on July 8, 2020.
•
U.S.$305.0 million in working capital loans under credit facility agreements due between 2025 and 2027.
•
U.S.$145.0 million in trade loans under credit facility agreements due 2025.
•
U.S.$300.0 million aggregate principal amount of 7.625% subordinated notes due 2034 issued on January 9, 2024.
•
U.S.$350.0 million aggregate principal amount of 6.397% subordinated notes due 2035 issued on January 30, 2025.
On January 30, 2025, Interbank issued U.S.$350.0 million aggregate principal amount of 6.397% subordinated notes due 2035 under Rule 144A and Regulation S of the Securities Act of 1933 of the United States.
Additionally, as of December 31, 2024, we had U.S.$133.7 million in local debt, which includes S/150.0 million (U.S.$40.4 million at the nominal exchange rate of S/3.764 per U.S.$1.00 as of December 31, 2024) of local corporate inflation linked bonds, which have an amortization cost of S/188.9 million, S/113.0 million (U.S.$30.0 million) of negotiable certificates of deposits due on July 5, 2025, S/138.4 million (U.S.$36.8 million) of negotiable certificates of deposits due on September 5, 2025, and S/102.0 million (U.S.$27.1 million) of negotiable certificates of deposits due on December 8, 2025.
As of the date of this Annual Report on Form 20-F, Interbank complies with all the covenants described above and not subject to any other such obligations.
Interseguro
Interseguro’s primary source of funds is premiums collected, carry from fixed income investments, dividends on equity investments and real estate leases.
Outstanding Indebtedness of Interseguro
Interseguro has issued subordinated bonds in the Peruvian market. As of December 31, 2024, Interseguro had S/333.1 million in bonds outstanding compared to S/241.1 million for 2023. Additionally, Interseguro works with credit lines for promissory notes and letters of guarantee.
167
Inteligo
The following table presents Inteligo’s primary sources of funds as of December 31, 2024 and 2023:
As of December 31, 2024
As of December 31, 2023
Change
(S/ in millions)
(S/ in millions)
%
Total deposits and obligations
2,929.3
3,311.7
(382.4
)
(11.5
%)
Due to banks and correspondents and inter-bank funds
265.8
84.0
181.8
216.4
%
Total
3,195.1
3,395.7
(200.6
)
(5.9
%)
In our wealth management segment, the primary source of funds has consisted of deposits and obligations, which amounted to S/2,929.3 million as of December 31, 2024. Inteligo Bank’s deposits are retail deposits, from its private wealth clients. Retail deposits provide Inteligo with a low-cost, diverse and stable source of funding. Amounts due to banks and correspondents and inter-bank funds consist of the credit facilities provided to Inteligo Bank.
Deposits and obligations decreased S/382.4 million or 11.5% from December 31, 2023 to December 31, 2024, mainly attributable to the decrease of interest rates through the year. Funds due to banks and correspondents increased by S/181.8 million, or 216.4%, from December 31, 2023, to December 31, 2024, mainly due to a new credit line that Inteligo Bank opened with BMO Capital Markets.
Outstanding Indebtedness of Inteligo
As of December 31, 2024, Inteligo’s outstanding indebtedness included the following:
•
U.S.$20.5 million loan under a credit facility between Inteligo Bank and Banque J. Safra Sarasin SA. The credit agreement includes standard clauses regarding eligible collateral.
•
U.S.$50.0 million loan under a credit facility between Inteligo Bank and BMO Capital Markets. The credit agreement includes standard clauses regarding eligible collateral.
Regulatory Capital
Since December 2024, pursuant to existing applicable regulations, there are minimum capital requirements for financial services holding companies on a fully consolidated basis, which the SBS evaluates on an annual basis. Pursuant to Oficio N° 61578-2024-SBS, after assessing the perimeter for purposes of consolidated supervision of Intecorp's Financial Group (Grupo Financiero), SBS limited such scope to us and our subsidiaries, plus Financiera Oh! This change took effect beginning with the consolidated regulatory information. As of Decemeber 2024, we are currently compliant with the applicable regulations.
Additionally, Interbank and Interseguro are required to maintain minimum regulatory capital pursuant to guidelines issued by the SBS, and Inteligo Bank is required to maintain minimum regulatory capital pursuant to guidelines issued by the Central Bank of The Bahamas. Izipay does not have mandatory capital requirements.
Interbank
As of December 31, 2024, the minimum regulatory capital as a percentage of risk-weighted assets for Interbank was 12.3% and its ratio of regulatory capital to total risk weighted assets was 15.9%, according to the SBS. As of December 31, 2023, the minimum regulatory capital as a percentage of risk-weighted assets for Interbank was 11.1% and its ratio of regulatory capital to total risk weighted assets was 15.5%, according to the SBS. As of December 31, 2022, the minimum regulatory capital as a percentage of risk-weighted assets for Interbank was 9.8% and its ratio of regulatory capital to total risk weighted assets was 15.1%, the highest among the four largest banks in Peru, according to the SBS. See Note 16(f) to our audited annual consolidated financial statements and “Item 4. Information on the Company—Business Overview—Regulation and Supervision” section in this Annual Report on Form 20-F for a discussion of regulatory capital requirements applicable to Interbank.
168
The following tables present Interbank’s regulatory capital as of December 31, 2024, 2023 and 2022, in accordance with SBS GAAP, as required by the Peruvian Banking and Insurance Law.
As of December 31, 2024
As of December 31, 2023
Change
(S/ in (millions)
(S/ in millions)
%
Paid-in-capital
6,314.1
5,910.6
403.5
6.8
%
Legal and special reserves
1,373.0
1,283.2
89.9
7.0
%
Treasury stock
(33.9
)
(33.9
)
—
—
Others
239.2
301.9
(62.7
)
(20.8
%)
Total Tier 1
7,892.4
7,461.7
430.6
5.8
%
Subordinated bonds
2,258.4
2,225.4
33.0
1.5
%
Generic allowances for loan losses
477.7
485.3
(7.5
)
(1.6
%)
Others
(389.2
)
(360.9
)
(28.3
)
7.8
%
Total Tier 2
2,346.9
2,349.8
(2.8
)
(0.1
%)
Total Regulatory Capital
10,239.3
9,811.5
427.8
4.4
%
Risk-weighted assets
64,308.3
63,494.9
813.4
1.3
%
Regulatory capital as a percentage of risk-weighted assets
15.9
%
15.5
%
As of December 31, 2023
As of December 31, 2022
Change
(S/ in (millions)
(S/ in millions)
%
Paid-in-capital
5,910.6
5,441.9
468.7
8.6
%
Legal and special reserves
1,283.2
1,166.0
117.2
10.0
%
Treasury stock
(33.9
)
(33.9
)
—
—
Others
301.9
442.4
(140.5
)
(31.8
%)
Total Tier 1
7,461.7
7,016.4
445.3
6.3
%
Subordinated bonds
2,225.4
2,288.4
(63.0
)
(2.8
%)
Generic allowances for loan losses
485.3
465.7
19.5
4.2
%
Others
(360.9
)
(15.7
)
(345.1
)
n.m.
Total Tier 2
2,349.8
2,738.4
(388.6
)
(14.2
%)
Total Regulatory Capital
9,811.5
9,754.8
56.7
0.6
%
Risk-weighted assets
63,494.9
64,690.1
(1,195.2
)
(1.8
%)
Regulatory capital as a percentage of risk-weighted assets
15.5
%
15.1
%
Interseguro
Interseguro is required to maintain a minimum regulatory capital, also known as solvency equity, pursuant to guidelines issued by the SBS. The capital requirement is the sum of solvency equity and the guarantee fund. Solvency equity is determined by the level of risk and the risk profile assumed by an insurance company in Peru in accordance with SBS regulations. The guarantee fund is equivalent to 35% of solvency equity plus the investment component borne by the company, spread risk additional equityand a growing percentage of the fair value of real estate, currently standing at 3.3% and projected to going up to 10% by December 2026. See Note 16(f) to our audited annual consolidated financial statements and “Item 4. Information on the Company—Business Overview—Regulation and Supervision” in this Annual Report on Form 20-F for a discussion of regulatory capital requirements applicable to Interseguro.
169
The following tables present Interseguro’s solvency ratio as of December 31, 2024, 2023 and 2022 in accordance with SBS GAAP as required by the Peruvian Banking and Insurance Law.
As of December 31, 2024
As of December 31, 2023
Change
(S/ in millions)
(S/ in millions)
%
Regulatory capital
1,509.4
1,370.2
139.2
10.2
%
Less:
Solvency equity (solvency margin)(1)
706.9
698.4
8.5
1.2
%
Guarantee fund(2)
499.1
455.3
43.8
9.6
%
Required capital
1,206.0
1,153.7
52.3
4.5
%
Surplus
303.4
216.5
86.9
40.1
%
Solvency Ratio(3)
125.2
%
118.8
%
As of December 31, 2023
As of December 31, 2022
Change
(S/ in millions)
(S/ in millions)
%
Regulatory capital
1,370.2
1,338.2
31.9
2.4
%
Less:
Solvency equity (solvency margin)(1)
698.4
714.9
(16.5
)
(2.3
%)
Guarantee fund(2)
455.3
250.2
205.0
82.0
%
Required capital
1,153.7
965.1
188.6
19.5
%
Surplus
216.5
373.2
(156.7
)
(42.0
%)
Solvency Ratio(3)
118.8
%
138.7
%
(1)
Corresponds to an amount determined by the level of risk and the risk profile assumed by an insurance company in Peru in accordance with SBS regulations.
(2)
Equal to 35% of solvency margin.
(3)
Solvency ratio for Interseguro is calculated in accordance with SBS guidelines. See “Item 4. Information on the Company—Business Overview—Regulation and Supervision—Insurance Regulation and Supervision—Solvency Requirements and Regulatory Capital”.
Inteligo Bank
Inteligo Bank is required to maintain a minimum regulatory capital of not less than 12% of its risk-weighted assets, pursuant to the Bahamas Capital Regulations 2022, released by the Central Bank of Bahamas in August 2022. Risk-weighted assets are the sum of (i) the total amount of credit risk weighted assets and indirect loans, (ii) 10 times the regulatory capital allocated to cover market risk, only if the bank’s market risk position is higher than (a) 5% of the total on- and off-balance sheet assets, or (b) U.S.$100 million, and (iii) 12.5 times the regulatory capital allocated to cover operational risk. As of December 31, 2024, Inteligo Bank’s ratio of regulatory capital to total risk-weighted assets was 19.3%.
170
The following tables present Inteligo Bank’s risk-weighted assets and regulatory capital as a percentage of risk-weighted assets as of December 31, 2024 and 2023, according to the current capital requirements of the Central Bank of the Bahamas.
As of December 31, 2024
As of December 31, 2023
Change
(U.S. $/ in millions)
(S/ in millions)
%
Total eligible capital
157.2
137.5
19.7
14.3
%
Total risk-weighted assets
812.5
792.4
20.2
2.5
%
Capital ratio
19.3
%
17.4
%
As of December 31, 2023
As of December 31, 2022
Change
(U.S. $/ in millions)
(S/ in millions)
%
Total eligible capital
137.5
195.8
(58.3
)
(29.8
%)
Total risk-weighted assets
792.4
959.2
(166.8
)
(17.4
%)
Capital ratio
17.4
%
20.4
%
Prior to 2023, the Central Bank of Bahamas required a minimum regulatory capital of not less than 8% of risk-weighted assets and the methodology to calculate the eligible capital did not include deductions of high-risk assets. The capital adequacy ratio reported by Inteligo Bank according to prior requirements was 24.4% and 20.4% as of December 31, 2021 and 2022, respectively. Using this methodology, the ratio as of December 31, 2024 would have been 25.5%.
In 2018, the Central Bank of The Bahamas published two discussion papers focused on minimum disclosures (Pillar III of the Basel II framework) and the net stable funding ratio and the liquidity coverage ratio (main components of Basel III), but its liquidity framework is still in development.
In Peru, Inteligo SAB is regulated by the SMV, which is responsible for determining the minimum capital requirement for the companies under its supervision. As of December 31, 2024, the capital requirement for brokerage houses is the sum of (i) the minimum regulatory capital required of S/2.4 million; and (ii) the regulatory capital allocated to cover operational risks. As of December 31, 2024, Inteligo SAB held capital exceeding S/24.1 million.
Commitments and Contractual Obligations
We enter into various commitments and contractual obligations that may require future cash payments.
The following tables summarize our commitments and contractual obligations as of December 31, 2024 and 2023:
As of December 31, 2024
Less than 1 year
1-3 years
3-5 years
More than 5 years
Total
(S/ in millions)
Deposits and obligations
53,064.8
356.6
56.4
290.2
53,768.0
Inter-bank funds
—
—
—
—
—
Due to banks and correspondents
3,586.4
2,304.7
279.9
1,391.0
7,562.1
Bonds, notes and other obligations
430.9
2,883.3
188.7
2,572.5
6,075.4
Due from customers on acceptances
9.2
—
—
—
9.2
Accounts payable, provisions and other liabilities
4,174.4
—
—
—
4,174.4
Lease liabilities
32.3
60.9
33.3
18.3
144.8
Total(1)
61,298.0
5,605.6
558.4
4,272.0
71,733.9
171
As of December 31, 2023
Less than 1 year
1-3 years
3-5 years
More than 5 years
Total
(S/ in millions)
Deposits and obligations
48,385.3
410.1
88.0
304.9
49,188.2
Inter-bank funds
119.7
—
—
—
119.7
Due to banks and correspondents
4,855.6
2,556.0
266.1
1,348.2
9,025.9
Bonds, notes and other obligations
71.7
1,789.6
1,045.2
2,645.2
5,551.6
Due from customers on acceptances
40.6
—
—
—
40.6
Accounts payable, provisions and other liabilities
3,315.8
—
—
—
3,315.8
Lease liabilities
30.4
43.1
14.7
3.5
91.6
Total(1)
56,819.0
4,798.7
1,414.0
4,301.7
67,333.4
(1)
For insurance contract liabilities as of December 31, 2024 and 2023, see Note 14 of our audited annual consolidated financial statements.
All contractual obligations included in these tables are recognized as liabilities on our consolidated statement of financial position and represent principal payments on an undiscounted basis without including payment of future interest.
Off-Balance Sheet Arrangements
Our subsidiaries Interbank, Interseguro and Inteligo have various contractual arrangements, such as contingent operations, that are not recognized as liabilities in our audited annual consolidated financial statements but are required to be recorded as off-balance sheet items. See Note 18 to our audited annual consolidated financial statements.
We enter into contingent operations to generate fees from guarantees, stand-by letters of credit, import and export letters of credit, due from bank acceptances and foreign currency forward obligations.
Off-Balance Sheet Arrangements as of December 31, 2024 and 2023
The following table presents our consolidated off-balance sheet arrangements as of December 31, 2024 and 2023.
As of December 31,
2024
2023
Change
(S/ in millions)
(S/ in millions)
%
Contingent credits—Indirect loans
Guarantees and standby letters
4,695.3
4,302.8
392.6
9.1
%
Import and export letters of credit
373.4
440.7
(67.3
)
(15.3
%)
5,068.7
4,743.5
325.2
6.9
%
Derivatives—Notional amounts Held for trading
Forward currency contracts—buy
2,514.2
1,811.1
703.0
38.8
%
Forward currency contracts—sell
4,078.3
2,316.8
1,761.5
76.0
%
Foreign currency forward contracts on currencies other than sol
499.5
747.7
(248.2
)
(33.2
%)
Interest rate swaps
1,742.1
1,530.5
211.6
13.8
%
Currency swaps
1,899.3
1,370.8
528.5
38.6
%
Foreign currency options
2.5
279.0
(276.5
)
(99.1
%)
Held as hedges Cash flow hedges:
Cross currency swap
2,334.9
2,578.5
(243.6
)
(9.4
%)
13,071.0
10,634.4
2,436.4
22.9
%
Responsibilities under credit lines agreements
13,536.3
13,311.1
225.2
1.7
%
Total
31,676.0
28,689.2
2,986.8
10.4
%
172
Guarantees and standby letters increased by S/392.6 or 9.1% from 4,302.8 million as of December 31, 2023 to S/4,695.3 million as of December 31, 2024. Import and export letters of credit decreased S/67.3 million.
Foreign currency forwards, including purchase and sale agreements decreased S/248.2 million from S/747.7 million as of December 31, 2023 to S/499.5 million as of December, 2024. We also use derivative financial instruments as hedges. See Note 10(b) to our audited annual consolidated financial statements for derivative financial instruments valuation.
Responsibilities under credit lines agreements increased by S/225.2 million as of December 31, 2023 to S/13,536.3 million as of December 31, 2024. These credit line agreements are cancellable at any time by Interbank.
Off-Balance Sheet Arrangements as of December 31, 2023 and 2022
The following table presents our consolidated off-balance sheet arrangements as of December 31, 2023 and 2022.
As of December 31,
2023
2022
Change
(S/ in millions)
(S/ in millions)
%
Contingent credits—Indirect loans
Guarantees and standby letters
4,302.8
4,001.8
301.0
7.5
%
Import and export letters of credit
440.7
485.5
(44.8
)
(9.2
%)
4,743.5
4,487.3
256.2
5.7
%
Derivatives—Notional amounts Held for trading
Forward currency contracts—buy
1,811.1
1,977.3
(166.2
)
(8.4
%)
Forward currency contracts—sell
2,316.8
4,057.8
(1,741.0
)
(42.9
%)
Foreign currency forward contracts on currencies other than sol
747.7
292.9
454.8
n.m.
Interest rate swaps
1,530.5
2,424.6
(894.1
)
(36.9
%)
Currency swaps
1,370.8
2,672.5
(1,301.7
)
(48.7
%)
Cross currency swap
—
224.5
(224.5
)
(100.0
%)
Foreign currency options
279.0
80.2
198.9
247.9
%
Held as hedges Cash flow hedges:
Cross currency swap
2,578.5
2,579.2
(0.7
)
(0.0
)%
10,634.4
14,309.0
(3,674.6
)
(25.7
%)
Responsibilities under credit lines agreements
13,311.1
14,758.7
(1,447.6
)
(9.8
%)
Total
28,689.2
33,555.0
(4,865.9
)
(14.5
%)
n.m. means not meaningful.
Guarantees and standby letters increased by S/301.0 million, or 7.5%, from S/4,001.8 million as of December 31, 2022 to S/4,302.8 million as of December 31, 2023. Import and export letters of credit decreased S/44.8 million.
Foreign currency forwards, including purchase and sale agreements increased S/454.8 million from S/292.9 million as of December 31, 2022 to S/747.7 million as of December 31, 2023. We also use derivative financial instruments as hedges. See Note 10(b) to our audited annual consolidated financial statements for derivative financial instruments valuation.
Responsibilities under credit line agreements decreased S/1,447.6 million for the year ended December 31, 2023, compared to the amount registered as of December 31, 2022. These credit line agreements are cancellable at any time by Interbank.
Capital Expenditures Program
We have made significant investments and, in particular, in our banking segment. In fact, Interbank has made substantial investments in recent years targeting both digital and physical infrastructure.
Interbank believes that it is building the foundations to capture current and future market opportunities and continue to grow. It has a capital expenditure plan to ensure the accomplishment of its medium-term strategic plan, as it believes that not only operating efficiency and proximity to its customers, but also digital transformation and innovation, are key competitive advantages.
173
We are investing intensely in our transformation and our technology capital expenditures is two times the amount of our investment made in 2015.
While we budget for investments across our subsidiaries, Interbank accounts for the substantial majority or our capital expenditures budget. Interbank’s budget for capital expenditures for 2024 was approximately S/270 million. Of this budget, approximately 77% is related to technology expenditures including investments in our digital platform, aligned with technology as a main pillar at IFS. Some of the key technological expenditures include:
• significant improvements in our digital platform, including new functionalities aimed to enhance User Experience (UX), in both retail and commercial segments;
• further improvement in advanced analytical capabilities and personalization approach to better understand our customers through data and analytics, artificial intelligence, machine learning, deep learning, among others, to enrich our understanding of Peruvian clients and strengthen our data driven organization approach;
• research and development of digital solutions, including products, services, and processes in a fast-changing and competitive environment; and
• strengthen cybersecurity standards to protect our customers.
To strengthen its network, Izipay consistently invests in technology, including POS systems with Android operative systems and hardware to increase its capacity. Additionally, Izipay develops software to deliver new services to different types of customers. The capital expenditure investment from Izipay for the period 2024 was S/62.9 million.
Interseguro has invested in technology and projects to support its rapidly expanding operations with the aim of providing a modern, stable and secure platform to support its rapidly expanding business, and creating new capacities in data, analytics and artificial intelligence. In alignment with this strategy, Interseguro completed the migration of all its systems to MS Cloud in 2024. Over the years, Interseguro has also introduced a range of digital products and solutions, such as life insurance, car insurance, travel insurance, and SOAT (obligatory insurance for car circulation). Additionally, Interseguro has implemented and digitized the process of analyzing needs for life insurance products, which allows the company to issue insurance policies without requiring a physical application form.
In our wealth management segment, Inteligo SAB and Inteligo Peru Holdings implemented a new core system, “SAP Business One”, to automate back-office activities such as accounting, budgeting and purchasing in 2022. During 2023, Interfondos also implemented “SAP Business One”. In 2024, Inteligo Bank has continued working on complementing its IT infrastructure and further developing its technology platform, which may allow it to leverage its existing CRM platform and develop stronger business intelligence capabilities.
C.
Research and Development, Patents and Licenses, etc.
Not Applicable.
D.
Trend Information
As of December 31, 2024, we had total assets of S/95.5 billion (approximately U.S.$25.4 billion), total gross loans of S/50.4 billion (approximately U.S.$13.4 billion), total deposits and obligations of S/53.8 billion (approximately U.S.$14.3 billion) and shareholders’ equity of S/11.0 billion (approximately U.S.$2.9 billion).
Substantially all of our subsidiaries’ operations are conducted in Peru. Accordingly, our results of operations and financial condition are dependent on economic conditions, consumer spending and investment levels in Peru.
Peru has suffered from political instability, with a series of government institutional crises starting in 2018 due to, among other things, several corruption scandals involving prominent political figures, which have resulted in resignations and impeachment of various presidents since then, including most recently former President Jose Pedro Castillo in December 2022 following an attempted coup, as well as investigations of certain members of the judicial system and the public ministry who are now facing prosecution. Despite these factors and continued political corruption scandals, the Peruvian economy continued to outperform its peer countries, supported by solid macroeconomic fundamentals and strong fiscal and monetary policies. At the beginning of 2021, Peru continued to struggle from the effects of the pandemic but started to recover over time as targeted lockdowns decreased and were eventually lifted and the vaccination program accelerated. The recovery was mainly driven by domestic demand-oriented sectors, improved trade terms, higher private consumption, and the base effect of such improvements as compared to 2020. Nevertheless, such improved economic landscape was negatively affected by the uncertainty that arose in the run up to the presidential and congressional elections that took place in April 2021. These political events contributed to a slowdown in GDP growth, volatility of the exchange
174
rate and weakening of the local currency, which in turn also affected inflation. As a result of these factors, the Peruvian GDP grew 13.6% in 2021.
In 2022, Peru had an economic deceleration due political uncertainty and social unrest. This outlook affected directly the mining, tourism and agricultural sectors. As a consequence, inflation remained at 8.5% as of December 2022. To curb inflation, the Central Bank tightened its monetary policy by elevating the reference policy rate to 7.50% as of December 2022. As a result of these factors, the Peruvian GDP grew 2.7% in 2022.
In 2023, the Peruvian GDP declined 0.6%, amidst social unrest, prolonged inflation, and the climate phenomenon known as “Yaku” that occurred during the first quarter. Furthermore, responding to these challenges, and with inflation under control, the Central Reserve Bank of Peru initiated a series of rate reductions in the latter half of the year, culminating in a reference interest rate decrease to 6.75% by December 31, 2023.
In 2024, the Peruvian GDP grew 3.3%, mostly driven by a 3.8% increase in domestic demand and an increase in public investment, particularly in infrastructure, which contributed positively to economic growth. Additionally, the strong performance of primary sectors such as fishing, which benefited because of the open season this year, and the agricultural and livestock sector, which showed a 4.9% increase, further bolstered the economy.
The following are the most important trends, uncertainties and events that are reasonably likely to affect us or that would cause the financial information disclosed herein not to be indicative of or have a material adverse effect on our future operating results or financial condition:
•
Our businesses and prospects rely on a market-oriented economy, and protests and social unrest in Peru against government economic policies and social inequality, as well as potential political changes may alter the current economic model and business environment.
•
Our subsidiaries are subject to extensive regulation and supervision, and changes in existing regulations or the implementation of future regulations.
•
The adoption of new international banking and insurance guidelines may cause our subsidiaries to require additional capital and could cause their cost of funds to increase.
•
Intense competition from other banking, insurance and financial institutions, and from other players including providers of emerging financial technologies.
•
Financial market volatility and market turmoil associated with the failure of two U.S. banks and the emergency sale of Credit Suisse or similar developments in the financial industry.
•
Our loans, deposits, asset quality and our profits have all experienced substantial growth, benefitting from growth in the Peruvian economy. However, economic, social and political developments in Peru, including political instability, high profile corruption investigations, inflation and unemployment may cease to support our historically strong growth.
•
Our capital and funding requirements as well as our client activity and our clients’ ability to repay loans could be affected by continued adverse developments and market uncertainties relating to climate phenomena and social unrest in Peru, which has resulted in unexpected volatility in equity and credit markets.
•
Cybersecurity events, earthquakes, other natural disasters, health epidemics and other outbreaks could negatively affect our reputation and the operations of Interbank, Interseguro, Interfondos, Inteligo SAB and Izipay.
•
The oceanic and atmospheric phenomenon El Niño may have a negative impact on the economy of Peru and on our results. Among other potential impacts, this phenomenon could affect Interbank’s loan activity and asset quality in the future, considering that (i) it may affect the overall payment capacity of Interbank borrowers, and (ii) Interbank loan agreements typically grant borrowers a grace period due to El Niño.
175
For more information regarding potential economic or regulatory factors that could affect our result of operations or financial condition, see “Item 3. Key Information—Risk Factors”, “Item 4. Information on the Company—Business Overview—Strategy”, “Item 5. Operating and Financial Review and Prospects—Operating Results” and “Forward-Looking Statements”.
E.
Critical Accounting Estimates
For a summary regarding critical accounting estimates and judgments, please refer to “Item 5. Operating and Financial Review and Prospects – Operating Results—Critical accounting estimates and judgments”.
ITEM 6. DIRECTORS, SENIOR MANAGEMENT AND EMPLOYEES
A.
Directors and Senior Management
General
Our business and affairs are managed by our board of directors in accordance with our articles of incorporation and Panamanian corporate law. Our articles of incorporation provide for a board of directors of no less than three members. Our current board of directors is comprised of seven directors and no alternates. The two-year term of our current board of directors appointed on March 31, 2025 will expire in March 2027.
If a director resigns or otherwise becomes unable to continue with its duties, a majority of our directors may appoint any other person to serve as director for the remaining term of the board.
The board of directors may establish one or more committees, to which it may delegate any or all of its responsibilities. Each committee shall be composed by two or more directors.
The board of directors typically meets in regularly scheduled quarterly meetings and when called by any dignitary (dignatario) or our Chief Executive Officer. Resolutions must be adopted by a majority of the directors present at the meeting.
Board of Directors
Our board of directors consists of seven members, four of whom are independent. The business address of our board of directors is Av. Carlos Villarán 140, 5th floor Urbanización Santa Catalina, La Victoria, Lima 13, Perú. The following table sets forth certain information about our current directors.
Name
Position
Year of Birth
Year Appointed
Carlos Tomás Rodríguez-Pastor Persivale
Chairman
1959
2007
Fernando Martín Zavala Lombardi
Secretary
1971
2019
Felipe Federico Roy Morris Guerinoni(1)
Treasurer
1953
2007
Alejandro Christian Sandoval Zavala(1)
Director
1972
2025
Lucía Cayetana Aljovín Gazzani(1)
Director
1966
2019
Hugo Antonio Santa María Guzmán
Director
1963
2019
Guillermo Martinez Barros(1)
Director
1958
2019
(1)
Independent director pursuant to Rule 10A-3 of the Securities Exchange Act of 1934, as amended (the “Exchange Act”).
The following sets forth selected biographical information for each of the members of IFS’s board of directors.
Carlos Tomás Rodríguez-Pastor Persivale has served as IFS’ chairman since 2007. He also serves as Interbank’s chairman since 1995 and was Interbank’s interim Chief Executive Officer during 2010. In addition, Mr. Rodríguez-Pastor serves as Chairman of Intercorp Peru, Supermercados Peruanos, Tiendas Peruanas, Colegios Peruanos, InRetail Peru Corp. and Universidad Tecnológica del Perú, and as director of Inteligo Group Corp., Interseguro, Homecenters Peruanos and Financiera OH! S.A., among others. Mr. Rodríguez-Pastor received a bachelor’s degree in social science from the University of California at Berkeley and a master’s degree in business administration from the Amos Tuck School of Business at Dartmouth College.
176
Fernando Martin Zavala Lombardi has served as an IFS director since his appointment in April 2019, and has been serving Interbank as director since March 2019. Mr. Zavala also serves as CEO and director of Intercorp Peru Ltd. and Chairman of InRetail Pharma and Homecenters Peruanos, and director of InRetail Peru Corp., Inteligo Group Corp., Universidad Tecnológica del Perú, Colegios Peruanos, Interseguro, Tiendas Peruanas, Supermercados Peruanos, Financiera OH! S.A., Intertítulos, and Inteligo Bank. He previously served as CEO in Peru and Panama of the multinational company SABmiller and has been director of several companies in Peru, and several business guilds and NGOs as well. In the public sector, he has been Prime Minister and Minister of Economy and Finance, the latest twice, as well as General Manager of the Peruvian Antitrust Authority (Indecopi). Mr. Zavala received a bachelor’s degree in economics from Universidad del Pacífico in Lima, a master’s degree in business management from Universidad de Piura, and a master’s in business administration from University of Birmingham in England.
Felipe Federico Roy Morris Guerinoni has served as one of IFS’ directors since 2007. Mr. Morris also serves as Chairman of Interseguro and Financiera OH!, and as Director of Intercorp Peru and Inteligo Bank. Mr. Morris received a bachelor’s degree in economics from the Universidad del Pacífico in Lima, a master’s degree in economics from the University of Pittsburgh and a master’s degree in finance from American University.
Lucía Cayetana Aljovin Gazzani has served as one of IFS’ directors since her appointment in April 2019 and has been serving as Interbank’s director since July 2018. Mrs. Aljovin is the President of the Board of Compañía Latinoamericana de Radiodifusión S.A. and director of Nexa Resources Peru, Nexa Resources Atacocha, JetSMART Holdings Limited, Pesquera Diamante, among other companies. Previously, she was President of the National Fishing Society (SNP) and Asociación Civil Perú 2021 (Perú Sostenible), Vice President of CONFIEP and the Arbitral Tribunal of AMCHAM Peru, a partner at Miranda & Amado law firm, a member of the board of directors of the Lima Stock Exchange and served as director of other Peruvian companies and nonprofit organizations. She has also served as Foreign Affairs Minister, Minister of Energy and Mines and Minister of Social Inclusion. Mrs. Aljovin received a degree in Law from the Pontificia Universidad Católica del Perú and a master’s degree in business administration from Universidad Adolfo Ibanez of Chile. She has also been a journalist and a professor at several Peruvian universities.
Hugo Antonio Santa María Guzmán has served as one of IFS’ directors since his appointment in April 2019, and has been serving as Interbank director since November 2016. Mr. Santa María is partner, manager of economic studies, and chief economist of APOYO Consultoría, where he runs the Business Advisory Service (“SAE,” for its acronym in Spanish). SAE is the leading economic and business (analysis) service in Peru. He is currently a member of the board of directors of APOYO Comunicación, Sociedad Agricola Virú S.A., Colegios Peruanos, InRetail Perú Corp., Inretail Pharma and Real Plaza. Previously, he was a member of the boards of Banco Santander Peru, EDPYME Santander Consumo Perú, Compañía Minera Atacocha S.A. (now, Nexa Resources Perú S.A.A.) and the Consolidated Reserve Fund (investment fund of the Peruvian public pension system) as well as independent director and President of the board of Mibanco. Mr. Santa María has been a professor in graduate programs at Universidad del Pacífico, Universidad Peruana de Ciencias Aplicadas and Universidad de Piura. Mr. Santa María holds a bachelor’s degree in economics from Universidad del Pacífico and master and Ph.D. from Washington University in St. Louis.
Guillermo Martínez Barros has served as one of IFS’s directors since 2019. He has also served as a director of Interseguro since 2008. Mr. Martínez serves as director of Financiera OH! S.A. in Peru, PrimAmérica Consultores S.A., Scan S.A. and Ebench S.A. in Chile and is a member of the Direction Committee of Centros de Salud Peruanos S.A.C. Mr. Martínez is also the chairman and owner of Inmobiliaria e Inversiones Siete Mares S.A. Mr. Martínez received a bachelor’s degree in business administration from the Universidad Católica de Chile, a master’s degree in business administration from the University of Chicago and a master’s degree in economics from the London School of Economics.
Alejandro Christian Sandoval Zavala serves as one of IFS’ directors since March 2025. Mr. Sandoval is Vice President of the board of Dinet S.A., Talma Servicios Aeroportuarios S.A. and Aeropuertos del Perú S.A., and also serves as director of Inmobiliaria Koricancha S.A. and DT Dinetperú S.A.C. Mr. Sandoval received a bachelor’s degree in economy from the Universidad del Pacífico in Lima and a master's degree in business administration from the Stanford Graduate School of Business.
177
Executive Officers
The business address of our executive officers is Av. Carlos Villarán 140, Urbanización Santa Catalina, La Victoria, Lima 13, Perú. The following table sets forth certain information about our executive officers. Each member of our management team serves for open-ended terms.
Name
Position
Year of Birth
Year Appointed
Luis Felipe Castellanos López Torres
Chief Executive Officer
1970
2013
Gonzalo José Basadre Brazzini
Deputy Chief Executive Officer
1970
2013
Michela Casassa Ramat
Chief Financial Officer
1973
2012
Liliana Elcira Vera Villacorta
Chief Accounting Officer
1974
2006
Juan Antonio Castro Molina
General Counsel
1971
2006
Cecilia Ramírez Riesco
Investor Relations Officer
1987
2024
Katia Mercedes Lung Won
Chief Compliance Officer
1968
2016
Peter Roekaert Embrechts
Internal Auditor
1967
2020
Zelma Francisca Acosta-Rubio Rodríguez
Chief Sustainability Officer
1965
2022
Luis Felipe Castellanos López Torres has served as IFS’ Chief Executive Officer since April 2013. Mr. Castellanos is also one of Interseguro’s directors since his appointment in April 2019 and one of Interbank's directors since May 2024. Mr. Castellanos served as Interbank’s Chief Executive Officer from January 2011 until May 2024. Mr. Castellanos joined Interbank in 2006 as the Chief Executive Officer of Interfondos. He has served as Interbank’s Vice President for Retail Banking and Manager of the Mortgage and Real Estate Division. Previously, he was a Director in the investment banking division at Citigroup Global Markets in New York. Before joining Citigroup, Mr. Castellanos was responsible for the treasury department at Minera Yanacocha S.A. Mr. Castellanos received a bachelor’s degree in business administration from the Universidad del Pacífico and a master’s degree in business administration from the Amos Tuck School of Business at Dartmouth College.
Gonzalo José Basadre Brazznini has served as IFS’ Deputy Chief Executive Officer since April 2013. Mr. Basadre is also the General Manager/Chief Executive Officer of Interseguro since 2012. Previously, he was the Vice President of Investments (Chief Investment Officer) of Interseguro. He received a bachelor’s degree in business administration from the Universidad del Pacífico in Lima and a master’s degree of business administration from Harvard University.
Michela Casassa Ramat has served as IFS’ Chief Financial Officer and as Interbank’s Chief Financial Officer since September 2012. Mrs. Casassa joined Interbank in September 2011 as Head of Strategic Planning. Prior to joining Interbank, she served as Head of Strategy at Banco de Crédito del Perú in Lima, and Head of Strategy for Corporate and Investment Banking at Unicredit in Milan and Istanbul. She has also worked at The Boston Consulting Group in Milan. Mrs. Casassa holds a bachelor’s degree in business administration from the Universidad de Lima and a master’s degree in business administration with a specialization in finance from the SDA Bocconi in Milan.
Liliana Elcira Vera Villacorta has served as IFS’ Chief Accounting Officer since our formation. Ms. Vera served as Accounting Manager of Interbank from 2003 to 2011. From 1998 to 2002, Ms. Vera was a senior analyst at EY Peru. Ms. Vera received a degree in accounting from the Pontificia Universidad Católica del Perú and a master’s degree in business administration from INCAE Business School.
Juan Antonio Castro Molina. Mr. Castro is Corporate Legal Vice President for Intercorp Group, and General Counsel for IFS since its incorporation. Mr. Castro also serves as member of the board of Universidad Tecnológica del Peru and other companies of the Intercorp Group. Mr. Castro was previously employed at Wilmer, Cutler, Pickering, Hale and Dorr in Washington D.C. and has also served as chief of staff to the Prime Minister of Peru (2001). Mr. Castro received a degree in law from the Pontificia Universidad Católica del Perú, a master’s of laws degree from the University of Virginia where he attended as a Fulbright scholar, a master’s degree in business administration from Universidad Adolfo Ibañez, and he has attended senior management programs at Harvard Business School and the Wharton School of Business at the University of Pennsylvania.
Cecilia Ramírez Riesco was appointed IFS’ Investor Relations Officer in February 2024, effective as of March 1, 2024. Ms. Ramírez previously served as Head of Structural Asset Liability Management at Interbank, a position she continues to hold, having joined the company in January 2023. Prior to joining Interbank, she served as Asset Liability Management Manager at Banco de Crédito del Perú. With over 14 years of experience in the financial services sector, Ms. Ramírez holds a bachelor’s degree in economics from the Universidad de Lima and a master’s degree in finance from the London Business School.
178
Katia Mercedes Lung Won was appointed as IFS’ Chief Compliance Officer in March 2016. She also serves as Chief Compliance Officer of Interbank since 2012. Prior to joining Interbank, Ms. Lung served as Vice President Project Manager for Suntrust Bank in Miami, Florida in the International Wealth Management Division and as Vice President BSA/AML Compliance Officer for BNP Paribas Agency and the General Security Principal (Broker Dealer) for BNP Paribas Investment Services. Ms. Lung holds a bachelor’s degree in business administration from Florida International University (Cum Laude), and a master’s degree in business administration from Nova Southeastern University, as well as a CP/AML FIBA and a Six Sigma Certification—Green Belt.
Peter Roekaert Embrechts was appointed as IFS’ Internal Auditor in June 2020. Since September 2019 Mr. Roekaert has been in charge of SOX and internal control implementation at IFS and subsidiaries. Previously he served as Interbank’s Head of Credit Risk Monitoring and Recovery – Commercial Banking since December 2006. Prior to that he was Deputy Head of Recovery – Commercial Banking since January 2004 and worked at Interbank’s Corporate Banking Division since July 1996. Mr. Roekaert holds a bachelor’s degree in economics from the Universidad del Pacífico, as well as a master’s degree in business administration from the Johnson Graduate School of Management at Cornell University.
Zelma Francisca Acosta-Rubio Rodríguez has served as IFS´ Chief Sustainability Officer since March 2022, as Interbank’s General Counsel and Secretary of the Board of Directors since April 2007, and as Executive Vice President of Corporate and Legal Affairs since 2018. Mrs. Acosta-Rubio also serves as Chief Diversity Officer for Intercorp since 2018, as well as a director of several related companies of Interbank, including, La Fiduciaria S.A. (related under SBS rules) and Intertítulos. Previously, she served as Director at Compañía de Servicios Conexos Expressnet. Before joining Interbank, Mrs. Acosta-Rubio worked at Clifford Chance in London and Milbank, Tweed, Hadley & McCloy in New York. Mrs. Acosta-Rubio received a law degree from the Universidad Católica Andres Bello in Caracas, a master’s degree in comparative jurisprudence from New York University, a master’s degree in international banking law from Morin Center for Banking and Financial Law at Boston University and a master’s degree in business administration from the Management School at Universidad de Piura. In addition, she attended courses on governance and corporate social responsibility at Harvard Business School. Mrs. Acosta-Rubio is admitted to the New York State Bar.
Interbank
Board of Directors
Interbank’s board of directors consists of ten members, five of whom are independent. The business address of Interbank’s board of directors is Av. Carlos Villarán 140, Urbanización Santa Catalina, La Victoria, Lima 13, Peru. The following table sets forth certain information about our directors as of the date of this Annual Report on Form 20-F.
Name
Position
Year of Birth
Year Appointed
Carlos Tomás Rodríguez-Pastor Persivale
Chairman
1959
1995
Ramón José Vicente Barúa Alzamora
Director
1946
1994
Luis Felipe Castellanos López Torres
Director
1970
2024
David Fischman Kalincausky(1)
Director
1958
2003
Carlos Miguel Heeren Ramos(1) (2)
Lead Director
1968
2015
Felipe Federico Roy Morris Guerinoni
2nd Vice-Chairman
1953
2000
Lucía Cayetana Aljovín Gazzani(1)
Director
1966
2018
Hugo Antonio Santa María Guzmán(1)
Director
1963
2016
Fernando Martín Zavala Lombardi
1st Vice-Chairman
1971
2019
Marcia Nogueira de Mello(1) (3)
Director(3)
1965
2022
(1)
Independent director pursuant to Peruvian regulations.
(2)
The Lead Director is the director who coordinates independent directors.
(3)
Director responsible for supervising the efficiency of the information security and cybersecurity systems of Interbank, as required by Peruvian regulations.
The following sets forth selected biographical information for each of the members of Interbank’s board of directors.
Carlos Tomás Rodríguez-Pastor Persivale, See “Item 6. Directors, Senior Management and Employees—Directors and Senior Management—General—Board of Directors”.
179
Ramón José Vicente Barúa Alzamora has served as one of Interbank’s directors since 1994. In addition, Mr. Barúa serves as a director of InRetail Pharma, Supermercados Peruanos, Homecenters Peruanos, Tiendas Peruanas, Real Plaza, Universidad Tecnológica del Perú, Financiera OH! S.A., Inteligo Group and Interseguro. He has also served as director of Intercorp Perú, Intercorp Financial Services Inc., Interfondos, Intertítulos, and Inteligo Bank, and, until 2019, he was the Chief Executive Officer of Intercorp Perú. Mr. Barúa received a bachelor’s degree in industrial engineering from the Universidad Nacional de Ingeniería in Lima and a degree in economics from the Université Catholique de Louvain in Belgium.
Luis Felipe Castellanos López Torres, See “Item 6. Directors, Senior Management and Employees—Directors and senior management—General—Executive Officers”.
David Fischman Kalincausky has served as one of Interbank’s directors since 2003. Mr. Fischman also serves as a director of Supermercados Peruanos. He has served for 17 years as Vice Chancellor of Administration of the Universidad Peruana de Ciencias Aplicadas (UPC) in Lima, of which he is also a funding member. Mr. Fischman is an international consultant on leadership and organizational culture issues. He holds a degree in civil engineering from Georgia Tech University and a master’s degree in business administration from Boston University.
Carlos Miguel Heeren Ramos has served as one of Interbank’s directors since 2015, appointed as Lead Director in 2020 and, as required by the SBS regulation, designated as the Director responsible to supervise the efficiency of the information security and cybersecurity system from 2021 to 2023. In addition, he is CEO of UTEC (Universidad de Ingeniería y Tecnología) and TECSUP (Instituto Superior de Tecnología). He currently serves on the board of several companies and non-profit organizations, such as Dinet S.A. and Talma Servicios Aeroportuarios S.A. Prior to his current role, he was a partner in the largest consulting firm in Peru, Apoyo Consultoría, where he served as the head of management consulting. He also served as director of Cementos Pacasmayo S.A.A. and San Fernando S.A. Additionally, he spent 12 years as a faculty member in the Graduate School of the Universidad del Pacífico. He obtained his bachelor’s degree in economics at the Universidad del Pacífico, and obtained his master’s degree in economics from the University of Texas at Austin.
Felipe Morris Guerinoni, See “Item 6. Directors, Senior Management and Employees—Directors and Senior Management—General—Board of Directors”.
Lucía Cayetana Aljovin Gazzani, See “Item 6. Directors, Senior Management and Employees—Directors and Senior Management—General—Board of Directors”.
Hugo Antonio Santa María Guzmán, See “Item 6. Directors, Senior Management and Employees—Directors and Senior Management—General—Board of Directors”.
Fernando Martin Zavala Lombardi, See “Item 6. Directors, Senior Management and Employees—Directors and Senior Management—General—Board of Directors”.
Marcia Nogueira de Mello has served as one of Interbank’s directors since October 2022. As required by the SBS regulation, she has been designated as the Director responsible for supervising the efficiency of Interbank’s information security and cybersecurity system since 2023. She is co-founder and board member of Oasis Capital Ltd. (formerly Volt Partners Investimentos Ltd.), independent board member of PagSeguro Digital Ltd. (Wallmine), Leo Madeiras Maquinas & Ferragens S.A. and Leo Meio de Pagamentos Ltd. Previously, she was co-founder and board member of Revolution Investimentos Ltda., served as CEO of Global Payments South America Brasil Serviços de Pagamentos, was member of the advisory board of Banco Letsbank S.A. (formerly Banco Smartbank S.A.), and DMCard Processamento de Dados e Central de Atendimento Ltda., commercial director of Elavon do Brasil Soluçoes de Pagamento S.A., country manager and sales director of Verifone do Brasil Ltda., director of channels, strategy and payment solutions at Companhia Brasileira de Meios de Pagamento S.A. (Cielo), and business development manager of EDS Electronic Data Systems do Brasil Ltda. (subsidiary of Hewlett-Packard - HP). Mrs. Nogueira received a degree in Computer Science from the Universidade Presbiteriana Mackenzie in Brazil.
180
Executive Officers
The business address of Interbank’s executive officers is Av. Carlos Villarán 140, Urbanización Santa Catalina, La Victoria, Lima 13, Perú. The following table sets forth certain information about Interbank’s executive officers as of the date of this Annual Report on Form 20-F.
Name
Position
Year of Birth
Year Appointed
Carlos José Tori Grande
Chief Executive Officer
1976
2024
Michela Casassa Ramat
Chief Financial Officer
1973
2012
Gabriela Prado Bustamante
Executive Vice President of Risk Management
1970
2008
Alexander Woodman Navarrete(1)
Executive Vice President of Retail Banking and Channels(2)
1974
2024
Víctor Edwin Martín Cárcamo Palacios
Executive Vice President of Commercial Banking
1972
2016
Alfonso Alejandro Díaz Tordoya
Executive Vice President of Operations and Technology
1979
2022
Giorgio Ettore Miguel Bernasconi Carozzi
Executive Vice President of Capital Markets
1961
2009
Zelma Francisca Acosta-Rubio Rodríguez
Executive Vice President of Corporate and Legal Affairs
1965
2007
Julio Antonio Del Valle Montero
Executive Vice President of Human Resources
1977
2023
(1)
Appointment approved by the Board of Directors on October 22, 2024.
(2)
As agreed by the Board of Directors on April 30, 2024, (i) the Vice Presidency of Payments was eliminated, and (ii) its underlying division, the Division of Payments, began reporting to the Vice Presidency of Retail Banking and Channels.
Carlos José Tori Grande has been serving as the Chief Executive Officer of Interbank since May 1, 2024. Prior to this role, he served at Interbank as Executive Vice President of Payments Ecosystem between August 2022 and April 2024, as Vice President of Retail Banking and Channels between March 2021 and July 2022, as Vice President of Retail Banking between December 2016 and March 2021, and as Vice President for Distribution Channels between February 2014 and December 2016. In addition, Mr. Tori serves as a director of PMP. Mr. Tori joined Interbank in 2009 as Head of the Corporate Finance team. Previously, Mr. Tori had served as a director of Interfondos, Compañía de Servicios Conexos Expressnet, Servitebca Perú Servicio de Transferencia Electrónica de Beneficios y Pagos (Servitebca), Cámara de Compensación Electrónica (CCE) and Pagos Digitales Peruanos. Prior to joining Interbank, Mr. Tori worked for Citigroup and BankBoston. He also served as an Investment Banking Associate at Merrill Lynch . Mr. Tori received a bachelor’s degree in business administration from Texas A&M University and a master’s degree in business administration from the Amos Tuck School of Business at Dartmouth College. In addition, he attended the Advanced Management Program at Harvard Business School.
Michela Casassa Ramat, See “Item 6. Directors, Senior Management and Employees—Directors and Senior Management—General—Executive Officers.”
Gabriela Prado Bustamante has served as Interbank’s Executive Vice President of Risk Management since July 2008. Previously, Ms. Prado was responsible for Interbank’s Special Asset Management Division and from 2000 to 2004, Ms. Prado served as Manager of Interbank’s Risk Management Division, and responsible for monitoring customer performance. Prior to joining Interbank, Ms. Prado also worked for Santander’s Risk Management Division. Ms. Prado received a bachelor’s degree in business administration from the Universidad de Lima, and a graduate degree in business administration from the INCAE Business School. In addition, she attended the Management Development Program at the Universidad de Piura.
Alexander Woodman Navarrete has served as Interbank’s Executive Vice President of Retail Banking and Channels since October 2024. He previously served as Head of Retail Products and Channels since April 2018, after having served as Head of Payment Services and Acquisition since November 2015. In addition, he also serves as director of Cámara de Compensación Electrónica (CCE). Previously, he served as director at Compañía Peruana de Medios de Pago (Niubiz). Before joining Interbank, he served as Head of Strategy and Commercial Management at LATAM Airlines Peru, Manager of Revenue Management and Planning and Control at LATAM Airlines USA, as Service Consultant in Value Added Services at Visa International and Six Sigma Black Belt and Product Manager Services at Bellsouth Perú. Mr. Woodman holds a bachelor’s degree as industrial engineer from Universidad de Lima and holds a master’s degree in business administration from Duke University.
181
Víctor Edwin Martin Cárcamo Palacios has served as Interbank’s Executive Vice President for Commercial Banking since January 2016. Previously, he served as Head of Corporate Finance and Head of Medium Enterprises Banking at Interbank. Until 2020, he served as director of Servitebca. He also serves as Director of Intertítulos, PMP and La Fiduciaria S.A. Before joining Interbank, Mr. Cárcamo was the Executive Director of Capital Markets at Banco Santander in Mexico and Deputy Manager of Retail Products at Banco Santander in Argentina. Mr. Cárcamo holds a bachelor’s degree in economics from the Universidad de Lima and a master’s degree in business administration from the Universidad Adolfo Ibáñez in Chile. Mr. Cárcamo also completed the General Management Program at Harvard Business School.
Alfonso Alejandro Díaz Tordoya has served as Interbank’s Executive Vice President of Operations and Technology since August 2022, after serving as Vice President of Digital Delivery & Partnerships since January 2022. Prior to this position, he served as the Head of Digital Alliances since March 2021, after serving as Vice President of Distribution Channels since December 2016 and as Manager for the Digital Channels Division since May 2013. Mr. Diaz also serves as a Director of Compañía Peruana de Medios de Pago. Previously, he served as director at Procesos de Medios de Pago, Interfondos, Servitebca, Expressnet and Cámara de Compensación Electrónica – CCE. Prior to joining Interbank, Mr. Diaz worked in management consulting at A.T. Kearney and in commercial banking at Citigroup Peru. Mr. Diaz is a Licensed Industrial Engineer from Universidad de Lima and holds a master’s degree in business administration from Harvard Business School.
Giorgio Ettore Miguel Bernasconi Carozzi has served as Interbank’s Executive Vice President for Capital Markets since March 2009. Until 2019, he served as director of Interfondos. Prior to joining Interbank, Mr. Bernasconi served as Director in Strategy and Marketing, Global Markets and Distribution for Latin America and was responsible for Latin American capital markets at BBVA Bancomer in México. From 1997 to 2006, he was the Deputy General Manager for BBVA Banco Continental in Peru. He previously served as Treasury Vice President for Citibank Lima. Mr. Bernasconi has a bachelor’s degree in administration from the Pontificia Universidad Católica del Perú. In addition, he attended the Management Development Program at the Universidad de Piura, the Corporate Leadership and Management Program at the IESE Business School of the Universidad de Navarra, and the Senior Leaders Group Program at the Harvard Business School.
Zelma Francisca Acosta-Rubio Rodríguez, See “Item 6. Directors, Senior Management and Employees—Directors and Senior Management—General—Executive Officers.”
Julio Antonio Del Valle Montero has served as Interbank’s Human Resources Manager since January 2019 and Executive Vice President of Human Resources since March 2023. Mr. Del Valle joined Interbank in 2007 and since then has led teams related to Process Transformation, Procurement and Facility Management. Previously, he worked as Senior Manager at BNSF Railway in Texas, United States. Mr. Del Valle holds a bachelor’s degree in industrial engineering from St. Mary’s University and a master’s degree in business administration from SMU Cox School of Business.
Interseguro
Board of Directors
Interseguro’s board of directors consists of nine principal members and one alternate member, three of whom are independent. The business address of Interseguro’s board of directors is Avenida Javier Prado Este No. 492, office No. 2601, San Isidro, Lima 27, Peru. The following table sets forth certain information about Interseguro’s directors as of the date of this Annual Report on Form 20-F.
Name
Position
Year of Birth
Year Appointed
Felipe Morris Guerinoni
Chairman
1953
1998
Juan Carlos Vallejo Blanco
Director
1964
2012
Carlos Tomás Rodríguez-Pastor Persivale
Director
1959
1998
Ramón José Vicente Barúa Alzamora
Director
1946
2000
Raúl Alberto Francisco Musso Vento(1)
Director
1954
2000
Fernando Martín Zavala Lombardi
Director
1971
2019
Luis Felipe Castellanos López Torres
Director
1970
2019
Guillermo Martínez Barros(1)
Director
1958
2008
Michela Casassa Ramat
Director
1973
2024
Carlos Octavio Saco Vértiz Tudela(1)(2)
Alternate Director for Mr. Guillermo Martínez Barros
1961
2013
(1)
Independent director pursuant to Peruvian regulations.
(2)
Carlos Octavio Saco Vértiz is an alternate director.
182
The following sets forth selected biographical information for each of the members of Interseguro’s board of directors.
Felipe Morris Guerinoni, See “Item 6. Directors, Senior Management and Employees—Directors and Senior Management—General—Board of Directors”.
Juan Carlos Vallejo Blanco has served as one of Interseguro’s directors since 2012. In addition, Mr. Vallejo is Chief Executive Officer of InRetail Peru Corp., and serves as director of Supermercados Peruanos, Makro Supermayorista, InRetail Pharma, Tiendas Peruanas, Homecenters Peruanos, Quicorp, Colegios Peruanos S.A., Financiera OH! S.A. and Inmobiliaria Milenia S.A. Mr. Vallejo served as Chief Executive Officer of Interseguro from 1998 until 2012. Mr. Vallejo received a bachelor’s degree in industrial engineering from the Universidad de Chile and a master’s degree in business administration from INCAE Business School in Costa Rica.
Carlos Tomás Rodríguez-Pastor Persivale, See “Item 6. Directors, Senior Management and Employees—Directors and Senior Management—General—Board of Directors.”
Ramón José Vicente Barúa Alzamora, See “Item 6. Directors, Senior Management and Employees—Directors and Senior Management—Interbank–Board of Directors.”
Raul Alberto Francisco Musso Vento has served as one of Interseguro’s directors since 2000 and is currently the Chief Executive Officer of Industrias Electro Químicas S.A. Mr. Musso served as a director of Urbi Mercados S.A. from 1999 to 2000, as the General Manager of LP Holding S.A. from 1998-1999 and as the Vice-President of Bankers Trust Company. Mr. Musso received a bachelor’s degree in Economics from the Universidad del Pacífico and a master’s degree in economics from the University of Pittsburgh.
Fernando Martín Zavala Lombardi, See “Item 6. Directors, Senior Management and Employees—Directors and Senior Management—General—Board of Directors”.
Luis Felipe Castellanos López Torres, See “Item 6. Directors, Senior Management and Employees—Directors and Senior Management—General—Executive Officers”
Guillermo Martínez Barros, See “Item 6. Directors, Senior Management and Employees—Directors and Senior Management—General—Board of Directors”.
Michela Casassa Ramat, See “Item 6. Directors, Senior Management and Employees—Directors and Senior Management—General—Executive Officers.”
Carlos Octavio Saco Vértiz Tudela has served as an alternate director of Interseguro’s since 2004. Mr. Saco-Vértiz has also served as a director of Financiera OH! S.A., Tiendas Peruanas S.A., Supermercados Peruanos S.A. and Homecenters Peruanos S.A. In addition, Mr. Saco-Vértiz is a Senior Partner at BBGS Saco-Vértiz & Landerer law firm. Mr. Saco-Vértiz received a law degree from the Pontificia Universidad Católica del Perú and graduated from the Senior Management Program (PAD) of the Universidad de Piura.
Executive Officers
The business address of Interseguro’s executive officers is Av. Javier Prado Este No. 492. office No. 2601, San Isidro, Lima 27, Peru. The following table sets forth certain information about Interseguro’s executive officers.
Name
Position
Year of Birth
Year Appointed
Gonzalo José Basadre Brazzini
Chief Executive Officer
1970
2012
Juan Carlos Motta Flores
Vice President, Operations
1963
2011
Claudia Maria Delgado Ehni
Vice President, Legal, Administration and Finance
1978
2023
Luciana Camila Olaechea Cadenillas
Vice President, Human Development
1977
2020
Percy Rolando Chávez Castillo
Vice President, Commercial
1971
2020
Ian Scofield Rodriguez- Arnaiz
Vice President, Mass Insurance, Digital and Analytics
1985
2022
Armando Vidal Gastañaga
Vice President, Investment
1983
2022
Sergio Jhasmany Soliz Bilbao
Vice President, Information Technology
1985
2022
183
Gonzalo José Basadre Brazzini, See “Item 6. Directors, Senior Management and Employees—Directors and Senior Management—General—Executive Officers”.
Juan Carlos Motta Flores has served as Interseguro’s Vice President of Operations and Actuarial Studies since 2011. Before joining Interseguro, he was the Chief Executive Officer at Penta Seguros de Vida-Penta Hipotecario in Chile for 10 years, and previously he worked as Technical Manager at Consorcio Nacional de Seguros S.A., also in Chile. Mr. Motta holds a bachelor’s degree in economics and a master’s degree in economics from Universidad Católica de Chile.
Claudia Maria Delgado Ehni has served as Interseguro’s Vice President of Legal, Administration and Finance since 2023. Prior to joining Interseguro, she was the Executive Director of Finance at Credicorp Capital. She holds a bachelor’s degree in economy from the Universidad del Pacifico and a master’s degree in business administration from Harvard Business School.
Luciana Camila Olaechea Cadenillas hasserved as Interseguro’s Human Development Vice President since March 2020. Previously, Mrs. Olaechea served as Interseguro’s Human Development Manager from April 2019 to February 2020. Before joining Interseguro, she served as Manager of Consulting in Management and Human Development, Human Development Manager of Digital Transformation, and Human Development Manager for Retail Banking at Banco de Crédito del Perú, where she remained for 11 years. Mrs. Olaechea holds a bachelor’s degree in psychology from the Universidad de Lima, and a master’s degree in human behavior from the Universidad de Ciencias Aplicadas.
Percy Rolando Chávez Castillo has served as Interseguro’s Commercial Vice President since November 2020. Before his appointment as Vice President, Mr. Chávez worked as an Annuities Division Manager of Interseguro. He previously served as Territorial Manager of the Commercial Banking Division at Banbif and Regional Manager for the provincial stores division at Interbank. Mr. Chávez holds a bachelor’s degree in economics from Universidad Nacional de la Plata in Argentina and a master’s degree in marketing intelligence from Escuela Superior de Gestión Comercial y Marketing in Spain.
Ian Scofield Rodriguez- Arnaiz has served as Interseguro’s Vice President, Mass Insurance, Digital and Analytics since August 2022. Before his appointment as Vice President, Mr. Scofield worked as Commercial Manager of Rímac Seguros. He had previously served as Insurance Manager at Banco Ripley and Commercial Division Manager at BNP Paribas Cardif. Mr. Scofield holds a bachelor's degree in Economics from Florida International University and a master’s degree in business administration from IE Business School.
Armando Vidal Gastañaga has served as Interseguro’s Vice President of Investments since August 2022. Before joining Interseguro, he held the position of Regional Head of Credit at SURA Investment Management. He also held the position of General Manager at Fondos Sura, and Investment Manager at AFP Integra. He holds a bachelor’s degree in economics from Universidad del Pacífico, and a master’s degree in business administration from IE Business School.
Sergio Jhasmany Soliz Bilbao has served as Interseguro’s Vice President of Technology and Information since August 2022. Before joining Interseguro, Mr. Soliz served as Data & Digital Manager at Hipermercados Tottus Perú & Chile. He also served as Digital Manager at Belcorp Corporation and Head of Information Technology at Belcorp Chile. Mr. Soliz holds a bachelor's degree in Systems Engineering from Universidad Catolica Boliviana and a master's degree in Software Engineering from Universidad Autónoma Gabriel Rene Moreno.
Inteligo
Board of Directors
Inteligo’s board of directors consists of five members, none of whom are independent. The business address of Inteligo’s board of directors is Calle 50 con Elvira Méndez, Piso 48 (P.H. Tower Financial Center), Panama City, Panama. The following table sets forth certain information about Inteligo’s directors as of the date of this Annual Report on Form 20-F.
Name
Position
Year of Birth
Year Appointed
Roberto Hoyle McCallum
Chairman
1949
2014
Carlos Tomás Rodríguez-Pastor Persivale
Director
1959
2007
Ramón José Vicente Barúa Alzamora
Secretary
1946
2006
Fernando Zavala Lombardi
Vice President
1971
2019
Luis Felipe Castellanos
Director
1970
2019
Reynaldo Roisenvit Grancelli
Treasurer
1969
2020
184
The following sets forth selected biographical information for each of the members of Inteligo’s board of directors.
Roberto Hoyle McCallum has served as Chairman of Inteligo Group since February 2014. He also serves as Chairman of Inteligo Bank Ltd., Chairman of Instituto Cultural Peruano Norteamericano (ICPNA), Director of inPeru, Director of Vida Peru, former director and member of the executive committee of Cámara de Comercio de Lima, former Chairman of the Bolsa de Valores de Lima, former Chairman of inPeru and former member of the Executive Committee of FIAB (Federación Iberoamericana de Bolsas). Mr. Hoyle has over 55 years of experience in international banking. He received a bachelor’s degree in business administration and completed the Management Executive Program and the executive master’s degree in business administration of the Universidad de Piura.
Carlos Tomás Rodríguez-Pastor Persivale, See “Item 6. Directors, Senior Management and Employees—Directors and Senior Management—General—Board of Directors”.
Ramón José Vicente Barúa Alzamora, See “Item 6. Directors, Senior Management and Employees—Directors and Senior Management—Interbank–Board of Directors”.
Fernando Zavala Lombardi, See “Item 6. Directors, Senior Management and Employees—Directors and Senior Management—General—Board of Directors”.
Luis Felipe Castellanos, See “Item 6. Directors, Senior Management and Employees—Directors and Senior Management—General—General–Executive Officers.”
Reynaldo Roisenvit Grancelli has served as Inteligo Group’s Treasurer since 2020. He also serves as Inteligo USA’s sole Director and Director of Inteligo Bank since 2005. Mr. Roisenvit is also member of the Investment Committee of Interseguro and member of various committees, including Corporate Governance Committees, of Inteligo Bank. He previously served as director of the Lima Stock Exchange, Chief Executive Officer of Inteligo Group, Inteligo Bank and Inteligo SAB, Deputy Chief Executive Officer of Inteligo SAB, Chief of Research of Interfip Bolsa, Chief Executive Officer of Interfip Bolsa, Products Manager of Private Banking at Interbank and Portfolio Manager of Global Investment Advisory Group at the Compass Group, in New York. Mr. Roisenvit received a bachelor’s degree in economics from the Universidad de Lima and a master’s degree in business administration from Columbia Business School.
Executive Officers
The business address of Inteligo’s executive officers is Calle 50 con Elvira Méndez, Piso 48 (P.H. Tower Financial Center), Panama City, Panama. The following table sets forth certain information about Inteligo’s executive officers.
Name
Position
Date of Birth
Year Appointed
Bruno Ferreccio Del Río(1)
Chief Executive Officer
1976
2024
Victor Vinatea Cámere
Chief Operations Officer
1962
2017
Gianina Gotuzzo Oliva
General Counsel
1975
2017
Daniel Yagui Yoshimoto
Chief Financial Officer
1980
2020
(1)
Reynaldo Roisenvit Grancelli was Chief Executive Officer until October 2024.
Bruno Ferreccio Del Río has served as Inteligo Group´s Chief Executive Officer since October 2024. He also has served as Inteligo Bank’s Chief Executive Officer since May 2019. Previously, he served as Inteligo SAB´s Chief Executive Officer since July 2019 until September 2021 and as Deputy Chief Executive Officer of Inteligo SAB since April 2017, and before that as Chief Commercial Officer since December 2015. In addition, he served as Inteligo’s Chief Financial Officer and as Inteligo SAB’s Financial Vice President since April 2014. Before joining Inteligo in June 2010 as Inteligo SAB’s Financial Manager and Chief of Products, Mr. Ferreccio was the Vice President of Futures and Derivates in Commodities at AAKOP LLC in New York, and Resident Engineer of HV S.A. CONTRATISTAS in Peru. He received a bachelor’s degree in civil engineering from the University of Texas, Austin, a master’s degree in business administration from the University of Michigan and completed the General Management Program at Harvard Business School.
Victor Vinatea Cámere has served as Inteligo’s Chief Operations Officer since 2017. Mr. Vinatea has more than 30 years of banking experience. Before joining Inteligo, Mr. Vinatea held management positions in commercial and retail banking as well as in operations at different banking institutions in Peru. He has been director of La Fiduciaria and Intertítulos. Mr. Vinatea received a degree in business administration from ESAN and holds a master’s degree in business administration in Direction from INCAE and Universidad Adolfo Ibañez and has participated in international seminars related to banking at Harvard Business School.
185
Gianina Gotuzzo Oliva has served as Inteligo SAB’s General Counsel since 2016 and Inteligo’s General Counsel since 2017. She has also served as General Counsel of InRetail Perú Corp. and Legal Counsel of Intercorp Peru from 2010 to 2016. Mrs. Gotuzzo was previously a Senior Associate of Hernández & Cía. Mrs. Gotuzzo was a professor of corporate law at Pontificia Universidad Católica del Peru for seven years, where she received her law degree in 1999. Mrs. Gotuzzo holds an LL.M. from Cornell University and was admitted to the New York Bar in 2002.
Daniel Yagui Yoshimoto has served as Chief Executive Officer of Inteligo SAB and Inteligo Peru Holdings S.A.C. since September 2021. He also serves as Chief Financial Officer of Inteligo since August 17, 2020. He has over sixteen years of professional experience in multinational companies, including 10 years of experience in financial departments within several industries such as financial services, retail and consumer products, and over five years of experience leading business consulting projects performed in top companies in Peru, Argentina and Colombia. Mr. Yagui holds a master’s degree in finance from Universidad Torcuato Di Tella in Argentina and a master’s degree in business administration from Universidad Adolfo Ibáñez in Chile.
B.
Compensation
Our articles of incorporation provide that our shareholders are responsible for determining the compensation to be paid to members of our board. Some of our executive officers are also executive officers in our subsidiaries, and receive compensation for their services from such subsidiaries. Consistent with applicable law, we do not disclose to our shareholders, or otherwise make public, information regarding the individual compensation of our board members or executive officers, or of the board members or executive officers of our subsidiaries. For the year ended December 31, 2024, the aggregate annual compensation to our board members and to board members of our subsidiaries totaled S/3.5 million. For the year ended December 31, 2024, the aggregate annual compensation to our executive officers and executive officers of our subsidiaries totaled S/32.0 million.
For the year ended December 31, 2024, no amounts were set aside or accrued by us to provide pension, retirement or similar benefits for our directors and officers. None of our directors or any of the directors of our subsidiaries have entered into any service contracts with our company or our subsidiaries providing for benefits upon termination of their employment. As of the year ended December 31, 2024, neither we nor our subsidiaries have adopted any executive long-term incentive plan, while Interbank has a retention bonus program for some of its executive officers.
Clawback policy
On November 8, 2023, IFS’ Board of Directors approved a clawback policy (the “Clawback Policy”), included as an exhibit hereto (see “Item 19. Exhibits.”), in accordance with the applicable provisions of The New York Stock Exchange Listed Company Manual. Pursuant to the Clawback Policy, IFS shall recover, subject to certain exceptions, erroneously awarded compensations received by current or former executive officers of IFS (as determined by IFS’ Board of Directors) in the event IFS is required to prepare an accounting restatement due to IFS’ material noncompliance with any financial reporting requirement under the securities laws in the United States of America. The Clawback Policy became effective on December 1, 2023.
C.
Board Practices
Our board of directors and the board of directors at each of our subsidiaries (Interbank, Interseguro, Inteligo and PMP) is responsible for establishing an appropriate and integrated risk management system and for promoting an internal environment that facilitates the board of directors’ supervision and risk management control. The board of directors is informed from time to time on the degree of exposure of the diverse risks managed by each subsidiary and inherent to their businesses.
The boards of directors of Interbank, Interseguro, Inteligo Bank and PMP have created several specialized committees to which they have delegated specific tasks in order to enhance risk management and internal control. We list below the main committees established by the boards of directors of our subsidiaries.
For more information on board practices, see “Item 6.A. Directors, Senior Management and Employees—Directors and Senior Management—General.”
Audit Committee
Our audit committee is fully independent and complies with the criteria set forth under our “Audit Committee Charter” (as amended from time to time) the rules of the NYSE and Rule 10A-3(b)(1) of the Exchange Act, each as applicable to foreign private issuers. Our audit committee consists of three directors, all of whom are financially literate and one of whom is a financial expert. The current members of our audit committee are Guillermo Martínez Barros, Felipe Federico Roy Morris Guerinoni and Lucía Cayetana Aljovín Gazzani.
186
Felipe Federico Roy Morris Guerinoni, Guillermo Martínez Barros and Lucía Cayetana Aljovín Gazzani meet the requirements for independence under the listing standards of the NYSE and SEC rules and regulations. In addition, Felipe Federico Roy Morris Guerinoni is a financial expert in accordance with NYSE rules. Our audit committee oversees our corporate accounting and financial reporting process. The audit committee is responsible for:
•
reviewing our financial statements;
•
evaluating our internal controls and procedures, and identifying deficiencies;
•
the appointment of our external auditors, determining their compensation, retention and oversight, and resolving any disagreement that may arise between management and our external auditors;
•
evaluating the Company’s compliance with the Board of Director’s internal regulation, as well as with general principles of corporate governance;
•
informing our board of directors regarding any issues that arise with respect to the quality or integrity of our financial statements, our compliance with legal or regulatory requirements, the performance and independence of the external auditors, or the performance of the internal audit function;
•
establishing procedures for the reception, retention and treatment of complaints regarding accounting, internal controls or other auditing matters, including the confidential, anonymous submission by our employees of concerns regarding questionable accounting or auditing matters;
•
independently engaging its own counsel and any other advisers it deems necessary to fulfill its functions; and
•
establishing policies and procedures to pre-approve audit and permissible non-audit services.
At our segments level, some of our subsidiaries have their own Audit Committee.
At Interbank, the Audit Committee was established in March 2000. According to SBS regulations, the Audit Committee must be comprised of at least three board members who do not hold executive positions, one of whom must be an independent member, who will be designated as its president.
Pursuant to SBS regulations, the Interbank Audit Committee is responsible for reviewing compliance with the internal auditing program, informing the board of directors about compliance with internal policies and procedures and the internal auditing program and informing the board of directors about any action taken to correct any situation that is not in compliance with the internal auditing program. In addition, the Interbank Audit Committee is responsible for defining the criteria for selection and hiring of the external auditors, evaluating their performance and coordinating on an ongoing basis with the external auditors any matters relating to the internal auditing program. The Interbank Audit Committee also is responsible for defining the criteria for selection and hiring of the manager of the internal audit division, proposing his appointment and dismissal to the Board of Directors.
In the case of Inteligo Bank, the Audit Committee supervises that the internal control system is well documented with the policies, processes and procedures, as well as the administration of information and management of resources, to guaranty that they are aligned with the applicable laws and regulations to achieve Inteligo Bank’s objectives. Inteligo Bank’s Audit Committee is composed by four members, three of them belong to the Board of Directors and do not hold executive positions in the company. Also, one of them is an independent director.
In the case of Interseguro, the principal purpose of the Internal Audit Committee is to monitor that the accounting processes and financial reporting are appropriate. Besides, the Internal Audit Committee evaluates the activities carried out by the internal and external auditors of the company. The members of the Audit Committee are appointed by the Board of Directors and must have the necessary knowledge and experience to perform their duties. This committee is composed of at least three members of the Board of Directors who do not hold executive positions in the company.
Other Committees
Comprehensive Risk Management Committee and Risk Committee
At Interbank, the Integral Risk Management Committee is a corporate body created by resolution of the board of directors. It is responsible for approving the policies and organization of the comprehensive risk management system, as well as any amendments to said policies. The Integral Risk Management Committee defines the risk appetite and level of tolerance that Interbank is willing to take in its business and the actions needed to implement the required corrective measures necessary to maintain adequate
187
levels of risk tolerance. The Integral Risk Management Committee is comprised of (i) up to six members of the board of directors, out of which three are directors and up to three are alternate directors; and, (ii) the Chief Executive Officer and the Vice-Presidents. The committee reports monthly to the board of directors the main issues it has discussed and the agreements adopted in the previous meeting.
In the case of Inteligo Bank, the Integral Risk Management Committee is comprised of at least two members of the board of directors, one of which must be independent (as defined pursuant to the Bahamian regulation), who oversees the Committee. Other members are the Chief Executive Officer of the Panamanian Branch, the Finance Manager, the Legal Manager and the Corporate Risk Officer. The Committee reports quarterly to the board of directors the main issues it has discussed and the agreements adopted in the previous meeting.
Instead of an Integral Risk Management Committee, Interseguro has a Risk Committee, which is a corporate body created by resolution of the board of directors, and is responsible for defining risk limits for Interseguro’s business, approving risk policies and approving required corrective measures necessary to maintain adequate levels of risk tolerance. The Risk Committee is comprised of four board members, the Chief Executive Officer and the Risk Manager.
Assets and Liabilities Committee
The Assets and Liabilities Committee (the “ALCO”) is a corporate body created by resolution of the board of directors of Interbank and Inteligo. In the case of Interbank, the ALCO is comprised exclusively of officers.
At Interbank, the ALCO’s main purpose is to manage the structure of Interbank’s financial position considering its profitability and risk targets. The ALCO is also responsible for the proposition of new products or operations that contain components of market risk. Additionally, it serves as the communication channel with units that generate market risks. The ALCO meets monthly and is comprised of the Chief Executive Officer, the Chief Financial Officer, the Executive Vice Presidents of Risks Management, Commercial Banking, Operations and Technology, Retail Banking and Channels, and Capital Markets and the Manager of Treasury/Position Desk.
Inteligo Bank holds positions that are not actively traded, but are part of its assets and liabilities. These positions include a loan portfolio, customer deposits and bank loans. These positions are also exposed to interest rate risk, exchange rate risk and liquidity risk. The main purpose of the ALCO at Inteligo Bank is to manage its financial position, considering its profitability and risk targets. The ALCO meets quarterly and is comprised of at least two board members, one of whom must be independent (as defined pursuant to Bahamian regulations), the Chief Executive Officer of the Panamanian Branch, Finance Manager, Legal Manager and the Corporate Risk Officer.
At Interseguro, the functions of the ALCO committee are assumed by the Investment Committee.
Investment and Fiduciary Committee
The Investment Committee of Interseguro is responsible for approving the limits of each security or real estate which could be included in Interseguro’s investment portfolio. This Committee is comprised of several members of the board, the Chief Executive Officer and the Investment-Vice President. The Risk Manager also participates as an advisor.
Inteligo Bank created an Investment Committee in 2017. The Committee is responsible for reviewing and approving the strategy of Inteligo Bank’s investment portfolio and approving new investment products. The Committee meets quarterly and is comprised of one board member, the Chief Executive Officer, the Chief Executive Officer of the Panamanian Branch, the Chief Financial Officer and the Corporate Risk Officer. Recently, the name of such committee at Inteligo Bank changed to Investment and Fiduciary Committee, to guarantee that the activities related to advisory, administration and investment management of the clients’ assets are conducted pursuant to Inteligo Bank’s policies and regulations.
Internal Audit
At our segments level, the Internal Audit Division reports to the board of directors at each subsidiary. It supports the Company in meeting its objectives through the application of a systemic and disciplined approach to assess and enhance the efficiency of its governance processes, risk management and control processes.
188
D.
Employees
IFS
As of December 31, 2024, IFS had no employees. However, its operations are carried out by employees from its subsidiaries and affiliates.
Interbank
As of December 31, 2024, Interbank had 6,328 employees, 1,805 work in financial stores and 4,523 work at the headquarters and in operational centers of Interbank. Of the total employees, 3,045 are dedicated to sales force. We have been optimizing our distributional channels and have reduced full time employees at financial stores. Interbank’s employees are not unionized, are not a party to any collective bargaining agreement and since Interbank’s privatization in 1994, have never been involved in a strike or work stoppage.
Interseguro
As of December 31, 2024, Interseguro had a total of 1,274 employees, which included officers and administrative staff, as well as sales agents and representatives. Interseguro’s employees are not unionized, are not a party to any collective bargaining agreement and have never been involved in a strike or work stoppage.
Interseguro provides its employees with benefits that exceed the requirements of Peruvian labor laws, including school allowance, specialized training programs, general health base plan and oncology plan, each covered at 100%. Interseguro also provides wellness programs for its employees, as well as a full portfolio of development, family inclusion, and social programs.
Inteligo
As of December 31, 2024, Inteligo and its subsidiaries had 353 employees, which included officers and administrative staff, as well as commercial representatives. Inteligo’s senior management is located in Peru and Panama. Inteligo’s and its subsidiaries’ employees are not unionized, are not a party to any collective bargaining agreement and have never been involved in a strike or work stoppage.
E.
Share Ownership
Except as described under “Item 7. Major Shareholders and Related Party Transactions—Major shareholders”, none of our directors or senior management beneficially owns our common shares other than two directors and one executive officer of IFS, who owned an aggregate 0.05% interest in IFS as of December 31, 2024. As of the date of this Annual Report on Form 20-F, one director and one executive officer of IFS held an aggregate 0.03% interest in IFS.
We do not have any arrangements for involving employees in our capital, including any arrangements that involve the issue or grant of options of our shares or securities.
F.
Disclosure of a Registrant’s Action to Recover Erroneously Awarded Compensation
Not applicable.
ITEM 7. MAJOR SHAREHOLDERS AND RELATED PARTY TRANSACTIONS
A.
Major Shareholders
Our only outstanding equity securities are our common shares. As of December 31, 2024, IFS had issued 115,447,705 common shares (including treasury stock), of which 64,958,266 were registered in CAVALI and 50,489,439 were registered in DTC. As of December 31, 2024, 14,632 common shares registered in CAVALI were held by 15 U.S. citizens and/or residents in the United States.
The following table sets forth certain information regarding the ownership of outstanding shares as of April 4, 2025 for the following:
•
each person or entity who is known by us to own beneficially more than 5% of our outstanding shares capital or voting rights;
189
•
our directors and members of our executive management group, as a group.
Common Shares Owned
Shareholders
Number of Shares
Percentage owned
Intercorp Perú Ltd.(1)(2)
81,507,547
70.6
%
Other Directors and Officers(3)
32,810
0.0
%
Treasury stock
3,503,924
3.0
%
Float
30,403,424
26.3
%
Total
115,447,705
100.0
%
(1)
International Financial Holdings Group Inc. (“IFH”), representing 77.3% of the voting rights to appoint the majority of the members of the board of directors of Intercorp Peru, has entered into an irrevocable proxy agreement (the “Irrevocable Proxy Agreement”) appointing Carlos Tomás Rodriguez-Pastor Persivale and two members of his family (the “Agents”) as IFH’s agents, acting by majority vote, with respect to any matters relating to IFH’s ownership interest in Intercorp Peru. The initial period of the Irrevocable Proxy Agreement was two years commencing in June 2019 automatically renewable for six-month periods unless otherwise terminated upon 90 days’ notice. On May 23, 2023, the Irrevocable Proxy was renewed and ratified with effectiveness as of June 12, 2023 under the same terms originally agreed, including automatic renewals for six-month periods unless otherwise terminated upon 90 days’ notice. The renewed Irrevocable Proxy is valid for a two-year period counted from June 12, 2023. As of the date of this Annual Report on Form 20-F, the Irrevocable Proxy Agreement had not been terminated.
(2)
IFH Capital Corp. and Intercorp Capital Investments Inc. are the record holders of 9,747,706 and 9,747,707, respectively, of our common shares, or 8.44% each, and are both wholly-owned subsidiaries of Intercorp Peru and therefore Intercorp Peru beneficially owns their shares.
(3)
Excluding Carlos Tomás Rodriguez-Pastor Persivale.
There have been no significant changes in the percentage ownership held by our major shareholders over the past three years.
As of December 31, 2024, IFS and its subsidiaries held 2,159,248 common shares in treasury stock. For more details regarding these shares, see “Item 16E – Purchases of Equity Securities by the Issuer and Affiliated Purchasers” and Note 16(b) to our audited annual consolidated financial statements.
B.
Related Party Transactions
In the ordinary course of business, we and our subsidiaries, Interbank, Interseguro, Inteligo and Izipay, engage in a variety of transactions among ourselves and with certain of our affiliates and related parties. All material transactions between us or our subsidiaries and our other affiliates or related parties are evaluated by our senior management and our board in accordance with specific regulations and internal rules applicable to all third-party transactions. These transactions are subject to prevailing market conditions and transfer pricing regulations.
Interbank extends loans to related parties, including its executive officers and directors and executive officers and directors of our affiliates, in accordance with Peruvian law and regulations established by the SBS. According to the SBS, loans to related parties cannot be made on more favorable terms than those offered to the public, with the exception of mortgage loans granted to workers for housing purposes. As a result, all related-party loans have been made in the ordinary course of business, on an arm’s-length basis and on substantially the same terms, including with respect to interest rates and collateral, as those prevailing at the time for comparable transactions offered to the public. In addition, related-party loans do not involve greater collection risk nor present other features unfavorable to Interbank as compared to loans offered to the public.
Peruvian law and SBS regulations also set forth limitations on the amount of credit loans that may be extended to related parties based on Article 201 and Article 202 of the Peruvian Banking and Insurance Law. The law currently establishes that the total amount of loans to be extended to directors, employees and close relatives of any such persons may not exceed 7.0% of the bank’s regulatory capital. All loans extended to any director or employee of the company (including close relatives of such person) may not exceed 0.35% of the regulatory capital (i.e., 5.0% of the overall 7.0% limit discussed above) per each person, including such person’s spouse and relatives.
190
In addition, under current Article 202 of the Peruvian Banking and Insurance Law, no loans extended to related parties or affiliates may exceed 30.0% of a bank’s regulatory capital. Under these laws, related-party borrowers include any corporation holding, directly or indirectly, 4.0% or more of a bank’s shares, such bank’s directors, certain of its principal executive officers or other persons affiliated with such bank’s management or any individual or entity that is deemed to have a significant influence in its operations. However, pursuant to Legislative Decree N° 1646, as of June 2025, the total amount of financing (whether in the form of loans, investments, contingent financing or other modalities) to be extended to directors, employees and close relatives of any such persons may not exceed 10.0% of the bank’s Tier 1 Regulatory Capital. In addition, pursuant to Legislative Decree N° 1646, as of June 2025, no financing extended to related parties or affiliates may exceed 25.0% of a bank’s Tier 1 Regulatory Capital. Furthermore, the meaning of “related party borrowers” for purposes of this section, will be extended to any entity that is part of the bank’s economic group and any person that is deemed to have a significant influence in the operations of any member of the bank’s economic group.
Peruvian regulations also set forth limits on the investments of insurance companies with any member of its economic group. Pursuant to SBS regulations, the aggregate amount of investments that Interseguro may have with any member of its economic group cannot exceed 7.0% of its technical obligations, being that any excess will be considered as non-eligible investment.
Furthermore, under Peruvian law, board members and executive officers of Interbank and Interseguro, may not (i) receive loans (in money or goods) from the company unless approved by the board of directors, (ii) use for their own benefit, the company’s assets, services or credits unless approved by the board of directors, (iii) disclose or use, inappropriately, for their own benefit, privileged information, and (iv) participate in any corporate decision that presents a conflict of interest with the company. In all cases, the execution of agreements that involve at least 5.0% of the assets of the company with persons or entities related to directors, managers or shareholders that own, directly or indirectly, more than 10.0% of the share capital requires the prior authorization of the board of directors (with no participation of the director(s) involved in the transaction, if any). In addition, the execution of agreements with a party controlled by the company’s controlling shareholder requires the prior authorization of the board of directors and an evaluation of the terms of the transaction by an external independent company (audit companies or other evaluator to be determined by the SMV).
During 2024, 2023 and 2022, IFS’s directors, officers and key management had been involved, directly and indirectly, in credit transactions with certain subsidiaries of IFS, as permitted by applicable Peruvian laws and regulations that regulate and limit certain transactions with employees, directors and officers of financial entities. As of December 31, 2024, 2023 and 2022, direct loans by IFS or its subsidiaries to employees, directors, officers, and key management of IFS and its subsidiaries amounted to S/235.2 million, S/209.7 million and S/211.7 million, respectively. These loans are current and accrue interest at market rates. Payment dates vary, and may be monthly, quarterly, or at maturity. See “Item 4. Information on the Company—Business Overview—Regulation and Supervision” for information on the regulation of IFS and its subsidiaries and on the protection of deposits.
Inteligo Bank is operating pursuant to its original license, which commencing in 2020 permits a related party exposure of up to 15% of its capital, a decrease from the prior 25% maximum. As of December 31, 2024, the exposure was 6.24%.
For additional information about loans, including tabular disclosure, to, and certain other transactions with, related parties and affiliates including directors and officers, see Note 26 to our audited annual consolidated financial statements.
In the normal course of our operations, related party transactions are evaluated in accordance with Peruvian banking and securities regulations, as described in this section. These transactions are subject to prevailing market conditions and transfer pricing regulations. We and our subsidiaries have a number of such transactions with our parent company, subsidiaries of our parent company, affiliates pursuant to the criteria of the SBS and other related parties. See “Presentation of Financial Information” for a brief description of a number of these parties. For additional information including tabular disclosure, about loans, to, and certain other transactions with, related parties and affiliates including directors and officers, see Note 26 to our audited annual consolidated financial statements.
IFS
Bonds in InRetail Shopping Malls.
Since September 20, 2019, IFS holds S/39.0 million in bonds of InRetail Shopping Malls. The annual interest rate for these bonds is 7.88% and they mature on July 25, 2034.
Interbank
Lease Agreement between Interbank and Supermercados Peruanos, S.A. (“Supermercados Peruanos”)
During 2020, Interbank entered into a lease agreement with Supermercados Peruanos under which Supermercados Peruanos granted Interbank the right to use supermarket space for the operation of their stores (Money Markets format) and ATMs for
191
a term of five years. Under the terms of the agreement, Supermercados Peruanos agreed to grant an area of 2,000 square meters of floor space for the first three years of the agreement and 1,800 square meters of floor space for the following two years.
In January 2024, an amendment to the agreement was entered into to reduce the rented area from February 2023 to September 2023 to 1,637.05 square meters of floor space, and to 1,599.55 square meters of floor space from October 2023 until the end of the agreement. As of December 31, 2024, Interbank was in the process of negotiating a new amendment to the lease agreement to extend the term until October 1, 2029.
The agreed monthly rent is as follows: (i) for stores located inside the premises (Money Markets format) the rent is S/302.93 per square meter plus taxes, (ii) for stores located outside the premises, the rent is S/201.55 per square meter plus taxes, (iii) for ATMs located inside the premises, the rent is S/2,198.70 plus taxes; and (iv) for ATMs located outside the premises, the rent is S/1,587.95 plus taxes.
In addition, Interbank has made a security deposit of U.S.$0.9 million (approximately S/3.4 million), which shall be applied as a guarantee of payment of the monthly rent. Additionally, Supermercados Peruanos has granted us an exclusivity right for the operation of stores (Money Market format) and for ATMs located inside the supermarket premises. As of December 31, 2024, we are operating under this agreement in 26 stores (Money Market format) and with 104 ATMs located inside the supermarket premises.
Loan Agreement between Interbank and GTP Inversionistas S.A.C.
In May 2017, Interbank has entered into a loan agreement with GTP Inversionistas S.A.C., an affiliate, pursuant to the criteria of the SBS, under which Interbank disbursed to the latter U.S.$32.6 million for the indirect acquisition of 24.95% of the capital stock of Universidad Tecnológica del Perú S.A.C. (“UTP”). The loan was granted for a term of five years to be repaid in five annual payments with an effective annual interest rate of 7.875%. The collateral granted consisted of a pledge agreement of 24.95% of the capital stock of UTP. In May 2020, the loan agreement was amended, increasing the remaining term to seven years. As of December 31, 2024, the total outstanding debt under the loan agreement amounts to S/54.9 million (U.S.$14.6 million), excluding interest.
In September 2023, Interbank entered into a new medium-term loan agreement with GTP Inversionistas S.A.C. under which we granted a loan for up to S/113 million to be paid in 8 annual installments at an annual interest rate of 10.7%. The total outstanding debt as of December 31, 2024 under the loan agreement amounts to S/106.3 million (U.S.$28.3 million), excluding interest.
Lease Agreements with Supermercados Peruanos
Interbank has entered into several lease agreements with Supermercados Peruanos, a subsidiary of Intercorp Peru, whereby Interbank leased real estate property, machinery and equipment to Supermercados Peruanos. These lease agreements are amended from time to time, most recently in March 2021. As of December 31, 2024, the outstanding debt under the lease agreements amounts to S/85 million, excluding interest.
Loan Agreement with Supermercados Peruanos
On September 27, 2018, Interbank entered into a medium-term loan agreement with Supermercados Peruanos under which Interbank granted a loan for up to S/95.0 million to be paid in 28 installments at a monthly interest rate of 5.85%. In October 2019, the loan agreement was amended increasing its amount to S/198.0 million, excluding interest. In March 2021, the interest rate was reduced to 3.99% to be paid on a quarterly basis and the due date was extended to February 2026.
In September 2022, Interbank entered into a new medium-term loan agreement with Supermercados Peruanos under which Interbank granted a loan for up to S/100 million to be paid in 18 installments at an annual interest rate of 7.99%. In addition, in the ordinary course of business, Interbank provides Supermercados Peruanos with short-term credit through factoring, short-term notes, and credit card financing.
The total outstanding debt as of December 31, 2024 under the loan agreement amounts to S/62.5 million (U.S.$16.6 million), excluding interest.
Lease Agreements with Homecenters Peruanos (“HPSA”)
Interbank has entered into several lease agreements with HPSA, a subsidiary of Intercorp Peru, whereby Interbank leased machinery and equipment to HPSA. As of December 31, 2024, the total outstanding debt under such lease agreements amounts to S/30.9 million, excluding interest.
192
Loan Agreements with HPSA
In November 2019, Interbank entered into a term loan agreement with HPSA, a subsidiary of Intercorp Peru, for S/24.3 million at annual interest rate of 5.30%. As of December 31, 2024, the total outstanding debt under such loan agreement amounts to S/11.7 million, excluding interest.
In September 2022, Interbank and HPSA entered into a new medium – term loan agreement for S/80 million at an annual interest rate of 8.55%. In September 2023, the loan agreement was amended to reschedule the total outstanding debt of S/67.0 million, at an annual interest rate of 9.45% to be paid on a quarterly basis, and the due date was extended to September 2029. As of December 31, 2024, the total outstanding debt amounts to S/55.9 million.
Loan Agreement with InRetail Pharma
Interbank has entered into a syndicated secured loan agreement with InRetail Pharma, a subsidiary of Intercorp Peru, for up to S/161.9 million due in April 2025. The collateral granted consisted of mortgage over real estate properties and guarantees (fianzas solidarias) granted by several of our subsidiaries. In May 2021, the loan agreement was refinanced by a new syndicated secured loan agreement for up to S/220.0 million due in March 2026. As of December 31, 2024, the total outstanding debt under the loan agreement amounts to S/220.0 million (excluding interest) at an interest rate of 3.75%.
Loan Agreement with UTP
In September 2018, Interbank entered into a loan agreement with UTP, a subsidiary of Intercorp Peru, under which Interbank disbursed S/80.0 million at an interest rate of 6.9%. The loan was granted for a term of seven years, which included a two-year grace period. The collateral consisted of a mortgage over real estate properties and assignment of surface rights. In September 2020, as a result of the spin-off of UTP and IDAT, the loan was split and assigned as follows: S/62.0 million to UTP and S/18.0 million to IDAT. In April 2021, UTP’s loan agreement was amended in order to reduce the interest rate to 4.15% and to extend the term for six years, including one year of grace period. As of December 31, 2024, the amount outstanding under the loan agreement with UTP amounted to S/28.3 million, excluding interest; and the amount outstanding under the loan agreement with IDAT amounted to S/8.2 million, excluding interest.
Loan Agreement with La Tinka
In September 2023, Interbank entered into a new medium-term loan agreement with La Tinka under which Interbank granted a loan for up to S/20 million (U.S.$5.3 million), bullet payment up to 18 months at an annual interest rate of 10.9%.
In December 2024, Interbank entered into a new medium-term loan agreement with La Tinka under which Interbank granted a loan for up to S/20 million (U.S.$5.3 million), bullet payment up to 18 months at an annual interest rate of 8.75%.
Lease Agreement with Centros de Salud Peruanos
In December 2022 Interbank entered into several lease agreements for up to S/112 million with Centros de Salud Peruanos, a subsidiary of Intercorp Peru, by means of which Interbank leased machinery and equipment for the construction of a new clinic located in Cercado de Lima. As of December 31, 2024, the amount outstanding under these lease agreements amounted to S/111.7 million, excluding interest.
In September 2024, we entered into a new medium-term loan agreement with Centros de Salud Peruanos under which we granted a loan for up to S/30 million, bullet payment up to 18 months at an annual interest rate of 7.78%, fully secured by cash collateral.
Loan Agreement with Intercorp Education Holding Corp.
On September 12, 2023, Interbank entered into a medium-term loan agreement with Intercorp Education Holding Corp., a subsidiary of Intercorp Peru, under which we granted a loan for up to U.S.$51.1 million to be paid in 5 annual installments at an annual SOFR rate plus 4.02% due in August 2028. The proceeds of the loan were disbursed to pay the acquisition price of 13.10% of NG Education Holding Corp’s share capital from NG Capital Partner I. The loan is guaranteed by a corporate guaranty granted by Intercorp Peru. As of December 31, 2024, the aggregated amount outstanding under the loan agreement amounted to U.S.$51.1 million, excluding interest.
193
Loan Agreement with NGR Group
In January 2022, Interbank entered into a syndicated secured loan agreement with NGR Group (Alert del Perú, EP de Restaurantes, EP de Franquicias, Nutra, Bembos and Corporación Peruana de Restaurantes) for up to S/107 million due in August 2025 at an annual interest rate of 9.50%. The collateral granted consisted of a trust over cash flows, pledge over shares and guarantees between companies (fianzas solidarias). In February 2024, the loan agreement was amended to include a new tranche for up to S/110 million, due in February 2029 at an annual interest rate of 11.50%. As of December 31, 2024, the total outstanding debt including first and second tranche amounts to S/59.6 million (U.S.$161.1 million).
Interseguro
Agreements with Colegios Peruanos S.A. (“CPSA”)
Trujillo, Peru
In September 2016, Interseguro and CPSA, a subsidiary of Intercorp, signed a usufruct agreement for a period of 20 years, according to which Interseguro granted in usufruct the property located in Trujillo, Peru in favor of CPSA, in order for CPSA to operate a school under the commercial name of “Innova School”. Interseguro constructed the building in four stages all of which were completed in 2019. Currently, CPSA pays Interseguro a monthly rent which amounts to S/133,918 before taxes, adjusted annually by 3% plus 9.1% on the total investment on the property made by Interseguro accumulated on the date incurred.
In April 2022, we amended the agreement to have rent adjusted pursuant to the number of students. For example, the number of students registered in 2022 increased by 11.25%, resulting in S/272,744 plus IGV. Pursuant to the amended agreement, rent due is variable and reviewed annually.
Cusco, Peru
In October 2017, Interseguro and CPSA signed a usufruct agreement for a period of 25 years, according to which Interseguro leased the property located in Cusco, Peru, in order to operate a school under the commercial name of “Innova School”. Interseguro constructed the building, which was completed in January 2018. In April 2018, CPSA began paying Interseguro a monthly rent. The current rent amounts to S/232,288 before taxes, adjusted annually by 3% plus 9.3% on the total investment on the property made by Interseguro accumulated on the date incurred.
In April 2022, we amended the agreement to have rent adjusted pursuant to the number of students. For example, the number of students registered in 2022 increased by 11.25%, resulting in S/473,089 plus IGV. Pursuant to the amended agreement, rent due is variable and reviewed annually.
Other locations
In June 2008, Interseguro bought a certificate of participation in the trust Patrimonio en Fideicomiso D.S 093-2002-EF Interproperties Perú (“Interproperties”), which is managed by Internacional de Titulos Sociedad Titulizadora S.A. (“Intertitulos”), corresponding to a real estate project that was developed in a property located in Ate, Lima, Peru. Also, in October 2012, Interproperties and CPSA signed a surface right agreement, according to which Interproperties granted this property in surface right, in order to operate a school under the commercial name of “Innova Schools”. As of December 31, 2024, the fair value of the property amounts to S/9,764,679.
Agreements with HPSA
In November 2012, HPSA, a subsidiary of Intercorp, and Hebraica Asociación Cultural Deportiva y Social (“Hebraica”) signed a surface right agreement according to which Hebraica granted a surface right in favor of HPSA over the commercial space with an area of 13,401.99 m², located in Ate, Lima. In October 2015, HPSA assigned its contractual position to Interseguro. In April 2016, Interseguro and HPSA entered into a 30-year usufruct agreement, according to which HPSA was granted in usufruct the property, in order to operate a home improvement store under the commercial name of “Promart”. Since 2022, Interseguro has not been a party to either the surface right agreement or the usufruct agreement.
In July 2017, HPSA and Interseguro signed a surface right agreement and an usufruct agreement granting surface and usufruct rights to Interseguro over certain commercial space located in Ica, Perú. In July 2022, HPSA and Interseguro terminated the surface right agreement and the usufruct agreement.
194
In October 2015, Interseguro contributed in trust the property located in Talara, Piura, Peru in favor of Interproperties, which is managed by Intertitulos. Accordingly, Intertitulos issued in favor of Interseguro a certificate of participation representing 100% of the property ownership. In addition, in October 2015, Interproperties Perú and HPSA signed a usufruct agreement for a period of 30 years, according to which Interproperties granted in usufruct this property, in order to operate a home improvement store under the commercial name of “Promart”. As of December 31, 2024, the fair value of the property amounts to S/10,776,084. In February 2021, Interproperties returned the property in favor of Interseguro, cancelling the certificate of participation for the amount of S/40.2 million, which represented Interseguro’s contribution to the trust assets. The current monthly rent amounts to S/121,658.46 before taxes.
Agreements with UTP
In June 2018, Interseguro and UTP signed a usufruct agreement for a period of 30 years, according to which Interseguro granted in usufruct to UTP the property located in Ate, Lima, Peru, for it to operate a university campus under the commercial name of “UTP”. The annual rent is equivalent to 8.5% of the total investment before taxes which is adjusted annually according to CPI variation and paid to Interseguro in four quarterly installments.
In November 2019, Interseguro and UTP signed a usufruct agreement for a period of 30 years, according to which Interseguro granted in usufruct to UTP the property located in Nuevo Chimbote, Ancash, Peru, for it to operate a university campus under the commercial name of “UTP”. The current annual rent paid to Interseguro amounts to S/1,170,023 before taxes, adjusted annually according to CPI variation.
In April 2020, Interseguro and UTP signed a usufruct agreement for a period of 30 years, pursuant to which Interseguro granted in usufruct to UTP the property located in Piura, Peru, for it to operate a university campus under the commercial name of “UTP”. Since March 2021, the UTP building in Piura has been operating. The current quarterly rent paid to Interseguro amounts to S/2,176,828 before taxes, adjusted annually according to CPI variation.
Agreements with Supermercados Peruanos
In October 2015, Interseguro contributed in trust the property located in Talara, Piura, Peru in favor of Interproperties, which is managed by Intertitulos. Accordingly, Intertitulos issued in favor of Interseguro a certificate of participation representing 100% of the property ownership. In addition, in January 2016, Interproperties and Supermercados Peruanos signed a usufruct agreement for a period of 30 years, according to which Interproperties granted in usufruct to Supermercados Peruanos this property of 5,573 m2, for it to operate a supermarket under the commercial name of “Plaza Vea”. In February 2021, Interproperties returned the property in favor of Interseguro, cancelling the certificate of participation for the amount of S/40.2 million, which represented Interseguro’s contribution to the trust assets. As of December 31, 2024, the fair value of the property amounts to S/10,990,709 and the current monthly rent amounts to S/139,883.76 before taxes.
In July 2022, Supermercados Peruanos assigned its contractual position in the usufruct agreement in favor of its affiliated Compañia Food Retail S.A.C.
In June 2023, Supermercados Peruanos and Interseguro signed a purchase and sale contract for the land located in Calle Bolognesi N° 110-150, Avenida Jose Pardo N° 715, Miraflores, Lima, Peru. The purchase price paid by Interseguro amounted to U.S.$10.0 million.
In June 2023, Supermercados Peruanossigned a purchase and sale contract for a future asset, Commercial Premises and 76 parking spaces for the property located in in Calle Bolognesi N° 110-150, Avenida Jose Pardo N° 715, Miraflores, Lima, Peru. The price for the transfer of ownership of the Properties amounted to S/14,294,436.76.
C.
Interests of Experts and Counsel
Not Applicable.
ITEM 8. FINANCIAL INFORMATION
A.
Consolidated Statements and Other Financial Information
See “Item 17. Financial Statements.”
195
Legal Proceedings
IFS is not involved in any legal or arbitration proceedings which could have a material adverse effect on its financial position.
Interbank is involved in certain legal proceedings in the ordinary course of its banking activities. Interbank is also a party to legal proceedings related to labor disputes with former employees and tax disputes with the tax authority. For more information on the tax disputes, see Note 17 to our audited annual consolidated financial statements appearing elsewhere in this Annual Report on Form 20-F.
Interseguro is routinely involved in legal or arbitration proceedings with respect to liabilities that are the subject of policy claims. These liabilities are taken into account in setting Interseguro’s technical reserves.
Inteligo Bank has been involved in legal proceedings in the ordinary course of its banking operations.
The two main lawsuits that Inteligo Bank has been a party to jointly sought the return of certain amounts in redemption payments received by Inteligo Bank in connection with investments in Fairfield Sentry Limited, a fund that was primarily invested in Bernard L. Madoff Investment Securities LLC.
On February 24, 2025, Inteligo Bank signed individual settlement agreements and both claimants have dismissed the claims related to the lawsuits described above.
Dividends and Dividends Policy
We are a holding company and, as such, our ability to pay dividends is subject to the ability of our subsidiaries to pay dividends to us.
Our annual dividend is proposed by our board of directors and approved at our annual ordinary meeting of shareholders, in accordance with our dividend policy which for year 2025 consists of distributing to shareholders at least 20% of any profit earned for the relevant year, subject to regulatory capitalization requirements and our financial condition. Dividends are paid to shareholders who held common shares as of the record date preceding the date set for payment of the dividend. The shares go ex-dividend two business days prior to the record date. Dividends are declared and paid in U.S. dollars.
IFS’ ordinary dividends for the fiscal years ended December 31, 2024, 2023 and 2022 were U.S.$115.4 million (S/420.1 million), U.S.$115.4 million (S/427.4 million) and U.S.$136.2 million (S/511.8 million). Dividends corresponding to fiscal year 2024 will be paid in early May 2025; dividends for fiscal year 2023 were paid in April 2024 and dividends for fiscal year 2022 were paid in April 2023. Dividend per share amounted to U.S.$1.00 for fiscal years 2024 and 2023, and U.S.$1.18 for fiscal year 2022.
Interbank
Interbank’s dividends are proposed annually by its board of directors and are subject to approval by the general shareholders’ meeting. On November 10, 2020, the shareholder’s meeting amended the dividend policy as follows: At least 20% of the distributable profits of Interbank recorded in the fiscal year shall be distributed among the shareholders, provided that the following rules are observed: (a) the profit capitalization commitment agreements adopted by the general shareholders’ meeting or by the board of directors (as delegated by the shareholders’ meeting), are not affected, (b) both the legal requirements applicable to Interbank and its appetite for equity growth are satisfied, in accordance with the board of directors’ proposal, and (c) the board of directors deems such distribution to be advisable based on the economic and financial conditions of Interbank and the business environment. In accordance with the foregoing, if during any year any of the aforementioned rules is not satisfied, the general shareholders’ meeting may agree to distribute a lower percentage of dividends than indicated or decide not to distribute dividends for such year. Any dividends would be distributed within sixty calendar days following their declaration and approval at the general shareholders’ meeting. For the fiscal year ended 2024, Interbank declared as dividends approximately 50% of its distributable income (net income minus the required legal reserves which may be up to 10% of net profit). For the fiscal year ended 2023, Interbank declared as dividends approximately 50% of its distributable income (net income minus the required legal reserves which may be up to 10% of net profit). For the fiscal year ended 2022, Interbank declared and distributed as dividends approximately 56% of its distributable income (net income minus the required legal reserves which may be up to 10% of net profit).
Dividends are declared based on Interbank’s financial statements prepared under SBS GAAP. The following table shows Interbank’s distribution of net profit for the three fiscal years ended December 31, 2024, 2023 and 2022 under SBS GAAP.
196
For the fiscal years ended December 31,
2024
2023
2022
(S/ in millions)
Net profit
933.7
900.5
1,171.7
Reserves
93.4
89.9
117.2
Capitalized earnings
420.2
403.4
468.7
Dividends
420.2
405.2
585.8
Interseguro
Interseguro’s dividends are proposed annually by its board of directors and are subject to approval by the general shareholders’ meeting. Current dividend policy establishes that Interseguro pays at least 20% of its net profits attained in any given year as dividends. Dividend distributions depend on several factors, including (1) approval by Interseguro’s shareholders of the proposal to distribute dividends, (2) Interseguro’s earnings, (3) protection of Interseguro’s equity growth, (4) capital and legal reserve requirements, and (5) prevailing market conditions.
The following table shows Interseguro’s distribution of net profit for the three fiscal years ended December 31, 2024, 2023 and 2022 under SBS GAAP.
For the fiscal years ended December 31,
2024
2023
2022
(S/ in millions)
Net profit
376.3
315.1
202.8
Reserves
13.0
13.0
—
Capitalized earnings(1)
37.0
37.0
—
Dividends
125.0
150.0
100.0
(1)
Includes capitalization of earnings net of accumulated losses.
Inteligo
Inteligo Bank’s dividends are proposed annually by its board of directors and are subject to approval by the general shareholders’ meeting. Dividend distributions depend on several factors, including (1) approval by Inteligo’s shareholders of the proposal to distribute dividends, (2) Inteligo Bank’s earnings, (3) Inteligo Bank’s capital expenditure program, and (4) prevailing market conditions.
The following table shows Inteligo Bank’s distribution of net profit and dividends for the three fiscal years ended December 31, 2024, 2023 and 2022 under IFRS Accounting Standards.
For the fiscal years ended December 31,
2024
2023
2022
(S/ in millions)
Net profit
117.8
28.2
(135.1
)
Dividends
82.4
27.8
—
For additional information regarding risks that could materially adversely affect our ability to pay dividends, see “Item 3. Key Information—Risk Factors—Risks Relating to Our Business—We are a holding company, and all of our operations are conducted by our subsidiaries. Our ability to pay dividends to holders of our common shares depends on the ability of our subsidiaries to pay dividends to us”.
For additional information regarding taxation of dividends, see “Item 10. Additional Information—Taxation—Peruvian Tax Considerations” and “Item 10. Additional Information—Taxation—United States Federal Income Tax Considerations—Distributions”.
For additional information regarding risks that could materially adversely affect our ability to pay dividends, see “Item 3. Key Information—Risk Factors—Risks Relating to Our Business—We are a holding company, and all of our operations are conducted by our subsidiaries. Our ability to pay dividends to holders of our common shares depends on the ability of our subsidiaries to pay dividends to us”.
197
For additional information regarding taxation of dividends, see “Item 10. Additional Information—Taxation—Peruvian Tax Considerations” and “Item 10. Additional Information—Taxation—United States Federal Income Tax Considerations—Distributions”.
B.
Significant Changes
No significant changes in our financial condition have occurred since the date of the most recent audited consolidated financial statements included in this Annual Report on Form 20-F.
ITEM 9. THE OFFER AND LISTING
A.
Offer and Listing Details
Our Shares
Our common shares are registered in the Public Registry of Securities held with the SMV and are listed on the Lima Stock Exchange and on the NYSE under the symbol “IFS”.
B.
Plan of Distribution
Not Applicable.
C.
Markets
Trading in the Peruvian Securities Market
Lima Stock Exchange
As of December 31, 2024, there were 256 companies listed on the Lima Stock Exchange. Established in 1970, the Lima Stock Exchange is Peru’s only securities exchange.
Trading on the Lima Stock Exchange is primarily done on an electronic trading system that became operational in August 1995. From the first Sunday of November through the second Sunday of March of each year, trading hours are Monday through Friday (except holidays) as follows: 9:00 a.m.–9:30 a.m. (pre-market ordering); 9:30 a.m.–3:52 p.m. (trading); 3:52 p.m.–4:00 p.m. (after-market sales); and 4:02 p.m.–4:10 p.m. (after-market trading). At all other times, trading hours are from Monday to Friday (except holidays) as follows: 8:20 a.m.-8:30 a.m. (pre-market ordering); 8:30 a.m.–2:52 p.m. (trading); 2:52 p.m.–3:00 p.m. (after-market sales); and 3:02 p.m.–3:10 p.m. (after-market trading).
Substantially all of the transactions on the Lima Stock Exchange are traded on the electronic system. Transactions during the electronic sessions are executed through brokerage firms and stockbrokers on behalf of their clients. The orders must specify the type of security as well as the amount and price of the proposed sale or purchase. The exchange is authorized to halt the trading of certain securities or the whole market, under certain circumstances, for example, when a significant fluctuation occurs with the price of a security, without apparent justification. In this case, the exchange may impose a 15-minute halt, which may be extended depending on the nature of the event.
Moreover, under the exchange’s market margin rule, when the market price for a particular security reaches a 15% variation (vis a vis the last closing price or proposal, whichever is higher), trading on that particular security is halted for the rest of the session. The exchange may exceptionally authorize further negotiation. The market margin rule is not applicable for securities cross-listed in certain markets, including the United States.
Certain information regarding trading on the Lima Stock Exchange is set forth in the table below:
(S/ in millions)
2020
2021
2022
2023
2024
Market capitalization(1)
599,007
591,734
540,366
657,589
695,136
Volume
20,107
21,803
14,243
8,405
23,445
Average daily trading volume
79
87
56
33
94
Source: Bolsa de Valores de Lima Annual Reports
End-of-period figures for trading on the Lima Stock Exchange.
198
D.
Selling Shareholders
Not Applicable.
E.
Dilution
Not Applicable.
F.
Expenses of the Issue
Not Applicable.
ITEM 10. ADDITIONAL INFORMATION
A.
Share Capital
As of December 31, 2024, our authorized capital consists of 150,000,000 common shares, and our issued capital stock consists of 115,447,705 outstanding common shares (including treasury stock), with no par value. As of December 31, 2024, IFS and its subsidiaries held 2,159,248 common shares in treasury stock, with book value of S/206.9 million. All of our common shares are fully paid and non-assessable. Non-residents of Panama may hold and vote shares.
B.
Memorandum and Articles of Association
The information under the heading “Description of Common Shares” except for the information under the subheading “—General;” in Amendment No. 1 to our Registration Statement on Form F-1 (333-232554) filed on July 15, 2019 is incorporated herein by reference. There have been no changes to the Company’s Articles, as reflected in the Company’s financial statements.
C.
Material Contracts
The following is a brief summary of our current material contracts. A copy of each of these contracts has been included as exhibit hereto. See “Item 19. Exhibits.”
Irrevocable Proxy Agreement
IFH, representing 77.3% of the voting rights to appoint the majority of the members of the board of directors of Intercorp Peru, has entered into an irrevocable proxy agreement on June 12, 2019 (the “Irrevocable Proxy Agreement”) appointing Carlos Tomás Rodriguez-Pastor Persivale and two members of his family (the “Agents”) as IFH’s agents, acting by majority vote, with respect to any matters relating to IFH’s ownership interest in Intercorp Peru. The initial period of the Irrevocable Proxy Agreement was two years commencing in June 2019 automatically renewable for six-month periods unless otherwise terminated upon 90 days’ notice. On May 20, 2021, the Irrevocable Proxy was renewed and ratified with effectiveness as of June 12, 2021 under the same terms originally agreed, including automatic renewals for six-month periods unless otherwise terminated upon 90 days’ notice. On May 23, 2023, the Irrevocable Proxy was renewed and ratified with effectiveness as of June 12, 2023 under the same terms originally agreed, including automatic renewals for six-month periods unless otherwise terminated upon 90 days’ notice. The renewed Irrevocable Proxy is valid for a two-year period counted from June 12, 2023. As of the date of this Annual Report on Form 20-F, the Irrevocable Proxy Agreement had not been terminated. “Item 7. Major Shareholders and Related Party Transactions—Major Shareholders.”
IFS Indenture
On October 19, 2017 we entered into an indenture among us, The Bank of New York Mellon, as trustee, and The Bank of New York Mellon SA/NV, Luxembourg Branch, as Luxembourg transfer and paying agent in connection with the issuance of U.S.$300,000,000 aggregate principal amount of 4.125% senior notes due 2027. The use of proceeds was to fund the acquisition of 100% of the capital stock of Seguros Sura S.A. and Hipotecaria Sura Empresa Administradora Hipotecaria S.A. See “Item 5. Operating and Financial Review and Prospects—Liquidity and Capital Resources.”
D.
Exchange Controls
The Peruvian sol is freely traded in the exchange market. Current Peruvian regulations on foreign investment allow foreign equity holders of Peruvian companies to receive and repatriate 100% of the cash dividends distributed by these companies, except for restrictions applicable to companies that have been convicted or have admitted to and/or acknowledged committing crimes against the Peruvian public administration or money laundering or committing equivalent crimes, as set forth in Law No. 30737 (A
199
law that ensures the immediate payment of the compensation to the State in cases of corruption and other crimes), which restricts the transfer of both local and foreign currency abroad. Non-Peruvian equity holders are allowed to purchase foreign currency at free market currency rates through any member of the Peruvian banking system and transfer such foreign currency outside Peru without restriction. Peruvian law in the past, however, has imposed restrictions on the conversion of Peruvian currency and the transfer of funds abroad, and we cannot assure holders of our common shares that Peruvian law will continue to permit such payments, transfers, conversions or remittances without restrictions. In addition, under Panamanian law, there are currently no exchange control restrictions imposed on payments made in U.S. dollars. There can be no assurance, however, that Peruvian and Panamanian laws will continue to permit such payments, transfers, conversions or remittances without restrictions.
E.
Taxation
The following discussion summarizes the material Peruvian, U.S. federal and Panamanian income tax consequences of acquiring, holding and disposing of our shares.
This discussion is not a comprehensive discussion of all the tax considerations that may be relevant to a decision to purchase our shares and is not applicable to all categories of investors, some of which may be subject to special rules, and does not specifically address all of the Peruvian, U.S. federal and Panamanian income tax considerations applicable to any particular holder. It is based upon the tax laws of Peru, the United States and Panama as in effect on the date of this Annual Report on Form 20-F, which are subject to change, possibly with retroactive effect, and to differing interpretations. Holders of our common shares are urged to consult its independent tax advisor about the particular Peruvian, U.S. federal and Panamanian income tax consequences to it of an investment in our shares.
Peruvian Tax Considerations
The following summary of certain Peruvian tax matters as in force on the date of this Annual Report on Form 20-F describes the principal tax consequences of an investment in our common shares or the beneficial interest therein by non-Peruvian shareholders. This summary is not intended to be a comprehensive description of all of the tax considerations that may be relevant to a decision to make an investment in our common shares or the beneficial interest therein. In addition, it does not describe any tax consequences: (i) arising under the laws of any taxing jurisdiction other than Peru or (ii) applicable to anyone different from a non-Peruvian shareholder.
For purposes of this section, “non-Peruvian shareholder” means either: (i) a legal entity which has neither been incorporated nor established in Peru, provided that it does not conduct any trade or business through a permanent establishment in Peru or holds our shares or the beneficial interest therein through a Peruvian branch or (ii) an individual who is not a Peruvian tax resident. For Peruvian tax purposes, an individual is deemed to be a Peruvian tax resident if such individual is (a) a Peruvian citizen who has a regular residence in Peru, or (b) a non-Peruvian citizen who has resided or remained in Peru for more than 183 calendar days during any 12-month period. Any change in the residency condition will be effective as of January 1 of the following calendar year in which such conditions are met.
The discussion in this summary is not intended or written to be used, and cannot be used or relied upon by any person, for the purpose of avoiding Peruvian taxation, and was written to support the promotion or marketing of this offering. Holders of our common shares should consult an independent tax advisor with respect to the Peruvian tax consequences of participating.
Peruvian Income Tax
Payment of Dividends
Dividends paid by legal entities incorporated in Peru are subject to a Peruvian withholding tax at a 5% rate. Our Peruvian subsidiaries are required to act as withholding agents for any income tax due with respect to dividends on their shares. We have not agreed to assume the withholding payments nor pay additional amounts so that the non-Peruvian shareholder of our common shares or the beneficial interest therein receives an amount equal to the sum it would have received had no such deductions or withholdings been made.
We are a company incorporated under the laws of Panama, accordingly, dividends paid on our common shares will not be subject to a Peruvian withholding.
Sale of our common shares
As a general rule, under the current Peruvian income tax laws and regulations, proceeds received by a non-Peruvian shareholder on the sale, exchange or disposition of our common shares will not be subject to any Peruvian withholding or capital gains tax, since our common shares are deemed to be issued by a legal entity not incorporated in Peru.
200
However, capital gains accrued and received by a non-Peruvian shareholder on the sale, exchange or disposition of our common shares will be subject to Peruvian income tax at a 30% rate if such transaction consists of an indirect transfer of shares issued by a Peruvian entity (“Peruvian shares”). An indirect transfer of Peruvian shares takes place in the transfer of the shares of a non-Peruvian entity that owns, directly or indirectly, shares of a Peruvian company provided that the following conditions are met:
(i)
the fair market value of the Peruvian shares, whether owned directly or indirectly by the foreign parent company, is equal to 50% or more of the fair market value of the capital stock issued by the foreign parent entity at any time during the 12-month period prior to the transfer; and,
(ii)
in any 12-month period, 10% or more of the shares issued by the foreign parent company are transferred.
Applicable regulations provide specific rules to determine the fair market value and cost of the shares and the capital stock issued by the foreign parent entity.
There is a rebuttable presumption that both conditions are met if the foreign parent company whose shares are transferred resides in a low-tax, zero-tax or un-cooperative jurisdiction pursuant to Peruvian legislation.
An indirect transfer of Peruvian shares also takes place in the transfer of the shares of a non-Peruvian entity that owns, directly or indirectly, shares of a Peruvian company provided the aggregate amount of the Peruvian shares being indirectly transferred by the transferor and its related parties in any 12-month period reaches or exceeds 40,000 Tax Units (the Tax Unit usually increases from one fiscal year to the next, so for the fiscal year 2024, one Tax Unit equaled to S/5,150, and for the fiscal year 2025, one Tax Unit equals to S/5,350). This rule applies irrespective if conditions (i) and (ii) abovementioned are not met.
A 5% preferential rate would be applicable on capital gains if (i) such shares are registered with the SMV; and (ii) such sale is performed through trading sessions (rueda de bolsa) of the Lima Stock Exchange.
A further tax exemption was applicable to capital gains obtained by individuals, either Peruvian or non-Peruvian, from sales performed through trading sessions (rueda de bolsa) of the Lima Stock Exchange, under certain terms and conditions. This tax exemption expired on December 31, 2023, and no extension has been issued.
Value added tax
Dividends resulting from the shares issued by our Peruvian subsidiaries are not subject to Peruvian Value Added Tax (Impuesto General a las Ventas, or “VAT”).
The sale, exchange or disposition of our common shares or of shares issued by our Peruvian subsidiaries is not subject to VAT.
Financial Transaction Tax
Deposits in and withdrawals from accounts held in Peruvian banks or other financial institutions, whether in soles or foreign currency, are levied with a financial transactions tax (“FTT”) at a 0.005% rate. Therefore, FTT will be levied on the price paid for and the dividends resulting from the shares issued by our Peruvian subsidiaries if deposited in or withdrawn from a Peruvian bank or other financial institution, as the case may be.
United States Federal Income Tax Considerations
The following discussion is a summary of certain material U.S. federal income tax consequences of acquiring, owning and disposing of our common shares. Except where otherwise noted, this discussion applies only to U.S. Holders (as defined below) of our common shares that hold such shares as “capital assets” (generally, property held for investment). This discussion is based on the Internal Revenue Code of 1986, as amended (the “U.S. Code”), its legislative history, existing final, temporary and proposed U.S. Treasury regulations, administrative pronouncements by the Internal Revenue Service (the “IRS”) and judicial decisions, all as of the date hereof and all of which are subject to change (possibly on a retroactive basis) and to different interpretations.
This discussion does not purport to address all U.S. federal income tax consequences that may be relevant to a particular holder and holders are urged to consult their own tax advisors regarding their specific tax situations. The discussion does not address the tax consequences that may be relevant to holders subject to special tax rules, including, for example:
•
insurance companies;
•
tax-exempt organizations;
201
•
dealers in securities or currencies;
•
traders in securities that elect the mark to market method of accounting with respect to their securities holdings;
•
banks or other financial institutions;
•
partnerships or other pass-through entities or arrangements for U.S. federal income tax purposes;
•
U.S. Holders whose functional currency for U.S. federal income tax purposes is not the U.S. dollar;
•
real estate investment trusts or regulated investment companies;
•
persons that, directly or indirectly, hold 10% or more of our stock by vote or value;
•
U.S. expatriates; or
•
persons for whom the common shares may form part of a hedge, straddle, conversion or other integrated transaction.
Further, this discussion does not address the U.S. federal estate and gift tax, the alternative minimum tax, or the Medicare tax on net investment income, or any state, local and non-U.S. tax consequences of acquiring, owning and disposing of the common shares.
As used herein, the term “U.S. Holder” means a beneficial owner of the common shares that is, for U.S. federal income tax purposes:
•
an individual who is a citizen or resident of the United States;
•
a corporation, or any other entity taxable as a corporation, created or organized in or under the laws of the United States, any state thereof or the District of Columbia;
•
an estate the income of which is subject to U.S. federal income tax regardless of its source; or
•
a trust if (i) a court within the United States is able to exercise primary supervision over its administration and one or more U.S. persons have the authority to control all substantial decisions of the trust or (ii) the trust has a valid election in effect under current U.S. Treasury regulations to be treated as a U.S. person.
If a partnership (or any other entity or arrangement treated as a partnership for U.S. federal income tax purposes) holds the common shares, the tax treatment of the partnership and a partner in such partnership generally will depend on the status of the partner and the activities of the partnership. Such partner or partnership should consult its own tax advisor as to its consequences of acquiring, owning and disposing of the common shares.
Except where specifically described below, this discussion assumes that we are not a PFIC for U.S. federal income tax purposes. Please see the discussion under “Item 10. Additional Information—Taxation—United States Federal Income Tax Considerations—Passive Foreign Investment Companies” below.
Distributions
Subject to the discussion below under “Item 10. Additional Information—Taxation—United States Federal Income Tax Considerations—Passive Foreign Investment Companies,” distributions of cash or property (other than our common shares, if any, distributed pro rata to all of our shareholders) paid out of our current or accumulated earnings and profits (as determined for U.S. federal income tax purposes) with respect to our common shares, including the net amount of any tax withheld on the distribution, will be includible in gross income as ordinary dividend income on the date the U.S. Holder actually or constructively receives the distribution in accordance with such holder’s regular method of accounting for U.S. federal income tax purposes. To the extent that the amount of any distribution exceeds our current and accumulated earnings and profits as determined for U.S. federal income tax purposes, such excess amounts will be treated first as a non-taxable return of capital to the extent of such U.S. Holder’s tax basis in our common shares and, thereafter, as capital gain. We do not intend to maintain calculations of our earnings and profits under U.S. federal income tax principles. Unless and until these calculations are made, distributions should be presumed to be taxable dividends for U.S. federal income tax purposes. As used below, the term “dividend” means a distribution that constitutes a dividend for U.S. federal income tax purposes.
202
A dividend paid in a non-U.S. currency will be includible in the gross income of a U.S. Holder in a U.S. dollar amount calculated by reference to the exchange rate in effect on the day the dividend is received by the U.S. Holder, regardless of whether the payment is in fact converted to U.S. dollars. If a dividend paid in a non-U.S. currency is converted into U.S. dollars on the day the dividend is received by the U.S. Holder, the U.S. Holder generally will not be required to recognize foreign currency gain or loss in respect of the dividend income. Any gain or loss resulting from currency exchange fluctuations during the period from the date the dividend payment is included in the gross income of a U.S. Holder through the date such non-U.S. currency is converted into U.S. dollars (or otherwise disposed of) generally will be treated as U.S. source ordinary income or loss. U.S. Holders should consult their own tax advisors regarding the treatment of foreign currency exchange gain or loss, if any, with respect to non-U.S. currency received by the U.S. Holder which is not converted into U.S. dollars on the date of receipt.
Dividends paid to corporate U.S. Holders with respect to our common shares will not be eligible for the dividends received deduction allowed to corporations under the U.S. Code. Dividends received by certain non-corporate U.S. Holders with respect to the common shares will be subject to U.S. federal income tax at preferential rates if the dividends constitute “qualified dividend income” for U.S. federal income tax purposes. Dividends paid on the common shares will be treated as qualified dividend income if (i) the common shares are readily tradable on an established securities market in the United States, (ii) the U.S. Holder satisfies certain holding period and other requirements and (iii) we were not, in the year prior to the year in which the dividend is paid, and are not, in the year in which the dividend is paid, a PFIC.
Our common shares are listed on the NYSE, and therefore we expect that the common shares should qualify as readily tradable on an established securities market in the United States.
Moreover, as discussed below under “Item 10. Additional Information—Taxation—United States Federal Income Tax Considerations—Passive Foreign Investment Companies,” we believe that we will not be treated as a PFIC for U.S. federal income tax purposes with respect to our 2024 and current taxable years, and we do not anticipate becoming a PFIC in the future. However, there can be no assurance in this regard because the PFIC determination is made annually and is based on the portion of our assets (including goodwill) and income that is characterized as passive under the PFIC rules and our continued qualification for an exception to the PFIC rules for certain foreign banks and insurance companies.
Subject to generally applicable limitations and conditions under the U.S. Code (including a minimum holding period requirement), any non-U.S. income tax withheld from dividends may be treated as a foreign income tax eligible for credit against a U.S. Holder’s U.S. federal income tax liability. Dividends paid on our common shares generally will constitute foreign source income, and for purposes of calculating the foreign tax credit, as “passive category income,” for most U.S. Holders. Alternatively, a U.S. Holder may be able to deduct foreign income taxes paid with respect to dividends on our common shares against its taxable income, assuming such U.S. Holder does not take a credit for any foreign income taxes paid or accrued during the taxable year and certain other conditions are met. U.S. Holders should consult their own advisors concerning the implications of these rules in light of their particular circumstances.
Sale, Exchange or Other Taxable Disposition of our Common Shares
Subject to the discussion below under “Item 10. Additional Information—Taxation—United States Federal Income Tax Considerations—Passive Foreign Investment Companies,” gain or loss realized by a U.S. Holder on the sale, exchange or other taxable disposition of our common shares generally will be capital gain or loss and generally will be long-term capital gain or loss if our common shares have been held for more than one year. The amount of gain or loss realized will be the difference between (i) the amount realized on the sale, exchange or other taxable disposition of our common shares over (ii) the U.S. Holder’s adjusted tax basis in such common shares, in each case determined in U.S. dollars. A U.S. Holder’s adjusted tax basis in a common share generally will equal the cost of the common share to the U.S. Holder. Long-term capital gain realized by certain U.S. Holders (including individuals) generally is eligible for favorable rates of U.S. federal income tax. The deductibility of capital losses is subject to significant limitations under the U.S. Code.
Any gain or loss realized by a U.S. Holder on a sale, exchange or other taxable disposition of our common shares generally will be treated as U.S. source income or loss for U.S. foreign tax credit purposes. Subject to certain generally applicable limitations (including a minimum holding period requirement), any Peruvian, Panamanian or other foreign tax withheld with respect to the sale, exchange or other taxable disposition of our common shares may be treated as foreign taxes eligible for credit against a U.S. Holder’s U.S. federal income tax liability. These generally applicable restrictions and conditions include new requirements adopted in U.S. Treasury regulations promulgated in December 2021, and subject to the discussion below, there can be no assurance that any taxes imposed by a non-U.S. jurisdiction will satisfy these requirements. A recent notice from the IRS provides temporary relief from such U.S. Treasury regulations by allowing taxpayers to apply a modified version of the U.S. Treasury regulations for taxable years ending before the date that a notice or other guidance withdrawing or modifying the temporary relief is issued (or any later date specified in such notice or other guidance), provided that the taxpayer consistently applies such modified version of the U.S. Treasury regulations and complies with specific requirements set forth in a previous notice. In the case of a U.S. Holder that
203
consistently elects to apply the modified version of the U.S. Treasury regulations in the manner described in the preceding sentence, any foreign tax on the sale, exchange or other taxable disposition of our common shares generally will qualify as a creditable tax. In the case of all other U.S. Holders, the application of these requirements to any foreign tax on the sale, exchange or other taxable disposition of our common shares is uncertain and we have not determined whether these requirements have been met. If the foreign tax is not a creditable tax for a U.S. Holder or the U.S. Holder does not elect to claim a foreign tax credit for any foreign income taxes, the U.S. Holder may be able to deduct such foreign tax in computing the U.S. Holder’s taxable income for U.S. federal income tax purposes, subject to applicable limitations and requirements. The rules relating to U.S. foreign tax credits are extremely complex and U.S. Holders should consult their own tax advisors regarding the application of the foreign tax credit limitation rules to their investment in, and disposition of, our common shares.
Passive Foreign Investment Companies
U.S. Holders should carefully consider the discussion below regarding our potential treatment as a PFIC for U.S. federal income tax purposes.
In general, if, during any taxable year of a non-U.S. corporation, 75% or more of the corporation’s gross income consists of certain types of “passive income,” or the average value during the taxable year of the “passive assets” of the corporation (generally, assets that produce or are held for the production of passive income) is 50% or more of the average value of all of its assets, the corporation will be classified as a PFIC under U.S. federal income tax law. Passive income for this purpose generally, among other things, includes interest, dividends, royalties, rents and gains from commodities and securities transactions. Certain exceptions are provided, however, for passive income derived in the conduct of an active business.
The PFIC provisions also contain a look-through rule under which a non-U.S. corporation shall be treated as if it received directly its proportionate share of the income and as if it held its proportionate share of the assets of any other corporation in which it owns at least 25% of the value of the stock. Under the look-through rule, we should be deemed to own a proportionate share of the assets and to have received a proportionate share of the income of our principal subsidiaries, including Interbank, Interseguro and Inteligo Bank, for purposes of the PFIC determination. As noted below, the assets and income of Interbank, Interseguro and Inteligo Bank are subject to special rules under the PFIC regime. Further, the PFIC test is performed on an annual basis and it is therefore possible that our PFIC status may change from year to year due to changes in income or asset composition.
Assets and Income of Interbank and Inteligo Bank under the PFIC Rules
The application of the PFIC rules to banks is unclear under present U.S. federal income tax law. Banks generally derive a substantial part of their income from assets that are interest-bearing or that otherwise could be considered passive assets under the PFIC rules. The IRS has issued a notice and has proposed U.S. Treasury regulations that exclude from passive income any income derived in the active conduct of a banking business by a qualifying foreign bank (the “active bank exception”). The IRS notice and proposed U.S. Treasury regulations have different requirements for qualifying as a foreign bank, and for determining the banking income that may be excluded from passive income under the active bank exception. Moreover, the proposed U.S. Treasury regulations have been outstanding since 1995 and may not be finalized in their current form. Our PFIC status may be impacted if and when these U.S. Treasury regulations are finalized.
Because final U.S. Treasury regulations have not been issued and because the notice and the proposed U.S. Treasury regulations are inconsistent in certain respects, Interbank’s, Inteligo Bank’s and (as a result) our status under the PFIC rules is subject to uncertainty. While Interbank and Inteligo Bank conduct, and intend to continue to conduct, a significant banking business, there can be no assurance that they will satisfy the specific requirements for the active bank exception under either the IRS notice or the proposed U.S. Treasury regulations. It is therefore possible that a significant portion of the assets and income of Interbank or Inteligo Bank may be treated as passive.
Assets and Income of Interseguro under the PFIC Rules
While passive income generally includes interest, dividends, annuities and other investment income, the PFIC rules provide that income “derived in the active conduct of an insurance business by a qualifying insurance corporation” is not treated as passive income. A qualifying insurance corporation is a foreign corporation (i) which would be taxable as an insurance company if it were a U.S. corporation and (ii) the applicable insurance liabilities of which constitute more than 25% of its total assets, as determined for financial reporting purposes. Additionally, if a corporation meets the first prong of this test, but not the second, a U.S. Holder can still elect to treat the corporation as a qualifying insurance company if at least 10% of its assets are applicable insurance liabilities and it meets certain alternative facts and circumstances tests. Under these tests, the corporation must be predominantly engaged in an insurance business and the failure to meet the 25% test described above must be due solely to run-off related or rating-related circumstances involving such insurance business. Proposed U.S. Treasury regulations were issued in 2019 that provide guidance about the definitions of “active conduct” and “insurance business.” The proposed regulations were withdrawn in part and subsequent U.S.
204
Treasury regulations were proposed in 2020 that provide explanation of the active insurance income exception as modified under changes to the U.S. Code as a result of the Tax Cuts and Jobs Act of 2017. We expect, for purposes of the PFIC rules, that Interseguro will meet the requirements to be considered a qualifying insurance corporation. No assurance can be provided, however, that changes in Interseguro’s business operations or in the application of U.S. federal income tax law, including the finalization of the proposed U.S. Treasury regulations, will not affect the ability of Interseguro to qualify for the active insurance income exception.
Consequences of PFIC Status
Although the matter is not free from doubt, based on our current expectations regarding our subsidiaries meeting the PFIC exceptions discussed above, the value and nature of the assets of our subsidiaries, the sources and nature of the income of our subsidiaries, relevant market and shareholder data and our current business plans, we believe that we will not be treated as a PFIC for U.S. federal income tax purposes with respect to our 2024 and current taxable years and we do not anticipate becoming a PFIC in the future. If we are classified as a PFIC for any taxable year during which a U.S. Holder holds our common shares, such a U.S. Holder would be subject to special rules (and may be subject to increased tax liability) with respect to (a) any gain realized on the sale or other disposition of our common shares, and (b) any “excess distribution” made by us to the U.S. Holder (generally, any distribution during a taxable year in which distributions to the U.S. Holder on our common shares exceed 125% of the average annual distributions the U.S. Holder received on the shares during the preceding three taxable years or, if shorter, the U.S. Holder’s holding period for the shares). Under those rules, (a) the gain or excess distribution would be allocated ratably over the U.S. Holder’s holding period for our common shares, (b) the amount allocated to the taxable year in which the gain or excess distribution is realized and to taxable years before the first year in which we became a PFIC would be taxable as ordinary income, (c) the amount allocated to each prior year in which we were a PFIC would be subject to U.S. federal income tax at the highest tax rate in effect for that year and (d) the interest charge generally applicable to underpayments of U.S. federal income tax would be imposed in respect of the tax attributable to each prior year in which we were a PFIC. In addition, in the event that we are classified as a PFIC, similar rules would apply to “excess distributions” or gains with respect to subsidiary PFICs held directly or indirectly by us (“Lower-tier PFICs”), even if the proceeds are not distributed to our shareholders. A U.S. Holder generally will be required to file IRS Form 8621 if it holds our common shares in any year in which we are classified as a PFIC.
A U.S. Holder may be able to mitigate these tax consequences by electing mark to market treatment for its common shares, provided the relevant shares constitute “marketable stock” as defined in U.S. Treasury regulations. Our shares will be “marketable stock” if they are “regularly traded” on a “qualified exchange or other market” within the meaning of the U.S. Treasury regulations. Our common shares are listed on the NYSE, and therefore we expect that our common shares should qualify as regularly traded on a qualified exchange or other market. No assurance can be given, however, that our common shares will be considered regularly traded on a qualified exchange or other market. A U.S. Holder electing the mark to market regime generally would, during any year in which we are treated as a PFIC, compute gain or loss at the end of such year as if the shares had been sold at fair value. Any gain recognized by the U.S. Holder under the mark to market election, including on an actual sale, would be treated as ordinary income, and the U.S. Holder would be allowed an ordinary deduction for any decrease in the value of shares as of the end of any taxable year and for any loss recognized on an actual sale, but only to the extent, in each case, of previously included mark to market income not offset by previously deducted decreases in value. Any loss on an actual sale of shares would be a capital loss to the extent in excess of previously included mark to market income not offset by previously deducted decreases in value. A U.S. Holder’s tax basis in shares would increase or decrease by gain or loss taken into account under the mark to market regime.
A mark to market election under the PFIC rules applies to all future years of an electing U.S. Holder during which the shares are regularly traded on a qualifying exchange or other market, unless revoked with the IRS’s consent. A mark to market election under the PFIC rules with respect to shares would not apply to a Lower-tier PFIC, and a U.S. Holder would not be able to make such a mark to market election in respect of its indirect ownership interest in that Lower-tier PFIC. Consequently, U.S. Holders of shares could be subject to the PFIC rules with respect to income of the Lower-Tier PFIC the value of which already had been taken into account indirectly via mark to market adjustments.
A U.S. Holder may in certain circumstances mitigate the adverse tax consequences of the PFIC rules by filing an election to treat the PFIC as a qualified electing fund (“QEF”). However, in the event that we are or become a PFIC, we do not intend to comply with the reporting requirements necessary to permit U.S. Holders to elect to treat us as a QEF.
Backup Withholding and Information Reporting
Dividends paid on, and proceeds from the sale or other disposition of, our common shares that are paid to a U.S. Holder generally will be subject to the information reporting requirements of the U.S. Code and may be subject to backup withholding unless the U.S. Holder provides an accurate taxpayer identification number and makes any other required certification or otherwise establishes an exemption. Backup withholding is not an additional tax. The amount of any backup withholding from a payment to a U.S. Holder will be allowed as a credit against the U.S. Holder’s U.S. federal income tax liability and may entitle the U.S. Holder to a refund, provided that certain required information is timely furnished to the IRS.
205
In addition, U.S. Holders may be required to comply with certain reporting requirements, including filing an IRS Form 8938, Statement of Specified Foreign Financial Assets, with respect to the holding of certain foreign financial assets, including stock of foreign issuers, either directly or through certain foreign financial institutions, if the aggregate value of all such assets exceeds U.S.$50,000. U.S. Holders should consult their own tax advisors regarding the application of the information reporting rules to our common shares and the application of these reporting requirements to their particular situations.
HOLDERS OF OUR COMMON SHARES SHOULD CONSULT THEIR OWN TAX ADVISORS AS TO THE U.S. FEDERAL INCOME AND OTHER TAX CONSEQUENCES OF THE ACQUISITION, OWNERSHIP AND DISPOSITION OF OUR COMMON SHARES, INCLUDING, IN PARTICULAR, THE EFFECT OF ANY NON-U.S. STATE OR LOCAL TAX LAWS.
Panamanian Taxation
The following is a summary of the principal Panamanian income tax consequences resulting from the beneficial ownership and disposition of our common shares by certain persons. This summary is based on the Panamanian Tax Code of 1956, as amended, other applicable tax laws, decrees and regulations issued thereunder, and judicial and administrative interpretations thereof, all as in effect on the date hereof, and is subject to any changes in these or other laws, decrees, regulations and interpretations occurring after such date, possibly with retroactive effect. This summary is intended as a descriptive summary only and is not a complete analysis or listing of all potential Panamanian income tax consequences to purchasers of our common shares. The summary does not address the tax treatment of potential purchasers that may be subject to special income tax and withholding rules. The summary is not intended as tax advice to any particular person, nor does it purport to furnish information on the level of detail or with attention to a purchaser’s specific tax circumstances that would be provided by a purchaser’s own tax advisor. Holders of our common shares are urged to consult their own tax advisors as to the precise Panamanian and other tax consequences of acquiring, owning and disposing of our common shares.
Panamanian Income Tax Structure
Panama’s income tax regime is essentially territorial. Consequently, income tax is levied only upon income or gains derived from income deemed to arise from Panamanian sources, while income not deemed to be Panamanian source income is not subject to Panamanian income taxes.
Taxation of Dividends
In light of the above, dividend income is not subject to income tax in Panama if the profits to which the dividends relate are not Panamanian source income. Moreover, further distributions of dividend income received by the direct shareholders of a Panamanian company to such direct shareholders’ own shareholders are not subject to income tax in Panama. Accordingly, because we are a holding company that does not perform income generating activities in Panama and our income is generated exclusively from activities outside of Panama, dividend payments made with respect to our common shares would not be subject to income tax or withholding requirements in Panama.
The offering and sale of our common shares and the use of proceeds therefrom herein described will all take place outside of Panama, and we do not intend to place, invest or economically utilize in Panama the proceeds that we will receive upon the issuance and sale of our common shares, or to conduct business activities in Panama.
Taxation of Capital Gains
Under the tax principles set forth above, because we generate income only from foreign or non-Panamanian sources, any capital gains realized by a holder of our common shares on the sale or other disposition thereof will be exempt from income or capital gains tax in Panama.
Stamp and Other Taxes
Because we are a holding company that does not perform income generating activities in Panama and our income is generated exclusively from activities outside of Panama, our common shares, and any document containing an agreement providing for the sale or disposition thereof, are not subject to stamp, registration or similar taxes, unless the respective documents shall be used before the courts or administrative authorities of Panama, in which case the stamp tax shall be paid at that time at a rate of U.S.$0.10 for each U.S.$100.00 or fraction of U.S.$100.00 of the face value of the obligations stated therein.
In light of the above, there are no sales, transfer or inheritance taxes in Panama applicable to the sale or disposition of our common shares.
206
Foreign Investors
Because the gains realized on the sale and disposition of our common shares are not subject to income tax in Panama as indicated above, a person domiciled outside of Panama is not required to file an income tax return in Panama solely by reason of his or her purchase or ownership of our common shares.
F.
Dividends and Paying Agents
Not Applicable.
G.
Statement by Experts
Not Applicable.
H.
Documents on Display
The materials included in this Annual Report on Form 20-F may be downloaded at the SEC’s website: http://www.sec.gov. Additional reports and information about us can be downloaded at the SEC’s website.
I.
Subsidiary Information
Not Applicable.
J.
Annual Report to Security Holders
Not Applicable.
ITEM 11.QUANTITATIVE AND QUALITATIVE DISCLOSURES ABOUT MARKET RISK
For quantitative and qualitative information related to market risk, in addition to the information presented below, see Note 29.2 to our audited consolidated financial statements as of and for the year ended December 31, 2024, 2023 and 2022, appearing elsewhere in this Annual Report on Form 20-F.
RISK MANAGEMENT
Our goal is to attain sustainable long-term growth, through a balance between risk policies and profitability. As a result, our senior management places great emphasis on risk management.
To manage the risks described below, we have a specialized risk management structure, measurement systems and mitigation and remediation processes in place for each of our business segments. We incorporate analytics into our decision-making process and make use of tools and methodologies that allow us to identify and manage risk efficiently.
Banking Segment
Main Types of Risks
The main types of risk inherent in Interbank’s businesses are credit, market, liquidity and operational risk.
•
Credit risk: probability of loss due to inability or lack of willingness to pay by debtors, counterparts or third parties bound by contractual obligations.
•
Market risk: probability of loss in positions on and off-balance sheets derived from variations in market conditions. It generally includes the following risk types: exchange rates, interest rates and prices.
•
Liquidity risk: potential inability to meet contractual and contingent obligations, both on- or off-balance sheet, as they come due.
•
Operational risk: probability of loss due to inadequate processes, personnel and information technology failures, or external events.
To manage the above risks, Interbank has a specialized risk management structure, measurement systems and mitigation and remediation processes. It uses different models and rating tools at the client or product level to manage risks. These tools measure
207
and value the risk with a prospective vision, thus allowing the organization to make better risk decisions in the different stages or life cycle of each loan.
These tools are monitored and validated on an ongoing basis to ensure that appropriate levels of prediction and performance are being maintained and to take corrective action or adjust to the models when needed.
The risk management indicators are reviewed and assessed from time to time to identify possible deviations in risk profile with respect to the established risk appetite and apply timely corrective actions as needed. This information is submitted to the Risk Management Committee monthly and to the board of directors periodically.
Credit Risk
The main risk Interbank must manage is credit risk. To mitigate exposure to credit risk and provide adequate risk coverage, Interbank has established the following measures, among others:
•
policies, procedures, methodologies, models, parameters and expert judgement to identify, measure, control and report credit risk;
•
review and assessment of credit risk through specialized units of risk screening, which are independent from Interbank’s Commercial Division, and which assess credit risk prior to loan approvals or prior to the acquisition of specific investments;
•
timely monitoring and tracking of credit risk and maintenance of pre-defined tolerance levels;
•
compliance with regulatory limits and establishment of internal limits to minimize exposure to debtors and counterparties, such as those related to sector concentration (for loans), by issuer, credit rating and liquidity;
•
procedures for the management of loan guarantees.
Interbank also uses different models and rating tools for each type of client and/or product. Interbank seeks to monitor and review these tools from time to time to ensure that adequate levels of prediction and performance are maintained and if necessary, to adjust or take corrective measures.
Through its policies and procedures, Interbank establishes the patterns and mechanisms needed to prevent excessive risk concentration and maintain a diversified portfolio.
Interbank manages its credit risk by means of three main processes: underwriting, monitoring and recovery. These processes are applied accordingly in different business lines.
The underwriting process is fundamentally based on comprehensive knowledge of the client and their economic activity and evaluating their repayment capacity, solvency and credit history. This process uses risk management methodologies and tools, which measures and assesses the quality of the risk to be granted, based on models and automatic rating systems for the admission of credits.
The monitoring process is used for early detection of credit risk to identify clients with potential risks that would affect their ability to pay which can possibly impact the debtor’s credit development. This process uses an integrated system of alerts, which is used to determine whether immediate actions need to be taken.
Actions include preventative, corrective or follow-up measures. This process utilizes systems, models and guidelines to assess the evolution of the debtor’s detected risks and determine their management for standardization or collection.
The recovery process is carried out through a set of coordinated actions for the appropriate and timely recovery of the loans, which aim to minimize losses in exposures with a high credit risk.
208
Commercial Banking
The following table presents the approval levels required for commercial loan applications at Interbank.
Approval requirement
Amount
Executive required to be present at committee meeting
Minimum quorum
Interbank related companies credit committee
Any transaction with related companies
Two Directors
2
Director credit committee
According to business segment and statistical rating situation Corporate Banking
Two Directors
2
-With updated statistical rating AAA-A greater than U.S.$70,000,000 BBB-B greater than U.S.$60,000,000 CCC-C greater than U.S.$40,000,000
-Without statistical rating updated Greater than U.S.$30,000,000 Medium-sized Banking, Institutional Banking and Real Estate Business Greater than U.S.$30,000,000
Central credit committee
According to business segment and statistical rating situation Corporate Banking
CEO or VP of Payments Ecosystem, VP of Risk Management, and Other VP.
3
-With statistical rating updated AAA-A up to
U.S.$70,000,000 BBB-B up to U.S.$60,000,000
CCC-C up to U.S.$40,000,000
-Without statistical rating updated Up to
U.S.$30,000,000
Medium-sized Banking, Institutional Banking and Real Estate Business Up to U.S.$30,000,000
Executive credit committee
According to business segment and statistical rating situation Corporate Banking
VP of Risk Management, VP Business and Other VP
3
-With statistical rating updated AAA-A: up to U.S.$40,000,000 BBB-B up to U.S.$30,000,000
CCC-C up to U.S.$15,000,000
-Without statistical rating updated Up to U.S.$15,000,000
Medium-sized Banking, Institutional Banking and Real Estate Business Up to U.S.$15,000,000
209
Credit approval is determined by the applicant’s repayment ability, which is defined primarily by their cash flow and credit history. The decision whether or not to approve an extension of credit takes into account the applicant’s economic environment, its ability to meet its obligations, collateral, management and the credit ratings assigned to the applicant by other companies of the financial system.
To rate credit risk within the commercial portfolio, Interbank uses a credit risk management system, the Statistical Rating System. This system measures credit risk by classifying companies based on their expected default probability, without considering the facility’s amount, loan conditions or collateral. The Statistical Rating System is supported by a statistical model that predicts default probability from historical default data, based on the company’s qualitative information, financial performance and internal and external credit behavior. Currently, the system is designed to rate companies from our commercial banking business line with at least S/3.0 million in annual sales.
For government entities or project finance, Interbank uses the Weighted Rating System. This methodology considers six different areas: (1) product, demand and industry; (2) shareholders and management; (3) access to credit; (4) profitability; (5) generation of resources; and (6) solvency. The final rating is the weighted sum of these areas.
In the case of financial institutions, Interbank uses an Expert Judgment Analysis Methodology. This methodology considers aspects such as shareholders, management, profitability, solvency, risk rating information, etc.
The Watchlist System monitors clients that have risk potential that needs to be addressed. Based on internal and external alerts, historical financial data and client behavior and market conditions, clients are classified into one of four categories: (1) surveillance; (2) guarantee (increase collateral), (3) reduce exposure and (4) exit or collect.
The Non-Performing Assets Monitoring System monitors the status of non-performing loans and defines categories and related strategies. This system allows Interbank to evaluate which companies are overdue and are struggling to pay their loans and focus recovery efforts on those loans. The recovery portfolio is divided into rescheduled and refinanced credit, judicial recoveries and restructured credit.
Credit risk management includes strategies related to proper recovery of defaulted loans. Depending on whether the recovery strategy is based upon the client’s cash flow or collateral foreclosure, loans are assigned to the recovery division. This division has two units, special credit and judicial recovery. Judicial recovery may include the sale of recovered or foreclosed assets, which are managed by the asset sales unit that oversees selling these assets.
Small Business Banking
The following table presents the approval levels required for small business banking loan applications by principal amount in U.S. dollars.
Approval levels
Amount(1)
Vice President of Risk Management
Over U.S.
$
272,000
Risk Manager
Up to U.S.
$
272,000
Risk Assistant Manager
Up to U.S.
$
159,400
Zonal Risk Officer
Up to U.S.
$
92,900
Master Risk Analyst
Up to U.S.
$
53,100
Senior Risk Analyst
Up to U.S.
$
39,800
Risk Analyst
Up to U.S.
$
12,700
(1)
Amounts stated in U.S. dollars as of and for the year ended December 31, 2024 have been translated from soles at the exchange rate of S/3.764= U.S. $1.00.
In small business banking, credit approval is determined by the applicant’s credit history and repayment ability, which is in turn determined primarily by the applicant’s cash flow and credit history. Approvals of loans depend on the applicant’s economic conditions, its ability to meet its obligations, collateral, management and the credit ratings assigned by a scoring system applied to new and current clients.
An independent unit is responsible for ensuring proper compliance with risk policies, the methodologies applied in the evaluation of creditors and the performance of scoring models and ensuring that the quality of the portfolio does not exceed risk limits.
210
Interbank has developed specific risk management tools to respond efficiently to new schemes and constraints that arise in the market for small business banking. Interbank refers to these tools as the Small Business Banking Management and Monitoring Process, which consist of:
•
Scoring Small Banking Enterprises: is an analysis tool in the credit evaluation process aimed at reducing risk rates and process times and assigning a score to the credit proposal evaluated.
•
Indebted Customers Methodology Small Business Banking: identifies customers who have high leverage exposure.
•
Field Audit and Monitoring: is used to assess quality by selecting samples of credit loans granted and poor performing portfolios and reviewing supporting documentation, with a final risk report presentation.
During collection of early stage (1-90 days), Interbank uses collection scores that allow Interbank to define the collection strategy: phone collection, text message collection, mail or personal collection.
Recovery in small business banking occurs in two phases. Early collection is based on and supported by admission risk officers for the first 90 days. During this time, a customer in default is contacted and recovery efforts are made in the form of letters, telephone calls and direct negotiations. After the first 90 days, the defaulted loan is transferred to the Recovery Unit.
Retail Banking
The following table presents the approval levels required for retail loan applications by principal amount in U.S. dollars. Approval levels also vary according to product.
Credit Card
Cash Credit
Pay-roll Loans
Loans for Diplomats
With Collateral
Automobile
Mortgage
Amount
Approval Levels(1)
Greater than
Greater than
Greater than
Greater than
Greater than
Greater than
Greater than
Vice President Risk Management
34,538
79,702
79,702
—
398,512
70,000
800,000
Central Manager
34,538
79,702
79,702
—
398,512
70,000
800,000
Risk Manager
26,567
66,419
66,419
39,851
265,675
60,000
700,000
Risk Assistant Manager
19,926
53,135
53,135
23,911
199,256
50,000
550,000
Risk Officer
15,940
47,821
47,821
23,911
132,837
40,000
350,000
Senior Risk Analyst
11,955
31,881
31,881
15,940
106,270
30,000
250,000
Risk Analyst
6,908
21,254
21,254
7,970
53,135
25,000
150,000
Junior Risk Analyst
3,188
13,284
13,284
5,313
26,567
16,000
100,000
(1)
Amounts stated in U.S. dollars as of and for the year ended December 31, 2024 have been translated from soles at the exchange rate of S/3.764= U.S.$1.00.
The approval process in retail banking is supported by world class tools, a workflow that includes a parameterized decision-making system, including risk policies and limits, as well as statistical models for all main retail banking products: credit cards, payroll deduction loans, mortgages and consumer loans.
In retail banking, credit approval is determined by the applicant’s repayment ability, credit history and risk profile. An independent unit is responsible for monitoring the performance of the customer’s portfolio, identifying and controlling risk across the customer’s life cycle, keeping track of the performance of credit policies at origination and monitoring behavior in customer management and collections. For this purpose, Interbank uses data mining and cluster analysis, stress testing for likelihood of defaults, vintage and roll rate analysis and credit risk scoring.
During collection of early stage (1-90 days) due loans in retail banking, Interbank uses collection scores that allow it to choose the appropriate collection strategy: phone collection, text message collection, chatbot, mail or personal collection.
Unpaid debts with a 90-day stay are deemed defaulted loans. Depending on whether the recovery strategy is based on the client’s cash flow or collateral foreclosure, loans are assigned to Interbank’s recovery division. The recovery division has two units, pre-judicial and judicial stage of recovery. During the judicial stage of recovery, accounts are assigned to recovery attorneys. Recovery may include the sale of foreclosed assets.
Defaulted loans that are 100% accounted for under loan loss reserves are written-off and managed through external judicial recovery.
211
Collections and recoveries are undertaken through advanced collection systems from world class suppliers and predictive dialers. The recovery portfolio is segmented into various groups that are divided according to the specific phase of the recovery process. Collections and recovery efforts are made by letters, SMS text messages, IVR (Interactive Voice Response), telephone and personal contact with the customer.
Market Risk
Market risk is the probability of loss due to variations in financial market conditions. The main variations to which Interbank is exposed are: (i) exchange rates, (ii) interest rates and (iii) prices. Said variations can affect the value of financial assets and liabilities. As part of the risk management system, in certain circumstances Interbank uses derivative financial instruments to mitigate the risk exposure which arises from the variations in interest rates and exchange rates.
Exchange Rate
Management sets limits on exposure levels by currency and monitors them on a daily basis. Transactions in foreign currency are accounted for by using exchange rates prevailing on the market.
Interbank manages exchange rates by matching its assets and liabilities, overseeing the global exchange position daily. Interbank’s global foreign exchange position is equivalent to the result of long positions minus short positions in currencies different from the sol. The global foreign exchange position includes spot positions and derivative positions.
Interest Rate
Interest rates continuously fluctuate on the market and affect us: (i) first, through the change in the valuation of assets and liabilities; and (ii) second, though cash flows at repricing. The variation in the valuation of assets and liabilities is increasingly sensitive as the term at which the asset or liability repricing increases. This process consists of the assessment of the repricing periods. On the other side, cash flows are affected when the instruments reach maturity, given that they are invested or placed at the new market interest rates.
The interest rate risk tracking is reported to the Integral Risk Management Committee, as well as the ALCO. The Integral Risk Management Committee approves the various limits applicable to the management of financial instruments. The tracking process is performed by the Division of Market Risk.
An analysis of repricing gaps is performed to determine the impact of interest rate movements on the valuation of assets and liabilities into different time gaps.
The following tables summarize Interbank’s exposure to interest rate risks. Financial instruments are presented at book value, classified by the period of the contract’s interest rate repricing or maturity date, whichever occurs first:
212
Repricing Gap
Repricing Gap at December 31, 2024
1 - Month
1 – 3 Months
3 Months - 1 Year
1 Year - 3 Years
3 Years - 5 Years
Over 5 Years
Past-due loans / Equities
Banking
(S/ in millions)
Assets
Cash due from banks
8,025.7
—
—
—
—
—
—
8,025.7
Inter-bank funds
220.1
—
—
—
—
—
—
220.1
Instruments measured at fair value through other comprehensive income
859.2
1,216.6
496.6
1,982.1
1,322.7
1,262.2
240.0
7,379.4
Investments at amortized cost
—
101.1
—
423.0
304.6
2,970.8
—
3,799.5
Loans, net of unearned income
3,950.3
5,206.6
12,644.0
12,838.2
6,678.7
6,585.9
1,434.3
49,337.9
Other assets
4.3
4.6
13.7
—
—
—
—
22.6
Total
13,059.5
6,529.0
13,154.3
15,243.2
8,306.0
10,818.9
1,674.4
68,785.2
Deposits and obligations
33,839.1
4,744.3
5,160.2
237.4
56.4
33.5
—
44,070.9
Inter-bank funds
—
—
—
—
—
—
—
—
Due to banks and correspondents
1,487.2
767.2
1,375.8
1,662.5
279.9
1,391.0
—
6,963.7
Bonds, notes and other obligations
249.9
1.7
1,481.7
1,813.7
1,122.1
—
—
4,669.1
Other liabilities
10.9
12.0
32.6
60.1
34.1
18.4
—
168.1
Total
35,587.1
5,525.3
8,050.3
3,773.7
1,492.5
1,442.9
—
55,871.8
Marginal gap
(22,527.6
)
1,003.7
5,104.0
11,469.5
6,813.5
9,376.0
1,674.4
12,913.4
Accumulated gap
(22,527.6
)
(21,523.9
)
(16,419.9
)
(4,950.4
)
1,863.1
11,239.0
12,913.4
—
Repricing Gap at December 31, 2023
1 - Month
1 – 3 Months
3 Months - 1 Year
1 Year - 3 Years
3 Years - 5 Years
Over 5 Years
Past-due loans / Equities
Banking
(S/ in millions)
Assets
Cash due from banks
5,879.1
—
—
—
—
—
—
5,879.1
Inter-bank funds
524.9
—
—
—
—
—
—
524.9
Instruments measured at fair value through other comprehensive income
451.3
1,540.1
2,216.6
2,174.0
889.1
1,218.8
80.4
8,570.3
Investments at amortized cost
—
86.7
634.0
433.6
146.6
2,093.1
—
3,394.0
Loans, net of unearned income
4,146.2
5,453.2
10,261.0
12,355.4
6,771.1
6,581.6
1,785.5
47,354.1
Other assets
1.6
14.9
16.2
5.2
3.0
—
—
40.8
Total
11,003.2
7,094.8
13,127.8
14,968.2
7,809.8
9,893.5
1,865.9
65,763.2
Deposits and obligations
29,947.4
3,556.3
5,093.9
262.8
88.0
46.9
—
38,995.3
Inter-bank funds
119.7
—
—
—
—
—
—
119.7
Due to banks and correspondents
1,163.0
1,753.1
2,753.4
1,385.4
266.1
1,348.2
—
8,669.3
Bonds, notes and other obligations
200.6
1,134.8
9.5
2,908.3
—
—
—
4,253.2
Other liabilities
8.3
22.4
61.9
59.2
20.6
3.7
—
176.0
Total
31,439.0
6,466.6
7,918.8
4,615.7
374.7
1,398.8
—
52,213.5
Marginal gap
(20,435.9
)
628.2
5,209.0
10,352.5
7,435.1
8,494.7
1,865.9
13,549.6
Accumulated gap
(20,435.9
)
(19,807.6
)
(14,598.6
)
(4,246.1
)
3,189.0
11,683.7
13,549.6
—
Interbank separates exposures to market risk into two blocks: (i) trading book, which comprises positions in liquid investments, and (ii) banking book, which comprises banking assets and liabilities inherent to the intermediation business whose market risk exposure stems from the changes in the portfolio’s structural positions.
Trading Book
To control and monitor the risks arising from the volatility of risk factors, Interbank has established maximum exposure limits by currency, investment type, Value-at-Risk (VaR) and tolerance to expected maximum loss (Stop Loss), which are monitored on a daily basis. Likewise, reports from the Integral Risk Management Committee and the ALCO are submitted regularly to Interbank’s board of directors.
213
The validity of VaR calculation is proven through a back-testing proof, which uses historical data to ensure that the model adequately estimates potential losses. Additionally, it calculates risk factor sensitivity, which shows potential portfolio losses resulting from interest rate shocks, exchange rate shocks and price shocks, among others.
As of December 31, 2024, 2023 and 2022, Interbank’s VaR calculated for its trading book, classified by type of risk, was as follows:
December 31, 2024
December 31, 2023
December 31, 2022
Change
(S/ in millions)
Dec 24 / Dec 23
Dec 23 / Dec 22
By type of risk
Exchange rate
0.8
1.0
1.2
(0.2
)
(0.2
)
Interest rate
0.2
0.7
1.7
(0.5
)
(1.0
)
Price
—
—
—
—
—
Diversification effect
(0.2
)
(0.5
)
(0.9
)
0.3
0.4
Total
0.9
1.2
2.0
(0.4
)
(0.8
)
Interbank’s VaR decreased from S/1.2 million as of December 31, 2023 to S/0.9 million as of December 31, 2024, mainly due to lower net exposure in foreign exchange derivatives and lower interest rate risk, derived from lower volatility in both soles and U.S. dollars SOFR curves.
Interbank’s VaR decreased from S/2.0 million as of December 31, 2022 to S/1.2 million as of December 31, 2023, mainly due toa reduction in interest rate risk and, to a lesser extent, foreign exchange risk. The interest rate risk was reduced due to the exit of Interbank's treasury position and a lower net position in forwards.
For the periods presented Interbank did not have back-testing exceptions.
Banking Book
Interbank also holds positions that are not actively traded. These positions include all loan placements and funds raised through Interbank’s intermediation business, as well as certain investments that are not deemed trading.
Foreign Exchange Risk
Foreign exchange rate risk is the risk due to exchange rates movements. Management sets limits on exposure levels by currency and monitors them on a daily basis. Transactions in foreign currency are accounted for by using exchange rates prevailing on the market.
Interbank manages exchange rate risk by matching its assets and liabilities, overseeing the global exchange position on a daily basis. Interbank’s global foreign exchange position is equivalent to the result of long positions minus short positions in currencies different from the sol. The global foreign exchange position includes spot positions and derivative positions.
Liquidity Risk
Interbank’s liquidity risk arises from the potential inability to comply with financial obligations. This risk may arise as a result of diverse events such as the unexpected loss of funding sources or the inability to rapidly settle assets, among others.
Interbank takes short-term deposits and transforms them into longer-term loans, which also increases its exposure to liquidity risk. Interbank keeps a set of deposits that historically represent a stable funding source.
Interbank’s liquidity is managed by the Vice President of Capital Markets, which leads the ALCO. Liquidity risk is overseen by the Integral Risk Management Committee, which defines the risk level that Interbank is willing to take and reviews the corresponding indicators, limits and controls.
Interbank has a set of indicators that establish minimum short-term liquidity and reflect several risk aspects, such as concentration, stability, position by currency, main depositors, etc. The Market Risk Division is responsible for tracking such indicators.
214
Interbank also assesses medium-term and long-term liquidity through a structural analysis of its funds inflows and outflows on diverse maturity terms. This process allows it to identify, for each currency, the funding sources, how liquidity needs increase and which terms are mismatched. For both assets and liabilities, Interbank makes assumptions for operations without specific maturity dates, including revolving loans and savings. These assumptions also include the estimated obligations arising from contingent liabilities such as guarantee letters or non-used credit lines. Based on this information, necessary actions are taken to maintain the target liquidity levels.
Operational Risk
Operational risk is defined as the possibility of losses due to inadequate processes, faulty personnel, information technology, or external events. To manage these risks, Interbank has established three defense lines:
•
1st line: comprises the business and support units, which perform operations directly and are responsible for the operational risks;
•
2nd line: comprises the units of risks, Fraud Prevention, Cybersecurity, the Portal for Money Laundering and Terrorism Financing Prevention (“PLAFT” by its Spanish acronym), among others, which provide for the methodological support for risk management; and
•
3rd line: comprises the Internal Audit unit, which conducts an independent review on the operational risk management.
The management of operational risk by Interbank has the following objectives:
•
to manage risk according to the defined levels of appetite and tolerance;
•
to reduce the level of operational losses;
•
to monitor, measure and report the main risks identified to their respective units;
•
to promote the development and innovation of new products and processes in accordance with the aforementioned objectives; and
•
to maintain an optimal level of readiness in case of any interrupting event that may weaken Interbank’s operations, as well as improve its recovery abilities.
The management of operational risk by Interbank uses the Basel standards as base and is part of our digital transformation process in a manner that we believe to be sustainable, streamlined, and straightforward.
Insurance Segment
Interseguro has the following risk management objectives:
•
protect shareholder value by monitoring that exposure to probable losses does not exceed approved limits;
•
protect policyholders so that their rights will not be affected by losses that exceed the value of Interseguro’s equity;
•
support the decision-making processes in Interseguro, by providing consistent, reliable and timely risk information; and
•
promote a successful company culture of risk awareness and informed risk-taking.
To this end, Interseguro uses tools and methodologies to identify and manage risk efficiently, incorporating analytics into its decision-making process.
Main Types of Risks
The main risks faced by Interseguro are insurance risk, credit risk, market risk, liquidity risk, real estate risk and operational risk. Other risks include interest rate risk and foreign exchange risk.
215
Insurance Risk
As an insurance company, Interseguro is exposed to the risk that the assumptions it employs to price a particular insurance policy, such as the frequency of losses or the severity of losses may be incorrect. Flaws in these assumptions may lead to premium mispricing and the miscalculation of the amount of funds necessary to cover such insurance policy. Particularly, upon the sale of an annuity, Interseguro records a reserve that is calculated on the basis of a market discount rate and mortality data.
Credit Risk
Interseguro holds a large portfolio of debt investments and fixed income securities and is therefore exposed to the risk that the issuer may default on its interest or principal payments. This risk is mitigated through a three-step process. Initially, regulations established by the SBS (1) limit the types of investments Interseguro can make, (2) set minimum credit ratings that securities must have, and (3) limit Interseguro’s investments with respect to a single issuer. Secondly, Interseguro performs a careful analysis on the securities it purchases. Finally, Interseguro’s investment committee, which is comprised of both internal and independent members of its board of directors, is responsible for approving any new investment and periodically reviews Interseguro’s investment portfolio.
Market Risk
Interseguro is exposed to the risk that the value of its investments decreases due to changing market conditions. Market risk drivers include equity prices, interest rates and real estate prices. Interseguro manages this risk by setting limits on individual issuer concentration, on type and liquidity of assets and on deviations from the terms of the technical liabilities they should cover. The risk management unit regularly assesses market risk to verify its alignment to Interseguro’s risk appetite. This assessment includes VaR analysis, contribution and sensitivity analysis of each risk driver and stress tests in different extreme scenarios.
The VaR analysis is a statistical measurement that quantifies the maximum loss expected for the investment portfolio for a period of time and a determined significance level under normal market conditions. For VaR calculation Interseguro uses a historical simulation model, with a 10-day period of time and a 99% significance level. The VaR is calculated for the entire market portfolio, and for market risk factors, such as interest rate, equity price and foreign exchange.
The validity of the VaR calculation is proven through back-testing, which uses historical data to ensure that the model adequately estimates the potential losses. Additionally, Interseguro employs sensitivity analysis to show potential portfolio losses derived from price, foreign currency and interest rate fluctuations.
As of December 31, 2024, December 31, 2023 and December 31, 2022, Interseguro’s VaR calculated for its investment portfolio, classified by type of risk, was as follows:
December 31, 2024
December 31, 2023
December 31, 2022
Change
(S/ in millions)
Dec 24 / Dec 23
Dec 23 / Dec 22
By type of risk
Exchange rate
(1.4
)
8.0
6.2
(9.4
)
1.8
Interest rate
600.5
596.8
534.4
3.7
62.4
Price
34.6
38.7
28.9
(4.1
)
9.8
Diversification effect
(33.0
)
(37.9
)
(29.1
)
5.0
(8.8
)
Total
600.6
605.5
540.3
(4.9
)
65.2
Between December 31, 2023 and December 31, 2024, the value of Interseguro’s investment portfolio in financial instruments increased by more than S/891.5 million. Although the portfolio grew, the VaR decreased mainly due to the absence of high-risk instruments in the portfolio compared to 2023.
Between December 31, 2022 and December 31, 2023, the value of Interseguro’s investment portfolio in financial instruments increased by more than S/1,458.1 million, which also led to an increase in exposure to market risk represented by the VaR, mainly explained by in interest rate risk and price risk.
For the periods presented Interseguro did not have back-testing exceptions.
216
Interest Rate Risk
The following tables set forth all the assets and liabilities that are sensitive to interest rate movements.
In addition to fixed income investments, Interseguro has almost no interest-bearing assets or liabilities. Consequently, the interest rate risk of Interseguro is already incorporated into the market risk of the portfolio.
Repricing Gap at December 31, 2024
1 - Month
1-3 Months
3 Months - 1 Year
1 Year – 3 Years
3 Years – 5 Years
Over 5 Years
Past-due loans / Equities
Insurance
(S/ in millions)
Interest earning assets
Cash and due from banks
144.6
—
—
—
—
—
—
144.6
Instruments measured at fair value through other comprehensive income.
30.4
22.9
231.1
710.0
1,054.8
10,775.5
443.1
13,268.0
Investments at amortized cost
—
—
—
—
24.8
—
—
24.8
Other assets
99.3
69.1
17.9
1.8
43.4
(6.7
)
—
224.8
Total interest earning assets
274.4
92.1
249.0
711.8
1,123.1
10,768.8
443.1
13,662.3
Interest bearing liabilities
Due to banks and correspondents
301.1
—
—
—
—
—
—
301.1
Bonds, notes and other obligations
1.9
—
—
—
—
333.1
—
335.0
Insurance contract liabilities
47.9
99.7
465.0
1,241.5
1,245.2
9,203.6
82.7
12,385.5
Other liabilities
148.1
28.6
12.2
12.4
—
1,294.3
—
1,495.6
Total interest bearing liabilities
499.1
128.4
477.2
1,253.9
1,245.2
10,831.0
82.7
14,517.3
Marginal gap
(224.7
)
(36.3
)
(228.1
)
(542.0
)
(122.1
)
(62.2
)
360.4
(855.0
)
Accumulated gap
(224.7
)
(261.0
)
(489.1
)
(1,031.2
)
(1,153.3
)
(1,215.4
)
(855.0
)
—
Repricing Gap at December 31, 2023
1 - Month
1-3 Months
3 Months - 1 Year
1 Year – 3 Years
3 Years – 5 Years
Over 5 Years
Past-due loans / Equities
Insurance
(S/ in millions)
Interest earning assets
Cash and due from banks
204.9
—
—
—
—
—
—
204.9
Instruments measured at fair value through other comprehensive income.
—
—
46.4
35.6
608.6
11,326.4
429.2
12,446.2
Investments at amortized cost
23.6
—
—
—
—
—
—
23.6
Other assets
33.4
55.0
31.3
4.9
35.4
5.6
—
165.7
Total interest earning assets
261.9
55.0
77.7
40.4
644.0
11,331.9
429.2
12,840.3
Interest bearing liabilities
Due to banks and correspondents
215.6
—
—
—
—
—
—
215.6
Bonds, notes and other obligations
—
3.5
—
—
—
241.1
—
244.6
Insurance contract liabilities
52.8
104.0
470.3
1,282.3
1,267.6
8,784.2
105.7
12,066.8
Other liabilities
99.0
60.5
88.7
183.2
223.0
516.4
—
1,170.9
Total interest bearing liabilities
367.3
168.1
558.9
1,465.5
1,490.7
9,541.7
105.7
13,697.9
Marginal gap
(105.4
)
(113.0
)
(481.2
)
(1,425.1
)
(846.6
)
1,790.3
323.6
(857.5
)
Accumulated gap
(105.4
)
(218.4
)
(699.6
)
(2,124.7
)
(2,971.4
)
(1,181.1
)
(857.5
)
—
Foreign Exchange Risk
Interseguro has mainly assets and liabilities denominated in U.S. dollars. Interseguro manages its foreign exchange rate exposure by matching assets and liabilities by currency.
217
Liquidity Risk
Interseguro controls its liquidity needs in the short, medium and long term with the application of Asset Adequacy Tests. In simple terms, these are exercises in which the projected flows of the contracted annuities and insurance policies, are compared with the cash flows of the assets allocated for their coverage, and the present value of the surpluses, dynamically calculated, represents the level of liquidity adequacy of Interseguro.
Real Estate Risk
There are two sources of real estate risk. The first is related to the real estate market, which includes property values and lease demand. The second is the possibility of default on leases.
Interseguro manages the risk associated with its real estate market by adapting its current offer and future projects to the new conditions that arises. Interseguro periodically evaluates the financial position of prospective and current tenants to reduce the risk of losing rental income.
Operational Risk
Operational risk is defined as the possibility of losses due to inadequate processes, faulty personnel, information technology, or external events. To manage these risks, Interseguro uses tools for identification, evaluation and treatment of risks similar to the tools used by banks to comply with Basel II. The goals of these risk management tools may be summarized as follows:
•
reduce operational losses by identifying potential process risks;
•
identify operational risk in the development of new products;
•
manage control risk and self-assessment of critical processes; and
•
monitor and measure operational risk.
Wealth Management Segment
Inteligo’s risk management policies are guided by an emphasis on maintaining growth that is both sustainable, profitable and aligned to adequate levels of risk. In order to accomplish this, Inteligo has developed analytic tools and methodologies aiming to identify and manage risk efficiently. Inteligo monitors and reviews these tools to ensure that adequate levels of prediction and performance are maintained and, if necessary, to make adjustments or take corrective measures.
In order to manage the above risks, Inteligo has a specialized risk management structure, measurement systems and mitigation and coverage processes.
Inteligo uses different key risk indicators (“KRI”) to measure its exposure to risk factors. These KRI are monitored on an ongoing basis and reviewed monthly by senior management and quarterly by the Integral Risk Management Committee and the board of directors to identify possible deviations from the stipulated risk appetite and apply timely corrective actions if needed.
Both credit and market risk are the main risks to be managed by Inteligo and, in order to mitigate its exposure and provide adequate risk coverage, it has established the following measures, among others:
•
policies, procedures, methodologies, and parameters aimed to identify, measure, control and report market and credit risk;
•
review and assessment of credit risk through a specialized risk department which is independent from the commercial unit and which assesses all credit risks prior to loan approvals;
•
compliance with regulatory limits and establishment of internal limits for concentration exposure to counterparties and financial instruments, such as concentration to industry, issuer, credit rating and type of investment; and
•
procedures for the management of loan guarantees.
Through these measures, Inteligo establishes the patterns and mechanisms needed to maintain a diversified portfolio and prevent excessive risk concentration.
218
Main Types of Risks
The main risks faced by Inteligo are credit risk, market risk, interest rate risk, foreign exchange risk, liquidity risk and operational risk.
Credit Risk
In our wealth management segment, only Inteligo Bank is exposed to credit risk. The substantial majority of loans we make are fully collateralized by time deposits or investment securities. Nevertheless, we have implemented strict credit risk management policies, which have contributed to a minimum level of non-performing loans. As of December 31, 2024, only 0.01% of its loan portfolio was classified as non-performing loans.
The following table presents the approval levels required for loan applications by total exposure amount in U.S. dollars.
Approval levels
Amount
Board of Directors
Over U.S.$
20,000,000
Executive Committee
Up to U.S.$
20,000,000
Credit Committee
Up to U.S.$
15,000,000
Chief Executive Officer
Up to U.S.$
5,000,000
Chief Operating Officer
Up to U.S.$
1,500,000
Operations Manager
Up to U.S.$
500,000
Credit approval is determined by the applicant’s repayment ability, which is determined primarily by the applicant’s credit history and cash flow generation for commercial loans or monthly net profit for retail loans.
The decision whether or not to approve an extension of credit takes into account the applicant’s economic environment, its ability to meet its obligations, collateral, management and character. We developed a credit risk scorecard system, which classifies applicants based on several variables such as leverage ratio, debt service as a percentage of monthly income and collateral quality, among others.
The Risk Unit is responsible for periodical monitoring of our credit portfolio and early detection of possible deviations in the credit performance and financial condition of clients in order to maintain a healthy loan portfolio and take timely and necessary actions to reduce or avoid losses. To this end, the Risk Unit reviews Inteligo Bank’s loan portfolio on a monthly basis and calculates an expected credit loss according to internal models. Additionally, it is responsible for the regulatory classification of all bank customers and appropriate allocation of reserves.
Although Inteligo Bank has a recovery process for the collection of unpaid loans, there have been very few cases of non-performing or defaulted loans.
Market Risk
Market risk is the probability of loss due to variations in financial market conditions. The main variations to which Inteligo is exposed to are: (i) interest rates and (ii) market pricing of financial instruments. Said variations can affect the value of Inteligo’s financial assets and liabilities. Exchange rate risk is minimal because of the small exposure to other currencies.
Inteligo Investment Portfolio
In order to monitor the risks within each instrument of its investment portfolio, Inteligo has established maximum exposure limits by individual issuer, investment type and currency that are calculated on a monthly basis.
The main technique used to measure and control market risk is VaR, which is a statistical measurement that quantifies the maximum loss expected for the investment portfolio for a period of time and a determined significance level under normal market conditions. Inteligo uses the historic VaR model for a period of one month with a 99% confidence level. The VaR is calculated for each risk factor (price, interest rate and exchange rate) and investment type (fixed income, equity and alternative investments).
Additionally, Inteligo calculates the marginal contribution to VaR of each instrument in the portfolio. The validity of the VaR calculation is verified through a back-testing methodology, which uses historical data to ensure that the model adequately estimates potential losses. Inteligo has also developed a sensitivity analysis to show potential portfolio losses from price variations in its investment portfolio or interest rates fluctuations.
219
The primary source of Inteligo’s market risk is Inteligo Bank’s investment portfolio, as it represents over 95% of Inteligo’s VaR results. As of December 31, 2024, December 31, 2023 and December 31, 2022, Inteligo’s VaR, classified by type of risk was as follows:
December 31, 2024
December 31, 2023
December 31, 2022
Change
By type of risk
(S/ in millions)
Dec 24 / Dec 23
Dec 23 / Dec 22
Exchange rate
1.1
3.5
2.7
(2.4
)
0.8
Interest rate
9.9
12.7
21.4
(2.8
)
(8.7
)
Price
39.6
70.5
137.9
(30.8
)
(67.4
)
Diversification effect
(0.2
)
(0.6
)
(2.6
)
0.4
2.0
Total
50.4
86.1
159.4
(35.7
)
(73.4
)
Inteligo’s VaR decreased S/35.7 million as of December 31, 2024, mainly due to better stock market conditions led by a resilient economy and easing inflation, which resulted in a significant reduction in the price risk VaR, when compared to December 31, 2023.
Inteligo’s VaR decreased S/73.4 million as of December 31, 2023, mainly due to the increase of fixed income assets compared with other assets with greater volatility in the portfolio as well as the sale of specific positions, when compared to December 31, 2022.
For the periods presented Inteligo did not have back-testing exceptions.
Assets and Liabilities Management
Inteligo holds positions that are not actively traded, including its loan portfolio, customer deposits, and bank loans. These positions are also exposed to interest rate risk, exchange rate risk and liquidity risk.
Interest Rate Risk
Interest rates continuously fluctuate on the market. These fluctuations affect Inteligo in two ways: firstly, through the change in the valuation of assets and liabilities; and secondly, affecting the cash flows at repricing dates. The variation in the valuation of assets and liabilities is increasingly sensitive as the term at which the asset or liability repricing increases.
An analysis of the repricing gaps is performed in order to determine the impact of interest rates movements. Said analysis consists of classifying all the interest earning assets and interest bearing liabilities in several time ranges according of their repricing date. The impact of the variation in the valuation of assets and liabilities on each range (the repricing gap) is calculated in function of this analysis.
220
The following tables summarize Inteligo’s exposure to interest rate risks. Inteligo’s financial instruments are presented at book value, classified by the period of the contract’s interest rate repricing or maturity date, whichever occurs first:
Repricing Gap at December 31, 2024
Up to 1 month
From 1 to 3 months
From 3 Months - 1 Year
From 1 Year - 3 Years
From 3 Years - 5 Years
Over 5 Years
Past-due loan/ Equities
Wealth Management
(S/ in millions)
Interest earning assets
Cash and due from banks
407.5
17.9
—
—
—
—
—
425.4
Instruments measured at fair value through other comprehensive income.
3.4
6.0
40.4
176.5
227.2
273.0
13.0
739.5
Loans, net of unearned interest
133.1
122.2
1,045.2
283.3
35.6
3.2
—
1,622.5
Other assets
—
—
—
12.3
—
—
—
12.3
Total interest earning assets
544.0
146.1
1,085.6
472.1
262.8
276.2
13.0
2,799.8
Interest bearing liabilities
Deposits and obligations and deposits from financial entities
251.3
437.3
1,275.1
119.3
—
—
—
2,082.9
Due to banks and correspondents
265.8
—
—
—
—
—
—
265.8
Other liabilities
0.3
0.4
6.4
—
—
—
69.7
76.8
517.4
437.6
1,281.5
119.3
—
—
69.7
2,425.5
Marginal gap
26.6
(291.5
)
(195.9
)
352.9
262.8
276.2
(56.7
)
374.3
Accumulated gap
26.6
(265.0
)
(460.9
)
(108.0
)
154.8
431.0
374.3
—
Repricing Gap at December 31, 2023
Up to 1 month
From 1 to 3 months
From 3 Months - 1 Year
From 1 Year - 3 Years
From 3 Years - 5 Years
Over 5 Years
Past-due loan/ Equities
Wealth Management
(S/ in millions)
Interest earning assets
Cash and due from banks
319.2
72.6
216.0
26.8
—
—
—
634.6
Instruments measured at fair value through other comprehensive income.
48.6
0.6
30.4
145.1
188.7
293.1
13.6
720.1
Loans, net of unearned interest
105.6
158.0
987.4
265.1
1.0
2.6
—
1,519.7
Other assets
—
9.0
—
—
—
—
—
9.0
Total interest earning assets
473.3
240.2
1,233.9
437.1
189.7
295.7
13.6
2,883.4
Interest bearing liabilities
Deposits and obligations and deposits from financial entities
238.8
338.4
1,508.0
161.5
—
—
—
2,246.7
Due to banks and correspondents
84.0
—
—
—
—
—
—
84.0
Other liabilities
0.4
0.3
6.8
0.4
—
—
48.5
56.4
323.2
338.7
1,514.8
161.9
—
—
48.5
2,387.1
Marginal gap
150.1
(98.5
)
(280.9
)
275.2
189.7
295.7
(34.9
)
496.3
Accumulated gap
150.1
51.6
(229.3
)
45.8
235.5
531.2
496.3
—
Foreign Exchange Risk
Exchange rate risk is related to the variation of the positions both on- and off-balance sheet that may be negatively affected by exchange rates movements. Inteligo Bank’s main business is performed in U.S. dollars, its functional currency. Management sets a limit to exposure levels in other currencies and monitors it monthly.
Inteligo SAB uses both soles and U.S. dollars in its trading operations and maintains positions in both currencies. Interfondos manages mutual funds in both soles and U.S. dollars.
221
Liquidity Risk
Liquidity risk consists of Inteligo’s inability to comply with the maturity of its obligations, thus incurring losses that affect its equity position. This risk may arise as result of diverse events such as the unexpected decrease of funding sources or the inability to rapidly settle assets, among others.
Although Inteligo takes short-term deposits, most of the deposits have historically been renewed or maintained, and consequently they represent a stable funding source. Additionally, the average loan term is less than a year and more than a half of the investment portfolio can be easily liquidated, so liquidity risk is low.
Nevertheless, Inteligo assesses medium-term and long-term liquidity through a structural analysis of its funds inflows and outflows on diverse maturity terms. This process allows it to know the diverse funding sources, how liquidity needs to be increased, and which terms are mismatched. On the basis of this information, the necessary decisions to maintain adequate liquidity levels are taken.
Inteligo Bank’s financial assets include unlisted equity investments, which generally are illiquid. In addition, Inteligo Bank holds investments in closed (unlisted) and open-ended investment funds, which may be subject to redemption restrictions such as “side pockets” and redemption limits. As a result, Inteligo Bank may not be able to settle some of its investments in these instruments in due time in order to meet its liquidity requirements.
Operational Risk
Inteligo manages operational risk through its risk unit, guided by banking best-practices, including Basel II policies. The objectives of the operational risk management are to:
•
reduce operational losses by identifying potential process risks;
•
identify operational risk in the development of new products; and
•
manage control risk and self-assess critical processes;
•
monitor and measure operational risk.
Inteligo’s methodology is based on two tools for identifying and measuring risks that calculate the exposure level and facilitates decision-making to mitigate exposures within certain limits of risk tolerance. These tools are risks and controls self-assessment, and collection of loss event.
Inteligo Bank uses the Standardized Approach for operational risk management under Basel III, according to the Central Bank of The Bahamas’ regulation. In recent years, Inteligo launched several initiatives to strengthen the risk culture among the employees.
ITEM 12. DESCRIPTION OF SECURITIES OTHER THAN EQUITY SECURITIES
A.
Debt Securities
Not Applicable.
B.
Warrants and Rights
Not Applicable.
C.
Other Securities
Not Applicable.
D.
American Depositary Shares
Not Applicable.
222
PART II
ITEM 13. DEFAULTS, DIVIDEND ARREARAGES AND DELINQUENCIES
None.
ITEM 14. MATERIAL MODIFICATIONS TO THE RIGHTS OF SECURITY HOLDERS AND USE OF PROCEEDS
None.
ITEM 15. CONTROLS AND PROCEDURES
Disclosure Controls and Procedures
Disclosure controls and procedures are designed to ensure that information required to be disclosed by us in reports filed or submitted under the Securities Exchange Act of 1934 is recorded, processed, summarized and reported within the time periods specified in the SEC’s rules and forms. We have evaluated, with the participation of our chief executive officer and chief financial officer, the effectiveness of our disclosure controls and procedures as of December 31, 2024.
There are inherent limitations to the effectiveness of any system of disclosure controls and procedures, including the possibility of human error and the circumvention or overriding of the controls and procedures. Accordingly, even effective disclosure controls and procedures can only provide reasonable assurance of achieving their control objectives. Based upon our evaluation, our chief executive officer and chief financial officer concluded that our disclosure controls and procedures were effective to provide reasonable assurance that information required to be disclosed by us in the reports that we file or submit under the Exchange Act is recorded, processed, summarized and reported, within the time periods specified in the applicable rules and forms, and that it is accumulated and communicated to our management, including our chief executive officer and chief financial officer, as appropriate to allow timely decisions regarding required disclosure.
Management’s Annual Report on Internal Control Over Financial Reporting
Management, under the supervision and with the participation of the chief executive officer and chief financial officer, is responsible for establishing and maintaining adequate internal control over financial reporting. Our internal control over financial reporting is designed to provide reasonable assurance regarding the reliability of financial reporting and the preparation of financial statements for external purposes in accordance with IFRS Accounting Standards as adopted by IASB and includes policies and procedures that pertain to the maintenance of records that, in reasonable detail, accurately and fairly reflect the transactions and dispositions of our assets; provide reasonable assurance that transactions are recorded as necessary to permit preparation of financial statements in accordance with IFRS Accounting Standards as adopted by IASB, and that receipts and expenditures are being made only in accordance with authorizations of our management and directors; and provide reasonable assurance regarding prevention or timely detection of unauthorized acquisition, use or disposition of our assets that could have a material effect on the consolidated financial statements.
Because of its inherent limitations, internal control over financial reporting may not prevent or detect misstatements. Therefore, effective control over financial reporting cannot and does not provide absolute assurance of achieving our control objectives. Also, projections of any evaluation of effectiveness to future periods are subject to the risk that controls may become inadequate because of changes in conditions, or that the degree of compliance with the policies or procedures may deteriorate.
Management assessed the effectiveness of the Company’s internal control over financial reporting (as defined in Rules 13(a)-13(f) and 15(d)-15(f) under the U.S. Securities Exchange Act of 1934) as of December 31, 2024. In making this assessment, it used the criteria established in Internal Control—Integrated Framework (2013) issued by the Committee of Sponsoring Organizations of the Treadway Commission (COSO). Based on our assessment, management concluded that, as of December 31, 2024, the Company’s internal control over financial reporting is effective based on those criteria.
Attestation report of the registered public accounting firm
EY Peru, an independent registered public accounting firm, has issued an unqualified opinion on the effectiveness of the Company’s internal control over financial reporting, which is included in this Annual Report on Form 20-F under “Item 18. Financial Statements—Report of independent registered public accounting firm.”
223
Changes in Internal Control over Financial Reporting
There has been no change in our internal control over financial reporting during 2024 that has materially affected, or is reasonably likely to materially affect, our internal control over financial reporting.
ITEM 16. [RESERVED]
ITEM 16A. Audit Committee Financial Expert
Our board of directors has determined that Felipe Federico Roy Morris Guerinoni, a member of our audit committee, meets the requirements of an “audit committee financial expert,” as defined by the SEC, and is an independent member of the audit committee under applicable SEC and NYSE rules.
For further information, see "Item 6. Directors, Senior Management and Employees—Board Practices—Audit Committee.”
ITEM 16B. Code of Ethics
In April 2024, we updated our code of ethics, as defined in Item 16B of Form 20-F under the Exchange Act which applies to all directors, officers, employees, consultants, and contractors without exception. The Code of Ethics is available to the public on our web page at www.ifs.com.pe. This URL is intended to be an inactive textual reference only. It is not intended to be an active hyperlink to our website. The information on our website, which might be accessible through a hyperlink resulting from this URL, is not and shall not be deemed to be incorporated into this Annual Report on Form 20-F.
ITEM 16C. Principal Accountant Fees and Services
Audit and Non-Audit Fees
The following table sets forth the fees billed to us by our independent auditors, EY Peru, during the fiscal years ended December 31, 2024 and December 31, 2023:
Year ended December 31,
2024(1)
2023(1)
(S/ in millions)
Audit fees
11.3
11.2
Audit-related fees
0.1
0.3
Tax fees
0.6
0.7
Other fees
0.2
0.2
Total fees
12.2
12.4
(1)
Including taxes.
“Audit fees” in the above table are the aggregate fees billed by EY Peru in connection with the audit of our annual financial statements. This line item includes (i) the audit of our and our subsidiaries’ statutory accounts, (ii) the audit of the consolidated financial statements required by Item 18 of Form 20-F, and (iii) the limited reviews of financial statements of our subsidiaries and procedures related to the issuance of comfort letters.
“Audit related fees” in the above table are the aggregate fees billed by EY Peru for assurance and related services that are reasonably related to the performance of the audit or review of IFS financial statements and are not reported under “audit fees”. This line item includes services such as attestation reports for our subsidiaries as required by statute or regulations.
“Tax fees” related to tax services which include all services performed by IFS’s independent auditor´s tax personnel, except those services specifically related to the review and preparation of IFS´s financial statements, and which principally consist of tax compliance and advisory service.
“All Other fees” includes other advisory services to our subsidiaries.
224
Audit Committee Pre-Approval Policies and Procedures
Our audit committee is responsible for the appointment of our external auditors, determining their compensation, retention and oversight, and resolving any disagreement that may arise between management and our external auditors. Our audit committee annually pre-approves the services that may be retained with our external auditor, considering the independence rules for the external auditor described in section I of Annex A of the Audit Committee Policy. These previously approved services are ratified and/or adjusted once a year by the audit committee. In addition, our audit committee may, at any time, add or eliminate services from the pre-approval list. We may engage our external auditors for all services contained in the pre-approval list without additional audit committee approval, provided that they do not exceed the amount of U.S.$50,000. Any services not included in such pre-approval list or which, having been previously approved, exceed the amount indicated above, need to be specifically reviewed and approved by our audit committee before any such engagement.
All proposed services carried out by our external auditors as well as corresponding fees related to audit and non-audit services, have been presented to our audit committee, which has determined they are reasonable and consistent with our policies.
In accordance with Rule 10A-3 of the Exchange Act, our board of directors delegated to our audit committee the approval of the engagement and compensation of the external auditors independent external for 2022 (or for longer periods, as may be recommended, up to the fiscal year of 2026), which delegation was approved by our shareholders at the Annual General Meeting of Shareholders held on March 31, 2022. Furthermore, in connection with such delegation, our audit committee reviewed proposals from various prominent global audit firms with operations in the countries where our subsidiaries operate to act as our external auditors for 2022 or a longer period as may be recommended. After analyzing such proposals received, the audit committee recommended EY Peru to serve as our and our subsidiaries’ independent external auditor for a period of five auditable years (2022-2026). Our board of directors’ agreed with the audit committee’s recommendation to appoint EY Peru for such term, subject to the audit committee’s continued evaluation of EY Peru’s performance and continued compliance with the SEC’s independence requirements.
Our audit committee’s main duties are disclosed in “Item 6. Directors, Senior Management and Employees—Board Practices.” Furthermore, the authorization to hire external auditors is subject to approval by our shareholders at the ordinary annual shareholders’ meeting although our audit committee is responsible for their appointment and oversight.
ITEM 16D. Exemptions from the Listing Standards for Audit Committees
Not applicable.
ITEM 16E. Purchases of Equity Securities by the Issuer and Affiliated Purchasers
On March 31, 2025, IFS’ shareholders approved the creation of a new share repurchase program for an amount of up to U.S.$100 million of our outstanding common shares (the “2025 Repurchase Program”). The repurchase may take place simultaneously in both the Lima Stock Exchange and the New York Stock Exchange, and may be carried out in one or several dates at market prices through open market transactions subject to market conditions. The 2025 Repurchase Program will begin after the 2023 Repurchase Program exhausts its U.S.$100 million limit or after the 2023 Repurchase Program is terminated by the Board of Directors, and will remain in force until it is terminated by the Board of Directors as it does not have a fixed expiration date.
Our shareholders authorized management to appoint a broker for the repurchase of our outstanding common shares on our behalf in the open market. Such purchases may benefit from the safe harbors provided by Rule 10b-18 and/or Rule 10b5-1 under the Exchange Act. The actual timing, number, and value of shares repurchased under the 2025 Repurchase Program depend on several factors, including constraints specified in Rule 10b-18, price, general business, and market conditions, and alternative investment opportunities. The 2025 Repurchase Program does not obligate us to acquire any specific number of shares in any period and may be discontinued at any time.
In the first quarter of 2025, we have repurchased a total of 1,257,638 common shares on a weighted-average price of U.S.$30.32 per share, with a total amount of U.S.$38.1 million pursuant to the 2023 Repurchase Program.
In 2024, we repurchased a total of 1,193,553 common shares on a weighted-average price of U.S.$27.57 per share, with a total amount of U.S.$32.8 million pursuant to the 2023 Repurchase Program.
In 2023, we repurchased a total of 938,371 common shares on a weighted-average price of U.S.$23.63 per share, with a total amount of U.S.$22.0 million pursuant to the 2023 Repurchase Program.
The following table sets out certain information concerning purchases of our previously issued common shares by us or any affiliated purchaser during the fiscal year ended December 31, 2024.
225
Period
Total number of shares purchased
Average price paid per share (S/)(1)
Total number of shares purchased as part of publicly announced plans or programs
Maximum number of shares that may yet be purchased under the plans or programs
January 2024
—
—
—
—
February 2024
—
—
—
—
March 2024
—
—
—
—
April 2024
—
—
—
—
May 2024
1,000
85.48
N/A
N/A
June 2024
1,000
83.14
N/A
N/A
July 2024
—
—
—
—
August 2024
—
—
—
—
September 2024
45,450
99.66
N/A
N/A
October 2024
694,769
100.60
N/A
N/A
November 2024
5,347
101.70
N/A
N/A
December 2024
445,987
109.14
N/A
N/A
Total(2)
1,193,553
—
—
—
(1)
For convenience purposes only, amounts in soles in this column have been converted from U.S. dollars using a rate of S/3.764 to U.S.$1.00, which was the exchange rate reported for December 31, 2024 by the SBS. These translations should not be construed as representations that the U.S. dollar amounts have been, could have been or could be converted into soles at that or at any other exchange rate.
(2)
As of December 31, 2024, IFS and certain subsidiaries held an aggregate of 2,159,248 shares issued by IFS.
ITEM 16F. Change in Registrant’s Certifying Accountant
Since 2022 and through the date of this Annual Report on Form 20-F, EY Peru, has not resigned, has not indicated that it will decline to stand for re-election after the completion of its current audit nor has it been dismissed.
ITEM 16G. Corporate Governance
Corporate Governance
As a foreign private issuer, we are subject to different corporate governance requirements than those followed by a U.S. company with shares listed on the NYSE that follow NYSE listing standards. With certain exceptions, foreign private issuers are permitted to follow their home country corporate governance standards.
We are registered with the SMV and although there is no legal obligation to comply with Peruvian corporate governance practices, we are required to report our degree of compliance with Peruvian corporate governance practices for Peruvian publicly-held companies to the SMV. Because we are not subject to Panamanian securities laws as we have not offered any securities in Panama and because general corporate law in Panama does not impose any meaningful restrictions on our corporate governance, a comparison to Panamanian corporate governance practices is not applicable. Additionally, we have adopted a set of additional corporate governance guidelines as contemplated by the U.S. Sarbanes-Oxley Act of 2002 and our articles of incorporation, which include the establishment of:
•
principles and duties relating to the conduct of our management, including as with respect to confidentiality and conflicts of interest;
•
internal accounting controls systems;
•
corporate governance guidelines;
•
amendments to the audit committee charter;
•
a code of business conduct and ethics;
226
•
corporate anti-corruption policies and guidelines, including compliance with the FCPA; and
•
amendments to corporate compliance policies.
Pursuant to Section 303A.11 of the Listed Company Manual of the NYSE, we are required to provide a summary of the significant ways in which our corporate governance practices differ from those required for U.S. companies under the NYSE listing standards. The following is a comparison between our corporate governance policies under Peruvian law and those of the NYSE listing standards.
NYSE Standards
Our Corporate Governance Practices
Director Independence. A majority of the board of directors must be independent, except in the case of a “controlled” issuer. §303A.01 of the NYSE Listed Company Manual
Our articles of incorporation provide for a minimum of three members for our board of directors. Currently, our board of directors is composed of seven members.
The criteria for determining independence under our corporate governance standards has been defined in accordance with Rule 10A-3 under the Exchange Act.
Executive Sessions. Non-management directors must meet regularly in executive sessions without management. Independent directors should meet alone in an executive session at least once a year. §303A.03 of the NYSE Listed Company Manual
Under our articles of incorporation and applicable laws non-management directors are not required to meet in executive sessions without management.
NYSE Standards
Our Corporate Governance Practices
Audit committee. An audit committee satisfying the requirements of Rule 10A-3 under the Exchange Act. §303A.06 of the NYSE Listed Company Manual
Our audit committee complies with the criteria set forth under our “Audit Committee Charter,” the rules of the NYSE and Rule 10A-3(b)(1) of the Exchange Act, each as applicable to foreign private issuers. Our audit committee consists of three directors, all of whom are financially literate and one of whom is a financial expert. Our audit committee is fully independent in compliance with NYSE rules and Rule 10A-3(b) of the Exchange Act.
Audit committee additional requirements. §303A.07 of the NYSE Listed Company Manual requires that an audit committee must consist of at least three members, each of whom are financially literate and at least one of whom is a financial expert, and that the audit committee have a written charter outlining the committee’s responsibilities.
Our audit committee complies with the criteria set forth under our “Audit Committee Charter,” the rules of the NYSE and Rule 10A-3(b)(1) of the Exchange Act, each as applicable to foreign private issuers. Our audit committee consists of three directors, all of whom are financially literate and one of whom is a financial expert. The three members of the audit committee are independent.
Nominating/corporate governance committee. A nominating/corporate governance committee of independent directors is required. The committee must have a charter specifying the purpose, duties and evaluation procedures of the committee. §303A.04 of the NYSE Listed Company Manual
We do not have a nominating/corporate governance committee. Our board of directors has the power to establish such a committee in the future on the terms it deems appropriate.
Compensation committee. A compensation committee of independent directors is required. The committee must approve executive officer compensation and must have a charter specifying the purpose, duties and evaluation procedures of the committee. §303A.05 of the NYSE Listed Company Manual
We do not have a compensation committee. Our Board of Directors may establish a compensation committee in the future on the terms it deems appropriate.
Code of Ethics. A code of business conduct and ethics are required, as is disclosure of any waiver for directors or executive officers. §303A.10 of the NYSE Listed Company Manual
We have adopted a code of business conduct and ethics, as contemplated by the NYSE. Our board of directors has the obligation to verify compliance with the provisions of such code.
227
ITEM 16H. Mine Safety Disclosure
Not applicable.
ITEM 16I. Disclosure Regarding Foreign Jurisdictions that Prevent Inspections
Not applicable.
ITEM 16J. Insider Trading Policies
In June 2020, we approved our IFS insider trading policy that governs the trading of our securities by the members of our board, our senior management and employees who due to their job, profession or function, may have access to material non-public information concerning IFS or its subsidiaries. Moreover, it forbids these individuals from disclosing such sensitive information to others who might be influenced or encouraged to trade securities based on this undisclosed information. The IFS insider trading policy and related procedures are reasonably designed to promote compliance with applicable insider trading laws.
A copy of our IFS insider trading policy is included as Exhibit No. 11.1 to this Annual Report on Form 20-F.We intend to disclose future amendments to our insider trading policy on our website or in public filings. Information contained on, or that can be accessed through, our website is not part of, or incorporated by reference into, this Annual Report on Form 20-F, and inclusions of our website address herein are inactive textual references provided only for your informational reference. The information on our website is not incorporated by reference into this Annual Report on Form 20-F, and you should not consider information contained on our website to be a part of this Annual Report on Form 20-F.
ITEM 16K. Cybersecurity
As cybersecurity risks increase in both frequency and impact, IFS and its subsidiaries have implemented a cyber resilience strategy designed to protect, identify, and respond to cybersecurity threats, as well as actions for the recovery of technology and operational processes to ensure business continuity in the event of a cybersecurity breach. This strategy includes the implementation of tools, procedures, and teams of cybersecurity experts operating under a management framework based on industry standards such as the National Institute of Standards and Technology Cybersecurity Framework (NIST CSF), ISO 27001, and PCI DSS. It also considers new industry trends, current regulations, and definitions established by IFS and its subsidiaries. The following is a summary of the cybersecurity risk management and strategy in each of our segments.
Banking Segment
Risk management and strategy
While the Cybersecurity Division of Interbank leads the cybersecurity risk management, the function extends across the organization, involving other teams in business, technology, risk, and auditing. Both the strategy and the cybersecurity risk management framework consider business strategy, cybersecurity-related regulations, risk appetite, and the global cybersecurity context.
The cybersecurity risk management framework is designed to establish capabilities and responsibilities at different control layers, including:
•
Teams, tools, and procedures for the identification, assessment, control, and mitigation of cybersecurity risks;
•
A governance model that sets the cybersecurity management framework, and provides direction and information to top management for decision-making; and
•
An independent audit model that supervises the cybersecurity management model definition and execution.
The Cybersecurity Division is responsible for defining methodologies, procedures, and tools for managing cybersecurity risks and for defining policies approved by Interbank’s board of directors. Both Interbank’s board of directors and the executive level seek to ensure adequate resource allocation (people, technology, and processes) for this purpose. They also promote the development of a culture around strong cybersecurity habits throughout the organization.
The sophistication of techniques used for attacks, coupled with the hybrid work environment extending the security perimeter to multiple locations and devices, the growing adoption of the cloud, and emerging technologies such as AI, create a challenging and ever-changing environment for cybersecurity management.
Interbank’s cybersecurity strategy to address this environment focuses on:
228
•
Strengthening capabilities to enable a secure hybrid work environment for employees and third parties involved in our operations, regardless of their location when accessing organizational resources. Technologies such as Secure Web Gateway (SWG) for web browsing security, Cloud Access Security Broker (CASB) for SaaS access and Zero Trust Network Access (ZTNA) for remote secure access, have been implemented. Additionally, this strategy includes strengthening capabilities for preventing data leakage (DLP) as a complement to these actions.
•
Consolidating a Security Operations Center (SOC), managed by IBM X-Force, which includes capabilities for protection, detection, and response to cybersecurity threats through technologies such as Endpoint and Network Detection and Response (EDR/NDR), Security Information and Event Management (SIEM), and Security Orchestration, Automation, and Response (SOAR), as part of our Extended Detection and Response (XDR) journey.
•
Enhancing our digital channels security, especially authentication mechanisms and their software development lifecycle through testing, including various dynamic (SAST), static (DAST), and composition (CSA) testing approaches to ensure the security quality of the services provided to customers.
In 2024, Interbank took the following main actions to consolidate its cybersecurity strategy:
•
Strengthened the security for public internet services (mobile applications, web applications, and APIs) through the implementation of a Web Application and API Protection (WaaP) architecture, leveraging cloud native technology from one of the market's leading providers in this category. This initiative has strengthened protection capabilities against Distributed Denial of Service (DDoS) attacks and automated bot threats (Bot Management), while integrating advanced functionalities such as Web Application Firewall (WAF) and API Gateway.
•
Implemented behavioral biometrics and Customer Identity and Access Management (CIAM) solutions to reinforce the security of its digital channels. These technologies enhance authentication processes, detect anomalous user behavior, and ensure secure and seamless access, aligning with local regulatory requirements and improving the overall protection of customer interactions.
•
Reinforced its processes for identifying and assessing cybersecurity threats associated with services provided by third parties by conducting security evaluations or requesting external audit reports on the operational effectiveness of the controls implemented by its most critical providers. Furthermore, Interbank assessed their cyber risk posture through security scorecards that evaluated their internet exposure.
•
Implemented Breach and Attack Simulation (BAS) technology to proactively identify vulnerabilities and assess the effectiveness of security controls. This solution enables testing through simulated cyberattacks, providing actionable insights to enhance threat detection, improve defenses, and strengthening the organization's overall cybersecurity posture.
In 2024, Interbank executed awareness and cybersecurity training actions, including internal campaigns with audiovisual media, informative bulletins, expert-supported talks, security courses, and simulated social engineering attack campaigns. These actions aimed to raise awareness among employees about such threats, measure their ability to detect them, and encourage effective reporting. Additionally, Interbank conducted tabletop and cyber range exercises involving senior management and technical incident response teams as part of strengthening the organization's capabilities to respond to potential security breaches.
During 2024, Interbank did not have any cybersecurity incidents that materially affected it or were reasonably likely to materially affect it.
Governance
Interbank’s board of directors has established oversight committees for cybersecurity risk management, including the Integrated Risk Management Committee and the Information Security and Cybersecurity Committee. These committees monitor the performance of cybersecurity management, provide guidance for policy creation and changes, and make decisions regarding cybersecurity management in the organization.Interbank’s board of directors approves policies and monitors cybersecurity management through reports from these committees. Furthermore, one of Interbank’s directors (Marcia Nogueira de Mello, see “Item 6. Directors, Senior Management and Employees—Directors and senior management—Interbank—Board of Directors”) has been designated as the director responsible for supervising the efficiency of Interbank’s information security and cybersecurity system since 2023, and periodically evaluates performance, provides guidance, and reports to the board on the state of cybersecurity management at Interbank. This governance model ensures proper cybersecurity risk management and keeps the board informed for a clear understanding of the state of cybersecurity, enabling them to make necessary decisions.
Through the Integrated Risk Committee, which includes board members, the board receives information on the cybersecurity risk exposure profile, state of alignment with the defined tolerance level, and adopted mitigation measures. Through the audit committee, which also includes board members, the board receives information on assessments of the cybersecurity management model and compliance with improvement plans related to these assessments.
229
The Information Security and Cybersecurity Committee is responsible for aligning the cybersecurity strategy with the business strategy and Interbank's risk appetite and tolerance objectives. It monitors the development of the defined cybersecurity strategy, stays informed about cybersecurity incidents, and ensures that mitigation actions and lessons learned have been taken. This committee ensures that relevant cybersecurity risks and mitigation actions are reported to the board through defined channels. This committee is composed by:
•
Alfonso Alejandro Díaz Tordoya. Executive Vice President of Operations and Technology (see “Item 6. Directors, Senior Management and Employees—Directors and senior management—Interbank—Executive Officers”).
•
Gabriela Prado Bustamante.Executive Vice President of Risk Management (see “Item 6. Directors, Senior Management and Employees—Directors and senior management—Interbank—Executive Officers”).
•
Julio Del Valle Montero.Executive Vice President of Human Resources (see “Item 6. Directors, Senior Management and Employees—Directors and senior management—Interbank—Executive Officers”).
•
Zelma Acosta-Rubio Rodríguez. Executive Vice President of Corporate and Legal Affairs (see “Item 6. Directors, Senior Management and Employees—Directors and senior management—General—Executive Officers”).
•
Alexander Woodman Navarrete. Executive Vice President of Retail Banking and Channels (see “Item 6. Directors, Senior Management and Employees—Directors and senior management—Interbank—Executive Officers”).
•
Víctor Cárcamo Palacios.Executive Vice President for Commercial Banking (see “Item 6. Directors, Senior Management and Employees—Directors and senior management—Interbank—Executive Officers”).
•
Andrés Felipe Castrillón Henao has served as Interbank’s Cybersecurity and Information Security Manager since July 2019 and as its secretary of the Information Security and Cybersecurity Committee. Before joining Interbank, Mr. Castrillón worked for Grupo Bancolombia, where he held the position of Corporate Cybersecurity and Information Security Manager, among other roles in the practice of cybersecurity. In this capacity, he collaborated with the banks of Grupo Bancolombia in Colombia, Panama, El Salvador, and Guatemala. Mr Castrillón is also member of the Strategic Security Risk Committee of Association of Banks of Peru (ASBANC, by its Spanish acronym). Mr. Castrillón received a bachelor's degree in systems engineering from Universidad de Antioquia and he has participated in strategic management and business management programs at Universidad de la Sabana. Additionally, he holds certifications as a Certified Information Security Manager (CISM) and a Certified in Risk and Information Systems Control (CRISC) from the Information Systems Audit and Control Association (ISACA).
Insurance Segment
Risk management and strategy
Interseguro has a framework for comprehensive risk management, including cybersecurity risks. The framework establishes procedures for the identification, assessment, mitigation, and communication of cybersecurity risks.
While the Information Security and Cybersecurity unit is responsible for providing methodological support for cybersecurity risk management and defining control policies and procedures, the function extends across business and support units, which are accountable for the risks. Additionally, an audit layer has been established to independently assess the performance of the defined management framework.
Interseguro’s strategy focuses on the implementation of measures to prevent, detect, respond and recover from cybersecurity threats in a global environment where the materialization of cybersecurity risks continues to increase. These measures have primarily centered around improving identity and access management controls, both in preventive aspects and monitoring activities. Additionally, the governance framework has been strengthened through the updating of information security policies and associated procedures, along with the reinforcement of vulnerability identification processes through red team exercises.
In 2024, Interseguro developed the following main cybersecurity initiatives to further consolidate its posture to face cybersecurity risks:
•
Following a Zero Trust approach, multi-factor authentication (MFA) has been implemented for all network users to reduce the risk of unauthorized access, and enhance overall identity protection.
•
Security patching procedures have been strengthened in both coverage and frequency, improving vulnerability remediation rates across all workstations.
•
Secure data disposal procedures have been implemented for decommissioned devices to ensure the permanent removal of sensitive information, mitigate the risk of unauthorized access, and ensure compliance with data protection regulations.
230
•
Hard Disk encryption has been implemented on workstations to enhance information security, ensuring the protection of sensitive data against unauthorized access and mitigating the risk of breaches or data loss.
In 2024, Interseguro carried out awareness initiatives, including internal communications through informative bulletins and simulated social engineering attack campaigns. These efforts aimed to enhance employee awareness of such threats, assess their ability to recognize them, and promote effective reporting. Additionally, Interseguro conducted a tabletop exercise with senior management and technical incident response teams to strengthen the organization's capabilities in responding to potential security breaches.
During 2024, Interseguro did not have any cybersecurity incidents that materially affected it or were reasonably likely to materially affect it.
Governance
Interseguro’s board of directors has established a Risk Committee to oversee risk management within the organization, including cybersecurity risks, with the participation of certain of Interseguro board members. This committee approves and oversees the implementation of the strategy, policies and procedures for cyber risk management, reports information on pertinent vulnerabilities and their corresponding correction plans and communicates incidents as they occur.
The board of directors has also set up an Audit Committee, with the participation of certain board members, to which the Interseguro internal audit unit reports on assessments of the cybersecurity management model and on the compliance with improvement plans related to these assessments.
Additionally, Interseguro’s management has established a Cyber and Information Security Committee which monitors the development of the defined strategy, analyzes information about relevant vulnerabilities and the related correction plans, and to which the occurrence of incidents is communicated. This committee is composed by:
•
Gonzalo José Basadre Brazzini Chief Executive Officer(see “Item 6. Directors, Senior Management and Employees—Directors and senior management—Interseguro—Executive Officers”).
•
Sergio Jhasmany Soliz Bilbao Vice President of Information Technology(see “Item 6. Directors, Senior Management and Employees—Directors and senior management—Interseguro—Executive Officers”).
•
Carlos Vereau Montenegro has served as Risk Manager since July 2011. Mr. Vereau received a bachelor’s degree in economics from Universidad del Pacífico and holds a master´s in administration from Universidad del Pacífico.
•
Carlos Campos Cabrera has served as Interseguro’s Head of Information Security and Cybersecurity since March 2023. Mr. Campos received a bachelor’s degree systems engineering from Universidad San Ignacio de Loyola and holds a master´s in business administration from Universidad Peruana de Ciencias Aplicadas. Additionally, he holds certifications as a ISO 27032 Lead Cybersecurity Manager and ISO 27001 ISMS Lead Implementer from the Professional Evaluation and Certification Board (PECB).
Wealth Management Segment
Risk management and strategy
Inteligo has a framework for comprehensive risk management, including cybersecurity risks. The framework establishes procedures for the identification, assessment, mitigation, and communication of cybersecurity risks.
While the Information Security unit is responsible for providing methodological support for cybersecurity risk management and defining control policies and procedures, the function extends across business and support units, which are accountable for the risks. Additionally, an audit layer has been established to independently assess the performance of the defined management framework.
As a part of its cybersecurity strategy, Inteligo has strengthened its identification, protection, detection and action cybersecurity plans, which reduced the occurrence of attacks and mitigated the risk of cyber threats. This strategy is based on the cybersecurity framework of the National Institute of Standards and Technology (NIST), and other standards such as ISO 27000 and 27032. Inteligo’s cybersecurity strategy includes improvements to security on different fronts, including mobile devices, workstations, in the cloud and on premises. Inteligo uses updated technology such as behavior analysis and artificial intelligence, which allow its human resources to reduce time spent on threat detection and analysis.
231
In 2024, Inteligo implemented the following main cybersecurity initiatives to further strengthen its stance in addressing cybersecurity risks:
•
Network Detection and Response (NDR) capabilities have been implemented, strengthening the organization's ability to identify and respond to threats.
•
The detection and response layer of the Security Operations Center (SOC) has been enhanced through improvements in existing EDR, SOAR, and XDR detection and response technologies.
•
Following a Zero Trust approach, Zero Trust Network Access (ZTNA) capabilities have been implemented for third-party connectivity to the corporate network.
•
Privileged Access Management (PAM) coverage has been strengthened.
•
New services have been implemented for brand abuse monitoring and the takedown of fraudulent sites, mitigating the potential impact of phishing vectors targeting customers.
•
A Cyber Risk insurance has been contracted as a risk treatment mechanism to address the potential materialization of a critical incident.
In 2024, Inteligo executed awareness actions including simulated social engineering attack campaigns, and newsletters and informative bulletins.
During 2024, Inteligo did not have any cybersecurity incidents that materially affected it or were reasonably likely to materially affect it.
Governance
Inteligo’s board of directors has established a Risk Management Committee to oversee risk management within the organization, including cybersecurity risks, with board members participating. This committee approves and oversees the implementation of the strategy policies and procedures for cyber risk management, reports information on pertinent vulnerabilities and their corresponding correction plans and communicates incidents as they occur.
In addition to the Directors who make up the committee, the following executive officers and managers are committee members:
•
Victor Vinatea Cámere Chief Executive Officer of the Panamanian Branch and Inteligo’s Chief Operations Officer (see “Item 6. Directors, Senior Management and Employees—Directors and senior management—Inteligo—Executive Officers”).
•
Cesar Pasara Ponce has served as Corporate Risk Officer since April 2021. Mr. Pasara received a bachelor’s degree in industrial engineering from Pontificia Universidad Católica del Perú and holds a master´s in business administration from IE Business School.
•
Peter Stanziola has served as Finance Manager from October 2018. Mr. Stanziola received a bachelor’s degree in economics and chemistry from University of Pennsilvania and holds a master´s in business administration from The Fuqua School of Business at Duke University.
The board of directors has also set up an Audit Committee, with the participation of certain board members, to which the Inteligo internal audit unit reports on assessments of the cybersecurity management model and on the compliance with improvement plans related to these assessments.
Additionally, Inteligo’s management has established an Information Security Committee which monitors the development of the defined strategy, analyzes information about relevant vulnerabilities and the related correction plans, and to which the occurrence of incidents is communicated. This committee is composed by:
•
Victor Vinatea Cámere Chief Executive Officer of the Panamanian Branch and Inteligo’s Chief Operations Officer (see “Item 6. Directors, Senior Management and Employees—Directors and senior management—Inteligo—Executive Officers”).
•
Josué Meneses has served as Information Security Manager since January 2010. Mr. Meneses received a bachelor’s degree in systems engineering from Universidad Tecnológica de Panamá and holds a master’s degree in Informatic Management from Universidad Latina de Panamá.
232
•
Alfredo Castro has served as Information Technology Manager since September 2022. Mr. Castro received a bachelor’s degree in systems engineering from Universidad Latina de Panamá and holds a master’s in business administration from Universidad de Chile.
•
Rogelio Chavez Lopez has served as Risk Manager since December 2013. Mr. Chavez received a bachelor’s degree in economics and finance from Universidad de Panamá and holds a master´s in business administration from Universidad Interamericana de Panamá.
233
PART III
ITEM 17. FINANCIAL STATEMENTS
We have responded to Item 18 in lieu of this item.
ITEM 18. FINANCIAL STATEMENTS
Our audited consolidated financial statements are included in this Annual Report on Form 20-F beginning at page F-1. Our financial statements have been prepared in accordance with IFRS as issued by the IASB.
Inline XBRL Taxonomy Extension Schema With Embedded Linkbase Documents
104**
Cover Page Interactive Data File (formatted as Inline XBRL and contained in Exhibit 101)
(*) Previously filed.
(**) Filed herewith.
Omitted from the exhibits filed with this Annual Report on Form 20-F are certain instruments and agreements with respect to our long-term debt, none of which authorizes securities in a total amount that exceeds 10% of our total assets and our subsidiaries on a consolidated basis. We hereby agree to furnish to the SEC copies of any such omitted instruments or agreements as the SEC requests.
234
SIGNATURE
The registrant, INTERCORP FINANCIAL SERVICES INC., hereby certifies that it meets all of the requirements for filing on Form 20-F and that it has duly caused and authorized the undersigned to sign this Annual Report on Form 20-F on its behalf.
Date: April 25, 2025
INTERCORP FINANCIAL SERVICES INC.
By
/s/ Luis Felipe Castellanos López Torres
Name:
Luis Felipe Castellanos López Torres
Title:
Chief Executive Officer
235
Intercorp Financial Services Inc. and Subsidiaries
Consolidated financial statements as of December 31, 2024 and 2023, together with the Report of Independent Registered Public Accounting Firm
F-1
Intercorp Financial Services Inc. and Subsidiaries
Consolidated financial statements as of December 31, 2024 and 2023, together with the Report of Independent Registered Public Accounting Firm
Content
Report of Independent Registered Public Accounting Firm
F-3
Consolidated financial statements
Consolidated statement of financial position
F-8
Consolidated statement of income
F-9
Consolidated statement of other comprehensive income
F-10
Consolidated statement of changes in equity
F-11
Consolidated statement of cash flows
F-12
Notes to the consolidated financial statements
F-14
F-2
Report of Independent Registered Public Accounting Firm
To the Shareholders and Board of Directors of Intercorp Financial Services Inc.
Opinion on the Financial Statements
We have audited the accompanying consolidated statements of financial position of Intercorp Financial Services Inc. and subsidiaries (the “Company”) as of December 31, 2024 and 2023, the related consolidated statements of income, other comprehensive income, changes in equity and cash flows for each of the three years in the period ended December 31, 2024, and the related notes (collectively referred to as the "consolidated financial statements"). In our opinion, the consolidated financial statements present fairly, in all material respects, the financial position of the Company at December 31, 2024 and 2023, and the results of its operations and its cash flows for each of the three years in the period ended December 31, 2024, in conformity with IFRS Accounting Standards as issued by the International Accounting Standards Board.
We also have audited, in accordance with the standards of the Public Company Accounting Oversight Board (United States) (PCAOB), the Company’s internal control over financial reporting as of December 31, 2024, based on criteria established in Internal Control-Integrated Framework issued by the Committee of Sponsoring Organizations of the Treadway Commission (2013 framework) and our report dated April 25, 2025 expressed an unqualified opinion thereon.
Basis for Opinion
These financial statements are the responsibility of the Company's management. Our responsibility is to express an opinion on the Company's financial statements based on our audits. We are a public accounting firm registered with the PCAOB and are required to be independent with respect to the Company in accordance with the U.S. federal securities laws and the applicable rules and regulations of the Securities and Exchange Commission and the PCAOB.
We conducted our audits in accordance with the standards of the PCAOB. Those standards require that we plan and perform the audit to obtain reasonable assurance about whether the financial statements are free of material misstatement, whether due to error or fraud. Our audits included performing procedures to assess the risks of material misstatement of the financial statements, whether due to error or fraud, and performing procedures that respond to those risks. Such procedures included examining, on a test basis, evidence regarding the amounts and disclosures in the financial statements. Our audits also included evaluating the accounting principles used and significant estimates made by management, as well as evaluating the overall presentation of the financial statements. We believe that our audits provide a reasonable basis for our opinion.
Critical audit matters
The critical audit matters communicated below are matters arising from the current period audit of the financial statements that were communicated or required to be communicated to the audit committee and that: (1) relate to accounts or disclosures that are material to the financial statements and (2) involved our especially challenging, subjective or complex judgments. The communication of critical audit matters does not alter in any way our opinion on the consolidated financial statements, taken as a whole, and we are not, by communicating the critical audit matters below, providing separate opinions on the critical audit matters or on the accounts or disclosures to which they relate.
F-3
Report of Independent Registered Public Accounting Firm (continued)
Expected credit loss on loan portfolio
Description of the matter
At December 31, 2024, the impairment allowance for loans was S/1,730,167 thousand. As disclosed in Notes 3.4(i)(ii), 6 and 29.1(d) to the consolidated financial statements, the impairment allowance for loans is calculated using an expected credit loss (ECL) model. The determination of the ECL is based on the credit losses expected to arise over the life of the asset as a result of a significant increase in credit risk - since origination or when there is objective evidence of impairment. ECL allowances are measured at amounts equal to either 12-month or lifetime ECLs. The ECL calculation is based on key elements being the probability of default, the exposure to the default and the loss given default, which are determined based on macroeconomic variables as forward-looking information inputs. When estimating ECLs, the Company considers three scenarios (optimistic, base and pessimistic), which are associated with different probability of default. Also, as disclosed in Note 29.1(d.8) to the consolidated financial statements, the Company has estimated the impact of governmental decisions regarding the withdrawal of Compensation for Service Time (CTS) deposits and of funds managed by the Administrators of Private Pension Funds (AFP), which resulted in a one-time improvement of consumers’ credit scores, by including a post-model adjustment to the ECL model.
Auditing the impairment allowance for loans was complex and required the application of significant judgment due to the inherent complexity of the models, assumptions, judgments, the forward-looking nature of key assumptions and the interrelationship of the critical variables in measuring the ECL. Significant assumptions and judgments with respect to the estimation of the allowance for credit losses include the determination of when a loan has experienced a significant increase in credit risk; the forecast of forward looking information for multiple economic scenarios and the probability weighting of those scenarios; the calculation of both 12-month and lifetime credit losses; and the application of expert credit judgment as a post-model adjustment. The allowance for credit losses is a significant estimate for which variations in model methodology, assumptions and judgments can have a material effect on the measurement of expected credit losses.
How we addressed the matter in our audit
We obtained an understanding, evaluated the design, and tested the operating effectiveness of management’s controls over the calculation of the ECL and the significant assumptions described above, including those related to the post-model adjustment for the impact of CTS deposit and AFP fund withdrawals. The controls we tested included, amongst others, controls over the identification of indicators of impairment, the determination of significant changes in credit risk, and management’s review and approval of models used to calculate the ECL, including the data inputs and outputs of those models; testing controls over the risk-rating process, and the governance and oversight controls over the review of the overall ECL.
To test the ECL, our audit procedures included, amongst others, involving our professionals with specialized skills in credit risk to assess whether the methodology and assumptions used to estimate ECLs were consistent with the requirements of IFRS Accounting Standards. We assessed significant changes in credit risk triggers, management’s forecasting methodology and compared management’s forward-looking information to publicly available information from third party sources. Also, we assessed management’s post-model adjustment estimate for the impact of CTS deposit and AFP fund withdrawals, performed independent recalculations for the expected credit loss and for a sample of portfolio their respective risk parameters, and we tested the completeness and accuracy of data used in the measurement of the ECL. We also assessed the adequacy of the related financial statement disclosures.
F-4
Report of Independent Registered Public Accounting Firm (continued)
Determination of the discount rate used to measure the liability for remaining coverage of the Company’s pension insurance contracts under the general model
Description of the matter
As discussed in Notes 3.4(d) and 14 to the consolidated financial statements, at December 31, 2024, the Company’s insurance and reinsurance contract liabilities were S/12,524,320 thousand, principally comprised of pension insurance contracts that are measured under the general model or building-block approach (BBA). The estimate of this liability is impacted by actuarial assumptions used in the general model, principally by the determination of the discount rate.
Auditing the liability for remaining coverage of the Company’s pension insurance contracts under the general model was complex and required the application of significant auditor judgment and involvement of specialists due to the actuarial models and highly judgmental nature of the most significant actuarial assumption related to the discount rate used by management to estimate the liability. Changes in this assumption could have material effects on the valuation of the remaining coverage of the Company’s pension insurance contract liabilities.
How we addressed the matter in our audit
We obtained an understanding, evaluated the design, and tested the operating effectiveness of management’s controls, related to the valuation of the liability for remaining coverage of the Company’s pension insurance contracts under the general model. This included testing the governance and oversight controls over the review of the actuarial models, the actuarial assumptions including the discount rate and the data inputs used.
To test the balance of this liability, our audit procedures included, among others, comparing the methodology, actuarial models and actuarial assumptions, including the discount rate, used by the Company considering actuarial practices under IFRS 17, and testing the completeness and accuracy of the underlying data used in the valuation. We involved our actuarial specialists to assist us in assessing Management’s assumptions, methodologies and models. Our actuarial specialists also performed an independent calculation of the liability for remaining coverage of the Company’s pension insurance contracts under the general model. In addition, our actuarial specialists performed independent sensitivity analyses over the significant actuarial assumptions. We also assessed the adequacy of the related financial statement disclosures.
/s/ Tanaka, Valdivia, & Asociados S. Civil de R.L.
A member of Ernst & Young Global Limited
We have served as the Company‘s auditor since 2006.
Lima, Peru
April 25, 2025
F-5
Report of Independent Registered Public Accounting Firm
To the Shareholders and Board of Directors of Intercorp Financial Services Inc.
Opinion on Internal Control Over Financial Reporting
We have audited Intercorp Financial Services Inc. and subsidiaries’ internal control over financial reporting as of December 31, 2024, based on criteria established in Internal Control—Integrated Framework issued by the Committee of Sponsoring Organizations of the Treadway Commission (2013 framework), (the COSO criteria). In our opinion, Intercorp Financial Services Inc. and subsidiaries (the Company) maintained, in all material respects, effective internal control over financial reporting as of December 31, 2024, based on the COSO criteria.
We also have audited, in accordance with the standards of the Public Company Accounting Oversight Board (United States) (PCAOB), the consolidated statements of financial position of the Company as of December 31, 2024 and 2023, and the related consolidated statements of income, other comprehensive income, changes in equity and cash flows for each of the three years in the period ended December 31, 2024, and the related notes and our report dated April 25, 2025, expressed an unqualified opinion thereon.
Basis for Opinion
The Company’s management is responsible for maintaining effective internal control over financial reporting and for its assessment of the effectiveness of internal control over financial reporting included in the accompanying Management’s Report on Internal Control Over Financial Reporting. Our responsibility is to express an opinion on the Company’s internal control over financial reporting based on our audit. We are a public accounting firm registered with the PCAOB and are required to be independent with respect to the Company in accordance with the U.S. federal securities laws and the applicable rules and regulations of the Securities and Exchange Commission and the PCAOB.
We conducted our audit in accordance with the standards of the PCAOB. Those standards require that we plan and perform the audit to obtain reasonable assurance about whether effective internal control over financial reporting was maintained in all material respects.
Our audit included obtaining an understanding of internal control over financial reporting, assessing the risk that a material weakness exists, testing and evaluating the design and operating effectiveness of internal control based on the assessed risk, and performing such other procedures as we considered necessary in the circumstances. We believe that our audit provides a reasonable basis for our opinion.
F-6
Report of Independent Registered Public Accounting Firm (continued)
Definition and Limitations of Internal Control Over Financial Reporting
A company’s internal control over financial reporting is a process designed to provide reasonable assurance regarding the reliability of financial reporting and the preparation of financial statements for external purposes in accordance with generally accepted accounting principles. A company’s internal control over financial reporting includes those policies and procedures that (1) pertain to the maintenance of records that, in reasonable detail, accurately and fairly reflect the transactions and dispositions of the assets of the company; (2) provide reasonable assurance that transactions are recorded as necessary to permit preparation of financial statements in accordance with generally accepted accounting principles, and that receipts and expenditures of the company are being made only in accordance with authorizations of management and directors of the company; and (3) provide reasonable assurance regarding prevention or timely detection of unauthorized acquisition, use, or disposition of the company’s assets that could have a material effect on the financial statements.
Because of its inherent limitations, internal control over financial reporting may not prevent or detect misstatements. Also, projections of any evaluation of effectiveness to future periods are subject to the risk that controls may become inadequate because of changes in conditions, or that the degree of compliance with the policies or procedures may deteriorate.
/s/ Tanaka, Valdivia, & Asociados S. Civil de R.L.
A member of Ernst & Young Global Limited
Lima, Peru
April 25, 2025
F-7
Intercorp Financial Services Inc. and Subsidiaries
Consolidated statement of financial position
As of December 31, 2024 and 2023
Note
2024
2023
Note
2024
2023
S/(000)
S/(000)
S/(000)
S/(000)
Assets
Liabilities and equity
Cash and due from banks
4(a)
Deposits and obligations
11
Non-interest bearing
4,021,880
3,059,226
Non-interest bearing
7,614,593
7,960,318
Interest bearing
7,973,580
6,038,794
Interest bearing
46,153,435
41,227,916
Restricted funds
619,766
720,691
53,768,028
49,188,234
12,615,226
9,818,711
Inter-bank funds
4(e)
-
119,712
Inter-bank funds
4(e)
220,060
524,915
Due to banks and correspondents
12
7,562,057
9,025,930
Financial investments
5
26,857,925
26,721,991
Bonds, notes and other obligations
13
6,075,433
5,551,629
Loans, net
6
Due to customers on acceptances
9,163
40,565
Loans, net of unearned interest
50,959,615
48,869,807
Insurance and reinsurance contract liabilities
14
12,524,320
12,207,536
Impairment allowance for loans
(1,730,167
)
(2,349,425
)
Other accounts payable, provisions and other liabilities
10
4,445,532
3,407,360
49,229,448
46,520,382
Deferred income tax liability, net
15
140,653
75,712
Total liabilities
84,525,186
79,616,678
Equity
16
Equity attributable to IFS’s shareholders:
Capital stock
1,038,017
1,038,017
Investment property
7
1,381,788
1,298,892
Treasury stock
(206,997
)
(84,309
)
Property, furniture and equipment, net
8
814,432
804,832
Capital surplus
532,771
532,771
Due from customers on acceptances
9,163
40,565
Reserves
8,300,000
6,000,000
Intangibles and goodwill, net
9
1,667,753
1,687,120
Unrealized results, net
(187,830
)
(457,793
)
Other accounts receivable and other assets, net
10
2,670,178
2,125,148
Retained earnings
1,439,274
2,921,531
Reinsurance contract assets
14
18,602
26,287
10,915,235
9,950,217
Deferred income tax asset, net
15
19,206
55,936
Non-controlling interest
63,360
57,884
Total equity
10,978,595
10,008,101
Total assets
95,503,781
89,624,779
Total liabilities and equity
95,503,781
89,624,779
F-8
Intercorp Financial Services Inc. and Subsidiaries
Consolidated statement of income
For the years ended December 31, 2024, 2023 and 2022
Note
2024
2023
2022
S/(000)
S/(000)
S/(000)
Interest and similar income
19
7,029,391
7,120,411
5,871,302
Interest and similar expenses
19
(2,480,270
)
(2,592,366
)
(1,661,689
)
Net interest and similar income
4,549,121
4,528,045
4,209,613
Impairment loss on loans, net of recoveries
6(d.1) and (d.2)
(1,720,179
)
(1,981,818
)
(830,551
)
Loss due to impairment of financial investments
5(c) and 5(d)
(47,521
)
(7,500
)
(12,752
)
Net interest and similar income after impairment loss
2,781,421
2,538,727
3,366,310
Fee income from financial services, net
20
1,142,943
1,178,462
1,137,386
Net gain on foreign exchange transactions
433,691
306,431
380,154
Net gain (loss) on sale of financial investments
26,544
6,431
(14,285
)
Net gain (loss) on financial assets at fair value through profit or loss
5(e) and 10(b)
81,990
15,181
(308,256
)
Net gain on investment property
7(b)
128,164
73,072
84,631
Other income
21
121,222
156,700
400,181
1,934,554
1,736,277
1,679,811
Result from insurance activities
22
(169,789
)
(178,392
)
(252,854
)
Other expenses
Salaries and employee benefits
23
(955,246
)
(897,275
)
(870,480
)
Administrative expenses
24
(1,336,954
)
(1,288,862
)
(1,179,788
)
Depreciation and amortization
8(a) and 9(a)
(413,057
)
(379,038
)
(336,226
)
Other expenses
21
(194,959
)
(184,992
)
(240,644
)
(2,900,216
)
(2,750,167
)
(2,627,138
)
Income before translation result and Income Tax
1,645,970
1,346,445
2,166,129
Exchange difference
(24,144
)
8,427
(25,478
)
Income tax
15(c)
(314,365
)
(275,596
)
(462,537
)
Net profit for the year
1,307,461
1,079,276
1,678,114
Attributable to:
IFS’s shareholders
1,300,078
1,072,728
1,668,026
Non-controlling interest
7,383
6,548
10,088
1,307,461
1,079,276
1,678,114
Earnings per share attributable to IFS’s shareholders, basic and diluted (stated in Soles)
25
11.376
9.327
14.452
Weighted average number of outstanding shares (in thousands)
25
114,287
115,012
115,418
F-9
Intercorp Financial Services Inc. and Subsidiaries
Consolidated statement of other comprehensive income
For the years ended December 31, 2024, 2023 and 2022
Note
2024
2023
2022
S/(000)
S/(000)
S/(000)
Net profit for the year
1,307,461
1,079,276
1,678,114
Other comprehensive income that will not be reclassified to the consolidated statement of income in subsequent periods:
Gains (losses) on valuation of equity instruments at fair value through other comprehensive income
16(e)
3,048
16,220
(21,924
)
Income tax
16(e)
(1,595
)
(157
)
218
Total gain (loss) unrealized that will not be reclassified to the consolidated statement of income
1,453
16,063
(21,706
)
Other comprehensive income to be reclassified to the consolidated statement of income in subsequent periods:
Net movement of debt instruments at fair value through other comprehensive income
16(e)
286,738
1,134,509
(1,833,856
)
Income tax
16(e)
(3,595
)
(3,645
)
8,250
283,143
1,130,864
(1,825,606
)
Insurance reserves at fair value
16(e)
(61,389
)
(970,191
)
1,714,334
Net movement of cash flow hedges
16(e)
(18,605
)
(29,112
)
(62,954
)
Income tax
16(e)
1,402
6,336
8,670
(17,203
)
(22,776
)
(54,284
)
Translation of foreign operations
16(e)
11,747
(21,970
)
(50,165
)
Total gain (loss) unrealized to be reclassified to the consolidated statement of income in subsequent periods
216,298
115,927
(215,721
)
Other comprehensive income for the year
217,751
131,990
(237,427
)
Total comprehensive income for the year, net of income tax
1,525,212
1,211,266
1,440,687
Attributable to:
IFS’s shareholders
1,516,304
1,202,789
1,432,395
Non-controlling interest
8,908
8,477
8,292
1,525,212
1,211,266
1,440,687
F-10
Intercorp Financial Services Inc. and Subsidiaries
Consolidated statement of changes in equity
For the years ended December 31, 2024, 2023 and 2022
Attributable to IFS’s shareholders
Unrealized results, net
Number of shares
Items that will not be reclassified to the consolidated statement of income
Items that will be reclassified to the consolidated statement of income
Issued
In treasury
Capital stock
Treasury stock
Capital surplus
Reserves
Equity instruments at fair value
Debt instruments at fair value
Insurance contracts reserves
Cash flow hedges reserve
Translation of foreign operations
Retained earnings
Total
Non- controlling interest
Total equity, net
(in thousands)
(in thousands)
S/(000)
S/(000)
S/(000)
S/(000)
S/(000)
S/(000)
S/(000)
S/(000)
S/(000)
S/(000)
S/(000)
S/(000)
S/(000)
Balances as of January 1, 2022
115,447
(29)
1,038,017
(3,363)
532,771
5,200,000
(8,787)
(599,626)
(27)
44,878
261,085
2,219,902
8,684,850
49,978
8,734,828
Net profit for the year
—
—
—
—
—
—
—
—
—
—
—
1,668,026
1,668,026
10,088
1,678,114
Other comprehensive income
—
—
—
—
—
—
(21,663)
(1,821,183)
1,711,520
(54,140)
(50,165)
—
(235,631)
(1,796)
(237,427)
Total comprehensive income
—
—
—
—
—
—
(21,663)
(1,821,183)
1,711,520
(54,140)
(50,165)
1,668,026
1,432,395
8,292
1,440,687
Declared and paid dividends, Note 16(a)
—
—
—
—
—
—
—
—
—
—
—
(751,532)
(751,532)
—
(751,532)
Transfer of retained earnings to reserves, Note 16(g)
—
—
—
—
—
800,000
—
—
—
—
—
(800,000)
—
—
—
Dividends paid to non-controlling interest of Subsidiaries
—
—
—
—
—
—
—
—
—
—
—
—
—
(4,511)
(4,511)
Sale of equity instruments at fair value through other comprehensive income, Note 5(g)
—
—
—
—
—
—
(16,313)
—
—
—
—
16,313
—
—
—
Others
—
—
—
—
—
—
-
—
—
—
—
6,755
6,755
—
6,755
Balance as of December 31, 2022
115,447
(29)
1,038,017
(3,363)
532,771
6,000,000
(46,763)
(2,420,809)
1,711,493
(9,262)
210,920
2,359,464
9,372,468
53,759
9,426,227
Net profit for the year
—
—
—
—
—
—
—
—
—
—
—
1,072,728
1,072,728
6,548
1,079,276
Other comprehensive income
—
—
—
—
—
—
16,055
1,127,246
(968,599)
(22,671)
(21,970)
—
130,061
1,929
131,990
Total comprehensive income
—
—
—
—
—
—
16,055
1,127,246
(968,599)
(22,671)
(21,970)
1,072,728
1,202,789
8,477
1,211,266
Declared and paid dividends, Note 16(a)
—
—
—
—
—
—
—
—
—
—
—
(511,788)
(511,788)
—
(511,788)
Purchase of treasury stock, Note 16(b)
—
(938)
—
(80,946)
—
—
—
—
—
—
—
—
(80,946)
—
(80,946)
Dividends paid to non-controlling interest of Subsidiaries
—
—
—
—
—
—
—
—
—
—
—
—
—
(4,242)
(4,242)
Sale of equity instruments at fair value through other comprehensive income, Note 5(g)
—
—
—
—
—
—
(33,433)
—
—
—
—
33,433
—
—
—
Others
—
—
—
—
—
—
—
—
—
—
—
(32,306)
(32,306)
(110)
(32,416)
Balances as of December 31, 2023
115,447
(967)
1,038,017
(84,309)
532,771
6,000,000
(64,141)
(1,293,563)
742,894
(31,933)
188,950
2,921,531
9,950,217
57,884
10,008,101
Net profit for the year
—
—
—
—
—
—
—
—
—
—
—
1,300,078
1,300,078
7,383
1,307,461
Other comprehensive income
—
—
—
—
—
—
1,263
281,695
(61,299)
(17,180)
11,747
—
216,226
1,525
217,751
Total comprehensive income
—
—
—
—
—
—
1,263
281,695
(61,299)
(17,180)
11,747
1,300,078
1,516,304
8,908
1,525,212
Declared and paid dividends, Note 16(a)
—
—
—
—
—
—
—
—
—
—
—
(427,369)
(427,369)
—
(427,369)
Transfer of retained earnings to reserves, Note 16(g)
—
—
—
—
—
2,300,000
—
—
—
—
—
(2,300,000)
—
—
—
Purchase of treasury stock, Note 16(b)
—
(1,192)
—
(122,688)
—
—
—
—
—
—
—
—
(122,688)
—
(122,688)
Dividends paid to non-controlling interest of Subsidiaries
—
—
—
—
—
—
—
—
—
—
—
—
—
(3,056)
(3,056)
Sale of equity instruments at fair value through other comprehensive income, Note 5(g)
—
—
—
—
—
—
53,737
—
—
—
—
(53,737)
—
—
—
Others
—
—
—
—
—
—
—
—
—
—
—
(1,229)
(1,229)
(376)
(1,605)
Balance as of December 31, 2024
115,447
(2,159)
1,038,017
(206,997)
532,771
8,300,000
(9,141)
(1,011,868)
681,595
(49,113)
200,697
1,439,274
10,915,235
63,360
10,978,595
F-11
Intercorp Financial Services Inc. and Subsidiaries
Consolidated statement of cash flows
For the years ended December 31, 2024, 2023 and 2022
2024
2023
2022
S/(000)
S/(000)
S/(000)
Cash flows from operating activities
Net profit for the year
1,307,461
1,079,276
1,678,114
Adjustments to reconcile net profit to net cash flows
Impairment loss on loans, net of recoveries
1,720,179
1,981,818
830,551
Loss due to impairment of financial investments
47,521
7,500
12,752
Depreciation and amortization
413,057
379,038
336,226
Provision for sundry risks
29,290
4,138
12,661
Deferred income tax
100,053
102,244
(442
)
Net (gain) loss on sale of financial investments
(26,544
)
(6,431
)
14,285
Net (gain) loss on financial assets at fair value through profit or loss
(81,990
)
(15,181
)
308,256
Net gain on valuation of investment property
(60,260
)
(7,111
)
(19,146
)
Net loss on sale of investment properties
3,176
—
—
Gain on sale of fixed assets
(12,879
)
(15,300
)
(11,780
)
Fair value adjustment on the participation held by Interbank in Izipay, Note 1(b)
—
—
(222,513
)
Exchange difference
24,144
(8,427
)
25,478
Decrease (increase) in accrued interest receivable
58,688
(167,468
)
(168,454
)
(Decrease) increase in accrued interest payable
(120,753
)
194,285
121,324
Net changes in assets and liabilities
Net increase in loan portfolio
(4,523,015
)
(2,883,998
)
(3,204,130
)
Net (increase) decrease in other accounts receivable and other assets
(245,377
)
(295,748
)
331,287
Net decrease (increase) in restricted funds
100,925
(246,775
)
225,659
Increase (decrease) in deposits and obligations
4,687,587
503,544
(467,213
)
(Decrease) increase in due to banks and correspondents
(1,445,205
)
1,837,830
(1,460,227
)
Increase in other accounts payable, provisions and other liabilities
1,422,823
558,971
498,321
(Increase) decrease of investments at fair value through profit or loss
(125,386
)
323,112
481,087
Income tax paid
(363,463
)
(450,125
)
(334,173
)
Net cash provided by (used in) operating activities
2,910,032
2,875,192
(1,012,077
)
F-12
Consolidated statement of cash flows (continued)
2024
2023
2022
S/(000)
S/(000)
S/(000)
Cash flows from investing activities
Sale (purchase) of investments at fair value through other comprehensive income and at amortized cost
320,182
(3,120,456
)
(857,589
)
Purchase of property, furniture and equipment
(104,719
)
(147,645
)
(135,036
)
Purchase of intangible assets
(245,334
)
(280,388
)
(227,270
)
Purchase of investment property
(61,812
)
(16,903
)
(34,760
)
Sale of investment property
39,176
—
—
Sale of property, furniture and equipment
45,462
32,667
54,313
Purchase of subsidiaries, net of cash received
—
—
(193,215
)
Net cash used in investing activities
(7,045
)
(3,532,725
)
(1,393,557
)
Cash flows from financing activities
Dividends paid
(427,369
)
(511,788
)
(751,532
)
Issuance of securities, bonds and obligations in circulation
1,706,371
-
-
Payments of bonds, notes and other obligations
(1,266,504
)
(2,189,040
)
(137,900
)
Net decrease (increase) in receivable inter-bank funds
304,855
(228,796
)
(266,117
)
Net (decrease) increase in payable inter-bank funds
(121,438
)
91,245
30,482
Purchase of treasury stock, net
(122,688
)
(80,946
)
—
Dividend payments to non-controlling interest
(2,911
)
(4,776
)
(4,174
)
Lease payments
(82,644
)
(89,334
)
(146,982
)
Net cash used in financing activities
(12,328
)
(3,013,435
)
(1,276,223
)
Net increase (decrease) in cash and cash equivalents
2,890,659
(3,670,968
)
(3,681,857
)
Translation gain (loss) on cash and cash equivalents
12,496
37,403
(26,678
)
Cash and cash equivalents at the beginning of the year
9,074,211
12,707,776
16,416,311
Cash and cash equivalents at the end of the year, Note 3.4(ad)
11,977,366
9,074,211
12,707,776
Supplementary cash flow information:
Cash paid by -
Interest
2,426,411
2,253,881
1,395,673
Dividends
430,280
516,564
755,706
Income tax
363,463
450,125
334,173
Cash received from -
Interest
7,025,584
6,905,711
5,620,231
Dividends received
50,862
52,215
88,236
Non-cash transactions -
Recognition of right-of-use assets
105,860
35,901
33,178
Effect on the participation in Izipay prior to its acquisition, Note 1(b)
—
—
(222,513
)
F-13
Intercorp Financial Services Inc. and Subsidiaries
Notes to the consolidated financial statements
As of December 31, 2024 and 2023
1.
Business activity
(a)
Business activity -
Intercorp Financial Services Inc. and Subsidiaries (henceforth "IFS", “the Company” or “the Group”), is a limited liability holding company incorporated in the Republic of Panama on September 19, 2006, and is a subsidiary of Intercorp Peru Ltd. (henceforth “Intercorp Peru”), holding of Intercorp Group incorporated in 1997 in the Commonwealth of the Bahamas. As of December 31, 2024, Intercorp Peru holds directly and indirectly 72.47 percent of the issued capital stock of IFS, equivalent to 71.95 percent of the outstanding capital stock of IFS (71.44 percent of the issued capital stock, equivalent to 71.20 percent of the outstanding capital stock as of December 31, 2023).
IFS’s legal domicile is located at Av. Carlos Villarán 140 Urb. Santa Catalina, La Victoria, Lima, Peru.
As of December 31, 2024 and 2023, IFS holds 99.31 percent and 99.30 percent of the capital stock of Banco Internacional del Peru S.A.A. – Interbank (henceforth “Interbank”), respectively, 99.85 percent and 99.84 percent of the capital stock of Interseguro Compañía de Seguros S.A. (henceforth “Interseguro”), respectively, 100 percent of the capital stock of Inteligo Group Corp. (henceforth “Inteligo”) and 100 percent of Procesos de Medios de Pago and its subsidiary Izipay S.A.C (henceforth and together "Izipay"), acquired in April 2022, see (d).
The operations of Interbank, Interseguro and Izipay are concentrated in Peru, while the operations of Inteligo and its Subsidiaries (Interfondos S.A. Sociedad Administradora de Fondos, Inteligo Sociedad Agente de Bolsa S.A. and Inteligo Bank Ltd.) are mainly concentrated in Peru and Panama.
The main activities of IFS’s subsidiaries and their assets, liabilities, equity, operating income, net income, balances and other relevant information are presented in Note 2.
The consolidated financial statements of IFS and Subsidiaries as of December 31, 2023, and for the year then ended, were approved by the Board of Directors on April 26, 2024. The consolidated financial statements as of December 31, 2024, and for the year then ended, have been approved and authorized for issuance by Management and the Board of Directors on April 25, 2025.
(b)
Acquisition of Procesos de Medios de Pago S.A. and Subsidiary Izipay S.A.C. (“Izipay”)
Until March 2022, the Group (through its subsidiary Interbank) held 50 percent of Izipay. In April 2022, IFS acquired the remaining 50 percent of Izipay's capital stock, thus completing the 100 percent of its capital stock. The amount paid by IFS amounted to US$83,775,000 (equivalent to approximately S/312,647,000). The economic activity of the acquired companies is explained in greater detail in Note 2(g).
The acquisition made by IFS was recorded using the “Step acquisition” accounting method, pursuant to IFRS 3 “Business Combinations”. According to this method, the acquirer company must readjust to fair value the previously held equity interest in the acquiree entities. Additionally, assets and liabilities must be recorded at their fair values estimated at the acquisition date, including the identified intangible assets and the resulting goodwill that were not recorded in the statements of financial position of each acquired entity. As of December 31, 2024, goodwill amounts to S/238,429,000.
As a result of the acquisition and pursuant to the accounting regulation in force, the previous participation was adjusted to its fair value with an effect of S/222,513,000, recorded in September 2022 and presented in the caption "Other income” of the consolidated statement of income, see Note 21. The expenses associated with the acquisition of approximately S/381,000 were presented in the caption “Administrative expenses” of the consolidated statement of income.
F-14
2.
Subsidiaries
IFS’s subsidiaries are the following:
(a)
Banco Internacional del Peru S.A.A. - Interbank and Subsidiaries -
Interbank is incorporated in Peru and is authorized by the Superintendencia de Banca, Seguros y AFP (henceforth “SBS”) to operate as a universal bank in accordance with Peruvian law. Interbank's operations are governed by the General Act of the Banking and Insurance System and Organic Act of the SBS – Act No. 26702 and its amendments (henceforth “the Banking and Insurance Act”), that establishes the requirements, rights, obligations, restrictions and other operating conditions that financial and insurance entities must comply with in Peru.
As of December 31, 2024, Interbank has 149 offices (153 offices as of December 31, 2023). Additionally, it holds approximately 100 percent of the shares of the following Subsidiaries:
Entity
Activity
Internacional de Títulos Sociedad Titulizadora S.A. - Intertítulos S.T.
Manages securitization funds.
Compañía de Servicios Conexos Expressnet S.A.C.
Services related to credit card transactions or products related to the brand “American Express”.
(b)
Interseguro Compañía de Seguros S.A. and Subsidiary -
Interseguro is incorporated in Peru and its operations are governed by the Banking and Insurance Act. It is authorized by the SBS to issue life and general risk insurance contracts.
Interseguro holds participations in Patrimonio Fideicometido D.S.093-2002-EF, Interproperties Peru (henceforth “Patrimonio Fideicometido – Interproperties Peru”), that is a structured entity, incorporated in April 2008, and in which several investors (related parties to the Group) contributed investment properties. Each investor or investors have ownership of and specific control over the contributed investment property. The fair values of the properties contributed by Interseguro that were included in this structured entity as of December 31, 2024 and 2023, amounted to S/89,124,000 and S/85,272,000, respectively; see Note 7. For accounting purposes and under IFRS 10 “Consolidated Financial Statements” the assets included in said structure are considered “silos”, because they are ring-fenced parts of the wider structured entity (the Patrimonio Fideicometido - Interproperties Peru). IFS has ownership and decision-making power over these properties and the Group has the exposure or rights to their returns; therefore, IFS consolidates the silos containing the investment properties that it controls.
(c)
Inteligo Group Corp. and Subsidiaries -
Inteligo is incorporated in the Republic of Panama. As of December 31, 2024 and 2023, it holds 100 percent of the shares of the following Subsidiaries:
Entity
Activity
Inteligo Bank Ltd.
Incorporated in The Commonwealth of the Bahamas and has a branch established in the Republic of Panama that operates under an international license issued by the Superintendence of Banks of the Republic of Panama. Its main activity is to provide private and institutional banking services, mainly to Peruvian citizens.
Inteligo Sociedad Agente de Bolsa S.A.
Brokerage firm incorporated in Peru.
Inteligo Peru Holding S.A.C.
Financial holding company incorporated in Peru in December 2018. As of December 31, 2024 and 2023, it holds 99.99 percent interest in Interfondos S.A. Sociedad Administradora de Fondos, company that manages mutual funds and investment funds.
Inteligo USA, Inc.
Incorporated in the United States of America in January 2019, provides investment consultancy and related services.
F-15
(d)
Negocios e Inmuebles S.A. -
Negocios e Inmuebles is incorporated in Peru, was acquired by IFS as part of the purchase of Seguros Sura and Hipotecaria Sura in year 2017; Note 9(b). As of December 31, 2024 and 2023, Negocios e Inmuebles S.A., holds 8.50 percent of Interse guro’s capital stock .
(e)
San Borja Global Opportunities S.A.C. -
San Borja Global Opportunities is incorporated in Peru. Its corporate purpose is the marketing of products and services through Internet, telephony or related and it operates under the commercial name of Shopstar (online Marketplace) dedicated to the sale of products from different stores locally.
(f)
IFS Management S.A.C. (before IFS Digital S.A.C.) –
IFS Management is incorporated in Peru. Its corporate purpose is to perform any type of investments and related services.
(g)
Procesos de Medios de Pago S.A. and subsidiary Izipay S.A.C. (Izipay) -
Both companies were acquired in April 2022, as detailed in Note 1(b). Procesos de Medios de Pago is dedicated to the development, management and operation of the shared service of transaction processing of credit and debit cards, through the acquirer role for the brands MasterCard, Visa and other private brands; also, it renders the processing service, through the issuer role, to entities of the financial system. Izipay is dedicated to the facilitation of payments and services, offering its services of technological, operating and safety infrastructure through the affiliation of commercial stores, as well as installation and maintenance of infrastructure for transactions through the electronic commerce modality, interconnected with the networks of payment methods processors.
As indicated in Note 1(b), in April 2022, IFS acquired control of Izipay, becoming it its subsidiary. Since then, Izipay consolidates its financial information together with IFS.
F-16
The table below presents a summary of the consolidated financial statements of the main subsidiaries, before adjustments and eliminations for consolidation, as of December 31, 2024 and 2023, in accordance with the IFRS. Additionally, for information on business segments, see Note 27:
Interbank and Subsidiaries
Interseguro
Inteligo and Subsidiaries
2024
2023
2024
2023
2024
2023
S/(000)
S/(000)
S/(000)
S/(000)
S/(000)
S/(000)
Consolidated statement of financial position -
Cash and due from banks
11,666,498
8,598,513
203,945
266,311
533,575
844,965
Financial Investments
11,187,487
11,964,232
13,669,514
12,776,783
1,986,408
1,855,074
Loans, net
47,607,947
45,004,811
—
—
1,622,503
1,519,659
Investment property
—
—
1,381,788
1,298,892
—
—
Total assets
73,626,419
68,437,614
15,706,165
14,741,746
4,316,010
4,374,266
Deposits and obligations
51,144,356
46,053,607
—
—
2,929,343
3,311,719
Due to banks and correspondents
6,963,726
8,669,331
301,139
215,560
265,772
84,004
Bonds, notes and other obligations
4,669,116
4,253,188
335,007
244,599
—
—
Insurance contract liabilities
—
—
12,385,525
12,068,741
—
—
Total liabilities
64,753,475
60,380,895
14,526,553
13,709,303
3,271,899
3,453,408
Equity attributable to IFS’s shareholders
8,872,944
8,056,719
1,179,612
1,032,443
1,044,111
920,858
Consolidated statement of income -
Net interest and similar income
3,752,432
3,712,220
771,400
778,649
69,694
85,556
(Loss) recovery due to impairment on loans, net of recoveries
(1,719,913
)
(1,981,988
)
—
—
(266
)
170
(Loss) recovery due to impairment of financial investments
(982
)
15
(45,910
)
(7,858
)
(585
)
347
Net gain of investment property
—
—
60,260
7,111
—
—
Fee income from financial services, net
791,815
813,279
(10,628
)
(13,431
)
170,955
146,223
Result from insurance activities
—
—
(169,750
)
(178,379
)
—
—
Net profit for the year attributable to IFS’s shareholders
1,007,353
856,149
269,568
359,550
137,336
36,180
F-17
3.
Significant accounting policies
3.1.
Basis of presentation -
The consolidated financial statements have been prepared in accordance with IFRS Accounting Standards as issued by International Accounting Standards Board (henceforth "IASB") and are presented in Soles, which is the functional currency of the Group. All values are rounded to the nearest thousand (S/(000)), except when otherwise indicated.
The preparation of the consolidated financial statements in conformity with the IFRS Accounting Standards, requires Management to make estimations and assumptions that affect the reported amounts of assets, liabilities, revenues and expenses, as well as the disclosure of significant events in the notes to the consolidated financial statements; see Note 3.6.
3.2.
Adoption of new standards and disclosures -
In these consolidated financial statements, the Group has not early adopted any standard, interpretation or amendment that was issued but is not yet effective.
On the other hand, since January 1, 2023, the Group is applying IFRS 17 “Insurance Contracts” (henceforth “IFRS 17”), as allowed by the standard, it was implemented by the Group by restating the comparative information of the period 2022 for insurance contracts within the scope of IFRS 17. Differences arising due to the adoption of IFRS 17 were recognized directly in retained earnings as of January 1, 2022. Therefore, information for 2022 is presented under IFRS 17, whose accounting policy is described in Note 3.4(d) and is comparable to information for 2023 and 2024.
The following standards, interpretations or modifications are applied for the first time in 2024 but, have not had a significant impact on the Group's consolidated financial statements.
- Amendments to IFRS 16 “Leases”: Lease Liability in a Sale and Leaseback
The amendments specify the requirements that a seller-lessee uses in measuring the lease liability arising in a sale and leaseback transaction, to ensure the seller-lessee does not recognize any amount of the gain or loss that relates to the right of use it retains. These amendments had no impact on the Group’s consolidated financial statements.
- Amendments to IAS 1 “Presentation of Financial Statements”: Classification of Liabilities as Current or Non-current
The amendments specify the requirements for classifying liabilities as current or non-current. The amendments clarify:
- What is meant by a right to defer settlement
- That a right to defer must exist at the end of the reporting period
- That classification is unaffected by the likelihood that an entity will exercise its deferral right
- That only if an embedded derivative in a convertible liability is itself an equity instrument, would the terms of a liability not impact its classification
In addition, an entity is required to disclose when a liability arising from a loan agreement is classified as non-current and the entity’s right to defer settlement is contingent on compliance with future covenants within twelve months.
These amendments had no impact on the Group's consolidated financial statements.
- Amendments to IAS 7 “Statement of Cash Flows” and IFRS 7 “Financial Instruments: Disclosures”: Supplier finance arrangements
The amendments clarify the characteristics of supplier finance arrangements and require additional disclosure of such arrangements. The disclosure requirements in the amendments are intended to assist users of financial statements in understanding the effects of supplier finance arrangements on an entity’s liabilities, cash flows and exposure to liquidity risk. These amendments had no impact on the Group’s consolidated financial statements.
3.3.
Basis of consolidation -
The consolidated financial statements comprise the financial statement of IFS and its Subsidiaries (see Note 2).
For consolidation accounting purposes, control is achieved when the Group is exposed, or has rights, to variable returns from its involvement with the investee and has the ability to affect those returns. Specifically, the Group controls an investee if and only if the Group has:
-
Power over the investee (i.e., existing rights that give it the current ability to direct the relevant activities of the investee);
-
Exposure, or rights, to variable returns from its involvement with the investee; and
-
The ability to use its power over the investee to affect its returns.
F-18
Generally, it is presumed that a majority of voting rights entitles to control. To support this presumption and when the Group has less than the majority of votes or similar rights in the investee, the Group considers all relevant facts and circumstances in assessing whether it has power over an investee, including:
-
The contractual arrangement with the other vote holders of the investee;
-
Rights arising from other contractual arrangements; and
-
The Group’s voting rights and potential voting rights.
The Group assesses whether or not it controls an investee if facts and circumstances indicate that there are changes to one or more of the three elements of control. Consolidation with a Subsidiary begins when the Group obtains control over the Subsidiary and ceases when the Group loses control of the Subsidiary. Assets, liabilities, income and expenses of a acquired or disposed subsidiary during the year are included in the consolidated financial statements from the date the Group acquired control until the date the Group ceases the control of the subsidiary.
Profit and loss and each component of other comprehensive income (“OCI”) are attributed to the equity holders of the Group’s parent Company and to the non-controlling interests, even if this results in the non-controlling interests having a deficit balance. When necessary, adjustments are made to the financial statement of Subsidiaries to bring their accounting policies into line with the Group’s accounting policies.
All intra-group assets and liabilities, equity, income, expenses and cash flows relating to transactions between members of the Group are totally eliminated on consolidation.
If the Group loses control over a subsidiary, it derecognizes the related assets (including goodwill), liabilities, non-controlling interest and other components of equity, while any resultant gain or loss is recognized in profit or loss. Any investment retained is recognized at fair value.
Assets in custody or managed by the Group, such as investment funds and others, are not part of the Group’s consolidated financial statements; see Note 3.4(ac).
3.4.
Summary of material accounting policies -
(a)
Foreign currency translation -
Functional and presentation currency:
The Group has determined that its functional and presentation currency is the Sol, because it reflects the economic substance of the underlying events and circumstances relevant to most of the Group’s entities, insofar as its main operations and/or transactions, such as loans granted, financing obtained, sale of insurance premiums, interest and similar income, interest and similar expenses and an important percentage of purchases are established and settled in Soles; in addition, it corresponds to the functional currency to most of the Subsidiaries; except for Inteligo Bank, whose functional currency is the US Dollar.
Because Inteligo Bank has a functional currency different from the Sol, its balances were translated for consolidation purposes using the methodology established by IAS 21 “The Effects of Changes in Foreign Exchange Rates”, as follows:
-
Assets and liabilities at the closing rate at the date of each consolidated statement of financial position.
-
Income and expenses, at the average exchange rate for each month.
As a result of the translation, the Group has recorded the difference in the caption “Exchange differences on translation of foreign operations” in the consolidated statement of other comprehensive income.
Foreign currency balances and transactions:
Foreign currency transactions and balances are those performed in currencies different from the functional currency. Transactions in foreign currencies are initially recorded in the functional currency using the exchange rate at the date of the transaction. Monetary assets and liabilities denominated in foreign currencies are translated into the functional currency using the exchange rate in effect on the reporting date. The differences between the closing rate at the date of each consolidated statement of financial position presented and the exchange rate initially used to record the transactions in foreign currency are recognized in the consolidated statement of income in the period in which they arise, in the caption “Translation result”. Non-monetary assets and liabilities acquired in a foreign currency are recorded at the exchange rate at the date of the initial transaction.
F-19
(b)
Interest income -
(b.1)
Effective interest rate method -
Under IFRS 9 “Financial Instruments”, interest income is recorded using the effective interest rate (“EIR”) method for all financial assets measured at amortized cost, interest rate derivatives for which hedge accounting is applied and the related amortization/recycling effect of hedge accounting. The interest income of financial assets that accrue interest measured at fair value through other comprehensive income according to IFRS 9 is also recorded using the EIR method. Interest expenses are also calculated using the EIR method for all financial liabilities held at amortized cost. EIR is the rate that exactly discounts estimated future cash flows through the expected life of the financial instrument or, when appropriate, a shorter period at the net carrying amount of the financial asset.
The EIR (and therefore, the amortized cost of the financial asset) is calculated by taking into account transaction costs and any discount or premium on the acquisition of the financial asset, as well as fees and costs that are an integral part of the EIR. The Group recognizes interest income using the best estimate of a constant rate of return over the expected life of the financial asset. Therefore, the EIR calculation also considers the effect of potentially different interest rates that may be charged at various stages of the financial asset’s expected life, and other characteristics of the product’s life cycle (including prepayments, penalty interest and charges).
If expectations of fixed rate financial assets’ or liabilities’ cash flows are revised for reasons other than credit risk, then changes to future contractual cash flows are discounted at the original EIR, and the adjustment is recorded as a positive or negative adjustment of the carrying amount of the financial asset in the consolidated statement of financial position with an increase or decrease in Interest revenue.
For floating-rate financial instruments, periodic re-estimation of cash flows to reflect the movements in the market rates of interest also alters the effective interest rate, but when instruments were initially recognized at an amount equal to the principal, re-estimating the future interest payments does not significantly affect the carrying amount of the asset or the liability.
(b.2)
Interest income and similar -
The Group calculates interest income by applying the EIR to the gross carrying amount of non-impaired financial assets.
When a financial asset becomes impaired, and, therefore, it is classified as Stage 3 (as established in Note 3.4(h)), the Group calculates the interest income by applying the EIR at the amortized cost of the asset. If the financial asset “recovers”, as detailed in Note 29.1(d), and is no longer impaired, the Group recalculates the interest income on a gross basis.
For purchased or originated credit-impaired (POCI) assets, as detailed in Note 29.1(d), the Group calculates the interest income by determining the credit-adjusted EIR at the amortized cost of the asset. The credit-adjusted EIR is the interest rate that, at initial recognition, discounts the estimated future cash flows (including credit losses) at the amortized cost of POCI assets.
The interest income for all trading assets, that is, for those that are measured at fair value through profit or loss, are presented under the caption “Net gain of financial assets at fair value through profit or loss” of the consolidated statement of income.
(c)
Banking services commissions -
The Group earns fee and commission income from a diverse range of financial services it provides to its customers. Fee and commission income are recognized at an amount that reflects the consideration to which the Group expects to be entitled in exchange for providing the services.
The performance obligations, as well as the timing of their satisfaction, are identified and determined at the inception of the contract. The Group’s income from contracts do not typically include multiple performance obligations.
When the Group provides a service to its clients, the consideration is invoiced and generally due immediately upon satisfaction of a service provided at a point in time or at the end of the contract period for a service provided over time.
The Group has generally concluded that it is the principal in its revenue arrangements because it typically controls the services before transferring them to the customer.
The fees included in the caption “Fee income from financial services, net” that make up part of the consolidated statement of income include fee income where performance obligations are satisfied at a specific time or over a period of time.
Fee income where performance obligations are satisfied over a period of time include, among others, collection services, funds management, memberships, fees for contingent loans and credit card insurance. Likewise, fee income where performance obligations are satisfied at a specific time include, among others, banking service fees, brokerage and custody services, and credit card fees.
Below is the main income from contracts with customers that are recognized in the consolidated statement of financial position:
F-20
-
Fees receivable for credit cards and certain fees receivable for letters of guarantee included in the caption “Other accounts receivable and other assets, net”, represent the Group’s right to an unconditional consideration (i.e., it only requires the passing of time for the consideration payment). This asset is measured at amortized cost and is subject to impairment specifications under IFRS 9.
-
Deferred income from commissions for letters of guarantee included in the caption “Other accounts payable, provisions and other liabilities”, represent the Group’s obligation to render services to a customer, from whom the Group has received a consideration (or a due amount). A liability for unearned fees and commissions is recognized when the payment is made or when the payment is due (whichever happens first). Unearned fees and commissions are recognized as income when the Group renders the service.
(d)
Insurance contracts –
(d.1) Insurance contracts -
(d.1.1) Initial recognition -
IFS recognizes, under IFRS 17, a group of insurance contracts when the first of the following events occurs:
- The beginning of the coverage period of the group of contracts,
- The date when the first payment from a policyholder in the group becomes due, and
- For a group of onerous contracts, when the group becomes onerous.
Measurement at initial recognition
At initial recognition, the Group measures a group of insurance contracts by the total of:
-The fulfillment cash flows, which comprise:
- Estimates of future cash flows.
- An adjustment to reflect the time value of money and the financial risks related to the future cash flows, to the extent that the financial risks are not included in the estimates of the future cash flows, and
- A risk adjustment for non-financial risk.
- The contractual service margin (“CSM”).
Subsequent measurement
The carrying amount at the end of period of a group of insurance contracts is the sum of:
- The liability for remaining coverage, which comprises:
- The fulfillment of cash flows related to future services
- The contractual service margin (CSM), applicable to insurance contracts valued under the general method (Building Block Approach or “BBA”) or under the Variable Fee Approach (“VFA”).
-The claims incurred liability, which comprises the fulfillment cash flows related to future services.
(d.1.2) Levels of aggregation -
Insurance contract portfolios-
The first level of aggregation for insurance contracts consists of determining the portfolio. An insurance portfolio is composed by a group of contracts subject to similar risks and managed together.
The Group has deemed that the following factors are relevant when defining the insurance portfolios in effect:
- Products lines and their differentiated management, separating the products by pensions, life, and general insurance, and below them, based on the specific covered risks: savings, risk, annuities, and accidents, among others. There are not separations of risks within the same contract because they are jointly managed.
- Contract limits: differentiating in equal contracts or shorter than one year and longer than four years.
- Individual or collective insurances policies.
- Policy currency: differentiating between policies denominated in different currencies. Currently, the currencies considered are the Sol, the US Dollar, and Sol VAC.
- Funeral expense cover (in currency VAC): a different portfolio is considered because it is understood that its risk management is different from the management of the main risk of the product Annuity (SPP and Private). This criterion is only applicable to funeral VAC of the pensions (SPP and Private), which are adjusted based on the consumer price index published by the regulator.
- The assessment based on the indicated attributes continues to be performed for the new products that may be designed and marketed in the future.
F-21
Cohorts -
The second level of aggregation is the cohort level, whereby the Group does include in the same group contracts issued more than one year apart. Contract issued between January 1 and December 31 of each year are included within each cohort for each portfolio.
Grouping by onerosity -
The last grouping level that the Group applies is in function of the expected profitability level or the onerosity at the moment of the contract issuance. Given that the standard requires at least three groups, the Group foresees that the products by level of profitability or onerosity will be grouped into two groups:
-Groups of contracts that are onerous at initial recognition, if any.
-Groups of non-onerous contracts: Include contracts that at initial recognition have no significant possibility of becoming onerous subsequently and the remaining non-onerous contracts at initial recognition.
The Group has defined a ratio to differentiate these groups. In this sense, even though it is foreseen that there will be two groups by profitability level, the groups that will eventually be determined will depend on the compliance of the ratio on the predetermined threshold.
(d.1.3) Valuation methods -
The Group applies the following valuation methods in the measurement of insurance contracts:
-Building Block Approach (“BBA”). This method will be applied by default to insurance contracts unless conditions exist to apply any of the other two methods.
-Two BBA variants. The first one will be applied compulsorily if the conditions for it are met, and the second one will be applied optionally if conditions are met:
- Variable Fee Approach (“VFA”)
- Premium Allocation Approach (“PAA”)
The application of one or the other method affects the measurement of the liability for remaining coverage (“LRC”) because the liability for incurred claims (“LIC”) refers to all cash flows allocated for the payment of claims and related expenses that, although incurred, have not yet been settled. This includes claims that have already occurred, but, for some reason have not been reported yet.
Building Block Approach (BBA) -
This method is applied to contracts with coverage periods longer than one year and whose liability flows do not depend on underlying elements. IFS measures a group of insurance contracts (unit of account) by the total of fulfillment cash flows and the CSM. The following are the elements details of this component group:
-Fulfillment Cash Flows (“FCF”): the fulfillment cash flows are comprised of the following elements:
- Estimation of future cash flows: Weighted estimation by the probability of future cash outflows occurrence minus the future cash inflows from the fulfillment of the contract. It is necessary to consider solely the cash flows that are within the limits of the insurance contract and the attributable acquisition expenses must be included.
The Group revises the estimations performed in the preceding valuation period and updates them so that they reflect the conditions at the valuation date, and that the changes made to the estimation represent the modifications of the period’s conditions.
- Discount effect: IFRS 17 establishes that the fulfillment cash flows are adjusted to reflect the time value of money and the financial risks related to the future cash flows. The estimation of cash flows and the inclusion of the discount effect may result in the best estimate liability (“BEL”). In the discount rate estimation procedure, observable market values are used; for pensions contracts, the Matching Adjustment Discount Rate is mainly used and for individual life contracts, the Risk Free Rate – USA is mainly used.
- Risk Adjustment (“RA”): Represents the compensation that an entity requires to bear the non-financial risk that arises from the uncertainty over the cash flows regarding their amount and the moment of payment of the future cash flows, and it is calculated in an explicit and separate manner from the cash flows. Likewise, the risk adjustment also reflects the risk aversion degree and the diversification degrees that the entity includes to determine the compensation to bear such non-financial risks.
F-22
- CSM: Represents the expected profit from the insurance contracts, which is recognized in profit or loss as the service is rendered. The recognition of the CSM throughout the contract’s life is made in a systematic manner and consistently with the rendering of the service provided by the insurance contract in the future.
Variable Fee Approach (VFA) –
The VFA valuation method is intended for insurance contracts with a direct component participation of the insured (the valuation risk is that of the insured) whereby at initial recognition the following conditions are met:
- The contractual terms specify that the policyholder takes part in a clearly identified set of underlying elements;
- The entity expects to pay the policyholder an amount equal to a substantial part of the profitability at fair value (market value) of the underlying elements; and
- The entity expects that a substantial part of any change in the amounts payable to the policyholder varies with the change in fair value of the underlying elements.
The VFA method has the following characteristics:
- In the CSM, market interest is credited.
- In the CSM the difference in the value of the funds of the underlying asset's funds is adjusted.
- The other components remain the same as the BBA method.
Premium Allocation Approach (PAA) -
The PAA valuation method is a simplification of the general method and its application is optional. The entity only applies the simplified method to contracts if one of the following criteria is met:
- For contracts longer than one year, the simplification results in a liability for remaining coverage that does not materially differ from that generated by the general model (BBA); or
- The coverage period of the group of contracts is one year or shorter. The criterion that defines the one-year period must be determined according to the contract limits.
To assign the appropriate valuation method to the insurance contracts issued, the Group has assessed the valuation requirements under each method, as well as the minimum criteria and possible approaches for the eligibility of the PAA method and the VFA method. The following are the valuation methods assigned to each product:
- Life: BBA, PAA or VFA, depending on the characteristics and evaluation of the contract
- Pensions: BBA
- General insurance: BBA or PAA, depending on the characteristics and evaluation of the contract
(d.1.4) Accounts receivable from insurance activities -
Accounts receivable from insurance activities of the Group are initially recognized when they are enforceable and are measured at the fair value of the compensation received or receivable. Therefore, at initial recognition, insurance receivables are measured at amortized cost. The carrying amount of insurance receivables is subject to impairment when events or circumstances indicate that the carrying amount cannot be recoverable; the impairment loss is recorded in the consolidated statement of income.
(d.1.5) Insurance contract liability with investment component -
When the contract has a financial component and transfers no relevant insurance risk as established by IFRS 17, the contract is recorded based on IFRS 9. These contracts are presented in the caption “Other accounts payable, provisions and other liabilities” as “Contract liabilities with investment component” of the consolidated statement of financial position; see Note 10(a).
F-23
(d.2) Exchange difference in insurance contract liabilities -
According to IAS 21 “Effects of variations in foreign currency exchange rates”, for the purpose of converting insurance contracts in foreign currency into the functional currency of the Company, they are treated as a monetary item. Exchange differences on remeasurement of the insurance contract liability are recognized in the profit or loss, except for exchange differences related to the interest rate effect for contracts under BBA method, which are recognized in “Other comprehensive income” together with the annual movements of the interest rate effect.
(d.3) Recognition of income and expenses -
The Group recognizes income and expenses for the following changes in the carrying amount of the liability for remaining coverage (LRC):
-Income from ordinary insurance activities: for the decrease in the LRC due to the service rendered in the period.
-Expenses of the insurance service: for losses in the groups of onerous contracts, and reversions of these losses.
-Financial expenses and income for insurance activities: for the effect of the time value of money and the financial risk effect.
The Group shall recognize income and expenses for the following changes in the carrying amount of the liability for incurred claims (LIC):
-Expenses of the insurance service: for the increase in liability due to claims and expenses incurred in the period, excluding investment components.
-Expenses of the insurance service: for the subsequent changes in the cash flows from the compliance related to claims and expenses incurred.
-Financial expenses and income for insurance activities: for the effect of the time value of money and the financial risk effect.
(d.4) Expenses attributable to the fulfillment of contracts -
Attributable expenses are related to the fulfillment of contracts, directly or indirectly.
Expenses directly and indirectly attributable -
The Group classifies expenses directly attributable to those that can be attributable at portfolio level or individual contracts. Indirect expenses are deemed partially attributable if they are necessary for the fulfillment of the insurance contracts, even if they are not directly associated to a portfolio or individual contract. Expenses indirectly attributable must be allocated to groups of contracts by using a systematic and rational method that can be applied in a consistent manner to all expenses with similar characteristics.
Expenses attributable (without considering the acquisition costs attributable) are included in the LRC, being released as income and decreasing the LRC when the service is rendered. The resulting income is recorded in the caption “Results from insurance activities” in the consolidated statement of income. At the same time, the expenses of the insurance service are recognized based on the actual expenses incurred and are presented in the caption “Other expenses” in the consolidated statement of income, see Note 22.
(d.5) Contractual Service Margin (CSM) -
The CSM represents the expected profit from a group of insurance contracts for the services rendered during the coverage period. It is released in the statement of income for each period to reflect the services rendered to the group in that period.
(d.5.1) Initial recognition
For the initial recognition of an insurance contract, the Group accounts for the positive balance of the CSM as part of the LRC for the insurance contracts valued by the BBA method and the VFA method.
At initial recognition of a profitable insurance contract, the CSM does not recognize any income (profit). Income (or profit) must only be recognized to the extent that the insurance contract services are rendered. The CSM cannot be negative, any loss at initial moment or subsequent moments must be recorded as a loss component in the caption “Results from insurance activities” in the consolidated statement of income.
F-24
(d.5.2) Subsequent valuation
Once the initial recognition of the contract is made, the groups of contracts or Units of Account (UoA) are formed considering their onerosity at that moment (additionally to the portfolio and the cohort they belong to); therefore, the CSM is measured in the subsequent valuations for the group of contracts. Also, the release of the CSM is made throughout the contract’s life in a systematic manner and consistently with the rendering of the service provided by the insurance contract and is recorded in the caption “Income from insurance activities” in the consolidated statement of income.
(d.6) Loss component -
Analogous to the CSM, the loss component (LC) is the estimated contract loss. The recording of these two concepts has a different temporality: while the CSM is deferred throughout the contract’s life, the LC must be recognized immediately, thus generating an expense in the statement of income once its existence is known.
(d.6.1) Determination of the loss component at initial recognition
At initial recognition of a non-profitable insurance contract, the LC must generate an expense in the statement of income once its existence is known.
In the moment at which the existence of an LC is determined, at each subsequent valuation, it shall be necessary to make the following adjustments:
- It shall be allocated exclusively to the LC, until it is reduced to zero.
- It shall be allocated in a systematic manner between the LC and the liability for remaining coverage, excluding the LC (LRC excluding the LC); the changes in the fulfillment cash flows of the LRC.
(d.6.2) Subsequent valuation
Once an LC for a group of onerous contracts has been established, the Group distributes the subsequent changes in the fulfillment cash flows between the LC and the LRC, excluding the LC, by making a systematic allocation between both concepts, as applicable, of the amounts related to.
- The release of claims and expenses of the LRC expected cash flows.
- Changes in the risk adjustment (RA) recognized in the income for the period.
- Financial expenses and income for insurance activities.
- In some cases, the Loss Component for adjustments in favorable actuarial experience and hypotheses can reach a positive value, in which case it shall be treated as a contract with a CSM component.
(d.7) Risk Adjustment (RA) -
The RA reflects the compensation that the entity requires for assuming the uncertainty that arises from the non financial risk, over the amount and the moment of payment of the future cash flows of the liability. Under IFRS 17, the RA is an explicit amount and is independent of the estimations of cash flows and discount.
The Group calculates the RA for the portfolios of life, pensions, and general insurance insurances with the purpose of quantifying the non-financial risks associated to the insurance contracts and reflecting the uncertainty of the insurance contracts regarding their amount and validity term. However, in the following cases the RI calculation will not be necessary:
- In portfolios whose provision for LRC is valued by the PAA method.
- In portfolios whose provision for LRC is valued by the VFA method.
(e)
Financial instruments: Initial recognition -
(e.1)
Date of recognition
Financial assets and liabilities, with the exception of loans, are initially recognized at the trading date. This includes regular transactions of purchases or sales of financial assets that require the delivery of assets within the time frame generally established by regulation or convention on the marketplace. Loans are recognized when the funds are transferred to the customers while deposits and obligations are recognized when the funds are received by the Group.
(e.2)
Initial measurement of financial instruments
The classification of financial instruments at initial recognition depends on the characteristics of the business model and contractual flows for managing the instruments, as described in Notes 3.4(f.1.1) and 3.4(f.1.2). Financial instruments are initially measured at their fair value (as defined in Note 3.4(e.4)), except in the case of financial assets and financial liabilities recorded at fair value through profit or loss, transaction costs are added to, or subtracted from, this amount. Accounts receivable are measured at the transaction price. When the fair value of financial instruments at initial recognition differs from the transaction price, the Group accounts for the Day 1 profit or loss, as described below.
F-25
(e.3)
Day 1 profit or loss
When the transaction price of the instrument differs from the fair value at origination and the fair value is based on a valuation technique that only uses inputs observable in market transactions, the Group recognizes the difference between the transaction price and fair value in the net trading income. In those cases where fair value is based on models for which some of the inputs are not observable, the difference between the transaction price and the fair value is deferred and is only recognized in profit or loss when the inputs become observable, or when the instrument is derecognized.
(e.4)
Measurement categories of financial assets and liabilities
The Group classifies all of its financial assets based on the business model and the contractual terms, measured at either:
Amortized cost, as explained in Note 3.4(f.1).
Fair value through other comprehensive income, as explained in Notes 3.4(f.4) and (f.5).
Fair value through profit or loss, as explained in Note 3.4(f.7).
The Group classifies and measures its derivative and trading portfolio at fair value through profit or loss as explained in Notes 3.4(f.2) and (f.3). The Group may designate financial instruments at fair value through profit or loss, if so doing eliminates or significantly reduces measurement or recognition inconsistencies, as explained in Note 3.4(f.7).
Financial liabilities, other than financial guarantees, are measured at amortized cost or at fair value through profit or loss when they are held for trading, are derivative instruments or the fair value designation is applied, as explained in Note 3.4(f.6). It should be noted that during 2023 and 2022, the Group only presents derivative financial instruments measured in this way.
(f)
Financial assets and liabilities -
Following is the description of the assets and liabilities held by the Group, as well as the criteria for their classification:
(f.1)
Assets measured at amortized cost -
As required by IFRS 9, the Group measure cash and due from banks inter-bank funds, financial investments in debt instruments, loans and other financial assets at amortized cost if the following two conditions are met:
The financial asset is held within a business model with the objective to hold financial assets to collect contractual cash flows, and
The contractual terms of the financial asset give rise on specified dates to cash flows that are solely payments of principal and interest (SPPI) on the principal amount outstanding.
The details of these conditions are presented below:
(f.1.1)
Business model assessment -
The Group's business model is assessed at a higher level of aggregated portfolios, and not instrument by instrument, and is based on observable factors such as:
How the performance of the business model and the financial assets held within that business model are assessed and reported to the entity's key management personnel.
The risks that affect the performance of the business model (and the financial assets held within that business model) and, in particular, the way those risks are managed.
The expected frequency, value and timing of sales are also important aspects of the Group’s assessment. The business model assessment is based on reasonably expected scenarios without taking “worst case” or “stress case”. If cash flows after initial recognition are realized in a way that is different from the Group's original expectations, the classification of the remaining financial assets that remain in that business model will not be changed but incorporates such information when assessing newly purchased financial assets going forward.
(f.1.2)
The SPPI test (Solely payments of principal and interest) -
As a second step of its classification process, the Group assesses the contractual terms to identify whether they meet the SPPI test.
“Principal”, for the purpose of this test, is defined as the fair value of the financial asset at initial recognition and may change over the life of the financial asset (for example, if there are repayments of principal or amortization of the premium/discount).
F-26
The most significant elements within a lending arrangement are the time value of money and credit risk. To perform the SPPI assessment, the Group applies judgement and considers relevant factors such as the currency in which the financial asset is denominated, and the period for which the interest rate is set. In contrast, contractual terms that introduce volatility in the contractual cash flows that are unrelated to a basic lending arrangement do not give rise to contractual cash flows that are solely payments of principal and interest on the amount outstanding. In such cases, the financial asset is required to be measured at fair value through profit or loss.
(f.2)
Derivatives recorded at fair value through profit or loss -
A derivative is a financial instrument or other contract with the following three characteristics:
Its value changes in response to the change in a specified interest rate, financial instrument price, commodity price, foreign exchange rate, index of prices or rates, credit rating or credit index, or other variable; provided that, in the case of a non-financial variable, it is not specific to part of the contract (i.e., the “underlying”).
It requires no initial net investment or an initial net investment that is smaller than the required for other types of contracts expected to have a similar response to changes in market factors.
It is settled at a future date.
The Group enters into derivative transactions with various counterparties, such as: interest rate swaps, cross-currency swaps, foreign currency options and foreign currency forward contracts. Derivatives are recorded at fair value and carried as assets when their fair value is positive and as liabilities when their fair value is negative. The notional amount and fair value of such derivatives are presented separately in Note 10(b). Changes in the fair value of derivatives are included in net trading income unless hedge accounting is applied. Hedge accounting disclosures are presented in Note 3.4(j).
(f.2.1)
Embedded derivatives -
An embedded derivative is a component of a hybrid instrument that also includes a non-derivative host contract with the effect that some of the cash flows of the combined instrument vary in a way like a stand-alone derivative. An embedded derivative causes some or all of the cash flows that otherwise would be required by the contract to be modified according to a specified interest rate, financial instrument price, commodity price, foreign exchange rate, index of prices or rates, credit rating or credit index, or other variable, provided that, in the case of a non-financial variable, it is not specific to a party to the contract. A derivative that is attached to a financial instrument, but is contractually transferable independently of that instrument, or has a different counterparty from that instrument, is not an embedded derivative, but a separate financial instrument.
Embedded derivatives in financial assets, liabilities and non-financial host contacts, were treated as separate derivatives and recorded at fair value if they met the definition of a derivative (as defined above), their economic characteristics and risks were not closely related to those of the host contract, and the host contract was not itself held for trading or designated at fair value through profit or loss. The embedded derivatives separated from the host contract are carried at fair value in the trading portfolio with changes in the fair value recognized in the consolidated statement of income.
In the case of embedded derivatives in financial assets, they are not separated from the financial asset and, therefore, the classification rules are applied to the hybrid instrument in its entirety, as described in Note 3.4(e.4).
As of December 31, 2024 and 2023, the Group does not present embedded derivatives in its financial liabilities needed to be separated from the host contract.
(f.3)
Financial assets or financial liabilities held for trading -
The Group classifies financial assets or financial liabilities as held for trading when they have been purchased or issued primarily for short-term profit making through trading activities or form part of a portfolio of financial instruments that are managed together, for which there is evidence of a recent pattern of short-term profit taking. Held-for-trading assets and liabilities are recorded and measured in the consolidated statement of financial position at fair value. Changes in fair value are recognized in the statement of income. Interest income or expense and dividend are recorded in the statement of income according to the terms of the contract, or when the right to payment has been established. Included in this classification are debt securities, equities and short positions that have been acquired mainly for the purpose of selling them in the short term.
(f.4)
Debt instruments at fair value through other comprehensive income -
The Group applies the category of debt instruments measured at fair value through other comprehensive income when both of the following conditions are met:
The instrument is held within a business model, the objective of which is achieved by collecting contractual cash flows and selling financial assets.
The contractual terms of the financial asset meet the SPPI test.
F-27
Debt instruments at fair value through other comprehensive income are subsequently measured at fair value through other comprehensive income. Interest income and foreign exchange gains and losses are recognized in profit or loss in the same manner as for financial assets measured at amortized cost, as explained in Note 3.4(f.1). The expected credit loss calculation for debt instruments at fair value through other comprehensive income is explained in Note 3.4(h)(iii). When the Group holds more than one investment in the same security, they are deemed to be disposed of on a “first-in first-out” basis. On derecognition, cumulative gains or losses previously recognized in other comprehensive income are reclassified to profit or loss.
(f.5)
Equity instruments at fair value through other comprehensive income -
Upon initial recognition, the Group occasionally elects to classify irrevocably some of its equity investments as equity instruments at fair value through other comprehensive income when not held for trading. Such classification is determined on an instrument-by- instrument basis.
Gains and losses on these equity instruments are never recycled to profit even when the asset is sold. Dividends are recognized in the consolidated statement of income as income when the right of the payment has been established, except when the Group benefits from such proceeds as a recovery of part of the cost of the instrument, in which case, such gains are recorded in other comprehensive income. Equity instruments at fair value through other comprehensive income are not subject to and impairment assessment.
(f.6)
Financial liabilities -
After initial measurement, financial liabilities, except those measured at fair value through profit or loss; see (f.7), are measured at amortized cost. Amortized cost includes commissions and interest, transaction lost and any other premium or discount. A compound financial instrument which contains both a liability and an equity component is separated at the issue date.
The Group first establishes whether the instrument is a compound instrument and classifies such instrument’s components separately as financial liabilities, financial assets, or equity instruments in accordance with IAS 32. Classification of the liability and equity components of a convertible instrument is not revised as a result of a change in the likelihood that a conversion option will be exercised, even when exercising the option may appear to have become economically advantageous to some holders. When allocating the initial carrying amount of a compound financial instrument to the equity and liability components, the equity component is assigned as the residual amount after deducting from the entire fair value of the instrument, the amount separately determined for the liability component. The value of any derivative features (such as call options) embedded in the compound financial instrument, other than the equity component (such as an equity conversion option), is included in the liability component. Once the Group has determined the split between equity and liability, it further assesses whether the liability component has embedded derivatives that must be accounted for separately.
(f.7)
Financial assets and financial liabilities at fair value through profit or loss -
Financial assets and financial liabilities in this category are those that are not held for trading and have been either designated by Management upon initial recognition or are mandatorily required to be measured at fair value under IFRS 9. Management designates an instrument at fair value through profit or loss upon initial recognition when one of the following criteria is met:
The designation eliminates, or significantly reduces, the inconsistent treatment that would otherwise arise from measuring the assets or liabilities or recognizing gains or losses on them on a different basis, or
The liabilities are part of a group of financial liabilities which are managed and their performance evaluated on a fair-value basis, in accordance with a documented risk management or investment strategy, or
The liabilities contain one or more embedded derivatives, unless they do not significantly modify the cash flows that would otherwise be required by the contract.
Financial assets and liabilities at fair value through profit or loss are recorded in the consolidated statement of financial position at fair value. Changes in fair value are recorded in profit and loss with the exception of movements in fair value of liabilities designated at fair value through profit or loss due to changes in the Group’s own credit risk. Such changes in fair value are recorded in other comprehensive income and do not get reclassified to profit or loss. Interest accrued on assets that must be measured at fair value through profit or loss is recorded using the contractual interest rate. Dividend income from equity instruments measured at fair value through profit or loss is recorded in profit or loss as “Interest and similar income”; see Note 19, when the right to the collection has been established.
(f.8)
Financial guarantees and letters of credit -
The Group issues financial guarantees, and letters of credit.
Financial guarantees are initially recognized in the consolidated financial statements (within provisions) at fair value, which is equivalent to the commission received. Subsequent to initial recognition, the recognized liability is measured at the higher amount between: a) amount initially recognized less its cumulative amortization; and b) an Expected Credit Loss (“ECL”) provision determined as set out in Note 3.4(h)(ii).
F-28
The commission received is recognized in the consolidated statement of income in the caption “Fee income from financial services, net” on a straight-line basis over the life of the guarantee.
Letters of credit are commitments under which, over the duration of the commitment, the Group is required to provide a loan with pre-specified terms to the customer. Similar to financial guarantee contracts, these contracts are within the scope of the ECL requirements.
The nominal contractual value of financial guarantees and letters of credit, where the loan agreed to be provided is on market terms, is not recorded in the consolidated statement of financial position. The nominal values of these instruments together with the corresponding ECLs are disclosed in Note 6(d).
(f.9)
Reclassification of financial assets and liabilities -
The reclassification of financial assets will take place as long as the business model that manages the financial assets is changed. It is expected that this change is very rare. These changes are determined by Management because of external or internal changes and must be significant for the Group's operations and demonstrable to third parties. Consequently, a change in the Group's business model will take place only when it begins or ceases to carry out an activity that is significant for its operations. As of December 31, 2024 and 2023, the Group has not reclassified its financial assets after their initial recognition. Financial liabilities are never reclassified.
(f.10)
Repurchase agreements -
Securities sold under repurchase agreements on a specified future date are not derecognized from the consolidated statement of financial position since the Group retains substantially all of the risks and rewards inherent to its ownership. Cash received is recognized as an asset with the corresponding obligation to return it, including accrued interest, as a liability, reflecting the transaction’s economic substance as a loan to the Group. The difference between the sale and repurchase price is recorded as interest expense and is accrued over the life of the agreement using the effective interest rate and is recognized in the caption “Interest and similar expenses” of the consolidated statement of income.
As of December 31, 2024 and 2023, the Group did not keep any repurchase agreements.
(f.11)
Short sale operations -
The securities sold under repurchase agreements at the specific future date correspond to short sales of securities, that the Group does not hold or acquires through temporary transfer of ownership.
At the date of the short-sale agreement, when initial recognition occurs, the Group records the cash received as an asset in the caption “Cash and due from banks” and, in other cases, an account receivable (equivalent to the amortized cost of the investment), recorded as “Accounts receivable for short-sale operations” in the caption “Other accounts receivable and other assets” of the consolidated statement of financial position; see Note 10(a). Also, the corresponding obligation, is recorded as “Financial liabilities at fair value through profit or loss”, in the caption “Other accounts payable, provisions and other liabilities” of the consolidated statement of financial position; see Note 10(a), reflecting the economic substance of the transaction.
Subsequent measurement, valuation and impairment will be recorded according to IFRS 9 criteria; see Note 3.4(f.3). Derecognition of these financial assets and liabilities will be recorded according to Note 3.4(h).
The difference between the purchase price and the resale price is accrued during the term of the contract by using the effective interest rate method and is recorded in the caption “Interest and similar income” of the consolidated statement of income.
As of December 31, 2024, Interbank agreed on short sale contracts for an amount approximately to S/61,191,000 recorded as “Accounts receivable for short sale operations”, in the caption “Other accounts receivable and other assets” of the consolidated statement of financial situation; see Note 10(a). This transaction allowed the recognition of a liability for an amount approximately to S/61,153,000 recorded as “Financial liabilities at fair value through profit or loss”, in the caption “Other accounts payable, provisions and other liabilities” of the consolidated statement of financial position; see Note 10(a). These instruments were settled in the first days of 2025.
(g)
Modification of financial assets and liabilities -
(g.1)
Modification of financial assets
When the contractual cash flows of a financial asset are renegotiated or otherwise modified as a result of commercial restructuring activity rather than due to credit risk and impairment considerations, the Group performs an assessment to determine whether the modifications result in the derecognition of the financial asset. For financial assets, this assessment is based on qualitative factors.
When assessing whether or not to derecognize a loan to a customer, among others, the Group considers the following factors:
F-29
Change in the loan’s currency.
Introduction of an equity feature.
Change in customer's credit risk.
If the modification is such that the instrument would no longer meet the SPPI criterion.
In addition, the Group evaluates whether there is a material change based on quantitative factors considering whether the present value of the discounted cash flows under the original effective interest rate and the new conditions differs by at least 10 percent from the discounted present value of the remaining cash flows of the original financial asset. This follows an analogy on the orientation of changes in financial liabilities. This method applies to all contractual changes to financial assets, regardless of the reason for the change.
The Group made modifications to its agreements with its customers as permitted by the SBS, through its subsidiary Interbank, and performed an analysis described above. The results derived from this evaluation are recognized in profit or loss in the account "Impact from the modification of contractual cash flows due to the loan rescheduling schemes", in the caption "Interest income and similar", see Note 19.
If the modification does not result in cash flows that are substantially different, the modification does not result in derecognition. Based on the change in cash flows discounted at the original effective interest rate, the Group records a gain or loss due to modification, to the extent that an impairment loss has not already been recorded.
(g.2)
Modification of financial liabilities -
When the modification of the terms of an existing financial liability is not judged to be substantial and, consequently, does not result in derecognition, the amortized cost of the financial liability is recalculated by computing the present value of estimated future contractual cash flows that are discounted at the financial liability's original EIR. Any resulting difference is recognized immediately in profit or loss.
Regarding the financial liabilities, the Group considers a substantial amendment based on qualitative factors and provided it exists a difference between the present value of the discounted cash flows under the new conditions and the original carrying amount of the financial liability is larger than ten percent.
(h)
Derecognition of financial assets and liabilities -
(h.1)
Derecognition due to substantial change in terms and conditions -
The Group derecognizes a financial asset, such as a loan to a customer, when the terms and conditions have been renegotiated to the extent that, substantially, it becomes a new loan, with the difference recognized as a derecognition gain or loss, to the extent that an impairment loss has not already been recorded.
(h.2)
Derecognition other than for substantial modification -
(h.2.1)
Financial assets
A financial asset (or, where applicable, a part of a financial asset or part of a group of similar financial assets) is derecognized when the rights to receive cash flows from the financial asset have expired.
The Group has transferred the financial asset if, and only if, either:
-
Has transferred its contractual rights to receive cash flows from the financial asset, or
-
It retains the rights to the cash flows, but has assumed an obligation to pay the received cash flows in full without material delay to a third party under a “pass-through” arrangement.
Pass-through arrangements are transactions whereby the Group retains the contractual rights to receive the cash flows of a financial asset (the 'original asset'), but assumes a contractual obligation to pay those cash flows to one or more entities (the 'eventual recipients'), when all of the following conditions are met:
-
The Group has no obligation to pay amounts to the eventual recipients unless it has collected equivalent amounts from the original asset.
-
The Group cannot sell or pledge the original asset other than as security to the eventual recipients.
-
The Group has to remit any cash flows it collects on behalf of the eventual recipients without material delay. In addition, the Group is not entitled to reinvest such cash flows, except for investments in cash or cash equivalents including interest earned, during the period between the collection date and the date of agreed revision with the eventual recipients.
A transfer only qualifies for derecognition if either:
F-30
-
The Group has transferred substantially all the risks and rewards of the asset, or
-
The Group has neither transferred nor retained substantially all the risks and rewards of the asset, but has transferred control of the asset.
The Group considers that control is transferred if, and only if, the transferee has the ability to sell the asset in its entirety to an unrelated third party and is able to exercise that ability unilaterally and without imposing additional restrictions to the transfer.
When the Group has neither transferred nor retained substantially all the risks and rewards and has retained control of the asset, the asset continues to be recognized only to the extent of the Group’s continuing involvement, in which case, the Group also recognizes an associated liability. The transferred asset and the associated liability are measured on a basis that reflects the rights and obligations that the Group retains.
When the continuing involvement takes the form of a guarantee over the transferred asset, the amount of the Group’s continuing involvement will be the lowest between the asset amount and the maximum amount of consideration the Group may be required to pay.
When the continuing involvement takes the form of a written or purchased option (or both) over the transferred asset, the amount of the Group’s continuing involvement will be the amount of the transferred asset that the Group could repurchase. In the case of a written put option on an asset that is measured at fair value, the amount of the Group's continuing involvement will be limited to the lowest between the fair value of the transferred asset and the option exercising Price.
The net loss originated as consequence of the derecognition of financial asset accounts measured at amortized cost is calculated as the difference between the carrying amount (impairment included) and the amount received.
As of December 31, 2024 and 2023, the Group did not recognize net losses as consequence of derecognition of financial assets accounts.
(h.2.2)
Financial liabilities
A financial liability is derecognized when the obligation under the liability has been discharged, cancelled or has expired. When an existing financial liability is replaced by another from the same lender on substantially different terms, or the terms of an existing liability are substantially modified, such exchange or modification is treated as a derecognition of the original liability and the recognition of a new liability. The difference between the carrying value of the original financial liability and the consideration paid is recognized in profit or loss of the period .
(i)
Impairment of financial assets -
(i)
Overview of the expected credit loss principles -
The Group records an allowance for expected credit losses for all loans and other debt financial assets not held at fair value through profit or loss, together with financial guarantee contracts. Equity instruments are not subject to impairment under IFRS 9.
The determination of the expected credit loss is based on the credit losses expected to arise over the life of the asset, unless there has been no significant increase in credit risk since origination, in which case, the allowance is based on the 12-month expected credit loss as described in (ii) below. The policies for determining whether there has been a significant increase in credit risk are set out in Note 29.1(d).
Both lifetime expected credit loss and 12-month expected credit loss are calculated on either an individual basis or a collective basis, depending on the nature of the portfolio. The Group’s policy for grouping financial assets measured on a collective basis is explained in Note 29.1(d).
The Group has established a policy to perform an assessment, at the end of each reporting period, of whether a financial instrument’s credit risk has increased significantly since initial recognition. This is further explained in Note 29.1(d).
Based on the above mentioned process, IFS groups its loans into “Stage 1”, “Stage 2”, “Stage 3” and purchased or originated credit impaired financial assets (“POCI”), as described below:
Stage 1: When loans are first recognized, the Group recognizes an allowance based on the 12-month expected credit loss. Stage 1 also includes loans whose credit risk has improved and the loan has been reclassified from Stage 2.
Stage 2: When a loan has shown a significant increase in credit risk since inception, the Group records an allowance based on the expected credit loss for the entire lifetime of the financial asset. Stage 2 also includes loans whose credit risk has improved and the loan has been reclassified from Stage 3.
F-31
Stage 3: Loans considered credit impaired (as outlined in Note 29.1(d)). The Group records an allowance for the entire lifetime of the financial asset.
POCI: Purchased or originated credit impaired assets are financial assets that are impaired on initial recognition. POCI assets are recorded at fair value at original recognition and interest income is subsequently recognized based on a credit-adjusted EIR. ECLs are only recognized or released to the extent that there is a subsequent change in the expected credit losses. It should be noted that during the year 2024 and 2023, the Group has not purchased or originated POCI financial assets.
For financial assets for which the Group has no reasonable expectations of recovering either the entire outstanding amount, or a proportion thereof, the gross carrying amount of the financial asset is reduced. This is considered a (partial) derecognition of the financial asset.
The Group recognizes a value correction for expected credit losses on the following financial assets:
Financial assets that are measured at amortized cost.
Financial assets that are measured at fair value with changes in other comprehensive income if the following two conditions are met:
(i)
The financial asset is maintained within a business model whose objective is achieved by obtaining contractual cash flows and selling financial assets; and
(ii)
The contractual terms of the financial asset give rise, on specified dates, to cash flows that are only payments of the principal and interest on the outstanding principal amount.
Accounts receivable from leases.
Assets from contracts.
Financial guarantee contracts.
In this regard, as of December 31, 2024 and 2023, the Group's financial assets subject to a correction for expected credit loss are the following:
Cash and due from banks.
Inter-bank funds.
Financial investments; see Notes 3.4(f), 5 and 29.1(e).
Loans; see Notes 3.4(f.1), 6 and 29.1(d).
Due from customers on acceptances.
Other accounts receivable and other assets.
The Group assesses periodically impairment alerts derived from factors such as the release of compensation for service time deposits (henceforth "CTS") and private pension funds (henceforth "AFP"), natural disasters, and economic context of the country, and the effects of the international conflicts that may affect Peru, with the purpose of timely identifying an increase in the credit loss risk. Thus, for those financial assets other than the loan portfolio, Management has estimated the expected credit loss, concluding that it is neither significant nor relevant, given that the maximum period considered for measuring expected credit losses is very small or, even if it implies a longer term, because the main debtor is the Central Reserve Bank of Peru (“BCRP”, by its Spanish acronym) or corresponds to cash in vaults of the Group.
(ii)
Calculation of ECL -
The Group calculates ECL based on three probability-weighted scenarios to measure the expected cash shortfalls, discounted at an approximation to the EIR. A cash shortfall is the difference between the cash flows that are due to an entity in accordance with the contract and the cash flows that the entity expects to receive.
The mechanics of the ECL calculations are described below, and the key elements are the following:
PD (“Probability of default”) is an estimate of the likelihood of default over a given time horizon. A default may only happen at a certain time over the assessed period, if the financial asset has not been previously derecognized and is still in the portfolio. The definition of PD is further explained in Note 29.1(d).
EAD (“Exposure at default”) is an estimate of the exposure at a future default date, taking into account expected changes in the exposure after the reporting date, including repayments of principal and interest, whether scheduled by contract or otherwise, expected drawdowns on committed facilities, and accrued interest from missed payments. The definition of EAD is further explained in Note 29.1(d).
LGD (“Loss Given Default”) is an estimate of the loss arising in the case where a default occurs at a given time. It is based on the difference between the contractual cash flows due and those that the lender would expect to receive, including from the realization of any collateral. It is usually expressed as a percentage of the EAD. The definition of LGD is further explained in Note 29.1(d).
F-32
When estimating the ECLs, the Group considers three scenarios (optimistic, base and pessimistic). Each of these is associated with different PDs, as presented in Note 29.1(d). When relevant, the assessment of multiple scenarios also incorporates how defaulted loans are expected to be recovered, including the probability that the loans will “cure” and the value of collateral or the amount that might be received for selling the asset.
With the exception of credit cards, for which the treatment is separately set out in (iv) below, the maximum period for which the credit losses are determined is the contractual life of a financial instrument (considering the prepayments) unless the Group has the legal right to call it earlier.
Impairment losses and reversals are accounted for and disclosed separately from modification losses or gains that are accounted for as an adjustment of the financial asset’s gross carrying value.
The criteria followed for calculating the ECL based on each stage are described below:
Stage 1: The provision for credit losses of those financial instruments that do not show a significant increase in risk since the initial recognition, will be calculated as the expected credit losses in the following 12 months. The group calculates the expectation that there is a probability of default (PD) in the 12 months after the reporting date. To this probability of default is multiplied and expected loss in case of default (LGD) and exposure on the date of default (EAD) and discounting the original effective interest rate. This calculation is made for each of the three scenarios (optimistic, base and pessimistic) defined by the Group.
Stage 2: When the financial instrument shows a significant increase in credit risk since initial recognition, the provision of credit losses of this financial instrument will be calculated as the expected credit loss throughout the life of this asset. The calculation method is similar to that for Stage 1, including the use of multiple scenarios, but expected credit loss is estimated over the lifetime of the instrument.
Stage 3: When there is objective evidence that the financial instrument is impaired, the provision of credit losses will be calculated as the expected credit loss over the life of the asset. The method is similar to that for Stage 2, with the PD set at 100 percent.
It is possible that the inputs and models used to calculate the expected loss do not reflect all the characteristics of the market as of the date of the financial statements. This is why that, occasionally, subsequent qualitative adjustments to the model are performed when there are significant differences. See Note 29.1(d.8).
Financial guarantee contracts
The Group measures each financial guarantee as the highest of the amount initially recognized minus cumulative amortization recognized in the consolidated statement of income, and the ECL provision. For this purpose, the Group estimates ECL based on the present value of the expected payments to reimburse the holder for a credit loss that it incurs. The deficits are discounted by the risk-adjusted interest rate relevant to the exposure. The ECLs related to financial guarantee contracts are recognized in provisions.
(iii)
Debt instruments measured at fair value through other comprehensive income -
The ECLs for debt instruments measured at fair value through other comprehensive income do not reduce the carrying amount of these financial assets in the consolidated statement of financial position, which remains at fair value. However, the expected losses that arise at each measurement date must be reclassified from other comprehensive income to results of the period.
(iv)
Credit cards -
The Group calculates the expected losses in a period that reflects the Group's expectations regarding the client's behavior, probability of default and the Group's future risk mitigation procedures that could include the reduction or cancellation of lines of credit. Based on past experience and the Group's expectations, the period during which the Group calculates the expected lifetime losses of this product is 16 months for the period 2024 and 2023.
The assessment of whether there has been a significant increase in credit risk for revolving products is similar to other credit products. This is based on changes in the customer's credit rating, as explained in Note 29.1(d).
The interest rate used to discount the ECL for credit cards is based on the average effective interest rate that is expected to be charged over the expected period of exposure to the facilities. This estimation takes into account that many facilities are repaid in full each month and are consequently not charged interest.
(v)
Forward-looking information -
F-33
In its expected credit loss models, the Group relies on the following macroeconomic variables as forward-looking information inputs as of December 31, 2024 and 2023:
2024
2023
Private formal employment
X
X
Real domestic demand
X
Real formal salary
X
X
Real informal salary
X
X
Real disposable income per capita
X
X
Unemployment rate
X
The inputs and models used for calculating ECLs may not always capture all characteristics of the market at the date of the consolidated financial statements. To reflect this, qualitative adjustments or overlays are occasionally made as temporary adjustments when such differences are significantly material. Detailed information about these inputs are provided in Note 29.1(d).
(vi)
Valuation of guarantees -
To mitigate the credit risks on financial assets, the Group generally uses three types of guarantees: physical guarantee, personal guarantees and title guarantees.
The guarantee, unless recovered, is not recorded in the Group's consolidated statement of financial position. However, the fair value of the guarantee affects the calculation of the expected losses, and because of that, it is assessed periodically.
The nominal contract value of the guarantees and the letters of credit not used where the loan was agreed to be granted is in market terms, is not recorded in the consolidated statement of financial position. The nominal values of these instruments together with the corresponding expected losses are disclosed in Note 29.1(d).
To the extent possible, the Group uses active market data for valuing financial assets held as guarantees. Non-financial guarantees, such as real estate, is valued based on data provided by third parties such as appraisers.
(vii)
Write-offs -
Financial assets are written off only when the Group has stopped pursuing the recovery, at which time the cumulative provision recorded coincides with the total amount of the asset.
(viii)
Refinanced and modified loans -
The Group may make concessions or modifications to the original terms of loans as a response to the borrower’s financial difficulties, rather than taking possession or to otherwise enforce collection of guarantees. Once the terms have been renegotiated, any impairment is measured using the original EIR (as calculated before the modification of terms). It is the Group’s policy to monitor refinanced loans to help ensure that future payments continue to be likely to occur.
A refinanced asset is initially classified into Stage 2 and there will be no clean-up period. However, if the financial asset presents a default mark, it will be reclassified from Stage 2 to Stage 3.
(j)
Hedge derivatives -
Derivatives are initially recognized at fair value at the date a derivative contract is entered into and are subsequently remeasured at their fair value. All derivatives are recognized as assets when the fair value is positive and they are recorded as “Accounts receivables related to derivative financial instruments” under “Other accounts receivable and other assets, net” and as liabilities when they are negative and they are recorded as “Accounts payable related to derivative financial instruments” under “Other accounts payable, provisions and other liabilities” in the consolidated statement of financial position.
Derivatives can be designated as hedging instruments under hedge accounting and in the event that they qualify, depending upon the nature of the hedged item, the method for recognizing gains or losses from changes in fair value will be different. These derivatives, which are used to hedge exposures to risk or modify the characteristics of financial assets and liabilities and that meet IFRS 9 criteria, are recognized as hedging accounting.
Derivatives not designated as hedging instruments or that do not qualify for hedging accounting are initially recognized at fair value and are subsequently remeasured at their fair value, which is estimated based on the market exchange rate and interest rate. Gains or losses due to changes in their fair value are recorded in the consolidated statement of income, see Note 3.4(f.2).
In accordance with IFRS 9, to qualify for hedge accounting, all of the following conditions must be met:
(i)
The hedging relationship consists of only hedging instruments and eligible hedged items.
(ii)
At the inception of the hedge, there is formal designation and documentation of the hedging relationship and the entity’s risk management objective and strategy for undertaking the hedge. This documentation will include the identification of the hedging instrument, the hedged item, the nature of the risk being hedged, and the way the entity will assess if the hedging relationship meets the hedge effectiveness requirements.
F-34
(iii)
The hedging relationship meets all the following hedge effectiveness requirements:
There is an economic relationship between the hedged item and the hedging instrument.
The effect of the credit risk does not dominate the value changes that result from that economic relationship.
The hedge ratio of the hedging relationship is the same as that resulting from the quantity of the hedged item that the entity actually hedges and the quantity of the hedging instrument that the entity actually uses to hedge that quantity of the hedged item.
IFRS 9 presents three hedge accounting categories: fair value hedge, cash flow hedge, and hedge of net investments in a foreign operation. The Group uses derivatives as hedging instruments under cash flow hedges, as detailed in Note 10(b).
For derivatives that are designated and qualify as cash flow hedge, the effective portion of derivative gains or losses is recognized in other comprehensive income for cash flow hedge, and reclassified to income in the same period or periods in which the hedge transaction affects income. The portion of gain or loss on derivatives that represents the ineffective portion or the hedge components excluded from the assessment of effectiveness is recognized immediately in income. Amounts originally recorded in other comprehensive income and subsequently reclassified to income are recorded in the corresponding income or expenses lines in which the related hedged item is reported.
When a hedging instrument expires, is sold, when a hedge no longer meets the criteria for hedge accounting or when the Group re-designates a hedge, the cumulative gain or loss existing in other comprehensive income is kept and recognized in income when the hedged item is ultimately recognized in the consolidated statement of income. When a projected transaction is no longer expected to occur, the cumulative gain or loss recognized in other comprehensive income is immediately transferred to the consolidated statement of income.
(k)
Leases -
The determination of whether an arrangement is a lease, or contains a lease, is based on the substance of the arrangement at contract inception: whether the fulfillment of the arrangement is dependent on the use of a specific asset or assets or whether the arrangement conveys a right to use the asset., even if it is not explicitly specified in the contract in exchange for consideration.
(i)
The Group as a lessee -
The Group, as a lessee, applies a single recognition and measurement approach for all leases, except for short-term leases and leases of low-value assets.
-
Right-of-use assets -
The Group recognizes right-of-use assets at the commencement date of the lease (i.e., the date the underlying asset is available for use). Right-of-use assets are measured at cost, less any accumulated depreciation and impairment loss, and adjusted for any remeasurement of lease liabilities. The cost of right-of-use assets includes the amount of lease liabilities recognized, initial direct costs incurred, and lease payments made at or before the commencement date less any lease incentives received. The Group holds as right-of-use assets: land lots, buildings and facilities and furniture and equipment. Land lots do not depreciate; buildings and facilities and furniture and equipment depreciate based on the straight-line method during the lease term and are presented in Note 8 “Property, furniture and equipment, net”, and are subject to impairment.
-
Lease liabilities -
The Group recognizes lease liabilities measured at the present value of lease payments to be made over the lease term. Given that this interest rate implicit in the lease agreement is not easily determinable, in the calculation of the present value of the lease payments, the Group uses the rate it applies to its loans. The lease payments include fixed payments (less any lease incentives receivable), variable lease payments that depend on an index or a rate, and amounts expected to be paid under residual value guarantees. The lease payments also include the exercise price of a purchase option reasonably certain to be exercised by the Group and payments of penalties for terminating the lease, if the lease term reflects exercising the option to terminate. Variable lease payments that do not depend on an index or a rate are recognized as expenses in the period in which the event or condition that triggers the payment occurs. Lease liabilities are presented in Note 10 as “Lease liabilities” in the caption “Other accounts payable, provisions and other liabilities”.
The Group performs accounting estimates related to the determination of terms and rates of the lease agreements, as detailed below:
-
Determination of the lease term for lease contracts with renewal and termination options
The Group as a lessee determines the lease term as the non-cancellable term of the lease, together with any periods covered by an option to extend the lease if it is reasonably certain to be exercised, or any periods covered by an option to terminate the lease, if it is reasonably certain not to be exercised. The Group applies judgement in evaluating whether it is reasonably certain whether or not to exercise the option to renew or terminate the lease. That is, it considers all relevant factors that create an economic incentive for it to exercise either the renewal or termination. After the commencement date, the Group reassesses the lease term if there is a significant event or change in circumstances that is within its control that affects its ability to exercise or not to exercise the option to
F-35
renew or to terminate (e.g., construction of significant leasehold improvements or significant customization of the leased asset).
-
Estimating the incremental borrowing rate
To determine the interest rate implicit in the lease, the Group uses its incremental borrowing rate - “IBR” to measure lease liabilities. The IBR is the rate of interest that the Group would have to pay to borrow over a similar term, and with a similar security, the funds necessary to obtain an asset of a similar value to the right-of-use asset in a similar economic environment. The IBR therefore reflects what the Group ‘would have to pay’, which requires estimation when no observable rates are available or when they need to be adjusted to reflect the terms and conditions of the lease (for example, when leases are not in the subsidiary’s functional currency).The Group estimates the IBR using observable inputs such as the free-risk interest rates, Peruvian government yield curves of global bonds (in Dollars) and sovereign bonds (in Soles), and a credit risk differential, using a spread on the most recent debt issuance.
The Group used the exemption proposed by the standard for short term and low value assets; thus, short term and low value lease agreements are kept classified as operating leases, and the disbursements incurred due to these leases are recorded in the caption “Administrative expenses” of the consolidated statement of income.
(ii)
The Group as a lessor –
As of December 31, 2024 and 2023, the Group holds the following types of leases:
-
Financial leases –
Leases in which the Group substantially transfers all risks and benefits related to the ownership of the asset are classified as financial leases.
Financial leases are recognized as loans at the present value of the installments. The difference between the total value receivable and the present value of the loan is recognized as accrued interest. This income is recognized during the term of the lease using the effective interest rate method, which reflects a constant rate of return.
As of December 31, 2024 and 2023, leasing receivables are subject to the financial asset impairment policy; see Notes 3.4(f.1) and (g).
-
Operating leases –
Leases in which the Group does not substantially transfers all risks and benefits related to the ownership of the asset are classified as operating leases.
Lease revenues obtained from investment properties are recorded using the straight-line method for the contract terms, and they are recorded as a revenue in the consolidated statement of income due to their operative nature, except for contingent lease revenues, which are recorded when realized.
The lease term is the non-cancelable period, together with any other additional period for which a lessee has the option of continuing with the lease, where, at the start date of the lease, Management is reasonably confident that a lessee will exercise such option.
Amounts received from tenants to terminate leases or to compensate impairment of leased facilities are recognized as revenues in the consolidated statement of income when the right to receive them arises.
Service charges, administration expenses and other recoverable expenses paid by the lessees and the revenues resulting from expenses charged to the lessees are recognized in the period in which the compensation becomes an account receivable. Service charges and administration expenses and other receipts are included in the gross revenues from rentals of the related costs, given that Management considers that the Group acts as principal party.
F-36
(l)
Customer Loyalty Program -
The Group has a customer loyalty program, which allows customers to accumulate points that can be exchanged for products. Loyalty points give rise to a separate performance obligation, as they provide a material right to the customer. A part of the transaction price is allocated to the loyalty points granted to customers on the basis of the relative independent selling price and is recognized as a contractual liability until the points are redeemed and presented as "Other accounts payable" in the item "Other accounts payable, provisions and other liabilities" of the consolidated statement of financial position. Expenses are provisioned monthly regardless of the customer’s redemption of products.
By estimating the selling price independent of the loyalty points, the Group considers the probability of a client will use the cumulated points. The Group updates the estimates of points to be monthly redeemed and any adjustment to the liability balance will be recognized in the caption "Administrative expenses" of the consolidated statement of income.
(m)
Services of purchase-sale of financial investments “principal versus agent”-
The Group has contracts with customers to buy and sell, on their behalf, financial investments on the stock market and over-the-counter market. The Group acts as an agent in these agreements.
When another party participates in the supply of services to their client, the Group determines whether it is a principal or an agent in these transactions when evaluating the nature of its agreement with the client. The Group is a principal and records the revenue by gross amounts if it controls the committed services before transferring to the customer. However, if the Group's role is only to arrange for another entity to provide the services, then the Group is an agent and records the revenues for the net amount it retains for its services as an agent.
(n)
Investment property -
Investment property comprises of land and buildings (mainly shopping malls, educational institutions and offices) that are not occupied substantially for use in the operations of the Group, nor for sale in the ordinary course of business, but are held primarily to earn rental income and capital appreciation. These buildings are substantially rented and not intended to be sold in the ordinary course of business. Investment property comprises completed property and property under construction or re-development.
The Group measures its investment property at fair value according to the requirements of IAS 40 “Investment Property”, as it has chosen to use the fair value model as its accounting policy.
Investment property is measured initially at cost, including transaction costs, that include transfer taxes, professional fees for legal services and initial leasing commissions to bring the property to the condition necessary to start operating. The carrying amount also includes the cost of replacing part of an existing investment property at the time that cost is incurred if the recognition criteria are met.
Properties under construction are measured based on estimates prepared by independent real estate valuation experts, except where such values (e.g. work-in-progress incurred on properties under construction) cannot be readily determined. Accordingly, the work-in-progress incurred on properties under construction is measured at cost until either its fair value becomes reliably measurable or construction is completed (whichever is earlier).
Investment property under construction includes the value of land, which is determined by appraisals performed by an accredited appraiser using the price per square meter as a market comparable method.
Subsequent to initial recognition, investment property is recorded at fair value. Gains or losses arising from changes in fair values are included in the caption “Net gain on investment property” of the consolidated statement of income in the year in which they arise.
Fair values are assessed periodically by Management, based on the discounted cash flows that are expected to be obtained from these investments. Fair values of investment properties under construction or investment properties held to operate in the future are assessed by an independent external appraiser, through the application of a recognized valuation model. See Note 7 for details of fair value and related assumptions.
Transfers to or from investment property are made only when a change in the asset’s use exists. If a component of property, furniture and equipment is transferred to an investment property, the Group transfers the net cost of the fixed asset to the caption investment property and subsequently measures the asset at fair value, with any gain recognized in the caption “Retained earnings” of the consolidated statement of changes in equity. In the case of a transfer from an investment property to the caption property, furniture and equipment, the reclassified amount corresponds to the fair value of the asset at the date of usage change. The amount recorded in the caption “Retained earnings” of the consolidated statement of changes in equity is recognized in the income of the period as the component of property, furniture and equipment is depreciated; or if said component is disposed, the cumulative balance is recognized directly in the consolidated statement of income.
During 2023, the Group transferred two floors from caption “Investment property” part of the “Orquideas” building, located in San Isidro, Lima, to caption “Property, furniture and equipment” for S/16,177,000. Additionally, the Group transferred another floor from caption “Property, furniture and equipment “part of the “Orquideas” building, located in San Isidro, Lima, to caption “Investment property”, for S/3,984,000). During 2022, the Group transferred from caption “Property, furniture and equipment “part of the “Orquideas and Andres Reyes” buildings, located in San Isidro, Lima, to caption “Investment property”, for S/9,357,000, see Note 7(c) and 8(a).
F-37
Investment property is derecognized when it has been disposed or withdrawn from use and no future economic benefit is expected from its disposal. The difference between the net disposal proceeds and the carrying amount of the asset would result in either gains or losses at the retirement or disposal of investment property. Any gains or losses are recognized in the consolidated statement of income of the year of retirement or disposal.
(o)
Property, furniture and equipment, net -
Property, furniture and equipment are stated at historical acquisition cost less residual value, cumulative depreciation and impairment losses, if applicable. The historical acquisition cost includes the expenses that are directly attributable to the acquired property, furniture or equipment. Maintenance and repair costs are charged to the consolidated statement of income; significant renewals and improvements are capitalized when it is probable that future economic benefits, in excess of the originally assessed standard of performance, will result from the use of the acquired property, furniture or equipment.
Land does not depreciate. Depreciation of property, furniture and equipment is calculated using the straight-line method over the estimated useful lives, which are as follows:
Years
Buildings and facilities
40 - 75
Leasehold improvements
5
Furniture and equipment
10
Vehicles
5
An item of property, furniture and equipment and any significant part initially recognized, is derecognized upon disposal or when no future economic benefits are expected from its use or disposal. Any gain or loss arising from the derecognition of the asset (calculated as the difference between the net disposal proceeds and the carrying amount of the asset) is included in the consolidated statement of income.
The residual value of each asset, its useful life and the selected depreciation method are periodically reviewed to ensure that they are consistent with current economic benefits and useful life expectations.
(p)
Intangible assets with finite or indefinite useful lives -
Intangible assets with finite or indefinite useful lives are included in the caption “Intangibles and goodwill, net” of the consolidated statement of financial position. Intangibles assets acquired separately are measured on initial recognition at cost. The cost of intangible assets acquired in a business combination is their fair value at the date of acquisition.
Intangibles assets with finite useful lives include costs incurred in connection with the acquisition of computer software used in operations and other minor intangible assets. The amortization expense is calculated following the straight-line method over the useful life estimated between four and five years; see Note 9.
Intangibles assets with indefinite useful lives are not amortized, but are tested for impairment annually, either individually or at the cash-generating unit level. The assessment of indefinite life is reviewed annually to determine whether the indefinite life continues to be sustainable. If not, the charge in useful life from indefinite to finite is made on a prospective basis.
(q)
Goodwill -
Goodwill is initially measured at cost, being the excess of the aggregate of the consideration transferred and the amount recognized for non-controlling interests, and any previous interest held, if any, over the net identifiable assets acquired and liabilities assumed. If the fair value of net assets acquired is in excess of the aggregate consideration transferred, the Group re-assesses whether it has correctly identified all of the assets acquired and all the liabilities assumed and reviews the procedures used to measure the amounts to be recognized at the acquisition date. If from the reassessment still results in an excess of fair value of net assets acquired over the aggregate consideration transferred, then the gain is recognized in the consolidated statement of income.
After initial recognition, goodwill is measured at cost less any cumulative impairment loss, if any. A goodwill impairment testing is performed on a yearly basis. To perform an impairment testing, goodwill acquired in a business combination is allocated, since the acquisition date, to one of the Group’s cash-generating units (henceforth “CGU”) that are expected to benefit from the business combination, irrespective of whether other assets or liabilities of the acquirer are assigned to those units.
Goodwill impairment is determined by assessing the recoverable amount of each CGU (or group of CGUs) to which the goodwill relates. When the recoverable amount of the CGU is less than its carrying amount, an impairment loss is recognized. Impairment losses relating to goodwill cannot be reversed in future periods.
Where the goodwill has been allocated to the CGU and part of the operation within that unit is disposed of, the goodwill associated to the disposed operation is included in the carrying amount of the operation when determining the gain or loss of disposal. Goodwill dispensed in these circumstances is measured based on the relative values of the disposed operation and the withheld portion of the CGU retained.
Goodwill, recorded by the Group; see Note 9(b), arises from the acquisition of Izipay, allocated to the CGU of Payments business unit and, Seguros Sura, allocated to the CGU of the insurance business unit.
(r)
Business combinations -
F-38
Business combinations are accounted for using the acquisition method established by IFRS 3 "Business Combinations". The cost of an acquisition is measured as the aggregate of the consideration transferred, which is measured at the acquisition date’s fair value, and the amount of any non-controlling interests in the acquiree. For each business combination, the Group chooses whether to measure the non-controlling interests in the acquiree at fair value or at the proportionate share of the acquiree’s identifiable net assets. Acquisition-related costs are expensed as incurred and included in the caption “Administrative expenses” of the consolidated statement of income, see Note 1(b).
The Group determines that it has acquired a business when the acquired set of activities and assets include an input and a substantive process that together significantly contribute to the ability to create outputs. The acquired process is considered substantive if it is critical for the capacity to the ability to continue producing outputs , and the inputs acquired include an organized workforce with the necessary skills, knowledge or experience to perform that process or it significantly contributes to the ability to continue producing outputs and is considered unique or scarce or cannot be replaced without incurring in significant costs, effort or delay in the ability of continue producing outputs.
When the Group acquires a business, it assesses the financial assets and liabilities assumed for appropriate classification and designation in accordance with the contractual terms, economic circumstances and pertinent conditions at the acquisition date. This includes the separation of embedded derivatives in host contracts by the acquiree.
Any contingent consideration to be transferred by the acquirer is recognized at fair value at the acquisition date. Contingent consideration classified as an asset or liability that is a financial instrument and within the scope of IFRS 9 “Financial Instruments: Recognition and Measurement”, is measured at fair value with the changes in the consolidated statement of income or in the consolidated statement of other comprehensive income. If the contingent consideration is not within the scope of IFRS 9, it is measured according to the applicable IFRS Accounting Standards. The contingent consideration that is classified as equity must not be remeasured and subsequent settlement is recorded in equity. As of December 31, 2024 and 2023, there have been no contingencies arising from business combinations.
A business combination between entities or businesses under common control is beyond the scope of IFRS 3, because it corresponds to a business combination in which all entities or businesses that are combined are ultimately controlled by the same part or parts, both before and after the business combination. In these transactions, the Group recognizes the assets acquired under the method of unification of interest, whereby the assets and liabilities of the combined companies are reflected in their carrying amounts and no commercial credit is recognized as a result of the combination.
(s)
Impairment of non-financial assets -
Property, furniture and equipment, right-of-use assets and intangible assets with a finite life are assessed to determine whether there are any indications of impairment as of the closing of each period. If any indication exists, the Group estimates the asset’s recoverable value. The recoverable amount of the assets is the highest between the value of an asset or a CGU less the costs of sale and its use value, and it is determined for an individual asset, unless the asset does not generate cash revenues that are largely independent from those of other assets or groups of assets.
When the carrying amount of an asset or CGU exceeds its recoverable amount, the asset is considered impaired and is written down to its recoverable amount. In assessing value in use, the estimated future cash flows are discounted to their present value using a pre-tax discount rate that reflects current market assessments of the time value of money and the risks specific to the asset. In determining fair value minus costs to sell, an appropriate valuation model is used.
Intangible assets with indefinite useful lives, including goodwill, are tested for impairment annually to determine if circumstances indicate that the value of the recoverable amount of the asset or a CGU (or group of CGUs) is greater than its carrying amount or recognize an impairment loss. Impairment losses relating to goodwill cannot be reversed in future periods.
(t)
Defined contribution pension plan -
The Group only operates a defined contribution pension plan. The defined contribution payable in the pension plan is in proportion to the services rendered to the Group by the employees and it is recorded as an expense in the caption “Salaries and employee benefits” of the consolidated statement of income. Unpaid contributions are recorded as liabilities.
(u)
Provisions -
Provisions are recognized when the Group has a present obligation (legal or implicit) as a result of a past event, and it is probable that an outflow of resources embodying economic benefits will be required to settle the obligation and a reliable estimate can be made of the amount of the obligation. The expense relating to any provision is presented in the consolidated statement of income, net of any reimbursement. If the effect of the time value of money is material, provisions are discounted using a pre-tax rate that reflects, where appropriate, the specific risks of the liability. When discounting is used, the increase in the provision due to the passage of time is recognized as a financial expense.
(v)
Contingencies -
Contingent liabilities are not recognized in the consolidated financial statements, but are disclosed in notes to the consolidated financial statements, unless the probability of an outflow of resources is remote. Contingent assets are not recorded in the consolidated financial statements, but they are disclosed if it is probable that an inflow of economic benefits will emerge.
F-39
(w)
Fair value measurement -
Fair value is the price that would be received for the sale of an asset or paid for the transfer of a liability in an orderly transaction between market participants at the measurement date. The fair value measurement is based on the presumption that the transaction to sell the asset or transfer the liability takes place either:
On the principal market for the asset or liability; or
In the absence of a principal market, on the most advantageous market for the asset or liability.
The principal or the most advantageous market must be accessible by the Group. Also, the fair value of a liability reflects its non-performance risk.
The fair value of an asset or a liability is measured using the assumptions that market participants would use when pricing the asset or liability, assuming that market participants act in their economic best interest.
When possible, the Group measures the fair value of a financial instrument using the quoted price in an active market for that instrument. A market is regarded as active if transactions for the asset or liability take place with sufficient frequency and volume to provide pricing information on an ongoing basis.
If there is no quoted price on an active market, then the Group uses valuation techniques that are appropriate in the circumstances and for which sufficient data are available to measure the fair value, maximizing the use of relevant and observable data and variables, and minimizing the use of unobservable data and variables.
The chosen valuation technique incorporates all of the factors that market participants would take into account in pricing a transaction.
In the case of investment property, the Group has considered the specific requirements relating to highest and best use, valuation of premises and principal (or most advantageous) market. The determination of investment property fair value requires the use of estimations such as the future cash flows of the assets (e.g., leases, sales, fixed rents for the different lessees, variable rents based on the sales percentage, operating costs, construction costs, maintenance costs, and the use of discount rates).
Additionally, real estate development risks (such as construction and abandonment) are also taken into account when determining the fair value of the land related to the investment property under construction.
The fair value of investment property in the consolidated statement of financial position must reflect the volatile nature of real estate markets; therefore, Management and its appraisers use their market knowledge and professional criteria and do not depend solely on historical comparable transactions. In this sense, there is a higher degree of uncertainty than when a more active market exists for the estimation of fair value. Significant methods and assumptions used in the estimation of fair value of investment property are detailed in Note 7.
All assets and liabilities for which the fair value is measured or disclosed in the consolidated financial statements are categorized within the fair value hierarchy described below:
Level 1 - Quoted (unadjusted) market prices in active markets for identical assets or liabilities.
Level 2 - Valuation techniques for input that is significant to the fair value measurement is directly or indirectly observable.
Level 3 - Valuation techniques for which data and variables of the lowest significant level to measure fair value are unobservable.
For assets and liabilities that are recognized at fair value in the consolidated financial statements on a recurring basis, the Group determines whether transfers have occurred between levels in the hierarchy by re-assessing categorization at the end of each reporting period.
For the purpose of fair value disclosures, the Group has determined classes of assets and liabilities on the basis of the nature, characteristics and risks of the asset or liability and the level of hierarchy of the fair value, as explained above.
Fair values of financial instruments measured at amortized cost are disclosed in Note 31(b).
(x)
Income tax -
Income tax is computed based on the separate financial statement of each Subsidiary.
Deferred income tax is accounted for in accordance with IAS 12 “Income Taxes”. In this sense, the deferred income tax reflects the effects of temporary differences between the carrying amounts of assets and liabilities for accounting purposes and the amounts determined for tax purposes. Deferred assets and liabilities are measured using the tax rates that are expected to be in force in the years in which such temporary differences are expected to be recovered or settled. Consequently, the deferred income tax has been calculated by applying the rates that are in force; see Note 17(c). The measurement of deferred tax assets and deferred tax liabilities reflects the tax consequences that arise from the manner in which each individual entity of the Group expects, at the consolidated statement of financial position dates, to recover or settle the carrying amount of their assets and liabilities.
Deferred tax assets and liabilities are recognized regardless of when the temporary differences are likely to reverse. Deferred tax assets are recognized when it is probable that sufficient taxable income will be generated against which the deferred tax assets
F-40
can be offset. At each consolidated statement of financial position date, unrecognized deferred assets and the carrying amount of deferred tax assets registered are assessed. A previously unrecognized deferred tax asset is recognized to the extent that it has now become probable that future taxable income will allow the deferred tax asset to be recovered. Likewise, the carrying amount of a deferred tax asset is reduced when it is no longer probable the generation of a sufficient taxable income that allow the application of the tax deferred asset.
According to IAS 12, the deferred income tax is determined by applying the income tax rate applicable to the retained earnings, recognizing any additional tax on distribution of dividends that may arise on the date when the liability is recognized.
(y)
Segment information -
IFRS 8 “Operating Segments” requires that the information of operating segments be disclosed consistently with information provided by the chief operating decision maker, who allocates resources to the segments and assesses their performance. Segment information is presented in Note 27.
(z)
Fiduciary activities and management of funds -
The Group provides trust management, investment management, advisory and custody services to third parties that result in the holding of assets on their behalf. These assets and the income arising thereon are excluded from these consolidated financial statements, as they are not assets of the Group; see Note 31.
Commissions generated from these activities are included in the caption “Fee income from financial services, net” of the consolidated statement of income.
(aa)
Earnings per share -
The amount of basic earnings per share is calculated by dividing the net profit for the year attributable to common shareholders by the weighted average number of common shares outstanding during the year. As of December 31, 2024 and 2023, the Group does not have financial instruments with dilutive effect, therefore, basic and diluted earnings per share are identical for the years reported.
(ab)
Capital surplus -
It is the difference between the nominal value of shares issued and their public offering price made in 2007 and 2019. Capital surplus is presented net of expenses incurred in the issuance of shares.
(ac)
Treasury stock -
Shares repurchased are recorded in the shareholders’ equity under treasury stock caption at their purchase price. No loss or gain is recorded in the consolidated statement of income arising from the purchase, sale, issuance or amortization of these instruments. Shares that are subsequently sold are recorded as a reduction in treasury stock, measured at the average price of treasury stock held at such date; and the resulting gain or loss is recorded in the consolidated statement of changes in net equity in the caption “Retained earnings”.
(ad)
Cash and cash equivalents -
Cash presented in the consolidated statement of cash flows includes cash and due from banks balances with original maturities lower than three months, excludes the restricted funds, which are subject to an insignificant risk of changes in value. The cash and cash equivalent item does not include accrued interest.
On the other hand, the cash collateral committed as part of a repurchase agreement is included in the “Cash and due from banks” caption of the consolidated statement of financial position; see Note 4(d).
(ae)
Interest Rate Benchmark Reform -
In recent years, global regulators decided to gradually eliminate LIBOR rates and replace them by an alternative interest rate (risk-free rates). During 2023, the Group managed the transition of all its contracts exposed to the alternative interest rate benchmark Secured Overnight Financial Rate (SOFR). Regarding other interest rate benchmarks, such as EURIBOR, the financial instruments subject to said rate will not need to perform a transition since the rates comply with the strict regulating requirements to qualify as interest rate benchmark.
The exposures that were migrated to other benchmarks included, as mentioned before, commercial loan contracts, liability positions, and derivatives. In the case of commercial loans and liability positions (bonds issued) the new conditions of migration to other benchmark were negotiated or the already existing fallback clauses in the contracts were applied. In the case of derivatives agreed under the framework of the International Swaps and Derivatives Association (ISDA), Interbank signed the ISDA Protocol, which allowed the migration to new benchmarks to follow the standard process defined by said protocol. In the
F-41
case of derivative contracts agreed outside the ISDA framework, mainly domestic contracts, the transition to the new SOFR benchmark was negotiated one by one.
Also, regarding the derivatives valuation, since June 2023, said valuations ceased to refer to the LIBOR benchmark and instead started to refer to SOFR rates or equivalents.
Regarding the new exposures, since the beginning of 2023, all new contracts refer to liquid standard risk-free rates (SOFR or similar) or are fixed rates, so that no new exposures are generated on the basis of LIBOR rates.
Note 10(b)(vi) details the nominal value and the average term in years of derivative financial instruments that are subject to the new interest rate benchmark SOFR.
(af)
Financial statements as of December 31, 2024 and 2023 –
When necessary, certain amounts from the previous year have been reclassified to make them comparable with the presentation of the current year.
(ag)
Subsequent events -
The events subsequent to the year-end closing that provide additional information about the consolidated financial position of the Group as of the date of the consolidated statement of financial position (adjustment events) are included in the consolidated financial statements. The subsequent events that are important but are not adjustment events are disclosed in the Notes to the consolidated financial statements; see Note 32.
3.5.
Standards issued but not yet effective -
Following is the description of the new and amended standards and interpretations issued, but which are not yet in force at the date of issuance of these consolidated financial statements. The Group intends to adopt these new and amended standards and interpretations, if applicable, when they become effective:
- Amendments to IAS 21 “The Effects of Changes in Foreign Exchange Rates”: Lack of Exchangeability
In August 2023, the IASB issued amendments to IAS 21 to specify how an entity should assess whether a currency is exchangeable and how it should determine a spot exchange rate when exchangeability is lacking. The amendments also require disclosure of information that enables users of its financial statements to understand how the currency not being exchangeable into the other currency affects, or is expected to affect, the entity’s financial performance, financial position and cash flows.
The amendments will be effective for annual reporting periods beginning on or after 1 January, 2025. Early adoption is permitted but will need to be disclosed. When applying the amendments, an entity cannot restate comparative information.
The amendments are not expected to have a material impact on the Group’s consolidated financial statements.
- IFRS 18 “Presentation and Disclosure in Financial Statements”
In April 2024, the IASB issued IFRS 18, which replaces IAS 1 “Presentation of Financial Statements”. IFRS 18 introduces new requirements for presentation within the statement of profit or loss, including specified totals and subtotals. Furthermore, entities are required to classify all income and expenses within the statement of profit or loss into one of five categories: operating, investing, financing, income taxes and discontinued operations, whereof the first three are new.
It also requires disclosure of newly defined management-defined performance measures, subtotals of income and expenses, and includes new requirements for aggregation and disaggregation of financial information based on the identified “roles” of the primary financial statements and the notes to the financial statements.
In addition, narrow-scope amendments have been made to IAS 7 “Statement of Cash Flows”, which include changing the starting point for determining cash flows from operations under the indirect method, from “profit or loss” to “operating profit or loss” and removing the optionality around classification of cash flows from dividends and interest. In addition, there are consequential amendments to several other standards.
IFRS 18, and the amendments to the other standards, is effective for reporting periods beginning on or after 1 January 2027, but earlier application is permitted and must be disclosed. IFRS 18 will apply retrospectively.
The Group is currently working to identify all impacts the amendments will have on the primary consolidated financial statements and notes to the consolidated financial statements.
-
IFRS 19 “Subsidiaries without Public Accountability”: Disclosures
F-42
In May 2024, the IASB issued IFRS 19, which allows eligible entities to elect to apply its reduced disclosure requirements while still applying the recognition, measurement and presentation requirements in other IFRS accounting standards. To be eligible, at the end of the reporting period, an entity: (i) must be a subsidiary as defined in IFRS 10 “Consolidated Financial Statements”; (ii) cannot have public accountability; and (iii) must have a parent (ultimate or intermediate) that prepares consolidated financial statements, available for public use, which comply with IFRS accounting standards.
IFRS 19 is effective for reporting periods beginning on 1 January 2027, with early application permitted. As the equity instruments of the Company are publicly traded, it is not eligible to elect to apply IFRS 19.
-
Amendments to IFRS 9 “Financial Instruments” and IFRS 7 “Financial Instruments”: Disclosures: Classification and measurement of financial instruments
In May 2024, the IASB issued amendments referred to the classification and measurement of financial instruments, which:
- Clarifies that a financial liability is derecognized on the “settlement date”; when the related obligation is discharged, cancelled, expires or the liability otherwise qualifies for derecognition. It also introduces an accounting policy option to derecognize financial liabilities that are settled through an electronic payment system before settlement date if certain conditions are met.
- Clarified how to assess the contractual cash flow characteristics of financial assets that include environmental, social and governance (ESG)-linked features and other similar contingent features.
- Clarifies the treatment of non-recourse assets and contractually linked instruments.
- Requires additional disclosures in IFRS 7 for financial assets and liabilities with contractual terms that reference a contingent event (including those that are ESG-linked), and equity instruments classified at fair value through other comprehensive income.
The amendments will be effective for annual reporting periods beginning on 1 January 2026. Early adoption is permitted for amendments that relate to the classification of financial assets plus the related disclosures. Other amendments can be applied later. The amendments are not expected to have a material impact on the Group’s consolidated financial statements.
3.6.
Material accounting judgments, estimates and assumptions -
The preparation of the consolidated financial statements of the Group requires Management to make judgments, estimates and assumptions that affect the reported amount of income, expenses, assets and liabilities, and the accompanying disclosures, as well as the disclosure of contingent liabilities. In the process of applying the Group's accounting policies, Management has used judgments and assumptions about the future and other key sources to make its estimates at the reporting date, which have a significant risk that may cause a material adjustment to the carrying amounts of assets and liabilities within the next financial year. The estimates and existing assumptions may change due to circumstances beyond the control of the Group and are reflected in assumptions if they occur. The items with the most impact recognized in the consolidated financial statements with judgements and/or considerable estimates are the following: the calculation of the impairment of the portfolio of loans and financial investments, the measurement of the fair value of financial investments and investment properties, the assessment of the impairment of the goodwill and indefinite-lived intangibles, the liabilities for insurance contracts and the measurement of the fair value of derivative financial instruments; also, there are other estimates such as provisions for litigation, the estimated useful life of intangible assets, and property, furniture and equipment, and the estimation of assets and liabilities for deferred income tax, and the determination of terms and estimation of the discount rate of lease agreements. The accounting criteria used for each of these items are described in Note 3.4.
4.
Cash and due from banks and inter-bank funds
(a)
The detail of cash and due from banks is as follows:
2024
2023
S/(000)
S/(000)
Cash and clearing (b)
2,853,187
2,248,845
Deposits in the BCRP (b)
7,333,818
5,215,762
Deposits in banks (c)
1,790,361
1,609,604
Total cash and cash equivalent
11,977,366
9,074,211
Accrued interest
18,094
23,809
Restricted funds (d)
619,766
720,691
Total
12,615,226
9,818,711
(b)
In accordance with rules in force, Interbank is required to maintain a legal reserve to honor its obligations with the public. This reserve is comprised of funds kept in Interbank and in the BCRP and is made up as follows:
F-43
2024
2023
S/(000)
S/(000)
Legal reserve (*)
Deposits in the BCRP
5,969,218
4,593,592
Cash in vaults
2,644,386
2,005,760
Subtotal legal reserve
8,613,604
6,599,352
Non-mandatory reserve
Term deposits in BCRP (**)
800,000
—
Overnight deposits in BCRP (***)
564,600
622,170
Cash and clearing
208,548
243,029
Subtotal non-mandatory reserve
1,573,148
865,199
Cash balances not subject to legal reserve
253
56
Total
10,187,005
7,464,607
(*) The legal reserve funds maintained in the BCRP are non-interest bearing, except for the part that exceeds the minimum reserve required that accrued interest at a nominal annual rate, established by the BCRP. As of December 31, 2024 and 2023, the Group presented only excess in foreign currency that accrued interest in US Dollars at an annual average rate of 3.90 and 4.86 percent, respectively.
During the years 2024, 2023 and 2022, the Group recognized income for interest related to the excess of the legal reserve, which amounted to S/202,637,000, S/194,446,000 and S/61,302,000, respectively, and were recorded in the item "Interest on due from banks and inter-bank funds” of the caption "Interest and similar income" of the consolidated statement of income, see Note 19.
In Group Management’s opinion, Interbank has complied with the requirements established by the rules in force related to the computation of the legal reserve.
(**) As of December 31, 2024, corresponds to overnight deposits in local currency, with maturity in the first days of January 2025, and accrued interest at an annual interest rate of 4.83 percent.
During the years 2024, 2023 and 2022, the Group recognized interest on time deposits, which amounted to S/52,245,000, S/36,960,000 and S/48,331,000, respectively, and were recorded in the item "Interest on due from banks and inter-bank funds” of the caption "Interest and similar income" of the consolidated statement of income, see Note 19.
(***) As of December 31, 2024, corresponds to an overnight deposit in foreign currency for US$150,000,000 (approximately equivalent to S/564,600,000), with maturity in the first days of January 2025, and accrued interest at an annual interest rate of 4.44 percent, (as of December 31, 2023, it corresponded to an overnight deposit in foreign currency for US$130,000,000 (approximately equivalent to S/482,170,000), and an overnight deposit in local currency for S/140,000,000, with maturity in the first days of January 2024, and accrued interest at an annual interest rate of 5.33 and 4.0 percent, respectively).
During the years 2024, 2023 and 2022, the Group recognized income for interest on overnight deposits, which amounted to S/66,989,000, S/68,850,000and S/35,874,000, respectively, and were recorded in the item "Interest on due from banks and inter-bank funds” of the caption "Interest and similar income" of the consolidated statement of income, see Note 19.
(c)
Deposits in domestic banks and abroad are mainly in Soles and US Dollars, they are freely available and accrue interest at market rates.
(d)
The Group maintains restricted funds related to:
2024
2023
S/(000)
S/(000)
Inter-bank transfers (*)
596,648
694,118
Derivative financial instruments, Note 10(b)(i) and Note 29.1(g.1)
21,568
24,725
Others
1,550
1,848
Total
619,766
720,691
(*) Funds held at BCRP to guarantee transfers made through the Electronic Clearing House ("CCE", by its Spanish acronym).
(e)
Inter-bank funds
These are loans made between financial institutions with maturity, in general, minor than 30 days. As of December 31, 2024, Inter-bank funds assets accrue interest at an annual rate of 5.00 percent in local currency (annual rate of 6.75 percent in local currency and annual rate of 5.5 in foreign currency for Inter-bank funds assets and liabilities, as of December 31, 2023); and do not have specific guarantees.
F-44
5.
Financial investments
(a)
This caption is made up as follows:
2024
2023
S/(000)
S/(000)
Debt instruments measured at fair value through other comprehensive income (b) and (c)
20,377,805
20,912,184
Investments at amortized cost (d)
3,784,912
3,383,014
Investments at fair value through profit or loss (e)
1,776,567
1,556,540
Equity instruments measured at fair value through other comprehensive income (f)
458,268
444,878
Total financial investments
26,397,552
26,296,616
Accrued income
Debt instruments measured at fair value through other comprehensive income (b)
347,087
334,385
Investments at amortized cost (d)
113,286
90,990
Total
26,857,925
26,721,991
In the determination of the expected loss for the financial investments’ portfolio, the Group has not needed to apply any subsequent adjustment to the model through expert judgment, because the most significant investments held as of December 31, 2024 and 2023 are continuously evaluated by local and international credit-rating agencies, in an individual manner. Said agencies periodically modify the ratings of the issuers in accordance with the risk variation of each of the financial instrument, based on specific situation of issuers.
F-45
(b)
Following is the detail of debt instruments measured at fair value through other comprehensive income:
Unrealized gross amount
Annual effective interest rates
Amortized
Estimated
Maturity
S/
US$
2024
cost
Gains
Losses (c)
fair value
Min
Max
Min
Max
S/(000)
S/(000)
S/(000)
S/(000)
%
%
%
%
Corporate, leasing and subordinated bonds (*)
9,867,060
111,866
(805,981
)
9,172,945
Jan-25 / Feb-97
2.20
14.00
3.70
10.86
Sovereign Bonds of the Republic of Peru (**)
8,331,426
24,387
(410,536
)
7,945,277
Aug-26 / Feb-55
2.81
7.12
—
—
Negotiable Certificates of Deposit issued by the Central Reserve Bank of Peru
2,113,571
370
(17
)
2,113,924
Jan-25 / Jun-25
4.51
4.68
—
—
Bonds guaranteed by the Peruvian Government
554,359
6,798
(4,603
)
556,554
Apr-28 / Oct-33
3.65
4.74
6.37
7.22
Global Bonds of the Republic of Peru
548,697
—
(27,058
)
521,639
Jul-25 / Nov-50
—
—
5.00
6.14
Treasury Bonds of the United States of America
57,607
—
(5,082
)
52,525
Nov-31 / Aug-34
—
—
4.46
4.53
Global Bonds of the United States of Mexico
18,100
—
(3,159
)
14,941
Feb-34
—
—
6.51
6.51
Total
21,490,820
143,421
(1,256,436
)
20,377,805
Accrued interest
347,087
Total
20,724,892
Unrealized gross amount
Annual effective interest rates
Amortized
Estimated
Maturity
S/
US$
2023
cost
Gains
Losses (c)
fair value
Min
Max
Min
Max
S/(000)
S/(000)
S/(000)
S/(000)
%
%
%
%
Corporate, leasing and subordinated bonds (*)
9,443,384
83,511
(865,654
)
8,661,241
Jan-24 / Feb-97
2.22
14.52
4.00
18.00
Sovereign Bonds of the Republic of Peru (**)
8,320,671
13,599
(558,282
)
7,775,988
Aug-24 / Feb-55
0.95
6.82
—
—
Negotiable Certificates of Deposit issued by the Central Reserve Bank of Peru (***)
3,445,361
3,638
(15
)
3,448,984
Jan-24 / Sep-24
5.60
6.66
—
—
Bonds guaranteed by the Peruvian Government
475,542
7,810
(9,722
)
473,630
Oct-24 / Oct-33
2.81
4.65
7.39
7.92
Global Bonds of the Republic of Peru
498,897
—
(35,564
)
463,333
Jul-25 / Dec-32
—
—
4.76
5.23
Treasury Bonds of the United States of America
76,556
26
(3,252
)
73,330
Jan-24 / Feb-32
—
—
3.87
5.00
Global Bonds of the United States of Mexico
17,769
—
(2,091
)
15,678
Feb-34
—
—
5.51
5.51
Total
22,278,180
108,584
(1,474,580
)
20,912,184
Accrued interest
334,385
Total
21,246,569
(*) As of December 31, 2024, Inteligo Bank holds corporate bonds from several entities for approximately S/410,509,000, which guarantee loans with BMO Capital Markets Corp and Bank J. Safra Sarasin (Inteligo holds corporate bonds from several entities for approximately S/101,215,000, which guarantee loans with Bank J. Safra Sarasin, as of December 31, 2023), see Note 12(d).
(**) As of December 31, 2024 and 2023, Interbank holds Sovereign Bonds of the Republic of Peru for approximately S/1,027,038,000 and S/629,265,000, respectively, which guarantee loans with foreign banks, see Note 12(d). As of December 31, 2023, Interbank held Sovereign Bonds of the Republic of Peru for approximately S/887,454,000, which guaranteed loans with the BCRP, see Note 12(b).
(***) As of December 31, 2023, Interbank maintained Negotiable Certificates of Deposits issued by the BCRP for approximately S/785,206,000, which guaranteed loans with the BCRP, see Note 12(b).
F-46
The following table shows the credit quality and maximum exposure to credit risk based on the Group's internal credit rating of debt instruments measured at fair value through other comprehensive income as of December 31, 2024 and 2023. The amounts presented do not consider impairment.
2024
2023
Stage 1
Stage 2
Stage 3
Total
Stage 1
Stage 2
Stage 3
Total
S/ (000)
S/ (000)
S/ (000)
S/ (000)
S/ (000)
S/ (000)
S/ (000)
S/ (000)
Not impaired
High grade
2,946,070
—
—
2,946,070
4,261,926
—
—
4,261,926
Standard grade
16,385,685
823,057
—
17,208,742
15,898,382
750,179
—
16,648,561
Sub-standard grade
—
222,993
—
222,993
—
—
—
-
Impaired
Individual
—
—
—
—
—
—
1,697
1,697
Total
19,331,755
1,046,050
—
20,377,805
20,160,308
750,179
1,697
20,912,184
F-47
(c)
The Group, according to the business model applied to these debt instruments, has the capacity to hold these investments for a sufficient period that allows the recovery of the fair value, up to the maximum period for the early recovery or the due date.
The following table shows the analysis of changes in fair value and the corresponding expected credit loss:
2024
Gross carrying amount of debt instruments measured at fair value through other comprehensive income
Stage 1
Stage 2
Stage 3
Total
S/(000)
S/(000)
S/(000)
S/(000)
Beginning of year balances
20,160,308
750,179
1,697
20,912,184
New originated or purchased assets
4,916,977
—
—
4,916,977
Assets matured or derecognized (excluding write-offs)
(5,166,123
)
(101,294
)
(1,718
)
(5,269,135
)
Change in fair value
(218,924
)
(28,365
)
—
(247,289
)
Transfers to Stage 1
—
—
—
—
Transfers to Stage 2
(425,221
)
425,221
—
—
Transfers to Stage 3
—
—
—
—
Write-offs
—
—
—
—
Foreign exchange effect
64,738
309
21
65,068
End of year balances
19,331,755
1,046,050
—
20,377,805
2024
Movement of the allowance for expected credit losses for debt instruments measured at fair value through other comprehensive income
Stage 1
Stage 2
Stage 3
Total
S/(000)
S/(000)
S/(000)
S/(000)
Expected credit loss at the beginning of the period
9,877
37,987
13,182
61,046
New originated or purchased assets
1,095
—
—
1,095
Assets matured or derecognized (excluding write-offs)
(851
)
(2,808
)
(256
)
(3,915
)
Transfers to Stage 1
—
—
—
—
Transfers to Stage 2
(1,053
)
1,053
—
—
Transfers to Stage 3
—
—
—
—
Effect on the expected credit loss due to the change of the stage during the year
—
8,958
—
8,958
Others (*)
457
40,926
—
41,383
Write-offs
—
—
(13,043
)
(13,043
)
Recoveries
—
—
—
—
Foreign exchange effect
(142
)
(409
)
117
(434
)
Expected credit loss at the end of the period
9,383
85,707
—
95,090
(*) Corresponds mainly to the effects on the expected loss due to changes in investment ratings that do not necessarily have resulted in stage transfers during the year.
F-48
2023
Gross carrying amount of debt instruments measured at fair value through other comprehensive income
Stage 1
Stage 2
Stage 3
Total
S/(000)
S/(000)
S/(000)
S/(000)
Beginning of year balances
15,770,778
945,321
418
16,716,517
New originated or purchased assets
5,810,766
—
—
5,810,766
Assets matured or derecognized (excluding write-offs)
(2,175,611
)
(80,810
)
—
(2,256,421
)
Change in fair value
783,826
(58,954
)
1,289
726,161
Transfers to Stage 1
161,781
(161,781
)
—
—
Transfers to Stage 2
(109,392
)
109,392
—
—
Transfers to Stage 3
—
—
—
—
Write-offs
—
—
—
—
Foreign exchange effect
(81,840
)
(2,989
)
(10
)
(84,839
)
End of year balances
20,160,308
750,179
1,697
20,912,184
2023
Movement of the allowance for expected credit losses for debt instruments measured at fair value through other comprehensive income
Stage 1
Stage 2
Stage 3
Total
S/(000)
S/(000)
S/(000)
S/(000)
Expected credit loss at the beginning of the period
10,822
29,600
13,552
53,974
New originated or purchased assets
1,689
—
—
1,689
Assets matured or derecognized (excluding write-offs)
(877
)
(116
)
—
(993
)
Transfers to Stage 1
4,198
(4,198
)
—
—
Transfers to Stage 2
(183
)
183
—
—
Transfers to Stage 3
—
—
—
—
Effect on the expected credit loss due to the change of the stage during the year
(4,003
)
3,414
—
(589
)
Others (*)
(1,739
)
9,120
—
7,381
Write-offs
—
—
—
—
Recoveries
—
—
—
—
Foreign exchange effect
(30
)
(16
)
(370
)
(416
)
Expected credit loss at the end of the period
9,877
37,987
13,182
61,046
(*) Corresponds mainly to the effects on the expected loss due to changes in investment ratings that do not necessarily have resulted in stage transfers during the year.
In the determination of the expected loss for the portfolio of financial investments, for the years 2024 and 2023; it has not been necessary to perform a subsequent adjustment to the model because it captures the expected loss in a satisfactory manner considering the Group's portfolio investments.
As a result of the assessment of the impairment of its debt instruments at fair value through other comprehensive income, the Group recorded a loss of S/47,521,000, S/7,500,000 and S/12,752,000 during the year 2024, 2023 and 2022, which are presented in the caption “Loss to impairment of financial investments” in the consolidated statement of income. The movement of unrealized results of investments at fair value through other comprehensive income, net of income tax and non-controlling interest, is presented in Notes 16(d) and (e).
F-49
(d)
As of December 31, 2024, investments at amortized cost corresponds mainly to sovereign bonds of the Republic of Peru issued in Soles for an amount of S/3,799,540,000, including accrued interest for an amount of S/101,143,000 (as of December 31, 2023, corresponded to sovereign bonds of the Republic of Peru issued in Soles for an amount of S/3,393,962,000, including accrued interest for an amount of S/86,652,000). Said investments present low credit risk and the impairment loss is not significant.
As of December 31, 2024, these investments have maturity dates that range from August 2026 to August 2039, have accrued interest at effective annual rates between 4.36 percent and 7.76 percent, and a fair value amounting to approximately S/3,775,935,000 (as of December 31, 2023, their maturity dates ranged from August 2024 to August 2037, accrued interest at effective annual rates between 4.36 percent and 7.50 percent, and a fair value amounted to approximately S/3,277,672,000 ).
Additionally, as of December 31, 2024, term deposits mainly issued in local currency are held, for an amount of S/98,658,000, including accrued interest amounting to S/12,143,000 (as of December 31, 2023, term deposits mainly issued in local currency are held, for an amount of S/80,042,000, included accrued interest amounting to S/4,338,000).Said investments present low credit risk and the impairment loss is not material. As of December 31, 2024, the maturity of these investments fluctuates between January 2025 and February 2029, have accrued interest at effective annual rates between 3.10 percent and 8.80 percent, and their fair value amounts to approximately S/98,658,000 (as of December 31, 2023, the maturity of these investments fluctuated between April 2024 and February 2029, have accrued interest at effective annual rates between 3.10 percent and 8.80 percent, and a fair value amounted to approximately S/80,042,000).
During the years 2024 and 2023, the Government of the Republic of Peru performed public offerings to repurchase certain sovereign bonds, with the purpose of renewing its debt and funding the fiscal deficit. Considering the purpose of this offering, subsequently to it, there should not be existing remaining sovereign bonds of the repurchased issuances or, in case of existing, they would become illiquid on the market. In that sense, during year 2024, Interbank took part of these public offering and sold to the Government of the Republic of Peru, sovereign bonds classified as investments at amortized cost for approximately S/630,749,000, generating a gain amounting to S/866,000 (during year 2023, Interbank sold S/482,632,000, generating a loss amounting to S/490,000), which was recorded in the caption “Net gain (loss) on sale of financial investments” of the consolidated statement of income. Additionally, with the purpose of maintaining its asset management strategy, Interbank, during year 2024, purchased simultaneously other sovereign bonds of the Republic of Peru for approximately S/628,675,000, and classified them as investments at amortized cost (during year 2023, purchased S/488,127,000 and classified them as investments at amortized cost). In Management’s opinion and pursuant to IFRS 9, said transaction is congruent with the Group’s business model because although said sales were significant, they were infrequent and were performed with the sole purpose of facilitating the renewal and the funding of the fiscal deficit of the Republic of Peru, and thus the business model regarding these assets has always been to collection of the contractual cash flows.
As of December 31, 2024 and 2023, Interbank holds loans with the BCRP that are guaranteed with these sovereign bonds, classified as restricted, for approximately S/1,861,524,000 and S/2,058,931,000, respectively, see Note 12(b).
As of December 31, 2024 and 2023, Interbank holds loans with foreign banks that are guaranteed with these sovereign bonds, classified as restricted, for approximately S/435,242,000 and S/445,909,000, respectively; see Note 12(d).
(e)
The composition of financial instruments at fair value through profit or loss is as follows:
2024
2023
S/(000)
S/(000)
Equity instruments
Local and foreign mutual funds and investment funds participations
1,396,582
1,169,491
Listed shares
202,054
253,203
Non-listed shares
154,856
122,482
Debt instruments
Negotiable Certificates of Deposits
12,365
6,075
Sovereign Bonds of the Republic of Peru
8,538
-
Corporate, leasing and subordinated bonds
2,172
5,289
Total
1,776,567
1,556,540
As of December 31, 2024 and 2023, investments at fair value through profit or loss include investments held for trading for approximately S/152,755,000 and S/194,033,000, respectively; and those assets that are necessarily measured at fair value through profit or loss for approximately S/1,623,812,000 and S/1,362,507,000, respectively.
During the year 2024, the Group recognized gains from valuation of instruments at fair value through profit or loss for approximately S/95,783,000 (during the year 2023 and 2022 recognized losses for S/53,134,000 and S/303,733,000), which are part of caption “Net gain (loss) from financial assets at fair value through profit or loss” of the consolidated statement of income.
During the years 2024, 2023 and 2022, the Group received dividends from these investments for approximately S/12,084,000, S/8,838,000 and S/33,897,000, respectively, which were recorded as “Dividends on financial instruments” in the caption “Interest and similar income” of the consolidated statement of income, see Note 19.
F-50
(f)
The composition of equity instruments measured at fair value through other comprehensive income is as follow:
2024
2023
S/(000)
S/(000)
Listed shares (g)
420,474
407,636
Non-listed shares
37,794
37,242
Total
458,268
444,878
As of December 31, 2024 and 2023, it corresponds to investments in shares in the biological sciences, distribution of machinery, energy, telecommunications, financial and general insurance consumption sectors that are listed on the domestic and foreign markets.
During the years 2024, 2023 and 2022, the Group received dividends from these investments for approximately S/37,312,000, S/33,941,000 and S/45,031,000, respectively, which were recorded as “Dividends on financial instruments” in the caption “Interest and similar income” in the consolidated statement of income, see Note 19.
(g)
During the year 2024, the Group sold shares of several entities, which were irrevocably designated at fair value through other comprehensive income. The total amount of the sales amounted to S/40,591,000 generating total losses for approximately S/53,737,000 (in 2023, the sales amounted to S/80,372,000, generating total gains for approximately S/33,433,000; in 2022, the sales amounted to S/345,791,000, generating total gains for approximately S/16,313,000). In accordance with IFRS 9 and considering the classification of this investment said gains or losses were reclassified to caption “Retained Earnings” of the consolidated statement of changes in equity.
(h)
The following is the balance of investments at fair value through other comprehensive income (debt and equity instruments) and investments at amortized cost as of December 31, 2024 and 2023 classified by contractual maturity (without including accrued interest or future interest):
2024
2023
Investments at fair value through other comprehensive income
Investments at amortized cost
Investments at fair value through other comprehensive income
Investments at amortized cost
S/(000)
S/(000)
S/(000)
S/(000)
Up to 3 months
1,973,030
52,301
1,933,761
—
From 3 months to 1 year
528,185
11,413
2,279,986
634,133
From 1 to 3 years
2,431,310
422,956
2,347,378
485,590
From 3 to 5 years
2,205,297
327,432
1,660,263
146,633
From 5 years onwards
13,239,983
2,970,810
12,690,796
2,116,658
Equity instruments (without maturity)
458,268
—
444,878
—
Total
20,836,073
3,784,912
21,357,062
3,383,014
F-51
(i)
Below are the debt instruments measured at fair value through other comprehensive income and at amortized cost according to the stages indicated by IFRS 9 as of December 31, 2024 and 2023:
2024
Debt instruments measured at fair value through other comprehensive income and at amortized cost
Stage 1
Stage 2
Stage 3
Total
S/(000)
S/(000)
S/(000)
S/(000)
Sovereign Bonds of the Republic of Peru
11,643,674
—
—
11,643,674
Corporate, leasing and subordinated bonds
8,126,895
1,046,050
—
9,172,945
Negotiable Certificates of Deposit issued by the BCRP
2,113,924
—
—
2,113,924
Bonds guaranteed by the Peruvian government
556,554
—
—
556,554
Global Bonds of the Republic of Peru
521,639
—
—
521,639
Treasury Bonds of the United States of America
52,525
—
—
52,525
Global Bonds of the United States of Mexico
14,941
—
—
14,941
Term deposits
86,515
—
—
86,515
Total
23,116,667
1,046,050
—
24,162,717
2023
Debt instruments measured at fair value through other comprehensive income and at amortized cost
Stage 1
Stage 2
Stage 3
Total
S/(000)
S/(000)
S/(000)
S/(000)
Sovereign Bonds of the Republic of Peru
11,083,297
—
—
11,083,297
Corporate, leasing and subordinated bonds
7,909,365
750,179
1,697
8,661,241
Negotiable Certificates of Deposit issued by the BCRP
3,448,984
—
—
3,448,984
Bonds guaranteed by the Peruvian government
473,630
—
—
473,630
Global Bonds of the Republic of Peru
463,333
—
—
463,333
Treasury Bonds of the United States of America
73,330
—
—
73,330
Global Bonds of the United States of Mexico
15,678
—
—
15,678
Term deposits
75,705
—
—
75,705
Total
23,543,322
750,179
1,697
24,295,198
F-52
6.
Loan, net
(a)
This caption is made up as follows:
2024
2023
S/(000)
S/(000)
Direct loans
Loans (*)
38,456,682
35,789,130
Credit cards and other loans (**)
5,386,427
6,023,769
Discounted notes
1,706,886
1,567,411
Leasing
1,584,357
1,495,290
Factoring
1,410,968
1,244,795
Advances and overdrafts
101,848
14,617
Refinanced loans
449,438
461,995
Past due and under legal collection loans
1,318,758
1,652,151
50,415,364
48,249,158
Plus (minus)
Accrued interest from performing loans (f)
569,384
657,355
Unearned interest and interest collected in advance
(25,133
)
(36,706
)
Impairment allowance for loans (d)
(1,730,167
)
(2,349,425
)
Total direct loans, net
49,229,448
46,520,382
Indirect loans, Note 18(a)
5,068,694
4,743,480
(*) As of December 31, 2024 and 2023, Interbank maintains repo operations of loans represented in securities according to the BCRP’s definition. In consequence, loans provided as guarantee amounts to S/123,772,000 and S/504,158,000, respectively, and is presented in the caption “Loan, net”, and the related liability is presented in the caption “Due to banks and correspondents” of the consolidated statement of financial position; see Note 12(b).
(**) As of December 31, 2024 and 2023, it includes non-revolving consumer loans for approximately S/2,666,284,000 and S/3,149,149,000, respectively.
(b)
The classification of the direct loan portfolio is as follows:
2024
2023
S/(000)
S/(000)
Commercial loans (c.1)
22,770,495
21,155,476
Consumer loans (c.1)
15,036,411
16,325,460
Mortgage loans (c.1)
10,571,300
9,834,398
Small and micro-business loans (c.1)
2,037,158
933,824
Total
50,415,364
48,249,158
As explained in further detail in Note 29.1, for purposes of estimating the impairment loss in accordance with IFRS 9, the Group's loans are segmented into homogeneous groups that share similar risk characteristics. In this sense, the Group has determined three types of loan portfolios: Retail Banking (consumer and mortgage loans), Commercial Banking (commercial loans) and Small Business Banking (loans to small and micro-business).
F-53
(c)
The following table shows the credit quality and maximum exposure to credit risk based on the Group's internal credit rating as of December 31, 2024 and 2023. The amounts presented do not consider impairment.
2024
2023
Direct loans, (c.1)
Stage 1
Stage 2
Stage 3
Total
Stage 1
Stage 2
Stage 3
Total
S/(000)
S/(000)
S/(000)
S/(000)
S/(000)
S/(000)
S/(000)
S/(000)
Not impaired
High grade
32,184,807
340,472
—
32,525,279
35,098,364
1,068,674
—
36,167,038
Standard grade
8,332,692
1,513,955
—
9,846,647
2,832,251
1,510,897
—
4,343,148
Sub-standard grade
2,705,012
1,582,401
—
4,287,413
1,367,503
1,450,751
—
2,818,254
Past due but not impaired
1,335,553
1,172,779
—
2,508,332
1,949,892
1,460,138
—
3,410,030
Impaired
Individually
—
—
23,214
23,214
—
—
36,257
36,257
Collectively
—
—
1,224,479
1,224,479
—
—
1,474,431
1,474,431
Total direct loans
44,558,064
4,609,607
1,247,693
50,415,364
41,248,010
5,490,460
1,510,688
48,249,158
2024
2023
Contingent Credits: Guarantees and stand by letters, import and export letters of credit (substantially, all indirect loans correspond to commercial loans)
Stage 1
Stage 2
Stage 3
Total
Stage 1
Stage 2
Stage 3
Total
S/(000)
S/(000)
S/(000)
S/(000)
S/(000)
S/(000)
S/(000)
S/(000)
Not impaired
High grade
3,434,095
31,240
—
3,465,335
3,988,999
457,518
—
4,446,517
Standard grade
1,055,740
118,821
—
1,174,561
32,433
214,806
—
247,239
Sub-standard grade
272,352
132,498
—
404,850
2,823
31,101
—
33,924
Past due but not impaired
—
—
—
—
—
—
—
—
Impaired
Individually
—
—
6,181
6,181
—
—
6,181
6,181
Collectively
—
—
17,767
17,767
—
—
9,619
9,619
Total indirect loans
4,762,187
282,559
23,948
5,068,694
4,024,255
703,425
15,800
4,743,480
F-54
(c.1) The following tables show the credit quality and maximum exposure to credit risk for each classification of the direct loans:
2024
2023
Commercial loans
Stage 1
Stage 2
Stage 3
Total
Stage 1
Stage 2
Stage 3
Total
S/(000)
S/(000)
S/(000)
S/(000)
S/(000)
S/(000)
S/(000)
S/(000)
Not impaired
High grade
11,636,968
290,927
—
11,927,895
14,979,356
855,890
—
15,835,246
Standard grade
6,274,653
1,024,426
—
7,299,079
1,347,961
1,013,803
—
2,361,764
Sub-standard grade
1,749,950
356,019
—
2,105,969
450,577
314,063
—
764,640
Past due but not impaired
770,026
345,062
—
1,115,088
1,431,064
364,603
—
1,795,667
Impaired
Individually
—
—
23,214
23,214
—
—
36,257
36,257
Collectively
—
—
299,250
299,250
—
—
361,902
361,902
Total direct loans
20,431,597
2,016,434
322,464
22,770,495
18,208,958
2,548,359
398,159
21,155,476
2024
2023
Consumer loans
Stage 1
Stage 2
Stage 3
Total
Stage 1
Stage 2
Stage 3
Total
S/(000)
S/(000)
S/(000)
S/(000)
S/(000)
S/(000)
S/(000)
S/(000)
Not impaired
High grade
10,914,268
28,813
—
10,943,081
11,475,514
199,501
—
11,675,015
Standard grade
1,210,504
320,220
—
1,530,724
945,060
452,811
—
1,397,871
Sub-standard grade
593,507
765,324
—
1,358,831
717,526
755,121
—
1,472,647
Past due but not impaired
180,748
508,336
—
689,084
217,712
829,119
—
1,046,831
Impaired
Individually
—
—
—
—
—
—
—
—
Collectively
—
—
514,691
514,691
—
—
733,096
733,096
Total direct loans
12,899,027
1,622,693
514,691
15,036,411
13,355,812
2,236,552
733,096
16,325,460
F-55
2024
2023
Mortgage loans
Stage 1
Stage 2
Stage 3
Total
Stage 1
Stage 2
Stage 3
Total
S/(000)
S/(000)
S/(000)
S/(000)
S/(000)
S/(000)
S/(000)
S/(000)
Not impaired
High grade
8,407,045
20,165
—
8,427,210
8,093,031
13,283
—
8,106,314
Standard grade
528,923
3,714
—
532,637
433,968
17,124
—
451,092
Sub-standard grade
318,802
400,671
—
719,473
193,340
348,274
—
541,614
Past due but not impaired
322,348
244,537
—
566,885
261,100
200,873
—
461,973
Impaired
Individually
—
—
—
—
—
—
—
—
Collectively
—
—
325,095
325,095
—
—
273,405
273,405
Total direct loans
9,577,118
669,087
325,095
10,571,300
8,981,439
579,554
273,405
9,834,398
2024
2023
Small and micro-business loans
Stage 1
Stage 2
Stage 3
Total
Stage 1
Stage 2
Stage 3
Total
S/(000)
S/(000)
S/(000)
S/(000)
S/(000)
S/(000)
S/(000)
S/(000)
Not impaired
High grade
1,226,526
567
—
1,227,093
550,463
—
—
550,463
Standard grade
318,612
165,595
—
484,207
105,262
27,159
—
132,421
Sub-standard grade
42,753
60,387
—
103,140
6,060
33,293
—
39,353
Past due but not impaired
62,431
74,844
—
137,275
40,016
65,543
—
105,559
Impaired
Individually
—
—
—
—
—
—
—
—
Collectively
—
—
85,443
85,443
—
—
106,028
106,028
Total direct loans
1,650,322
301,393
85,443
2,037,158
701,801
125,995
106,028
933,824
F-56
(d)
The balances of the direct and indirect loan portfolio and the movement of the respective allowance for expected credit loss, calculated according to IFRS 9, is as follows:
(d.1) Direct loans
2024
2023
Gross carrying amount of direct loans
Stage 1
Stage 2
Stage 3
Total
Stage 1
Stage 2
Stage 3
Total
S/(000)
S/(000)
S/(000)
S/(000)
S/(000)
S/(000)
S/(000)
S/(000)
Beginning of year balances
41,248,010
5,490,460
1,510,688
48,249,158
41,798,055
4,037,168
1,190,127
47,025,350
New originated or purchased assets
24,385,615
—
—
24,385,615
22,372,321
—
—
22,372,321
Assets matured or derecognized (excluding write-offs)
(14,540,979
)
(1,529,947
)
(74,309
)
(16,145,235
)
(14,406,950
)
(977,654
)
(72,977
)
(15,457,581
)
Transfers to Stage 1
1,191,935
(1,190,305
)
(1,630
)
—
762,554
(760,269
)
(2,285
)
—
Transfers to Stage 2
(3,580,445
)
3,607,482
(27,037
)
—
(4,664,954
)
4,706,631
(41,677
)
—
Transfers to Stage 3
(1,051,604
)
(1,294,253
)
2,345,857
—
(1,235,354
)
(1,054,563
)
2,289,917
—
Write-offs
—
—
(2,405,564
)
(2,405,564
)
—
—
(1,714,968
)
(1,714,968
)
Others (*)
(3,181,151
)
(481,308
)
(103,405
)
(3,765,864
)
(3,217,003
)
(449,390
)
(131,273
)
(3,797,666
)
Foreign exchange effect
86,683
7,478
3,093
97,254
(160,659
)
(11,463
)
(6,176
)
(178,298
)
End of year balances
44,558,064
4,609,607
1,247,693
50,415,364
41,248,010
5,490,460
1,510,688
48,249,158
2024
2023
Changes in the allowance for expected credit losses for direct loans, see (d.1.1)
Stage 1
Stage 2
Stage 3
Total
Stage 1
Stage 2
Stage 3
Total
S/(000)
S/(000)
S/(000)
S/(000)
S/(000)
S/(000)
S/(000)
S/(000)
Expected credit loss at the beginning of year balances
545,242
833,912
970,271
2,349,425
608,558
737,286
682,011
2,027,855
Impact of the expected credit loss in the consolidated statement of income -
New originated or purchased assets
345,800
—
—
345,800
624,484
—
—
624,484
Assets matured or derecognized (excluding write-offs)
(117,510
)
(63,854
)
(24,285
)
(205,649
)
(147,086
)
(66,329
)
(25,445
)
(238,860
)
Transfers to Stage 1
115,241
(114,022
)
(1,219
)
—
106,745
(104,939
)
(1,806
)
—
Transfers to Stage 2
(142,315
)
149,763
(7,448
)
—
(327,728
)
339,051
(11,323
)
—
Transfers to Stage 3
(88,212
)
(380,565
)
468,777
—
(163,156
)
(269,881
)
433,037
—
Impact on the expected credit loss for credits that change stage in the year (***)
(98,820
)
193,935
1,476,103
1,571,218
(90,594
)
259,309
1,407,191
1,575,906
Others (**)
(120,334
)
(52,823
)
185,680
12,523
(65,775
)
(60,358
)
163,834
37,701
Total
(106,150
)
(267,566
)
2,097,608
1,723,892
(63,110
)
96,853
1,965,488
1,999,231
Write-offs
—
—
(2,524,919
)
(2,524,919
)
—
—
(1,813,670
)
(1,813,670
)
Recovery of written–off loans
—
—
179,683
179,683
—
—
138,886
138,886
Foreign exchange effect
232
290
1,564
2,086
(206
)
(227
)
(2,444
)
(2,877
)
Expected credit loss at the end of year balances
439,324
566,636
724,207
1,730,167
545,242
833,912
970,271
2,349,425
(*) Corresponds mainly to: (i) the variation between the amortized cost of the loan at the beginning of the year and its amortized cost at the end of the year (partial amortizations that did not represent a reduction or derecognized of the loan), and (ii) the execution of contingent loans (conversion of indirect debt into direct debt).
(**) Corresponds mainly to: (i) the variation between the amortized cost of the loan at the beginning of the year and its amortized cost at the end of the year (variation in the provision recorded for partial amortizations that did not represent a reduction or derecognized of the loan), (ii) variations in credit risk that did not generate transfers to other stages; and (iii) the execution of contingent loans (conversion of indirect debt into direct debt).
(***) The Group applied its expert judgement with the purpose of reflecting the effects of the potential impairment that could be caused by the withdrawals of Compensation for Service Time (CTS) deposits and of funds managed by the Administrators of Private Pension Funds (AFP), which resulted in a one-time improvement of consumer' credit scores during 2024, and the possible impact of the El Niño event during 2023, that were not considered in the forward-looking model and led to incur in a higher provision for expected loss, see Note 29.1(d.8).
F-57
(d.1.1) The following tables show the movement of the allowance for expected credit losses for each classification of the direct loan portfolio:
2024
2023
Commercial loans
Stage 1
Stage 2
Stage 3
Total
Stage 1
Stage 2
Stage 3
Total
S/(000)
S/(000)
S/(000)
S/(000)
S/(000)
S/(000)
S/(000)
S/(000)
Expected credit loss at beginning of year
51,611
64,470
162,385
278,466
45,474
47,311
154,299
247,084
Impact of the expected credit loss in the consolidated statement of income -
New originated or purchased assets
35,739
—
—
35,739
47,129
—
—
47,129
Assets derecognized or matured (excluding write-offs)
(27,765
)
(18,765
)
(4,083
)
(50,613
)
(26,668
)
(10,113
)
(2,924
)
(39,705
)
Transfers to Stage 1
5,405
(5,405
)
—
—
2,920
(2,687
)
(233
)
—
Transfers to Stage 2
(20,669
)
21,431
(762
)
—
(27,598
)
30,826
(3,228
)
—
Transfers to Stage 3
(2,208
)
(14,571
)
16,779
—
(10,620
)
(16,046
)
26,666
—
Impact on the expected credit loss for credits that change stage in the year (**)
(4,722
)
(1,638
)
12,108
5,748
(1,988
)
7,333
40,748
46,093
Others (*)
(20,973
)
(9,539
)
9,402
(21,110
)
23,154
8,006
6,579
37,739
Total
(35,193
)
(28,487
)
33,444
(30,236
)
6,329
17,319
67,608
91,256
Write-offs
—
—
(78,217
)
(78,217
)
—
—
(62,960
)
(62,960
)
Recovery of written–off loans
—
—
4,254
4,254
—
—
5,189
5,189
Foreign exchange effect
222
175
1,147
1,544
(192
)
(160
)
(1,751
)
(2,103
)
Expected credit loss at end of year
16,640
36,158
123,013
175,811
51,611
64,470
162,385
278,466
(*) Corresponds mainly to: (i) the variation between the amortized cost of the loan at the beginning of the year and its amortized cost at the end of the year (variation in the provision recorded for partial amortizations that did not represent a reduction or derecognized of the loan), (ii) variations in credit risk that did not generate transfers to other stages; and (iii) the execution of contingent loans (conversion of indirect debt into direct debt).
(**) The Group applied its expert judgement with the purpose of reflecting the effects of the potential impairment that could be caused by the withdrawals of Compensation for Service Time (CTS) deposits and of funds managed by the Administrators of Private Pension Funds (AFP), which resulted in a one-time improvement of consumer' credit scores during 2024, and the possible impact of the El Niño event during 2023, that were not considered in the forward-looking model and led to incur in a higher provision for expected loss, see Note 29.1(d.8).
F-58
2024
2023
Consumer loans
Stage 1
Stage 2
Stage 3
Total
Stage 1
Stage 2
Stage 3
Total
S/(000)
S/(000)
S/(000)
S/(000)
S/(000)
S/(000)
S/(000)
S/(000)
Expected credit loss at beginning of year
466,606
713,361
682,417
1,862,384
534,005
657,474
430,902
1,622,381
Impact of the expected credit loss in the consolidated statement of income -
New originated or purchased assets
219,439
—
—
219,439
552,847
—
—
552,847
Assets derecognized or matured (excluding write-offs)
(75,335
)
(38,022
)
(8,120
)
(121,477
)
(98,984
)
(54,036
)
(10,863
)
(163,883
)
Transfers to Stage 1
96,900
(95,895
)
(1,005
)
—
95,173
(93,918
)
(1,255
)
—
Transfers to Stage 2
(101,634
)
104,024
(2,390
)
—
(282,373
)
287,164
(4,791
)
—
Transfers to Stage 3
(73,066
)
(338,289
)
411,355
—
(135,476
)
(231,432
)
366,908
—
Impact on the expected credit loss for credits that change stage in the year (**)
(81,900
)
174,052
1,369,154
1,461,306
(81,051
)
221,421
1,263,515
1,403,885
Others (*)
(47,271
)
(44,916
)
188,121
95,934
(117,534
)
(73,259
)
162,060
(28,733
)
Total
(62,867
)
(239,046
)
1,957,115
1,655,202
(67,398
)
55,940
1,775,574
1,764,116
Write-offs
—
—
(2,310,032
)
(2,310,032
)
—
—
(1,647,576
)
(1,647,576
)
Recovery of written–off loans
—
—
165,081
165,081
—
—
123,679
123,679
Foreign exchange effect
1
101
119
221
(1
)
(53
)
(162
)
(216
)
Expected credit loss at end of year
403,740
474,416
494,700
1,372,856
466,606
713,361
682,417
1,862,384
2024
2023
Mortgage loans
Stage 1
Stage 2
Stage 3
Total
Stage 1
Stage 2
Stage 3
Total
S/(000)
S/(000)
S/(000)
S/(000)
S/(000)
S/(000)
S/(000)
S/(000)
Expected credit loss at beginning of year
6,794
25,753
54,651
87,198
4,236
12,285
45,101
61,622
Impact of the expected credit loss in the consolidated statement of income -
New originated or purchased assets
4,114
—
—
4,114
3,949
—
—
3,949
Assets derecognized or matured (excluding write-offs)
(429
)
(1,689
)
(9,267
)
(11,385
)
(181
)
(833
)
(10,625
)
(11,639
)
Transfers to Stage 1
9,983
(9,983
)
—
—
6,414
(6,414
)
—
—
Transfers to Stage 2
(2,348
)
6,551
(4,203
)
—
(2,052
)
5,115
(3,063
)
—
Transfers to Stage 3
(2,025
)
(3,142
)
5,167
—
(1,915
)
(2,423
)
4,338
—
Impact on the expected credit loss for credits that change stage in the year (**)
(9,606
)
16,451
15,411
22,256
(5,956
)
15,996
20,982
31,022
Others (*)
(969
)
10,001
(15,977
)
(6,945
)
2,312
2,040
2,018
6,370
Total
(1,280
)
18,189
(8,869
)
8,040
2,571
13,481
13,650
29,702
Write-offs
—
—
(1,755
)
(1,755
)
—
—
(3,580
)
(3,580
)
Recovery of written–off loans
—
—
—
—
—
—
—
—
Foreign exchange effect
9
14
294
317
(13
)
(13
)
(520
)
(546
)
Expected credit loss at end of year
5,523
43,956
44,321
93,800
6,794
25,753
54,651
87,198
(*) Corresponds mainly to: (i) the variation between the amortized cost of the loan at the beginning of the year and its amortized cost at the end of the year (variation in the provision recorded for partial amortizations that did not represent a reduction or derecognized of the loan), (ii) variations in credit risk that did not generate transfers to other stages; and (iii) the execution of contingent loans (conversion of indirect debt into direct debt).
(**) The Group applied its expert judgement with the purpose of reflecting the effects of the potential impairment that could be caused by the withdrawals of Compensation for Service Time (CTS) deposits and of funds managed by the Administrators of Private Pension Funds (AFP), which resulted in a one-time improvement of consumer' credit scores during 2024, and the possible impact of the El Niño event during 2023, that were not considered in the forward-looking model and led to incur in a higher provision for expected loss, see Note 29.1(d.8).
F-59
2024
2023
Small and micro-business loans
Stage 1
Stage 2
Stage 3
Total
Stage 1
Stage 2
Stage 3
Total
S/(000)
S/(000)
S/(000)
S/(000)
S/(000)
S/(000)
S/(000)
S/(000)
Expected credit loss at beginning of year
20,231
30,328
70,818
121,377
24,843
20,216
51,709
96,768
Impact of the expected credit loss in the consolidated statement of income -
New originated or purchased assets
86,508
—
—
86,508
20,559
—
—
20,559
Assets derecognized or matured (excluding write-offs)
(13,981
)
(5,378
)
(2,815
)
(22,174
)
(21,253
)
(1,347
)
(1,033
)
(23,633
)
Transfers to Stage 1
2,953
(2,739
)
(214
)
—
2,238
(1,920
)
(318
)
—
Transfers to Stage 2
(17,664
)
17,757
(93
)
—
(15,705
)
15,946
(241
)
—
Transfers to Stage 3
(10,913
)
(24,563
)
35,476
—
(15,145
)
(19,980
)
35,125
—
Impact on the expected credit loss for credits that change stage in the year (**)
(2,592
)
5,070
79,430
81,908
(1,599
)
14,559
81,946
94,906
Others (*)
(51,121
)
(8,369
)
4,134
(55,356
)
26,293
2,855
(6,823
)
22,325
Total
(6,810
)
(18,222
)
115,918
90,886
(4,612
)
10,113
108,656
114,157
Write-offs
—
—
(134,915
)
(134,915
)
—
—
(99,554
)
(99,554
)
Recovery of written–off loans
—
—
10,348
10,348
—
—
10,018
10,018
Foreign exchange effect
—
—
4
4
—
(1
)
(11
)
(12
)
Expected credit loss at end of year
13,421
12,106
62,173
87,700
20,231
30,328
70,818
121,377
(*) Corresponds mainly to: (i) the variation between the amortized cost of the loan at the beginning of the year and its amortized cost at the end of the year (variation in the provision recorded for partial amortizations that did not represent a reduction or derecognized of the loan), (ii) variations in credit risk that did not generate transfers to other stages; and (iii) the execution of contingent loans (conversion of indirect debt into direct debt).
(**) The Group applied its expert judgement with the purpose of reflecting the effects of the potential impairment that could be caused by the withdrawals of Compensation for Servive Time (CTS) deposits and of funds managed by the Administrators of Private Pension Funds (AFP), which resulted in a one-time improvement of consumer' credit scores during 2024, and the possible impact of the El Niño event during 2023, that were not considered in the forward-looking model and led to incur in a higher provision for expected loss, see Note 29.1(d.8).
F-60
(d.2) Indirect loans (substantially, all indirect loans correspond to commercial loans)
2024
2023
Gross carrying amount of contingent credits, guarantees and stand-by letters, import and export letters of credit
Stage 1
Stage 2
Stage 3
Total
Stage 1
Stage 2
Stage 3
Total
S/(000)
S/(000)
S/(000)
S/(000)
S/(000)
S/(000)
S/(000)
S/(000)
Beginning of year balances
4,024,255
703,425
15,800
4,743,480
3,959,441
501,830
26,076
4,487,347
New originated or purchased assets
2,669,212
—
—
2,669,212
2,122,067
—
—
2,122,067
Assets derecognized or matured
(2,044,010
)
(332,730
)
(882
)
(2,377,622
)
(1,606,539
)
(135,042
)
(1,784
)
(1,743,365
)
Transfers to Stage 1
172,930
(172,930
)
—
—
30,259
(30,259
)
—
—
Transfers to Stage 2
(100,437
)
102,899
(2,462
)
—
(392,176
)
407,454
(15,278
)
—
Transfers to Stage 3
(277
)
(10,778
)
11,055
—
(12
)
(6,687
)
6,699
—
Others (*)
23,959
(8,766
)
436
15,629
(54,162
)
(26,950
)
92
(81,020
)
Foreign exchange effect
16,555
1,439
1
17,995
(34,623
)
(6,921
)
(5
)
(41,549
)
End of year balances
4,762,187
282,559
23,948
5,068,694
4,024,255
703,425
15,800
4,743,480
2024
2023
Changes in the allowance for expected credit losses for contingent credits, guarantees and stand-by letters, import and export letters of credit
Stage 1
Stage 2
Stage 3
Total
Stage 1
Stage 2
Stage 3
Total
S/(000)
S/(000)
S/(000)
S/(000)
S/(000)
S/(000)
S/(000)
S/(000)
Expected credit loss at beginning of year balances
6,624
3,939
7,369
17,932
8,354
18,205
8,936
35,495
Impact of the expected credit loss in the consolidated statement of income -
New originated or purchased assets
2,110
—
—
2,110
4,770
—
—
4,770
Assets derecognized or matured
(3,275
)
(1,484
)
(330
)
(5,089
)
(1,988
)
(4,205
)
(631
)
(6,824
)
Transfers to Stage 1
1,265
(1,265
)
—
—
180
(180
)
—
—
Transfers to Stage 2
(697
)
961
(264
)
—
(1,986
)
3,626
(1,640
)
—
Transfers to Stage 3
(229
)
(91
)
320
—
(1
)
(50
)
51
—
Impact on the expected credit loss for credits that change stage in the year
(1,001
)
(109
)
1,202
92
(57
)
(837
)
684
(210
)
Others (**)
(2,155
)
294
1,035
(826
)
(2,521
)
(12,600
)
(28
)
(15,149
)
Total
(3,982
)
(1,694
)
1,963
(3,713
)
(1,603
)
(14,246
)
(1,564
)
(17,413
)
Foreign exchange effect
21
5
3
29
(127
)
(20
)
(3
)
(150
)
Expected credit loss at the end of year balances, Note 10(a)
2,663
2,250
9,335
14,248
6,624
3,939
7,369
17,932
(*) Corresponds mainly to: (i) the variation between the amortized cost of the loan at the beginning of the year and its amortized cost at the end of the year (partial amortizations that did not represent a reduction or derecognized of the loan), and (ii) the execution of contingent loans (conversion of indirect debt into direct debt).
(**) Corresponds mainly to: (i) the variation between the amortized cost of the loan at the beginning of the year and its amortized cost at the end of the year (variation in the provision recorded for partial amortizations that did not represent a reduction or derecognized of the loan), (ii) variations in credit risk that did not generate transfers to other stages; and (iii) the execution of contingent loans (conversion of indirect debt into direct debt).
F-61
(e)
In Group Management’s opinion, the allowance for loan losses recorded as of December 31, 2024 and 2023, has been established in accordance with IFRS 9; and it is sufficient to cover incurred losses on the loan portfolio.
(f)
During 2024 and 2023, the interest that the loan portfolio generates is freely agreed considering the interest rates prevailing on the market. Notwithstanding the above, Act No. 31143, “Act Protecting Consumers of Financial Services from Usury” established that the BCRP is the entity that determined maximum and minimum interest rates for consumer, small and micro-business loans in financial institutions. As of December 31, 2024, the maximum interest rate for the period between November 2024 and April 2025 is 112.98 percent in national currency and 93.86 percent in foreign currency (the maximum interest rate for the period between November 2023 and April 2024 was 101.86 percent in national currency and 82.94 percent in foreign currency, as of December 31, 2023).
(g)
Interest income from loans classified in Stage 3 is calculated through the effective interest rate adjusted for credit quality at amortized cost.
(h)
The refinanced loans during the 2024 period amounted to approximately S/104,173,000 (S/132,172,000, during the year 2023) which had no significant impact on the consolidated statement of income.
During 2024 and 2023, the Group has carried out rescheduling of credits related to social conflicts, natural disasters and other resolutions that amounted to S/853,222,000 and S/1,979,342,000, respectively. Said loans are not considered as refinanced loans. See further detail in Note 29.1 (d.7.3).
During recent years, the Group modified the contractual conditions of a determined number of loans that were granted under the “Reactiva Peru” program, said loans were not deemed as refinanced loans. As of December 31, 2024 and 2023, the balance of rescheduled loans amounts of approximately S/212,398,000 and S/730,508,000, respectively; see further detail in Note 29.1 (d.7.2).
Additionally, during 2020, the Group modified the contractual conditions of a determined number of loans as relief for its clients’ liquidity as consequence of the Covid-19 pandemic, for a total of approximately S/12,663,960,000. Said loans are not considered as refinanced loans. As of December 31, 2024 and 2023, the balances of the rescheduled loans amount to approximately S/2,501,672,000 and S/3,513,905,000, respectively; see further detail in Note 29.1 (d.7.1).
(i)
The table below presents the maturity of the direct loan portfolio without including accrued interest, interest to be accrued and interest collected in advance as of December 31, 2024 and 2023:
2024
2023
S/(000)
S/(000)
Outstanding
Within 1 month
4,693,941
4,461,634
Between 1 and 3 months
5,315,685
5,781,509
Between 3 months and 1 year
12,967,405
10,831,137
Between 1 and 5 years
20,000,898
19,500,481
More than 5 years
6,118,677
6,022,246
49,096,606
46,597,007
Past due and under legal collection loans, see (i.1) -
Up to 4 months
177,367
484,808
Over 4 months
640,853
697,246
Under legal collection
500,538
470,097
50,415,364
48,249,158
F-62
(i.1) The tables below present past due and under legal collection loans for each classification of the direct loan portfolio:
2024
2023
S/(000)
S/(000)
Commercial loans
Up to 4 months
33,440
98,263
Over 4 months
84,331
143,170
Under legal collection
217,741
228,809
335,512
470,242
Consumer loans
Up to 4 months
81,020
284,954
Over 4 months
371,731
401,164
Under legal collection
78,432
78,290
531,183
764,408
Mortgage loans
Up to 4 months
52,779
35,934
Over 4 months
95,106
94,568
Under legal collection
174,179
140,018
322,064
270,520
Small and micro-business loans
Up to 4 months
10,128
65,657
Over 4 months
89,685
58,344
Under legal collection
30,186
22,980
129,999
146,981
See credit risk analysis in Note 29.1
(j)
Part of the loan portfolio is collateralized with guarantees received from clients, which mainly consist of mortgages, trust assignments, financial instruments as well as industrial commercial pledges.
F-63
(k)
The following tables present the maturities of direct and indirect loans of Stages 2 and 3 as of December 31, 2024 and 2023, as follows:
- Stage 2: Loans with maturity longer or shorter than 30 days, regardless of the criteria that caused their classification into Stage 2.
- Stage 3: Loans with maturity longer or shorter than 90 days, regardless of the criteria that caused their classification into Stage 3.
2024
2023
Stage 2
Stage 3
Total
Stage 2
Stage 3
Total
Gross amount
Expected loss
Gross amount
Expected loss
Gross amount
Expected loss
Gross amount
Expected loss
Gross amount
Expected loss
Gross amount
Expected loss
S/(000)
S/(000)
S/(000)
S/(000)
S/(000)
S/(000)
S/(000)
S/(000)
S/(000)
S/(000)
S/(000)
S/(000)
Maturity shorter than:
30 days
4,260,747
450,143
—
—
4,260,747
450,143
5,400,087
609,406
—
—
5,400,087
609,406
90 days
—
—
3,060
2,801
3,060
2,801
—
—
16,219
14,888
16,219
14,888
Maturity longer than:
30 days
631,419
118,743
—
—
631,419
118,743
793,798
228,445
—
—
793,798
228,445
90 days
—
—
1,268,581
730,741
1,268,581
730,741
—
—
1,510,269
962,752
1,510,269
962,752
Total
4,892,166
568,886
1,271,641
733,542
6,163,807
1,302,428
6,193,885
837,851
1,526,488
977,640
7,720,373
1,815,491
(k.1) The following tables present the maturities of direct and indirect loans of Stages 2 and 3 as of December 31, 2024 and 2023, for each classification:
2024
2023
Stage 2
Stage 3
Total
Stage 2
Stage 3
Total
Commercial loans
Gross amount
Expected loss
Gross amount
Expected loss
Gross amount
Expected loss
Gross amount
Expected loss
Gross amount
Expected loss
Gross amount
Expected loss
S/(000)
S/(000)
S/(000)
S/(000)
S/(000)
S/(000)
S/(000)
S/(000)
S/(000)
S/(000)
S/(000)
S/(000)
Maturity shorter than:
30 days
2,169,530
36,418
—
—
2,169,530
36,418
3,155,267
60,877
—
—
3,155,267
60,877
90 days
—
—
6
5
6
5
—
—
2,686
2,259
2,686
2,259
Maturity longer than:
30 days
129,463
1,990
—
—
129,463
1,990
96,517
7,532
—
—
96,517
7,532
90 days
—
—
346,406
132,343
346,406
132,343
—
—
411,273
167,495
411,273
167,495
Total
2,298,993
38,408
346,412
132,348
2,645,405
170,756
3,251,784
68,409
413,959
169,754
3,665,743
238,163
2024
2023
Stage 2
Stage 3
Total
Stage 2
Stage 3
Total
Consumer loans
Gross amount
Expected loss
Gross amount
Expected loss
Gross amount
Expected loss
Gross amount
Expected loss
Gross amount
Expected loss
Gross amount
Expected loss
S/(000)
S/(000)
S/(000)
S/(000)
S/(000)
S/(000)
S/(000)
S/(000)
S/(000)
S/(000)
S/(000)
S/(000)
Maturity shorter than:
30 days
1,299,718
369,516
—
—
1,299,718
369,516
1,700,558
508,045
—
—
1,700,558
508,045
90 days
—
—
2,581
2,373
2,581
2,373
—
—
10,295
9,883
10,295
9,883
Maturity longer than:
30 days
322,975
104,900
—
—
322,975
104,900
535,994
205,316
—
—
535,994
205,316
90 days
—
—
512,110
492,327
512,110
492,327
—
—
722,801
672,534
722,801
672,534
Total
1,622,693
474,416
514,691
494,700
2,137,384
969,116
2,236,552
713,361
733,096
682,417
2,969,648
1,395,778
F-64
2024
2023
Stage 2
Stage 3
Total
Stage 2
Stage 3
Total
Mortgage loans
Gross amount
Expected loss
Gross amount
Expected loss
Gross amount
Expected loss
Gross amount
Expected loss
Gross amount
Expected loss
Gross amount
Expected loss
S/(000)
S/(000)
S/(000)
S/(000)
S/(000)
S/(000)
S/(000)
S/(000)
S/(000)
S/(000)
S/(000)
S/(000)
Maturity shorter than:
30 days
539,780
35,542
—
—
539,780
35,542
463,168
20,311
—
—
463,168
20,311
90 days
—
—
—
—
—
—
—
—
546
109
546
109
Maturity longer than:
30 days
129,307
8,414
—
—
129,307
8,414
116,386
5,442
—
—
116,386
5,442
90 days
—
—
325,095
44,321
325,095
44,321
—
—
272,859
54,542
272,859
54,542
Total
669,087
43,956
325,095
44,321
994,182
88,277
579,554
25,753
273,405
54,651
852,959
80,404
2024
2023
Stage 2
Stage 3
Total
Stage 2
Stage 3
Total
Small and micro-business loans
Gross amount
Expected loss
Gross amount
Expected loss
Gross amount
Expected loss
Gross amount
Expected loss
Gross amount
Expected loss
Gross amount
Expected loss
S/(000)
S/(000)
S/(000)
S/(000)
S/(000)
S/(000)
S/(000)
S/(000)
S/(000)
S/(000)
S/(000)
S/(000)
Maturity shorter than:
30 days
251,719
8,667
—
—
251,719
8,667
81,094
20,173
—
—
81,094
20,173
90 days
—
—
473
423
473
423
—
—
2,692
2,637
2,692
2,637
Maturity longer than:
30 days
49,674
3,439
—
—
49,674
3,439
44,901
10,155
—
—
44,901
10,155
90 days
—
—
84,970
61,750
84,970
61,750
—
—
103,336
68,181
103,336
68,181
Total
301,393
12,106
85,443
62,173
386,836
74,279
125,995
30,328
106,028
70,818
232,023
101,146
F-65
(l)
The following tables present the exposure and the expected credit losses by the economic sector for direct loans as of December 31, 2024 and 2023:
2024
Carrying amount
Expected credit loss
Percentage expected credit loss
Stage 1
Stage 2
Stage 3
Total
Stage 1
Stage 2
Stage 3
Total
Stage 1
Stage 2
Stage 3
Total
S/(000)
S/(000)
S/(000)
S/(000)
S/(000)
S/(000)
S/(000)
S/(000)
%
%
%
%
Direct loans
Consumer loans
12,899,027
1,622,693
514,691
15,036,411
403,740
474,416
494,700
1,372,856
3.1
%
29.2
%
96.1
%
9.1
%
Mortgage loans
9,577,118
669,087
325,095
10,571,300
5,523
43,956
44,321
93,800
0.1
%
6.6
%
13.6
%
0.9
%
Commerce
392,929
12,365
5,073
410,367
242
389
1,807
2,438
0.1
%
3.1
%
35.6
%
0.6
%
Manufacturing
3,888,532
228,696
21,788
4,139,016
3,383
2,963
8,490
14,836
0.1
%
1.3
%
39.0
%
0.4
%
Professional, scientific and technical activities
583,931
122,359
8,580
714,870
636
715
3,247
4,598
0.1
%
0.6
%
37.8
%
0.6
%
Communications, storage and transportation
1,819,460
105,875
20,939
1,946,274
1,253
2,278
6,328
9,859
0.1
%
2.2
%
30.2
%
0.5
%
Agriculture
2,239,264
141,792
12,255
2,393,311
1,260
2,480
2,524
6,264
0.1
%
1.7
%
20.6
%
0.3
%
Electricity, gas, water and oil
101,903
20,289
35,649
157,841
364
396
28,281
29,041
0.4
%
2.0
%
79.3
%
18.4
%
Leaseholds and real estate activities
398,882
46,199
3,758
448,839
1,137
1,523
2,957
5,617
0.3
%
3.3
%
78.7
%
1.3
%
Construction and infrastructure
632,424
118,719
21,022
772,165
1,763
1,675
10,446
13,884
0.3
%
1.4
%
49.7
%
1.8
%
Others
12,024,594
1,521,533
278,843
13,824,970
20,023
35,845
121,106
176,974
0.2
%
2.4
%
43.4
%
1.3
%
Total direct loans
44,558,064
4,609,607
1,247,693
50,415,364
439,324
566,636
724,207
1,730,167
1.0
%
12.3
%
58.0
%
3.4
%
2023
Carrying amount
Expected credit loss
Percentage expected credit loss
Stage 1
Stage 2
Stage 3
Total
Stage 1
Stage 2
Stage 3
Total
Stage 1
Stage 2
Stage 3
Total
S/(000)
S/(000)
S/(000)
S/(000)
S/(000)
S/(000)
S/(000)
S/(000)
%
%
%
%
Direct loans
Consumer loans
13,355,812
2,236,552
733,096
16,325,460
466,606
713,361
682,417
1,862,384
3.5
%
31.9
%
93.1
%
11.4
%
Mortgage loans
8,981,439
579,554
273,405
9,834,398
6,794
25,753
54,651
87,198
0.1
%
4.4
%
20.0
%
0.9
%
Commerce
454,962
18,592
1,867
475,421
736
1,109
1,376
3,221
0.2
%
6.0
%
73.7
%
0.7
%
Manufacturing
3,279,555
458,429
24,135
3,762,119
6,700
9,780
9,823
26,303
0.2
%
2.1
%
40.7
%
0.7
%
Professional, scientific and technical activities
639,699
4,343
9,422
653,464
1,770
1,265
3,501
6,536
0.3
%
29.1
%
37.2
%
1.0
%
Communications, storage and transportation
441,627
109,686
40,207
591,520
2,109
3,570
8,831
14,510
0.5
%
3.3
%
22.0
%
2.5
%
Agriculture
1,927,954
233,793
11,067
2,172,814
3,638
2,920
1,658
8,216
0.2
%
1.2
%
15.0
%
0.4
%
Electricity, gas, water and oil
113,039
27,827
38,543
179,409
1,463
860
27,611
29,934
1.3
%
3.1
%
71.6
%
16.7
%
Leaseholds and real estate activities
277,573
62,852
5,972
346,397
2,156
3,433
4,404
9,993
0.8
%
5.5
%
73.7
%
2.9
%
Construction and infrastructure
593,416
84,193
21,834
699,443
2,564
2,422
8,462
13,448
0.4
%
2.9
%
38.8
%
1.9
%
Others
11,182,934
1,674,639
351,140
13,208,713
50,706
69,439
167,537
287,682
0.5
%
4.1
%
47.7
%
2.2
%
Total direct loans
41,248,010
5,490,460
1,510,688
48,249,158
545,242
833,912
970,271
2,349,425
1.3
%
15.2
%
64.2
%
4.9
%
F-66
(m)
The following tables present the exposure and the expected credit losses by the economic sector for indirect loans as of December 31, 2024 and 2023:
2024
Carrying amount
Expected credit loss
Percentage expected credit loss
Stage 1
Stage 2
Stage 3
Total
Stage 1
Stage 2
Stage 3
Total
Stage 1
Stage 2
Stage 3
Total
S/(000)
S/(000)
S/(000)
S/(000)
S/(000)
S/(000)
S/(000)
S/(000)
%
%
%
%
Indirect loans
Commerce
406,317
23,200
—
429,517
70
11
—
81
0.0
%
0.0
%
0.0
%
0.0
%
Manufacturing
825,853
6,734
—
832,587
185
61
—
246
0.0
%
0.9
%
0.0
%
0.0
%
Professional, scientific and technical activities
42,476
1,410
—
43,886
50
42
—
92
0.1
%
3.0
%
0.0
%
0.2
%
Communications, storage and transportation
547,328
2,209
54
549,591
323
15
45
383
0.1
%
0.7
%
83.3
%
0.1
%
Agriculture
13,890
37
—
13,927
16
1
—
17
0.1
%
2.7
%
0.0
%
0.1
%
Electricity, gas, water and oil
169,810
16,495
8,474
194,779
409
208
6,819
7,436
0.2
%
1.3
%
80.5
%
3.8
%
Leaseholds and real estate activities
90,609
45,051
—
135,660
88
118
—
206
0.1
%
0.3
%
0.0
%
0.2
%
Construction and infrastructure
114,457
10,194
—
124,651
45
100
—
145
0.0
%
1.0
%
0.0
%
0.1
%
Others
2,551,447
177,229
15,420
2,744,096
1,477
1,694
2,471
5,642
0.1
%
1.0
%
16.0
%
0.2
%
Total indirect loans
4,762,187
282,559
23,948
5,068,694
2,663
2,250
9,335
14,248
0.1
%
0.8
%
39.0
%
0.3
%
2023
Carrying amount
Expected credit loss
Percentage expected credit loss
Stage 1
Stage 2
Stage 3
Total
Stage 1
Stage 2
Stage 3
Total
Stage 1
Stage 2
Stage 3
Total
S/(000)
S/(000)
S/(000)
S/(000)
S/(000)
S/(000)
S/(000)
S/(000)
%
%
%
%
Indirect loans
Commerce
298,440
25,424
—
323,864
266
40
—
306
0.1
%
0.2
%
0.0
%
0.1
%
Manufacturing
682,138
145,052
—
827,190
685
275
—
960
0.1
%
0.2
%
0.0
%
0.1
%
Professional, scientific and technical activities
44,501
1,448
—
45,949
139
8
—
147
0.3
%
0.6
%
0.0
%
0.3
%
Communications, storage and transportation
453,038
12,257
—
465,295
745
92
—
837
0.2
%
0.8
%
0.0
%
0.2
%
Agriculture
9,760
37
—
9,797
22
—
—
22
0.2
%
0.0
%
0.0
%
0.2
%
Electricity, gas, water and oil
95,956
127,084
8,606
231,646
598
890
6,513
8,001
0.6
%
0.7
%
75.7
%
3.5
%
Leaseholds and real estate activities
57,614
50,671
—
108,285
133
214
—
347
0.2
%
0.4
%
0.0
%
0.3
%
Construction and infrastructure
72,910
2,053
1
74,964
100
6
—
106
0.1
%
0.3
%
0.0
%
0.1
%
Others
2,309,898
339,399
7,193
2,656,490
3,936
2,414
856
7,206
0.2
%
0.7
%
11.9
%
0.3
%
Total indirect loans
4,024,255
703,425
15,800
4,743,480
6,624
3,939
7,369
17,932
0.2
%
0.6
%
46.6
%
0.4
%
During the years 2024 and 2023, the Group applied its expert judgment, which led incurring in a higher provision for expected losses, see Note 29.1(d.8).
F-67
7.
Investment property
(a)
This caption is made up as follows:
2024
2023
Acquisition or construction year
Valuation methodology (f) 2024 / 2023
S/(000)
S/(000)
Land (i)
San Isidro – Lima
279,775
269,194
2009
Appraisal
San Martín de Porres – Lima
80,389
77,970
2015
Appraisal
Pardo (Vivanda) (d)
68,200
12,903
2021
Appraisal / Cost
Nuevo Chimbote
37,382
34,724
2021
Appraisal
Ate Vitarte - Lima
32,195
31,510
2006
Appraisal
Santa Clara – Lima
28,613
27,229
2017
Appraisal
Piura (e)
—
39,081
2020
Appraisal
Others
33,982
32,738
-
Appraisal / Cost
560,536
525,349
Completed investment property - “Real Plaza” shopping malls (i)
Talara
26,720
28,991
2015
DCF
26,720
28,991
Buildings (i)
Orquídeas - San Isidro - Lima, (d) Note 3.4(o)
150,718
128,593
2017
DCF
Ate Vitarte – Lima
133,768
128,698
2006
DCF
Paseo del Bosque
100,023
87,168
2021
DCF
Chorrillos – Lima
95,849
94,184
2017
DCF
Piura
94,907
92,063
2020
DCF
Chimbote
48,690
47,054
2015
DCF
Maestro – Huancayo
35,004
34,978
2017
DCF
Cuzco
29,843
28,167
2017
DCF
Panorama – Lima
22,474
22,136
2016
DCF
Others
83,256
81,511
-
DCF / Appraisal
794,532
744,552
Total
1,381,788
1,298,892
DCF: Discounted cash flow
(i)
Investment property portfolio has been classified by the Group as Level 3. During 2024 and 2023, there were no transfers between levels of hierarchy, see Note 3.4(w).
(ii)
As of December 31, 2024 and 2023, there are no liens on investment property.
F-68
(b)
The net gain on investment properties as of December 31, 2024, 2023 and 2022, consists of the following:
2024
2023
2022
S/(000)
S/(000)
S/(000)
Income from rental of investment property
71,080
65,961
65,485
Gain on valuation of investment property
60,260
7,111
19,146
Loss on sale (e)
(3,176
)
-
-
Total
128,164
73,072
84,631
(c)
The movement of investment property for the years ended December 31, 2024, 2023 and 2022, is as follows:
2024
2023
2022
S/(000)
S/(000)
S/(000)
Beginning of year balances
1,298,892
1,287,717
1,224,454
Additions (d)
61,812
16,903
34,760
Sales (e)
(39,176
)
-
-
Valuation gain
60,260
7,111
19,146
Net transfers, Note 3.4(n)
-
(12,839
)
9,357
End of year balances
1,381,788
1,298,892
1,287,717
(d)
During 2024 and 2023, the main additions correspond to partial purchases of the “Pardo (Vivanda)” building, which was purchased in its entirety from a related party, in cash; and disbursements related to the construction of the building “Orquideas (San Isidro)”, located in Lima.
(e)
During 2024, Interseguro sold, for cash and at market value, a land located in Piura to a related entity. The loss generated by this sale amounted to S/3,176,000, and was recorded in the caption “Net gain from investment properties” in the consolidated income statement.
(f)
Fair value measurement – Investment property and investment property under construction
Valuation techniques -
The discounted cash flow (“DCF”) method is used for completed shopping malls, buildings and investment property built on land leases and owned lands.
This method involves the projection of a series of periodic cash flows at present value through a discount rate. The periodic calculation of the cash flows is normally determined as rental income net of operating expenses. The series of periodic net operating income, together with an estimation of the terminal value (which uses the traditional valuation method) at the end of the projection period, is discounted at present value. The sum of the net current values is equal to the investment property’s fair value.
The fair value of land is determined based on the value assigned by an external appraiser. The external appraiser uses the market comparable method. Under this method, a property’s fair value is estimated based on comparable transactions.
The unit of comparison applied by the Group is the price per square meter. Following are the minimum ranges, maximum ranges and the average price for the main lands, before any adjustment:
Minimum range
Maximum range
Average
US$ per m2
US$ per m2
US$ per m2
San Isidro – Lima
3,961
7,987
5,672
Miraflores – Lima
3,589
5,961
4,699
Ate Vitarte - Lima
1,183
1,546
1,357
San Martin de Porres – Lima
1,076
1,398
1,268
Piura
672
797
724
Main assumptions
Below is a brief description of the assumptions considered in the determination of cash flows as of December 31, 2024 and 2023:
-
ERV (Estimated Rental Value) -
Corresponds to the Estimated Rental Value, that is, the rent amount under which the space could be rented considering the prevailing market conditions at the valuation date.
-
Long-term inflation -
It is the increase in the general level of prices expected in Peru for the long term.
F-69
-
Long-term occupancy rate -
It is the expected occupancy level of lessees in the leased properties.
-
Average growth rate of rental income -
It is the rate that expresses the rental income growth and includes growth factors of the industry, inflation rates, stable exchange rate, per capita income and increasing expenses.
-
Average Net Operating Income (NOI) margin -
It is projected from the rental income from leasable areas, by property and marketing income, minus costs related to administration fees, other administrative expenses, insurance, taxes and other expenses.
-
Discount rate -
It reflects the current market risk and the uncertainty associated with obtaining cash flows.
The main assumptions used in the valuation and estimation of the market value of investment property are detailed below:
US$ / Percentage
2024
2023
Average ERV
US$144.3
US$129.3
Long-term inflation
3.0
%
2.9
%
Long-term occupancy rate
97.5
%
97.1
%
Average growth rate of rental income
2.5
%
3.1
%
Average NOI margin
93.6
%
93.0
%
Discount rate
9.3
%
9.6
%
Sensitivity analysis -
The sensitivity analysis on the valuation of investment property, against changes in factors deemed relevant by Management, is presented below:
2024
2023
S/(000)
S/(000)
Average growth rate of rental income (basis) -
Increase
+0.25%
3,839
20,853
Decrease
-0.25%
(3,837)
(16,791)
Long-term inflation (basis) -
Increase
+0.25%
15,836
17,833
Decrease
-0.25%
(15,404)
(13,824)
Discount rate (basis) -
Increase
+0.5%
(56,868)
(50,337)
Decrease
-0.5%
66,193
62,076
Likewise, a significant increase (decrease) in the price per square meter of the land lots could result in a significantly higher (lower) fair value measurement.
(g)
Below are the nominal amounts of the future minimum fixed rental income of the Group’s investment property (operating leases):
2024
2023
Year
S/(000)
S/(000)
Within 1 year
72,831
69,078
After 1 year but not more than 5 years
249,668
255,898
Over 5 years
750,179
855,949
Total
1,072,678
1,180,925
The minimum rental income is computed considering a period between 20 and 26 years as of December 31, 2024 (between 20 and 27 years as of December 31, 2023).
F-70
8.
Property, furniture and equipment, net
(a)
The movement of property, furniture and equipment and depreciation for the years ended December 31, 2024, 2023 and 2022, is as follows:
Right-of-use assets
Description
Land
Buildings, facilities and leasehold improvements
Furniture and equipment
Vehicles
Assets and work-in- progress
Buildings and facilities
Furniture and equipment
Total 2024
Total 2023
Total 2022
S/(000)
S/(000)
S/(000)
S/(000)
S/(000)
S/(000)
S/(000)
S/(000)
S/(000)
S/(000)
Cost
Balance as of January 1
125,822
612,818
890,797
1,216
43,206
300,926
17,641
1,992,426
1,864,977
1,826,051
Acquisition of Izipay, Note 1(b)
—
—
—
—
—
—
—
—
—
90,079
Additions
—
21,317
55,931
558
26,913
105,860
—
210,579
183,546
168,214
Transfers
6,058
10,837
16,573
—
(33,468
)
—
—
—
—
—
Transfer (to) from investment property, Note 3.4(n)
—
—
—
—
—
—
—
—
12,193
(10,643
)
Disposals, write-offs and others (d)
(20,286
)
(27,696
)
(44,104
)
(226
)
(311
)
(34,800
)
(1,844
)
(129,267
)
(68,290
)
(208,724
)
Balance as of December 31
111,594
617,276
919,197
1,548
36,340
371,986
15,797
2,073,738
1,992,426
1,864,977
Depreciation
Balance as of January 1
—
(325,467
)
(628,758
)
(1,058
)
—
(215,132
)
(17,179
)
(1,187,594
)
(1,073,545
)
(1,010,933
)
Depreciation of the year
—
(19,794
)
(91,004
)
(139
)
—
(47,434
)
(385
)
(158,756
)
(156,023
)
(133,825
)
Transfer to (from) investment property, Note 3.4(n)
—
—
—
—
—
—
—
—
—
1,286
Disposals, write-offs and others (d)
—
15,723
38,816
219
—
30,443
1,843
87,044
41,974
69,927
Balance as of December 31
—
(329,538
)
(680,946
)
(978
)
—
(232,123
)
(15,721
)
(1,259,306
)
(1,187,594
)
(1,073,545
)
Net book value
111,594
287,738
238,251
570
36,340
139,863
76
814,432
804,832
791,432
(b)
Financial entities in Peru are prohibited from pledging their fixed assets.
(c)
Management periodically reviews the residual values, useful life and the depreciation method to ensure they are consistent with the economic benefits and life expectation of property, furniture and equipment. In Management’s opinion, there is no evidence of impairment in property, furniture and equipment as of December 31, 2024, 2023 and 2022.
(d)
During 2024, transactions include the sale of diverse properties, performed by Interbank to third parties, for US$12,090,000 (equivalent to approximately S/45,462,000), with a net disposal cost of S/32,583,000. The gain generated from these sales amounted to S/12,879,000, and was recorded as “Gain on sale of Property, furniture and equipment” in the caption “Other income and (expenses)” in the consolidated statement of income; see Note 21.
During 2023, transactions include the sale of a property, performed by Interbank to a third party, for US$8,552,000 (equivalent to approximately S/32,667,000), with a net disposal cost of S/17,367,000. The gain generated from the sale amounted to S/15,300,000, and was recorded as “Gain on sale of Property, furniture and equipment” in the caption “Other income and (expenses)” in the consolidated statement of income; see Note 21.
During 2022, transactions include the sale of a land lot, performed by Interbank to a related entity, for US$14,100,000 (equivalent to approximately S/54,313,000), with a net disposal cost of S/44,374,000. The gain generated from the sale amounted to S/9,939,000, and was recorded as “Gain on sale of Property, furniture and equipment” in the caption “Other income and (expenses)” in the consolidated statement of income; see Note 21. Additionally, includes the sale of two land lots from Interseguro to a related entity, recorded as financial lease according to IFRS 16. This sale implied the derecognition of a right-of-use asset, net of depreciation, for S/59,051,000, alongside a derecognition of a right-of-use liability for S/77,305,000), generating a net disposal cost of S/18,253,000 and a gain amounting to S/1,841,000, presented as “Gain on sale of Property, furniture and equipment” in the caption “Other income and (expenses)” in the consolidated statement of income; see Note 21.
F-71
(e) The following table shows the carrying amounts of lease liabilities (included in the caption “Other accounts payable, provisions and other liabilities”); see Note 10(a) and the movement of the year:
2024
2023
S/(000)
S/(000)
As of January 1
90,513
112,581
Additions
105,860
35,900
Interest expenses, Note 19(a)
7,627
5,562
Disposals
(4,908
)
(5,433
)
Exchange differences
102
(279
)
Payments
(55,391
)
(57,818
)
As of December 31
143,803
90,513
As of December 31, 2024 and 2023, the amortization schedule of these obligations is as follows:
2024
2023
S/(000)
S/(000)
2024
—
2,709
2025
35,544
31,956
2026
33,011
20,801
2027
23,621
17,669
2028 onwards
51,627
17,378
Total
143,803
90,513
The following table shows the amounts recognized in the consolidated statement of income:
2024
2023
2022
S/(000)
S/(000)
S/(000)
Depreciation expenses of right-of-use assets
47,819
49,305
53,134
Interest expenses of lease liabilities, Note 19(a)
7,627
5,562
9,283
Expenses related to short-term and low-value assets leases (included in administrative expenses, see Note 24 (c))
5,317
9,643
10,958
Total amount recognized in the consolidated statement of income
60,763
64,510
73,375
During year 2024, the Group paid leases for approximately S/82,644,000 (S/89,334,000 during year 2023).
F-72
9.
Intangible and goodwill, net
(a)
Intangible assets
The movement of intangible assets and amortization for the years ended December 31, 2024, 2023 and 2022, is as follows:
2024
2023
2022
Description
Software
Software development
Relationship with clients
Brand
Database
Other intangible
Goodwill (b and c)
Total
Total
Total
S/(000)
S/(000)
S/(000)
S/(000)
S/(000)
S/(000)
S/(000)
S/(000)
S/(000)
S/(000)
Cost
Balance as of January 1
1,600,270
187,016
110,042
82,546
97,016
229,067
669,075
2,975,032
2,698,486
1,908,144
Acquisition of Izipay, Note 1(b)
—
—
—
—
—
—
—
—
—
569,850
Additions
186,572
54,519
—
—
—
4,243
—
245,334
280,388
227,270
Transfers
105,652
(72,544
)
—
—
—
(33,108
)
—
—
—
—
Disposals and write-offs, Note 21(a)
(22,109
)
—
—
—
—
(20,731
)
—
(42,840
)
(3,842
)
(6,778
)
Balance as of December 31
1,870,385
168,991
110,042
82,546
97,016
179,471
669,075
3,177,526
2,975,032
2,698,486
Amortization
Balance as of January 1
(1,126,123
)
—
(19,257
)
—
(16,978
)
(125,554
)
—
(1,287,912
)
(1,065,284
)
(863,395
)
Amortization of the year
(216,370
)
—
(11,004
)
—
(9,702
)
(17,225
)
—
(254,301
)
(223,015
)
(202,401
)
Disposals and write-offs
21,712
—
—
—
—
10,728
—
32,440
387
512
Balance as of December 31
(1,320,781
)
—
(30,261
)
—
(26,680
)
(132,051
)
—
(1,509,773
)
(1,287,912
)
(1,065,284
)
Net book value
549,604
168,991
79,781
82,546
70,336
47,420
669,075
1,667,753
1,687,120
1,633,202
Management assesses periodically the amortization method used with the purpose of ensuring that it is consistent with the economic benefit of the intangible assets. In Management’s opinion, there is no evidence of impairment in the Group’s intangible assets as of December 31, 2024, 2023 and 2022.
F-73
(b)
Goodwill of Seguros Sura:
In 2017, IFS acquired 99.39 percent of Seguros Sura’s capital stock and 99.42 percent of Hipotecaria Sura’s capital stock. In March 2018, Interseguro merged with Seguro Sura, using the method of absorption, originating the transfer of all the assets and liabilities of Seguros Sura to the absorbing company and extinguishing without having to liquidate.
The goodwill resulting from the purchase of Seguros Sura and Hipotecaria Sura equivalent to S/430,646,000 represents the future synergies that are expected to arise from the combination of operations, distribution channels, workforce and other efficiencies not included in the intangible assets of the present value of acquired in-force business.
The goodwill recorded by the Group has been allocated to the CGU (cash generated unit) comprised of the merged entity.
The recoverable amount for the CGU was determined based on the income approach, specifically the dividend discount model.
As of December 31, 2024 and 2023, the key assumptions used for the calculation of fair value are:
- Perpetuity growth rate: 6.4% (2024) and 6.3% (2023)
- Discount rate: 14.4% (2024) and 14.3% (2023)
10-year cash flows plus an estimation of the value at perpetuity were included in the dividend discount model. The estimated growth rates are based on the historical performance and the expectations of Management over the development of the market. Long-term perpetuity growth rate was determined based on reports from the sector.
The discount rate represents the assessment of the CGU specific risks. The discount rate was established considering the Company’s capital structure, the cost of capital coming from the benefits that the Group’s investors expect to obtain, from the specific risk incorporated by applying comparable individual beta factors adapted to the CGU’s debt structure and from the country and market specific risk premiums for the CGU. Beta factors are assessed on an annual basis using available market information.
The key assumptions described above can change if the market conditions and the economy change. As of December 31, 2024 and 2023, the Group estimates that the reasonableness of possible changes in these assumptions would not make the recoverable amount of the CGU decrease to an amount lower than its carrying amount.
(c) Goodwill and indefinite-lived intangible of Izipay:
In April 2022, IFS acquired 50 percent of Izipay, through the method of step acquisitions, adjusting at fair value the previous participation held by IFS in Izipay through its Subsidiary Interbank (50 percent).
The goodwill resulting from the acquisition of Izipay, amounts to S/ 238,429,000, represents the future synergies that are expected to arise from the combination of operations and other efficiencies not included in the intangibles of the current value of the ongoing business. The value of the brand resulting from the acquisition of Izipay was equivalent to S/82,546,000.
The goodwill and the indefinite-lived brand recorded by the Group has been assigned to the CGU (cash-generating unit) consisting of the acquired entities, Izipay.
The recoverable amount for the CGU has been determined based on the method of discounted cash flows.
As of December 31, 2024 and 2023, the key assumptions used for the calculation of the fair value are the following:
- Perpetual growth rate: 3.0% (2024 and 2023)
- Discount rate: 13.47% (2024) and 13.95% (2023)
10-year cash flows plus an estimation of the value at perpetuity were included in the model of discounted cash flows. The estimated growth rates are based on the historical performance and the expectations of Management over the market development. The long-term perpetual growth rate has been determined considering the upper target range of inflation established by the BCRP.
The discount rate represents the assessment of the CGU’s specific risks. The discount rate was originated considering the data obtained from market information sources.
The key assumptions described before can change if market conditions and the economy change. As of December 31, 2024 and 2023, the Group estimates that the reasonableness of these possible changes in these assumptions would not originate that the recoverable amount of the CGU decreases below its carrying amount.
F-74
10.
Other accounts receivable and other assets, net, and other accounts payable, provisions and other liabilities
(a)
These captions are comprised of the following:
2024
2023
S/(000)
S/(000)
Other accounts receivable and other assets
Financial instruments
Other accounts receivable, net
540,883
660,956
Accounts receivable from sale of investments (c)
432,341
63,466
POS commission receivable
390,126
420,644
Operations in process (d)
149,105
83,640
Accounts receivable related to derivative financial instruments (b)
143,201
158,101
Accounts receivable from short sale operations, Note 3.4(f.11)
61,191
—
Others
14,954
17,774
1,731,801
1,404,581
Non-financial instruments
Tax paid to recover
673,786
422,248
Deferred charges
99,776
101,551
Deferred cost of POS affiliation and registration
85,006
92,511
Tax credit for General Sales Tax - IGV
35,391
32,482
Investments in associates
24,795
22,548
POS equipment supplies (*)
12,966
14,854
Assets received as payment and seized through legal actions
4,158
28,933
Others
2,499
5,440
938,377
720,567
Total
2,670,178
2,125,148
(*) Comprises the Points of Sale (“POS”) required for the rendering of the service. Their supplies are recorded at cost, which is determined by applying the weighted average method.
F-75
2024
2023
S/(000)
S/(000)
Other accounts payable, provisions and other liabilities
Financial instruments
Insurance contract liability with investment component, Note 3.4(d.1.5)
1,308,422
1,010,429
Third party compensation (**)
866,665
763,039
Other accounts payable
665,296
727,906
Operations in process (d)
556,543
226,428
Accounts payable for acquisitions of investments (c)
353,787
106,955
Lease liabilities, Note 8(e)
143,803
90,513
Workers’ profit sharing and salaries payable
109,395
105,734
Accounts payable related to derivative financial instruments (b)
102,288
145,395
Financial liabilities at fair value through profit or loss, Note 3.4(f.11)
61,153
—
Allowance for indirect loan losses, Note 6(d.2)
14,248
17,932
Accounts payable to reinsurers and coinsurers
6,354
7,260
4,187,954
3,201,591
Non-financial instruments
Provision for other contingencies (e)
107,078
70,671
Taxes payable
87,262
80,331
Deferred income (***)
36,394
23,490
Registration for use of POS
18,005
21,962
Others
8,839
9,315
257,578
205,769
Total
4,445,532
3,407,360
(**) Corresponds mainly to outstanding balances payable to affiliated businesses, for the consumptions made by the card’s users, net of the respective fee charged by Izipay, which are mainly settled the day after the transaction was made.
(***) Corresponds mainly to deferred fees for indirect loans (mainly guarantee letters) and the transactions registered in Izipay related to installments pending of accrual within the contract’s term with affiliated businesses.
F-76
(b)
The following table presents the fair value of derivative financial instruments recorded as assets or liabilities, including their notional amounts, as of December 31, 2024 and 2023. The notional gross amount is the nominal amount of the derivative’s underlying asset, and it is the base over which changes in the fair value of derivatives are measured; see Note 18(a):
Note
Assets
Liabilities
Notional amount
Effective part recognized in other comprehensive income during the year
Maturity
Hedged instruments
Caption of the consolidated statement of financial position where the hedged item has been recognized
S/(000)
S/(000)
S/(000)
S/(000)
2024
Derivatives held for trading (*) -
Forward exchange contracts
22,336
45,012
7,092,071
—
Between January 2025 and June 2026
—
—
Cross swaps
11,593
13,277
1,899,348
—
Between January 2025 and November 2029
—
—
Interest rate swaps
38,817
28,812
1,742,139
—
Between January 2025 and June 2036
—
—
Options
—
—
2,518
—
Between January 2025 and July 2025
—
—
72,746
87,101
10,736,076
—
Derivatives held as hedges - Cash flow hedges:
Cross currency swaps (CCS)
13(d)
5,953
3,415
1,129,200
(6,754
)
October 2026
Corporate bonds
Bonds, notes and obligations outstanding
Cross currency swaps (CCS)
13(e)
54,218
—
565,500
(10,463
)
October 2027
Senior bond
Bonds, notes and obligations outstanding
Cross currency swaps (CCS)
12(d)
3,168
—
188,200
1,002
June 2025
Due to banks
Due to banks and correspondents
Cross currency swaps (CCS)
12(d)
—
404
188,200
742
May 2025
Due to banks
Due to banks and correspondents
Cross currency swaps (CCS)
13(e)
—
5,518
75,400
(1,418
)
October 2027
Senior bond
Bonds, notes and obligations outstanding
Cross currency swaps (CCS)
13(e)
—
5,433
75,400
(1,537
)
October 2027
Senior bond
Bonds, notes and obligations outstanding
Cross currency swaps (CCS)
12(d)
7,116
—
75,280
588
February 2025
Due to banks
Due to banks and correspondents
Cross currency swaps (CCS)
13(e)
—
417
37,700
(433
)
October 2027
Senior bond
Bonds, notes and obligations outstanding
Cross currency swaps (CCS)
12(d)
—
—
—
218
-
Due to banks
Due to banks and correspondents
Cross currency swaps (CCS)
12(d)
—
—
—
632
-
Due to banks
Due to banks and correspondents
Cross currency swaps (CCS)
12(e)
—
—
—
243
-
Due to banks
Due to banks and correspondents
70,455
15,187
2,334,880
(17,180
)
143,201
102,288
13,070,956
(17,180
)
(c)
F-77
Note
Assets
Liabilities
Notional amount
Effective part recognized in other comprehensive income during the year
Maturity
Hedged instruments
Caption of the consolidated statement of financial position where the hedged item has been recognized
S/(000)
S/(000)
S/(000)
S/(000)
2023
Derivatives held for trading (*) -
Forward exchange contracts
36,595
29,517
4,875,692
—
Between January 2024 and December 2025
—
—
Interest rate swaps
40,350
25,196
1,530,493
—
Between March 2024 and June 2036
—
—
Cross currency swaps
20,982
44,897
1,370,799
—
Between January 2024 and April 2028
—
—
Options
1,172
1,174
279,047
—
Between January 2024 and December 2024
—
—
99,099
100,784
8,056,031
—
Derivatives held as hedges- Cash flow hedges:
Cross currency swaps (CCS)
13(d)
2,958
7,383
1,112,700
(10,199
)
October 2026
Corporate bonds
Bonds, notes and obligations outstanding
Cross currency swaps (CCS)
13(e)
56,044
—
556,950
(3,309
)
October 2027
Senior bond
Bonds, notes and obligations outstanding
Cross currency swaps (CCS)
12(d)
—
3,020
241,085
(1,374
)
Between January 2025 and June 2025
Due to banks
Due to banks and correspondents
Cross currency swaps (CCS)
12(d)
—
3,823
185,450
(1,234
)
May 2025
Due to banks
Due to banks and correspondents
Cross currency swaps (CCS)
12(d)
—
6,708
111,270
(578
)
August 2024
Due to banks
Due to banks and correspondents
Cross currency swaps (CCS)
12(d)
—
9,442
111,270
(277
)
October 2024
Due to banks
Due to banks and correspondents
Cross currency swaps (CCS)
13(e)
—
5,245
74,260
(2,401
)
October 2027
Senior bond
Bonds, notes and obligations outstanding
Cross currency swaps (CCS)
13(e)
—
5,041
74,260
(1,923
)
October 2027
Senior bond
Bonds, notes and obligations outstanding
Cross currency swaps (CCS)
12(d)
—
811
74,180
(619
)
February 2025
Due to banks
Due to banks and correspondents
Cross currency swaps (CCS)
12(e)
—
3,138
37,090
(88
)
November 2024
Due to banks
Due to banks and correspondents
Cross currency swaps (CCS)
-
—
—
—
(669
)
-
Corporate bonds
Bonds, notes and obligations outstanding
59,002
44,611
2,578,515
(22,671
)
158,101
145,395
10,634,546
(22,671
)
(*) During the years 2024, 2023 and 2022, the Group recognized losses for S/13,793,000, gains for S/68,315,000 and losses for S/4,523,000 , respectively, as a result of the valuation of derivative financial instruments held for trading, which were recorded in the caption “Net (loss) gain from financial assets at fair value through profit or loss” in the consolidated statement of income.
(i)
As of December 31, 2024 and 2023, certain derivative financial instruments hold collateral deposits; see Note 4(d).
(ii)
For the designated hedging derivatives mentioned in the table above, changes in fair values of hedging instruments completely offset the changes in fair values of hedged items; therefore, there has been no hedge ineffectiveness as of December 31, 2024 and 2023. During 2024 and 2023, there were no discontinued hedges accounting.
(iii)
Derivatives held for trading are traded mainly to satisfy clients’ needs. The Group may also take positions with the expectation of profiting from favorable movements in prices or rates. Also, this caption includes any derivatives which do not comply with IFRS 9 hedging accounting requirements.
F-78
(iv)
The table below presents the future effect of current cash flow hedges on the consolidated statement of income, net of the deferred Income Tax, which will be included in the caption “Net (loss) gain of financial assets at fair value through profit or loss” when realized:
As of December 31, 2024
As of December 31, 2023
Up to 1 year
From 1 to 3 years
Over 3 years
Expected effect
Up to 1 year
From 1 to 3 years
Over 3 years
Expected effect
S/(000)
S/(000)
S/(000)
S/(000)
S/(000)
S/(000)
S/(000)
S/(000)
Consolidated statement of income – (Expense) income
(2,458
)
(46,655
)
—
(49,113
)
(2,139
)
(13,717
)
(16,077
)
(31,933
)
The transfer of net unrealized losses on cash flow hedges to the consolidated statement of income is presented in Note 16(d) and 16(e).
F-79
(v)
The gain (loss) for cash flow hedges reclassified to the consolidated statement of income for the years ended as of December 31, 2024 and 2023, is as follows:
2024
2023
S/(000)
S/(000)
Interest expenses from cash flow hedges
(119,893
)
(116,885
)
Interest income from cash flow hedges
89,947
92,637
Expenses for exchange differences from cash flow hedges
(133,480
)
(136,625
)
Income for exchange differences from cash flow hedges
168,835
118,180
5,409
(42,693
)
These amounts offset the effects of interest rate risk and exchange rate risk on the hedged item.
The following table shows hedging instruments that the Group uses in its cash flow hedges due to maturities:
December 31, 2024
1 to 3 months
3 to 12 months
1 to 5 years
Total
Cross currency swaps (CCS)
Notional
75,280
376,400
1,883,200
2,334,880
Average interest rate in US Dollars
4.66
%
5.20
%
2.17
%
—
Average interest rate in Soles
8.59
%
7.89
%
2.07
%
—
Average exchange rate Soles / US Dollar
3.89
3.71
3.66
—
December 31, 2023
1 to 3 months
3 to 12 months
1 to 5 years
Total
Cross currency swaps (CCS)
Notional
—
259,630
2,318,885
2,578,515
Average interest rate in US Dollars
—
3.60
%
3.07
%
—
Average interest rate in Soles
—
8.09
%
3.86
%
—
Average exchange rate Soles / US Dollar
—
3.94
3.66
—
(c)
As of December 31, 2024 and 2023, corresponds to accounts receivable and payable for the sale and purchase of financial investments negotiated during the last days of the month, which were settled at the beginning of the following month. As of said dates, the balance corresponds mainly to the purchase and sale of Sovereign Bonds issued by the Peruvian Government and Global Bonds issued by the Treasury of the United States of America.
(d)
Operations in process include transactions made during the last days of the month and other types of similar transactions that are reclassified to their corresponding accounting accounts in the following month. These transactions do not affect the consolidated statement of income.
(e)
As of December 2024, Inteligo Bank has established a provision of US$5,800,000 (equivalent to approximately S/21,831,000) related to the legal proceedings in the ordinary course of its banking operations.
F-80
11.
Deposits and obligations
(a)
This caption is made up as follows:
2024
2023
S/(000)
S/(000)
Time deposits (e)
19,891,128
17,288,629
Saving deposits
19,411,720
17,756,097
Demand deposits
13,746,684
13,376,375
Compensation for service time (c)
711,806
760,551
Other obligations
6,690
6,582
Total
53,768,028
49,188,234
(b)
Interest rates applied to deposits and obligations are determined based on the market interest rates.
(c)
In May 2024 and 2022, through Act No. 32027 “Act Authorizing workers the free disposal of 100 percent of their severance indemnity deposits in order to cover their needs caused by the economic crises” and Act No. 31480 “Act Authorizing the Withdrawal of Severance Indemnities to Cover Economic Needs Caused by the Covid-19 Pandemic”, respectively, the Peruvian government authorized clients of the financial system, to withdraw 100 percent of these deposits until December 31, 2024 and 2023, respectively. As a result of this benefit, during 2024 approximately 324,000 clients withdrew approximately S/1,014,252,000 (during 2023, approximately 308,000 clients withdrew approximately S/1,061,734,000).
(d)
As of December 31, 2024 and 2023, deposits and obligations of approximately S/19,978,058,000 and S/18,668,431,000, respectively, are covered by the Peruvian Deposit Insurance Fund. Likewise, at those dates, the coverage of the Deposit Insurance Fund by each client is up to S/121,600 and S/123,810, respectively.
(e)
The table below presents the balance of time deposits classified by maturity as of December 31, 2024 and 2023:
2024
2023
S/(000)
S/(000)
Within 1 month
7,744,887
6,131,655
Between 1 and 3 months
5,179,603
3,890,589
Between 3 months and 1 year
6,263,412
6,458,103
Between 1 and 5 years
413,031
512,280
More than 5 years
290,195
296,002
Total
19,891,128
17,288,629
F-81
12.
Due to banks and correspondents
(a)
This caption is comprised of the following:
2024
2023
S/(000)
S/(000)
By type -
Banco Central de Reserva del Peru (b)
1,756,687
3,683,687
Promotional credit lines (c)
2,090,825
2,014,600
Loans received from foreign entities (d)
3,304,169
2,895,637
Loans received from Peruvian entities (e)
332,165
309,525
7,483,846
8,903,449
Interest and commissions payable
78,211
122,481
7,562,057
9,025,930
By term -
Short term
3,586,376
4,852,495
Long term
3,975,681
4,173,435
Total
7,562,057
9,025,930
(b)
As part of the exceptional measures implemented to mitigate the financial and economic impact generated by the Covid-19 pandemic, the BCRP issued a series of regulations related to the loans repurchase agreements. In this sense, during 2022, Interbank took in repurchase agreements of loan portfolio for an amount of S/42,461,000.
As of December 31, 2024, includes repurchase operations on loans represented by securities according to which Interbank receives a debt in local currency for approximately S/123,772,000 (S/540,158,000 as of December 31, 2023), and gives commercial and micro and small business loans as guarantee; see Note 6(a). As of December 31, 2024, these obligations have maturities between May 2025 and November 2025 and accrue interest at effective rates of 0.50 percent; these operations accrued interest payable for approximately S/85,000 (as of December 31, 2023, these obligations had maturities between July 2024 and November 2025, and accrued interest at effective rates of 0.50 percent; these operations accrued interest payable for S/114,000).
Additionally, as of December 31, 2024, it includes repurchase agreements whereby Interbank receives a debt in Soles for approximately S/1,632,915,000, and delivers securities of its investment portfolio as guarantees. In relation to these transactions, Interbank delivered as guarantees Peruvian Sovereign Bonds, recorded as restricted investments at amortized cost, see Note 5(d). These transactions have maturities between January 2025 and March 2025 and accrue interest at effective rates between 5.16 and 5.46 percent. These transactions generated interest payable for approximately S/13,489,000 (as of December 31, 2023, it includes repurchase agreements whereby Interbank receives a debt in Soles for approximately S/3,143,529,000 and delivers securities of its investment portfolio as guarantees. In relation to said operations, Interbank delivered as guarantee Peruvian Sovereign Bonds and Negotiable Certificates of Deposits issued by the BCRP, recorded as restricted investments at fair value through other comprehensive income and restricted investments at amortized cost; see Note 5(b) and (d), respectively. These operations had maturities between January 2024 and October 2024 and accrued interest at effective interest rates between 0.50 percent and 7.33 percent. These operations accrued interest payable for approximately S/59,864,000).
(c)
Promotional credit lines are loans in Soles and US Dollars from the Corporación Financiera de Desarrollo (“COFIDE”) and Fondo Mivivienda (“FMV”) whose purpose is to promote development in Peru. These liabilities are guaranteed by a loan portfolio up to the amount of the line and include specific agreements on the use of funds, the financial conditions to be met and other management issues. In Management’s opinion, Interbank is meeting these requirements.
As of December 31, 2024, COFIDE’s loans accrued interest at an effective annual rate in foreign currency that fluctuated between 5.81 percent and 11.11 percent, and have maturities between December 2029 and October 2034 (as of December 31, 2023, they accrued, in foreign currency, an effective annual interest rate that fluctuated between 5.81 percent and 10.62 percent and had maturities between December 2029 and October 2034).
As of December 31, 2024, FMV’s loans accrued, in local currency, an effective annual interest rate that fluctuated between 5.0 percent and 8.30 percent, and maturities between January 2025 and July 2053 and in foreign currency of 7.75 percent and maturities between January 2025 and November 2028 (as of December 31, 2023, accrued in local currency, an effective annual interest rate between 5.00 percent and 8.30 percent, and maturities between January 2024 and December 2048, and in foreign currency, 7.75 percent and maturities between January 2024 and November 2028).
F-82
(d)
As of December 31, 2024 and 2023, corresponds to the following funding in foreign currency:
Entity
Country
Final maturity
2024
2023
S/(000)
S/(000)
Standard Chartered Bank London
United Kingdom
2026
1,055,140
662,161
China Development Bank Hong Kong Branch
China
2027
376,400
—
Citigroup Global Markets Inc.
United States of America
2026
289,867
289,867
Standard Chartered Bank Hong Kong Ltd.
China
2025
263,480
—
Sumitomo Mitsui Banking
Japan
2026
263,480
259,630
Banco del Estado de Chile, Note 10(b)
Chile
2025
244,660
241,085
BMO Capital Markets Corp.
Canada
2025
188,200
—
Banco Bilbao Vizcaya Argentaria NY Branch, Note 10(b)
Spain
2025
188,200
185,450
Caixabank S.A. Barcelona, Note 10(b)
Spain
2025 / 2024
169,380
166,905
Bank J. Safra Sarasin
Switzerland
2025 / 2024
77,162
81,598
Commerzbank Ag Frankfurt
Germany
2025
75,280
—
Standard Chartered Bank NY, Note 10(b)
United States of America
2025
75,280
74,180
Citibank NA New York
United States of America
2025
37,640
—
Wells Fargo
United States of America
2024
—
296,720
Bank of America
United States of America
2024
—
203,995
Bank of Montreal
Canada
2024
—
185,450
JP Morgan Chase Bank NY, Note 10(b)
United States of America
2024
—
111,270
Bank of New York
United States of America
2024
—
92,725
HSBC Branch India
India
2024
—
37,090
Banco Interamericano de Desarrollo
Multilateral
2024
—
7,511
3,304,169
2,895,637
During the year 2024, the operations with foreign entities accrued an average interest rate between 6-month Term SOFR plus 0.60 percent and 6-month Term SOFR plus 1.99 percent, 3-month Term SOFR plus 0.70 percent and 3-month Term SOFR plus 1.90 percent and Daily SOFR plus 1.30 percent, and annual fixed rates that fluctuate between 5.16 percent and 7.51 percent (between 6-month Term SOFR plus 0.75 percent and 6-month Term SOFR plus 1.70 percent, and annual fixed rates that fluctuate between 6.53 percent and 7.51 percent during the year 2023).
F-83
(e)
As of December 31, 2024 and 2023, corresponds to the following funding in local and foreign currency:
Entity
2024
Maturity
Currency
Carrying amount
S/(000)
Banco de Credito del Peru S.A.
Jan-25 / Jan-26
S/
125,171
Bank of GNB Peru S.A.
Jan-25
S/
74,500
Scotiabank Peru S.A.A.
Jan-25 / Oct-25
S/
72,270
Banco BBVA Continental
Jan-25
S/
60,224
332,165
Entity
2023
Maturity
Currency
Carrying amount
S/(000)
Banco de Credito del Peru S.A.
Jan-24 / Jan-26
S/
127,000
Scotiabank Peru S.A.A.
Jan-24 / Oct-25
S/
75,465
Bank of GNB Peru S.A.
Jan-24
S/
69,970
Bank of China (Peru) S.A., Note 10(b)
Nov-24
US$
37,090
309,525
(f)
As of December 31, 2024 and 2023, maturities are the following:
Year
2024
2023
S/(000)
S/(000)
2024
—
4,852,495
2025
3,586,376
1,185,753
2026
1,787,212
1,373,363
2027
517,521
133,723
2028 onwards
1,670,948
1,480,596
Total
7,562,057
9,025,930
F-84
13.
Bonds, notes and other obligations
(a)
This caption is comprised of the following:
Issuance
Issuer
Annual interest rate
Interest payment
Maturity
Amount issued
2024
2023
(000)
S/(000)
S/(000)
Local issuances
Subordinated bonds – third program (b)
Fourth - single series
Interseguro
7.09375%
Semi-annually
2034
US$34,780
130,912
—
Third - single series
Interseguro
4.84375%
Semi-annually
2030
US$25,000
94,100
92,725
Second - single series
Interseguro
4.34%
Semi-annually
2029
US$20,000
—
74,180
First - single series
Interseguro
6.00%
Semi-annually
2029
US$20,000
—
74,102
225,012
241,007
Corporate bonds – fourth program (b)
First (single series)
Interseguro
6.75%
Semi-annually
2034
US$28,706
108,049
—
Negotiable certificates of deposit – second program
First (A series)
Interbank
5.21875%
Annual
2025
S/112,964
110,010
—
First (B Series)
Interbank
4.9375%
Annual
2025
S/138,435
133,852
—
First (C Series)
Interbank
4.59375%
Annual
2025
S/102,000
97,643
—
341,505
—
Corporate bonds – second program
Fifth (A series)
Interbank
3.41% + VAC (*)
Semi-annually
2029
S/150,000
150,000
150,000
Total local issuances
824,566
391,007
International issuances
Subordinated bonds (c)
Interbank
4.000%
Semi-annually
2030
US$300,000
1,124,502
1,107,228
Corporate bonds
Interbank
5.000%
Semi-annually
2026
S/312,000
311,788
311,644
Corporate bonds (d)
Interbank
3.250%
Semi-annually
2026
US$400,000
1,501,894
1,477,909
Senior bonds (e)
IFS
4.125%
Semi-annually
2027
US$300,000
1,062,514
1,045,258
Subordinated bonds (f)
Interbank
7.625%
Semi-annually
2034
US$300,000
1,122,122
—
Subordinated bonds (g)
Interbank
6.625%
Semi-annually
2029
US$300,000
—
1,112,438
Total international issuances
5,122,820
5,054,477
Total local and international issuances
5,947,386
5,445,484
Interest payable
128,047
106,145
Total
6,075,433
5,551,629
(*) The Spanish term “Valor de actualización constante“ refers to amounts in Soles indexed by inflation.
F-85
(b)
Subordinated bonds do not have specific guarantees and in accordance with SBS rules, qualify as second level equity (Tier 2) in the determination of the effective equity; see Note 16(f).
(c)
Starting on July 8, 2025, prior to authorization by the SBS, Interbank will be able to redeem the entirety of the bonds, having to pay a redemption price of 100 percent of the issued subordinated bonds. From that date onwards, in case Interbank does not perform the early redemption, the interest rate will increase by 371.1 basis points. After July 8, 2025, prior authorization by the SBS, Interbank will be able to redeem the entirety of the bonds, having to pay a redemption price of 100 percent of the issued subordinated bonds plus the present value of each scheduled coupon payment, discounted at the redemption date.
(d)
As of December 31, 2024, Interbank holds fourth cross currency swap contracts for a total of US$300,000,000 (equivalent to approximately S/1,129,200,000), which were designated as cash flow hedges (four cross-currency swap contracts for a total of US$300,000,000 (equivalent to approximately S/1,112,700,000, as of December 31, 2023)), see Note 10(b). Through these operations, part of the amount issued of said bonds was economically converted to Soles at rates of 2.12, 4.92, 5.10 and 5.32 percent.
(e)
From 2018 until July 2027, IFS, at any time, can redeem these bonds, paying a penalty equal to the United States of America Treasury rate plus 30 basis points. The payment of principal will take place on the maturity date of the bonds or when IFS redeems them.
In October 2017, IFS entered a cross-currency swap for US$150,000,000 (equivalent to approximately S/565,500,000 and S/556,950,000, as of December 31, 2024 and 2023, respectively). Later on, during January and February 2023, IFS signed two cross-currency swap contracts for US$20,000,000 each (equivalent to approximately S/75,400,000 and S/74,260,000 each, as of December 31, 2024 and 2023, respectively) and during August 2024, signed another cross-currency swap contract for US$10,000,000 (equivalent to approximately S/37,700,000); which were designated as a cash flow hedges; see Note 10(b).
As of December 31, 2024, Management does not intend to redeem these bonds before their maturity date; said situation may change in the future, depending on market conditions.
(f)
Starting in January 2029, prior to authorization by the SBS, Interbank will be able to redeem the entirety of the bond, without penalties; since that date, the interest rate changes to 5-year U.S. Treasury plus 365.2 basis points. In accordance with SBS regulation, this issuance qualifies as second level equity (Tier 2) in the determination of the regulatory capital.
Also, as part of said program, Interbank announced a repurchase offering in cash aimed to the bondholders of the subordinated bond called “6.625% Subordinated Notes due 2029”; see paragraph (j). On January 17, 2024, Interbank repurchased bonds for an amount of US$194,852,000. Regarding the remaining balance of bondholders that did not accept the repurchase offering, on January 29, 2024, Interbank informed them its decision to early redeem said instruments.
(g)
In accordance with SBS regulation, this issuance qualifies as second level equity (Tier 2) in the determination of the regulatory capital.
In January 2024, Interbank performed a repurchase of part of these bonds; see paragraph (i). On March 19, 2024, Interbank redeemed the entirety of the outstanding bonds for US$105,148,000.
(h)
International issuances are listed at the Luxembourg Stock Exchange. On the other hand, the local and international issuances include standard clauses of compliance with financial ratios, the use of funds and other administrative matters, which have been met by the Group as of December 31, 2024 and 2023. In addition, Interbank maintains the following additional clauses: (i) limits regarding related party transactions that are not under market conditions and (ii) limits regarding consolidation, merger or transfer of Interbank assets. In the opinion of Interbank Management and its legal advisers, these clauses has been met by Interbank as of December 31, 2024 and 2023.
(i)
As of December 31, 2024 and 2023, the repayment schedule of these obligations is as follows:
Year
2024
2023
S/(000)
S/(000)
2024
—
71,709
2025
430,884
—
2026
1,813,682
1,789,553
2027
1,069,661
1,052,011
2028 onwards
2,761,206
2,638,356
Total
6,075,433
5,551,629
F-86
14.
Assets and Liabilities for insurance and reinsurance contracts
(a)
This caption is comprised of the following:
2024
2023
Assets
Liabilities
Net
Assets
Liabilities
Net
S/(000)
S/(000)
S/(000)
S/(000)
S/(000)
S/(000)
Reinsurance contracts held (*)
(18,602
)
1,968
(16,634
)
(26,287
)
1,895
(24,392
)
Insurance contracts issued
Liability for remaining coverage
—
12,335,922
12,335,922
—
12,000,220
12,000,220
Liability for incurred claims
—
186,430
186,430
—
205,421
205,421
Total insurance contracts issued (b) and (c)
—
12,522,352
12,522,352
—
12,205,641
12,205,641
Total insurance contracts issued and reinsurance contracts held
(18,602
)
12,524,320
12,505,718
(26,287
)
12,207,536
12,181,249
(*) Correspond to the ceded part of the reinsurance contracts mainly life insurance contracts.
The Group disaggregates the information to provide disclosure regarding the life insurance contracts issued and reinsurance contracts issued separately. This disaggregation has been determined based on how the insurance company is managed.
F-87
(b) The movement of issued insurance contract liabilities is presented below:
2024
Liabilities for remaining coverage
Liabilities for incurred claims in contracts measured by the general model (BBA) and variable free approach (VFA)
Liabilities incurred claims in contracts measured by the Premium Allocation Approach (PAA)
Excluding loss component
Loss component
Fulfillment Cash Flows (FCF)
Risk Adjustment (RA)
Fulfillment Cash Flows (FCF)
Risk Adjustment (RA)
Total
S/(000)
S/(000)
S/(000)
S/(000)
S/(000)
S/(000)
S/(000)
Balance as of January 1, 2024
11,301,149
699,071
155,649
5,257
43,237
1,278
12,205,641
Insurance premiums earned
(768,758
)
—
—
—
—
—
(768,758
)
Contracts under fair value, BBA and VFA approach
(545,835
)
—
—
—
—
—
(545,835
)
Contracts under PAA approach
(222,923
)
—
—
—
—
—
(222,923
)
Insurance service expenses
136,433
6,872
454,446
(990
)
101,245
(497
)
697,509
Incurred claims and other expenses
—
—
979,959
106
47,549
(497
)
1,027,117
Amortization of insurance acquisition cash flows
136,433
—
—
—
—
—
136,433
Losses on onerous contracts and reversals of those losses
—
6,872
—
—
—
—
6,872
Changes to liabilities for incurred claims
—
—
(525,513
)
(1,096
)
53,696
—
(472,913
)
Insurance service result
(632,325
)
6,872
454,446
(990
)
101,245
(497
)
(71,249
)
Insurance financial expenses
622,647
32,557
—
—
—
—
655,204
Insurance financial result
563,093
32,557
—
—
—
—
595,650
Interest rate effect (*), see Note 3.4(d.1)
59,554
—
—
—
—
—
59,554
Effect of movements in exchange rates
67,098
3,668
292
4
146
1
71,209
Total changes in the statement of income and other comprehensive income
57,420
43,097
454,738
(986
)
101,391
(496
)
655,164
Total cash flows and investment component
235,185
—
(462,286
)
—
(111,352
)
—
(338,453
)
Premiums received
1,029,082
—
—
—
—
—
1,029,082
Claims and other expenses paid
—
—
(1,039,615
)
—
(111,352
)
—
(1,150,967
)
Insurance acquisition cash flows
(216,568
)
—
—
—
—
—
(216,568
)
Investment component
(577,329
)
—
577,329
—
—
—
—
Balance as of December 31, 2024
11,593,754
742,168
148,101
4,271
33,276
782
12,522,352
(*) Comprises the variation in market interest rate. In 2024, the rates for pension business in US Dollars presented an increase from 6.409 percent in 2023 to 6.412 percent in 2024; whereas rates for pension business in soles presented a decrease from 6.962 percent in 2023 to 6.922 percent in 2024; and rates for pension business in soles VAC presented a decrease, from 3.722 percent in 2023 to 3.599 percent in 2024.
F-88
2023
Liabilities for remaining coverage
Liabilities for incurred claims in contracts measured by the general model (BBA) and variable free approach (VFA)
Liabilities incurred claims in contracts measured by the Premium Allocation Approach (PAA)
Excluding loss component
Loss component
Fulfillment Cash Flows (FCF)
Risk Adjustment (RA)
Fulfillment Cash Flows (FCF)
Risk Adjustment (RA)
Total
S/(000)
S/(000)
S/(000)
S/(000)
S/(000)
S/(000)
S/(000)
Balance as of January 1, 2023
10,337,035
685,630
151,594
5,411
45,278
2,897
11,227,845
Insurance premiums earned
(720,636
)
—
—
—
—
—
(720,636
)
Contracts under fair value, BBA and VFA approach
(495,923
)
—
—
—
—
—
(495,923
)
Contracts under PAA approach
(224,713
)
—
—
—
—
—
(224,713
)
Insurance service expenses
127,009
(12,547
)
433,958
(81
)
106,801
(1,566
)
653,574
Incurred claims and other expenses
—
—
965,054
(81
)
58,884
(1,566
)
1,022,291
Amortization of insurance acquisition cash flows
127,009
—
—
—
—
—
127,009
Losses on onerous contracts and reversals of those losses
—
(12,547
)
—
—
—
—
(12,547
)
Changes to liabilities for incurred claims
—
—
(531,096
)
—
47,917
—
(483,179
)
Insurance service result
(593,627
)
(12,547
)
433,958
(81
)
106,801
(1,566
)
(67,062
)
Insurance financial expenses
1,499,572
29,771
—
—
(545
)
—
1,528,798
Insurance financial result
543,941
29,771
—
—
(545
)
—
573,167
Interest rate effect (*), see note 3.4(d.1)
955,631
—
—
—
—
—
955,631
Effect of movements in exchange rates
(135,726
)
(3,736
)
(447
)
(73
)
(213
)
(53
)
(140,248
)
Total changes in the statement of income and other comprehensive income
770,219
13,488
433,511
(154
)
106,043
(1,619
)
1,321,488
Total cash flows and investment component
193,895
(47
)
(429,456
)
—
(108,084
)
—
(343,692
)
Premiums received
974,312
—
—
—
—
—
974,312
Claims and other expenses paid
—
—
(996,755
)
—
(108,084
)
—
(1,104,839
)
Insurance acquisition cash flows
(213,118
)
(47
)
—
—
—
—
(213,165
)
Investment component
(567,299
)
—
567,299
—
—
—
—
Balance as of December 31, 2023
11,301,149
699,071
155,649
5,257
43,237
1,278
12,205,641
(*) Comprises the variation in market interest rate. In 2023, the rates for pension business in US Dollars presented a decrease from 6.472 percent in 2022 to 6.409 percent in 2023; whereas rates for pension business in soles presented a decrease from 8.139 percent in 2022 to 6.962 percent in 2023; and rates for pension business in soles VAC presented a decrease, from 4.765 percent in 2022 to 3.722 percent in 2023.
F-89
(c) Following is the movement of the issued insurance contracts’ net asset or liability, showing the present value estimates of future cash flows, risk adjustment and the contractual service margin (CSM) for portfolios included in the life insurance unit:
2024
2023
Estimates of the present value of future cash flows
Risk Adjustment
Contractual Service Margin (d)
Total
Estimates of the present value of future cash flows
Risk Adjustment
Contractual Service Margin (d)
Total
S/(000)
S/(000)
S/(000)
S/(000)
S/(000)
S/(000)
S/(000)
S/(000)
Balance as of January 1
11,072,275
302,764
742,870
12,117,909
10,256,194
277,973
599,799
11,133,966
Changes that relate to current services
Contractual service margin recognized for services provided
—
—
(94,596
)
(94,596
)
—
—
(80,778
)
(80,778
)
Risk adjustment recognized for the risk expired
—
(12,257
)
—
(12,257
)
—
(306
)
—
(306
)
Experience adjustments
(30,427
)
—
—
(30,427
)
(114,952
)
—
—
(114,952
)
Changes that relate to future services
Contracts initially recognized in the period
(260,895
)
13,417
269,737
22,259
(249,907
)
9,441
289,323
48,857
Changes in estimates that adjust the contractual service margin
101,713
(6,470
)
(95,243
)
—
98,096
609
(98,705
)
—
Changes in estimates that do not adjust the contractual service margin
88,456
(36,502
)
—
51,954
70,637
17,930
—
88,567
Changes that relate to past services
Adjustments to liabilities for incurred claims
(6,806
)
—
—
(6,806
)
2,866
—
—
2,866
Insurance service result
(107,959
)
(41,812
)
79,898
(69,873
)
(193,260
)
27,674
109,840
(55,746
)
Insurance financial expenses
593,390
15,090
46,348
654,828
1,471,337
111
37,868
1,509,316
Insurance financial result
533,836
15,090
46,348
595,274
515,706
111
37,868
553,685
Interest rate effect (*), see Note 3.4(d.1)
59,554
—
—
59,554
955,631
—
—
955,631
Effect of movements in Exchange rates
68,328
1,242
1,735
71,305
(111,021
)
(2,994
)
(4,637
)
(118,652
)
Total changes in the statement of income and other comprehensive income
553,759
(25,480
)
127,981
656,260
1,167,056
24,791
143,071
1,334,918
Cash flows
(320,911
)
—
—
(320,911
)
(350,975
)
—
—
(350,975
)
Premiums received
812,221
—
—
812,221
737,205
—
—
737,205
Claims and other expenses paid
(1,039,615
)
—
—
(1,039,615
)
(996,755
)
—
—
(996,755
)
Insurance acquisition cash flows
(93,517
)
—
—
(93,517
)
(91,425
)
—
—
(91,425
)
Balance as of December 31
11,305,123
277,284
870,851
12,453,258
11,072,275
302,764
742,870
12,117,909
(*) Balance does not include PPA movement of LRC and LIC amounting to S/69,094,000 and S/87,732,000 as of December 31, 2024 and 2023, respectively.
F-90
(d) Following is the CSM movement for insurance contract portfolios for the periods 2024 and 2023:
2024
2023
Total Contracts using the fair value approach
Total Contracts using the fair value approach
S/(000)
S/(000)
Contractual Service Margin as of January 1
742,870
599,799
Changes that relate to current services
Contractual service margin recognized for services provided
(94,596
)
(80,778
)
Changes that relate to future services
Contracts initially recognized in the period
269,737
289,323
Changes in estimates that adjust the contractual service margin
(95,243
)
(98,705
)
Insurance service result
79,898
109,840
Insurance financial expenses
46,348
37,868
Effect of movements in exchange difference
1,735
(4,637
)
Total changes in the statement of income
127,981
143,071
Other movements
—
—
Balance as of December 31
870,851
742,870
(e) The following table details the components of the new insurance contracts issued and included in the life insurance unit:
2024
2023
Contracts issued
Contracts issued
Non-onerous
Onerous
Total
Non-onerous
Onerous
Total
S/(000)
S/(000)
S/(000)
S/(000)
S/(000)
S/(000)
Life insurance contract liabilities
Estimate of present value of future cash outflows, excluding insurance acquisition cash flows
652,557
218,540
871,097
683,302
99,200
782,502
Estimates of insurance acquisition cash flows
75,164
17,338
92,502
81,957
8,875
90,832
Estimate of present value of future cash outflows
727,721
235,878
963,599
765,259
108,075
873,334
Estimates of present value of future cash inflows
(1,008,629
)
(215,865
)
(1,224,494
)
(1,063,336
)
(59,905
)
(1,123,241
)
Risk adjustment
11,171
2,246
13,417
8,754
687
9,441
Contractual service margin
269,737
—
269,737
289,323
—
289,323
Losses on onerous contracts at initial recognition
—
22,259
22,259
—
48,857
48,857
F-91
(f) Following is the disclosure of when the CSM is expected to be in profit or loss in future years:
2024
Less than a year
From 1 to 2 years
From 2 to 3 years
From 3 to 4 years
From 4 to 5 years
More than 5 years
Total
S/(000)
S/(000)
S/(000)
S/(000)
S/(000)
S/(000)
S/(000)
Insurance contracts issued -
Pensions
(11,923
)
(10,803
)
(9,509
)
(8,481
)
(7,654
)
350,817
302,447
Life
(3,773
)
(3,615
)
(2,780
)
(877
)
1,665
448,532
439,152
General insurance
30,864
23,683
16,570
11,035
6,961
40,139
129,252
15,168
9,265
4,281
1,677
972
839,488
870,851
2023
Less than a year
From 1 to 2 years
From 2 to 3 years
From 3 to 4 years
From 4 to 5 years
More than 5 years
Total
S/(000)
S/(000)
S/(000)
S/(000)
S/(000)
S/(000)
S/(000)
Insurance contracts issued -
Pensions
(11,028
)
(10,474
)
(9,441
)
(8,398
)
(7,570
)
294,707
247,796
Life
(3,681
)
(2,111
)
(776
)
1,271
4,240
347,975
346,918
General insurance
38,088
27,662
19,468
12,920
8,397
41,621
148,156
23,379
15,077
9,251
5,793
5,067
684,303
742,870
F-92
(g) Reconciliation of the amount included in net unrealized income for insurance premium reserves. On transition to IFRS 17, the Group applied the fair value approach for certain groups of contracts with term-life cover and surrender options. The movement in the fair value reserve for related financial assets measured at fair value through other comprehensive income is disclosed below:
2024
2023
S/(000)
S/(000)
Cumulative other comprehensive income, opening balance
744,116
1,714,334
Losses recognized in other comprehensive income in the period
(59,554
)
(955,631
)
Rate effect of “Renta Particular” contract (*)
1,065
(14,587
)
Others
(2,900
)
—
Cumulative other comprehensive income, closing balance
682,727
744,116
(*) Comprises the variation in market interest rate of contracts with investment component recorded in the caption “other accounts payable, provisions and other liabilities”, see Note 10.
F-93
15.
Deferred income tax asset and liability
(a)
As indicated in Note 3.4(aa), the net tax position has been met based on the separate financial statement of each subsidiary domiciled in Peru. The following table presents a summary of the items comprising the subsidiaries' deferred income tax:
2024
2023
S/(000)
S/(000)
Deferred asset
Tax loss
22,400
23,686
Deferred service income
5,386
6,975
Provision for loan portfolio and other provisions
3,859
261,713
Right-of-use assets
436
2,787
Others
15,402
30,912
Net unrealized losses from fluctuation in investments through other comprehensive income
—
8,263
Leveling of assets and liabilities
—
7,474
Unrealized loss from derivatives
—
6,407
Deferred income from indirect credits (stand-by letters)
—
2,272
Modification of rescheduled loan cash flows
—
731
Deferred liability
Deferred cost of POS affiliation and registration
(22,708
)
(25,348
)
Deemed cost of fixed assets
(2,950
)
(60,731
)
Past-due and refinanced loans
—
(121,928
)
Amortization of intangible assets, net
—
(84,552
)
Others
(2,619
)
(2,725
)
Total deferred income tax asset, net
19,206
55,936
Deferred asset
Provision for loan portfolio and other provisions
200,241
—
Unrealized loss from derivatives
7,743
—
Net unrealized losses from fluctuation in investments through other comprehensive income
4,542
—
Deferred income from indirect credits (stand-by letters)
3,629
—
Right-of-use assets
2,299
—
Modification of rescheduled loan cash flows
580
—
Others
16,793
—
Deferred liability
Recording of past-due and refinanced loans
(149,111
)
—
Amortization of intangible assets, net
(76,149
)
—
Higher value of intangibles generated by business combination, Note 1(b)
(68,636
)
(74,744
)
Deemed cost of fixed assets
(56,481
)
—
Leveling of assets and liabilities
(21,741
)
—
Higher value of property, furniture and equipment and right-of-use generated by business combination, Note 1(b)
(889
)
(968
)
Others
(3,473
)
—
Total deferred income tax liability, net
(140,653
)
(75,712
)
(b)
In Management’s opinion, the deferred income tax assets will be recovered from the taxable income that will be generated by each company of the Group over the coming years, including the portion that is recorded in the consolidated statement of changes in equity.
(c)
The table below presents the amounts reported in the consolidated statement of income for the years 2024, 2023 and 2022:
2024
2023
2022
S/(000)
S/(000)
S/(000)
Current – Expense
188,236
140,332
432,392
Current – Dividend expense, Note 17(b)
26,076
33,020
30,587
Deferred – Expense (income)
100,053
102,244
(442
)
314,365
275,596
462,537
F-94
(d)
The table below presents the reconciliation of the effective income tax rate to the statutory tax rate for the Group:
2024
2023
2022
S/(000)
%
S/(000)
%
S/(000)
%
Income before income tax
1,621,826
100.0
1,354,872
100.0
2,140,651
100.0
Theoretical tax
478,439
29.5
399,687
29.5
631,492
29.5
Increase in income of Subsidiaries not domiciled in Peru
1,299
0.1
46,453
3.4
11,412
0.5
Non-taxable income, net
(284,298
)
(17.5
)
(275,379
)
(20.3
)
(243,003
)
(11.4
)
Permanent non-deductible expenses
115,616
7.1
109,602
8.1
61,833
2.9
Non-taxable translation results
3,309
0.2
(4,767
)
(0.4
)
803
0.1
Income tax
314,365
19.4
275,596
20.3
462,537
21.6
16.
Equity
(a)
Capital stock and distribution of dividends –
IFS’s shares are listed on the Lima Stock Exchange and, since July 2019, they are listed also on the New York Stock Exchange. IFS’s shares have no nominal value and their issuance value was US$9.72 per share. As of December 31, 2024 and 2023, IFS’s capital stock is represented by 115,447,705 subscribed and paid-in common shares.
The General Shareholders’ Meeting of IFS held on March 31, 2025, agreed to distribute dividends charged to profits for the year 2024 for approximately US$115,443,000 (equivalent to approximately S/420,096,000); equivalent to US$1.00 per share, which will be paid on May 5, 2025.
The General Shareholders’ Meeting of IFS held on April 1, 2024, agreed to distribute dividends charged to profits for the year 2023 for approximately US$115,443,000 (equivalent to approximately S/427,369,000); equivalent to US$1.00 per share, which were paid on April 29, 2024.
The General Shareholders’ Meeting of IFS held on March 31, 2023, agreed to distribute dividends charged to profits for the year 2022 for approximately US$136,222,000 (equivalent to approximately S/511,788,000); equivalent to US$1.18 per share, which were paid on May 8, 2023.
The General Shareholders’ Meeting of IFS held on March 31, 2022, agreed to distribute dividends charged to profits for the year 2021 for approximately US$202,025,000 (equivalent to approximately S/751,532,000); equivalent to US$1.75 per share, which were paid on May 6, 2022.
(b)
Treasury stock -
On March 31, 2023, the General Shareholders of IFS approved the Share Repurchase Program for an amount of up to US$100 million of common shares, which may be carried out simultaneously on the Lima Stock Exchange – BVL and New York Stock Exchange – NYSE, on one or more dates at market value. The program is expected to continue until terminated by the Board of Directors.
During 2024, within the framework of this Program, Interbank has purchased 1,191,553 shares, at their market values, for approximately US$32,847,000, equivalent to approximately S/122,688,000 (during 2023, Interbank has purchased 938,371 shares, at market values, for approximately US$21,952,000 (equivalent to approximately S/81,021,000).
In addition, during 2024, Interfondos acquired 2,000 common shares, at market value, for approximately US$45,000 (equivalent to approximately S/169,000). On November 20, 2024, it sold these shares (during 2023, Interfondos sold 750 shares for approximately S/75,000).
As of December 31, 2024 and 2023, the Company and some Subsidiaries hold, 2,159,000 and 967,000 shares issued by IFS, respectively, with an acquisition cost equivalent to S/206,997,000 and S/84,309,000.
(c)
Capital surplus -
Corresponds to the difference between the nominal value of the shares issued and their public offerings price, which were performed in 2007 and 2019. Capital surplus is presented net of the expenses incurred and related to the issuance of such shares.
F-95
(d)
Unrealized results, net -
This item is made up as follows:
Unrealized gain (loss)
Instruments that will not be reclassified to consolidated statement of income
Instruments to be reclassified to the consolidated statement of income
Equity instruments at fair value
Debt instruments at fair value
Insurance contracts reserve
Cash flow hedge reserve
Translation of foreign operations
Total
S/(000)
S/(000)
S/(000)
S/(000)
S/(000)
S/(000)
Balances as of January 1, 2022
(8,787
)
(599,626
)
(27
)
44,878
261,085
(302,477
)
Effect of changes in the discount rates of pension reserves, Note 3.4(d)
—
—
1,711,520
—
—
1,711,520
Unrealized loss from equity instruments at fair value through other comprehensive income, net of unrealized gain
(21,663
)
—
—
—
—
(21,663
)
Transfer to retained earnings from realized gain from equity instruments at fair value through other comprehensive income, Note 5(g)
(16,313
)
—
—
—
—
(16,313
)
Unrealized loss from debt instruments at fair value through other comprehensive income, net of unrealized gain
—
(1,848,192
)
—
—
—
(1,848,192
)
Transfer to realized loss from debt instruments at fair value through other comprehensive income, net of unrealized gain
—
14,263
—
—
—
14,263
Transfer of impairment on debt instruments at fair value through other comprehensive income
—
12,746
—
—
—
12,746
Variation for net unrealized loss on cash flow hedges
—
—
—
(70,170
)
—
(70,170
)
Transfer of realized loss on cash flow hedges to consolidated statement of income, net of realized gain
—
—
—
16,030
—
16,030
Translation of foreign operations
—
—
—
—
(50,165
)
(50,165
)
Balances as of December 31, 2022
(46,763
)
(2,420,809
)
1,711,493
(9,262
)
210,920
(554,421
)
Effect of changes in the discount rates of pension reserves, Note 3.4(d)
—
—
(968,599
)
—
—
(968,599
)
Unrealized gain from equity instruments at fair value through other comprehensive income, net of unrealized loss.
16,055
—
—
—
—
16,055
Transfer to retained earnings from realized gain from equity instruments at fair value through other comprehensive income, Note 5(g)
(33,433
)
—
—
—
—
(33,433
)
Unrealized gain from debt instruments at fair value through other comprehensive income, net of unrealized loss.
—
1,128,206
—
—
—
1,128,206
Transfer to realized gain from debt instruments at fair value through other comprehensive income, net of realized loss.
—
(8,350
)
—
—
—
(8,350
)
Transfer of impairment on debt instruments at fair value through other comprehensive income
—
7,390
—
—
—
7,390
Variation for net unrealized loss on cash flow hedges
—
—
—
(67,980
)
—
(67,980
)
Transfer of realized loss on cash flow hedges to consolidated statement of income, net of realized gain
—
—
—
45,309
—
45,309
Translation of foreign operations
—
—
—
—
(21,970
)
(21,970
)
Balances as of December 31, 2023
(64,141
)
(1,293,563
)
742,894
(31,933
)
188,950
(457,793
)
Effect of changes in the discount rates of pension reserves, Note 3.4(d)
—
—
(61,299
)
—
—
(61,299
)
Unrealized gain from equity instruments at fair value through other comprehensive income, net of unrealized loss.
1,263
—
—
—
—
1,263
Transfer to retained earnings from realized loss from equity instruments at fair value through other comprehensive income, Note 5(g)
53,737
—
—
—
—
53,737
Unrealized gain from debt instruments at fair value through other comprehensive income, net of unrealized loss.
—
259,523
—
—
—
259,523
Transfer to realized gain from debt instruments at fair value through other comprehensive income, net of realized loss.
—
(25,325
)
—
—
—
(25,325
)
Transfer of impairment on debt instruments at fair value through other comprehensive income
—
47,497
—
—
—
47,497
Variation for net unrealized loss on cash flow hedges
—
—
—
(57,848
)
—
(57,848
)
Transfer of realized loss on cash flow hedges to consolidated statement of income, net of realized gain
—
—
—
40,668
—
40,668
Translation of foreign operations
—
—
—
—
11,747
11,747
Balances as of December 31, 2024
(9,141
)
(1,011,868
)
681,595
(49,113
)
200,697
(187,830
)
F-96
(e)
Components of other comprehensive income -
The consolidated statement of comprehensive income includes: (i) other comprehensive income that will not be reclassified to the consolidated statement of income in future periods, such as the revaluation of gain (loss) in equity instruments at fair value through other comprehensive income; which will not be reclassified to the consolidated statement of income at the time of its disposal, but will be reclassified to retained earnings; and (ii) other comprehensive income to be reclassified to the consolidated statement of income in future periods, such as the comprehensive income of financial instruments derivatives used as cash flow hedges, debt instruments at fair value through other comprehensive income and translation for foreign operations. Below is the movement of the caption:
2024
2023
2022
S/(000)
S/(000)
S/(000)
Other comprehensive income that will not be reclassified to the consolidated statement of income in future periods:
Equity instruments at fair value through other comprehensive income
Gains (losses) on equity instruments at fair value through other comprehensive income, net
1,263
16,055
(21,663
)
Subtotal
1,263
16,055
(21,663
)
Non-controlling interest
190
8
(43
)
Income Tax
1,595
157
(218
)
Total
3,048
16,220
(21,924
)
Other comprehensive income to be reclassified to the consolidated statement of income in future periods:
Debt instruments at fair value through other comprehensive income
Net gain (loss) unrealized on debt instruments at fair value through other comprehensive income
259,523
1,128,206
(1,848,192
)
Transfer to income of unrealized net (gain) loss on debt instruments at fair value through other comprehensive income
(25,325
)
(8,350
)
14,263
Transfer to income of loss for impairment on debt instruments at fair value through other comprehensive income
47,497
7,390
12,746
Subtotal
281,695
1,127,246
(1,821,183
)
Non-controlling interest
1,448
3,618
(4,423
)
Income Tax
3,595
3,645
(8,250
)
Total
286,738
1,134,509
(1,833,856
)
Insurance contracts reserve at fair value, Note 14(b)
(61,299
)
(968,599
)
1,711,520
Non-controlling interest
(90
)
(1,592
)
2,814
Total
(61,389
)
(970,191
)
1,714,334
Cash flow hedges:
Net loss from cash flow hedges
(57,848
)
(67,980
)
(70,170
)
Transfer of net realized loss from cash flow hedge to consolidated statement of income
40,668
45,309
16,030
Subtotal
(17,180
)
(22,671
)
(54,140
)
Non-controlling interest
(23
)
(105
)
(144
)
Income Tax
(1,402
)
(6,336
)
(8,670
)
Total
(18,605
)
(29,112
)
(62,954
)
Foreign currency translation
11,747
(21,970
)
(50,165
)
(f)
Shareholders’ equity for legal purposes (regulatory capital) -
Within the framework of the Consolidated Supervision set out by the Regulation for the Consolidated Supervision of Financial and Mixed Conglomerates, approved by SBS Resolution No. 11823-2010 and amendments, the Intercorp Group must meet certain capital requirements as well as global and concentration limits, among other requirements, applicable to its Financial Group. As of December 31, 2024, the Financial Group is mainly comprised of Intercorp Financial Services Inc. and its subsidiaries.
On the other hand, as of December 31, 2024 and 2023, the regulatory capital required for Interbank, Interseguro and Inteligo Bank (a Subsidiary of Inteligo Group Corp.), is calculated based on the separate financial statement of each Subsidiary and prepared following the accounting principles and practices of their respective regulators (the SBS or the Central Bank of the Bahamas, in the case of Inteligo Bank).
As of December 31, 2024, the Company and its subsidiaries have complied with the capital requirements and complementary provisions established by their regulators for individual and consolidated supervision purposes, as applicable.
F-97
The regulatory capital required for Interbank, Interseguro and Inteligo Bank is detailed below:
Interbank’s regulatory capital -
According to Legislative Decree No. 1028 and amendments, Interbank’s regulatory capital must be equal to or higher than 10 percent of the assets and contingent credits weighted by total risk represented by the sum of: the regulatory capital requirement for market risk multiplied by 10, the regulatory capital requirement for operational risk multiplied by 10 and the assets and contingent credits weighted by credit risk. However, through Multiple Official Letter No. 27358-2021 and Emergency Decree No. 003-2022, it was established that in the period between April 2021 and August 2022, the regulatory capital for financial companies shall be equal or higher than 8 percent of total risk-weighted assets and contingencies and from September 2022 to March 2023, it will be of 8.5 percent, once this period ends, the regulatory capital shall go back to be equal or higher than 10 percent determined as or indicated above. The aforementioned regulations were modified by SBS Resolution No. 3952-2022, establishing that within the period between January and March 2023, the regulatory capital for financial companies must be equal or higher than 8.5 percent of the assets and contingent assets weighted by total risks; equal or higher than 9 percent between April 2023 and August 2024; equal or higher than 9.5 percent between September 2024 and February 2025; and 10 percent from March 2025 onwards.
As of December 31, 2024 and 2023, in application of the current SBS Resolutions, Interbank maintains the following amounts related to the risk weighted assets and contingent and regulatory capital (basic and supplementary):
2024
2023
S/(000)
S/(000)
Total risk weighted assets and credits
64,308,282
63,494,884
Total regulatory capital
10,239,304
9,811,486
Basic regulatory capital (Level 1)
7,892,361
7,461,727
Supplementary regulatory capital (Level 2)
2,346,943
2,349,759
Global capital to regulatory capital ratio
15.92
%
15.45
%
As of December 31, 2024 and 2023, Interbank has complied with SBS Resolutions No.2115-2009, No.6328-2009, No.14354-2009, No.4128-2014, “Regulations for the Regulatory Capital Requirement for Operational Risk”, “Market Risk” and “Credit Risk”, respectively, and their amendments. These resolutions establish, mainly, the methodologies to be applied by financial entities to calculate the assets and credits weighted per type of risk.
SBS Resolution No. 3953-2022 establishes the calculation of the regulatory capital requirement for additional risks, which shall be equal to the sum of the regulatory capital requirements for concentration risk plus the regulatory capital requirements of interest rate risk in the banking book. As of December 31, 2024 and 2023, the regulatory capital requirement for additional risks is approximately S/731,841,000 and S/594,256,000, respectively.
Interseguro’s regulatory capital -
In accordance with SBS Resolution No. 1124-2006, and its amendments, Interseguro is required to maintain a level of regulatory capital to maintain a minimum equity to support technical risks and other risks that could affect it. The regulatory capital must be higher than the amount resulting from the sum of the solvency net equity, the guarantee fund and the regulatory capital intended to cover credit risks.
The solvency net equity is represented by the higher amount between the solvency margin and the minimal capital. As of December 31, 2024 and 2023, the solvency net equity is represented by the solvency margin. The solvency margin is the complementary support that insurance entities must maintain to deal with possible situations of excess claims not foreseen in the establishment of technical reserves. The total solvency margin corresponds to the sum of the solvency margins of each branch in which Interseguro operates.
Also, the guarantee fund represents the additional equity support that insurance companies must maintain to deal with the other risks that can affect them and that are not covered by the solvency net equity, such as investment risks and other risks. The monthly amount of said fund must be equivalent to 35 percent of the solvency net equity, calculated in accordance with SBS Resolution No. 1124-2006 and its amendments.
As of December 31, 2024 and 2023, Interseguro’s surplus equity is as follows:
2024
2023
S/(000)
S/(000)
Regulatory capital
1,509,399
1,370,151
Less
Solvency equity (solvency margin)
706,926
698,409
Guarantee fund
499,073
455,253
Surplus
303,400
216,489
F-98
Inteligo Bank’s regulatory capital –
The Central Bank of the Bahamas requires Inteligo Bank to maintain a regulatory capital of not less than 8 percent of its risk weighted assets. Inteligo Bank’s capital ratio as of December 31, 2024 and 2023 is the following:
2024
2023
US$(000)
US$(000)
Total eligible capital
157,178
137,460
Total risk weighted assets
812,526
792,352
Capital adequacy ratio (in percentage)
19.34
17.35
In Management’s opinion, IFS and its Subsidiaries have complied with the requirements set forth by the regulatory entities.
(g)
Reserves -
The Board of Directors’ Meeting of IFS held on November 12, 2024, agreed to constitute reserves for S/2,300,000,000 charged to retained earnings.
The General Shareholders’ Meeting of IFS held on March 31, 2022, agreed to constitute reserves for S/800,000,000 charged to retained earnings.
(h)
Subsidiaries’ legal and special reserves -
In accordance with Peruvian regulations, the Subsidiaries domiciled in Peru are required to establish a reserve equivalent to a certain percentage of their paid-in capital (20 or 35 percent, depending on their economic activity) through annual transfers of not less than 10 percent of their net income. As of December 31, 2024 and 2023, the reserves constituted by the Peruvian subsidiaries amounted to S/1,779,383,000 and S/1,670,500,000, respectively.
17.
Tax situation
(a)
IFS and its Subsidiaries incorporated and domiciled in the Republic of Panama and the Commonwealth of the Bahamas (see Note 2), are not subject to any Income Tax, or any other taxes on capital gains, equity or property. The Subsidiaries incorporated and domiciled in Peru (see Note 2) are subject to the Peruvian Tax legislation; see paragraph (c).
Peruvian life insurance companies are exempt from Income Tax regarding the income derived from assets linked to technical reserves for pension insurance and pensions from the Private Pension Fund Administration System; as well as income generated through assets related to life insurance contracts with savings component.
In Peru, all income from Peruvian sources obtained from the direct or indirect sale of shares of stock capital representing participation of legal persons domiciled in the country are subject to income tax. For that purpose, an indirect sale shall be considered to have occurred when shares of stock or ownership interests of a legal entity are sold and this legal entity is not domiciled in the country and, in turn, is the holder — whether directly or through other legal entity or entities — of shares of stock or ownership interests of one or more legal entities domiciled in the country, provided that certain conditions established by law occur.
In this sense, the Act states that an assumption of indirect transfer of shares arises when in any of the 12 months prior to disposal, the market value of shares or participations of the legal person domiciled is equivalent to 50 percent or more of the market value of shares or participations of the legal person non-domiciled. Additionally, as a concurrent condition, it is established that in any period of 12 months shares or participations representing 10 percent or more of the capital of legal persons non-domiciled be disposed of.
Also, an indirect disposal assumption arises when the total amount of the shares of the domiciled legal person whose indirect disposal is performed, is equal or greater than 40,000 Taxation Units (henceforth “UIT”, by its Spanish acronym).
(b)
Legal entities or individuals not domiciled in Peru are subject to an additional tax (equivalent to 5 percent) on dividends received from entities domiciled in Peru. The corresponding tax is withheld by the entity that distributes the dividends. In this regard, since IFS controls the entities that distribute the dividends, it records the amount of Income Tax on dividends as an expense for the financial year of the dividends received. In this sense, during 2024, 2023 and 2022, the Company has recorded a provision for S/26,076,000, S/33,020,000 and S/30,587,000, respectively, in the caption “Income Tax” of the consolidated statement of income.
(c)
IFS’s Subsidiaries incorporated in Peru are subject to the payment of Peruvian taxes; hence, they must calculate their tax expenses on the basis of their separate financial statements. The Income Tax rate as of December 31, 2024, 2023 and 2022, was 29.5 percent, over the taxable income.
(d)
The Tax Authority (henceforth “SUNAT”, by its Spanish acronym) is legally entitled to perform tax audit procedures for up to four years subsequent to the date at which the tax return regarding a taxable period must be filed.
Below are the taxable periods subject to inspection by the SUNAT as of December 31, 2024:
- Interbank: Income Tax returns for the years 2020 to 2023, and Value-Added-Tax returns for the years 2019 to 2024.
- Interseguro: Income Tax returns for the years 2021 to 2024, and Value-Added-Tax returns for the years 2020 to 2024.
- Procesos de Medios de Pago: Income Tax returns for the years 2021 to 2024 and Value-Added-Tax returns for the years 2020 to 2024.
F-99
- Izipay: Income Tax returns and Value-Added-Tax returns for the years 2020 to 2024.
Due to the possible interpretations that the SUNAT may have on the legislation in force, it is not possible to determine at this date whether or not the reviews carried out will result in liabilities for the Subsidiaries; therefore, any higher tax or surcharge that may result from possible tax reviews would be applied to the results of the year in which it is determined.
Following is the description of the main ongoing tax procedures for the Subsidiaries:
Interbank:
Tax periods from 2000 to 2006:
Between 2004 and 2010, Interbank received several Tax Determination and Tax Penalty notices corresponding mainly to the Income Tax determination for the fiscal years 2000 to 2006. As a result, claims and appeals were filed and subsequent contentious administrative proceedings were started.
For these periods, the most relevant matter subject to discrepancy with SUNAT corresponds to whether the “interest in suspense” are subject to Income Tax or not. In this sense, Interbank considers that the interest in suspense does not constitute accrued income, in accordance with the SBS’s regulations and IFRS accounting standards, which is also supported by a ruling by the Permanent Constitutional and Social Law Chamber of the Supreme Court issued in August 2009 and a pronouncement in June 2019.
In June, September and December 2022, the Fifth Constitutional and Social Law Transitory Chamber of the Supreme Court notified of its ruling regarding the Income Tax 2004, advance payments 2004 and Income Tax 2001, respectively, thus reaffirming the aforementioned criterium.
In October 2023, the Fifth Constitutional and Social Law Transitory Chamber of the Supreme Court issued the Resolution through which declared unfounded the cassation appeals filed by SUNAT and the Tax Court against the favorable ruling regarding the Income Tax 2005, thus reaffirming the aforementioned criterium.
Tax period 2003:
In January 2023, Interbank was notified with a Resolution of Compliance which rectified and resettled the debt related to advance payments of the Income Tax for the period 2003, without any amount to pay.
In March 2023, Interbank was notified with a Resolution of Compliance regarding Income Tax for the period 2003, which rectified the tax debt, thus reducing said penalty from S/69,000,000 to S/25,000,000. Likewise, Interbank filed the respective Appeal Recourse against said Resolution of Compliance. In September 2023, Interbank was notified with a Tax Court Resolution, which revokes said Resolution, of Compliance in relation to the updating of the debt, thus, SUNAT must proceed according to what said Resolution mandates, and confirm its content. In October 2023, Interbank was notified with a new Resolution of Compliance, which Interbank has filed an Appeal Recourse against.
In February 2024, the Tax Court issued a Resolution, which ruled to revoke a Resolution of Compliance regarding the updating of the liability, thus, SUNAT must perform a new resettlement. In May 2024, SUNAT issued a Resolution of Compliance, which was appealed by Interbank. In October 2024, Interbank was notified with other Tax Court Resolution, which ruled to confirm the updating contained in Resolution of Compliance issued by the Tax Court.
Also, in October 2024, through Resolution of Coactive Collection, SUNAT notified Interbank the payment of the liability from the third-category Income Tax corresponding the period 2003 for approximately S/17,800,000 (includes taxes, fines and arrears) amount that was paid by Interbank in November 2024; however, the case continues at the Judiciary. This payment was recorded as account receivable from SUNAT, and was recorded as “Recoverable tax” in the caption “Other accounts receivable and other assets, net”; see Note 10(a).
Tax period 2004:
In April 2023, Interbank was notified with a Resolution, through which it rectified the determination of payments on account of Income Tax for the year 2004; this Resolution was appealed by Interbank. In December 2024, Interbank was notified with another Tax Court Resolution, which confirmed the original Resolution of the Intendence.
In October 2024, Interbank was notified with a Resolution of Intendence regarding the third-category Income Tax corresponding to the period 2004, which ruled to rectify and continue with the collection of the tax liability.
Tax period 2005:
In May 2020, Interbank was notified with the Resolution of Compliance related to the Income Tax and advance payments of the Income Tax for the year 2005 (linked to the interest in suspense). Through said notification, SUNAT increased the requested tax debt from S/1,000,000 to S/35,000,000 because as a result of the Resolution of Compliance, certain previously accepted deductions by SUNAT were rejected. In June 2020, Interbank filed an Appeal, which is pending of pronouncement by the Tax Court.
In December 2022, the Tax Court notified to Interbank with a Resolution, through which it revoked interest in suspense, financial pro-rata, advance payments and fines.
F-100
In October 2023, Interbank was notified with a Resolution of Intendence, issued in compliance with Tax Court Resolution appealed by Interbank. In April 2024, the Tax Court issued a Resolution, which ruled to partially revoke the previous Resolution of Intendence and ordered the resettlement of the tax, by virtue of which, a Resolution of Compliance was issued for approximately S/23,700,000, against which an Appeal Recourse was filed by Interbank.
In November 2024, Interbank was notified by the Tax Court with a Resolution, related to the advance payments of the Income Tax 2005, which is under compliance phase.
Tax period 2006:
In February 2021, Interbank was notified with the Resolution of Compliance related to the Income Tax and prepaid income tax of the year 2006 (related to litigations about interest in suspense). Through said notification, SUNAT rejected an excess payment of S/3,500,000 and determined a tax debt of S/23,000,000.
In December 2022, the Tax Court revoked the claims over interest in suspense, prepayment quotient and associated penalties. However, in December 2024, the Tax Court ordered to maintain and continue with the updated collection of the tax liability related to the Income Tax 2006, thus confirming previous Resolutions related to claims and penalties. To the date of this report, the case is pending resolution by the Judiciary.
As of December 31, 2024, the tax liability requested for this concept and others minor, amounts to approximately S/84,000,000, and includes taxes, fines and arrears; out of which S/56,000,000 correspond to the concept of interest in suspense, and S/28,000,000 correspond to other claims. As of December 31, 2023, the tax liability requested amounted to S/124,000,000, including taxes, fines and arrears.
Tax period 2010:
In February 2017, SUNAT closed the audit procedure corresponding to the Income Tax for the year 2010. Interbank paid the debt under protest and filed a claim recourse. As of the date of this report, the procedure has been appealed, and it is pending resolution by the Tax Court.
Tax period 2012:
In July 2020, Interbank was notified of the Determination and Penalty Resolutions corresponding to the audit of the third-category Income Tax for the fiscal year 2012. As of December 31, 2024 and 2023, the tax debt claimed by the SUNAT amounted to S/14,600,000 and S/14,400,000, respectively. As of the date of this report, the process is on appeal, pending resolution by the Tax Court.
Tax period 2013:
In January 2019, Interbank was notified of the Determination and Penalty Resolutions corresponding to the audit of the Income Tax for the fiscal year 2013. As of that date, the tax debt claimed by the Tax Court amounted to approximately S/50,000,000. The main concept observed corresponded to the deduction of loan write-offs without proof by the SBS.
In December 2022, the SUNAT through Resolution of Coactive Collection, notified the payment of the third-category Income Tax debt corresponding to the period 2013, for approximately S/62,000,000 (which includes the tax, fines and interest arrears) sum that was paid by Interbank in February 2023; however, the process continues before the Judiciary instance. This payment was recorded as account receivable from SUNAT, that was recorded as “Tax paid to recover”, in the caption “Other accounts receivable and other assets, net”; see Note 10(a).
Tax period 2014:
In September 2019, Interbank was notified with Resolutions of Determination and Penalty corresponding to the audit of the third-category Income Tax corresponding the period 2014, without additional amounts; as well as with Resolutions of Determination, issued on the application of the additional Income Tax rate of 4.1 percent; regarding this, the tax liability requested by SUNAT as of December 31, 2024 and 2023, amounts to S/178,000 and S/177,000, respectively. To the date of this report, the case is under appeal, pending resolution by the Tax Court.
Tax period 2015:
In December 2021, Interbank was notified with Resolutions of Determination and Penalty corresponding to the audit of the third-category Income Tax of the period 2015.
As of December 31, 2024 and 2023, the tax debt requested in relation to the Income Tax advance payments for the period 2015 and to the application of the additional Income Tax rate of 4.1 percent, amounted to S/14,800,000 and S/14,600,000, respectively. As of the date of this report, the process is under appeal, pending resolution by the Tax Court.
F-101
Tax period 2017:
In December 2021, SUNAT notified Interbank about the beginning of the definitive audit procedure on Income Tax corresponding to the year 2017. In October 2022, SUNAT notified through Resolutions of Determination, issued regarding the third-category Income Tax corresponding to the period 2017 and Income Tax advance payments from January to December 2017; however, in November 2022, Interbank filed a claim recourse against the aforementioned determination resolutions. As of the date of this report, the process is under appeal, pending resolution by the Tax Court.
Tax period 2018:
In April 2019, SUNAT notified of the start of the final audit process for non-domiciled income tax withholdings corresponding to the year 2018.
In November 2023, SUNAT notified Interbank with a Resolution of Determination regarding the Income Tax for the fiscal year 2018, Resolutions of Determination, issued regarding advance payments from January to December 2018 and resolutions of Penalty for the tax and period indicated.
As of December 31, 2024 and 2023, the tax liability requested regarding the Income Tax and advance payments of the third-category Income Tax corresponding to the period 2018, amounted to S/78,000,000 and S/74,800,000, respectively. To the date of this report, the case is under appeal, pending resolution by the Tax Court.
Tax period 2019:
In October 2023 and February 2024, SUNAT notified the beginning of the audit process to Interbank regarding the third-category Income Tax corresponding to the period 2019 and Transfer Prices for the period 2019, respectively. As of December 31, 2024, the audit process for the period 2019 is ongoing.
Interseguro:
In October 2023, SUNAT completed the fiscalization procedure regarding the Income Tax corresponding for the period 2020, without additional observations.
Procesos de Medios de Pago:
In December 2024, SUNAT concluded the definite audit procedure of the Income Tax for the period 2020, without material observations.
Izipay:
F-102
As of December 31, 2024 and 2023, Izipay maintains carryforward tax losses amounting to S/70,043,812 and S/71,552,053, respectively. In application of current tax regulations, Management opted for system “B” to offset its tax losses. Through this system, the tax loss may be offset against the net income obtained in the following years, up to 50 percent of said income until they are extinguished; therefore, they do not have an expiration date.
In the opinion of IFS Management, its Subsidiaries and its legal advisers, any eventual additional tax would not be significant for the financial statements as of December 31, 2024 and 2023.
(e)
For the purpose of determining the Income Tax, the transfer prices of transactions with related companies and with companies domiciled in countries or territories that are non-cooperating or low or zero tax countries or territories, or with entities or permanent establishments whose income, revenues or gains from said contracts are subject to a preferential tax regime, must be supported by documented information on the valuation methods used and the criteria considered for their determination. The Tax Administration is authorized to request this information from the Group's subsidiaries.
Through Legislative Decree No. 1312,in force since 2017, it was also established that intra-group transactions of low aggregate value cannot have a margin higher than 5 percent of their cost, and regarding services rendered between related companies, taxpayers must comply with the benefit test and with providing the documentation supporting their reality (information on costs and expenses incurred by the service provider, profit margin, among others), as well as the information requested for the deduction of the cost or expense.
Through Legislative Decree No. 1116, it was established that the regulations of Transfer Prices are not applicable for purposes of the Value-Added Tax.
Through Legislative Decree No.1381, in force since 2018, it was incorporated in the Income Tax Act the concept of “non-cooperating” countries or territories and preferential tax regimes to which defensive measures already existing for countries and territories with low or zero taxation are imposed.
Based on the analysis of the operations of the Group, Management and its internal legal advisors believe that, as a consequence of the application of these standards, no contingencies will arise for the Group as of December 31, 2024 and 2023.
(f)
Starting on September 14, 2018, Legislative Decree No. 1422 established that, when an audited entity is subject to the General Anti-Avoidance Clause (“CAG”, by its Spanish acronym), it is automatically deemed that there exists deceit, grave negligence or abuse of powers by the legal representatives, unless proven otherwise. The mentioned joint liability will be attributed to said representatives provided that they have collaborated with the design or approval or execution of actions or situations or economic relations with avoidance purposes.
This legal norm also includes the members of the Board of Directors. It sets out that it is up to this corporate body to define the tax strategy of the entity, having to decide on the approval or not of actions, situations or economic relations to be carried out within the framework of tax planning, this power being non-delegable.
Board members of domiciled entities were given until March 29, 2019, to ratify or modify the actions, situations or economic relations performed within the tax planning framework, and implemented as of September 14, 2018, that continue to have tax effects until now.
Notwithstanding the aforementioned deadline for the compliance of said formal obligation, and considering the referred joint liability attributable to both the legal representatives and the Board members, as well as the lack of definition of the term “tax planning”, it will be critical to review every actions, situation or economic relation that (i) has increased tax attributes; and/or (ii) has generated a lower tax payment for the aforementioned periods in order to avoid the attribution of tax joint liability, at administrative level or even criminal level, depending on the judgment of the auditing agent, in case of application of the CAG to the entity subject to tax intervention by SUNAT.
(g)
Legislative Decree No. 1372, in force since 2018, established the rules that regulate the obligation of legal persons and/or legal entities to inform the identification of their final beneficiaries. These rules are applicable to legal entities domiciled in the country and legal entities established in the country. The obligation covers non-domiciled legal entities and legal entities established abroad, provided that: a) they have a branch, agency or other permanent establishment in the country; b) the natural or juridical person who manages the autonomous patrimony or the investment funds from abroad, or the natural or legal person who has the status of trustee or administrator, is domiciled in the country; and c) any member of a consortium is domiciled in the country. This obligation will be fulfilled through the presentation to SUNAT of an informative sworn statement, which must contain the information of the final beneficiary and be submitted in accordance with the regulations and within the deadlines established by Resolution of Superintendence from SUNAT. Notice that in case some modification has been made to the informative sworn statement submitted by the Company, related to the identification of its final beneficiaries, it has to comply with informing of said updating to SUNAT.
(h)
Legislative Decree No. 1532, published on March 19, 2022, and in force since January 1, 2023, regulated the attribution procedure of the condition of Subject Without Operating Capacity (“SSCO”, by its Spanish acronym), within the framework of the fight against tax avoidance. In that sense, an SSCO was defined as the subject that, although being registered as issuer of payment receipts or complementary documents, does not have economic, financial, material, human or other resources, or they are not suitable for the performing of operations for which said documents are issued. Supreme Decree No. 319-2023-EF approved the regulation on the attribution procedure of the SSCO condition.
On December 31, 2024, SUNAT’s webpage and the Official Bulletin published the roster of SSCOs whose resolutions of attribution have been ratified.
F-103
(i)
The use of payment methods is regulated by Act No. 28194 (Act for the Fight Against Tax Avoidance and for the Formalization of the Economy, henceforth, the “Act”), which is referred to the obligation to bankarize certain operations for certain amounts through Entities of the Financial System (“ESF”, by its Spanish acronym).
The Article 4 of the Act, modified by Legislative Decree No. 1529, establishes that the minimum amount for the use of payment methods is two thousand Soles (S/2,000) or five hundred American Dollars (US$500). This means that, in general, every operation above the aforementioned amounts performed by both legal and natural persons have to the channeled through EFSs.
(j)
On June 30, 2023, Supreme Decree No. 137-2023-EF was published, amending Article 30 of the Regulation of the Income Tax Act, through which that regulates the rates applicable to operations with non-domiciled persons. The amendment updates the use of the SOFR rate as the prevailing preferential rate, for the purpose of applying the reduced rate of 4.99 percent. The aforementioned legislation is effective from June 30, 2023.
(k)
On April 22, 2023, Legislative Decree No. 1549 was published. It extends the validity of the exemptions provided by Article 19 of the Income Tax Act until December 31, 2026. Said legislation entered into effect on January 1, 2024.
In this regard, among the aforementioned extended exemptions that are applicable or related to the operations of Interbank, are subsection i) of Article 19, which indicates that shall be exempted any type of fixed or variable interest rate, in local or foreign currency, that is paid for a deposit or levy pursuant to the Banking and Insurance Act (Act No. 26702), as well as the capital increases of said deposits or levies, in local or foreign currency, except when said gains constitute third category income.
(l)
Act No. 32218, published on December 29, 2024, establishes that the following income will be exempted from the Income Tax starting on January 1, 2025: interest and capital gains from repurchase agreements and the sale of participation units of Exchange Traded Funds (ETF), whose underlying assets are instruments issued by the Republic of Peru.
(m)
On December 19, 2023, Act No. 31962 was published. It ordered the use of an interest arrears rate to reconcile the interest payments for the reimbursement of undue or excess payments, and for the cumulative balances of withholdings or perceptions not applied to the tax credit for general sales tax (“IGV”, by its Spanish acronym), as well as in the updating of fines. Likewise, the Act establishes that in the case of unpaid fines, the legal interest rate set out by the BCRP shall be used for their updating and shall be accrued starting on the date that SUNAT requests the payment of the debtor’s fine.
F-104
18.
Off-balance sheet accounts
(a)
The table below presents the components of this caption:
Forward foreign currency agreements, see Note 29.2(b)(i):
Forward currency agreements – purchase
2,514,195
1,811,147
Forward currency agreements – sale
4,078,348
2,316,809
Forward foreign currency agreements in other currencies
499,528
747,736
Foreign currency options
2,518
279,047
Swap agreements, see Note 29.2(b)(ii):
Currency swaps: Foreign currency delivery / receipt in Soles
156,678
283,648
Currency swaps: Soles delivery / receipt in foreign currency
1,742,670
1,087,151
Interest rate swaps
1,742,139
1,530,493
Designated as hedges: Note 10(b)
Cash flows:
Cross currency swaps
2,334,880
2,578,515
13,070,956
10,634,546
Responsibilities for credit lines granted (cancellable) (c)
10,564,239
11,295,837
Responsibilities for credit lines – commercial and others (d)
2,972,089
2,015,304
Total
31,675,978
28,689,167
(b)
In the normal course of its operations, the Group performs contingent operations (indirect loans). These transactions expose the Group to additional credit risks to the amounts recognized in the consolidated statement of financial position.
The Group applies the same credit policies for granting and evaluating the provisions required for direct loans when performing contingent operations (see Note 6(a)), including obtaining guarantees when deemed necessary. Guarantees vary and include deposits in financial institutions or other assets.
Taking into account that most of the contingent operations are expected to expire without the Group having to disburse cash, the total committed amounts do not necessarily represent future cash requirements.
(c)
Responsibilities under credit lines agreements include consumer credit lines and other consumer loans that are cancellable by Interbank.
(d)
Corresponds to commitments of disbursement of future loans that Interbank has committed to carry out; provided that the borrower complies with the obligations under the corresponding loan agreements, however, they may be cancelled by Interbank.
F-105
19.
Interest income and expenses, and similar accounts
(a)
This caption is comprised of the following:
2024
2023
2022
S/(000)
S/(000)
S/(000)
Interest and similar income
Interest on loan portfolio
5,157,744
5,353,991
4,207,420
Impact from the modification of contractual cash flows due to the loan rescheduling schemes (*)
510
(29,404
)
41,110
Interest on investments at fair value through other comprehensive income
1,218,304
1,199,059
1,189,428
Interest on due from banks and inter-bank funds
372,622
367,167
175,401
Interest on investments at amortized cost
217,716
172,602
161,966
Dividends on financial instruments, Note 5(e) and (f)
49,396
42,779
78,928
Others
13,099
14,217
17,049
Total
7,029,391
7,120,411
5,871,302
Interest and similar expenses
Interest and fees on deposits and obligations
(1,495,881
)
(1,662,139
)
(863,335
)
Interest and fees on obligations with financial institutions
(482,392
)
(474,362
)
(234,842
)
Interest on bonds, notes and other obligations
(327,385
)
(311,665
)
(418,821
)
Deposit insurance fund fees
(86,776
)
(81,171
)
(77,920
)
Insurance contract expense with investment component, Note 3.4(d.1.5)
(71,202
)
(51,190
)
(52,440
)
Interest on lease payments, Note 8(e)
(7,627
)
(5,562
)
(9,283
)
Others
(9,007
)
(6,277
)
(5,048
)
Total
(2,480,270
)
(2,592,366
)
(1,661,689
)
(*) For rescheduled loans, Interbank recalculated the carrying amount of these financial assets as the present value of the modified contractual cash flows, discounted at the loan’s original effective interest rate. During 2024, 2023 and 2022, interest was recorded according to the rescheduled term for approximately S/2,165,000, S/9,246,000 and S/22,930,000, respectively. Likewise, as result of the rescheduling of loans under the “Reactiva Peru” program, expenses for approximately S/1,654,000 and S/38,650,000, and income for approximately S/18,180,000, respectively; were recorded.
(b)
The amounts shown in paragraph (a) above, include interest income and expenses calculated using the effective interest rate (EIR), which are related to the following items:
2024
2023
2022
S/(000)
S/(000)
S/(000)
Financial assets measured at amortized cost
5,748,592
5,864,356
4,585,897
Financial assets measured at fair value through other comprehensive income
1,218,304
1,199,059
1,189,428
Total interest from financial assets calculated at EIR
6,966,896
7,063,415
5,775,325
Financial liabilities measured at amortized cost
(2,313,285
)
(2,453,728
)
(1,526,281
)
F-106
20.
Fee income from financial services, net
(a)
For the years ended December 31, 2024, 2023 and 2022, this caption is comprised of the following:
2024
2023
2022
S/(000)
S/(000)
S/(000)
Income
Performance obligations at a point in time:
Accounts maintenance, carriage, transfers, and debit and credit card fees
755,432
747,568
705,188
Income from services (acquirer and issuer role) (b)
733,885
738,177
523,313
Banking service fees
196,985
208,420
248,175
Brokerage and custody services
8,116
5,811
5,836
Others
30,370
36,393
34,438
Performance obligations over time:
Funds management
158,928
137,137
153,948
Contingent loans fees
67,045
68,355
70,038
Collection services
55,978
60,648
60,931
Others
18,694
28,757
40,168
Total (d)
2,025,433
2,031,266
1,842,035
Expenses
Expenses for services (acquirer and issuer role) (b)
(343,038
)
(339,846
)
(238,997
)
Credit cards
(177,492
)
(199,464
)
(164,722
)
Credit card processing commissions
(103,838
)
(85,741
)
(56,845
)
Local banks fees
(71,564
)
(58,956
)
(50,192
)
Credit life insurance premiums
(71,239
)
(71,796
)
(97,378
)
Digital services fees
(53,857
)
(19,451
)
(16,756
)
Foreign banks fees
(25,778
)
(26,285
)
(24,920
)
Registry expenses
(1,865
)
(1,466
)
(2,046
)
Brokerage and custody services (c)
(780
)
(675
)
(961
)
Others
(33,039
)
(49,124
)
(51,832
)
Total
(882,490
)
(852,804
)
(704,649
)
Net
1,142,943
1,178,462
1,137,386
(b)
Corresponds to the management and operation of the shared service of transaction processing of credit and debit cards, for clients of Izipay since April 2022, the month in which Izipay became a Subsidiary of IFS.
(c)
Fee income by geographic distribution for the years ended December 31, 2024, 2023 and 2022 is presented below:
2024
2023
2022
S/(000)
S/(000)
S/(000)
Country
Peru
1,919,295
1,931,303
1,720,865
Panama
106,138
99,963
121,170
Total
2,025,433
2,031,266
1,842,035
F-107
21.
Other income and (expenses)
(a)
This caption is comprised of the following:
2024
2023
2022
S/(000)
S/(000)
S/(000)
Other income
Maintenance, installation and sale of POS equipment
23,269
28,743
22,000
Gain on sale of property, furniture and equipment, Note 8(d)
12,879
15,300
11,780
Services rendered to third parties
8,223
7,512
7,611
Income from investments in associates (b)
7,447
—
18,692
Income from ATM rentals
5,507
5,365
6,459
Other technical income from insurance operations
4,162
10,163
6,489
Gain from sale of written-off-loans (c)
2,542
18,770
19,177
Gain from refunds and penalties
—
—
18,783
Fair value adjustment of the participation held by Interbank in Izipay, Note 1(b)
—
—
222,513
Others
57,193
70,847
66,677
Total other income
121,222
156,700
400,181
Other expenses
Commissions from insurance activities
(38,780
)
(42,400
)
(90,168
)
Provision for sundry risk
(29,290
)
(4,138
)
(12,661
)
Administrative and tax penalties
(16,277
)
(20,198
)
(7,317
)
Sundry technical insurance expenses
(14,414
)
(10,066
)
(11,048
)
Expenses related to rental income
(12,607
)
(5,814
)
(7,521
)
Provision for accounts receivable
(11,508
)
(13,847
)
(5,684
)
Write-off of intangibles, Note 9(a)
(10,400
)
(3,455
)
(6,266
)
Donations
(4,826
)
(4,529
)
(4,712
)
Cost of sale of POS equipment
(1,154
)
(12,819
)
(27,366
)
Others (*)
(55,703
)
(67,726
)
(67,901
)
Total other expenses
(194,959
)
(184,992
)
(240,644
)
(*) During the years 2024, 2023 and 2022, corresponds mainly to expenses for operational write-offs, among other minor expenses.
(b)
As of December 31, 2022, includes S/5,033,000 corresponding to the participation that Interbank held in Izipay until the date of its acquisition, see Note 1(b).
(c)
During the years 2024, 2023 and 2022, Interbank sold written-off loan portfolios, in cash and to non-related third parties. The nominal value of the credits sold amounted to S/248,249,000, S/1,300,296,000 and S/973,966,000, respectively.
F-108
22.
Result from insurance activities
(a) This caption is comprised of the following:
2024
2023
2022
General insurance
Pensions
Life
Total
General insurance
Pensions
Life
Total
General insurance
Pensions
Life
Total
S/(000)
S/(000)
S/(000)
S/(000)
S/(000)
S/(000)
S/(000)
S/(000)
S/(000)
S/(000)
S/(000)
S/(000)
Insurance service income -
Contracts measured under BBA and VFA (*):
CSM recognized for services rendered
61,800
3,970
28,826
94,596
49,191
3,609
27,978
80,778
43,496
1,945
25,320
70,761
Change in Risk adjustment for non-financial risk
3,083
7,756
(358
)
10,481
1,476
255
(1,850
)
(119
)
1,562
(828
)
2,014
2,748
Insurance service expenses and expected claims incurred
(**) Before expenses attributed to the insurance activity that are presented in the caption “Other expenses” in the consolidated statement of income, and that correspond to salaries and employee benefits, administrative expenses, depreciation and amortization, and other expenses for S/368,885,000, S/334,602,000 and S/313,647,000 as of December 31, 2024, 2023 and 2022, respectively. See also financial information by segments in Note 27.
F-109
(b) The composition of the financial result of insurance operations, is as follows:
2024
2023
2022
Pensions
Life
Total
Pensions
Life
Total
Pensions
Life
Total
S/(000)
S/(000)
S/(000)
S/(000)
S/(000)
S/(000)
S/(000)
S/(000)
S/(000)
Financial expenses for issued insurance contracts -
Changes in the obligation to pay the fair value holder of the underlying assets of direct participation agreements due to the investment’s return
—
96
96
—
(10,499
)
(10,499
)
—
27,284
27,284
Interest credited
(562,252
)
(35,858
)
(598,110
)
(541,468
)
(23,088
)
(564,556
)
(523,539
)
(9,526
)
(533,065
)
Changes in interest rate and other financial hypotheses
(162
)
3,879
3,717
(433
)
3,257
2,824
754
1,728,374
1,729,128
Effect of changes in current estimates and in CSM adjustment rates in relation to the rates used in the initial recognition
1
(1,020
)
(1,019
)
4
(621
)
(617
)
(16
)
(1,729,032
)
(1,729,048
)
(562,413
)
(32,903
)
(595,316
)
(541,897
)
(30,951
)
(572,848
)
(522,801
)
17,100
(505,701
)
Financial income from insurance contracts -
Interest credited
—
(16
)
(16
)
(388
)
(1,086
)
(1,474
)
76
72
148
Effect of changes in interest rates and other financial hypotheses
—
(373
)
(373
)
(76
)
1,130
1,054
—
(1,451
)
(1,451
)
Exchange differences
—
—
—
—
—
—
—
—
—
Effect of changes in current estimates and in CSM adjustment rates in relation to the rates used in the initial recognition
—
55
55
—
101
101
—
3,617
3,617
-
(334
)
(334
)
(464
)
145
(319
)
76
2,238
2,314
Result from insurance activities
(562,413
)
(33,237
)
(595,650
)
(542,361
)
(30,806
)
(573,167
)
(522,725
)
19,338
(503,387
)
F-110
23. Salaries and employee benefits
This caption is comprised of the following:
2024
2023
2022
S/(000)
S/(000)
S/(000)
Salaries
672,180
655,665
589,773
Vacations, health insurance and others
111,886
87,996
81,581
Social security
71,573
66,331
62,637
Severance indemnities
52,916
49,265
44,447
Workers’ profit sharing
46,691
38,018
92,042
Total
955,246
897,275
870,480
The average number of employees for the years 2024, 2023 and 2022 was 8,542, 8,333 and 8,076 respectively.
24. Administrative expenses
(a)
This caption is comprised of the following:
2024
2023
2022
S/(000)
S/(000)
S/(000)
Services received from third parties (b)
1,248,183
1,202,017
1,104,822
Taxes and contributions
83,454
77,202
64,008
Rental expenses (c) and Note 8(e)
5,317
9,643
10,958
Total
1,336,954
1,288,862
1,179,788
(b)
Services received from third parties correspond mainly to computer equipment repair and maintenance services, credit cards associated expenses, securities transportation services, agency rentals, advertising and public relations, customer loyalty programs, marketing on digital media, telecommunications and professional fees, among others.
(c)
During the years 2024, 2023 and 2022 corresponds mainly to short-term leases, see Note 3.4(k).
F-111
25.
Earnings per share
The following table presents the calculation of the weighted average number of shares and the basic and diluted earnings per share, determined and calculated based on the earnings attributable to the Group, as described in Note 3.4(ad):
Outstanding shares
Shares considered in computation
Effective days in the year
Weighted average number of shares
(in thousands)
(in thousands)
(in thousands)
Year 2022
Balance as of January 1, 2022
115,418
115,418
365
115,418
Balance as of December 31, 2022
115,418
115,418
115,418
Net earnings attributable to IFS’s shareholders S/(000)
1,668,026
Basic and diluted earnings per share attributable to IFS’s shareholders (Soles)
14.452
Year 2023
Balance as of January 1, 2023
115,418
115,418
365
115,418
Sale of treasury stock
1
1
277
1
Purchase of treasury stock
(939
)
(939
)
158
(407
)
Balance as of December 31, 2023
114,480
114,480
115,012
Net earnings attributable to IFS’s shareholders S/(000)
1,072,728
Basic and diluted earnings per share attributable to IFS’s shareholders (Soles)
9.327
Year 2024
Balance as of January 1, 2024
114,480
114,480
365
114,480
Sale of treasury stock
2
2
41
—
Purchase of treasury stock
(1,194
)
(1,194
)
59
(193
)
Balance as of December 31, 2024
113,288
113,288
114,287
Net earnings attributable to IFS’s shareholders S/(000)
1,300,078
Basic and diluted earnings per share attributable to IFS’s shareholders (Soles)
11.376
26.
Transactions with related parties and affiliated entities
(a)
The table below presents the main transactions with related parties and affiliated entities as of December 31, 2024 and 2023 and for the years ended December 31, 2024, 2023 and 2022:
2024
2023
S/(000)
S/(000)
Assets
Instruments at fair value through profit or loss
819
1,165
Investments at fair value through other comprehensive income
72,906
64,229
Loans, net (b)
1,805,083
1,686,288
Accounts receivable
87,889
87,902
Other assets
11,454
21,260
Liabilities
Deposits and obligations
1,084,713
1,066,505
Other liabilities
224,391
225,034
Off-balance sheet accounts
Indirect loans (b)
59,399
76,652
F-112
2024
2023
2022
S/(000)
S/(000)
S/(000)
Income (expenses)
Interest and similar income
117,713
95,604
72,334
Rental income
28,833
25,532
31,428
Valuation of financial derivative instruments
—
106
149
Interest and similar expenses
(32,031
)
(39,749
)
(16,821
)
Administrative expenses
(45,320
)
(39,897
)
(33,758
)
Loss on sale of investment properties, Note 7(b)
(3,176
)
—
—
Others, net
59,921
63,626
51,241
(b)
As of December 31, 2024 and 2023, the detail of loans is the following:
2024
2023
Direct Loans
Indirect Loans
Total
Direct Loans
Indirect Loans
Total
S/(000)
S/(000)
S/(000)
S/(000)
S/(000)
S/(000)
Affiliated
1,502,218
3,409
1,505,627
1,389,463
3,557
1,393,020
Associates
302,865
55,990
358,855
296,825
73,095
369,920
1,805,083
59,399
1,864,482
1,686,288
76,652
1,762,940
(c)
As of December 31, 2024 and 2023, the directors, executives and employees of the Group have been involved in credit transactions with certain subsidiaries of the Group, between the permitted limits by Peruvian law for financial entities. As of December 31, 2024 and 2023, direct loans to employees, directors and executives amounted to S/235,235,000 and S/209,671,000, respectively; said loans are repaid monthly and bear interest at market rates.
There are no loans to the Group’s directors and key personnel guaranteed with shares of any Subsidiary.
(d)
The Group’s key personnel basic remuneration for the years ended December 31, 2024, 2023 and 2022, is presented below:
2024
2023
2022
S/(000)
S/(000)
S/(000)
Salaries
32,003
28,325
26,964
Board of Directors’ compensations
3,456
3,151
3,923
Total
35,459
31,476
30,887
(e)
As of December 2024 and 2023, the Group holds participation in different mutual funds that are managed by its subsidiary Interfondos, which are classified as investments at fair value through profit or loss for S/2,364,000 and S/7,358,000, respectively.
(f)
In Management’s opinion, transactions with related companies have been performed under market conditions and within the limits permitted by the SBS.
F-113
27.
Business segments
The Chief Operating Decision Maker (“CODM”) of IFS is the Chief Executive Officer (“CEO”).
The business segments monitor the operating results of their business units separately in order to make decisions on the distribution of resources and performance assessment. The segments performance is assessed based on operating profit or loss and is measured consistently with operating profit or loss in the consolidated financial statements. Transfer prices between operating segments are on an arm’s length basis in a manner similar to transactions with third parties.
As of December 31, 2023, the Group presented four operating business segments: Banking, Insurance, Wealth Management and Payments. In the period 2024, the Group performed an assessment of the operating business segments, taking into consideration, among others, relevance criteria regarding revenues, income and the Group’s consolidated assets, and concluded that the segment Payments will no longer be an operating business segment and will be presented jointly with the rest of the Group’s Subsidiaries that are not part of an operating segment. This conclusion is aligned with the thresholds established by IFRS 8 “Operating Segments”, according to which said segment does not exceed the following limits:
- At revenue level: Revenues from the segment Payments do not account for 10 percent or more of the total combined revenues of all operating segments.
- At income level: The absolute income of the segment Payments is not equal or more than 10 percent of the higher amount between: (i) the combined income of all segments that have not presented losses; and (ii) the combined loss of all segments that report losses.
- At asset level: The assets of the segment Payments are not 10 percent or more of the total combined assets of all operating segments.
Accordingly, as of December 31, 2024, the Group presents three operating business segments:
Banking -
Mainly loans, credit facilities, deposits and current accounts.
Insurance -
It provides life annuity products with single-premium payment and conventional life insurance products, as well as other retail insurance products.
Wealth management -
It provides brokerage and investment management services. Inteligo serves mainly Peruvian citizens.
No revenue from transactions with a single external customer or counterparty exceeded 10 percent of the Group’s total revenues in the years 2024, 2023 and 2022.
F-114
The following table presents the Group’s financial information by business segments for the years ended December 31, 2024, 2023 and 2022:
2024
Banking
Insurance
Wealth management
Holding, other subsidiaries and eliminations (*)
Total consolidated
S/(000)
S/(000)
S/(000)
S/(000)
S/(000)
Total income (**)
Third party
7,732,766
1,760,985
435,882
685,558
10,615,191
Inter-segment
(154,329
)
(4,517
)
(2,355
)
161,201
—
Total income
7,578,437
1,756,468
433,527
846,759
10,615,191
Consolidated statement of income data
Interest and similar income
5,969,629
870,993
178,160
10,609
7,029,391
Interest and similar expenses
(2,217,197
)
(153,464
)
(108,466
)
(1,143
)
(2,480,270
)
Net interest and similar income
3,752,432
717,529
69,694
9,466
4,549,121
Loss due to impairment of loans
(1,719,913
)
—
(266
)
—
(1,720,179
)
Loss due to impairment of financial investments
(982
)
(45,910
)
(585
)
(44
)
(47,521
)
Net interest and similar income after impairment loss on loans
2,031,537
671,619
68,843
9,422
2,781,421
Fee income from financial services, net
791,815
(10,628
)
170,955
190,801
1,142,943
Net gain (loss) on sale of financial investments
12,995
17,664
(4,115
)
—
26,544
Other income
500,512
103,571
89,331
71,653
765,067
Result from insurance activities
—
(169,750
)
—
(39
)
(169,789
)
Depreciation and amortization
(294,514
)
(22,091
)
(8,734
)
(87,718
)
(413,057
)
Other expenses
(1,762,494
)
(379,087
)
(166,789
)
(178,789
)
(2,487,159
)
Income before translation result and Income Tax
1,279,851
211,298
149,491
5,330
1,645,970
Exchange difference
(7,402
)
(9,390
)
(2,066
)
(5,286
)
(24,144
)
Income Tax
(265,096
)
—
(10,089
)
(39,180
)
(314,365
)
Net profit (loss) for the year
1,007,353
201,908
137,336
(39,136
)
1,307,461
Attributable to:
IFS’s shareholders
1,007,353
201,908
137,336
(46,519
)
1,300,078
Non-controlling interest
—
—
—
7,383
7,383
1,007,353
201,908
137,336
(39,136
)
1,307,461
(*) Corresponds to financial information of IFS and other subsidiaries, as well as consolidation adjustments and elimination of intercompany transactions.
(**) Corresponds to interest income, net profit on the sale of financial investments, other income, income from commissions for banking services and income from insurance services.
F-115
2023 (*)
Banking
Insurance
Wealth management
Holding, other subsidiaries and eliminations (**)
Total consolidated
S/(000)
S/(000)
S/(000)
S/(000)
S/(000)
Total income (***)
Third party
7,812,858
1,695,222
291,408
630,640
10,430,128
Inter-segment
(126,620
)
(4,975
)
(1,386
)
132,981
—
Total income
7,686,238
1,690,247
290,022
763,621
10,430,128
Consolidated statement of income data
Interest and similar income
6,076,020
851,648
183,926
8,817
7,120,411
Interest and similar expenses
(2,363,800
)
(126,704
)
(98,370
)
(3,492
)
(2,592,366
)
Net interest and similar income
3,712,220
724,944
85,556
5,325
4,528,045
(Loss) recovery to impairment of loans
(1,981,988
)
—
170
—
(1,981,818
)
(Loss) recovery due to impairment of financial investments
15
(7,858
)
347
(4
)
(7,500
)
Net interest and similar income after impairment loss on loans
1,730,247
717,086
86,073
5,321
2,538,727
Fee income from financial services, net
813,279
(13,431
)
146,223
232,391
1,178,462
Net (loss) gain on sale of financial investments
(660
)
9,948
(2,857
)
—
6,431
Other income (expenses)
495,500
112,990
(37,332
)
(19,774
)
551,384
Result from insurance activities
—
(178,379
)
—
(13
)
(178,392
)
Depreciation and amortization
(271,526
)
(21,658
)
(15,018
)
(70,836
)
(379,038
)
Other expenses
(1,678,356
)
(352,933
)
(138,589
)
(201,251
)
(2,371,129
)
Income (loss) before translation result and Income Tax
1,088,484
273,623
38,500
(54,162
)
1,346,445
Exchange difference
(15,969
)
18,430
761
5,205
8,427
Income Tax
(216,366
)
—
(3,081
)
(56,149
)
(275,596
)
Net profit (loss) for the year
856,149
292,053
36,180
(105,106
)
1,079,276
Attributable to:
IFS’s shareholders
856,149
292,053
36,180
(111,654
)
1,072,728
Non-controlling interest
—
—
—
6,548
6,548
856,149
292,053
36,180
(105,106
)
1,079,276
(*) The 2023 balances have been restated to consider the three operating segments, effective from 2024.
(**) Corresponds to financial information of IFS and other subsidiaries, as well as consolidation adjustments and elimination of intercompany transactions.
(***) Corresponds to interest income, net profit on the sale of financial investments, other income, income from commissions for banking services and income from insurance services.
F-116
2022 (*)
Banking (***)
Insurance
Wealth management
Holding, other subsidiaries and eliminations (****)
Total consolidated
S/(000)
S/(000)
S/(000)
S/(000)
S/(000)
Total income (**)
Third party
6,459,232
1,663,992
75,706
734,007
8,932,937
Inter-segment
(125,848
)
(3,288
)
(1,668
)
130,804
—
Total income
6,333,384
1,660,704
74,038
864,811
8,932,937
Consolidated statement of income data
Interest and similar income
4,774,378
940,894
155,116
914
5,871,302
Interest and similar expenses
(1,476,942
)
(130,049
)
(50,306
)
(4,392
)
(1,661,689
)
Net interest and similar income
3,297,436
810,845
104,810
- 3,478
4,209,613
(Loss) recovery to impairment of loans
(832,919
)
—
2,368
—
(830,551
)
Loss due to impairment of financial investments
(732
)
(26
)
(11,981
)
(13
)
(12,752
)
Net interest and similar income after impairment loss on loans
2,463,785
810,819
95,197
(3,491
)
3,366,310
Fee income from financial services, net
797,711
(7,160
)
163,325
183,510
1,137,386
Net loss on sale of financial investments
(2,891
)
(1,613
)
(9,781
)
—
(14,285
)
Other income
478,308
47,536
(234,702
)
265,568
556,710
Result from insurance activities
—
(252,854
)
—
—
(252,854
)
Depreciation and amortization
(257,210
)
(23,682
)
(15,044
)
(40,290
)
(336,226
)
Other expenses
(1,673,581
)
(318,528
)
(130,453
)
(168,350
)
(2,290,912
)
Income (loss) before translation result and Income Tax
1,806,122
254,518
(131,458
)
236,947
2,166,129
Exchange difference
(22,800
)
950
(7,146
)
3,518
(25,478
)
Income Tax
(409,201
)
—
(2,791
)
(50,545
)
(462,537
)
Net profit (loss) for the year
1,374,121
255,468
(141,395
)
189,920
1,678,114
Attributable to:
IFS’s shareholders
1,374,121
255,468
(141,395
)
179,832
1,668,026
Non-controlling interest
—
—
—
10,088
10,088
1,374,121
255,468
(141,395
)
189,920
1,678,114
(*) The 2023 balances have been restated to consider the three operating segments, effective from 2024.
(**) Corresponds to interest income, net profit on the sale of financial investments, other income, income from commissions for banking services and income from insurance services.
(***) Includes 50 percent of Interbank’s participation in Izipay until March 2022, for the date on which Izipay becomes a subsidiary of the Group, see Note 1(b).
(****) Corresponds to financial information of IFS and other subsidiaries, as well as consolidation adjustments and elimination of intercompany transactions.
F-117
2024
Banking
Insurance
Wealth management
Holding, other subsidiaries and eliminations (*)
Total consolidated
S/(000)
S/(000)
S/(000)
S/(000)
S/(000)
Capital investments (***)
277,836
65,335
5,879
62,815
411,865
Total assets
73,626,419
16,175,883
4,316,010
1,385,469
95,503,781
Total liabilities
64,753,475
15,618,274
3,271,899
881,538
84,525,186
2023 (**)
Banking
Insurance
Wealth management
Holding, other subsidiaries and eliminations (*)
Total consolidated
S/(000)
S/(000)
S/(000)
S/(000)
S/(000)
Capital investments (***)
327,513
21,184
6,430
89,809
444,936
Total assets
68,437,614
15,225,254
4,374,266
1,587,645
89,624,779
Total liabilities
60,380,895
14,787,105
3,453,408
995,270
79,616,678
(*) Corresponds to financial information of IFS and other subsidiaries, as well as consolidation adjustments and elimination of intercompany transactions.
(**) The 2023 balances have been restated to consider the three operating segments, effective from 2024.
(***) Includes the purchase of property, furniture and equipment, intangible assets and investment properties.
The distribution of the Group’s total income based on the location of the customer and its assets, for the year ended December 31, 2024, is S/10,232,012,000 in Peru and S/383,179,000 in Panama (for the year ended December 31, 2023, was S/10,185,755,000 in Peru and S/244,373,000 in Panama). The distribution of the Group’s total assets based on the location of the customer and its assets as of December 31, 2024 is S/91,323,869,000 in Peru and S/4,179,912,000 in Panama (for the year ended December 31, 2023, was S/85,387,995,000 in Peru and S/4,236,784,000 in Panama).
F-118
28.
Financial instruments classification
The financial assets and liabilities of the consolidated statement of financial position as of December 31, 2024 and 2023, are presented below.
As of December 31, 2024
At fair value through profit or loss
Debt instruments measured at fair value through other comprehensive income
Equity instruments measured at fair value through other comprehensive income
Amortized cost
Total
S/(000)
S/(000)
S/(000)
S/(000)
S/(000)
Financial assets
Cash and due from banks
—
—
—
12,615,226
12,615,226
Inter-bank funds
—
—
—
220,060
220,060
Financial investments
1,776,567
20,724,892
458,268
3,898,198
26,857,925
Loans, net
—
—
—
49,229,448
49,229,448
Due from customers on acceptances
—
—
—
9,163
9,163
Other accounts receivable and other assets, net
143,201
—
—
1,588,600
1,731,801
Reinsurance contacts assets
—
—
—
18,602
18,602
1,919,768
20,724,892
458,268
67,579,297
90,682,225
Financial liabilities
Deposits and obligations
—
—
—
53,768,028
53,768,028
Due to banks and correspondents
—
—
—
7,562,057
7,562,057
Bonds, notes and other obligations
—
—
—
6,075,433
6,075,433
Due from customers on acceptances
—
—
—
9,163
9,163
Insurance and reinsurance contract liabilities
—
—
—
12,524,320
12,524,320
Other accounts payable, provisions and other liabilities
163,441
—
—
4,024,513
4,187,954
163,441
—
—
83,963,514
84,126,955
As of December 31, 2023
At fair value through profit or loss
Debt instruments measured at fair value through other comprehensive income
Equity instruments measured at fair value through other comprehensive income
Amortized cost
Total
S/(000)
S/(000)
S/(000)
S/(000)
S/(000)
Financial assets
Cash and due from banks
—
—
—
9,818,711
9,818,711
Inter-bank funds
—
—
—
524,915
524,915
Financial investments
1,556,540
21,246,569
444,878
3,474,004
26,721,991
Loans, net
—
—
—
46,520,382
46,520,382
Due from customers on acceptances
—
—
—
40,565
40,565
Other accounts receivable and other assets, net
158,101
—
—
1,246,480
1,404,581
Reinsurance contacts assets
—
—
—
26,287
26,287
1,714,641
21,246,569
444,878
61,651,344
85,057,432
Financial liabilities
Deposits and obligations
—
—
—
49,188,234
49,188,234
Inter-bank funds
—
—
—
119,712
119,712
Due to banks and correspondents
—
—
—
9,025,930
9,025,930
Bonds, notes and other obligations
—
—
—
5,551,629
5,551,629
Due from customers on acceptances
—
—
—
40,565
40,565
Insurance and reinsurance contract liabilities
—
—
—
12,207,536
12,207,536
Other accounts payable, provisions and other liabilities
145,395
—
—
3,056,196
3,201,591
145,395
—
—
79,189,802
79,335,197
F-119
29.
Financial risk management
It comprises the management of the main risks, that due to the nature of their operations, IFS and its Subsidiaries are exposed to; and correspond to: credit risk, market risk, liquidity risk, insurance risk and real estate risk.
Credit risk: possibility of loss due to inability or failure to pay debtors, counterparts or third parties bound to comply with their contractual obligations.
Market risk: probability of loss in positions on and off the consolidated statement of financial position derived from variations in market conditions; generally includes the following types of risk: exchange rate; fair value by interest rate, price, among others.
Liquidity risk: possibility of loss due to noncompliance with the requirements of financing and fund application that arise from mismatches of cash flows.
Insurance risk: possibility that the actual cost of claims and payments will differ from the estimates.
Real estate risk: possibility of significant loss in rental income due to the insolvency of the lessee or, a decrease in the market value of real estate investments.
To manage the risks detailed above, every Subsidiary of the Group has a specialized structure and organization in their management, measurement systems, as well as mitigation and coverage processes, according to specific regulatory needs and requirements for the development of its business. The Group and its Subsidiaries, mainly Interbank, Interseguro and Inteligo Bank, operate independently but in coordination with the general provisions issued by the Board of Directors and Management of IFS. The Board of Directors and Management of IFS are ultimately responsible for identifying and controlling risks. The Company has an Audit Committee comprised of three independent directors, pursuant to Rule 10A-3 of the Securities Exchange Act of the United States; and one of them is a financial expert according to the regulations of the New York Stock Exchange. The Audit Committee is appointed by the Board of Directors and its main purpose is to monitor and supervise the preparation processes of financial and accounting information, as well as the audits over the financial statements of IFS and its Subsidiaries.
Also, the Audit Committee is responsible for assisting the Board of Directors with the monitoring and supervising, thus helping to ensure:
The quality and comprehensiveness of IFS’s financial statements, including its disclosures.
The existence of adequate procedures to assess, objectively and periodically, the effectiveness of the internal control system over the financial report.
The compliance of the legal and regulatory framework.
The qualification and independence of external auditors.
The performance of external auditors.
The implementation by Management of an adequate internal control system, particularly the internal control system over the financial report.
The Company has an Internal Audit Division which is responsible for monitoring the key processes and controls to ensure an adequate low risk control according to the standards defined in the Sarbanes Oxley Act.
Management is responsible for the preparation, presentation and comprehensiveness of the Group’s consolidated financial statements, the suitability of the principles and accounting policies it uses, the establishment and upkeeping of the internal control over the financial information, as well as the facilitation of communications among external auditors, IFS’s managers, Audit Committee and the Board of Directors.
(a)
Structure and organization of risk management -
The Group’s risk management structure and organization for each of its Subsidiaries is as follows:
(i)
Interbank -
Board of Directors
Interbank’s Board of Directors is responsible for establishing an appropriate and integral risk management and promoting an internal environment that facilitates its development. The Board is continuously informed about the degree of exposure of the various risks managed by Interbank.
The Board has created several specialized committees to which it has delegated specific tasks to strengthen risk management and internal control.
Audit Committee
The Audit Committee’s main purpose is to monitor that the accounting financial reporting processes are appropriate, as well as to evaluate the activities performed by the auditors, both internal and external. The Committee is comprised of three members of the Board and the Chief Executive Officer, the Internal Auditor, the Vice-President of Corporate and Legal Affairs and other executives may also participate, when required. The Committee meets at least six times a year in ordinary sessions and informs the Board about the most relevant issues discussed.
F-120
Comprehensive Risk Management Committee
The Comprehensive Risk Management Committee (“GIR”, by its Spanish acronym) is responsible for approving the policies and organization for comprehensive risk management, as well as the amendments to said policies. This Committee defines the level of tolerance and the degree of exposure to risk that Interbank is willing to assume in its business and also decides on the necessary actions aimed at implementing the required corrective measures in case of deviations from the levels of tolerance to risk. The Committee is comprised of two Directors, the Chief Executive Officer and the Vice-Presidents. The Committee reports monthly to the Board of Directors the main issues it has discussed and the resolutions taken in the previous meeting.
Assets and Liabilities Committee
The main purpose of the Assets and Liabilities Committee (“ALCO”) is to manage the financial structure of the statement of financial position of Interbank, based on profitability and risk targets. The ALCO is also responsible for the proposal of new products or operations that contain components of market risk. Likewise, it is the communication channel with the units that generate market risk. The ALCO meets monthly and it is comprised of the Chief Executive Officer, the Vice-Presidents of Risks, Commercial, Finance, Operations, Distribution Channels, Capital Market and the Manager of Treasury / Position Desk.
Internal Audit Division -
Risk management processes of Interbank are monitored by the Internal Audit Division, which examines both the adequacy of the procedures and the compliance with them. The Internal Audit Division discusses the results of all assessments with Management and reports its findings and recommendations to the Audit Committee and Board of Directors.
(ii)
Interseguro -
Board of Directors
The Board of Directors is responsible for the overall approach to risk management and it is responsible for the approval of the policies and strategies currently used. The Board of Directors provides the principles for overall risk management, as well as the policies prepared for specific areas, such as foreign exchange risk, interest rate risk, credit risk and the use of derivative and non-derivative financial instruments.
Audit Committee
The main purpose of the Audit Committee is to monitor that the accounting and financial reporting processes are appropriate, as well as to assess the activities performed by External and Internal Auditors. The Audit Committee is comprised of three Board members who do not fulfil any executive position within Interseguro; at least one of them is an Independent Director, who leads the Committee and cannot lead any other Committee within Interseguro. The Committee sessions can be attended by the Chief Executive Officer, the Audit Manager, the External Auditors and other executives when required. The Committee meets at least six times a year in ordinary sessions and informs the Board on the most relevant issues it has addressed.
Risk Committee
The Risk Committee is a corporate body created by the Board. It is responsible for defining the business risk limits of Interseguro through the approval of risk policies and the corrective measures needed to maintain adequate levels of risk tolerance. The Risk Committee is comprised of four Board members, the Risk Manager and the Chief Executive Officer.
Investment Committee
The Investment Committee is responsible for approving the limits of each security or real estate that may be included in Interseguro’s investment portfolio. This Committee is comprised of several Board Members, the Chief Executive Officer and the Vice-President of Investments.
Internal Audit Division
Risk management processes throughout Interseguro are monitored by the Internal Audit Division, which reviews and assesses the design, scope and functioning of the internal control system and verifies the compliance of legal requirements, policies, standards and procedures. The Internal Audit Division discusses the results of all assessments with Management and reports its findings and recommendations to the Audit Committee and Board of Directors.
(iii)
Inteligo Bank -
Inteligo Bank’s Board of Directors is responsible for the establishment and monitoring of the risk administration policies. To manage and monitor the various risks Inteligo Bank is exposed to, the Board of Directors has created the Credit and Investment Committee, the Assets and Liabilities Committee, the Credit Risk Committee and the Audit Committee.
(b)
Risk measurement and reporting systems -
The Group uses different models and rating tools. These tools measure and value the risk with a prospective vision, thus allowing better decision making regarding risk in the different stages or life cycle of client or product.
Said models and tools are permanently monitored and periodically validated to assure that the levels of prediction and performance are being maintained and to make corrective actions or adjustments, when needed.
F-121
(c)
Risk mitigation and risk coverage -
To mitigate its exposure to the various financial risks and provide adequate coverage, the Group has established a series of measures, among which the following stand out:
Policies, procedures, methodologies, models and parameters aimed to allow for the identification, measurement, control and reporting of diverse financial risks;
Review and assessment of diverse financial risks, through specialized units of risk screening;
Timely monitoring and tracking of diverse financial risks and their maintenance within a defined tolerance level;
Compliance with regulatory limits and establishment of internal limits for exposure concentration; and
Procedures for managing guarantees.
Likewise, as part of its comprehensive risk management, in certain circumstances the Group uses derivative financial instruments to mitigate its risk exposure, which arises from the variations in interest rates and foreign exchange rates.
(d)
Risk concentration -
Through its policies and procedures, the Group has established the guidelines and mechanisms needed to prevent excessive risk concentration. In case any concentration risk is identified, the Group works with specialized units that enable it to control and manage said risks.
29.1.
Credit risk
(a)
The Group opts for a credit risk policy that ensures sustained and profitable growth in all its products and the business segments it operates. In doing so, it applies assessment procedures for the adequate decision-making, and uses tools and methodologies that allow the identification, measurement, mitigation and control of the different risks in the most efficient manner. Likewise, the Group regularly incorporates, develops and reviews management models that allow an adequate measurement, quantification and monitoring of the loans granted by each business unit and also encourages the continuous improvement of its policies, tools, methodologies and processes. Additionally, as a consequence of the political, economic and social context that arose during 2022, and the high uncertainty of the intensity of the El Niño event in 2023, and the excess of liquidity generated by the withdrawal of the CTS and AFP funds, during 2024; the behavior and performance of the expected credit losses of the retail and commercial clients has been affected, thus requiring a greater monitoring of results, which has also required certain subsequent adjustments to the expected loss model to be able to capture the effects of the current situation, which has generated a high level of uncertainty in the estimation of the loans expected loss.
In compliance with the policy of monitoring the Group’s credit risk, during 2024, 2023 and 2022 Interbank performed the recalibration process of its risk parameters for the calculation of the expected credit losses.
(b)
The Group is exposed to credit risk, which is the risk that a counterparty causes a financial loss by failing to comply with an obligation. Credit risk is the most important risk for the Group’s business; therefore, Management carefully manages its exposure to credit risk, which arise mainly in lending activities that lead to loans and investment activities that contribute with securities and other financial instruments to the Group’s asset portfolio. There is also credit risk in the financial instruments out of the consolidated statement of financial position, such as contingent credits (indirect loans), which expose the Group to risks similar to those of direct loans, being mitigated with the same control processes and policies. Likewise, credit risk arising from derivative financial instruments is, at any time, limited to those with positive fair values, as recorded in the consolidated statement of financial position.
As of the date of the consolidated statement of financial position and under IFRS 9, impairment allowances are established for expected credit losses. Significant changes in the economy or in the particular situation of an economic sector that represents a concentration in the Group’s portfolio could result in losses that are different from those provisioned for as of the date of the consolidated statement of financial position.
The Group structures the levels of credit risk it undertakes by placing limits on the amount of risk accepted in relation to one borrower or groups of borrowers, and geographical and industry segments. Said risks are monitored on a revolving basis and subject to continuous review.
The Group’s exposure to credit risk is managed through the regular assessment of debtors and their potential capability to pay the principal and interest of their obligations, and through the change in exposure limits, when appropriate.
The exposure to credit risk is also mitigated, in part, through the obtaining of personal and corporate collateral. Nevertheless, there is a significant part of the financial instruments where said collateral cannot be obtained. Following is a description of the procedures and policies related to collateral management and valuation of collaterals.
Policies and procedures for management and valuation of guarantees -
Collateral required for financial assets other than the loan portfolio are determined according to the nature of the instrument. However, debt instruments, treasury papers and other financial assets are in general not guaranteed, except for securities guaranteed with similar assets and instruments.
F-122
The Group has policies and guidelines established for the management of collateral received to back loans granted. The assets that guarantee loan operations bear a certain value prior to the loan approval and the procedures for their updating are described in the internal rules. To manage guarantees, the Group operates specialized divisions for the establishment, management and release of guarantees.
Collateral that back loan operations include different goods, property and financial instruments (including cash and securities). Their preferential status depends on the following conditions:
Easy convertibility into cash.
Proper legal documentation, duly registered with the corresponding public registry.
Do not have previous obligations that could reduce their value.
Their fair value must be updated.
Long-term loans and fundings granted to corporate entities are generally guaranteed. Consumer loans granted to small companies are not generally guaranteed.
Management monitors the fair value of collateral, and with the purpose of mitigating credit losses, requests additional collateral to the counterparty as soon as impairment evidence exists. The proceeds from the settlement of the collateral obtained are used to reduce or repay the outstanding claim.
In the case of derivative financial instruments, the Group maintains strict control limits on net open derivative positions (the difference between purchase and sale contracts), both in amount and term. The amount subject to credit risk is limited to the current fair value of instruments that are favorable to the Group (for example, an asset when its fair value is positive), which in relation to derivatives is only a small fraction of the contract, or notional amount used to express the volume of instruments outstanding. This credit risk exposure is managed as part of the overall lending limits with customers, together with potential exposures from market movements. Collateral or other securities are not usually obtained for credit risk exposures on these instruments.
Settlement risk arises in any situation where a payment in cash, securities or equity is made in the expectation of a corresponding receipt in cash. Daily settlement limits are established for each counterparty to cover the aggregate of all settlement risk arising from the Group’s market transactions on any single day.
(c)
Maximum exposure to credit risk -
As of December 31, 2024 and 2023, Management estimates that the maximum credit risk to which the Group is exposed is represented by the carrying amount of the financial assets which show a potential credit risk and consist mostly of deposits in banks, inter-bank funds, investments, loans (direct and indirect), without considering the fair value of the collateral or guarantees, derivative financial instruments transactions, receivables from insurance transactions and other monetary assets. In this sense, As of December 31, 2024 and 2023, the main captions were formed as follows:
-80.8 percent and 76.0 percent, respectively, of cash corresponds to amounts deposited in the Group’s vaults or in the BCRP;
-84.7 percent and 85.3 percent, respectively, of the loan portfolio is classified into the two lower credit risk categories defined by the Group under IFRS 9 (high and standard grade);
-92.5 percent and 89.8 percent, respectively, of loans is deemed non-past-due and non-impaired. It is worth mentioning that, because of the effects of the Covid-19 pandemic, the Group has rescheduled loans that met certain requirements. The balance of rescheduled loans related to Covid-19 as of December 31, 2024 and 2023 amounts approximately to S/2,501,672,000 and S/3,513,905,000,000, respectively. Additionally, as a consequence of “Reactiva Peru” program, the Group has rescheduled loans that meet certain requirements; therefore, the balance of credits rescheduled under this program as of December 31, 2024 and 2023, amounts approximately to S/212,398,000 and S/730,508,000, respectively. Likewise, during 2024 and 2023, the Group made rescheduling to its retail clients that were affected by social conflicts, natural disasters and other resolutions for S/853,222,000 and S/1,979,342,000, respectively.
-87.2 percent and 90.2 percent, respectively, of investments at fair value through other comprehensive income and investments at amortized cost have at least an investment grade (BBB- or higher) or are debt instruments issued by the BCRP or the Peruvian Government; and
-97.1 percent and 97.2 percent of accounts receivable from insurance premiums and leases of the investment properties are deemed non-past due and non-impaired.
-In addition, as of December 31, 2024 and 2023, the Group holds loans (direct and indirect) and investments in fixed income instruments issued by entities related to the infrastructure sector that, in recent years, have been exposed to local and international events. As of December 31, 2024 the loans amount approximately to S/530,066,000 (S/158,694,000 in direct loans and S/371,372,000 in indirect loans) and investments in fixed income instruments amount approximately to S/939,065,000. (as of December 31, 2023 the loans amount approximately to S/588,659,000 (S/200,177,000 in direct loans and S/388,482,000in indirect loans) and investments in fixed income instruments amount approximately to S/1,011,043,000).
F-123
(d)
Impairment assessment for loan portfolios -
The main objective of the impairment requirements is to recognize expected credit losses during the average life of financial instruments when there has been a significant increase in credit risk after the initial recognition — as evaluated on a collective or individual basis — considering all reasonable and sustainable information, including that which refers to the future. If the financial instrument does not show a significant increase in credit risk after the initial recognition, the provision for credit losses shall be calculated as 12-month expected credit losses (Stage 1), as defined in Note 3.4(i).
Under some circumstances, entities may not have reasonable and sustainable information available without disproportionate effort or cost to measure the expected credit losses during the lifetime of the asset on an individual instrument basis. In that case, expected credit losses during the asset’s lifetime shall be recognized on a collective basis considering information about the overall credit risk. The financial assets for which the Group calculates the expected loss under a collective assessment include:
- All direct and indirect (contingent) loans related to stand-by letters, guarantees, bank guarantees and letters of credit; except loans under legal collection that have or do not have a payment agreement and specifically, certain clients that belong to the infrastructure sector.
- Debt instruments measured at amortized cost or at fair value through other comprehensive income.
The expected credit loss is estimated collectively for each loan portfolio with shared similar risk characteristics. Not only default indicators, but all information such as: macroeconomic projections, type of instrument, credit risk ratings, types of guarantees, date of initial recognition and remaining time to maturity, among other indicators.
For the collective impairment assessment, the financial assets are grouped based on the Group's internal credit rating system, which considers credit risk characteristics, such as: type of asset, economic sector, geographical location and type of guarantee, among other relevant factors.
Expected losses are calculated under the identification and multiplication of the following risk parameters:
- Probability of Default (PD): It is the likelihood of a default over a particular time horizon that the counterpart will be unable to meet its debt obligations in a certain term and with it is cataloged as default.
- Loss Given Default (LGD): Measures the loss in percentage terms on total exposure at default (see Exposure at default).
- Exposure at Default (EAD): Represents the total value that the Group can lose upon default of a counterpart.
(d.1) Definition of default:
In accordance with IFRS 9, the Group determines that there is default on a financial asset when:
- The borrower is unlikely to pay their credit obligations to the Group in full, without recourse by the Group to actions such as realizing guarantee (if applicable); or
- The borrower is past due by more than 90 days on any material credit obligation to the Group.
In assessing whether a borrower is in default, the Group considers the following indicators:
-
Qualitative: contracts in judicial and prejudicial proceedings.
-
Quantitative: contracts in default for more than 90 days; and
-
Based on data prepared internally and obtained from external sources such as:
-
Significant changes in indicators of credit risk
-
Significant changes in external market indicators
-
Real or expected significant change in the external and/or internal credit rating
-
Existing or forecast adverse changes in the business, economic or financial conditions that are expected to cause a significant change in the borrower’s ability to meet its debt obligations.
-
Real or expected significant change in the operating results of the borrower
-
Existing or future adverse changes in the regulatory, economic, or technological environment of the borrower that results in a significant change in its ability to meet its debt obligations.
Likewise, losses recognized in the period are affected by several factors, such as:
-
Financial assets moving from Stage 1 to Stage 2 or Stage 3 because there has been a significant increase in their risk since initial recognition or they present impairment at the analysis date, respectively. As a result, lifetime expected losses are calculated.
-
Impact on the measurement of expected losses due to changes in PD, EAD and LGD resulting from the update of the inputs used.
-
Impact on the measurement of expected losses due to changes in the models and assumptions used.
-
Additional provisions for new financial instruments reported during the period.
-
Periodic reversals of the discount of expected losses due to the passage of time, as they are measured based on the present value.
-
Financial assets written off during the period.
-
Exchange difference arising from financial assets denominated in foreign currency.
F-124
(d.1.1) Internal rating and PD:
The Group’s loans are segmented into homogeneous groups with shared similar credit risk characteristics as detailed below:
-
Personal Banking (credit cards, mortgages, payroll loans, consumer loans and vehicular loans)
-
Small Business Banking
-
Commercial Banking (Corporate, Institutional, Companies and Real estate)
In the case of Interbank, its Credit Risk Department determines its risk level according to the following classification, as of December 31, 2024 and 2023:
2024
High grade
Standard grade
Grade lower than standard
Banking
Segment
PD less than or equal (*)
PD range (*)
PD equal to or higher (*)
Credit card
5.25%
5.26% - 12.05%
12.06%
Mortgage
1.12%
1.13% - 3.55%
3.56%
Payroll loans
2.36%
2.37% - 5.15%
5.16%
Personal Banking
Consumer
7.11%
7.12% - 14.68%
14.69%
Vehicular
3.76%
3.76%
3.76%
Small Business Banking
8.55%
8.56% - 17.86%
17.87%
Corporate
0.10%
0.11% - 0.20%
0.21%
Commercial Banking
Institutional
0.66%
0.66%
0.66%
Companies
3.45%
3.46% - 8.13%
8.14%
Real estate
2.61%
2.61%
2.61%
2023
High grade
Standard grade
Grade lower than standard
Banking
Segment
PD less than or equal (*)
PD range (*)
PD equal to or higher (*)
Credit card
7.12%
7.13% - 16.98%
16.99%
Mortgage
2.07%
2.08% - 6.80%
6.81%
Payroll loans
2.80%
2.81% - 6.43%
6.44%
Personal Banking
Consumer
9.32%
9.33% - 20.78%
20.79%
Vehicular
9.13%
9.14% - 22.90%
22.91%
Small Business Banking
15.26%
15.27% - 31.69%
31.70%
Corporate
0.22%
0.22%
0.22%
Commercial Banking
Institutional
0.55%
0.55%
0.55%
Companies
5.23%
5.24% - 9.67%
9.68%
Real estate
3.71%
3.71%
3.71%
(*) The probability of default is exclusively determined by the statistical model and, therefore, do not include the subsequent adjustments to the model, detailed in Note 29.1 (d.8).
The main objective of the scoring or rating is to generate statistical models that allow forecasting the applicant’s level of credit risk. The development of these models incorporates both qualitative and quantitative information, as well as client specific information that may affect their performance.
These rating models are monitored on a regular basis because over time, some factors may have a negative impact on the model’s discriminating power, and stability due to changes in the population or its characteristics.
Each rating has an associated PD, which is adjusted to incorporate prospective information. This is replicated for each macroeconomic scenario, as appropriate.
To calculate the PD, two differentiated methodologies have been developed, which are described below:
-
Transition matrixes
Its objective is to determine the probability of default over a 12-month horizon based on the maturity of the operation, by analyzing the conditional probability of transition from one credit rating state to another. This method is suitable for loans with high exposure and wide data availability. The intention is to calculate the PD based on the maturity of the operation.
F-125
-
Default ratio
Its objective is to determine the probability of default over a 12-month horizon based on the level of risk with which the operation begins, based on a counting analysis and the percentage of cases that report a default mark. This method is suitable for loans with poor data availability by type of maturity.
Given the nature of the portfolios and the availability of historical information, the method to estimate the PD for each portfolio is presented below:
Banking / Segments
Transition matrix
Default ratio
Personal banking:
Credit cards
X
Mortgage
X
Payroll loans
X
Consumer
X
Vehicular
X
Small business banking
X
Commercial banking
Corporate
X
Institutional
X
Companies
X
Real estate
X
Likewise, for commercial sector clients, Interbank has implemented a system that allows more personalized monitoring, based on warnings, changes in ratings and reputation problems, among others.
On the other hand, at each reporting date, for indirect loans (contingent), as happens for direct loans, the expected loss is calculated depending on the stage in which each operation is located; that is, if it is in Stage 1, the expected loss is calculated with a 12-month view. If it is in Stage 2 (if the operation shows a significant risk increase since the initial recognition) or Stage 3 (if the operation has a default), the expected loss is calculated for the remaining life of the asset.
The Group considers the changes in credit risk based on the probability that the borrower will fail to comply with the loan agreement.
As of December 31, 2024 and 2023, the Group holds stand-by letters and guarantees with entities related to the infrastructure sector that, in recent years, for circumstantial reasons; were exposed to national and international events, as well as loans under legal collection that have or do not have a payment agreements. To determine the expected losses of these entities, the Group, in a complementary manner, has performed an individual assessment to determine if the operation is in Stage 1, Stage 2 or Stage 3.
The criteria established to assign the risk to each one of the operations that are evaluated under an individual evaluation use the following combination of factors: quantitative, qualitative and financial.
To estimate the PD for the lifetime of a financial asset, a transformation to a 12-month PD is made according to the year of remaining life. That is, the PD is determined for a lifetime by an exponentiation of the 12-month PD.
At Inteligo Bank, both for Personal Banking and Commercial Banking, the internal model developed (scorecard) assigns 5 levels of credit risk: low, medium low, medium, medium high, and high. This methodology evaluates the scoring, increase or decrease of risks, taking into consideration the loan structure and the type of client; therefore, there is one scorecard for Personal Banking and another for Commercial Banking.
(d.2) Loss Given Default (LGD):
It is an estimated loss in case of default. It is the difference between contractual cash flows due and those expected to be received, including guarantees. Generally, it is expressed as an EAD percentage.
In the case of Interbank, the calculation of the LGD has been developed under two differentiated methods, which are described below:
-
Closed recoveries
Those in which a client entered and left default (due to debt settlement, application of penalty or refinancing) over a course of up to 72 months and 100 months, as of December 31, 2024 and 2023, respectively.
-
Open recoveries
F-126
Those in which a client entered and did not manage to exit default over a course of up to 72 months and 100 months, as of December 31, 2024 and 2023, respectively. This method identifies the adjustment factor that allows to simulate the effect of a closed recovery process. Thus, a recovery curve is built from the information of closed recovery processes, and a recovery rate curve is estimated based on the number of months of each process.
This methodology is applied to the Mortgage and Commercial Banking loan portfolios.
In the case of Inteligo Bank, for those credits that are classified in Stage 1 or Stage 2 at the reporting date, the regulatory recoveries of the Central Bank of the Bahamas and the Superintendence of Banks of Panama are used, using stressed scenarios for each type of guarantee.
(d.3) Exposure at default (EAD):
Exposure at default represents the gross carrying amount of financial instruments subject to impairment, which involves both the client's ability to increase exposure as default approaches and possible early repayments. To calculate the EAD of a loan in Stage 1, potential default events are evaluated over a 12- month horizon. For financial assets in Stage 2 and Stage 3, exposure at default is determined over the life of the instrument.
A calculation methodology has been developed for those portfolios that present a defined schedule, differentiating those transactions that consider prepayment and those that do not consider prepayment; another methodology is based on building the credit risk factor for those portfolios that allow the client the ability to use a line of credit (revolving products) and, therefore, the percentage of additional use of the credit line that the client could use in the event of a default must be calculated.
(d.4) Significant increase in credit risk:
The Group has established a framework that incorporates quantitative and qualitative information to determine whether the credit risk on a financial instrument has significantly increased since initial recognition, both for loans and investments. The framework is aligned with the Group's internal credit risk management process.
In certain cases, using its expert credit judgment and, where possible, with relevant historical experience, the Group may determine that an exposure has experienced a significant increase in credit risk when certain qualitative indicators may not be captured by a timely quantitative analysis.
At each reporting date, expected losses are calculated depending on the stage of each loan, as each one is evaluated with a different life period.
-
Stage 1 -
12-month expected losses are calculated. For this, the following risk parameters are multiplied: the 12-month forward-looking PD for year 1 of the remaining life, the client's LGD, and the EAD for year 1 of the remaining life for operations with payment schedule or the balance as of the reporting date for operations without payment schedule.
-
Stage 2 -
Lifetime expected losses are calculated for the entire remaining life of the asset. For operations with payment schedule, they are calculated in each year of remaining life by multiplying the following risk parameters: 12-month forward-looking PD, the client's LGD, and the EAD of the corresponding year of remaining life, then the summation is done. For operations without a payment schedule, they are calculated by multiplying the lifetime forward-looking PD, the client's LGD, and the balance as of the reporting date.
-
Stage 3 -
Expected losses are calculated by multiplying the PD (equal to 100 percent) by the client’s LGD and the balance as of the reporting date.
The Group classifies the operations with a significant increase in the risk of each portfolio such as marked refinanced operations, operations with arrears longer than 30 days (for all portfolios except Mortgages that consider arrears longer than 60 days), or operations marked “Leave” or “Reduce” in the surveillance system for the Commercial Banking portfolio.
Likewise, the evaluation of the significant risk increase is made by comparing the 12-month PD to the date of origin and the 12-month PD to the date of the report adjusted by the forward-looking factor, according to the quantitative criteria of absolute variation and relative variation. As of December 31, 2024, the Group has established a range of simple average absolute variation of 8.0 percent and a simple average relative variation of 473.9 percent (a range of simple average absolute variation of 7.5 percent and a simple average relative variation of 417.2 percent, as of December 31, 2023).
F-127
The Group periodically evaluates the following warning signs and criteria to assess whether the placement presents a significant increase in credit risk (Stage 2):
-
Rescheduled loans.
-
Infraction to the covenants.
-
Forced interventions by governments in the primary and secondary markets of obligors.
-
Involvement of the borrower in illicit, political and fraud business.
-
Impairment of guarantees (underlying assets).
-
Arrears or short and frequent failures to pay installments.
-
Significantly adverse macroeconomic, regulatory, social, technological and environmental changes.
-
Other assessments and/or warnings (financial statements, EBIT evaluation, financial indicators by industry, regulatory criteria, others).
On the other hand, the Group monitors the effectiveness of the criteria used to identify significant increases in credit risk through periodic reviews to confirm that:
- Criteria are able to identify significant increases in credit risk before an exposure is in default;
- The average time between the identification of a significant increase in credit risk and default is reasonable;
- Exposures usually do not transfer directly from the measurement of 12-month expected losses to impaired loans; and
- There is no unjustified volatility in the allocation of expected credit losses between the measurement of 12-month expected credit losses and lifetime expected credit losses.
Subsequently, the expected loss of each scenario (optimistic, base and pessimistic) is calculated as the sum of the expected loss of each Stage. Finally, the expected loss of the portfolio is calculated by assigning weights to each scenario based on their respective probability of occurrence.
An operation shall migrate from Stage 1 to Stage 2 due to significant risk increase, if comparing the current PD with the PD at the moment it was generated shows an increase (relative and absolute variation) in the PD that exceeds the established thresholds.
On the other hand, the methodology introduces the concept of cure for the Mortgage, Corporate and Business portfolios. According to this concept, a loan in Stage 3 that has been recovered through the payment of the debt, does not migrate directly to Stage 1, instead of continuing in Stage 2 during an observation window of 12 months, to secure a consistent behavior in the transaction’s risk, as well as to mitigate the migration volatility between risk stages.
(d.5) Reactiva Peru
The National Government Guarantees Program “Reactiva Peru”, created in April 2020 by Legislative Decree No.1455, and amended by Legislative Decree No.1457, aimed to secure the continuity of the payment chain from affected companies due to the impact of the Covid -19 pandemic.
During the year 2020, Interbank granted loans for S/6,617,142,000. As of December 31, 2024 and 2023, Interbank maintains loans from the "Reactiva Perú" program, for a balance of approximately S/315,379,000 and S/848,886,000, respectively; including accrued interest amounting to S/45,229,000 and S/46,277,000, respectively. The amounts covered by the Peruvian Government guarantee amounted to S/192,948,000 and S/675,492,000, respectively.
Also, during the years 2024 and 2023, the Peruvian government established measures for the rescheduling of these loans setting new grace periods in addition to the grace periods of the original loan. Also, certain requirements were established that the client had to comply with to access to the rescheduling.
(d.6) Impulso Empresarial MYPE Program:
The Impulso Empresarial MYPE Program (henceforth “Impulso MyPerú”) is an initiative of the Peruvian Government created in the year 2022 with the purpose of granting the recovery and growth of micro, small, medium companies of all productive sectors. This program grants access to working capital loans, fixed assets acquisitions and consolidation of current debts, with favorable conditions such as state guarantees and a reward for be a good payer.
As of December 31, 2024, Interbank holds loans under the “Impulso MyPerú” program for an amount of approximately S/2,780,282,000; including accrued interest amounting to S/13,155,000. The amounts covered by the guarantee of the Peruvian government amount to S/1,797,725,000.
F-128
(d.7) Rescheduled loans:
(d.7.1) Reschedules due to Covid-19
Because of the consequences of the Covid-19 pandemic, the SBS authorized financial entities to grant credit facilities (rescheduling) to clients that meet certain requirements specified by the regulations issued by this regulatory entity. In that sense, Interbank granted repayment facilities to its customers that included: modification of repayment schedules, granting of grace periods, reduction of interest rates and fractioning and downsizing of installments, among others. The effects of these reschedulings have been recorded in the caption "Interest and similar income" of the consolidated income statement, see Note 19.
As of December 31, 2024 and 2023, the balance of said rescheduling amounted to S/2,501,672,000 and S/3,513,950,000, respectively.
(d.7.2) Reschedules “Reactiva Peru”
During the last years, the MEF and the SBS established measures to reschedule the loans guaranteed under the “Reactiva Peru” program. See Note 29.1 (d.5).
As of December 31, 2024 and 2023, the balance of rescheduled credits of the “Reactiva Peru” program amounts to approximately S/212,398,000 and S/730,508,000, respectively. As a result of these reschedulings, during the years 2024 and 2023 interest expenses of approximately S/1,655,000 and S/38,650,000 were recorded, respectively. Both amounts are presented as a part of interest and similar income. See Note 19.
Interbank performed an assessment to define whether these rescheduled contracts represented, or not, a substantial modification under IFRS 9 - Financial Instruments. From that assessment, the new cash flows of the rescheduled loans did not generate substantial nor significant changes in the conditions initially contracted by the client; therefore, the adjustments in the conditions did not generate any substantial modification and, thus, neither a derecognition of the asset.
(d.7.3) Other rescheduling
During the years 2024 and 2023, the SBS authorized the entities of the financial sector to modify the contractual conditions of retail loans (consumer, mortgage, micro and small businesses) in order to facilitate the debt payment of the financial sector’s clients, provided they comply with several conditions related to their risk classification, maximum past due days as of the date of the rescheduling and maximum term extensions, among others. The effects of these rescheduling have been recorded in the caption “Interest and similar income” of the consolidated statement of income; see Note 19.
During the year 2024 and 2023, in application of the aforementioned measures and other Resolutions, Interbank has performed loan reschedulings for an amount of S/853,222,000 and S/1,979,342,000, respectively.
(d.8) Subsequent adjustments to the model
The political and economic context of Peru in the year 2022, and the probability of occurrence of the El Niño event in the year 2023, and the impact of the release of the CTS deposits and AFP funds during 2024, have not been adequately reflected by the existing statistical models which are parameterized to determine the expected loss of the Group, considering that those events are of extraordinary nature and have not had precedents that would have been used as basis to model them in the calculation of the expected loss. For this reason, Interbank incorporated a serie of expert judgments with the purpose of calculating the expected loss pursuant to the requirement established by IFRS 9.
Following are details of the subsequent adjustments to the expected loss model performed to include in the calculation the effects of the uncertainty and risks as of December 31, 2024, 2023 and 2022:
(i)
Subsequent adjustments to the model included in 2024:
An expert judgment was set out to capture the effects of the current economic situation on the estimation of the loan portfolio, considering the impact of governmental decisions regarding the withdrawal of CTS deposits and AFP funds.
As consequence of the liquidity excess generated by these measures, an improvement of the risk rating scoring (“BURO”) has been observed, which has affected the regular behavior and performance of the expected credit losses in the segment of retail clients. Under this situation, it has been necessary to enhance the monitoring of outcomes of the expected loss model and to record subsequent adjustments to the calculation, thus neutralizing the improvements of the credit scoring due to temporary improvements in the aforementioned segment. These adjustments seek to ensure a more representative risk estimation, taking into consideration the uncertainty generated by the current situation of the loans’ performance.
Following is the amount of the expected loss to direct and indirect loans as of December 31, 2024, as determined by the model, and the subsequent adjustments to the model explained in previous paragraphs.
F-129
Expected loss (according to model)
Subsequent adjustments to the model
Expected loss (total)
S/(000)
S/(000)
S/(000)
Commercial loans
189,557
—
189,557
Consumer loans
1,218,011
154,846
1,372,857
Mortgage loans
80,047
13,750
93,797
Small and micro-business loans
88,204
—
88,204
Total
1,575,819
168,596
1,744,415
(ii) Subsequent adjustments to the model included in 2023:
An expert judgment was set out that seeks to stress the probability of default from clients due to the uncertainty of the intensity and occurrence probability of the El Niño event.
This judgment is related to the reviewing of the forward-looking factors used by the model, which are built from macroeconomic models and forecasts performed by an external provider; and it is based on a more stressed forward-looking scenario of the economy’s performance compared with the weighted factors of the expected loss model. The difference between both represents, for each portfolio, the additional provision requirement. In this sense, it is possible to stress the expected loss by applying more severe macroeconomic forecasts to the probability of default.
Following is the amount of the expected loss to direct and indirect loans as of December 31, 2023, as determined by the model, and the subsequent adjustments to the model explained in previous paragraphs:
Expected loss (according to model)
Subsequent adjustments to the model
Expected loss (total)
S/(000)
S/(000)
S/(000)
Commercial loans
278,145
18,107
296,252
Consumer loans
1,709,256
153,126
1,862,382
Mortgage loans (*)
84,731
2,464
87,195
Small and micro-business loans
114,629
6,899
121,528
Total
2,186,761
180,596
2,367,357
(iii)
Subsequent adjustments to the model included in 2022:
With the purpose of reflecting the impact of the political and economic uncertainty in Peru, Interbank decided to apply its expert judgment to stress the probability of default for its entire client portfolio, except for the mortgage portfolio. As of December 31, 2022, the impact of the application of these criteria generated a higher provision for expected credit loss of S/353,300,000.
(d.9) Prospective information
Expected credit losses consider information about overall credit risk. Information about overall credit risk must incorporate not only information on delinquency, but also all relevant credit information, including forward-looking macroeconomic information.
To comply with the regulatory requirement, it has been determined that the methodology includes the aforementioned effects within the expected loss.
The estimation of expected credit losses will always reflect the possibility of a credit loss, even if the most likely result is not credit loss. Therefore, estimates of expected credit losses are required to reflect a weighted, unbiased amount that is determined by evaluating a range of possible outcomes.
To capture these effects, stress models have been used that have been carried out by an external provider and seek to stress the probability of default based on different macroeconomic variable projection scenarios.
The Group has defined three possible scenarios for each portfolio: base, optimistic and pessimistic.
Within the analysis carried out for the projection of probability of default, the projection period determined is 36 months (3 years). For projections after that period, the same information of that last year is considered, because it is deemed that projections beyond this period lose statistical significance, as evidenced by observing thresholds of confidence levels.
F-130
Macroeconomic variables used as of December 31, 2024:
Scenario
2025
2026
2027
Unemployment rate (annual % var.)
Optimistic
(3.9
%)
(4.7
%)
(7.6
%)
Base
(2.6
%)
(3.4
%)
(4.0
%)
Pessimistic
(0.7
%)
(0.1
%)
(0.4
%)
Real disposable income per capita (annual % var.)
Optimistic
1.7
%
2.4
%
3.2
%
Base
1.1
%
2.0
%
2.7
%
Pessimistic
(0.7
%)
1.3
%
2.3
%
Real formal average salary (annual % var.)
Optimistic
1.8
%
0.9
%
1.4
%
Base
1.3
%
0.5
%
0.7
%
Pessimistic
0.0
%
(0.1
%)
0.1
%
Private formal employment (annual % var.)
Optimistic
3.5
%
3.0
%
3.2
%
Base
3.0
%
2.6
%
2.8
%
Pessimistic
2.1
%
2.1
%
2.3
%
Real informal average salary (annual % var.)
Optimistic
1.4
%
1.3
%
1.2
%
Base
1.0
%
0.5
%
0.7
%
Pessimistic
0.3
%
(0.1
%)
0.1
%
Macroeconomic variables used as of December 31, 2023:
Scenario
2024
2025
2026
Domestic demand (annual % var.)
Optimistic
3.3
%
2.9
%
2.8
%
Base
3.0
%
2.7
%
2.4
%
Pessimistic
1.8
%
2.8
%
2.3
%
Private formal employment (annual % var.)
Optimistic
3.0
%
3.1
%
2.6
%
Base
2.7
%
2.9
%
2.5
%
Pessimistic
1.8
%
2.9
%
3.1
%
Real disposable income per capita (annual % var.)
Optimistic
2.3
%
1.8
%
2.9
%
Base
2.0
%
1.6
%
2.6
%
Pessimistic
0.7
%
1.7
%
2.3
%
Real formal salary (annual % var.)
Optimistic
1.3
%
1.7
%
2.1
%
Base
1.1
%
1.6
%
1.9
%
Pessimistic
(2.6
%)
0.6
%
1.0
%
Real informal salary (annual % var.)
Optimistic
3.3
%
3.0
%
3.1
%
Base
2.9
%
2.9
%
2.8
%
Pessimistic
(0.1
%)
1.8
%
2.2
%
F-131
For the determination of these macroeconomic variables, different reputable external sources have been considered. The impact of these macroeconomic variables on the expected loss differs for each portfolio depending on the sensitivity in each of them.
The following tables summarize the impact of multiple scenarios on the expected credit loss of direct and indirect loans (optimistic, base and pessimistic):
December 31, 2024
%
Total
S/ (000)
Optimistic
5
81,557
Base
58
999,681
Pessimistic
37
663,177
Total
1,744,415
December 31, 2023
%
Total
S/ (000)
Optimistic
7
159,536
Base
49
1,127,461
Pessimistic
44
1,080,360
Total
2,367,357
F-132
Guarantees:
The fair value of the loan guarantees as of December 31, 2024 and 2023, is presented below:
Fair value of the credit guarantee under the base scenario
As of December 31, 2024
Maximum exposure to credit risk
Cash
Investments
Properties
Others
Total guarantee (*)
Net exposure
Expected loss associated
S/(000)
S/(000)
S/(000)
S/(000)
S/(000)
S/(000)
S/(000)
S/(000)
Subject to impairment
Financial assets
Cash and due from banks
12,615,226
—
—
—
—
—
12,615,226
—
Commercial loans
22,770,495
878,109
1,706,707
11,437,282
3,205,987
17,228,085
5,542,410
175,811
Small and micro-business loans
2,037,158
—
—
—
—
—
2,037,158
87,700
Consumer loans
15,036,411
—
—
—
—
—
15,036,411
1,372,856
Mortgage loans
10,571,300
—
—
18,926,685
—
18,926,685
(8,355,385
)
93,800
Direct loans
50,415,364
878,109
1,706,707
30,363,967
3,205,987
36,154,770
14,260,594
1,730,167
Debt instruments at amortized cost
3,784,912
—
—
—
—
—
3,784,912
53
Total financial assets at amortized cost
66,815,502
878,109
1,706,707
30,363,967
3,205,987
36,154,770
30,660,732
1,730,220
Debt instruments at fair value through other comprehensive income
20,377,805
—
—
—
—
—
20,377,805
95,090
Total debt instruments at fair value through other comprehensive income
20,377,805
—
—
—
—
—
20,377,805
95,090
Not subject to impairment
Derivative financial instruments - Trading
72,746
35,645
—
—
—
35,645
37,101
—
Derivative financial instruments - Hedges
70,455
—
—
—
—
—
70,455
—
Financial assets at fair value through profit or loss
1,776,567
—
—
—
—
—
1,776,567
—
Total financial instruments at fair value through profit or loss
1,919,768
35,645
—
—
—
35,645
1,884,123
—
89,113,075
913,754
1,706,707
30,363,967
3,205,987
36,190,415
52,922,660
1,825,310
Financial guarantees (guarantees and stand-by letters)
4,695,331
21,981
143,731
2,005,957
1,471,778
3,643,447
1,051,884
14,005
Letters of credit for customers
373,363
695
24,442
—
67,752
92,889
280,474
243
Indirect loans
5,068,694
22,676
168,173
2,005,957
1,539,530
3,736,336
1,332,358
14,248
94,181,769
936,430
1,874,880
32,369,924
4,745,517
39,926,751
54,255,018
1,839,558
F-133
Fair value of the credit guarantee under the base scenario
As of December 31, 2023
Maximum exposure to credit risk
Cash
Investments
Properties
Others
Total guarantee (*)
Net exposure
Expected loss associated
S/(000)
S/(000)
S/(000)
S/(000)
S/(000)
S/(000)
S/(000)
S/(000)
Subject to impairment
Financial assets
Cash and due from banks
9,818,711
—
—
—
—
—
9,818,711
—
Commercial loans
21,155,476
665,532
1,242,105
11,585,327
3,202,231
16,695,195
4,460,281
278,466
Small and micro-business loans
933,824
—
—
—
—
—
933,824
121,377
Consumer loans
16,325,460
—
—
—
—
—
16,325,460
1,862,384
Mortgage loans
9,834,398
—
—
17,005,359
—
17,005,359
(7,170,961
)
87,198
Direct loans
48,249,158
665,532
1,242,105
28,590,686
3,202,231
33,700,554
14,548,604
2,349,425
Debt instruments at amortized cost
3,474,004
—
—
—
—
—
3,474,004
62
Total financial assets at amortized cost
61,541,873
665,532
1,242,105
28,590,686
3,202,231
33,700,554
27,841,319
2,349,487
Debt instruments at fair value through other comprehensive income
21,246,569
—
—
—
—
—
21,246,569
61,046
Total debt instruments at fair value through other comprehensive income
21,246,569
—
—
—
—
—
21,246,569
61,046
Not subject to impairment
Derivative financial instruments - Trading
99,099
9,755
—
—
—
9,755
89,344
—
Derivative financial instruments - Hedges
59,002
—
—
—
—
—
59,002
—
Financial assets at fair value through profit or loss
1,556,540
—
—
—
—
—
1,556,540
—
Total financial instruments at fair value through profit or loss
1,714,641
9,755
—
—
—
9,755
1,704,886
—
84,503,083
675,287
1,242,105
28,590,686
3,202,231
33,710,309
50,792,774
2,410,533
Financial guarantees (guarantees and stand-by letters)
4,302,772
37,039
111,984
1,838,666
775,774
2,763,463
1,539,309
17,667
Letters of credit for customers
440,708
4,984
27,936
—
10,000
42,920
397,788
265
Indirect loans
4,743,480
42,023
139,920
1,838,666
785,774
2,806,383
1,937,097
17,932
89,246,563
717,310
1,382,025
30,429,352
3,988,005
36,516,692
52,729,871
2,428,465
F-134
The following table shows the analysis of the fair values of the guarantees classified in Stage 3:
Fair value of the credit guarantee under the base scenario
As of December 31, 2024
Maximum exposure to credit risk
Cash
Investments
Guarantees from third parties or governments
Properties
Others
Total guarantee (*)
Net exposure
Expected loss associated
S/(000)
S/(000)
S/(000)
S/(000)
S/(000)
S/(000)
S/(000)
S/(000)
S/(000)
Commercial loans
322,464
2,936
1,045
—
529,922
26,107
560,010
(237,546
)
123,013
Small and micro-business loans
85,443
—
—
—
—
—
—
85,443
62,173
Consumer loans
514,691
2,936
—
—
—
—
2,936
511,755
494,700
Mortgage loans
325,095
—
—
—
782,659
—
782,659
(457,564
)
44,321
Total
1,247,693
5,872
1,045
—
1,312,581
26,107
1,345,605
(97,912
)
724,207
Indirect loans
23,948
—
—
—
7,561
—
7,561
16,387
9,335
1,271,641
5,872
1,045
—
1,320,142
26,107
1,353,166
(81,525
)
733,542
Fair value of the credit guarantee under the base scenario
As of December 31, 2023
Maximum exposure to credit risk
Cash
Investments
Guarantees from third parties or governments
Properties
Others
Total guarantee (*)
Net exposure
Expected loss associated
S/(000)
S/(000)
S/(000)
S/(000)
S/(000)
S/(000)
S/(000)
S/(000)
S/(000)
Commercial loans
398,159
—
962
—
608,852
55,610
665,424
(267,265
)
162,385
Small and micro-business loans
106,028
—
—
—
—
—
—
106,028
70,818
Consumer loans
733,096
—
—
—
—
—
—
733,096
682,417
Mortgage loans
273,405
—
—
—
679,945
—
679,945
(406,540
)
54,651
Total
1,510,688
—
962
—
1,288,797
55,610
1,345,369
165,319
970,271
Indirect loans
15,800
—
275
—
7,451
—
7,726
8,074
7,369
1,526,488
—
1,237
—
1,296,248
55,610
1,353,095
173,393
977,640
(*) Includes the total fair value of the guarantees held by the Group as of December 31, 2024 and 2023, regardless of the balance of the loan it guarantees.
F-135
(e) Credit risk management for investments
(e.1) Scoring or internal rating and PD:
For this type of financial instruments, the Group analyzes public information available from international risk rating agencies such as: Fitch, Moody's and Standard & Poor's, and assigns a rating to each instrument.
For each rating agency, the ratings associated with higher to lower credit quality are shown:
Fitch
Moody's
Standard & Poor's
AAA
Aaa
AAA
AA+
Aa1
AA+
AA
Aa2
AA
AA-
Aa3
AA-
A+
A1
A+
A
A2
A
A-
A3
A-
BBB+
Baa1
BBB+
BBB
Baa2
BBB
BBB-
Baa3
BBB-
BB+
Ba1
BB+
BB
Ba2
BB
BB-
Ba3
BB-
B+
B1
B+
B
B2
B
B-
B3
B-
CCC
Caa1
CCC+
The Group determines its risk level according to the following classification as of December 31, 2024 and 2023:
High grade
Standard grade
Grade lower than standard
2024
Rating: from AAA to A
Rating: from BBB to B
Rating: from CCC to C
PD less than or equal to:
PD range
PD equal to or higher than:
Global
0.05% - 0.11%
0.12% - 2.03%
23.31%
Latin America
0.00%
0.08% - 3.03%
22.32%
Sovereigns
0.00%
0.00% - 1.78%
26.56%
High grade
Standard grade
Grade lower than standard
2023
Rating: from AAA to A
Rating: from BBB to B
Rating: from CCC to C
PD less than or equal to:
PD range
PD equal to or higher than:
Global
0.04% - 0.11%
0.12% - 2.11%
22.97%
Latin America
0.00%
0.09% - 2.91%
22.80%
Sovereigns
0.00%
0.00% - 1.87%
25.45%
Finally, each instrument is assigned a PD according to the transition matrices published by Fitch.
(e.2) Loss given default (LGD):
For those issuers that are classified in Stage 1 or Stage 2 at the reporting date, the Group uses the recovery matrix published by Moody's.
For those investments in Stage 3, an evaluation must be made to determine the severity of the expected loss according to the progress of the recovery process initiated.
(e.3) Exposure at default (EAD):
EAD represents the gross carrying amount of the financial instruments subject to impairment. To calculate the EAD of an investment in Stage 1, possible non-compliance events are evaluated within 12 months. For financial assets in Stage 2 and Stage 3, exposure at default is determined for events throughout the life of the instrument.
(e.4) Significant increase in credit risk:
The Group has assumed that the credit risk of a financial instrument has not increased significantly since the initial recognition if it is determined that the investment has a low credit risk at the reporting date, which occurs when the issuer has a strong ability to meet its contractual cash flow obligations in the near term and adverse changes in economic and business conditions in the long term may reduce, but not necessarily, the ability of the issuer to meet its cash flow obligations contractual cash.
F-136
In accordance with the assignment of ratings to each debt instrument, the Group determines whether there is a significant increase in credit risk by comparing the rating at the date of acquisition with the rating at the reporting date, and designates the Stage in which each debt instrument is classified according to the quantitative and qualitative criteria, defined as follows:
(i) Quantitative criteria -
The Group holds an investment that does not present a significant increase in risk if there is a movement of its credit risk rating within the investment grade. In case there is a movement of its credit risk rating outside the investment grade, it is deemed that the instrument presents a significant increase in risk.
(ii) Qualitative criteria -
The Group periodically evaluates the following warning signs and criteria to assess whether the financial instrument presents a significant risk increase (stage 2) at the reporting date:
- Significant decrease (30 percent of its original value) and prolonged (12 months) of the market value of the investment.
- Infringements of covenants without a waiver from the bondholders committee.
- Forced interventions by governments in the primary and secondary markets of the issuers.
- Linkage of the issuer in illicit, political and fraud activities.
- Impairment of collaterals (underlying assets) in the case of securitized instruments.
- Delays or short and frequent breaches in the payment of coupons.
- Macroeconomic, regulatory, social, technological and environmental changes are significantly adverse.
- Other evaluations and/or alerts made by each Subsidiary (financial statements, evaluation of EBIT, financial indicators by industry, regulatory criteria, others).
F-137
The table below presents the credit risk ratings issued by reputable risk rating agencies of local and international financial investments:
As of December 31, 2024
As of December 31, 2023
S/(000)
%
S/(000)
%
Instruments issued and rated in Peru:
BBB- / BBB+
2,287,880
8.5
2,611,807
9.8
BB- / BB+
1,028,735
3.8
652,347
2.4
B- / B+
111,708
0.4
4,770
0.0
Less de B-
4,664
0.0
—
—
3,432,987
12.7
3,268,924
12.2
Instruments issued in Peru and rated abroad:
BBB- / BBB+
14,011,438
52.2
13,174,718
49.3
BB- / BB+
774,100
2.9
490,215
1.8
B- / B+
—
0.0
214,083
0.8
Less than B-
218,328
0.8
—
—
15,003,866
55.9
13,879,016
51.9
Instruments issued and rated abroad:
AAA
9,429
0.0
11,105
0.0
AA- / AA+
111,247
0.4
145,599
0.5
A- / A+
689,996
2.6
656,237
2.5
BBB- / BBB+
2,581,191
9.6
2,565,054
9.6
BB- / BB+
124,581
0.5
228,812
0.9
B- / B+
19,689
0.1
16,190
0.1
Less than B-
—
0.0
1,723
0.0
3,536,133
13.2
3,624,720
13.6
Unrated
Negotiable certificates of deposit issued by the BCRP
2,113,924
7.9
3,448,984
12.9
Mutual funds and investment funds participations (*)
1,317,625
4.9
1,099,282
4.1
Securitized bonds
—
—
3,008
0.0
Others
98,882
0.4
81,910
0.3
Listed shares
622,528
2.3
660,839
2.5
Non-listed shares and participations
271,607
1.0
229,933
0.9
Total
26,397,552
98.3
26,296,616
98.4
Accrued interest
460,373
1.7
425,375
1.6
Total
26,857,925
100.0
26,721,991
100.0
(*) Includes mutual and investment funds which do not have risk rating.
F-138
(f) Concentration of financial instruments exposed to credit risk -
Financial instruments exposed to credit risk were distributed according to the following economic sectors:
As of December 31, 2024
Designated at fair value through profit or loss
Debt instruments measured at fair value through other comprehensive income
Equity instruments measured at fair value through other comprehensive income
Amortized cost
Total
S/(000)
S/(000)
S/(000)
S/(000)
S/(000)
Consumer loans
—
—
—
15,094,313
15,094,313
Government of Peru
—
8,466,916
—
3,698,395
12,165,311
Mortgage loans
—
—
—
10,579,426
10,579,426
Commercial and micro-business loans
—
—
—
10,236,695
10,236,695
BCRP
—
2,113,925
—
7,951,226
10,065,151
Financial services
1,693,571
1,672,720
126,594
6,530,688
(*)
10,023,573
Manufacturing
87,764
797,082
171,920
4,155,680
5,212,446
Mining
2,792
1,234,867
—
2,436,753
3,674,412
Construction and infrastructure
17,203
2,501,203
38,640
772,165
3,329,211
Communications, storage and transportation
55,385
654,287
37,640
1,946,274
2,693,586
Agriculture
87
27,286
3,714
2,393,311
2,424,398
Electricity, gas, water and oil
12,820
1,685,411
74,750
157,841
1,930,822
Commerce
15,754
508,195
—
414,063
938,012
Professional, scientific and technical activities
—
214,358
—
714,871
929,229
Leaseholds and real estate activities
10,980
187,953
—
448,839
647,772
Community services
611
7,509
—
540,084
548,204
Education, health and other services
540
94,202
—
213,206
307,948
Medicine and biotechnology
—
36,138
—
190,510
226,648
Public administration and defense
21,894
91,702
—
7,885
121,481
Fishing
—
—
5,010
79,112
84,122
Foreign governments
—
67,468
—
—
67,468
Insurance
363
12,075
—
4,728
17,166
Others
4
4,507
—
85,863
90,374
Total
1,919,768
20,377,804
458,268
68,651,928
91,407,768
Impairment allowance for loans
(1,730,167
)
Accrued interest
1,004,624
Total
90,682,225
(*) Includes mainly cash and due from banks deposited in the vaults of Interbank and in foreign banks; see Note 4.
F-139
As of December 31, 2023
Designated at fair value through profit or loss
Debt instruments measured at fair value through other comprehensive income
Equity instruments measured at fair value through other comprehensive income
Amortized cost
Total
S/(000)
S/(000)
S/(000)
S/(000)
S/(000)
Consumer loans
—
—
—
16,354,337
16,354,337
Government of Peru
—
8,239,321
—
3,307,309
11,546,630
Mortgage loans
—
—
—
9,844,293
9,844,293
BCRP
—
3,448,984
—
5,926,921
9,375,905
Financial services
1,450,713
1,609,137
121,083
5,834,322
(*)
9,015,255
Manufacturing
79,551
807,805
119,938
4,513,506
5,520,800
Professional, scientific and technical activities
841
207,340
—
4,385,889
4,594,070
Commerce
1,144
224,148
—
3,791,306
4,016,598
Construction and infrastructure
2,915
2,566,009
31,917
559,070
3,159,911
Electricity, gas, water and oil
14,561
1,698,582
81,438
936,836
2,731,417
Mining
1,079
1,125,295
—
1,333,655
2,460,029
Communications, storage and transportation
126,455
496,130
78,384
1,249,526
1,950,495
Agriculture
989
26,339
2,806
1,894,430
1,924,564
Commercial and micro-business loans
—
—
—
804,212
804,212
Leaseholds and real estate activities
15,751
184,898
5,707
590,501
796,857
Fishing
—
—
3,605
600,848
604,453
Community services
871
4,710
—
594,254
599,835
Medicine and biotechnology
—
31,367
—
450,704
482,071
Education, health and other services
2
99,097
—
240,736
339,835
Public administration and defense
16,075
41,187
—
42,714
99,976
Foreign governments
—
89,007
—
—
89,007
Insurance
3,694
8,501
—
2,034
14,229
Others
—
4,327
—
31,727
36,054
Total
1,714,641
20,912,184
444,878
63,289,130
86,360,833
Impairment allowance for loans
(2,349,425
)
Accrued interest
1,046,024
Total
85,057,432
(*) Includes mainly cash and due from banks deposited in the vaults of Interbank and in foreign banks; see Note 4.
F-140
The table below presents the financial instruments with exposure to credit risk, by geographic area:
As of December 31, 2024
Designated at fair value through profit or loss
Debt instruments measured at fair value through other comprehensive income
Equity instruments measured at fair value through other comprehensive income
Investments at amortized cost
Total
S/(000)
S/(000)
S/(000)
S/(000)
S/(000)
Peru
138,125
16,843,710
294,034
65,957,138
83,233,007
United States of America
1,499,518
896,372
37,640
823,188
3,256,718
Mexico
17,996
1,017,363
—
10,733
1,046,092
Chile
1
807,524
7,995
32,038
847,558
Panama
461
148,363
277
479,425
(*)
628,526
United Kingdom
94,483
264,082
116,458
135,358
610,381
Bahamas
—
—
—
243,750
243,750
Canada
1,256
15,387
—
219,857
236,500
Ecuador
—
—
—
231,087
231,087
Colombia
79
121,545
—
105,332
226,956
Brazil
—
146,286
—
30,848
177,134
Germany
23,326
587
—
123,436
147,349
Cayman Islands
116,217
1,186
—
—
117,403
Luxembourg
—
15,534
—
68,835
84,369
Suiza
—
4,743
—
56,542
61,285
Venezuela
—
—
—
54,261
54,261
España
—
9,933
—
20,394
30,327
Argentina
—
—
—
19,349
19,349
Ireland
—
553
—
624
1,177
Belgium
—
154
—
1
155
Others
28,306
84,482
1,864
39,732
154,384
Total
1,919,768
20,377,804
458,268
68,651,928
91,407,768
Impairment allowance for loans
(1,730,167
)
Accrued interest
1,004,624
Total
90,682,225
(*) Corresponds mainly to the loan portfolio maintained by Inteligo Bank (domiciled in Panama) with Peruvian citizens.
F-141
As of December 31, 2023
Designated at fair value through profit or loss
Debt instruments measured at fair value through other comprehensive income
Equity instruments measured at fair value through other comprehensive income
Amortized cost
Total
S/(000)
S/(000)
S/(000)
S/(000)
S/(000)
Peru
118,277
17,289,485
245,411
60,879,122
78,532,295
United States of America
1,311,432
853,799
78,384
516,788
2,760,403
Mexico
15,559
1,054,480
—
17,031
1,087,070
Panama
—
147,198
190
632,672
(*)
780,060
Chile
1
710,106
10,011
46,243
766,361
United Kingdom
64,727
266,974
109,045
32,562
473,308
Canada
12,898
12,095
—
369,993
394,986
Colombia
96
309,994
—
80,764
390,854
Cayman Islands
121,815
4,132
—
101,554
227,501
Brazil
—
150,120
—
41,231
191,351
Ecuador
—
—
—
190,181
190,181
Suiza
—
1,461
—
89,430
90,891
Germany
24,487
582
—
58,025
83,094
Luxembourg
—
14,395
—
60,909
75,304
Venezuela
—
—
—
46,363
46,363
España
—
13,074
—
18,876
31,950
Bahamas
—
—
—
27,563
27,563
Argentina
—
—
—
19,244
19,244
Ireland
—
—
—
2,896
2,896
Belgium
—
—
152
1
153
Others
45,349
84,289
1,685
57,682
189,005
Total
1,714,641
20,912,184
444,878
63,289,130
86,360,833
Impairment allowance for loans
(2,349,425
)
Accrued interest
1,046,024
Total
85,057,432
(*) Corresponds mainly to the loan portfolio maintained by Inteligo Bank (domiciled in Panama) with Peruvian citizens.
(g)
Offsetting of financial assets and liabilities
The information contained in the tables below includes financial assets and liabilities that:
are offset in the statement of financial position of the Group; or
are subject to an enforceable master netting arrangement or similar agreement that covers similar financial instruments, regardless of whether they are offset in the consolidated statement of financial position or not.
Similar arrangements of the Group include derivatives clearing agreements. Financial instruments such as loans and deposits are not disclosed in the following tables since they are not offset in the consolidated statement of financial position.
The offsetting framework agreement issued by the International Swaps and Derivatives Association Inc. (“ISDA”) and similar master netting arrangements do not meet the criteria for offsetting in the statement of financial position, because such agreements were created in order for both parties to have an enforceable offsetting right in cases of default, insolvency or bankruptcy of the Group or the counterparties or following other predetermined events. In addition, the Group and its counterparties do not intend to settle such instruments on a net basis or to realize the assets and settle the liabilities simultaneously.
The Group receives and delivers guarantees in the form of cash with respect to transactions with derivatives; see Note 4.
F-142
(g.1) Financial assets subject to offsetting, enforceable master netting arrangements and similar agreements as of December 31, 2024 and 2023, are presented below:
Gross amounts of recognized financial liabilities and offset
Net amounts of financial assets presented in the
Related amounts not offset in the consolidated statement of financial position
Gross amounts of recognized financial assets
in the consolidated statement of financial position
(g.2) Financial liabilities subject to offsetting, enforceable master netting arrangements and similar agreements as of December 31, 2024 and 2023, are presented below:
Gross amounts of recognized financial assets and offset in the
Net amounts of financial liabilities presented in the
Related amounts not offset in the consolidated statement of financial position
Market risk is the possibility of loss due to variations in the financial market conditions. The main variations to which the Group is exposed to are exchange rates, interest rates and prices. Said variations can affect the value of the Group’s financial assets and liabilities.
During years 2024 and 2023, interest rates remained lower, in line with the reductions defined by the Central Reserve Bank on the reference rate. These reductions are explained by the favorable evolution of inflation, which is approaching the target range. Regarding sovereign bonds, volatility continued with a downward trend accompanied by an improvement in prices.
On the other side, the Banking Book results are affected by the decreases in interest rates, particularly in products that appreciate quickly such as time deposits or short-term commercial loans as they mature.
The Group separates its exposure to market risk into two blocks: (i) one that arises from the fluctuation of the value of the trading investment portfolios, due to movements of market rates or prices (“Trading Book”) and; (ii) one that arises from the changes in the structural positions (“Banking Book”) due to movements in interest rates, prices and exchange rates.
(a)
Trading Book -
To control and monitor the risks arising from the volatility of risk factors involved within each instrument, maximum exposure limits by currency, by type of investment and Value-at-Risk (“VaR”), which are controlled on a daily basis, have been established.
The main measurement technique used to measure and control market risk is VaR, which is a statistical measurement that quantifies the maximum loss expected for a period of time and a determined significance level under normal market conditions. The Group uses the VaR model for a period of one day, and a 99-percent confidence level. VaR is calculated by risk factor: interest rate; price or exchange rate and by type of investment: derivatives, fixed income and variable income.
VaR models are designed to measure the market risk within a normal market environment. Since VaR is based mainly on historical data to provide information and does not clearly predict future changes and modifications in risk factors, the probability of big market movements may be underestimated. VaR can also be underestimated or overestimated due to the hypotheses made on the risk factors and the relation among these factors with the specific instruments. To determine the reliability of VaR models, the actual results are regularly monitored to prove the validity of the assumptions and parameters used in the calculation of VaR.
F-143
The Group includes within the VaR calculation the potential loss that may arise from the exposure to exchange rate risk. This risk is included in the VaR calculation because the exchange position is the result of the spot position plus the position in derivative products. Likewise, the total VaR includes the diversification effect that arises as a result of the interaction of the various market risk factors to which the Group is exposed.
The validity of the VaR calculation is proven through back-testing, which uses historical data to ensure that the model adequately estimates the potential losses. Additionally, the sensitivity of risk factors is calculated, which shows the potential portfolio losses in the event of certain fluctuations in factors. Said fluctuations include: interest rate shocks, exchange rate shocks and price shocks.
The VaR results of the Group’s portfolio by type of asset are presented below:
2024
2023
S/(000)
S/(000)
Equity investments
36,036
26,584
Debt investments
131
709
Derivatives and/or exchange position
953
1,548
Diversification effect
(243
)
(237
)
Consolidated VaR by type of asset (*)
36,877
28,604
The Group’s VaR results by type of risk are the following:
2024
2023
S/(000)
S/(000)
Exchange rate risk
2,893
4,813
Interest rate risk
376
1,417
Price risk
37,804
25,733
Diversification effect
(4,196
)
(3,359
)
Consolidated VaR by type of risk (*)
36,877
28,604
(*) The total VaR is lower than the sum of its components due to the benefits of risk diversification.
(b)
Banking Book -
The portfolios which are not for trading are exposed to different financial risks, since they are sensitive to movements of the market rates, which can result in a negative effect on the value of the assets compared to its liabilities and therefore, on its net value.
(i)
Interest rate risk
Interest rates fluctuate permanently on the market. These fluctuations affect the Group in two ways: first, through the change in the valuation of assets and liabilities; and secondly, affecting the cash flows at repricing. The variation in the valuation of assets and liabilities is increasingly sensitive as the term at which the asset or liability is repriced is extended. This process consists in the assessment of repricing periods. On the other hand, cash flows are affected when the instruments reach maturity, when they are invested or placed at new interest rates effective in the market.
Repricing gap
An analysis of the repricing gaps is performed to determine the impact of the interest rates movements. Said analysis consists of assigning the balances of the operations that will change the interest rate into different time gaps. Based on this analysis, the impact of the variation in the valuation of assets and liabilities on each gap is calculated.
In the case of the insurance segment, this risk arises from the fluctuation in interest rates and its effect on the repricing rates required for the payment of long-term obligations of insurance contracts. Therefore, Interseguro maintains short-term deposits at preferential rates, and medium and short-term bonds with different amortization structures to achieve a match of cash flows between assets and liabilities, minimizing repricing gap.
F-144
(i.1) The following table summarizes the Group’s exposure to interest rate risk. The Group’s financial instruments are presented at carrying amount (including interest accrued), classified by the repricing period of the contract’s interest rate or maturity date, whichever occurs first:
As of December 31, 2024
Up to 1 month
From 1 to 3 months
From 3 to 12 months
From 1 to 5 years
More than 5 years
Non-interest bearing
Total
S/(000)
S/(000)
S/(000)
S/(000)
S/(000)
S/(000)
S/(000)
Financial assets
Cash and due from banks
8,575,399
17,936
11
—
—
4,021,880
12,615,226
Inter-bank funds
220,060
—
—
—
—
—
220,060
Investments at fair value through other comprehensive income (debt and equity)
894,402
1,245,519
768,069
5,473,331
12,343,571
458,268
21,183,160
Investments at amortized cost
61,382
101,450
12,131
752,424
2,970,811
—
3,898,198
Loans, net (*)
4,082,359
5,328,773
13,689,207
19,835,684
6,589,089
(295,664
)
49,229,448
Other assets (**)
852,858
152,093
97,488
371,874
(6,718
)
5,040,781
6,508,376
Total assets
14,686,460
6,845,771
14,566,906
26,433,313
21,896,753
9,225,265
93,654,468
Financial liabilities
Deposits and obligations
34,089,992
5,181,622
6,435,281
413,041
33,499
7,614,593
53,768,028
Due to banks and correspondents
2,055,726
772,527
1,398,001
1,944,760
1,391,043
—
7,562,057
Bonds, notes and other obligations
251,845
1,680
1,490,591
4,005,402
325,915
—
6,075,433
Insurance and reinsurance contract liabilities
47,878
99,710
464,997
2,486,668
9,203,598
221,469
12,524,320
Other liabilities (***)
952,940
104,144
88,873
160,189
1,312,693
1,828,255
4,447,094
Equity
—
—
—
—
—
10,978,595
10,978,595
Total liabilities and equity
37,398,381
6,159,683
9,877,743
9,010,060
12,266,748
20,642,912
95,355,527
Off- balance sheet accounts
Derivatives held as assets
75,280
—
1,505,600
754,000
—
—
2,334,880
Derivatives held as liabilities
75,280
—
1,505,600
754,000
—
—
2,334,880
—
—
—
—
—
—
—
Marginal gap
(22,711,921
)
686,088
4,689,163
17,423,253
9,630,005
(11,417,647
)
(1,701,059
)
Cumulative gap
(22,711,921
)
(22,025,833
)
(17,336,670
)
86,583
9,716,588
(1,701,059
)
—
(*) The balance presented in column “non-interest bearing” corresponds mainly to accrued income from loans, past-due loans, loans under judicial collection and the provision for loan losses.
(**) Includes investment property, property, furniture and equipment, net, banker’s acceptances, intangibles and goodwill, net, other accounts receivable and other assets, net (except accounts receivable from derivative financial instruments held for trading), reinsurance contract assets, and deferred income tax assets, net.
(***) Includes banks acceptances and other accounts payable, provisions and other liabilities (except accounts payable for derivative financial instruments held for trading) and deferred income tax liability, net.
Investments at fair value through profit or loss, derivatives held for trading and liabilities at fair value through profit or loss, are not considered because these instruments are part of the trading book and the methodology used for the measurement of their market risk is VaR.
F-145
As of December 31, 2023
Up to 1 month
From 1 to 3 months
From 3 to 12 months
From 1 to 5 years
More than 5 years
Non-interest bearing
Total
S/(000)
S/(000)
S/(000)
S/(000)
S/(000)
S/(000)
S/(000)
Financial assets
Cash and due from banks
6,438,844
77,841
216,012
26,788
—
3,059,226
9,818,711
Inter-bank funds
524,915
—
—
—
—
—
524,915
Investments at fair value through other comprehensive income (debt and equity)
501,199
1,540,643
2,293,382
4,041,060
12,870,285
444,878
21,691,447
Investments at amortized cost
23,583
86,652
634,133
636,561
2,093,075
—
3,474,004
Loans, net (*)
4,247,703
5,611,232
11,248,432
19,392,632
6,584,178
(563,795
)
46,520,382
Other assets (**)
1,034,215
195,323
262,343
219,298
5,590
4,222,912
5,939,681
Total assets
12,770,459
7,511,691
14,654,302
24,316,339
21,553,128
7,163,221
87,969,140
Financial liabilities
Deposits and obligations
30,185,794
3,894,718
6,601,910
498,592
46,902
7,960,318
49,188,234
Inter-bank funds
119,712
—
—
—
—
—
119,712
Due to banks and correspondents
1,459,377
1,758,037
2,776,380
1,683,940
1,348,196
—
9,025,930
Bonds, notes and other obligations
200,594
1,138,301
18,233
3,960,246
234,255
—
5,551,629
Insurance and reinsurance contract liabilities
52,793
104,011
470,253
2,549,908
8,784,208
246,363
12,207,536
Other liabilities (***)
867,346
142,339
205,445
514,669
520,057
1,172,997
3,422,853
Equity
—
—
—
—
—
10,008,101
10,008,101
Total liabilities and equity, net
32,885,616
7,037,406
10,072,221
9,207,355
10,933,618
19,387,779
89,523,995
Off- balance sheet accounts
Derivatives held as assets
185,450
111,270
1,576,325
705,470
—
—
2,578,515
Derivatives held as liabilities
185,450
111,270
1,576,325
705,470
—
—
2,578,515
—
—
—
—
—
—
—
Marginal gap
(20,115,157
)
474,285
4,582,081
15,108,984
10,619,510
(12,224,558
)
(1,554,855
)
Cumulative gap
(20,115,157
)
(19,640,872
)
(15,058,791
)
50,193
10,669,703
(1,554,855
)
—
(*) The balance presented in column “non-interest bearing” corresponds mainly to accrued income from loans, past-due loans, loans under judicial collection and the provision for loan losses.
(**) Includes investment property, property, furniture and equipment, net, banker’s acceptances, intangibles and goodwill, net, other accounts receivable and other assets, net (except accounts receivable from derivative financial instruments held for trading), reinsurance contract assets, and deferred income tax assets, net.
(***) Includes banks acceptances and other accounts payable, provisions and other liabilities (except accounts payable for derivative financial instruments held for trading) and deferred income tax liability, net.
Investments at fair value through profit or loss and derivatives held for trading are not considered because these instruments are part of the trading book and the methodology used for the measurement of their market risk is VaR.
F-146
(i.2) Sensitivity to changes in interest rates -
The exposure to the interest rate, in the case of Interbank, is supervised by the GIR Committee and the ALCO Committee. The GIR Committee approves the various limits applicable to the financial instruments’ management. The ALCO Committee analyzes and monitors the results of the asset and liability management strategies and decisions implemented. Likewise, it defines the strategies and analyzes the sources of financing, as well as the coverage of the balance executed by the Bank. In particular, the latter could be considered to cover the exposure due to the variation in cash flows attributed to changes in variable market rates, to fix the cost of funds considering the global context of future movement of rates in the currencies under evaluation, to transform the cost of funds from foreign currency to the functional currency, among other casuistry as reviewed and approved by the Committee, considering the risk limits.
In this regard, the effect of movements in interest rates is analyzed based on the Regulatory Model and considers: (i) the financial margin for the next 12 months or Earning at Risk (EaR) and (ii) the Equity Value at Risk (EVaR), as detailed below:
-
Earning at Risk indicator, calculated as a percentage of the Regulatory Capital, the legal limit of 5 percent and an early warning of 4 percent are set.
-
Value at Risk indicator, calculated as a percentage of the effective equity, establishes the internal limit of 15 percent and an early warning of 13 percent.
Thus, interest rate risk is managed and supervised by monitoring the aforementioned indicators, which allows Management to assess the potential effect of interest rates movements on the Group’s financial margin and thus manage the terms and the fixed and/or variable yields generated by the financial instruments held by the Group, including strategies on the derivative financial instruments designated as hedge accounting.
For its part, the GIR Committee oversees the approval levels of structural interest-rate risk capacity and appetite, which are detailed in the Bank's Risk Appetite Framework.
In the case of Interseguro and Inteligo Bank, their Boards establish limits, which are controlled by their respective Investment Risk Unit.
The table below presents the sensitivity to a possible change in interest rates, with all other variables kept constant, in the consolidated statement of income and in the consolidated statement of changes in equity, before Income Tax and non-controlling interest.
As of December 31, 2024
Currency
Changes in basis points
Sensitivity of net income
Sensitivity of other net comprehensive income
S/(000)
S/(000)
US Dollar
+/-25
+/-
83
+/-
102,859
US Dollar
+/-50
+/-
163
+/-
205,867
US Dollar
+/-75
+/-
245
+/-
309,164
US Dollar
+/-100
+/-
325
+/-
412,907
Sol
+/-50
-/+
48,323
-/+
488,795
Sol
+/-75
-/+
72,484
-/+
733,881
Sol
+/-100
-/+
96,645
-/+
979,797
Sol
+/-150
-/+
144,968
-/+
1,475,267
As of December 31, 2023
Currency
Changes in basis points
Sensitivity of net income
Sensitivity of other net comprehensive income
S/(000)
S/(000)
US Dollar
+/-25
+/-
105
+/-
103,189
US Dollar
+/-50
+/-
210
+/-
206,551
US Dollar
+/-75
+/-
315
+/-
310,258
US Dollar
+/-100
+/-
421
+/-
414,485
Sol
+/-50
-/+
44,656
-/+
444,244
Sol
+/-75
-/+
66,984
-/+
677,590
Sol
+/-100
-/+
89,313
-/+
904,721
Sol
+/-150
-/+
133,969
-/+
1,362,566
The interest rate sensitivities shown in the tables above are only illustrative and are based on simplified scenarios. The figures represent the effect of the pro-forma movements in the net interest income based on the projected scenarios yield curve and the Group’s current interest rate risk profile. However, this effect, does not include actions that would be taken by Management to mitigate the impact of this interest rate risk. In addition, the Group seeks proactively to change the interest rate risk profile to minimize losses and optimize net revenues. The above projections also assume that interest rate of all maturities move by the same amount and, therefore, do not reflect the potential impact on net interest income of some rates changing while others remain unchanged. The projections also include assumptions to facilitate calculations, such as the assumption that all positions are held to maturity.
F-147
As described in Note 3.4(ae), in previous years, regulators eliminated LIBOR rates and replaced them by an alternative interest rate. During 2024, the Group successfully managed the transition of all its contracts to the alternative interest rate benchmark Secured Overnight Financial Rate (SOFR); therefore; as of December 31, 2024 and 2023, IFS do not have exposure to USD-LIBOR rates.
The exposure to the interest rate in the case of Interseguro is shown in Note 29.5(a.3).
(i.3) Sensitivity to price variation -
Shares classified as investments at fair value through other comprehensive income, for the years 2024 and 2023, are not considered as part of the investments for interest rate sensitivity calculation purposes. However, a calculation of sensitivity in market prices and the effect on expected unrealized gain or loss in the consolidated statement of other comprehensive income, before Income Tax and non-controlling interest, as of December 31, 2024 and 2023, is presented below:
Changes in market price
2024
2023
Sensitivity to market price
%
S/(000)
S/(000)
Shares
+/-10
45,827
44,488
Shares
+/-25
114,567
111,220
Shares
+/-30
137,480
133,463
F-148
(ii)
Foreign exchange risk
The Group is exposed to fluctuations in the exchange rates of the foreign currency prevailing in its financial position and cash flows. Management sets limits on the levels of exposure by currency and total daily and overnight positions, which are monitored daily. Most of the assets and liabilities in foreign currency are stated in US Dollars. Transactions in foreign currency are made at the exchange rates of free market.
As of December 31, 2024, the weighted average exchange rate of free market published by the SBS for transactions in US Dollars was S/3.758 per US$1 bid and S/3.770 per US$1 ask (S/3.705 and S/3.713 as of December 31, 2023, respectively). As of December 31, 2024, the exchange rate for the accounting of asset and liability accounts in foreign currency set by the SBS was S/3.764 per US$1 (S/3.709 as of December 31, 2023).
The table below presents the detail of the Group’s position:
As of December 31, 2024
US Dollars
Soles
Other currencies
Total
S/(000)
S/(000)
S/(000)
S/(000)
Assets
Cash and due from banks
8,615,546
3,676,441
323,239
12,615,226
Inter-bank funds
—
220,060
—
220,060
Financial investments
7,456,057
19,356,325
45,543
26,857,925
Loans, net
14,372,955
34,848,570
7,923
49,229,448
Due from customers on acceptances
9,163
—
—
9,163
Other accounts receivable and other assets, net
405,658
1,326,121
22
1,731,801
Insurance and reinsurance contract assets
207
18,395
—
18,602
30,859,586
59,445,912
376,727
90,682,225
Liabilities
Deposits and obligations
19,802,404
33,451,094
514,530
53,768,028
Due to banks and correspondents
2,210,040
5,352,017
—
7,562,057
Bonds, notes and other obligations
5,227,805
847,628
—
6,075,433
Due from customers on acceptances
9,163
—
—
9,163
Insurance contract liabilities
3,940,738
8,583,582
—
12,524,320
Other accounts payable, provisions and other liabilities
1,689,640
2,484,247
14,067
4,187,954
32,879,790
50,718,568
528,597
84,126,955
Forwards position, net
(1,842,468
)
1,564,150
278,318
—
Currency swaps position, net
1,849,472
(1,849,472
)
—
—
Cross currency swaps position, net
2,071,400
(2,071,400
)
—
—
Options position, net
(61
)
61
—
—
Monetary position, net
58,139
6,370,683
126,448
6,555,270
F-149
As of December 31, 2023
US Dollars
Soles
Other currencies
Total
S/(000)
S/(000)
S/(000)
S/(000)
Assets
Cash and due from banks
6,745,220
2,710,275
363,216
9,818,711
Inter-bank funds
55,660
469,255
—
524,915
Financial investments
7,090,138
19,569,726
62,127
26,721,991
Loans, net
14,131,543
32,388,839
—
46,520,382
Due from customers on acceptances
40,565
—
—
40,565
Other accounts receivable and other assets, net
242,935
1,161,624
22
1,404,581
Reinsurance contract assets
166
26,121
—
26,287
28,306,227
56,325,840
425,365
85,057,432
Liabilities
Deposits and obligations
18,277,393
30,420,832
490,009
49,188,234
Inter-bank funds
63,081
56,631
—
119,712
Due to banks and correspondents
2,342,325
6,683,605
—
9,025,930
Bonds, notes and other obligations
5,049,942
501,687
—
5,551,629
Due from customers on acceptances
40,565
—
—
40,565
Insurance and reinsurance contract liabilities
3,997,075
8,210,461
—
12,207,536
Other accounts payable, provisions and other liabilities
1,272,832
1,928,716
43
3,201,591
31,043,213
47,801,932
490,052
79,335,197
Forwards position, net
(631,449
)
505,661
125,788
—
Currency swaps position, net
951,864
(951,864
)
—
—
Cross currency swaps position, net
2,430,155
(2,430,155
)
—
—
Options position, net
(51
)
51
—
—
Monetary position, net
13,533
5,647,601
61,101
5,722,235
As of December 31, 2024, the Group granted indirect loans (contingent operations) in foreign currency for approximately US$770,827,000, equivalent to S/2,901,393,000 (US$741,882,000, equivalent to S/2,751,640,000 as of December 31, 2023); see Note 18.
The Group manages the exchange rate risk through the matching of its assets and liabilities operations, supervising its global exchange position daily. The global exchange position of the Group is equivalent to long positions minus short positions in currencies other than the Sol. The global exchange position includes balance positions (spot) and the positions in derivatives, including the positions of derivatives that have been designated as accounting hedges with the purpose of covering the exposure due to the variation of the exchange rate; see Note10(b). Any depreciation/appreciation of the foreign currency would affect the consolidated statement of income. An imbalance in the monetary position would make the Group’s consolidated statement of financial position vulnerable to the fluctuation of the foreign currency (exchange rate “shock”).
The table below shows the analysis of variations of the US Dollar, the main foreign currency to which the Group has exposure as of December 31, 2024 and 2023. The analysis determines the effect of a reasonably possible variation of the exchange rate US Dollar to the Sol, considering all the other variables constant in the consolidated statement of other comprehensive income before Income Tax. A negative amount shows a potential net reduction in the consolidated statement of income, while a positive amount reflects a net potential increase:
Sensitivity analysis
Changes in currency rates
2024
2023
%
S/(000)
S/(000)
Devaluation
US Dollar
5
21,165
8,796
US Dollar
10
42,329
17,592
US Dollar
15
63,494
26,388
Revaluation
US Dollar
5
(21,165
)
(8,796
)
US Dollar
10
(42,329
)
(17,592
)
US Dollar
15
(63,494
)
(26,388
)
The exposure to the interest rate in the case of Interseguro is shown in Note 29.5(a.3).
F-150
29.3.
Liquidity risk
Liquidity risk consists in the Group’s inability to comply with the maturity of its obligations, thus incurring in losses that significantly affect its equity position. This risk may arise as a result of various events such as: the unexpected decrease of funding sources, and the inability to rapidly settle assets, among others.
The Group has a set of indicators that are controlled and reported daily, which establish the minimum liquidity levels allowed for the short-term and reflect several risk aspects such as: concentration, stability, position by currency, main depositors, etc.
Likewise, the Group assesses medium-term and long-term liquidity through a structural analysis of its funds inflows and outflows in different maturity terms. This process allows to know, for each currency, the various funding sources, how liquidity needs increase and which terms are mismatched. Both for assets and liabilities, assumptions are considered for the operations that do not have determined maturity dates, such as revolving loans, savings and similar ones, as well as contingent liabilities, such as non-used letters of credit or lines of credit. Based on this information, the necessary decisions to maintain target liquidity levels are made.
In the case of Interbank, liquidity is managed by the Vice-Presidency of Capital Markets, which chairs the ALCO Committee, in which positions, movements, indicators and limits on liquidity management are presented. Liquidity risk is supervised by the GIR Committee, defining the risk level that Interbank is willing to take and the corresponding indicators, limits and controls are reviewed. The Market Risk Division is in charge of tracking said indicators. Interbank takes short-term deposits and transforms them into longer-term loans. Therefore, its exposure to liquidity risk increases. Interbank maintains a set of deposits that are historically renewed or maintained, and represent a stable funding source.
In the case of Interseguro, it is exposed to requirements other than their cash resources, mainly claims resulting from their short-term insurance contracts. The Board of Directors of the company establishes limits on the minimum proportion of the maturity funds available to meet these requirements and in a minimum level of lines of credit that must be available to cover claims at unexpected claim levels.
Regarding long-term insurance contracts, considering the types of products offered and the long-term contractual relationship with clients (the liquidity risk is not material) the emphasis is on sufficient availability of flow of assets, and the term matching of the latter with the liability obligations (mathematical technical reserves), for which there are sufficiency and adequacy indicators.
The exposure to the interest rate in the case of Interseguro is shown in Note 29.5(a.2).
In the case of Inteligo Bank, the Board of Directors has established liquidity levels as to the minimum amount of available funds required to meet such requirements and the minimum level of inter-banking facilities and other loan mechanisms that should exist to cover unexpected withdrawals. Inteligo Bank holds a short-term asset portfolio comprised of loans and investments to ensure sufficient liquidity.
Inteligo Bank’s financial assets include unlisted equity investments, which generally are illiquid. In addition, Inteligo Bank holds investments in closed (unlisted) and open-ended investment funds, which may be subject to redemption restrictions, such as “side pockets” and redemption limits. As a result, Inteligo Bank may not be able to settle some of its investments in these instruments in due time to meet its liquidity requirements.
F-151
The following table presents the Group’s undiscounted cash flows payable according to contractual terms agreed (including the payment of future interest):
As of December 31, 2024
Up to 1 month
From 1 to 3 months
From 3 to 12 months
From 1 to 5 years
Over 5 years
Total
S/(000)
S/(000)
S/(000)
S/(000)
S/(000)
S/(000)
Financial liabilities by type -
Deposits and obligations
39,797,251
5,412,063
6,777,915
925,035
1,256,702
54,168,966
Due to banks and correspondents
1,949,333
792,039
733,189
2,465,292
3,831,777
9,771,630
Bonds, notes and other obligations
70,454
2,943
1,652,261
4,665,178
333,061
6,723,897
Due from customers on acceptances
4,691
4,472
—
—
—
9,163
Insurance and reinsurance contract liabilities
116,089
222,826
1,007,404
4,994,624
18,194,009
24,534,952
Other accounts payable, provisions and other liabilities
2,301,897
115,868
150,913
134,248
1,382,740
4,085,666
Total non-derivative liabilities
44,239,715
6,550,211
10,321,682
13,184,377
24,998,289
99,294,274
Derivatives held for trading (*) -
Contractual amounts receivable (inflow)
1,637,115
880,914
1,123,569
1,134,788
176,817
4,953,203
Contractual amounts payable (outflow)
1,605,814
1,088,989
962,496
1,145,555
179,999
4,982,853
Total
31,301
(208,075
)
161,073
(10,767
)
(3,182
)
(29,650
)
Derivatives held as hedge (**) -
Contractual amounts receivable (inflow)
—
86,992
414,593
1,230,550
—
1,732,135
Contractual amounts payable (outflow)
1,690
78,266
450,019
1,173,525
—
1,703,500
Total
(1,690
)
8,726
(35,426
)
57,025
—
28,635
As of December 31, 2023
Up to 1 month
From 1 to 3 months
From 3 to 12 months
From 1 to 5 years
Over 5 years
Total
S/(000)
S/(000)
S/(000)
S/(000)
S/(000)
S/(000)
Financial liabilities by type -
Deposits and obligations
36,150,590
4,042,302
6,874,724
1,212,870
1,473,786
49,754,272
Inter-bank funds
119,712
—
—
—
—
119,712
Due to banks and correspondents
1,310,020
1,522,550
2,452,158
3,310,756
1,918,633
10,514,117
Bonds, notes and other obligations
24,108
1,153,716
133,232
4,280,041
428,712
6,019,809
Due from customers on acceptances
7,080
19,300
14,185
—
—
40,565
Insurance and reinsurance contract liabilities
—
—
821,389
2,908,106
20,449,732
24,179,227
Other accounts payable, provisions and other liabilities
1,568,886
144,250
156,571
133,382
1,053,107
3,056,196
Total non-derivative liabilities
39,180,396
6,882,118
10,452,259
11,845,155
25,323,970
93,683,898
Derivatives held for trading (*) -
Contractual amounts receivable (inflow)
387,872
479,652
1,261,268
993,514
516,340
3,638,646
Contractual amounts payable (outflow)
387,923
479,288
1,274,079
983,356
514,785
3,639,431
Total
(51
)
364
(12,811
)
10,158
1,555
(785
)
Derivatives held as hedge (**) -
Contractual amounts receivable (inflow)
3,763
4,061
323,273
1,750,880
—
2,081,977
Contractual amounts payable (outflow)
6,215
5,065
390,706
1,759,660
—
2,161,646
Total
(2,452
)
(1,004
)
(67,433
)
(8,780
)
—
(79,669
)
(*) It includes contracts whose future flows agreed to be exchanged are settled on a net basis (non-delivery) and a gross basis (full-delivery).
(**) It only includes contracts whose future flows agreed to be exchanged are settled on a net basis (non-delivery)
F-152
The table below shows maturity, by contractual term, of the contingent credits (indirect loans) granted by the Group as of the dates of the consolidated statement of financial position:
2024
2023
S/(000)
S/(000)
Contingent credits (indirect loans)
Up to 1 month
649,837
1,095,339
From 1 to 3 months
1,364,278
1,062,605
From 3 to 12 months
2,644,655
2,391,145
From 1 to 5 years
409,898
193,835
Over 5 years
26
556
Total
5,068,694
4,743,480
The Group estimates that not all of the contingent loans (indirect) or commitments will be used before the maturity date of the commitments.
The following table shows the changes in liabilities arising from financing activities according to IAS 7:
2024
Balance as of January 1
Dividends payable
Cash flow
Effect of variation in exchange rate
Others
Balance as of December 31
S/(000)
S/(000)
S/(000)
S/(000)
S/(000)
S/(000)
Inter-bank funds
119,712
—
(121,438
)
1,785
(59
)
-
Bonds, notes and other obligations
5,551,629
—
439,867
67,186
16,751
6,075,433
Lease liability related to right-of-use assets
90,513
—
(55,391
)
102
108,579
143,803
Dividends payable
911
430,425
(430,280
)
—
(98
)
958
Total liabilities for financing activities
5,762,765
430,425
(167,242
)
69,073
125,173
6,220,194
2023
Balance as of January 1
Dividends payable
Cash flow
Effect of variation in exchange rate
Others
Balance as of December 31
S/(000)
S/(000)
S/(000)
S/(000)
S/(000)
S/(000)
Inter-bank funds
30,012
—
91,245
(1,592
)
47
119,712
Bonds, notes and other obligations
7,906,303
—
(2,189,040
)
(131,024
)
(34,610
)
5,551,629
Lease liability related to right-of-use assets
112,581
—
(57,818
)
(279
)
36,029
90,513
Dividends payable
1,461
516,164
(516,564
)
-
(150
)
911
Total liabilities for financing activities
8,050,357
516,164
(2,672,177
)
(132,895
)
1,316
5,762,765
F-153
29.4.
Operational risk
Operational risk is the risk of loss arising from systems failure, human error, fraud or external events. When internal controls fail, operational risks can cause damage to reputation, have legal or regulatory implications, or lead to financial loss. The Group cannot expect to eliminate all operational risks, but through a control framework and by monitoring and responding to potential risks, the Group is able to manage these risks. Controls include mainly the segregation of duties, accesses, authorization and reconciliation procedures, staff training and assessment processes, including the review by Internal Audit.
Management has focused its attention on the implementation of a series of measures aimed to ensure the Group’s workers an optimal environment of information technology systems and cybersecurity systems for the execution of their operations within a mixed labor environment (home or office).
29.5.
Insurance risk management
The risk under an insurance contract, in any of its various forms, is the possibility that the insured event occurs; therefore, uncertainty is realized in the amount of the resulting claim. Given the nature of the insurance contract, this risk is aleatory and; therefore, unpredictable.
Regarding a portfolio of insurance contracts where the theory of large numbers and probabilities for pricing and provisions is applied, the main risk faced by the insurance business of the Group, managed by Interseguro, is that claims and/or payments of benefits covered by the policies exceed the carrying amount of insurance liabilities. This could happen to the extent that the frequency and/or severity of claims and benefits are higher than estimated. The factors that are considered to perform the assessment of insurance risks are the following:
- Frequency and severity of claims;
- Sources of uncertainty in the calculation of payment of future claims;
- Mortality tables for different coverage plans in the life insurance segment;
- Changes in market rates of investments that directly affect the discount rates to calculate mathematical reserves; and
- Specific requirements established by the SBS according to insurance plans.
On the other hand, Interseguro has signed contracts of automatic reinsurance coverage mainly in credit life, retirement and life insurances that protect it from losses due to frequency and severity. The objective of this reinsurance negotiation is that the total net insurance losses do not affect the equity and liquidity of Interseguro. Interseguro’s policy is to sign contracts with companies with international rating determined by SBS rules. Pension contracts do not have reinsurance coverage.
(a)
Life insurance contracts -
Interseguro has developed its insurance underwriting strategy to diversify the type of insurance risks accepted. Factors that aggravate the insurance risk include lack of risk diversification in terms of type and amount of risk and geographic location. The underwriting strategy aims to ensure that underwriting risks are well diversified in terms of type and amount of risk. Underwriting limits serve to implement the selection criteria for appropriate risk. As of December 31, 2024 and 2023, most of the insurance contracts entered into by Interseguro are located in the city of Lima.
The sufficiency of reserves is a principle of insurance management. Technical reserves for claims and premiums are estimated by Interseguro’s actuaries and reviewed by independent experts when deemed necessary.
Interseguro’s Management constantly monitors trends in claims, which allows it to perform estimates of claims incurred but not reported (IBNR) that are supported by recent information.
On the other hand, Interseguro is exposed to the risk that mortality and morbidity rates associated with customers do not reflect the actual mortality and morbidity and may cause the premium calculated for the coverage offered to be insufficient to cover claims. For this reason, Interseguro performs a careful risk selection or underwriting when issuing policies, because by doing so it can classify the degree of risk presented by a proposed insured, analyzing characteristics such as gender, smoking condition, health condition, among others.
In the particular case of pensions, the risk assumed by Interseguro is that the real life expectancy of the insured population is greater than that estimated when determining income, which would mean a deficit of reserves to comply with the payment of pensions.
On the other hand, insurance products do not have particularly relevant terms or clauses that could have a significant impact or represent significant uncertainties over Interseguro’s cash flows.
F-154
(a.1) Insurance risk –
Sensitivity of life insurance contracts and reinsurance contracts -
The following sensitivity analysis shows the impact (gross and net of the reinsurance held) on the contractual service margin (“CSM”), income before taxes and net equity for the reasonably possible movements in the key assumptions, the rest of the assumptions remaining constant. The correlation of the assumptions will have a significant effect on the determination of the final impacts, but to demonstrate the impact resulting from changes in each assumption, the assumptions had to be changed individually. It is worth noting that the movements of these assumptions are non-linear. When options exist, these are the main reason of the sensitivities’ asymmetry. The method used to obtain information of the sensitivity and the significant hypotheses did not vary regarding the previous period.
Life insurance contracts issued
2024
2023
Change in assumptions
Impact on income before taxes, gross of reinsurance
Impact on income before taxes, net of reinsurance
Impact on net equity, gross of reinsurance
Impact on net equity of reinsurance
Impact on income before taxes, gross of reinsurance
Impact on income before taxes, net of reinsurance
Impact on net equity, gross of reinsurance
Impact on net equity of reinsurance
%
S/(000)
S/(000)
S/(000)
S/(000)
S/(000)
S/(000)
S/(000)
S/(000)
Mortality/morbidity rate
+10%
(11,560
)
(9,942
)
(12,038
)
(10,420
)
(13,198
)
(12,808
)
(5,827
)
(5,264
)
Longevity
+10%
(215,592
)
(215,592
)
(179,819
)
(179,819
)
(210,185
)
(210,185
)
(172,323
)
(172,323
)
Expenses
+10%
(38,400
)
(38,274
)
(33,987
)
(33,862
)
(32,980
)
(32,985
)
(28,421
)
(28,426
)
Expiration and abandonment rate
+10%
11,536
10,589
7,267
6,320
11,877
11,699
8,871
8,629
Mortality/morbidity rate
-10%
11,150
10,048
11,470
10,368
13,048
12,642
6,062
5,488
Longevity
-10%
157,253
157,253
125,713
125,713
147,670
147,670
114,215
114,215
Expenses
-10%
38,394
38,330
33,980
33,916
32,960
33,006
28,407
28,453
Expiration and abandonment rate
-10%
(12,300
)
(11,206
)
(7,665
)
(6,571
)
(12,787
)
(12,522
)
(9,367
)
(9,023
)
2024
2023
Change in assumptions
Impact on CSM before taxes, gross of reinsurance
Impact on CSM before taxes, net of reinsurance
Impact on CSM before taxes, gross of reinsurance
Impact on CSM before taxes, net of reinsurance
%
S/(000)
S/(000)
S/(000)
S/(000)
Mortality/morbidity rate
+10%
(32,566
)
(21,822
)
(24,696
)
(17,314
)
Longevity
+10%
(40,650
)
(40,650
)
(37,318
)
(37,318
)
Expenses
+10%
(26,561
)
(26,686
)
(20,613
)
(20,608
)
Expiration and abandonment rate
+10%
(3,941
)
(4,485
)
(1,562
)
(1,972
)
Mortality/morbidity rate
-10%
33,422
22,119
25,277
18,034
Longevity
-10%
75,852
75,852
77,609
77,609
Expenses
-10%
26,543
26,606
20,591
20,544
Expiration and abandonment rate
-10%
4,852
5,480
1,944
2,375
F-155
(a.2) Liquidity risk –
Analysis of maturities of insurance and reinsurance contracts liabilities (present value of the future cash flows) –
The following table summarizes the maturity profile of the portfolios of insurance contracts issued and the portfolios of reinsurance contracts held that are liabilities of the Group, based on the estimations of the present value of the future cash flows that are expected to be paid in the following periods:
2024
Less than 1 year
From 1 to 2 years
From 2 to 3 years
From 3 to 4 years
From 4 to 5 years
More than 5 years
Total
S/(000)
S/(000)
S/(000)
S/(000)
S/(000)
S/(000)
S/(000)
Life insurance contractual liabilities
828,869
662,883
701,260
742,760
787,041
21,797,613
25,520,426
Life reinsurance contractual liabilities
(20,594
)
(1,034
)
(1,075
)
(1,117
)
(1,157
)
(109,120
)
(134,097
)
Other liabilities
98,700
137,306
154,129
164,923
265,832
992,608
1,813,498
Total
906,975
799,155
854,314
906,566
1,051,716
22,681,101
27,199,827
2023
Less than 1 year
From 1 to 2 years
From 2 to 3 years
From 3 to 4 years
From 4 to 5 years
More than 5 years
Total
S/(000)
S/(000)
S/(000)
S/(000)
S/(000)
S/(000)
S/(000)
Life insurance contractual liabilities
849,238
660,864
717,179
751,224
781,239
20,348,966
24,108,710
Life reinsurance contractual liabilities
(27,849
)
(577
)
(589
)
(608
)
(626
)
(38,029
)
(68,278
)
Other liabilities
78,253
83,650
118,419
134,337
141,352
858,734
1,414,745
Total
899,642
743,937
835,009
884,953
921,965
21,169,671
25,455,177
F-156
Analysis of maturities of financial assets (based on non-discounted contractual cash flows) –
The following table summarizes the maturity profile of the Group’s financial assets in function of the non-discounted contractual cash flows, including interest receivable.
2024
Less than 1 year
From 1 to 2 years
From 2 to 3 years
From 3 to 4 years
From 4 to 5 years
More than 5 years
Total
S/(000)
S/(000)
S/(000)
S/(000)
S/(000)
S/(000)
S/(000)
Financial assets
Cash and cash equivalents
—
—
—
—
—
—
—
Investments at fair value through profit or loss
98
98
98
98
98
2,834
3,324
Debt instruments at fair value through other comprehensive income
1,057,660
1,067,828
1,152,885
1,162,798
1,283,365
18,332,782
24,057,318
Investments at amortized cost
—
—
—
—
27,201
—
27,201
Total
1,057,758
1,067,926
1,152,983
1,162,896
1,310,664
18,335,616
24,087,843
2023
Less than 1 year
From 1 to 2 years
From 2 to 3 years
From 3 to 4 years
From 4 to 5 years
More than 5 years
Total
S/(000)
S/(000)
S/(000)
S/(000)
S/(000)
S/(000)
S/(000)
Financial assets
Cash and cash equivalents
—
—
—
—
—
—
—
Investments at fair value through profit or loss
97
97
97
97
97
2,888
3,373
Debt instruments at fair value through other comprehensive income
1,020,609
969,034
991,445
1,079,552
1,064,316
18,247,679
23,372,635
Investments at amortized cost
—
—
—
—
—
27,201
27,201
Total
1,020,706
969,131
991,542
1,079,649
1,064,413
18,277,768
23,403,209
F-157
(a.3) Financial risk –
Exchange rate risk –
It is the risk that the fair value of future cash flows of a financial instrument, assets and/or liabilities of insurance contracts may fluctuate due to changes in the exchange rate.
The main operations of the Group are performed in Soles and their exposure to exchange rate risk arises mainly regarding the US Dollar. The Group’s financial assets are mainly denominated in the same currencies as its insurance contracts liabilities.
The Group partially mitigates the foreign currency risk associated with insurance contracts through the holding of reinsurance contracts denominated in the same currencies as its insurance contractual liabilities.
The following table summarizes the financial assets and the insurance contracts assets and liabilities of the Company by main currency:
2024
2023
US Dollar
Sol
Total
US Dollar
Sol
Total
S/(000)
S/(000)
S/(000)
S/(000)
S/(000)
S/(000)
Financial assets
Cash and cash equivalents
72,053
131,892
203,945
48,899
217,411
266,310
Investments at fair value through profit or loss
372,064
4,585
376,649
300,007
7,029
307,036
Debt instruments at fair value through other comprehensive income
4,205,803
9,062,225
13,268,028
4,159,311
8,286,854
12,446,165
Investments at amortized cost
—
24,838
24,838
—
23,584
23,584
Insurance contracts assets -
Life insurance issued
—
—
—
—
—
—
Life reinsurance held
207
18,395
18,602
166
26,121
26,287
Reinsurance held
—
—
—
—
—
—
Insurance contracts liabilities -
Life insurance issued
3,940,738
8,581,614
12,522,352
3,997,075
8,208,566
12,205,641
Life reinsurance held
—
1,968
1,968
—
1,895
1,895
Reinsurance held
—
—
—
—
—
—
F-158
Interest rate risk
The Group has adopted the option of reflecting in other comprehensive income (“OCI”) the fluctuations in the discount rate applicable to insurance contract liabilities, pursuant to IFRS 17, as well as certain financial instruments that are recorded at fair value through OCI, according to IFRS 9. This accounting strategy allows the mitigation of the volatility in the consolidated statement of income because the interest rate fluctuations do not impact directly on the income for the period. As a whole, these decisions protect the reported financial performance against changes in the market environment.
It is the risk that the fair value or future cash flows of a financial instrument or insurance or reinsurance contract may fluctuate due to changes in the market interest rates. Instruments at variable interest rates expose the Group to cash flow interest risk, while instruments at fixed interest rates expose the Group to fair value risk. There is not any direct contractual relation between financial assets and insurance contracts. However, the Group’s policy on interest rate risk requires it to manage the scope of the net interest rate risk by keeping an adequate combination of instruments at variable and fixed rates to support the insurance contract liabilities. Said policy also requires it to manage the maturity of financial assets that accrue interest. The Group does not have a significant concentration of the interest rate risk. The Group’s exposure to insurance and reinsurance contracts sensitive to interest rate risk and debt instruments is the following:
2024
2023
S/(000)
S/(000)
Insurance contracts assets -
Life insurance issued
—
—
Life reinsurance held
18,602
26,287
Reinsurance held
—
—
Insurance contracts liabilities -
Life insurance issued
12,522,352
12,205,641
Life reinsurance held
1,968
1,895
Reinsurance held
—
—
Debt instruments at fair value through profit or loss
376,649
307,036
Debt instruments at fair value through other comprehensive income
13,268,028
12,446,165
Debt instruments at amortized cost
24,838
23,584
Total
26,212,437
25,010,608
The following analysis is made for the reasonably possible movements of the key variables, the rest of the variables remaining constant, showing the impact on income before taxes and equity. The correlation of the variables will have a significant effect on the determination of the final impact of the interest rate risk, but to demonstrate the impact due to changes in variables, the variables had to be changed individually. It is worth noting that the movements of these variables are non-linear. The method used to obtain information of the sensitivity and the significant variables did not vary regarding the previous period.
2024
2023
Change in basis points
Impact on income before taxes
Impact on equity
Impact on income before taxes
Impact on equity
S/(000)
S/(000)
S/(000)
S/(000)
Insurance and reinsurance contracts
+100
(4,958
)
1,113,771
16,542
1,075,830
Debt instruments
+100
(99
)
(928,453
)
(100
)
(906,268
)
Insurance and reinsurance contracts
-100
6,210
(1,345,914
)
(20,226
)
(1,293,888
)
Debt instruments
-100
115
1,068,856
115
1,048,722
F-159
(b)
Real estate risk management -
Real estate risk is defined as the possibility of losses due to changes or volatility of market prices of properties; see Note 7. Investment properties are held by Interseguro to manage its long-term inflows and match its technical reserves. SBS Resolution No. 2840-2012, dated May 11, 2012, “Regulations on Real Estate Risk Management in Insurance Companies”, requires that insurance companies adequately identify, measure, control and report the real estate risk level they are exposed to.
Additionally, Interseguro has identified the following risks associated with its real estate portfolios:
- The cost to develop a project may increase if there are delays in the planning process; however, Interseguro receives services from advisors to reduce the risks that may arise in the planning process.
- A major lessee may become insolvent thus causing a significant loss in rental income and a reduction in the value of the associated property. To reduce this risk, Interseguro reviews the financial position of all prospective lessees and decides on the appropriate level of safety required, such as lease deposits or guarantees.
- The fair values of the investment property could be affected by the cash flows generated by the tenants and/or lessees, as well as by the economic conditions of Peru and future expectations.
29.6.
Capital management
The Group manages in an active manner a capital base to cover the risks inherent to its activities. Capital adequacy of the Group is monitored by using regulations and ratios established by the different regulators. See Note 16(f).
F-160
30.
Fair value
(a)
Financial instruments measured at their fair value and fair value hierarchy
The following table presents an analysis of the financial instruments that are measured at their fair value, including the level of hierarchy of fair value. The amounts are based on the balances presented in the consolidated statement of financial position.
As of December 31, 2024
Level 1
Level 2
Level 3
Total
S/(000)
S/(000)
S/(000)
S/(000)
Financial assets
Financial investments
At fair value through profit or loss (*)
304,659
459,767
1,012,141
1,776,567
Debt instruments measured at fair value through other comprehensive income
12,722,114
7,655,691
—
20,377,805
Equity instruments measured at fair value through other comprehensive income
406,778
13,850
37,640
458,268
Derivatives receivable
—
143,201
—
143,201
13,433,551
8,272,509
1,049,781
22,755,841
Accrued interest
347,087
Total financial assets
23,102,928
Financial liabilities
Derivatives payable
—
102,288
—
102,288
Liabilities at fair value through profit or loss
61,153
—
—
61,153
Total financial liabilities
61,153
102,288
—
163,441
F-161
As of December 31, 2023
Level 1
Level 2
Level 3
Total
S/(000)
S/(000)
S/(000)
S/(000)
Financial assets
Financial investments
At fair value through profit or loss (*)
329,609
344,155
882,776
1,556,540
Debt instruments measured at fair value through other comprehensive income
11,779,535
9,132,649
—
20,912,184
Equity instruments measured at fair value through other comprehensive income
397,247
10,541
37,090
444,878
Derivatives receivable
—
158,101
—
158,101
12,506,391
9,645,446
919,866
23,071,703
Accrued interest
334,385
Total financial assets
23,406,088
Financial liabilities
Derivatives payable
—
145,395
—
145,395
(*) As of December 31, 2024 and 2023, correspond mainly to participations in mutual funds, and investment funds and shares.
Financial assets included in Level 1 are those measured on the basis of information that is available on the market, to the extent that their quoted prices reflect an active and liquid market and that are available in some centralized trading mechanism, trading agent, price supplier or regulatory entity.
Financial instruments included in Level 2 are valued based on the market prices of other instruments with similar characteristics or with financial valuation models based on information of variables observable in the market (interest rate curves, price vectors, etc.).
Financial assets included in Level 3 are valued by using assumptions and data that do not correspond to prices of operations traded on the market. The valuation requires Management to make certain assumptions about the model variables and data, including the forecast of cash flow, discount rate, credit risk and volatility.
During 2024 and 2023, there were transfers of certain financial instruments from Level 1 to Level 2 for an amount of S/7,995,000 and S/32,577,000, respectively, because they stopped being actively traded during the year, and consequently, fair values were obtained by using observable market data. Likewise, during 2024 and 2023, there were transfers of certain financial instruments from Level 2 to Level 1 for an amount of S/42,195,000 and S/717,011,000, respectively.
During 2024 and 2023, there were no transfers of financial instruments to or from level 3 to level 1 or level 2.
F-162
The table below presents a description of significant unobservable data used in valuation:
Valuation technique
Significant unobservable inputs
Valuation
Sensitivity of inputs to fair value
2024
2023
Private Equity Stocks
Net asset value
NAV
Depends on each investment
Depends on each investment
10 percent increase (decrease) in the NAVs would result in an increase (decrease) in fair value by S/8,096,000 as of December 31, 2024 and S/7,678,000 as of December 31, 2023.
Private equity funds
Net asset value
NAV
Depends on each investment
Depends on each investment
10 percent increase (decrease) in the NAVs would result in an increase (decrease) in fair value by S/93,119,000 as of December 31, 2024 and S/80,597,000 as of December 31, 2023.
Not-listed shares
Equity method
-
According to price risk
According to price risk
5 percent increase (decrease) of the price would result in an increase in fair value of S/1,882,000 as of December 31, 2024 and S/1,854,000 as of December 31, 2023.
The table below includes a reconciliation of fair value measurement of financial instruments classified by the Group within Level 3 of the valuation hierarchy:
2024
2023
S/(000)
S/(000)
Initial balance as of January 1
919,866
977,835
Purchases
81,369
85,777
Sales
(78,231
)
(35,625
)
Gain (loss) recognized on the consolidated statement of income
126,777
(108,121
)
Balance as of December 31
1,049,781
919,866
F-163
(b)
Financial instruments not measured at their fair value -
The table below presents the disclosure of the comparison between the carrying amounts and fair values of the Group’s financial instruments that are not measured at their fair value, presented by level of fair value hierarchy:
As of December 31, 2024
As of December 31, 2023
Level 1
Level 2
Level 3
Fair value
Book value
Level 1
Level 2
Level 3
Fair value
Book value
S/(000)
S/(000)
S/(000)
S/(000)
S/(000)
S/(000)
S/(000)
S/(000)
S/(000)
S/(000)
Assets
Cash and due from banks
12,615,226
—
—
12,615,226
12,615,226
9,818,711
—
—
9,818,711
9,818,711
Inter-bank funds
—
220,060
—
220,060
220,060
—
524,915
—
524,915
524,915
Investments at amortized cost
3,775,935
98,658
—
3,874,593
3,898,198
3,277,672
80,042
—
3,357,714
3,474,004
Loans, net
—
48,333,964
—
48,333,964
49,229,448
—
44,737,995
—
44,737,995
46,520,382
Due from customers on acceptances
—
9,163
—
9,163
9,163
—
40,565
—
40,565
40,565
Other accounts receivable and other assets, net
—
1,588,600
—
1,588,600
1,588,600
—
1,246,480
—
1,246,480
1,246,480
Reinsurance contract assets
—
18,602
—
18,602
18,602
—
26,287
—
26,287
26,287
Total
16,391,161
50,269,047
—
66,660,208
67,579,297
13,096,383
46,656,284
—
59,752,667
61,651,344
Liabilities
Deposits and obligations
—
53,770,487
—
53,770,487
53,768,028
—
49,394,868
—
49,394,868
49,188,234
Inter-bank funds
—
—
—
—
—
—
119,712
—
119,712
119,712
Due to banks and correspondents
—
7,706,223
—
7,706,223
7,562,057
—
9,028,209
—
9,028,209
9,025,930
Bonds, notes and other obligations
5,163,150
838,662
—
6,001,812
6,075,433
4,587,631
708,643
—
5,296,274
5,551,629
Due from customers on acceptances
—
9,163
—
9,163
9,163
—
40,565
—
40,565
40,565
Insurance and reinsurance contract liabilities
—
12,524,320
—
12,524,320
12,524,320
—
12,207,536
—
12,207,536
12,207,536
Other accounts payable and other liabilities
—
4,024,513
—
4,024,513
4,024,513
—
3,056,196
—
3,056,196
3,056,196
Total
5,163,150
78,873,368
—
84,036,518
83,963,514
4,587,631
74,555,729
—
79,143,360
79,189,802
The methodologies and assumptions used to determine fair values depend on the terms and risk characteristics of each financial instrument and they include the following:
(i)
Long-term fixed-rate and variable-rate loans are assessed by the Group based on parameters such as interest rates, specific country risk factors, individual creditworthiness of the customer and the risk characteristics of the financed project. Based on this evaluation, allowances are taken into account for the estimated losses of these loans. As of December 31, 2024 and 2023, the carrying amount of loans, net of allowances, was not significantly different from the calculated fair values.
(ii)
Instruments whose fair value approximates their carrying amount: For financial assets and financial liabilities that are liquid or have short-term maturity (less than 3 months) it is assumed that the carrying amounts approximate to their fair values. This assumption is also applied to demand deposits, savings accounts without a specific maturity and variable-rate financial instruments.
(iii)
Fixed-rate financial instruments: The fair value of fixed-rate financial assets and financial liabilities at amortized cost is determined by comparing market interest rates when they were first recognized with current market rates related to similar financial instruments for their remaining term to maturity. The fair value of fixed interest-rate deposits is based on discounted cash flows using market interest rates for financial instruments with similar credit risk and maturity. For quoted debt issued, the fair value is determined based on quoted market prices. When quotations are not available, a discounted cash flow model is used based on the yield curve of the appropriate interest rate for the remaining term to maturity.
F-164
31.
Fiduciary activities and management funds
The Group provides custody, trustee, investment management and advisory services to third parties; therefore, the Group makes purchase and sale decisions in relation to a wide range of financial instruments. Assets that are held as trust are not included in the consolidated financial statements. These services give rise to the risk that the Group could eventually be held responsible for poor yielding of the assets under its management.
As of December 31, 2024 and 2023, the value of the managed off-balance sheet financial assets is as follows:
2024
2023
S/(000)
S/(000)
Investment funds
19,534,337
17,829,262
Mutual funds
7,926,478
5,352,241
Total
27,460,815
23,181,503
32.
Subsequent events
On January 27, 2025, Interbank issued subordinated bonds called “6.397% Subordinated Notes” for an amount of US$350,000,000, under Rule 144-A and/or Regulation S of the U.S. Securities Act of 1933 of the United States of America. This issuance has maturity in January 2035 and the agreed annual interest rate was 6.397 percent.
On March 31, 2025, IFS’s shareholders approved a new Share Repurchase Program for an amount of up to US$100,000,000 of IFS’ common shares, which is expected to continue until terminated by the Board of Directors. The share repurchase program may be carried out simultaneously in the Lima Stock Exchange and the New York Stock Exchange (“NYSE”) in one or several dates, at market prices.