| • | Implementation of the Fondo de Apoyo Empresarial a las MYPE, a S/800 million fund to support SMEs, in addition to approximately S/1,100 million available from the Fondo Crecer, another fund with a similar purpose; |
| • | Postponement of income tax payments by companies and households; |
| • | Subsidies of 35% of companies’ payrolls (for employees with salaries up to S/1,500); and |
| • | Launch of the Reactiva Peru program and related loan rescheduling schemes. |
In August 2021, the Central Reserve Bank of Peru started tightening its monetary policy, similar to other monetary authorities around the world. As of December 31, 2021, the reference interest rate was 2.50%.
Business Lines
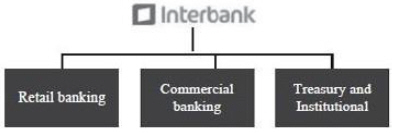
Interbank has three business lines: (1) retail banking, (2) commercial banking and (3) treasury and institutional.
Retail Banking
Interbank’s retail banking business line provides a variety of financial products and services to individuals including retail loans and retail deposits. Interbank’s retail banking strategy consists of providing the best customer experience through convenient, agile and friendly service. Interbank’s key objectives include increasing its market share in its core products through acquiring new clients, increasing its share of wallet and cross-selling products to its existing customers. Interbank seeks to meet the financial service needs of Peru’s growing middle class. Interbank believes the retail banking sector presents significant opportunities to continue to grow and sustain high margins, while taking on reasonable risk.
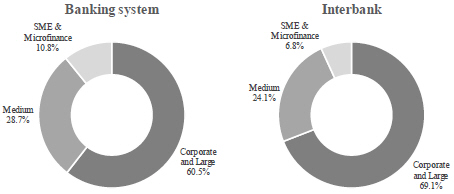
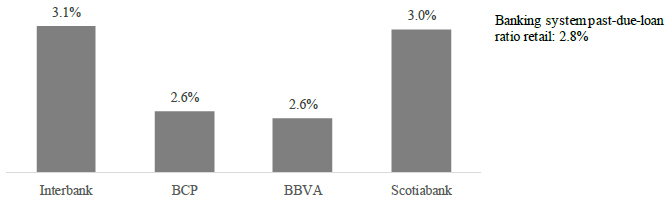
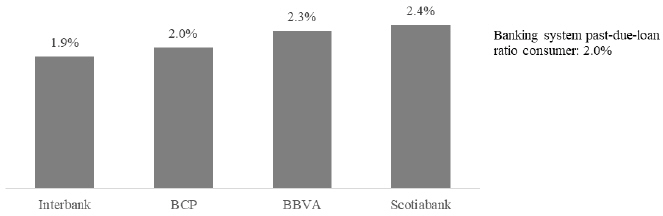
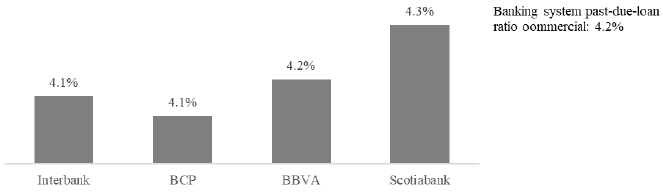
As of December 31, 2021, retail loans represented 49.1% of Interbank’s total loan portfolio outstanding as compared to 31.9% for the Peruvian banking system under SBS GAAP. Furthermore, Interbank’s strategy also seeks to continue capturing
low-cost
funding through a stable and diversified deposit base. The following charts show Interbank’s and the Peruvian banking system’s retail gross loans breakdown according to the SBS as of December 31, 2021. 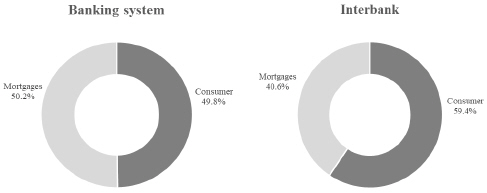
Source: SBS.
60