☒ANNUAL REPORT PURSUANT TO SECTION 13 OR 15(d) OF THE SECURITIES EXCHANGE ACT OF 1934
For the fiscal year ended August 29, 2025
OR
☐TRANSITION REPORT PURSUANT TO SECTION 13 OR 15(d) OF THE SECURITIES EXCHANGE ACT OF 1934
For the transition period from to
Commission File Number 001-38102
PENGUIN SOLUTIONS, INC.
(Exact name of registrant as specified in its charter)
Delaware
36-5142687
(State or other jurisdiction of incorporation or organization)
(I.R.S. Employer Identification No.)
45800 Northport Loop West
Fremont, CA
94538
(Address of Principal Executive Offices)
(Zip Code)
Registrant’s telephone number, including area code: (510) 623-1231
Securities registered pursuant to Section 12(b) of the Act:
Title of each class
Trading Symbol(s)
Name of each exchange on which registered
Common stock, $0.03 par value per share
PENG
Nasdaq Global Select Market
Indicate by check mark if the registrant is a well-known seasoned issuer, as defined in Rule 405 of the Securities Act. Yes ☒ No ☐
Indicate by check mark if the registrant is not required to file reports pursuant to Section 13 or Section 15(d) of the Act. Yes ☐ No ☒
Indicate by check mark whether the registrant (1) has filed all reports required to be filed by Section 13 or 15(d) of the Securities Exchange Act of 1934 during the preceding 12 months (or for such shorter period that the registrant was required to file such reports), and (2) has been subject to such filing requirements for the past 90 days. Yes ☒ No ☐
Indicate by check mark whether the registrant has submitted electronically every Interactive Data File required to be submitted pursuant to Rule 405 of Regulation S-T (§ 232.405 of this chapter) during the preceding 12 months (or for such shorter period that the registrant was required to submit such files). Yes ☒ No ☐
Indicate by check mark whether the registrant is a large accelerated filer, an accelerated filer, a non-accelerated filer, a smaller reporting company, or an emerging growth company. See the definitions of “large accelerated filer,” “accelerated filer,” “smaller reporting company,” and “emerging growth company” in Rule 12b-2 of the Exchange Act.
Large Accelerated Filer
Accelerated filer
Non-accelerated filer
Smaller reporting company
Emerging growth company
☒
☐
☐
☐
☐
If an emerging growth company, indicate by check mark if the registrant has elected not to use the extended transition period for complying with any new or revised financial accounting standards provided pursuant to Section 13(a) of the Exchange Act. ☐
Indicate by check mark whether the registrant has filed a report on and attestation to its management’s assessment of the effectiveness of its internal control over financial reporting under Section 404(b) of the Sarbanes-Oxley Act (15 U.S.C. 7262(b)) by the registered public accounting firm that prepared or issued its audit report. ☒
If securities are registered pursuant to Section 12(b) of the Act, indicate by check mark whether the financial statements of the registrant included in the filing reflect the correction of an error to previously issued financial statements. ☐
Indicate by check mark whether any of those error corrections are restatements that required a recovery analysis of incentive-based compensation received by any of the registrant’s executive officers during the relevant recovery period pursuant to §240.10D-1(b). ☐
Indicate by check mark whether the registrant is a shell company (as defined in Rule 12b-2 of the Act). Yes ☐ No ☒
The aggregate market value of the voting and non-voting common equity held by non-affiliates of the Registrant, based on the closing price of the common stock on the Nasdaq Global Select Market on February 28, 2025 (the last business day of the registrant’s most recently completed second fiscal quarter) was approximately $1.05 billion. Common stock held by each executive officer and director, and their affiliated holders, have been excluded in that such persons may be deemed to be affiliates. This determination of affiliate status is not necessarily a conclusive determination for other purposes.
As of October 15, 2025, the registrant had 52,859,335 shares of common stock outstanding.
DOCUMENTS INCORPORATED BY REFERENCE
Portions of the registrant’s Definitive Proxy Statement for the 2026 Annual Meeting of Stockholders are incorporated herein by reference in Part III of this Annual Report on Form 10-K to the extent stated herein. Such proxy statement will be filed with the Securities and Exchange Commission within 120 days of the registrant’s fiscal year ended August 29, 2025.
This Annual Report on Form 10-K (“Annual Report”) and the documents incorporated herein by reference contain “forward-looking statements” within the meaning of Section 27A of the Securities Act of 1933, as amended (the “Securities Act”), Section 21E of the Securities Exchange Act of 1934, as amended (the “Exchange Act”), and the Private Securities Litigation Reform Act of 1995 that are not historical in nature, that are predictive or that depend upon or refer to future events or conditions. These statements may include, but are not limited to, statements regarding future events or our future financial or operating performance, the extent and timing of, and expectations regarding, our future revenues and expenses and customer demand, statements regarding our objectives and development of our services and capabilities, statements regarding the deployment of our products and services, statements regarding our reliance on third parties, statements regarding our rebranding initiatives and strategy, and statements using words such as “anticipate,” “believe,” “could,” “estimate,” “expect,” “forecast,” “intend,” “plan,” “target,” “commit,” “potential,” “should” and similar words and the negatives thereof. These forward-looking statements are based on our current expectations or forecasts of future events, circumstances, results or aspirations and are subject to a number of significant risks, uncertainties and other factors, many of which are outside of our control, including but not limited to, global business and economic conditions including the impact on the financial condition of our customers, particularly in challenging macroeconomic environments, growth and demand trends in technology industries (including trends and markets related to artificial intelligence (“AI”)), our customer markets and various geographic regions; uncertainties in the geopolitical environment; our ability to manage our cost structure; disruptions in our operations or supply chain as a result of global pandemics, tariffs or other factors; changes in trade regulations and tariffs or adverse developments in international trade relations and agreements; changes in currency exchange rates; overall information technology spending, including changes in customer spending on our products and services; appropriations for government spending; the success of our strategic initiatives including our U.S. Domestication (as defined below) and our ability to realize the anticipated benefits thereof, our rebranding and related strategy, any existing or potential collaborations, and additional investments in new products and additional capacity; acquisitions of companies or technologies and the failure to successfully integrate and operate them or customers’ negative reactions to them; issues, delays or complications in integrating the operations of Storm Private Holdings I Ltd. (together with its subsidiaries, “Stratus Technologies”); the failure to achieve the intended benefits of the sale of SMART Brazil (as defined below) and its business; the impact of and expected timing of winding down the manufacturing and discontinuing the sale of products offered through our Penguin Edge business; limitations on or changes in the availability of supply of materials and components; fluctuations in material costs; the temporary or volatile nature of pricing trends in memory or elsewhere; deterioration in customer relationships; our dependence on a select number of customers and the timing and volume of customer orders and renewals; the impact of customer churn rates, including discounting and churn of significant customers from whom we derive a significant percentage of our revenue; production or manufacturing difficulties; competitive factors; technological changes; difficulties with, or delays in, the introduction of new products; slowing or contraction of growth in the memory market, LED market or other markets in which we participate; changes to applicable tax regimes or rates; changes to the valuation allowance for our deferred tax assets, including any potential inability to realize these assets in the future; prices for the end products of our customers; strikes or labor disputes; deterioration in or loss of relations with any of our limited number of key vendors; the inability to maintain or expand government business; potential sales of our common stock following the end of the lock-up period on the holder of our Issued CPS (as defined below) or the anticipation of such sales; and the continuing availability of borrowings under revolving lines of credit or other debt arrangements and our ability to raise capital through debt or equity financings. These and other risks, uncertainties and factors are described in greater detail under the sections titled “Risk Factors,” “Critical Accounting Estimates,” “Results of Operations,” “Quantitative and Qualitative Disclosures About Market Risk” and “Liquidity and Capital Resources” contained in this Annual Report and the risks discussed in our other SEC filings. Such risks, uncertainties and factors as outlined above and in such filings could cause actual results of Penguin Solutions to be materially different from such forward-looking statements. Accordingly, you are cautioned not to place undue reliance on any forward-looking statements.
The forward-looking statements included in this Annual Report are made only as of the date of this Annual Report. We do not intend, and have no obligation, to update or revise any forward-looking statements in order to reflect events or circumstances that may arise after the date of this Annual Report, except as required by law.
About This Annual Report
On June 30, 2025, we consummated the redomiciliation of the parent company of our corporate group, Penguin Solutions (Cayman), Inc., a Cayman Islands exempted company (formerly known as Penguin Solutions, Inc., “Penguin Solutions Cayman”), from the Cayman Islands to the State of Delaware in the United States, resulting in Penguin Solutions, Inc., a Delaware corporation (“Penguin Solutions Delaware”), becoming our publicly traded
3
parent company (the “U.S. Domestication”). The U.S. Domestication was approved by the shareholders of Penguin Solutions Cayman and effected via a court-sanctioned scheme of arrangement under Cayman Islands law, pursuant to which each ordinary share of Penguin Solutions Cayman was exchanged for one share of common stock of Penguin Solutions Delaware, and each convertible preferred share of Penguin Solutions Cayman was exchanged for one share of convertible preferred stock of Penguin Solutions Delaware.
As used herein, unless stated otherwise or the context requires otherwise, the terms “Penguin Solutions,” “Company,” “Registrant,” “we,” “our,” “us” or similar terms (i) for periods prior to the consummation of the U.S. Domestication, refer to Penguin Solutions Cayman and its consolidated subsidiaries and (ii) for periods at or after the consummation of the U.S. Domestication, refer to Penguin Solutions Delaware and its consolidated subsidiaries. Throughout this Annual Report, we refer to our equity securities (i) for periods prior to the consummation of the U.S. Domestication, as ordinary shares and/or convertible preferred shares and (ii) for periods at or after the consummation of the U.S. Domestication, as shares of common stock and/or shares of convertible preferred stock. For a description of our equity securities following the U.S. Domestication, refer to the “Description of the Registrant’s Capital Stock” filed as Exhibit 4.1 hereto.
The common stock of Penguin Solutions Delaware began trading on The Nasdaq Global Select Market on July 1, 2025 (the first trading day following the U.S. Domestication) under the symbol “PENG”, which is the same symbol under which Penguin Solutions Cayman ordinary shares previously traded.
Our fiscal year is the 52- or 53-week period ending on the last Friday in August. Fiscal years 2025, 2024 and 2023 contained 52, 53 and 52 weeks, respectively. All period references are to our fiscal periods unless otherwise indicated.
Penguin Solutions, Penguin Computing, Penguin Edge, the Penguin Solutions logo, SMART Modular Technologies, SMART, Cree LED, Stratus, Stratus Technologies, and our other trademarks or service marks appearing in this Annual Report are our trademarks or registered trademarks. Trade names, trademarks and service marks of other companies appearing in this Annual Report are the property of their respective holders.
Certain information included herein or elsewhere, such as on our website or related materials, is disclosed in response to certain third-party frameworks or stakeholder expectations. However, such information, even if significant, is not necessarily material for purposes of our SEC filings, even if we use “material” or similar language. Particularly in the sustainability context, “materiality” is subject to multiple definitions that differ from — and are often more expansive than — the definition under U.S. federal securities laws.
4
PART I
Item 1. Business
Overview
At Penguin Solutions, we understand the boundless potential of technology and support our customers in turning cutting-edge ideas into outcomes—faster, and at any scale.
With over two decades of experience as trusted advisors, Penguin Solutions is an end-to-end technology company solving complex challenges in computing, memory and LED solutions. Penguin Solutions designs, builds, deploys and manages high-performance, high-availability enterprise solutions, allowing customers to achieve their breakthrough innovations.
We do this in partnership with our customers—customizing solutions while facilitating rapid time to value, optimized long-term performance, high availability, and greater return on investment.
As of the end of fiscal 2025, Penguin Solutions employed approximately 2,900 employees worldwide, with most located in the United States, China, and Malaysia. We believe that our employees are the cornerstone of our success. To support their efforts, we aim to provide inclusive and equitable workplaces maintained through ongoing intentional actions.
On October 15, 2024, we changed our corporate name from “SMART Global Holdings, Inc.” to “Penguin Solutions, Inc.” and changed our Nasdaq Global Select Market ticker symbol from “SGH” to “PENG.” The changes to the corporate name and ticker symbol did not have any impact on our legal entity structure, financial statements or previously reported financial information.
On June 30, 2025, we consummated the U.S. Domestication of the parent company of our corporate group from the Cayman Islands to the State of Delaware in the United States. For more information about the U.S. Domestication, see “About This Annual Report” above.
Business Segments
The most exciting technological advancements are also the most challenging for companies to adopt. We support our customers in achieving their ambitions across our computing, memory, and LED solutions. With our expert skills, experience and partnerships, we help turn our customers’ most complex challenges into compelling opportunities.
We aim to deliver the highest quality products and services through our customer-centered approach. Drawing on our extensive knowledge in specialized domains, we bring customers new ideas and tailored solutions that can meet their most pressing needs. By combining leading-edge technologies with our unique software and services, we demonstrate our commitment to customer success.
Over the past few years, we have been transforming our business from a holding company structure to a global enterprise solutions provider. As part of this transformation, on October 15, 2024, we rebranded as Penguin Solutions®, reflecting our ongoing commitment to delivering leading-edge solutions that solve the complexity of AI. Along with the update of our company brand, we revised how we describe our business segments. Today we have Advanced Computing, Integrated Memory and Optimized LED.
Divestiture of SMART Brazil
On November 29, 2023, we completed the divestiture of an 81% interest in SMART Modular Technologies do Brasil – Indústria e Comércio de Componentes Ltda. (“SMART Brazil”) to Lexar Europe B.V. (“Lexar Europe”), an affiliate of Shenzhen Longsys Electronics Co. Ltd.
Presentation of SMART Brazil as Discontinued Operations: In accordance with authoritative guidance under U.S. GAAP, we have presented the balance sheets, results of operations and cash flows of SMART Brazil operations in this Annual Report, including in the accompanying consolidated financial statements and notes, as discontinued operations for all periods presented. The SMART Brazil operations were previously reported as part
5
of our Integrated Memory segment. Unless otherwise noted, discussion within this Annual Report relates solely to our continuing operations and excludes the SMART Brazil operations.
See “PART II – Item 8. Financial Statements and Supplementary Data – Notes to Consolidated Financial Statements – Divestiture of SMART Brazil.”
Acquisition of Stratus Technologies
On August 29, 2022, we completed the acquisition of Stratus Technologies. At the closing, we paid a cash purchase price of $225.0 million, subject to certain adjustments. In addition, the seller had the right to receive, and we were obligated to pay, contingent consideration of up to $50.0 million (the “Stratus Earnout”) based on the gross profit performance of the Stratus Technologies business during the first full 12 fiscal months following the closing. In the second quarter of 2024, we paid in full $50.0 million related to the Stratus Earnout. See “PART II – Item 8. Financial Statements and Supplementary Data – Notes to Consolidated Financial Statements – Business Acquisitions – Stratus Technologies.”
Our Products and Services
Advanced Computing
Our Advanced Computing segment offers high-performance and high-availability computing platforms and services that span the continuum from core to edge to cloud. Within our Advanced Computing segment, we offer products under the Penguin Solutions®, Penguin Computing®, Stratus®, and our Penguin EdgeTM product brands. Our Penguin Solutions and Penguin Computing hardware, software, and services focus on technical computing for core and cloud environments via advanced high-performance computing (“HPC”) and AI solutions. With our Stratus product brand, we offer simplified, protected, and autonomous fault-tolerant computing solutions in data centers and at the edge also through hardware, software, and services. We provide these leading-edge advanced computing solutions to customers in the education, energy, financial services, healthcare life sciences, government, hyperscale, and manufacturing markets. Our Advanced Computing segment had net sales of $648.4 million, $554.6 million and $749.7 million in 2025, 2024 and 2023, respectively.
AI and HPC Data Centers
Penguin Solutions designs, builds, deploys, and manages HPC and AI infrastructure solutions that reliably enable the world’s most advanced, data intensive workloads formore than 25 years. Our expert insights and strong relationships with best-in-class compute, networking, storage and software technology partners result in highly efficient and scalable AI systems for our customers. We aim to quickly deliver production-ready AI factories, seamlessly scale them to meet customers’ expanding AI needs, and continually optimize infrastructure performance to maximize customers’ return on investment throughout the lifecycle. We can meet the needs of customers’ specific AI workloads across a broad range of industries from hyperscalers and government agencies to financial services firms and manufacturing companies.
Our solutions include Penguin Solutions OriginAI® — an AI infrastructure solution for customers deploying GPUs at scale (hundreds to thousands of GPUs). OriginAI can accelerate AI deployment and deliver predictable performance. This is achieved through proven, pre-defined architectures integrated with validated technologies and backed by the Penguin Solutions ICE ClusterWare™ software platform and our expert services for designing, building, deploying, and managing AI infrastructure. ICE ClusterWare is a hardware-agnostic, intelligent software platform for managing, scaling, and optimizing AI infrastructure. It provides a unified cluster management environment, combining open-source, industry-standard and third-party tools with Penguin Solutions’ proprietary software innovations. With these solutions and services, we seek to mitigate customers’ AI skill gaps, accelerate their AI deployments, optimize their AI systems, and maximize their return on investment.
Fault Tolerant Computing
Our Stratus brand products are designed to ensure the continuous availability of customers’ critical data and applications in data centers and edge locations. Our Stratus zero-touch computing (ztC) platforms deliver fault tolerance that is simple to install, interoperable with existing systems, manageable by time-constrained IT or OT (operational technology) teams, and protected from interruptions and threats. For over 40 years, our fault tolerant computing solutions have provided reliable and redundant computing that supports Fortune 500 companies as
6
well as small-to-medium sized businesses in securely and remotely turning critical data into actionable intelligence. As a result, IT and OT professionals across financial services, oil and gas, transportation, healthcare, retail and discrete manufacturing rely on our platforms and services to mitigate operational, financial, and reputational risk and support “always on” availability.
Our solutions include the Stratus ztC Endurance™ compute platforms which are designed to deliver 99.99999% availability. The Stratus ztC Endurance and its Automated Uptime Layer with Smart Exchange™ capability delivers intelligent, predictive fault tolerant computing within an easily serviced modular architecture. These platforms evolve from the built-in fault tolerance and proactive health monitoring found in our fully integrated and continuously available Stratus ftServer® platforms. Additionally, the Stratus ftServer V series platforms deliver advanced availability, performance and scalability for high-volume, high-risk transaction processing. The Stratus ztC Edge® platform brings high availability and fault tolerance to IT constrained edge environments, such as retail locations and manufacturing sites, in a secure, highly automated Class 1, Div 2-certified computing platform. Lastly, our Stratus everRun® software protects virtualized workloads on third-party hardware. Our Stratus platforms and software are backed by expert services professionals dedicated to customer success.
Discontinued Computing Solutions
By approximately the end of calendar 2025, we expect to fully discontinue our Penguin Edge product portfolio, which had brought together our SMART Embedded Computing™ (“SMART EC”) and SMART Wireless Computing™ (“SMART Wireless”) brands under the unified Penguin Edge brand. Penguin Edge technology has become obsolete and is only sold to a small number of customers who we expected to phase out the technology. See “PART II – Item 8. Financial Statements and Supplementary Data – Notes to Consolidated Financial Statements – Intangible Assets and Goodwill.”
Integrated Memory
Our Integrated Memory segment solves memory limitations experienced withinhigh-performance, high-availability computing solutions through the design, development, and advanced packaging of specialty memory and storage solutions. Within our Integrated Memory segment, we offer products under the SMART Modular Technologies® product brand. Products include dynamic random access memory (“DRAM”) modules, solid-state/flash storage and other advanced integrated memory solutions critical to networking and telecom, data analytics, AI and ML. Our Integrated Memory segment also offers SMART Supply Chain Services, which provides customized, integrated supply chain services to enable our customers to better manage supply chain planning and execution, reduce costs and increase productivity. Our Integrated Memory segment had net sales of $464.2 million, $356.4 million and $443.3 million in 2025, 2024 and 2023, respectively.
Memory Products
Our SMART Modular Technologies memory solutions have been helping customers across diverse industries and demanding applications—including data centers, networking, industrial automation, rugged environments, and emerging AI and cloud infrastructure. For over 30 years through innovative design, development, and advanced packaging of specialty integrated memory and storage solutions, our solutions have solved complex, cutting-edge memory challenges. Our robust portfolio ranges from today’s leading-edge memory technologies to standard and DRAM and flash storage products, as well as ruggedized and custom memory and storage solutions for diverse applications in a wide range of markets.
We collaborate closely with global original equipment manufacturers (“OEM”) throughout their design process across multiple projects to create solutions for demanding applications with differentiated requirements. This includes unique form factors, with specific firmware, higher density, lower power, specific and greater durability and reliability compared to standard solutions. We are a primary supplier of longer-lifecycle solutions to OEM customers for diverse end markets within industrial, government, networking and communications, enterprise storage and computing as well as other vertical markets. We offer an extensive portfolio of memory products available in standard and rugged form factors.
Our offerings include an extensive lineup of DRAM modules across a variety of DRAM technologies, including legacy synchronous DRAM, double data rate (“DDR”), DDR2, DDR3 and leading-edge, high-performance DDR4 and DDR5 DRAM devices. These technologies are incorporated into standard memory, enterprise memory, and hybrid integrated memory solutions in both standard and rugged formats. Our DRAM modules encompass a broad range of form factors and functions, including dual in-line memory modules (“DIMMs”), differential DIMMs
7
(“DDIMM”), load reduced DIMMs, registered DIMMs, unbuffered DIMMs, small-outline DIMMs, and mini-DIMMs for industrial, government, networking and communications, enterprise storage and computing and other vertical markets. These memory modules come in configurations of up to 288 pins and densities of up to 256 gigabytes. \We utilize advanced printed circuit board and device packaging and stacking technologies to achieve cost-effective, high-density solutions. Our products are designed to meet the quality requirements of enterprise class systems pursuant to the stringent specifications required for various high-speed applications.
Our Integrated Memory segment also offers Zero Failure Rate (“Zefr®”) memory modules to support powerful HPC platforms that process massive amounts of data. A Zefr memory module undergoes a rigid proprietary screening process which is performed on OEM original memory modules or SMART Modular Technologies memory modules to deliver ultra-high reliability for demanding workloads. SMART Zefr aims to deliver the industry’s highest levels of memory uptime and reliability and, for example, enhances the reliability and uptime of our Stratus ztC Endurance platform.
Additionally, we support leading-edge and emerging interconnect standards such as Compute Express Link (“CXL”), an industry standard, open protocol for low latency GPU interconnects. SMART CXL Memory is available as a memory expansion add-in-card (AIC) in our Penguin Solutions Altus® AMD EPYC™ based servers, providing expansive memory for AI workloads.
We also design and manufacture embedded and removable flash memory products in a variety of form factors and capacities, incorporated into storage and hybrid-integrated memory solutions in standard and rugged formats. Our flash memory products include solid-state drives (“SSDs”), Serial Advanced Technology Attachment (SATA) and PCIe NVMe products in 2.5" enclosures, M.2, EDSFF, and other module form factors. We also offer flash component products such as embedded MultiMediaCard and embedded and removable USB products, and SD and microSD Card configurations. Our flash memory capabilities include customized firmware development.
Supply Chain Services
We offer a wide array of supply chain services including procurement, logistics, inventory management, temporary warehousing, programming, kitting and packaging services. We tailor our supply chain service offerings to meet the specific needs of our customers and enable our customers to manage supply chain planning and execution, which reduces costs and increases productivity. Our supply chain services are based on our proprietary software platform, which is then integrated with customers’ procurement management systems as well as our suppliers’ distribution management systems. Our global footprint allows us to provide these services to customers and their manufacturing partners in many regions of the world. In addition, our global inventory management capabilities enable us to manage a vast array of customer and supplier part numbers across worldwide manufacturing and logistics hubs, which helps our customers minimize inventory levels while maintaining reliable delivery and availability of supply.
Optimized LED
Our Optimized LED segment offers a broad portfolio of application-optimized LEDs focused on improving lumen density, intensity, efficacy, optical control and/or reliability. Backed by expert design assistance and superior sales support, our Optimized LED products enable our customers to develop and market LED-based products for lighting, video displays and specialty lighting applications. This segment was formed after our acquisition of Cree LED in March 2021 and offers products under the Cree LED® brand. Our Optimized LED segment had net sales of $256.1 million, $259.8 million, and $248.3 million in 2025, 2024, and 2023, respectively.
Cree LED
For over 30 years, Cree LED has been a leader in LED lighting technology, offering innovative and differentiated LED solutions to a broad base of customers across multiple market segments. The Cree LED product offering includes both chips and packaged LED components.
Our Cree LED chip products include blue and green LED chips based on gallium nitride and related materials. These chips are used in a number of applications and are available in a range of brightness levels, wavelengths (colors) and sizes. Products using our blue and green LED chips can be found in automotive, video displays, gaming displays, heart rate monitors and function indicator lights. Customers also combine our blue LED chips with phosphors to create white LEDs, which are used for indoor and outdoor illumination, medical and industrial applications and automotive interior lighting, indicators, headlamps and daytime running lights.
8
Our Cree LED XLamp®, J Series® and high-brightness product lines feature packaged LED components. The XLamp and J Series components meet a broad range of market needs for lighting applications, including general illumination (both indoor and outdoor applications), portable, architectural, signal and transportation lighting. Our high-brightness LED components consist of surface mount device (“SMD”) and through-hole packaged LED products. Our SMD LED component products are available in a full range of colors and are suitable for a variety of applications, including video, signage, general illumination, transportation, gaming and specialty lighting. Our through-hole packaged LED component products are available in a full range of colors and are primarily designed for the signage market.
Manufacturing and Test
Overview
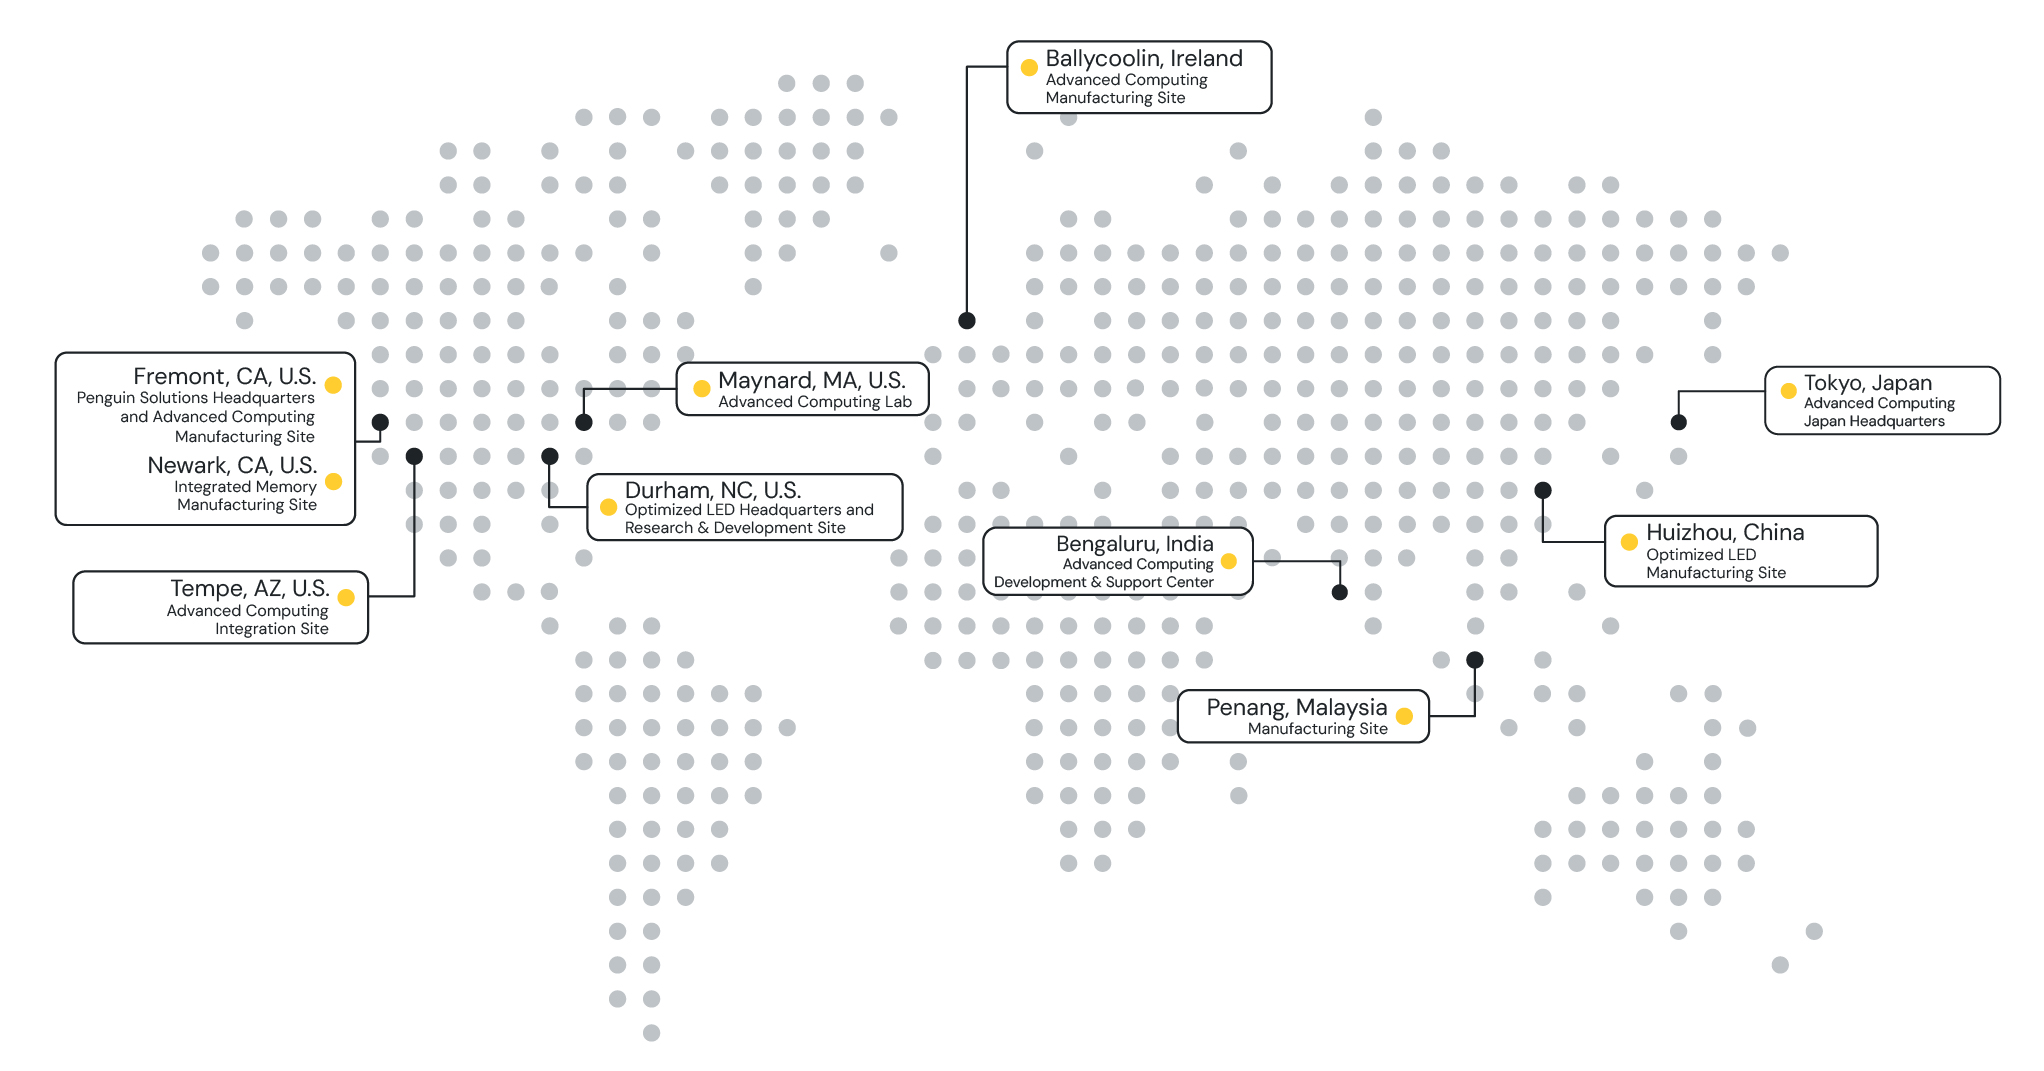
We have manufacturing and testing facilities that support one or more of our business segments, which are primarily located in the United States, Malaysia and China. Our manufacturing facilities in Newark and Fremont, California and Penang, Malaysia, which support our Integrated Memory and Advanced Computing operations, are all certified in one or more of the following: ISO 9001:2015, ISO 14001:2015 and ISO 45001:2018. We also have a manufacturing facility in Huizhou, China for Optimized LED that is ISO9001:2015, ISO14001:2015 and IATF16949:2016 certified. In addition, we have a test and integration facility in Tempe, Arizona for our Penguin Edge product portfolio, which is part of our Advanced Computing business segment. We are a member of the Responsible Business Alliance (“RBA”), and our manufacturing facilities in Malaysia and California currently comply with the RBA Code of Conduct, which increasingly is a business requirement of our customers.
Product testing is an important aspect of our manufacturing operations. We have established substantial technical expertise in the testing of products for high-end applications. Our extensive testing capabilities not only help to ensure a low defect rate but also enable us to sell specialized testing as an additional service. We design customer-specific testing processes that differ from the core focus of standard providers. We have achieved stringent quality targets across a broad spectrum of system applications and customer-specific designs. Our staff includes experienced test engineers who have developed proprietary testing routines and parameters that, when combined with our advanced test equipment, enable us to diagnose problems in components as well as system design, characterize the performance of new products and provide high quality products at volume.
Advanced Computing
Within Advanced Computing, we utilize three primary methods of fulfilling product demand: using third-party contract manufacturers, building products to order based on sourced components, and configuring products to order. In each case, we use components and subassemblies acquired from a wide range of vendors. For our fault tolerant products, we primarily use third-party manufacturers with assembly in our Ireland facility for certain product lines. For our HPC and AI products, we have developed capabilities for design and development of large-scale systems and dense HPC and AI clusters that have significant power and cooling requirements, with manufacturing and testing conducted at our Fremont, California facility. Our extensive experience in manufacturing and validating HPC and AI clusters has equipped us with the playbooks and best practices needed to move quickly. The Penguin Edge products, which are expected to be discontinued by approximately the end of calendar 2025, are manufactured, assembled, and tested at our manufacturing facilities in Newark, California and Tempe, Arizona.
Integrated Memory
Our Integrated Memory manufacturing operations benefit from our many years of design experience and our existing library of proven designs that stress high manufacturability and quality. Over 30 years of manufacturing experience enables us to move quickly to high-volume production of new products, which is paramount in helping our customers achieve rapid time-to-market for their latest innovations. Our design efficiencies, high level of automation and expertise in advanced manufacturing processes power our build-to-order approach and help enable us to achieve high manufacturing yields, reduced direct labor costs and quick turnaround of both small and large production orders.
For certain customers in our Integrated Memory segment, we employ extensive software-based electrical and thermal simulations and test our designs on high-end functional testers utilizing a broad array of test suites. These tests are designed to meet the quality requirements of enterprise-class systems with stringent specifications
9
required for various high-speed and high-compute applications. We also conduct design verification testing of hardware, firmware, system integration and reliability. We continually work to improve our test routines and associated software. For our specialty memory products, we have developed a high-volume, fully automated reliability testing and screening capability that substantially exceeds standard industry practices. These capabilities enable us to reduce the occurrence of early-life failures and weak module fallout, which can save our customers from the significant expenses associated with replacing products that fail after field deployment.
Optimized LED
While we do not own or operate wafer fabrication facilities, we have capabilities for subsequent stages of the product manufacturing cycle. In our manufacturing facilities in Huizhou, China, we receive LED chips from third-party wafer fabrication facilities, prepare and package dies into LED components, test components, and in some cases, assemble components on substrates or printed circuit boards to manufacture LED products. Through our years of investment and experience, we have developed expertise in LED technology that results in brighter, more efficient and lower cost LED chips and components for a broad range of lighting applications.
Customers
We believe that our customers look to us as a strategic partner based on our high-performance, high-availability, application-specific products, quality, technical support and global footprint. We also provide customized, integrated supply chain services for certain customers to assist them with the management and execution of their procurement and distribution processes. We believe our close collaboration with customers, customer-specific designs, long-lifecycle solutions and proprietary supply chain services create significant customer value. Our products are generally manufactured on a build-to-order basis. Our sales are made primarily pursuant to customer purchase orders and are not based on long-term supply agreements.
We sell our products and solutions directly and through third-party channels, including distributors, value-added resellers, independent software vendors and systems integrators, to a diversified base of local and global OEM, enterprise and government customers.
In Advanced Computing, we sell our HPC and AI products to enterprise and government customers in AI cloud services, energy, financial services, hyperscale, and education; fault-tolerant computing products and services to enterprise customers in financial services, telecom, energy, transportation, healthcare, retail and industrial automation; and Penguin Edge products to OEM customers, system integrators and through distribution to government, telecom infrastructure, industrial, network edge computing and transportation.
In our Integrated Memory segment, we sell memory solutions to OEM customers in industrial, government, networking and communications, enterprise storage and compute, and other vertical markets.
Our Optimized LED segment sells LED chips and components to manufacturers and electronic component distributors. We sell our Optimized LED products and solutions using both channel and direct sales to a diverse base of local and global OEM and contract manufacturers that together support a broad range of customers. We also utilize third-party sales representatives that generally do not maintain product inventory. A substantial portion of our Optimized LED products are sold to distributors that stock inventory and sell our products to their customers, which include value-added resellers, manufacturers who incorporate our products into their own manufactured goods and end-users of our products. Like other global semiconductor component suppliers, our Optimized LED segment has historically experienced seasonally lower sales during the earlier part of the calendar year and may see similar trends in the future.
In 2025, 2024, and 2023, sales to our ten largest end customers (including sales to contract manufacturers and original design manufacturers (“ODMs”) at the direction of such end customers) accounted for 66%, 58%, and 60% of total net sales respectively. See “Item 1A. Risk Factors – Risks Related to Our Business – We depend on a select number of customers for a significant portion of our revenue” and “PART II – Item 8. Financial Statements and Supplementary Data – Notes to Consolidated Financial Statements – Concentrations.”
Suppliers
To address the needs of our customers, we have developed and maintained relationships with leading suppliers and contract manufacturers located in Asia, Europe and the Americas. Our semiconductor suppliers include many
10
of the world’s largest memory manufacturers, including Samsung Semiconductor, Inc., Micron Technology, Inc., SK hynix, Inc., International Business Machines Corporation, and Kioxia Holdings Corporation. They also include some of the world’s largest providers of computing, communications and graphics processers, including Intel Corporation (“Intel”), Advanced Micro Devices, Inc. and TD SYNNEX Corporation; as well as providers of subsystems including Intel; networking products including Super Micro Computer, Inc. and Juniper Networks, Inc.; and suppliers of software products. Our contract manufacturers include NEC Corporation, Advantech Co., Ltd. and Celestica Inc. We often work with our suppliers in bidding for customers’ design-in opportunities. We also work closely with our suppliers to better ensure that needed materials are available and delivered on time. Our established global network of materials sourcing is designed to help ensure that our pricing remains competitive and to allow us to provide a stable source of supply for our customers.
We believe that our longstanding relationships with leading suppliers put us in a favorable position to procure sufficient quantities of materials, including during periods of industry shortages. Our flexible and responsive global manufacturing capabilities, inventory management systems and global IT systems allow us to move materials from one site to another in a cost-efficient manner and often deploy what might otherwise be excess inventory among other products and customers. In our Advanced Computing and Integrated Memory segments, we purchase a significant portion of our materials from suppliers on a purchase order basis and generally do not have long-term commitments from our suppliers. Our Optimized LED segment has a number of supply agreements with third-party providers for LED chips in wafer or discrete form.
See “Item 1A. Risk Factors – Risks Related to Our Business – We depend on a small number of sole or limited source suppliers.”
Global macroeconomic headwinds and evolving industry dynamics have contributed to supply constraints across our business segments. These supply challenges, combined with geopolitical factors including tariffs, have increased material costs and, in some cases, affected delivery timelines.
Sales, Support and Marketing
We sell our products both directly and through third-party channels to global OEMs as well as enterprise, government and other end customers located across North America, Asia and Europe. Our sales and marketing efforts are conducted through an integrated process that engages our direct sales force, e-commerce, customer service representatives and on-site field application engineers (“FAE”) alongside a network of independent sales representatives, distributors, integrators and resellers. Larger customers are also often supported by dedicated sales and support teams. Our sales and marketing efforts also include a high level of involvement from our senior executives.
Our on-site FAEs work closely with our sales team to provide product design support to our customers. Our FAEs collaborate with our customers, providing us with insight into their business models and product roadmaps and enabling us to identify early-stage opportunities that can help grow our business. Our integrated sales network and FAEs together allow us to be more responsive to our customers and more successful in navigating each customer’s unique and often complex design qualification and/or bid proposal processes.
Our marketing activities include advertising in technical journals; publishing articles in leading industry periodicals; hosting webinars; publishing white papers, electronic newsletters and blogs; and utilizing direct email solicitation. We participate in many industry trade shows worldwide and have active memberships in a number of industry organizations, including the Joint Electron Device Engineering Council, SD Card Association, Storage Networking Industry Association, CXL Consortium, Trusted Computing Group, Open Compute Project, Sensor Open Systems Architecture Consortium, Peripheral Component Interconnect Special Interest Group and Illuminating Engineering Society.
Research and Development
The timely development of new products and services is essential to maintaining our competitive position. Our primary research and development (“R&D”) activities are conducted at our R&D centers in the United States (Durham, North Carolina; Fremont, California; Irvine, California; Maynard, Massachusetts; Newark, California; Tempe, Arizona and Tewksbury, Massachusetts) and in Huizhou, China; Bangalore, India; New Taipei City, Taiwan; and Penang, Malaysia. Our R&D activities focus on driving innovation in our products and services as well as continuous process improvement for procurement, test and manufacturing.
11
Our research and product development for Advanced Computing includes high-availability server architecture and design, high-availability software development (including virtualization, operating systems and systems management); server selection and occasional design; designs to enable integration of racks and clusters, including power and cooling design, evaluation, and deployment; storage system design and evaluation; high-performance network design; component testing for switches; cables and interface devices; development of software-defined storage systems; and embedded computer boards and systems.
Our product development in Integrated Memory includes innovations for next-generation DRAM products, including DDR5, DRAM, and emerging interconnect standards such as CXL, enterprise memory and flash-based products, as well as associated firmware development. We continue to develop a broad offering of flash-based products for industrial, government, communications and enterprise storage and compute markets. Our engineering team is focused on firmware development, systems engineering and integration, system and platform validation, applications, and product and reliability engineering for new products.
R&D in our Optimized LED segment includes innovations for next-generation LED products, including chips, packages for high-power general illumination, next generation direct-view video displays and specialty applications such as horticulture lighting, architectural, torch and emergency vehicles. We plan to continue R&D focused on the innovation and design of these and other new products that address the needs of our customers, with a focus on faster-growing markets.
Our advanced engineering and design capabilities enable us to address our customers’ increasingly complex needs. We design our products to be compatible with existing industry standards and, where appropriate, develop and promote new standards and provide custom solutions to meet customers’ requirements. An important aspect of our R&D is understanding the challenges presented by our customers’ requirements and addressing them using our industry knowledge, proprietary technologies and technical expertise. By working closely with our customers and suppliers, we are able to deliver technically advanced products designed to meet customer-specific needs with competitive solutions that satisfy our customers’ memory, storage and compute requirements; shorten their time-to-market; and enhance the performance of their end products and applications.
R&D expenses were $79.8 million, $81.5 million and $90.6 million in 2025, 2024 and 2023, respectively. As of August 29, 2025, we had approximately 430 R&D personnel worldwide.
Competition
Our businesses compete with numerous global and local companies. The principal competitive factors in our markets include the ability to meet customer-specific requirements and provide high product quality, strong technical support, technologically advanced products and services, advanced testing capabilities, flexible and global delivery options, reliable supply and reasonable pricing.
Across our Penguin Solutions business segments, our principal competitors include:
•Specialty memory products providers;
•Memory semiconductor manufacturers that also manufacture DRAM modules and Flash products;
•Supply chain service providers, including distributors and third-party logistics providers;
•Compute and storage systems providers;
•Semiconductor and subsystem manufacturers;
•Embedded computing platforms and systems providers;
•Providers of System-on-Modules (SoMs) and Single-Board Computers (SBCs);
•LED product manufacturers;
•Enterprise IT server vendors; and
•Manufacturers of industrial computers.
With respect to our Advanced Computing segment, with our fault tolerant solutions we primarily compete with manufacturers of enterprise servers and industrial computers. Our HPC and AI business competes primarily with global manufacturers of HPC and AI products and services.
Within our Integrated Memory segment, we compete against memory module providers and, to a lesser extent, large semiconductor manufacturers that utilize a portion of their capacity to manufacture memory modules.
12
Within our Optimized LED segment, we compete with companies that manufacture and/or sell nitride-based LED chips as well as manufacturers of LED components concentrated primarily in indoor and outdoor lighting; specialty lighting including torch lamps (flashlights), horticulture and color-changing architectural lighting; signs and signals; and transportation.
Some of our global competitors are large international companies that have substantially greater financial, technical, marketing, distribution and other resources as well as greater name recognition and longer-standing relationships with customers and suppliers than we do. These competitors tend to have limited customization and service capabilities and are generally focused on higher-volume memory, storage, or compute products that are manufactured to industry-standard specifications. We believe that our close collaboration with customers, customer-specific designs, long-lifecycle solutions, superior products and proprietary supply chain services create significant customer loyalty that may provide an advantage when competing against large international companies.
In addition, some of our competitors are also our suppliers or customers. See “Item 1A. Risk Factors – Risks Related to Our Business – We depend on a select number of customers for a significant portion of our revenue” and “– We depend on a small number of sole or limited source suppliers.”
Intellectual Property
Intellectual property is an important aspect of our business. We actively seek to protect and leverage our intellectual property to promote our business interests. As of August 29, 2025, we owned or exclusively licensed approximately 1,650 patents, which are set to expire between 2025 to 2050, and had 442 pending patent applications. We continually review our development efforts to assess the existence and patentability of new intellectual property, which we work to protect as appropriate. We believe the duration and scope of our most relevant patents are sufficient to support our business, which as a whole is not significantly dependent on any particular patent or other intellectual property rights.
To protect our intellectual property, we rely upon a combination of patent, copyright, trade secret and trademark laws; contractual restrictions such as nondisclosure agreements, licenses and intellectual property assignment agreements; and policies and procedures. We pursue the registration of our domain names and trademarks in various jurisdictions and register trademarks in the United States and other countries as warranted. We maintain a policy requiring our employees, contractors, consultants and other third parties to enter into confidentiality and proprietary rights agreements to control access to our proprietary information. Additionally, we actively monitor data on our computer networks to assure compliance with data use policies. However, these laws, procedures and policies provide only limited protection and any of our intellectual property rights may be challenged, invalidated, infringed or misappropriated. Furthermore, the laws of certain countries do not protect proprietary rights to the same extent as the laws of the United States, which means that we may be unable to protect our proprietary technology in certain jurisdictions.
While many of our products contain proprietary aspects and are protected by patents, some of our products are built around mature industry standards and have less patent protection. For these products, we rely on trade secret rights to protect our proprietary interests. The absence of patent protection means that we cannot prevent our competitors from reverse-engineering and duplicating those products. Moreover, some of our product solutions incorporate open source software that is available under public licenses such as the GNU General Public License. We maintain policies and procedures to evaluate open source software used in our products and strive to minimize the risk of our proprietary intellectual property being inadvertently pulled under such licenses.
Human Capital
At Penguin Solutions, we aim to put people first by nurturing a culture that supports creativity and growth. We value our employees and understand the importance of their contributions as well as personal development. We believe that at the best workplaces, employees feel inspired, engaged, valued and included. As part of our “people first” mindset, we are dedicated to advancing our people strategy by developing our talent, maintaining an engaged workforce and offering programs and rewards that attract and retain the best talent. At the core of our people strategy is a commitment to maintaining a safe and inclusive culture where individuals can achieve their highest potential, regardless of background.
13
Employees
As of August 29, 2025, we had approximately 2,900 full-time employees (excluding contractors) in locations across the globe, including in the United States, China and Malaysia. We have never experienced a work stoppage at any of our locations and take pride in our good employee relations.
Employee Engagement and Development
Continuous growth requires ongoing investment in people, innovation and new opportunities. We are always working to improve our communications between employees and management teams in order to advance our company goals and enhance the employee experience. We aim to develop capable leadership that can meet the challenges of business growth while instilling a supportive and inclusive company culture. At all locations, we provide our employees with performance assessments and evaluations. We place a priority on identifying talent throughout the organization and providing them with development and coaching opportunities through our newly adopted annual talent calibration and succession planning process. We also provide employees with access to technical and leadership training and training on workplace culture and enrichment, covering topics such as harassment, healthy work environments, inclusion, and global ethics and compliance.
Inclusion and Belonging
We strive to promote a workforce where individuals feel welcome and included. We know that a sense of belonging can help us to achieve our highest potential, helping to consistently raise the bar and drive innovation forward. This philosophy applies to all levels of our organization, including our executive leadership team and our Board of Directors.
Our commitment to providing employees with an inclusive and nondiscriminatory work environment is outlined in our non-discrimination policy, though for the avoidance of doubt such policy is not incorporated herein by reference. Through this policy, we aim to articulate people-oriented, fair treatment principles for the recruitment, promotion, performance evaluation, compensation, training and retirement of all employees. We have established a council comprised of employees from across the organization focused on creating a working environment that offers equal opportunity employment so that all workers are treated with fairness and respect. The council enables us to expand on our strategy to nurture an inclusive work environment through initiatives such as employee resource groups which are open to individuals regardless of background, and efforts to recruit leadership from the widest pool of eligible talent.
Wellness, Health and Safety
We strive to provide and maintain a safe work environment and prioritize employee well-being throughout our operations. Our wellness program is supported by a committee that provides information and events throughout the year on health as well as mental and financial well-being. We also support mental health and wellness through our Employee Assistance Program, which offers free and confidential counseling and support for our employees and members of their households.
Compensation and Benefits
We offer compensation and benefits programs designed to motivate and reward our employees based on our pay-for-performance philosophy. We are committed to paying market competitive wages to attract key talent and work to help promote pay equality across equal quality and levels of work. Our bonus program links employee compensation to Penguin Solutions’ business performance. We also offer an Employee Stock Purchase Plan, equity compensation, retirement benefits and, in the United States, a 401(k) match program.
Environmental Regulations
Our operations and properties are subject to various federal, state, local, foreign and international environmental laws and regulations that govern, among other things, environmental licensing and registries, protection of flora and fauna, air and noise emissions, use of water resources, wastewater discharges, management and disposal of hazardous and non-hazardous materials and wastes, reverse logistics (take-back policy) and remediation of releases of hazardous materials. We cannot be certain that future identification of environmental concerns or conditions, more vigorous regulatory enforcement, enactment of more stringent laws and regulations or other
14
unanticipated events will not arise in the future. Additionally, certain environmental laws may impose liability without regard to fault or the legality of the original conduct. These developments could give rise to material environmental liabilities and related costs that could have a material adverse effect on our business, financial condition and results of operations.
Available Information
Our address and principal U.S. executive offices are located at 45800 Northport Loop West, Fremont, California 94538 and our telephone number at this address is (510) 623-1231. Our principal website is www.penguinsolutions.com. Information contained on or accessible through our website is not a part of this Annual Report.
Through our website, we make available free of charge our Annual Reports on Form 10-K, Quarterly Reports on Form 10-Q and Current Reports on Form 8-K, and amendments to those reports, filed or furnished pursuant to Sections 13(a) or Section 15(d) of the Exchange Act, as soon as reasonably practicable after they have been electronically filed with, or furnished to, the SEC.
The SEC maintains a website (www.sec.gov) containing reports, proxy and information statements and other information regarding issuers that file electronically with the SEC.
15
Item 1A. Risk Factors
You should carefully consider the risks and uncertainties described below and the other information in this Annual Report, including “PART II – Item 7. Management’s Discussion and Analysis of Financial Condition and Results of Operations” and our consolidated financial statements and related notes. Our business, financial condition or results of operations could be materially and adversely affected if any of these risks occurs and, as a result, the market price of our common stock could decline and you could lose all or part of your investment. As noted above in “Item 1. Business,” the financial results and operations of SMART Brazil have been presented as discontinued operations. While the divestiture of our SMART Brazil business continues to pose certain risks and uncertainties described below, unless otherwise noted, the financial results included in the risks below relate solely to our continuing operations and do not include the operations of SMART Brazil.
This Annual Report also contains forward-looking statements that involve risks and uncertainties. See “Cautionary Note Regarding Forward-Looking Statements” for additional information. Our actual results could differ materially and adversely from those anticipated in these forward-looking statements as a result of certain factors, including the risks facing our company described below and elsewhere in this Annual Report.
Risk Factor Summary
The following is a summary of the principal risks described below in this Annual Report. The following summary should not be considered an exhaustive summary of the material risks facing us, and it should be read in conjunction with the “Risk Factors” section and the other information contained in this Annual Report.
Risks Related to Our Business
•Changing worldwide economic conditions could adversely affect our results of operations and financial condition.
•Our results of operations fluctuate from quarter to quarter, which make them difficult to predict.
•We have experienced losses in the past and may experience losses in the future.
•We compete in historically cyclical markets.
•Fluctuations in average selling prices may have a material adverse effect on our business, results of operations and financial condition.
•Tariffs or other trade restrictions or taxes have had in the past, and could have in the future, an adverse impact on our business, results of operations and financial condition.
•We depend on a select number of customers for a significant portion of our revenue.
•Issues in the development of, our investment in, and use of AI or AI technologies, combined with an uncertain regulatory environment, may result in a material adverse impact on our business
•The markets that we serve are highly competitive.
•We may be unable to optimally match purchasing and production to customer demand, which may have a material adverse effect on our business, results of operations and financial condition.
•Our future success depends on our ability to develop new products and services.
•Our customers often require that our products undergo a lengthy and expensive process of evaluation and qualification without any assurance of net sales.
•If our OEM customers decide to utilize standardized solutions instead of our specialty products, our net sales and market share may decline.
•We depend on a small number of sole or limited source suppliers.
•We may be unable to adapt to technological change or maintain or improve our manufacturing efficiency.
•Disruption of our operations at any one of our manufacturing facilities would substantially harm our business.
•We are subject to a number of procurement laws and regulations.
•Products that fail to meet specifications, are defective or that are otherwise incompatible with end uses could impose significant costs on us.
•Actual or perceived failures or breaches of our information and security systems, or those of our customers, suppliers or business partners, could expose us to losses.
•Actual or perceived non-compliance with applicable data privacy and security laws, or that of our customers, suppliers or business partners, could expose us to losses.
16
•Some of our offerings utilize open source software, which may pose particular risks to our proprietary software, products and services in a manner that could harm our business or make it easier for competitors to enter our markets and compete with us.
•We could be prevented from selling or developing our software if our licenses are not enforceable or are modified so as to become incompatible with other open source licenses.
•Contracts with the U.S. Government may be terminated, cancelled or modified.
•Our indemnification obligations to our customers and suppliers could require us to pay substantial damages.
•We may need to raise additional funds, which may not be available on acceptable terms or at all.
•We have in the past made, and may in the future make, acquisitions, investments and/or alliances, which involve numerous risks.
•We may fail to realize the anticipated benefits of our acquisitions or the sale of our SMART Brazil business.
•We have incurred, and may in the future incur, impairment charges related to our goodwill, which could have a material adverse effect on our business, results of operations and financial condition.
•We may incur liabilities relating to additional Brazilian withholding tax in connection with the sale of our Brazil business.
•The sale of our Brazil business could impair our ability to protect our trademarks and brand.
•If we are not able to maintain, develop and enhance our brand and our reputation, our business and results of operations may be adversely affected.
•We rely on third parties to sell a portion of our products and services.
•We may be unable to protect our intellectual property.
•Legal proceedings and claims could have a material adverse effect on our business, results of operations or financial condition.
•We may be required to pay royalties or obtain licenses to sell certain products.
•The anticipated benefits of the U.S. Domestication may not be realized.
•Changes in tax laws or potential adjustments by tax authorities could materially increase our tax expense, and our ability to use our tax attributes is limited.
•We reversed the valuation allowance for a significant portion of our deferred tax assets in the fourth quarter of 2023, and we may not be able to realize these assets in the future. Our deferred tax assets may also be subject to additional valuation allowances, which could have a material adverse effect on our business, results of operations and financial condition.
•The U.S. Domestication may adversely impact our effective tax rate.
•We could incur substantial costs or liabilities as a result of violations of environmental laws.
•We may be unable to successfully manage environmental or social sustainability initiatives, in whole or in part, which could lead to less opportunity for us to have sustainability investors and partners and could negatively impact our reputation or options for capital acquisition.
•Our worldwide operations, and those of our suppliers, business partners and customers, may be disrupted by events outside of our control, including the effects of climate change, natural disasters, man-made disasters or other events, as well as societal and governmental responses to such events.
Risks Related to Our International Operations
•Our business is subject to the risks generally associated with international business operations.
•We are subject to the taxation requirements of the jurisdictions in which we operate, and if we fail to qualify for certain tax incentives or to comply with local tax regulations, we may suffer financial losses.
•Changes in foreign currency exchange rates could materially adversely affect our business, results of operations or financial condition.
•If enacted, exchange controls may limit our ability to receive dividends and other distributions from our foreign subsidiaries.
•High rates of inflation could have a material adverse effect on our business, results of operations and financial condition.
•We may have limited legal recourse under the laws of China if disputes arise under our agreements with third parties.
Risks Related to Our Debt
•Our indebtedness, and the terms of our debt instruments, including our credit agreement and the agreements governing our Convertible Senior Notes (as defined below) and capped call transactions,
17
could impair our financial condition, harm our ability to operate our business or hinder third-party acquisition attempts, and affect the value of our debt and common stock.
Risks Related to Our Common Stock
•The trading price of our common stock has been and may continue to be volatile, and actual or perceived future sales of our common stock could cause our stock price to fall.
•If our estimates or judgments relating to our critical accounting estimates are based on assumptions that change or prove to be incorrect, our results of operations could fall below expectations of securities analysts and investors, resulting in a decline in the market price of our common stock.
•Anti-takeover provisions contained in our amended and restated certificate of incorporation and amended and restated bylaws, as well as provisions of Delaware law, could delay, defer, discourage, or prevent a takeover attempt.
•We do not anticipate paying any cash dividends on our common stock in the foreseeable future.
•Claims for indemnification by our directors and officers may reduce our available funds to satisfy successful third-party claims against us and may reduce the amount of money available to us.
•Our amended and restated certificate of incorporation contains exclusive forum provisions.
General Risk Factors
•Worldwide economic and political conditions, including terrorist attacks as well as other factors, may adversely affect our operations and cause fluctuations in demand for our products.
Risks Related to Our Business
Changing worldwide economic conditions could adversely affect our results of operations and financial condition.
The United States and global economies are facing increased levels of inflation, higher interest rates and potential recession. Adverse changes in economic conditions could harm our results of operations and financial condition in a variety of ways. For example, regional or global economic downturns could have an impact on the financial condition of our customers, particularly in challenging macroeconomic environments, and adversely affect demand for our products, which could adversely affect our revenue and potentially result in write-offs of excess or obsolete inventory. Inflation could also drive increases in our costs of revenue and operations, which we may not be able to successfully pass along to our customers. Higher interest rates could result in increased cash usage to service our variable rate indebtedness and increase the cost to us of refinancing our indebtedness.
Our results of operations fluctuate from quarter to quarter, which make them difficult to predict.
Our quarterly results of operations have fluctuated in the past and may fluctuate in the future. As a result, our past quarterly results of operations are not necessarily indicative of future performance. Furthermore, we may not be able to maintain the margins we have achieved in recent periods. Our results of operations in any given quarter can be and have been influenced by numerous factors, many of which we are unable to predict or are outside of our control, including:
•the loss of, significant reduction in, or variability in the timing of sales to, or demand from, one or more key customers, which can be affected by factors such as the timing of customer deployments or customer budget considerations;
•customer churn rates, including discounting and churn of significant customers from whom we derive a significant percentage of our revenue;
•changes in customer spending on our products and services;
•the timing, size and effectiveness of our investment in research and development for new and innovative products, including AI solutions;
•the timing, size and effectiveness of our marketing efforts;
•the acquisition of other companies or technologies, the failure to successfully integrate and operate them, or customers’ or suppliers’ negative reactions to them;
•a disruption in, or termination of, our supply relationship with one or more key suppliers;
18
•supply shortages that may impact our ability to manufacture products for our customers and may result in rising prices of the materials we need to manufacture our products;
•our failure to develop new or enhanced products and introduce them in a timely manner;
•the wind down or discontinuation of products, such as products offered through our Penguin Edge business;
•the timing of our entry into new contracts or timing of revenues recognized from our customers, which can be affected by factors such as singular large-scale projects in one period not recurring in subsequent periods or customer decisions as to the completion of delivery and system go-live events; and
•other factors described in this “Risk Factors” section.
Due to the various factors mentioned above and other factors, the results of any prior quarterly or annual period should not be relied upon as an indication of our future operating performance. In one or more future periods, as has happened in the past, our results of operations may fall below the expectations of securities analysts and investors. In that event, the market price of our common stock would likely decline. In addition, the market price of our common stock may fluctuate or decline regardless of our operating performance.
We have experienced losses in the past and may experience losses in the future.
Our business has experienced quarterly and annual operating losses. For example, in 2024,we had a net loss of $52.5 million. Our ability to achieve or maintain profitability depends in part on revenue growth from, among other things, increased demand for our integrated memory solutions, products and related service offerings in our current markets, growth in our Advanced Computing and Optimized LED segments, the performance of our acquired companies, as well as our ability to expand into new markets, including those related to AI. We may not be successful in achieving the revenue and revenue growth necessary to achieve and maintain profitability. Moreover, as we continue to expend substantial funds for research and development projects, enhancements to sales and marketing efforts, integration of acquisitions and to otherwise operate our business, we cannot assure you that we will achieve or maintain profitability on an annual or quarterly basis even if our revenue does grow.
We compete in historically cyclical markets.
Historically, the markets in which we compete have been highly cyclical and have experienced significant downturns often connected with, or in anticipation of, maturing product lifecycles of both component suppliers and electronic equipment manufacturers and/or declines in general economic conditions. These downturns have been characterized by diminished product demand, production overcapacity, high inventory levels and accelerated erosion of selling prices and inventory values. Our business depends on the continued growth of technology utilization, the electronics industry and on end-user demand for our customers’ products. Economic downturns often have had an adverse effect upon manufacturers and end-users of electronics products. The timing of new product developments, the lifecycle of existing electronics products and the level of acceptance and growth of new products can also affect demand for our products. Downturns in the markets we serve could have a significant negative impact on the demand for our products. Additionally, due to changing conditions, our customers have experienced and may in the future experience periods of excess inventory that could have a significant adverse impact on our sales. During a downturn in any of the markets that we serve, there is also a higher risk that some of our trade receivables become delinquent or even uncollectible and that our inventory would decrease in value. We cannot predict the timing or the severity of the cycles within our industries. In particular, it is difficult to predict how long and to what levels any industry upturn or downturn, or general economic strength or weakness, will last or develop. Reduced demand for our products could have a material adverse effect on our business, results of operations and financial condition.
Fluctuations in average selling prices may have a material adverse effect on our business, results of operations and financial condition.
The markets for our Integrated Memory products have historically been characterized by declines in average selling prices. Our average selling prices may decline due to several factors, including general declines in demand for our products and excess supply of DRAM and flash memory components, including as a result of overcapacity. In the past, transitions to smaller design geometries and other factors causing overcapacity in memory markets have led to significant increases in the worldwide supply of memory components. If not accompanied by increases in demand, supply increases usually result in significant declines in component prices and, in turn, declines in the average selling prices and profit margins of our products. During periods of oversupply, our net sales may decline
19
if we fail to increase sales volume of existing products or to introduce and sell new products in quantities sufficient to offset declines in selling prices. Our efforts to increase sales or to introduce new products to offset the impact of declines in average selling prices may not be successful. Furthermore, our competitors and customers also impose significant pricing pressures on us. Declines in average selling prices have in the past had, and may again in the future have, a material adverse effect on our business, results of operations and financial condition. Declines in average selling prices also might enable OEMs to pre-install higher density memory modules into new systems at existing price points, thereby reducing the demand for future memory upgrades. In addition, our net sales and gross profit may be negatively affected by shifts in our product mix during periods of declining average selling prices.
Tariffs or other trade restrictions or taxes have had in the past, and could have in the future, an adverse impact on our business, results of operations and financial condition.
We source a significant portion of our materials from, manufacture products in, and sell products in foreign countries, including China, making the price and availability of our merchandise susceptible to international trade risks and other international conditions. The United States has implemented new tariffs and significant increases and changes to existing tariffs, including on goods from China, and has proposed further changes and new tariffs. In response to such tariffs announced by the United States, other countries have imposed or are considering imposing new or increased tariffs on certain imports from the United States. There is currently significant uncertainty about the future relationship between the United States and other countries with respect to tariffs, trade policies, taxes and other related government regulations, which have and will likely to continue to evolve rapidly and unpredictably, and we cannot predict whether, and to what extent, current tariffs will continue or trade policies will change in the future or their impact on our business. Economic and political uncertainty caused by the U.S. tariffs imposed on goods from China and other countries by the current administration, and any corresponding tariffs and related retaliatory actions or currency devaluations from China or such other countries in response, has negatively impacted and may in the future negatively impact our business. In addition, many of our customers also rely on international trade and may experience impacts similar to our own, which could in turn affect their relationship with us. Furthermore, the imposition of additional tariffs, duties, border adjustment taxes or other trade restrictions by the United States have resulted in the adoption of additional or increased tariffs or other trade restrictions by other countries. Tariffs have in the past increased, and may in the future, increase our cost of materials, particularly within our LED business, and have in the past caused us and may in the future cause us to increase prices to our customers, which we believe may have reduced or may in the future reduce demand for our products. Our price increases or other efforts to address these risks may not be sufficient to fully offset the impact of tariffs and may result in lowering our margin on products sold. The volatility and unpredictability of international trade policies and conditions add further complexity to our operations, making it challenging to forecast and plan effectively. The adoption and expansion of trade restrictions and tariffs, quotas and embargoes, the occurrence or threat of a trade war or other governmental action related to tariffs or trade agreements or policies, has the potential to adversely impact demand for our products, our costs, our customers, our suppliers and the world and U.S. economies, which in turn could have a material adverse effect on our business, results of operations and financial condition.
We depend on a select number of customers for a significant portion of our revenue.
Our principal customers include global distributors, enterprise users, government agencies and OEMs that compete in the computing, networking, communications, storage, aerospace, mobile, industrial automation, Internet of Things (“IoT”), industrial IoT, government, military and lighting markets. In 2025, 2024 and 2023, sales to our ten largest end customers (including sales to contract manufacturers or ODMs at the direction of such end customers) accounted for 66%, 58% and 60% of net sales, respectively. In 2025, 2024 and 2023, we had two, one and one customers account individually for over 10% of our net sales. In some cases, our customers also compete with us and/or are our major suppliers. We expect that sales to relatively few customers, including distributors in our Optimized LED business, will continue to account for a significant percentage of our net sales for the foreseeable future. However, we can provide no assurance that any of these customers or any of our other customers will continue to utilize our products or our services at current levels, or at all, since sales of our products are made primarily pursuant to purchase orders and are not based on long-term supply agreements. The select number of customers from whom we derive a significant percentage of our sales, and the timing and volume of customer orders and renewals, some of which are substantial, may be significantly reduced due to several factors including discounting, churning of significant customers, incorporating work in-house, or reduced spending due to economic pressures among others. Although we have master agreements with some of our
20
customers, these agreements govern the terms and conditions of the relationship and do not typically contain requirements for them to purchase minimum volumes. Because of the uncertainty of the timing, volume and renewals or non-renewals of orders from our customers, sales to our customers have varied from period to period and may vary significantly in the future, and our ability to forecast our sales have been, and may in the future be, difficult. Our customer concentration may also subject us to perceived or actual bargaining leverage that our key customers may have, given their relative size and importance to us. Since a large percentage of our sales is to a small number of customers that are primarily large enterprises or OEMs, these customers are able to exert, have exerted and we expect will continue to exert, pressure on us to make concessions on price and on terms and conditions which can adversely affect our business, results of operations and financial condition. If our key customers seek to negotiate their agreements on terms less favorable to us and we accept such unfavorable terms, such unfavorable terms may have a material adverse effect on our business, results of operations and financial condition. Additionally, our services include point-in-time services, such as design and implementation, as well as longer-term managed services that are typically subject to renewal after an initial term of a year or sometimes longer. Accordingly, unless and until we diversify and expand our customer base, our future success will significantly depend upon the timing and volume of business from our largest customers and the financial and operational success of these customers. Furthermore, many of our customer and supplier markets are characterized by a limited number of large companies. Industry consolidation and company failures could decrease the number of potential significant customers for our products and services. The decrease in the number of potential significant customers will increase our reliance on key customers and, due to the increased size of these companies, may negatively impact our bargaining position and thus our profit margins. If we were to lose one of our key customers or have a key customer cancel a key program or otherwise significantly reduce its volume of business with us or fail to pay us in full for the goods or services purchased from us, our sales and profitability would be materially reduced and our business and financial condition would be seriously harmed.
Issues in the development of, our investment in, and use of AI or AI technologies, combined with an uncertain regulatory environment, may result in a material adverse impact on our business, results of operations and financial condition, reputational harm, liability or other adverse consequences to our business operations.
We are making significant investments in AI initiatives, including designing, building, deploying and managing AI and HPC infrastructure. AI and accelerated computing technologies, markets and related demand trends are complex and rapidly evolving, and we face significant competition from other companies, including companies with greater resources than ours, and an evolving regulatory landscape. If we do not develop and timely offer AI solutions or keep pace with the product offerings of our competitors, or if demand for such products does not grow as anticipated, our business could be adversely affected. We may incur significant costs, invest substantial resources, and experience delays without achieving a return on investment or capitalizing on opportunities presented by AI.
The introduction of AI technologies into our internal business practices and the use of our proprietary software to manage AI compute environments may result in new or enhanced governmental or regulatory scrutiny, litigation, confidentiality or security risks, ethical concerns, or other complications that could materially and adversely affect our business, results of operations or financial condition. Existing laws and regulations may apply to us or our customers or partners in new ways, and new laws and regulations may be instituted, the effects of which are difficult to predict. The intellectual property ownership and license rights, including copyright, surrounding AI technologies has not been fully addressed by courts or national or local laws or regulations, and any use or adoption of third-party AI technologies into our products and services may result in exposure to claims of copyright infringement or other intellectual property misappropriation.
The evolution of the technology industry, including the formation of strategic alliances among major technology companies in the AI sector, can result in rapid and significant changes to market dynamics and the competitive landscape. Failure to anticipate, adapt to, or successfully implement business strategies in response to such industry shifts could affect our ability to serve our customers’ evolving needs, maintain competitive positioning and achieve our business objectives, resulting in a material adverse effect on our business, results of operations and financial condition.
We are working to incorporate generative AI technologies for use by our personnel for internal business purposes, such as software coding tools. These generative AI technologies could generate output that is infringing, and we could be subject to claims or lawsuits, including for infringement of third-party intellectual property rights as a
21
result of the output of such generative AI technologies. While some providers of AI technologies offer to indemnify their end users for any copyright or other intellectual property infringement claims arising from the output of their AI technologies, we may not be successful in adequately recovering our losses in connection with such claims.
In addition, we may experience difficulties in enforcing the intellectual property rights, to the extent we seek to protect output generated using generative AI technologies. The United States Copyright Office has previously denied copyright protection for content generated by AI technologies, and the United States Patent and Trademark Office (the “USPTO”) has similarly stated that an AI tool cannot be an “inventor” of a patent, rendering it impossible to obtain patent protection for inventions created solely by AI technologies. The Supreme Court of the United Kingdom has reached a similar conclusion, stating that AI systems cannot be named as an “inventor” for UK patent law purposes.
The rapid evolution of AI technologies and regulations requires the application of resources to help to ensure that AI is implemented responsibly in order to minimize unintended, harmful impact. There is a risk that AI technologies could produce inaccurate or misleading content or other discriminatory or unexpected results or behaviors, such as hallucinatory behavior that can generate irrelevant, nonsensical, or factually incorrect results, all of which could harm our reputation, business, or customer relationships. The development and use of AI technologies presents emerging ethical and social issues, and if we enable or offer solutions that draw scrutiny or controversy due to their perceived or actual impact on customers or on society as a whole, we may experience brand or reputational harm, competitive harm and/or legal liability.
The markets that we serve are highly competitive.
The markets that we serve are characterized by intense competition. Our competitors include many large domestic and international companies that have substantially greater financial, technical, marketing, distribution and other resources, greater name recognition, broader product lines, lower cost structures and longer-standing relationships with customers and suppliers than we do. As a result, our competitors may be able to respond better to new or emerging technologies, such as generative AI, or standards and to changes in customer requirements. Further, some of our competitors are in better financial and marketing positions from which to influence industry acceptance of a particular product or service standard or competing technology than we are. Our competitors may also be able to devote greater resources to the development, promotion and sale of products and services, and may be able to deliver competitive products and services at a lower price than we can. In addition to competing with certain portions of our product and services offerings, certain of our competitors are also our significant customers, suppliers, or both. Finally, China’s stated national policy to be a global leader in all segments of the semiconductor industry by 2030 has resulted in and may continue to cause increased competitive capability in China.
Across all of our markets, we also expect to face new companies that may enter our existing or future markets with similar or alternative offerings, which may be less costly or provide additional features. We also face competition from current and prospective customers that evaluate our capabilities against the merits of manufacturing products or developing solutions internally. Competition may also arise due to the development of cooperative relationships among our current and potential competitors and/or suppliers or third parties to increase the ability of their offerings to address the needs of our prospective customers. Accordingly, it is possible that new competitors or alliances among competitors and/or suppliers may emerge and acquire significant market share.
Competitive pressure has led in the past and may continue to lead to intensified price competition resulting in lower net sales and lower profit margins which could negatively impact our financial performance. Our efforts to maintain and improve our competitive position, or our failure to do so, could have a material adverse effect on our business, results of operations and financial condition.
We may be unable to optimally match purchasing and production to customer demand, which may have a material adverse effect on our business, results of operations and financial condition.
In most cases we do not obtain long-term purchase orders or commitments from our customers, but instead we work with our customers to develop non-binding estimates or forecasts of future requirements. Utilizing these non-binding estimates or forecasts, we make significant decisions based on our estimates of customer requirements including determining the levels of business that we will seek and accept, production scheduling, component purchasing and procurement commitments, inventory levels, product development or customization, personnel
22
and production facility needs and other resource requirements. Customers may cancel, reduce or delay orders that were either previously made or anticipated, often with little or no notice to us, and generally without penalty, which can result in us having underutilized resources or excess materials. Conversely, customers may require rapid increases in production, which can challenge our resources and can reduce profit margins. We may not have sufficient capacity at any given time to meet our customers’ demands. As many of our costs and operating expenses are relatively fixed, reduction in customer demand has had in the past, and could in the future have, a material adverse effect on our business, results of operations and financial condition.
Additionally, we have had in the past and expect we could again have in the future, inventory write-downs and/or write-offs due to obsolescence, excess quantities (including due to decreased demand) and declines in market value below our costs. In particular, if product obsolescence causes product demand to decrease or we fail to forecast demand accurately, we could be required to write-off inventory or record underutilization charges, which would have a negative impact on our profit margins and our profitability. Any one or more of these occurrences could have a negative impact on our results of operations and financial condition.
Our future success depends on our ability to develop new products and services.
The markets that we serve are subject to rapid technological change, product obsolescence, frequent new product introductions and feature enhancements, changes in end-user requirements, evolving industry standards, and frequent innovations and disruptions in the markets in which we compete for products and services. Our ability to successfully compete and to continue to grow our business depends in significant part upon our ability to develop, introduce and sell new and enhanced products and services on a timely and cost-effective basis, and to anticipate and respond to changing customer requirements and competition. We have invested and expect to continue to invest heavily in research and development for new and innovative products, including AI solutions. In addition, we have invested and expect to continue to invest significant time and capital into developing infrastructure, employee training and marketing efforts to expand our services offerings. However, there can be no guarantee that our evolving business strategy or our efforts will be successful or that our new products or services will gain market acceptance, be price competitive or result in any significant increase in our net sales. If these investments fail to provide the expected returns, then such failure could have a material adverse effect on our business, results of operations and financial condition.
Additionally, we have experienced, and may experience in the future, delays and unanticipated expenses in the development and introduction of new products and services. A failure to develop products with required feature sets or performance standards, or delays in the development, introduction and qualification of new products or services, could significantly reduce our return on investment as well as our net sales, provide a competitor a first-to-market advantage and allow a competitor to achieve greater market share, or cause our customers to cancel their orders (generally without penalty), all of which would have a material adverse effect on our business, results of operations and financial condition.
Our customers often require that our products undergo a lengthy and expensive process of evaluation and qualification without any assurance of net sales.
Our products are often incorporated into customers’ systems at the design stage. We rely on OEM and other customers to select our product designs, which we refer to as design wins, and then to qualify our products for production buys. With OEM and other customers, we often incur significant expenditures in the development of new products without any assurance that the customer will select our products for purchase. Furthermore, even if a customer designs one of our products into its system, we cannot be assured that they will qualify or use our product in production, that the customer’s product will be commercially successful or that we will receive significant orders as a result of that design win or qualification. Generally, our customers are not obligated to purchase our products even if we achieve a design win. If we are unable to achieve design wins or if our customers’ systems incorporating our products are not commercially successful, it could have a material adverse effect on our business, results of operations and financial condition.
In addition, because the qualification process is both product-specific and platform-specific, our existing customers sometimes require us to re-qualify our products, or to qualify our new products, for use in new platforms or applications, which can be time-consuming and cause reductions in our net sales during the design and qualification period. Likewise, when our suppliers discontinue production of components, it may be necessary for us to design and qualify new products for our customers. Such customers may require of us or we may decide to purchase an estimated quantity of discontinued components necessary to help to ensure a steady supply of
23
existing products until products with new components can be qualified. Purchases of this nature may not be available, or they may affect our liquidity. Additionally, our estimation of quantities required during a transition may be incorrect, which could adversely impact our results of operations through lost revenue opportunities or charges related to excess and obsolete inventory.
We must devote substantial resources, including design, engineering, sales, marketing and management efforts, to qualify our products with existing and prospective customers in anticipation of sales. Significant delays in the qualification process could result in an inability to keep up with rapid technological change or new, competitive technologies. If we delay or do not succeed in qualifying a product with an existing or prospective customer, we will not be able to sell that product to that customer, which may result in us losing potential revenue and holding excess or obsolete inventory, any of which may have a material adverse effect on our business, results of operations and financial condition.
If our OEM customers decide to utilize standardized solutions instead of our specialty products, our net sales and market share may decline.
Many of our specialty products are specifically designed for our OEM customers’ systems or products. In an effort to reduce costs, a number of our OEM customers design standardized or commodity components, modules or subsystems into their products. Although we also manufacture standard components, modules and subsystems, an increase in such efforts by our customers could reduce the demand for our higher priced specialized or customized solutions, which in turn would have a significant negative impact on our business, results of operations and financial condition. In addition, when customers utilizing custom solutions choose to adopt a standard instead of custom or specialty components, modules or subsystems, new competitors producing standard components, modules or subsystems may take a portion of our customers’ business previously purchased from us.
We depend on a small number of sole or limited source suppliers.
We are dependent upon a small number of sole or limited source suppliers for certain materials, including certain critical components or subsystems, we use in manufacturing our products. Purchases from our two largest suppliers were $0.6 billion, $0.4 billion and $0.5 billion in each of 2025, 2024 and 2023, respectively. Certain of our suppliers also compete with us in one or more of our markets. We purchase almost all of our materials from our suppliers on a purchase order basis and generally do not have long-term commitments from suppliers. Our suppliers are not required to supply us with any minimum quantities, and there is no assurance that our suppliers will supply the quantities of components we may need to meet our production goals.
The markets in which we operate have in the past experienced, are currently experiencing, and may in the future experience, shortages, long lead times and price fluctuations in certain materials, including certain critical components and raw materials that we use in manufacturing our products. These shortages cause some suppliers to place their customers, including us, on supply allocation. As a result, we may not be able to obtain the materials that we need to fill customer orders in a timely fashion or at all. If any of our suppliers experience quality control or intellectual property infringement problems, this may further impact our ability to fill customer orders. Furthermore, our products that utilize that supplier’s materials may be disqualified by one or more of our customers and we may not be able to fill their orders.
A disruption in or termination of our supply relationship with any of our significant suppliers or our inability to develop relationships with new suppliers, if required, would cause delays, disruptions or reductions in product manufacturing and shipments or require product redesigns which could damage relationships with our customers, increase our costs, reduce our margins or increase the prices we need to charge for our products and could materially and adversely affect our business, results of operations and financial condition.
Additionally, there are increasing expectations in various jurisdictions that companies monitor the environmental and social performance of their suppliers, including compliance with a variety of labor practices, as well as consider a wider range of potential environmental and social matters, including the end-of-life considerations for products. Compliance can be costly, require us to establish or augment programs to diligence or monitor our suppliers, or to design supply chains to avoid certain regions altogether. Failure to comply with such regulations can result in fines, reputational damage, or import ineligibility for our products or product components, or otherwise adversely impact our business, results of operations and financial condition.
24
We may be unable to adapt to technological change.
The industries in which we conduct business are characterized by constant and rapid technological changes and product obsolescence. For example, new manufacturing process technologies using smaller feature sizes and offering better performance characteristics are generally introduced every one to two years. The introduction of new manufacturing process technologies allows us to increase the functionality of our products while at the same time optimizing performance parameters, decreasing power consumption and/or increasing storage capacity. In order to remain competitive, it is essential that we secure the capabilities to develop and qualify new manufacturing process technologies. If we are delayed in transitioning to new technologies, our business, results of operations and financial condition could be materially adversely affected.
If the lifecycle of a product is shortened as a result of the introduction of a new technology, we may be forced to transition our manufacturing capabilities to a new configuration more quickly than originally planned. This can result in increased capital and other expenditures and decreases in demand for the older technology products. As a result, we may be required to record additional obsolescence charges or an impairment on our long-lived assets, including facilities and equipment, as well as intangible assets, which would increase our expenses. When new technologies are introduced, our capacity and the capacity of our suppliers to manufacture the new products often cannot meet the demand or expected timelines, and product shortages or delays can arise. If we or our suppliers cannot support such demand or expected timelines, we may not be able to fill customer orders or participate in new markets as they emerge, and our relationships with customers and our business, results of operations and financial condition could be adversely impacted.
We may not be able to maintain or improve our manufacturing efficiency.
Our manufacturing efficiency can significantly affect our results of operations, and we cannot be sure that we will be able to maintain or increase our manufacturing efficiency to the same extent as our competitors. During periods when we are implementing new process technologies, manufacturing facilities may not be fully productive and may experience higher than acceptable defect rates. We may fail to achieve acceptable yields or may experience product delivery delays as a result of, among other things, capacity constraints, delays in the development of new process technologies, increased defect rates, changes in our process technologies, upgrades or expansion of existing facilities, impurities or other difficulties in the manufacturing process. Any of these occurrences could adversely impact our relationships with customers, cause harm to our reputation in the marketplace, cause customers to move future business to our competitors or cause us to make financial concessions to our customers. Improving our manufacturing efficiency in future periods is dependent on our ability to:
•develop advanced process technologies and advanced products that utilize those technologies;
•successfully transition to more advanced process technologies;
•continue to reduce test times;
•ramp product and process technology improvements rapidly and effectively to commercial volumes across our facilities;
•achieve acceptable levels of manufacturing output and yields, which may decrease as we implement more advanced technologies; and
•maintain our quality controls and rely upon the quality and process controls of our suppliers.
Disruption of our operations at any one of our manufacturing facilities would substantially harm our business.
We rely on a limited number of production facilities for each of our various product lines. A disruption at one of our manufacturing facilities could adversely impact our manufacturing operations and consequently our customer relations and our business. Such a disruption could result from, among other things, severe or chronic weather conditions, including in connection with climate change, local outbreaks of infectious diseases, sustained process abnormalities, government intervention, waste disposal issues, power failures or other circumstances, or from ramp-up related challenges, such as obtaining sufficient raw materials, hiring of qualified factory personnel, installation and efficient operation of new equipment and management and coordination of our logistics networks within our global operations. We maintain insurance to protect against certain claims associated with business interruption, however, our insurance may not cover all or any part of a particular loss. Since a large percentage of our production is done in a small number of facilities, a disruption to operations, or a loss that is in excess of, or
25
excluded from, our insurance coverage could adversely impact our business, results of operations and financial condition.
We are subject to a number of procurement laws and regulations.
With respect to a portion of our business, we must comply with and are affected by laws and regulations relating to the award, administration and performance of government contracts in the United States and other countries. Government contract laws and regulations affect how we do business with our customers and impose certain risks and costs on our business. A violation of specific laws and regulations by us, our employees, others working on our behalf, a supplier or a venture partner, could harm our reputation and result in the imposition of fines and penalties, the termination of our contracts, suspension or debarment from bidding on or being awarded contracts, loss of our ability to export products or services and civil or criminal investigations or proceedings. A termination arising out of our default may expose us to liability and may have a material adverse effect on our ability to compete for future contracts and orders. Additionally, if an audit or investigation uncovers improper or illegal activities, we may be subject to civil or criminal penalties and administrative sanctions, including reductions of the value of contracts, contract modifications or terminations, forfeiture of profits, suspension of payments, penalties, fines and suspension or prohibition from doing business with the government. We could also suffer serious reputational harm if allegations of impropriety were made against us. Similar government oversight exists in most other countries where we conduct business.
Products that fail to meet specifications, are defective or that are otherwise incompatible with end uses could impose significant costs on us.
If our products are defectively manufactured, contain defective components or are used in defective or malfunctioning systems, we could be subject to warranty and product liability claims and product recalls, safety alerts or advisory notices. For example, certain of our products are used in transportation safety devices in the rail industry. These products are certified by independent auditors to safety integrity level 4 standards. In the event that our products fail to perform as expected, accidents and significant losses could occur. While our contracts for the sale of these products typically contain disclaimers, there can be no assurance that we would be insulated from liability in the event of an accident. While we have product liability insurance coverage, it may not be adequate to satisfy claims made against us. We also may be unable to obtain insurance in the future at satisfactory rates or in adequate amounts. Investigations, warranty and product liability claims and product recalls, regardless of their ultimate outcome, could have an adverse effect on our business, financial condition and reputation and on our ability to attract and retain customers. In addition, we may determine that it is in our best interest to accept product returns in circumstances where we are not contractually obligated to do so to maintain good relations with our customers. Accepting product returns may adversely impact our results of operations and financial condition. Further, quality issues in customer installations have occurred in the past and could occur in the future, which have in the past affected, and could possibly affect in the future, customer relationships, demand for products and our reputation. Quality issues and potential impact to our reputation may adversely affect our results of operations and financial condition.
Actual or perceived failures or breaches of our information and security systems, or those of our customers, suppliers or business partners, could expose us to losses.
We rely on computer systems, hardware, software, technology infrastructure and online sites and networks for both internal and external operations that are critical to our business (collectively, “IT Systems”). We own and manage some of these IT Systems but also rely on third parties for a range of IT Systems and related products and services. Additionally, we sometimes provide network connections and system access to customers and vendors to facilitate product builds and collaborative development processes, which creates potential additional attack vectors and potential additional entry points for cybersecurity incidents that could compromise our systems or data.
We and certain of our third-party service providers have experienced cybersecurity incidents, though none have materially impacted our Company, including our operations or financial condition. There can be no guarantee that future cyberattacks or events, whether originating from us, our suppliers or our customers, will not materially impact our Company generally or our IT Systems or data or that of critical service providers specifically. We face numerous and evolving cybersecurity risks that threaten the confidentiality, integrity and availability of our IT Systems and data. Those risks include data security incidents, cybersecurity events, data breaches, ransomware
26
attacks or other compromises of the IT Systems we or that our vendors use to provide services or process data on our behalf, which may lead to compromised network security and misappropriation or compromise of our information or that of third parties, system disruptions or lead to shutdowns. Cyberattack actors include criminal hackers, hacktivists, state-sponsored intrusions, and may involve industrial espionage, employee malfeasance and human or technological error. Computer hackers and others routinely attempt to breach the security of technology products, services and systems, and to fraudulently induce employees, customers and other third parties to disclose information or unwittingly provide access to systems or data. The risk of such attacks includes attempted breaches not only of our own products, services and systems, but also those of customers, contractors, business partners, vendors and other third parties.
Our products, services and systems may be used in critical company, customer, government or other third-party operations, or involve the storage, processing and transmission of sensitive data, including valuable intellectual property, classified information, other proprietary or confidential data, regulated data and personal information of employees, customers and others. In our on-demand and hosted solutions, we process, store and transmit data provided by our customers, which may include sensitive and personal data. We also manage, store, transmit and otherwise process various sensitive personal or confidential data related to our company and our employees in the regular course of business. Successful breaches, employee malfeasance or human or technological error could materially impact our business due to, for example, unauthorized access to, disclosure, modification, misuse, loss or destruction of company, customer, government or other third party data or systems; theft of sensitive, regulated, classified or confidential data including personal information and intellectual property; the loss of access to critical data or systems through distributed denial-of-service attacks, denial-of-service attacks, ransomware attacks, supply chain attacks, destructive attacks or other means; and business delays, service or system disruptions or denials of service. Further, hardware and operating system software and applications that we produce or procure from third parties may contain significant defects in design or manufacture, including “bugs” and other problems that could materially disrupt the operation of such systems. Given the nature of complex systems, software and services like ours, and the scanning tools that we deploy across our networks, infrastructure and products, we regularly identify and track security vulnerabilities. We are unable to comprehensively guarantee patches or confirm that measures are in place to mitigate all such vulnerabilities, or that patches will be applied before vulnerabilities are exploited by a threat actor. If attackers are able to exploit critical vulnerabilities before patches are installed or mitigating measures are implemented, significant compromises could materially impact our and our customers’ systems and data.
The information technology systems we and our vendors use are vulnerable to outages, breakdowns or other damage or interruption from service interruptions, system malfunction, natural disasters, terrorism, war, and telecommunication and electrical failures. For example, in July 2024, a software update by CrowdStrike Holdings, Inc. (“CrowdStrike”), a cybersecurity technology company, caused widespread crashes of Windows systems into which it was integrated. Although we have not experienced any material impacts as a result of the CrowdStrike software update, we have and expect to continue in the future to experience other third-party software- and service-related incidents and/or operational disruptions, which may materially affect our business, results of operations and financial condition.
Cyberattacks are expected to accelerate on a global basis in both frequency and magnitude as threat actors are becoming increasingly sophisticated in using techniques and tools (including AI) that circumvent controls, evade detection and even remove forensic evidence. Further, the use of AI technologies by us, our customers, suppliers, and third-party service providers, among others, introduces unique and/or unknown vulnerabilities. As a result, there can be no assurance that the systems we have designed to protect against cyberattacks, or our cybersecurity risk management program and processes, will be fully implemented, complied with or sufficient to identify, detect or prevent material consequences arising from such attacks in the future. In addition, we have acquired and continue to acquire companies with cybersecurity vulnerabilities and/or unsophisticated security measures, which exposes us to significant cybersecurity, operational, and financial risks.
The costs to address product defects or any of the foregoing security problems and security vulnerabilities before or after a cyber incident could be significant. Remediation efforts may not be successful and could result in interruptions, delays or cessation of service and loss of existing or potential customers that may impede our sales, manufacturing, distribution or other critical functions. We could lose existing or potential customers for outsourcing services or other information technology solutions in connection with any actual or perceived security vulnerabilities in our products. In addition, breaches of our IT Systems or security measures and the unapproved dissemination of proprietary information or sensitive or confidential data about us or our customers or other third parties could expose us, our customers or other third parties affected to a risk of loss or misuse of this
27
information, result in regulatory enforcement, litigation and potential liability, damage our brand and reputation or otherwise harm our business. Further, we rely in certain limited capacities on third-party data management providers and other vendors whose own security vulnerabilities or problems may have similar detrimental effects on us.
Actual or perceived non-compliance with applicable data privacy and security laws, or that of our customers, suppliers or business partners, could expose us to losses.
We are subject to laws, rules and regulations in the United States and other countries relating to the collection, use, transmission, processing and security of user and other data. Our ability to execute transactions and to possess, process, transmit and use personal information and data in conducting our business, for example with respect to our marketing efforts, which include email marketing and telemarketing, subjects us to legislative and regulatory obligations that, among other things, may require us to expend time, financial and other resources to monitor and interpret ever-evolving and complex data privacy and security laws.
In particular, certain states have adopted new or modified privacy and security laws and regulations that may apply to our business, for example, the California Consumer Privacy Act (“CCPA”) imposes obligations on businesses that process personal information of California residents. Among other things, the CCPA: requires disclosures to such residents about the data collection, use and disclosure practices of covered businesses; provides such individuals expanded rights to access, delete and correct their personal information and opt-out of certain transfers of personal information; requires covered businesses enter into specific contractual provisions with service providers that process California resident personal information on the covered business’s behalf; and provides such individuals with a private right of action and statutory damages for data breaches. The enactment of the CCPA has prompted a wave of similar laws being passed in the United States, which creates the potential for a patchwork of overlapping but different state laws. For example, since the CCPA went into effect, comprehensive privacy statutes that share similarities with the CCPA are now in effect and enforceable in numerous states. We cannot predict the full impact of these laws on our business or operations. Many other states are currently reviewing or proposing the need for greater regulation of the collection, sharing, use and other processing of information related to individuals for marketing purposes or otherwise, and there remains increased interest at the federal level as well. Additionally, other jurisdictions outside of the United States have or have recently enacted privacy and cybersecurity laws, such as the United Kingdom and the European Union that have enacted the UK General Data Protection Regulation and the EU General Data Protection Regulation respectively and Brazil which has enacted the Lei Geral de Proteção de Dados, creating the potential for a patchwork of overlapping but different laws.
We have incurred, and will continue to incur, significant expenses to comply with mandatory privacy and security standards and protocols under applicable laws, regulations, industry standards and contractual obligations. Despite such expenditures, we may face regulatory and other legal actions in the event of perceived or actual non-compliance with such applicable obligations. Many of these laws would also require us to notify regulators and customers, employees or other individuals of any data security breach as described above. The various data privacy enactments impose significant obligations and compliance with these requirements depends in part on how particular regulators apply and interpret them. In addition, as a contractor to the Department of Defense (“DoD”), we are contractually required to protect “controlled unclassified information” and comply with DoD cybersecurity requirements, including controls specified in the National Institute of Standards and Technology Special Publication 800-171. The DoD has implemented certain information security requirements and obligations relating to the Cybersecurity Maturity Model Certification (“CMMC”). When incorporated into our contracts or solicitations, we will need to comply with the CMMC and flow down such requirements, as appropriate, to our vendors and suppliers.
The laws, rules and regulations relating to privacy and data security are in some cases relatively new and the interpretation and application of these laws are uncertain. Any failure or perceived failure by us to comply with data privacy laws, rules, regulations, industry standards and other requirements could result in proceedings or actions against us by individuals, consumer rights groups, government agencies or others. We could incur significant costs in investigating and defending such claims and, if found liable, pay significant damages or fines or be required to make changes to our business. Further, these proceedings and any subsequent adverse outcomes may subject us to significant negative publicity and an erosion of trust. If any of these events were to occur, our business, results of operations and financial condition could be materially adversely affected.
28
Some of our offerings utilize open source software, which may pose particular risks to our proprietary software, products and services in a manner that could harm our business.
Many of our Advanced Computing offerings, including Linux-based products and Penguin Solutions’ ClusterWare products, incorporate software components licensed under various open source licenses. Open source software is made available under licenses that in some instances may subject us to certain unfavorable conditions, including requirements that we offer our proprietary software, or portions of our proprietary software, which incorporates or links to such open source software, for no cost, that we make available source code for modifications or derivative works we create based upon, incorporating or using such open source software, and that we license such modifications or derivative works under the terms of the applicable open source licenses. The terms of many open source licenses to which we are subject have not been interpreted by U.S. or foreign courts, and there is a risk that open source software licenses could be construed in a manner that imposes unanticipated conditions or restrictions on our ability to provide or distribute our products or services. We could face claims from third parties claiming ownership of, or demanding release of, the open source software or derivative works that we developed using such software, which could implicate aspects of our proprietary code. These claims could result in litigation and could require us to make our software source code freely available to the public, purchase a costly license or cease offering the implicated products or services. Such claims may require us to re-engineer our offerings to avoid an undesirable open source license or infringement, which may be costly and time-consuming. Additionally, some open source software may include generative AI technologies or other software that incorporates or relies on generative AI models or other AI technologies. The use of such software may expose us to risks as the intellectual property ownership and license rights, including copyrights, surrounding AI technologies, has not been fully interpreted by courts or national or local laws or regulations, and any use or adoption of third-party AI technologies into our products and services may result in exposure to claims of copyright infringement or other intellectual property misappropriation. In addition, the use or modification of third-party generative AI models that are made available under an open source or similar license could introduce inaccuracies or vulnerabilities that we are unable to anticipate, detect, or control. If the licensor for such generative AI technologies developed their models by training on data that was inaccurate, biased or for which it did not have the appropriate rights, we could be subject to claims or lawsuits, including for infringement of third-party intellectual property. In addition, our usage of open-source generative AI technologies may require us to license our data or intellectual property to third parties and limit our ability to protect our intellectual property rights or proprietary data.
In addition to risks related to open source license requirements, usage of open source software can lead to greater risks than use of third-party commercial software. Increased risks arise in part because open source licensors generally do not provide updates, warranties, support, indemnities or other contractual protections regarding infringement claims or the quality of the code, including with respect to security vulnerabilities where open source software may be more susceptible. These third-party open source providers could experience service outages, data loss, privacy breaches, cyberattacks, ransomware and other events relating to the applications and services they provide that could diminish the utility of these services, which could harm our business as a result. To the extent that Advanced Computing offerings depend upon the successful operation and continued updates and support of the open source software it uses, any undetected errors or defects in this open source software could prevent the deployment or impair the functionality of Advanced Computing offerings, delay the release of new product solutions, result in a failure of our offerings and injure our reputation. If open source programmers fail to adequately further develop and enhance open source technologies, we would have to rely on other parties to develop and enhance our offerings or we would need to develop and enhance our offerings with our own resources. We cannot predict whether further developments and enhancements to these technologies would be available from reliable alternative sources. Moreover, if third-party software programmers fail to adequately further develop and enhance open source technologies, the development and adoption of these technologies could be stifled and our offerings could become less competitive. Any of these risks could be difficult to eliminate or manage and, if not addressed, could have a material adverse effect on our business, financial condition and results of operations.
We may also use AI technologies, including tools provided by third parties, to develop or assist in the development of our own software code. While use of such tools could make our development process more efficient, AI technologies have sometimes generated content that is “substantially similar” to open source code on which the AI tool was trained or which is used by the AI tool. If the AI technologies we use generate code that is the same or too similar to open source code, we risk not properly attributing the author of such code, we may not
29
be abiding by the applicable licensing requirements and we may lose protection of our own proprietary code that is commingled with such code.
Open source software may make it easier for competitors, some of which may have greater resources than we have, to enter our markets and compete with us.
One of the characteristics of open source software is that anyone may modify and redistribute the existing open source software and use it to compete with us. Such competition can develop without the degree of overhead and lead time required by traditional proprietary software companies. It is possible for competitors with greater resources than ours to develop their own open source solutions or acquire a smaller business that has developed open source offerings that compete with our offerings, potentially reducing the demand for, and putting price pressure on, our offerings. In addition, some competitors make their open source software available for free download and use on an ad hoc basis or may position their open source software as a loss leader. We cannot guarantee that we will be able to compete successfully against current and future competitors or that competitive pressure and/or the availability of open source software will not result in price reductions, reduced operating margins and loss of market share. Additionally, any failure by us to provide high-quality technical support, or the perception that we do not provide high-quality technical support, could harm our reputation and negatively impact our ability to sell subscriptions for our open source offerings to existing and prospective customers. If we are unable to differentiate our open source offerings from those of our competitors or compete effectively with other open source offerings, our business, financial condition, results of operations and cash flows could be adversely affected.
In our Advanced Computing business, we regularly contribute software source code under open source licenses and have made other technology we developed available under other open licenses, and we include open source software in our products. For example, we have contributed certain technology related to our products to the OCP Foundation, a non-profit entity that shares and develops such information with the technology community, under the Open Web Foundation License. As a result of our open source contributions and the use of open source in our products, we may license or be required to license or disclose code and/or innovations that turn out to be material to our business and may also be exposed to increased litigation risk. As a result of making certain of our technology available to third parties, the value of our brands and other intangible assets may be diminished and competitors may be able to more effectively mimic our products, services and methods of operations which could have an adverse effect on our business and financial results. Likewise, if the protection of our proprietary rights is inadequate to prevent unauthorized use or appropriation by third parties, the value of our brands and other intangible assets may be diminished and competitors may be able to more effectively mimic our products, services and methods of operations. Any of these events could have an adverse effect on our business and financial results.
We could be prevented from selling or developing our software if our licenses are not enforceable or are modified so as to become incompatible with other open source licenses.
A number of our Advanced Computing offerings have been developed and licensed under the GNU General Public License and similar open source licenses. These licenses state that any program licensed under them may be liberally copied, modified and distributed. It is possible that a court would hold these licenses to be unenforceable or that someone could assert a claim for proprietary rights in a program developed and distributed under them. Additionally, if any of the third-party open source components of our offerings may not be liberally copied, modified or distributed, then our ability to distribute or develop all or a portion of our offerings could be adversely impacted. In addition, licensors of open source software employed in our offerings may, from time to time, modify the terms of their license agreements in such a manner that those license terms may become incompatible with other open source licenses in our offerings or our end user license agreement, and thus could, among other consequences, prevent us from distributing the software code subject to the modified license.
Contracts with the U.S. Government may be terminated, cancelled or modified.
Certain of the U.S. Government programs in which we participate as a contractor or subcontractor may extend for several years and include one or more base years and one or more option years. Under some contracts, the government generally has the right not to exercise options to extend or expand our contracts and may otherwise terminate, cancel, modify or curtail our contracts at its convenience. Any decision by a government agency not to
30
exercise contract options or to terminate, cancel, modify or curtail any major programs or contracts would adversely affect our revenues, revenue growth and our ability to achieve or maintain profitability. We may experience periodic performance issues under certain of our contracts. Depending on the nature and value of the contract, a performance issue or termination for default could cause our actual results to differ from those anticipated and could harm our reputation and our results of operations and financial condition.
Our indemnification obligations to our customers and suppliers could require us to pay substantial damages.
A number of our product sales and product purchase agreements provide that we will defend, indemnify and hold harmless our customers and suppliers from damages and costs which may arise from various matters including, without limitation, product warranty claims or claims for injury or damage resulting from defects in, or usage of, our products or the products of our suppliers. In addition, we currently have in effect a number of agreements in which we agree to defend, indemnify and hold harmless our customers and suppliers from damages and costs which may arise from the infringement or alleged infringement by our products of third-party patents, trademarks or other intellectual property rights. We periodically have to respond to claims and may have to litigate indemnification obligations in the future.
Indemnification obligations could require us to expend significant amounts of money to defend claims and/or to pay damages or settlement amounts. We maintain insurance to protect against certain claims associated with the use of our products; however, our insurance may not cover all or any part of a claim asserted against us. Our insurance does not cover intellectual property infringement in most instances. A claim brought against us that is in excess of, or excluded from, our insurance coverage could adversely impact our business, results of operations and financial condition.
We may need to raise additional funds, which may not be available on acceptable terms or at all.
We may need to raise additional funds, which we may seek to obtain through, among other avenues, public or private equity offerings and debt financings. Additional funds may not be available on terms acceptable to us, or at all. If we issue equity or convertible debt securities to raise additional funds, our existing stockholders may experience dilution and the new equity or debt securities may have rights, preferences and privileges senior to those of our then existing stockholders, such as was the case in connection with the issuance of the series of 200,000 shares of preferred stock of Penguin Solutions Delaware, par value $0.03 per share, designated as convertible preferred stock (the “Issued CPS”) as described in more detail in “PART II – Item 8. Financial Statements and Supplementary Data – Notes to Consolidated Financial Statements – Preferred Stock Investment.” If we incur additional debt, it may increase our leverage relative to our earnings or to our equity capitalization, as well as impose financial and operating covenants that could restrict the operations of our business. In a rising interest rate environment, debt financing will become more expensive and may have higher transactional and servicing costs. In addition, our existing indebtedness may limit our ability to obtain additional financing in the future, as discussed in greater detail below under “Risks Relating to Our Debt – Our indebtedness could impair our financial condition and harm our ability to operate our business.”
In 2025, 2024 and 2023, we spent $9.0 million, $19.4 million and $39.4 million, respectively, on capital expenditures, which we used, among other things, to expand manufacturing and test capacity as well as research and development. In the first quarter of 2023, we closed our acquisition of Stratus Technologies. The consideration for this acquisition consisted of approximately $225 million in cash, plus an earnout of up to $50 million based on the gross profit performance of the Stratus Technologies business during the first full 12 fiscal months following the closing of the acquisition. In the second quarter of 2024, we paid in full $50.0 million related to the earnout. We plan to continue exploring additional acquisition opportunities in the future.
If adequate capital is not available when needed, we may be required to modify our business model and operations to reduce spending. This could cause us to be unable to execute our business plan, take advantage of future opportunities or respond to competitive pressures or customer requirements. It may also cause us to delay, scale back or eliminate some or all of our research and development programs, or to reduce or cease operations, which could adversely impact our business, results of operations and financial condition.
31
We have in the past made, and may in the future make, acquisitions, investments and/or alliances, which involve numerous risks.
As part of our business and growth strategy, we have in the past and may in the future acquire or make significant investments in businesses, products or technologies, such as our acquisitions of Stratus Technologies, Cree’s LED business, SMART EC, SMART Wireless and Penguin Computing. Any acquisitions or investments would expose us to the risks commonly encountered in acquisitions of businesses or technologies. Such risks include, among others:
•problems integrating the purchased operations, technologies, systems, processes, products or personnel;
•unanticipated costs or expenses associated with an acquisition or investment, including write-offs of tangible assets as well as goodwill or other intangible assets;
•negative effects on results of operations resulting from an acquisition or investment;
•adverse effects on existing business relationships with suppliers and customers;
•the risk that suppliers (such as Wolfspeed, Inc.) or customers of an acquired business are unable or unwilling to do business with us following the acquisition;
•risks associated with entering markets in which we have little or no prior experience, such as the market for LED products that we entered following our acquisition of Cree’s LED business and markets with complex government regulations;
•loss of key employees of the acquired business; and
•potential risks and liabilities associated with acquired businesses, including intellectual property infringement claims, violations of laws, commercial disputes, tax liabilities, litigation or other claims in connection with the acquired company, including claims from terminated employees, former stockholders or other third parties, and other known and unknown liabilities.
Problems encountered in connection with an acquisition could divert the attention of management, utilize scarce corporate resources and otherwise harm our business. Acquisitions may also lead to increased operational complexity, and effectively streamlining operations and processes of acquired businesses or entities requires management attention and expenditures. To the extent that we make any future acquisitions, we could issue common stock that would dilute our existing stockholders’ percentage ownership, incur substantial additional debt (such as the Purchase Price Note we issued in connection with the acquisition of Cree’s LED business), expend cash and reduce our cash reserves or assume additional liabilities. Furthermore, acquisitions may require material charges and could result in adverse tax consequences, substantial depreciation, deferred compensation charges, liabilities under earnout provisions, the amortization of amounts related to deferred compensation and identifiable purchased intangible assets or impairment of goodwill or other intangibles, any of which could negatively impact our business, results of operations and financial condition. We are unable to predict whether or when any prospective acquisition candidate will become available or the likelihood that any acquisition will be completed. We may expend significant resources and management time pursuing an acquisition that we are unable to consummate, including for reasons outside of our control. Even if we do find suitable acquisition opportunities, we may not be able to consummate the acquisitions on commercially acceptable terms or at all, or may not realize the anticipated benefits of any acquisitions we do undertake, including our acquisition of Cree’s LED business. Our investments in private companies are subject to risk of loss of investment capital. These investments are inherently risky because the markets for the technologies or products they may have under development are typically in the early stages and may never materialize. We could lose our entire investment in these companies.
We may fail to realize the anticipated benefits of our acquisitions.
We closed the acquisition of Stratus Technologies in August 2022. As we continue to integrate this business into our operations and portfolio, our ability to realize some or all of the anticipated benefits of the acquisition may be impacted by the following:
•difficulties in the assimilation and successful integration of the operations, sales functions, technologies, products, systems, processes, personnel and development capabilities;
•failure to maintain and expand the customer bases of our acquired business;
•difficulties in leveraging the Stratus Technologies research and development and product development capabilities to expand our products portfolio;
•our failure to protect and expand their intellectual property and patent portfolios;
•unanticipated costs, including write-offs of tangible assets as well as goodwill or other intangible assets, litigation or other contingent liabilities associated with the acquisition;
32
•the diversion of management’s attention from other business concerns;
•adverse effects on existing business relationships with suppliers and customers;
•risks associated with entering markets in which we have little or no prior experience and markets with complex government regulations; and
•loss of key employees of the acquired business.
Any of these risks or other risks arising from the integration of Stratus Technologies’ business into our operations could have a material adverse effect on our business, financial condition or results of operations and could cause the impact of the acquisition to be dilutive to our company.
We have incurred, and may in the future incur, impairment charges related to our goodwill, which could have a material adverse effect on our business, results of operations and financial condition.
We have a significant amount of goodwill. As of August 29, 2025, we had goodwill of $145.9 million, which represented 9% of our total assets as of such date. This balance reflects the recent charges recognized for the full impairment of goodwill associated with our Penguin Edge business under our Advanced Computing segment. The carrying value of goodwill may be reduced if we determine that goodwill is impaired. We test goodwill for impairment in the fourth quarter of each year, or more frequently if indicators of an impairment exist, to determine whether it is more likely than not that the fair value of a reporting unit is less than its carrying value. The testing of goodwill for impairment requires us to make significant estimates about future performance and cash flows, as well as other assumptions. These estimates can be affected by numerous factors, including potential changes in economic, industry or market conditions; changes in business operations; changes in competition or changes in the price of our common stock and market capitalization and other relevant events and factors affecting the fair value of the reporting unit. Changes in these factors, or changes in actual performance compared with estimates of our future performance, may affect the fair value of goodwill and could result in an impairment charge.
We may incur liabilities relating to additional Brazilian withholding tax in connection with the sale of our Brazil business.
In connection with the sale of a majority of our interest in SMART Brazil to Lexar Europe, Lexar Europe withheld (from the purchase price otherwise payable to us) Brazilian capital gains tax (Iposto de Renda na Fonte Sobre Ganho de Capital), with such tax being imposed on the excess of the purchase price over our tax basis in the SMART Brazil equity interests sold by us. The calculation of tax basis was based on our interpretation of current Brazilian law. We believe our interpretation and calculations are correct, but if the Brazilian tax authorities were to successfully challenge our determination of the amount of withholding tax due, we would be required to indemnify Lexar Europe in respect of any additional withholding taxes (together with any interest and penalties imposed). The amount of such additional withholding taxes and our liability in respect of such taxes could be substantial.
We may not achieve the intended benefits of the sale of our Brazil business.
We may not realize some or all of the anticipated benefits from the sale of our Brazil business and such failure to realize anticipated benefits could have a material adverse effect on our business, financial condition or results of operations.
The sale of our Brazil business could impair our ability to protect our trademarks and brand.
In connection with the sale of our SMART Brazil business, we permitted Lexar Europe and the divested businesses to use of the word “SMART” in combination with pre-approved words and logos in trademarks, domain names, logos and other source identifiers solely in Brazil (the “New Marks”).To prevent potential consumer confusion and protect our brands, and as a closing condition to the sale of our SMART Brazil business, we entered into an agreement with Lexar Europe and the divested subsidiaries that includes a number of restrictions on Lexar Europe’s and the divested business’ use of the New Marks, including that: (i) the New Marks may not be used outside of Brazil or in connection with products that will be consumed or exported outside of Brazil, (ii) the New Marks may only be used in connection with certain business and products, (iii) the word “SMART” may not be used alone as a brand name or source identifier and (iv) the New Marks must comply with certain font, style, format and color restrictions to avoid similarity with our logos.
33
While we have the foregoing contractual protections, there are no assurances (i) that Lexar Europe and the divested businesses will adhere to the contract or (ii) that customers or potential customers of our products and of Lexar Europe’s and its affiliates’ products will not have confusion as to source given the joint use of “SMART,” which could lead to dilution of our rights in our “SMART” marks and/or reputational harm. If disputes arise in the future with respect to the contractual restrictions, we may not be able to successfully resolve these types of conflicts to our satisfaction. Although we changed our name from SMART Global Holdings, Inc. to Penguin Solutions, Inc. on October 15, 2024, the “SMART” brand is critical to our business and any consumer confusion, tarnishing or dilution of the “SMART” brand may have a material impact on our business.
If we are not able to maintain, develop and enhance our brand and our reputation, our business and results of operations may be adversely affected.
We believe that maintaining, developing and enhancing our brand and our reputation is critical to our relationships with our existing customers, suppliers and business partners and our ability to attract new customers and business partners. The successful promotion of our business will depend on a number of factors, including our marketing efforts, and ultimately our ability to continue to develop attractive products and to continue to provide services valued by customers. Although we believe it is important for our growth, our brand promotion activities may not be successful or yield increased revenue.
On October 15, 2024, we rebranded and changed our name from SMART Global Holdings, Inc. to Penguin Solutions, Inc. This rebranding is a continuation of our strategic transformation over the past several years and reflects our focus on delivering leading-edge solutions that seek to solve the complexity of AI. However, customers, suppliers and business partners may be confused by the name change and investors may not perceive the expected benefits of our rebranding or business strategic efforts, which could materially and adversely impact our business, results of operations, financial condition and trading price of our common stock.
We rely on third parties to sell a portion of our products and services.
Sales of our products to some of our OEM customers are accomplished, in part, through the efforts of third-party sales representatives and, particularly in the case of our LED business, third-party distributors. We are unable to predict the extent to which these third-party sales representatives and distributors will be successful in marketing and selling our products. Moreover, many of these third-party sales representatives and distributors also market and sell competing products and may more aggressively pursue sales of our competitors’ products. Our third-party sales representatives and distributors may terminate their relationships with us at any time on short or no notice. Our future performance may also depend, in part, on our ability to attract and retain additional third-party sales representatives and distributors that will be able to market and support our products effectively, especially in markets in which we have not previously sold our products. If we cannot retain our current third-party sales representatives and distributors or recruit additional or replacement third-party sales representatives and distributors or if these sales representatives or distributors are not effective, it could have a material adverse effect on our business, results of operations and financial condition.
We may be unable to protect our intellectual property.
Our success is dependent, in part, upon protecting our intellectual property rights. We rely on a combination of trade secrets, trademarks, copyrights, patents and other forms of intellectual property rights, contractual restrictions and confidentiality procedures to establish and protect our proprietary technology. Much of the intellectual property created in our Integrated Memory and Advanced Computing segments exists in the form of know-how and trade secrets. As such, few patents are sought or procured on products created in these business areas. The absence of patent protection for these products means that we cannot prevent our competitors from reverse-engineering, independently developing, or duplicating them, which could harm our competitive position, sales and results of operations.
We seek to protect our confidential proprietary information, in part, by confidentiality and non-disclosure agreements and invention assignment agreements with our employees, consultants, advisors, contractors and collaborators. However, we cannot be certain that such agreements have been entered into with all relevant parties. Furthermore, we cannot be certain that our trade secrets and other confidential proprietary information will not be disclosed or that competitors will not otherwise gain access to our trade secrets or independently develop substantially equivalent information and techniques. In addition, our trade secrets, know-how, and other proprietary information may be stolen, used in an unauthorized manner, or compromised through a direct intrusion
34
by private parties or foreign actors, including those affiliated with or controlled by state actors. Such misappropriation of our proprietary information can occur through cyber intrusions into our computer systems, physical theft through corporate espionage, or other means. Misappropriation of proprietary information can also occur through other routes, including by our collaborators, licensees that do not comply with the terms of licenses, potential licensees that were ultimately not granted licenses, or other parties who reverse engineer our solutions. See also “Actual or perceived failures or breaches of our information and security systems, or those of our customers, suppliers or business partners, could expose us to losses.” If any of our confidential proprietary information were to be lawfully obtained or independently developed by a competitor, we would have no right to prevent such competitor from using that technology or information to compete with us, which could harm our competitive position.
We also protect our intellectual property through patent protection, particularly in our Optimized LED segment, but our patents do not cover all of our technologies, methods and systems and our competitors or others may design around our patented technologies. If any of our issued patents are found to be invalid or if any of our patent applications are rejected, our ability to exclude competitors from making, using, importing or selling the same or similar products as us could be compromised. Further, when we seek patent protection for a particular technology, there is no assurance that the applications we file will result in issued patents or that if patents do issue as a result that they will allow us to effectively block competitors creating competing technology.
We also rely on trademark registrations and have registered, or have applied to register, those trademarks that we believe are important to our business with the USPTO and in many foreign jurisdictions. We cannot assure that our applications will be approved or that these registrations will prevent imitation, counterfeiting or other infringement of our name or the infringement of our other intellectual property rights. Third parties may also oppose our trademark applications and registrations or otherwise challenge our use of the trademarks. Imitation, unauthorized use, or misuse of our name or trademarks in a manner that projects lesser quality or carries a negative connotation of our brand image or services could have a material adverse effect on our business, financial condition and results of operations. To assert control over the use of our trademarks, we rely on contractual protections with our customers and we implement quality control measures and monitoring techniques intended to protect our trademarks from unauthorized use or other misuse. However, no assurances can be given that those contracts will not be breached, and we cannot be certain that the actions we have taken to establish, police and protect our trademarks or our resources will be adequate to prevent or detect infringing use by others. If disputes arise in the future, we may not be able to successfully resolve these types of conflicts to our satisfaction.
In addition, because we conduct a substantial portion of our operations and sell a large percentage of our products outside of the United States, our ability to protect our intellectual property may be constrained. The laws of certain countries in which we operate our business or sell products may not protect proprietary rights to the same extent or in the same ways as the laws in the United States. As such, we may not be able to effectively leverage or defend our intellectual property rights in foreign countries and markets due to applicable intellectual property laws and procedures, which could undermine our business interests. It is also possible that certain of our suppliers or other partners will either not protect or not respect our intellectual property rights, and that we may have difficulty enforcing our intellectual property rights while maintaining our business relationships with those partners.Moreover, policing unauthorized use of our technologies, trade secrets and intellectual property may be difficult, expensive and time-consuming, particularly in foreign countries where the laws may not be as protective of intellectual property rights as those in the United States and where mechanisms for enforcement of intellectual property rights may be weak. Accordingly, despite our efforts, we may be unable to prevent third parties from infringing upon, misappropriating or otherwise violating our intellectual property rights. Our inability to secure or enforce our intellectual property rights could have a material adverse effect on our business, results of operations and financial condition.
Legal proceedings and claims could have a material adverse effect on our business, results of operations or financial condition.
We are currently involved, and may in the future become involved, in legal proceedings, claims or government and administrative investigations, including any identified under “Item 3. Legal Proceedings.” For example, from time to time, third parties may assert claims against us alleging infringement of their intellectual property rights on technologies that are important to our business. In addition, litigation or other actions may be necessary to protect our intellectual property rights, to determine the validity and scope of the proprietary rights of others or to defend
35
against third party claims of infringement and/or invalidity. The steps we take to prevent misappropriation, infringement or other violations of the intellectual property of others may not be successful. For instance, there may be issued patents held by third parties of which we are not aware, that if found to be valid and enforceable, could be alleged to be infringed by our current or future technologies or products. There may also be pending patent applications of which we are not aware, that may result in issued patents, which could be alleged to be infringed by our current or future technologies or products. Litigation and other legal and administrative processes, whether as plaintiff, defendant or otherwise, could result in substantial costs and diversion of resources and management attention and could have a material adverse effect on our business, results of operations and financial condition, whether or not such litigation or other processes are ultimately determined in our favor. In the event of an adverse result in, or a settlement of, a litigation matter, we could be required to pay substantial damages or settlement amounts; cease the manufacture, use, import and sale of certain products or components; expend significant resources to develop or acquire rights to use non-infringing technology; and/or discontinue the use of certain processes or obtain licenses and pay one-time fees and/or on-going royalties to use the infringing or allegedly infringing technology. The occurrence of any of the foregoing could result in unexpected expenses or require us to recognize an impairment of our assets, which would reduce the value of our assets and increase our expenses.
We may be required to pay royalties or obtain licenses to sell certain products.
The markets in which we operate are constantly undergoing rapid technological change and evolving industry standards. From time to time, third parties may claim that we are infringing upon technology to which they have proprietary rights and that we require a license to manufacture and/or sell certain of our products. If we are unable to supply certain products at competitive prices due to royalty payments we are required to make or are unable to supply them at all because we were unable to secure a required license, our customers might make claims against us, cancel orders or seek other suppliers to replace us. Any of these outcomes could have a material adverse effect on our business, results of operations and financial condition.
The anticipated benefits of the U.S. Domestication may not be realized.
On June 30, 2025, we consummated the U.S. Domestication. We may not realize the anticipated benefits of the U.S. Domestication. The achievement of such benefits is, in many significant respects, subject to factors beyond our control, including the responses of third parties with whom we conduct business, the terms of future contractual relationships, and the reactions of investors. Additionally, the anticipated benefits from the U.S. Domestication may not outweigh the direct and indirect costs and expenses incurred in connection with the transaction. Failure to realize those benefits could have a material and adverse effect on our business, results of operations, or financial condition.
The U.S. Domestication may adversely impact our effective tax rate.
Although we do not currently expect the U.S. Domestication to increase our effective tax rate, there is a risk that our effective tax rate may nonetheless increase following the U.S. Domestication. Our effective tax rate could change materially after the U.S. Domestication, which may adversely affect our financial results, including our earnings and cash flow in future periods, and may fluctuate significantly from period to period. Our effective tax rate is based upon the application of currently applicable income tax laws, regulations and treaties, as well as current judicial and administrative interpretations of those rules in various jurisdictions, including jurisdictions outside the United States.
In light of these factors, there can be no assurance that our effective tax rate will not increase in future periods, including as a result of and following the U.S. Domestication. Moreover, U.S. tax laws significantly limit the ability of U.S. corporations to redomicile outside of the United States. Accordingly, if our effective tax rate were to increase as a result of the U.S. Domestication, our business and financial performance could be adversely affected.
Changes in tax laws or potential adjustments by tax authorities could materially increase our tax expense.
We are a multinational company subject to taxation in multiple jurisdictions. Our future effective tax rates could be adversely affected by various factors, including the resolution of tax audits with tax authorities in the United States and abroad; adjustments to income taxes upon finalization of various tax returns; increases in non-deductible
36
expenses for tax purposes, such as write-offs of acquired in-process research and development or impairments of goodwill related to acquisitions; changes in available tax credits; changes in tax laws, regulations, or tax rates; changes in the interpretation or application of tax laws; fluctuations in the proportion of net sales or earnings generated in countries with particularly high or low statutory tax rates; changes in tax exemptions available in certain jurisdictions or in connection with certain transactions; or changes in the valuation of our deferred tax assets and liabilities.
Taxable income in any jurisdiction depends in part on whether local tax authorities accept our operational practices and intercompany transfer pricing as being conducted on an arm’s-length basis. Due to inconsistencies in how taxing authorities apply the arm’s-length standard and the limited protection provided by treaties, transfer pricing challenges by tax authorities could, if successful, substantially increase our income tax expense. While we currently benefit from preferential tax treatment in certain foreign jurisdictions, most notably Malaysia, such treatment is contingent upon our continued compliance with specific conditions and may be subject to change. Further changes in tax laws could arise as a result of the base erosion and profit shifting project that was undertaken by the Organisation for Economic Co-operation and Development (“OECD”). For example, the OECD introduced an international tax framework under Pillar Two, which establishes a global minimum tax rate of 15%. This framework has been adopted by several jurisdictions, including those in which we operate, effective January 1, 2024, with additional jurisdictions expected to implement similar measures. The effect of Pillar Two taxes is applicable for our fiscal year ended August 29, 2025. We continue to monitor developments in jurisdictions that are expected to implement Pillar Two in the future, and we have evaluated the potential impact of the enactment of Pillar Two by such jurisdictions on our consolidated financial statements.
We regularly assess the likelihood of outcomes resulting from tax examinations in the United States and abroad to determine the adequacy of our provision for taxes and have recorded reserves for potential adjustments that may result from ongoing examinations. We believe these estimates are reasonable; however, there can be no assurance that the final determination of any examinations will align with our estimates.
Any significant variance between the results of tax examinations and our estimates, any failure to continue to receive any beneficial tax treatment in any of our foreign locations or any increase in our future effective tax rates due to any of the factors set forth above or otherwise could reduce our net income and have a material adverse effect on our business, results of operations, and financial condition.
Our ability to use our tax attributes is limited.
As of August 29, 2025, we had U.S. federal and state net operating loss carryforwards of $23.6 million and $36.2 million, respectively. If not utilized, the federal net operating loss carryforwards will begin to expire in 2027. State net operating loss carryforwards of $35.9 million will begin to expire in 2031, while the remaining state net operating loss carryforwards do not expire. In addition, we have U.S. federal and state research and development credit carryforwards of $8.5 million and $4.5 million, respectively, and $1.2 million of foreign tax credit carryforwards. If not utilized, the federal research and foreign tax credits will begin to expire in 2032. If not utilized, $2.0 million of state credits will begin to expire in 2030, while $2.5 million of state credits do not expire. In addition, we have Section 163(j) interest expense carryforwards of $99.0 million from the acquisition of Stratus Technologies and $318.5 million from the U.S. Domestication, both of which do not expire. Net operating loss carryforwards in Hong Kong of $29.6 million do not expire.
Federal and state tax attributes can be subject to an annual limitation under the provisions of Section 382 of the Internal Revenue Code of 1986, as amended (the “Code”), and applicable state tax laws. Under Sections 382 and 383 of the Code,if a corporation undergoes an “ownership change,” the corporation’s ability to use its pre-change net operating loss carryforwards and other pre-change tax attributes to offset its post-change taxable income may be limited. In general, an “ownership change” occurs if there is a cumulative change in our ownership by certain “5-percent shareholders” (including groups of stockholders) that exceeds 50 percentage points (by value) over a rolling three-year period. Similar rules may apply under state tax laws. Our net operating loss, tax credit and Section 163(j) interest expense carryforwards are subject to limitations per Sections 382 and 383 of the Code. We have experienced ownership changes in the past and may experience ownership changes in the future as a result of transactions involving our common stock, some of which may be outside of our control. Consequently, our ability to utilize our pre-change net operating loss, tax credit, and Section 163(j) interest expense carryforwards to offset post-change U.S. federal and state taxable income could be further limited.
37
We reversed the valuation allowance for a significant portion of our deferred tax assets in the fourth quarter of 2023, and we may not be able to realize these assets in the future. Our deferred tax assets may also be subject to additional valuation allowances, which could have a material adverse effect on our business, results of operations, and financial condition.
Determining whether a valuation allowance for deferred tax assets is appropriate requires significant judgment and an evaluation of all positive and negative evidence. At each reporting period, we assess the need for, or the adequacy of, a valuation allowance against our deferred tax assets.
In the fourth quarter of fiscal year 2025, based on the weight of all the positive and negative evidence, we concluded that it was more likely than not that we would be unable to realize the benefit of interest expense carryforward attributes inherited as part of the U.S. Domestication. Therefore, we recorded a valuation allowance against that deferred tax asset in the same period that it was inherited.
In the fourth quarter of fiscal year 2023, based on the weight of all the positive and negative evidence, we concluded that it was more likely than not that we will realize certain federal and state net deferred tax assets based on three significant pieces of positive evidence occurring during the year ended August 25, 2023: (1) achieving three-year cumulative earnings, (2) recent use of deferred tax assets including available tax attribute carryforwards and (3) forecasted growth and profitability. Therefore, we reversed the valuation allowance on those deferred tax assets in fiscal year 2023.
Our conclusion that it is more likely than not that we will realize certain federal and state net deferred tax assets considers our estimate of future taxable income. Our estimate of future taxable income is based on internal projections which primarily consider historical performance, but also include various internal estimates and assumptions as well as certain external data. We believe all of these inputs to be reasonable, although inherently subject to judgment. If actual results differ significantly from these estimates of future taxable income, we may need to reestablish a valuation allowance for some or all of our deferred tax assets. Establishing an allowance on our net deferred tax assets could have a material adverse effect on our business, results of operations and financial condition.
We could incur substantial costs or liabilities as a result of violations of environmental laws.
Our operations and properties are subject to various federal, state, local, foreign and international environmental laws and regulations governing, among other things, environmental licensing and registries, protection of flora and fauna, air and noise emissions, use of water resources, wastewater discharges, management and disposal of hazardous and non-hazardous materials and wastes, reverse logistics (take-back policy) and remediation of releases of hazardous materials. Our failure to comply with present and future requirements, or the management of known or identification of new or unknown contamination, could cause us to incur substantial costs, including cleanup costs, indemnification obligations, damages, compensations, fines, suspension of activities and other penalties, investments to upgrade our facilities or change our processes or curtailment of operations. Additionally, certain environmental laws may impose liability without regard to fault or the legality of the original conduct. The identification of presently unidentified environmental conditions, more vigorous enforcement by regulatory agencies, enactment of more stringent laws and regulations or other unanticipated events may arise in the future and give rise to material environmental liabilities and related costs. The occurrence of any of the foregoing could have a material adverse effect on our business, results of operations and financial condition.
We may be unable to successfully manage environmental or social sustainability initiatives, in whole or in part, which could lead to less opportunity for us to have sustainability investors and partners and could negatively impact our reputation or options for capital acquisition.
There is scrutiny from investors, customers, policymakers, and other stakeholders regarding companies’ management of climate change, human capital, and various other environmental and social sustainability matters, and we expect to be subject to further scrutiny as a listed company with growing operations. We engage in various voluntary initiatives (including disclosures) to manage such matters or to respond to stakeholder
38
expectations, but such initiatives can be costly and may not have the desired effect. Our management of climate, human capital, and other sustainability matters continues to evolve rapidly, in many instances due to factors that are out of our control, and we cannot guarantee that our approach will align with the expectations or preferences of any particular stakeholder. For example, we may ultimately be unable to complete certain initiatives or reach certain targets or goals. Similarly, many sustainability actions or statements rely on methodologies, standards, technology, and data that continue to evolve, including in ways we cannot predict. In recent years, there have been increasingly sophisticated complaints against companies for alleged deficiencies in their disclosures, methodologies, or actions related to sustainability matters. Various stakeholders also have different, and at times conflicting, expectations.
From a regulatory perspective, various policymakers have adopted (or are considering adopting) requirements for companies to undertake various disclosures or other actions on climate, human capital or other sustainability matters. These requirements, however, are not uniform, which can increase the cost and complexity of compliance and associated risks. Moreover, some policymakers have sought to constrain companies’ consideration of various environmental and social sustainability matters, Advocates and opponents of such matters are increasingly resorting to activism, including litigation, to advance their perspectives. Addressing stakeholder expectations and regulatory requirements entails costs and any failure to successfully navigate such expectations, including any evolving interpretations of existing governmental laws, may result in reputational harm (including under various ratings or certification programs), loss of customers or contracts, regulatory or investor engagement, or other adverse impacts to our business. Increased regulation and increased stakeholder expectations will likely lead to increased costs as well as scrutiny that could heighten all of the risks we face associated with environmental, social and regulatory matters. Additionally, many of our customers and suppliers are subject to similar expectations, which may augment or create additional risks, including risks that may not be known to us.
Our worldwide operations, and those of our suppliers, business partners and customers, may be disrupted by events outside of our control, including the effects of climate change, natural disasters, man-made disasters or other events, as well as societal and governmental responses to such events.
Our operations in different parts of the world could be subject to natural disasters or severe weather conditions, or an accident that damages or otherwise adversely affects any of our operations, assets or infrastructure, or the operations, assets or infrastructure of one or more of our suppliers, business partners or customers. Earthquakes, hurricanes, monsoons, cyclones, droughts, extreme wind conditions, severe storms, heatwaves, wildfires and floods could damage our property and assets, require us to shut down operations or have either of those effects on third parties on whom we rely. For example, our U.S. headquarters in Fremont, California, manufacturing and research and development facility in Newark, California and our Penguin Computing operations in Fremont, California are located near major earthquake fault lines. Our manufacturing facility in Penang, Malaysia is located in an area that is also prone to natural disasters, such as cyclones, monsoons and floods. In the event of a major earthquake, cyclone, monsoon or other natural or man-made disaster, we could experience business interruptions, destruction of facilities and/or loss of life, any of which could materially adversely affect our business. In addition, the outbreak of war, political unrest or terrorist activity, diseases, epidemics or pandemics in any of the locations in which we conduct business could severely disrupt our business or the business of our customers and suppliers, which could in turn materially adversely affect our business. Since a large percentage of our production is done in a small number of facilities, a disruption to operations could have a material adverse effect on our business, results of operations and financial condition.
Climate change and other environmental and social pressures are expected to increase the intensity and frequency of many such disasters, as well as contribute to various chronic changes in the physical environment, such as sea-level rise or changes in ambient temperature or precipitation patterns, which may also adversely impact our or our third-parties’ operations. While we may take various actions to mitigate our business risks associated with climate change and other natural and catastrophic events, this may require us to incur substantial costs and may not be successful, due to, among other things, the uncertainty associated with the longer-term projections associated with managing climate risk. For example, to the extent catastrophic events become more frequent, it may adversely impact the availability or cost of insurance.
Additionally, we may be subject to risks associated with societal efforts to mitigate or otherwise respond to climate change, including but not limited to increased regulations and evolving stakeholder expectations. Changing
39
market dynamics, global and domestic policy developments, and the increasing frequency and impact of meteorological phenomena have the potential to disrupt our business, the business of our suppliers and/or customers, or otherwise adversely impact our business, financial condition, or results of operations.
Public health crises, such as pandemics, epidemics, or widespread outbreaks of infectious disease, have had, and could in the future have, an adverse effect on our business, financial condition and results of operations.
The occurrence of pandemics, epidemics, or widespread outbreaks of infectious diseases, as well as the imposition of related public health measures and travel and business restrictions or other actions that may be taken by governmental authorities in an effort to contain such pandemics, epidemics or outbreaks, have had, and could in the future have, a material adverse effect on our business, customer relationships, and cash flows. For example, the COVID-19 pandemic adversely impacted sales volumes of certain of our product lines and also disrupted our product development, marketing and corporate development activities and adversely affected the economies and financial markets within many countries, including countries in which we conduct business. While we have developed, and continue to develop, strategies to help mitigate the negative effects of potential public health crises on our business and operations, such efforts may prove to be insufficient. The duration and extent of the impact of any public health crises cannot be accurately assessed or predicted at this time, and could adversely impact our business, financial condition, and results of operations.
Risks Related to Our International Operations
Our business is subject to the risks generally associated with international business operations.
Sales outside of the United States accounted for 43%, 43% and 39% of our net sales in 2025, 2024 and 2023, respectively. In addition, a significant portion of our product design and manufacturing is performed at our facilities in Malaysia and China, and a significant amount of our product design activities are performed in Taiwan and India. As a result, our business is and will continue to be subject to the risks generally associated with international business operations in Malaysia, China, Taiwan, India and other foreign countries, including:
•compliance with numerous changing, and sometimes conflicting legal regimes on matters as diverse as tax, anticorruption, import/export controls and quotas, local manufacturing requirements, trade restrictions, tariffs, taxation, sanctions, immigration, internal and disclosure control obligations, securities regulation, anti-competition, data privacy, employment regulations and labor relations, and labor and human rights laws and expectations;
•changes in social, political and economic conditions, including as a result of changes of administration, political regimes or sentiment in countries in which we operate or with which we do business;
•transportation delays;
•power and other utility shutdowns or shortages;
•limitations on foreign investment;
•disruptions in or lack of adequate infrastructure;
•challenges protecting intellectual property and trade secrets;
•exchange or currency controls and fluctuations, restrictions on currency convertibility and volatility of foreign exchange markets;
•increased trade wars;
•corruption or adverse political situations;
•governmental intervention in local economies, industries, or the operations of specific companies, including us or our competitors;
•changes or instability in local labor conditions, including strikes, work stoppages, protests and changes in employment regulations, increases in wages and the conditions of collective bargaining agreements;
•compliance with travel restrictions, stay-at-home or work location conditions or other government or voluntary restrictions relating to epidemics or pandemics;
•difficulties recruiting, employing and retaining qualified personnel to manage and oversee our local operations, sales and other activities;
•difficulties in managing and overseeing employees and operations in locations far from senior management, which could result in compliance, control or other issues;
•difficulties in obtaining governmental approvals and extension of existing incentives;
40
•difficulties in collecting accounts receivable;
•expropriation and nationalization of our assets in a particular jurisdiction; and
•restrictions, or increases in existing tax rates, on repatriation of cash, dividends or profits.
Some of the foreign countries in which we do business or have operations have been subject to social and political instability in the past, and interruptions in operations could occur in the future. Our net sales, results of operations and financial condition could be adversely affected by any of the foregoing factors.
We are subject to the taxation requirements of the jurisdictions in which we operate, and if we fail to qualify for certain tax incentives or to comply with local tax regulations, we may suffer financial losses.
We are subject to changes in tax laws, treaties and regulations or the interpretation or enforcement thereof in the Cayman Islands, United States, Malaysia, Ireland and other jurisdictions in which we or any of our subsidiaries operate or are resident. We have structured our operations in a manner designed to maximize our benefit from various government incentives and/or tax holidays extended to manufacturers in Malaysia to encourage investment and employment, and to minimize our tax liability in other jurisdictions such as the United States to the extent permitted by law. Our interpretations and conclusions regarding these tax incentives are not binding on any taxing authority. Additionally, we have been in the past and may in the future be subject to tax assessments by the relevant authorities in the jurisdictions in which we operate and we have been in the past and may in the future be involved in legal disputes with regulatory or governmental authorities relating to these assessments. If our assumptions about, or interpretation or implementation of, tax and other laws are incorrect; if tax laws or regulations are substantially modified or rescinded; if the tax incentives from which we benefit in the jurisdictions in which we operate are substantially modified or rescinded; if we fail to meet the conditions of any of the tax incentives; or if we do not prevail in disputes with tax authorities, we could suffer material adverse tax and other financial consequences including owing significant amounts of taxes and penalties that would increase our expenses, reduce our profitability and adversely affect our cash flows, results of operations and financial condition.
Changes in foreign currency exchange rates could materially adversely affect our business, results of operations or financial condition.
Our international sales and our operations in foreign countries expose us to certain risks associated with fluctuating currency values and exchange rates. Because some of our sales are denominated in U.S. dollars, increases in the value of the U.S. dollar could increase the price of our products so that they become relatively more expensive to customers in a particular country, possibly leading to a reduction in sales and profitability in that country. Volatility of currencies in countries where we conduct business, most notably the U.S. dollar, Chinese renminbi, Malaysian ringgit, Japanese yen, euro, British pound, South Korean won, New Taiwan dollar, Hong Kong dollar and South African rand have had and may in the future have an effect on our liquidity and results of operations. Gains and losses on the conversion to U.S. dollars of the associated monetary assets and liabilities, as well as profits and losses incurred in certain countries, may contribute to fluctuations in the value of our assets and our results of operations. We also have costs and expenses that are denominated in foreign currencies, and decreases in the value of the U.S. dollar could result in increases in such costs that could have a significant negative impact on our results of operations. In addition, fluctuating values between the U.S. dollar and other currencies can result in currency gains which are used in the computation of foreign taxes and can increase foreign taxable income.
If enacted, exchange controls may limit our ability to receive dividends and other distributions from our foreign subsidiaries.
We conduct all of our operations through subsidiaries and are dependent on dividends or other intercompany transfers of funds from our subsidiaries to meet our obligations. If enacted, restrictions on intercompany dividends or other distributions in certain jurisdictions could have a material adverse effect on our ability to transfer funds from certain subsidiaries. Certain foreign jurisdictions permit temporary restrictions on conversions of currency into foreign currencies and on remittances to foreign investors of proceeds from their investments under certain circumstances. Any imposition of restrictions on conversions and remittances could hinder or prevent us from converting foreign currencies into U.S. dollars and remitting dividends, distributions or the proceeds from operations. In addition, an increase in the existing tax rates applicable to the remittance of dividends or any other
41
intercompany transfer of funds, as well as the enactment of any new tax related to such transfers, may either affect our ability to transfer funds from our subsidiaries or significantly reduce the amounts subject to transfer.
High rates of inflation could have a material adverse effect on our business, results of operations and financial condition.
If countries where we operate experience substantial inflation or deflation in the future, our business may be materially adversely affected. In addition, we may not be able to adjust the prices we charge our customers to offset the impact of inflation on our expenses, leading to an increase in our expenses and a reduction in our net operating margin. This could have a material adverse impact on our business, results of operations and financial condition.
We may have limited legal recourse under the laws of China if disputes arise under our agreements with third parties.
The Chinese government has enacted certain laws and regulations dealing with matters such as corporate organization and governance, foreign investment, currency control, commerce, taxation and trade. However, the implementation, interpretation and enforcement of these laws and regulations is still evolving, and our ability to enforce commercial claims or to resolve commercial disputes is unpredictable. If disputes arise under our agreements with other parties doing business in China, we face the risk that such party may breach any such agreement or otherwise engage in conduct relating to their relationship with us that could otherwise give rise to liability under U.S. law. The resolution of these matters may be subject to the exercise of considerable discretion by agencies of the Chinese government. Any rights we may have to specific performance, or to seek an injunction under Chinese law, in either of these cases, may be limited, and without a means of recourse by virtue of the Chinese legal system, we may be unable to prevent these situations from occurring. The occurrence of any such events could have a material adverse effect on our business, financial condition and results of operations.
Risks Related to Our Debt
Our indebtedness could impair our financial condition and harm our ability to operate our business.
We have a significant amount of debt outstanding as of August 29, 2025, including the debt described in “PART II – Item 8. Financial Statements and Supplementary Data – Notes to Consolidated Financial Statements – Debt.” Our indebtedness may have important consequences, including, but not limited to, the following:
•increasing our vulnerability to general economic downturns and adverse industry conditions;
•limiting our ability to obtain additional financing;
•requiring us to dedicate a significant portion of our cash flows from operations to the payment of interest and principal on our debt, which would reduce the funds available to us for our working capital, capital expenditures or other general corporate requirements;
•increasing our exposure to rising interest rates from variable rate indebtedness;
•diluting the interests of our existing stockholders to the extent common stock are issued upon conversion of our Convertible Senior Notes (as defined below);
•limiting our flexibility in planning for, or reacting to, changes in our business and industry;
•placing us at a competitive disadvantage compared to our competitors with less indebtedness or more liquidity; and
•limiting our ability to obtain additional financing in the future for working capital, capital expenditures, acquisitions, general corporate purposes or other purposes.
Our ability to make scheduled payments on, to refinance or to pay off our debt obligations when due depends on the financial condition and operating performance of our business. This, to a certain extent, is subject to prevailing economic and competitive conditions, including general conditions prevailing in the financial markets and global economy, and to certain financial, business, regulatory and other factors beyond our control, including the risks described herein. Our business may not generate sufficient cash flows from operations, and future borrowings may not be available to us under our debt arrangements, including the 2025 Credit Agreement (as defined below), in an amount sufficient to enable us to service our debt or to fund our other liquidity needs. In addition, certain of our debt is subject to terms that may require the use of significant cash in the future under certain circumstances.
42
For example, holders of our 2.25% Convertible Senior Notes due 2026 (the “2026 Notes”), our 2.00% Convertible Senior Notes due 2029 (the “2029 Notes”) and our 2.00% Convertible Senior Notes due 2030 (the “2030 Notes,” collectively, the “Convertible Senior Notes”), may, subject to a limited exception, require us to repurchase their Convertible Senior Notes following a “fundamental change,” as described in more detail in “PART II – Item 8. Financial Statements and Supplementary Data – Notes to Consolidated Financial Statements – Debt – Convertible Senior Notes.” In addition, all conversions of the Convertible Senior Notes will be settled partially or entirely in cash. We may not have enough available cash or be able to obtain financing at the time we are required to repurchase the Convertible Senior Notes or pay the cash amounts due upon conversion. Applicable law, regulatory authorities and the agreements governing our other indebtedness, including the 2025 Credit Agreement, may restrict our ability to repurchase the Convertible Senior Notes. Our failure to repurchase the Convertible Senior Notes or to pay the cash amounts due upon conversion when required will constitute a default under the relevant indenture. A default under such indenture or the fundamental change itself could also lead to a default under agreements governing our other indebtedness, which may result in that other indebtedness becoming immediately payable in full. We may not have sufficient funds to satisfy all amounts due under the other indebtedness and the Convertible Senior Notes.
If we are unable to meet our debt obligations or fund our other liquidity needs, we may need to restructure or refinance all or a portion of our debt or sell certain of our assets on or before the maturity of our debt. We may not be able to restructure or refinance any of our debt on commercially reasonable terms, or at all, which could cause us to default on our debt obligations and impair our liquidity, which in turn could cause the acceleration of other indebtedness under certain of our debt agreements which could exacerbate our liquidity problems. Any refinancing of our indebtedness will likely be at higher interest rates in the current environment and may require us to comply with more onerous covenants that could further restrict our business operations. If we are not able to repay our debt obligations as they become due, or if we are not able to refinance or restructure our debt obligations before they become due, this could cause us to default on our debt obligations and impair our liquidity.
In addition, if our cash flows and capital resources are insufficient to fund our debt service obligations, we may be forced to reduce or delay investments and capital expenditures, or to sell assets or seek additional capital. These alternative measures may not be available to us, may not be successful and may not permit us to meet our scheduled debt service obligations, which could result in substantial liquidity problems. The 2025 Credit Agreement restricts our ability to dispose of our assets and use the proceeds from the disposition. We may not be able to consummate any such disposition or dispositions or to obtain the proceeds which we could realize from them, and these proceeds may not be adequate to meet any debt service obligations then due. Any of these circumstances could have a material adverse effect on our business, results of operations and financial condition.
Our credit agreement may limit our flexibility in operating our business.
Penguin Solutions Cayman, and certain of our subsidiaries, are party to a Credit Agreement dated as of June 24, 2025 (the “2025 Credit Agreement”) as described in more detail in “PART II – Item 8. Financial Statements and Supplementary Data – Notes to Consolidated Financial Statements – Debt.” This agreement contains, and future credit agreements may contain, restrictive covenants that limit our ability to engage in specified transactions and prohibit us from voluntarily prepaying certain of our other indebtedness. For instance, the covenants in the 2025 Credit Agreement limit the ability of Penguin Solutions Cayman and certain of its subsidiaries to, among other things:
•incur additional indebtedness;
•create liens on assets;
•engage in mergers or consolidations;
•sell assets;
•pay dividends, make distributions or repurchase capital stock;
•make investments, loans or advances;
•repay or repurchase certain subordinated debt (except as scheduled or at maturity);
•create restrictions on the payment of dividends or other amounts to us from our restricted subsidiaries;
•make certain acquisitions;
•engage in certain transactions with affiliates; and
•amend material agreements governing our subordinated debt and fundamentally change our business.
43
Under the 2025 Credit Agreement, we also are required to satisfy and maintain certain specified financial ratios. Our ability to meet those financial ratios could be affected by events beyond our control, and there can be no assurance that we will meet those ratios.
The failure to comply with any of these covenants would cause a default under the relevant credit agreement. A default, if not waived, could result in acceleration of the outstanding indebtedness under the 2025 Credit Agreement as well as under the Convertible Senior Notes, in which case such indebtedness would become immediately due and payable. If any default occurs, we may not be able to pay our debt or borrow sufficient funds to refinance it. Even if new financing is available, it may not be available on terms that are acceptable to us. Complying with these covenants may cause us to take actions that we otherwise would not take or not take actions that we otherwise would take.
Provisions in the Convertible Senior Notes and their respective indentures could delay or prevent an otherwise beneficial takeover of us.
Certain provisions in the Convertible Senior Notes and their respective indentures could make a third-party attempt to acquire us more difficult or expensive. For example, if a takeover constitutes a “fundamental change”, then noteholders will have the right to require us to repurchase their Convertible Senior Notes for cash. In addition, if a takeover constitutes a “make-whole fundamental change” (as defined in the relevant indenture), then we may be required to temporarily increase the conversion rate. In either case, and in other cases, our obligations under the Convertible Senior Notes and their respective indentures could increase the cost of acquiring us or otherwise discourage a third party from acquiring us, including in a transaction that noteholders or holders of our common stock may view as favorable.
Our capped call transactions may affect the value of our debt and common stock.
In connection with the pricing of the Convertible Senior Notes, we entered into privately-negotiated capped call transactions (“Capped Calls”) with certain financial institutions. The Capped Calls are expected generally to reduce the potential dilution to our common stock upon any conversion of the Convertible Senior Notes and/or offset any cash payments we are required to make in excess of the principal amount of converted Convertible Senior Notes, as the case may be, with such reduction and/or offset subject to a cap.
In connection with establishing their initial hedges of the Capped Calls, the Capped Call counterparties or their respective affiliates likely purchased our common stock concurrently with the pricing of the Convertible Senior Notes. In addition, the Capped Call counterparties and/or their respective affiliates may modify their hedge positions by entering into or unwinding various derivatives with respect to our common stock and/or purchasing or selling our common stock or other securities of ours in secondary market transactions and prior to the maturity of the Convertible Senior Notes (and are likely to do so during any Observation Period (as defined in the relevant indenture) related to a conversion of Convertible Senior Notes). This activity could cause or avoid an increase or a decrease in the market price of our common stock or the Convertible Senior Notes.
The potential effect, if any, of these transactions and activities on the trading price of our common stock or the Convertible Senior Notes will depend in part on market conditions. Any of these activities could adversely affect the trading price of our common stock or the Convertible Senior Notes.
Risks Related to Our Common Stock
The trading price of our common stock has been and may continue to be volatile.
The market price of the securities of technology companies can be especially volatile. Broad market and industry factors may adversely affect the market price of our common stock regardless of our actual operating performance. The market price of our common stock has been in the past and could be in the future subject to wide fluctuations in response to the risk factors listed in this section and others beyond our control, including those risks described herein as well as:
•the failure of financial analysts to cover our company;
•negative or inaccurate coverage by financial analysts;
44
•changes in financial estimates by financial analysts, any failure by us to meet or exceed any of these estimates or changes in the recommendations of any financial analysts that elect to follow our company or our competitors;
•changes in the market valuations of other companies operating in our industry;
•announcement of, or expectation of, additional financing efforts or potential collaborations;
•future sales of our common stock, including common stock issuable upon conversion of our Issued CPS;
•stock price and volume fluctuations attributable to inconsistent trading volume levels of our common stock;
•the impact of the U.S. Domestication; and
•general economic and market conditions.
In addition, the stock market in general has experienced substantial price and volume fluctuations that have often been unrelated or disproportionate to the operating performance of particular companies affected. These broad market and industry factors may materially harm the market price of our common stock, regardless of our operating performance. In the past, following periods of volatility in the market price of certain companies’ securities, securities class action litigation has been instituted against these companies. This litigation, if instituted against us, could adversely affect our financial condition or results of operations.
If our estimates or judgments relating to our critical accounting estimates are based on assumptions that change or prove to be incorrect, our results of operations could fall below expectations of securities analysts and investors, resulting in a decline in the market price of our common stock.
The preparation of financial statements in conformity with U.S. GAAP requires management to make estimates and assumptions that affect the amounts reported in the accompanying consolidated financial statements and notes. We base our estimates on historical experience and on various other assumptions that we believe to be reasonable under the circumstances, as described in “PART II – Item 7. Management’s Discussion and Analysis of Financial Condition and Results of Operations,” the results of which form the basis for making judgments about the carrying values of assets, liabilities, equity, revenue and expenses that are not readily apparent from other sources. Significant assumptions and estimates used in preparing our consolidated financial statements include those related to business acquisitions, income taxes, inventory valuation, impairment of long-lived assets, goodwill and identified intangible assets and revenue recognition. If our assumptions change or if actual circumstances differ from those in our assumptions, our results of operations may be adversely affected and may fall below the expectations of securities analysts and investors, resulting in a decline in the market price of our common stock.
Future sales of our common stock in the public market, or the perception that these sales may occur, could cause our stock price to fall.
Sales of substantial amounts of our common stock in the public market, including sales of our common stock by our directors or officers, or sales by us or our affiliates pursuant to one or more effective registration statements or shares of common stock issuable upon conversion of our Issued CPS, or otherwise, or the perception that these sales may occur, could cause the market price of our common stock to decline. This could also impair our ability to raise additional capital through the sale of our equity securities. Under our amended and restated certificate of incorporation, we are authorized to issue up to 200 million shares of common stock, of which 52.7 million shares of common stock were outstanding as of August 29, 2025.
In addition, certain of our existing stockholders, convertible preferred stockholders, and holders of options, restricted stock unit awards or performance-based awards, in the event they become exercisable, have the right to demand that we file a registration statement covering the offer and sale of their common stock and shares issuable under such options and awards under the Securities Act and to require us to include their securities on a registration statement filed by us. For instance, on August 27, 2025, we filed a registration statement for the resale from time to time of up to 6,096,103 shares of our common stock by the selling securityholder (the “Selling Securityholder”), consisting of 6,096,103 shares of common stock initially issuable upon the conversion of the Issued CPS held by the Selling Securityholder. Pursuant to their registration rights, following the expiration of the initial lock-up term and subject to the terms of the lock-up provisions under the Investor Agreement (as defined below), the Selling Securityholder may, from time to time, sell, transfer, or otherwise dispose of any or all of their securities. The dispositions may be at fixed prices, at prevailing market prices at the time of sale, at prices related to the prevailing market price, at varying prices determined at the time of sale, or at negotiated prices. In the
45
future, we may also issue securities in connection with investments, acquisitions, or capital raising activities, which could constitute a material portion of our then-outstanding shares of common stock.
We cannot predict the size of any future sales or issuances of our common stock or the effect, if any, that such future sales and issuances would have on the market price of our common stock. Any such issuance of additional securities or any exercise of registration rights or the prospect of any such sales, could materially impact the market price of our common stock and could impair our ability to raise capital through future sales of equity securities.
Anti-takeover provisions contained in our amended and restated certificate of incorporation and amended and restated bylaws, as well as provisions of Delaware law, could delay, defer, discourage, or prevent a takeover attempt.
Our amended and restated certificate of incorporation and amended and restated bylaws contain, and the General Corporation Law of the State of Delaware (the “Delaware General Corporation Law”) contains, provisions which could have the effect of delaying, deferring, discouraging or preventing acquisitions of the Company that some stockholders may favor. These provisions provide for the following:
•a classified board of directors with three-year staggered terms, who can only be removed for cause, and only by the affirmative vote of the holders of at least 66 2/3% of the voting power of all then-outstanding voting stock entitled to vote at an election of directors, which may delay the ability of stockholders to change the membership of a majority of our board of directors;
•no cumulative voting in the election of directors, which limits the ability of minority stockholders to elect director candidates;
•the exclusive right of our board of directors to set the size of the board of directors and to elect a director to fill a vacancy, however occurring, including by an expansion of the board of directors, which prevents stockholders from being able to fill vacancies on our board of directors;
•the ability of our board of directors to authorize the issuance of shares of undesignated preferred stock and to determine the price and other terms of those shares, including voting or other rights or preferences, without stockholder approval, which could impede the success of any attempt to change control of the Company and be used to significantly dilute the ownership of a hostile acquirer;
•the ability of our board of directors to alter our amended and restated bylaws without obtaining stockholder approval;
•in addition to our board of directors’ ability to adopt, amend, or repeal our amended and restated bylaws, our stockholders may adopt, amend, or repeal our amended and restated bylaws only with the affirmative vote of the holders of at least 66 2/3% of the voting power of the outstanding shares of voting stock of the Company entitled to vote generally in an election of directors;
•the required approval of at least 66 2/3% of the voting power of all then outstanding shares of the Company entitled to vote thereon, voting together as a single class, to adopt, amend, or repeal certain provisions of our amended and restated certificate of incorporation;
•the requirement that any action required or permitted to be taken by its stockholders must be effected at a duly called annual or special meeting of its stockholders and may not be taken by written consent in lieu of a meeting; however, any action required or permitted to be taken by the holders of our convertible preferred stock, voting separately as a series or class, may be taken by written consent;
•the requirement that a special meeting of stockholders may be called only by or at the direction of our board of directors, the chairperson of our board of directors, or our chief executive officer or president, thus prohibiting a stockholder from calling a special meeting;
•advance notice procedures that stockholders must comply with in order to nominate candidates to our board of directors or to bring other business before a stockholders’ meeting, which may discourage or deter a potential acquirer from conducting a solicitation of proxies to elect the acquirer’s own slate of directors or otherwise attempting to obtain control of us;
•certain litigation against us can only be brought in Delaware; and
•the limitation of liability of, and provision of indemnification to, our directors and officers.
These provisions, alone or together, could delay, defer, discourage or prevent hostile takeovers and changes in control or changes in our management. These provisions could also discourage proxy contests and make it more difficult for stockholders to elect directors of their choosing and to cause us to take other corporate actions they desire.
46
As a Delaware corporation, we are also subject to provisions of the Delaware General Corporation Law, including Section 203 thereof, which prevents some stockholders holding more than 15% of our outstanding common stock from engaging in certain business combinations without approval of the holders of substantially all of our outstanding common stock.
Any provision of our amended and restated certificate of incorporation, amended and restated bylaws or the Delaware General Corporation Law that has the effect of delaying, deferring, discouraging or preventing a change in control could limit the opportunity for our stockholders to receive a premium for their shares of our common stock, and could also affect the price that some investors are willing to pay for our common stock.
We do not anticipate paying any cash dividends on our common stock in the foreseeable future.
We currently intend to retain our future earnings, if any, for the foreseeable future, to repay indebtedness and to fund the development and growth of our business. We do not intend to pay any dividends to holders of our common stock. In addition, certain of our agreements, including the 2025 Credit Agreement, the Securities Purchase Agreement that we entered into with SKT on July 14, 2024 (the “SKT Purchase Agreement”) and the Certificate of Designation of Convertible Preferred Stock we executed and adopted on June 27, 2025 (the “CPS Delaware Certificate of Designation”) contain restrictions on our ability to pay dividends. As a result, capital appreciation in the price of our common stock, if any, will be your only source of gain on an investment in our common stock. Holders of shares of Issued CPS are entitled to receive dividends of six percent per annum, cumulative, and payable quarterly in-kind or in cash at our option. Shares of Issued CPS are not redeemable upon or repurchased upon the election of the holders of Issued CPS.
Claims for indemnification by our directors and officers may reduce our available funds to satisfy successful third-party claims against us and may reduce the amount of money available to us.
Our amended and restated certificate of incorporation and amended and restated bylaws provide that we will indemnify our directors and officers, in each case to the fullest extent permitted by Delaware law.
In addition, as permitted by Section 145 of the Delaware General Corporation Law, our amended and restated bylaws and our indemnification agreements that we have entered or intend to enter into with our directors and officers provide that:
•we will indemnify our directors and officers to the fullest extent permitted by Delaware law. Delaware law provides that a corporation may indemnify such person if such person acted in good faith and in a manner such person reasonably believed to be in or not opposed to the best interests of the registrant and, with respect to any criminal proceeding, had no reasonable cause to believe such person’s conduct was unlawful;
•we may, in our discretion, indemnify employees and agents in those circumstances where indemnification is permitted by applicable law;
•we are required to advance expenses incurred by a director or officer in advance of the final disposition of any action or proceeding, except that such directors or officers will undertake to repay such advances if it is ultimately determined that such person is not entitled to indemnification;
•the rights conferred in our amended and restated bylaws are not exclusive, and we are authorized to enter into indemnification agreements with our directors, officers, employees and agents and to obtain insurance to indemnify such persons; and
•we may not retroactively amend our amended and restated bylaw provisions to reduce our indemnification obligations to directors, officers, employees, and agents.
Our directors’ and officers’ liability insurance policies may not be available to us in the future at a reasonable rate, may not cover all potential claims for indemnification, and may not be adequate to indemnify us for all liability that may be imposed.
Our amended and restated certificate of incorporation provides for an exclusive forum in the Court of Chancery of the State of Delaware for certain disputes between us and our stockholders, and that the federal district courts of the United States will be the
47
exclusive forum for the resolution of any complaint asserting a cause of action under the Securities Act.
Our amended and restated certificate of incorporation provides that unless we consent in writing to the selection of an alternative forum, (a) the Court of Chancery of the State of Delaware (or, if such court does not have subject matter jurisdiction thereof, the federal district court for the District of Delaware or other state courts of the State of Delaware) will, to the fullest extent permitted by law, be the sole and exclusive forum for: (i) any derivative action, suit or proceeding brought on behalf of the Company, (ii) any action, suit or proceeding asserting a claim of breach of a fiduciary duty owed by any director, officer or stockholder to the Company or our stockholders, (iii) any action, suit or proceeding arising pursuant to any provision of the Delaware General Corporation Law or our amended and restated certificate of incorporation or amended and restated bylaws (as either may be amended from time to time), or (iv) any action, suit or proceeding asserting a claim against the Company that is governed by the internal affairs doctrine; and (b) the federal district courts of the United States will be the exclusive forum for the resolution of any complaint asserting a cause or causes of action arising under the Securities Act, including all causes of action asserted against any defendant to such complaint.
Any person or entity purchasing or otherwise acquiring any interest in any security of the Company will be deemed to have notice of and consented to these provisions. Nothing in our amended and restated certificate of incorporation or amended and restated bylaws precludes stockholders that assert claims under the Exchange Act, from bringing such claims in federal court to the extent that the Exchange Act confers exclusive federal jurisdiction over such claims, subject to applicable law.
We believe these provisions may benefit us by providing increased consistency in the application of Delaware law and federal securities laws by chancellors and judges, as applicable, particularly experienced in resolving corporate disputes, efficient administration of cases on a more expedited schedule relative to other forums and protection against the burdens of multi-forum litigation. If a court were to find the choice of forum provision that is contained in our amended and restated certificate of incorporation or amended and restated bylaws to be inapplicable or unenforceable in an action, we may incur additional costs associated with resolving such action in other jurisdictions, which could materially adversely affect our business, results of operations, and financial condition. For example, Section 22 of the Securities Act creates concurrent jurisdiction for federal and state courts over all suits brought to enforce any duty or liability created by the Securities Act or the rules and regulations thereunder. Accordingly, there is uncertainty as to whether a court would enforce such a forum selection provision as written in connection with claims arising under the Securities Act.
The choice of forum provisions may limit a stockholder’s ability to bring a claim in a judicial forum that it finds favorable for disputes with us or any of our current or former director, officer or stockholder to the Company, which may discourage such claims against us or any of our current or former director, officer or stockholder to the Company and result in increased costs for investors to bring a claim.
General Risk Factors
Worldwide economic and political conditions as well as other factors may adversely affect our operations and cause fluctuations in demand for our products.
Uncertainty in global economic and political conditions poses a risk to the overall economy, as consumers and businesses have made it difficult for customers, suppliers and us to accurately forecast and plan future business activities. Declines in the worldwide semiconductor market, economic conditions or consumer confidence would likely decrease the overall demand for our products. Other factors that could cause demand for our products to fluctuate include:
•a downturn in the computing, networking, communications, storage, aerospace, government, mobile or industrial markets;
•changes in consumer confidence caused by changes in market conditions, including changes in the credit markets, expectations for employment and inflation and energy prices;
•changes in the level of customers’ components inventory;
•competitive pressures, including pricing pressures, from companies that have competing products, architectures, manufacturing technologies and marketing programs;
•changes in technology or customer product needs;
•strategic actions taken by our competitors;
48
•market acceptance of our products;
•changes in prevailing or available interest rates or liquidity of the domestic capital and lending markets;
•exchange rates and currency controls and restrictions on the movement of capital out of country;
•recent and potential bank failures;
•inflation; and
•changes to tax, trade and regulatory policies, including as a result of changes in administration.
If demand for our products decreases, our manufacturing or assembly and test capacity could be underutilized, and we may be required to record an impairment on our long-lived assets, including facilities and equipment, as well as intangible assets, which would increase our expenses. In addition, if product demand decreases or we fail to forecast demand accurately, we could be required to write-off inventory or record underutilization charges, which would have a negative impact on our profitability. If product demand increases more or faster than anticipated, we may not be able to add manufacturing or assembly and test capacity fast enough to meet market demand. These changes in demand for our products, and changes in our customers’ product needs, could have a variety of negative effects on our competitive position and our financial results, and in certain cases, may reduce our net sales, increase our costs, lower our profit margins or require us to recognize impairments of our assets. The occurrence of any of the foregoing could have a material adverse effect on our business, results of operations and financial condition.
We and others are subject to a variety of laws, regulations, or industry standards that may have a material adverse effect on our business, results of operations or financial condition.
Our business is subject to regulation by various U.S. federal and state governmental agencies. Such regulation includes, without limitation, the radio frequency emission regulatory activities of the Federal Communications Commission, the antitrust regulatory activities of the Federal Trade Commission (the “FTC”) and the Department of Justice, the consumer protection laws of the FTC, the import/export regulatory activities of the Department of Commerce, the product safety regulatory activities of the Consumer Products Safety Commission, the regulatory activities of the Occupational Safety and Health Administration, the environmental regulatory activities of the Environmental Protection Agency, the labor regulatory activities of the Equal Employment Opportunity Commission, the export control regulatory activities of the Department of State and tax and other regulations by a variety of regulatory authorities in each of the areas in which we conduct business. We are also subject to similar, and in some cases additional, regulation in other countries where we conduct business, including import and export laws and foreign currency control. In certain jurisdictions, such regulatory requirements may be more stringent and complex than in the United States. We are also subject to a variety of U.S. federal and state employment and labor laws and regulations, including, without limitation, the Americans with Disabilities Act, the Federal Fair Labor Standards Act, the Worker Adjustment and Restructuring Notification Act and other regulations related to working conditions, wage-hour pay, overtime pay, employee benefits, anti-discrimination and termination of employment.
Like other companies operating or selling internationally, we face risks of non-compliance with the U.S. Foreign Corrupt Practices Act (the “FCPA”) and other laws which generally prohibit direct and indirect improper payments to foreign government officials and political parties for the purpose of securing an unfair business advantage. In addition, because we have operations and suppliers in China and adjacent jurisdictions, we have exposure and risks associated with the Uyghur Forced Labor Prevention Act (“UFLPA”) and other global laws against forced labor. The UFLPA prohibits the importation of articles, merchandise, apparel and goods mined, produced, or manufactured wholly or in part in the Xinjiang Uyghur Autonomous Region (Xinjiang) of the People’s Republic of China (PRC), or by entities identified by the U.S. government on the UFLPA Entity List. Forced labor concerns have rapidly become a global area of interest and is a topic that will likely be subject to new regulations in the markets we operate within. If we fail to comply with these laws and regulations, we may be subject to detention, seizure and exclusion of imports, as well as penalties, costs and restrictions on export and import privileges that could have an adverse effect on our business, financial condition and results of operations. We are also subject to similar or even more restrictive anticorruption laws imposed by the governments of other countries where we do business, such as laws that prohibit commercial bribery, including the UK Bribery Act and the Malaysian Anticorruption Act. We make sales, are subject to government regulation and operate in countries known to present heightened risks of public corruption. Although we have implemented policies and controls to mitigate risks of non-compliance, our business activities create the risk of unauthorized conduct by one or more of our employees, consultants, customs brokers, freight forwarders, third party representatives or distributors that could
49
be in violation of various laws including the FCPA or similar local regulations. In addition, we may be held liable for actions taken by such parties even if such parties themselves are not subject to the FCPA or similar laws. Investigations into allegations of such misconduct can be costly, and any determination that we have violated the FCPA or similar laws may result in severe criminal or civil sanctions, and we may be subject to other liabilities that could have a material adverse effect on our business, results of operations and financial condition.
Our China operations are subject to national, regional and local regulation. The regulatory environment in China continues to evolve, and officials in the Chinese government exercise broad discretion in deciding how to interpret and apply regulations. It is possible that the Chinese government’s current or future interpretation and application of existing or new regulations will negatively impact our China operations, result in regulatory investigations or lead to fines or penalties.
Noncompliance with applicable regulations or requirements could subject us to investigations, sanctions, mandatory product recalls, enforcement actions, disgorgement of profits, disbarment from government projects, fines, damages, civil and criminal penalties or injunctions and reputational damage that could harm our business, results of operations and financial condition. In addition, from time to time we have received, and may receive in the future, correspondence from former employees and parties with whom we have done business, threatening to bring claims against us alleging that we have violated one or more regulations related to customs, labor and employment, foreign currency control or other laws or regulations. An adverse outcome in any litigation or proceeding related to such matters could require us to pay damages, attorneys’ fees and/or other costs.
If any governmental sanctions were to be imposed, or if we were not to prevail in any civil action or criminal proceeding, our business, results of operations and financial condition could be materially adversely affected. In addition, responding to any litigation or action would likely result in a significant diversion of management’s attention and resources and a significant increase in professional fees.
Our success depends on our ability to attract, retain and motivate highly skilled employees.
Our future results of operations depend in significant part upon the continued contributions of our key senior management and technical personnel, many of whom hold critical institutional knowledge and expertise and would be difficult to replace. Our future results of operations also depend in significant part upon our ability to attract, train and retain qualified management, including for manufacturing and quality assurance, engineering, design, finance, marketing, sales and support. We are continually recruiting such personnel in various parts of the world. However, competition for such personnel across all of our markets can be strong. Our ability to attract, retain and motivate such personnel depends in part on our ability to offer competitive compensation packages, including salary, cash incentive compensation and stock-based compensation along with other benefits and workplace policies, and we can provide no assurance that we will be successful in attracting or retaining such personnel now or in the future. In addition, particularly in the high-technology industry, the value of stock options, restricted stock unit awards or other stock-based compensation is an important element in the retention of employees. Declines in the value of our common stock could adversely affect our ability to retain employees and we may have to take additional steps to make the equity component of our compensation packages more attractive to attract and retain employees. These steps could result in dilution to stockholders.
The loss of any key employee, the failure of any key employee to adequately perform in his or her current position, our inability to attract, train and retain skilled employees as needed or the inability of our key employees to expand, train and manage our employee base as needed, could have a material adverse effect on our business, results of operations and financial condition.
Worldwide political conditions and threats of terrorist attacks may adversely affect our operations and demand for our products.
Armed conflicts around the world, including those in Ukraine and Israel, as well as the global response to such conflicts, including the imposition of sanctions by the United States and other countries, could create or exacerbate risks facing our business. Political and economic instability could have an impact on our sales, our supply chain, our ability to deliver products to our customers, and demand for our products. More generally, various events could cause consumer confidence and spending to decrease.
50
We have evaluated our operations, vendor contracts and customer arrangements, and to date the hostilities have not directly had a material and adverse effect on our financial condition or results of operations. However, if the hostilities persist, escalate or expand, risks we have identified in this report may be exacerbated. For example, if our supply or customer arrangements are disrupted due to sanctions or expanded sanctions, involvement of countries where we have operations or relationships or rising energy prices, our business could be materially disrupted. Further, the use of state-sponsored cyberattacks could expand as part of the conflict, which could adversely affect our ability to maintain or enhance our cybersecurity and data protection measures.
Additionally, the occurrence or threat of terrorist attacks may in the future adversely affect demand for our products. In addition, such attacks may negatively affect our operations directly or indirectly and such attacks or other armed conflicts may directly impact our facilities or those of our suppliers or customers. Such attacks may make travel and the transportation of our products more difficult and more expensive, ultimately having a negative effect on our business.
Item 1B. Unresolved Staff Comments
None.
Item 1C. Cybersecurity
Cybersecurity Risk Management and Strategy
We have developed and implemented a cybersecurity risk management program intended to protect the confidentiality, integrity and availability of our critical systems, internal networks and information.
We have aligned our cybersecurity risk management program with recognized security frameworks such as the National Institute of Standards and Technology Cybersecurity Framework and ISO standards. This does not imply that we meet any particular technical standards, specifications or requirements, only that we use these frameworks as a guide to help us identify, assess and manage cybersecurity risks relevant to our business.
Key elements of our cybersecurity risk management program include, but are not limited to, the following:
•risk assessments designed to help identify material cybersecurity risks to our critical systems and information;
•the use of external service providers, where appropriate, to assess, test or otherwise assist with aspects of our security processes;
•cybersecurity awareness training of our employees;
•an information security event response plan that includes procedures for responding to cybersecurity events;
•an information security event response team (the “Response Team”) principally responsible for managing our response to cybersecurity events; and
•a third-party risk management process for key IT vendors based on our assessment of their criticality to our operations and respective risk profile.
During 2025, we did not identify any risks from cybersecurity threats, including as a result of any previous cybersecurity events, that materially affected us, including our business strategy, results of operations or financial condition. However, we face ongoing and increasing cybersecurity risks, including from bad actors that are becoming more sophisticated and effective over time, and if realized, these risks are reasonably likely to materially affect us. Additional information on the cybersecurity risks we face is discussed in “Item 1A. Risk Factors.”
Cybersecurity Governance
Our Board of Directors considers cybersecurity risk as part of its risk oversight function and has delegated to the Cybersecurity and Technology Risk Management Committee of the Board of Directors (the “Cybersecurity Committee”) oversight of cybersecurity and other information technology risks. The Cybersecurity Committee oversees management’s implementation of our cybersecurity risk management program.
51
The Cybersecurity Committee receives regular reports from our Chief Information Officer (“CIO”) regarding any significant cybersecurity events, as well as any events with lesser impact potential. The CIO periodically reports to the Board of Directors regarding cybersecurity risks and our cybersecurity risk management program. Board members periodically receive presentations on cybersecurity topics from our CIO or external experts as part of the Board of Directors’ continuing education on topics that impact public companies.
Our CIO, who is a member of our management team, is primarily responsible for assessing and managing our material risks from cybersecurity threats. Our CIO has over two decades of IT experience, including in applications, infrastructure, development, security and governance, and has presented as a featured speaker at numerous IT and security conferences. Our management team, including our CIO, has overall responsibility for our corporate cybersecurity risk management program and supervises both our internal cybersecurity personnel and our retained external cybersecurity consultants. The Response Team, which includes our CIO and other members of our management team, has primary responsibility for assessing and managing our response to cybersecurity events.
Our management team takes steps to stay informed about and monitor efforts to prevent, detect, mitigate and remediate cybersecurity risks and events through various means, which may include briefings from internal security personnel; threat intelligence and other information obtained from governmental, public or private sources, including external consultants engaged by us; tabletop training exercises; and alerts and reports produced by security tools deployed in the IT environment.
Item 2. Properties
Our U.S. headquarters are located in Fremont, California. We lease or own various facilities described below for our design, manufacture, research and development and sales and marketing activities. We believe that our
52
existing facilities are suitable and adequate for our present purposes. The following is a summary of our principal facilities as of August 29, 2025:
Location
Square Feet
(in 000s)
Manufacturing
Procurement
R&D
Sales
Supply Chain
Services
Durham, NC
102
X
X
X
Fremont, CA
86
X
X
X
X
Huizhou, China
824
X
X
X
Maynard, MA
69
X
X
X
Newark, CA
79
X
X
X
X
X
Penang, Malaysia
139
X
X
X
X
X
Tempe, AZ
50
X
X
X
X
In addition to the principal facilities in the table above, we lease additional facilities in the United States, China, Hong Kong, Ireland, Japan, Scotland, Singapore and Taiwan.
Item 3. Legal Proceedings
For a discussion of legal proceedings, see “Item 1A. Risk Factors” and “PART II – Item 8. Financial Statements and Supplementary Data – Notes to Consolidated Financial Statements – Commitments and Contingencies.”
Item 4. Mine Safety Disclosures
Not applicable.
53
PART II
Item 5. Market for Registrant’s Common Equity, Related Stockholder Matters, and Issuer Purchases of Equity Securities
Market Information for Common Stock
Our common stock is listed on the Nasdaq Global Select Market under the trading symbol “PENG.”
Holders of Record
As of October 15, 2025, there were 37 registered holders of record of our common stock (not including beneficial holders of our common stock held in street name by brokers and other institutions on behalf of stockholders). As of October 15, 2025, there was one registered holder of record of our preferred stock, the Issued CPS.
Common Stock Dividends
On January 3, 2022, our Board of Directors declared a share dividend of one ordinary share, $0.03 par value per share, for each outstanding ordinary share owned, to shareholders of record as of January 25, 2022. The dividend was paid on February 1, 2022.
We have not paid any cash dividends on our common stock, and we do not currently intend to pay any cash dividends on our common stock in the foreseeable future. Any future determination to pay dividends on our common stock will be made at the discretion of our Board of Directors subject to applicable laws and will depend on, among other factors, our results of operations, financial condition, contractual restrictions and capital requirements.
The Issued CPS entitles the holder to receive dividends of six percent per annum, cumulative, and payable quarterly in-kind or in cash at our option. Other than dividend payments to the holder of Issued CPS, we currently intend to retain all available funds and future earnings to support operations and to finance the growth and development of our business. During fiscal 2025, we did not record any paid in-kind dividends.
See “PART II – Item 8. Financial Statements and Supplementary Data – Notes to Consolidated Financial Statements – Preferred Stock Investment” and “– Temporary Equity” of this report for further discussion of the Issued CPS.
Securities Authorized for Issuance under Equity Compensation Plans
Information regarding securities authorized for issuance under our equity compensation plans is incorporated herein by reference to “Item 12. Security Ownership of Certain Beneficial Owners and Management and Related Stockholder Matters” of Part III of this Annual Report.
Recent Sales of Unregistered Securities
As previously disclosed in our Current Report on Form 8-K12B filed with the SEC on June 30, 2025, the U.S. Domestication was effected via a court-sanctioned scheme of arrangement under Cayman Islands law, pursuant to which each ordinary share of Penguin Solutions Cayman was exchanged for one share of common stock of Penguin Solutions Delaware, and each convertible preferred share of Penguin Solutions Cayman was exchanged for one share of convertible preferred stock of Penguin Solutions Delaware.
The issuance of 52,401,114 shares of Penguin Solutions Delaware capital stock pursuant to the scheme of arrangement was exempt from registration under Section 3(a)(10) of the Securities Act, which exempts from the registration requirements any security that is issued in exchange for one or more bona fide outstanding securities where the terms and conditions of such issuance and exchange are approved, after a hearing upon the fairness of such terms and conditions at which all persons to whom it is proposed to issue securities in such exchange shall have the right to appear, by any court expressly authorized by law to grant such approval. Please refer to Penguin Solutions Cayman’s definitive proxy statement on Schedule 14A filed with the SEC on May 2, 2025 for additional information about the U.S. Domestication.
54
Issuer Purchases of Equity Securities
Common Stock Repurchase Authorization
On April 4, 2022, our Board of Directors approved a $75.0 million stock repurchase authorization (the “2022 Authorization”), under which we may repurchase our outstanding common stock from time to time through open market purchases, privately-negotiated transactions or otherwise. On each of January 8, 2024 and October 6, 2025, the Audit Committee of the Board of Directors approved additional $75.0 million stock repurchase authorizations (the “2024 Authorization” and “2025 Authorization,” respectively, and together, the “Current Authorizations”). The Current Authorizations, which consist solely of amounts approved pursuant to the 2024 Authorization and 2025 Authorization as all amounts under the 2022 Authorization have been utilized, have no expiration date but may be suspended or terminated by the Board of Directors at any time. As of August 29, 2025, an aggregate of $36.5 million remained available for the repurchase of our common stock under the 2024 Authorization. Certain of our agreements, including the 2025 Credit Agreement, the SKT Purchase Agreement and the CPS Delaware Certificate of Designation, contain restrictions that limit our ability to repurchase our common stock.
The following table sets forth information relating to repurchases of our equity securities during the three months ended August 29, 2025:
Period
Total number of shares purchased
Average price paid per share
Total number of shares purchased as part of publicly announced plans or programs
Approximate dollar value of shares that may yet be purchased under the plans or programs
May 31, 2025 - June 27, 2025
16,207
$
18.26
16,207
$
36,510,000
June 28, 2025 - July 25, 2025
—
$
—
—
$
36,510,000
July 26, 2025 - August 29, 2025
—
$
—
—
$
36,510,000
16,207
$
18.26
16,207
Stock Performance Graph
This performance graph shall not be deemed “soliciting material” or to be “filed” with the SEC for purposes of Section 18 of the Exchange Act or otherwise subject to the liabilities under that Section, and shall not be deemed to be incorporated by reference into any of our filings under the Securities Act, except as shall be expressly set forth by specific reference in such filing.
The following graph illustrates a comparison of cumulative total returns for our common stock, the Russell 2000 Index and the Nasdaq Electronic Components Index from August 31, 2020 through August 31, 2025. We operate on a 52- or 53-week fiscal year, which ends on the last Friday in August. As a result, the last day of our fiscal year
55
varies. For consistent presentation and comparison to the industry indices shown herein, we have calculated our stock performance graph as of August 31 for each year.
Note: Management cautions that the stock price performance information shown in the graph above may not be indicative of current stock price levels or future stock price performance.
The stock performance graph assumes $100 was invested in our common stock and in the other indices on August 31, 2020. Any dividends paid during the period presented were assumed to be reinvested. The performance was plotted using the following data:
August 31,
2020
August 31,
2021
August 31,
2022
August 31,
2023
August 31,
2024
August 31,
2025
Penguin Solutions, Inc.
$
100
$
192
$
146
$
205
$
164
$
192
Russell 2000 Index
$
100
$
147
$
121
$
126
$
150
$
163
Nasdaq Electronic Components Index
$
100
$
144
$
128
$
145
$
183
$
283
Item 6. [Reserved]
56
Item 7. Management’s Discussion and Analysis of Financial Condition and Results of Operations
The following discussion and analysis of our financial condition and results of operations should be read in conjunction with the accompanying consolidated financial statements and notes for the year ended August 29, 2025. This discussion contains forward looking statements that involve risks, uncertainties and other factors. Our actual results could differ materially from those contained in these forward-looking statements due to a number of risks, uncertainties and other factors, including those discussed below and elsewhere in this report. See also “Cautionary Note Regarding Forward-Looking Statements” and “PART I – Item 1A. Risk Factors.”
Our fiscal year is the 52- or 53-week period ending on the last Friday in August. Fiscal years 2025, 2024 and 2023 contained 52, 53 and 52 weeks, respectively. All period references are to our fiscal periods unless otherwise indicated. All financial information for our subsidiaries in Brazil is included in our consolidated financial statements on a one-month lag because their fiscal years ended on July 31 of each year. In connection with the completion of the divestiture of an 81% interest in SMART Brazil, we ceased consolidating the operations of SMART Brazil in our financial statements as of the November 29, 2023 disposal date. As a result, financial information for the first quarter of 2024 includes the four-month period for the SMART Brazil operations from August 1, 2023 to November 29, 2023. All tabular amounts are in thousands.
Overview
For an overview of our business, see “PART I – Item 1. Business.”
On June 30, 2025, we completed the U.S. Domestication of the parent company of our corporate group, Penguin Solutions Cayman, from the Cayman Islands to the State of Delaware in the United States, resulting in Penguin Solutions Delaware becoming our publicly traded parent company and the successor issuer to Penguin Solutions Cayman. The financial information in this Annual Report for periods prior to the completion of the U.S. Domestication relates to Penguin Solutions Cayman. Unless stated otherwise or the context requires otherwise, the terms “Penguin Solutions,” “Company,” “we,” “our,” “us” or similar terms (i) for periods prior to the effectiveness of the U.S. Domestication, refer to Penguin Solutions Cayman and its consolidated subsidiaries and (ii) for periods at or after the completion of the U.S. Domestication, refer to Penguin Solutions Delaware and its consolidated subsidiaries. See “About this Annual Report,” above.
Divestiture of SMART Brazil
On November 29, 2023, we completed the divestiture of an 81% interest in SMART Brazil to Lexar Europe B.V., an affiliate of Shenzhen Longsys Electronics Co. Ltd.
Presentation of SMART Brazil as Discontinued Operations: In accordance with authoritative guidance under U.S. GAAP, we have presented the balance sheets, results of operations and cash flows of SMART Brazil operations in this Annual Report, including in the accompanying consolidated financial statements and notes, as discontinued operations for all periods presented. The SMART Brazil operations were previously reported as part of our Integrated Memory segment. Unless otherwise noted, discussion within this Annual Report relates solely to our continuing operations and excludes the SMART Brazil operations.
See “PART II – Item 8. Financial Statements and Supplementary Data – Notes to Consolidated Financial Statements – Divestiture of SMART Brazil.”
Acquisition of Stratus Technologies
On August 29, 2022, we completed the acquisition of Stratus Technologies. At the closing, we paid a cash purchase price of $225.0 million, subject to certain adjustments. In addition, the seller had the right to receive the Stratus Earnout based on the gross profit performance of the Stratus Technologies business during the first full 12 fiscal months following the closing. Throughout 2023, we adjusted the fair value of the Stratus Earnout by an aggregate of $29.0 million and, as of August 25, 2023, current liabilities included $50.0 million for the amount payable in connection with the Stratus Earnout. In the second quarter of 2024, we paid in full $50.0 million related to the Stratus Earnout.
57
See “PART II – Item 8. Financial Statements and Supplementary Data – Notes to Consolidated Financial Statements – Business Acquisitions – Stratus Technologies.”
Factors Affecting Our Operating Performance
Macro-Economic Demand Factors. Our business segments each have their own unique set of demand factors. Our Advanced Computing business is driven by demand for our HPC and AI products, as well as traditional workload optimization and efficiency applications. We expect increased AI adoption and broader implementation by enterprises within but not limited to verticals such as financial services, energy, government and education, as well as increased sovereign AI adoption, as organizations seek scalable infrastructure solutions, though the extent and timing of such adoption and implementation may vary and may affect our results of operations. Demand in our Integrated Memory segment is driven by end-market demand from OEMs for customer-specific solutions in vertical markets such as industrial, government, networking, HPC and enterprise storage, as well as emerging demand for higher density and greater bandwidth solutions for AI deployments, and we anticipate growing demand for higher performance and reliability memory solutions, such as our CXL family of products, to support both traditional use cases and increasingly complex AI applications, although there can be no assurance that such demand will materialize as expected or at all. Finally, demand for our Optimized LED products is derived from targeted end-market applications, such as general high-power and mid-power lighting and specialty lighting, including video display and horticulture applications. However, broader macro-economic trends, including global conflicts impacting international relations, recessionary indicators, high inflation rates, uncertainty and costs associated with trade policies and tariffs, and interest rates, can adversely affect all three segments concurrently.
Shifts in the Mix and Timing of Our Revenue. Shifts in the mix of revenue from our operating segments, and in the timing of revenue, which can vary significantly from period to period, have impacted and can continue to impact our business and results of operations, including gross and operating margins. For example, our Advanced Computing segment has shown solid growth, but is subject to variability in its sales and margin profile from period to period due to factors such as the following: recognition of revenue sometimes being tied to customer decisions as to the completion of delivery and system go-live events; certain sales being affected by the timing of customer deployments and shipments or customer budget considerations; changes in customer spending on our products and services (including as a result of the macro-economic demand factors discussed above); the impact of customer churn rates (including discounting and churn of significant customers from whom we derive a significant percentage of our revenue); discontinuation of certain of our products from time to time; shifts in our customer mix, including expected trends with respect to growth in demand from non-hyperscaler customers for HPC and AI solutions; and margin being driven by the proportion of higher margin software and managed services within our Advanced Computing sales. Our resource commitments and planning for each segment are relatively fixed in the short term, and as such, variability in expected revenue mix may have direct implications for our operating income and margins. Additionally, our revenue and margins will be negatively impacted by the winding down of our Penguin Edge business, which we expect to wind down and discontinue by approximately the end of calendar 2025. The comparability of our results of operations against prior periods will also be affected following the wind down of our Penguin Edge business.
Our Ability to Identify, Complete and Successfully Integrate Acquisitions. A substantial portion of our growth over the last several years has been driven by acquisitions, and we intend to continue to use corporate development as an engine for growth. Within our existing segments, we plan to pursue acquisitions to expand features and functionality, expand into adjacent businesses and grow our customer base and geographic footprint. From time to time, we may seek to expand our addressable market by entering new business segments where we identify a business opportunity at scale with a path to being accretive to our overall operations in the near term. If we are unable to identify and complete attractive acquisitions and successfully integrate such businesses, we may not be successful in growing our revenue and/or expanding our margins. Any acquisitions we do complete may require us to incur debt or raise capital through equity financings or may subject us to unforeseen liabilities or costs, or operational challenges, that in turn impede our ability to realize the expected returns on our investment.
Disruptions in Our Supply Chain May Adversely Affect Our Businesses. We depend on third-party suppliers for key components of our products as well as certain raw materials, such as commodity DRAM components from offshore foundries that we use in our specialty memory products, third-party wafers that we use in our memory and LED businesses and HPC and AI components for our Advanced Computing business; the costs of such components and raw materials may fluctuate from time to time due to market conditions. In our memory and LED businesses, we have adopted a “Fab-Light” business model to reduce our capital expenditures and operating expenses, while affording greater flexibility in adapting to shifts in demand and other market trends. Our Fab-Light
58
business model contributed to margin expansion in our overall business. However, our reliance on third-party manufacturers exposes us to risk of supply chain disruption and lost business. For example, the global semiconductor shortage, particularly during its peak, has adversely affected our results of operations. In addition, in our Advanced Computing business, where we source components from third parties, the high demand for and limited supply of AI components globally, as well as any delays in the production of such components, continues to affect our sourcing of these components and the timing of deployments. In particular, we continue to experience extended lead times for certain components that are incorporated into our overall solutions, which impacts how quickly we are able to ramp existing and new customer projects and may negatively affect gross margins due to changes in shipment timing and product mix. If such disruptions worsen or are prolonged, or if there is meaningful disruption in our supply arrangement with any of our third-party suppliers, our results of operations and financial condition may continue to be adversely affected.
Results of Operations
Year ended
August 29, 2025
% of net
sales (1)
August 30, 2024
% of net
sales (1)
August 25, 2023
% of net
sales (1)
Net sales:
Advanced Computing
$
648,417
47.4
%
$
554,552
47.4
%
$
749,708
52.0
%
Integrated Memory
464,249
33.9
%
356,426
30.4
%
443,264
30.8
%
Optimized LED
256,128
18.7
%
259,818
22.2
%
248,278
17.2
%
Total net sales
1,368,794
100.0
%
1,170,796
100.0
%
1,441,250
100.0
%
Cost of sales
974,520
71.2
%
830,020
70.9
%
1,026,079
71.2
%
Gross profit
394,274
28.8
%
340,776
29.1
%
415,171
28.8
%
Operating expenses:
Research and development
79,801
5.8
%
81,537
7.0
%
90,565
6.3
%
Selling, general and administrative
238,177
17.4
%
233,880
20.0
%
260,722
18.1
%
Impairment of goodwill
16,063
1.2
%
—
—
%
19,092
1.3
%
Change in fair value of contingent consideration
—
—
%
—
—
%
29,000
2.0
%
Other operating expense
2,098
0.2
%
7,064
0.6
%
7,047
0.5
%
Total operating expenses
336,139
24.6
%
322,481
27.5
%
406,426
28.2
%
Operating income
58,135
4.2
%
18,295
1.6
%
8,745
0.6
%
Non-operating (income) expense:
Interest expense, net
7,305
0.5
%
28,378
2.4
%
36,421
2.5
%
Other non-operating expense
1,929
0.1
%
21,084
1.8
%
11,837
0.8
%
Total non-operating expense
9,234
0.7
%
49,462
4.2
%
48,258
3.3
%
Income (loss) before taxes
48,901
3.6
%
(31,167)
(2.7)
%
(39,513)
(2.7)
%
Income tax provision (benefit)
20,066
1.5
%
10,618
0.9
%
(49,203)
(3.4)
%
Net income (loss) from continuing operations
28,835
2.1
%
(41,785)
(3.6)
%
9,690
0.7
%
Net loss from discontinued operations
—
—
%
(8,148)
(0.7)
%
(195,384)
(13.6)
%
Net income (loss)
28,835
2.1
%
(49,933)
(4.3)
%
(185,694)
(12.9)
%
Net income attributable to noncontrolling interest
3,444
0.3
%
2,539
0.2
%
1,832
0.1
%
Net income (loss) attributable to Penguin Solutions
$
25,391
1.9
%
$
(52,472)
(4.5)
%
$
(187,526)
(13.0)
%
(1)Summations of percentages may not compute precisely due to rounding.
Net Sales, Cost of Sales and Gross Profit
Net sales increased by $198.0 million, or 16.9%, in 2025 compared to the prior year, primarily due to higher sales from our Advanced Computing and Integrated Memory business segment. Advanced Computing net sales increased by $93.9 million, or 16.9%, compared to the same period in the prior year, primarily due to higher hardware sales driven by increased demand for AI solutions and HPC. Integrated Memory net sales increased by $107.8 million, or 30.3%, compared to the same period in the prior year, primarily due to higher sales volumes of flash and DRAM products stemming from improved market demand. Optimized LED net sales decreased by $3.7 million, or 1.4%, compared to the same period in the prior year, primarily due to lower direct sales across China and Europe.
59
Net sales decreased by $270.5 million, or 18.8%, in 2024 compared to the prior year, primarily due to lower sales and weakness in our Advanced Computing and Integrated Memory segments, partially offset by moderate growth in our Optimized LED segment. Advanced Computing net sales decreased by $195.2 million, or 26.0%, primarily related to lower hardware sales year over year due to the unpredictable nature of large project engagements, which may not occur with the same frequency or scale each year. Integrated Memory net sales decreased by $86.8 million, or 19.6%, primarily due to lower sales volumes of flash and DRAM products to our OEM customers, driven by macroeconomic environment challenges. Optimized LED net sales increased by $11.5 million, or 4.6%, primarily due to higher demand as channel partners addressed low inventory carrying levels.
Cost of sales increased by $144.5 million, or 17.4%, in 2025 compared to the prior year, primarily due to our Advanced Computing and Integrated Memory segments having increased products sales for the year. Cost of sales decreased by $196.1 million, or 19.1%, in 2024 compared to the prior year, primarily due to our Advanced Computing and Integrated Memory segments, which had lower material and production costs from lower sales, as well as lower personnel-related expenses mainly driven by cost reduction efforts.
Gross margin decreased to 28.8% in 2025 compared to 29.1% in 2024 primarily due to unfavorable mix from higher product revenue in our Advanced Computing segment and a higher mix of Integrated Memory sales. Gross margin increased to 29.1% in 2024 compared to 28.8% in 2023 primarily due to favorable mix from higher service revenue in our Advanced Computing segment.
Non-GAAP Measure of Segment Operating Income
Below is a table of our operating income, measured on a non-GAAP basis, which Penguin Solutions management uses to supplement Penguin Solutions’ financial results under GAAP to analyze its operations and make decisions as to future operational plans, and which management believes provides supplemental information that is useful to investors in analyzing and assessing our past and future operating performance. These non-GAAP measures exclude certain items, such as stock-based compensation expense; amortization of acquisition-related intangible assets (consisting of amortization of developed technology, customer relationships, trademarks/trade names and backlog acquired in connection with business combinations); acquisition-related inventory adjustments; diligence, acquisition and integration expense; restructuring charges; impairment of goodwill; changes in the fair value of contingent consideration; redomiciliation costs; and other infrequent or unusual items. While amortization of acquisition-related intangible assets is excluded, the revenues from acquired companies is reflected in our non-GAAP measures and these intangible assets contribute to revenue generation. See “Item 8. Financial Statements and Supplementary Data – Notes to Consolidated Financial Statements – Segment and Other Information.”
Non-GAAP financial measures should not be considered as a substitute for, or superior to, measures of financial performance prepared in accordance with GAAP, as they exclude important information about our financial results, as noted above. The presentation of these adjusted amounts varies from amounts presented in accordance with GAAP and therefore may not be comparable to amounts reported by other companies.
60
Year ended
August 29, 2025
August 30, 2024
August 25, 2023
GAAP operating income
$
58,135
$
18,295
$
8,745
Stock-based compensation expense
41,176
43,160
39,228
Amortization of acquisition-related intangibles
34,838
39,272
44,601
Flow-through of inventory step up
—
—
2,599
Cost of sales-related restructuring
746
2,136
6,813
Diligence, acquisition and integration expense
1,829
8,772
20,869
Redomiciliation costs (1)
10,038
470
—
Impairment of goodwill
16,063
—
19,092
Change in fair value of contingent consideration
—
—
29,000
Restructuring charges
2,098
7,064
7,047
Other (1)
2,729
1,088
1,800
Non-GAAP operating income
$
167,652
$
120,257
$
179,794
Non-GAAP operating income by segment:
Advanced Computing
$
115,009
$
95,291
$
110,975
Integrated Memory
43,639
22,413
73,639
Optimized LED
9,004
2,553
(4,820)
Total non-GAAP operating income by segment
$
167,652
$
120,257
$
179,794
(1) In 2025 we began breaking out costs related to the U.S. Domestication from “Other.” All periods presented have been adjusted to reflect this change.
Advanced Computing operating income increased by $19.7 million, or 20.7%, in 2025 compared to the prior year primarily due to increased net sales driven by increased demand for AI solutions, as well as lower subcontract services, partially offset by increased operating expenses, mainly driven by increased personnel-related expenses stemming from bonus achievement. Advanced Computing operating income decreased by $15.7 million, or 14.1%, in 2024 compared to the prior year primarily due to lower sales from our Penguin Computing business, partially offset by lower operating expenses, mainly driven by personnel-related expenses due to lower headcount and lower subcontract services.
Integrated Memory operating income increased by $21.2 million, or 94.7%, in 2025 compared to the prior year primarily due to increased net revenue, partially offset by increased operating expenses, mainly driven by
increased personnel costs stemming from bonus achievement. Integrated Memory operating income decreased by $51.2 million, or 69.6%, in 2024 compared to the prior year primarily due to lower sales and gross profit due to lower sales volumes of flash and DRAM products.
Optimized LED operating income increased by $6.5 million, or 252.7%, in 2025 primarily due to higher gross profit, stemming from a more favorable product mix. Optimized LED operating loss improved by $7.4 million, or 153.0%, in 2024 primarily due to higher revenue from increased demand, better factory leverage and product mix and lower personnel-related expenses due to headcount reductions.
Operating and Non-operating (Income) Expense
Research and Development
Research and development expense decreased by $1.7 million, or 2.1%, in 2025 compared to the prior year, primarily due to lower personnel-related expenses mainly driven by headcount reductions, as well as lower subcontract services mainly driven by Advanced Computing.
Research and development expense decreased by $9.0 million, or 10.0%, in 2024 compared to the prior year, primarily due to lower personnel-related expenses mainly driven by headcount reductions, as well as lower subcontract services mainly driven by Advanced Computing.
61
Selling, General and Administrative
Selling, general and administrative expense increased by $4.3 million, or 1.8%, in 2025 compared to the prior year, primarily due to higher personnel-related expenses stemming from increased bonus achievement as a result of Company performance, partially offset by decreased professional services driven by increased cost in the
prior year due to the SMART Brazil divestiture referenced above.
Selling, general and administrative expense decreased by $26.8 million, or 10.3%, in 2024 compared to the prior year, primarily due to lower diligence, acquisition and integration expense, lower personnel-related expenses, mainly driven by headcount reductions, and lower amortization expense of intangible assets.
Impairment of Goodwill
In the second quarter of 2023, we initiated a plan pursuant to which we intend to wind down manufacturing and discontinue the sale of certain products offered through our Penguin Edge business by approximately the end of calendar 2025. In connection therewith and with the preparation of the financial statements included in this Annual Report, we assessed goodwill associated with our Penguin Edge business within our Advanced Computing segment and concluded it is now fully impaired. As a result, we recorded impairment charges of $16.1 million and $19.1 million in 2025 and 2023, respectively, to impair the carrying value of Penguin Edge goodwill. See “Item 8. Financial Statements and Supplementary Data – Notes to Consolidated Financial Statements – Intangible Assets and Goodwill.”
Change in Fair Value of Contingent Consideration
Our acquisitions of Stratus Technologies in the first quarter of 2023 included contingent consideration. We estimate the fair value of the contingent consideration as of the date of acquisition and subsequently recognize changes in the fair value in results of operations. During 2023, we recorded charges of $29.0 million to adjust the fair value of the contingent consideration. See “Item 8. Financial Statements and Supplementary Data – Notes to Consolidated Financial Statements – Business Acquisitions.”
Other Operating (Income) Expense
Other operating expense in 2025, 2024, and 2023 included restructuring charges of $2.1 million, $7.1 million, and $7.0 million, respectively, primarily for employee severance costs and other benefits resulting from workforce reductions, the elimination of certain projects across our businesses and other costs associated with the wind down of our Penguin Edge business. We anticipate that such activities will continue into future quarters and anticipate recording additional restructuring charges.
Interest Expense, Net
Net interest expense decreased by $21.1 million, or 74.3%, in 2025 compared to the prior year, primarily due to principal payments made on the Amended 2022 TLA (as defined below) during the last half of fiscal 2024 along with the full repayment in the last quarter of fiscal 2025. Net interest expense decreased by $8.0 million, or 22.1%, in 2024 compared to the prior year, primarily due to higher interest income resulting from higher cash and investment balances, partially offset by higher interest expense from the Amended 2022 TLA.
Other Non-operating (Income) Expense
Other non-operating (income) expense in 2025, 2024 and 2023 included losses of $2.9 million, $22.8 million, and $15.9 million, respectively, from the extinguishment or prepayment of debt. Other non-operating (income) expense in 2024 also included net gains of $0.2 million from the disposition of assets. See “Item 8. Financial Statements and Supplementary Data – Notes to Consolidated Financial Statements – Debt.”
Income Tax Provision (Benefit)
Our provision for income taxes increased by $9.4 million, or 89.0%, in 2025 compared to 2024 primarily due to an increase in profit before tax in jurisdictions subject to income tax. Our provision for income taxes increased by $59.8 million, or 121.6%, in 2024 compared to 2023 primarily due to the tax benefit on the release of the U.S. federal and state valuation allowance in 2023, partially offset by tax addbacks for nondeductible goodwill impairment and additional uncertain tax positions recorded in 2023.
62
In 2025, our tax expense of $20.1 million and effective tax rate of 41.0% differed from the U.S. statutory tax rate primarily due to losses generated in a jurisdiction where no tax benefit can be recognized, non-deductible expenses, return to provision adjustments, and foreign withholding taxes, offset in part by benefits from the U.S. Domestication (net of valuation allowance) and tax credits.
In 2024, our tax expense of $10.6 million and effective tax rate of (34.1)% differed from the U.S. statutory tax rate primarily due to losses generated in a jurisdiction where no tax benefit can be recognized, non-deductible expenses and foreign withholding taxes, offset in part by benefits associated with decreases in reserves for uncertain tax provisions and U.S. federal and state tax credits.
In 2023, our tax benefit of $49.2 million and effective tax rate of 124.5% differed from the U.S. statutory tax rate primarily due to a release of the U.S. federal and state valuation allowance. The effective tax rate benefit from the valuation allowance release was offset with detriments associated with losses generated in jurisdictions with rates lower than the U.S. statutory tax rate, increases in reserves for uncertain tax provisions, foreign withholding taxes and goodwill impairment for financial reporting purposes with no tax basis.
We have operations in Malaysia, where we have tax incentive arrangements for our pioneer status activities and our global supply chain business. The statutory tax rate for Malaysia is 24%. This Malaysia arrangement for the pioneer status activities is scheduled to expire in August 2028 and is subject to certain conditions, with which we have fully complied in 2025, 2024, and 2023. This Malaysia arrangement for the global supply chain activities is scheduled to expire in August 2028 and is subject to certain conditions, with which we have partially complied in 2025 and 2024 and fully complied in 2023. The impact of partial compliance is reflected within the 2025 and 2024 income tax provisions. Our effective income tax rate in the future may be higher depending on a combination of our overall and jurisdictional profitability, the general expectation that future tax holidays may have tax rates greater than our prior approved tax holidays, and the impact of the Organisation for Economic Co-operation and Development's Pillar Two Model rules which aims to implement a global minimum tax of 15%. For additional information, see “Item 8. Financial Statements and Supplementary Data – Notes to Consolidated Financial Statements – Income Taxes.”
Net Income (Loss) From Discontinued Operations
As discussed above, we have presented the results of SMART Brazil as discontinued operations in our consolidated statements of operations for all periods presented. As of August 25, 2023, SMART Brazil was classified as held for sale. Accordingly, in 2023 we evaluated the carrying value of the net assets of SMART Brazil (including $206.3 million recognized within stockholder’s equity related to the cumulative translation adjustment from SMART Brazil), estimated costs to sell and expected proceeds and concluded the net assets were impaired. As a result, we recognized an impairment charge of $153.0 million in 2023 to write down the carrying value of the net assets of SMART Brazil. In addition, we concluded that the outside basis of SMART Brazil inclusive of any withholding taxes should be recognized upon the classification as held for sale as of August 25, 2023. Accordingly, we recognized withholding taxes on the expected capital gain and deferred tax liabilities of $28.6 million in 2023. In the first quarter of 2024, we completed the divestiture, and in connection therewith, recognized an additional loss of $8.9 million. See “Item 8. Financial Statements and Supplementary Data – Notes to Consolidated Financial Statements – Divestiture of SMART Brazil.”
Liquidity and Capital Resources
As of August 29, 2025, we had cash, cash equivalents and short-term investments of $453.8 million, of which $315.5 million was held by subsidiaries outside of the United States. Our principal uses of cash and capital resources have been acquisitions, debt service requirements, capital expenditures, investments in working capital, research and development expenditures, and other operating expenses. We expect that future capital expenditures will focus on expansion of our research and development activities, manufacturing equipment upgrades, acquisitions and IT infrastructure and software upgrades. Cash and cash equivalents generally consist of funds held in demand deposit accounts, money market funds and time deposits. We do not acquire investments for trading or speculative purposes.
We may from time to time seek additional equity or debt financing. Any future equity or debt financing may be dilutive to our existing investors and may include debt service requirements and financial and other restrictive covenants that may constrain our operations and growth strategies. In the event that we seek additional financing, we may not be able to raise such financing on terms acceptable to us or at all. If we are unable to raise additional
63
capital or generate cash flows necessary to expand our operations and invest in continued product innovation, we may not be able to compete successfully, which would harm our business, operations and financial condition.
We expect that our existing cash and cash equivalents, short-term investments, borrowings available under our credit facilities and cash generated by operating activities will be sufficient to fund our operations for at least the next 12 months.
Entry Into 2025 Credit Agreement and Repayment of 2022 TLA
On February 7, 2022, Penguin Solutions Cayman and SMART Modular Technologies, Inc. (the “Borrowers”) entered into a credit agreement (the “2022 Original Credit Agreement”) with a syndicate of banks and Citizens Bank, N.A., as administrative agent that provided for (i) a term loan credit facility in an aggregate principal amount of $275.0 million (the “2022 TLA”) and (ii) a revolving credit facility in an aggregate principal amount of $250.0 million (the “2022 Revolver”), in each case, maturing on February 7, 2027. The 2022 Original Credit Agreement provided that up to $35.0 million of the 2022 Revolver was available for issuances of letters of credit. On August 29, 2022, the 2022 Original Credit Agreement was amended (the ”2022 Amended Credit Agreement”) to, among other things, provide for incremental term loans of $300.0 million (together with the 2022 TLA, the “Amended 2022 TLA”), amend the First Lien Leverage Ratio (as defined in the 2022 Amended Credit Agreement) and increase the aggregate amount of unrestricted cash and permitted investments netted from the definitions of Consolidated First Lien Debt and Consolidated Net Debt. As of August 30, 2024, there was $300.0 million of aggregate principal amount outstanding under the Amended 2022 TLA and there were no amounts outstanding under the 2022 Revolver.
On June 24, 2025 (the “Refinancing Closing Date”), the Borrowers entered into a new Credit Agreement (the “2025 Credit Agreement”) by and among the Borrowers, the lenders party thereto, and JPMorgan Chase Bank, N.A., as administrative agent, collateral agent and an issuing bank. The 2025 Credit Agreement provides for a revolving credit facility in an aggregate principal amount of $400 million (the “2025 Credit Facility” and the revolving loans thereunder, the “2025 Loans”), maturing on June 24, 2030 (subject to certain earlier “springing maturity” dates upon certain conditions specified in the 2025 Credit Agreement). The 2025 Credit Agreement provides that up to $35.0 million of the 2025 Credit Facility is available for issuances of letters of credit.
On the Refinancing Closing Date, we borrowed $100 million under the 2025 Credit Facility and simultaneously applied such proceeds, together with $200 million cash on hand, to repay in full all borrowings and terminate all commitments under the 2022 Amended Credit Agreement. Immediately prior to the repayment and termination of the 2022 Amended Credit Agreement, we had $300 million of principal outstanding under the Amended 2022 TLA, with unamortized issuance costs of $1.8 million and an effective interest rate of 7.17%, and no amounts outstanding under the 2022 Revolver, with unamortized issuance costs of $1.5 million. Following the termination of the 2022 Amended Credit Agreement, we recognized a loss on extinguishment of debt of $2.9 million.
Under the 2025 Credit Agreement, 2025 Loans bear interest at a rate per annum equal to either, at the Borrowers’ option, Term Secured Overnight Financing Rate (“Term SOFR”) rate or a base rate, in each case plus an applicable margin based on the Total Leverage Ratio (as defined in the 2025 Credit Agreement) and ranges from 1.25% to 3.00% per annum with respect to Term SOFR borrowings and from 0.25% to 2.00% per annum with respect to base rate borrowings. In addition, we are required to pay a quarterly unused commitment fee at an initial rate of 0.25%, which may increase up to a rate of 0.35% based on certain Total Leverage Ratio levels specified in the 2025 Credit Agreement.
For additional details regarding the 2025 Credit Agreement, refer to “PART II – Item 8. Financial Statements and Supplementary Data – Notes to Consolidated Financial Statements – Debt – Credit Agreement.”
Convertible Senior Notes
2026 Notes
In February 2020, we issued $250.0 million in aggregate principal amount of 2.25% Convertible Senior Notes due 2026 (the “2026 Notes”) pursuant to an indenture (the “2026 Indenture”) between the Company and U.S. Bank Trust Company National Association, as trustee. The 2026 Notes will mature on February 15, 2026, unless earlier converted, redeemed or repurchased.
64
On January 18, 2023, we exchanged $150.0 million principal amount of 2026 Notes for $150.0 million principal amount of new 2029 Notes (as defined below). On August 6, 2024, we repurchased $80.0 million aggregate principal amount of our 2026 Notes for $100.6 million cash (including payment for accrued interest) in privately-negotiated transactions. See “Item 8. Financial Statements and Supplementary Data - Notes to Consolidated Financial Statements - Debt - Convertible Senior Notes - Repurchase of Convertible Senior Notes” in this 2025 Annual Report. As of August 29, 2025, $20.0 million in aggregate principal amount of 2026 Notes were outstanding.
2029 Notes
In February 2023, we issued $150.0 million in aggregate principal amount of 2.00% Convertible Senior Notes due 2029 (the “2029 Notes”) pursuant to an indenture (the “2029 Indenture”), dated as of January 23, 2023, between the Company and U.S. Bank Trust Company, National Association, as trustee. The 2029 Notes will mature on February 1, 2029, unless earlier converted, redeemed or repurchased. As of August 29, 2025, $150.0 million in aggregate principal amount of 2029 Notes were outstanding.
2030 Notes
On August 6, 2024 and August 14, 2024, we issued $175.0 million and $25.0 million aggregate principal amount, respectively, of our 2.00% Convertible Senior Notes due 2030 (collectively, the “2030 Notes,” and together with the 2026 Notes and the 2029 Notes, the “Convertible Senior Notes”) pursuant to, and governed by, an indenture (the “2030 Indenture”), dated August 6, 2024, between us and U.S. Bank Trust Company, National Association, as trustee. The 2030 Notes will mature on August 15, 2030, unless earlier converted, redeemed or repurchased. As of August 29, 2025, $200.0 million in aggregate principal amount of 2030 Notes were outstanding.
For additional details of the terms of our Convertible Senior Notes, refer to “PART II - Item 8. Financial Statements and Supplementary Data - Notes to Consolidated Financial Statements - Debt - Convertible Senior Notes” in this 2025 Annual Report.
Capped Calls
In connection with our Convertible Senior Notes, we have entered into privately-negotiated capped call transactions, which are intended to reduce the effect of potential dilution upon conversion of our Convertible Senior Notes. The capped calls provide for our receipt of cash or shares, at our election, from counterparties if the trading price of our common stock is above the strike price on the expiration date. For additional information on our capped call transactions, refer to “PART II – Item 8. Financial Statements and Supplementary Data – Notes to Consolidated Financial Statements – Equity – Capped Calls” in this 2025 Annual Report.
Divestiture of SMART Brazil
In November 2023, we completed the divestiture of SMART Brazil. In connection with the divestiture, we sold an 81% interest and retained a 19% interest in SMART Brazil. At the closing of the transaction, we received cash of $143.0 million, net of tax, from the sale. In addition, we received a deferred payment of $24.3 million (net of $4.2 million withholding tax) in May 2025. Refer to “PART II – Item 8. Financial Statements and Supplementary Data – Notes to Consolidated Financial Statements – Divestiture of SMART Brazil.”
Preferred Stock Investment
On December 13, 2024, we closed the SKT Investment (as defined below) by SK Telecom Co., Ltd. (“SKT”). Pursuant to the SKT Purchase Agreement, we sold to Astra AI Infra LLC, an affiliate of SKT (“Astra AI Infra”), 200,000 convertible preferred shares, par value $0.03 per share (the “Issued Cayman CPS”) at a price of $1,000 per share or an aggregate price of $200.0 million (the “SKT Investment”).
On the closing date of the SKT Investment, we and Astra AI Infra entered into an Investor Agreement (the “Investor Agreement”), and the Certificate of Designation of Convertible Preferred Shares setting forth the terms, rights and obligations of the Issued Cayman CPS (the “CPS Cayman Certificate of Designation”) became effective. The Investor Agreement and the CPS Cayman Certificate of Designation provided for certain rights and restrictions relating to the SKT Investment, including but not limited to board representation rights, pro rata rights, registration rights and consent rights, and standstill provisions, disposition restrictions and voting obligations.
65
On June 27, 2025, in connection with the U.S. Domestication, Penguin Solutions Delaware executed and adopted a Certificate of Designation of Convertible Preferred Stock (the “CPS Delaware Certificate of Designation”) that sets forth the terms, rights and obligations of the Issued CPS, which principal attributes remain substantially the same as prior to the U.S. Domestication, with changes to give effect to requirements of Delaware law. The shares of Issued CPS are convertible into shares of common stock of Penguin Solutions at an initial conversion price of $32.81 per ordinary share, subject to adjustment upon the occurrence of certain events, have an initial liquidation preference of 1x and are only be redeemable at our option, subject to certain conditions. The holder of Issued CPS may convert such holder’s Issued CPS into shares of common stock at any time, provided that the Issued CPS may, at our option, automatically be converted into shares of common stock on any date following the second anniversary of the closing upon certain conditions. The Issued CPS entitle the holder to receive dividends of six percent per annum, cumulative, and payable quarterly in-kind or in cash at our option. Shares of Issued CPS are not redeemable upon or repurchased upon the election of the holders of Issued CPS. Refer to the CPS Delaware Certificate of Designation filed as Exhibit 3.3 hereto, and to the section entitled “Comparison of Rights of Cayman Islands Shareholders and Delaware Stockholders” contained in Penguin Solutions Cayman’s definitive proxy statement on Schedule 14A filed with the SEC on May 2, 2025.
On June 30, 2025, effective upon consummation of the U.S. Domestication, Penguin Solutions Delaware assumed the Investor Agreement from Penguin Solutions Cayman, and Penguin Solutions Delaware and SKT amended and restated the Investor Agreement (as amended and restated, the “Amended and Restated Investor Agreement”) such that the rights and restrictions relating to SKT’s beneficial ownership of the Issued Cayman CPS in place prior to the U.S. Domestication apply in respect of SKT’s holdings of the Issued CPS following consummation of the U.S. Domestication.
See “Item 8. Financial Statements and Supplementary Data – Notes to Consolidated Financial Statements – Preferred Stock Investment.”
Contractual Obligations
For information regarding our debt obligations, see “Item 8. Financial Statements and Supplementary Data – Notes to Consolidated Financial Statements – Debt.” For our operating lease obligations, see “Item 8. Financial Statements and Supplementary Data – Notes to Consolidated Financial Statements – Leases.” For our purchase obligations, see “Item 8. Financial Statements and Supplementary Data – Notes to Consolidated Financial Statements – Commitments and Contingencies.”
Cash Flows
Year ended
August 29, 2025
August 30, 2024
August 25, 2023
Net cash provided by operating activities from continuing operations
$
113,183
$
105,521
$
63,677
Net cash used for investing activities from continuing operations
(3,377)
(11,804)
(281,184)
Net cash provided by (used for) financing activities from continuing operations
(63,464)
(209,495)
237,221
Net increase in cash and cash equivalents from discontinued operations
24,251
90,447
22,520
Effect of changes in currency exchange rates
—
(1,256)
4,765
Net increase (decrease) in cash, cash equivalents and restricted cash
$
70,593
$
(26,587)
$
46,999
Operating Activities: Cash flows from operating activities reflects net income, adjusted for certain non-cash items, including depreciation and amortization expense, stock-based compensation, changes in the fair value of contingent consideration, gains and losses from investing or financing activities and from the effects of changes in operating assets and liabilities.
Net cash provided by operating activities from continuing operations in 2025 was $113.2 million, comprised primarily of net income of $28.8 million, adjusted for non-cash items of $103.5 million. Operating cash flows were negatively affected by a $19.1 million net change in our operating assets and liabilities, primarily from the effects of an increase of $101.6 million of inventories primarily to support future demand across both Advanced Computing and Integrated Memory and an increase of $56.2 million in accounts receivable primarily due to timing of cash receipts, partially offset by an increase of $131.0 million in accounts payable and accrued expenses and other liabilities primarily due to higher accounts payable related to the timing of purchases from suppliers and an increase in deferred revenue from customer services, along with a decrease of $7.7 million in other assets.
66
Net cash provided by operating activities from continuing operations in 2024 was $105.5 million, comprised primarily of net loss of $41.8 million, adjusted for non-cash items of $121.6 million. Operating cash flows were favorably affected by a $25.7 million net change in our operating assets and liabilities, primarily from the effects of an increase of $54.3 million in accounts payable and accrued expenses and other liabilities and a decrease of $23.8 million inventories, partially offset by an increase of accounts receivable of $32.5 million and the payment of $29.0 million of contingent consideration, which related to our 2023 acquisition of Stratus Technologies. The increase in accounts payable and accrued expenses and other liabilities was primarily due to timing of payments, as well as higher deferred revenue resulting from amounts received from customers in advance of satisfying performance obligations.
Net cash provided by operating activities from continuing operations in 2023 was $63.7 million, comprised primarily of net income of $9.7 million, adjusted for non-cash items of $119.3 million. Operating cash flows were adversely affected by a $65.4 million net change in our operating assets and liabilities, primarily from the effects of decreases of $256.1 million in accounts payable and accrued expenses and other liabilities and the payment of $73.7 million of contingent consideration, which related to our 2021 acquisition of the Optimized LED business, partially offset by the effect of decreases of $162.5 million in accounts receivable and $95.2 million in inventories. The decreases in both accounts payable and accrued expenses and inventories were primarily due to lower inventories in our Integrated Memory and Advanced Computing segments. The decrease in accounts receivable was primarily due to lower gross sales in our Integrated Memory segment.
Investing Activities: Net cash used for investing activities from continuing operations in 2025 consisted primarily of $9.0 million used for capital expenditures and deposits on equipment, partially offset by net sales of marketable investment securities of $7.3 million.
Net cash used for investing activities from continuing operations in 2024 consisted primarily of $19.4 million used for capital expenditures and deposits on equipment and $11.0 million of purchases of non-marketable investment securities, partially offset by net maturities of marketable investment securities of $19.9 million.
Net cash used for investing activities from continuing operations in 2023 consisted primarily of $213.1 million net cash used for the acquisition of Stratus Technologies, $39.4 million used for capital expenditures and deposits on equipment and $25.0 million used for the purchases of marketable investment securities.
Financing Activities: Net cash used for financing activities from continuing operations in 2025 was $63.5 million, consisting primarily of $300.0 million in principal payments of debt, $52.3 million of payments to acquire common stock (including $41.2 million under our stock repurchase program), and $7.9 million cash paid for dividends to the holder of Issued CPS, partially offset by $191.2 million of proceeds from the issuance of the Issue CPS, $100.0 millionof proceeds from amounts drawn from the 2025 Credit Facility, and $8.8 million in proceeds from the issuance of common stock from our equity plans.
Net cash used for financing activities from continuing operations in 2024 was $209.5 million, consisting primarily of $351.3 million in principal repayment of debt, $21.3 million of payments to acquire ordinary shares, $21.0 million payment of contingent consideration related to our 2023 acquisition of Stratus Technologies and $16.3 million of payments to acquire capped calls in connection with the issuance of our 2030 Notes, partially offset by $192.7 million in net proceeds from the issuance of our 2030 Notes and $9.8 million in proceeds from the issuance of ordinary shares from our equity plans.
Net cash provided by financing activities from continuing operations in 2023 was $237.2 million, consisting primarily of $295.3 million in net proceeds from our term loan and $43.0 million in proceeds from the issuance of ordinary shares from our equity plans, partially offset by $28.1 million payment of contingent consideration related to our 2021 acquisition of our Optimized LED business, $24.7 million of payments to acquire ordinary shares, $21.6 million in principal repayment of debt, and $14.1 million payment of premium in connection with our convertible note exchange.
Critical Accounting Estimates
The preparation of these financial statements and related disclosures in conformity with U.S. GAAP requires management to make estimates and judgments that affect the reported amounts of assets, liabilities, revenues, expenses and related disclosures. We evaluate our estimates and judgments on an ongoing basis. Estimates and judgments are based on historical experience, forecasted events and various other assumptions that we believe
67
to be reasonable under the circumstances; however, actual results could differ from those estimates. Our management believes the accounting policies below are critical in the portrayal of our financial condition and results of operations and require management’s most difficult, subjective or complex judgments.
Our discussion of critical accounting estimates is intended to supplement our summary of significant accounting policies so that readers will have greater insight into the uncertainties involved in applying our critical accounting policies and estimates. For a summary of our significant accounting policies, see “Item 8. Financial Statements and Supplementary Data – Notes to Consolidated Financial Statements – Significant Accounting Policies.”
Business Acquisitions: Accounting for acquisitions requires us to estimate the fair value of consideration paid and the individual assets and liabilities acquired, which involves a number of judgments, assumptions and estimates that could materially affect the amount and timing of costs recognized in subsequent periods. We typically obtain independent third-party valuation studies to assist in determining fair values, including assistance in determining future cash flows, discount rates and comparable market values. Items involving significant assumptions, estimates and judgments include the following:
•Fair value of consideration paid or transferred (including contingent consideration);
•Inventory, including estimated future selling prices, timing of product sales and completion costs for work in process;
•Property, plant and equipment, including determination of values in a continued-use model;
•Intangible assets, including valuation methodology, estimates of future revenues and costs, profit allocation rates attributable to the acquired technology and discount rates;
•Debt and other liabilities, including discount rate and timing of payments; and
•Deferred taxes, including projections of future taxable income and tax rates.
The valuation of contingent consideration in connection with an acquisition may be inherently challenging due to the dependence on the occurrence of future events and complex payment provisions. Estimating the fair value of contingent consideration at an acquisition date and in subsequent periods involves significant judgments, including projecting future average selling prices, future sales volumes, manufacturing costs and gross margins. To project average selling prices and sales volumes, we review recent sales volumes, existing customer orders, current prices and other factors such as industry analyses of supply and demand, seasonal factors, general economic trends and other information. To project manufacturing costs, we must estimate future production levels and costs of production, including labor, materials and other overhead costs. Actual selling prices and sales volumes, as well as levels and costs of production, can often vary significantly from projected amounts.
Income Taxes: We are required to estimate our provision for income taxes and amounts ultimately payable or recoverable in numerous tax jurisdictions around the world. These estimates involve significant judgment and interpretations of regulations and are inherently complex. Resolution of income tax treatments in individual jurisdictions may not be known for many years after completion of the applicable year. We are also required to evaluate the realizability of our deferred tax assets on an ongoing basis in accordance with U.S. GAAP, which requires the assessment of our performance and other relevant factors. Realization of deferred tax assets is dependent on our ability to generate future taxable income. Our income tax provision or benefit is dependent, in part, on our ability to forecast future taxable income in various jurisdictions. Such forecasts are inherently difficult and involve significant judgments including, among others, projecting future average selling prices and sales volumes, manufacturing and overhead costs and other factors that significantly impact our analyses of the amount of net deferred tax assets that are more likely than not to be realized.
Inventories: Inventories are stated at the lower of cost or net realizable value. In our Optimized LED segment, cost is determined on a first-in, first-out basis. For all other segments, inventory value is determined on a specific identification basis for material and an allocation of labor and manufacturing overhead. At each balance sheet date, we evaluate ending inventories for excess quantities and obsolescence, including analyses of sales levels by product family, historical demand and forecasted demand in relation to inventory on hand, competitiveness of product offerings, market conditions and product life cycles. From time to time, our customers may request that we purchase and maintain significant inventory of raw materials for specific programs. Such inventory purchases are evaluated for excess quantities and potential obsolescence and could result in a provision at the time of purchase or subsequent to purchase. Inventory levels may fluctuate based on inventory held under service arrangements. Our provision for excess and obsolete inventory is also impacted by our arrangements with our customers and/or suppliers, including our ability or inability to resell such inventory to them.
68
Goodwill and Intangible Assets: We test goodwill for impairment in our fourth quarter each year, or more frequently if indicators of an impairment exist, to determine whether it is more likely than not that the fair value of the reporting unit with goodwill is less than its carrying value. For reporting units for which we conclude that it is more likely than not that the fair value is more than its carrying value, goodwill is considered not impaired and we are not required to perform the goodwill impairment test. Qualitative factors considered in this assessment include industry and market considerations, overall financial performance and other relevant events and factors affecting the fair value of the reporting unit. For reporting units for which this assessment concludes that it is more likely than not that the fair value is below the carrying value, goodwill is tested for impairment by determining the fair value of the reporting unit and comparing it to the carrying value of the net assets assigned to the reporting unit. If the fair value of the reporting unit exceeds its carrying value, goodwill is considered not impaired. If the carrying value of the reporting unit exceeds its fair value, we would record an impairment loss up to the difference between the carrying value and implied fair value.
Determining when to test for impairment, the reporting units, the assets and liabilities of the reporting unit and the fair value of the reporting unit requires significant judgment and involves the use of significant estimates and assumptions. These estimates and assumptions include revenue growth rates, forecasted manufacturing costs, budgets and other expenses developed as part of our long-range planning process. We test the reasonableness of the output of our long-range planning process by calculating an implied value per share and comparing that to current stock prices, analysts’ consensus pricing and management’s expectations. These estimates and assumptions are used to calculate projected future cash flows for the reporting unit, which are discounted using a risk-adjusted rate to estimate a fair value. We base fair value estimates on assumptions we believe to be reasonable but that are unpredictable and inherently uncertain. Actual future results may differ from those estimates.
We test other identified intangible assets with definite useful lives when events and circumstances indicate the carrying value may not be recoverable by comparing the carrying amount to the sum of undiscounted cash flows expected to be generated by the asset. Estimating fair values involves significant assumptions, including future sales prices, sales volumes, costs and discount rates.
Revenue Recognition: We recognize revenue based on the transfer of control of goods and services and apply the following five-step approach: (1) identification of a contract with a customer, (2) identification of the performance obligations in the contract, (3) determination of the transaction price, (4) allocation of the transaction price to the performance obligations in the contract and (5) recognition of revenue as performance obligations are satisfied.
Applying the five-step approach in determining whether to recognize revenue at a point in time or over time requires significant judgment. A portion of our revenue is from sales of customized product which, in some cases, are non-cancellable and/or non-refundable. Significant judgment is required to determine when control passes to the customer and whether and when our performance obligations have been satisfied. This determination can significantly affect the timing of recognizing revenue.
Product Revenue: Product revenue is generally recognized when control of the promised goods is transferred to customers. Contracts with customers are generally short-term in duration at fixed, negotiated prices with payment generally due shortly after delivery. We estimate a liability for returns using the expected value method based on historical rates of return. In addition, we generally offer price protection to our distributors, which is a form of variable consideration that decreases the transaction price. We use the expected value method, based on historical price adjustments and current pricing trends, to estimate the amount of revenue recognized from sales to distributors. Differences between the estimated and actual amounts are recognized as adjustments to revenue.
Noncancellable, nonrefundable customized product sales are recognized over time on a cost-incurred basis. In connection with these arrangements, customers obtain control and benefit from products as they are completed. The terms for these arrangements provide us with a legally enforceable right to receive payment, including a reasonable profit margin upon customer cancellation, for performance completed to date. Accordingly, we recognize revenue over time as we complete the manufacture of these products.
A portion of our revenue is derived from the sale of customized products. In certain cases, we recognize revenue when control of the underlying assets passes to the customer when the customer is able to direct the use of, and obtain substantially all of the remaining benefit from, the assets; the customer has the significant risks and rewards associated with ownership of the assets; and we have a present right to payment. Under the terms of
69
these arrangements, we cannot repurpose products without the customer’s consent and accordingly, we recognize revenue at the point in time when products are completed and made available to the customer.
Service Revenue: Our service revenue is derived from professional services and supply chain services. Professional services include solution design, system installation, software automation and managed support services related to HPC and storage systems. Supply chain services include procurement, logistics, inventory management, temporary warehousing, kitting and packaging. While we take title to inventory under such arrangements, control of such inventory does not transfer to us as we do not, at any point, have the ability to direct the use, and thereby obtain the benefits, of the inventory. Service revenue also includes extended warranty, on-site services and subscriptions to our HPC environment.
Agent Services: We provide certain services on an agent basis, whereby we procure product, materials and services on behalf of our customers and then resell such product, materials or services to our customers. Gross amounts invoiced to customers in connection with these agent services include amounts related to the services performed by us in addition to the cost of the product, materials and services procured. However, only the amount related to the agent component is recognized as revenue in our results of operations. We generally recognize revenue for these procurement, logistics and inventory management services upon the completion and/or acceptance of such services, which typically occurs at the time of shipment of product to the customer. Amounts we invoice to customers for the cost of product, materials and services performed, which remain unpaid as of the end of a reporting period, are included in accounts receivable. Additionally, the cost of product and materials procured for customers under these agent services, which remain on hand as of the end of a reporting period, are included in inventories. Amounts in accounts receivable and inventories impact the determination of cash flows from operating activities.
Determining whether we are the principal or agent in these transactions requires significant judgment. This determination affects the amount of revenue we recognize; a principal recognizes revenues at the gross amount received for the goods and services, while an agent recognizes revenue at the net amount. The impact of this determination significantly impacts the amount of revenue and cost of sales we recognize.
Transaction Price: The transaction price is determined based on the consideration to which we will be entitled in exchange for transferring goods or services to the customer. We allocate the transaction price to each distinct product and service based on its relative standalone selling price. The standalone selling price for products primarily involves the cost to produce the deliverable plus the anticipated margin and for services is estimated based on our approved list price.
A portion of our service revenue is from professional services, including installation and other services and hardware and software related support. Each contract may contain multiple performance obligations, which requires the transaction price to be allocated to each performance obligation. We allocate the consideration to each performance obligation based on the relative selling price, determined as the best estimate of the price at which we would transact if we sold the deliverable regularly on a stand-alone basis.
Contract Costs: As a practical expedient, we recognize the incremental costs of obtaining a contract, specifically commission expenses, that have an amortization period of less than 12 months, as an expense when incurred. Additionally, we account for shipping and handling costs, if any, that occur after control transfers to the customer as a fulfillment activity. We record shipping and handling costs related to revenue transactions within cost of sales as a period cost.
Item 7A. Quantitative and Qualitative Disclosure About Market Risk
Foreign Exchange Risk
Our international sales and our operations in foreign countries subject us to risks associated with fluctuating currency values and exchange rates. Because a significant portion of our sales are denominated in U.S. dollars, increases in the value of the U.S. dollar could increase the price of our products so that they become relatively more expensive to customers in a particular country, possibly leading to a reduction in sales and profitability in that country. In addition, we have certain costs that are denominated in foreign currencies, and decreases in the value of the U.S. dollar could result in increases in such costs, which could have a material adverse effect on our results of operations.
70
As a result of our international operations, we generate a portion of our net sales and incur a portion of our expenses in currencies other than the U.S. dollar, such as the Japanese yen, Malaysian ringgit and Chinese renminbi. We present our consolidated financial statements in U.S. dollars and remeasure certain assets and liabilities into U.S. dollars at applicable exchange rates. Consequently, increases or decreases in the value of the U.S. dollar may affect the value of these items with respect to our non-U.S. dollar businesses in our consolidated financial statements, even if their value has not changed in their local currency. Our customer pricing and material cost of sales are generally based on U.S. dollars. Accordingly, the impact of currency fluctuations to our consolidated statements of operations is primarily to our other costs of sales (i.e., non-material components) and our operating expenses as those items are typically denominated in local currency. Our consolidated statements of operations are also impacted by foreign currency gains and losses arising from transactions denominated in a currency other than the U.S. dollar. These translations could significantly affect the comparability of our results between financial periods or result in significant changes to the carrying value of our assets and liabilities. As a result, changes in foreign currency exchange rates impact our reported results.
Based on our monetary assets and liabilities denominated in foreign currencies as of August 29, 2025 and August 30, 2024, we estimate that a 10% adverse change in exchange rates versus the U.S. dollar would result in losses recorded in non-operating expense of $2.7 million and $2.5 million, respectively, to revalue these assets and liabilities.
Interest Rate Risk
We are subject to interest rate risk in connection with our variable-rate debt. As of August 29, 2025, we had $100.0 million outstanding under the 2025 Credit Agreement. In addition, the 2025 Credit Facility under the 2025 Credit Agreement provides for additional borrowings of up to $300.0 million for a total commitment of $400.0 million. Assuming that we would satisfy the financial covenants required to borrow and that the amounts available under the 2025 Credit Facility were fully drawn, a 1.0% increase in interest rates would result in an increase in annual interest expense and a decrease in our cash flows of $4.0 million per year.
As of August 29, 2025, we had cash, cash equivalents and short-term investments of $453.8 million. We maintain our cash and cash equivalents in deposit accounts, money market funds with various financial institutions and in short-duration fixed income securities. Due to the short-term nature of these instruments, we believe that we do not have any material exposure to changes in the fair value of these investments as a result of changes in interest rates. Increases or decreases in interest rates would be expected to augment or reduce future interest income by an insignificant amount.
71
Item 8. Financial Statements and Supplementary Data
Liabilities, Temporary Equity and Stockholders' Equity
Accounts payable and accrued expenses
$
318,761
$
219,090
Current debt
19,945
—
Deferred revenue
73,893
63,954
Other current liabilities
61,300
44,552
Total current liabilities
473,899
327,596
Long-term debt
441,893
657,347
Noncurrent operating lease liabilities
62,736
60,542
Other noncurrent liabilities
30,445
29,813
Total liabilities
1,008,973
1,075,298
Commitments and contingencies
Temporary equity
Preferred stock, $0.03 par value; authorized 30,000 shares; 200 shares of convertible preferred stock issued and outstanding as of August 29, 2025, redemption amount of $200,500; no shares issued or outstanding as of August 30, 2024
202,710
—
Penguin Solutions stockholders’ equity:
Common stock, $0.03 par value; authorized 200,000 shares; 62,756 shares issued and 52,738 shares outstanding as of August 29, 2025; 60,226 shares issued and 53,277 shares outstanding as of August 30, 2024
1,883
1,807
Additional paid-in capital
551,712
513,335
Retained earnings
46,709
29,985
Treasury stock, 10,018 shares and 6,949 shares held as of August 29, 2025 and August 30, 2024, respectively
(206,076)
(153,756)
Accumulated other comprehensive income
18
10
Total Penguin Solutions stockholders’ equity
394,246
391,381
Noncontrolling interest in subsidiary
11,271
7,827
Total stockholders' equity
405,517
399,208
Total liabilities, temporary equity and stockholders' equity
$
1,617,200
$
1,474,506
The accompanying notes are an integral part of these consolidated financial statements.
73
Penguin Solutions, Inc.
Consolidated Statements of Operations
(In thousands, except per share amounts)
Year ended
August 29, 2025
August 30, 2024
August 25, 2023
Net sales:
Products
$
1,072,738
$
925,827
$
1,192,890
Services
263,706
244,969
248,360
Related party
32,350
—
—
Total net sales
1,368,794
1,170,796
1,441,250
Cost of sales:
Products
863,136
722,634
916,005
Services
111,384
107,386
110,074
Total cost of sales
974,520
830,020
1,026,079
Gross profit
394,274
340,776
415,171
Operating expenses:
Research and development
79,801
81,537
90,565
Selling, general and administrative
238,177
233,880
260,722
Impairment of goodwill
16,063
—
19,092
Change in fair value of contingent consideration
—
—
29,000
Other operating expense
2,098
7,064
7,047
Total operating expenses
336,139
322,481
406,426
Operating income
58,135
18,295
8,745
Non-operating (income) expense:
Interest expense, net
7,305
28,378
36,421
Other non-operating expense
1,929
21,084
11,837
Total non-operating expense
9,234
49,462
48,258
Income (loss) before taxes
48,901
(31,167)
(39,513)
Income tax provision (benefit)
20,066
10,618
(49,203)
Net income (loss) from continuing operations
28,835
(41,785)
9,690
Net loss from discontinued operations
—
(8,148)
(195,384)
Net income (loss)
28,835
(49,933)
(185,694)
Net income attributable to noncontrolling interest
3,444
2,539
1,832
Net income (loss) attributable to Penguin Solutions
$
25,391
$
(52,472)
$
(187,526)
Preferred stock dividends
8,667
—
—
Income available for distribution
16,724
(52,472)
(187,526)
Income allocated to participating securities
1,263
—
—
Net income (loss) available to common stockholders
$
15,461
$
(52,472)
$
(187,526)
Basic earnings (loss) per share of common stock:
Continuing operations
$
0.29
$
(0.85)
$
0.16
Discontinued operations
—
(0.15)
(3.94)
$
0.29
$
(1.00)
$
(3.78)
Diluted earnings (loss) per share of common stock:
Continuing operations
$
0.28
$
(0.85)
$
0.15
Discontinued operations
—
(0.15)
(3.80)
$
0.28
$
(1.00)
$
(3.65)
Common stock used in per share calculations:
Basic
53,154
52,428
49,566
Diluted
54,368
52,428
51,322
The accompanying notes are an integral part of these consolidated financial statements.
74
Penguin Solutions, Inc.
Consolidated Statements of Comprehensive Income (Loss)
(In thousands)
Year ended
August 29, 2025
August 30, 2024
August 25, 2023
Net income (loss)
$
28,835
$
(49,933)
$
(185,694)
Other comprehensive income (loss), net of tax:
Cumulative translation adjustment
—
(6,352)
15,686
Cumulative translation adjustment reclassified to net income (loss)
—
212,321
—
Gain (loss) on investments
8
5
5
Comprehensive income (loss)
28,843
156,041
(170,003)
Comprehensive income attributable to noncontrolling interest
3,444
2,539
1,832
Comprehensive income (loss) attributable to Penguin Solutions
$
25,399
$
153,502
$
(171,835)
The accompanying notes are an integral part of these consolidated financial statements.
75
Penguin Solutions, Inc.
Consolidated Statements of Stockholders’ Equity
(In thousands)
Common
Preferred
Shares
Issued
Amount
Shares
Issued
Amount
Additional
Paid-in Capital
Retained
Earnings
Treasury
Shares
Accumulated
Other
Comprehensive
Income (Loss)
Total Penguin
Solutions
Stockholders’
Equity
Non-
controlling
Interest in
Subsidiary
Total
Equity
As of August 26, 2022
52,880
$
1,586
—
$
—
$
448,112
$
251,344
$
(107,776)
$
(221,655)
$
371,611
$
6,935
$
378,546
Net income (loss)
—
—
—
—
—
(187,526)
—
—
(187,526)
1,832
(185,694)
Other comprehensive income (loss)
—
—
—
—
—
—
—
15,691
15,691
—
15,691
Shares issued under equity plans
4,662
140
—
—
42,904
—
—
—
43,044
—
43,044
Repurchase of shares
—
—
—
—
—
—
(24,671)
—
(24,671)
—
(24,671)
Purchase of 2029 Capped Calls
—
—
—
—
(15,090)
—
—
—
(15,090)
—
(15,090)
Settlement of 2026 Capped Calls
—
—
—
—
10,786
—
—
—
10,786
—
10,786
Stock-based compensation expense
—
—
—
—
40,813
—
—
—
40,813
—
40,813
Distribution to noncontrolling interest
—
—
—
—
—
—
—
—
—
(2,009)
(2,009)
Adoption of ASU 2020-06
—
—
—
—
(50,822)
18,639
—
—
(32,183)
—
(32,183)
As of August 25, 2023
57,542
1,726
—
—
476,703
82,457
(132,447)
(205,964)
222,475
6,758
229,233
Net income (loss)
—
—
—
—
—
(52,472)
—
—
(52,472)
2,539
(49,933)
Other comprehensive income (loss)
—
—
—
—
—
—
—
205,974
205,974
—
205,974
Stock issued under equity plans
2,684
81
—
—
9,728
—
—
—
9,809
—
9,809
Repurchase of shares
—
—
—
—
—
—
(21,309)
—
(21,309)
—
(21,309)
Purchase of 2030 Capped Calls
—
—
—
—
(16,300)
—
—
—
(16,300)
—
(16,300)
Stock-based compensation expense
—
—
—
—
43,204
—
—
—
43,204
—
43,204
Distribution to noncontrolling interest
—
—
—
—
—
—
—
—
—
(1,470)
(1,470)
As of August 30, 2024
60,226
1,807
—
—
513,335
29,985
(153,756)
10
391,381
7,827
399,208
Net income
—
—
—
—
—
25,391
—
—
25,391
3,444
28,835
Other comprehensive income (loss)
—
—
—
—
—
—
—
8
8
—
8
Stock issued under equity plans
2,530
76
—
—
8,728
—
—
—
8,804
—
8,804
Repurchase of shares
—
—
—
—
—
—
(52,320)
—
(52,320)
—
(52,320)
Stock-based compensation expense
—
—
—
—
41,176
—
—
—
41,176
—
41,176
Issuance of preferred stock
—
—
200
6
191,177
—
—
—
191,183
—
191,183
Preferred stock dividends
—
—
—
—
—
(8,667)
—
—
(8,667)
—
(8,667)
Preferred stock reclassified to Temporary equity
—
—
(200)
(6)
(202,704)
—
—
—
(202,710)
—
(202,710)
As of August 29, 2025
62,756
$
1,883
—
$
—
$
551,712
$
46,709
$
(206,076)
$
18
$
394,246
$
11,271
$
405,517
The accompanying notes are an integral part of these consolidated financial statements.
76
Penguin Solutions, Inc.
Consolidated Statements of Cash Flows
(In thousands)
Year Ended
August 29, 2025
August 30, 2024
August 25, 2023
Cash flows from operating activities
Net income (loss)
$
28,835
$
(49,933)
$
(185,694)
Net loss from discontinued operations
—
(8,148)
(195,384)
Net income (loss) from continuing operations
28,835
(41,785)
9,690
Adjustments to reconcile net income (loss) from continuing operations to net cash provided by operating activities:
Depreciation expense and amortization of intangible assets
56,216
65,716
71,632
Amortization of debt issuance costs
3,493
3,724
4,064
Stock-based compensation expense
41,176
43,160
39,228
Impairment of goodwill
16,063
—
19,092
Change in fair value of contingent consideration
—
—
29,000
Loss on extinguishment debt
2,908
22,763
15,924
Deferred income taxes, net
(14,112)
(11,042)
(63,603)
Other
(2,293)
(2,689)
4,008
Changes in operating assets and liabilities:
Accounts receivable
(56,160)
(32,495)
162,515
Inventories
(101,610)
23,765
95,217
Other assets
7,653
9,098
6,767
Accounts payable and accrued expenses and other liabilities
131,014
54,306
(256,133)
Payment of acquisition-related contingent consideration
—
(29,000)
(73,724)
Net cash provided by operating activities from continuing operations
113,183
105,521
63,677
Net cash used for operating activities from discontinued operations
(4,099)
(28,336)
40,710
Net cash provided by operating activities
109,084
77,185
104,387
Cash flows from investing activities
Capital expenditures and deposits on equipment
(9,012)
(19,424)
(39,421)
Proceeds from sales and maturities of investment securities
66,361
39,395
—
Purchases of held-to-maturity investment securities
(59,066)
(19,503)
(25,015)
Purchases of non-marketable investments
—
(11,000)
(4,150)
Acquisition of business, net of cash acquired
—
—
(213,073)
Other
(1,660)
(1,272)
475
Net cash used for investing activities from continuing operations
(3,377)
(11,804)
(281,184)
Net cash provided by investing activities from discontinued operations
28,350
119,389
(17,385)
Net cash provided by investing activities
24,973
107,585
(298,569)
Cash flows from financing activities
Repayments of debt
(300,015)
(351,337)
(21,634)
Payments to acquire common stock
(52,320)
(21,309)
(24,671)
Payment of acquisition-related contingent consideration
—
(21,000)
(28,100)
Net cash paid for settlement and purchase of capped calls
—
(16,300)
(4,304)
Distribution to noncontrolling interest
—
(1,470)
(2,009)
Proceeds from debt
—
192,694
295,287
Proceeds from issuance of common stock
8,804
9,809
43,045
Payment of premium in connection with convertible note exchange
—
—
(14,141)
Payment of preferred stock cash dividends
(7,860)
—
—
Proceeds from issuance of convertible preferred stock, net of issuance costs
191,182
—
—
Proceeds from borrowing under line of credit
100,000
—
—
Fees paid for revolving line of credit financing
(3,255)
—
—
Other
—
(582)
(6,252)
Net cash provided by (used for) financing activities from continuing operations
(63,464)
(209,495)
237,221
Net cash used for financing activities from discontinued operations
—
(606)
(805)
Net cash provided by (used for) financing activities
(63,464)
(210,101)
236,416
Effect of changes in currency exchange rates
—
(1,256)
4,765
Net increase (decrease) in cash, cash equivalents and restricted cash
70,593
(26,587)
46,999
Cash, cash equivalents and restricted cash at beginning of period
383,477
410,064
363,065
Cash, cash equivalents and restricted cash at end of period
$
454,070
$
383,477
$
410,064
Cash, cash equivalents and restricted cash at end of period:
Continuing operations
$
454,070
$
383,477
$
365,563
Discontinued operations
—
—
44,501
$
454,070
$
383,477
$
410,064
The accompanying notes are an integral part of these consolidated financial statements.
77
Penguin Solutions, Inc.
Notes to Consolidated Financial Statements
(Tabular amounts in thousands, except per share amounts)
Significant Accounting Policies
Basis of Presentation
U.S. Domestication: On June 30, 2025, we consummated the redomiciliation of the parent company of our corporate group, Penguin Solutions (Cayman), Inc., formerly known as Penguin Solutions, Inc., a Cayman Islands exempted company (“Penguin Solutions Cayman”), from the Cayman Islands to the State of Delaware in the United States, resulting in Penguin Solutions, Inc., a Delaware corporation (“Penguin Solutions Delaware”), becoming our publicly traded parent company (the “U.S. Domestication”). The U.S. Domestication was approved by the shareholders of Penguin Solutions Cayman and effected via a court-sanctioned scheme of arrangement under Cayman Islands law, pursuant to which each ordinary share of Penguin Solutions Cayman was exchanged for one share of common stock of Penguin Solutions Delaware, and each convertible preferred share of Penguin Solutions Cayman was exchanged for one share of convertible preferred stock of Penguin Solutions Delaware.
The accompanying consolidated financial statements include the accounts of Penguin Solutions Cayman and its consolidated subsidiaries prior to the consummation of the U.S. Domestication and the accounts of Penguin Solutions Delaware and its consolidated subsidiaries after the consummation of the U.S. Domestication, and have been prepared in accordance with accounting principles generally accepted in the United States of America. Unless stated otherwise or the context otherwise requires, references to “Penguin Solutions,” “we,” “us,” “our,” and the “Company” in the accompanying consolidated financial statements (i) for periods prior to the consummation of the U.S. Domestication refer to Penguin Solutions Cayman and its consolidated subsidiaries and (ii) for periods at or after the consummation of the U.S. Domestication refer to Penguin Solutions Delaware and its consolidated subsidiaries. Intercompany balances and transactions have been eliminated in consolidation.
Company Name Change: On October 15, 2024, we changed our name from SMART Global Holdings, Inc. to Penguin Solutions, Inc. The change reflects our focus on key areas such as artificial intelligence (“AI”) infrastructure deployment, advanced memory enterprise solutions and high-performance computing (“HPC”).
Presentation of SMART Brazil as Discontinued Operations: On June 13, 2023, we entered into an agreement to divest of an 81% interest in SMART Modular Technologies do Brasil – Indústria e Comércio de Componentes Ltda. (“SMART Brazil”). We concluded that, as of August 25, 2023, (i) the net assets of SMART Brazil met the criteria for classification as held for sale and (ii) the proposed sale represented a strategic shift that was expected to have a major effect on our operations and financial results. On November 29, 2023, we completed the divestiture. The balance sheets, results of operations and cash flows of SMART Brazil have been presented as discontinued operations for all periods presented. SMART Brazil was previously included within our Integrated Memory segment. See “Divestiture of SMART Brazil.”
Unless otherwise noted, amounts and discussion within these notes to the consolidated financial statements relate to our continuing operations.
Reclassifications: Certain reclassifications have been made to prior period amounts to conform to current period presentation.
Fiscal Year: Our fiscal year is the 52- or 53-week period ending on the last Friday in August. Fiscal years 2025, 2024 and 2023 contained 52, 53 and 52 weeks, respectively. All period references are to our fiscal periods unless otherwise indicated.
Financial information for our subsidiaries in Brazil was included in our consolidated financial statements on a one-month lag because their fiscal years ended on July 31 of each year. In connection with the completion of the divestiture of an 81% interest in SMART Brazil, we ceased consolidating the operations of SMART Brazil in our financial statements as of the November 29, 2023 disposal date. As a result, financial information for the first
78
quarter of 2024 included the four-month period for our SMART Brazil operations from August 1, 2023 to November 29, 2023.
Cash, Cash Equivalents and Short-term Investments
Cash equivalents include highly liquid investments, readily convertible to known amounts of cash, with original maturities of three months or less. Investments with original maturities of greater than three months and remaining maturities of less than one year are classified as short-term investments.
Cash paid for interest, net of amounts capitalized, was $26.2 million, $47.7 million and $41.8 million for 2025, 2024 and 2023, respectively. Income taxes paid, net of refunds, were $34.5 million, $13.1 million and $35.5 million for 2025, 2024 and 2023, respectively.
Derivative Instruments
We use derivative instruments to manage our exposure to changes in currency exchange rates from certain monetary assets and liabilities denominated in currencies other than the U.S. dollar. Derivative instruments are measured at their fair values and recognized as either assets or liabilities. The accounting for changes in the fair value of derivative instruments is based on the intended use of the derivative and the resulting designation. For derivative instruments that are not designated for hedge accounting, gains or losses from changes in fair values are recognized in other non-operating (income) expense. We do not use foreign currency contracts for speculative or trading purposes.
Fair Value Measurements
We measure and report certain financial assets and liabilities at fair value, which is defined as the price that would be received to sell an asset or paid to transfer a liability in an orderly transaction between market participants on the measurement date. U.S. GAAP has established a hierarchy for inputs used in measuring fair value that maximizes the use of observable inputs and minimizes the use of unobservable inputs by requiring that the most observable inputs be used when available. Observable inputs are those that can be obtained from independent sources and can be validated by a third party, whereas unobservable inputs reflect assumptions regarding what a third party might use in pricing an asset or liability. The fair value hierarchy is categorized into three levels, based on the reliability of inputs, as follows:
•Level 1 – Valuations based on quoted prices in active markets for identical assets or liabilities;
•Level 2 – Valuations based on inputs other than quoted prices included within Level 1 that are observable for the asset or liability, either directly or indirectly; and
•Level 3 – Valuations based on unobservable inputs for the asset or liability.
Functional Currency
The functional currency for all of our operations is the U.S. dollar. Monetary balances recorded in currencies other than the U.S. dollar are remeasured into U.S. dollars at prevailing exchange rates in effect as of the end of each reporting period. Gains or losses resulting from the remeasurement of monetary balances are recognized in other non-operating (income) expense.
Goodwill
We test goodwill for impairment in the fourth quarter of each year, or more frequently if indicators of an impairment exist, to determine whether it is more likely than not that the fair value of a reporting unit with goodwill is less than its carrying value. Qualitative factors considered in this assessment include industry and market considerations, overall financial performance and other relevant events and factors affecting the fair value of a reporting unit. In 2025 and 2023, we recorded aggregate goodwill impairment charges of $16.1 million and $19.1 million, respectively under the Penguin Edge reporting unit. No impairment was recognized in 2024. Other than these impairment charges, there has been no impairment of goodwill for any of our other reporting units. See “Intangible Assets and Goodwill.”
79
Income Taxes
We recognize current and deferred income taxes based on reported income before income taxes. Deferred income taxes reflect the effect of temporary differences and carryforwards recognized for financial reporting and income tax purposes. Deferred tax assets and liabilities are recognized based on the differences between the financial statement carrying amounts of assets and liabilities and their respective tax bases, utilizing tax rates that are expected to apply in the years in which temporary differences are expected to be recovered or settled. We recognize valuation allowances to reduce deferred tax assets to the amounts that we estimate, based on available evidence and management judgment, will more likely than not be realized. We record a valuation allowance in the period the determination is made that all or part of the net deferred tax assets will not be realized. We record interest and penalties related to unrecognized tax benefits in tax expense.
Intangible Assets
Intangible assets are stated at cost and amortized on a straight-line basis over their estimated useful lives of generally 5 to 19 years for technology, 6 to 8 years for customer relationships and 5 to 10 years for trademarks and trade names. Intangible assets are retired in the period they become fully amortized.
We review the carrying value of identified intangible assets for impairment when events and circumstances indicate that their carrying value may not be recoverable from the estimated future cash flows expected to result from their use and/or disposition. In cases where undiscounted expected future cash flows are less than the carrying value, an impairment loss is recognized equal to the amount by which the carrying value exceeds the estimated fair value of the identifiable intangible assets.
Inventories
Inventories are stated at the lower of cost or net realizable value. In our Optimized LED segment, cost is determined on a first-in, first-out basis. For our other segments, inventory value is determined on a specific identification basis for material and an allocation of labor and manufacturing overhead. At each balance sheet date, we evaluate ending inventories for excess quantities and obsolescence, including analyses of sales levels by product family, historical demand and forecasted demand in relation to inventory on hand, competitiveness of product offerings, market conditions and product life cycles.
Leases
We have operating leases through which we acquire or utilize facilities, offices and equipment in our manufacturing operations, research and development activities and selling, general and administrative functions. In determining the lease term, we assess whether it is reasonably certain we will exercise options to renew or terminate a lease and when or whether we would exercise an option to purchase the right-of-use asset. Measuring the present value of the initial lease liability requires exercising judgment to determine the discount rate, which we base on interest rates for similar borrowings issued by entities with credit ratings similar to ours.
We recognize right-of use assets and corresponding lease liabilities for leases with an initial term of more than 12 months and do not separate lease and non-lease components. Recognized leases are included in operating lease right-of-use assets and corresponding lease liabilities are included in other current liabilities or noncurrent operating lease liabilities. For operating leases of buildings, we account for non-lease components, such as common area maintenance, as a component of the lease and include the components in the initial measurement of our right-of-use assets and corresponding liabilities. Operating lease assets are amortized on a straight-line basis over the lease term.
Property and Equipment
Property and equipment is stated at cost and depreciated using the straight-line method over estimated useful lives of generally 2 to 8 years for equipment, 5 to 40 years for buildings and building improvements and 2 to 5 years for furniture, fixtures and software. Land leases are amortized using the straight-line method over their lease terms, which expire from 2057 to 2082.
We review the carrying value of property and equipment for impairment when events and circumstances indicate that the carrying value of an asset or group of assets may not be recoverable from the estimated future cash flows
80
expected to result from its use and/or disposition. In cases where undiscounted expected future cash flows are less than the carrying value, an impairment loss is recognized equal to the amount by which the carrying value exceeds the estimated fair value of the assets.
Research and Development
Research and development expenditures are expensed in the period incurred.
Revenue Recognition
We recognize revenue based on the transfer of control of goods and services and apply the following five-step approach: (1) identification of a contract with a customer, (2) identification of the performance obligations in the contract, (3) determination of the transaction price, (4) allocation of the transaction price to the performance obligations in the contract and (5) recognition of revenue as performance obligations are satisfied.
Product Revenue: Product revenue is generally recognized when control of the promised goods is transferred to customers. Contracts with customers are generally short-term in duration at fixed, negotiated prices with payment generally due shortly after delivery. We estimate a liability for returns using the expected value method based on historical rates of return. In addition, we generally offer price protection to our distributors, which is a form of variable consideration that decreases the transaction price. We use the expected value method, based on historical price adjustments and current pricing trends, to estimate the amount of revenue recognized from sales to distributors. Differences between the estimated and actual amounts are recognized as adjustments to revenue.
Noncancellable, nonrefundable customized product sales are recognized over time on a cost-incurred basis. In connection with these arrangements, customers obtain control and benefit from products as they are completed. The terms for these arrangements provide us with a legally enforceable right to receive payment, including a reasonable profit margin, upon customer cancellation for performance completed to date. Accordingly, we recognize revenue over time as we complete the manufacture of these products.
A portion of our revenue is derived from the sale of customized products. In certain cases, we recognize revenue when control of the underlying assets passes to the customer when the customer is able to direct the use of, and obtain substantially all of the remaining benefit from, the assets; the customer has the significant risks and rewards associated with ownership of the assets; and we have a present right to payment. Under the terms of these arrangements, we cannot repurpose products without the customer’s consent and accordingly, we recognize revenue at the point in time when products are completed and made available to the customer.
Service Revenue: Our service revenue is derived from professional services and supply chain services. Professional services include solution design, system installation, software automation and managed support services related to HPC and storage systems. Revenue from professional services and managed services is recognized based on the nature of the service and terms of the agreements based on the transfer of control. Design and system installations revenue is recognized upon completion of the services, whereas, managed support services and extended warranties revenue is recognized over-time as the services are provided. Supply chain services includes procurement, logistics, inventory management, temporary warehousing, kitting and packaging. While we take title to inventory under such arrangements, control of such inventory does not transfer to us as we do not, at any point, have the ability to direct the use, and thereby obtain the benefits, of the inventory. Revenue from supply chain services is recognized on a net basis as the service is provided to the customer. Revenue for these services is typically recognized at the point in time when the underlying goods are shipped to the customer.
Agent Services: We provide certain services on an agent basis, where we procure product, materials and services on behalf of our customers and then resell such product, materials or services to our customers. Gross amounts invoiced to customers in connection with these agent services include amounts related to the services performed by us in addition to the cost of the product, materials and services procured. However, only the amount related to the agent component is recognized as revenue in our results of operations. We generally recognize revenue for these procurement, logistics and inventory management services upon the completion and/or acceptance of such services, which typically occurs at the time of shipment of product to the customer. Amounts we invoice to customers for the cost of product, materials and services performed, which remain unpaid as of the end of a reporting period, are included in accounts receivable. Additionally, the cost of product and materials procured for customers under these agent services, which remain on hand as of the end of a reporting period, are included in
81
inventories. Amounts in accounts receivable and inventories impact the determination of cash flows from operating activities.
Transaction Price: The transaction price is determined based on the consideration to which we will be entitled in exchange for transferring goods or services to the customer. We allocate the transaction price to each distinct product and service based on its relative standalone selling price. The standalone selling price for products primarily involves the cost to produce the deliverable plus the anticipated margin and for services is estimated based on our approved list price.
A portion of our service revenue is from professional services, including installation and other services and hardware and software related support. Each contract may contain multiple performance obligations, which requires the transaction price to be allocated to each performance obligation. We allocate the consideration to each performance obligation based on the relative selling price, determined as the best estimate of the price at which we would transact if it sold the deliverable regularly on a stand-alone basis.
Contract Costs: As a practical expedient, we recognize the incremental costs of obtaining a contract, specifically commission expenses, that have an amortization period of less than 12 months as an expense when incurred. Additionally, we account for shipping and handling costs, if any, that occur after control transfers to the customer as a fulfillment activity. We record shipping and handling costs related to revenue transactions within cost of sales as a period cost.
Stock-Based Compensation
Stock-based compensation is measured at the grant date, based on the fair value of the award, and recognized as expense under the straight-line attribution method over the requisite service period. We account for forfeitures as they occur.
Treasury Shares
Treasury shares are carried at cost. When treasury shares are retired, any excess of the repurchase price paid over par value is allocated between additional capital and retained earnings.
Use of Estimates
The preparation of financial statements and related disclosures in conformity with accounting principles generally accepted in the United States of America requires that we make estimates and judgments that affect the reported amounts of assets, liabilities, revenues, expenses and related disclosures. Estimates and judgments are based on historical experience, forecasted events and various other assumptions. Significant items subject to such estimates and assumptions include business acquisitions and divestitures, income taxes, inventories, goodwill and intangible assets, property and equipment, revenue recognition and stock-based compensation. Actual results could differ from the estimates made by management.
Related Party Transactions
A related party is generally defined as (i) any person that holds 10% or more of the Company’s securities and their immediate family members, (ii) the Company’s management, (iii) someone that directly or indirectly controls, is controlled by or is under common control with the Company or (iv) anyone who can significantly influence the financial and operating decisions of the Company. A transaction is considered to be a related party transaction when there is a transfer of resources or obligations between related parties.
Preferred Stock Investment
On December 13, 2024, we closed the SKT Investment (as defined below). Pursuant to the terms of the Securities Purchase Agreement (the “SKT Purchase Agreement”) by and between Penguin Solutions and SK Telecom Co., Ltd. (“SKT”), we sold to Astra AI Infra LLC (“Astra AI Infra”), an affiliate of SKT, 200,000 convertible preferred shares, par value $0.03 per share, of Penguin Solutions (the “Issued Cayman CPS”) at a price of $1,000 per share or an aggregate price of $200.0 million (the “SKT Investment”).
82
Additionally, on the closing date of the SKT Investment, we and Astra AI Infra entered into an Investor Agreement (the “Investor Agreement”), and the Certificate of Designation relating to the Issued Cayman CPS (the “CPS Cayman Certificate of Designation”) became effective. The Investor Agreement and the CPS Cayman Certificate of Designation provided for certain rights and restrictions relating to the SKT Investment, including but not limited to board representation rights, pro rata rights, registration rights and consent rights, and standstill provisions, disposition restrictions and voting obligations.
Amended and Restated Investor Agreement
On June 30, 2025, effective upon consummation of the U.S. Domestication, Penguin Solutions Delaware assumed the Investor Agreement from Penguin Solutions Cayman and Penguin Solutions Delaware and SKT amended and restated the Investor Agreement (as amended and restated, the “Amended and Restated Investor Agreement”) such that the rights and restrictions relating to SKT’s beneficial ownership of the Issued Cayman CPS in place prior to the U.S. Domestication apply in respect of SKT’s holdings of Issued CPS (as defined below) following consummation of the U.S. Domestication.
Delaware Certificate of Designation for Convertible Preferred Stock
On June 27, 2025, in connection with the U.S. Domestication, Penguin Solutions Delaware executed and adopted a Certificate of Designation of Convertible Preferred Stock (the “CPS Delaware Certificate of Designation”) that sets forth the terms, rights and obligations of a series of 200,000 shares of preferred stock of Penguin Solutions Delaware, par value $0.03 per share, designated as convertible preferred stock (the “Issued CPS”). The principal attributes of the Issued Cayman CPS and the Issued CPS are substantially the same, with changes to give effect to requirements of Delaware law.
The Issued CPS have an initial liquidation preference of 1x. Shares of Issued CPS are not redeemable upon or repurchased upon the election of the holders of shares of Issued CPS and are only redeemable, at our option, in one installment upon notice, provided that no such notice shall be sent until at least five years after the date of the closing of the SKT Investment. The shares of Issued CPS vote together with the common stock, par value $0.03 per share, of Penguin Solutions, on an as-converted basis, and entitle the holder to receive dividends of six percent per annum, cumulative, payable quarterly in-kind or in cash at our option, subject to certain conditions.
The holder of shares of Issued CPS may convert the shares of Issued CPS into common stock at any time, provided that the Issued CPS may, at our option, automatically be converted into common stock on any date following the second anniversary of the closing of the SKT Investment upon which the volume-weighted average price of the common stock for any 15 consecutive trading day period equals or exceeds 150% of the then-applicable conversion price. The shares of Issued CPS are convertible into common stock at an initial conversion price of $32.81, subject to adjustment upon the occurrence of certain events. Holders of Issued CPS are also entitled to certain protective provisions.
For more details, refer to the CPS Delaware Certificate of Designation, filed as Exhibit 3.3 hereto, to the description of the Issued CPS contained in the description of the Registrant’s capital stock, filed as Exhibit 4.1 hereto, and to the information under the heading “Comparison of Rights of Cayman Islands Shareholders and Delaware Stockholders” in Penguin Solutions Cayman’s definitive proxy statement on Schedule 14A filed with the SEC on May 2, 2025.
Assumption and Amendment and Restatement of Equity Plans
Effective upon the completion of the U.S. Domestication, Penguin Solutions Delaware assumed Penguin Solutions Cayman’s equity incentive plans and all outstanding awards and rights thereunder and amended and restated each plan in the form of the Amended and Restated 2017 Stock Incentive Plan, the Amended and Restated 2021 Inducement Plan and the Amended and Restated 2018 Employee Stock Purchase Plan (together with any applicable predecessor plans, the “Incentive Plans”), to provide, among other things, that Penguin Solutions Delaware common stock will be issued, held, available for issuance or used to measure or satisfy benefits as appropriate under the Incentive Plans, in substitution for Penguin Solutions Cayman ordinary shares. The assumed awards and rights have substantially the same terms and conditions that applied prior to the consummation of the U.S. Domestication (including any applicable vesting and change in control provisions and the U.S. Domestication did not constitute a change in control for the purposes of such provisions).
83
Divestiture of SMART Brazil
Overview of Transaction
On November 29, 2023, we completed the divestiture of SMART Brazil pursuant to the terms of that certain Stock Purchase Agreement (the “Brazil Purchase Agreement”), by and among SMART Modular Technologies (LX) S.à r.l., a société à responsabilité limitée governed by the laws of the Grand Duchy of Luxembourg and a wholly owned subsidiary of Penguin Solutions (the “Brazil Seller”), Lexar Europe B.V., a company organized under the laws of The Netherlands (the “Brazil Purchaser”), Shenzhen Longsys Electronics Co., Ltd., a company limited by shares governed by the laws of the People’s Republic of China (“Longsys”), solely with respect to certain provisions therein, Shanghai Intelligent Memory Semiconductor Co., Ltd., a limited liability company governed by the laws of the People’s Republic of China and, solely with respect to certain provisions therein, Penguin Solutions.
Pursuant to the Brazil Purchase Agreement, Brazil Seller sold to Brazil Purchaser, and Brazil Purchaser purchased from Brazil Seller, 81% of Brazil Seller’s right, title and interest in and to the outstanding quotas of SMART Brazil, with Brazil Seller retaining a 19% interest in SMART Brazil (the “Retained Interest”) (the “Brazil Divestiture”).
At the closing of the Brazil Divestiture, Brazil Purchaser paid to Brazil Seller (based on a total enterprise value of $204.6 million for SMART Brazil) an upfront cash purchase price, subject to certain customary adjustments as set forth in the Brazil Purchase Agreement. In addition, pursuant to the Brazil Purchase Agreement, Brazil Seller has a right to receive, and Brazil Purchaser is obligated to pay, (i) a deferred payment due 18 months following the closing and (ii) subject to and at the time of exercise of the Put/Call Option (as defined below), an additional deferred cash adjustment equal to 19% of the amount of SMART Brazil’s net cash as of the closing (as calculated pursuant to the Brazil Purchase Agreement).
Put/Call Option: Pursuant to the Brazil Purchase Agreement, at the closing, SMART Brazil, Brazil Seller, Brazil Purchaser and Longsys entered into a Quotaholders Agreement, which provides Brazil Seller with a put option to sell the Retained Interest in SMART Brazil to Brazil Purchaser (the “Put Option”) during three exercise windows following SMART Brazil’s fiscal years ending December 31, 2026, December 31, 2027 or December 31, 2028 (the “Exercise Windows”), with such Exercise Windows beginning on June 15, 2027 and ending on July 15, 2027, beginning on June 15, 2028 and ending on July 15, 2028 and beginning on June 15, 2029 and ending on July 15, 2029, respectively. A call option has also been granted to Brazil Purchaser to require Brazil Seller to sell the Retained Interest to Brazil Purchaser during the Exercise Windows (together with the Put Option, the “Put/Call Option”). The price for the Put/Call Option is based on a 100% enterprise value of 7.5x net income for SMART Brazil for the preceding fiscal year at the time of exercise.
Total consideration in exchange for the sale of an 81% interest in SMART Brazil amounted to $194.1 million which included cash at closing of $164.9 million, a deferred payment with fair value of $25.4 million and a deferred cash adjustment with a fair value of $3.7 million. The deferred payment, comprised of a notional amount of $28.4 million discounted at 7.5%, was received in May 2025. The deferred payment is included in other current assets in the accompanying consolidated balance sheets for prior periods presented. The fair value of the deferred cash adjustment, comprised of a notional amount of $4.8 million discounted at 7.5%, equal to 19% of the amount of SMART Brazil’s net cash as of the closing (as calculated pursuant to the Brazil Purchase Agreement). The deferred cash adjustment, which is accounted for as a derivative financial instrument, is due at the time of exercise of the Put/Call Option and was included in other noncurrent assets in the accompanying consolidated balance sheet.
Presentation of SMART Brazil Operations
As of August 25, 2023, we concluded that the net assets of SMART Brazil met the criteria for classification as held for sale. In addition, the divestiture of SMART Brazil was expected to have a major effect on our operations and financial results. As a result, we have presented the results of operations, cash flows and financial position of SMART Brazil as discontinued operations in the accompanying consolidated financial statements and notes for all periods presented.
A disposal group classified as held for sale is measured at the lower of its carrying amount or fair value less costs to sell. Accordingly, we evaluated the carrying value of the net assets of SMART Brazil (including $206.3 million
84
recognized within stockholders’ equity related to the cumulative translation adjustment from SMART Brazil), estimated costs to sell and expected proceeds and concluded the net assets were impaired as of August 25, 2023. As a result, we recognized an impairment charge of $153.0 million in the fourth quarter of 2023 to write down the carrying value of the net assets of SMART Brazil. In addition, we concluded that the outside basis of SMART Brazil inclusive of any withholding taxes should be recognized upon the classification as held for sale as of August 25, 2023. Accordingly, we recognized withholding taxes on the expected capital gain and deferred tax liabilities of $28.6 million in 2023.
Assets and liabilities of SMART Brazil as of the November 29, 2023 disposal date and as of August 25, 2023 were as follows:
As of
November 29, 2023
August 25, 2023
Cash and cash equivalents
$
40,927
$
44,501
Accounts receivable, net
16,482
17,055
Inventories
26,103
25,877
Other current assets
17,800
17,732
Total current assets
101,312
105,165
Property and equipment, net
66,870
58,321
Operating lease right-of-use assets
6,912
5,213
Goodwill
19,856
20,668
Other noncurrent assets
27,490
34,243
Total assets
222,440
223,610
Impairment of SMART Brazil assets
(153,036)
(153,036)
Total assets, net of impairment
69,404
70,574
Accounts payable and accrued expenses
20,576
25,867
Current debt
3,872
4,006
Other current liabilities
1,023
1,030
Total current liabilities
25,471
30,903
Long-term debt
11,938
13,689
Noncurrent operating lease liabilities
5,686
4,614
Noncurrent deferred tax liabilities
28,564
28,564
Other noncurrent liabilities
93
—
Total liabilities
71,752
77,770
Net assets (liabilities) of discontinued operations
$
(2,348)
$
(7,196)
Reported as:
Current assets of discontinued operations
$
70,574
Current liabilities of discontinued operations
77,770
Net assets (liabilities) of discontinued operations
$
(7,196)
85
The following table presents the results of operations for SMART Brazil:
Year ended
August 30, 2024
August 25, 2023
Net sales
$
55,159
$
185,377
Cost of sales
50,560
184,016
Gross profit
4,599
1,361
Operating expenses:
Research and development
157
5,887
Selling, general and administrative
5,421
12,509
Other operating (income) expense
64
657
Total operating expenses
5,642
19,053
Operating income (loss)
(1,043)
(17,692)
Non-operating (income) expense:
Loss from divestiture of 81% interest in SMART Brazil
10,888
153,036
Interest (income) expense, net
(1,262)
(4,174)
Other non-operating (income) expense
138
996
Total non-operating (income) expense
9,764
149,858
Income (loss) before taxes
(10,807)
(167,550)
Income tax provision (benefit)
(2,659)
27,834
Net income (loss) from discontinued operations
$
(8,148)
$
(195,384)
Loss from Divestiture of SMART Brazil
The following table presents the calculation of the loss from the divestiture of an 81% interest in SMART Brazil:
Proceeds, less costs to sell and other expenses:
Consideration
$
194,092
Costs to sell and other expenses
(4,150)
189,942
Basis in 81% interest in SMART Brazil:
Net assets of SMART Brazil
145,194
Cumulative translation adjustment (1)
212,397
357,591
Gain on revalue of 19% Retained Interest in SMART Brazil (2)
3,725
Pre-tax loss on divestiture of 81% interest in SMART Brazil
163,924
Income tax provision
26,580
Loss on divestiture of 81% interest in SMART Brazil
$
190,504
(1)The sale of an 81% interest in SMART Brazil resulted in the de-consolidation of SMART Brazil and, accordingly, the release of the related cumulative translation adjustment. Included in the basis calculation above is the balance of cumulative translation adjustment for SMART Brazil as of the closing. The release of the cumulative translation adjustment is included in net income (loss) from discontinued operations in the accompanying consolidated statement of operations.
(2)In connection with the transaction, we revalued our 19% Retained Interest in SMART Brazil based on the implied value for 100% of SMART Brazil, adjusted for lack of control premium. As of August 29, 2025, the carrying value of our remaining 19% interest in SMART Brazil was $37.8 million and was included in other noncurrent assets in the accompanying consolidated balance sheet as a non-marketable equity investment as of August 29, 2025.
86
Recognition Periods: The loss from the divestiture of an 81% interest in SMART Brazil was recognized as follows:
Three Months Ended
December 1, 2023
August 25, 2023
Total
Pre-tax loss on divestiture of 81% interest in SMART Brazil
$
10,888
$
153,036
$
163,924
Income tax provision (benefit)
(1,984)
28,564
26,580
Loss on divestiture of 81% interest in SMART Brazil
$
8,904
$
181,600
$
190,504
Recently Adopted Accounting Standards
In November 2023, the Financial Accounting Standards Board (“FASB”) issued Accounting Standards Update (“ASU”) 2023-07, Segment Reporting (Topic 280): Improvements to Segment Reporting Disclosures, which updates reportable segment disclosure requirements, primarily through enhanced disclosures about significant segment expenses and information used to assess segment performance. The guidance is effective for the Company's annual periods beginning in 2025 and interim periods beginning in the first quarter of fiscal year 2026. The Company adopted the standard on August 29, 2025. See “Segment and Other Information.”
Recently Issued Accounting Standards
In September 2025, the FASB issued ASU 2025-06, Intangibles—Goodwill and Other—Internal-Use Software (Subtopic 350-40): Improvements to the Accounting for and Disclosure of Internal-Use Software, which replaces the previous stage-based model for capitalizing internal-use software development costs with a principles-based approach. Under the new guidance, capitalization begins when management authorizes and commits to funding a project and it is probable the project will be completed and used as intended. The ASU also incorporates website development guidance into ASC 350-40 and introduces the concept of “significant development uncertainty,” which, if present, would delay capitalization. ASU 2025-06 is effective for fiscal years beginning after December 15, 2027, including interim periods within those years, with early adoption permitted at the beginning of an annual period. The new guidance may be applied prospectively, retrospectively, or using a modified prospective approach. We are currently evaluating the impact of this guidance on our consolidated financial statements and related disclosures, though we do not expect there to be a material impact.
In July 2025, the FASB issued ASU 2025-05, Financial Instruments – Credit Losses (Topic 326): Measurement of Credit Losses for Accounts Receivable and Contract Assets (“ASU 2025-05”). ASU 2025-05 provides a practical expedient that all entities can use when estimating expected credit losses for current accounts receivable and current contract assets arising from transactions accounted for under ASC 606, Revenue from Contracts with Customers. Under this practical expedient, an entity is allowed to assume that the current conditions it has applied in determining credit loss allowances for current accounts receivable and current contract assets remain unchanged for the remaining life of those assets. ASU 2025-05 is effective for fiscal years beginning after December 15, 2025, and interim reporting periods in those years. Entities that elect the practical expedient and, if applicable, make the accounting policy election are required to apply the amendments prospectively. We are currently evaluating the potential impact of adopting ASU 2025-05 on our consolidated financial statements and disclosures.
In November 2024, the FASB issued ASU 2024-03, Income Statement-Reporting Comprehensive Income-Expense Disaggregation Disclosure (Subtopic 220-40): Disaggregation of Income Statement Expenses. The amendments in this ASU require disclosure, in the notes to the financial statements, of specified information about certain costs and expenses, as well as a qualitative description of amounts remaining in relevant expense captions that are not separately disaggregated quantitatively. This ASU also requires disclosure of the total amount of selling expenses and an entity’s definition of selling expenses. The amendments in this ASU are effective for us in 2028 for annual reporting and in 2029 for interim reporting, with early adoption permitted and may be applied prospectively or retrospectively. We do not expect ASU 2024-03 to have an impact on our financial position, results of operations and cash flows. We are currently evaluating the impact on our consolidated financial statement disclosures.
In December 2023, the FASB issued ASU 2023-09, Income Taxes (Topic 740): Improvements to Income Tax Disclosures. The amendments in this ASU are intended to increase transparency through improvements to annual disclosures primarily related to income tax rate reconciliation and income taxes paid. The amendments in this
87
ASU are effective for us in 2026 for annual reporting, with early adoption permitted. The ASU may be applied on a prospective basis, although retrospective application is permitted. We are evaluating the timing and effects of this ASU on our income tax disclosures.
Business Acquisitions
Stratus Technologies
On August 29, 2022 (the “Stratus Acquisition Date”), we completed the acquisition of Storm Private Holdings I Ltd., a Cayman Islands exempted company (“Stratus Holding Company” and together with its subsidiaries, “Stratus Technologies”), pursuant to the terms of that certain Share Purchase Agreement (the “Stratus Purchase Agreement”), dated as of June 28, 2022, by and among Penguin Solutions, Stratus Holding Company and Storm Private Investments LP, a Cayman Islands exempted limited partnership (the “Stratus Seller”). Pursuant to the Stratus Purchase Agreement, among other matters, the Stratus Seller sold to Penguin Solutions, and Penguin Solutions purchased from the Stratus Seller, all of the Stratus Seller’s right, title and interest in and to the outstanding equity securities of Stratus Holding Company.
Stratus Technologies is a global leader in simplified, protected and autonomous computing platforms and services in the data center and at the edge. For more than 40 years, Stratus Technologies has provided high-availability, fault-tolerant computing to Fortune 500 companies and small-to-medium sized businesses enabling them to securely and remotely run critical applications with minimal downtime. Stratus Technologies operates as part of Penguin Solutions’ Advanced Computing segment. The acquisition of Stratus Technologies further enhances Penguin Solutions’ growth and diversification strategy and complements and expands Penguin Solutions’ Advanced Computing business in data center and edge environments.
Purchase Price: At the closing of the transaction, we paid the Stratus Seller a cash purchase price of $225.0 million, subject to certain adjustments. In addition, the Stratus Seller had the right to receive, and we were obligated to pay, contingent consideration of up to $50.0 million (the “Stratus Earnout”) based on the gross profit performance of Stratus Technologies during the first full 12 fiscal months following the closing of the acquisition. In the second quarter of 2024, we paid in full $50.0 million related to the Stratus Earnout.
Cash paid was utilized, in part, to settle the outstanding debt of Stratus Technologies as of the closing of the transaction and was recognized as a component of consideration transferred. As a result, the assets acquired and liabilities assumed do not include an assumed liability for the outstanding debt of Stratus Technologies. The purchase price for Stratus Technologies was as follows:
Cash
$
225,000
Additional payment for net working capital adjustment (1)
17,246
Fair value of Stratus Earnout
20,800
$
263,046
(1)Includes $14.4 million paid at closing and $2.8 million paid in the second quarter of 2023 upon completion of the review of the working capital assets acquired and liabilities assumed.
Contingent Consideration: The Stratus Earnout was accounted for as contingent consideration. As of the Stratus Acquisition Date, the fair value of the Stratus Earnout was estimated to be $20.8 million and was valued using a Monte Carlo simulation analysis in a risk-neutral framework with assumptions for volatility, market price of risk adjustment, risk-free rate and cost of debt. The fair value measurement was based on significant inputs, not observable in the market, including forecasted gross profit, comparable company volatility, discount rate and cost of debt. The fair value of the Stratus Earnout was estimated based on the Company’s evaluation of the probability and amount of the Stratus Earnout to be achieved based on the expected gross profit of Stratus Technologies, using an estimated gross profit volatility of 33.4% and a discount rate of 7.3% as of the Stratus Acquisition Date.
88
Valuation: We estimated the fair value of the assets and liabilities of Stratus Technologies as of the Stratus Acquisition Date. The purchase price was allocated to the tangible and intangible assets acquired and liabilities assumed as follows:
Cash and cash equivalents
$
29,174
Accounts receivable
26,685
Inventories
10,890
Other current assets
6,536
Property and equipment
7,292
Operating lease right-of-use assets
9,216
Intangible assets
123,700
Goodwill
125,929
Other noncurrent assets
11,661
Accounts payable and accrued expenses
(32,656)
Other current liabilities
(36,723)
Noncurrent operating lease liabilities
(7,067)
Other noncurrent liabilities
(11,591)
Total net assets acquired
$
263,046
The goodwill arising from the acquisition of Stratus Technologies was assigned to our Advanced Computing segment. None of the goodwill recognized is deductible for income tax purposes.
The fair values and useful lives of identifiable intangible assets were as follows:
Amount
Estimated
useful life
(in years)
Technology
$
82,000
5
Customer relationships
27,800
8
Trademarks/trade names
10,000
9
In-process research and development
3,900
N/A
$
123,700
•Technology intangible assets were valued using the multi-period excess earnings method based on the discounted cash flow and technology obsolescence rate. Discounted cash flow requires the use of significant unobservable inputs, including projected revenue, expenses, capital expenditures and other costs, and discount rates calculated based on the cost of equity adjusted for various risks, including the size of the acquiree, industry risk and other risk factors.
•Customer relationship intangible assets were valued using the multi-period excess earnings method, which is the present value of the projected cash flows that are expected to be generated by the existing intangible assets after reduction by an estimated fair rate of return on contributory assets required to generate the customer relationship revenues. Key assumptions included discounted cash flow, estimated life cycle and customer attrition rates.
•Trademark/trade name intangible assets were valued using the relief from royalty method, which is the discounted cash flow savings accruing to the owner by virtue of the fact that the owner is not required to license the trademarks/trade names from a third party. Key assumptions included attributable revenue expected from the trademarks/trade names, royalty rates and assumed asset life.
•In-process research and development (“IPR&D”) relates to next generation fault tolerant architecture. IPR&D is indefinite-lived and will be reviewed for impairment at least annually. IPR&D was valued based on discounted cash flow, which requires the use of significant unobservable inputs, including projected revenue, expenses, capital expenditures and other costs. Amortization of this technology over an estimated useful life of 10 years commenced in the second quarter of 2024 upon completion of research and development efforts.
89
Cash and Investments
As of August 29, 2025 and August 30, 2024, all of our debt securities, the fair values of which approximated their carrying values, were classified as held to maturity. As of August 29, 2025, restricted cash, which is included in other noncurrent assets, was $0.3 million. Cash, cash equivalents and short-term investments were as follows:
August 29, 2025
August 30, 2024
As of
Cash and Cash Equivalents
Short-term Investments
Cash and Cash Equivalents
Short-term Investments
Cash
$
426,870
$
—
$
354,037
$
—
Level 1:
Money market funds
26,884
—
29,110
—
U.S. Treasury securities
—
—
—
6,337
$
453,754
$
—
$
383,147
$
6,337
Non-marketable Equity Investments
As of August 29, 2025 and August 30, 2024, other noncurrent assets included $53.0 million of non-marketable equity investments, which are accounted for under the measurement alternative at cost less impairment, if any. In the event an observable price change occurs in an orderly transaction for an identical or a similar investment, the carrying value of investments would be remeasured to fair value as of the date the observable transaction occurred, with any resulting gains or losses recorded in results of operations.
Accounts Receivable
In the third quarter of 2023, we entered into a trade accounts receivable sale program with a third-party financial institution to sell certain of our trade accounts receivable on a non-recourse basis pursuant to a factoring arrangement. This program allows us to sell certain of our trade accounts receivables up to $60.0 million. As of August 29, 2025, there have been no trade accounts receivables sold under this program.
Inventories
As of
August 29, 2025
August 30, 2024
Raw materials
$
92,393
$
75,514
Work in process
32,002
18,742
Finished goods
130,787
56,957
$
255,182
$
151,213
As of August 29, 2025 and August 30, 2024, 21% and 14%, respectively, of total inventories were owned and held under our logistics services program.
Property and Equipment
As of
August 29, 2025
August 30, 2024
Equipment
$
90,160
$
89,848
Buildings and building improvements
69,245
70,462
Furniture, fixtures and software
46,784
48,027
Land
14,983
16,126
221,172
224,463
Accumulated depreciation
(128,569)
(117,915)
$
92,603
$
106,548
90
As of August 29, 2025 and August 30, 2024, depreciation expense for property and equipment was $20.6 million and $25.7 million, respectively.
Intangible Assets and Goodwill
August 29, 2025
August 30, 2024
As of
Gross
Amount
Accumulated
Amortization
Gross
Amount
Accumulated
Amortization
Intangible assets:
Technology
$
144,445
$
(83,375)
$
142,539
$
(58,948)
Customer relationships
33,000
(13,602)
72,500
(45,556)
Trademarks/trade names
15,786
(8,500)
27,964
(17,045)
$
193,231
$
(105,477)
$
243,003
$
(121,549)
In 2025 and 2024, we capitalized $1.9 million and $1.4 million, respectively, for intangible assets, with weighted-average useful lives of 18.6 years and 18.2 years, respectively. Amortization expense for intangible assets was $35.6 million, $40.0 million and $45.1 million in 2025, 2024 and 2023, respectively. Amortization expense is expected to be $30.3 million for 2026, $29.7 million for 2027, $10.0 million for 2028, $6.1 million for 2029 and $5.4 million for 2030 and $6.2 million for 2031 andthereafter.
In connection with our acquisition of Stratus Technologies, we capitalized $3.9 million of in-process research and development related to next generation fault tolerant architecture. Amortization of this technology commenced in the second quarter of 2024.
Goodwill by segment
Advanced Computing
Integrated Memory
Total
Balance as of August 25, 2023
Gross
$
166,330
$
14,720
$
181,050
Accumulated impairment losses
(19,092)
—
(19,092)
Carrying value
147,238
14,720
161,958
Balance as of August 30, 2024
Gross
166,330
14,720
181,050
Accumulated impairment losses
(19,092)
—
(19,092)
Carrying value
147,238
14,720
161,958
Impairment losses during the year-ended August 29, 2025
$
(16,063)
$
—
$
(16,063)
Balance as of August 29, 2025
Gross
166,330
14,720
181,050
Accumulated impairment losses
(35,155)
—
(35,155)
Carrying value
$
131,175
$
14,720
$
145,895
During the second quarter of 2023, we initiated a plan within our Advanced Computing segment pursuant to which we are winding down manufacturing and discontinuing the sale of products offered through our Penguin Edge business by approximately the end of calendar 2025. The Penguin Edge technology is becoming obsolete and is only sold to a small number of customers who we expect to phase out the technology. In each quarter of 2025, to assess the fair value of the Penguin Edge business and reporting unit for the purpose of goodwill impairment, we utilized a discounted cash flow model using assumptions for how a market participant would value the business based on expected future cash flows through the expected completion of the wind down. We used this valuation approach because there were no comparable transactions in the marketplace of a similar business being sold while in the process of winding down. Further, since the Penguin Edge business has no expansion or product initiatives, those expected future cash flows incorporated expected revenues, the costs associated with fulfilling customer contracts, and the costs associated with winding down the Penguin Edge business. In determining the fair value of the Penguin Edge business, it was our expectation that the business would continue to be profitable and generate positive free cash flow through the wind down of the business. We calculated the expected remaining cash flows based on existing contracts, future expected orders based on historical order volumes, and future expected orders identified through customer engagements for last-time buy planning, which were expected to fully consume all inventory on hand. Net estimated discounted cash flows were calculated by taking the total
91
proceeds expected from sales, minus cash outflows for costs associated with fulfilling customer contracts, operating expenses, collection of receivables recognized as of August 29, 2025, and costs associated with the wind down of the Penguin Edge business. We assumed no capital expenditures because we are no longer investing in the business.
We applied a discount rate of 16.25%, which we believe reflects the return a market participant would require when purchasing the Penguin Edge business given the risk profile of the remaining operations and the limited future cash flows from winding down. However, given the short period of time associated with the remaining cash flows for the business, changes to the discount rate would not have produced a materially different fair value estimate. Since the Penguin Edge business is no longer investing in growth initiatives and operating costs are significantly lower than for an ongoing business, we observed a positive present value of future expected cash flows, which we then compared to the carrying value of the business.
Based on our analysis, the fair value of the Penguin Edge business was determined to be lower than its carrying value, resulting in an impairment charge for the remaining goodwill balance of $16.1 million for the year-ended August 29, 2025. The goodwill impairments were recorded to align the carrying value of the Penguin Edge reporting unit with the fair value of the Penguin Edge reporting unit as of the end of the respective reporting periods. The goodwill impairment loss recognized reduced the Penguin Edge reporting unit’s carrying value to zero.
Accounts Payable and Accrued Expenses
As of
August 29, 2025
August 30, 2024
Accounts payable (1)
$
267,498
$
182,037
Salaries, wages and benefits
34,169
22,819
Income and other taxes
15,304
11,863
Other
1,790
2,371
$
318,761
$
219,090
(1)Included accounts payable for property and equipment of $1.7 million and $0.4 million as of August 29, 2025 and August 30, 2024, respectively.
Debt
As of
August 29, 2025
August 30, 2024
Amended 2022 TLA
$
—
$
297,297
2030 Notes
193,906
192,778
2029 Notes
147,987
147,439
2026 Notes
19,945
19,833
2025 Loans
100,000
—
461,838
657,347
Less current debt
(19,945)
—
Long-term debt
$
441,893
$
657,347
Credit Agreement
On February 7, 2022, Penguin Solutions Cayman and Penguin Solutions Corporation (formerly known as SMART Modular Technologies, Inc.) (collectively, the “Borrowers”) entered into a credit agreement (the “2022 Original Credit Agreement”) with a syndicate of banks and Citizens Bank, N.A., as administrative agent (the “Administrative Agent”) that provided for (i) a term loan credit facility in an aggregate principal amount of $275.0 million (the “2022 TLA”) and (ii) a revolving credit facility in an aggregate principal amount of $300.0 million (the “2022 Revolver”), in each case, maturing on February 7, 2027. The 2022 Original Credit Agreement provided that up to $35.0 million of the 2022 Revolver was available for issuances of letters of credit.
On August 29, 2022, the Borrowers entered into an amendment (the 2022 Original Credit Agreement, as amended by this amendment and subsequent amendments, the “2022 Amended Credit Agreement”) with and
92
among the lenders party thereto and the Administrative Agent, which (i) provided for incremental term loans under the 2022 Amended Credit Agreement in an aggregate amount of $300.0 million (the “Incremental Term Loans” and together with the 2022 TLA, the “Amended 2022 TLA”), which Incremental Term Loans were on the same terms as the term loans incurred under the 2022 Original Credit Agreement, (ii) increased the maximum First Lien Leverage Ratio (as defined in the 2022 Amended Credit Agreement) financial covenant from 3.00:1.00 to 3.25:1.00 and (iii) increased the aggregate amount of unrestricted cash and permitted investments netted from the definitions of Consolidated First Lien Debt and Consolidated Net Debt under the 2022 Amended Credit Agreement from $100.0 million to $125.0 million.
Simultaneously with amending the 2022 Original Credit Agreement, the Borrowers applied a portion of the proceeds of the Incremental Term Loans to (i) finance a portion of the purchase price for the acquisition of Stratus Technologies and (ii) prepay in full the $101.8 million outstanding under the LED Earnout Note (as defined below). In connection with our prepayment of the LED Earnout Note, we recognized a gain of $0.8 million in the first quarter of 2023, which is included in other non-operating (income) expense in the accompanying consolidated statements of operations.
On June 24, 2025 (the “Refinancing Closing Date”), the Borrowers entered into a new Credit Agreement (the “2025 Credit Agreement”) by and among the Borrowers, the lenders party thereto, and JPMorgan Chase Bank, N.A., as administrative agent, collateral agent and an issuing bank.
The 2025 Credit Agreement provides for a revolving credit facility in an aggregate principal amount of $400.0 million (the “2025 Credit Facility” and the revolving loans thereunder, the “2025 Loans”), maturing on June 24, 2030. The 2025 Credit Agreement provides that up to $35.0 million of the 2025 Credit Facility is available for issuances of letters of credit.
On the Refinancing Closing Date, we borrowed $100.0 million under the 2025 Credit Facility, and simultaneously applied such proceeds, together with $200.0 million cash on hand, to repay in full all borrowings and terminate all commitments under the 2022 Amended Credit Agreement. Immediately prior to the repayment and termination of the 2022 Amended Credit Agreement, we had $300.0 million of principal outstanding under the Amended 2022 TLA, with unamortized issuance costs of $1.8 million and the effective interest rate was 7.17%, and no amounts outstanding under the 2022 Revolver, with unamortized issuance costs of $1.5 million. Following the extinguishment of the 2022 Amended Credit Agreement, we recognized a loss on extinguishment of $2.9 million.
Interest and Fees:
Under the 2025 Credit Agreement, 2025 Loans bear interest at a rate per annum equal to either, at our option, a Term Secured Overnight Financing Rate (“Term SOFR”) rate or a base rate, in each case plus an applicable margin based on the Total Leverage Ratio (as defined in the 2025 Credit Agreement) and ranges from 1.25% to 3.00% per annum with respect to Term SOFR borrowings and from 0.25% to 2.00% per annum with respect to base rate borrowings. In addition, we are required to pay a quarterly unused commitment fee at an initial rate of 0.25%, which may increase up to a rate of 0.35% based on certain Total Leverage Ratio levels specified in the 2025 Credit Agreement.
Security:
The 2025 Credit Agreement is jointly and severally guaranteed on a senior basis by certain subsidiaries of the Parent Borrower (as defined in the 2025 Credit Agreement) organized in the United States and the Cayman Islands. In addition, the 2025 Credit Agreement is secured by a pledge of the capital stock of, or equity interests in, certain subsidiaries of the Parent Borrower and by substantially all of the assets of certain subsidiaries of the Parent Borrower organized in the United States and the Cayman Islands.
Covenants: The 2025 Credit Agreement contains customary representations and warranties and affirmative covenants, as described in the 2025 Credit Agreement. The 2025 Credit Agreement also contains a number of negative covenants that, among other things, restrict, subject to certain exceptions, the Borrowers’ ability and the ability of the Borrowers’ subsidiaries to: incur additional indebtedness; create liens on assets; engage in mergers or consolidations; sell assets; pay dividends; make distributions or repurchase capital stock; make investments, loans or advances; repay or repurchase certain subordinated debt (except as scheduled or at maturity); create restrictions on the payment of dividends or other amounts to the Borrowers from the Borrowers’ restricted subsidiaries; make certain acquisitions; engage in certain transactions with affiliates; amend material agreements governing the Borrowers’ subordinated debt and fundamentally change the Borrowers’ business.
93
The 2025 Credit Agreement also includes the following financial maintenance covenants tested on the final day of each fiscal quarter:
•First Lien Leverage Ratio (as defined in the 2025 Credit Agreement) of 3.25 to 1.00;
•Total Leverage Ratio of 4.50 to 1.00; provided, that in connection with any Material Acquisition (as defined in the 2025 Credit Agreement), at the election of the Borrowers, the maximum Total Leverage Ratio for the next four quarterly testing periods after such Material Acquisition has been consummated will be increased to 5.00 to 1.00; provided further, that (x) no more than two such elections may be made during the term of the 2025 Credit Agreement and (y) following the first such election, no subsequent election may be made unless the Total Leverage Ratio has been less than or equal to 4.50 to 1.00 as of the last day of at least two consecutive quarterly testing periods following the expiration of the first increase; and
•Interest Coverage Ratio (as defined in the 2025 Credit Agreement) of at least 3.00 to 1.00.
For purposes of calculating the First Lien Leverage Ratio and the Total Leverage Ratio, the consolidated debt of the Parent Borrower and its Restricted Subsidiaries (as defined in the 2025 Credit Agreement) is reduced by up to $175.0 million of the aggregate amount of unrestricted cash and Permitted Investments (as defined in the 2025 Credit Agreement) of the Parent Borrower and its Restricted Subsidiaries.
Other: As of August 29, 2025, there was $100.0 million outstanding under the 2025 Loans and unamortized issuance costs were $3.6 million.
Convertible Senior Notes
Repurchase of Convertible Senior Notes
On August 6, 2024, we repurchased $80.0 million aggregate principal amount of our 2.25% Convertible Senior Notes due 2026 (the “2026 Notes”) for $100.6 million cash (including payment for accrued interest) in privately-negotiated transactions. The repurchase was accounted for as debt extinguishment. Accordingly, we recognized a loss in the fourth quarter of 2024, included in other non-operating expense, of $20.4 million, consisting of $19.7 million premium paid to extinguish the 2026 Notes and $0.7 million for the write-off of unamortized issuance costs.
Convertible Senior Notes Exchange
On January 18, 2023, we entered into separate, privately-negotiated exchange agreements with a limited number of holders of our 2026 Notes to exchange $150.0 million principal amount of the 2026 Notes for (i) $150.0 million in aggregate principal amount of new 2.00% Convertible Senior Notes due 2029 (the “2029 Notes”) and (ii) an aggregate of $15.6 million in cash, with such cash payment representing $14.1 million of premium paid for the 2026 Notes in excess of par value and $1.5 million of accrued and unpaid interest on the 2026 Notes (collectively, the “Exchange Transactions”). The 2029 Notes were issued pursuant to, and are governed by, an indenture (as supplemented, the “2029 Indenture”), dated as of January 23, 2023, between the Company and U.S. Bank Trust Company, National Association, as trustee.
Transactions involving contemporaneous exchanges between the same debtor and creditor in connection with the issuance of a new debt obligation and satisfaction of an existing debt obligation are accounted for as debt extinguishments if the debt instruments have substantially different terms. An exchange is deemed to have substantially different terms if:
•The present value of the remaining cash flows of the old instrument differs by more than 10% of the present value of the cash flows of the new instrument, or
•The change in the fair value of the conversion option immediately before and after the exchange is greater than 10% of the carrying value of the debt instrument immediately prior to the exchange.
We concluded that the exchanged 2026 Notes and the 2029 Notes had substantially different terms, and accordingly, we accounted for the Exchange Transactions as the extinguishment of the 2026 Notes and the issuance of the 2029 Notes. As a result, we recognized an extinguishment loss in the second quarter of 2023, included in other non-operating expense, of $16.7 million consisting of the premium paid to extinguish the 2026 Notes and $2.5 million for the write-off of unamortized issuance costs.
94
2030 Notes
On August 6, 2024 and August 14, 2024, we issued $175.0 million and $25.0 million aggregate principal amount, respectively, of our 2.00% Convertible Senior Notes due 2030 (collectively, the “2030 Notes”) pursuant to, and governed by, an indenture (as supplemented, the “2030 Indenture”), dated August 6, 2024, between us and U.S. Bank Trust Company, National Association, as trustee.
The 2030 Notes bear interest at a rate of 2.00% per annum on the principal amount thereof, payable semi-annually in arrears on February 15 and August 15 of each year, beginning on February 15, 2025, to the noteholders of record of the 2030 Notes as of the close of business on the immediately preceding February 1 and August 1, respectively. The 2030 Notes will mature on August 15, 2030 (the “2030 Maturity Date”), unless earlier converted, redeemed or repurchased.
The initial conversion rate of the 2030 Notes is 35.7034 shares of common stock per $1,000 principal amount of the 2030 Notes, which represents an initial conversion price of approximately $28.01 per share of common stock. The conversion rate is subject to adjustment upon the occurrence of certain specified events as set forth in the 2030 Indenture. Upon conversion, we are required to pay cash in an amount at least equal to the principal portion and have the option to settle any amount in excess of the principal portion in cash and/or shares of common stock.
Conversion Rights: Holders of the 2030 Notes may convert them under the following circumstances:
i.during any fiscal quarter commencing after the fiscal quarter ended on November 29, 2024 (and only during such fiscal quarter) if the last reported sale price per share of common stock exceeds 130% of the conversion price for at least 20 trading days, whether or not consecutive, in the 30 consecutive trading days ending on, and including, the last trading day of the immediately preceding fiscal quarter;
ii.during the five consecutive business days immediately after any 10 consecutive trading day period (such 10 consecutive trading day period, the “2030 Notes Measurement Period”) in which the trading price per $1,000 principal amount of notes for each trading day of the 2030 Notes Measurement Period was less than 98% of the product of the last reported sale price per share of common stock on such trading day and the conversion rate on such trading day;
iii.upon the occurrence of certain corporate events or distributions on our common stock, as provided in the 2030 Indenture;
iv.if we call the 2030 Notes for redemption; and
v.on or after February 15, 2030 until the close of business on the second scheduled trading day immediately before the 2030 Maturity Date.
Cash Redemption at Our Option: We have the right to redeem the 2030 Notes, in whole or in part, at our option at any time, and from time to time, on or after August 20, 2027 and on or before the 31st scheduled trading day immediately before the 2030 Maturity Date, at a cash redemption price equal to the principal amount of the 2030 Notes to be redeemed, plus accrued and unpaid interest, if any, but only if the 2030 Notes are “freely tradable” (as defined in the 2030 Indenture) and all accrued and unpaid additional interest, if any, has been paid in full as of the date we send the related redemption notice, and if the last reported per share sale price of our common stock exceeds 130% of the conversion price on (i) each of at least 20 trading days during the 30 consecutive trading days ending on, and including, the trading day immediately before the redemption notice date for such redemption and (ii) the trading day immediately before the date we send such notice. In addition, we have the right to redeem all, but not less than all, of the 2030 Notes if certain changes in tax law occur. Calling any 2030 Note for redemption will constitute a make-whole fundamental change with respect to such note, in which case the conversion rate applicable to the conversion of such note will be increased in certain circumstances if it is converted after it is called for redemption.
2029 Notes
The 2029 Notes bear interest at a rate of 2.00% per annum on the principal amount thereof, payable semi-annually in arrears on February 1 and August 1 of each year, beginning on August 1, 2023, to the noteholders of record of the 2029 Notes as of the close of business on the immediately preceding January 15 and July 15, respectively. The 2029 Notes will mature on February 1, 2029 (the “2029 Maturity Date”), unless earlier converted, redeemed or repurchased.
95
The initial conversion rate of the 2029 Notes is 47.1059 shares of common stock per $1,000 principal amount of the 2029 Notes, which represents an initial conversion price of approximately $21.23 per share of common stock. The conversion rate is subject to adjustment upon the occurrence of certain specified events as set forth in the 2029 Indenture. Upon conversion, we are required to pay cash in an amount at least equal to the principal portion and have the option to settle any amount in excess of the principal portion in cash and/or common stock.
Conversion Rights: Holders of the 2029 Notes may convert them under the following circumstances:
i.during any fiscal quarter commencing after the fiscal quarter ended on May 26, 2023 (and only during such fiscal quarter) if the last reported sale price per share of common stock exceeds 130% of the conversion price for at least 20 trading days in the 30 consecutive trading days ending on the last trading day of the immediately preceding fiscal quarter;
ii.during the five consecutive business days immediately after any 10 consecutive trading day period (such 10 consecutive trading day period, the “2029 Notes Measurement Period”) in which the trading price per $1,000 principal amount of notes for each trading day of the 2029 Notes Measurement Period was less than 98% of the product of the last reported sale price per share of common stock on such trading day and the conversion rate on such trading day;
iii.upon the occurrence of certain corporate events or distributions on our common stock, as provided in the 2029 Indenture;
iv.if we call the 2029 Notes for redemption; and
v.on or after August 1, 2028 until the close of business on the second scheduled trading day immediately before the 2029 Maturity Date.
Cash Redemption at Our Option: We have the right to redeem the 2029 Notes, in whole or in part, at our option at any time, and from time to time, on or after February 6, 2026 and on or before the 40th scheduled trading day immediately before the 2029 Maturity Date, at a cash redemption price equal to the principal amount of the 2029 Notes to be redeemed, plus accrued and unpaid interest, if any, but only if the last reported per share sale price of our common stock exceeds 130% of the conversion price on (i) each of at least 20 trading days during the 30 consecutive trading days ending on, and including, the trading day immediately before the redemption notice date for such redemption and (ii) the trading day immediately before the date we send such notice. In addition, we have the right to redeem all, but not less than all, of the 2029 Notes if certain changes in tax law occur. Calling any 2029 Note for redemption will constitute a make-whole fundamental change with respect to such note, in which case the conversion rate applicable to the conversion of such note will be increased in certain circumstances if it is converted after it is called for redemption.
2026 Notes
In February 2020, we issued $250.0 million in aggregate principal amount of 2026 Notes. The 2026 Notes are general unsecured obligations, bear interest at an annual rate of 2.25% per year, payable semi-annually on February 15 and August 15, and mature on February 15, 2026 (the “2026 Maturity Date”), unless earlier converted, redeemed or repurchased. The 2026 Notes are governed by an indenture (as supplemented, the “2026 Indenture” and, together with the 2030 Indenture and the 2029 Indenture, the “Indentures”) between us and U.S. Bank Trust Company National Association, as trustee. After the effect of the share dividend paid in the second quarter of 2022, the conversion rate of the 2026 Notes is 49.2504 shares of common stock per $1,000 principal amount of notes, which represents a conversion price of approximately $20.30 per share of common stock. The conversion rate is subject to adjustment upon the occurrence of certain specified events as set forth in the 2026 Indenture. On January 18, 2023, we exchanged $150.0 million principal amount of 2026 Notes for $150.0 million principal amount of new 2029 Notes. As a result, as of August 30, 2024, $100.0 million in aggregate principal amount of 2026 Notes were outstanding. On August 6, 2024, we repurchased $80.0 million aggregate principal amount of our 2026 Notes for $100.6 million cash (including payment for accrued interest) in privately-negotiated transactions. As of August 29, 2025, $20.0 million in aggregate principal amount of 2026 Notes were outstanding. See “Repurchase of Convertible Senior Notes” and “Convertible Senior Notes Exchange.”
First Supplemental Indenture to Indenture Governing the 2026 Notes: On August 26, 2022, Penguin Solutions entered into the First Supplemental Indenture (the “2026 First Supplemental Indenture”) to the 2026 Indenture governing the 2026 Notes. The 2026 First Supplemental Indenture became effective on August 27, 2022. Pursuant to the 2026 First Supplemental Indenture, Penguin Solutions irrevocably elected (i) to eliminate Penguin Solutions’ option to elect Physical Settlement (as defined in the 2026 Indenture) on any conversion of the 2026 Notes that occurs on or after the date of the 2026 First Supplemental Indenture and (ii) with respect to any
96
Combination Settlement (as defined in the 2026 Indenture) for a conversion of the 2026 Notes, the Specified Dollar Amount (as defined in the 2026 Indenture) that will be settled in cash per $1,000 principal amount of the 2026 Notes shall be no lower than $1,000. As a result of our election, upon conversion, we are required to pay cash in an amount at least equal to the principal portion. We will settle any amount in excess of principal with respect to conversions of the 2026 Notes in common stock.
Conversion Rights: Holders of the 2026 Notes may convert them under the following circumstances:
i.during any fiscal quarter commencing after the fiscal quarter ended on May 28, 2020 (and only during such fiscal quarter) if the last reported sale price per share of common stock exceeds 130% of the conversion price for at least 20 trading days in the 30 consecutive trading days ending on the last trading day of the immediately preceding fiscal quarter;
ii.during the five consecutive business days immediately after any 10 consecutive trading day period (such 10 consecutive trading day period, the “2026 Notes Measurement Period”) in which the trading price per $1,000 principal amount of notes for each trading day of the 2026 Notes Measurement Period was less than 98% of the product of the last reported sale price per share of common stock on such trading day and the conversion rate on such trading day;
iii.upon the occurrence of certain corporate events or distributions on our common stock, as provided in the 2026 Indenture;
iv.if we call the 2026 Notes for redemption; and
v.on or after August 15, 2025 until the close of business on the second scheduled trading day immediately before the 2026 Maturity Date.
Cash Redemption at Our Option: We have the right to redeem the 2026 Notes, in whole or in part, at our option at any time, and from time to time, on or after February 21, 2023 and on or before the 40th scheduled trading day immediately before the 2026 Maturity Date, at a cash redemption price equal to the principal amount of the 2026 Notes to be redeemed, plus accrued and unpaid interest, if any. However, the repurchase right is only applicable if the last reported per share sale price of our common stock exceeds 130% of the conversion price on each of at least 20 trading days during the 30 consecutive trading days ending on, and including, the trading day immediately before the redemption notice date for such redemption. In addition, we have the right to redeem all, but not less than all, of the 2026 Notes if certain changes in tax law occur. Calling any 2026 Note for redemption will constitute a make-whole fundamental change with respect to such note, in which case the conversion rate applicable to the conversion of such note will be increased in certain circumstances if it is converted after it is called for redemption.
Ranking
Our convertible notes are senior, unsecured obligations of the Company and are equal in right of payment with our existing and future senior, unsecured indebtedness, senior in right of payment to our existing and future indebtedness that is expressly subordinated to the respective notes and effectively subordinated to our existing and future senior, secured indebtedness, to the extent of the value of the collateral securing that indebtedness. Our convertible notes are structurally subordinated to all other existing and future indebtedness and other liabilities, including trade payables and (to the extent the Company is not a holder thereof) preferred equity, if any, of our subsidiaries.
Make-Whole Fundamental Change
Upon the occurrence of a “make-whole fundamental change” (as defined in each of our convertible note indentures), we will in certain circumstances increase the conversion rate for a specified period of time. In addition, upon the occurrence of a “fundamental change” (as defined in each of our convertible note indentures), holders of the notes may require us to repurchase their notes at a cash repurchase price equal to the principal amount of the notes to be repurchased, plus accrued and unpaid interest, if any, to, but excluding, the fundamental change repurchase date. The definition of fundamental change includes certain business combination transactions and certain de-listing events with respect to our common stock.
Ordinary Share Change Event and 2025 Supplemental Indentures
The consummation of the U.S. Domestication on June 30, 2025 and the transactions associated therewith constituted an “Ordinary Share Change Event” (as defined in each of the Indentures) pursuant to the terms of the
97
Indentures. As a result, noteholders had a 35-trading-day window, beginning on June 30, 2025, where such noteholders had the option to convert their convertible senior notes pursuant to the terms of the Indentures.
On June 30, 2025, immediately following the consummation of the U.S. Domestication, Penguin Solutions Delaware entered into that certain (i) Second Supplemental Indenture, dated as of June 30, 2025 (the “2026 Second Supplemental Indenture”), by and among Penguin Solutions Delaware, Penguin Solutions Cayman and U.S. Bank Trust Company, National Association, a national banking association organized under the laws of the United States of America, as trustee (in such capacity, the “Trustee”), to the 2026 Indenture; (ii) First Supplemental Indenture, dated as of June 30, 2025 (the “2029 First Supplemental Indenture”), by and among Penguin Solutions Cayman, Penguin Solutions Delaware and the Trustee, to the 2029 Indenture; and (iii) First Supplemental Indenture, dated as of June 30, 2025 (the “2030 First Supplemental Indenture,” and together with the 2026 Second Supplemental Indenture and the 2029 First Supplemental Indenture, the “2025 Supplemental Indentures”), by and among Penguin Solutions Cayman, Penguin Solutions Delaware and the Trustee, to the 2030 Indenture.
In connection with the U.S. Domestication and the associated “Ordinary Share Change Event” under each Indenture, the 2025 Supplemental Indentures entered into as described in the foregoing paragraph provide that (i) our convertible senior notes will, in each case, be fully and unconditionally guaranteed by Penguin Solutions Delaware and (ii) Penguin Solutions Cayman will satisfy its conversion obligations under the convertible senior notes by paying or delivering, as applicable and in accordance with the terms of the Indentures, either (x) solely cash or (y) a combination of cash and common stock of Penguin Solutions Delaware, together, if applicable, with cash in lieu of fractional shares of common stock. Pursuant to the terms of the Supplemental Indentures, Penguin Solutions Delaware agreed to deliver such common stock when issuable under the applicable Indentures.
Convertible Senior Note Interest
Unamortized debt issuance costs are amortized over the terms of our 2026 Notes, 2029 Notes and 2030 Notes using the effective interest method. As of August 29, 2025 and August 30, 2024, the effective interest rate for our 2026 Notes was 2.83%. As of August 29, 2025 and August 30, 2024, the effective interest rate for our 2029 Notes was 2.40%. As of August 29, 2025, the effective interest rate for our 2030 Notes was 2.65%. Aggregate interest expense for our convertible notes consisted of contractual stated interest and amortization of issuance costs and included the following:
Year ended
August 29, 2025
August 30, 2024
August 25, 2023
Contractual stated interest
$
7,430
$
5,470
$
5,397
Amortization of debt issuance costs
1,788
1,167
1,160
$
9,218
$
6,637
$
6,557
LED Earnout Note
Part of our consideration for the acquisition of the Optimized LED business was the possibility of an earnout payment of up to $125.0 million based on the revenue and gross profit performance of the Optimized LED business in Cree’s first four full fiscal quarters following the closing, with a minimum payment of $2.5 million. In the third quarter of 2022, we issued an unsecured promissory note to Cree for this earnout in the amount of $101.8 million (the “LED Earnout Note”). The LED Earnout Note bore interest at LIBOR plus 3.0%, payable quarterly, and was scheduled to mature on March 27, 2025. In the first quarter of 2023, and substantially simultaneously with entering into the First Amendment, we repaid in full the $101.8 million outstanding under the LED Earnout Note. In connection with our prepayment of the LED Earnout Note, we recognized a gain of $0.8 million in the first quarter of 2023, which is included in other non-operating income in the accompanying consolidated statements of operations.
98
Maturities of Debt
As of August 29, 2025, maturities of debt were as follows:
2026
$
20,000
2027
—
2028
—
2029
150,000
2030
300,000
2031 and thereafter
—
Less unamortized debt issuance costs
(8,162)
$
461,838
Leases
We have operating leases through which we utilize facilities, offices and equipment in our manufacturing operations, research and development activities and selling, general and administrative functions.Sublease income was not significant in any period presented. The components of operating lease expense were as follows:
Year ended
August 29, 2025
August 30, 2024
August 25, 2023
Fixed lease cost
$
11,486
$
12,894
$
16,574
Variable lease cost
2,433
1,834
1,386
Short-term lease cost
1,903
2,086
2,266
$
15,822
$
16,814
$
20,226
Cash flows used for operating activities included payments for operating leases of $8.0 million, $9.0 million and $7.7 million in 2025, 2024 and 2023, respectively. Acquisitions of right-of-use assets were $10.5 million, $2.3 million and $10.8 million in 2025, 2024 and 2023, respectively.
As of August 29, 2025 and August 30, 2024, the weighted-average remaining lease term for our operating leases was 9.0 years and 10.1 years, respectively, and the weighted-average discount rate was 6.1% respectively. Certain of our operating leases include one or more options to extend the lease term for periods from two to five years. In determining the present value of our operating lease liabilities, we have assumed we will not extend any lease terms.
As of August 29, 2025, minimum payments of lease liabilities were as follows:
2026
$
9,687
2027
9,615
2028
9,606
2029
9,665
2030
9,835
2031 and thereafter
43,812
92,220
Less imputed interest
(23,734)
Present value of total lease liabilities
$
68,486
Commitments and Contingencies
Commitments
As of August 29, 2025, we had commitments of $25.5 million for purchase obligations, a substantial majority of which will be due within one year. Purchase obligations include payments for the acquisition of inventories, property and equipment and other goods or services of either a fixed or minimum quantity.
99
Product Warranty and Indemnities
We generally provide a limited warranty that our products are in compliance with applicable specifications existing at the time of delivery. Under our standard terms and conditions of sale, liability for certain failures of product during a stated warranty period is usually limited to repair or replacement of defective items or return of amounts paid for such items. Our warranty obligations are not material.
We are party to a number of agreements in which we have agreed to defend, indemnify and hold harmless our customers and suppliers from damages and costs, which may arise from product defects as well as from any alleged infringement by our products of third-party patents, trademarks or other proprietary rights. We believe our internal development processes and other policies and practices limit our exposure related to such indemnities. Maximum potential future payments cannot be estimated because many of these agreements do not have a maximum stated liability. However, to date, we have not had to reimburse any of our customers or suppliers for any significant losses related to these indemnities. We have not recorded any liability for such indemnities.
Contingencies
From time to time, we may be involved in legal matters that arise in the normal course of business. Litigation in general, and intellectual property, employment and stockholder litigation in particular, can be expensive and disruptive to normal business operations. Moreover, the results of complex legal proceedings are difficult to predict. We regularly review contingencies to determine whether the likelihood of loss has changed and to assess whether a reasonable estimate of the loss or range of loss can be made.
Temporary Equity
Convertible Preferred Stock
On December 13, 2024, we closed the SKT Investment. Pursuant to the terms of the SKT Purchase Agreement, we sold to Astra AI Infra 200,000 Issued Cayman CPS at a price of $1,000 per share or an aggregate price of $200.0 million.
At the time of issuance, we evaluated the terms and conditions of the Issued Cayman CPS. Based on this evaluation, we determined that the Issued Cayman CPS did not contain redemption features that were outside the Company’s control and therefore initially classified the Issued Cayman CPS as permanent equity within the consolidated balance sheet.
On June 30, 2025, we completed the U.S. Domestication, at which time each ordinary share of Penguin Solutions Cayman was exchanged for one share of common stock of Penguin Solutions Delaware, and each convertible preferred share of Penguin Solutions Cayman was exchanged for one share of convertible preferred stock of Penguin Solutions Delaware. In connection with this event, we reassessed the classification of the Issued CPS.
The terms of the Issued CPS are substantially the same as those of the Issued Cayman CPS. However, the Cayman governing documents included protective provisions that set forth the Company's ability to solely control redemption features. These provisions are not explicitly included in the Company's amended and restated certificate of incorporation or the CPS Delaware Certificate of Designation. The Company evaluated the absence of these provisions in the Delaware governing documents and determined that the CPS should be classified as temporary equity beginning June 30, 2025. Accordingly, the Issued CPS was reclassified to temporary equity effective June 30, 2025.
In accordance with SEC guidance on redeemable equity securities, we reclassified the Issued CPS out of permanent equity at its fair value as of the date of the U.S. Domestication. The reclassification resulted in an adjustment to additional paid-in capital, representing the difference between the historical carrying amount and the fair value at the reclassification date. This adjustment had no impact on the Company’s net income, comprehensive income, or cash flows.
As of June 30, 2025, we recorded $202.7 million of Issued CPS within temporary equity on the consolidated balance sheet. As of August 29, 2025, we did not adjust the carrying values of the Issued CPS to the redemption values of such shares because a deemed liquidation event did not occur and the shares were not probable of becoming redeemable in the future as of the consolidated balance sheet date.
100
Amended and Restated Investor Agreement
On June 30, 2025, effective upon consummation of the U.S. Domestication, Penguin Solutions Delaware assumed the Investor Agreement from Penguin Solutions Cayman and Penguin Solutions Delaware and SKT amended and restated the Investor Agreement such that the rights and restrictions relating to SKT’s beneficial ownership of the Issued Cayman CPS in place prior to the U.S. Domestication apply in respect of SKT’s holdings of Issued CPS following consummation of the U.S. Domestication.
Delaware Certificate of Designation for Convertible Preferred Stock
On June 27, 2025, in connection with the U.S. Domestication, Penguin Solutions Delaware executed and adopted the CPS Delaware Certificate of Designation that sets forth the terms, rights and obligations of the Issued CPS. The principal attributes of the Issued Cayman CPS and the Issued CPS are substantially the same, subject to changes to give effect to requirements of Delaware law. Refer to the Certificate of Designation of Penguin Solutions, Inc., effective as of June 27, 2025, filed as Exhibit 3.3 hereto, to the description of the Issued CPS contained in the description of the Registrant’s capital stock, filed as Exhibit 4.1 hereto, and to the information under the heading “Comparison of Rights of Cayman Islands Shareholders and Delaware Stockholders” in Penguin Solutions Cayman’s definitive proxy statement on Schedule 14A filed with the SEC on May 2, 2025.
Conversion
A holder of Issued CPS may convert such holder’s Issued CPS into common stock at any time, provided that the shares of Issued CPS may, at our option, automatically be converted into common stock on any date following the second anniversary of the closing of the SKT Investment upon which the volume-weighted average price of the common stock for any fifteen consecutive trading day period equals or exceeds 150% of the then-applicable conversion price. The shares of Issued CPS are convertible into common stock at an initial conversion price of $32.81, subject to customary adjustment upon the occurrence of certain events (including share subdivision and consolidation, certain dividends and distributions, and any reclassification or share exchange).
Dividends
The shares of Issued CPS entitle the holder to receive dividends of six percent per annum, cumulative, and payable quarterly in-kind or in cash at our option, subject to certain conditions, including a stock issuance limitation. In 2025, we declared $8.7 million of preferred dividends, with $7.9 million paid in cash in 2025,and $0.5 million of accrued preferred dividends as of as of August 29, 2025.
Liquidation Preference
In case of a Liquidation Trigger Event (as defined in the CPS Delaware Certificate of Designation), each holder of Issued CPS will be entitled to receive, in preference to holders of common stock, the greater of (i) the original issue price plus accrued but unpaid dividends (whether or not declared) to the date of the applicable Liquidation Trigger Event to the extent such accrued but unpaid dividends are not compounded dividends as of such time and (ii) the amount such holder of Issued CPS would receive had such holder, immediately prior to such Liquidation Trigger Event, converted the shares of Issued CPS into shares of common stock. The liquidation preference associated with the Issued CPS was $1,000 per share at August 29, 2025.
Voting Rights
Except as specified under applicable law, each holder of Issued CPS will be entitled to vote or consent as a single class with the holders of common stock on all matters submitted for a vote of or consent by holders of common stock, such number of votes equal to the largest number of whole shares of common stock in which all Issued CPS held of record by such holder could then be converted.
Director Designation Rights
SKT (through Astra AI Infra) is entitled to nominate one director if the total number of directors of the Company is eleven or less, and two directors if the total number of directors of the Company is twelve or more, to be elected or appointed to the Board of Directors of the Company (any such director, an “Investor Designee”). The right to nominate an Investor Designee continues until such time as SKT and its subsidiaries and affiliates (including Astra
101
AI Infra) beneficially own less than five percent of the common stock then issued and outstanding (calculated on a fully-diluted basis) directly or by holding Issued CPS.
Company Redemption Rights
Holders of Issued CPS do not have pre-emptive, subscription, or redemption rights. We may repurchase the Issued CPS in one installment upon notice to the holders of Issued CPS, provided that no such notice shall be sent until at least five years after the date of the closing of the SKT Investment.
Equity
Penguin Solutions Stockholders’ Equity
Common Stock Repurchase Authorization
On April 4, 2022, our Board of Directors approved a $75.0 million stock repurchase authorization (the “2022 Authorization”), under which we may repurchase our outstanding common stock from time to time through open market repurchases, privately-negotiated transactions or otherwise. On each of January 8, 2024 and October 6, 2025, the Audit Committee of the Board of Directors approved additional $75.0 million stock repurchase authorizations (the “2024 Authorization” and “2025 Authorization,” respectively, and together with the 2022 Authorization, the “Current Authorizations”). The Current Authorizations, which consists solely of amounts approved pursuant to the 2024 Authorization and 2025 Authorization as all amounts under the 2022 Authorization have been utilized, has no expiration date but may be suspended or terminated by the Board of Directors at any time. In 2025, 2024 and 2023, we repurchased 2.5 million, 0.9 million and 0.5 million shares, respectively, for $41.2 million, $13.9 million and $8.4 million, respectively, under the 2022 and 2024 Authorizations. As of August 29, 2025, an aggregate of $36.5 million remained available for the repurchase of our common stock under the 2024 Authorization. Certain of our agreements, including the 2025 Credit Agreement and the Certificate of Designation, contain restrictions that limit our ability to repurchase our common stock.
Other Stock Repurchases
Common stock withheld as payment of withholding taxes and exercise prices in connection with the vesting or exercise of equity awards are treated as common stock repurchases. In 2025, 2024 and 2023, we repurchased 597 thousand, 377 thousand and 506 thousand shares of common stock as payment of withholding taxes for $11.1 million, $7.4 million and $10.9 million, respectively.
In connection with the Exchange Transactions in the second quarter of 2023, we repurchased 326 thousand shares of common stock for $5.4 million. See “Debt – Convertible Senior Notes – Convertible Senior Notes Exchange.”
Capped Calls
In connection with our convertible notes, we have entered into privately-negotiated capped call transactions, which are intended to reduce the effect of potential dilution upon conversion of our convertible notes. The capped calls associated with the 2026 Notes provide for our receipt of shares from the counterparties if the trading price of our common stock is above the strike price on the expiration date of the capped calls. The capped calls associated with the 2029 Notes and 2030 Notes provide for our receipt of cash or shares, at our election, from counterparties if the trading price of our common stock is above the strike price on the expiration date. The capped calls are subject to anti-dilution adjustments substantially similar to those applicable to the corresponding convertible notes. The cost of capped calls, which are considered capital transactions, were recognized as decreases to additional paid-in capital.
Capped calls are separate transactions, each between the Company and the counterparties to the various capped calls, and are not part of the terms of any of the convertible notes and do not affect any holder’s rights under the convertible notes or related indentures. Holders of any of the convertible notes do not have any rights with respect to any of the capped calls.
As of August 29, 2025, the dollar value of cash or common stock that we would receive from our outstanding capped calls upon their expiration dates range from $0, if the trading price of our common stock is at or below the
102
strike prices for each of the capped calls at expiration, to $158.4 million, if the trading price of our common stock is at or above the cap prices for each of the capped calls. Settlement of a capped call prior to its expiration date may be for an amount different than the value at expiration. The following table presents information related to outstanding capped calls as of August 29, 2025:
Expiration Date
Strike Price
Cap Price
Shares
Maximum Value at Expiration
2026 Capped Calls
February 15, 2026
$
20.3044
$
27.0725
4,925
$
33,333
2029 Capped Calls
February 1, 2029
$
21.2288
$
29.1375
7,066
55,883
2030 Capped Calls
August 15, 2030
$
28.0085
$
37.7038
7,141
69,231
19,132
$
158,447
As part of the Exchange Transactions, we settled a portion of the 2026 Capped Calls in a notional amount of $150.0 million, equal to the amount of the 2026 Notes exchanged. In connection therewith, we received cash of $10.8 million, which was recognized as an increase in additional paid-in capital in the second quarter of 2024.
Other Comprehensive Income
Changes in accumulated other comprehensive income (loss) by component for 2025 were as follows:
Gains (Losses)
on
Investments
As of August 30, 2024
$
10
Other comprehensive income (loss) before reclassifications
18
Reclassifications out of accumulated other comprehensive income
—
Other comprehensive income (loss)
18
As of August 29, 2025
$
28
In connection with our divestiture of an 81% interest in SMART Brazil, we reclassified $212.4 million of cumulative translation adjustment related to SMART Brazil from other accumulated comprehensive income to results of operations in the first quarter of 2024. See “Divestiture of SMART Brazil.”
Noncontrolling Interest in Subsidiary
We have a 51% ownership interest in Cree Venture LED Company Limited (“Cree Joint Venture”), with the remaining 49% ownership interest held by San’an Optoelectronics Co., Ltd (“San’an”). The Cree Joint Venture has a five-member board of directors, three of which are designated by us and two of which are designated by San’an. As a result of our majority voting interest, we consolidate the operations of the Cree Joint Venture and report its results of operations within our Optimized LED segment.
The Cree Joint Venture has a manufacturing agreement pursuant to which San’an supplies it with mid-power LED products and we and the Cree Joint Venture have a sales agent agreement pursuant to which we are the independent sales representative of the Cree Joint Venture. The Cree Joint Venture produces and delivers to market high performing, mid-power lighting class LEDs in an exclusive arrangement serving the markets of North and South America, Europe and Japan, and serves China markets and the rest of the world on a non-exclusive basis. The 49% ownership interest held by San’an is classified as noncontrolling interest. Cash and other assets of the Cree Joint Venture are generally not available for use by us in our other operations.
103
Fair Value Measurements
August 29, 2025
August 30, 2024
As of
Fair Value
Carrying Value
Fair Value
Carrying Value
Assets:
Derivative financial instruments
$
4,223
$
4,223
$
3,929
$
3,929
Liabilities:
Amended 2022 TLA
$
—
$
—
$
300,015
$
297,297
2030 Notes
224,048
193,906
199,160
192,778
2029 Notes
197,363
147,987
178,760
147,439
2026 Notes
25,713
19,945
23,918
19,833
The deferred cash adjustment resulting from the divestiture of an 81% interest in SMART Brazil is accounted for as a derivative financial instrument and is revalued at the end of each reporting period. The asset’s fair value, as measured on a recurring basis, was based on Level 2 measurements, including market-based observable inputs of interest rates and credit-risk spreads.
The fair value of the Amended 2022 TLA, as measured on a non-recurring basis, was estimated based on Level 2 measurements, including discounted cash flows and interest rates based on similar debt issued by parties with credit ratings similar to ours. The fair values of our convertible notes, as measured on a non-recurring basis, were determined based on Level 2 measurements, including the trading prices of the notes.
Equity Plans
Our Amended and Restated 2017 Stock Incentive Plan (the “2017 Plan”) provides for the issuance of equity awards to our employees, directors and consultants. Such awards include both incentive and non-qualified options, stock appreciation rights, restricted stock awards (“RSAs”), restricted stock units (“RSUs”) and performance-based awards, such as performance-based restricted stock awards (“PRSAs”) and performance-based restricted stock units (“PSUs”). As of August 29, 2025, 4.8 million of our common stock were available for issuance under the 2017 Plan.
Our Amended and Restated 2021 Stock Inducement Plan (the “Inducement Plan”) provides for the issuance of equity awards to provide inducements for certain individuals to enter into employment with us within the meaning of Rule 5635(c)(4) of the Nasdaq Marketplace Rules, and to motivate such persons to contribute to, and to enable them to share in, any long-term growth and financial success we may experience. Such awards include options, stock appreciation rights, RSAs, RSUs and performance-based awards such as PRSAs and PSUs. As of August 29, 2025, 1.9 million of our common stock were available for issuance under the Inducement Plan.
Our Amended and Restated 2018 Employee Stock Purchase Plan (“ESPP”) has been offered to substantially all employees since April 2018 and generally permits eligible employees to purchase our common stock through payroll deductions of up to 15% of their eligible compensation, subject to certain limitations. As of August 29, 2025, 2.0 million shares of our common stock were available for issuance under the ESPP.
Options and RSUs generally vest over a period of four years, and options generally have a ten-year term.
The disclosures related to our restricted awards, stock options and employee stock purchase plan include both our continuing and discontinued operations.
104
Restricted Stock Awards and Restricted Stock Units Awards (“Restricted Awards”)
Shares
Weighted-
Average
Grant Date
Fair Value
Per Share
Aggregate
Intrinsic
Value
Outstanding as of August 30, 2024
4,199
$
21.12
$
87,006
Granted
2,137
$
18.85
Vested
(1,803)
$
20.91
Forfeited and cancelled
(689)
$
19.15
Outstanding as of August 29, 2025
3,844
$
21.49
$
93,751
Restricted Award activity was as follows:
Year ended
August 29, 2025
August 30, 2024
August 25, 2023
Restricted awards granted
2,137
2,085
2,579
Weighted-average grant date fair value per share
$
18.85
$
22.96
$
17.77
Aggregate vesting date fair value of shares vested
$
33,911
$
36,286
$
31,686
Restricted Awards include grants with service, performance and/or market conditions with restrictions that generally lapse after a three- to four-year service period. Awards with market conditions are based on either the Company’s stock price or the Company’s total stockholder return relative to companies included in a market index. For awards with market conditions, the number of shares that will vest will vary between 0% and 200% of target amounts, depending upon the Company’s achievement level over the specified performance period. The fair value of awards with market conditions were fixed at the grant date using a Monte Carlo simulation analysis and were based on significant inputs not observable in the market.
As of August 29, 2025, total unrecognized compensation costs for unvested Restricted Awards was $68.3 million, which was expected to be recognized over a weighted-average period of 2 years, 6 months, 18 days.
Stock Options
As of August 29, 2025, there were 0.5 million stock options outstanding, which are generally exercisable in increments of either one-fourth or one-third per year beginning one year from the date of grant. Stock options generally expire seven to ten years from the date of grant. The total intrinsic value for options exercised was $2.3 million, $2.6 million and $19.9 million in 2025, 2024 and 2023, respectively.
Shares
Weighted-
Average
Exercise Price
Per Share
Weighted-
Average
Remaining Contractual
Term (in years)
Aggregate
Intrinsic
Value
Outstanding as of August 30, 2024
724
$
12.72
4.33
$
5,911
Granted
—
$
—
Exercised
(197)
$
9.95
Forfeited and cancelled
(5)
$
16.09
Outstanding as of August 29, 2025
522
$
13.74
3 years, 3 months, 29 days
$
5,426
Exercisable as of August 29, 2025
522
$
13.74
3 years, 3 months, 29 days
$
5,426
The fair value of stock options is estimated on the date of grant using the Black-Scholes option pricing model. The expected volatility is based on the historical volatilities of the common stock of comparable publicly traded companies. The expected term of options granted represents the weighted-average period of time that options granted are expected to be outstanding. We apply the simplified approach in which the expected term is the mid-
105
point between the vesting date and the expiration date. The risk-free interest rate is based on the average U.S. Treasury yield curve at the end of the quarter in which the option was granted.
As of August 29, 2025, there were no unrecognized compensation costs for unvested options.
Employee Stock Purchase Plan
The purchase price of shares under our ESPP is equal to 85% of the lower of the fair market value of our common stock on either the first or last day of each offering period, which is generally six months. Compensation expense is calculated as of the beginning of the offering period as the fair value of the employees’ purchase rights utilizing the Black-Scholes option valuation model and is recognized over the offering period. Under the ESPP, employees purchased 529 thousand shares of common stock for $6.8 million in 2025, 584 thousand shares for $6.8 million in 2024 and 602 thousand shares for $6.6 million in 2023.
Stock-Based Compensation Expense
Stock-based compensation expense for our continuing operations was as follows:
Year ended
August 29, 2025
August 30, 2024
August 25, 2023
Stock-based compensation expense by caption:
Cost of sales
$
6,136
$
7,113
$
6,334
Research and development
6,300
7,120
6,016
Selling, general and administrative
28,740
28,927
26,878
$
41,176
$
43,160
$
39,228
Income tax benefits for stock-based awards were $5.9 million, $6.6 million and $6.7 million in 2025, 2024 and 2023, respectively.
Employee Savings and Retirement Plan
We have a 401(k) retirement plan under which U.S. employees may make contributions, subject to Internal Revenue Service annual contribution limits, to various savings alternatives, none of which include direct investment in the Company’s common stock. We may make matching contributions, which vest immediately, at our discretion. Contribution expense for our 401(k) plan was $4.7 million, $3.9 million and $4.6 million in 2025, 2024 and 2023, respectively.
Revenue and Customer Contract Balances
We disaggregate revenue by segment and geography and by product and service revenue. See “Segment and Other Information.”
Net Sales and Gross Billings
We provide certain services on an agent basis, whereby we procure product, materials and services on behalf of our customers and then resell such product, materials or services to our customers. As a result, we recognize only the amount related to the agent component as revenue in our results of operations. The cost of products, materials and services invoiced to our customers under these arrangements, but not recognized as revenue or cost of sales in our results of operations, were as follows:
Year ended
August 29, 2025
August 30, 2024
August 25, 2023
Cost of materials and services invoiced in connection with logistics services
$
893,715
$
518,685
$
765,796
106
Customer Contract Balances
As of
August 29, 2025
August 30, 2024
Contract assets (1)
$
1,929
$
1,801
Contract liabilities: (2)
Deferred revenue
$
89,943
$
76,178
Customer advances
21,525
6,036
$
111,468
$
82,214
(1)Contract assets are included in other current and noncurrent assets.
(2)Contract liabilities are included in other current and noncurrent liabilities based on the timing of when our customers are expected to take control of the asset or receive the benefit of the service.
Contract assets represent amounts recognized as revenue for which we do not have the unconditional right to consideration.
Deferred revenue represents amounts received from customers in advance of satisfying performance obligations. As of August 29, 2025, we expect to recognize revenue of $73.9 million of the balance of $89.9 million in the next 12 months and the remaining amount thereafter. In 2025, we recognized revenue of $63.1 million from satisfying performance obligations related to amounts included in deferred revenue as of August 30, 2024. In addition, as of August 29, 2025, other current liabilities included $15.3 million that is not included in the above remaining performance obligations. While this liability relates to amounts received from customers in connection with arrangements that are cancellable at the customer’s discretion, we have not had to refund any such amounts to our customers in the periods presented.
Customer advances represent amounts received from customers for advance payments to secure product. In 2025, we recognized revenue of $0.5 million from satisfying performance obligations related to amounts included in customer advances as of August 30, 2024.
As of August 29, 2025 and August 30, 2024, other current liabilities included $17.7 million and $12.2 million, respectively, for estimates of consideration payable to customers, including estimates for pricing adjustments and returns.
Other Operating (Income) Expense
In recent periods, we executed plans that included the elimination of certain projects across our businesses, which resulted in workforce reductions. In connection therewith, we recorded restructuring charges of $2.1 million and $7.1 million in the first year months of 2025 and 2024, respectively, consisting solely of employee severance costs and other benefits, reflected in Other Operating (Income) Expense in the Consolidated Statements of Operations. These charges were primarily concentrated in the period management defined, committed, and communicated the plan, and therefore, they were accrued and recorded in the respective period announced. We anticipate there will be additional restructuring activities in future quarters, for which we will record additional charges.
The following table summarizes the liabilities directly attributable to us that were recognized under the plans discussed above:
As of August 25, 2023
$
1,367
Additions
$
7,064
Cash payments
$
(7,582)
As of August 30, 2024
$
849
Additions
2,098
Cash payments
(1,884)
As of August 29, 2025
$
1,063
107
The 2024 beginning restructuring liability balance was $1.4 million, which was fully settled in 2024. The $0.8 million balance as of August 30, 2024 was fully settled in the year ended August 29, 2025. The unpaid balance as of August 29, 2025 is expected to be fully paid in 2026.
Other Non-operating (Income) Expense
Year ended
August 29, 2025
August 30, 2024
August 25, 2023
Loss on extinguishment or prepayment of debt
$
2,908
$
22,763
$
15,924
Loss (gain) on disposition of assets
76
179
(2,986)
Other
(1,055)
(1,858)
(1,101)
$
1,929
$
21,084
$
11,837
Income Taxes
Income (loss) before provision for income taxes consisted of the following:
Year ended
August 29, 2025
August 30, 2024
August 25, 2023
Income (loss) before income taxes:
U.S.
$
39,438
$
38,246
$
20,118
Non-U.S.
9,463
(69,413)
(59,631)
$
48,901
$
(31,167)
$
(39,513)
Income tax provision (benefit) consisted of the following:
Year ended
August 29, 2025
August 30, 2024
August 25, 2023
Income tax provision (benefit):
Current:
Federal
$
17,444
$
10,930
$
3,253
State
4,000
1,821
2,417
Foreign
12,768
9,253
8,418
34,212
22,004
14,088
Deferred:
Federal
(12,227)
(6,815)
(51,540)
State
(1,099)
540
(6,998)
Foreign
(820)
(5,111)
(4,753)
(14,146)
(11,386)
(63,291)
Income tax provision (benefit)
$
20,066
$
10,618
$
(49,203)
108
In applying the statutory tax rate in the effective income tax rate reconciliation below, we used the U.S. statutory tax rate rather than the Cayman Islands zero percent tax rate. The table below reconciles our tax provision (benefit) based on the U.S. federal statutory rate to our effective tax rate:
Year ended
August 29, 2025
August 30, 2024
August 25, 2023
Statutory tax rate
$
10,269
21.0
%
$
(6,545)
21.0
%
$
(8,298)
21.0
%
Foreign income taxes at different rates
6,665
13.6
%
15,870
(50.9)
%
16,992
(43.0)
%
State income tax, net of federal benefit
1,903
3.9
%
2,278
(7.3)
%
2,793
(7.1)
%
Goodwill impairment
—
—
%
—
—
%
2,876
(7.3)
%
Tax on uncertain tax positions
313
0.6
%
(3,825)
12.3
%
5,679
(14.4)
%
Stock-based compensation
135
0.3
%
(100)
0.3
%
(538)
1.4
%
Change in valuation allowance
69,669
142.5
%
1,111
(3.6)
%
(69,789)
176.6
%
Non-deductible expenses (non-taxable income)
2,177
4.5
%
1,053
(3.4)
%
2,151
(5.4)
%
Foreign withholding tax
2,429
5.0
%
4,548
(14.6)
%
3,371
(8.5)
%
Tax credits
(1,814)
(3.7)
%
(3,337)
10.7
%
(4,339)
11.0
%
Effect of cross-border tax laws
1,409
2.9
%
—
—
%
—
—
%
U.S. Domestication
(75,126)
(153.6)
%
—
—
%
—
—
%
Return to Provision
2,283
4.7
%
—
—
%
—
—
%
Other
(246)
(0.7)
%
(435)
1.4
%
(101)
0.2
%
Effective tax rate
$
20,066
41.0
%
$
10,618
(34.1)
%
$
(49,203)
124.5
%
For 2025, the primary difference between the U.S. federal statutory tax rate and the effective tax rate was due to losses in jurisdictions where no tax benefit can be recognized prior to the U.S. Domestication, non-deductible expenses, return to provision adjustments, and foreign withholding taxes, partially offset by benefits from the U.S. Domestication (net of valuation allowance) and tax credits.
As a result of the U.S. Domestication, we inherited $75.1 million of certain tax attributes, including interest expense carryforwards and capitalized R&D carryforwards. The utilization of certain of these tax attributes is subject to various limitations under the Internal Revenue Code and applicable regulations, restricting the extent to which attributes generated in periods prior to the U.S. Domestication may be used to offset future consolidated taxable income. Under our current structure the Company has no ability to utilize a portion of these attributes. Accordingly, the Company has recorded a $69.7 million valuation allowance against such portion which is not expected to be realized.
109
Deferred income taxes reflect the net tax effects of temporary differences between the bases of assets and liabilities for financial reporting and income tax purposes as well as carryforwards. Deferred tax assets and liabilities consisted of the following:
As of
August 29, 2025
August 30, 2024
Deferred tax assets:
Accruals and allowances
$
16,868
$
13,868
Deferred revenue
371
1,838
Stock-based compensation
2,028
3,027
Research and other tax credit carryforwards
4,479
4,762
Capitalized research and development
29,584
22,059
Operating lease liabilities
15,823
15,199
Tax amortizable goodwill
13,370
14,097
Interest carryforward
91,125
21,873
Intangible assets
11,704
5,039
Loss carryforwards
10,690
11,908
Gross deferred tax assets
196,042
113,670
Valuation allowance
(73,443)
(3,774)
Net deferred tax assets
122,599
109,896
Deferred tax liabilities:
Operating right-of-use assets
13,531
13,306
Property and equipment
9,346
10,717
Brazil capital gains tax
—
4,138
Other liabilities
922
1,143
Gross deferred tax liabilities
23,799
29,304
Net deferred tax assets
$
98,800
$
80,592
Reported as:
Deferred tax assets
$
99,107
$
85,078
Deferred tax liabilities (included in other noncurrent liabilities)
(307)
(4,486)
Net deferred tax assets
$
98,800
$
80,592
We assess positive and negative evidence for each jurisdiction to determine whether it is more likely than not existing deferred tax assets will be realized. In 2025, we recorded $69.0 million of valuation allowance on interest expense carryforward attributes inherited as part of the U.S. Domestication due to uncertainty regarding the realizability of these deferred tax assets. We also have a valuation allowance against certain acquired state and foreign tax attributes due to expected limitations on utilization. We will continue to monitor the need for a valuation allowance against our remaining deferred tax assets.
As of August 29, 2025, we had U.S. federal and state net operating loss carryforwards of $23.6 million and $36.2 million, respectively. If not utilized, the federal net operating loss carryforwards will begin to expire in 2027. State net operating loss carryforwards of $35.9 million will begin to expire in 2031, while the remaining state net operating loss carryforwards do not expire. In addition, we had U.S. federal and state research and development credit carryforwards of $8.5 million and $4.5 million, respectively, and $1.2 million of foreign tax credit carryforwards. If not utilized, the federal research and foreign tax credits will begin to expire in 2032. If not utilized, $2.0 million of state credits will begin to expire in 2030, while $2.5 million of state credits do not expire. In addition, we had Section 163(j) interest expense carryforwards of $99.0 million from the acquisition of Stratus Technologies as well as $318.5 million from the U.S. Domestication, both of which do not expire. Net operating loss carryforwards in Hong Kong of $29.6 million do not expire.
Federal and state tax attributes can be subject to an annual limitation under the provisions of Section 382 of the Internal Revenue Code of 1986, as amended (the “Code”), and state tax laws. Further, under Section 382 of the Code, if a corporation undergoes an “ownership change,” the corporation’s ability to use its pre-change net operating loss carryforwards to offset its post-change taxable income may be limited. In general, an “ownership change” will occur if there is a cumulative change in our ownership by certain “5-percent shareholders” (including
110
groups of stockholders) that exceeds 50 percentage points over a rolling three-year period. Similar rules may apply under state tax laws. Our net operating loss, tax credit and section 163(j) interest expense carryforwards are subject to limitations per Sections 382 and 383 of the Code. We have experienced ownership changes in the past, and we may experience ownership changes in the future as a result of future transactions in our common stock, some changes of which may be outside of our control. As a result, our ability to use our pre-change net operating loss, tax credit and section 163(j) interest expense carryforwards to offset post-change U.S. federal and state taxable income may be subject to additional limitations.
On July 4, 2025, the One Big Beautiful Bill Act ("OBBBA") was enacted into U.S. law. Certain provisions were applicable to the Company beginning in 2025 while other provisions will become implemented in future periods. As a result of OBBBA we expect a decrease to our deferred tax assets and income tax payable resulting from the restoration of full expensing of U.S. research and experimentation expenditures. We do not expect any current or ongoing material impact to our effective tax rate as a result of the OBBBA.
Activity related to our deferred tax valuation allowance was as follows:
Year ended
August 29, 2025
August 30, 2024
August 25, 2023
Balance at beginning of period
$
3,774
$
2,663
$
52,267
Charged (credited) to operations
69,669
1,111
(69,789)
Charged to other accounts (1)
—
—
(4,073)
Business acquisitions
—
—
24,258
Balance at end of period
$
73,443
$
3,774
$
2,663
(1)During the period ended August 25, 2023, SMART Embedded Computing B.V. entered liquidation, resulting in the existing Netherlands NOL carryforwards being considered to have a remote likelihood of being utilized. Accordingly, a deferred tax asset of $4.1 million was written off and the related valuation allowance released.
We choose to maintain flexibility to repatriate excess cash from all jurisdictions where needed, to manage debt balances. Provisions have been made for deferred income taxes on undistributed earnings of foreign subsidiaries to the extent that dividend payments by such foreign subsidiaries are expected to result in additional tax liability, which is primarily related to foreign withholding taxes which are not individually or cumulatively significant.
We have operations in Malaysia, where we have tax incentive arrangements for our pioneer status activities and our global supply chain operations. The statutory rate for Malaysia is 24%. During the year ended August 25, 2025 the incentive agreement for the pioneer status activities was amended and extended to 2031. As of August 29, 2025, the global supply chain operation incentives were scheduled to expire in August 2028. Both incentive agreements are subject to certain conditions, with which we have fully complied for the pioneer status activities incentive in 2025, 2024, and 2023, and partially complied for the global supply chain operations incentive in 2025 and 2024 and fully complied in 2023. The effect of the tax incentive arrangements noted above reduced our income tax provision by $1.8 million ($0.03 per diluted share) in 2025, $1.2 million ($0.02 per diluted share) in 2024 and $10.4 million ($0.20 per diluted share) in 2023.
Below is a reconciliation of our unrecognized tax benefits:
Year ended
August 29, 2025
August 30, 2024
August 25, 2023
Beginning unrecognized tax benefits
$
21,428
$
25,603
$
18,920
Acquired balances
—
—
871
Increases related to prior year tax provisions
—
129
6,271
Increases related to current year tax provisions
495
1,099
4,248
Decreases related to prior year tax provisions
(602)
(5,348)
(3,468)
Lapse of statute of limitation
(280)
(55)
(1,239)
Ending unrecognized tax benefits
$
21,041
$
21,428
$
25,603
As of August 29, 2025 and August 30, 2024, the total amount of unrecognized tax benefits that would affect our effective tax rate, if recognized, was $18.3 million and $18.7 million, respectively. Amounts accrued for interest
111
and penalties related to uncertain tax positions were not material for any period presented. The resolution of tax audits or expiration of statute of limitations could also reduce our unrecognized tax benefits. Although the timing of final resolution is uncertain, the estimated potential reduction in our unrecognized tax benefits in the next 12 months would not be material.
We and our subsidiaries file income tax returns with the U.S. federal government, various U.S. states and various foreign jurisdictions throughout the world. We regularly engage in discussions and negotiations with tax authorities regarding tax matters, including transfer pricing, and we continue to defend any and all such claims presented. Our U.S. federal and state tax returns remain open to examination for 2007 through 2024. In addition, tax returns that remain open to examination in non-U.S. subsidiaries, including Malaysia, Luxembourg, Ireland, United Kingdom, Hong Kong and China, vary by country. We believe that adequate amounts of taxes and related interest and penalties have been provided and any adjustments as a result of examinations are not expected to materially adversely affect our business, results of operations or financial condition.
Earnings Per Share
We calculate basic earnings per common share (“EPS”) pursuant to the two-class method as a result of the issuance of the Issued Cayman CPS on December 13, 2024. The two-class method is an earnings allocation formula that determines EPS for common stock and participating securities according to dividend and participation rights in undistributed earnings. Under this method, all current period earnings, distributed and undistributed, are allocated to common stock and participating securities based on their respective rights to receive dividends. The Issued CPS is considered a participating security. The Issued CPS is not included in the computation of basic EPS in periods in which we have a net loss, as the Issued CPS is not contractually obligated to share in our net losses.
With respect to the Issued CPS, diluted EPS is calculated using the more dilutive of the two-class method or if-converted method. The two-class method uses net income available to common stockholders and assumes conversion of all potential shares other than the participating securities. The if-converted method uses net income and assumes conversion of all potential shares including the participating securities.
Dilutive potential common stock include outstanding stock options, unvested restricted stock units, convertible senior notes and convertible preferred stock.
112
The following table summarizes the computation of basic and diluted EPS under the two-class or if-converted method in applicable periods, as well as the anti-dilutive shares excluded:
Year ended
August 29, 2025
August 30, 2024
August 25, 2023
Net income (loss) from continuing operations
$
25,391
$
(44,324)
$
7,858
Net income (loss) from discontinued operations
—
(8,148)
(195,384)
Net income (loss) attributable to Penguin Solutions – Basic and Diluted
$
25,391
$
(52,472)
$
(187,526)
Less: Preferred stock dividends
8,667
—
—
Income available for distribution
16,724
(52,472)
(187,526)
Income allocated to participating securities
1,263
—
—
Net income available to common stockholders
$
15,461
$
(52,472)
$
(187,526)
Weighted-average shares outstanding – Basic
53,154
52,428
49,566
Dilutive effect of equity plans and Convertible Senior Notes
1,214
—
1,756
Weighted-average shares outstanding – Diluted
54,368
52,428
51,322
Basic earnings (loss) per common share:
Continuing operations
$
0.29
$
(0.85)
$
0.16
Discontinued operations
—
(0.15)
(3.94)
$
0.29
$
(1.00)
$
(3.78)
Method used:
Two-Class
Diluted earnings (loss) per common share:
Continuing operations
$
0.28
$
(0.85)
$
0.15
Discontinued operations
—
(0.15)
(3.80)
$
0.28
$
(1.00)
$
(3.65)
Unweighted anti-dilutive shares:
Equity plans
945
5,184
2,238
Convertible Senior Notes
—
—
—
Preferred stock
6,096
—
—
7,041
5,184
2,238
Upon any conversion of our convertible notes, we will be required to pay cash in an amount at least equal to the principal portion. We will settle any amount in excess of principal with respect to conversions of the 2026 Notes in common stock. and we have the option to settle in cash and/or common stock for the 2029 Notes and 2030 Notes. As a result, only the amounts expected to be settled in excess of the principal portion are considered in calculating diluted earnings per share under the if-converted method.
Segment and Other Information
Segment information presented below is consistent with how our Chief Operating Decision Maker (“CODM”), the Chief Executive Officer, evaluates our results of operations to make decisions about allocating resources and assessing performance using segment net sales, cost of sales, operating expenses, and operating income (loss). The CODM is regularly provided this segment information to assess relative segment performance and allocate resources to the segment in the annual planning process.
We have the following three business units, which are our reportable segments:
•Advanced Computing: Our Advanced Computing group, under our Penguin Computing and Stratus brands, offers specialized platform solutions and services for HPC, AI, machine learning, advanced modeling and the internet of things that span the continuum of edge, core and cloud. Our solutions are designed specifically for customers across multiple markets, including hyperscale, financial services, energy, government, education, healthcare and others.
113
•Integrated Memory: Our Integrated Memory group, under our SMART Modular Technologies brand, provides high-performance and reliable integrated memory solutions through the design, development and advanced packaging of leading-edge to extended lifecycle products. These specialty products are tailored to meet customer-specific requirements across networking and communications, enterprise storage and computing, including server applications and other vertical markets. These products are marketed to original equipment manufacturers and to commercial and government customers. The Integrated Memory group also offers SMART Supply Chain Services, which provides customized, integrated supply chain services to enable our customers to better manage supply chain planning and execution, reduce costs and increase productivity.
•Optimized LED: Our Optimized LED group, under our Cree LED brand, offers a broad portfolio of application-optimized LEDs focused on improving lumen density, intensity, efficacy, optical control and/or reliability. Backed by expert design assistance and superior sales support, our LED products enable our customers to develop and market LED-based products for general lighting, video displays and specialty lighting applications.
Segments are determined based on sources of sales, types of customers and operating performance.
There are no differences between the accounting policies for our segment reporting and our consolidated results of operations. Operating expenses directly associated with the activities of a specific segment are charged to that segment. Certain other indirect operating income and expenses are generally allocated to segments based on their respective percentage of net sales. We do not identify (other than goodwill) or report internally our assets nor allocate certain expenses and amortization, interest, other non-operating (income) expense or taxes to segments.
August 29, 2025
Advanced Computing
Integrated Memory
Optimized LED
Total
Net sales:
$
648,417
$
464,249
$
256,128
$
1,368,794
Less:
Costs of goods sold
404,032
362,612
177,549
944,193
Operating expense
129,376
57,998
69,575
256,949
Operating income:
$
115,009
$
43,639
$
9,004
167,652
Reconciliation of profit (loss)
Stock-based compensation expense
(41,176)
Amortization of acquisition-related intangibles
(34,838)
Cost of sales-related restructuring
(746)
Diligence, acquisition and integration expense
(1,829)
Redomiciliation costs
(10,038)
Impairment of goodwill
(16,063)
Restructuring charges
(2,098)
Other
(2,729)
Total unallocated
(109,517)
Total non-operating expense
(9,234)
Income (loss) before taxes
$
48,901
114
August 30, 2024
Advanced Computing
Integrated Memory
Optimized LED
Total
Net sales:
$
554,552
$
356,426
$
259,818
$
1,170,796
Less:
Costs of Goods Sold
324,152
283,821
188,838
796,811
Operating Expense
135,109
50,192
68,427
253,728
Segment operating income:
$
95,291
$
22,413
$
2,553
120,257
Reconciliation of profit (loss)
Stock-based compensation expense
(43,160)
Amortization of acquisition-related intangibles
(39,272)
Cost of sales-related restructuring
(2,136)
Diligence, acquisition and integration expense
(8,772)
Redomiciliation costs
(470)
Restructuring charges
(7,064)
Other
(1,088)
Total unallocated
(101,962)
Total non-operating expense
(49,462)
Income (loss) before taxes
$
(31,167)
August 25, 2023
Advanced Computing
Integrated Memory
Optimized LED
Total
Net sales:
$
749,708
$
443,264
$
248,278
$
1,441,250
Less:
Costs of Goods Sold
488,602
314,247
181,853
984,702
Operating Expense
150,131
55,378
71,245
276,754
Segment operating income:
$
110,975
$
73,639
$
(4,820)
179,794
Reconciliation of profit (loss)
Stock-based compensation expense
(39,228)
Amortization of acquisition-related intangibles
(44,601)
Flow through of inventory step up
(2,599)
Cost of sales-related restructuring
(6,813)
Diligence, acquisition and integration expense
(20,869)
Impairment of goodwill
(19,092)
Change in fair value of contingent consideration
(29,000)
Restructuring charges
(7,047)
Other
(1,800)
Total unallocated
(171,049)
Total non-operating expense
(48,258)
Income (loss) before taxes
$
(39,513)
115
Depreciation included in segment operating income was as follows:
Year ended
August 29, 2025
August 30, 2024
August 25, 2023
Advanced Computing
$
7,946
$
9,495
$
9,196
Integrated Memory
4,053
3,873
3,891
Optimized LED
8,580
12,352
13,411
$
20,579
$
25,720
$
26,498
Related Party Transactions
From time to time, we may enter into an agreement with a related party in the ordinary course of business. These agreements are reviewed and approved or ratified by the Audit Committee of the Board pursuant to our related person transaction policy. We follow Accounting Standards Codification 850, Related Party Disclosures, for the identification of related parties and disclosure of related party transactions, under which related parties are defined as members of our Board of Directors, affiliates of the Company, management and principal owners of our outstanding stock and members of their immediate families. Related parties also include any other person or entity with significant influence over our management or operations. A transaction is considered to be a related party transaction when there is a transfer of resources or obligations between related parties. We assess related parties each reporting period.
On May 26, 2025, we entered into an agreement with SKT, a related party, under which we anticipate providing solutions to support SKT’s future AI data center infrastructure initiatives. SKT, through Astra AI Infra, a special purpose vehicle formed by SKT, holds more than 10% of the voting interest of the Company. Additionally, Min Yong Ha, an executive of SKT, is a member of our Board of Directors. For the year ended August 29, 2025, we recognized a total transaction amount of $50.7 million for cash received for payment on the fulfillment of AI hardware solutions and installation services, of which $32.4 million of the order was completed and recognized as revenue for the year ended August 29, 2025. The remaining $18.3 million is recorded as contract liability.
Concentrations
Our concentrations of credit risk consists principally of cash and cash equivalents, investments and accounts receivable. Our revenues and related accounts receivable reflect a concentration of activity with certain customers. We generally do not require collateral or other security to support accounts receivable. We perform periodic credit evaluations of our customers to minimize collection risk on accounts receivable and maintain allowances for potentially uncollectible accounts.
A significant portion of our net sales is concentrated with a select number of customers. Sales to our ten largest customers were 66%, 58% and 60% of total net sales in each of 2025, 2024 and 2023, respectively. As of August 29, 2025, two Integrated Memory customers accounted for more than 10% of accounts receivable.
Net sales to certain customers each exceeded 10% of our total net sales in the past three years. Net sales to an Advanced Computing customer were 18.2%, 18.4% and 23.3% of total net sales in 2025, 2024 and 2023, respectively. Net sales to an Integrated Memory customer was 14.1% of total net sales in 2025. No other customers accounted for more than 10% of our total net sales in 2025, 2024 and 2023.
We rely on a limited number of suppliers for a significant portion of our raw materials. Purchases from our two largest suppliers were $0.6 billion, $0.4 billion and $0.5 billion in each of 2025, 2024 and 2023, respectively. As of August 29, 2025 and August 30, 2024, accounts payable and accrued expenses included $77.4 million and $63.4 million, respectively, for amounts owed to our two largest suppliers in each of 2025 and 2024.
116
Geographic Information
Net sales by geographic area, based on customer ship-to location, were as follows:
Year ended
August 29, 2025
August 30, 2024
August 25, 2023
United States
$
776,506
$
672,751
$
877,416
China
186,848
190,654
192,104
Europe
96,999
114,298
114,118
Mexico
147,298
27,301
9,902
Other
161,143
165,792
247,710
$
1,368,794
$
1,170,796
$
1,441,250
Long-lived assets, including property and equipment and right-of-use assets, by geographic area were as follows:
As of
August 29, 2025
August 30, 2024
United States
$
107,380
$
116,901
China
33,180
37,229
Malaysia
8,655
8,660
Other
2,235
4,107
$
151,450
$
166,897
Quarterly Financial Data (Unaudited)
The table below sets forth selected quarterly financial data from our continuing operations:
Q4 FY25
Q3 FY25
Q2 FY25
Q1 FY25
Q4 FY24
Q3 FY24
Q2 FY24
Q1 FY24
Net sales
$
337,922
$
324,251
$
365,519
$
341,102
$
311,148
$
300,580
$
284,821
$
274,247
Gross profit
96,731
95,083
104,648
97,812
87,086
88,906
81,934
82,850
Operating income (loss)
12,448
9,843
18,488
17,356
8,791
11,511
(3,312)
1,305
Net income (loss) attributable to Penguin Solutions
9,431
2,661
8,082
5,217
(24,547)
5,616
(13,620)
(11,773)
Preferred stock dividends
3,034
3,033
2,600
—
—
—
—
—
Income available for distribution
6,397
(372)
5,482
5,217
(24,547)
5,616
(13,620)
(11,773)
Income allocated to participating securities
666
—
482
—
—
—
—
—
Net income (loss) available to common stockholders
5,731
(372)
5,000
5,217
(24,547)
5,616
(13,620)
(11,773)
Earnings (loss) per share:
Basic
$
0.11
$
(0.01)
$
0.09
$
0.10
$
(0.46)
$
0.11
$
(0.26)
$
(0.23)
Diluted
$
0.11
$
(0.01)
$
0.09
$
0.10
$
(0.46)
$
0.10
$
(0.26)
$
(0.23)
Shares used in per share calculations:
Basic
52,553
53,130
53,454
53,482
53,071
52,570
52,031
52,068
Diluted
54,371
53,738
54,384
54,312
53,071
54,283
52,031
52,068
117
REPORT OF INDEPENDENT REGISTERED PUBLIC ACCOUNTING FIRM
To the Stockholders and the Board of Directors of Penguin Solutions, Inc.
Opinion on the Financial Statements
We have audited the accompanying consolidated balance sheets of Penguin Solutions, Inc. and subsidiaries (the “Company”) as of August 29, 2025 and August 30, 2024, the related consolidated statements of operations, comprehensive income (loss), stockholders’ equity, and cash flows, for each of the three years in the period ended August 29, 2025, and the related notes (collectively referred to as the “financial statements”). In our opinion, the financial statements present fairly, in all material respects, the financial position of the Company as of August 29, 2025 and August 30, 2024, and the results of its operations and its cash flows for each of the three years in the period ended August 29, 2025, in conformity with accounting principles generally accepted in the United States of America.
We have also audited, in accordance with the standards of the Public Company Accounting Oversight Board (United States) (PCAOB), the Company’s internal control over financial reporting as of August 29, 2025, based on criteria established in Internal Control — Integrated Framework (2013) issued by the Committee of Sponsoring Organizations of the Treadway Commission and our report dated October 21, 2025, expressed an unqualified opinion on the Company’s internal control over financial reporting.
Basis for Opinion
These financial statements are the responsibility of the Company’s management. Our responsibility is to express an opinion on the Company’s financial statements based on our audits. We are a public accounting firm registered with the PCAOB and are required to be independent with respect to the Company in accordance with the U.S. federal securities laws and the applicable rules and regulations of the Securities and Exchange Commission and the PCAOB.
We conducted our audits in accordance with the standards of the PCAOB. Those standards require that we plan and perform the audit to obtain reasonable assurance about whether the financial statements are free of material misstatement, whether due to error or fraud. Our audits included performing procedures to assess the risks of material misstatement of the financial statements, whether due to error or fraud, and performing procedures that respond to those risks. Such procedures included examining, on a test basis, evidence regarding the amounts and disclosures in the financial statements. Our audits also included evaluating the accounting principles used and significant estimates made by management, as well as evaluating the overall presentation of the financial statements. We believe that our audits provide a reasonable basis for our opinion.
Critical Audit Matter
The critical audit matter communicated below is a matter arising from the current-period audit of the financial statements that was communicated or required to be communicated to the audit committee and that (1) relates to accounts or disclosures that are material to the financial statements and (2) involved our especially challenging, subjective, or complex judgments. The communication of critical audit matters does not alter in any way our opinion on the financial statements, taken as a whole, and we are not, by communicating the critical audit matter below, providing a separate opinion on the critical audit matter or on the accounts or disclosures to which it relates.
Revenue Recognition — Refer to the Significant Accounting Policies and Revenue and Customer Contract Balances notes to the financial statements
Critical Audit Matter Description
The Company had $1.37 billion of revenue for the year ended August 29, 2025, of which $648 million related to the Advanced Computing segment.
A portion of the Company’s revenue is derived from the sale of customized products. The Company recognizes revenue when control of the underlying assets passes to the customer, which is when the customer is able to direct the use of and obtain substantially all of the remaining benefit from the assets, the customer has the significant risks and rewards associated with ownership of the assets, and the Company has a present right to
118
payment. Under the terms of these arrangements, the Company cannot repurpose products without the customer’s consent and accordingly, the Company recognizes revenue at the point in time when products are completed and made available to the customer.
A portion of the Company’s service revenue is from professional services, including installation and other services as well as hardware and software related support. Each contract may contain multiple performance obligations, which requires the transaction price to be allocated to each performance obligation. The Company allocates the consideration to each performance obligation based on the relative selling price, determined as the best estimate of the price at which the Company would transact if it sold the deliverable regularly on a stand-alone basis.
We identified both the evaluation of performance obligations and the determination of the timing of recognition as performance obligations are satisfied in certain contracts within the Advanced Computing segment to be a critical audit matter. This required a high degree of auditor judgment and an increased extent of audit effort.
How the Critical Audit Matter Was Addressed in the Audit
Our audit procedures related to the Company’s identification of performance obligations and the recognition of revenue as performance obligations are satisfied for the Advanced Computing segment included the following, among others:
–We tested the effectiveness of internal controls related to revenue for the Advanced Computing segment including those related to the identification of the performance obligations and the recognition of revenue as performance obligations were satisfied.
–We evaluated management’s significant accounting policies related to revenue recognition for compliance with generally accepted accounting principles.
–We selected a sample of contract documents for customers in the Advanced Computing segment and performed the following procedures:
•Obtained and read the arrangement with the customer for each selection, including the contract, amendments, purchase order, and other documents (together the “contractual documents”) that were part of the arrangement, each as applicable.
•Held inquiries with management outside of accounting, as needed, to identify the performance obligations in the contract and assist in evaluating when performance obligations are satisfied.
•Assessed the terms and conditions in the contractual documents and evaluated the appropriateness of management’s application of their accounting policies in the evaluation of performance obligations and the recognition of revenue as performance obligations are satisfied.
/s/ DELOITTE & TOUCHE LLP
San Jose, California
October 21, 2025
We have served as the Company’s auditor since 2014.
119
Item 9. Changes in and Disagreements With Accountants on Accounting and Financial Disclosure
None.
Item 9A. Controls and Procedures
Evaluation of Disclosure Controls and Procedures
An evaluation was performed under the supervision and with the participation of our management, including our principal executive officer and principal financial officer, of the effectiveness of our disclosure controls and procedures (as defined in Rules 13a-15(e) and 15d-15(e) under the Securities Exchange Act of 1934, as amended (the “Exchange Act”)) as of the end of the period covered by this report. Based upon that evaluation, our management, including our principal executive officer and principal financial officer, concluded that our disclosure controls and procedures were effective as of August 29, 2025 to provide reasonable assurance that the information required to be disclosed by us in the reports that we file or submit under the Exchange Act is (i) recorded, processed, summarized and reported within the time periods specified in the SEC rules and forms and (ii) accumulated and communicated to our management, including our principal executive officer and principal financial officer, as appropriate, to allow timely decisions regarding required disclosures.
Management’s Annual Report on Internal Control Over Financial Reporting
Our management is responsible for establishing and maintaining adequate internal control over financial reporting, as such term is defined in the Exchange Act.
Management conducted an evaluation of the effectiveness of our internal control over financial reporting based on the framework in Internal Control – Integrated Framework (2013) issued by the Committee of Sponsoring Organizations of the Treadway Commission. Based on this evaluation, management concluded that our internal control over financial reporting was effective as of August 29, 2025 to provide reasonable assurance regarding the reliability of financial reporting and the preparation of financial statements for external purposes in accordance with U.S. GAAP. The effectiveness of our internal control over financial reporting as of August 29, 2025 has been audited by Deloitte & Touche LLP, an independent registered public accounting firm, as stated in their report, which is included in this Annual Report on Form 10-K.
Changes in Internal Control Over Financial Reporting
During the fourth quarter of fiscal year 2025, there were no changes in our internal control over financial reporting, as defined in Rules 13a-15(f) and 15d-15(f) under the Exchange Act, that have materially affected, or are reasonably likely to materially affect, our internal control over financial reporting.
120
REPORT OF INDEPENDENT REGISTERED PUBLIC ACCOUNTING FIRM
To the Stockholders and the Board of Directors of Penguin Solutions, Inc.
Opinion on Internal Control over Financial Reporting
We have audited the internal control over financial reporting of Penguin Solutions, Inc. and subsidiaries (the “Company”) as of August 29, 2025, based on criteria established in Internal Control — Integrated Framework (2013) issued by the Committee of Sponsoring Organizations of the Treadway Commission (COSO). In our opinion, the Company maintained, in all material respects, effective internal control over financial reporting as of August 29, 2025, based on criteria established in Internal Control — Integrated Framework (2013) issued by COSO.
We have also audited, in accordance with the standards of the Public Company Accounting Oversight Board (United States) (PCAOB), the consolidated financial statements as of and for the year ended August 29, 2025, of the Company and our report dated October 21, 2025, expressed an unqualified opinion on those financial statements.
Basis for Opinion
The Company’s management is responsible for maintaining effective internal control over financial reporting and for its assessment of the effectiveness of internal control over financial reporting, included in the accompanying Management’s Annual Report on Internal Control Over Financial Reporting. Our responsibility is to express an opinion on the Company’s internal control over financial reporting based on our audit. We are a public accounting firm registered with the PCAOB and are required to be independent with respect to the Company in accordance with the U.S. federal securities laws and the applicable rules and regulations of the Securities and Exchange Commission and the PCAOB.
We conducted our audit in accordance with the standards of the PCAOB. Those standards require that we plan and perform the audit to obtain reasonable assurance about whether effective internal control over financial reporting was maintained in all material respects. Our audit included obtaining an understanding of internal control over financial reporting, assessing the risk that a material weakness exists, testing and evaluating the design and operating effectiveness of internal control based on the assessed risk, and performing such other procedures as we considered necessary in the circumstances. We believe that our audit provides a reasonable basis for our opinion.
Definition and Limitations of Internal Control over Financial Reporting
A company’s internal control over financial reporting is a process designed to provide reasonable assurance regarding the reliability of financial reporting and the preparation of financial statements for external purposes in accordance with generally accepted accounting principles. A company’s internal control over financial reporting includes those policies and procedures that (1) pertain to the maintenance of records that, in reasonable detail, accurately and fairly reflect the transactions and dispositions of the assets of the company; (2) provide reasonable assurance that transactions are recorded as necessary to permit preparation of financial statements in accordance with generally accepted accounting principles, and that receipts and expenditures of the company are being made only in accordance with authorizations of management and directors of the company; and (3) provide reasonable assurance regarding prevention or timely detection of unauthorized acquisition, use, or disposition of the company’s assets that could have a material effect on the financial statements.
Because of its inherent limitations, internal control over financial reporting may not prevent or detect misstatements. Also, projections of any evaluation of effectiveness to future periods are subject to the risk that controls may become inadequate because of changes in conditions, or that the degree of compliance with the policies or procedures may deteriorate.
/s/ DELOITTE & TOUCHE LLP
San Jose, California
October 21, 2025
121
Item 9B. Other Information
During the fiscal quarter ended August 29, 2025, no officers or directors of Penguin Solutions adopted or terminated a “Rule 10b5-1 trading arrangement” or a “non-Rule 10b5-1 trading arrangement” (in each case, as defined in Item 408 of Regulation S-K).
Item 9C. Disclosure Regarding Foreign Jurisdictions That Prevent Inspections
Not applicable.
122
PART III
Item 10. Directors, Executive Officers and Corporate Governance
The information required by Item 10 is incorporated herein by reference to our 2025 Proxy Statement for our next Annual Meeting of Stockholders to be filed with the SEC no later than 120 days after August 29, 2025.
We have adopted a Code of Business Conduct and Ethics that applies to our officers, directors and employees, and that is available on our website (www.penguinsolutions.com) under “Governance.” The Code of Business Conduct and Ethics is intended to qualify as a “code of ethics” within the meaning of Section 406 of the Sarbanes-Oxley Act of 2002, as amended, and Item 406 of Regulation S-K. In addition, we intend to promptly disclose on our website (1) any amendment to our Code of Business Conduct and Ethics that applies to our directors or our principal executive officer, principal financial officer, principal accounting officer or controller or persons performing similar functions and (2) the nature of any waiver, including an implicit waiver, from a provision of our Code of Business Conduct and Ethics that is granted to a director or one of these specified officers, the name of such person who is granted the waiver and the date of the waiver.
Item 11. Executive Compensation
The information required by Item 11 is incorporated herein by reference to our 2025 Proxy Statement for our next Annual Meeting of Stockholders to be filed with the SEC no later than 120 days after August 29, 2025.
Item 12. Security Ownership of Certain Beneficial Owners and Management and Related Stockholder Matters
The information required by Item 12, including Securities Authorized for Issuance Under Equity Plans, is incorporated herein by reference to our 2025 Proxy Statement for our next Annual Meeting of Stockholders to be filed with the SEC no later than 120 days after August 29, 2025.
Item 13. Certain Relationships and Related Transactions, and Director Independence
The information required by Item 13 is incorporated herein by reference to our 2025 Proxy Statement for our next Annual Meeting of Stockholders to be filed with the SEC no later than 120 days after August 29, 2025.
Item 14. Principal Accountant Fees and Services
The information required by Item 14 is incorporated herein by reference to our 2025 Proxy Statement for our next Annual Meeting of Stockholders to be filed with the SEC no later than 120 days after August 29, 2025.
123
PART IV
Item 15. Exhibits and Financial Statement Schedules
(a)The following documents are filed as part of this report:
1.Financial Statements. See “PART II – Item 8. Financial Statements and Supplementary Data.”
2.Financial Statement Schedules. Certain financial statement schedules have been omitted since they are either not required, not applicable or the information is otherwise included.
Inline XBRL Instance Document – the instance document does not appear in the Interactive Data File because XBRL tags are embedded within the Inline XBRL document
Cover Page Interactive Data File (embedded within the Inline XBRL document)
X
*
Portions of this exhibit have been excluded pursuant to Rule 601(b)(2)(ii) of Regulation S-K. The omitted information is both not material and is the type that the registrant treats as private or confidential.
**
Constitutes a management contract or compensatory plan or arrangement.
***
Certain schedules and exhibits have been omitted from this filing pursuant to Item 601(a)(5) of Regulation S-K. The Registrant agrees to furnish supplementally a copy of any omitted attachment to the Securities and Exchange Commission on a confidential basis upon request.
****
The certifications attached as Exhibit 32.1 and Exhibit 32.2 that accompany this Annual Report are deemed furnished and not filed with the Securities and Exchange Commission and are not to be incorporated by reference into any filing of the Registrant under the Securities Act of 1933, as amended, or the Securities Exchange Act of 1934, as amended, whether made before or after the date of this Annual Report, irrespective of any general incorporation language contained in such filing.
Item 16. Form 10-K Summary
Not applicable.
127
SIGNATURES
Pursuant to the requirements of Section 13 or 15(d) of the Securities Exchange Act of 1934, the Registrant has duly caused this report to be signed on its behalf by the undersigned, thereunto duly authorized.
Penguin Solutions, Inc.
Date: October 21, 2025
By:
/s/ Mark Adams
Mark Adams
President and Chief Executive Officer
Date: October 21, 2025
By:
/s/ Nate Olmstead
Nate Olmstead
Senior Vice President and Chief Financial Officer
POWER OF ATTORNEY AND SIGNATURES
KNOW ALL PERSONS BY THESE PRESENTS, that each person whose signature appears below hereby constitutes and appoints Mark Adams, Nate Olmstead and Anne Kuykendall, and each of them, as his or her true and lawful attorney-in-fact and agent with full power of substitution, for him or her in any and all capacities, to sign any and all amendments to this Annual Report on Form 10-K, and to file the same, with all exhibits thereto and other documents in connection therewith, with the SEC, granting unto said attorney-in-fact and agent full power and authority to do and perform each and every act and thing requisite and necessary to be done in connection therewith, as fully for all intents and purposes as he or she might or could do in person, hereby ratifying and confirming all that said attorney-in-fact and agent, or his substitute, may lawfully do or cause to be done by virtue hereof.
Pursuant to the requirements of the Securities Exchange Act of 1934, this report has been signed below by the following persons on behalf of the Registrant in the capacities and on the dates indicated.