July 23, 2026 I N V E S T O R P R E S E N T A T I O N F O U R T H Q U A R T E R F I S C A L 2 0 2 6 .2
Forward Looking Statements & Financial Measures 2 This presentation may include certain “forward-looking statements,” which are made in good faith by Kearny Financial Corp. (the “Company”) pursuant to the “safe harbor” provisions of the Private Securities Litigation Reform Act of 1995. These forward-looking statements are subject to risks and uncertainties, such as statements of the Company’s plans, objectives, expectations, estimates and intentions that are subject to change based on various important factors (some of which are beyond the Company’s control). In addition to the factors described under Item 1A. Risk Factors in the Company’s Annual Report on Form 10-K, and subsequent filings with the Securities and Exchange Commission, the following factors, among others, could cause the Company’s financial performance to differ materially from the plans, objectives, expectations, estimates and intentions expressed in such forward-looking statements: • the strength of the United States economy in general and the strength of the local economy in which the Company conducts operations, • the effects of, and changes in, trade, monetary and fiscal policies and laws, including interest rate policies of the Board of Governors of the Federal Reserve System, inflation, interest rates, market and monetary fluctuations, • the impact of changes in laws, regulations and government policies effecting financial institutions (including taxation, banking, securities, insurance and tariffs), • the current or anticipated impact of military conflict, terrorism or other geopolitical events, • changes in accounting policies and practices, as may be adopted by regulatory agencies, the Financial Accounting Standards Board (“FASB”) or the Public Company Accounting Oversight Board, • technological changes, • competition among financial services providers, and • the success of the Company at managing the risks involved in the foregoing and managing its business. The Company cautions that the foregoing list of important factors is not exhaustive. Readers should not place any undue reliance on any forward looking statements, which speak only as of the date made. The Company does not undertake any obligation to update any forward-looking statement, whether written or oral, that may be made from time to time by or on behalf of the Company. This presentation contains financial information determined by methods other than in accordance with accounting principles generally accepted in the United States of America (“GAAP”). Management uses these “non-GAAP” measures in its analysis of the Company’s performance. Management believes these non-GAAP financial measures allow for better comparability of period to period operating performance. Additionally, the Company believes this information is utilized by regulators and market analysts to evaluate a company’s financial condition and therefore, such information is useful to investors. These disclosures should not be viewed as a substitute for operating results determined in accordance with GAAP, nor are they necessarily comparable to non-GAAP performance measures that may be presented by other companies. A reconciliation of the non-GAAP measures used in this presentation to the most directly comparable GAAP measures is provided at the end of this presentation.
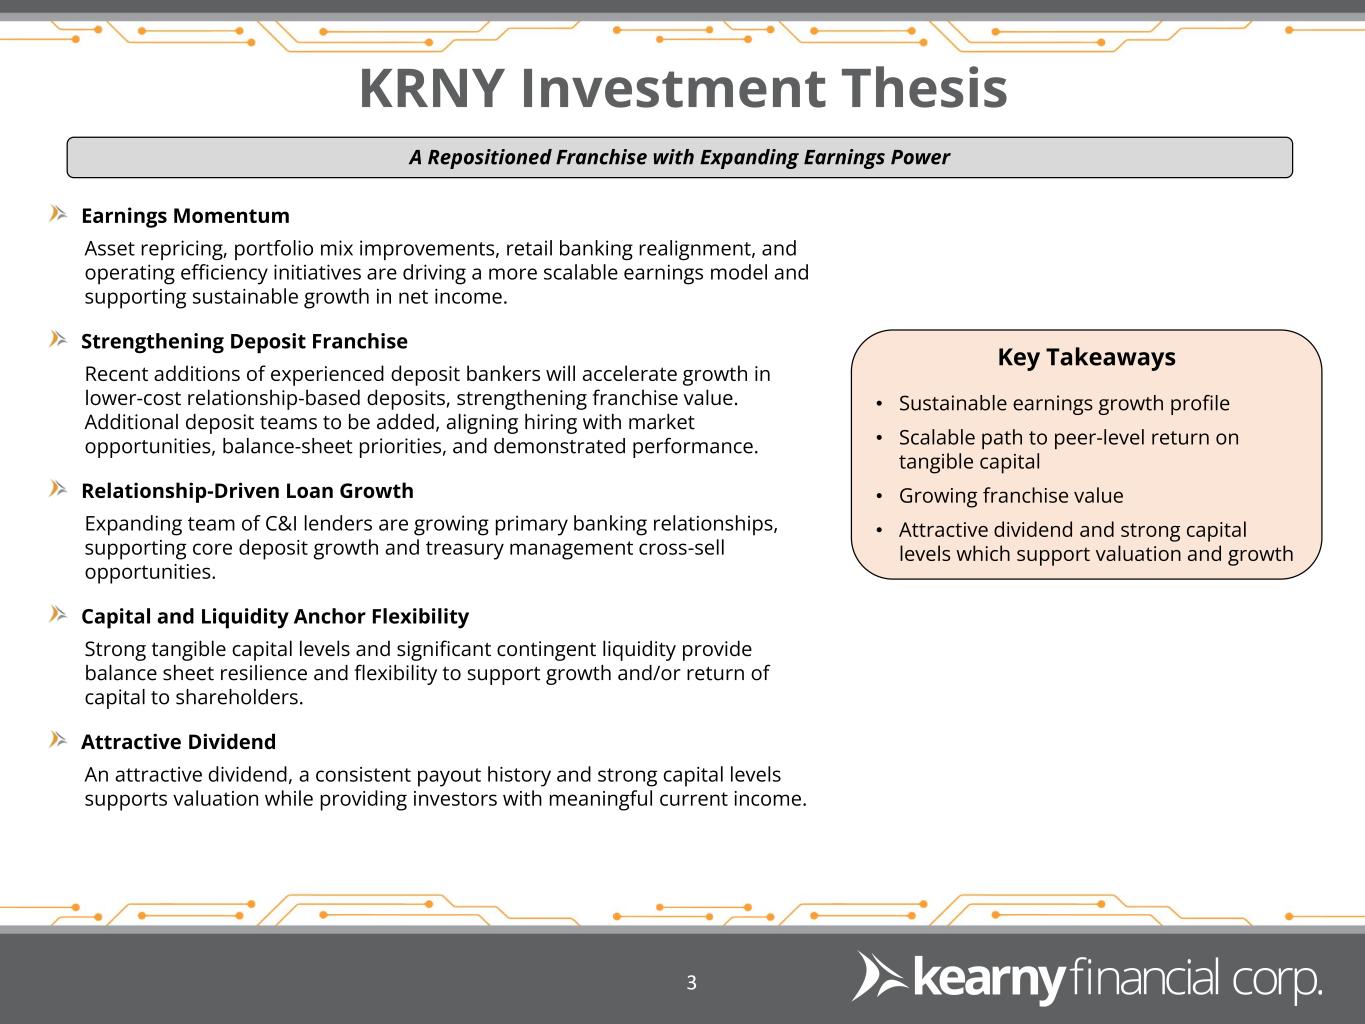
KRNY Investment Thesis 3 Key Takeaways • Sustainable earnings growth profile • Scalable path to peer-level return on tangible capital • Growing franchise value • Attractive dividend and strong capital levels which support valuation and growth Earnings Momentum Asset repricing, portfolio mix improvements, retail banking realignment, and operating efficiency initiatives are driving a more scalable earnings model and supporting sustainable growth in net income. Strengthening Deposit Franchise Recent additions of experienced deposit bankers will accelerate growth in lower-cost relationship-based deposits, strengthening franchise value. Additional deposit teams to be added, aligning hiring with market opportunities, balance-sheet priorities, and demonstrated performance. Relationship-Driven Loan Growth Expanding team of C&I lenders are growing primary banking relationships, supporting core deposit growth and treasury management cross-sell opportunities. Capital and Liquidity Anchor Flexibility Strong tangible capital levels and significant contingent liquidity provide balance sheet resilience and flexibility to support growth and/or return of capital to shareholders. Attractive Dividend An attractive dividend, a consistent payout history and strong capital levels supports valuation while providing investors with meaningful current income. A Repositioned Franchise with Expanding Earnings Power
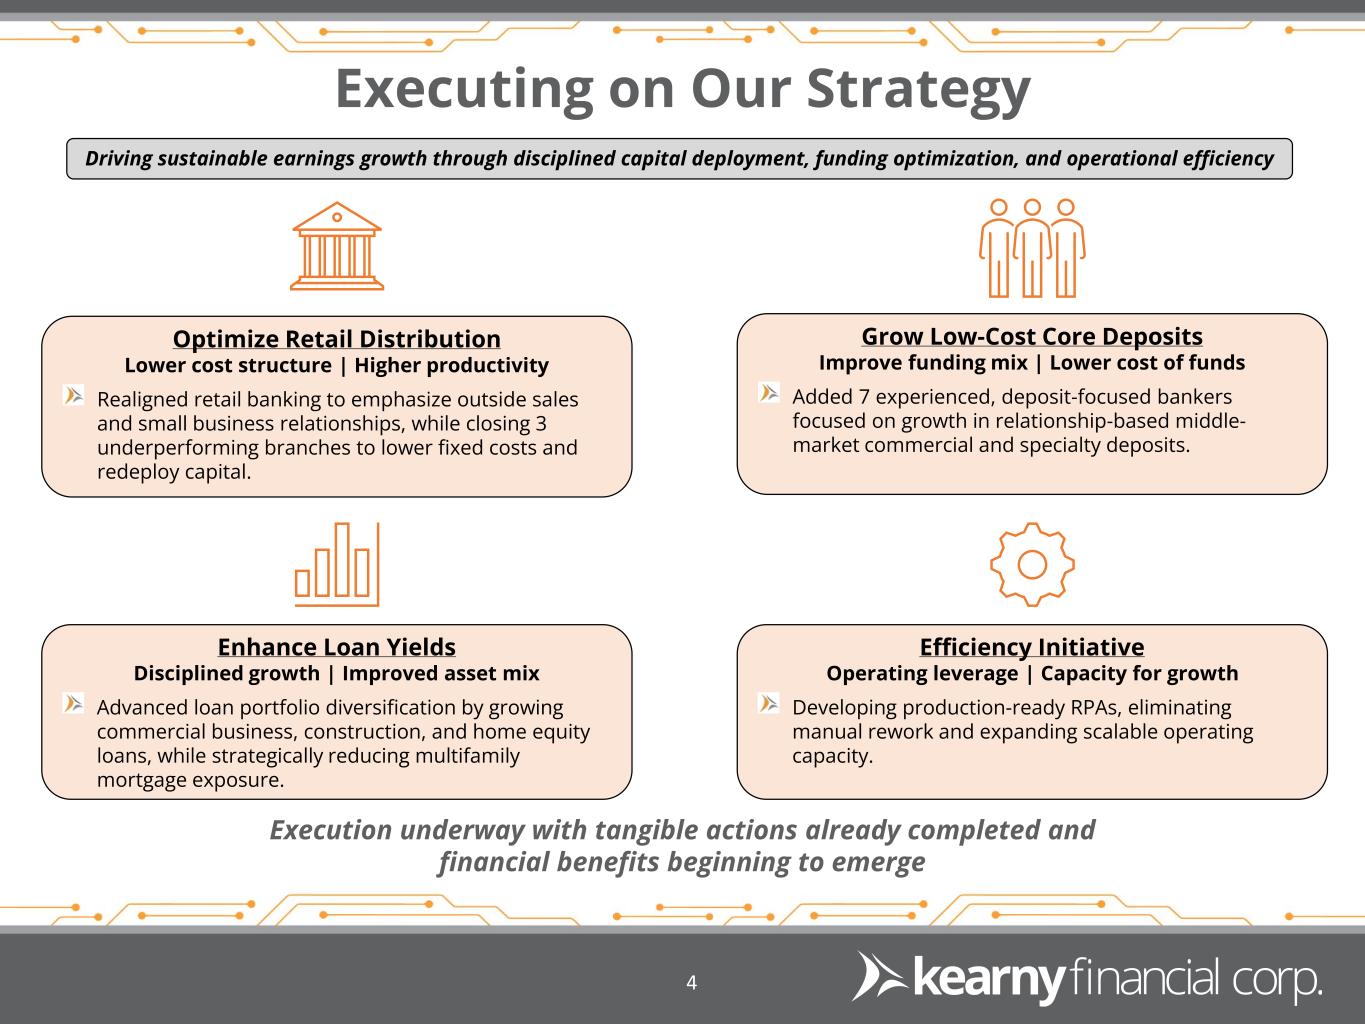
Executing on Our Strategy 4 Efficiency Initiative Operating leverage | Capacity for growth Developing production-ready RPAs, eliminating manual rework and expanding scalable operating capacity. Optimize Retail Distribution Lower cost structure | Higher productivity Realigned retail banking to emphasize outside sales and small business relationships, while closing 3 underperforming branches to lower fixed costs and redeploy capital. Grow Low-Cost Core Deposits Improve funding mix | Lower cost of funds Added 7 experienced, deposit-focused bankers focused on growth in relationship-based middle- market commercial and specialty deposits. Enhance Loan Yields Disciplined growth | Improved asset mix Advanced loan portfolio diversification by growing commercial business, construction, and home equity loans, while strategically reducing multifamily mortgage exposure. Driving sustainable earnings growth through disciplined capital deployment, funding optimization, and operational efficiency Execution underway with tangible actions already completed and financial benefits beginning to emerge
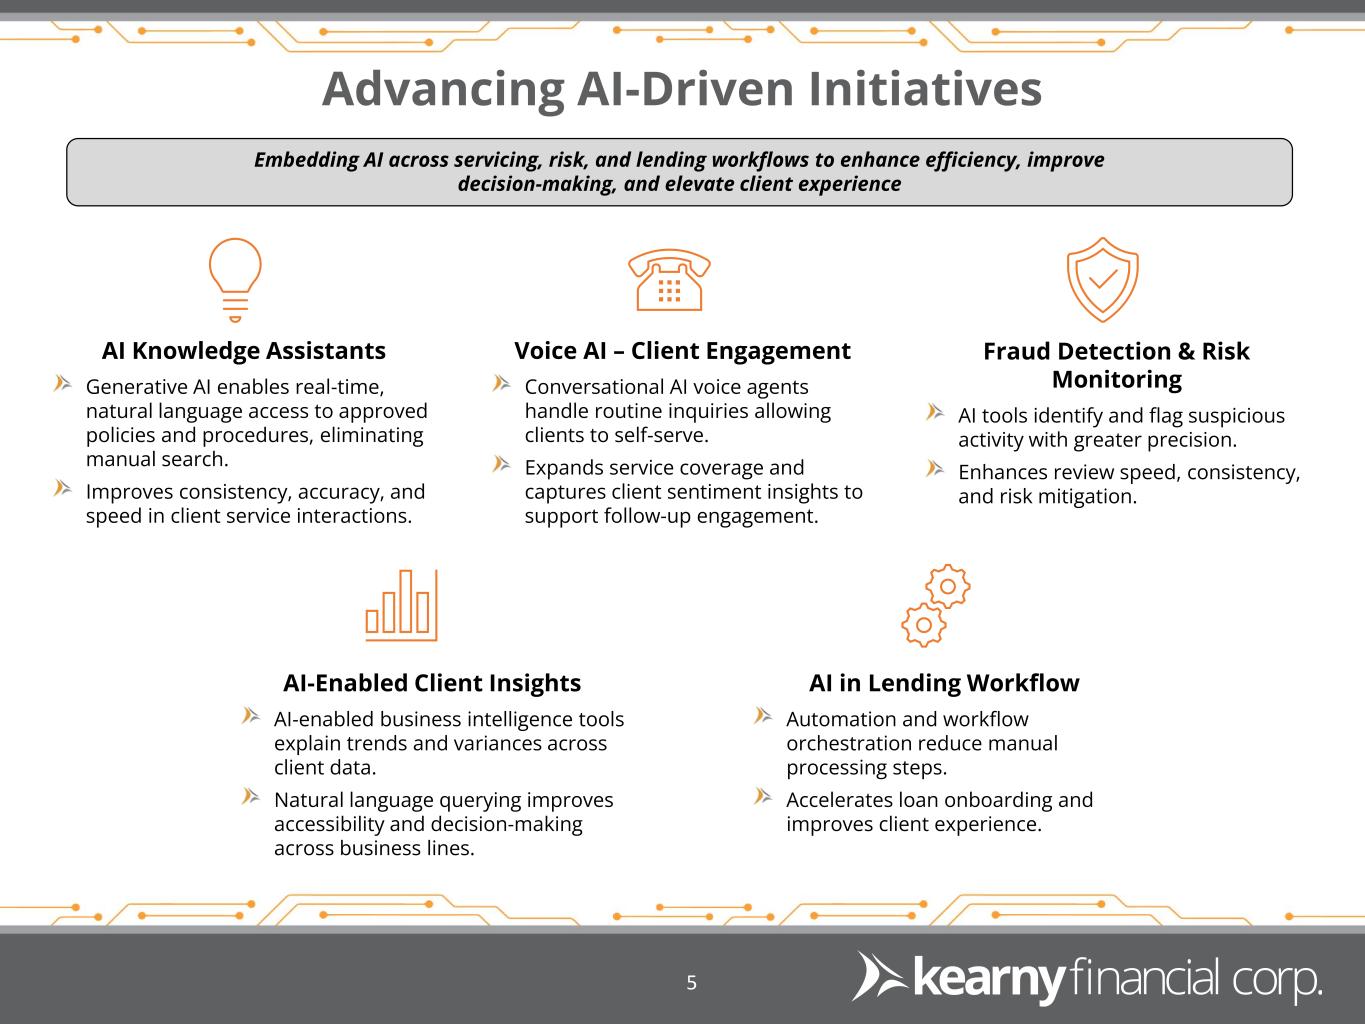
Advancing AI-Driven Initiatives 5 AI Knowledge Assistants Generative AI enables real-time, natural language access to approved policies and procedures, eliminating manual search. Improves consistency, accuracy, and speed in client service interactions. Fraud Detection & Risk Monitoring AI tools identify and flag suspicious activity with greater precision. Enhances review speed, consistency, and risk mitigation. Voice AI – Client Engagement Conversational AI voice agents handle routine inquiries allowing clients to self-serve. Expands service coverage and captures client sentiment insights to support follow-up engagement. AI-Enabled Client Insights AI-enabled business intelligence tools explain trends and variances across client data. Natural language querying improves accessibility and decision-making across business lines. AI in Lending Workflow Automation and workflow orchestration reduce manual processing steps. Accelerates loan onboarding and improves client experience. Embedding AI across servicing, risk, and lending workflows to enhance efficiency, improve decision-making, and elevate client experience
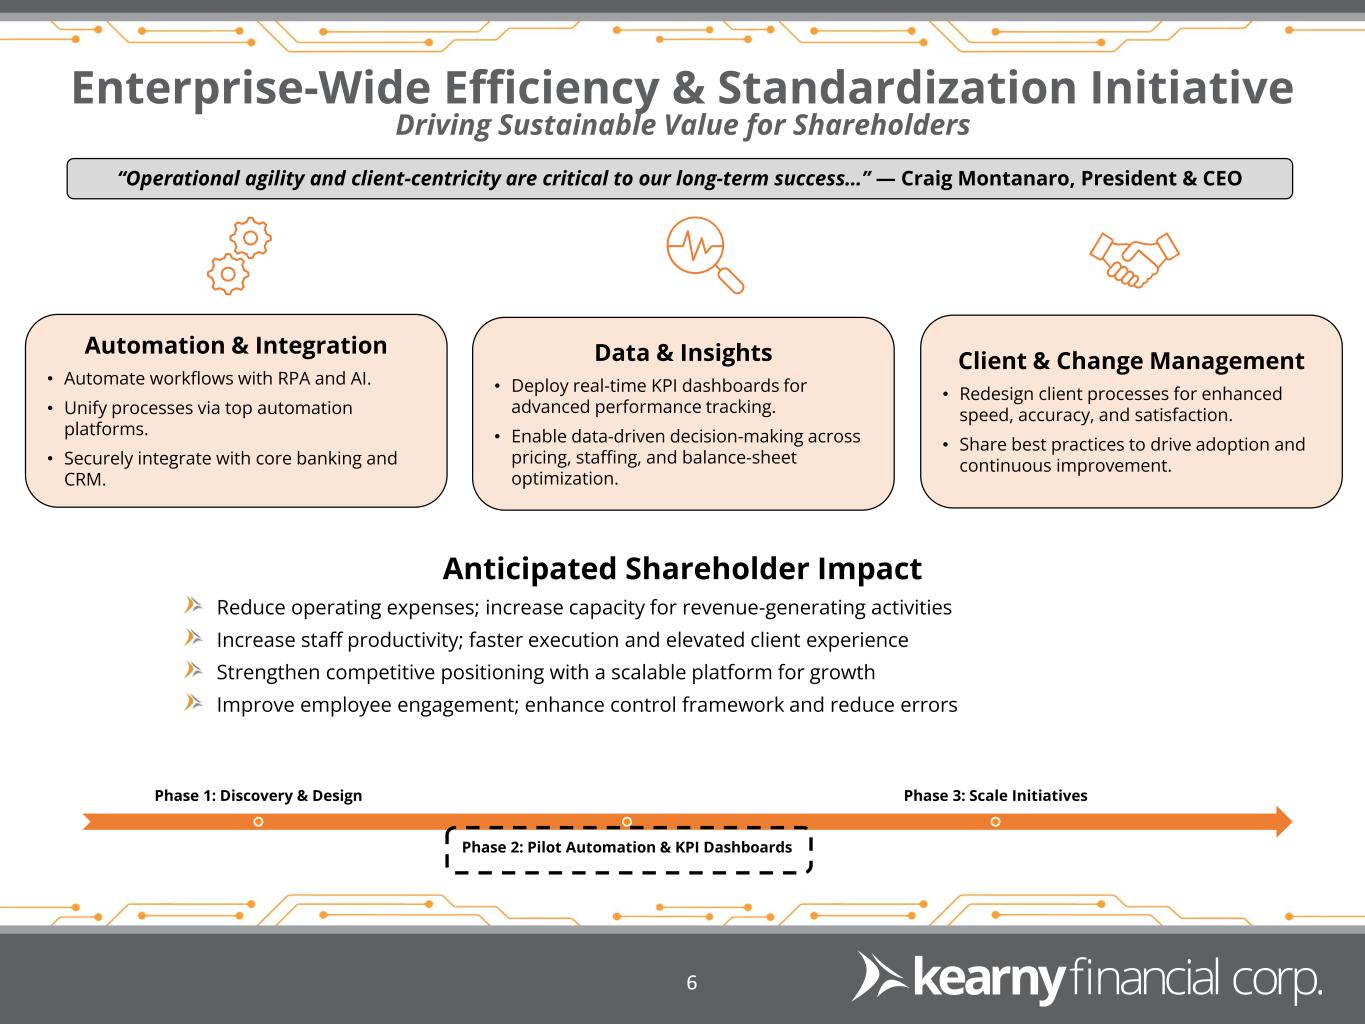
Enterprise-Wide Efficiency & Standardization Initiative Driving Sustainable Value for Shareholders 6 Anticipated Shareholder Impact Reduce operating expenses; increase capacity for revenue-generating activities Increase staff productivity; faster execution and elevated client experience Strengthen competitive positioning with a scalable platform for growth Improve employee engagement; enhance control framework and reduce errors “Operational agility and client-centricity are critical to our long-term success…” — Craig Montanaro, President & CEO Phase 1: Discovery & Design Phase 2: Pilot Automation & KPI Dashboards Phase 3: Scale Initiatives Automation & Integration • Automate workflows with RPA and AI. • Unify processes via top automation platforms. • Securely integrate with core banking and CRM. Data & Insights • Deploy real-time KPI dashboards for advanced performance tracking. • Enable data-driven decision-making across pricing, staffing, and balance-sheet optimization. Client & Change Management • Redesign client processes for enhanced speed, accuracy, and satisfaction. • Share best practices to drive adoption and continuous improvement.
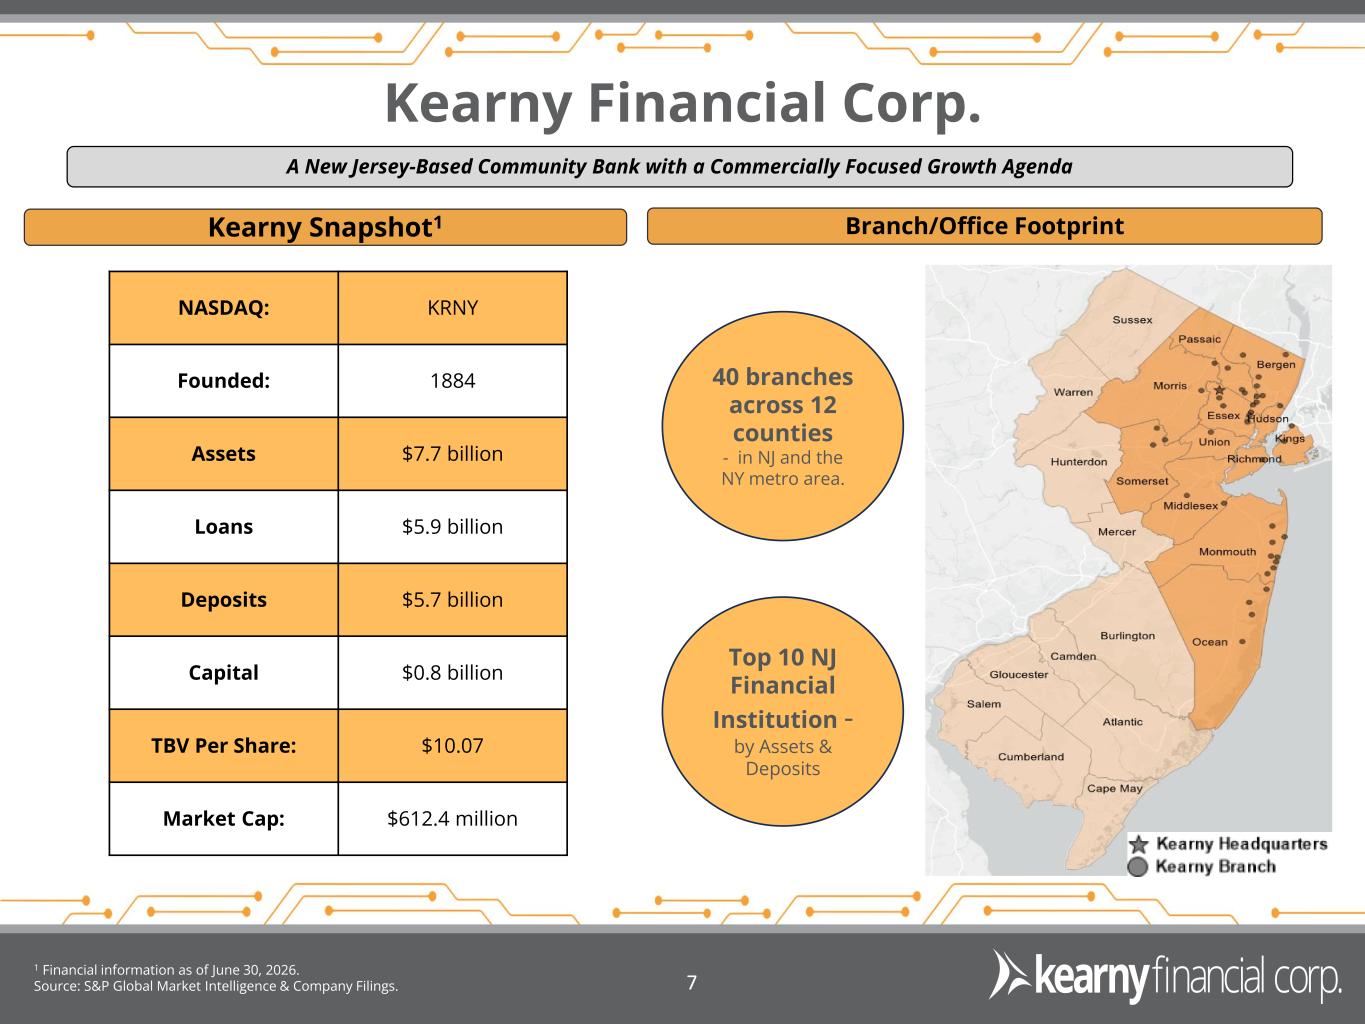
Kearny Financial Corp. 1 Financial information as of June 30, 2026. Source: S&P Global Market Intelligence & Company Filings. 7 Branch/Office Footprint NASDAQ: KRNY Founded: 1884 Assets $7.7 billion Loans $5.9 billion Deposits $5.7 billion Capital $0.8 billion TBV Per Share: $10.07 Market Cap: $612.4 million Kearny Snapshot1 40 branches across 12 counties - in NJ and the NY metro area. Top 10 NJ Financial Institution - by Assets & Deposits A New Jersey-Based Community Bank with a Commercially Focused Growth Agenda
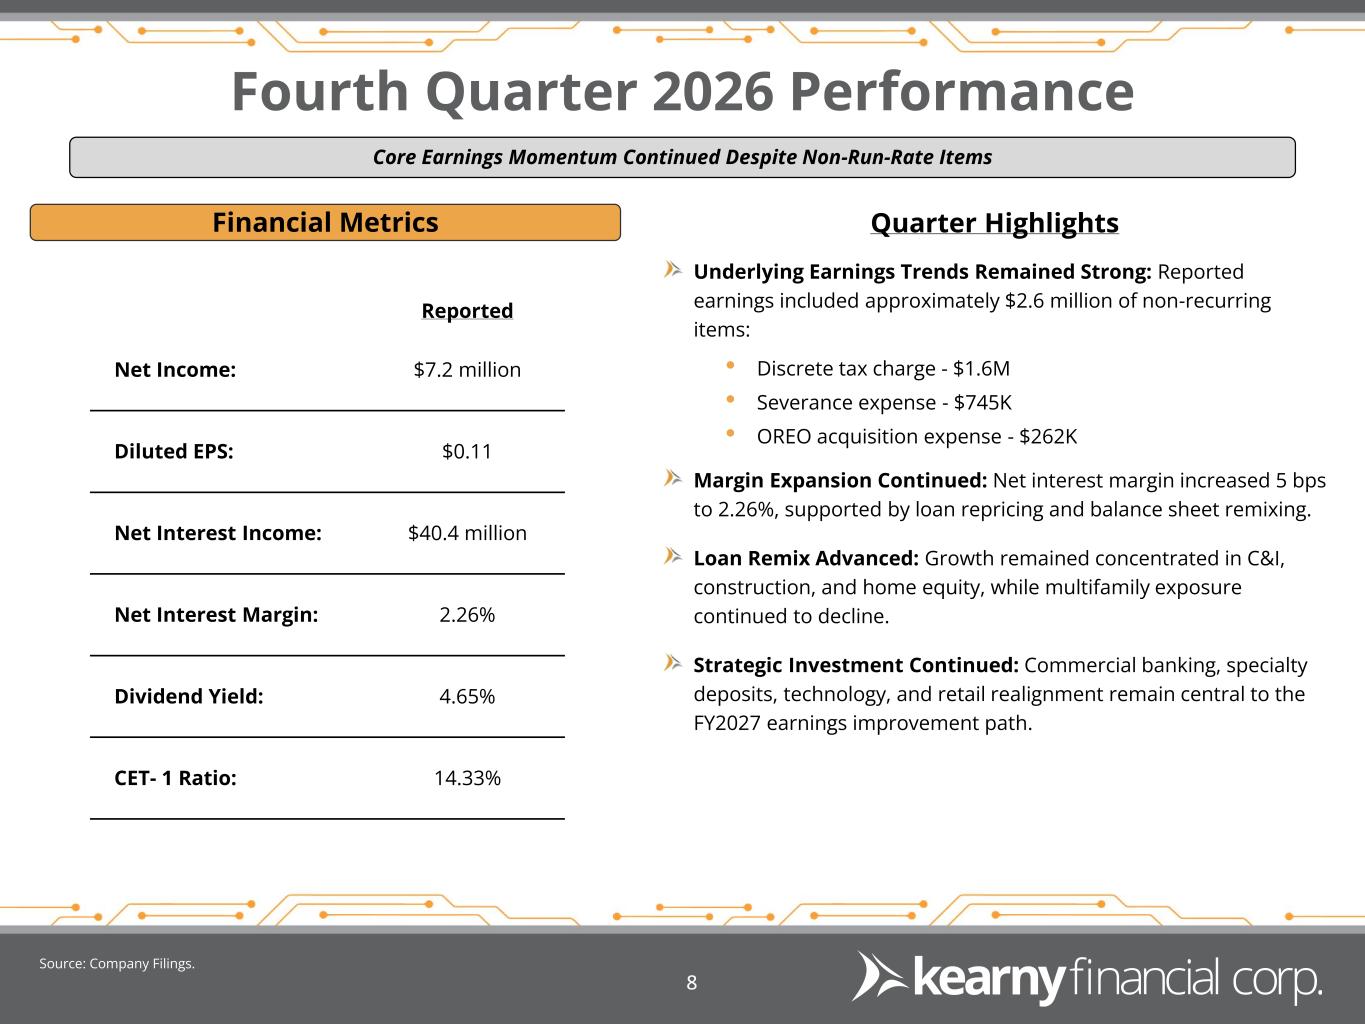
Fourth Quarter 2026 Performance Source: Company Filings. 8 Quarter Highlights Underlying Earnings Trends Remained Strong: Reported earnings included approximately $2.6 million of non-recurring items: • Discrete tax charge - $1.6M • Severance expense - $745K • OREO acquisition expense - $262K Margin Expansion Continued: Net interest margin increased 5 bps to 2.26%, supported by loan repricing and balance sheet remixing. Loan Remix Advanced: Growth remained concentrated in C&I, construction, and home equity, while multifamily exposure continued to decline. Strategic Investment Continued: Commercial banking, specialty deposits, technology, and retail realignment remain central to the FY2027 earnings improvement path. Reported Net Income: $7.2 million Diluted EPS: $0.11 Net Interest Income: $40.4 million Net Interest Margin: 2.26% Dividend Yield: 4.65% CET- 1 Ratio: 14.33% Financial Metrics Core Earnings Momentum Continued Despite Non-Run-Rate Items
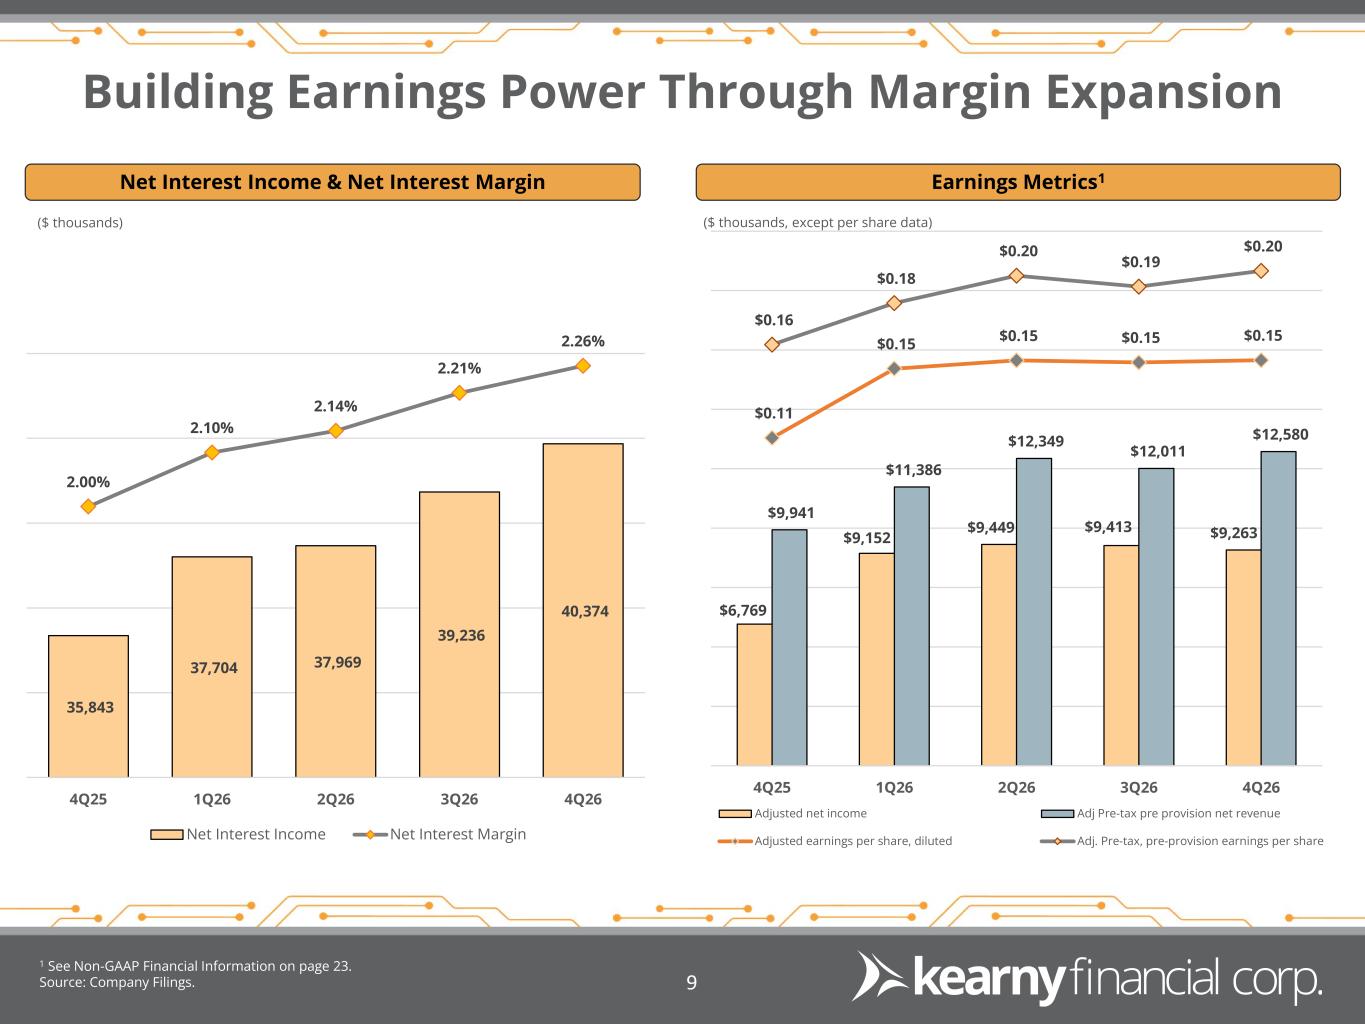
Building Earnings Power Through Margin Expansion Net Interest Income & Net Interest Margin 9 Earnings Metrics1 1 See Non-GAAP Financial Information on page 23. Source: Company Filings. ($ thousands) ($ thousands, except per share data) 35,843 37,704 37,969 39,236 40,374 2.00% 2.10% 2.14% 2.21% 2.26% 4Q25 1Q26 2Q26 3Q26 4Q26 Net Interest Income Net Interest Margin $6,769 $9,152 $9,449 $9,413 $9,263 $9,941 $11,386 $12,349 $12,011 $12,580 $0.11 $0.15 $0.15 $0.15 $0.15 $0.16 $0.18 $0.20 $0.19 $0.20 4Q25 1Q26 2Q26 3Q26 4Q26 Adjusted net income Adj Pre-tax pre provision net revenue Adjusted earnings per share, diluted Adj. Pre-tax, pre-provision earnings per share
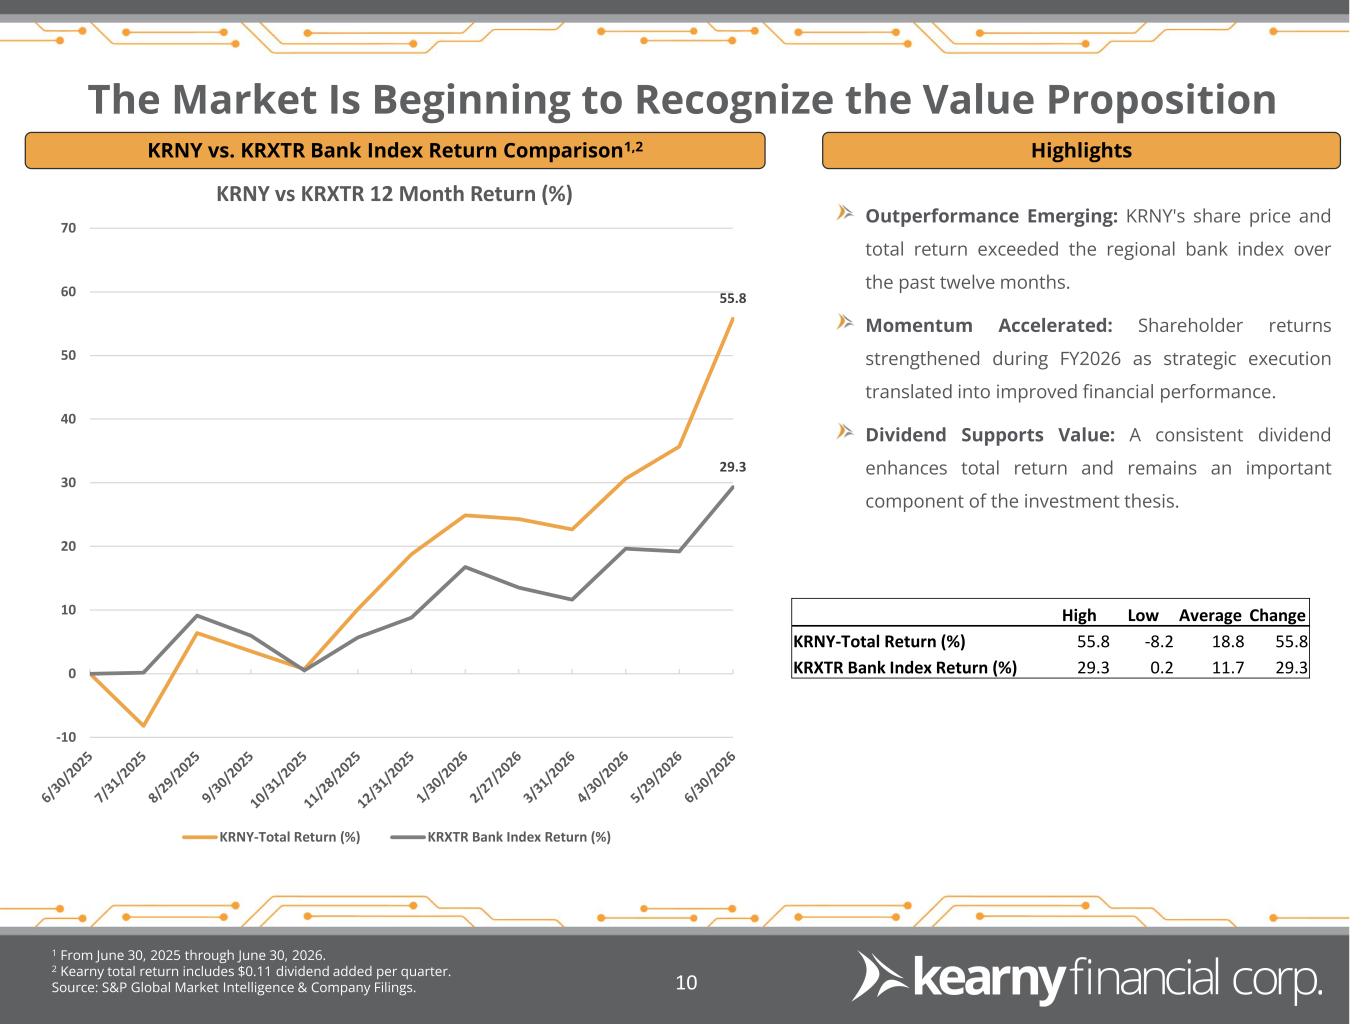
10 HighlightsKRNY vs. KRXTR Bank Index Return Comparison1,2 High Low Average Change KRNY-Total Return (%) 55.8 -8.2 18.8 55.8 KRXTR Bank Index Return (%) 29.3 0.2 11.7 29.3 1 From June 30, 2025 through June 30, 2026. 2 Kearny total return includes $0.11 dividend added per quarter. Source: S&P Global Market Intelligence & Company Filings. 55.8 29.3 -10 0 10 20 30 40 50 60 70 KRNY vs KRXTR 12 Month Return (%) KRNY-Total Return (%) KRXTR Bank Index Return (%) The Market Is Beginning to Recognize the Value Proposition Outperformance Emerging: KRNY's share price and total return exceeded the regional bank index over the past twelve months. Momentum Accelerated: Shareholder returns strengthened during FY2026 as strategic execution translated into improved financial performance. Dividend Supports Value: A consistent dividend enhances total return and remains an important component of the investment thesis.
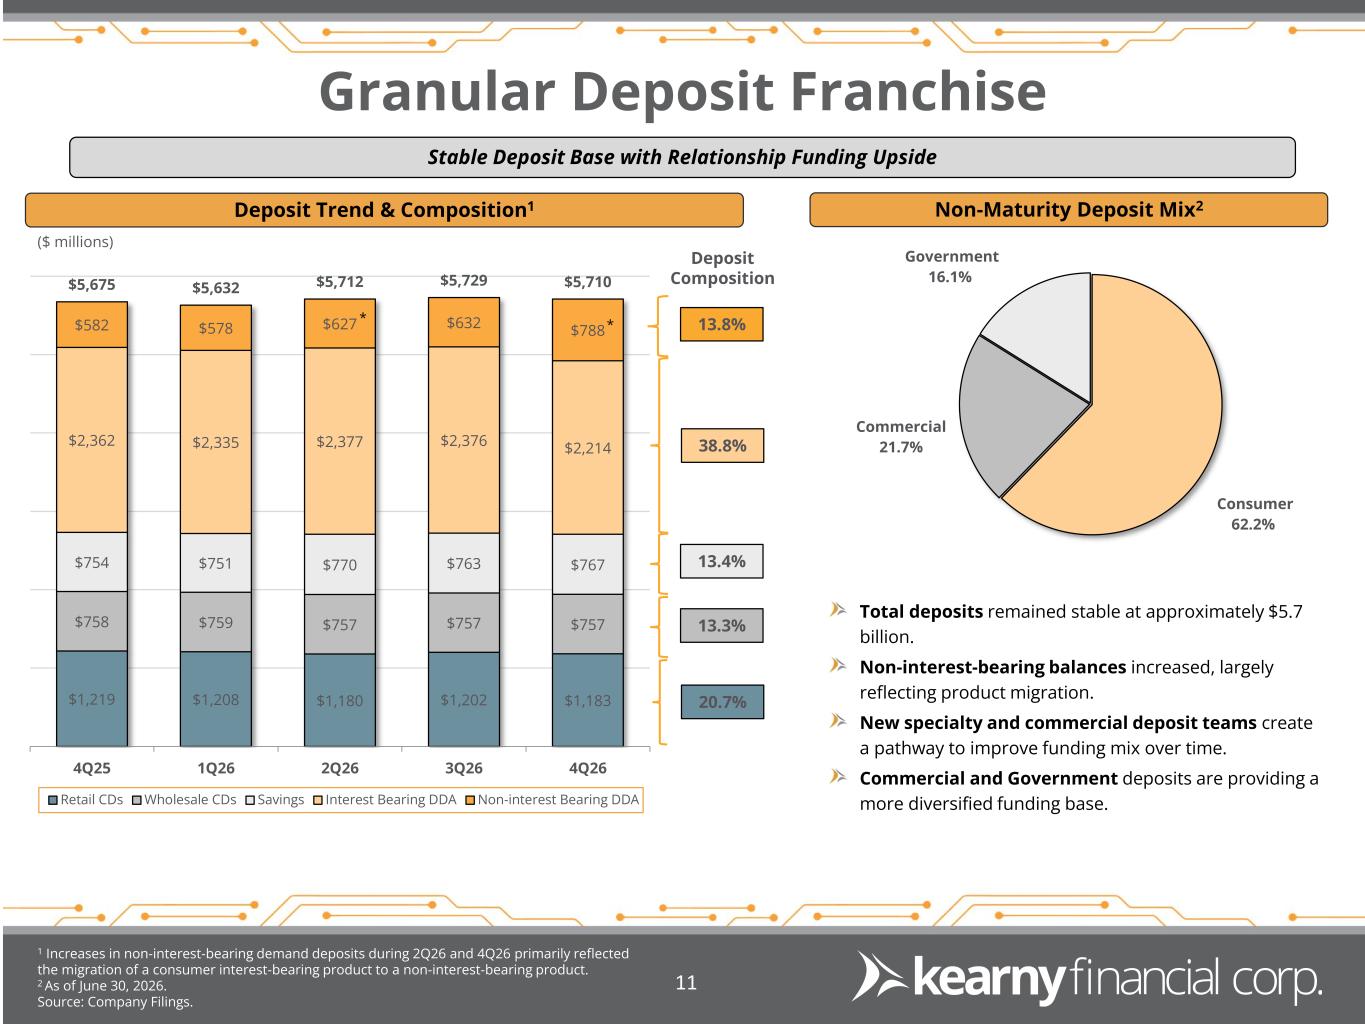
Granular Deposit Franchise 1 Increases in non-interest-bearing demand deposits during 2Q26 and 4Q26 primarily reflected the migration of a consumer interest-bearing product to a non-interest-bearing product. 2 As of June 30, 2026. Source: Company Filings. 11 Non-Maturity Deposit Mix2 ($ millions) 20.7% 13.3% 13.4% 38.8% 13.8% Deposit Composition Deposit Trend & Composition1 $1,219 $1,208 $1,180 $1,202 $1,183 $758 $759 $757 $757 $757 $754 $751 $770 $763 $767 $2,362 $2,335 $2,377 $2,376 $2,214 $582 $578 $627 $632 $788 $5,675 $5,632 $5,712 $5,729 $5,710 4Q25 1Q26 2Q26 3Q26 4Q26 Retail CDs Wholesale CDs Savings Interest Bearing DDA Non-interest Bearing DDA Consumer 62.2% Commercial 21.7% Government 16.1% Total deposits remained stable at approximately $5.7 billion. Non-interest-bearing balances increased, largely reflecting product migration. New specialty and commercial deposit teams create a pathway to improve funding mix over time. Commercial and Government deposits are providing a more diversified funding base. Stable Deposit Base with Relationship Funding Upside **
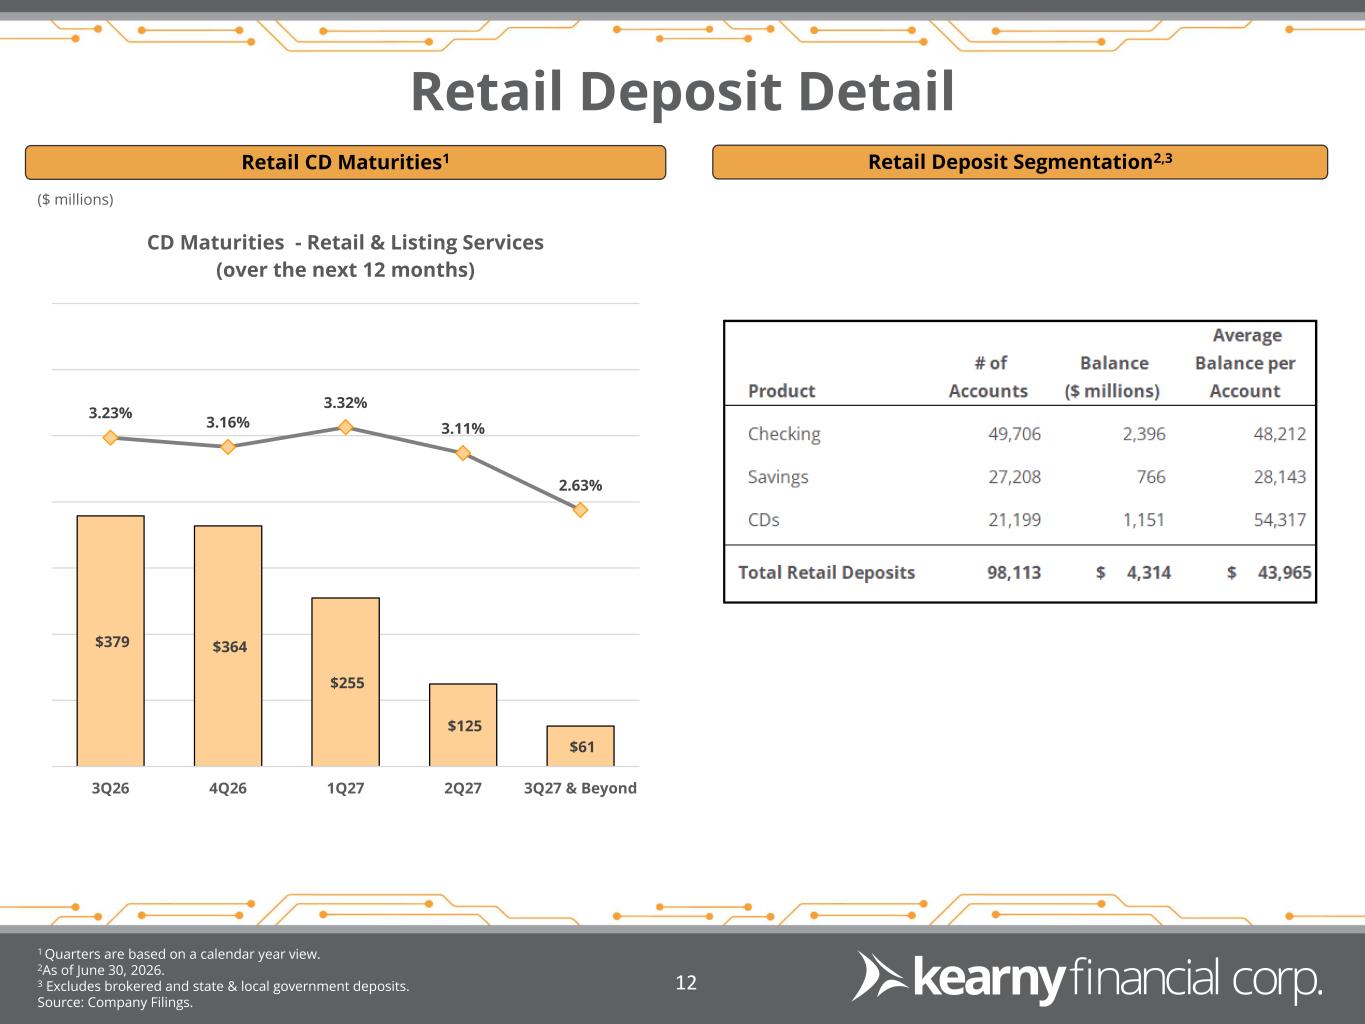
Retail Deposit Detail 1 Quarters are based on a calendar year view. 2As of June 30, 2026. 3 Excludes brokered and state & local government deposits. Source: Company Filings. 12 Retail CD Maturities1 Retail Deposit Segmentation2,3 ($ millions) $379 $364 $255 $125 $61 3.23% 3.16% 3.32% 3.11% 2.63% 3Q26 4Q26 1Q27 2Q27 3Q27 & Beyond CD Maturities - Retail & Listing Services (over the next 12 months)
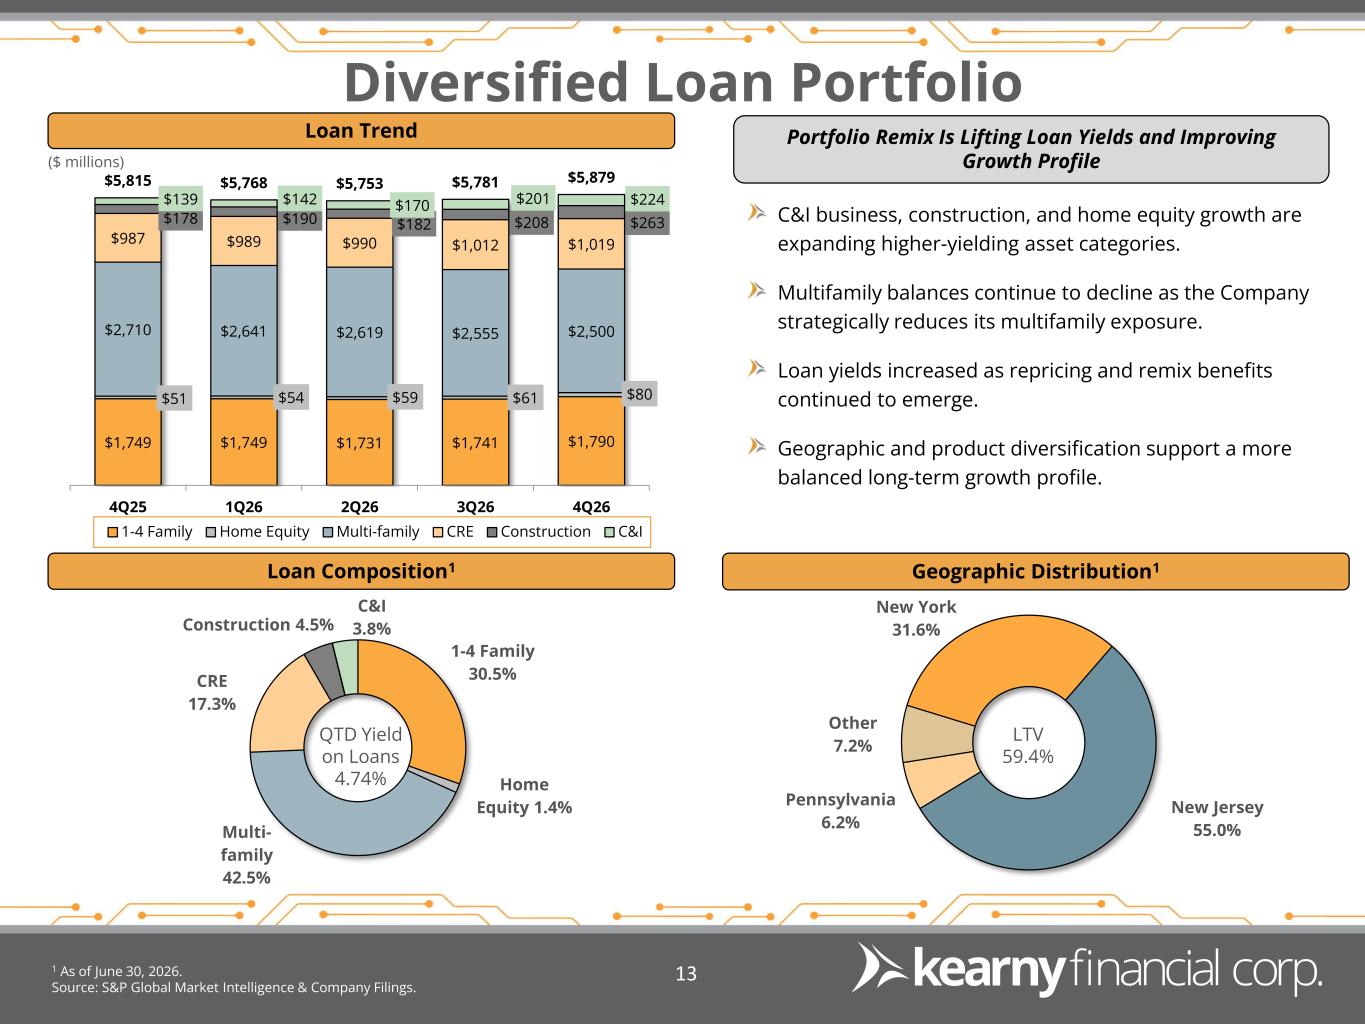
New York 31.6% New Jersey 55.0% Pennsylvania 6.2% Other 7.2% 1-4 Family 30.5% Home Equity 1.4% Multi- family 42.5% CRE 17.3% Construction 4.5% C&I 3.8% QTD Yield on Loans 4.74% Diversified Loan Portfolio Loan Trend 1 As of June 30, 2026. Source: S&P Global Market Intelligence & Company Filings. 13 Geographic Distribution1 LTV 59.4% Loan Composition1 ($ millions) C&I business, construction, and home equity growth are expanding higher-yielding asset categories. Multifamily balances continue to decline as the Company strategically reduces its multifamily exposure. Loan yields increased as repricing and remix benefits continued to emerge. Geographic and product diversification support a more balanced long-term growth profile. $1,749 $1,749 $1,731 $1,741 $1,790 $51 $54 $59 $61 $80 $2,710 $2,641 $2,619 $2,555 $2,500 $987 $989 $990 $1,012 $1,019 $178 $190 $182 $208 $263 $139 $142 $170 $201 $224 $5,815 $5,768 $5,753 $5,781 $5,879 4Q25 1Q26 2Q26 3Q26 4Q26 1-4 Family Home Equity Multi-family CRE Construction C&I Portfolio Remix Is Lifting Loan Yields and Improving Growth Profile
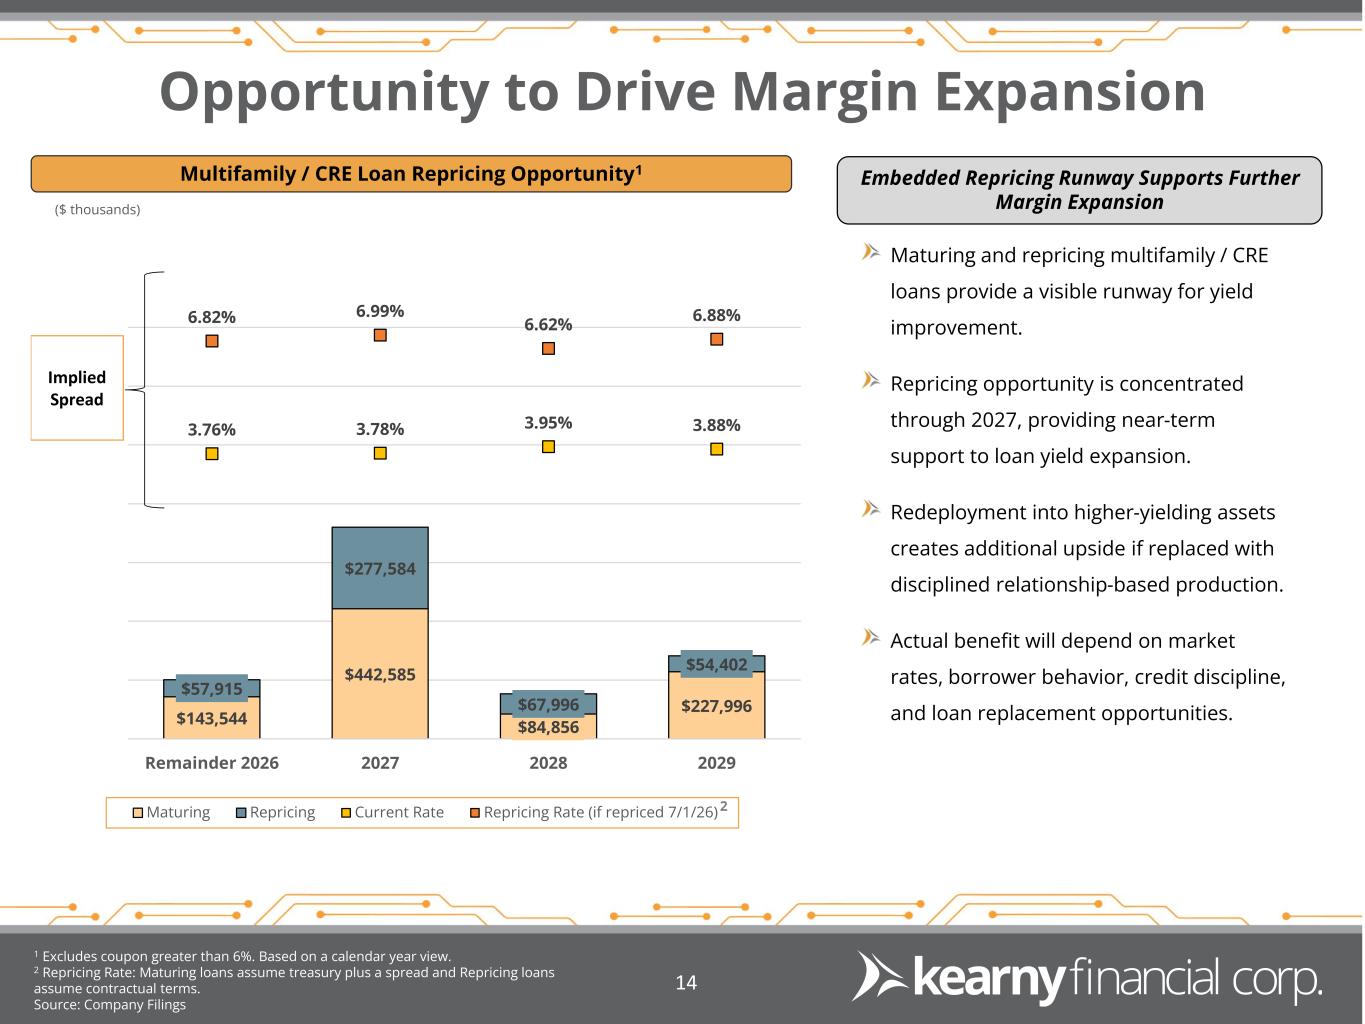
Opportunity to Drive Margin Expansion 14 Multifamily / CRE Loan Repricing Opportunity1 Maturing and repricing multifamily / CRE loans provide a visible runway for yield improvement. Repricing opportunity is concentrated through 2027, providing near-term support to loan yield expansion. Redeployment into higher-yielding assets creates additional upside if replaced with disciplined relationship-based production. Actual benefit will depend on market rates, borrower behavior, credit discipline, and loan replacement opportunities. 1 Excludes coupon greater than 6%. Based on a calendar year view. 2 Repricing Rate: Maturing loans assume treasury plus a spread and Repricing loans assume contractual terms. Source: Company Filings ($ thousands) $143,544 $442,585 $84,856 $227,996 $57,915 $277,584 $67,996 $54,402 3.76% 3.78% 3.95% 3.88% 6.82% 6.99% 6.62% 6.88% Remainder 2026 2027 2028 2029 Maturing Repricing Current Rate Repricing Rate (if repriced 7/1/26) Implied Spread 2 Embedded Repricing Runway Supports Further Margin Expansion
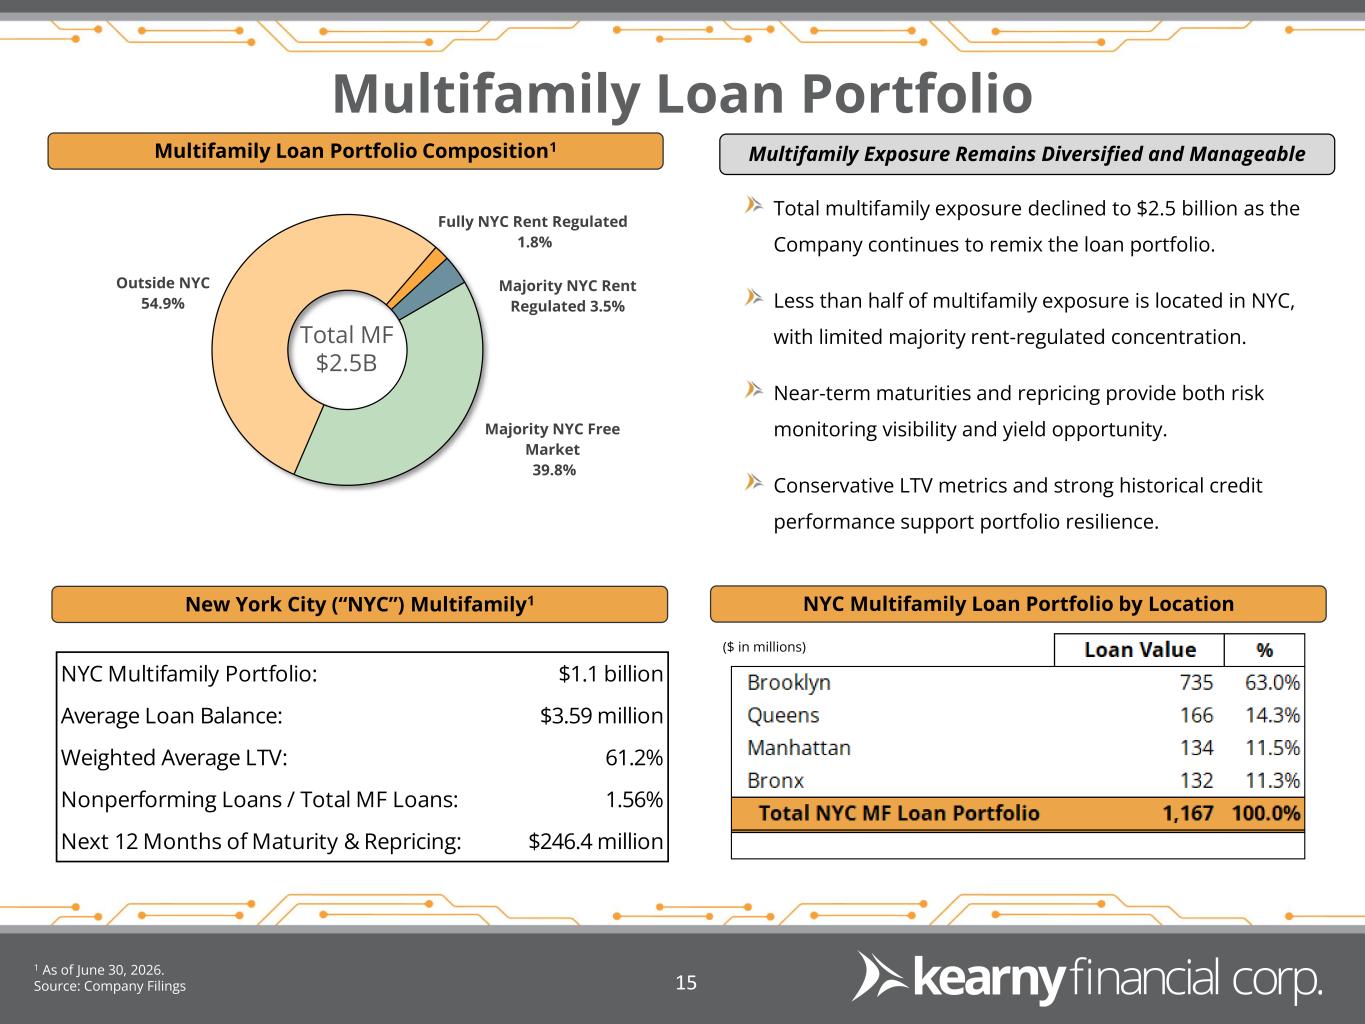
Multifamily Loan Portfolio Multifamily Loan Portfolio Composition1 1 As of June 30, 2026. Source: Company Filings 15 NYC Multifamily Loan Portfolio by Location Total MF $2.5B New York City (“NYC”) Multifamily1 Majority NYC Free Market 39.8% Outside NYC 54.9% Fully NYC Rent Regulated 1.8% Majority NYC Rent Regulated 3.5% ($ in millions) Multifamily Exposure Remains Diversified and Manageable Total multifamily exposure declined to $2.5 billion as the Company continues to remix the loan portfolio. Less than half of multifamily exposure is located in NYC, with limited majority rent-regulated concentration. Near-term maturities and repricing provide both risk monitoring visibility and yield opportunity. Conservative LTV metrics and strong historical credit performance support portfolio resilience. NYC Multifamily Portfolio: $1.1 billion Average Loan Balance: $3.59 million Weighted Average LTV: 61.2% Nonperforming Loans / Total MF Loans: 1.56% Next 12 Months of Maturity & Repricing: $246.4 million
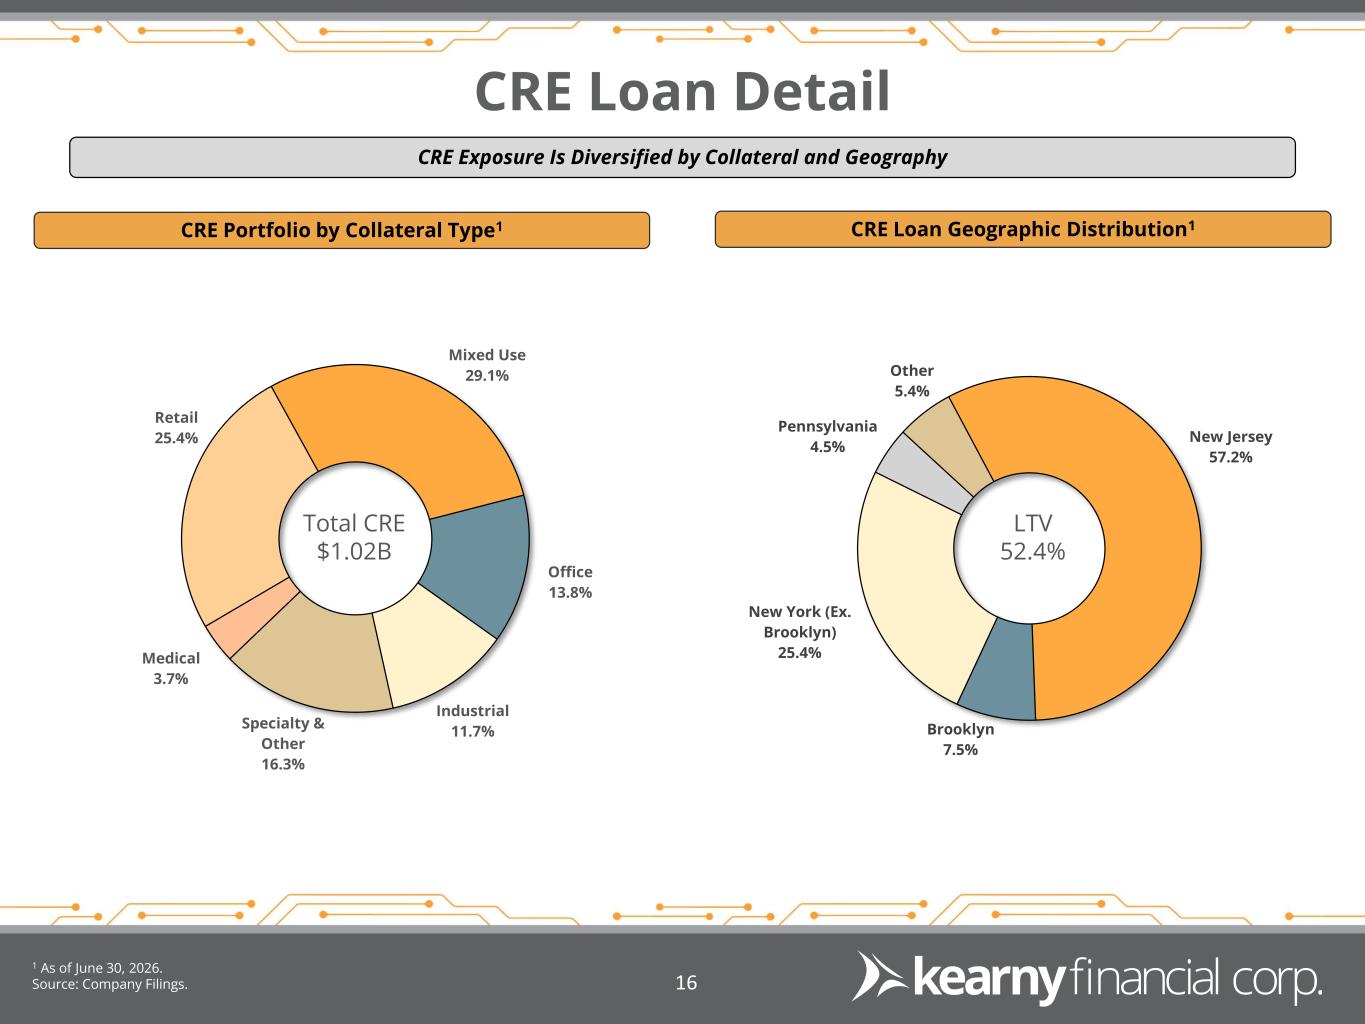
Mixed Use 29.1% Office 13.8% Industrial 11.7%Specialty & Other 16.3% Medical 3.7% Retail 25.4% New Jersey 57.2% Brooklyn 7.5% New York (Ex. Brooklyn) 25.4% Pennsylvania 4.5% Other 5.4% CRE Loan Detail 1 As of June 30, 2026. Source: Company Filings. 16 Total CRE $1.02B LTV 52.4% CRE Portfolio by Collateral Type1 CRE Loan Geographic Distribution1 CRE Exposure Is Diversified by Collateral and Geography
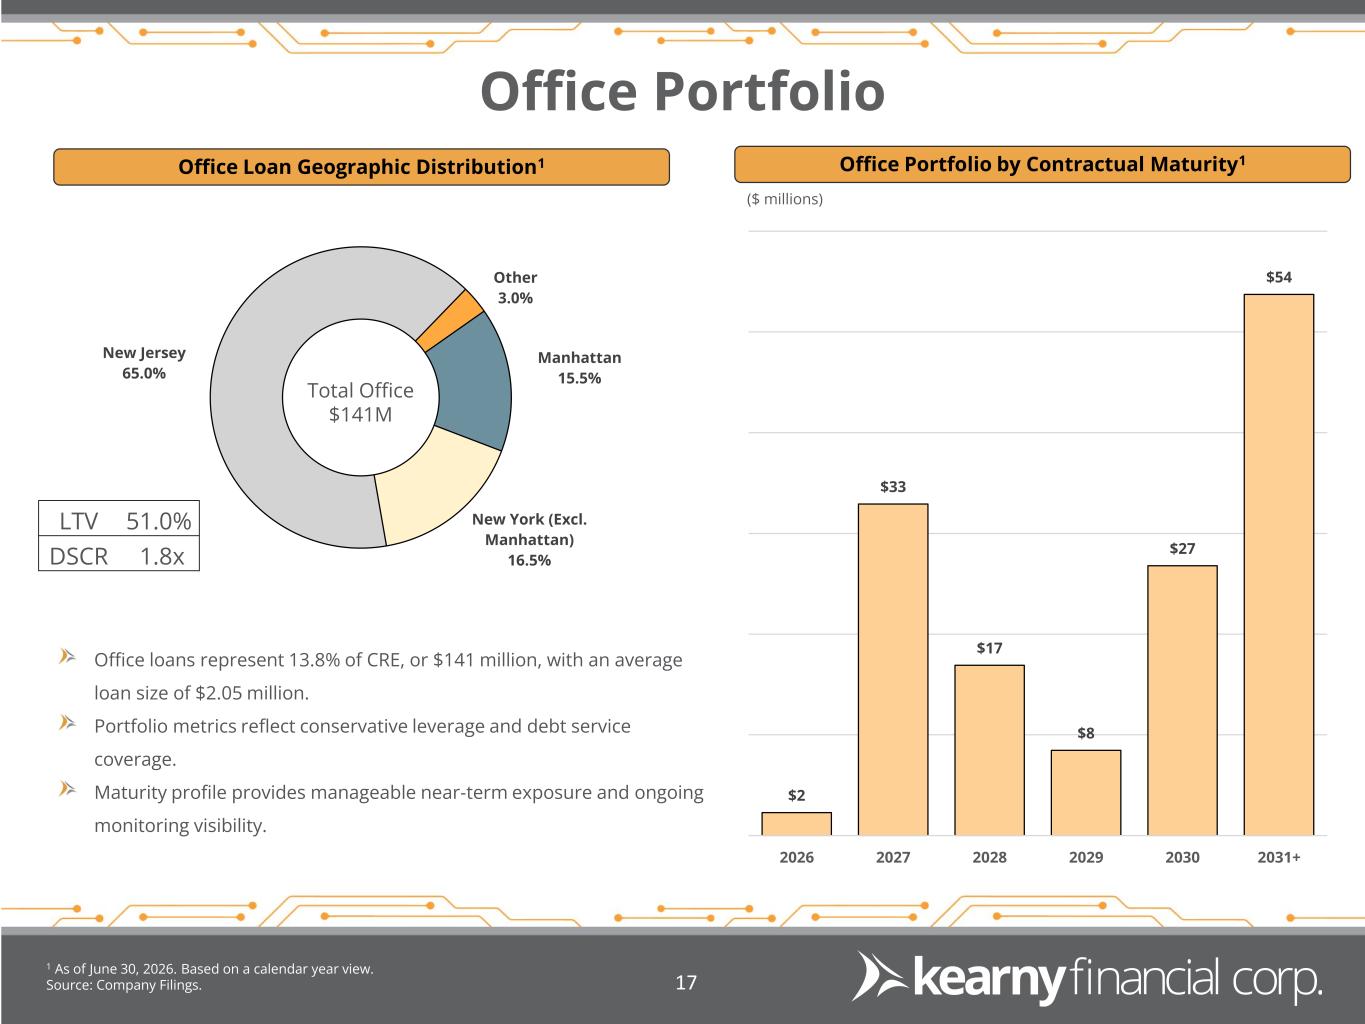
Manhattan 15.5% New York (Excl. Manhattan) 16.5% New Jersey 65.0% Other 3.0% Office Portfolio 1 As of June 30, 2026. Based on a calendar year view. Source: Company Filings. 17 Office Portfolio by Contractual Maturity1 Office loans represent 13.8% of CRE, or $141 million, with an average loan size of $2.05 million. Portfolio metrics reflect conservative leverage and debt service coverage. Maturity profile provides manageable near-term exposure and ongoing monitoring visibility. ($ millions) Office Loan Geographic Distribution1 LTV 51.0% DSCR 1.8x Total Office $141M $2 $33 $17 $8 $27 $54 2026 2027 2028 2029 2030 2031+
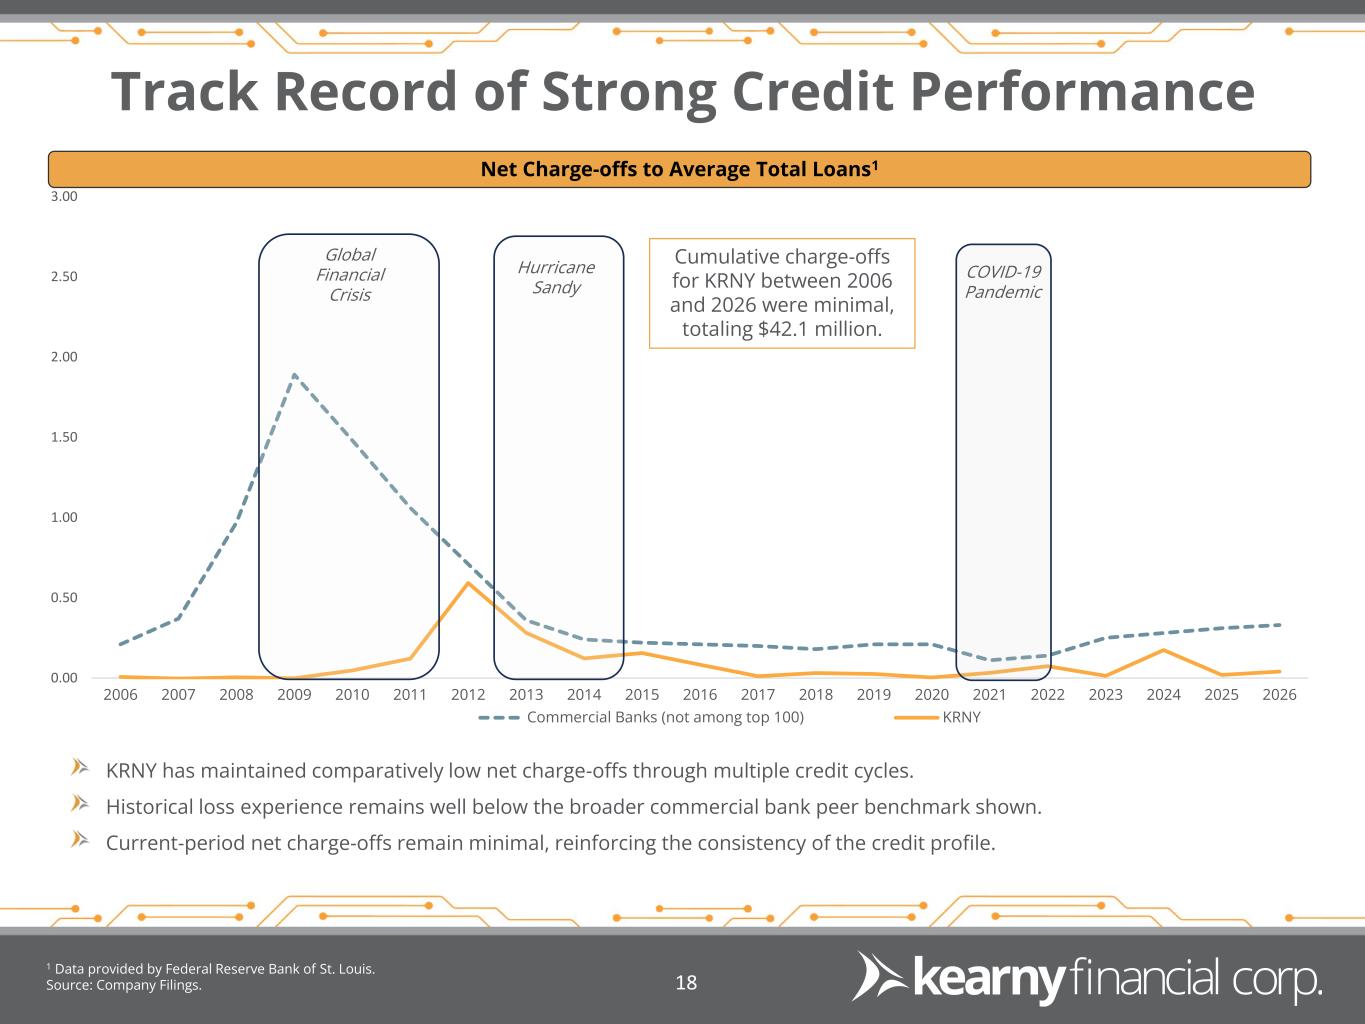
0.00 0.50 1.00 1.50 2.00 2.50 3.00 2006 2007 2008 2009 2010 2011 2012 2013 2014 2015 2016 2017 2018 2019 2020 2021 2022 2023 2024 2025 2026 Commercial Banks (not among top 100) KRNY Global Financial Crisis Hurricane Sandy COVID-19 Pandemic Track Record of Strong Credit Performance 1 Data provided by Federal Reserve Bank of St. Louis. Source: Company Filings. 18 Net Charge-offs to Average Total Loans1 KRNY has maintained comparatively low net charge-offs through multiple credit cycles. Historical loss experience remains well below the broader commercial bank peer benchmark shown. Current-period net charge-offs remain minimal, reinforcing the consistency of the credit profile. Cumulative charge-offs for KRNY between 2006 and 2026 were minimal, totaling $42.1 million.
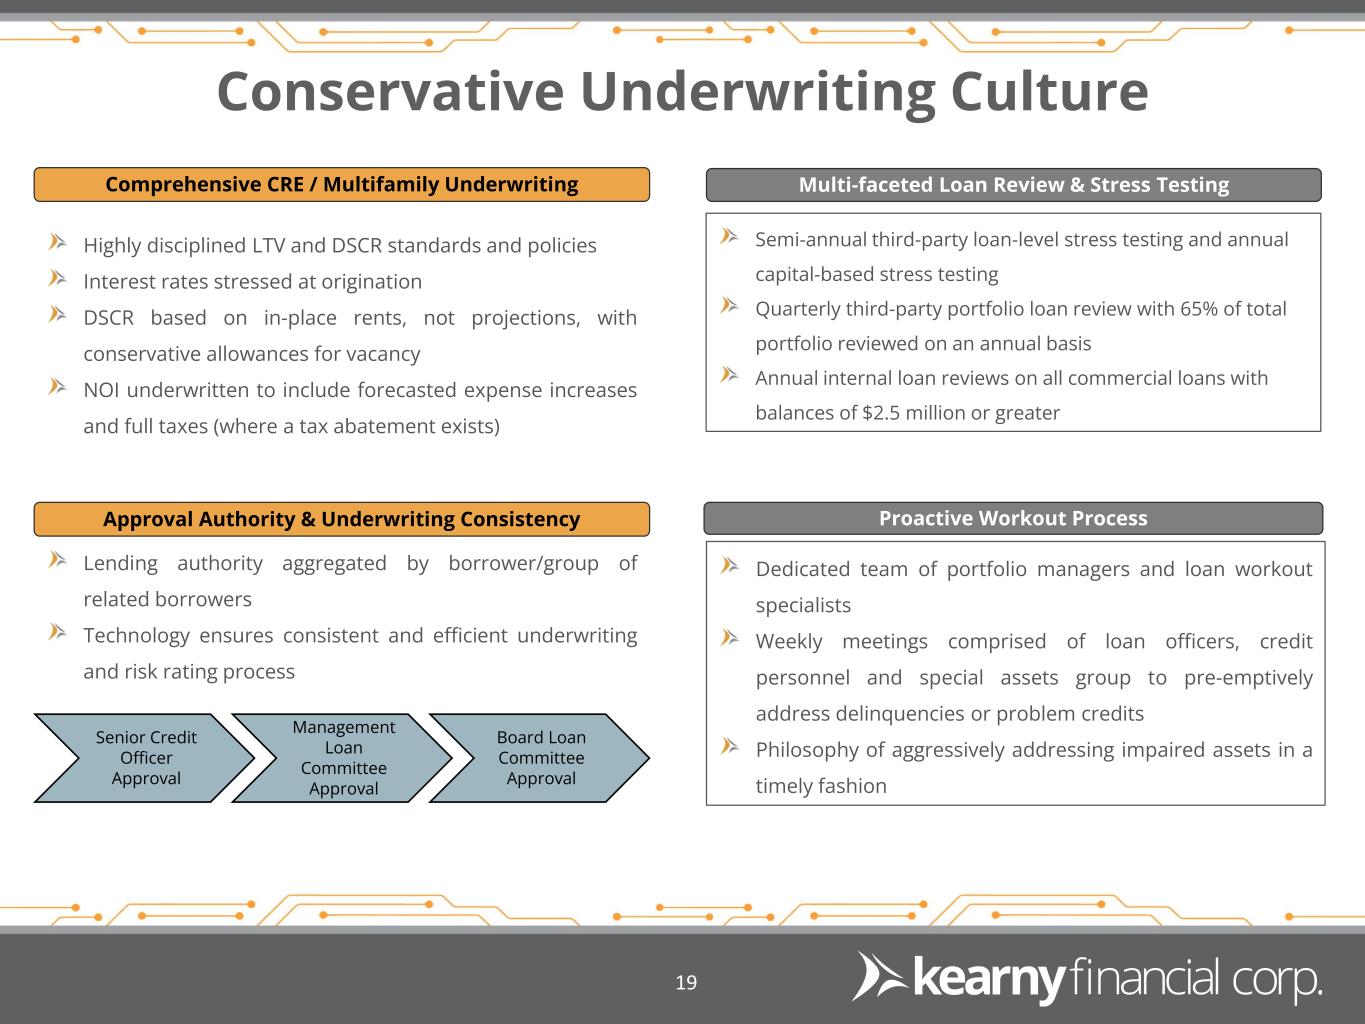
19 Conservative Underwriting Culture Comprehensive CRE / Multifamily Underwriting Highly disciplined LTV and DSCR standards and policies Interest rates stressed at origination DSCR based on in-place rents, not projections, with conservative allowances for vacancy NOI underwritten to include forecasted expense increases and full taxes (where a tax abatement exists) Approval Authority & Underwriting Consistency Lending authority aggregated by borrower/group of related borrowers Technology ensures consistent and efficient underwriting and risk rating process Multi-faceted Loan Review & Stress Testing Semi-annual third-party loan-level stress testing and annual capital-based stress testing Quarterly third-party portfolio loan review with 65% of total portfolio reviewed on an annual basis Annual internal loan reviews on all commercial loans with balances of $2.5 million or greater Proactive Workout Process Dedicated team of portfolio managers and loan workout specialists Weekly meetings comprised of loan officers, credit personnel and special assets group to pre-emptively address delinquencies or problem credits Philosophy of aggressively addressing impaired assets in a timely fashion Senior Credit Officer Approval Management Loan Committee Approval Board Loan Committee Approval
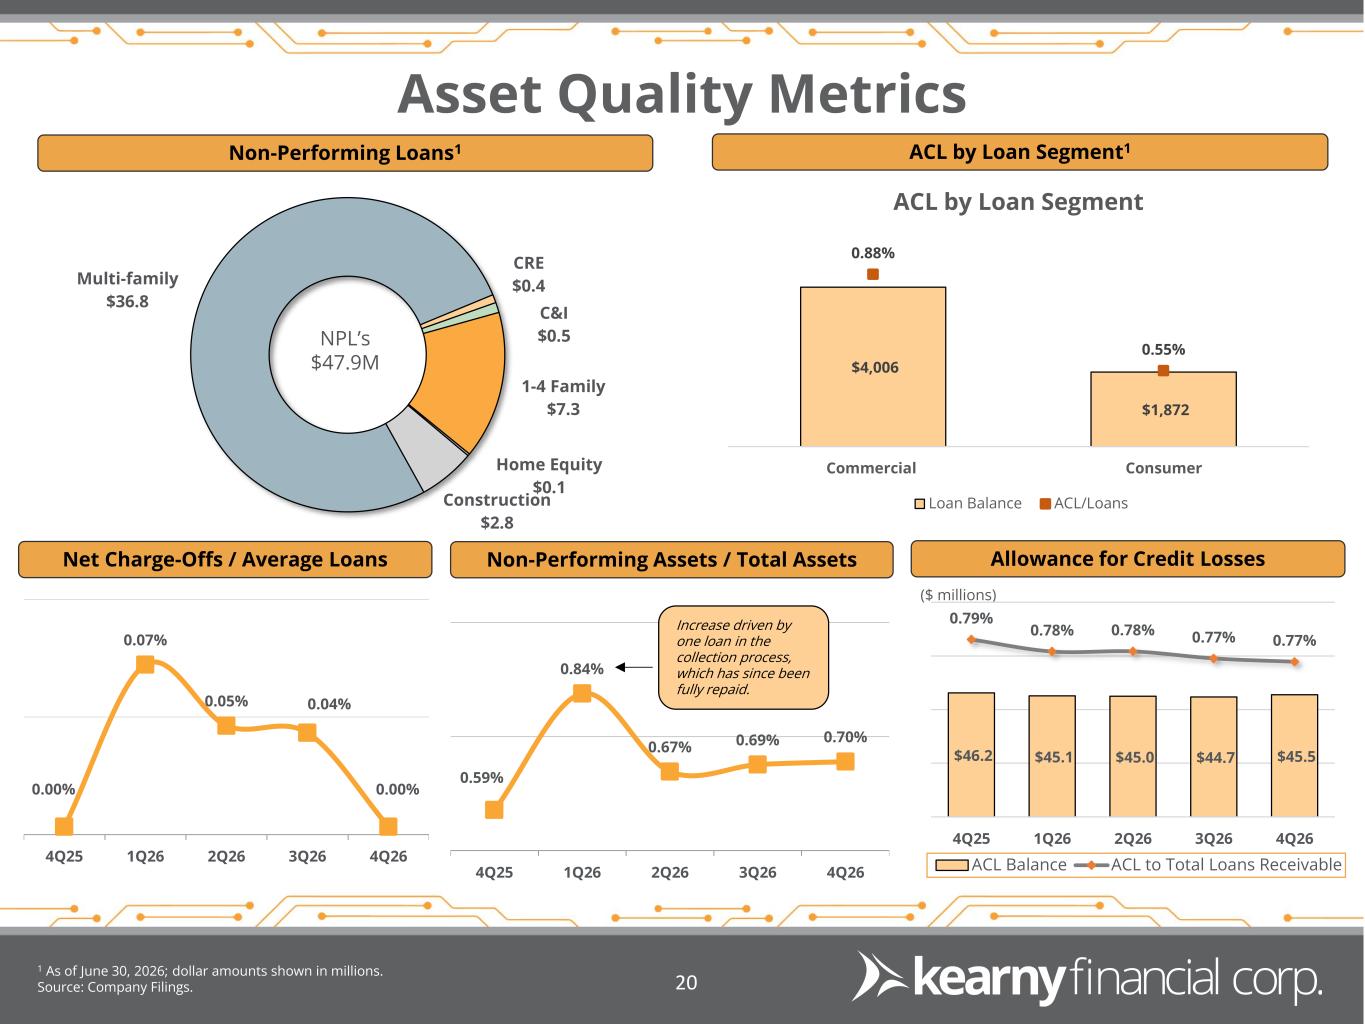
Multi-family $36.8 CRE $0.4 C&I $0.5 1-4 Family $7.3 Home Equity $0.1 Construction $2.8 0.59% 0.84% 0.67% 0.69% 0.70% 4Q25 1Q26 2Q26 3Q26 4Q26 Asset Quality Metrics Non-Performing Assets / Total Assets 1 As of June 30, 2026; dollar amounts shown in millions. Source: Company Filings. 20 Net Charge-Offs / Average Loans Non-Performing Loans1 Allowance for Credit Losses ACL by Loan Segment1 NPL’s $47.9M ($ millions) Increase driven by one loan in the collection process, which has since been fully repaid. $4,006 $1,872 0.88% 0.55% Commercial Consumer ACL by Loan Segment Loan Balance ACL/Loans 0.00% 0.07% 0.05% 0.04% 0.00% 4Q25 1Q26 2Q26 3Q26 4Q26 $46.2 $45.1 $45.0 $44.7 $45.5 0.79% 0.78% 0.78% 0.77% 0.77% 4Q25 1Q26 2Q26 3Q26 4Q26 ACL Balance ACL to Total Loans Receivable
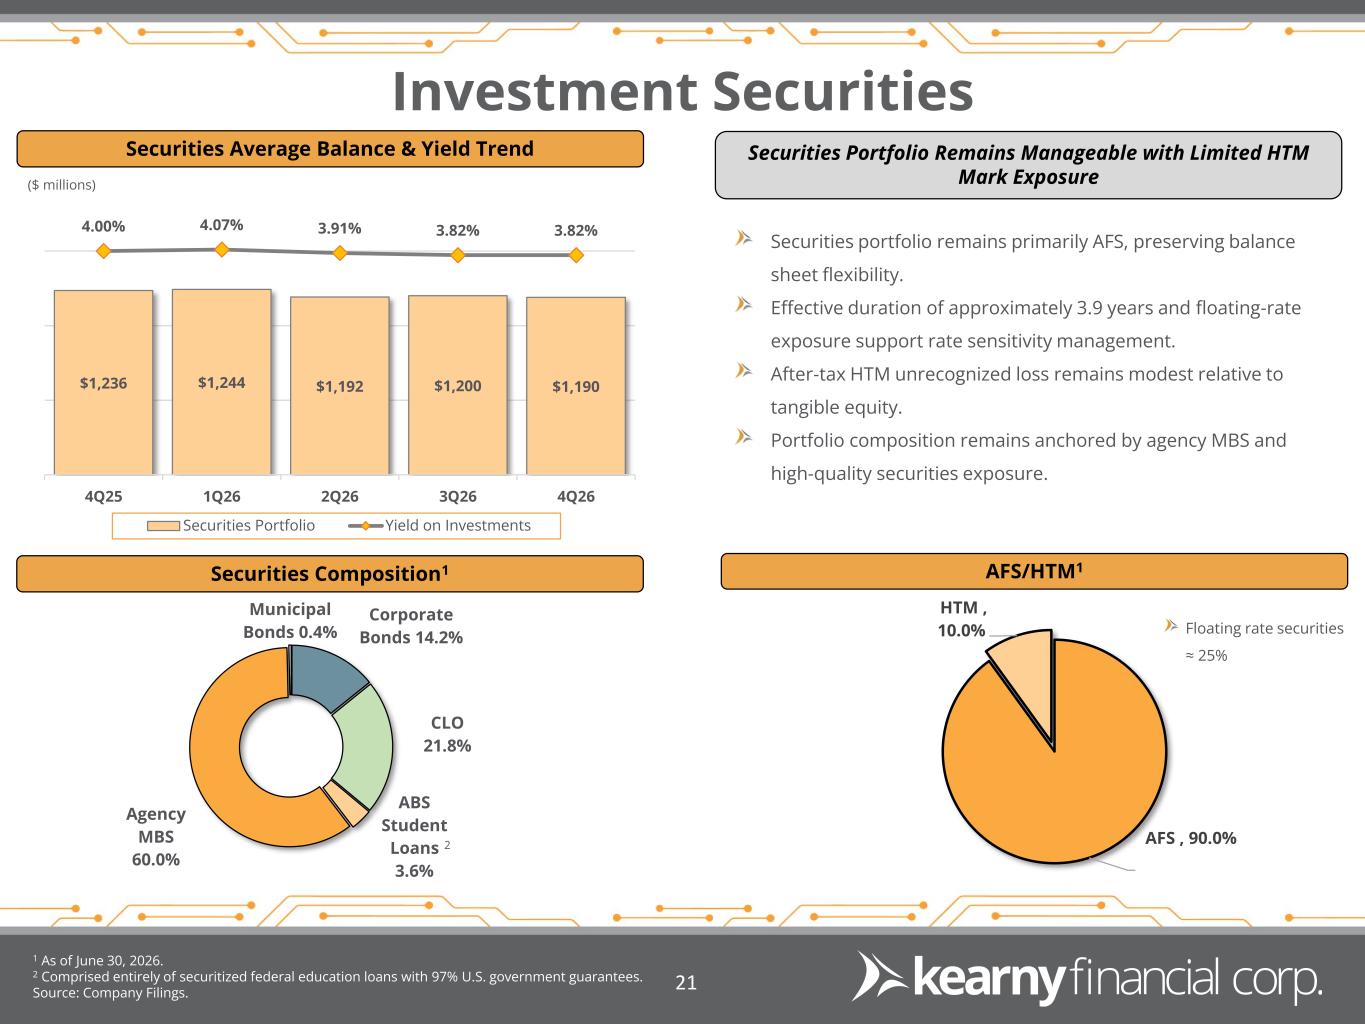
Investment Securities 1 As of June 30, 2026. 2 Comprised entirely of securitized federal education loans with 97% U.S. government guarantees. Source: Company Filings. 21 Securities Composition1 AFS/HTM1 Floating rate securities ≈ 25% Corporate Bonds 14.2% CLO 21.8% ABS Student Loans 3.6% Agency MBS 60.0% Municipal Bonds 0.4% AFS , 90.0% HTM , 10.0% $1,236 $1,244 $1,192 $1,200 $1,190 4.00% 4.07% 3.91% 3.82% 3.82% 4Q25 1Q26 2Q26 3Q26 4Q26 Securities Portfolio Yield on Investments ($ millions) Securities portfolio remains primarily AFS, preserving balance sheet flexibility. Effective duration of approximately 3.9 years and floating-rate exposure support rate sensitivity management. After-tax HTM unrecognized loss remains modest relative to tangible equity. Portfolio composition remains anchored by agency MBS and high-quality securities exposure. Securities Average Balance & Yield Trend 2 Securities Portfolio Remains Manageable with Limited HTM Mark Exposure
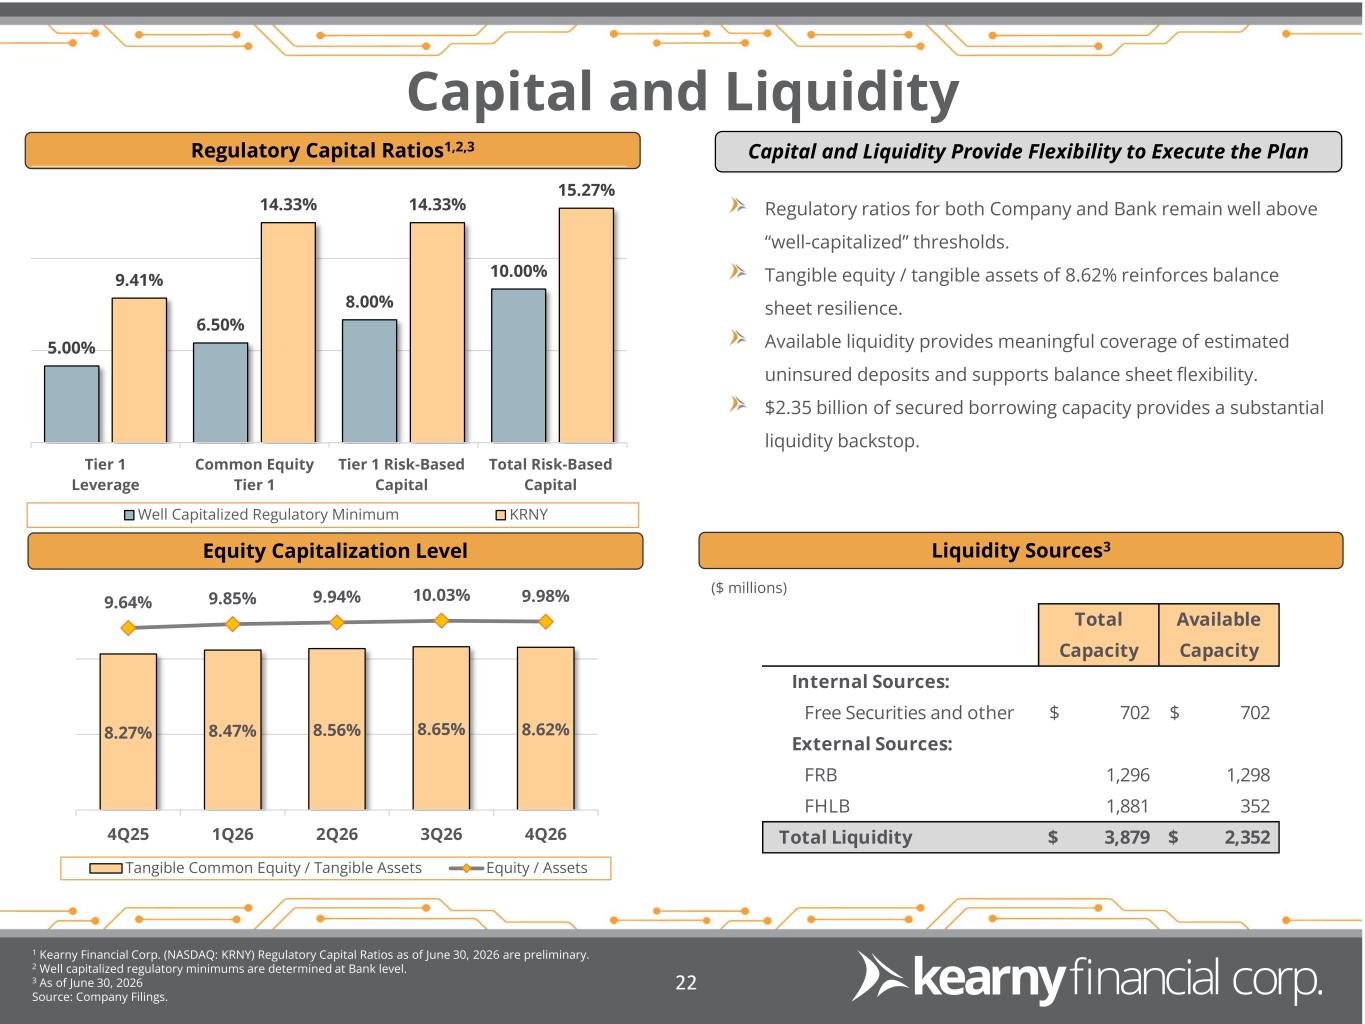
Capital and Liquidity 1 Kearny Financial Corp. (NASDAQ: KRNY) Regulatory Capital Ratios as of June 30, 2026 are preliminary. 2 Well capitalized regulatory minimums are determined at Bank level. 3 As of June 30, 2026 Source: Company Filings. 22 Regulatory Capital Ratios1,2,3 Equity Capitalization Level Liquidity Sources3 8.27% 8.47% 8.56% 8.65% 8.62% 9.64% 9.85% 9.94% 10.03% 9.98% 4Q25 1Q26 2Q26 3Q26 4Q26 Tangible Common Equity / Tangible Assets Equity / Assets 5.00% 6.50% 8.00% 10.00%9.41% 14.33% 14.33% 15.27% Tier 1 Leverage Common Equity Tier 1 Tier 1 Risk-Based Capital Total Risk-Based Capital Well Capitalized Regulatory Minimum KRNY ($ millions) Regulatory ratios for both Company and Bank remain well above “well-capitalized” thresholds. Tangible equity / tangible assets of 8.62% reinforces balance sheet resilience. Available liquidity provides meaningful coverage of estimated uninsured deposits and supports balance sheet flexibility. $2.35 billion of secured borrowing capacity provides a substantial liquidity backstop. Capital and Liquidity Provide Flexibility to Execute the Plan Total Capacity Available Capacity Internal Sources: Free Securities and other 702$ 702$ External Sources: FRB 1,296 1,298 FHLB 1,881 352 Total Liquidity 3,879$ 2,352$
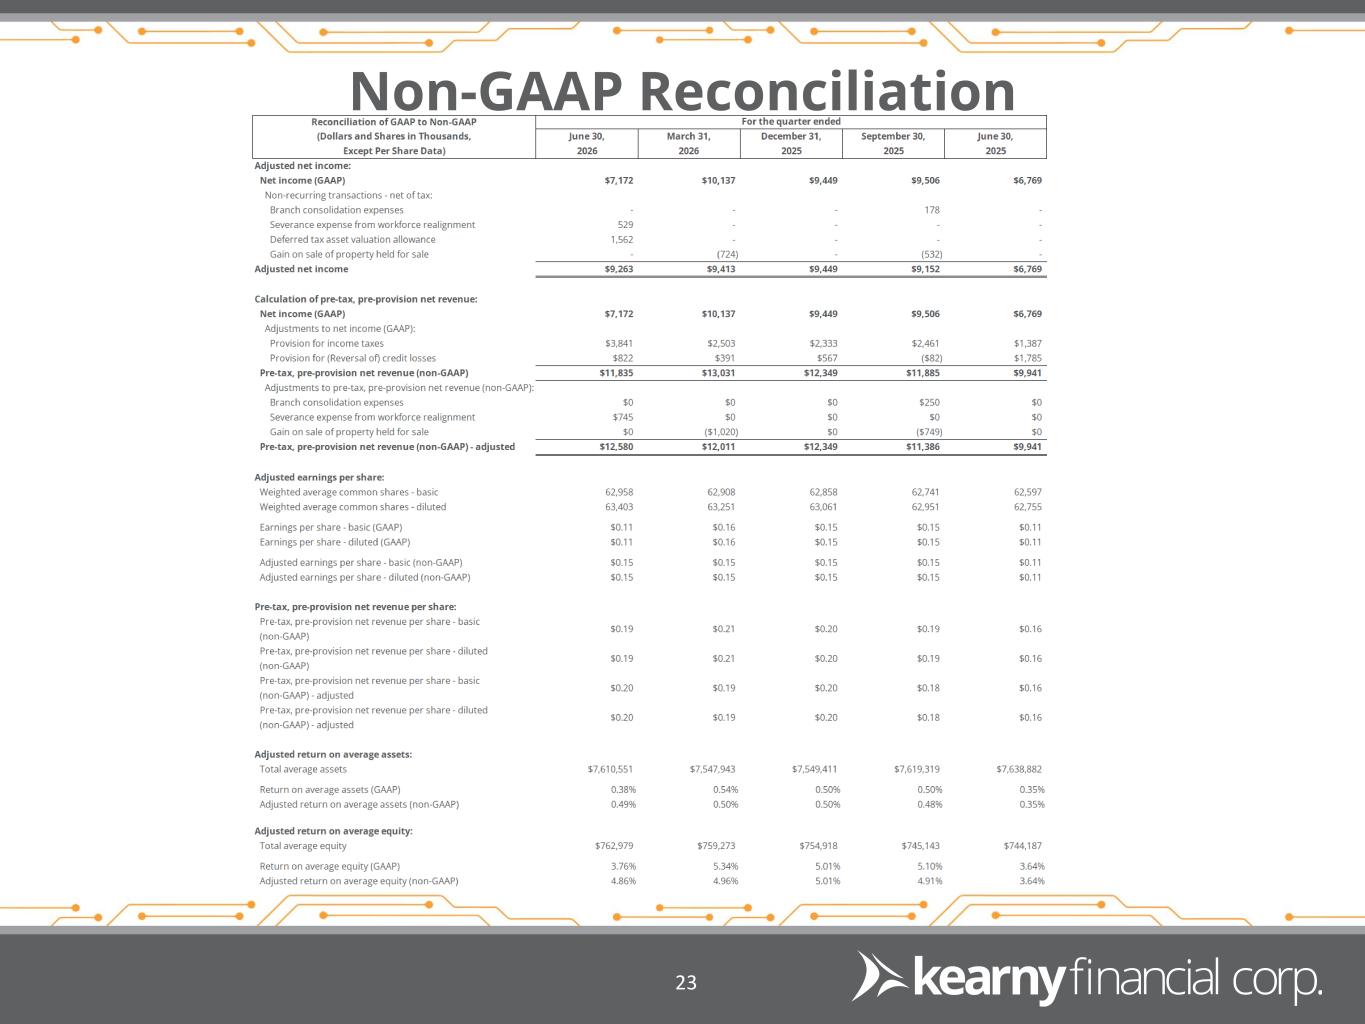
Non-GAAP Reconciliation 23