
B + + .2

` Q3 2025 Shareholder Letter 1

Q3 2025 Shareholder Letter 2
To Our Shareholders ZipRecruiter’s financial performance through Q3’25 continued to show positive momentum despite the soft labor market. While both the Quits Rate and Hires in the U.S. remained near their lowest levels since 20151, Q3’25 revenue grew 2% sequentially to $115 million. This is our second straight quarter of sequential growth, reflecting a more typical seasonal pattern despite the tempered hiring environment. The midpoint of our Q4’25 revenue guidance reflects a major milestone: A return to year-over-year revenue growth for the first time since Q3’22. Our enterprise strategy is working. Performance-based revenue grew 12% sequentially, greater than we’ve seen in over three years. Enterprise employers increasingly recognize the value they get when they allocate job advertising spend to ZipRecruiter. Our over 180 applicant tracking system (ATS) integrations make it easy for employers to seamlessly manage their hiring. In Q3’25, Enterprise customer adoption of our automated campaign optimization solution increased 19% quarter-over-quarter. We are constantly developing new tools that increase effectiveness, efficiency, and ease of use, which is helping employers move faster, engage better, and ultimately shorten time-to-hire. These are powerful drivers of future enterprise revenue growth. Quarterly Paid Employers (QPEs) grew sequentially for the third consecutive quarter, growing on a year-over-year basis for the first quarter since Q1’22. In Q3’25 we observed faster engagement on the platform. Compared to Q3’24, nearly 24% more SMB jobs receive five or more applications within the first 24 hours. Engagement between hirers and job seekers continues to improve as well. SMB employer messages sent to candidates each month increased 13% year-over-year. Our Q4’25 revenue guidance of $112 million at the midpoint reflects a return to year-over-year growth in quarterly revenue for the first time since Q3’22. The 3% sequential decline follows typical seasonality despite a subdued macroeconomic environment. Our Q4’25 Adjusted EBITDA guidance is $14 million at the midpoint. This implies a full-year Adjusted EBITDA margin of 9%, exceeding the mid-single-digit scenario we outlined at the beginning of the year. We believe our performance during this period in the labor market demonstrates ZipRecruiter’s lasting durability. Despite a protracted and ongoing hiring decline, we maintained financial 1 Source: U.S. Bureau of Labor Statistics, Total nonfarm quits and hires, August 2025, excludes the onset of the COVID pandemic (March - June 2020) Q3 2025 Shareholder Letter 3
flexibility while aggressively investing in tomorrow’s innovative hiring solutions. This gives us confidence in achieving our long-term goal of 30% Adjusted EBITDA margins. Based on our results, we believe that ZipRecruiter is poised to emerge from this period as a stronger company and capture market share from both online and offline competitors as we continue to lead the evolution of modern recruiting. _____________________ ________________________ ________________________ Ian Siegel David Travers Tim Yarbrough Chief Executive Officer President Chief Financial Officer Q3 2025 Shareholder Letter 4
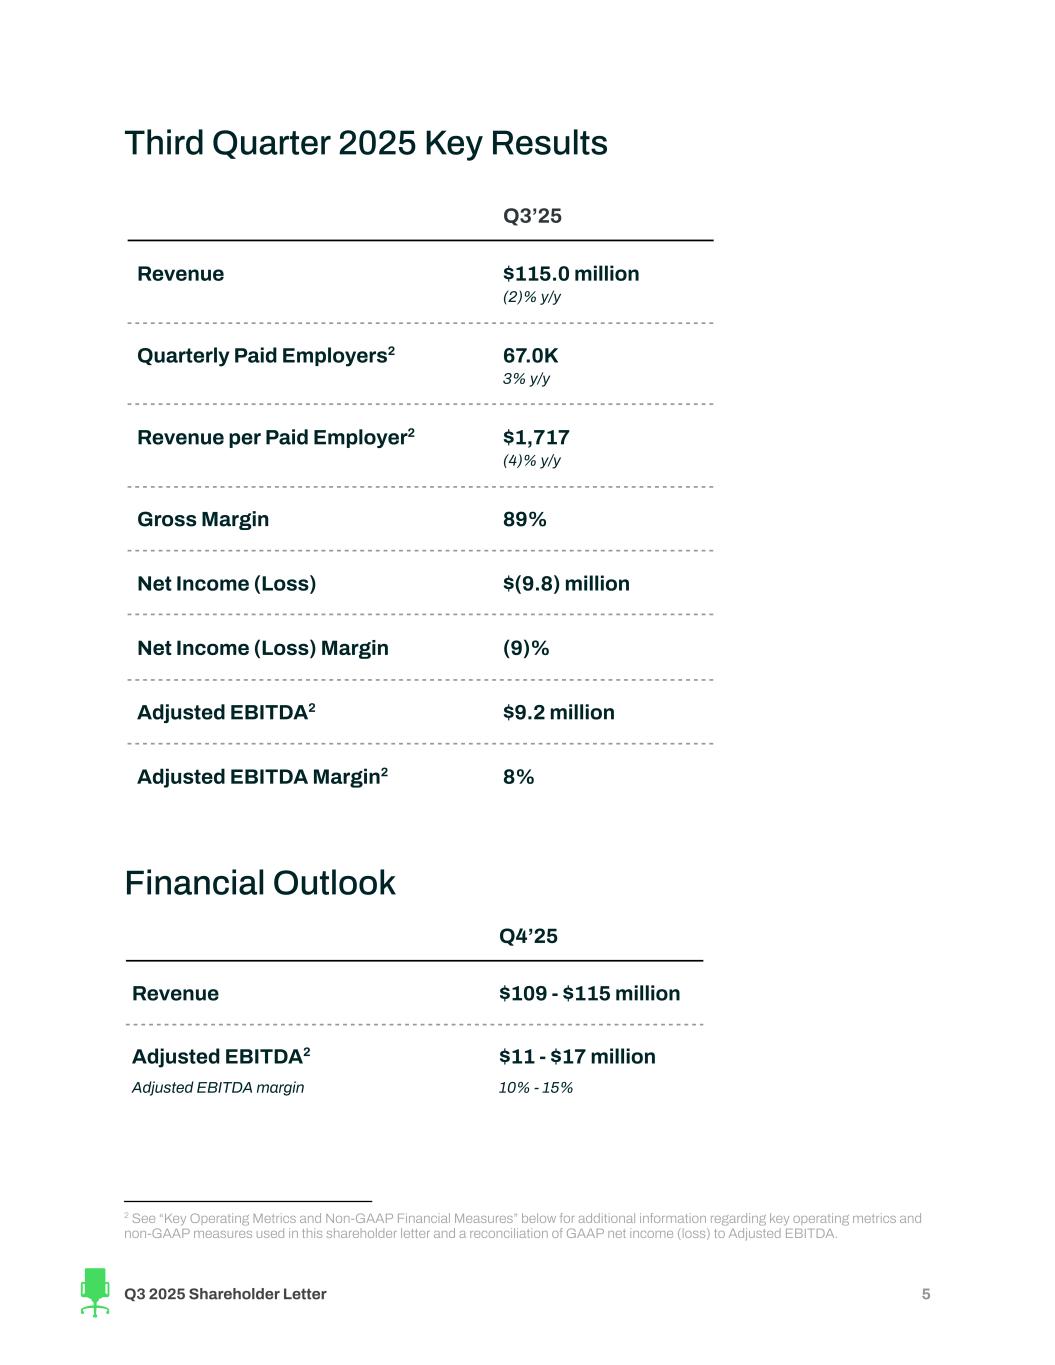
Third Quarter 2025 Key Results Q3’25 Revenue $115.0 million (2)% y/y Quarterly Paid Employers2 67.0K 3% y/y Revenue per Paid Employer2 $1,717 (4)% y/y Gross Margin 89% Net Income (Loss) $(9.8) million Net Income (Loss) Margin (9)% Adjusted EBITDA2 $9.2 million Adjusted EBITDA Margin2 8% Financial Outlook Q4’25 Revenue $109 - $115 million Adjusted EBITDA2 Adjusted EBITDA margin $11 - $17 million 10% - 15% 2 See “Key Operating Metrics and Non-GAAP Financial Measures” below for additional information regarding key operating metrics and non-GAAP measures used in this shareholder letter and a reconciliation of GAAP net income (loss) to Adjusted EBITDA. Q3 2025 Shareholder Letter 5
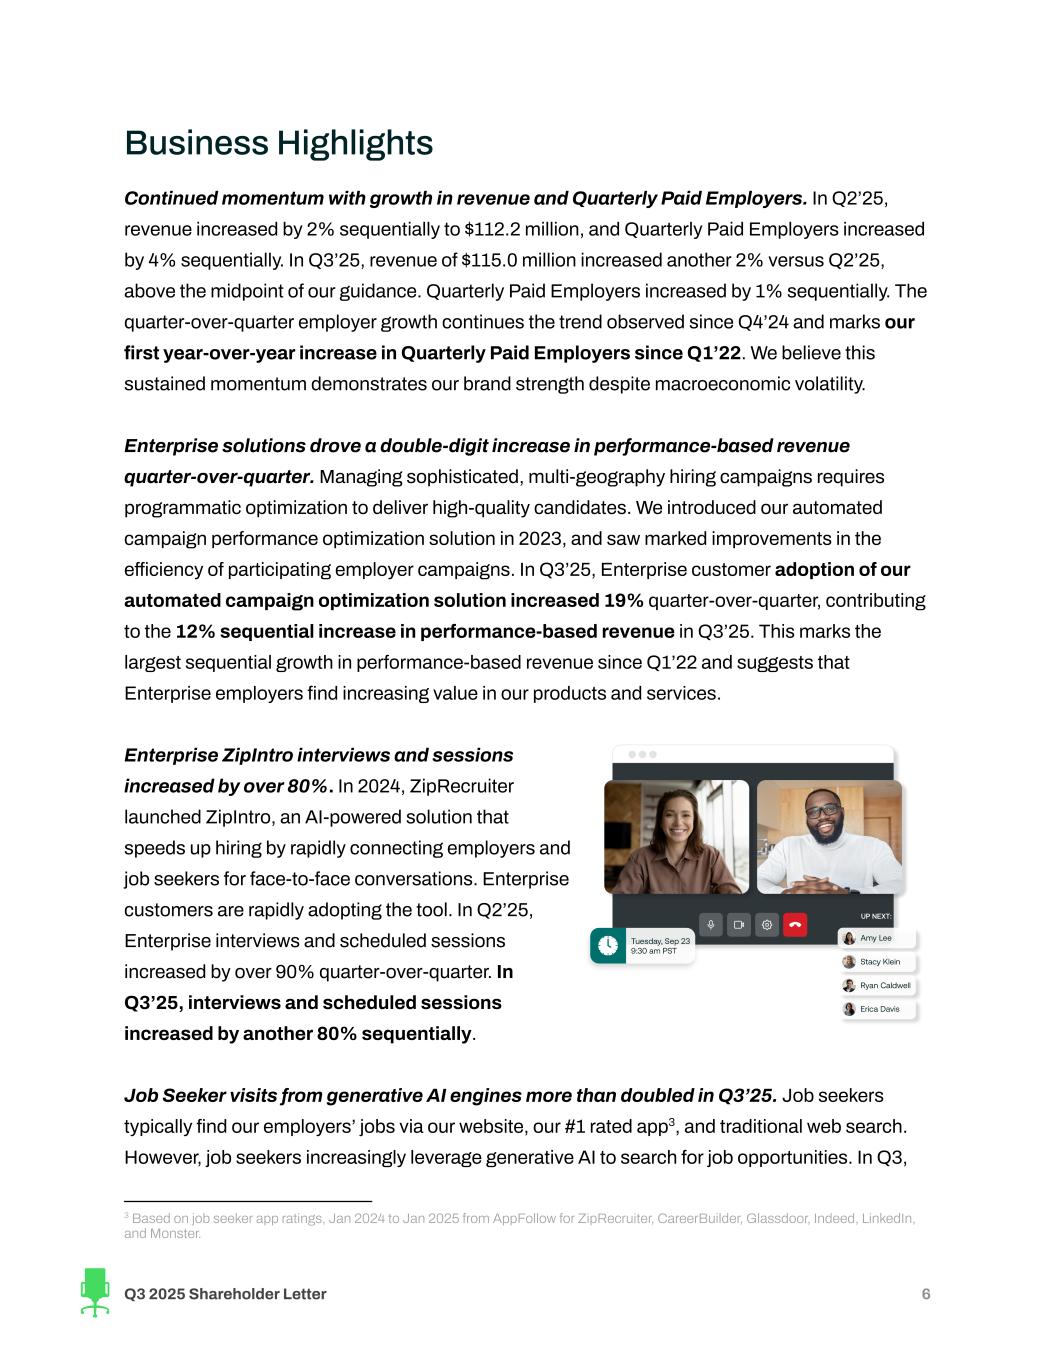
Business Highlights Continued momentum with growth in revenue and Quarterly Paid Employers. In Q2’25, revenue increased by 2% sequentially to $112.2 million, and Quarterly Paid Employers increased by 4% sequentially. In Q3’25, revenue of $115.0 million increased another 2% versus Q2’25, above the midpoint of our guidance. Quarterly Paid Employers increased by 1% sequentially. The quarter-over-quarter employer growth continues the trend observed since Q4’24 and marks our first year-over-year increase in Quarterly Paid Employers since Q1’22. We believe this sustained momentum demonstrates our brand strength despite macroeconomic volatility. Enterprise solutions drove a double-digit increase in performance-based revenue quarter-over-quarter. Managing sophisticated, multi-geography hiring campaigns requires programmatic optimization to deliver high-quality candidates. We introduced our automated campaign performance optimization solution in 2023, and saw marked improvements in the efficiency of participating employer campaigns. In Q3’25, Enterprise customer adoption of our automated campaign optimization solution increased 19% quarter-over-quarter, contributing to the 12% sequential increase in performance-based revenue in Q3’25. This marks the largest sequential growth in performance-based revenue since Q1’22 and suggests that Enterprise employers find increasing value in our products and services. Enterprise ZipIntro interviews and sessions increased by over 80%. In 2024, ZipRecruiter launched ZipIntro, an AI-powered solution that speeds up hiring by rapidly connecting employers and job seekers for face-to-face conversations. Enterprise customers are rapidly adopting the tool. In Q2’25, Enterprise interviews and scheduled sessions increased by over 90% quarter-over-quarter. In Q3’25, interviews and scheduled sessions increased by another 80% sequentially. Job Seeker visits from generative AI engines more than doubled in Q3’25. Job seekers typically find our employers’ jobs via our website, our #1 rated app3, and traditional web search. However, job seekers increasingly leverage generative AI to search for job opportunities. In Q3, 3 Based on job seeker app ratings, Jan 2024 to Jan 2025 from AppFollow for ZipRecruiter, CareerBuilder, Glassdoor, Indeed, LinkedIn, and Monster. Q3 2025 Shareholder Letter 6
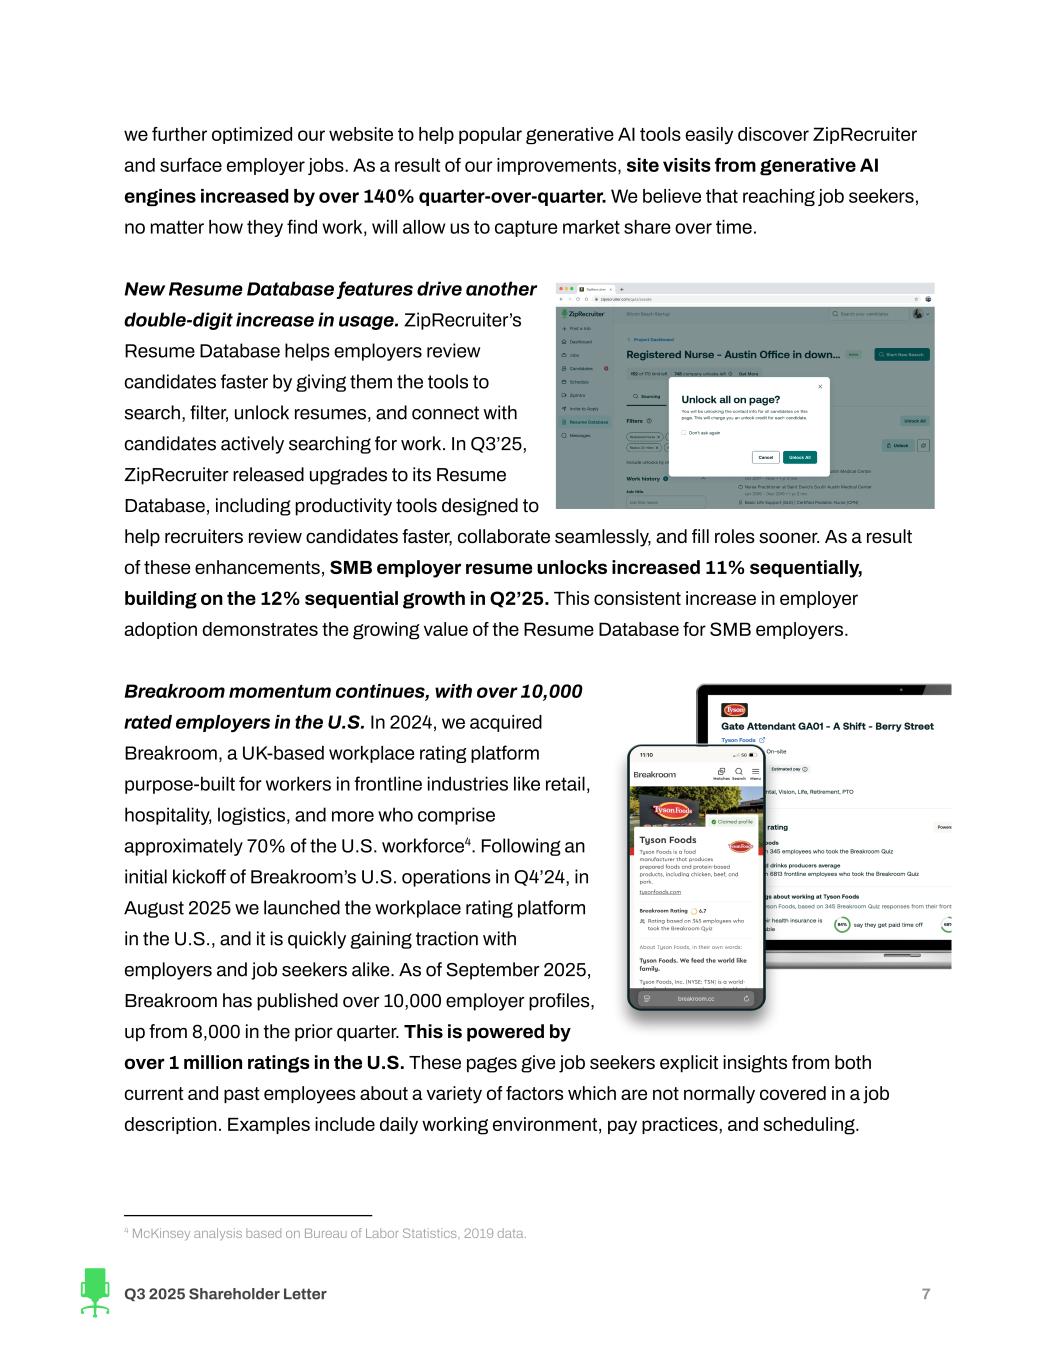
we further optimized our website to help popular generative AI tools easily discover ZipRecruiter and surface employer jobs. As a result of our improvements, site visits from generative AI engines increased by over 140% quarter-over-quarter. We believe that reaching job seekers, no matter how they find work, will allow us to capture market share over time. New Resume Database features drive another double-digit increase in usage. ZipRecruiter’s Resume Database helps employers review candidates faster by giving them the tools to search, filter, unlock resumes, and connect with candidates actively searching for work. In Q3’25, ZipRecruiter released upgrades to its Resume Database, including productivity tools designed to help recruiters review candidates faster, collaborate seamlessly, and fill roles sooner. As a result of these enhancements, SMB employer resume unlocks increased 11% sequentially, building on the 12% sequential growth in Q2’25. This consistent increase in employer adoption demonstrates the growing value of the Resume Database for SMB employers. Breakroom momentum continues, with over 10,000 rated employers in the U.S. In 2024, we acquired Breakroom, a UK-based workplace rating platform purpose-built for workers in frontline industries like retail, hospitality, logistics, and more who comprise approximately 70% of the U.S. workforce4. Following an initial kickoff of Breakroom’s U.S. operations in Q4’24, in August 2025 we launched the workplace rating platform in the U.S., and it is quickly gaining traction with employers and job seekers alike. As of September 2025, Breakroom has published over 10,000 employer profiles, up from 8,000 in the prior quarter. This is powered by over 1 million ratings in the U.S. These pages give job seekers explicit insights from both current and past employees about a variety of factors which are not normally covered in a job description. Examples include daily working environment, pay practices, and scheduling. 4 McKinsey analysis based on Bureau of Labor Statistics, 2019 data. Q3 2025 Shareholder Letter 7
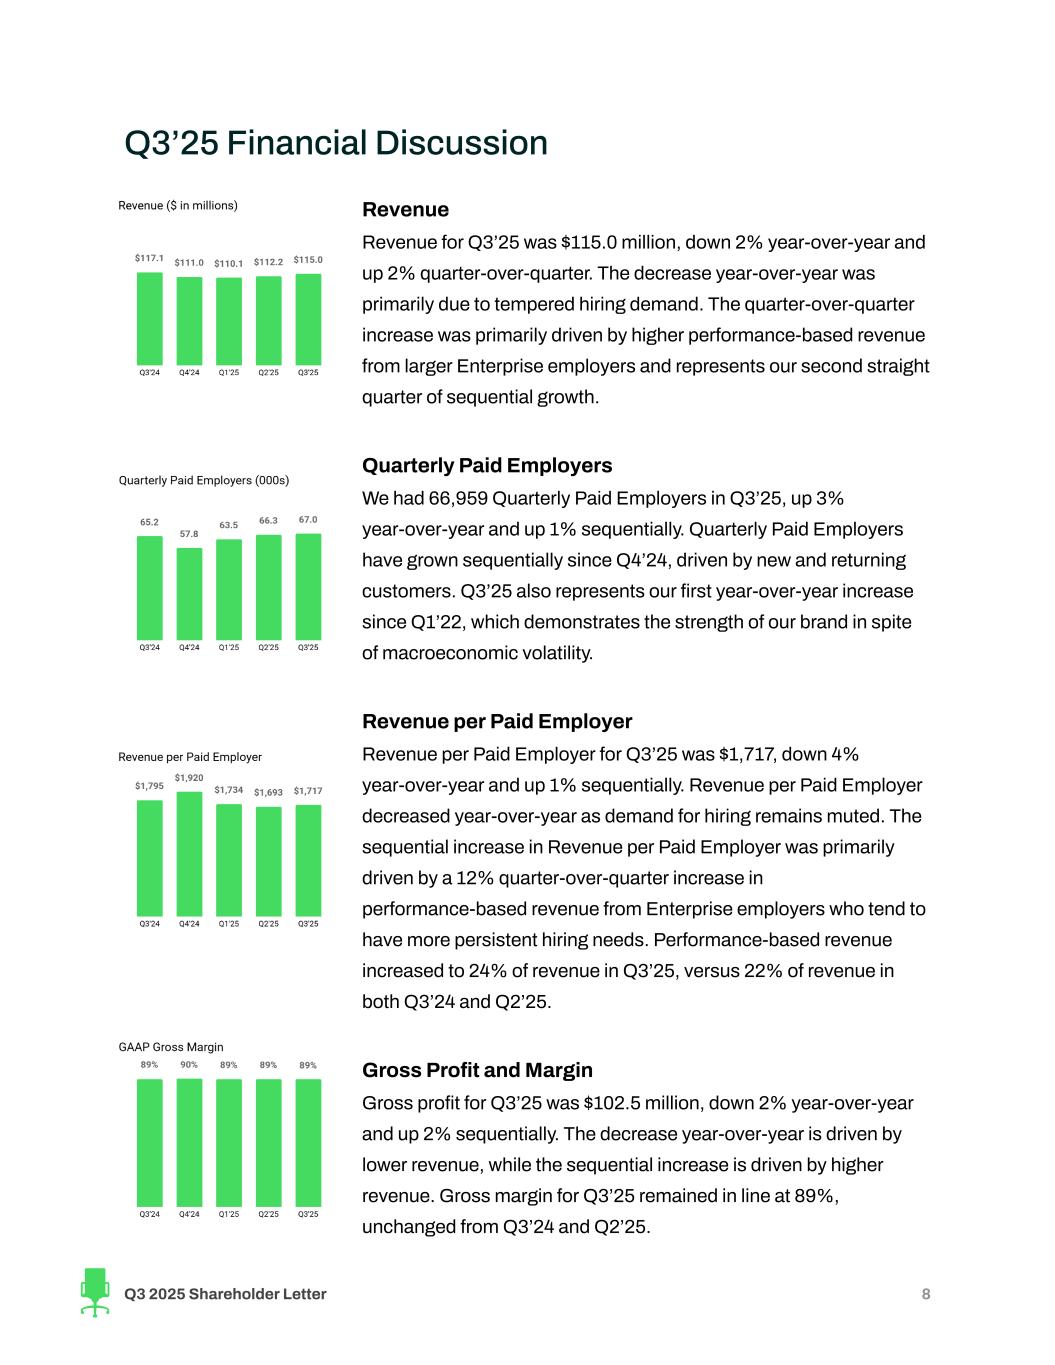
Q3’25 Financial Discussion Revenue Revenue for Q3’25 was $115.0 million, down 2% year-over-year and up 2% quarter-over-quarter. The decrease year-over-year was primarily due to tempered hiring demand. The quarter-over-quarter increase was primarily driven by higher performance-based revenue from larger Enterprise employers and represents our second straight quarter of sequential growth. Quarterly Paid Employers We had 66,959 Quarterly Paid Employers in Q3’25, up 3% year-over-year and up 1% sequentially. Quarterly Paid Employers have grown sequentially since Q4’24, driven by new and returning customers. Q3’25 also represents our first year-over-year increase since Q1’22, which demonstrates the strength of our brand in spite of macroeconomic volatility. Revenue per Paid Employer Revenue per Paid Employer for Q3’25 was $1,717, down 4% year-over-year and up 1% sequentially. Revenue per Paid Employer decreased year-over-year as demand for hiring remains muted. The sequential increase in Revenue per Paid Employer was primarily driven by a 12% quarter-over-quarter increase in performance-based revenue from Enterprise employers who tend to have more persistent hiring needs. Performance-based revenue increased to 24% of revenue in Q3’25, versus 22% of revenue in both Q3’24 and Q2’25. Gross Profit and Margin Gross profit for Q3’25 was $102.5 million, down 2% year-over-year and up 2% sequentially. The decrease year-over-year is driven by lower revenue, while the sequential increase is driven by higher revenue. Gross margin for Q3’25 remained in line at 89%, unchanged from Q3’24 and Q2’25. Q3 2025 Shareholder Letter 8
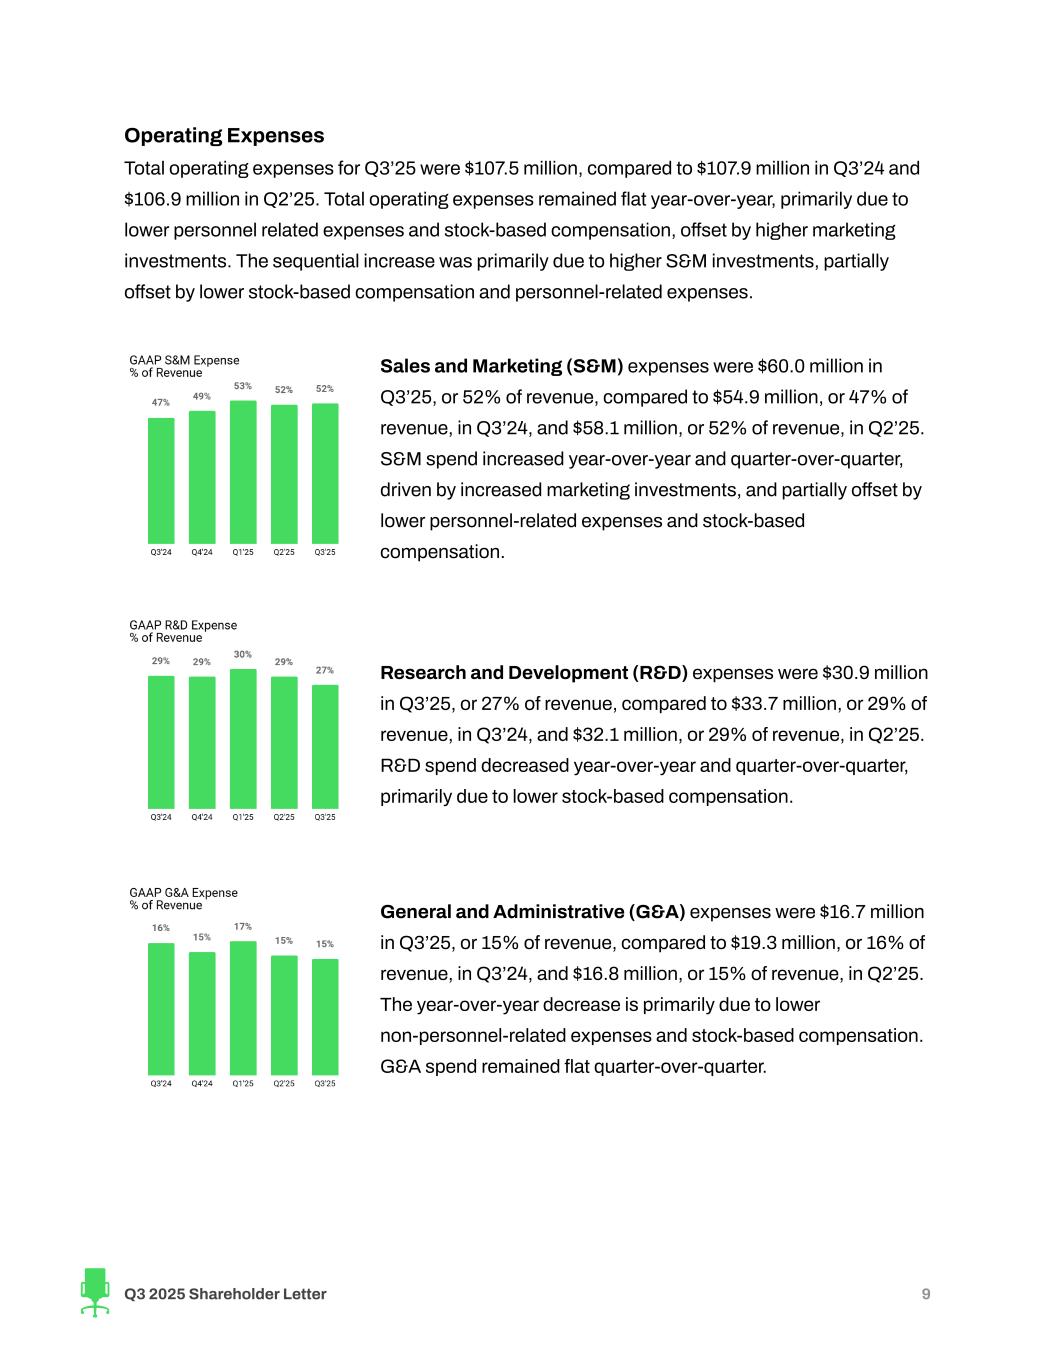
Operating Expenses Total operating expenses for Q3’25 were $107.5 million, compared to $107.9 million in Q3’24 and $106.9 million in Q2’25. Total operating expenses remained flat year-over-year, primarily due to lower personnel related expenses and stock-based compensation, offset by higher marketing investments. The sequential increase was primarily due to higher S&M investments, partially offset by lower stock-based compensation and personnel-related expenses. Sales and Marketing (S&M) expenses were $60.0 million in Q3’25, or 52% of revenue, compared to $54.9 million, or 47% of revenue, in Q3’24, and $58.1 million, or 52% of revenue, in Q2’25. S&M spend increased year-over-year and quarter-over-quarter, driven by increased marketing investments, and partially offset by lower personnel-related expenses and stock-based compensation. Research and Development (R&D) expenses were $30.9 million in Q3’25, or 27% of revenue, compared to $33.7 million, or 29% of revenue, in Q3’24, and $32.1 million, or 29% of revenue, in Q2’25. R&D spend decreased year-over-year and quarter-over-quarter, primarily due to lower stock-based compensation. General and Administrative (G&A) expenses were $16.7 million in Q3’25, or 15% of revenue, compared to $19.3 million, or 16% of revenue, in Q3’24, and $16.8 million, or 15% of revenue, in Q2’25. The year-over-year decrease is primarily due to lower non-personnel-related expenses and stock-based compensation. G&A spend remained flat quarter-over-quarter. Q3 2025 Shareholder Letter 9
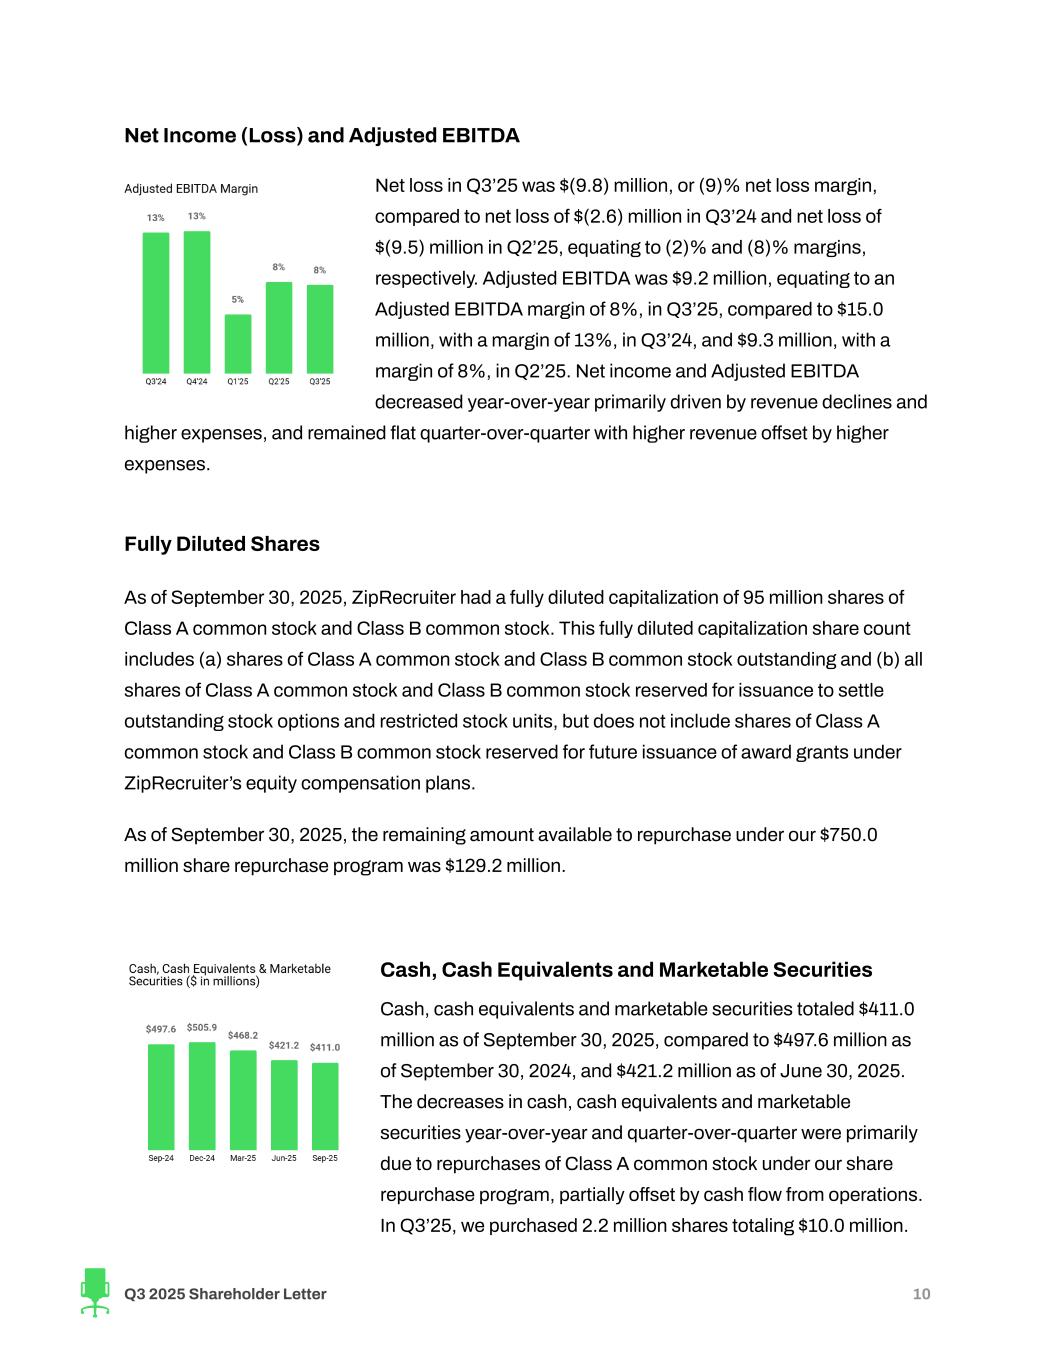
Net Income (Loss) and Adjusted EBITDA Net loss in Q3’25 was $(9.8) million, or (9)% net loss margin, compared to net loss of $(2.6) million in Q3’24 and net loss of $(9.5) million in Q2’25, equating to (2)% and (8)% margins, respectively. Adjusted EBITDA was $9.2 million, equating to an Adjusted EBITDA margin of 8%, in Q3’25, compared to $15.0 million, with a margin of 13%, in Q3’24, and $9.3 million, with a margin of 8%, in Q2’25. Net income and Adjusted EBITDA decreased year-over-year primarily driven by revenue declines and higher expenses, and remained flat quarter-over-quarter with higher revenue offset by higher expenses. Fully Diluted Shares As of September 30, 2025, ZipRecruiter had a fully diluted capitalization of 95 million shares of Class A common stock and Class B common stock. This fully diluted capitalization share count includes (a) shares of Class A common stock and Class B common stock outstanding and (b) all shares of Class A common stock and Class B common stock reserved for issuance to settle outstanding stock options and restricted stock units, but does not include shares of Class A common stock and Class B common stock reserved for future issuance of award grants under ZipRecruiter’s equity compensation plans. As of September 30, 2025, the remaining amount available to repurchase under our $750.0 million share repurchase program was $129.2 million. Cash, Cash Equivalents and Marketable Securities Cash, cash equivalents and marketable securities totaled $411.0 million as of September 30, 2025, compared to $497.6 million as of September 30, 2024, and $421.2 million as of June 30, 2025. The decreases in cash, cash equivalents and marketable securities year-over-year and quarter-over-quarter were primarily due to repurchases of Class A common stock under our share repurchase program, partially offset by cash flow from operations. In Q3’25, we purchased 2.2 million shares totaling $10.0 million. Q3 2025 Shareholder Letter 10
Financial Outlook Quarterly Guidance We see positive momentum in our marketplace despite the macroeconomic volatility. Quarterly Paid Employers grew sequentially for the third straight quarter and Q3’25 also marked the first quarter of year-over-year Paid Employer growth since Q1’22. Our Q4’25 revenue guidance of $112 million at the midpoint represents a 1% increase year-over-year. This would represent our first quarter of year-over-year revenue growth since Q3’22. The 3% sequential decline assumes a continuation of the same stable but subdued hiring environment market observed in Q3 with normal seasonal slowness during holiday periods. Our Adjusted EBITDA guidance for Q4’25 is $14 million at the midpoint, or a 13% Adjusted EBITDA margin. Our fourth quarter guidance implies a full year 2025 Adjusted EBITDA margin of 9%, exceeding the scenario of mid-single digits that we’ve outlined since the beginning of the year. As we finish 2025 and move into 2026, our operating philosophy remains unchanged. We continue to believe in disciplined capital deployment and sustained investment in high-ROI product and marketing opportunities. We remain confident that these investments will help us successfully navigate the current hiring environment and increase our market share during the eventual labor market recovery. Q3 2025 Shareholder Letter 11
Forward-Looking Statements This shareholder letter contains forward-looking statements within the meaning of the Private Securities Litigation Reform Act of 1995. All statements contained in this shareholder letter that do not relate to matters of historical fact should be considered forward-looking statements, including, without limitation, statements regarding our market opportunity and market share; statements under the section titled “Financial Outlook”; statements regarding our financial performance showing signs of momentum and our expected financial performance and operational performance for the fourth quarter of 2025 and fiscal year 2025; statements regarding our expected future revenue growth, Adjusted EBITDA profitability and key strategies and investments; statements regarding the long term health of the U.S. labor market and expected hiring activity and our lasting durability; statements regarding volatility in the U.S. economy; statements regarding our new products or product improvements, including, but not limited to, our automated campaign optimization solution, our next-generation Resume Database and ZipIntro and the use of artificial intelligence in our products, and the expected performance thereof, as well as statements that include the words “expect,” “intend,” “plan,” “believe,” “project,” “forecast,” “estimate,” “may,” “should,” “anticipate” and similar statements of a future or forward-looking nature. These forward-looking statements are based on management’s current expectations. These statements are neither promises nor guarantees, but involve known and unknown risks, uncertainties and other important factors that may cause actual results, performance or achievements to be materially different from any future results, performance or achievements expressed or implied by the forward-looking statements, including, but not limited to: our ability to attract and retain employers and job seekers; our ability to compete with well-established competitors and new entrants; our ability to achieve and/or maintain profitability; our ability to maintain, protect and enhance our brand and intellectual property; our dependence on macroeconomic factors, including potential unfavorable changes in U.S. trade or other policies, such as U.S. tariff policies, and the potential negative economic consequences thereof; our ability to maintain and improve the quality of our platform; our dependence on the interoperability of our platform with mobile operating systems that we do not control; our ability to successfully implement our business plan during a global economic downturn that may impact the demand for our services or have a material adverse impact on our and our business partners’ financial condition and results of operations; our ability and the ability of third parties to protect our users’ personal or other data from a security breach and to comply with laws and regulations relating to consumer data privacy and data protection; our ability to detect errors, defects or disruptions in our platform; our ability to comply with the terms of underlying licenses of open source software components on our platform; our ability to expand into markets outside the United States; our ability to achieve desired operating margins; our compliance with a wide variety of U.S. and international laws and regulations; our reliance on Amazon Web Services; our ability to mitigate payment and fraud risks; our dependence on our senior management and our ability to attract and retain new talent; and the other important risk factors more fully discussed and described in documents we have filed with the Securities and Exchange Commission (“SEC”), including our Annual Report on Form 10-K for the year ended December 31, 2024, as well as our Quarterly Reports on Form 10-Q for the quarters ended March 31, 2025 and June 30, 2025, in each case, that we filed with the SEC, and our Quarterly Report on Form 10-Q for the quarter ended September 30, 2025 that we will file with the SEC. In addition, we operate in a very competitive and rapidly changing environment. New risks emerge from time to time. It is not possible for our management to predict all risks, nor can we assess the impact of all factors on our business or the extent to which any factor, or combination of factors, may cause actual results to differ materially from those contained in any forward-looking statements that we may make. In light of these risks, uncertainties and assumptions, the forward-looking events and circumstances discussed in this release are inherently uncertain and may not occur, and actual results could differ materially and adversely from those anticipated or implied in the forward-looking statements. Accordingly, you should not rely upon forward-looking statements as predictions of future events. In addition, the forward-looking statements made in this shareholder letter relate only to events or information as of the date on which the statements are made in this letter. Except as required by law, we undertake no obligation to update or revise publicly any forward-looking statements, whether as a result of new information, future events or otherwise, after the date on which the statements are made or to reflect the occurrence of unanticipated events. Q3 2025 Shareholder Letter 12
Conference Call Details We will host a conference call to discuss our financial results on Wednesday, November 5, 2025, at 2:00 p.m. Pacific Time. A live webcast of the call can be accessed from ZipRecruiter’s Investor Relations website. An archived version will be available on the website two hours after the call. Investors and analysts can participate in the conference call by dialing +1 (888) 440-4199, or +1 (646) 960-0818 for callers outside the United States, and using the conference ID 9351892. A telephonic replay of the conference call will be available until Wednesday, November 12, 2025. To listen to the replay please dial +1 (800) 770-2030 or +1 (609) 800-9909 for callers outside the United States and use the Conference ID 9351892. Q3 2025 Shareholder Letter 13
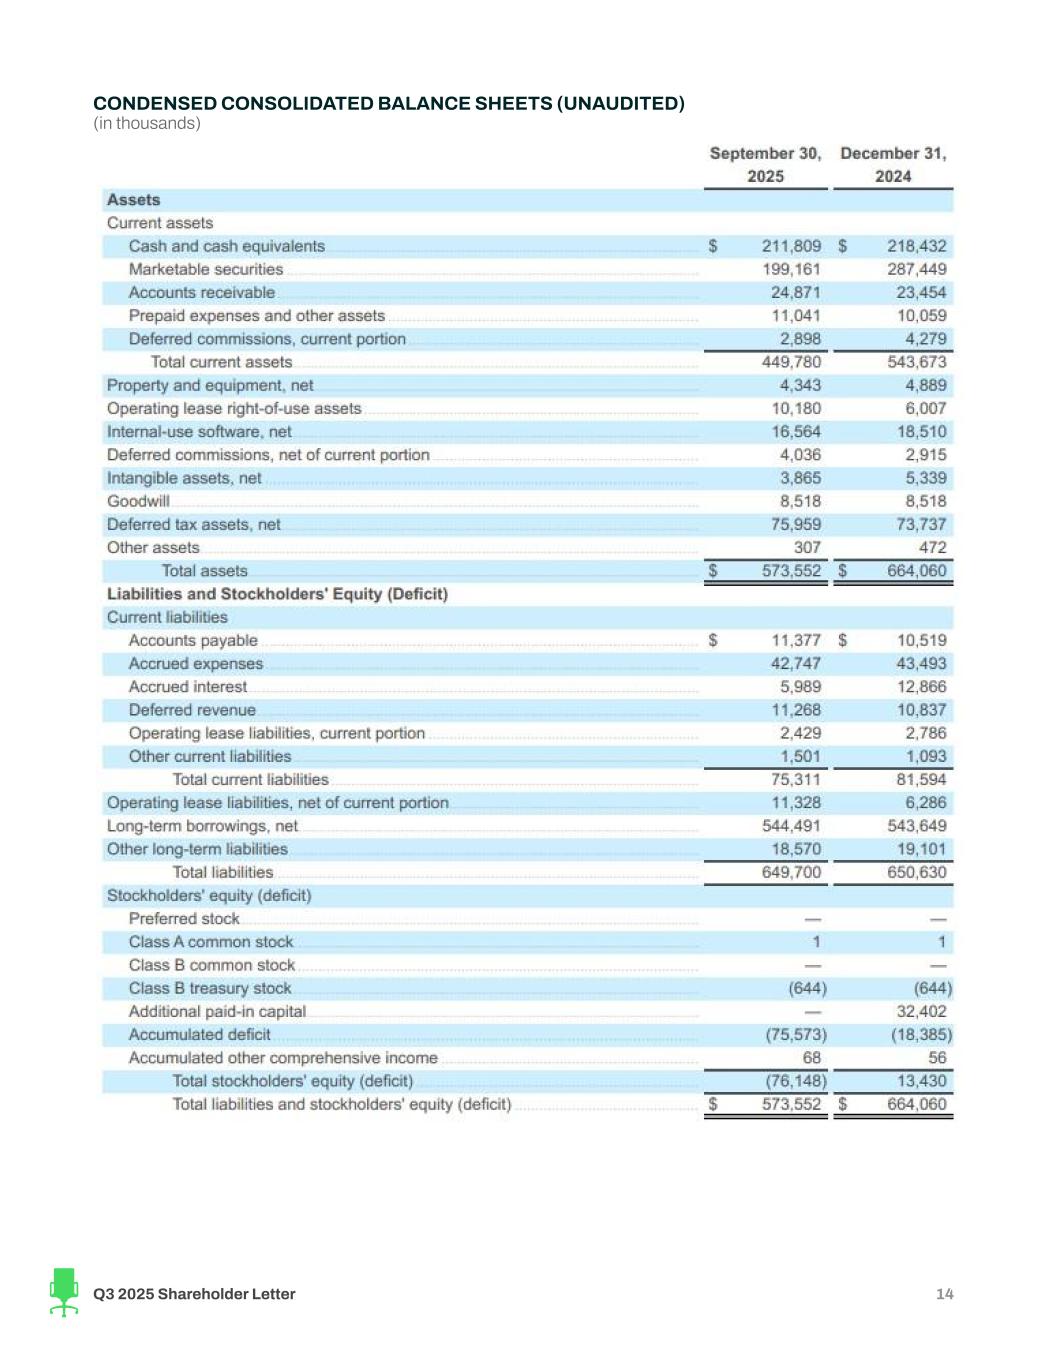
CONDENSED CONSOLIDATED BALANCE SHEETS (UNAUDITED) (in thousands) Q3 2025 Shareholder Letter 14
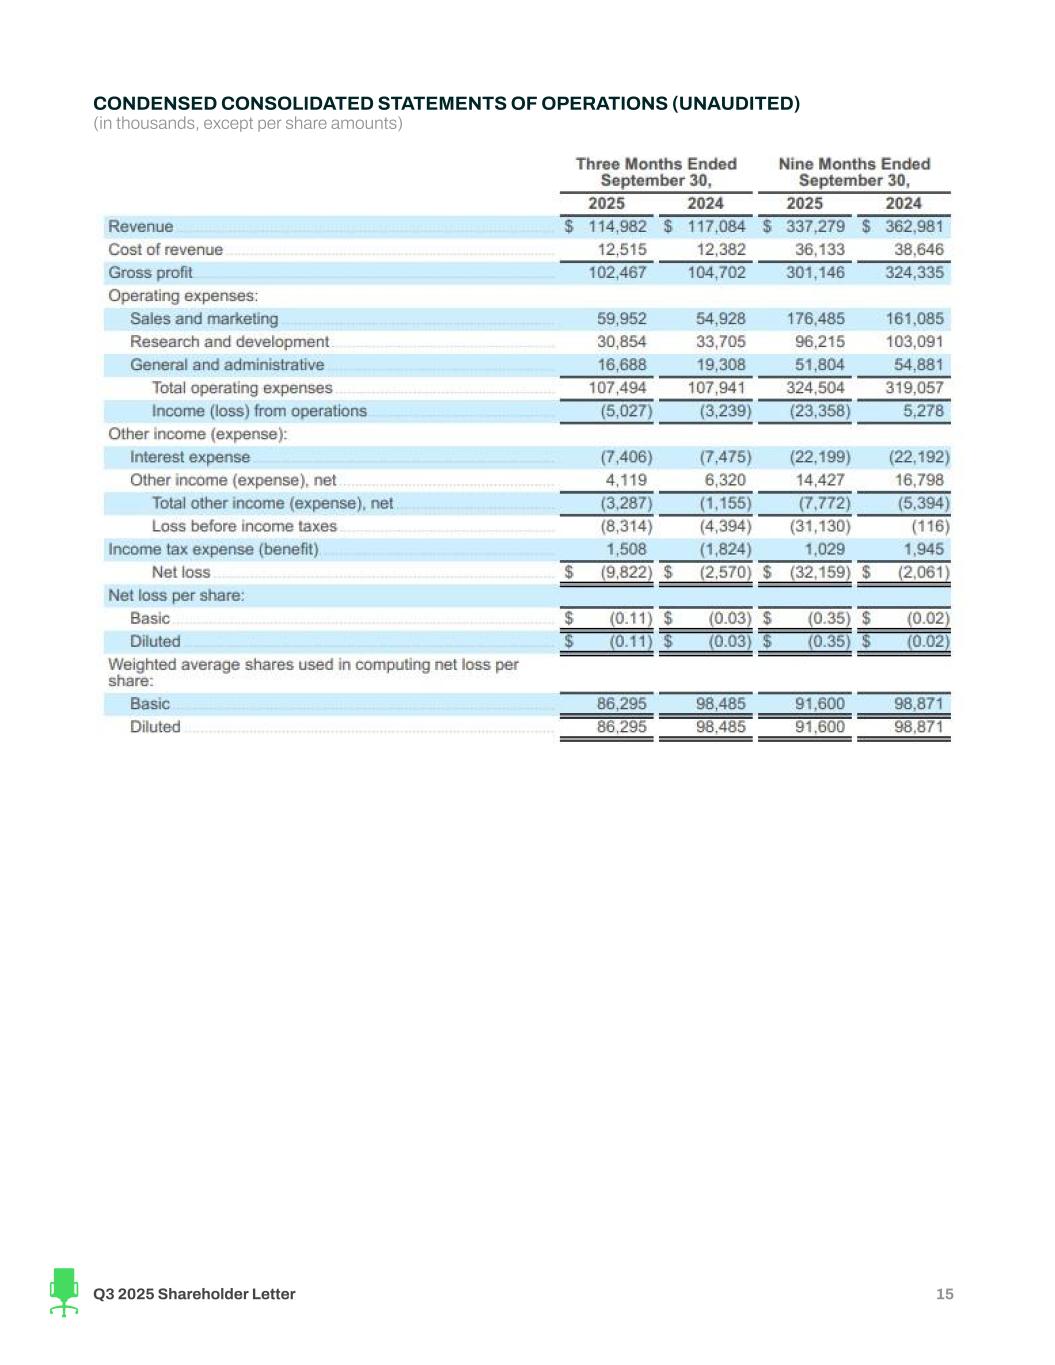
CONDENSED CONSOLIDATED STATEMENTS OF OPERATIONS (UNAUDITED) (in thousands, except per share amounts) Q3 2025 Shareholder Letter 15
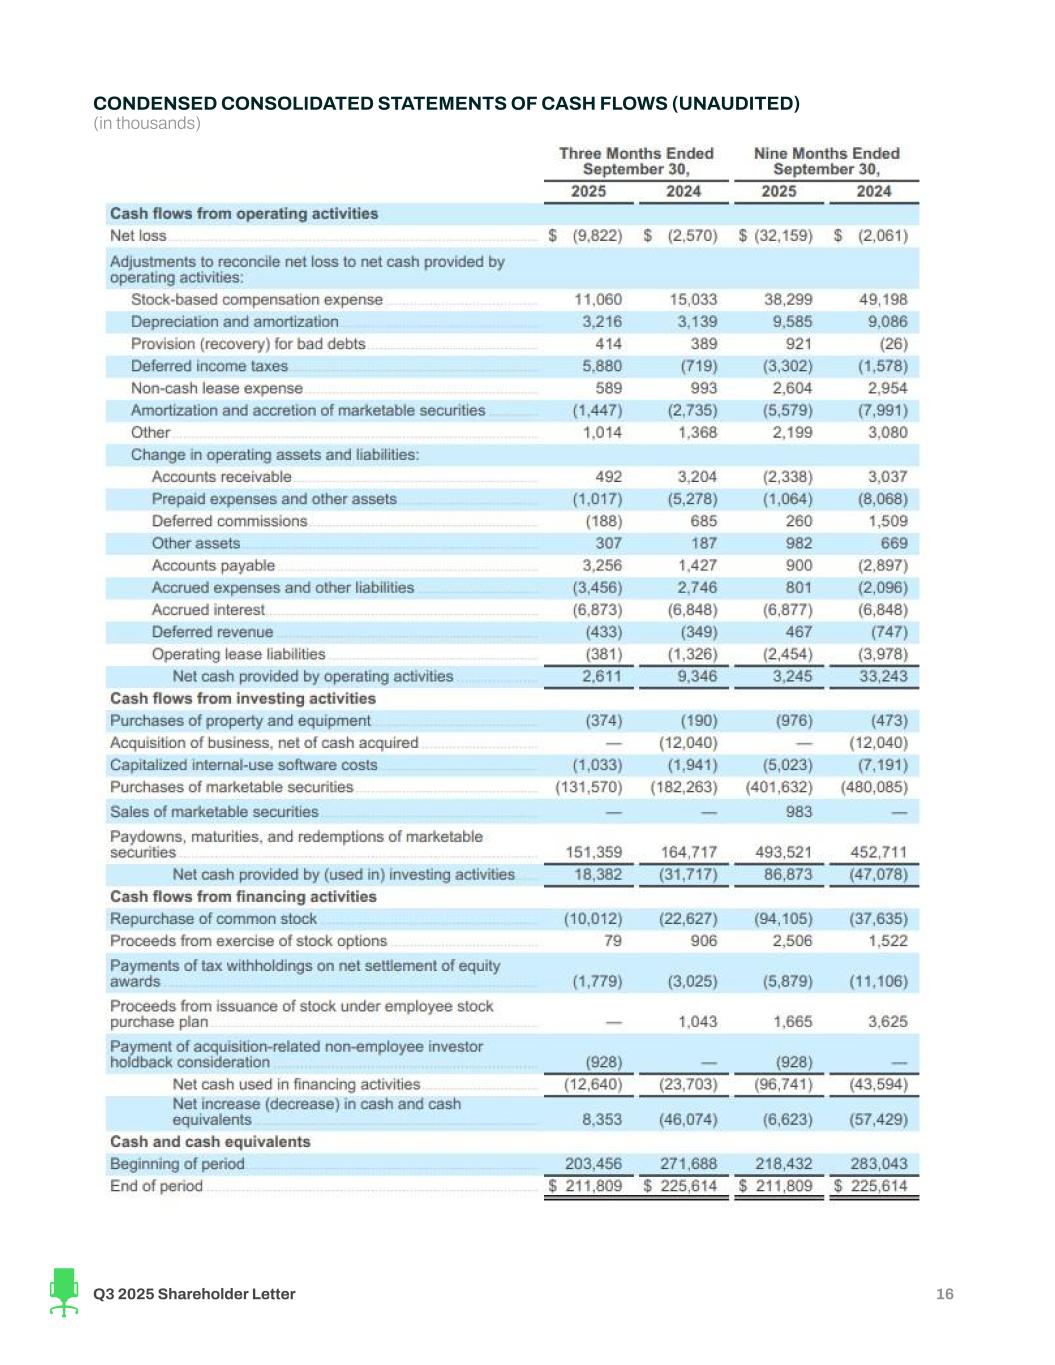
CONDENSED CONSOLIDATED STATEMENTS OF CASH FLOWS (UNAUDITED) (in thousands) Q3 2025 Shareholder Letter 16
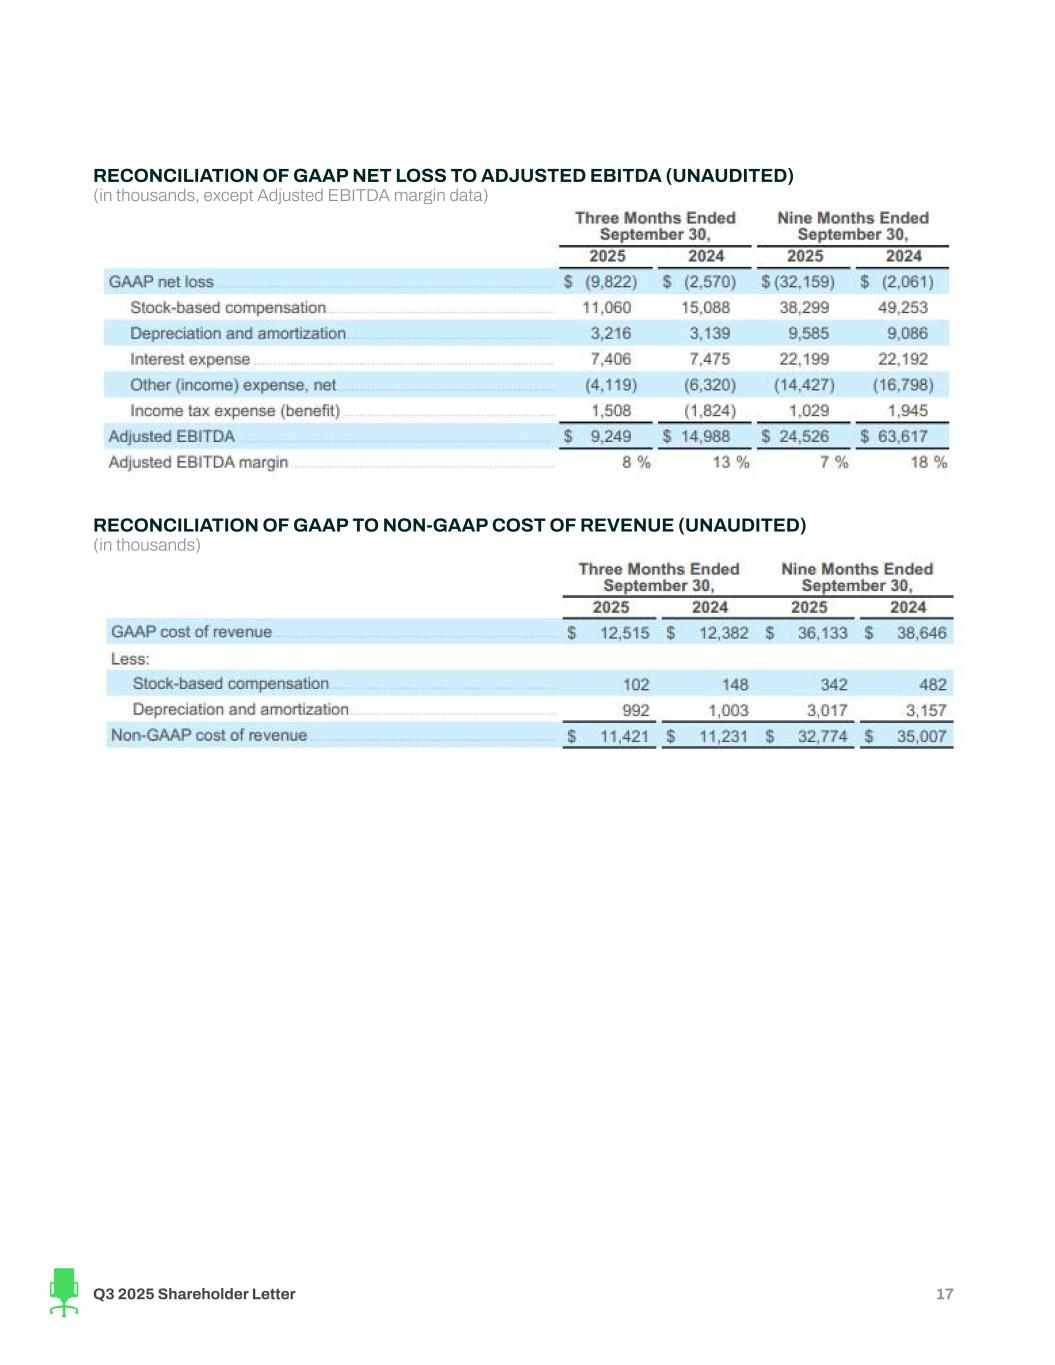
RECONCILIATION OF GAAP NET LOSS TO ADJUSTED EBITDA (UNAUDITED) (in thousands, except Adjusted EBITDA margin data) RECONCILIATION OF GAAP TO NON-GAAP COST OF REVENUE (UNAUDITED) (in thousands) Q3 2025 Shareholder Letter 17
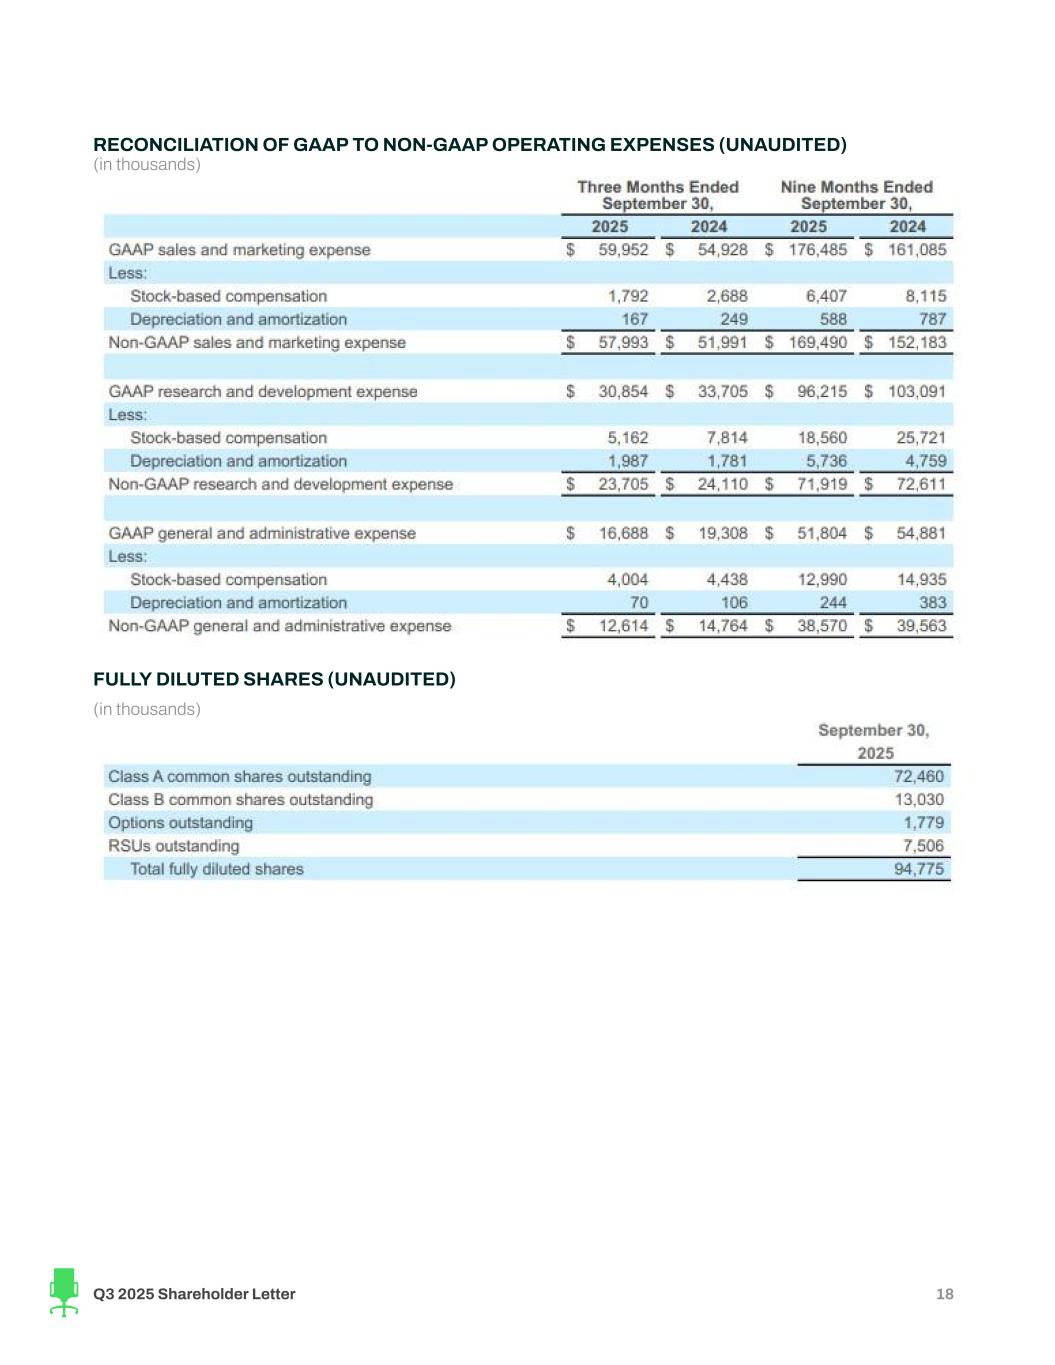
RECONCILIATION OF GAAP TO NON-GAAP OPERATING EXPENSES (UNAUDITED) (in thousands) FULLY DILUTED SHARES (UNAUDITED) (in thousands) Q3 2025 Shareholder Letter 18
Key Operating Metrics and Non-GAAP Financial Measures This shareholder letter includes certain key operating metrics, including Quarterly Paid Employers and Revenue per Paid Employer, and non-GAAP financial measures, including Non-GAAP cost of revenue, Non-GAAP operating expenses, Adjusted EBITDA and Adjusted EBITDA margin. We define Paid Employers as any actively recruiting employer(s) (or entities acting on behalf of an employer) on a paying subscription plan or performance marketing campaign for at least one day. Paid Employer(s) excludes employers from our Job Distribution Partners or other indirect channels, employers who are not actively recruiting, and employers on free trial. Job Distribution Partners are defined as third-party sites who have a relationship with us and advertise jobs from our marketplace. Quarterly Paid Employers means, with respect to any fiscal quarter, the count of Paid Employers during such fiscal quarter. Revenue per Paid Employer is the total company revenue in a particular period divided by the count of Quarterly Paid Employers in the same period. We define Non-GAAP cost of revenue as our cost of revenue before stock-based compensation expense, and depreciation and amortization. We define Non-GAAP operating expenses as our operating expenses before stock-based compensation expense, and depreciation and amortization. We define Adjusted EBITDA as our net income (loss) before interest expense, other (income) expense, net, income tax expense (benefit) and depreciation and amortization, adjusted to eliminate stock-based compensation expense. Adjusted EBITDA margin represents Adjusted EBITDA as a percentage of revenue for the same period. Management and our board of directors use these key operating metrics and non-GAAP financial measures as supplemental measures of our performance because they assist us in comparing our operating performance on a consistent basis, as they remove the impact of some items not directly resulting from our core operations. We also use these key operating metrics and non-GAAP financial measures for planning purposes, including the preparation of our internal annual operating budget and financial projections, to evaluate the performance and effectiveness of our strategic initiatives and to evaluate our capacity for capital expenditures to expand our business. Non-GAAP cost of revenue, Non-GAAP operating expenses, Adjusted EBITDA and Adjusted EBITDA margin should not be considered in isolation, as an alternative to, or superior to net income (loss), revenue, cash flows or other measures derived in accordance with GAAP. These non-GAAP measures are frequently used by analysts, investors and other interested parties to evaluate companies in our industry. Management believes that the presentation of non-GAAP financial measures is an appropriate measure of operating performance because they eliminate the impact of some expenses that do not relate directly to the performance of our underlying business. These non-GAAP financial measures should not be construed as an inference that our future results will be unaffected by unusual or other items. Additionally, Adjusted EBITDA and Adjusted EBITDA margin are not intended to be a measure of free cash flow for management’s discretionary use, as they do not reflect our tax payments and certain other cash costs that may recur in the future, including, among other things, cash requirements for costs to replace assets being depreciated and amortized including our capitalized internal use software. Management compensates for these limitations by relying on our GAAP results in addition to using Adjusted EBITDA and Adjusted EBITDA margin as supplemental measures of our performance. Our measures of Adjusted EBITDA and Adjusted EBITDA margin used herein are not necessarily comparable to similarly titled captions of other companies due to different methods of calculation. We are not able to provide a reconciliation of Adjusted EBITDA and Adjusted EBITDA margin for Q4’25 or the full fiscal year 2025 to net income (loss) and net income (loss) margin, the comparable GAAP measures, respectively, because certain items that are excluded from non-GAAP financial measures cannot be reasonably predicted or are not in our control. In particular, we are unable to forecast the timing or magnitude of stock-based compensation or amortization of internal-use software, as applicable, without unreasonable efforts, and these items could significantly impact, either individually or in the aggregate, GAAP measures in the future. See the tables above regarding reconciliations of these non-GAAP financial measures to the most directly comparable GAAP measures. Q3 2025 Shareholder Letter 19