
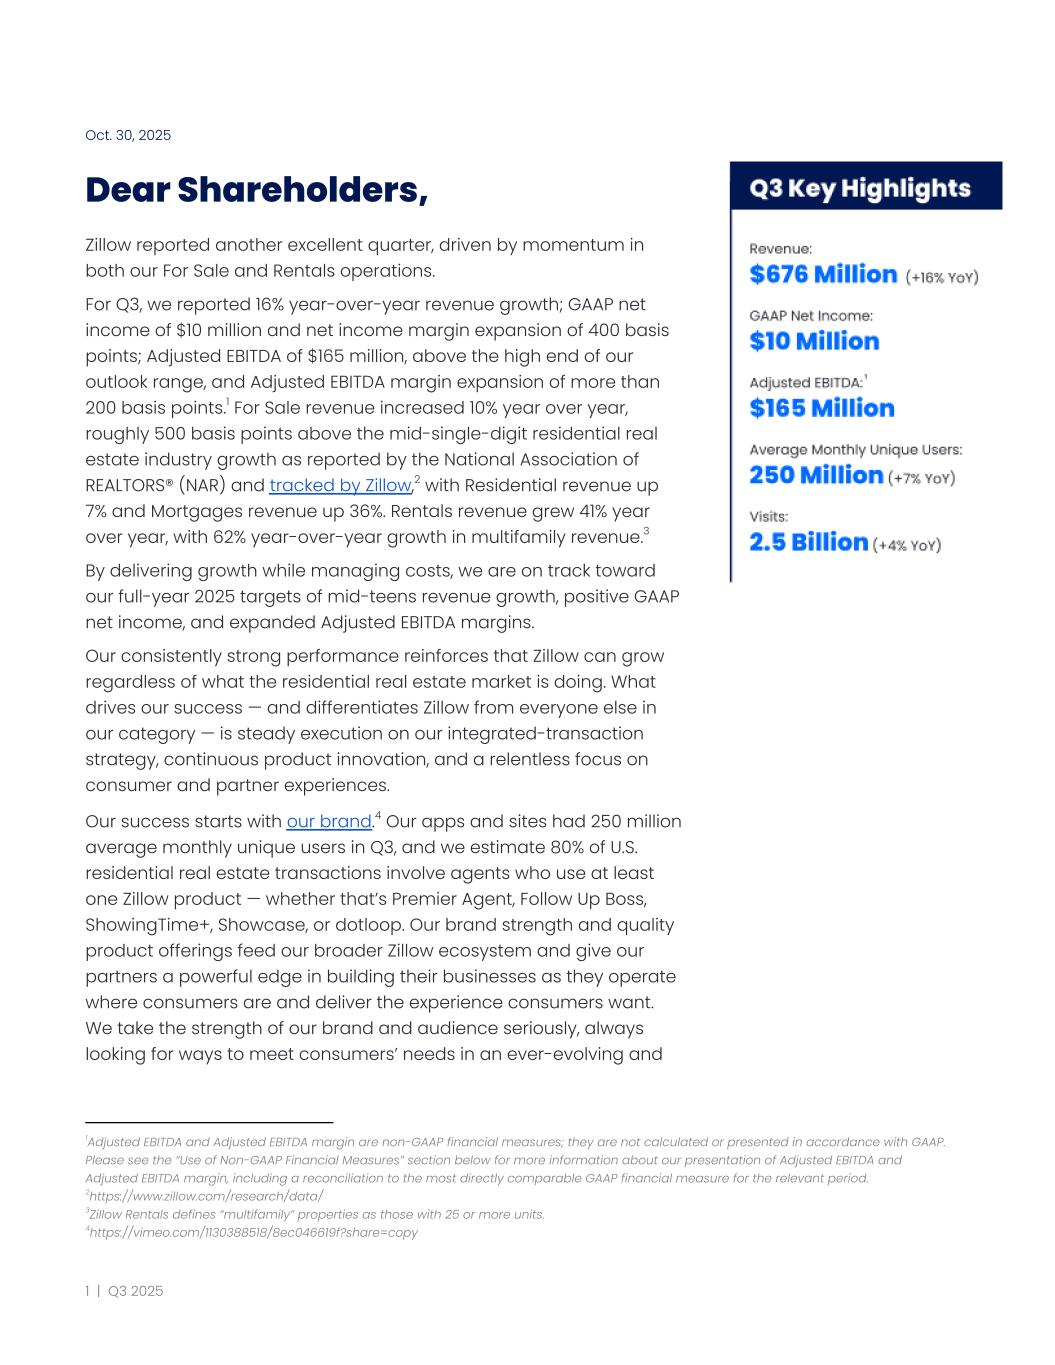
Oct. 30, 2025 Dear Shareholders, Zillow reported another excellent quarter, driven by momentum in both our For Sale and Rentals operations. For Q3, we reported 16% year-over-year revenue growth; GAAP net income of $10 million and net income margin expansion of 400 basis points; Adjusted EBITDA of $165 million, above the high end of our outlook range, and Adjusted EBITDA margin expansion of more than 200 basis points.1 For Sale revenue increased 10% year over year, roughly 500 basis points above the mid-single-digit residential real estate industry growth as reported by the National Association of REALTORS® (NAR) and tracked by Zillow,2 with Residential revenue up 7% and Mortgages revenue up 36%. Rentals revenue grew 41% year over year, with 62% year-over-year growth in multifamily revenue.3 By delivering growth while managing costs, we are on track toward our full-year 2025 targets of mid-teens revenue growth, positive GAAP net income, and expanded Adjusted EBITDA margins. Our consistently strong performance reinforces that Zillow can grow regardless of what the residential real estate market is doing. What drives our success — and differentiates Zillow from everyone else in our category — is steady execution on our integrated-transaction strategy, continuous product innovation, and a relentless focus on consumer and partner experiences. Our success starts with our brand.4 Our apps and sites had 250 million average monthly unique users in Q3, and we estimate 80% of U.S. residential real estate transactions involve agents who use at least one Zillow product — whether that’s Premier Agent, Follow Up Boss, ShowingTime+, Showcase, or dotloop. Our brand strength and quality product offerings feed our broader Zillow ecosystem and give our partners a powerful edge in building their businesses as they operate where consumers are and deliver the experience consumers want. We take the strength of our brand and audience seriously, always looking for ways to meet consumers’ needs in an ever-evolving and 4https://vimeo.com/1130388518/8ec046619f?share=copy 3Zillow Rentals defines “multifamily” properties as those with 25 or more units. 2https://www.zillow.com/research/data/ 1Adjusted EBITDA and Adjusted EBITDA margin are non-GAAP financial measures; they are not calculated or presented in accordance with GAAP. Please see the “Use of Non-GAAP Financial Measures” section below for more information about our presentation of Adjusted EBITDA and Adjusted EBITDA margin, including a reconciliation to the most directly comparable GAAP financial measure for the relevant period. 1 | Q3 2025

competitive landscape. The latest demonstration of that principle launched this month: the Zillow App in ChatGPT.5 Consumers searching for homes in ChatGPT can explore listings, maps, photos, and pricing directly in the Zillow experience6 and can seamlessly continue on to Zillow’s website or mobile app to book a tour, connect with an agent, or learn about financing. It’s another new doorway directly into our ecosystem, just like when we built one of the first apps in the industry for mobile. As we learned then, first-mover advantage pays off when technology transforms how people use the internet. We are currently the only real estate app inside ChatGPT — a testament to the speed and technical depth of our teams, as well as our nearly 20-year track record of using AI7 to build innovative, data-driven, consumer-first products responsibly. We are still in the very early innings of how AI will transform consumer experiences, but we strongly believe the critical differentiators between those who succeed and those who get left behind in our category will be user experience, quality of audience, unique insights, and providing integrated transaction services instead of just top-of-funnel lead generation. FOR SALE Our For Sale revenue is consistently outperforming the broader residential real estate market as we deliver strong revenue growth and continue to drive share growth relative to the industry total transaction value. We’re executing well on our For Sale strategy to make buying, selling, and financing easier for consumers and agents alike. Zillow is built for where the industry is going, not where it’s been. We’ve moved beyond home search and become a diversified, transaction-focused platform that integrates across the housing journey — connecting with an agent, touring, exploring financing options, and more — and equips agents to successfully guide consumers through the journey. We continue to scale our immersive listing experience, Zillow Showcase.8 More than 50 brokerages9 have adopted Showcase as a 9https://investors.zillowgroup.com/investors/news-and-events/news/news-details/2025/More-than-50-brokerages-adopt-Zillow-Showcase-as- go-to-tool-for-listing-marketing-innovation/default.aspx 8https://www.zillow.com/agents/showcase/ 7https://vimeo.com/1130388571/4687f382f4?share=copy 6https://vimeo.com/1130388584/5a9ff26843?share=copy 5https://www.zillowgroup.com/news/zillow-becomes-first-real-estate-app-in-chatgpt/ 2 | Q3 2025
go-to marketing solution to help agents win more listings and sell homes faster. These enterprise partnerships — spanning leading national brands, regional powerhouses and innovative independents — reflect industry recognition that Showcase gives agents and sellers a measurable edge10 in today’s housing market. As of the end of Q3, Showcase was on 3.2% of all new listings in the U.S., up from 2.5% last quarter and more than double our listing share compared with a year ago. And in Q3, we launched AI-powered virtual staging11 on Showcase listings. This new feature uses computer vision to restyle rooms instantly, letting buyers picture a home’s potential while giving agents who use Showcase12 another way to make listings stand out.13 With products like BuyAbilitySM,14 a powerful tool from Zillow Home Loans15 that helps buyers shop based on what they can afford, we’re making financing simpler and more transparent — and improving how we identify high-intent buyers in the process. BuyAbility has enrolled 2.9 million people since it launched. These buyers are typically more knowledgeable and ready to act when they connect with an agent through Zillow. In addition, in Zillow Home Loans, we introduced a verified digital pre-approval16 and began rolling out a new borrower application designed to get shoppers quickly to a decision and improve loan officer efficiency. These updates are live now on our website and coming soon to the app. We also just rolled out major enhancements17 to our proprietary messaging system that lets buyers communicate directly with their agent and with loan officers from Zillow Home Loans within the Zillow app thanks to an integration with Follow Up Boss.18 Buyers can now co-shop with a partner or co-buyer right inside the Zillow app — sharing homes, comparing favorites, and staying aligned in one place. We expect enabling home buyers to be better connected will deepen engagement and help real estate professionals provide better service to their clients, and ultimately boost transaction rates. 18https://www.zillow.com/premier-agent/follow-up-boss/ 17 https://www.zillow.com/product-releases/fall-2025/ 16 https://www.zillow.com/mortgages/pre-approval/ 15https://www.zillow.com/homeloans/ 14https://www.zillow.com/homeloans/buyability/ 13https://www.zillowgroup.com/news/zillow-showcase-brings-listings-to-life/ 12https://vimeo.com/1130388548/dffcebd525?share=copy 11https://investors.zillowgroup.com/investors/news-and-events/news/news-details/2025/Zillow-brings-AI-powered-Virtual-Staging-to-Showcase -listings/default.aspx 10https://www.zillow.com/agents/showcase-facts/ 3 | Q3 2025
We are innovating rapidly to apply new technology where it matters most: improving the customer journey and helping real estate professionals succeed in the age of AI by giving them the tools and insights they need to serve clients better, work more efficiently, and grow their businesses. As part of that effort, we’ve continued to invest in a growing set of features within Follow Up Boss, many of them AI-powered.19 Recent updates include real-time call transcripts, Smart Summaries that recap each connection’s recent communication with suggested next steps, and custom Zillow Home Loans pre-approval letters for buyers who request one — each integrated directly in the Follow Up Boss system, giving agents richer context and helping them communicate faster. All of this innovation comes together, and brings our For Sale strategy to life, in our Enhanced Markets, where we’re connecting high-intent movers with high-performing professionals and delivering a more integrated transaction. In Q3, 34% of connections came through the Enhanced Market experience, up from 27% last quarter, on our way to our mid-term goal of at least 75%. Virtually all Zillow connections in the Enhanced Market experience are now managed through Follow Up Boss, improving collaboration among buyers, agents, and loan officers. We’re also seeing double-digit adoption of Zillow Home Loans across Enhanced Markets, a clear sign the integrated experience is delivering value as we help customers get home. As that integrated experience expands, we’re updating our invite-only, pay-when-you-close program for top real estate agent teams. This month, we announced Zillow Preferred,20 the next chapter for our Flex program that recognizes partners for delivering outstanding customer experiences and provides them access to dedicated support and growth tools. Zillow Preferred builds on Flex’s foundation and makes it clear shoppers are connecting with a preferred partner of ours. As we expand the integrated experience in our Enhanced Markets to the majority of our connections, we expect Zillow Preferred to expand in tandem. Earlier this month, we also introduced Zillow Pro,21 a membership that brings together Zillow’s most impactful tools and services into an 21https://www.zillow.com/agents/zillow-pro/ 20https://www.zillow.com/preferred/ 19https://vimeo.com/1130388531/8a7fc89267?share=copy 4 | Q3 2025
integrated, AI-powered suite that helps growth-oriented agents scale their businesses. Zillow Pro helps agents more effectively serve all the clients in their sphere, not just those they connected with on Zillow. With features like My Agent, client insights flow into Follow Up Boss, and agents can see what their buyers are eyeing on Zillow, invite any customer to connect on Zillow, and keep their branding visible across Zillow as those clients shop. Zillow Pro also enables real-time touring for clients an agent found off of Zillow, unified messaging and property sharing among co-shoppers, and premium profiles that let agents customize how they show up across our apps and sites. Over time, top-performing Zillow Pro users also become eligible for Zillow Preferred. Zillow Pro is designed to give agents the data, tools, and brand reach they need to uncover opportunities, work smarter, deepen relationships, and drive more transactions. It also expands the serviceable addressable market of our housing super app to more agents and all consumers. Given that agents who use at least one of our products touch an estimated 80% of U.S. residential real estate transactions, we have a strong partner base to sell Zillow Pro into. We look forward to rolling it out across the country throughout 2026. RENTALS In Rentals, just like in For Sale, we’re focused on speed, transparency and innovation on behalf of consumers and partners. And because renting is where nearly every mover starts, our progress here is expanding the top of Zillow’s housing funnel and creating durable growth across the business. Rentals revenue increased 41% year over year in Q3, primarily due to a 62% increase in multifamily revenue. In Q3, Zillow Rentals had 2.5 million average monthly active rental listings, ranging from single-family homes to large apartment complexes. This includes 69,000 multifamily properties listed on Zillow — almost double the 35,000 we had two years ago — and there is room to expand, with an estimated 140,000 total multifamily properties across the country. Multifamily is a key growth driver, and we’re expanding both our property count and wallet share as more large property managers choose to upgrade to more comprehensive advertising packages with us. 5 | Q3 2025
As proof of the value we add for our multifamily partners, we are pleased that Zillow Rentals ranks #1 in partner satisfaction22 in our category for return on marketing investment.23 Our listing syndication agreements with the Redfin rental network24 and with Realtor.com®25 are benefiting consumers and property managers by expanding the reach and visibility of rental listings online, helping more renters see more available properties on more sites and helping property managers connect with qualified applicants more efficiently. Beyond cultivating a comprehensive marketplace, we’re innovating quickly to make renting simpler, fairer, more transparent, and more affordable. This quarter, we expanded our cost-transparency features26 across the Zillow Rentals network, providing renters more information about move-in and monthly costs and providing calculators to help them estimate total expenses before applying. This helps cost-burdened renters plan accurately, and in turn, property managers get more qualified, serious applicants. Many renters on Zillow can also reuse a single, secure rental application across listings, saving time and cutting repeated fees — an example of how Zillow reduces friction and makes renting fairer. We also announced a new partnership with Esusu,27 the leading rent-reporting platform, to help renters build credit through on-time rent payments. This collaboration expands credit-building access28 nationwide, allowing any renter — not just those who pay rent through Zillow — to have their payments reported to major credit bureaus. This partnership is another example of Zillow’s broader effort29 to help renters and buyers access and afford housing. Finally, we recently launched Listing Spotlight,30 a premium listing option on Zillow Rentals that gives single-family rentals and smaller buildings the highest exposure available to this category on Zillow. 30https://www.zillowgroup.com/news/appfolio-partners-with-zillow-to-launch-listing-spotlight/ 29https://www.zillowgroup.com/news/how-zillow-makes-renting-easier-fairer-and-more-affordable -for-everyone/ 28https://www.zillowgroup.com/news/renters-deserve-credit-for-paying-rent-and-zillow-is-delivering/ 27https://zillow.mediaroom.com/2025-10-14-Zillow-and-Esusu-partner-to-expand-credit-building-for-re nters-nationwide 26https://www.zillow.com/learn/rental-pricing-transparency/ 25https://investors.zillowgroup.com/investors/news-and-events/news/news-details/2024/Realtor.com-a nd-Zillow-Ink-New-Rental-Listings-Syndication-Agreement/default.aspx 24https://investors.zillowgroup.com/investors/news-and-events/news/news-details/2025/Zillow-and-Re dfin-partner-to-make-apartment-hunting-easier-and-give-listings-more-exposure/default.aspx 23Zillow internal data and estimates, 2025 22https://www.youtube.com/watch?v=PS1iG3_ZguA 6 | Q3 2025
Building a better experience for renters and property managers has earned us consistently strong rentals traffic, with about 35 million average monthly unique visitors in Q3.31 Our strong results in both For Sale and Rentals show how Zillow is successfully innovating on behalf of consumers and real estate professionals across the housing journey. IN CLOSING As we continue to deliver excellent results, we’re also aware of the external noise that has gotten louder in recent months — and we’re confident in our ability to execute through it, as we have the past few years whenever the volume has turned up. We’re all eyes forward on building a marketplace that expands visibility and choice, promotes fairness and broad access, and empowers consumers and the real estate professionals who serve them. Solving their problems is what ultimately matters. That’s what enables success in the modern era and the AI-driven future. That’s what drives results. And that’s exactly what Zillow is doing — with this quarter as the most recent example. We’ll keep executing with discipline as we aim to lead the industry toward a more transparent, consumer-first future. We are on track toward our full-year 2025 goals of mid-teens revenue growth, GAAP profitability, and expanded Adjusted EBITDA margins — with year-over-year revenue growth expected to accelerate in Q4. Our steady focus and execution are setting us up for what we believe will be sustainable profitable growth well into the future. Behind our strong financial performance is a clear mission: helping millions of people get home and supporting the professionals who make that possible. As a beloved consumer brand and a trusted partner platform, we’re proud of the work we’re doing to make the housing journey simpler, more transparent, and more integrated. Sincerely, Jeremy Wacksman Jeremy Hofmann CEO CFO 31Average monthly rentals unique visitors for Q3 2025, estimated using Comscore data 7 | Q3 2025
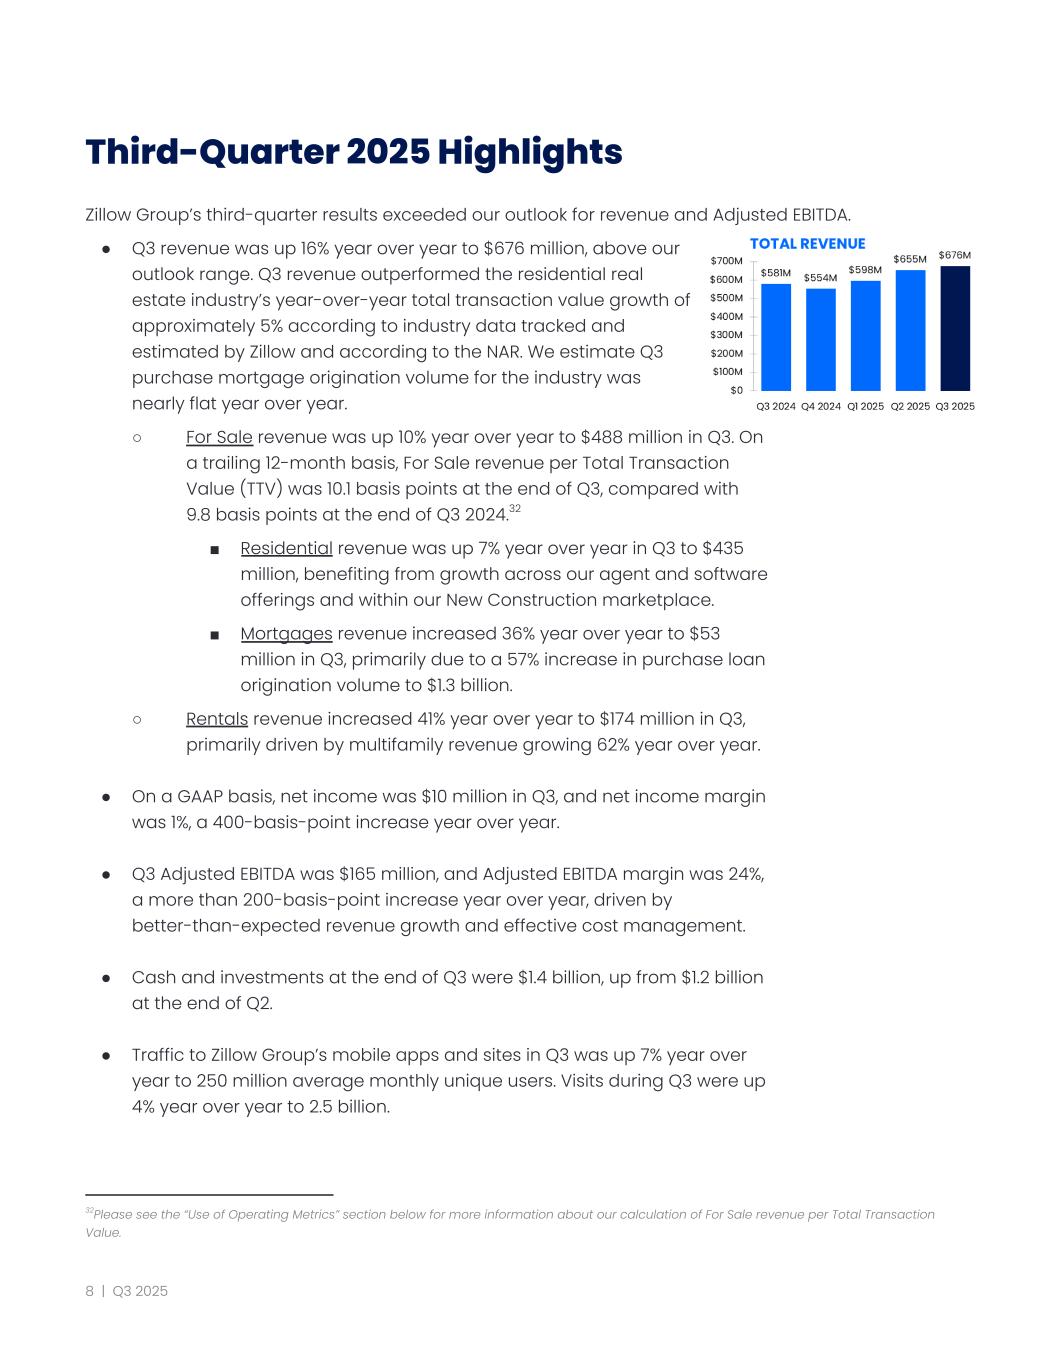
Third-Quarter 2025 Highlights Zillow Group’s third-quarter results exceeded our outlook for revenue and Adjusted EBITDA. ● Q3 revenue was up 16% year over year to $676 million, above our outlook range. Q3 revenue outperformed the residential real estate industry’s year-over-year total transaction value growth of approximately 5% according to industry data tracked and estimated by Zillow and according to the NAR. We estimate Q3 purchase mortgage origination volume for the industry was nearly flat year over year. ○ For Sale revenue was up 10% year over year to $488 million in Q3. On a trailing 12-month basis, For Sale revenue per Total Transaction Value (TTV) was 10.1 basis points at the end of Q3, compared with 9.8 basis points at the end of Q3 2024.32 ■ Residential revenue was up 7% year over year in Q3 to $435 million, benefiting from growth across our agent and software offerings and within our New Construction marketplace. ■ Mortgages revenue increased 36% year over year to $53 million in Q3, primarily due to a 57% increase in purchase loan origination volume to $1.3 billion. ○ Rentals revenue increased 41% year over year to $174 million in Q3, primarily driven by multifamily revenue growing 62% year over year. ● On a GAAP basis, net income was $10 million in Q3, and net income margin was 1%, a 400-basis-point increase year over year. ● Q3 Adjusted EBITDA was $165 million, and Adjusted EBITDA margin was 24%, a more than 200-basis-point increase year over year, driven by better-than-expected revenue growth and effective cost management. ● Cash and investments at the end of Q3 were $1.4 billion, up from $1.2 billion at the end of Q2. ● Traffic to Zillow Group’s mobile apps and sites in Q3 was up 7% year over year to 250 million average monthly unique users. Visits during Q3 were up 4% year over year to 2.5 billion. 32Please see the “Use of Operating Metrics” section below for more information about our calculation of For Sale revenue per Total Transaction Value. 8 | Q3 2025
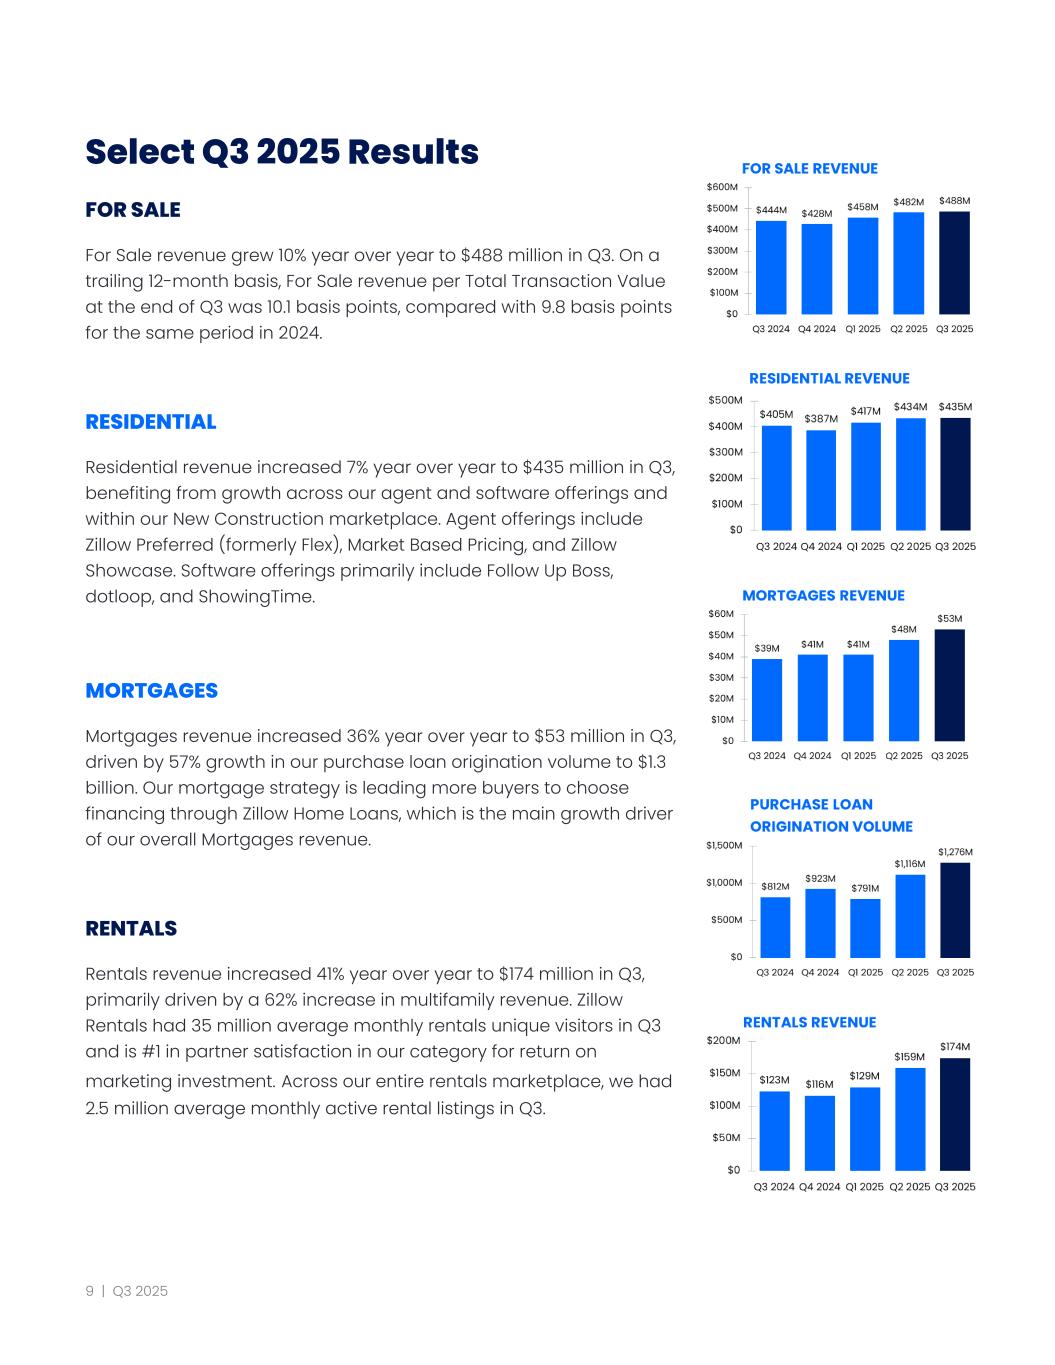
Select Q3 2025 Results FOR SALE For Sale revenue grew 10% year over year to $488 million in Q3. On a trailing 12-month basis, For Sale revenue per Total Transaction Value at the end of Q3 was 10.1 basis points, compared with 9.8 basis points for the same period in 2024. RESIDENTIAL Residential revenue increased 7% year over year to $435 million in Q3, benefiting from growth across our agent and software offerings and within our New Construction marketplace. Agent offerings include Zillow Preferred (formerly Flex), Market Based Pricing, and Zillow Showcase. Software offerings primarily include Follow Up Boss, dotloop, and ShowingTime. MORTGAGES Mortgages revenue increased 36% year over year to $53 million in Q3, driven by 57% growth in our purchase loan origination volume to $1.3 billion. Our mortgage strategy is leading more buyers to choose financing through Zillow Home Loans, which is the main growth driver of our overall Mortgages revenue. RENTALS Rentals revenue increased 41% year over year to $174 million in Q3, primarily driven by a 62% increase in multifamily revenue. Zillow Rentals had 35 million average monthly rentals unique visitors in Q3 and is #1 in partner satisfaction in our category for return on marketing investment. Across our entire rentals marketplace, we had 2.5 million average monthly active rental listings in Q3. 9 | Q3 2025
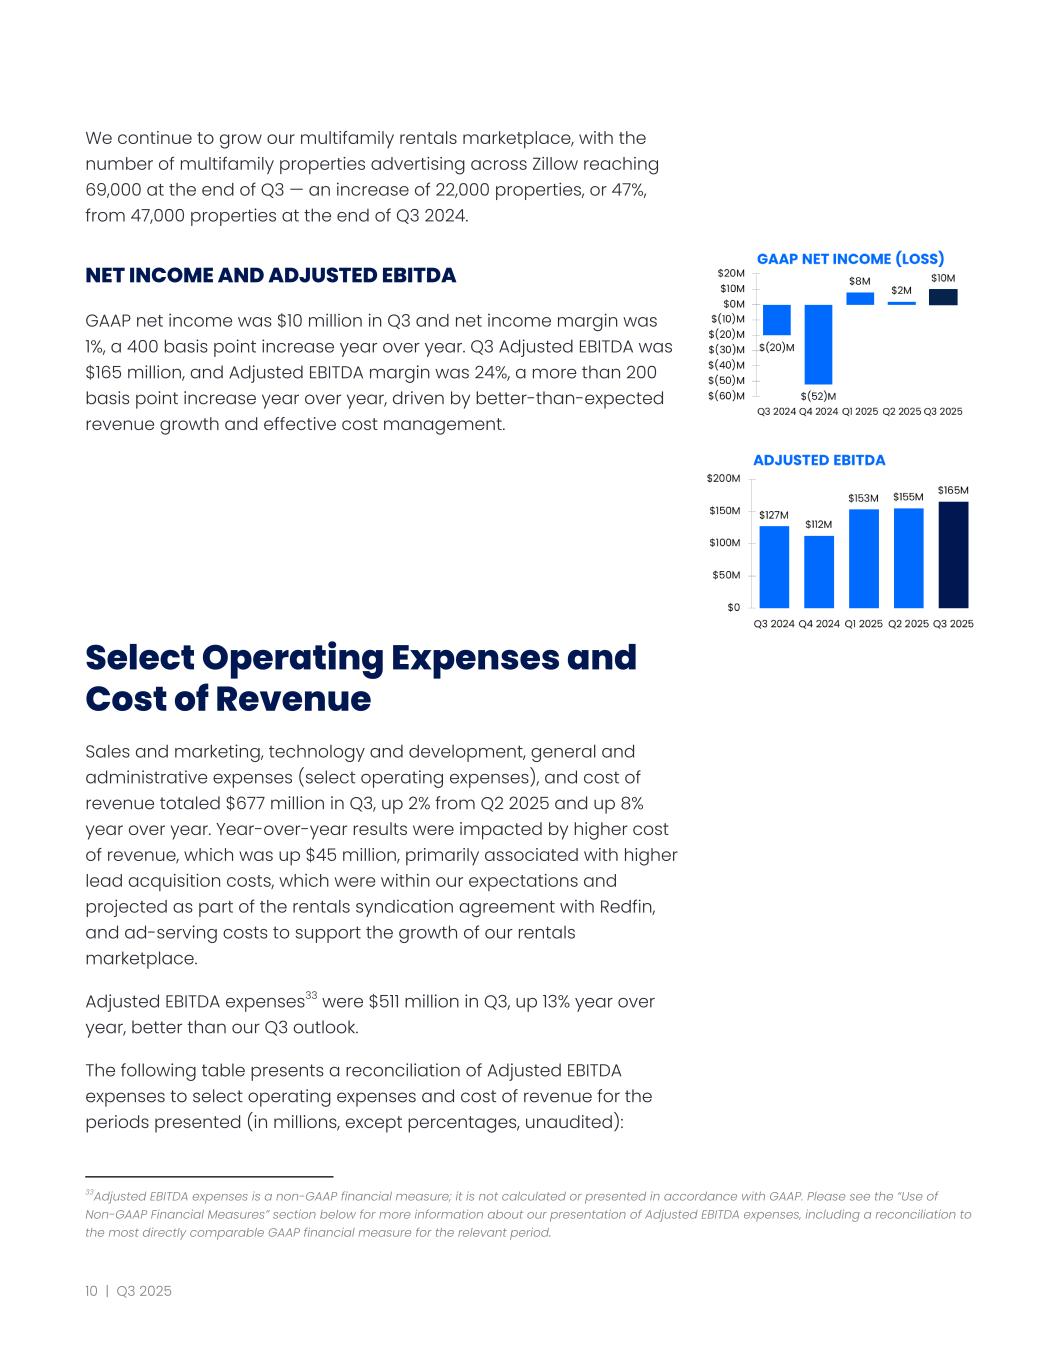
We continue to grow our multifamily rentals marketplace, with the number of multifamily properties advertising across Zillow reaching 69,000 at the end of Q3 — an increase of 22,000 properties, or 47%, from 47,000 properties at the end of Q3 2024. NET INCOME AND ADJUSTED EBITDA GAAP net income was $10 million in Q3 and net income margin was 1%, a 400 basis point increase year over year. Q3 Adjusted EBITDA was $165 million, and Adjusted EBITDA margin was 24%, a more than 200 basis point increase year over year, driven by better-than-expected revenue growth and effective cost management. Select Operating Expenses and Cost of Revenue Sales and marketing, technology and development, general and administrative expenses (select operating expenses), and cost of revenue totaled $677 million in Q3, up 2% from Q2 2025 and up 8% year over year. Year-over-year results were impacted by higher cost of revenue, which was up $45 million, primarily associated with higher lead acquisition costs, which were within our expectations and projected as part of the rentals syndication agreement with Redfin, and ad-serving costs to support the growth of our rentals marketplace. Adjusted EBITDA expenses33 were $511 million in Q3, up 13% year over year, better than our Q3 outlook. The following table presents a reconciliation of Adjusted EBITDA expenses to select operating expenses and cost of revenue for the periods presented (in millions, except percentages, unaudited): 33Adjusted EBITDA expenses is a non-GAAP financial measure; it is not calculated or presented in accordance with GAAP. Please see the “Use of Non-GAAP Financial Measures” section below for more information about our presentation of Adjusted EBITDA expenses, including a reconciliation to the most directly comparable GAAP financial measure for the relevant period. 10 | Q3 2025
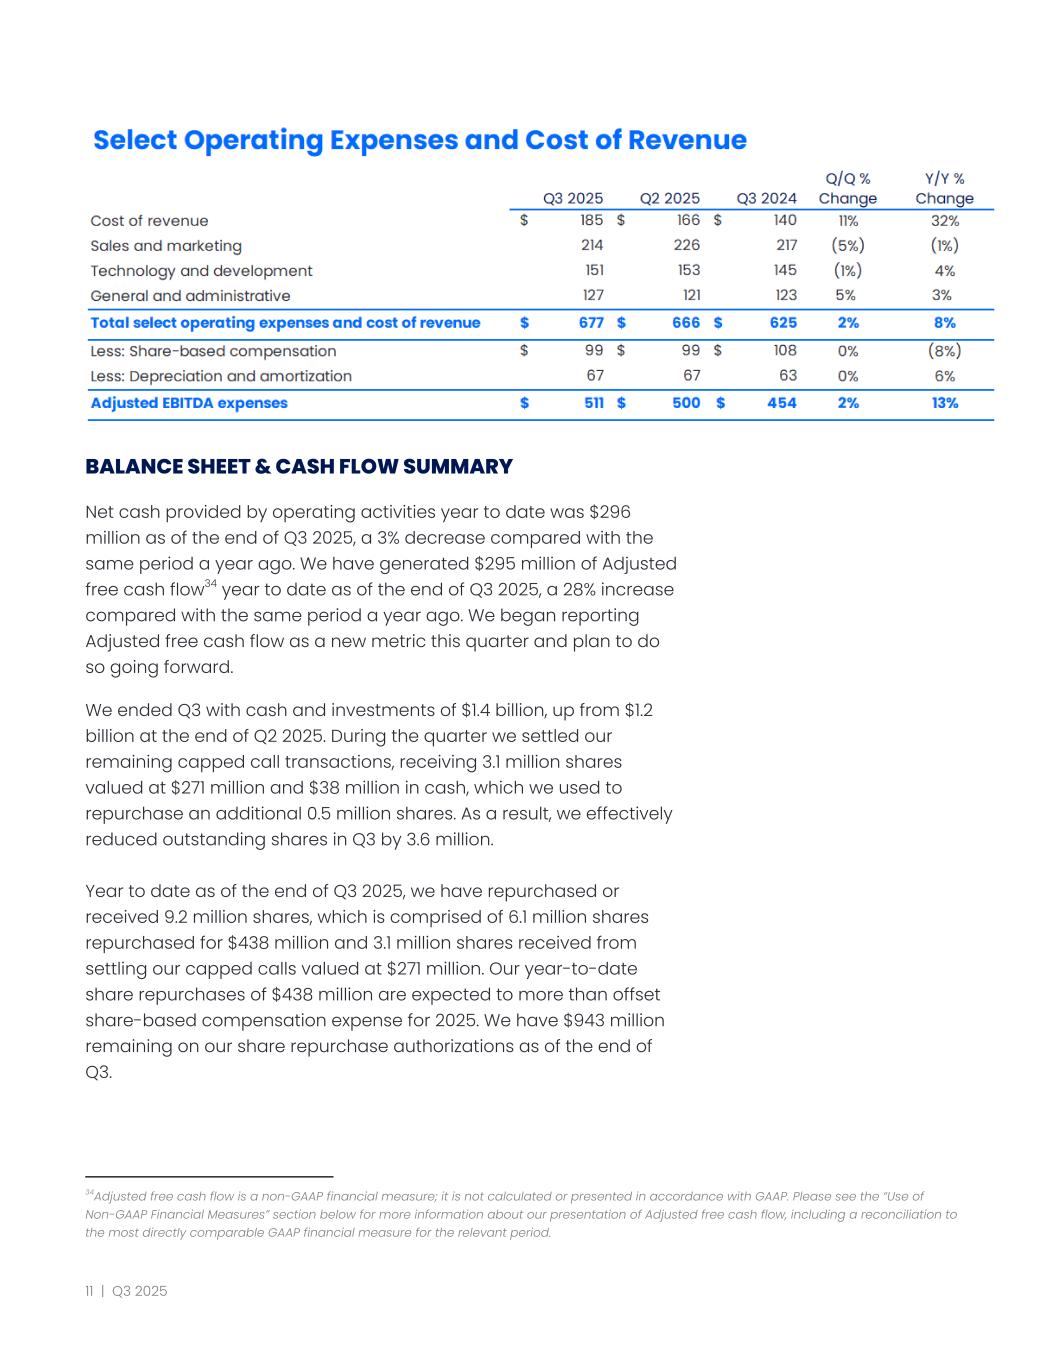
BALANCE SHEET & CASH FLOW SUMMARY Net cash provided by operating activities year to date was $296 million as of the end of Q3 2025, a 3% decrease compared with the same period a year ago. We have generated $295 million of Adjusted free cash flow34 year to date as of the end of Q3 2025, a 28% increase compared with the same period a year ago. We began reporting Adjusted free cash flow as a new metric this quarter and plan to do so going forward. We ended Q3 with cash and investments of $1.4 billion, up from $1.2 billion at the end of Q2 2025. During the quarter we settled our remaining capped call transactions, receiving 3.1 million shares valued at $271 million and $38 million in cash, which we used to repurchase an additional 0.5 million shares. As a result, we effectively reduced outstanding shares in Q3 by 3.6 million. Year to date as of the end of Q3 2025, we have repurchased or received 9.2 million shares, which is comprised of 6.1 million shares repurchased for $438 million and 3.1 million shares received from settling our capped calls valued at $271 million. Our year-to-date share repurchases of $438 million are expected to more than offset share-based compensation expense for 2025. We have $943 million remaining on our share repurchase authorizations as of the end of Q3. 34Adjusted free cash flow is a non-GAAP financial measure; it is not calculated or presented in accordance with GAAP. Please see the “Use of Non-GAAP Financial Measures” section below for more information about our presentation of Adjusted free cash flow, including a reconciliation to the most directly comparable GAAP financial measure for the relevant period. 11 | Q3 2025
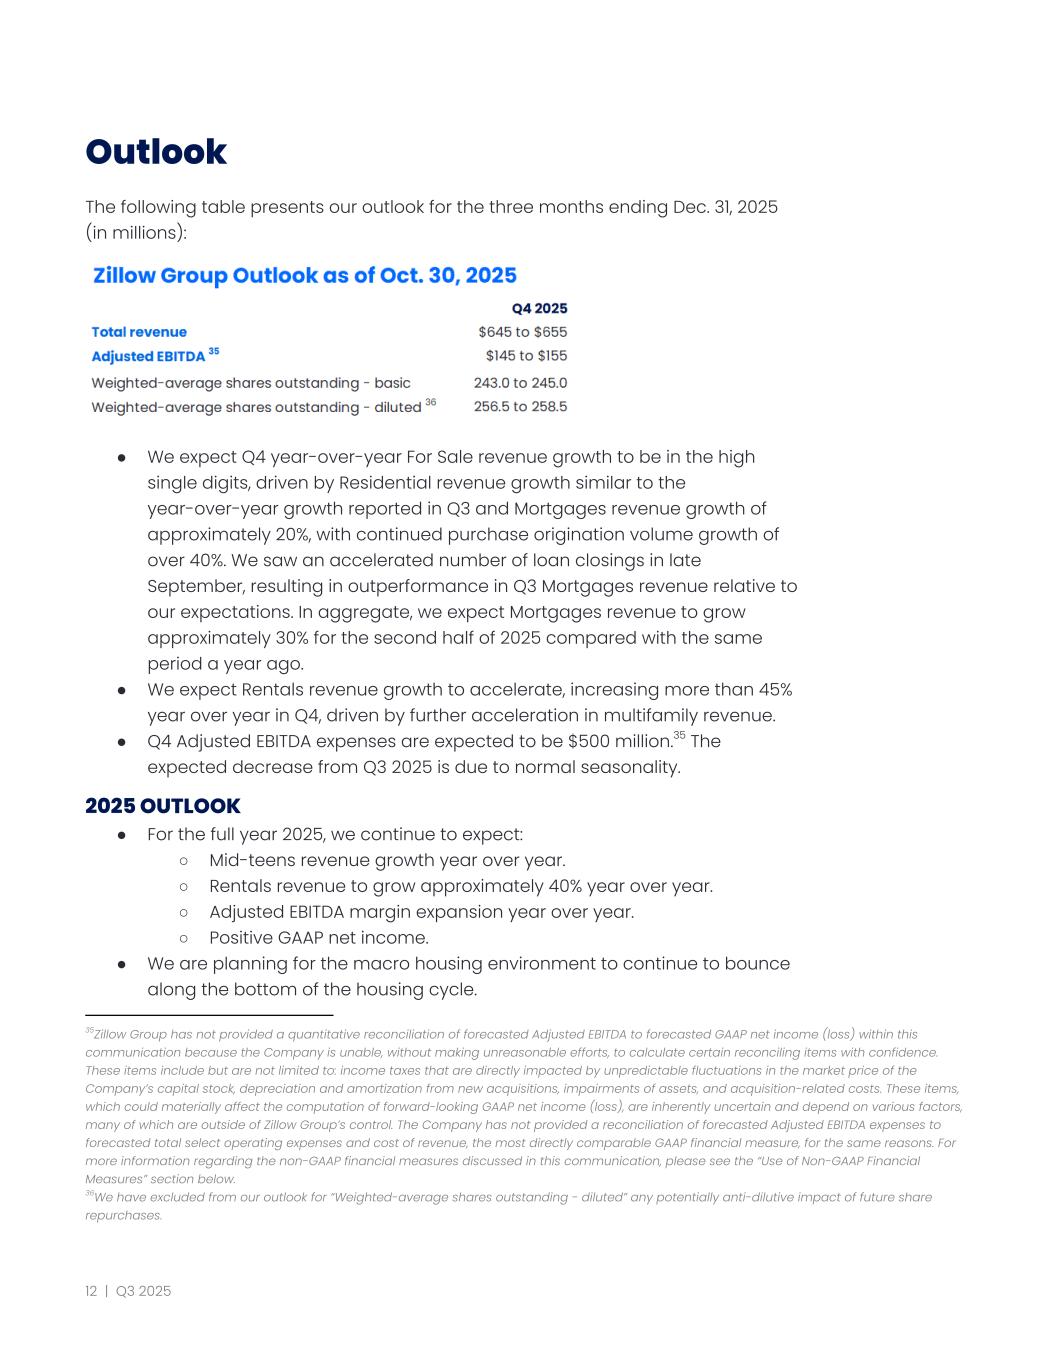
Outlook The following table presents our outlook for the three months ending Dec. 31, 2025 (in millions): 3536 ● We expect Q4 year-over-year For Sale revenue growth to be in the high single digits, driven by Residential revenue growth similar to the year-over-year growth reported in Q3 and Mortgages revenue growth of approximately 20%, with continued purchase origination volume growth of over 40%. We saw an accelerated number of loan closings in late September, resulting in outperformance in Q3 Mortgages revenue relative to our expectations. In aggregate, we expect Mortgages revenue to grow approximately 30% for the second half of 2025 compared with the same period a year ago. ● We expect Rentals revenue growth to accelerate, increasing more than 45% year over year in Q4, driven by further acceleration in multifamily revenue. ● Q4 Adjusted EBITDA expenses are expected to be $500 million.35 The expected decrease from Q3 2025 is due to normal seasonality. 2025 OUTLOOK ● For the full year 2025, we continue to expect: ○ Mid-teens revenue growth year over year. ○ Rentals revenue to grow approximately 40% year over year. ○ Adjusted EBITDA margin expansion year over year. ○ Positive GAAP net income. ● We are planning for the macro housing environment to continue to bounce along the bottom of the housing cycle. 36We have excluded from our outlook for “Weighted-average shares outstanding - diluted” any potentially anti-dilutive impact of future share repurchases. 35Zillow Group has not provided a quantitative reconciliation of forecasted Adjusted EBITDA to forecasted GAAP net income (loss) within this communication because the Company is unable, without making unreasonable efforts, to calculate certain reconciling items with confidence. These items include but are not limited to: income taxes that are directly impacted by unpredictable fluctuations in the market price of the Company’s capital stock, depreciation and amortization from new acquisitions, impairments of assets, and acquisition-related costs. These items, which could materially affect the computation of forward-looking GAAP net income (loss), are inherently uncertain and depend on various factors, many of which are outside of Zillow Group’s control. The Company has not provided a reconciliation of forecasted Adjusted EBITDA expenses to forecasted total select operating expenses and cost of revenue, the most directly comparable GAAP financial measure, for the same reasons. For more information regarding the non-GAAP financial measures discussed in this communication, please see the “Use of Non-GAAP Financial Measures” section below. 12 | Q3 2025
Forward-Looking Statements This communication contains forward-looking statements within the meaning of Section 27A of the Securities Act of 1933 and Section 21E of the Securities Exchange Act of 1934 that involve risks and uncertainties, including, without limitation, statements regarding our future targets and opportunities; the future growth, performance and operation of our business; our business strategies and ability to translate such strategies into financial performance; and the health of, and our impact on, the residential real estate industry. Statements containing words such as “may,” “believe,” “anticipate,” “expect,” “intend,” “plan,” “project,” “predict,” “will,” “projections,” “continue,” “estimate,” “outlook,” “opportunity,” “guidance,” “would,” “could,” “strive,” “path,” “positioned,” “on track,” “target,” “goal,” or similar expressions constitute forward-looking statements. Forward-looking statements are made based on assumptions as of October 30, 2025, and although we believe the expectations reflected in the forward- looking statements are reasonable, we cannot guarantee these results. Differences in Zillow Group’s actual results from those described in these forward-looking statements may result from actions taken by Zillow Group as well as from risks and uncertainties beyond Zillow Group’s control. Factors that may contribute to such differences include, but are not limited to: the health and stability of the economy and United States residential real estate industry, including changes in inflationary conditions, interest rates, housing availability and affordability, labor shortages and supply chain issues; our ability to manage advertising, product inventory and pricing, and to maintain relationships with our real estate partners; our ability to establish or maintain relationships with listing and data providers, which affects traffic to our mobile applications and websites; or changes to our rights to use or timely access listing data, or to the quality or quantity of such listing data; our ability to comply with current and future rules and requirements promulgated by the National Association of REALTORS®, multiple listing services, or other real estate industry groups or governing bodies, or decisions to repeal, amend, or not enforce such rules and requirements; our ability to navigate industry changes, including as a result of past, pending or future lawsuits, settlements or government investigations, which may include lawsuits, settlements or investigations in which we are not a named party; uncertainties related to policy changes, enforcement priorities, or government shutdowns at the federal and state levels; our ability to continue to innovate and compete to attract customers and real estate partners; our ability to effectively invest resources to pursue new strategies, develop new products and services and expand existing products and services into new markets; our ability to operate and grow Zillow Home Loans’ mortgage operations, including the ability to obtain or maintain sufficient financing to fund the origination of mortgages, meet customers’ financing needs with product offerings, continue to grow origination operations and resell originated mortgages on the secondary market; the duration and impact of natural disasters, climate change, geopolitical events, and other catastrophic events (including public health crises) on our ability to operate, demand for our products or services, or general economic conditions; our targets and disclosures related to environmental, social and governance matters; our ability to maintain adequate security controls or technology systems, or those of third parties on which we rely, to protect data integrity and the information and privacy of our customers and other third parties; our ability to navigate any significant disruption in service on our mobile applications or websites or in our network; the impact of past, pending or future litigation and other disputes or enforcement actions, which may include lawsuits or investigations to which we are not a party; our ability to attract, engage, and retain a highly skilled workforce; mergers, acquisitions, investments, strategic partnerships, capital-raising activities, or other corporate transactions or commitments by us or our competitors; our ability to continue relying on third-party services to support critical functions of our business; our ability to protect and continue using our intellectual property and prevent others from copying, infringing upon, or developing similar intellectual property, including as a result of generative artificial intelligence; our ability to comply with domestic and international laws, regulations, rules, contractual obligations, policies and other obligations, or to obtain or maintain required licenses to support our business and operations; our ability to pay our debt or to raise additional capital or refinance our indebtedness on acceptable terms, or at all; actual or anticipated fluctuations in quarterly and annual results of operations and financial position; actual or perceived inaccuracies in the assumptions, estimates and internal or third-party data that we use to calculate business, performance and operating metrics; and volatility of our Class A common stock and Class C capital stock prices. The foregoing list of risks and uncertainties is illustrative but not exhaustive. For more information about potential factors that could affect Zillow Group’s business and financial results, please review the “Risk 13 | Q3 2025
Factors” described in Zillow Group’s publicly available filings with the United States Securities and Exchange Commission (“SEC”). Except as may be required by law, Zillow Group does not intend and undertakes no duty to update this information to reflect future events or circumstances. No Incorporation by Reference This communication includes website addresses and references to additional materials found on those websites, including Zillow Group’s websites. These websites and materials are not incorporated by reference herein or in our other filings with the SEC. Use of Estimates and Statistical Data This communication includes estimates and other statistical data made by independent third parties and by Zillow Group relating to the housing market, the mortgage-rate environment, connections, conversion, engagement, growth, rental listings and other data about Zillow Group’s audience and performance and the residential real estate industry and purchase loan origination industry. These data involve a number of assumptions and limitations, which may significantly impair their accuracy, and you are cautioned not to give undue weight to such estimates. Projections, assumptions and estimates of future performance are necessarily subject to a high degree of uncertainty and risk. Use of Operating Metrics Zillow Group reviews a number of operating metrics to evaluate its business, measure performance, identify trends, formulate business plans, and make strategic decisions. This communication includes total transaction value and For Sale revenue per total transaction value. Zillow Group uses these operating metrics on a periodic basis to evaluate and provide investors with insight into the performance of Zillow Group’s transaction-based product and service offerings. For Sale Revenue per Total Transaction Value Zillow Group calculates “For Sale revenue per Total Transaction Value” as total Residential and Mortgages revenue, or For Sale revenue, for the relevant period divided by the aggregate Total Transaction Value for the same period. Total Transaction Value is calculated as the number of existing residential homes sold multiplied by the average sales price of existing residential homes sold during the relevant period according to industry data collected and estimated by Zillow, as published monthly on our site. For Sale revenue and Total Transaction Value have historically been affected by seasonal fluctuations in the residential real estate market. We generally expect For Sale revenue to peak during the three months ending June 30 or September 30. As such, we measure performance and present our For Sale revenue per Total Transaction Value on a trailing twelve-month basis to account for seasonality. Use of Non-GAAP Financial Measures To provide investors with additional information regarding our financial results, this communication includes references to Adjusted EBITDA, Adjusted EBITDA margin, Adjusted EBITDA expenses, and Adjusted free cash flow, all of which are non-GAAP financial measures not calculated or presented in accordance with U.S. generally accepted accounting principles (“GAAP”). We have provided a reconciliation below of each non-GAAP financial measure to the most directly comparable GAAP financial measure. Adjusted EBITDA, Adjusted EBITDA margin and Adjusted EBITDA expenses These non-GAAP measures are key metrics used by our management and board of directors to measure operating performance and trends and to prepare and approve our annual budget. In particular, we believe the exclusion of certain expenses in calculating these measures facilitates operating performance comparisons on a period-to-period basis. Our use of these non-GAAP financial measures has limitations as an analytical tool, and you should not consider these measures in isolation or as a substitute for analysis of our results as reported under GAAP. Some of these limitations include, but are not limited to, the fact that such non-GAAP measures: • Do not reflect changes in, or cash requirements for, our working capital needs; • Do not consider the potentially dilutive impact of share-based compensation; 14 | Q3 2025
• Although depreciation and amortization are non-cash charges, the assets being depreciated and amortized may have to be replaced in the future, and these non-GAAP measures do not reflect cash capital expenditure requirements for such replacements or for new capital expenditures or contractual commitments; • Do not reflect impairment costs; • Do not reflect acquisition-related costs; • Do not reflect loss on extinguishment of debt; • Do not reflect interest expense or other income, net; • Do not reflect income taxes; and • May be calculated differently by other companies, including companies in our own industry, from the way we do, limiting their usefulness as comparative measures. Because of these limitations, you should consider these measures alongside other financial performance measures, including various cash-flow metrics, net income (loss), and our other GAAP results. Adjusted Free Cash Flow We define Adjusted free cash flow as net cash provided by operating activities adjusted for purchases of property and equipment, purchases of intangible assets, net borrowings (repayments) on repurchase agreements and the initial payment in connection with the Redfin rentals partnership. Borrowings (repayments) on repurchase agreements are used to fund Zillow Home Loans mortgage loan originations, and we consider them part of our ongoing liquidity management. The initial payment in connection with the Redfin rentals partnership was considered an unusual and nonrecurring cash flow, and we exclude it from our calculation as we believe it impacts the ability to evaluate the liquidity of our business operations on a period-to-period basis. We have included Adjusted free cash flow in this communication as it is a key metric used by our management to evaluate the effectiveness of our business strategies and execution and our ability to consistently generate cash from our core operations on a period-to-period basis. Our use of Adjusted free cash flow has limitations as an analytical tool and you should not consider this measure in isolation or as a substitute for analysis of our results as reported under GAAP. Adjusted free cash flow does not represent the residual cash flow available for discretionary expenditures. Other companies, including companies in our own industry, may calculate Adjusted free cash flow differently from the way we do, limiting its usefulness as a comparative measure. 15 | Q3 2025
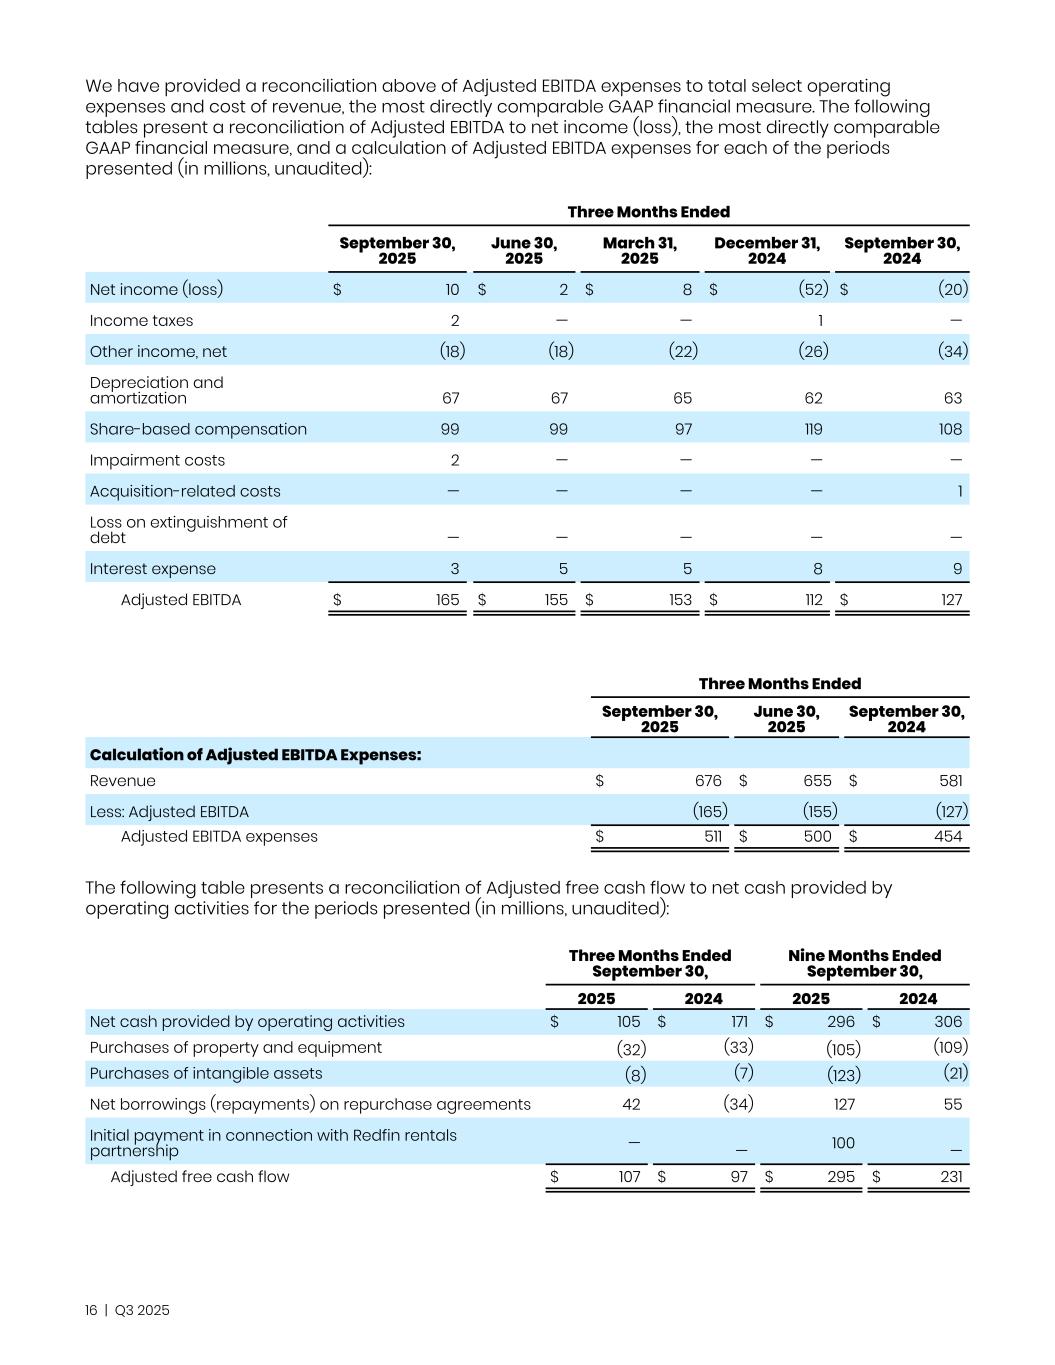
We have provided a reconciliation above of Adjusted EBITDA expenses to total select operating expenses and cost of revenue, the most directly comparable GAAP financial measure. The following tables present a reconciliation of Adjusted EBITDA to net income (loss), the most directly comparable GAAP financial measure, and a calculation of Adjusted EBITDA expenses for each of the periods presented (in millions, unaudited): Three Months Ended September 30, 2025 June 30, 2025 March 31, 2025 December 31, 2024 September 30, 2024 Net income (loss) $ 10 $ 2 $ 8 $ (52) $ (20) Income taxes 2 — — 1 — Other income, net (18) (18) (22) (26) (34) Depreciation and amortization 67 67 65 62 63 Share-based compensation 99 99 97 119 108 Impairment costs 2 — — — — Acquisition-related costs — — — — 1 Loss on extinguishment of debt — — — — — Interest expense 3 5 5 8 9 Adjusted EBITDA $ 165 $ 155 $ 153 $ 112 $ 127 Three Months Ended September 30, 2025 June 30, 2025 September 30, 2024 Calculation of Adjusted EBITDA Expenses: Revenue $ 676 $ 655 $ 581 Less: Adjusted EBITDA (165) (155) (127) Adjusted EBITDA expenses $ 511 $ 500 $ 454 The following table presents a reconciliation of Adjusted free cash flow to net cash provided by operating activities for the periods presented (in millions, unaudited): Three Months Ended September 30, Nine Months Ended September 30, 2025 2024 2025 2024 Net cash provided by operating activities $ 105 $ 171 $ 296 $ 306 Purchases of property and equipment (32) (33) (105) (109) Purchases of intangible assets (8) (7) (123) (21) Net borrowings (repayments) on repurchase agreements 42 (34) 127 55 Initial payment in connection with Redfin rentals partnership — — 100 — Adjusted free cash flow $ 107 $ 97 $ 295 $ 231 16 | Q3 2025
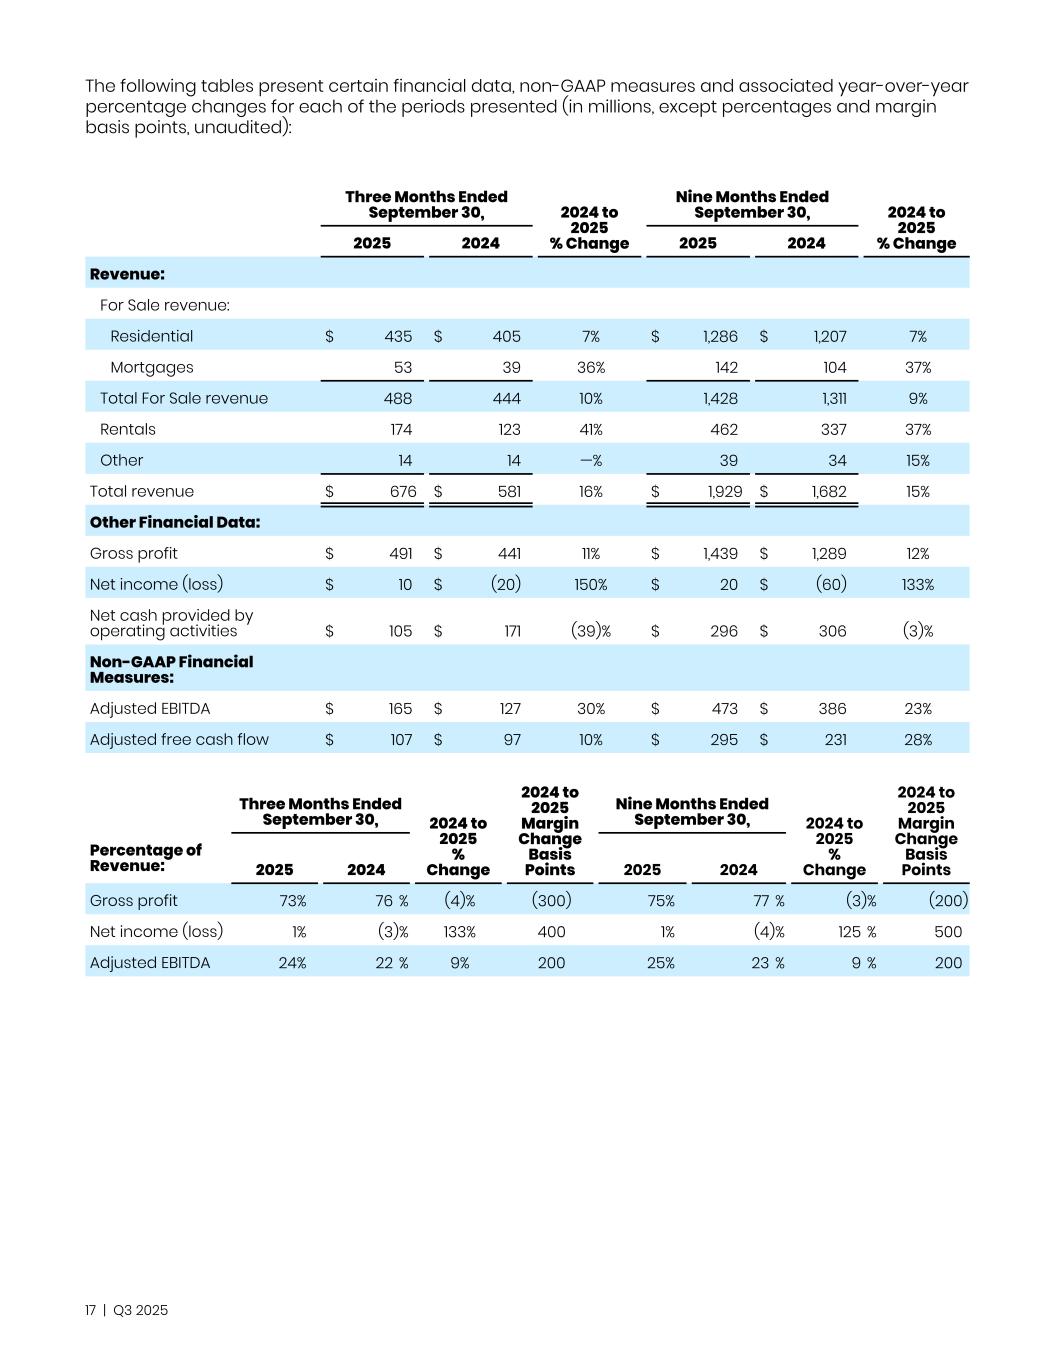
The following tables present certain financial data, non-GAAP measures and associated year-over-year percentage changes for each of the periods presented (in millions, except percentages and margin basis points, unaudited): Three Months Ended September 30, 2024 to 2025 % Change Nine Months Ended September 30, 2024 to 2025 % Change2025 2024 2025 2024 Revenue: For Sale revenue: Residential $ 435 $ 405 7% $ 1,286 $ 1,207 7% Mortgages 53 39 36% 142 104 37% Total For Sale revenue 488 444 10% 1,428 1,311 9% Rentals 174 123 41% 462 337 37% Other 14 14 —% 39 34 15% Total revenue $ 676 $ 581 16% $ 1,929 $ 1,682 15% Other Financial Data: Gross profit $ 491 $ 441 11% $ 1,439 $ 1,289 12% Net income (loss) $ 10 $ (20) 150% $ 20 $ (60) 133% Net cash provided by operating activities $ 105 $ 171 (39)% $ 296 $ 306 (3)% Non-GAAP Financial Measures: Adjusted EBITDA $ 165 $ 127 30% $ 473 $ 386 23% Adjusted free cash flow $ 107 $ 97 10% $ 295 $ 231 28% Three Months Ended September 30, 2024 to 2025 % Change 2024 to 2025 Margin Change Basis Points Nine Months Ended September 30, 2024 to 2025 % Change 2024 to 2025 Margin Change Basis Points Percentage of Revenue: 2025 2024 2025 2024 Gross profit 73 % 76 % (4)% (300) 75 % 77 % (3) % (200) Net income (loss) 1 % (3) % 133% 400 1 % (4) % 125 % 500 Adjusted EBITDA 24 % 22 % 9% 200 25 % 23 % 9 % 200 17 | Q3 2025

https://investors.zillowgroup.com