2 0 2 5 ANNUAL REPORT We are our vision Our Year in Focus Fiscal 2025 was a year of record growth, coast-to-coast market leadership, and expanding international sales, strengthening our foundation. To be a respected global cannabis leader, rooted in Canada and trusted by consumers, partners, and investors. Innovation-led, consumer-focused, and building a scalable cannabis platform for long-term value. This Annual Report summarizes Organigram’s strategy, operational progress, and financial performance for the fiscal year ended September 30, 2025.
2 0 2 5 Letter from the Executive Chair Fiscal 2025 was a defining year for us. We strengthened our leadership position in Canada, achieving the #1 market share nationally¹ , while also delivering record financial results and significantly accelerating the growth of our international business. We achieved record gross and net revenue, record adjusted gross profit and adjusted EBITDA, and the highest international sales in our history. These outcomes reflect disciplined execution of a long-term strategy focused on scale, operational excellence, and expanding participation in regulated cannabis markets globally. Looking forward, Organigram is well positioned to build on this momentum. The Company has established a strong platform to pursue growth opportunities across international markets while maintaining leadership in Canada. While the outcome of recent regulatory developments in the United States remain uncertain, Organigram remains prepared to adapt its strategy as frameworks evolve in order to responsibly leverage global growth opportunities. The Board would like to thank Beena Goldenberg for her leadership as Chief Executive Officer during a period of significant change in the cannabis industry. Under her stewardship, Organigram successfully navigated a dynamic and evolving market, strengthened its leadership position, and built a durable foundation for long-term growth. As we look ahead, we are excited to welcome James Yamanaka as our new CEO. With his global strategy experience and growth-oriented perspective, we believe Organigram is well positioned to enter its next chapter—expanding its reach in international regulated markets while creating enduring value for shareholders. Peter Amirault Executive Chair ¹ Multiple Sources (Hifyre, Weedcrawler, provincial boards, internal modelling) as of September 30, 2025.

EDIBLES & BEVERAGES Organigram’s edibles and beverages portfolio combines bold, flavour-forward gummies with rapidly scaling infused drinks. Our SHRED’ems and Monjour branded gummies strengthen our leadership position and are amongst Canada’s top-selling edibles, while Collective Project’s premium cannabis beverages highlight our expansion into the fast-growing cannabinoid drink category in Canada and key international markets.
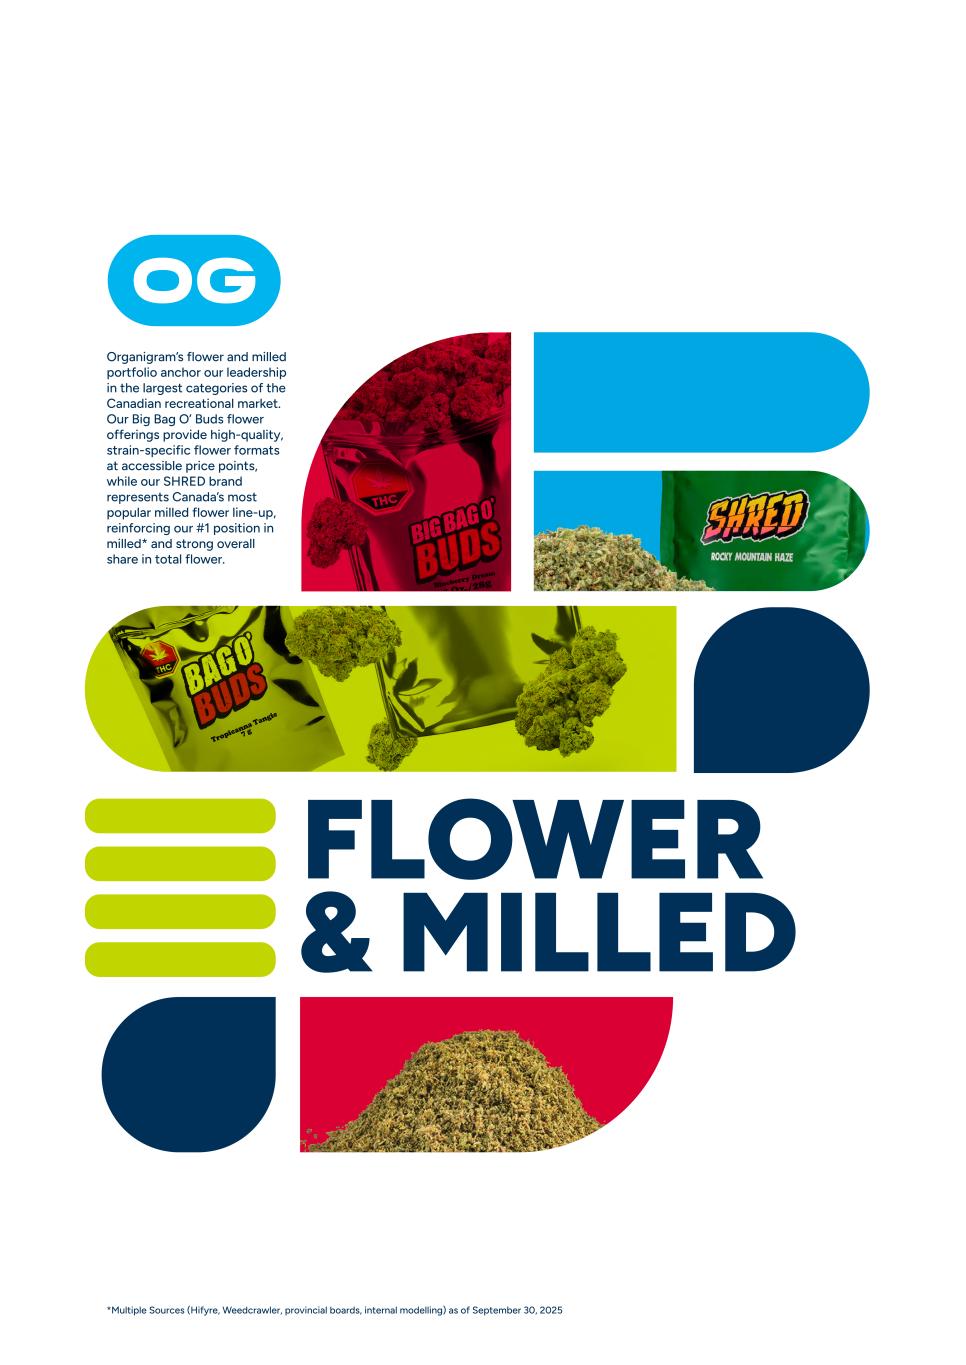
FLOWER & MILLED Organigram’s flower and milled portfolio anchor our leadership in the largest categories of the Canadian recreational market. Our Big Bag O’ Buds flower offerings provide high-quality, strain-specific flower formats at accessible price points, while our SHRED brand represents Canada’s most popular milled flower line-up, reinforcing our #1 position in milled* and strong overall share in total flower. *Multiple Sources (Hifyre, Weedcrawler, provincial boards, internal modelling) as of September 30, 2025
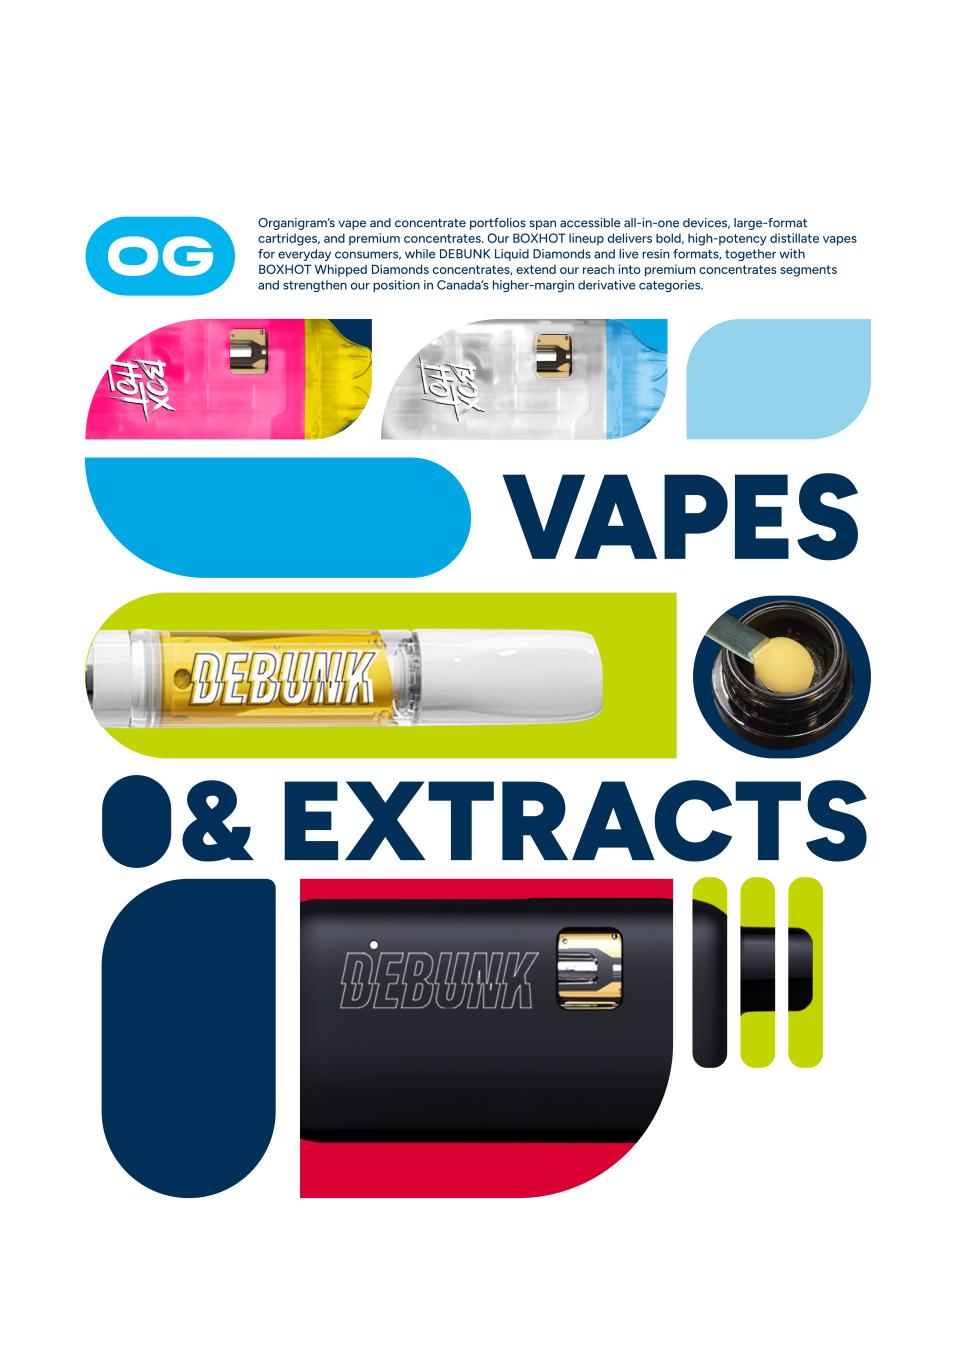
VAPES & EXTRACTS Organigram’s vape and concentrate portfolios span accessible all-in-one devices, large-format cartridges, and premium concentrates. Our BOXHOT lineup delivers bold, high-potency distillate vapes for everyday consumers, while DEBUNK Liquid Diamonds and live resin formats, together with BOXHOT Whipped Diamonds concentrates, extend our reach into premium concentrates segments and strengthen our position in Canada’s higher-margin derivative categories.
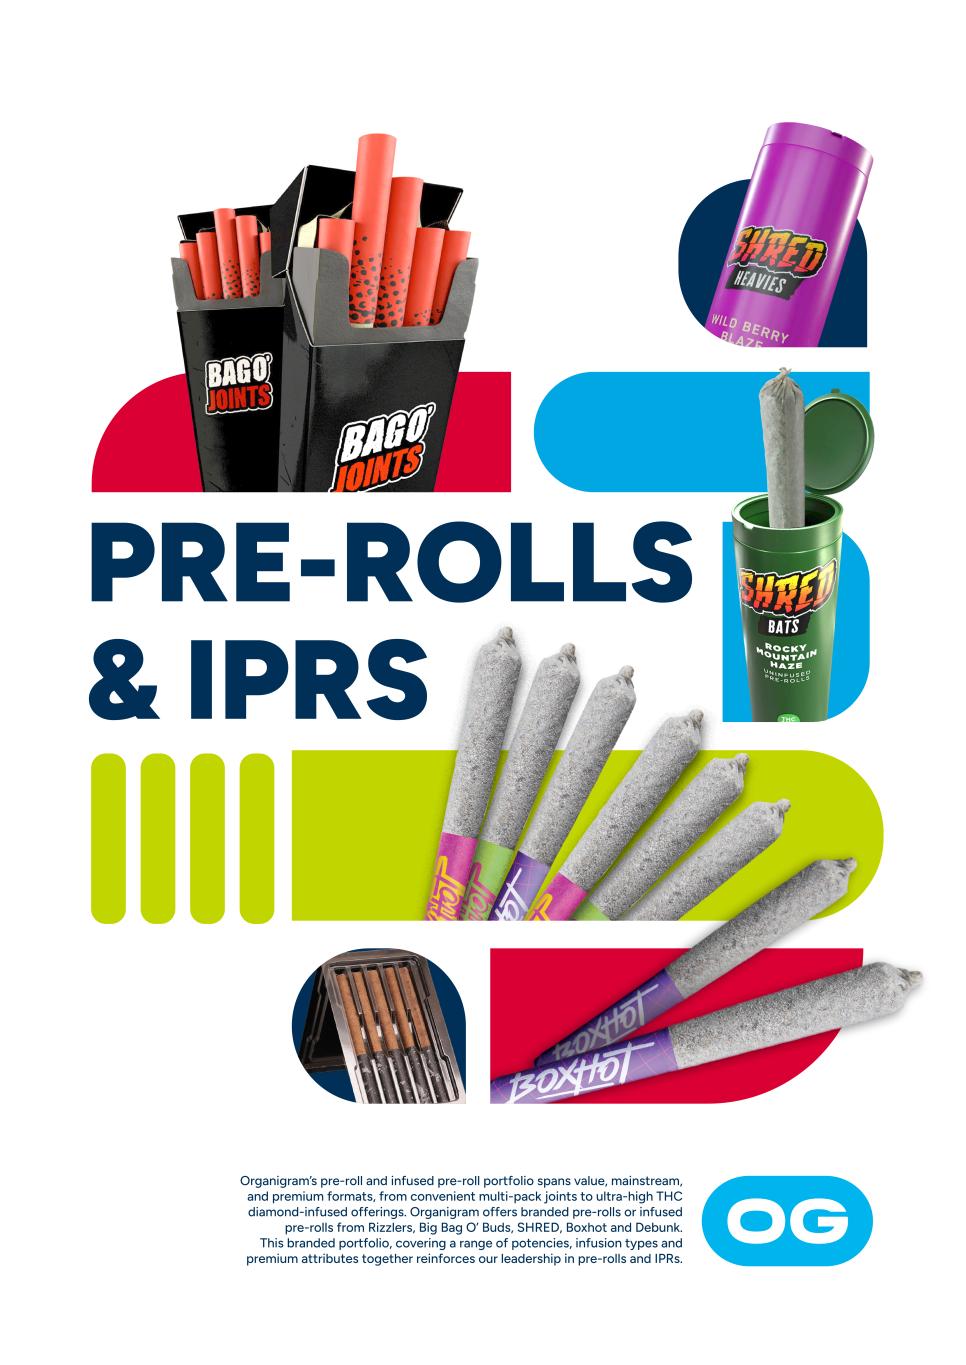
PRE-ROLLS & IPRS Organigram’s pre-roll and infused pre-roll portfolio spans value, mainstream, and premium formats, from convenient multi-pack joints to ultra-high THC diamond-infused offerings. Organigram offers branded pre-rolls or infused pre-rolls from Rizzlers, Big Bag O’ Buds, SHRED, Boxhot and Debunk. This branded portfolio, covering a range of potencies, infusion types and premium attributes together reinforces our leadership in pre-rolls and IPRs.
INTRODUCTION This Management’s Discussion and Analysis dated December 16, 2025 (this “MD&A”), should be read in conjunction with the audited annual consolidated financial statements (the “Financial Statements”) of Organigram Global Inc. (together with its subsidiaries, the “Company”, "Organigram", "we", "us", or "our") for the years ended September 30, 2025 ("Fiscal 2025") and September 30, 2024 ("Fiscal 2024"), including the accompanying notes thereto. References to "Q4 Fiscal 2025" are to the three- month period beginning July 1, 2025, and ending September 30, 2025. References to "Q4 Fiscal 2024" are to the three-month period beginning July 1, 2024, and ending September 30, 2024. Financial data in this MD&A is based on the Financial Statements of the Company, and has been prepared in accordance with International Financial Reporting Standards ("IFRS") as issued by the International Accounting Standards Board (“IASB”), unless otherwise stated. All financial information in this MD&A is expressed in thousands of Canadian dollars (“$”), except for share and per share calculations, references to $ millions and $ billions, per gram (“g”) or kilogram (“kg”) of dried flower and per milliliter (“mL”) or liter (“L”) of cannabis extracts calculations. Refer to the cautionary statements regarding forward-looking information and non-IFRS measures found at the end of this MD&A. BUSINESS OVERVIEW NATURE OF THE COMPANY’S BUSINESS Organigram is a licensed cannabis cultivator and producer of consumer packaged goods containing cannabis. The Company manufactures and distributes cannabis products to wholesale and retail channels in Canada, exports to international jurisdictions, and distributes hemp-derived tetrahydrocannabinol ("THC") beverages and edibles in the U.S. Organigram operates five facilities across Canada: Moncton Campus (Indoor Cultivation and Manufacturing) The Moncton Campus is home to our 500,000+ square foot state-of-the-art flagship facility, which features three-tiered, strain- specific grow rooms with the ability to control critical environmental factors specific to the needs of each strain. The facility's capabilities include extraction, cannabinoid testing, and automated production and packaging lines. We have invested in cost- effective seed-based production, which contributes to efficiency through faster room turns, lower plant care, and higher yields. Winnipeg Facility (Ingestible Products Manufacturing) The Winnipeg Facility is a purpose-built, highly automated 51,000 square-foot ingestibles manufacturing facility capable of producing up to 48 million gummies annually. The Company's newly commissioned beverage manufacturing line is capable of producing up to 2.6 million beverage cans annually, but is not yet operational. The facility also contains specialized manufacturing equipment for the Company's FASTTM (Fast Acting Soluble Technology) nanoemulsion technology ("FASTTM") used in some of its ingestible products. Lac-Supérieur Facility (Hash/Concentrates and Premium Flower) The Lac-Supérieur Facility is a greenhouse facility which provides a strategic footprint in Quebec, spans 33,000 square feet of space, and is equipped to produce 2,400 kg of premium flower and over 2 million packaged units of hash annually. Aylmer Facility (Extraction and Manufacturing) The Aylmer Facility houses advanced extraction and manufacturing capabilities, including hydrocarbon and CO2 extraction refinement, formulation, post-processing of minor cannabinoids, and infused and regular pre-roll production. London Facility (Warehousing and Distribution) The London Facility is a centralized warehouse distribution hub in Ontario, Canada's most populous province. The facility supports growing demand for Organigram's products, optimizes fulfillment, and reduces the cost and complexity of shipping products from the Moncton Campus to Central and Western Canada. As of the end of Fiscal 2025, Organigram held the #1 market share position in the Canadian recreational cannabis market1. STRATEGY Our corporate strategy is to leverage our strengths in innovation, consumer focus, efficiency, and market expansion to profitably drive global growth and shareholder value. 1. Innovation We are committed to maintaining a culture of innovation and have a track record of launching differentiated products that quickly capture market share. MANAGEMENT’S DISCUSSION AND ANALYSIS | FOR THE YEAR ENDED SEPTEMBER 30, 2025 AND 2024 1 1 Multiple Sources (Hifyre, Weedcrawler, provincial boards, internal modelling) as of September 30, 2025.
Organigram maintains a Product Development Collaboration (“PDC”) with a wholly-owned subsidiary of British American Tobacco p.l.c. ("BAT"), its largest institutional shareholder and a leading multi-category consumer goods company, to develop next- generation cannabis products. Through the PDC we established a Centre of Excellence (“CoE”) at the Moncton Campus where we are licensed to conduct research on cannabis. Under Organigram's PDC agreement with BAT dated March 10, 2021 (the "PDC Agreement"), Organigram holds a worldwide, royalty-free, sub-licensable, perpetual license to all intellectual property developed through the PDC, exclusive in Canada and non-exclusive internationally. Both companies contribute scientists, researchers, and product developers to the CoE, which is jointly governed by a steering committee composed of equal representation from Organigram and BAT. 2. Consumer Focus We maintain a diversified brand and product portfolio with competitive pricing that is aligned with evolving consumer preferences which we monitor through consumer and market research and social engagement. 3. Efficiency We continue to reduce costs and improve scalability and margins through ongoing investments in facility automation, cultivation practices (including seed-based cultivation), and logistics efficiency, particularly at our London Facility. 4. Market Expansion Organigram is committed to expanding its market presence through both organic growth and strategic diversification. Our key initiatives have included: • Domestic expansion: acquisitions of cannabis cultivation and production facilities across Ontario, Québec, and Manitoba, enabling participation in all major Canadian product categories. • International exports: shipments of bulk cannabis to Germany, Australia, and the United Kingdom (UK), strengthening Organigram’s position as a reliable global supplier. • Strategic partnership with BAT: completion of a $124.6 million follow-on equity investment by BAT (the "Follow-on BAT Investment"), and creation of the Jupiter Pool to fund international growth opportunities, with initial investments in Steady State LLC (d/b/a Open Book Extracts ("OBX") (U.S.) and Sanity Group GmbH ("Sanity Group") (Germany). • U.S. market entry: expansion into evolving hemp-derived THC beverages and edibles through the acquisition of Collective Project Limited ("CPL") and launch of "happly", a lifestyle edibles brand focused on consumer mood states and functional ingredients.2 OUTLOOK Market Size & Industry Trends The Company maintains a positive outlook on the cannabis industry, both in Canada and internationally. Recreational cannabis sales in Canada are expected to total $6.4 billion in calendar 20283. The Canadian market is stabilizing after years of oversupply and pricing pressure. Stabilization has been driven by consolidation, reduced capacity, and the absorption of supply by increased international demand. To address continued increases in international demand, several licensed producers ("LPs") have announced capacity expansion projects. Consumer preferences continue to evolve with sustained demand for high-THC, value-format flower, and rapid growth in the infused pre-roll category. Regulatory scrutiny has intensified, particularly around inflated THC potency labeling, prompting initiatives by the Ontario Cannabis Store, Health Canada, and the Cannabis Standards Alliance of Canada to establish consistent testing and enforcement. In November 2025, the U.S. enacted the Continuing Appropriations and Extensions Act of 2026 (H.R. 5371), which includes a provision (section 781) to amend the definition of hemp in the 2018 Farm Bill to effectively eliminate hemp-derived THC products, although the change does not become effective for 365 days from the date of enactment. Organigram’s U.S. offerings would be directly impacted by this change in law; additionally, Organigram has investments in hemp seed and hemp ingredient manufacturers in the U.S. that may be impacted by this legislation. Efforts are underway to repeal, replace, or delay this amendment, but whether any change will occur is uncertain. If current federal legislation is not amended or reversed, Organigram may have to sell, wind-down or otherwise restructure its hemp THC product related activities in the U.S. by November 2026. LPs are increasingly seeking growth in international markets to increase their revenues and margins, and to solidify Canada's strong reputation abroad for producing high quality cannabis products. Certain international markets comprise the majority of demand for Canada's cannabis exports. Of the 37,223 kilograms of dried cannabis flower imported into Germany in the first three months of calendar 2025, about half, 16,057 kg, were from Canada and MANAGEMENT’S DISCUSSION AND ANALYSIS | FOR THE YEAR ENDED SEPTEMBER 30, 2025 AND 2024 2 2 See amendments to definition of hemp in the 2018 Farm Bill as described in greater detail in the "Outlook" section of this MD&A. 3 October, 2025 data from BDS Analytics, Inc. (BDSA).
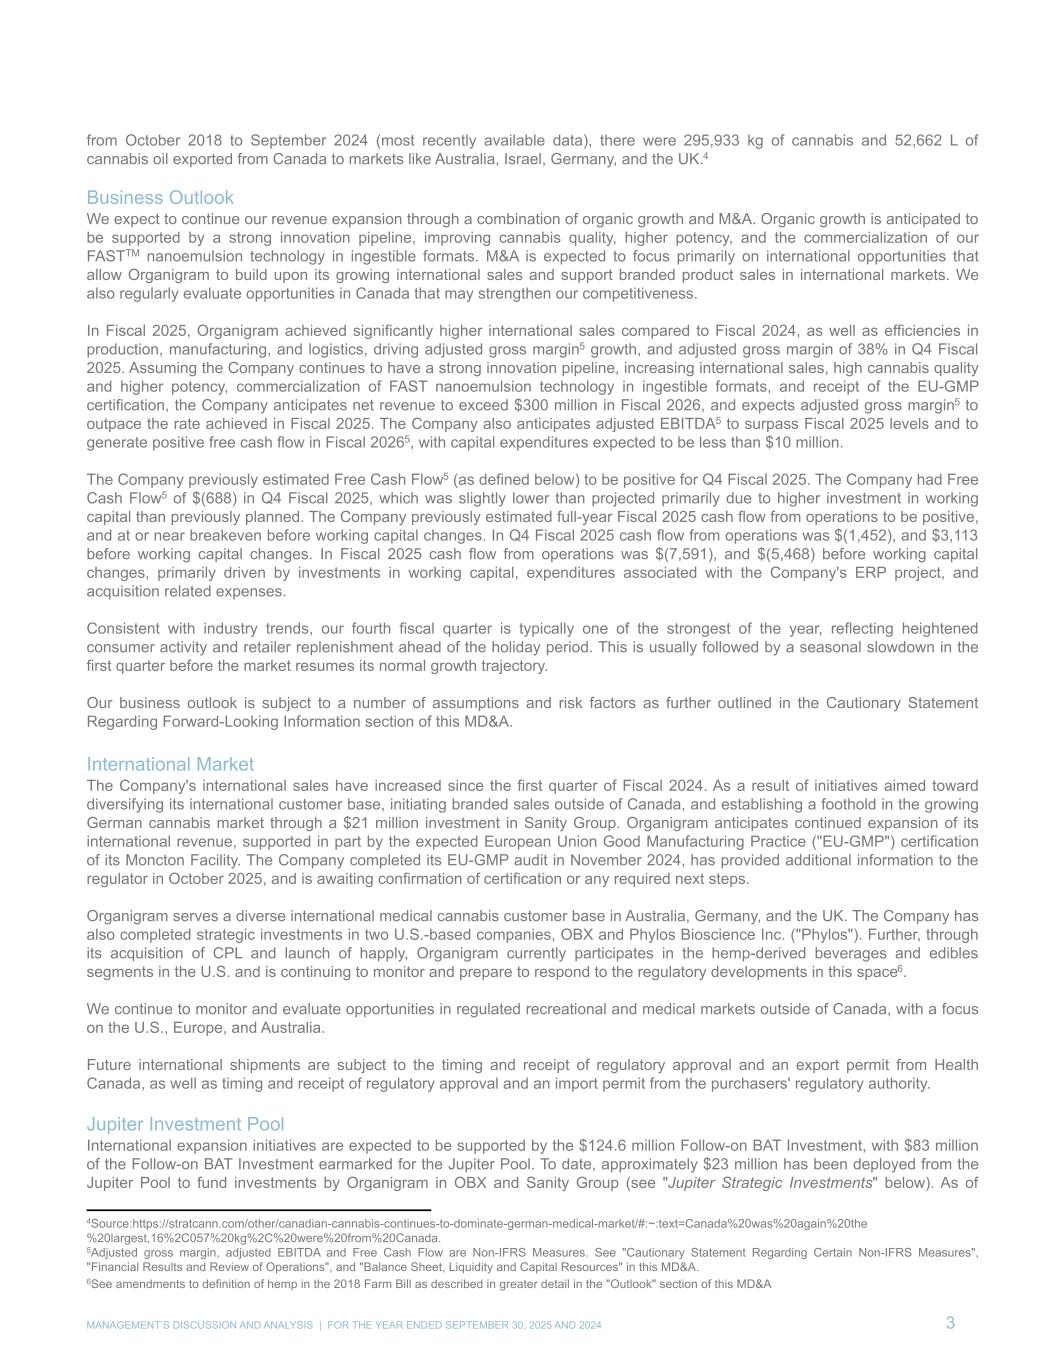
from October 2018 to September 2024 (most recently available data), there were 295,933 kg of cannabis and 52,662 L of cannabis oil exported from Canada to markets like Australia, Israel, Germany, and the UK.4 Business Outlook We expect to continue our revenue expansion through a combination of organic growth and M&A. Organic growth is anticipated to be supported by a strong innovation pipeline, improving cannabis quality, higher potency, and the commercialization of our FASTTM nanoemulsion technology in ingestible formats. M&A is expected to focus primarily on international opportunities that allow Organigram to build upon its growing international sales and support branded product sales in international markets. We also regularly evaluate opportunities in Canada that may strengthen our competitiveness. In Fiscal 2025, Organigram achieved significantly higher international sales compared to Fiscal 2024, as well as efficiencies in production, manufacturing, and logistics, driving adjusted gross margin5 growth, and adjusted gross margin of 38% in Q4 Fiscal 2025. Assuming the Company continues to have a strong innovation pipeline, increasing international sales, high cannabis quality and higher potency, commercialization of FAST nanoemulsion technology in ingestible formats, and receipt of the EU-GMP certification, the Company anticipates net revenue to exceed $300 million in Fiscal 2026, and expects adjusted gross margin5 to outpace the rate achieved in Fiscal 2025. The Company also anticipates adjusted EBITDA5 to surpass Fiscal 2025 levels and to generate positive free cash flow in Fiscal 20265, with capital expenditures expected to be less than $10 million. The Company previously estimated Free Cash Flow5 (as defined below) to be positive for Q4 Fiscal 2025. The Company had Free Cash Flow5 of $(688) in Q4 Fiscal 2025, which was slightly lower than projected primarily due to higher investment in working capital than previously planned. The Company previously estimated full-year Fiscal 2025 cash flow from operations to be positive, and at or near breakeven before working capital changes. In Q4 Fiscal 2025 cash flow from operations was $(1,452), and $3,113 before working capital changes. In Fiscal 2025 cash flow from operations was $(7,591), and $(5,468) before working capital changes, primarily driven by investments in working capital, expenditures associated with the Company's ERP project, and acquisition related expenses. Consistent with industry trends, our fourth fiscal quarter is typically one of the strongest of the year, reflecting heightened consumer activity and retailer replenishment ahead of the holiday period. This is usually followed by a seasonal slowdown in the first quarter before the market resumes its normal growth trajectory. Our business outlook is subject to a number of assumptions and risk factors as further outlined in the Cautionary Statement Regarding Forward-Looking Information section of this MD&A. International Market The Company's international sales have increased since the first quarter of Fiscal 2024. As a result of initiatives aimed toward diversifying its international customer base, initiating branded sales outside of Canada, and establishing a foothold in the growing German cannabis market through a $21 million investment in Sanity Group. Organigram anticipates continued expansion of its international revenue, supported in part by the expected European Union Good Manufacturing Practice ("EU-GMP") certification of its Moncton Facility. The Company completed its EU-GMP audit in November 2024, has provided additional information to the regulator in October 2025, and is awaiting confirmation of certification or any required next steps. Organigram serves a diverse international medical cannabis customer base in Australia, Germany, and the UK. The Company has also completed strategic investments in two U.S.-based companies, OBX and Phylos Bioscience Inc. ("Phylos"). Further, through its acquisition of CPL and launch of happly, Organigram currently participates in the hemp-derived beverages and edibles segments in the U.S. and is continuing to monitor and prepare to respond to the regulatory developments in this space6. We continue to monitor and evaluate opportunities in regulated recreational and medical markets outside of Canada, with a focus on the U.S., Europe, and Australia. Future international shipments are subject to the timing and receipt of regulatory approval and an export permit from Health Canada, as well as timing and receipt of regulatory approval and an import permit from the purchasers' regulatory authority. Jupiter Investment Pool International expansion initiatives are expected to be supported by the $124.6 million Follow-on BAT Investment, with $83 million of the Follow-on BAT Investment earmarked for the Jupiter Pool. To date, approximately $23 million has been deployed from the Jupiter Pool to fund investments by Organigram in OBX and Sanity Group (see "Jupiter Strategic Investments" below). As of MANAGEMENT’S DISCUSSION AND ANALYSIS | FOR THE YEAR ENDED SEPTEMBER 30, 2025 AND 2024 3 4Source:https://stratcann.com/other/canadian-cannabis-continues-to-dominate-german-medical-market/#:~:text=Canada%20was%20again%20the %20largest,16%2C057%20kg%2C%20were%20from%20Canada. 5Adjusted gross margin, adjusted EBITDA and Free Cash Flow are Non-IFRS Measures. See "Cautionary Statement Regarding Certain Non-IFRS Measures", "Financial Results and Review of Operations", and "Balance Sheet, Liquidity and Capital Resources" in this MD&A. 6See amendments to definition of hemp in the 2018 Farm Bill as described in greater detail in the "Outlook" section of this MD&A
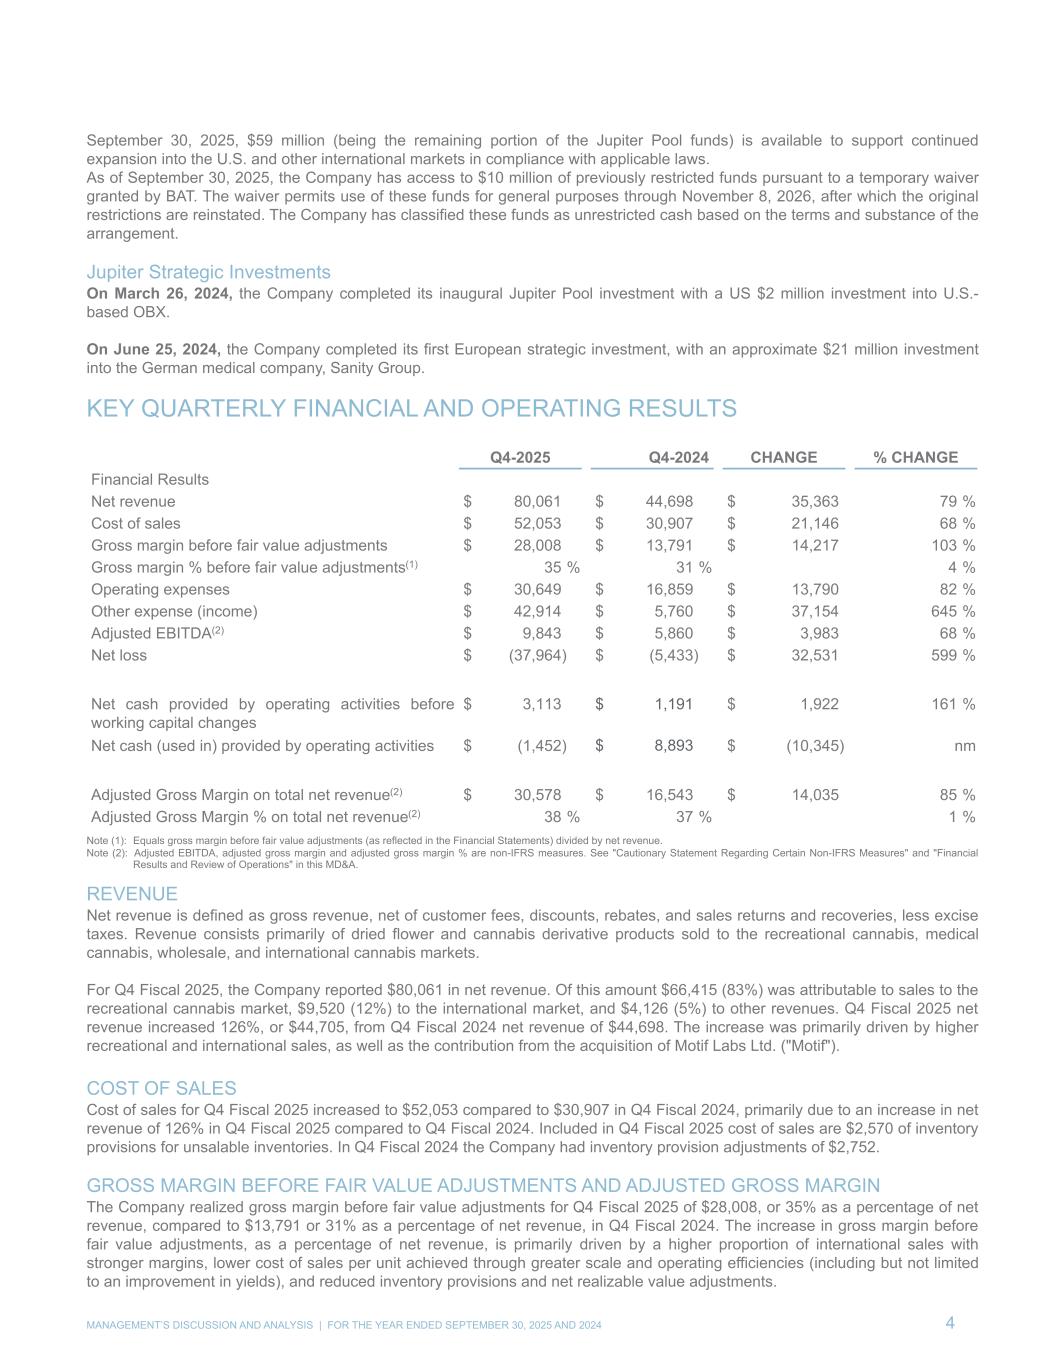
September 30, 2025, $59 million (being the remaining portion of the Jupiter Pool funds) is available to support continued expansion into the U.S. and other international markets in compliance with applicable laws. As of September 30, 2025, the Company has access to $10 million of previously restricted funds pursuant to a temporary waiver granted by BAT. The waiver permits use of these funds for general purposes through November 8, 2026, after which the original restrictions are reinstated. The Company has classified these funds as unrestricted cash based on the terms and substance of the arrangement. Jupiter Strategic Investments On March 26, 2024, the Company completed its inaugural Jupiter Pool investment with a US $2 million investment into U.S.- based OBX. On June 25, 2024, the Company completed its first European strategic investment, with an approximate $21 million investment into the German medical company, Sanity Group. KEY QUARTERLY FINANCIAL AND OPERATING RESULTS Q4-2025 Q4-2024 CHANGE % CHANGE Financial Results Net revenue $ 80,061 $ 44,698 $ 35,363 79 % Cost of sales $ 52,053 $ 30,907 $ 21,146 68 % Gross margin before fair value adjustments $ 28,008 $ 13,791 $ 14,217 103 % Gross margin % before fair value adjustments(1) 35 % 31 % 4 % Operating expenses $ 30,649 $ 16,859 $ 13,790 82 % Other expense (income) $ 42,914 $ 5,760 $ 37,154 645 % Adjusted EBITDA(2) $ 9,843 $ 5,860 $ 3,983 68 % Net loss $ (37,964) $ (5,433) $ 32,531 599 % Net cash provided by operating activities before working capital changes $ 3,113 $ 1,191 $ 1,922 161 % Net cash (used in) provided by operating activities $ (1,452) $ 8,893 $ (10,345) nm Adjusted Gross Margin on total net revenue(2) $ 30,578 $ 16,543 $ 14,035 85 % Adjusted Gross Margin % on total net revenue(2) 38 % 37 % 1 % Note (1): Equals gross margin before fair value adjustments (as reflected in the Financial Statements) divided by net revenue. Note (2): Adjusted EBITDA, adjusted gross margin and adjusted gross margin % are non-IFRS measures. See "Cautionary Statement Regarding Certain Non-IFRS Measures" and "Financial Results and Review of Operations" in this MD&A. REVENUE Net revenue is defined as gross revenue, net of customer fees, discounts, rebates, and sales returns and recoveries, less excise taxes. Revenue consists primarily of dried flower and cannabis derivative products sold to the recreational cannabis, medical cannabis, wholesale, and international cannabis markets. For Q4 Fiscal 2025, the Company reported $80,061 in net revenue. Of this amount $66,415 (83%) was attributable to sales to the recreational cannabis market, $9,520 (12%) to the international market, and $4,126 (5%) to other revenues. Q4 Fiscal 2025 net revenue increased 126%, or $44,705, from Q4 Fiscal 2024 net revenue of $44,698. The increase was primarily driven by higher recreational and international sales, as well as the contribution from the acquisition of Motif Labs Ltd. ("Motif"). COST OF SALES Cost of sales for Q4 Fiscal 2025 increased to $52,053 compared to $30,907 in Q4 Fiscal 2024, primarily due to an increase in net revenue of 126% in Q4 Fiscal 2025 compared to Q4 Fiscal 2024. Included in Q4 Fiscal 2025 cost of sales are $2,570 of inventory provisions for unsalable inventories. In Q4 Fiscal 2024 the Company had inventory provision adjustments of $2,752. GROSS MARGIN BEFORE FAIR VALUE ADJUSTMENTS AND ADJUSTED GROSS MARGIN The Company realized gross margin before fair value adjustments for Q4 Fiscal 2025 of $28,008, or 35% as a percentage of net revenue, compared to $13,791 or 31% as a percentage of net revenue, in Q4 Fiscal 2024. The increase in gross margin before fair value adjustments, as a percentage of net revenue, is primarily driven by a higher proportion of international sales with stronger margins, lower cost of sales per unit achieved through greater scale and operating efficiencies (including but not limited to an improvement in yields), and reduced inventory provisions and net realizable value adjustments. MANAGEMENT’S DISCUSSION AND ANALYSIS | FOR THE YEAR ENDED SEPTEMBER 30, 2025 AND 2024 4
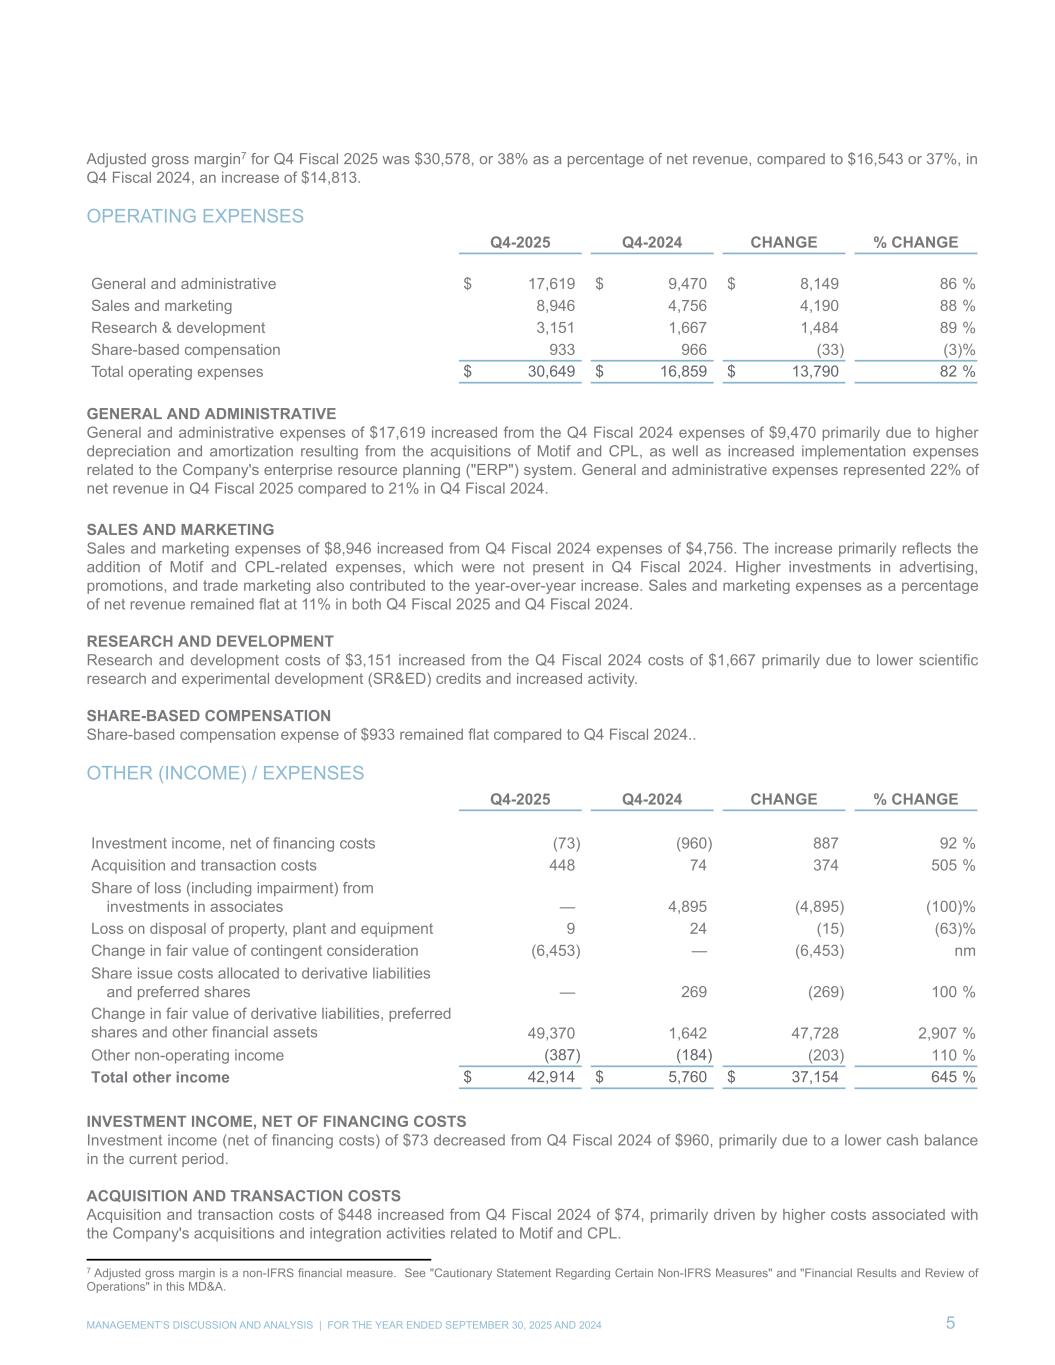
Adjusted gross margin7 for Q4 Fiscal 2025 was $30,578, or 38% as a percentage of net revenue, compared to $16,543 or 37%, in Q4 Fiscal 2024, an increase of $14,813. OPERATING EXPENSES Q4-2025 Q4-2024 CHANGE % CHANGE General and administrative $ 17,619 $ 9,470 $ 8,149 86 % Sales and marketing 8,946 4,756 4,190 88 % Research & development 3,151 1,667 1,484 89 % Share-based compensation 933 966 (33) (3) % Total operating expenses $ 30,649 $ 16,859 $ 13,790 82 % GENERAL AND ADMINISTRATIVE General and administrative expenses of $17,619 increased from the Q4 Fiscal 2024 expenses of $9,470 primarily due to higher depreciation and amortization resulting from the acquisitions of Motif and CPL, as well as increased implementation expenses related to the Company's enterprise resource planning ("ERP") system. General and administrative expenses represented 22% of net revenue in Q4 Fiscal 2025 compared to 21% in Q4 Fiscal 2024. SALES AND MARKETING Sales and marketing expenses of $8,946 increased from Q4 Fiscal 2024 expenses of $4,756. The increase primarily reflects the addition of Motif and CPL-related expenses, which were not present in Q4 Fiscal 2024. Higher investments in advertising, promotions, and trade marketing also contributed to the year-over-year increase. Sales and marketing expenses as a percentage of net revenue remained flat at 11% in both Q4 Fiscal 2025 and Q4 Fiscal 2024. RESEARCH AND DEVELOPMENT Research and development costs of $3,151 increased from the Q4 Fiscal 2024 costs of $1,667 primarily due to lower scientific research and experimental development (SR&ED) credits and increased activity. SHARE-BASED COMPENSATION Share-based compensation expense of $933 remained flat compared to Q4 Fiscal 2024.. OTHER (INCOME) / EXPENSES Q4-2025 Q4-2024 CHANGE % CHANGE Investment income, net of financing costs (73) (960) 887 92 % Acquisition and transaction costs 448 74 374 505 % Share of loss (including impairment) from investments in associates — 4,895 (4,895) (100) % Loss on disposal of property, plant and equipment 9 24 (15) (63) % Change in fair value of contingent consideration (6,453) — (6,453) nm Share issue costs allocated to derivative liabilities and preferred shares — 269 (269) 100 % Change in fair value of derivative liabilities, preferred shares and other financial assets 49,370 1,642 47,728 2,907 % Other non-operating income (387) (184) (203) 110 % Total other income $ 42,914 $ 5,760 $ 37,154 645 % INVESTMENT INCOME, NET OF FINANCING COSTS Investment income (net of financing costs) of $73 decreased from Q4 Fiscal 2024 of $960, primarily due to a lower cash balance in the current period. ACQUISITION AND TRANSACTION COSTS Acquisition and transaction costs of $448 increased from Q4 Fiscal 2024 of $74, primarily driven by higher costs associated with the Company's acquisitions and integration activities related to Motif and CPL. MANAGEMENT’S DISCUSSION AND ANALYSIS | FOR THE YEAR ENDED SEPTEMBER 30, 2025 AND 2024 5 7 Adjusted gross margin is a non-IFRS financial measure. See "Cautionary Statement Regarding Certain Non-IFRS Measures" and "Financial Results and Review of Operations" in this MD&A.
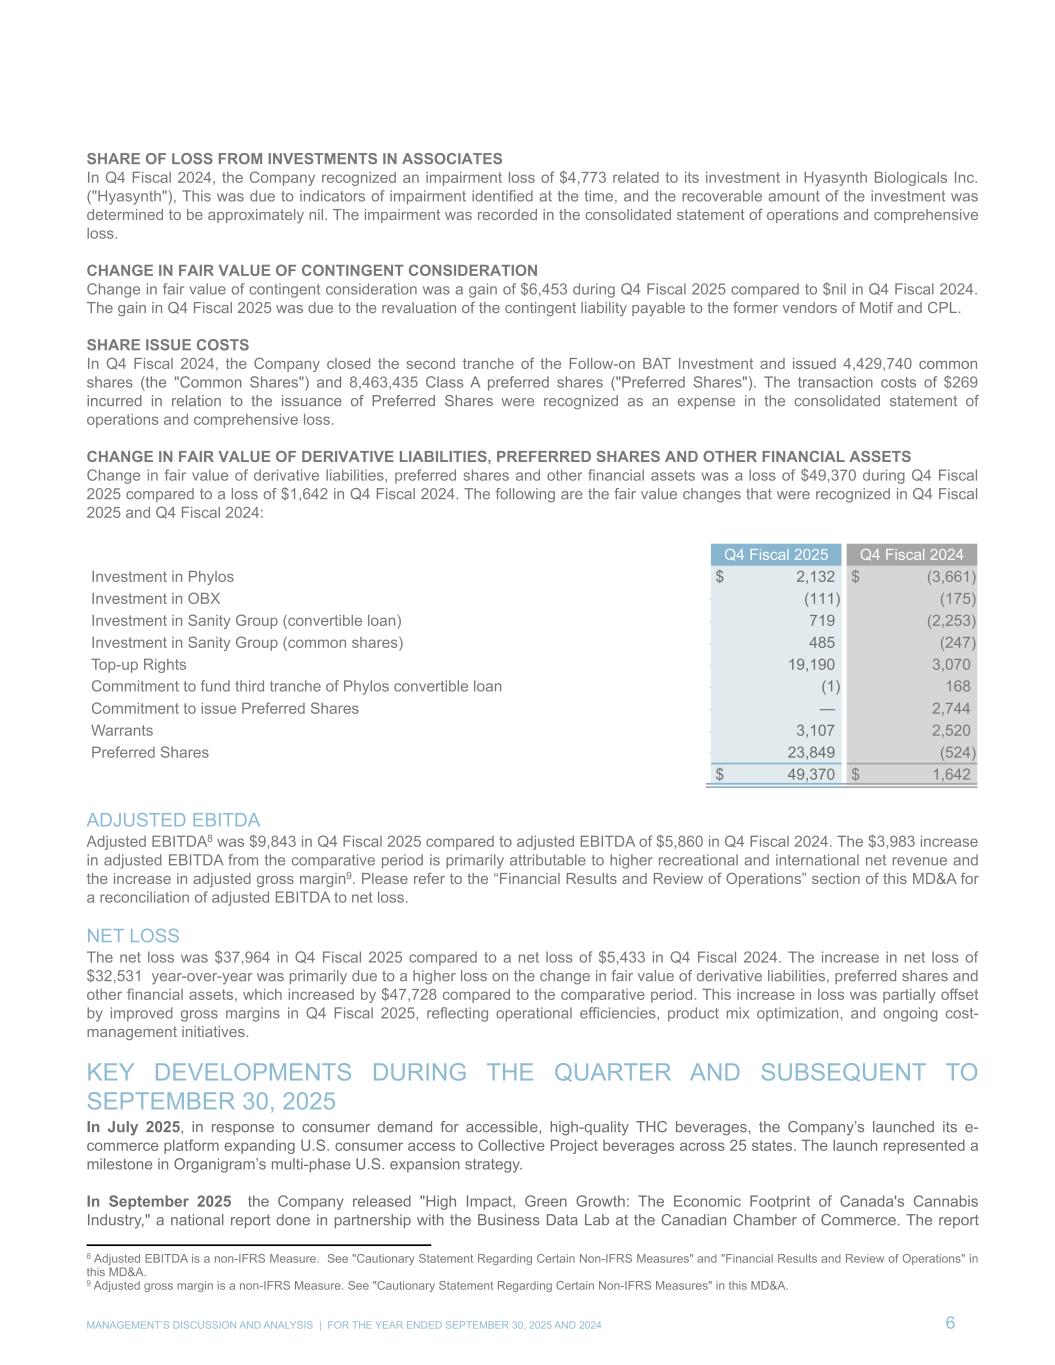
SHARE OF LOSS FROM INVESTMENTS IN ASSOCIATES In Q4 Fiscal 2024, the Company recognized an impairment loss of $4,773 related to its investment in Hyasynth Biologicals Inc. ("Hyasynth"), This was due to indicators of impairment identified at the time, and the recoverable amount of the investment was determined to be approximately nil. The impairment was recorded in the consolidated statement of operations and comprehensive loss. CHANGE IN FAIR VALUE OF CONTINGENT CONSIDERATION Change in fair value of contingent consideration was a gain of $6,453 during Q4 Fiscal 2025 compared to $nil in Q4 Fiscal 2024. The gain in Q4 Fiscal 2025 was due to the revaluation of the contingent liability payable to the former vendors of Motif and CPL. SHARE ISSUE COSTS In Q4 Fiscal 2024, the Company closed the second tranche of the Follow-on BAT Investment and issued 4,429,740 common shares (the "Common Shares") and 8,463,435 Class A preferred shares ("Preferred Shares"). The transaction costs of $269 incurred in relation to the issuance of Preferred Shares were recognized as an expense in the consolidated statement of operations and comprehensive loss. CHANGE IN FAIR VALUE OF DERIVATIVE LIABILITIES, PREFERRED SHARES AND OTHER FINANCIAL ASSETS Change in fair value of derivative liabilities, preferred shares and other financial assets was a loss of $49,370 during Q4 Fiscal 2025 compared to a loss of $1,642 in Q4 Fiscal 2024. The following are the fair value changes that were recognized in Q4 Fiscal 2025 and Q4 Fiscal 2024: 0 Q4 Fiscal 2025 0 Q4 Fiscal 2024 Investment in Phylos $ — $ 2,132 $ (3,661) Investment in OBX — (111) (175) Investment in Sanity Group (convertible loan) — 719 (2,253) Investment in Sanity Group (common shares) — 485 (247) Top-up Rights — 19,190 3,070 Commitment to fund third tranche of Phylos convertible loan — (1) 168 Commitment to issue Preferred Shares — — 2,744 Warrants — 3,107 2,520 Preferred Shares — 23,849 (524) $ — $ 49,370 $ 1,642 ADJUSTED EBITDA Adjusted EBITDA8 was $9,843 in Q4 Fiscal 2025 compared to adjusted EBITDA of $5,860 in Q4 Fiscal 2024. The $3,983 increase in adjusted EBITDA from the comparative period is primarily attributable to higher recreational and international net revenue and the increase in adjusted gross margin9. Please refer to the “Financial Results and Review of Operations” section of this MD&A for a reconciliation of adjusted EBITDA to net loss. NET LOSS The net loss was $37,964 in Q4 Fiscal 2025 compared to a net loss of $5,433 in Q4 Fiscal 2024. The increase in net loss of $32,531 year-over-year was primarily due to a higher loss on the change in fair value of derivative liabilities, preferred shares and other financial assets, which increased by $47,728 compared to the comparative period. This increase in loss was partially offset by improved gross margins in Q4 Fiscal 2025, reflecting operational efficiencies, product mix optimization, and ongoing cost- management initiatives. KEY DEVELOPMENTS DURING THE QUARTER AND SUBSEQUENT TO SEPTEMBER 30, 2025 In July 2025, in response to consumer demand for accessible, high-quality THC beverages, the Company’s launched its e- commerce platform expanding U.S. consumer access to Collective Project beverages across 25 states. The launch represented a milestone in Organigram’s multi-phase U.S. expansion strategy. In September 2025 the Company released "High Impact, Green Growth: The Economic Footprint of Canada's Cannabis Industry," a national report done in partnership with the Business Data Lab at the Canadian Chamber of Commerce. The report MANAGEMENT’S DISCUSSION AND ANALYSIS | FOR THE YEAR ENDED SEPTEMBER 30, 2025 AND 2024 6 8 Adjusted EBITDA is a non-IFRS Measure. See "Cautionary Statement Regarding Certain Non-IFRS Measures" and "Financial Results and Review of Operations" in this MD&A. 9 Adjusted gross margin is a non-IFRS Measure. See "Cautionary Statement Regarding Certain Non-IFRS Measures" in this MD&A.
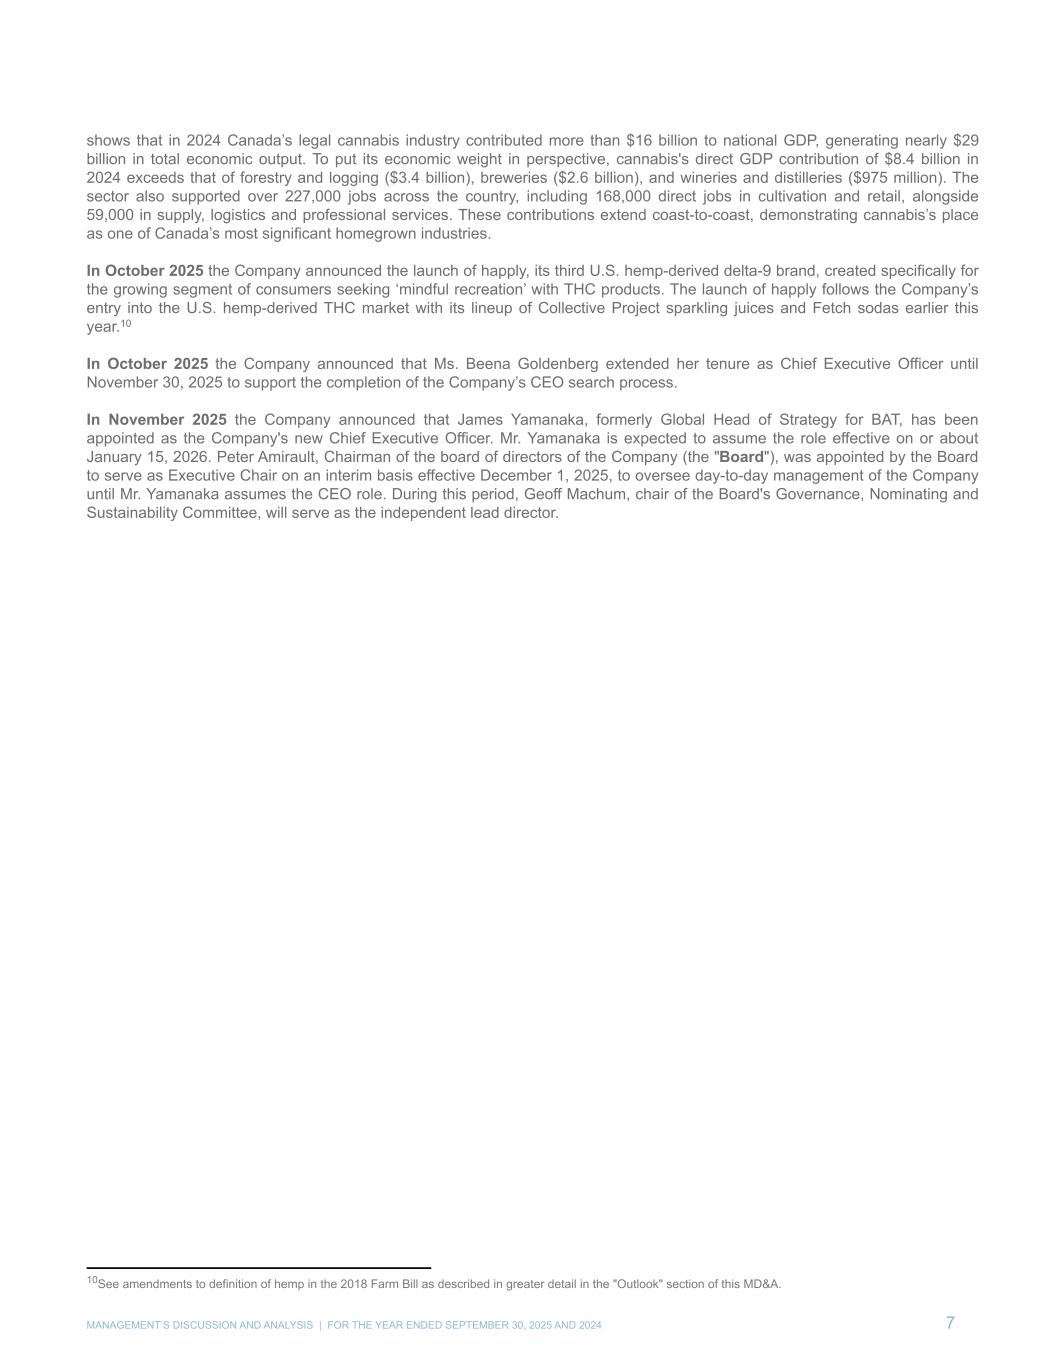
shows that in 2024 Canada’s legal cannabis industry contributed more than $16 billion to national GDP, generating nearly $29 billion in total economic output. To put its economic weight in perspective, cannabis's direct GDP contribution of $8.4 billion in 2024 exceeds that of forestry and logging ($3.4 billion), breweries ($2.6 billion), and wineries and distilleries ($975 million). The sector also supported over 227,000 jobs across the country, including 168,000 direct jobs in cultivation and retail, alongside 59,000 in supply, logistics and professional services. These contributions extend coast-to-coast, demonstrating cannabis’s place as one of Canada’s most significant homegrown industries. In October 2025 the Company announced the launch of happly, its third U.S. hemp-derived delta-9 brand, created specifically for the growing segment of consumers seeking ‘mindful recreation’ with THC products. The launch of happly follows the Company’s entry into the U.S. hemp-derived THC market with its lineup of Collective Project sparkling juices and Fetch sodas earlier this year.10 In October 2025 the Company announced that Ms. Beena Goldenberg extended her tenure as Chief Executive Officer until November 30, 2025 to support the completion of the Company’s CEO search process. In November 2025 the Company announced that James Yamanaka, formerly Global Head of Strategy for BAT, has been appointed as the Company's new Chief Executive Officer. Mr. Yamanaka is expected to assume the role effective on or about January 15, 2026. Peter Amirault, Chairman of the board of directors of the Company (the "Board"), was appointed by the Board to serve as Executive Chair on an interim basis effective December 1, 2025, to oversee day-to-day management of the Company until Mr. Yamanaka assumes the CEO role. During this period, Geoff Machum, chair of the Board's Governance, Nominating and Sustainability Committee, will serve as the independent lead director. MANAGEMENT’S DISCUSSION AND ANALYSIS | FOR THE YEAR ENDED SEPTEMBER 30, 2025 AND 2024 7 10See amendments to definition of hemp in the 2018 Farm Bill as described in greater detail in the "Outlook" section of this MD&A.
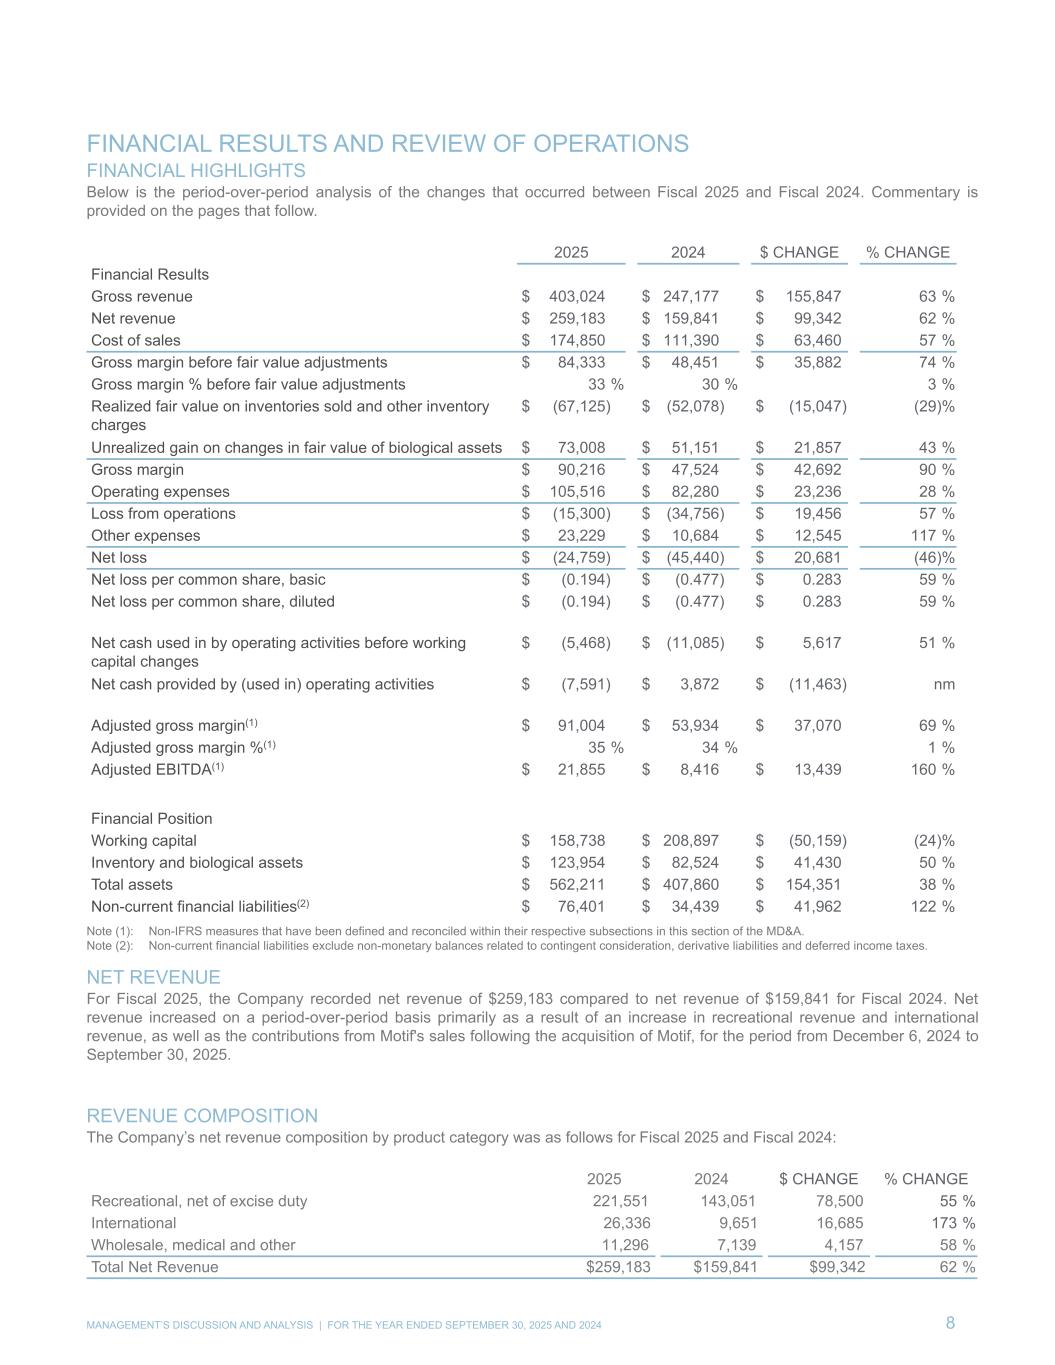
FINANCIAL RESULTS AND REVIEW OF OPERATIONS FINANCIAL HIGHLIGHTS Below is the period-over-period analysis of the changes that occurred between Fiscal 2025 and Fiscal 2024. Commentary is provided on the pages that follow. 2025 2024 $ CHANGE % CHANGE Financial Results Gross revenue $ 403,024 $ 247,177 $ 155,847 63 % Net revenue $ 259,183 $ 159,841 $ 99,342 62 % Cost of sales $ 174,850 $ 111,390 $ 63,460 57 % Gross margin before fair value adjustments $ 84,333 $ 48,451 $ 35,882 74 % Gross margin % before fair value adjustments 33 % 30 % 3 % Realized fair value on inventories sold and other inventory charges $ (67,125) $ (52,078) $ (15,047) (29) % Unrealized gain on changes in fair value of biological assets $ 73,008 $ 51,151 $ 21,857 43 % Gross margin $ 90,216 $ 47,524 $ 42,692 90 % Operating expenses $ 105,516 $ 82,280 $ 23,236 28 % Loss from operations $ (15,300) $ (34,756) $ 19,456 57 % Other expenses $ 23,229 $ 10,684 $ 12,545 117 % Net loss $ (24,759) $ (45,440) $ 20,681 (46) % Net loss per common share, basic $ (0.194) $ (0.477) $ 0.283 59 % Net loss per common share, diluted $ (0.194) $ (0.477) $ 0.283 59 % Net cash used in by operating activities before working capital changes $ (5,468) $ (11,085) $ 5,617 51 % Net cash provided by (used in) operating activities $ (7,591) $ 3,872 $ (11,463) nm Adjusted gross margin(1) $ 91,004 $ 53,934 $ 37,070 69 % Adjusted gross margin %(1) 35 % 34 % 1 % Adjusted EBITDA(1) $ 21,855 $ 8,416 $ 13,439 160 % Financial Position Working capital $ 158,738 $ 208,897 $ (50,159) (24) % Inventory and biological assets $ 123,954 $ 82,524 $ 41,430 50 % Total assets $ 562,211 $ 407,860 $ 154,351 38 % Non-current financial liabilities(2) $ 76,401 $ 34,439 $ 41,962 122 % Note (1): Non-IFRS measures that have been defined and reconciled within their respective subsections in this section of the MD&A. Note (2): Non-current financial liabilities exclude non-monetary balances related to contingent consideration, derivative liabilities and deferred income taxes. NET REVENUE For Fiscal 2025, the Company recorded net revenue of $259,183 compared to net revenue of $159,841 for Fiscal 2024. Net revenue increased on a period-over-period basis primarily as a result of an increase in recreational revenue and international revenue, as well as the contributions from Motif's sales following the acquisition of Motif, for the period from December 6, 2024 to September 30, 2025. REVENUE COMPOSITION The Company’s net revenue composition by product category was as follows for Fiscal 2025 and Fiscal 2024: 2025 2024 $ CHANGE % CHANGE Recreational, net of excise duty 221,551 143,051 78,500 55 % International 26,336 9,651 16,685 173 % Wholesale, medical and other 11,296 7,139 4,157 58 % Total Net Revenue $259,183 $159,841 $99,342 62 % MANAGEMENT’S DISCUSSION AND ANALYSIS | FOR THE YEAR ENDED SEPTEMBER 30, 2025 AND 2024 8
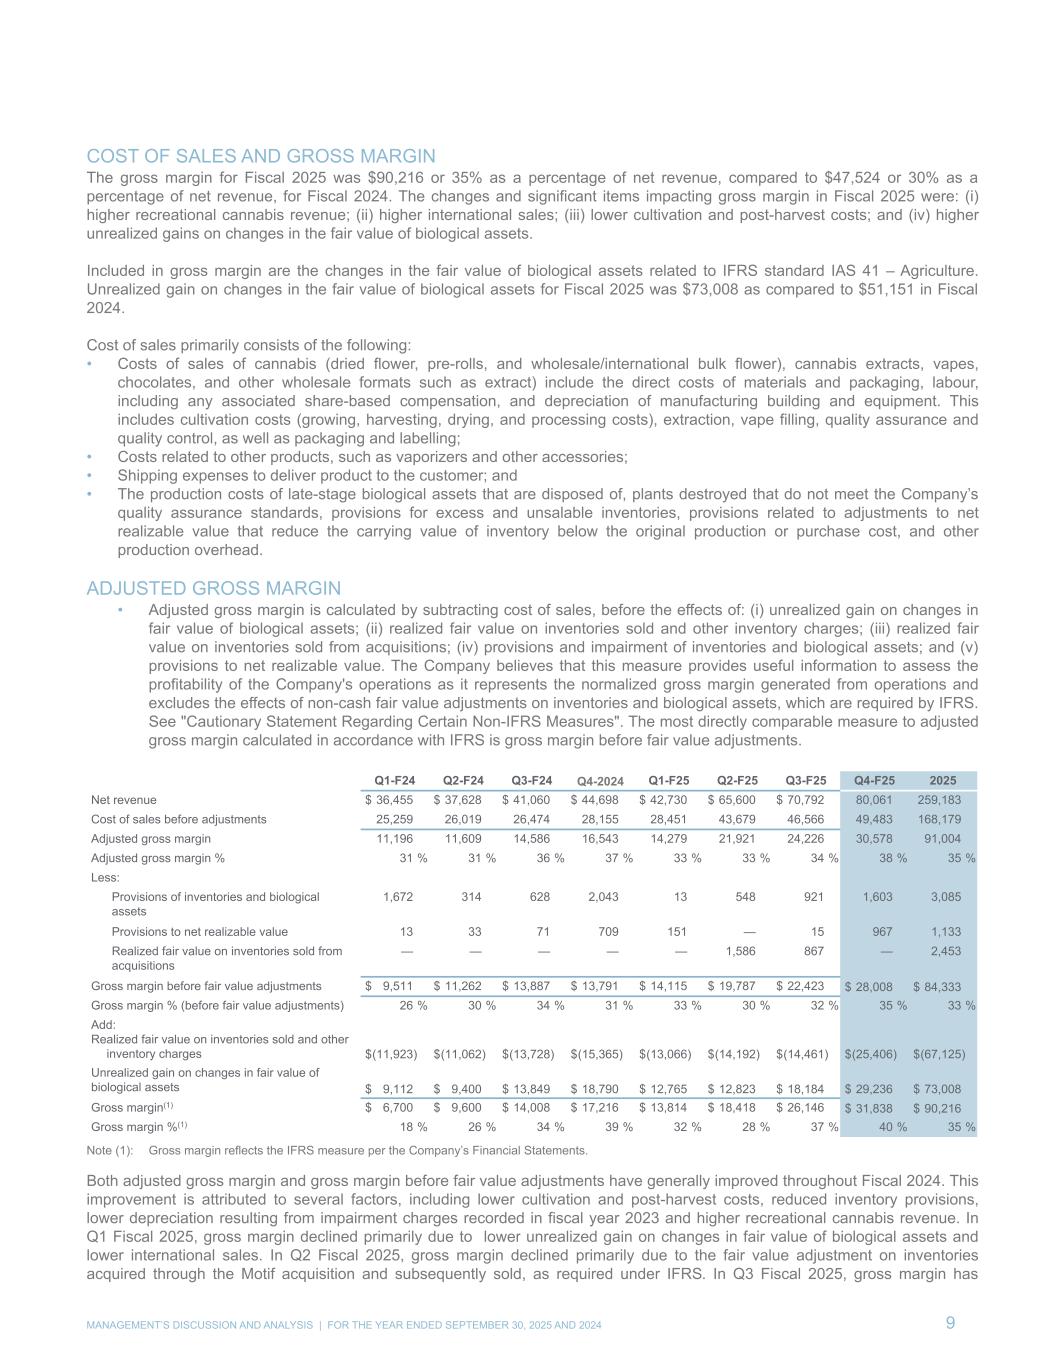
COST OF SALES AND GROSS MARGIN The gross margin for Fiscal 2025 was $90,216 or 35% as a percentage of net revenue, compared to $47,524 or 30% as a percentage of net revenue, for Fiscal 2024. The changes and significant items impacting gross margin in Fiscal 2025 were: (i) higher recreational cannabis revenue; (ii) higher international sales; (iii) lower cultivation and post-harvest costs; and (iv) higher unrealized gains on changes in the fair value of biological assets. Included in gross margin are the changes in the fair value of biological assets related to IFRS standard IAS 41 – Agriculture. Unrealized gain on changes in the fair value of biological assets for Fiscal 2025 was $73,008 as compared to $51,151 in Fiscal 2024. Cost of sales primarily consists of the following: • Costs of sales of cannabis (dried flower, pre-rolls, and wholesale/international bulk flower), cannabis extracts, vapes, chocolates, and other wholesale formats such as extract) include the direct costs of materials and packaging, labour, including any associated share-based compensation, and depreciation of manufacturing building and equipment. This includes cultivation costs (growing, harvesting, drying, and processing costs), extraction, vape filling, quality assurance and quality control, as well as packaging and labelling; • Costs related to other products, such as vaporizers and other accessories; • Shipping expenses to deliver product to the customer; and • The production costs of late-stage biological assets that are disposed of, plants destroyed that do not meet the Company’s quality assurance standards, provisions for excess and unsalable inventories, provisions related to adjustments to net realizable value that reduce the carrying value of inventory below the original production or purchase cost, and other production overhead. ADJUSTED GROSS MARGIN • Adjusted gross margin is calculated by subtracting cost of sales, before the effects of: (i) unrealized gain on changes in fair value of biological assets; (ii) realized fair value on inventories sold and other inventory charges; (iii) realized fair value on inventories sold from acquisitions; (iv) provisions and impairment of inventories and biological assets; and (v) provisions to net realizable value. The Company believes that this measure provides useful information to assess the profitability of the Company's operations as it represents the normalized gross margin generated from operations and excludes the effects of non-cash fair value adjustments on inventories and biological assets, which are required by IFRS. See "Cautionary Statement Regarding Certain Non-IFRS Measures". The most directly comparable measure to adjusted gross margin calculated in accordance with IFRS is gross margin before fair value adjustments. Q1-F24 Q2-F24 Q3-F24 Q4-2024 Q1-F25 Q2-F25 Q3-F25 Q4-F25 2025 Net revenue $ 36,455 $ 37,628 $ 41,060 $ 44,698 $ 42,730 $ 65,600 $ 70,792 80,061 259,183 Cost of sales before adjustments 25,259 26,019 26,474 28,155 28,451 43,679 46,566 49,483 168,179 Adjusted gross margin 11,196 11,609 14,586 16,543 14,279 21,921 24,226 30,578 91,004 Adjusted gross margin % 31 % 31 % 36 % 37 % 33 % 33 % 34 % 38 % 35 % Less: Provisions of inventories and biological assets 1,672 314 628 2,043 13 548 921 1,603 3,085 Provisions to net realizable value 13 33 71 709 151 — 15 967 1,133 Realized fair value on inventories sold from acquisitions — — — — — 1,586 867 — 2,453 Gross margin before fair value adjustments $ 9,511 $ 11,262 $ 13,887 $ 13,791 $ 14,115 $ 19,787 $ 22,423 $ 28,008 $ 84,333 Gross margin % (before fair value adjustments) 26 % 30 % 34 % 31 % 33 % 30 % 32 % 35 % 33 % Add: Realized fair value on inventories sold and other inventory charges $ (11,923) $ (11,062) $ (13,728) $ (15,365) $ (13,066) $ (14,192) $ (14,461) $ (25,406) $ (67,125) Unrealized gain on changes in fair value of biological assets $ 9,112 $ 9,400 $ 13,849 $ 18,790 $ 12,765 $ 12,823 $ 18,184 $ 29,236 $ 73,008 Gross margin(1) $ 6,700 $ 9,600 $ 14,008 $ 17,216 $ 13,814 $ 18,418 $ 26,146 $ 31,838 $ 90,216 Gross margin %(1) 18 % 26 % 34 % 39 % 32 % 28 % 37 % 40 % 35 % Note (1): Gross margin reflects the IFRS measure per the Company’s Financial Statements. Both adjusted gross margin and gross margin before fair value adjustments have generally improved throughout Fiscal 2024. This improvement is attributed to several factors, including lower cultivation and post-harvest costs, reduced inventory provisions, lower depreciation resulting from impairment charges recorded in fiscal year 2023 and higher recreational cannabis revenue. In Q1 Fiscal 2025, gross margin declined primarily due to lower unrealized gain on changes in fair value of biological assets and lower international sales. In Q2 Fiscal 2025, gross margin declined primarily due to the fair value adjustment on inventories acquired through the Motif acquisition and subsequently sold, as required under IFRS. In Q3 Fiscal 2025, gross margin has MANAGEMENT’S DISCUSSION AND ANALYSIS | FOR THE YEAR ENDED SEPTEMBER 30, 2025 AND 2024 9
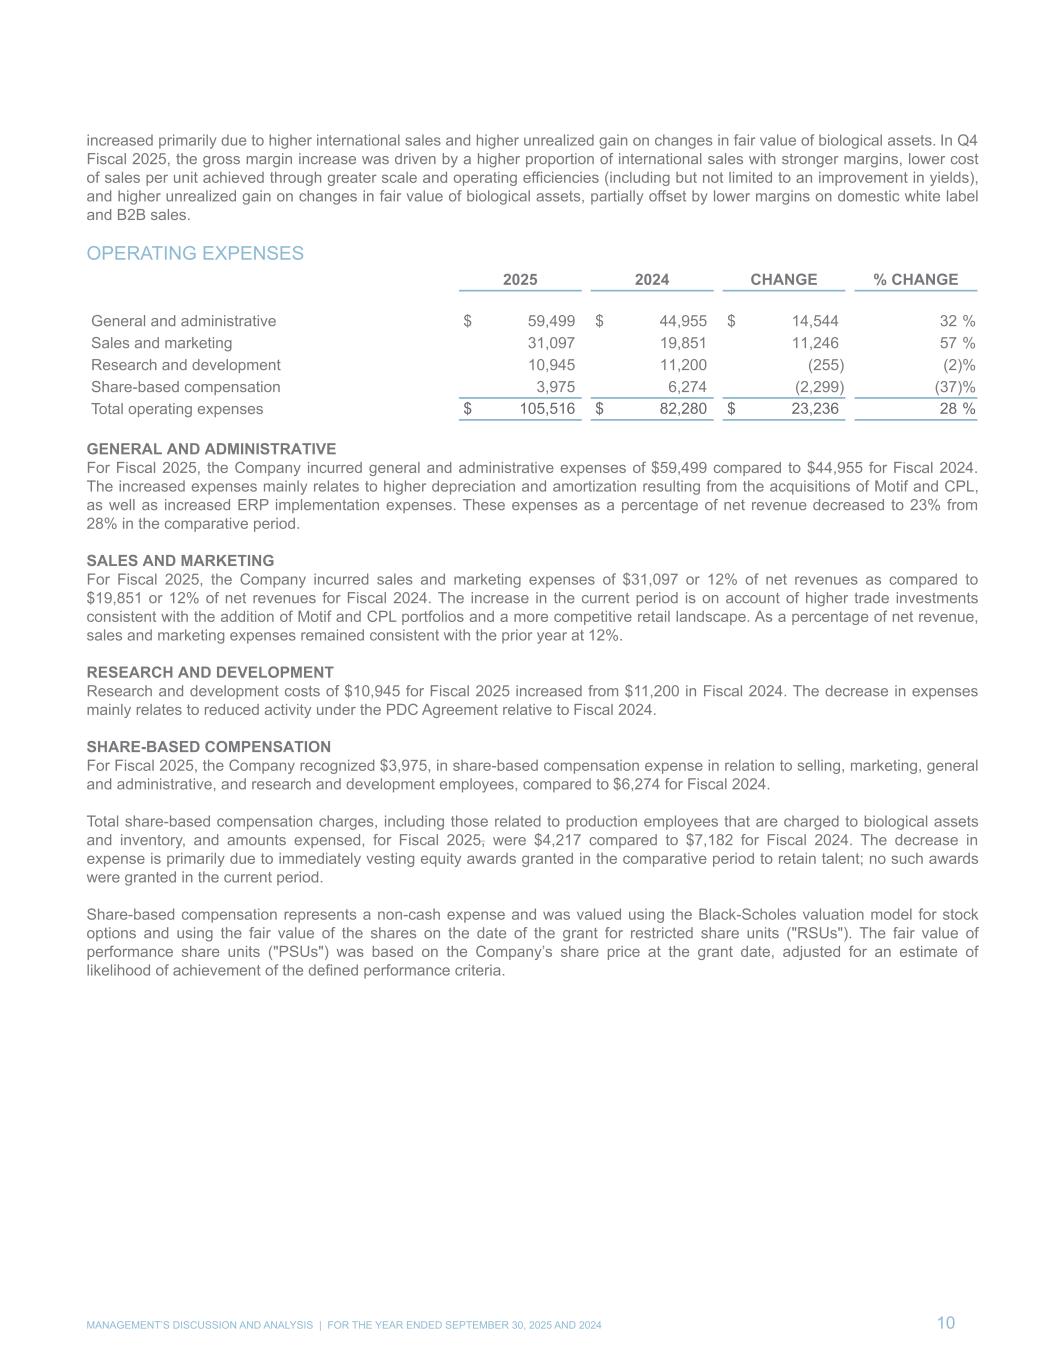
increased primarily due to higher international sales and higher unrealized gain on changes in fair value of biological assets. In Q4 Fiscal 2025, the gross margin increase was driven by a higher proportion of international sales with stronger margins, lower cost of sales per unit achieved through greater scale and operating efficiencies (including but not limited to an improvement in yields), and higher unrealized gain on changes in fair value of biological assets, partially offset by lower margins on domestic white label and B2B sales. OPERATING EXPENSES 2025 2024 CHANGE % CHANGE General and administrative $ 59,499 $ 44,955 $ 14,544 32 % Sales and marketing 31,097 19,851 11,246 57 % Research and development 10,945 11,200 (255) (2) % Share-based compensation 3,975 6,274 (2,299) (37) % Total operating expenses $ 105,516 $ 82,280 $ 23,236 28 % GENERAL AND ADMINISTRATIVE For Fiscal 2025, the Company incurred general and administrative expenses of $59,499 compared to $44,955 for Fiscal 2024. The increased expenses mainly relates to higher depreciation and amortization resulting from the acquisitions of Motif and CPL, as well as increased ERP implementation expenses. These expenses as a percentage of net revenue decreased to 23% from 28% in the comparative period. SALES AND MARKETING For Fiscal 2025, the Company incurred sales and marketing expenses of $31,097 or 12% of net revenues as compared to $19,851 or 12% of net revenues for Fiscal 2024. The increase in the current period is on account of higher trade investments consistent with the addition of Motif and CPL portfolios and a more competitive retail landscape. As a percentage of net revenue, sales and marketing expenses remained consistent with the prior year at 12%. RESEARCH AND DEVELOPMENT Research and development costs of $10,945 for Fiscal 2025 increased from $11,200 in Fiscal 2024. The decrease in expenses mainly relates to reduced activity under the PDC Agreement relative to Fiscal 2024. SHARE-BASED COMPENSATION For Fiscal 2025, the Company recognized $3,975, in share-based compensation expense in relation to selling, marketing, general and administrative, and research and development employees, compared to $6,274 for Fiscal 2024. Total share-based compensation charges, including those related to production employees that are charged to biological assets and inventory, and amounts expensed, for Fiscal 2025, were $4,217 compared to $7,182 for Fiscal 2024. The decrease in expense is primarily due to immediately vesting equity awards granted in the comparative period to retain talent; no such awards were granted in the current period. Share-based compensation represents a non-cash expense and was valued using the Black-Scholes valuation model for stock options and using the fair value of the shares on the date of the grant for restricted share units ("RSUs"). The fair value of performance share units ("PSUs") was based on the Company’s share price at the grant date, adjusted for an estimate of likelihood of achievement of the defined performance criteria. MANAGEMENT’S DISCUSSION AND ANALYSIS | FOR THE YEAR ENDED SEPTEMBER 30, 2025 AND 2024 10
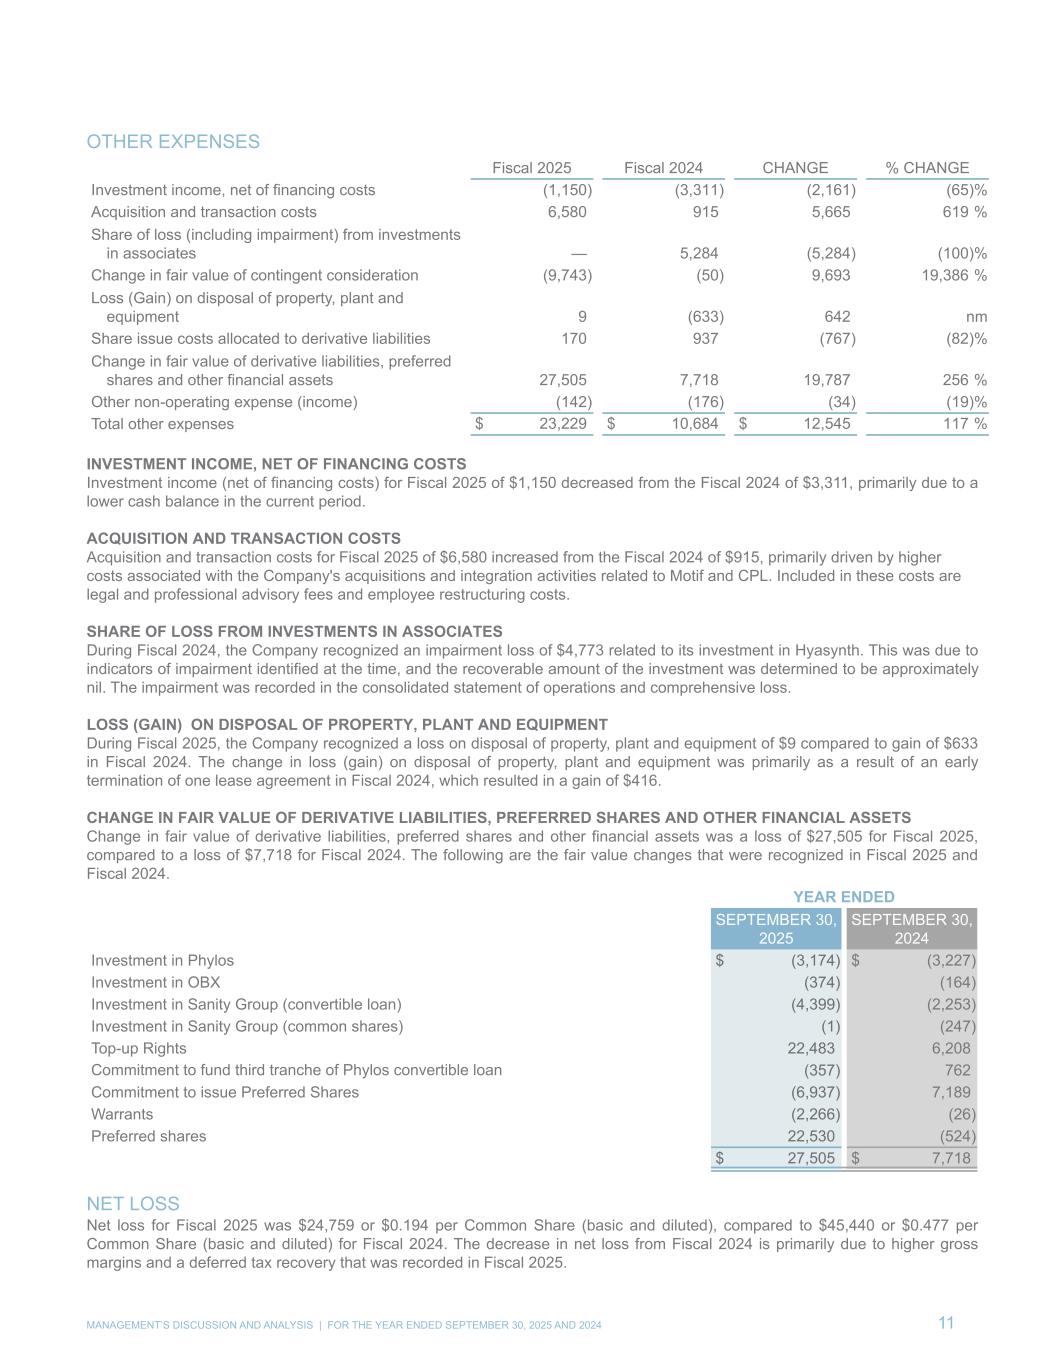
OTHER EXPENSES Fiscal 2025 Fiscal 2024 CHANGE % CHANGE Investment income, net of financing costs (1,150) (3,311) (2,161) (65) % Acquisition and transaction costs 6,580 915 5,665 619 % Share of loss (including impairment) from investments in associates — 5,284 (5,284) (100) % Change in fair value of contingent consideration (9,743) (50) 9,693 19,386 % Loss (Gain) on disposal of property, plant and equipment 9 (633) 642 nm Share issue costs allocated to derivative liabilities 170 937 (767) (82) % Change in fair value of derivative liabilities, preferred shares and other financial assets 27,505 7,718 19,787 256 % Other non-operating expense (income) (142) (176) (34) (19) % Total other expenses $ 23,229 $ 10,684 $ 12,545 117 % INVESTMENT INCOME, NET OF FINANCING COSTS Investment income (net of financing costs) for Fiscal 2025 of $1,150 decreased from the Fiscal 2024 of $3,311, primarily due to a lower cash balance in the current period. ACQUISITION AND TRANSACTION COSTS Acquisition and transaction costs for Fiscal 2025 of $6,580 increased from the Fiscal 2024 of $915, primarily driven by higher costs associated with the Company's acquisitions and integration activities related to Motif and CPL. Included in these costs are legal and professional advisory fees and employee restructuring costs. SHARE OF LOSS FROM INVESTMENTS IN ASSOCIATES During Fiscal 2024, the Company recognized an impairment loss of $4,773 related to its investment in Hyasynth. This was due to indicators of impairment identified at the time, and the recoverable amount of the investment was determined to be approximately nil. The impairment was recorded in the consolidated statement of operations and comprehensive loss. LOSS (GAIN) ON DISPOSAL OF PROPERTY, PLANT AND EQUIPMENT During Fiscal 2025, the Company recognized a loss on disposal of property, plant and equipment of $9 compared to gain of $633 in Fiscal 2024. The change in loss (gain) on disposal of property, plant and equipment was primarily as a result of an early termination of one lease agreement in Fiscal 2024, which resulted in a gain of $416. CHANGE IN FAIR VALUE OF DERIVATIVE LIABILITIES, PREFERRED SHARES AND OTHER FINANCIAL ASSETS Change in fair value of derivative liabilities, preferred shares and other financial assets was a loss of $27,505 for Fiscal 2025, compared to a loss of $7,718 for Fiscal 2024. The following are the fair value changes that were recognized in Fiscal 2025 and Fiscal 2024. YEAR ENDED SEPTEMBER 30, 2025 SEPTEMBER 30, 2024 Investment in Phylos $ (3,174) $ (3,227) Investment in OBX (374) (164) Investment in Sanity Group (convertible loan) (4,399) (2,253) Investment in Sanity Group (common shares) (1) (247) Top-up Rights 22,483 6,208 Commitment to fund third tranche of Phylos convertible loan (357) 762 Commitment to issue Preferred Shares (6,937) 7,189 Warrants (2,266) (26) Preferred shares 22,530 (524) $ 27,505 $ 7,718 NET LOSS Net loss for Fiscal 2025 was $24,759 or $0.194 per Common Share (basic and diluted), compared to $45,440 or $0.477 per Common Share (basic and diluted) for Fiscal 2024. The decrease in net loss from Fiscal 2024 is primarily due to higher gross margins and a deferred tax recovery that was recorded in Fiscal 2025. MANAGEMENT’S DISCUSSION AND ANALYSIS | FOR THE YEAR ENDED SEPTEMBER 30, 2025 AND 2024 11
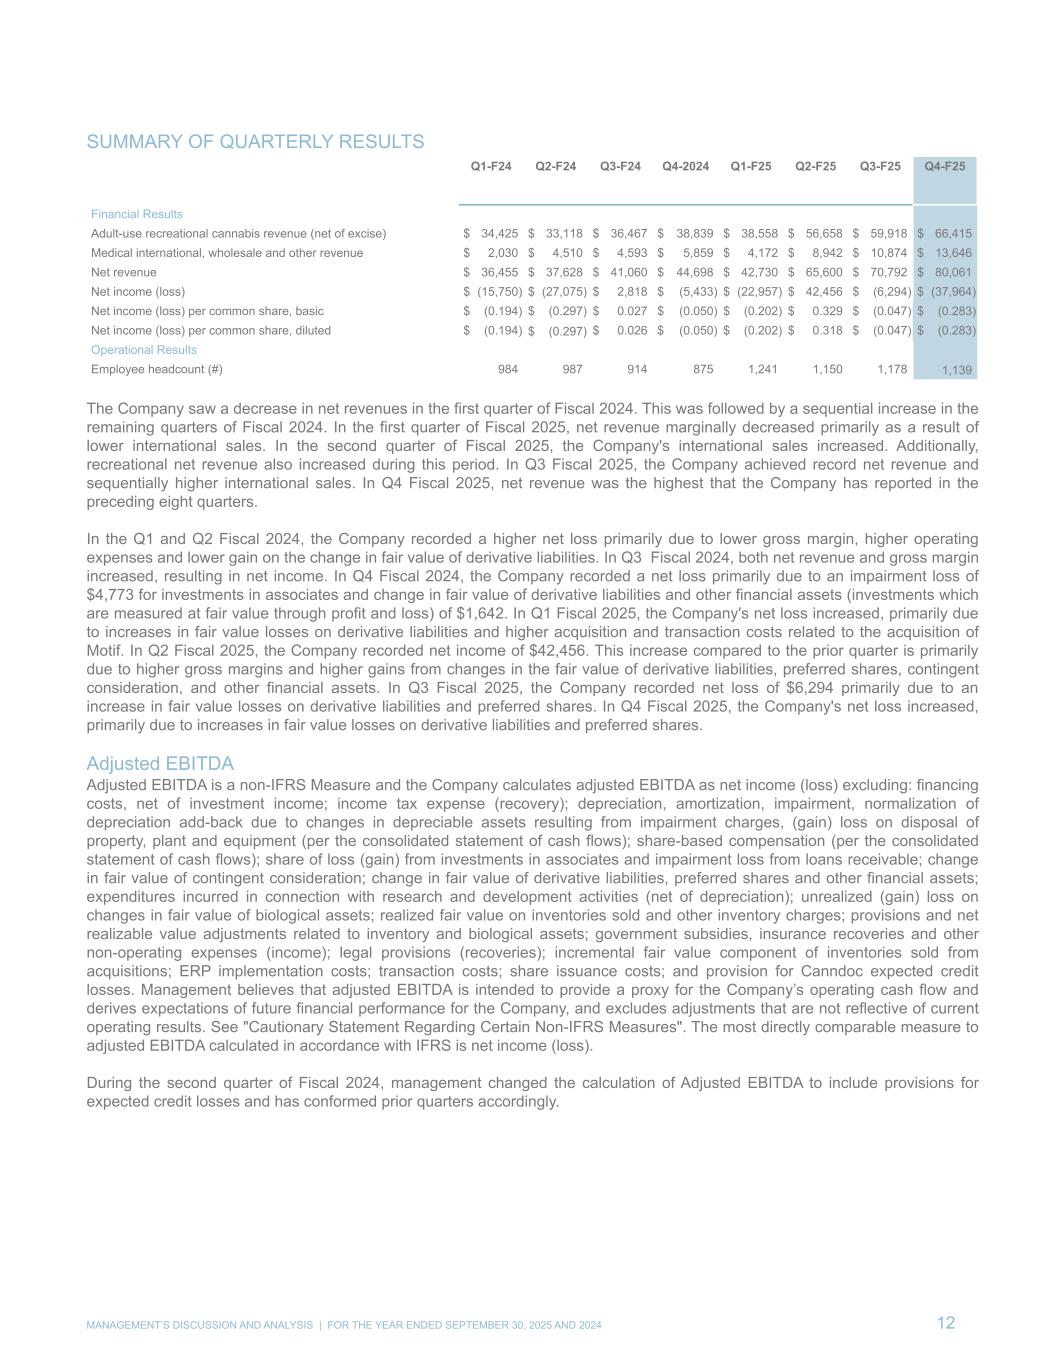
SUMMARY OF QUARTERLY RESULTS Q1-F24 Q2-F24 Q3-F24 Q4-2024 Q1-F25 Q2-F25 Q3-F25 Q4-F25 Financial Results Adult-use recreational cannabis revenue (net of excise) $ 34,425 $ 33,118 $ 36,467 $ 38,839 $ 38,558 $ 56,658 $ 59,918 $ 66,415 Medical international, wholesale and other revenue $ 2,030 $ 4,510 $ 4,593 $ 5,859 $ 4,172 $ 8,942 $ 10,874 $ 13,646 Net revenue $ 36,455 $ 37,628 $ 41,060 $ 44,698 $ 42,730 $ 65,600 $ 70,792 $ 80,061 Net income (loss) $ (15,750) $ (27,075) $ 2,818 $ (5,433) $ (22,957) $ 42,456 $ (6,294) $ (37,964) Net income (loss) per common share, basic $ (0.194) $ (0.297) $ 0.027 $ (0.050) $ (0.202) $ 0.329 $ (0.047) $ (0.283) Net income (loss) per common share, diluted $ (0.194) $ (0.297) $ 0.026 $ (0.050) $ (0.202) $ 0.318 $ (0.047) $ (0.283) Operational Results Employee headcount (#) 984 987 914 875 1,241 1,150 1,178 1,139 The Company saw a decrease in net revenues in the first quarter of Fiscal 2024. This was followed by a sequential increase in the remaining quarters of Fiscal 2024. In the first quarter of Fiscal 2025, net revenue marginally decreased primarily as a result of lower international sales. In the second quarter of Fiscal 2025, the Company's international sales increased. Additionally, recreational net revenue also increased during this period. In Q3 Fiscal 2025, the Company achieved record net revenue and sequentially higher international sales. In Q4 Fiscal 2025, net revenue was the highest that the Company has reported in the preceding eight quarters. In the Q1 and Q2 Fiscal 2024, the Company recorded a higher net loss primarily due to lower gross margin, higher operating expenses and lower gain on the change in fair value of derivative liabilities. In Q3 Fiscal 2024, both net revenue and gross margin increased, resulting in net income. In Q4 Fiscal 2024, the Company recorded a net loss primarily due to an impairment loss of $4,773 for investments in associates and change in fair value of derivative liabilities and other financial assets (investments which are measured at fair value through profit and loss) of $1,642. In Q1 Fiscal 2025, the Company's net loss increased, primarily due to increases in fair value losses on derivative liabilities and higher acquisition and transaction costs related to the acquisition of Motif. In Q2 Fiscal 2025, the Company recorded net income of $42,456. This increase compared to the prior quarter is primarily due to higher gross margins and higher gains from changes in the fair value of derivative liabilities, preferred shares, contingent consideration, and other financial assets. In Q3 Fiscal 2025, the Company recorded net loss of $6,294 primarily due to an increase in fair value losses on derivative liabilities and preferred shares. In Q4 Fiscal 2025, the Company's net loss increased, primarily due to increases in fair value losses on derivative liabilities and preferred shares. Adjusted EBITDA Adjusted EBITDA is a non-IFRS Measure and the Company calculates adjusted EBITDA as net income (loss) excluding: financing costs, net of investment income; income tax expense (recovery); depreciation, amortization, impairment, normalization of depreciation add-back due to changes in depreciable assets resulting from impairment charges, (gain) loss on disposal of property, plant and equipment (per the consolidated statement of cash flows); share-based compensation (per the consolidated statement of cash flows); share of loss (gain) from investments in associates and impairment loss from loans receivable; change in fair value of contingent consideration; change in fair value of derivative liabilities, preferred shares and other financial assets; expenditures incurred in connection with research and development activities (net of depreciation); unrealized (gain) loss on changes in fair value of biological assets; realized fair value on inventories sold and other inventory charges; provisions and net realizable value adjustments related to inventory and biological assets; government subsidies, insurance recoveries and other non-operating expenses (income); legal provisions (recoveries); incremental fair value component of inventories sold from acquisitions; ERP implementation costs; transaction costs; share issuance costs; and provision for Canndoc expected credit losses. Management believes that adjusted EBITDA is intended to provide a proxy for the Company’s operating cash flow and derives expectations of future financial performance for the Company, and excludes adjustments that are not reflective of current operating results. See "Cautionary Statement Regarding Certain Non-IFRS Measures". The most directly comparable measure to adjusted EBITDA calculated in accordance with IFRS is net income (loss). During the second quarter of Fiscal 2024, management changed the calculation of Adjusted EBITDA to include provisions for expected credit losses and has conformed prior quarters accordingly. MANAGEMENT’S DISCUSSION AND ANALYSIS | FOR THE YEAR ENDED SEPTEMBER 30, 2025 AND 2024 12
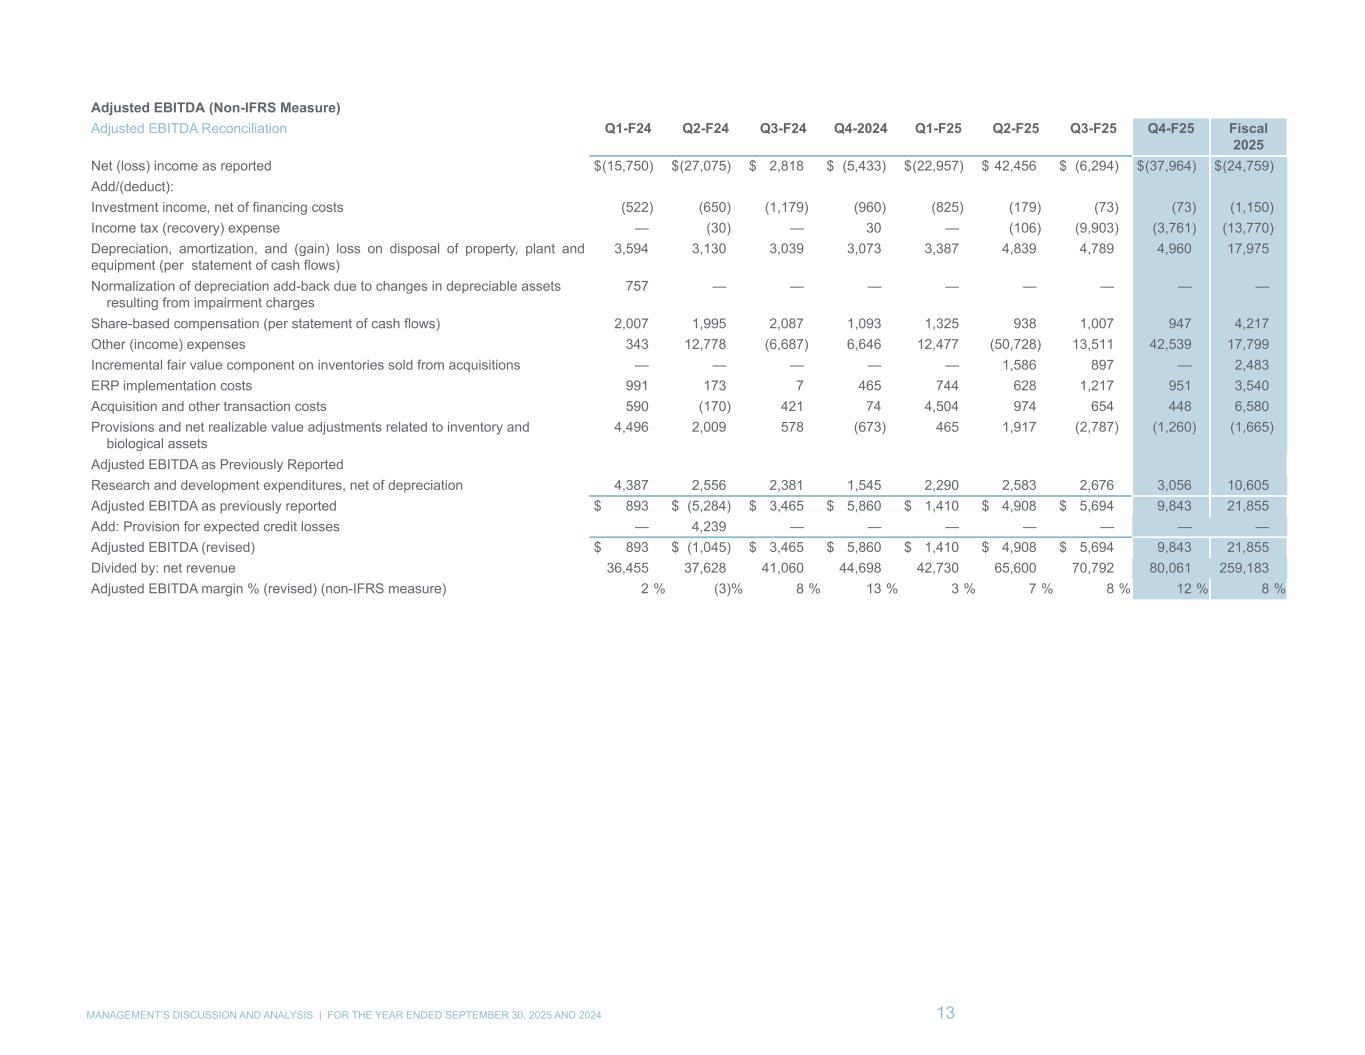
Adjusted EBITDA (Non-IFRS Measure) Adjusted EBITDA Reconciliation Q1-F24 Q2-F24 Q3-F24 Q4-2024 Q1-F25 Q2-F25 Q3-F25 Q4-F25 Fiscal 2025 Net (loss) income as reported $ (15,750) $ (27,075) $ 2,818 $ (5,433) $ (22,957) $ 42,456 $ (6,294) $ (37,964) $ (24,759) Add/(deduct): Investment income, net of financing costs (522) (650) (1,179) (960) (825) (179) (73) (73) (1,150) Income tax (recovery) expense — (30) — 30 — (106) (9,903) (3,761) (13,770) Depreciation, amortization, and (gain) loss on disposal of property, plant and equipment (per statement of cash flows) 3,594 3,130 3,039 3,073 3,387 4,839 4,789 4,960 17,975 Normalization of depreciation add-back due to changes in depreciable assets resulting from impairment charges 757 — — — — — — — — Share-based compensation (per statement of cash flows) 2,007 1,995 2,087 1,093 1,325 938 1,007 947 4,217 Other (income) expenses 343 12,778 (6,687) 6,646 12,477 (50,728) 13,511 42,539 17,799 Incremental fair value component on inventories sold from acquisitions — — — — — 1,586 897 — 2,483 ERP implementation costs 991 173 7 465 744 628 1,217 951 3,540 Acquisition and other transaction costs 590 (170) 421 74 4,504 974 654 448 6,580 Provisions and net realizable value adjustments related to inventory and biological assets 4,496 2,009 578 (673) 465 1,917 (2,787) (1,260) (1,665) Adjusted EBITDA as Previously Reported Research and development expenditures, net of depreciation 4,387 2,556 2,381 1,545 2,290 2,583 2,676 3,056 10,605 Adjusted EBITDA as previously reported $ 893 $ (5,284) $ 3,465 $ 5,860 $ 1,410 $ 4,908 $ 5,694 9,843 21,855 Add: Provision for expected credit losses — 4,239 — — — — — — — Adjusted EBITDA (revised) $ 893 $ (1,045) $ 3,465 $ 5,860 $ 1,410 $ 4,908 $ 5,694 9,843 21,855 Divided by: net revenue 36,455 37,628 41,060 44,698 42,730 65,600 70,792 80,061 259,183 Adjusted EBITDA margin % (revised) (non-IFRS measure) 2 % (3) % 8 % 13 % 3 % 7 % 8 % 12 % 8 % MANAGEMENT’S DISCUSSION AND ANALYSIS | FOR THE YEAR ENDED SEPTEMBER 30, 2025 AND 2024 13
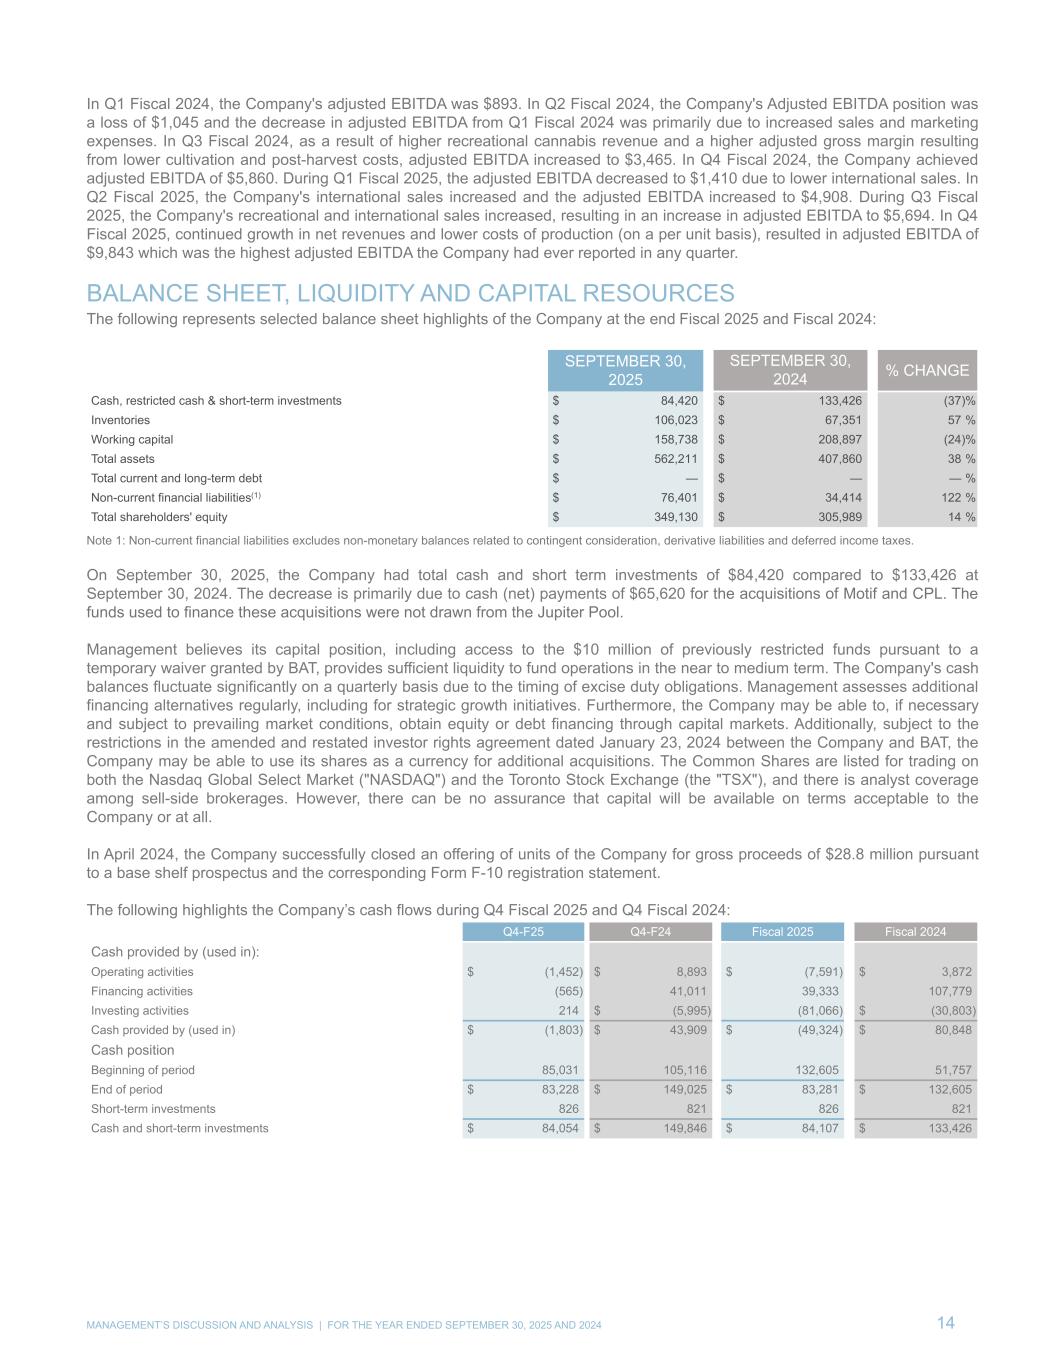
In Q1 Fiscal 2024, the Company's adjusted EBITDA was $893. In Q2 Fiscal 2024, the Company's Adjusted EBITDA position was a loss of $1,045 and the decrease in adjusted EBITDA from Q1 Fiscal 2024 was primarily due to increased sales and marketing expenses. In Q3 Fiscal 2024, as a result of higher recreational cannabis revenue and a higher adjusted gross margin resulting from lower cultivation and post-harvest costs, adjusted EBITDA increased to $3,465. In Q4 Fiscal 2024, the Company achieved adjusted EBITDA of $5,860. During Q1 Fiscal 2025, the adjusted EBITDA decreased to $1,410 due to lower international sales. In Q2 Fiscal 2025, the Company's international sales increased and the adjusted EBITDA increased to $4,908. During Q3 Fiscal 2025, the Company's recreational and international sales increased, resulting in an increase in adjusted EBITDA to $5,694. In Q4 Fiscal 2025, continued growth in net revenues and lower costs of production (on a per unit basis), resulted in adjusted EBITDA of $9,843 which was the highest adjusted EBITDA the Company had ever reported in any quarter. BALANCE SHEET, LIQUIDITY AND CAPITAL RESOURCES The following represents selected balance sheet highlights of the Company at the end Fiscal 2025 and Fiscal 2024: SEPTEMBER 30, 2025 SEPTEMBER 30, 2024 % CHANGE Cash, restricted cash & short-term investments $ 84,420 $ 133,426 (37) % Inventories $ 106,023 $ 67,351 57 % Working capital $ 158,738 $ 208,897 (24) % Total assets $ 562,211 $ 407,860 38 % Total current and long-term debt $ — $ — — % Non-current financial liabilities(1) $ 76,401 $ 34,414 122 % Total shareholders' equity $ 349,130 $ 305,989 14 % Note 1: Non-current financial liabilities excludes non-monetary balances related to contingent consideration, derivative liabilities and deferred income taxes. On September 30, 2025, the Company had total cash and short term investments of $84,420 compared to $133,426 at September 30, 2024. The decrease is primarily due to cash (net) payments of $65,620 for the acquisitions of Motif and CPL. The funds used to finance these acquisitions were not drawn from the Jupiter Pool. Management believes its capital position, including access to the $10 million of previously restricted funds pursuant to a temporary waiver granted by BAT, provides sufficient liquidity to fund operations in the near to medium term. The Company's cash balances fluctuate significantly on a quarterly basis due to the timing of excise duty obligations. Management assesses additional financing alternatives regularly, including for strategic growth initiatives. Furthermore, the Company may be able to, if necessary and subject to prevailing market conditions, obtain equity or debt financing through capital markets. Additionally, subject to the restrictions in the amended and restated investor rights agreement dated January 23, 2024 between the Company and BAT, the Company may be able to use its shares as a currency for additional acquisitions. The Common Shares are listed for trading on both the Nasdaq Global Select Market ("NASDAQ") and the Toronto Stock Exchange (the "TSX"), and there is analyst coverage among sell-side brokerages. However, there can be no assurance that capital will be available on terms acceptable to the Company or at all. In April 2024, the Company successfully closed an offering of units of the Company for gross proceeds of $28.8 million pursuant to a base shelf prospectus and the corresponding Form F-10 registration statement. The following highlights the Company’s cash flows during Q4 Fiscal 2025 and Q4 Fiscal 2024: Q4-F25 Q4-F24 Fiscal 2025 Fiscal 2024 Cash provided by (used in): Operating activities $ (1,452) $ 8,893 $ (7,591) $ 3,872 Financing activities (565) 41,011 39,333 107,779 Investing activities 214 $ (5,995) (81,066) $ (30,803) Cash provided by (used in) $ (1,803) $ 43,909 $ (49,324) $ 80,848 Cash position Beginning of period 85,031 105,116 132,605 51,757 End of period $ 83,228 $ 149,025 $ 83,281 $ 132,605 Short-term investments 826 821 826 821 Cash and short-term investments $ 84,054 $ 149,846 $ 84,107 $ 133,426 MANAGEMENT’S DISCUSSION AND ANALYSIS | FOR THE YEAR ENDED SEPTEMBER 30, 2025 AND 2024 14
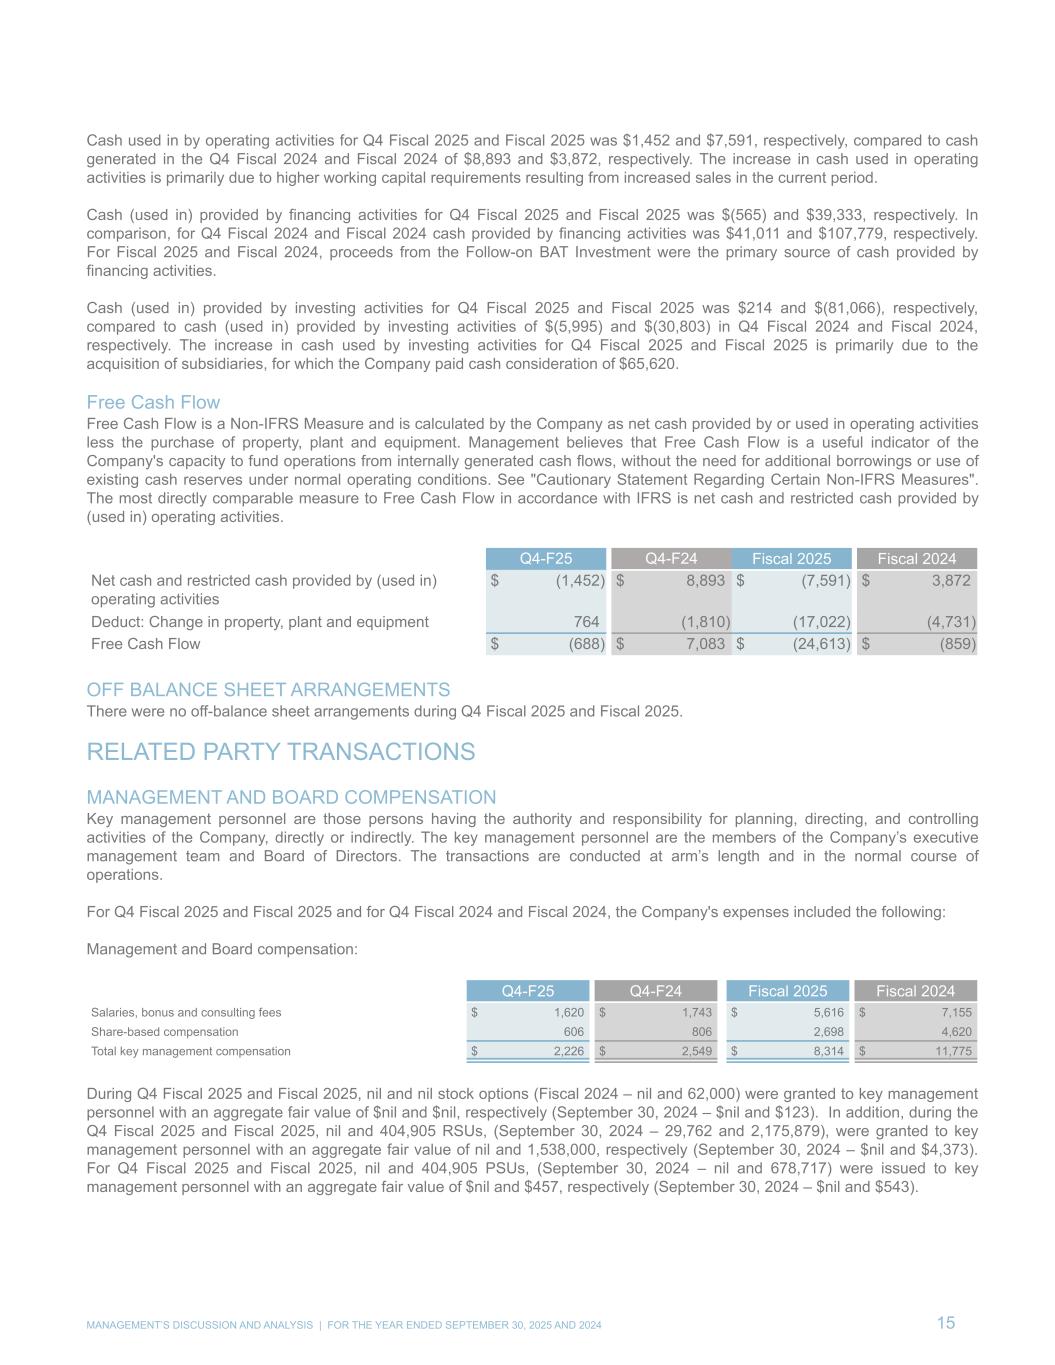
Cash used in by operating activities for Q4 Fiscal 2025 and Fiscal 2025 was $1,452 and $7,591, respectively, compared to cash generated in the Q4 Fiscal 2024 and Fiscal 2024 of $8,893 and $3,872, respectively. The increase in cash used in operating activities is primarily due to higher working capital requirements resulting from increased sales in the current period. Cash (used in) provided by financing activities for Q4 Fiscal 2025 and Fiscal 2025 was $(565) and $39,333, respectively. In comparison, for Q4 Fiscal 2024 and Fiscal 2024 cash provided by financing activities was $41,011 and $107,779, respectively. For Fiscal 2025 and Fiscal 2024, proceeds from the Follow-on BAT Investment were the primary source of cash provided by financing activities. Cash (used in) provided by investing activities for Q4 Fiscal 2025 and Fiscal 2025 was $214 and $(81,066), respectively, compared to cash (used in) provided by investing activities of $(5,995) and $(30,803) in Q4 Fiscal 2024 and Fiscal 2024, respectively. The increase in cash used by investing activities for Q4 Fiscal 2025 and Fiscal 2025 is primarily due to the acquisition of subsidiaries, for which the Company paid cash consideration of $65,620. Free Cash Flow Free Cash Flow is a Non-IFRS Measure and is calculated by the Company as net cash provided by or used in operating activities less the purchase of property, plant and equipment. Management believes that Free Cash Flow is a useful indicator of the Company's capacity to fund operations from internally generated cash flows, without the need for additional borrowings or use of existing cash reserves under normal operating conditions. See "Cautionary Statement Regarding Certain Non-IFRS Measures". The most directly comparable measure to Free Cash Flow in accordance with IFRS is net cash and restricted cash provided by (used in) operating activities. Q4-F25 Q4-F24 Fiscal 2025 Fiscal 2024 Net cash and restricted cash provided by (used in) operating activities $ (1,452) $ 8,893 $ (7,591) $ 3,872 Deduct: Change in property, plant and equipment 764 (1,810) (17,022) (4,731) Free Cash Flow $ (688) $ 7,083 $ (24,613) $ (859) OFF BALANCE SHEET ARRANGEMENTS There were no off-balance sheet arrangements during Q4 Fiscal 2025 and Fiscal 2025. RELATED PARTY TRANSACTIONS MANAGEMENT AND BOARD COMPENSATION Key management personnel are those persons having the authority and responsibility for planning, directing, and controlling activities of the Company, directly or indirectly. The key management personnel are the members of the Company’s executive management team and Board of Directors. The transactions are conducted at arm’s length and in the normal course of operations. For Q4 Fiscal 2025 and Fiscal 2025 and for Q4 Fiscal 2024 and Fiscal 2024, the Company's expenses included the following: Management and Board compensation: Q4-F25 Q4-F24 Fiscal 2025 Fiscal 2024 Salaries, bonus and consulting fees $ 1,620 $ 1,743 $ 5,616 $ 7,155 Share-based compensation 606 806 2,698 4,620 Total key management compensation $ 2,226 $ 2,549 $ 8,314 $ 11,775 During Q4 Fiscal 2025 and Fiscal 2025, nil and nil stock options (Fiscal 2024 – nil and 62,000) were granted to key management personnel with an aggregate fair value of $nil and $nil, respectively (September 30, 2024 – $nil and $123). In addition, during the Q4 Fiscal 2025 and Fiscal 2025, nil and 404,905 RSUs, (September 30, 2024 – 29,762 and 2,175,879), were granted to key management personnel with an aggregate fair value of nil and 1,538,000, respectively (September 30, 2024 – $nil and $4,373). For Q4 Fiscal 2025 and Fiscal 2025, nil and 404,905 PSUs, (September 30, 2024 – nil and 678,717) were issued to key management personnel with an aggregate fair value of $nil and $457, respectively (September 30, 2024 – $nil and $543). MANAGEMENT’S DISCUSSION AND ANALYSIS | FOR THE YEAR ENDED SEPTEMBER 30, 2025 AND 2024 15
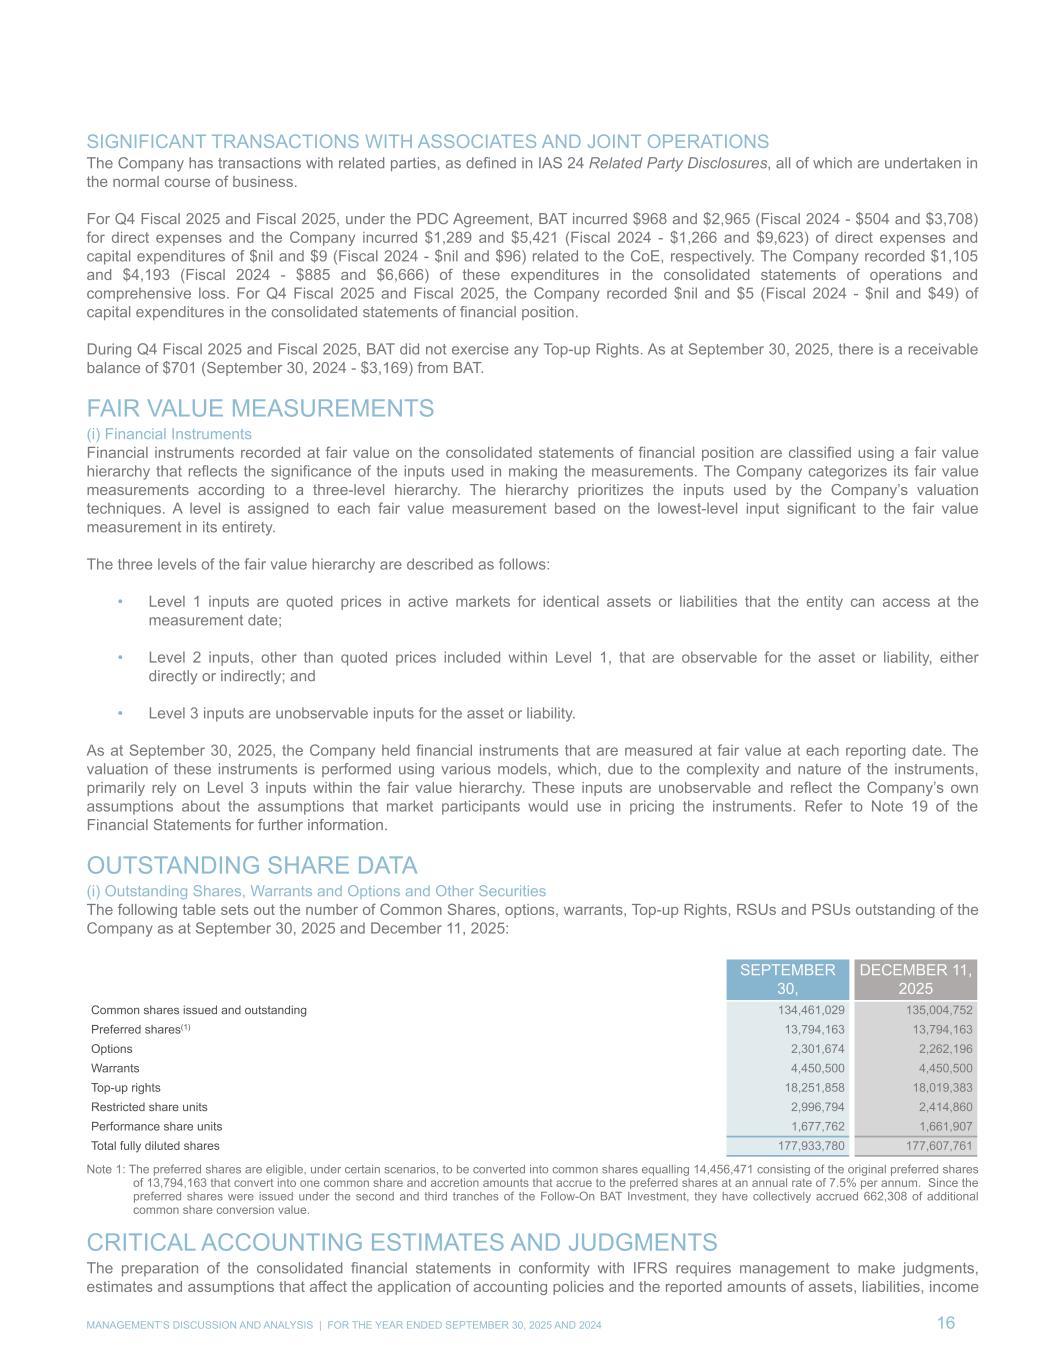
SIGNIFICANT TRANSACTIONS WITH ASSOCIATES AND JOINT OPERATIONS The Company has transactions with related parties, as defined in IAS 24 Related Party Disclosures, all of which are undertaken in the normal course of business. For Q4 Fiscal 2025 and Fiscal 2025, under the PDC Agreement, BAT incurred $968 and $2,965 (Fiscal 2024 - $504 and $3,708) for direct expenses and the Company incurred $1,289 and $5,421 (Fiscal 2024 - $1,266 and $9,623) of direct expenses and capital expenditures of $nil and $9 (Fiscal 2024 - $nil and $96) related to the CoE, respectively. The Company recorded $1,105 and $4,193 (Fiscal 2024 - $885 and $6,666) of these expenditures in the consolidated statements of operations and comprehensive loss. For Q4 Fiscal 2025 and Fiscal 2025, the Company recorded $nil and $5 (Fiscal 2024 - $nil and $49) of capital expenditures in the consolidated statements of financial position. During Q4 Fiscal 2025 and Fiscal 2025, BAT did not exercise any Top-up Rights. As at September 30, 2025, there is a receivable balance of $701 (September 30, 2024 - $3,169) from BAT. FAIR VALUE MEASUREMENTS (i) Financial Instruments Financial instruments recorded at fair value on the consolidated statements of financial position are classified using a fair value hierarchy that reflects the significance of the inputs used in making the measurements. The Company categorizes its fair value measurements according to a three-level hierarchy. The hierarchy prioritizes the inputs used by the Company’s valuation techniques. A level is assigned to each fair value measurement based on the lowest-level input significant to the fair value measurement in its entirety. The three levels of the fair value hierarchy are described as follows: • Level 1 inputs are quoted prices in active markets for identical assets or liabilities that the entity can access at the measurement date; • Level 2 inputs, other than quoted prices included within Level 1, that are observable for the asset or liability, either directly or indirectly; and • Level 3 inputs are unobservable inputs for the asset or liability. As at September 30, 2025, the Company held financial instruments that are measured at fair value at each reporting date. The valuation of these instruments is performed using various models, which, due to the complexity and nature of the instruments, primarily rely on Level 3 inputs within the fair value hierarchy. These inputs are unobservable and reflect the Company’s own assumptions about the assumptions that market participants would use in pricing the instruments. Refer to Note 19 of the Financial Statements for further information. OUTSTANDING SHARE DATA (i) Outstanding Shares, Warrants and Options and Other Securities The following table sets out the number of Common Shares, options, warrants, Top-up Rights, RSUs and PSUs outstanding of the Company as at September 30, 2025 and December 11, 2025: SEPTEMBER 30, DECEMBER 11, 2025 Common shares issued and outstanding 134,461,029 135,004,752 Preferred shares(1) 13,794,163 13,794,163 Options 2,301,674 2,262,196 Warrants 4,450,500 4,450,500 Top-up rights 18,251,858 18,019,383 Restricted share units 2,996,794 2,414,860 Performance share units 1,677,762 1,661,907 Total fully diluted shares 177,933,780 177,607,761 Note 1: The preferred shares are eligible, under certain scenarios, to be converted into common shares equalling 14,456,471 consisting of the original preferred shares of 13,794,163 that convert into one common share and accretion amounts that accrue to the preferred shares at an annual rate of 7.5% per annum. Since the preferred shares were issued under the second and third tranches of the Follow-On BAT Investment, they have collectively accrued 662,308 of additional common share conversion value. CRITICAL ACCOUNTING ESTIMATES AND JUDGMENTS The preparation of the consolidated financial statements in conformity with IFRS requires management to make judgments, estimates and assumptions that affect the application of accounting policies and the reported amounts of assets, liabilities, income MANAGEMENT’S DISCUSSION AND ANALYSIS | FOR THE YEAR ENDED SEPTEMBER 30, 2025 AND 2024 16
and expenses. Actual results may differ from these estimates. Estimates and underlying assumptions are reviewed on an ongoing basis. Revisions to accounting estimates are recognized in the year in which the estimates are revised and in any future years affected. The following are the estimates and judgments made by management in applying the accounting policies of the Company that have the most significant effect on the consolidated financial statements: 1. Biological assets and inventories Determination of the fair value of biological assets requires management to make a number of estimates, including estimating the average selling price per gram and expected average yield per plant. The Company records obsolete and unsalable inventories at the lower of cost and net realizable value. Adjustments to the carrying value of inventories are based on obsolescence trends, historical experience, forecast demand and average selling price for obsolete and unsalable inventories. Refer to Notes 6 and 7 for further information. 2. Useful lives and impairment of property, plant and equipment and finite-life intangible assets Amortization of property, plant and equipment and finite life intangible assets requires estimates of useful lives, which are determined through the exercise of judgment. The assessment of any impairment of these assets is dependent upon estimates of recoverable amounts, taking into consideration factors such as economic and market conditions. 3. Share-based payments In determining the fair value of options and related costs, management estimates the expected life of the option, the expected volatility of the Company’s share price, the risk-free interest rate, and the rate of forfeitures. Refer to Note 14 for further information. 4. Provision for returns and price adjustments Government customers typically have the right to return products, and in some cases, the right to pricing adjustments for products that are subsequently discounted or sold for a lower price in another jurisdiction. The estimation of potential future returns and pricing adjustments includes the use of management estimates and assumptions that may not be certain given the evolving nature of the industry. 5. Impairment of non-financial assets The recoverable amount of an individual CGU and group of CGUs is determined based on value in use which involves the use of a discounted cash flow model and significant assumptions which include forecasted cash flows, terminal growth rate and post-tax discount rates. In allocating any impairment loss, the Company determines the recoverable amounts of its property, plant and equipment. The recoverable amount of property and plant is determined based on fair value less costs of disposal and involves the use of capitalization rates, market rentals, market transactions and demolition costs. Refer to Note 8 for further information. 6. Derivative liabilities Warrants issued pursuant to equity offerings that are potentially exercisable in cash or on a cashless basis resulting in a variable number of shares being issued are considered derivative liabilities and therefore measured at fair value through profit or loss. The Company uses the Black-Scholes option pricing model to estimate the fair value of such warrants at inception, on each exercise, and subsequently at the period end date. The key assumption used in the model is the expected future volatility in the price of the Company’s Common Shares. The potential issuance of Common Shares related to Top-up Rights is classified as a derivative liability and is therefore measured at fair value through profit or loss. The Company uses the Monte Carlo pricing model to estimate the fair value of such Top-up Rights at inception, upon each exercise, and at year-end. The key assumption used in the model is the expected future volatility of the price of the Company's Common Shares. The impact of changes in these key assumptions is described in Note 12. 7. Recognition and measurement of preferred shares and derivative financial instrument In determining the initial and subsequent measurement of the Preferred Shares and relative derivative, management has applied significant judgment and estimation in regards to the fair valuation of the Preferred Shares and related derivative liability. Refer to Notes 12 and 19 for further information. 8. Recognition and measurement of other financial assets MANAGEMENT’S DISCUSSION AND ANALYSIS | FOR THE YEAR ENDED SEPTEMBER 30, 2025 AND 2024 17
In determining the initial and subsequent recognition and measurement of the other financial assets, management has applied significant judgment and estimates including but not limited to determining the appropriate valuation methodology and key inputs. Refer to Notes 11 and 19 for further information. 9. Business Combinations Management performs a valuation analysis to allocate the purchase price based on the acquisition date fair values of the identifiable assets acquired and liabilities assumed. Determining the fair value of identifiable assets acquired and liabilities assumed on the acquisition date and contingent consideration requires the use of judgment and estimates. With respect to the acquisitions, the significant assumptions related to estimating the fair value of the acquired brands and customer relationships, included: the royalty rate, forecasted revenues, and forecasted cash flows. Valuations are highly dependent on the inputs used and assumptions made by management regarding the future performance of these assets and any changes in the discount rate applied. New and amended accounting standards effective for the current year Amendments to IAS 1: Classification of Liabilities as Current or Non-Current and Non-current Liabilities with Covenants In January 2020 and October 2022, the IASB issued amendments to IAS 1 to specify the requirements relating to determining whether a liability should be presented as current or non-current in the statement of financial position. Under the new requirements, the assessment of whether a liability is presented as current or non-current is based on the contractual arrangements in place as at the reporting date and does not impact the amount or timing of recognition. These amendments also clarify how conditions with which an entity must comply within twelve months after the reporting period affect the classification of a liability. The amendments apply retrospectively for annual reporting periods beginning on or after January 1, 2024. These amendments do not have a material impact on the Company’s consolidated financial statements. Amendments to IFRS 16: Lease Liability in a Sale and Leaseback On September 22, 2022, the IASB issued amendments to IFRS 16 Leases, to specify the requirements that a seller-lessee uses in measuring the lease liability arising in a sale and leaseback transaction, to ensure the seller-lessee does not recognize any amount of the gain or loss that relates to the right of use it retains. The amendments are effective for annual reporting periods beginning on or after January 1, 2024 and must be applied retrospectively to sale and leaseback transactions entered into after the date of initial application of IFRS 16. Earlier application is permitted and that fact must be disclosed. The Company has not entered into any sale and leaseback transactions in the past and does not anticipate doing so in the future. Therefore, these amendments do not have an impact on the Company's consolidated financial statements. Amendments to IAS 7 and IFRS 7: Supplier Finance Arrangements In May 2023, the IASB issued amendments to IAS 7 Statement of Cash Flows and IFRS 7 Financial Instruments: Disclosures to clarify the characteristics of supplier finance arrangements and require additional disclosure of such arrangements. The disclosure requirements in the amendments are intended to assist users of financial statements in understanding the effects of supplier finance arrangements on an entity’s liabilities, cash flows and exposure to liquidity risk. These amendments do not have an impact on the Company’s consolidated financial statements. Accounting standards issued but not yet effective The new and amended standards and interpretations that are issued, but are not yet effective, up to the date of issuance of the Company's consolidated financial statements are disclosed below. The Company intends to adopt these new and amended standards and interpretations when they become effective. Amendment to the Classification and Measurement of Financial Instruments – Amendments to IFRS 9 and IFRS 7 In May 2024, the IASB issued amendments to IFRS 9 and IFRS 7 to respond to recent questions arising in practice, and to include new requirements not only for financial institutions but also for corporate entities. These amendments: • clarify the date of recognition and derecognition of some financial assets and liabilities, with a new exception for some financial liabilities settled through an electronic cash transfer system; • clarify and add further guidance for assessing whether a financial asset meets the solely payments of principal and interest (SPPI) criterion; • add new disclosures for certain instruments with contractual terms that can change cash flows (such as some financial instruments with features linked to the achievement of environment, social and governance targets); and • update the disclosures for equity instruments designated at fair value through other comprehensive income (FVOCI). These amendments are effective for annual reporting periods beginning on or after January 1, 2026, and must be applied retrospectively. Earlier application is permitted. The Company is currently evaluating the full potential impact of these amendments on the consolidated financial statements. IFRS 18 Presentation and Disclosure in Financial Statements MANAGEMENT’S DISCUSSION AND ANALYSIS | FOR THE YEAR ENDED SEPTEMBER 30, 2025 AND 2024 18
In April 2024, the IASB issued IFRS 18, which replaces IAS 1 Presentation of financial statements. IFRS 18 introduces new requirements for presentation within the statement of profit or loss, including specified totals and subtotals. Furthermore, entities are required to classify all income and expenses within the statement of profit or loss into one of five categories: operating, investing, financing, income taxes and discontinued operations, whereof the first three are new. It also requires disclosure of newly defined management-defined performance measures, subtotals of income and expenses, and includes new requirements for aggregation and disaggregation of financial information based on the identified "roles" of the primary financial statements (PFS) and the notes. In addition, narrow-scope amendments have been made to IAS 7 Statement of Cash Flows. These include changing the starting point for determining cash flows from operations under the indirect method from "profit or loss" to "operating profit or loss" and removing the optionality around classification of cash flows from dividends and interest. In addition, there are consequential amendments to several other standards. IFRS 18 and the amendments to the other standards, are effective for annual reporting periods beginning on or after January 1, 2027, but earlier application is permitted and must be disclosed. IFRS 18 will apply retrospectively. The Company is currently evaluating the potential impact of IFRS 18 on the Company’s consolidated financial statements. IFRS 19 Subsidiaries without Public Accountability: Disclosures and amendment In May 2024, the IASB issued amendments to IFRS 19, which permits an eligible subsidiary (i.e., a subsidiary without public accountability, whose ultimate or intermediate parent prepares consolidated financial statements under IFRS) to apply reduced disclosure requirements while otherwise applying full IFRS recognition, measurement and presentation requirements.The standard is effective for annual periods beginning on or after January 1, 2027 and may be applied prospectively, with earlier application permitted. As the Company is not a subsidiary and has public accountability (its shares are publicly traded), it is not eligible to apply IFRS 19 and therefore these amendments are not expected to have any impact on the Company’s consolidated financial statements. Amendments to IAS 21 - Lack of Exchangeability In August 2023, the IASB amended IAS 21 to clarify when a currency is exchangeable into another currency and how a company estimates a spot rate when a currency lacks exchangeability. The amendments are effective for annual reporting periods beginning on or after January 1, 2025 and must be applied prospectively to foreign-currency items entered into after the date of initial application. These amendments are not expected to have a material impact on the Company’s consolidated financial statements. ACQUISITION OF SUBSIDIARIES i. Acquisition of Motif On December 6, 2024, the Company acquired 100% of the issued and outstanding shares of Motif, a Canadian leader in the vape and infused pre-roll categories backed by a portfolio of strong owned brands, for upfront consideration of $90 million. This included $50 million in cash and $40 million of the Company's common shares priced based on the 30 day trading volume- weighted average price ("VWAP") of $2.3210. In addition, Motif shareholders are entitled to receive an additional contingent consideration of $10 million payable in the Company's common shares, conditional on the Company achieving a price per share exceeding $3.2203 per share, based on the rolling 30-trading day VWAP on the TSX, within 12 months of the date of the transaction. The acquisition was accounted for as a business combination under IFRS 3. For additional details regarding the accounting treatment of the acquisition, refer to Note 26 of the Financial Statements. The acquisition of Motif resulted in Organigram becoming the #1 LP in Canada by market share11 and added two purpose-built facilities to its portfolio that are optimized for cannabis extraction, processing, manufacturing, and distribution. Motif's product portfolio is highly complementary to Organigram's, with minimal portfolio overlap. On April 1, 2025, the Company completed the amalgamation of Motif and it continued as a single legal entity under the name Organigram Inc. Integration efforts are substantially complete, with core systems, operational processes, and organizational structures largely aligned. Management continues to monitor residual integration matters as part of normal operations. ii. Acquisition of CPL On March 31, 2025, the Company acquired 100% of the issued and outstanding shares of CPL, a company operating in the cannabis and hemp-derived THC beverage categories, supported by a portfolio of strong owned brands, for upfront consideration of $6 million. CPL's former shareholder is also entitled to receive up to additional consideration of $24 million in contingent consideration, subject to achievement of certain milestone and earnout targets. The acquisition was accounted for as a business MANAGEMENT’S DISCUSSION AND ANALYSIS | FOR THE YEAR ENDED SEPTEMBER 30, 2025 AND 2024 19 11 Source: Hifyre (all provinces other than QC, NB and NS), Weedcrawler (QC), and Board Data (NB, NS, PE), R3M Oct 30
combination under IFRS 3. For additional details regarding the accounting treatment of the acquisition, refer to Note 26 of the Financial Statements. Through the Company's acquisition of CPL, the Company entered the cannabis beverage category in Canada and the hemp- derived THC beverage category in the U.S. In Canada, the Company has captured 5.5% of the beverage category12 and intends to further expand in this category by leveraging sales capabilities and the FASTTM nanoemulsion technology. In the U.S., CPL beverages are currently distributed in approximately 25 states through its online DTC platform and retail brick and mortar locations across several states.12 Refer to Note 26 to the Financial Statements for further information. CONTINGENT LIABILITIES The Company recognizes loss contingency provisions for probable losses when management can reasonably estimate the loss. When the estimated loss lies within a range, the Company records a loss contingency provision based on its best estimate of the probable loss. If no particular amount within that range is a better estimate than any other amount, the mid-point of the range is used. As information becomes known a loss contingency provision is recorded when a reasonable estimate can be made. The estimates are reviewed at each reporting date and the estimates are changed when expectations are revised. An outcome that deviates from the Company’s estimate may result in an additional expense or release in a future accounting period. DISCLOSURE CONTROLS AND PROCEDURES AND INTERNAL CONTROL OVER FINANCIAL REPORTING In accordance with National Instrument 52-109 - Certification of Disclosure in Issuers’ Annual and Interim Filings (“NI 52-109”) and Rule 13a-15 under the United States Securities Exchange Act of 1934, as amended (the “Exchange Act”), the establishment and maintenance of Disclosure Controls and Procedures (“DCP”) and Internal Control Over Financial Reporting (“ICFR”) is the responsibility of management. The Company engaged PKF O'Connor Davies ("PKF"), the Company's independent registered public accounting firm, to perform an “integrated audit” which encompassed an opinion on the fairness of presentation of the Company’s annual consolidated financial statements for the year ended September 30, 2025, as well as an opinion on the effectiveness of the Company’s ICFR. PKF, has audited the Company's Financial Statements and has issued an adverse report on the effectiveness of ICFR. PKF‘s audit report on the Company’s ICFR is incorporated by reference into the Company’s annual report on Form 40-F under the Exchange Act for the year ended September 30, 2025. DISCLOSURE CONTROLS AND PROCEDURES The Company maintains a set of DCP designed to provide reasonable assurance that information required to be publicly disclosed is recorded, processed, summarized and reported on a timely basis. As required by NI 52-109 and Exchange Act Rule 13a-15(b), an evaluation of the design and operation of our DCP was completed as of September 30, 2025 under the supervision and with the participation of management, including our Chief Executive Officer who departed subsequent to Fiscal 2025 effective November 30, 2025, and our Executive Chair who is acting in the capacity of Chief Executive Officer effective December 1, 2025 (“CEO”) and Chief Financial Officer (“CFO”) using the criteria set forth in Internal Control - Integrated Framework, issued by the Committee of Sponsoring Organizations of the Treadway Commission (the “COSO 2013 Framework”). Based upon this evaluation, our CEO and CFO concluded that because of the material weaknesses in our ICFR described below, our DCP were not effective as of such date. LIMITATIONS ON SCOPE OF DESIGN The Company has limited the scope of its evaluation of DCP and ICFR to exclude controls, policies and procedures over entities that were acquired by the Company not more than 365 days before the end of the financial period. The only entities controlled by MANAGEMENT’S DISCUSSION AND ANALYSIS | FOR THE YEAR ENDED SEPTEMBER 30, 2025 AND 2024 20 12 As of September 30, 2025 - Multiple sources (Hifyre, Weedcrawler, OCS wholesale sales and e-commerce orders shipped data, provincial boards data and internal sales data) 12See amendments to definition of hemp in the 2018 Farm Bill as described in greater detail in the "Outlook" section of this MD&A.
the Company but that was scoped out of the evaluation of DCP and ICFR were Motif (acquired effective December 6, 2024), CPL and CPL USA (both acquired effective March 31, 2025). Excluding goodwill and intangible assets, Motif constitutes approximately $52,485 of the Company’s current assets, $78,093 of total assets, $40,000 of current liabilities and $55,518 of total liabilities as of the acquisition date. During the three months and year ended September 30, 2025, Motif contributed $42,463 and $137,793 in gross revenue to the consolidated results. Excluding goodwill and intangible assets, CPL constitutes approximately $2,523 of the Company’s current assets, $2,523 of total assets, $1,097 of current liabilities and $5,030 of total liabilities as of the acquisition date. As of the date of this MD&A, the purchase price allocation for CPL has not yet been finalized. INTERNAL CONTROL OVER FINANCIAL REPORTING NI 52-109 requires the CEO and CFO to certify that they are responsible for establishing and maintaining ICFR for the Company and that those internal controls have been designed and are effective in providing reasonable assurance regarding the reliability of financial reporting and the preparation of financial statements in accordance with IFRS. Similarly, Exchange Act Rule 13a-15(c) requires the Company's management, with the participation of the CEO and CFO, to evaluate ICFR as of the end of the fiscal year. The CEO and CFO are also responsible for disclosing any changes to the Company’s internal controls during the most recent period that have materially affected, or are reasonably likely to materially affect, its internal control over financial reporting. MATERIAL CHANGES TO INTERNAL CONTROL OVER FINANCIAL REPORTING There has been a change to the Company’s ICFR during the three months ended September 30, 2025 that has materially affected, or is likely to materially affect, the Company’s ICFR. In the fourth quarter of fiscal year 2025, staff turnover among personnel responsible for preparing and reviewing complex spreadsheets related to biological assets and inventory impacted management’s ability to maintain effective operation of applicable controls. Security and Administration and Monitoring of Service Organizations With respect to the material weakness related to the information process during Fiscal 2025, the following remedial activities were completed and the material weakness assessed as remediated in Q4 of Fiscal 2025: • Engaged internal control specialists that assisted management in evaluating internal controls and in designing remediation plans; • Hired a VP, Information Technology to oversee and enhance the IT department and support the remediation of deficiencies in general IT controls; • Hired and trained a dedicated resource to review the third-party service organization control reports and assess their impact in relation to the Company’s control environment; • Remediated certain IT General controls; and • Remediated the identified deficiencies related to the design, implementation, and operation of certain process-level and financial statement close controls. MANAGEMENT’S EVALUATION OF INTERNAL CONTROL OVER FINANCIAL REPORTING The Company’s management, under the supervision and with the participation of its CEO and CFO, conducted an evaluation of the effectiveness of the Company’s ICFR as defined by NI 52-109 and Rule 13a-15(f) of the Exchange Act as of September 30, 2025, using the criteria set forth by the COSO 2013 Framework. Based on this evaluation, management concluded that the Company's ICFR was not effective as of September 30, 2025. A material weakness is a deficiency, or a combination of deficiencies, in internal control over financial reporting, such that there is a reasonable possibility that a material misstatement of the Company’s annual or interim financial statements will not be prevented or detected on a timely basis. Management has identified the following material weakness: • Management review controls designed to ensure the completeness and accuracy of complex spreadsheets used in the biological assets and inventory valuation processes, as well as user access rights and related controls over the inventory management application Ample system, were not designed or operating effectively. The material weakness related to the inventory management application Ample system was remediated through the decommissioning of the system application in the first quarter of Fiscal 2026, and the system application is no longer in use. MANAGEMENT’S DISCUSSION AND ANALYSIS | FOR THE YEAR ENDED SEPTEMBER 30, 2025 AND 2024 21
STATUS OF REMEDIATION PLAN The Company was successful in remediating the material weakness related to IT General Controls and made progress in remediating other control deficiencies as discussed above under “Material Changes to Internal Control Over Financial Reporting” as at the end of Fiscal 2025. Management, with the assistance of external and internal specialists, has continued reviewing and revising its ICFR, and remains committed to implementing changes to its ICFR to ensure that the control deficiencies that contributed to the remaining material weakness is remediated in Fiscal 2026. The following remedial activities remain in progress as at the date of this MD&A and are expected to continue at least throughout the first half of Fiscal 2026. The controls associated with these remedial activities have not yet been subject to control testing to conclude on the design or operational effectiveness. • The Company will continue to streamline complex spreadsheet models related to biological assets and inventory to reduce the risk of errors in mathematical formulas and to improve the ability to verify the logic of complex spreadsheets, while continuing to automate processes, and leverage the Company's new inventory costing upgrades in its ERP system. A component of the material weakness related to the inventory management application Ample system was remediated through the decommissioning of the system application in the first quarter of Fiscal 2026, and the system application is no longer in use. Following the improvement and remediation of the material weakness related to IT General Controls, senior management has discussed the remaining material weakness with the Audit Committee which will continue to review progress on these remediation activities. While we believe these actions, including the third phase of the ERP system, will contribute to the remediation of the material weakness, we have not yet completed all of the corrective processes, procedures and related evaluation or remediation that we believe are necessary. As we continue to evaluate and work to remediate the remaining material weakness, we may need to take additional measures to address the deficiencies. Until the remediation steps set forth above, including the efforts to implement any additional control activities identified in the process, are fully implemented and operate for a sufficient period of time that they can be concluded to be operating effectively, the remaining material weakness described above will not be considered fully remediated. While significant progress has been made toward remediation of the remaining material weakness, no assurance can be provided at this time that the actions and remediation efforts will effectively remediate the remaining material weakness described above or prevent the incidence of other material weaknesses in the Company’s ICFR in the future. Management expects to fully remediate the remaining material weakness identified before the end of Fiscal 2026. See “Risk Factors” in this MD&A and the AIF. Management, including the CEO and CFO, does not expect that DCP or ICFR will prevent all misstatements, even as the remediation measures are implemented and further improved to address the material weakness. The design of any system of internal controls is based in part upon certain assumptions about the likelihood of future events, and there can be no assurance that any design will succeed in achieving the stated goals under all potential future conditions. RISK FACTORS The Company’s business is subject to risks inherent in a high growth, heavily regulated enterprise. We have identified certain risks pertinent to our business that may have affected or may affect our business, financial conditions, results of operations and cash flows, as further described throughout this MD&A and under “Risk Factors” in the AIF. For additional risk factors, readers are directed to the Company’s AIF, which is (a) available under the Company’s issuer profile on SEDAR+ at www.sedarplus.ca, and (b) incorporated into and forms part of the Company's annual report on Form-40F filed on EDGAR at www.sec.gov. As a general matter, management of the Company attempts to assess and mitigate any risks and uncertainties by retaining experienced professional staff and ensuring that the Board of Directors and senior management of the Company are monitoring the risks impacting or likely to impact the business on a continuous basis. (i) Credit Risk Credit risk arises from deposits with banks, short-term investments, outstanding trade and other receivables, restricted cash and other financial assets. For trade receivables, the Company does not hold any collateral as security but mitigates this risk by dealing only with what management believes to be financially sound counterparties and, accordingly, does not anticipate significant loss for non-performance. For other receivables, outside of the normal course of business, management generally obtains guarantees and general security agreements. The maximum exposure to credit risk of cash, short-term investments, restricted cash, other financial assets and accounts receivable and other receivables on the statement of financial position at September 30, 2025 approximates $198,827 (September 30, 2024 - $211,306). MANAGEMENT’S DISCUSSION AND ANALYSIS | FOR THE YEAR ENDED SEPTEMBER 30, 2025 AND 2024 22
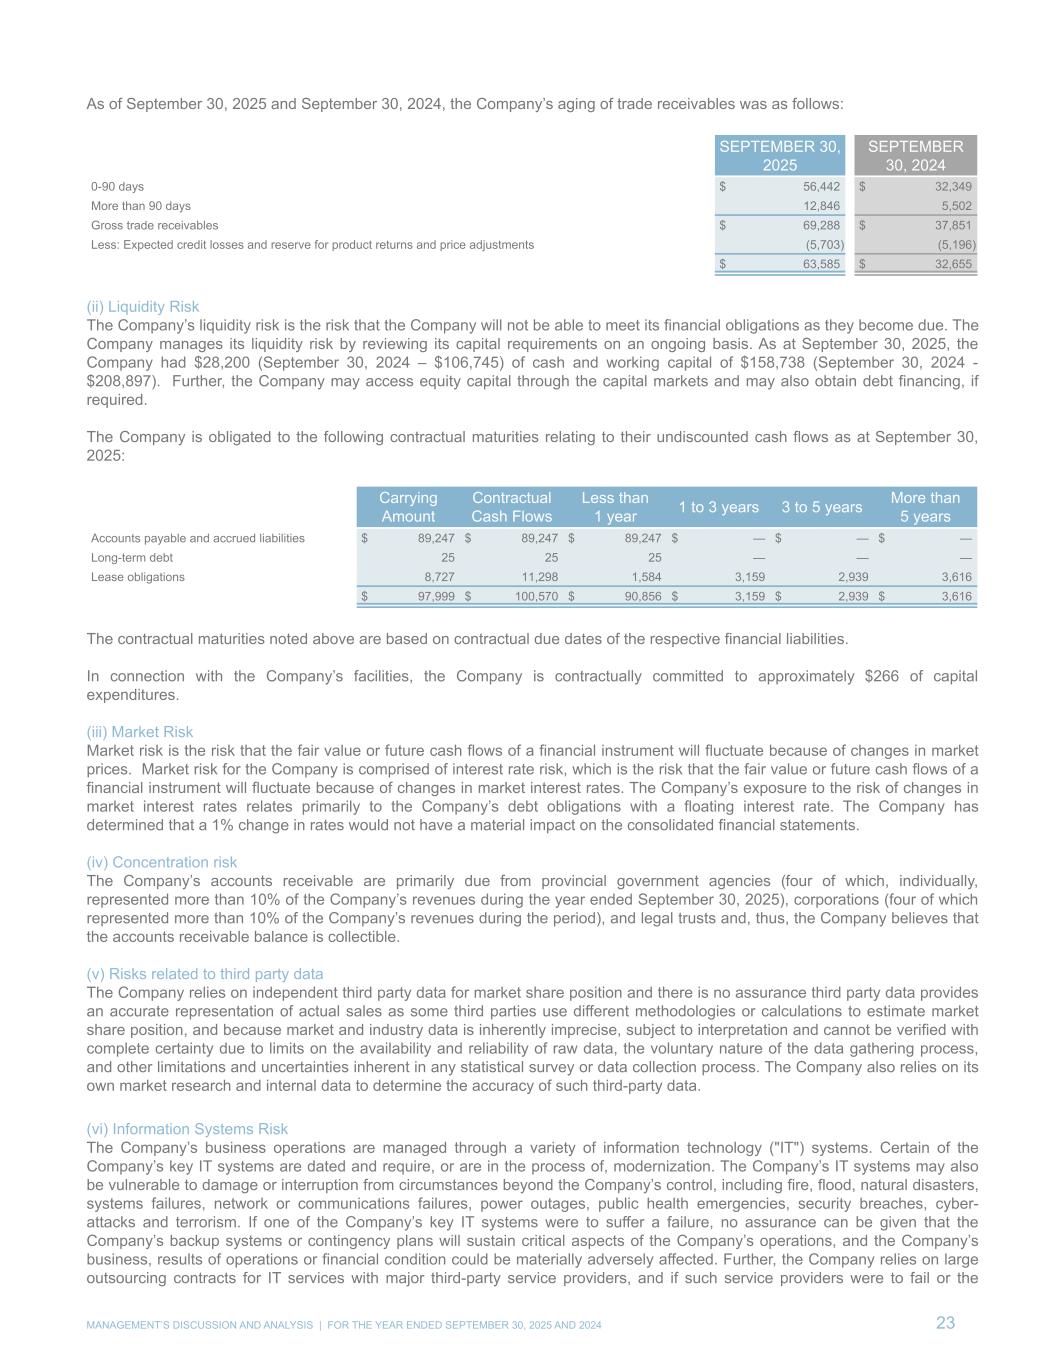
As of September 30, 2025 and September 30, 2024, the Company’s aging of trade receivables was as follows: SEPTEMBER 30, 2025 SEPTEMBER 30, 2024 0-90 days $ 56,442 $ 32,349 More than 90 days 12,846 5,502 Gross trade receivables $ 69,288 $ 37,851 Less: Expected credit losses and reserve for product returns and price adjustments (5,703) (5,196) $ 63,585 $ 32,655 (ii) Liquidity Risk The Company’s liquidity risk is the risk that the Company will not be able to meet its financial obligations as they become due. The Company manages its liquidity risk by reviewing its capital requirements on an ongoing basis. As at September 30, 2025, the Company had $28,200 (September 30, 2024 – $106,745) of cash and working capital of $158,738 (September 30, 2024 - $208,897). Further, the Company may access equity capital through the capital markets and may also obtain debt financing, if required. The Company is obligated to the following contractual maturities relating to their undiscounted cash flows as at September 30, 2025: Carrying Amount Contractual Cash Flows Less than 1 year 1 to 3 years 3 to 5 years More than 5 years Accounts payable and accrued liabilities $ 89,247 $ 89,247 $ 89,247 $ — $ — $ — Long-term debt 25 25 25 — — — Lease obligations 8,727 11,298 1,584 3,159 2,939 3,616 $ 97,999 $ 100,570 $ 90,856 $ 3,159 $ 2,939 $ 3,616 The contractual maturities noted above are based on contractual due dates of the respective financial liabilities. In connection with the Company’s facilities, the Company is contractually committed to approximately $266 of capital expenditures. (iii) Market Risk Market risk is the risk that the fair value or future cash flows of a financial instrument will fluctuate because of changes in market prices. Market risk for the Company is comprised of interest rate risk, which is the risk that the fair value or future cash flows of a financial instrument will fluctuate because of changes in market interest rates. The Company’s exposure to the risk of changes in market interest rates relates primarily to the Company’s debt obligations with a floating interest rate. The Company has determined that a 1% change in rates would not have a material impact on the consolidated financial statements. (iv) Concentration risk The Company’s accounts receivable are primarily due from provincial government agencies (four of which, individually, represented more than 10% of the Company’s revenues during the year ended September 30, 2025), corporations (four of which represented more than 10% of the Company’s revenues during the period), and legal trusts and, thus, the Company believes that the accounts receivable balance is collectible. (v) Risks related to third party data The Company relies on independent third party data for market share position and there is no assurance third party data provides an accurate representation of actual sales as some third parties use different methodologies or calculations to estimate market share position, and because market and industry data is inherently imprecise, subject to interpretation and cannot be verified with complete certainty due to limits on the availability and reliability of raw data, the voluntary nature of the data gathering process, and other limitations and uncertainties inherent in any statistical survey or data collection process. The Company also relies on its own market research and internal data to determine the accuracy of such third-party data. (vi) Information Systems Risk The Company’s business operations are managed through a variety of information technology ("IT") systems. Certain of the Company’s key IT systems are dated and require, or are in the process of, modernization. The Company’s IT systems may also be vulnerable to damage or interruption from circumstances beyond the Company’s control, including fire, flood, natural disasters, systems failures, network or communications failures, power outages, public health emergencies, security breaches, cyber- attacks and terrorism. If one of the Company’s key IT systems were to suffer a failure, no assurance can be given that the Company’s backup systems or contingency plans will sustain critical aspects of the Company’s operations, and the Company’s business, results of operations or financial condition could be materially adversely affected. Further, the Company relies on large outsourcing contracts for IT services with major third-party service providers, and if such service providers were to fail or the MANAGEMENT’S DISCUSSION AND ANALYSIS | FOR THE YEAR ENDED SEPTEMBER 30, 2025 AND 2024 23
relationships with the Company were to end, and the Company were unable to find suitable replacements in a timely manner, the Company’s business, results of operations or financial condition could be materially adversely affected. The Company is continually modifying and enhancing its IT systems and technologies to increase productivity, efficiency and security. As new systems and technologies are implemented, the Company could experience unanticipated difficulties resulting in unexpected costs and adverse impacts to its financial reporting and manufacturing and other business processes. When implemented, the systems and technologies may not provide the benefits anticipated and could add costs and complications to ongoing operations, which may have a material adverse effect on the Company’s business, results of operations or financial condition. During fiscal year 2023 and Fiscal 2024, the Company launched a new ERP system, which provides for a more robust and secure financial system of record, among other supply chain and operational data. Various IT general controls are now centralized currently in the midst of stabilizing a new ERP system, which replaces its previous financial system. There can be no assurance that the ERP system will provide the information and benefits expected by management. Phase 3 of the Company’s ERP system has been implemented; however, there remains a risk of post-implementation challenges during the stabilization period, which could adversely affect operational efficiency or internal controls over financial reporting if not effectively managed. CAUTIONARY STATEMENT REGARDING FORWARD-LOOKING INFORMATION Certain information herein contains or incorporates comments that constitute forward-looking information within the meaning of applicable securities legislation (“forward-looking information”). Forward-looking information, in general, can be identified by the use of forward-looking terminology such as “outlook”, “objective”, “may”, “will”, “could”, “would”, “might”, “expect”, “intend”, “estimate”, “anticipate”, “believe”, “plan”, “continue”, “budget”, “schedule” or “forecast” or similar expressions suggesting future outcomes or events. They include, but are not limited to, statements with respect to expectations, forecasts or other characterizations of future events or circumstances, and the Company’s objectives, goals, strategies, beliefs, intentions, plans, estimates, projections and outlook, including statements relating to the Company’s plans and objectives, or estimates or predictions of actions of customers, suppliers, partners, distributors, competitors or regulatory authorities; and statements regarding the Company’s future economic performance. These statements are not historical facts but instead represent management beliefs regarding future events, many of which by their nature are inherently uncertain and beyond management control. Forward-looking information in this MD&A is based on the Company’s current expectations about future events. Certain forward-looking information in this MD&A includes, but is not limited to the following: • Expectations regarding production capacity, including seed-based cultivation, capability of the beverage manufacturing line, facility size, THC content, costs and yields; • Expectations regarding the prospects of the Company’s collaboration and investment transaction with BAT; • Expectations regarding the prospects for the Company’s primary operating subsidiary, Organigram Inc.; • Expectations around demand for cannabis and related products, future opportunities and sales, including the relative mix of medical versus recreational cannabis products, the relative mix of products within the recreational category; • Changes in legislation related to permitted cannabis types, forms, and potency, and legislation of additional cannabis types and forms for adult use recreational cannabis in Canada, including regulations relating thereto, the timing and the implementation thereof, and our future product forms; • Expectations around branded cannabis products with respect to timing, launch, product attributes, composition and consumer demand; • Expectations around the revenue growth from innovative products, particularly the commercialization of its new FASTTM nanoemulsion technology; • The scope of protection the Company is able to establish and maintain, if any, for its intellectual property ("IP") rights; • Strategic investments and capital expenditures, and expected related benefits; • Expectations regarding the Company's investments in OBX, Phylos and Sanity Group; • Expectations regarding EU-GMP certification, including successful completion of the audit and timing for the issuance of the certification, if successful; • The general continuance of current, or where applicable, assumed industry conditions; • Changes in laws, regulations, guidelines, and policies, and the interpretation thereof, including those relating to the recreational and/or medical cannabis markets domestically and internationally, minor cannabinoids and environmental programs; • The price of cannabis and derivative cannabis products; • The impact of the Company’s cash flow and financial performance on third parties, including its supply partners; • Fluctuations in the price of Common Shares and the market for Common Shares; • The treatment of the Company's business under international regulatory regimes and impacts on changes thereto on the Company's international sales; • The Company’s growth strategy, targets for future growth and forecasts of the results of such growth; MANAGEMENT’S DISCUSSION AND ANALYSIS | FOR THE YEAR ENDED SEPTEMBER 30, 2025 AND 2024 24
• Expectations concerning access to capital and liquidity, and the Company’s ability to access the public markets from time to time to fund operational activities and growth; • Expectations concerning the Company's financial position, future liquidity and other financial results; • The ability of the Company to generate cash flow from operations and from financing activities; • The competitive conditions of the industry, including the Company’s ability to maintain or grow its market share; • Expectations regarding the Company's ability to generate cost savings from operational effectiveness and automation initiatives; • Expectations regarding capital expenditures and timing thereof; and • Expectations concerning the Company's performance during the first quarter of fiscal year 2026 and full-year fiscal 2026, including with respect to revenue, adjusted gross margin, selling, general and administrative expenses, adjusted EBITDA Free Cash Flow, and cash from operations before working capital changes. Forward-looking information is provided for the purposes of assisting the reader in understanding the Company and its business, operations, risks, financial performance, financial position and cash flows as at and for the periods ended on certain dates, and to present information about management’s current expectations and plans relating to the future, and the reader is cautioned that such statements may not be appropriate for other purposes. In addition, this MD&A may contain forward-looking information attributed to third party industry sources. Undue reliance should not be placed on forward-looking information, as there can be no assurance that the plans, intentions or expectations upon which they are based will occur. Forward-looking information does not guarantee future performance and involves known and unknown risks, uncertainties and other factors that may cause actual results or events to differ materially from those anticipated in the forward-looking information. By its nature, forward-looking information involves numerous assumptions, known and unknown risks and uncertainties, both general and specific, that contribute to the possibility that the expectations, predictions, forecasts, projections and conclusions will not occur or prove accurate, that assumptions may not be correct, and that objectives, strategic goals and priorities will not be achieved. These and other factors may cause actual results or events to differ materially from those anticipated in the forward-looking information. Factors that could cause actual results to differ materially from those set forth in forward-looking information include, but are not limited to: financial risks; cyber security risks; dependence on senior management and other key personnel, the Board, consultants and advisors; availability and sufficiency of insurance including continued availability and sufficiency of director and officer and other forms of insurance; the Company and its subsidiaries being able to, where applicable, cultivate cannabis pursuant to applicable law and on the currently anticipated timelines and in anticipated volumes; industry competition; global events, including heightened economic and industry uncertainty as a result of any pandemic or epidemic and governmental action in respect thereto, including with respect to impacts on production, operations, disclosure controls and procedures or internal control over financial reporting, and supply chain and distribution disruptions; facility and technological risks; changes to government laws, regulations or policy, including the amendment of the definition of hemp in the 2018 Farm Bill to effectively eliminate hemp-derived THC products, environmental or tax, or the enforcement thereof; agricultural risks; ability to maintain any required licenses or certifications; supply risks; product risks; construction delays or postponements; packaging and shipping logistics; inflationary risk, expected number of medical and recreational cannabis users in Canada and internationally; continuation of shipments to existing and prospective international jurisdictions and customers; potential time frame for the implementation of legislation to legalize cannabis internationally; the Company’s, its subsidiaries' and its investees’ ability to, where applicable, obtain and/or maintain their status as LP or other applicable licensees; risk factors affecting its investees; availability of any required financing on commercially acceptable terms or at all; the potential size of the regulated recreational cannabis market in Canada; demand for and changes in the Company’s cannabis and related products, including the Company’s derivative products, and the sufficiency of the retail networks to supply such demand; ability to enter and participate in international market opportunities; general economic, financial market, regulatory, industry and political conditions affecting the Company; the ability of the Company to compete in the cannabis industry and changes in the competitive landscape; a material decline in cannabis prices; the Company’s ability to manage anticipated and unanticipated costs; the Company’s ability to implement and maintain effective internal control over financial reporting and disclosure controls and procedures; risks relating to potential failure of the Company's IT system; ongoing expansions to the Company's ERP system; continuing to meet listing standards for the TSX and the NASDAQ; risks relating to the Company's IP; liquidity risk; concentration risk; and other risks and factors described from time to time in the documents filed by the Company with securities regulators in Canada and the United States. Material factors and assumptions used in establishing forward-looking information include that production activities will proceed as planned, and demand for cannabis and related products will change in the manner expected by management. All forward-looking information is provided as of the date of this MD&A. Certain forward-looking information included herein may also constitute a "financial outlook" within the meaning of applicable securities legislation. Financial outlook involves statements about the Company's prospective financial performance and financial position that are based on and subject to the assumptions about future economic conditions and courses of action described above as well as management's expectations regarding a strong innovation pipeline, increasing international sales, high cannabis quality and higher potency, commercialization of FAST nano-emulsion technology in ingestible formats, and receipt of the EU- GMP certification. Such assumptions are based on management's assessment of the relevant information currently available and any financial outlook included herein is provided for the purpose of helping readers understand managements's current expectations and plans for the future as of the date hereof. The actual results of the Company's operations may vary from the amounts set forth in any financial outlook and such variances may be material. Readers are cautioned that reliance on any MANAGEMENT’S DISCUSSION AND ANALYSIS | FOR THE YEAR ENDED SEPTEMBER 30, 2025 AND 2024 25
financial outlook may not be appropriate for other purposes, or in other circumstances and that the risk factors described above and other factors may cause actual results to differ materially from any financial outlook. The Company does not undertake to update any such forward-looking information whether as a result of new information, future events or otherwise, except as required by law. ADDITIONAL INFORMATION ABOUT THE ASSUMPTIONS, RISKS AND UNCERTAINTIES OF THE COMPANY’S BUSINESS AND MATERIAL FACTORS OR ASSUMPTIONS ON WHICH INFORMATION CONTAINED IN FORWARD-LOOKING INFORMATION IS BASED IS PROVIDED IN THE COMPANY’S DISCLOSURE MATERIALS, INCLUDING IN THIS MD&A UNDER “RISK FACTORS” AND THE COMPANY’S CURRENT AIF UNDER “RISK FACTORS”, FILED WITH THE SECURITIES REGULATORY AUTHORITIES IN CANADA AND AVAILABLE UNDER THE COMPANY’S ISSUER PROFILE ON SEDAR+ AT WWW.SEDARPLUS.CA, AND FILED WITH OR FURNISHED TO THE SEC AND AVAILABLE ON EDGAR AT WWW.SEC.GOV. ALL FORWARD-LOOKING INFORMATION IN THIS MD&A IS QUALIFIED BY THESE CAUTIONARY STATEMENTS. CAUTIONARY STATEMENT REGARDING CERTAIN NON-IFRS MEASURES This MD&A contains certain financial and operational performance measures that are not recognized or defined under IFRS (i.e. non-IFRS measures). As there are no standardized methods of calculating these non-IFRS measures, the Company's approaches may differ from those used by others and this data may not be comparable to similar data presented by other LPs and cannabis companies. For an explanation of these measures to related comparable financial information presented in the Financial Statements prepared in accordance with IFRS, refer to the discussion below. The Company believes that these non-IFRS measures are useful indicators of operating performance and are specifically used by management to assess the financial and operating performance of the Company. These non-IFRS measures include, but are not limited to, the following: • Adjusted gross margin is calculated by subtracting cost of sales, before the effects of: (i) unrealized gain on changes in fair value of biological assets; (ii) realized fair value on inventories sold and other inventory charges; (iii) realized fair value on inventories sold from acquisitions; (iv) provisions and impairment of inventories and biological assets; and (v) provisions to net realizable value. Adjusted gross margin percentage is calculated by dividing adjusted gross margin by net revenue. Adjusted gross margin is reconciled to the most directly comparable IFRS financial measure in the "Financial Results and Review of Operations" section of this MD&A. Management believes that these measures provide useful information to assess the profitability of our operations as they represent the normalized gross margin generated from operations and exclude the effects of non-cash fair value adjustments on inventories and biological assets, which are required by IFRS. The most directly comparable measure to adjusted gross margin calculated in accordance with IFRS is gross margin before fair value adjustments. • Adjusted EBITDA is calculated as net income (loss) excluding: financing costs, net of investment income; income tax expense (recovery); depreciation, amortization, impairment, normalization of depreciation add-back due to changes in depreciable assets resulting from impairment charges, (gain) loss on disposal of property, plant and equipment (per the consolidated statement of cash flows); share-based compensation (per the consolidated statement of cash flows); share of loss (gain) from investments in associates including impairment loss; change in fair value of contingent consideration; change in fair value of derivative liabilities, other financial assets and preferred shares; expenditures incurred in connection with research and development activities (net of depreciation); unrealized gain on changes in fair value of biological assets; realized fair value on inventories sold and other inventory charges; provisions and net realizable value adjustments related to inventory and biological assets; government subsidies, insurance recoveries and other non- operating expenses (income); legal provisions (recoveries); ERP implementation costs; transaction costs; share issuance costs; and provision for Canndoc (as defined herein) expected credit losses. Adjusted EBITDA is reconciled to the most directly comparable IFRS financial measure in the "Financial Results and Review of Operations" section of this MD&A. During the second quarter of Fiscal 2024, management changed the calculation of adjusted EBITDA and has conformed prior quarters accordingly to include provision for expected credit losses. Adjusted EBITDA is intended to provide a proxy for the Company’s operating cash flow and derives expectations of future financial performance for the Company, and excludes adjustments that are not reflective of current operating results. The most directly comparable measure to adjusted EBITDA calculated in accordance with IFRS is net income (loss). • Free Cash Flow provided by (used in) operating activities is calculated as net cash provided by or used in operating activities less the purchase of property, plant and equipment. Free Cash Flow is reconciled to the most directly comparable IFRS financial measure in the "Balance Sheet, Liquidity and Capital Resources" section of this MD&A. MANAGEMENT’S DISCUSSION AND ANALYSIS | FOR THE YEAR ENDED SEPTEMBER 30, 2025 AND 2024 26

Free Cash Flow is a useful indicator of the Company's capacity to fund operations from internally generated cash flows, without the need for additional borrowings or use of existing cash reserves under normal operating conditions. The most directly comparable measure to Free Cash Flow calculated in accordance with IFRS is net cash and restricted cash provided by (used in) operating activities. Non-IFRS measures should be considered together with other data prepared in accordance with IFRS to enable investors to evaluate the Company’s operating results, underlying performance and prospects in a manner similar to the Company’s management. Accordingly, these non-IFRS measures are intended to provide additional information and should not be considered in isolation or as a substitute for measures of performance prepared in accordance with IFRS. MANAGEMENT’S DISCUSSION AND ANALYSIS | FOR THE YEAR ENDED SEPTEMBER 30, 2025 AND 2024 27

TABLE OF CONTENTS Management’s Responsibility for the Financial Statements 1 Independent Auditor's Reports 2 – 8 Consolidated Statements of Financial Position 9 Consolidated Statements of Operations and Comprehensive Loss 10 Consolidated Statements of Changes in Equity 11 Consolidated Statements of Cash Flows 12 Notes to the Consolidated Financial Statements 13 – 44
December 11, 2025 Management’s Responsibility for the Financial Statements The accompanying consolidated financial statements of Organigram Global Inc. (the “Company”) have been prepared by the Company’s management in accordance with International Financial Reporting Standards as issued by the International Accounting Standards Board and contain estimates based on management’s judgment. Internal control systems are maintained by management to provide reasonable assurance that assets are safe-guarded and financial information is reliable. The Board of Directors of the Company is responsible for ensuring that management fulfills its responsibilities for financial reporting and is ultimately responsible for reviewing and approving the financial statements and the accompanying management discussion and analysis. The Board of Directors carries out this responsibility principally through its Audit Committee. The Audit Committee is appointed by the Board of Directors. It meets with the Company’s management and auditors, and reviews internal controls and financial reporting matters to ensure that management is properly discharging its responsibilities before submitting the financial statements to the Board of Directors for approval. (signed) ‘Peter Amirault’ (signed) ‘Greg Guyatt’ Executive Chair Chief Financial Officer Toronto, Ontario Toronto, Ontario CONSOLIDATED FINANCIAL STATEMENTS | FOR THE YEAR ENDED SEPTEMBER 30, 2025 AND 2024 1
CONSOLIDATED FINANCIAL STATEMENTS | FOR THE YEAR ENDED SEPTEMBER 30, 2025 AND 2024 2
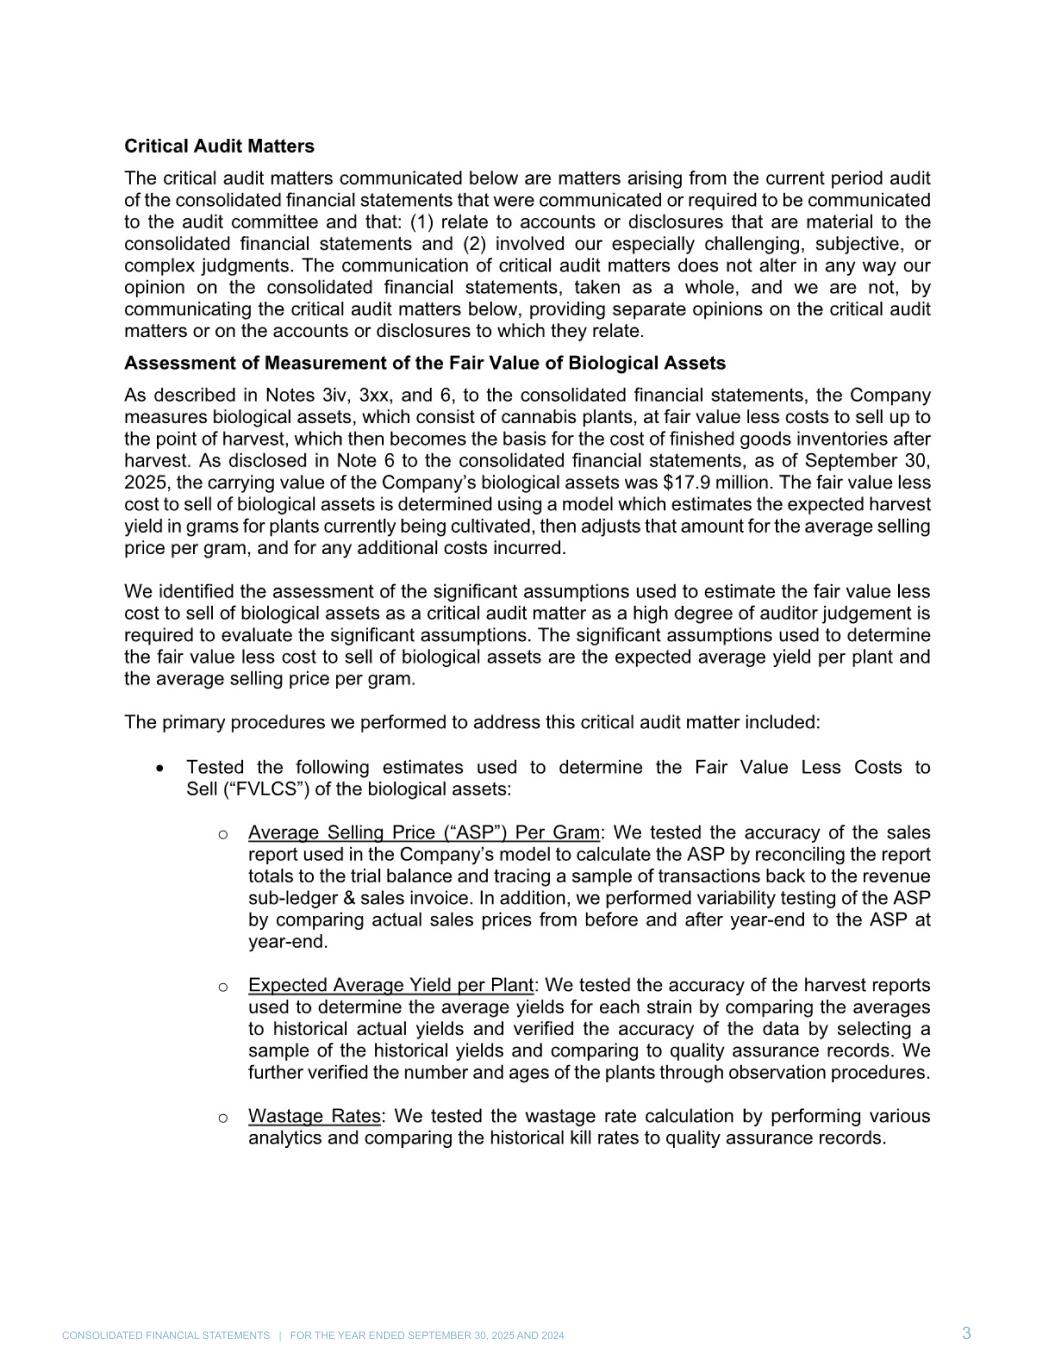
CONSOLIDATED FINANCIAL STATEMENTS | FOR THE YEAR ENDED SEPTEMBER 30, 2025 AND 2024 3
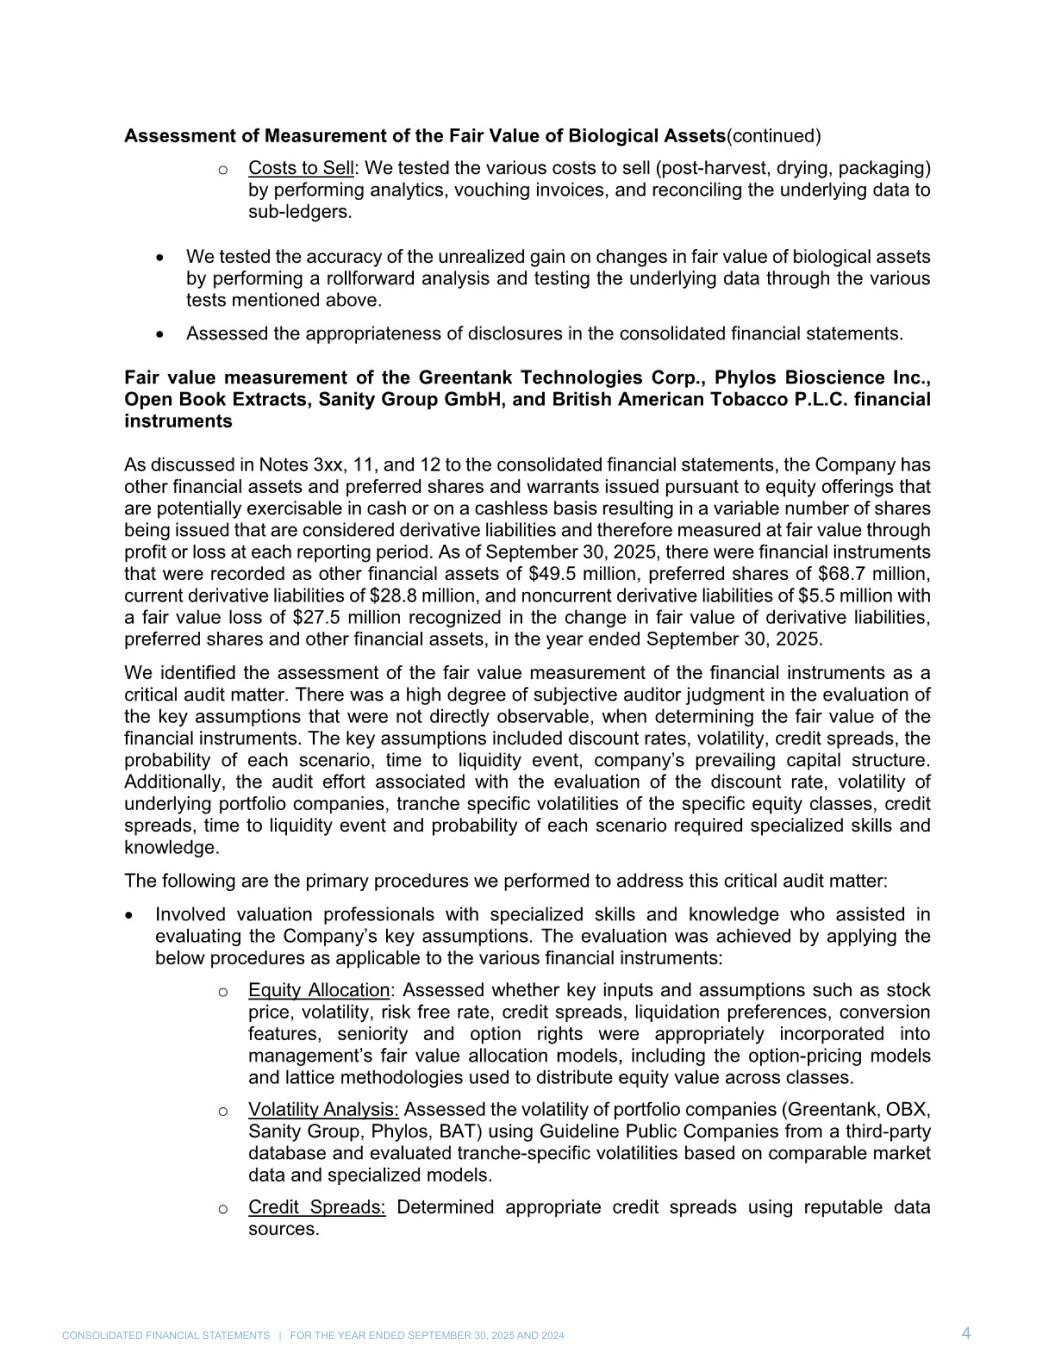
CONSOLIDATED FINANCIAL STATEMENTS | FOR THE YEAR ENDED SEPTEMBER 30, 2025 AND 2024 4
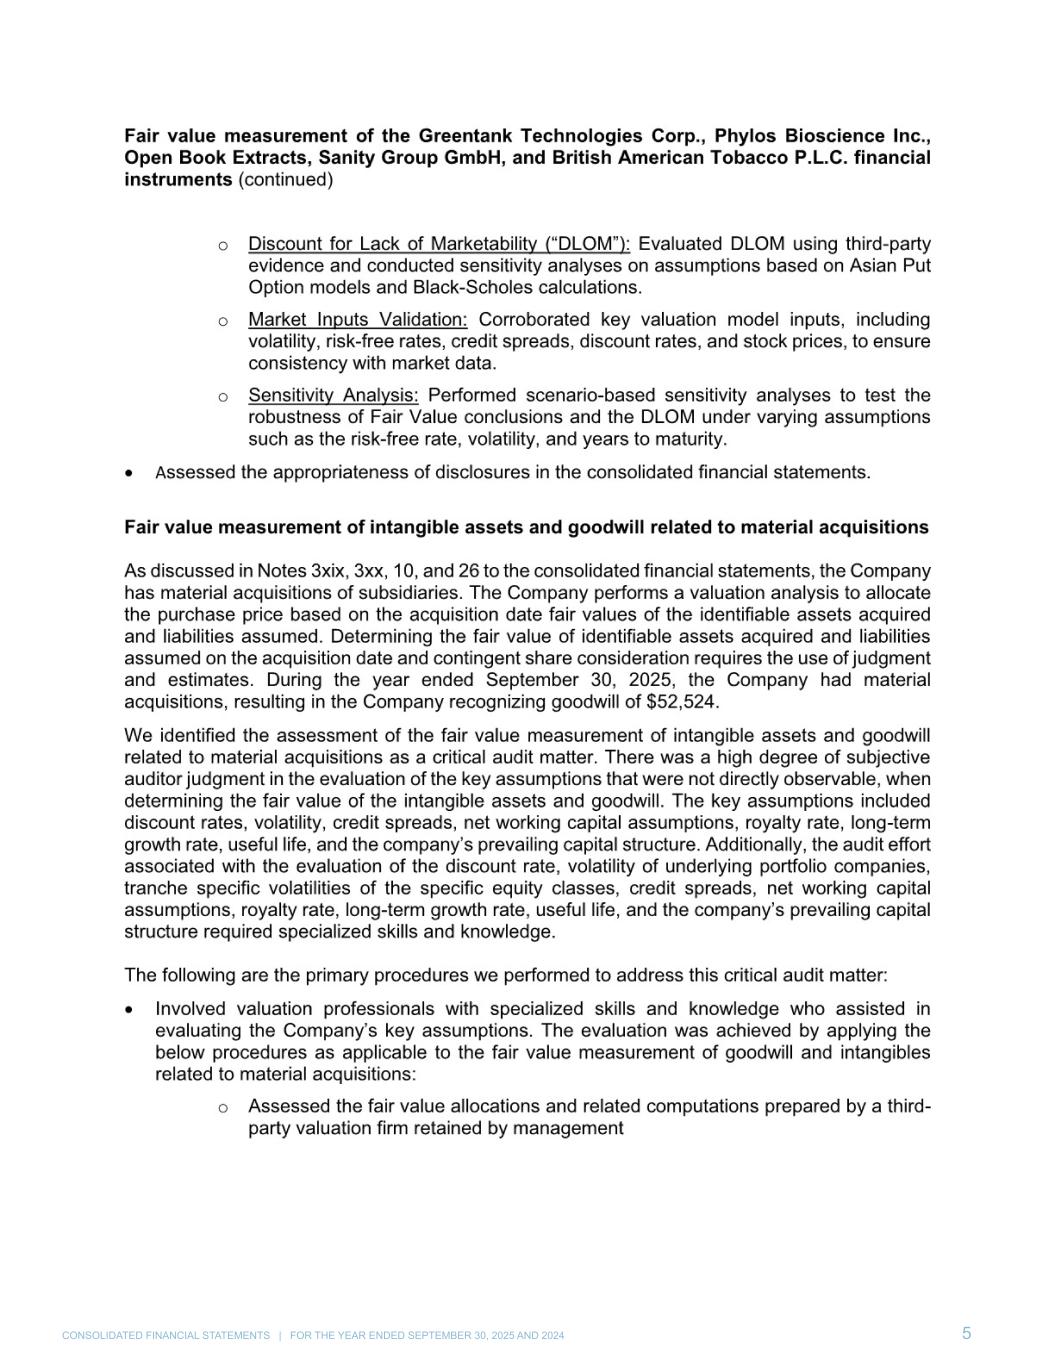
CONSOLIDATED FINANCIAL STATEMENTS | FOR THE YEAR ENDED SEPTEMBER 30, 2025 AND 2024 5
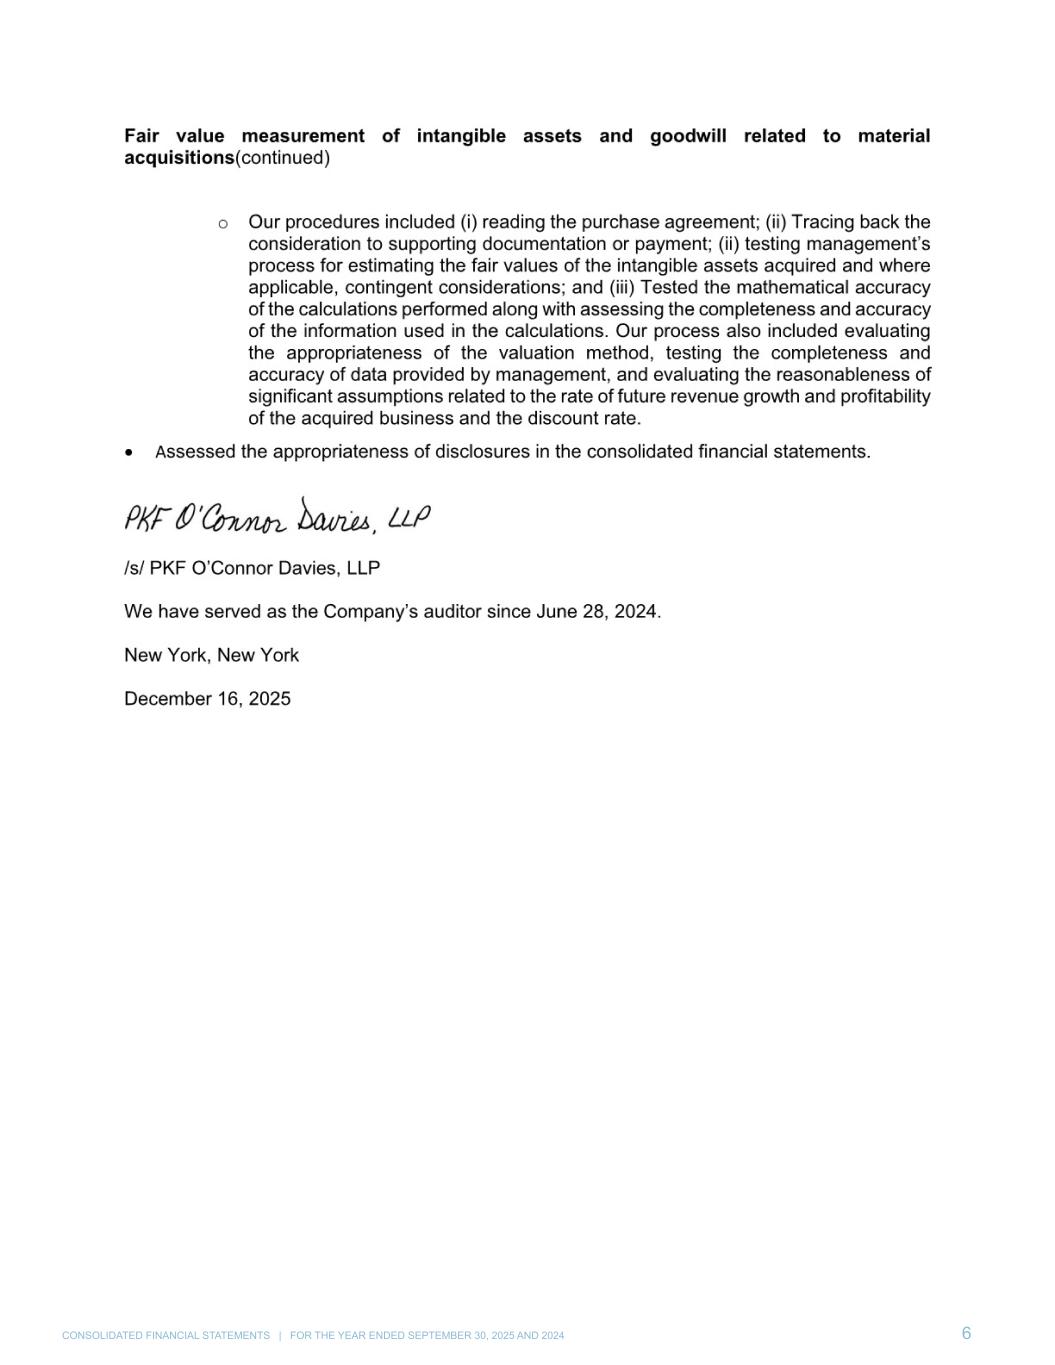
CONSOLIDATED FINANCIAL STATEMENTS | FOR THE YEAR ENDED SEPTEMBER 30, 2025 AND 2024 6
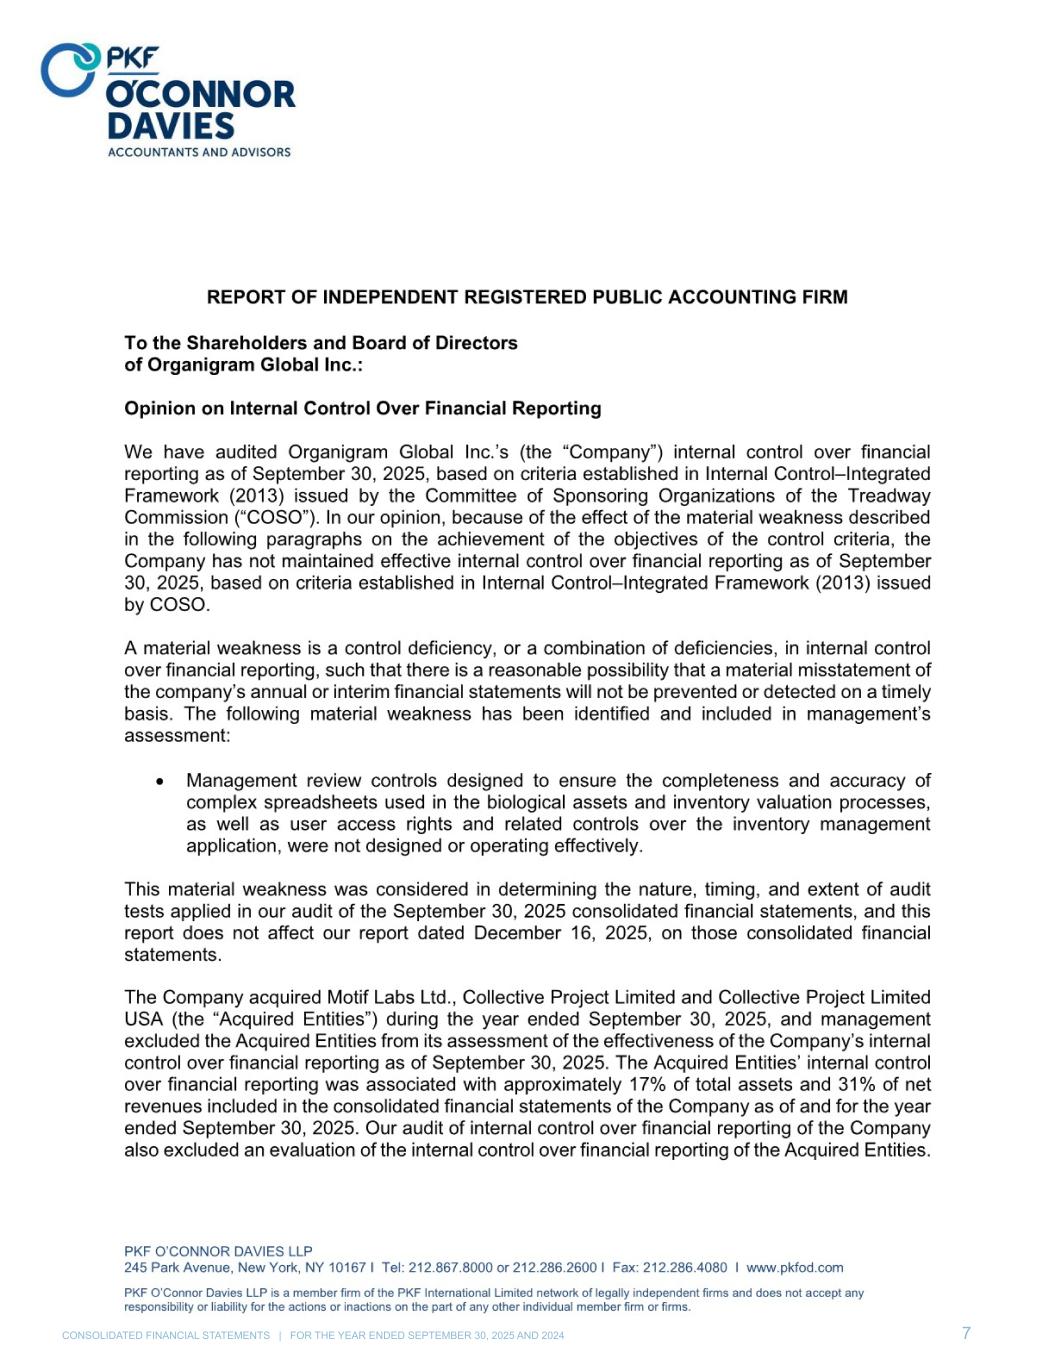
CONSOLIDATED FINANCIAL STATEMENTS | FOR THE YEAR ENDED SEPTEMBER 30, 2025 AND 2024 7
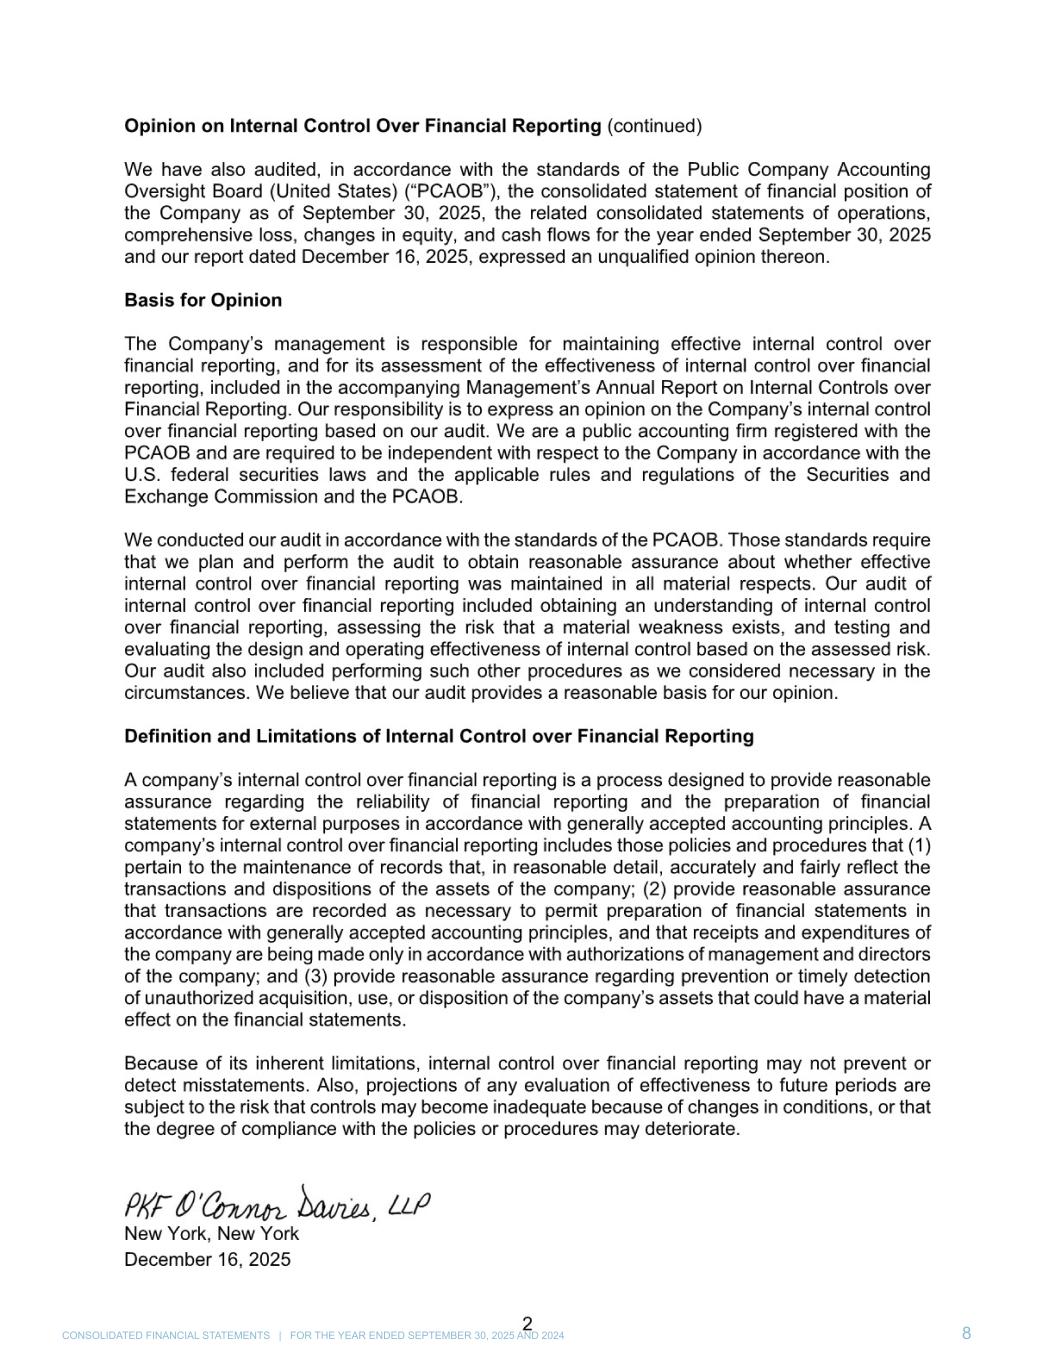
CONSOLIDATED FINANCIAL STATEMENTS | FOR THE YEAR ENDED SEPTEMBER 30, 2025 AND 2024 8
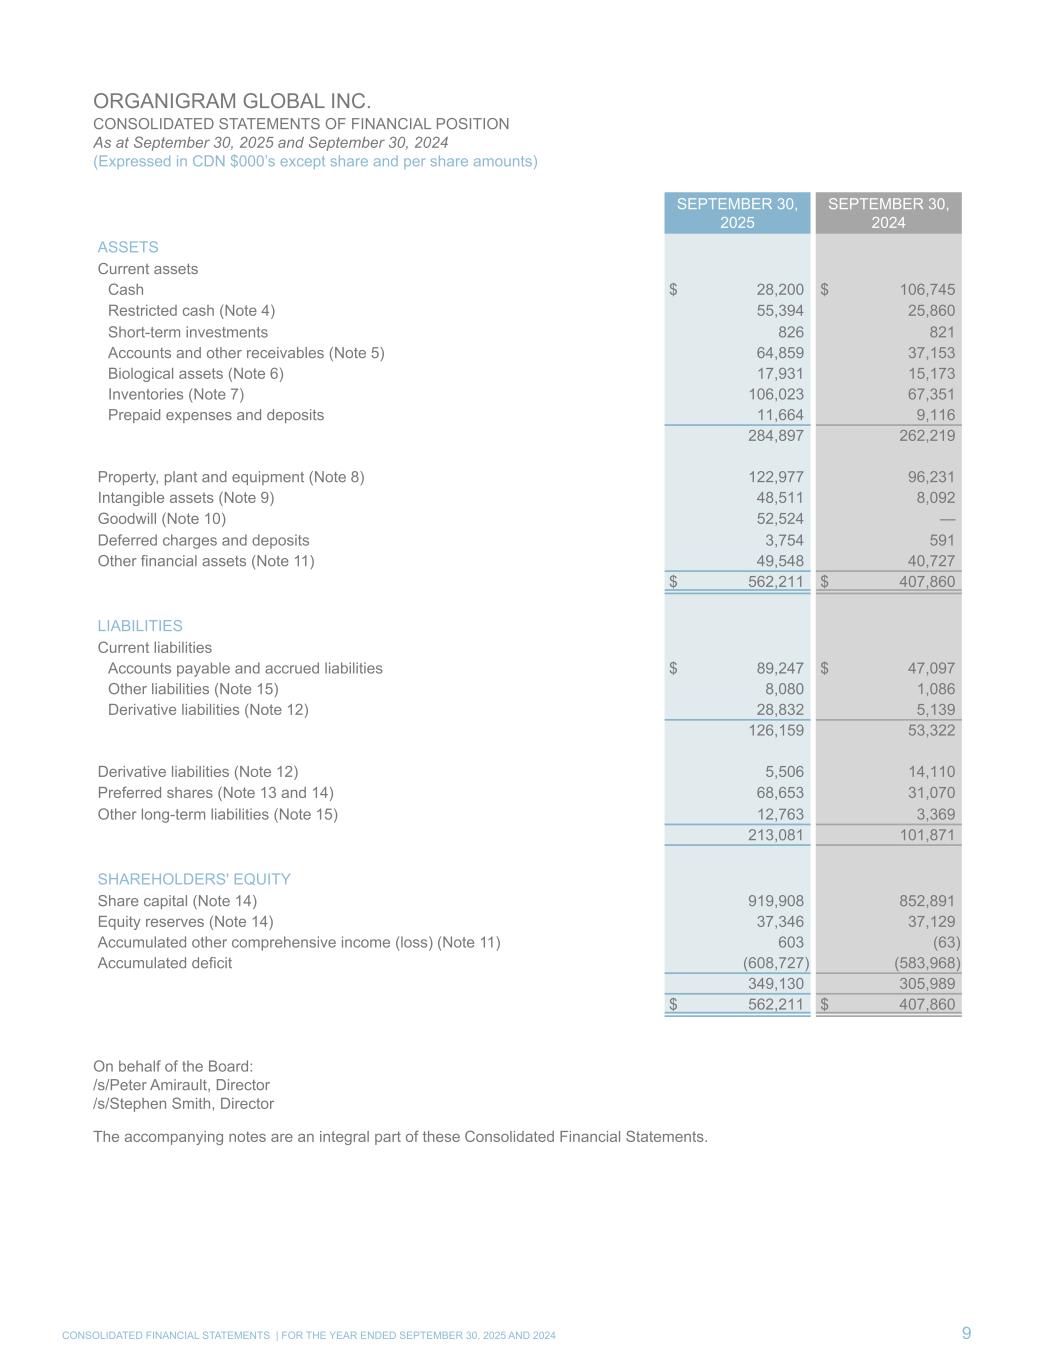
ORGANIGRAM GLOBAL INC. CONSOLIDATED STATEMENTS OF FINANCIAL POSITION As at September 30, 2025 and September 30, 2024 (Expressed in CDN $000’s except share and per share amounts) SEPTEMBER 30, 2025 SEPTEMBER 30, 2024 ASSETS Current assets Cash $ 28,200 $ 106,745 Restricted cash (Note 4) 55,394 25,860 Short-term investments 826 821 Accounts and other receivables (Note 5) 64,859 37,153 Biological assets (Note 6) 17,931 15,173 Inventories (Note 7) 106,023 67,351 Prepaid expenses and deposits 11,664 9,116 284,897 262,219 Property, plant and equipment (Note 8) 122,977 96,231 Intangible assets (Note 9) 48,511 8,092 Goodwill (Note 10) 52,524 — Deferred charges and deposits 3,754 591 Other financial assets (Note 11) 49,548 40,727 $ 562,211 $ 407,860 LIABILITIES Current liabilities Accounts payable and accrued liabilities $ 89,247 $ 47,097 Other liabilities (Note 15) 8,080 1,086 Derivative liabilities (Note 12) 28,832 5,139 126,159 53,322 Derivative liabilities (Note 12) 5,506 14,110 Preferred shares (Note 13 and 14) 68,653 31,070 Other long-term liabilities (Note 15) 12,763 3,369 213,081 101,871 SHAREHOLDERS' EQUITY Share capital (Note 14) 919,908 852,891 Equity reserves (Note 14) 37,346 37,129 Accumulated other comprehensive income (loss) (Note 11) 603 (63) Accumulated deficit (608,727) (583,968) 349,130 305,989 $ 562,211 $ 407,860 On behalf of the Board: /s/Peter Amirault, Director /s/Stephen Smith, Director The accompanying notes are an integral part of these Consolidated Financial Statements. CONSOLIDATED FINANCIAL STATEMENTS | FOR THE YEAR ENDED SEPTEMBER 30, 2025 AND 2024 9
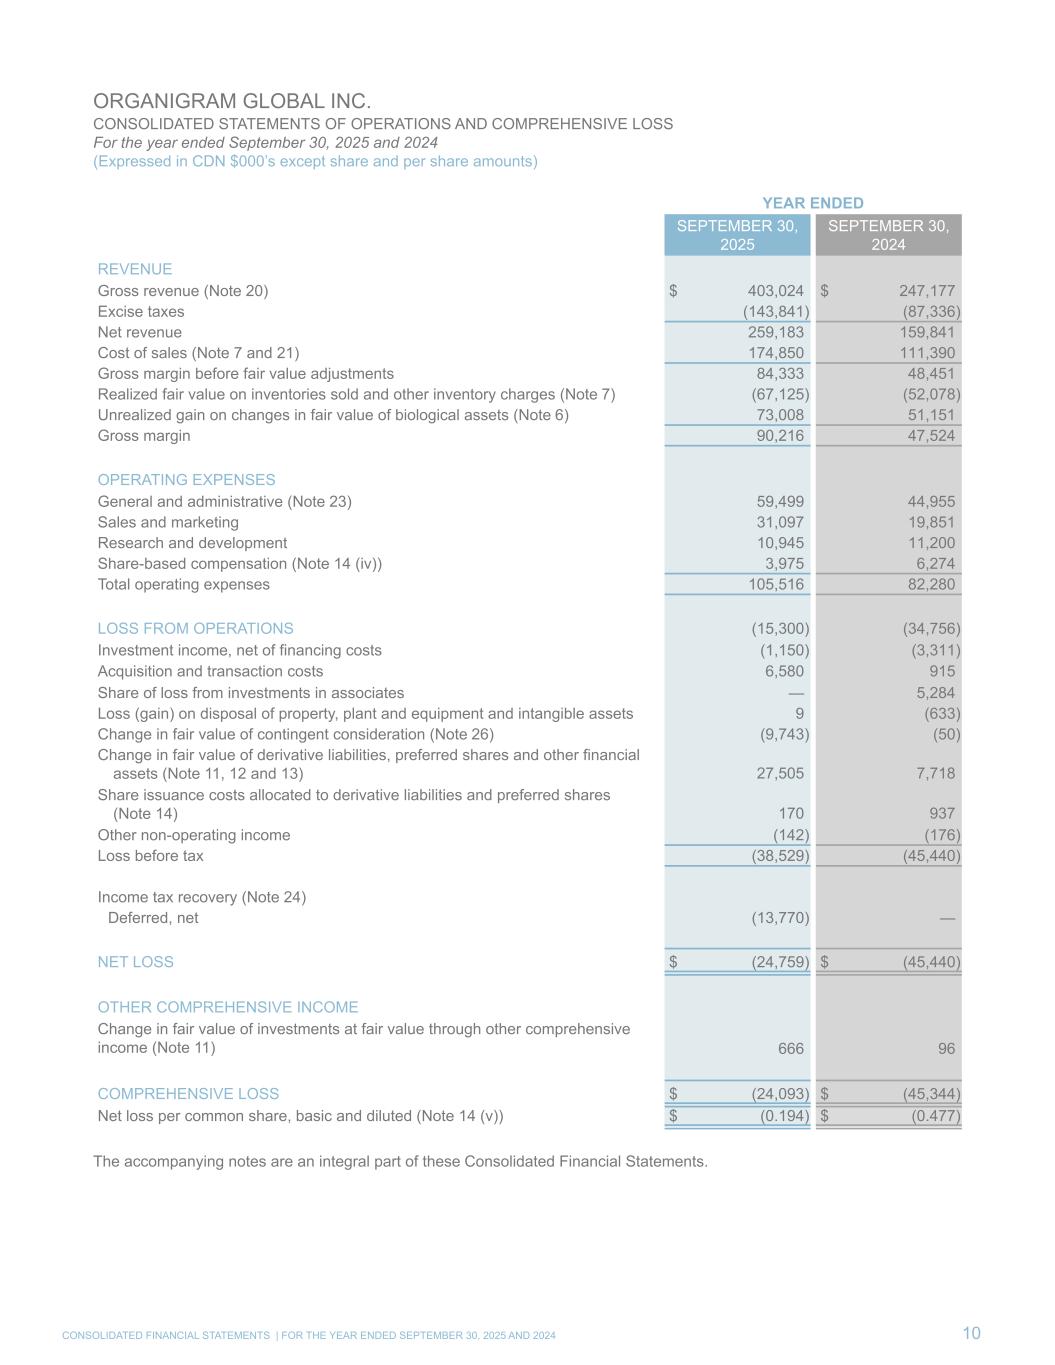
ORGANIGRAM GLOBAL INC. CONSOLIDATED STATEMENTS OF OPERATIONS AND COMPREHENSIVE LOSS For the year ended September 30, 2025 and 2024 (Expressed in CDN $000’s except share and per share amounts) YEAR ENDED SEPTEMBER 30, 2025 SEPTEMBER 30, 2024 REVENUE Gross revenue (Note 20) $ 403,024 $ 247,177 Excise taxes (143,841) (87,336) Net revenue 259,183 159,841 Cost of sales (Note 7 and 21) 174,850 111,390 Gross margin before fair value adjustments 84,333 48,451 Realized fair value on inventories sold and other inventory charges (Note 7) (67,125) (52,078) Unrealized gain on changes in fair value of biological assets (Note 6) 73,008 51,151 Gross margin 90,216 47,524 OPERATING EXPENSES General and administrative (Note 23) 59,499 44,955 Sales and marketing 31,097 19,851 Research and development 10,945 11,200 Share-based compensation (Note 14 (iv)) 3,975 6,274 Total operating expenses 105,516 82,280 LOSS FROM OPERATIONS (15,300) (34,756) Investment income, net of financing costs (1,150) (3,311) Acquisition and transaction costs 6,580 915 Share of loss from investments in associates — 5,284 Loss (gain) on disposal of property, plant and equipment and intangible assets 9 (633) Change in fair value of contingent consideration (Note 26) (9,743) (50) Change in fair value of derivative liabilities, preferred shares and other financial assets (Note 11, 12 and 13) 27,505 7,718 Share issuance costs allocated to derivative liabilities and preferred shares (Note 14) 170 937 Other non-operating income (142) (176) Loss before tax (38,529) (45,440) Income tax recovery (Note 24) Deferred, net (13,770) — NET LOSS $ (24,759) $ (45,440) OTHER COMPREHENSIVE INCOME Change in fair value of investments at fair value through other comprehensive income (Note 11) 666 96 COMPREHENSIVE LOSS $ (24,093) $ (45,344) Net loss per common share, basic and diluted (Note 14 (v)) $ (0.194) $ (0.477) The accompanying notes are an integral part of these Consolidated Financial Statements. CONSOLIDATED FINANCIAL STATEMENTS | FOR THE YEAR ENDED SEPTEMBER 30, 2025 AND 2024 10
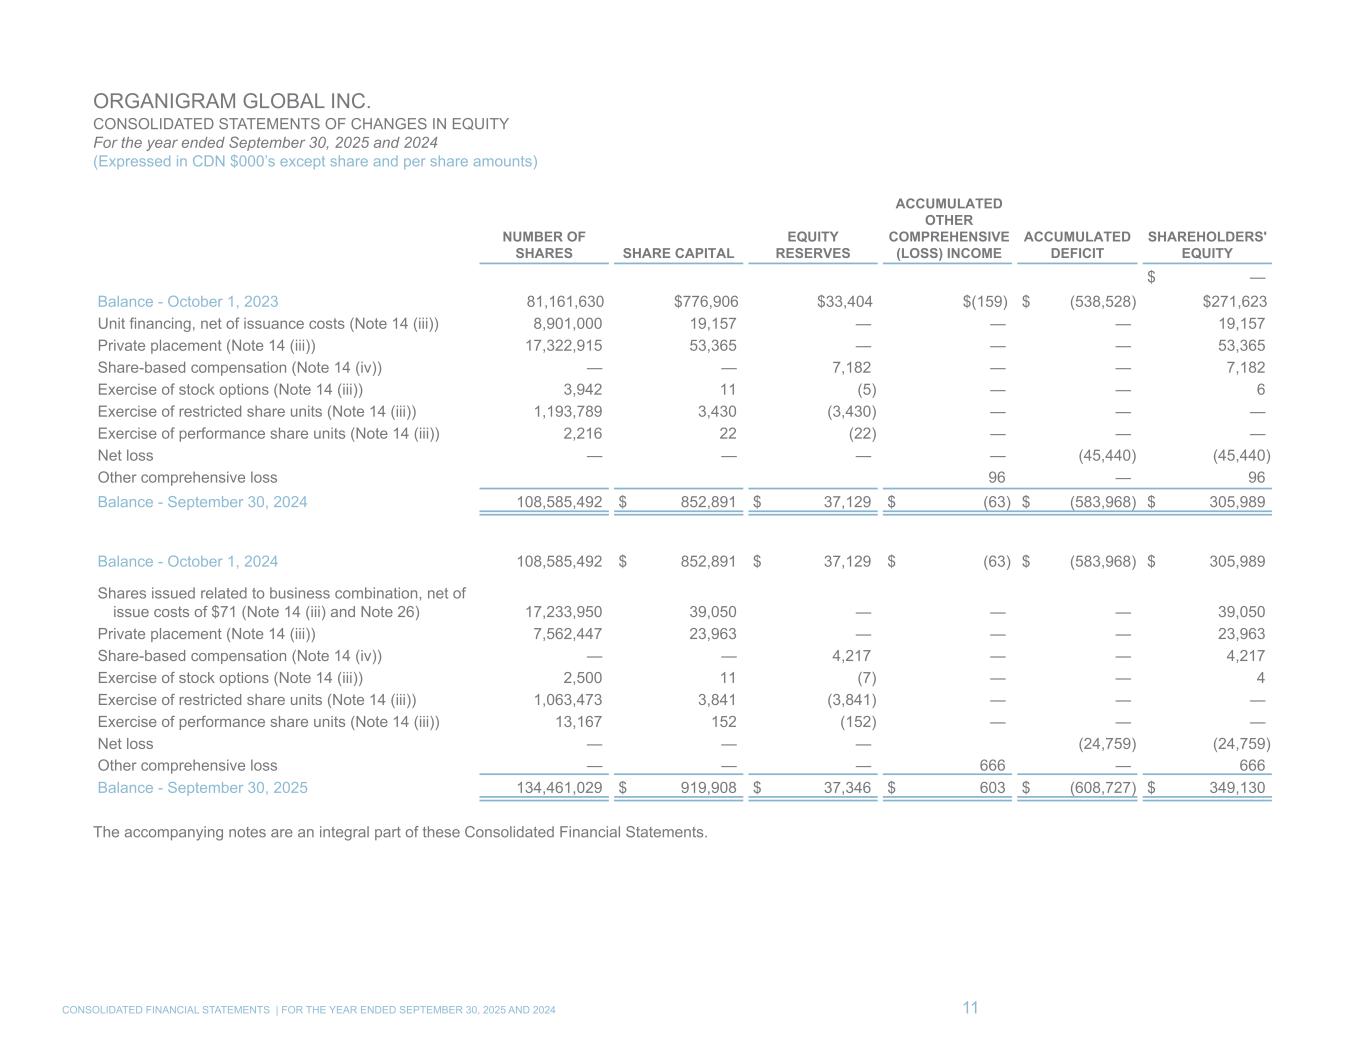
ORGANIGRAM GLOBAL INC. CONSOLIDATED STATEMENTS OF CHANGES IN EQUITY For the year ended September 30, 2025 and 2024 (Expressed in CDN $000’s except share and per share amounts) NUMBER OF SHARES SHARE CAPITAL EQUITY RESERVES ACCUMULATED OTHER COMPREHENSIVE (LOSS) INCOME ACCUMULATED DEFICIT SHAREHOLDERS' EQUITY $ — Balance - October 1, 2023 81,161,630 $776,906 $33,404 $(159) $ (538,528) $271,623 Unit financing, net of issuance costs (Note 14 (iii)) 8,901,000 19,157 — — — 19,157 Private placement (Note 14 (iii)) 17,322,915 53,365 — — — 53,365 Share-based compensation (Note 14 (iv)) — — 7,182 — — 7,182 Exercise of stock options (Note 14 (iii)) 3,942 11 (5) — — 6 Exercise of restricted share units (Note 14 (iii)) 1,193,789 3,430 (3,430) — — — Exercise of performance share units (Note 14 (iii)) 2,216 22 (22) — — — Net loss — — — — (45,440) (45,440) Other comprehensive loss 96 — 96 Balance - September 30, 2024 108,585,492 $ 852,891 $ 37,129 $ (63) $ (583,968) $ 305,989 Balance - October 1, 2024 108,585,492 $ 852,891 $ 37,129 $ (63) $ (583,968) $ 305,989 Shares issued related to business combination, net of issue costs of $71 (Note 14 (iii) and Note 26) 17,233,950 39,050 — — — 39,050 Private placement (Note 14 (iii)) 7,562,447 23,963 — — — 23,963 Share-based compensation (Note 14 (iv)) — — 4,217 — — 4,217 Exercise of stock options (Note 14 (iii)) 2,500 11 (7) — — 4 Exercise of restricted share units (Note 14 (iii)) 1,063,473 3,841 (3,841) — — — Exercise of performance share units (Note 14 (iii)) 13,167 152 (152) — — — Net loss — — — (24,759) (24,759) Other comprehensive loss — — — 666 — 666 Balance - September 30, 2025 134,461,029 $ 919,908 $ 37,346 $ 603 $ (608,727) $ 349,130 The accompanying notes are an integral part of these Consolidated Financial Statements. CONSOLIDATED FINANCIAL STATEMENTS | FOR THE YEAR ENDED SEPTEMBER 30, 2025 AND 2024 11
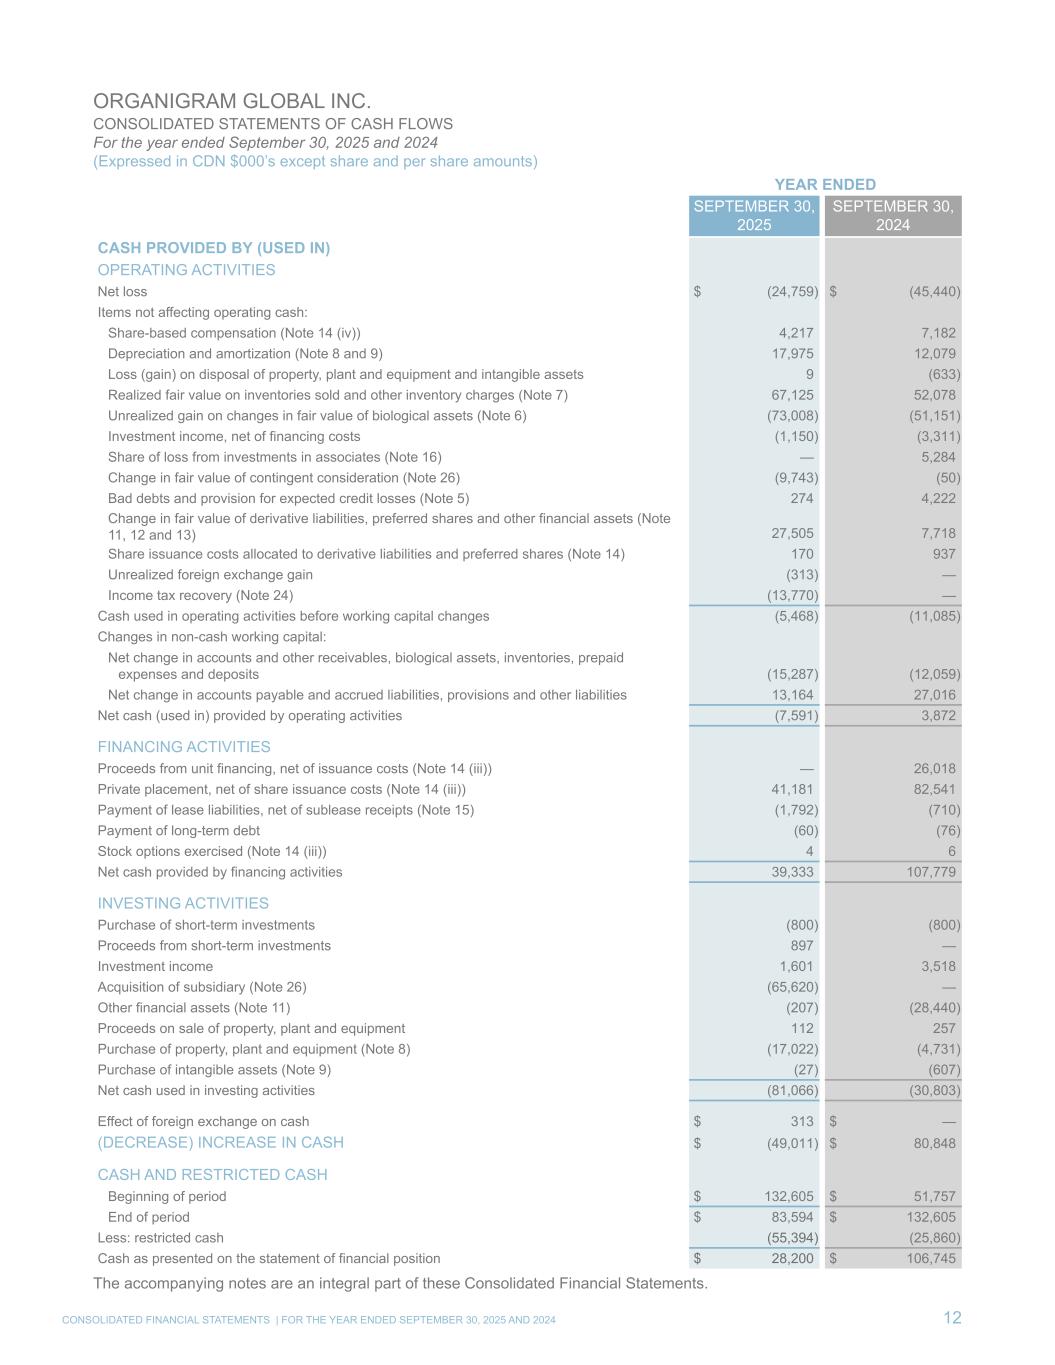
ORGANIGRAM GLOBAL INC. CONSOLIDATED STATEMENTS OF CASH FLOWS For the year ended September 30, 2025 and 2024 (Expressed in CDN $000’s except share and per share amounts) YEAR ENDED SEPTEMBER 30, 2025 SEPTEMBER 30, 2024 CASH PROVIDED BY (USED IN) OPERATING ACTIVITIES Net loss $ (24,759) $ (45,440) Items not affecting operating cash: Share-based compensation (Note 14 (iv)) 4,217 7,182 Depreciation and amortization (Note 8 and 9) 17,975 12,079 Loss (gain) on disposal of property, plant and equipment and intangible assets 9 (633) Realized fair value on inventories sold and other inventory charges (Note 7) 67,125 52,078 Unrealized gain on changes in fair value of biological assets (Note 6) (73,008) (51,151) Investment income, net of financing costs (1,150) (3,311) Share of loss from investments in associates (Note 16) — 5,284 Change in fair value of contingent consideration (Note 26) (9,743) (50) Bad debts and provision for expected credit losses (Note 5) 274 4,222 Change in fair value of derivative liabilities, preferred shares and other financial assets (Note 11, 12 and 13) 27,505 7,718 Share issuance costs allocated to derivative liabilities and preferred shares (Note 14) 170 937 Unrealized foreign exchange gain (313) — Income tax recovery (Note 24) (13,770) — Cash used in operating activities before working capital changes (5,468) (11,085) Changes in non-cash working capital: Net change in accounts and other receivables, biological assets, inventories, prepaid expenses and deposits (15,287) (12,059) Net change in accounts payable and accrued liabilities, provisions and other liabilities 13,164 27,016 Net cash (used in) provided by operating activities (7,591) 3,872 FINANCING ACTIVITIES Proceeds from unit financing, net of issuance costs (Note 14 (iii)) — 26,018 Private placement, net of share issuance costs (Note 14 (iii)) 41,181 82,541 Payment of lease liabilities, net of sublease receipts (Note 15) (1,792) (710) Payment of long-term debt (60) (76) Stock options exercised (Note 14 (iii)) 4 6 Net cash provided by financing activities 39,333 107,779 INVESTING ACTIVITIES Purchase of short-term investments (800) (800) Proceeds from short-term investments 897 — Investment income 1,601 3,518 Acquisition of subsidiary (Note 26) (65,620) — Other financial assets (Note 11) (207) (28,440) Proceeds on sale of property, plant and equipment 112 257 Purchase of property, plant and equipment (Note 8) (17,022) (4,731) Purchase of intangible assets (Note 9) (27) (607) Net cash used in investing activities (81,066) (30,803) Effect of foreign exchange on cash $ 313 $ — (DECREASE) INCREASE IN CASH $ (49,011) $ 80,848 CASH AND RESTRICTED CASH Beginning of period $ 132,605 $ 51,757 End of period $ 83,594 $ 132,605 Less: restricted cash (55,394) (25,860) Cash as presented on the statement of financial position $ 28,200 $ 106,745 The accompanying notes are an integral part of these Consolidated Financial Statements. CONSOLIDATED FINANCIAL STATEMENTS | FOR THE YEAR ENDED SEPTEMBER 30, 2025 AND 2024 12
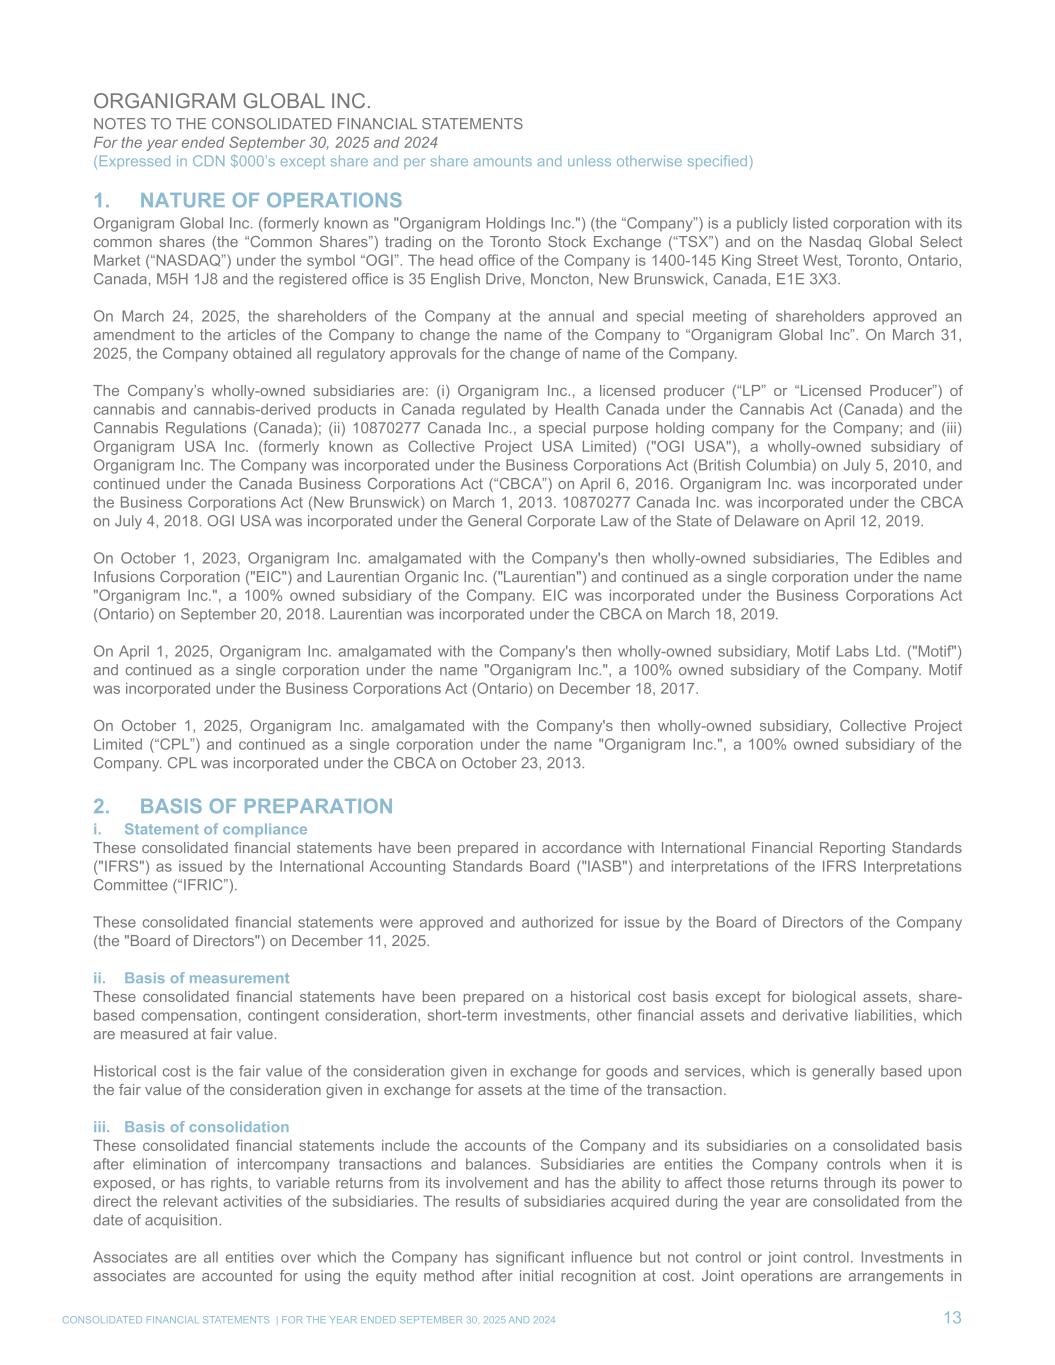
ORGANIGRAM GLOBAL INC. NOTES TO THE CONSOLIDATED FINANCIAL STATEMENTS For the year ended September 30, 2025 and 2024 (Expressed in CDN $000’s except share and per share amounts and unless otherwise specified) 1. NATURE OF OPERATIONS Organigram Global Inc. (formerly known as "Organigram Holdings Inc.") (the “Company”) is a publicly listed corporation with its common shares (the “Common Shares”) trading on the Toronto Stock Exchange (“TSX”) and on the Nasdaq Global Select Market (“NASDAQ”) under the symbol “OGI”. The head office of the Company is 1400-145 King Street West, Toronto, Ontario, Canada, M5H 1J8 and the registered office is 35 English Drive, Moncton, New Brunswick, Canada, E1E 3X3. On March 24, 2025, the shareholders of the Company at the annual and special meeting of shareholders approved an amendment to the articles of the Company to change the name of the Company to “Organigram Global Inc”. On March 31, 2025, the Company obtained all regulatory approvals for the change of name of the Company. The Company’s wholly-owned subsidiaries are: (i) Organigram Inc., a licensed producer (“LP” or “Licensed Producer”) of cannabis and cannabis-derived products in Canada regulated by Health Canada under the Cannabis Act (Canada) and the Cannabis Regulations (Canada); (ii) 10870277 Canada Inc., a special purpose holding company for the Company; and (iii) Organigram USA Inc. (formerly known as Collective Project USA Limited) ("OGI USA"), a wholly-owned subsidiary of Organigram Inc. The Company was incorporated under the Business Corporations Act (British Columbia) on July 5, 2010, and continued under the Canada Business Corporations Act (“CBCA”) on April 6, 2016. Organigram Inc. was incorporated under the Business Corporations Act (New Brunswick) on March 1, 2013. 10870277 Canada Inc. was incorporated under the CBCA on July 4, 2018. OGI USA was incorporated under the General Corporate Law of the State of Delaware on April 12, 2019. On October 1, 2023, Organigram Inc. amalgamated with the Company's then wholly-owned subsidiaries, The Edibles and Infusions Corporation ("EIC") and Laurentian Organic Inc. ("Laurentian") and continued as a single corporation under the name "Organigram Inc.", a 100% owned subsidiary of the Company. EIC was incorporated under the Business Corporations Act (Ontario) on September 20, 2018. Laurentian was incorporated under the CBCA on March 18, 2019. On April 1, 2025, Organigram Inc. amalgamated with the Company's then wholly-owned subsidiary, Motif Labs Ltd. ("Motif") and continued as a single corporation under the name "Organigram Inc.", a 100% owned subsidiary of the Company. Motif was incorporated under the Business Corporations Act (Ontario) on December 18, 2017. On October 1, 2025, Organigram Inc. amalgamated with the Company's then wholly-owned subsidiary, Collective Project Limited (“CPL”) and continued as a single corporation under the name "Organigram Inc.", a 100% owned subsidiary of the Company. CPL was incorporated under the CBCA on October 23, 2013. 2. BASIS OF PREPARATION i. Statement of compliance These consolidated financial statements have been prepared in accordance with International Financial Reporting Standards ("IFRS") as issued by the International Accounting Standards Board ("IASB") and interpretations of the IFRS Interpretations Committee (“IFRIC”). These consolidated financial statements were approved and authorized for issue by the Board of Directors of the Company (the "Board of Directors") on December 11, 2025. ii. Basis of measurement These consolidated financial statements have been prepared on a historical cost basis except for biological assets, share- based compensation, contingent consideration, short-term investments, other financial assets and derivative liabilities, which are measured at fair value. Historical cost is the fair value of the consideration given in exchange for goods and services, which is generally based upon the fair value of the consideration given in exchange for assets at the time of the transaction. iii. Basis of consolidation These consolidated financial statements include the accounts of the Company and its subsidiaries on a consolidated basis after elimination of intercompany transactions and balances. Subsidiaries are entities the Company controls when it is exposed, or has rights, to variable returns from its involvement and has the ability to affect those returns through its power to direct the relevant activities of the subsidiaries. The results of subsidiaries acquired during the year are consolidated from the date of acquisition. Associates are all entities over which the Company has significant influence but not control or joint control. Investments in associates are accounted for using the equity method after initial recognition at cost. Joint operations are arrangements in CONSOLIDATED FINANCIAL STATEMENTS | FOR THE YEAR ENDED SEPTEMBER 30, 2025 AND 2024 13
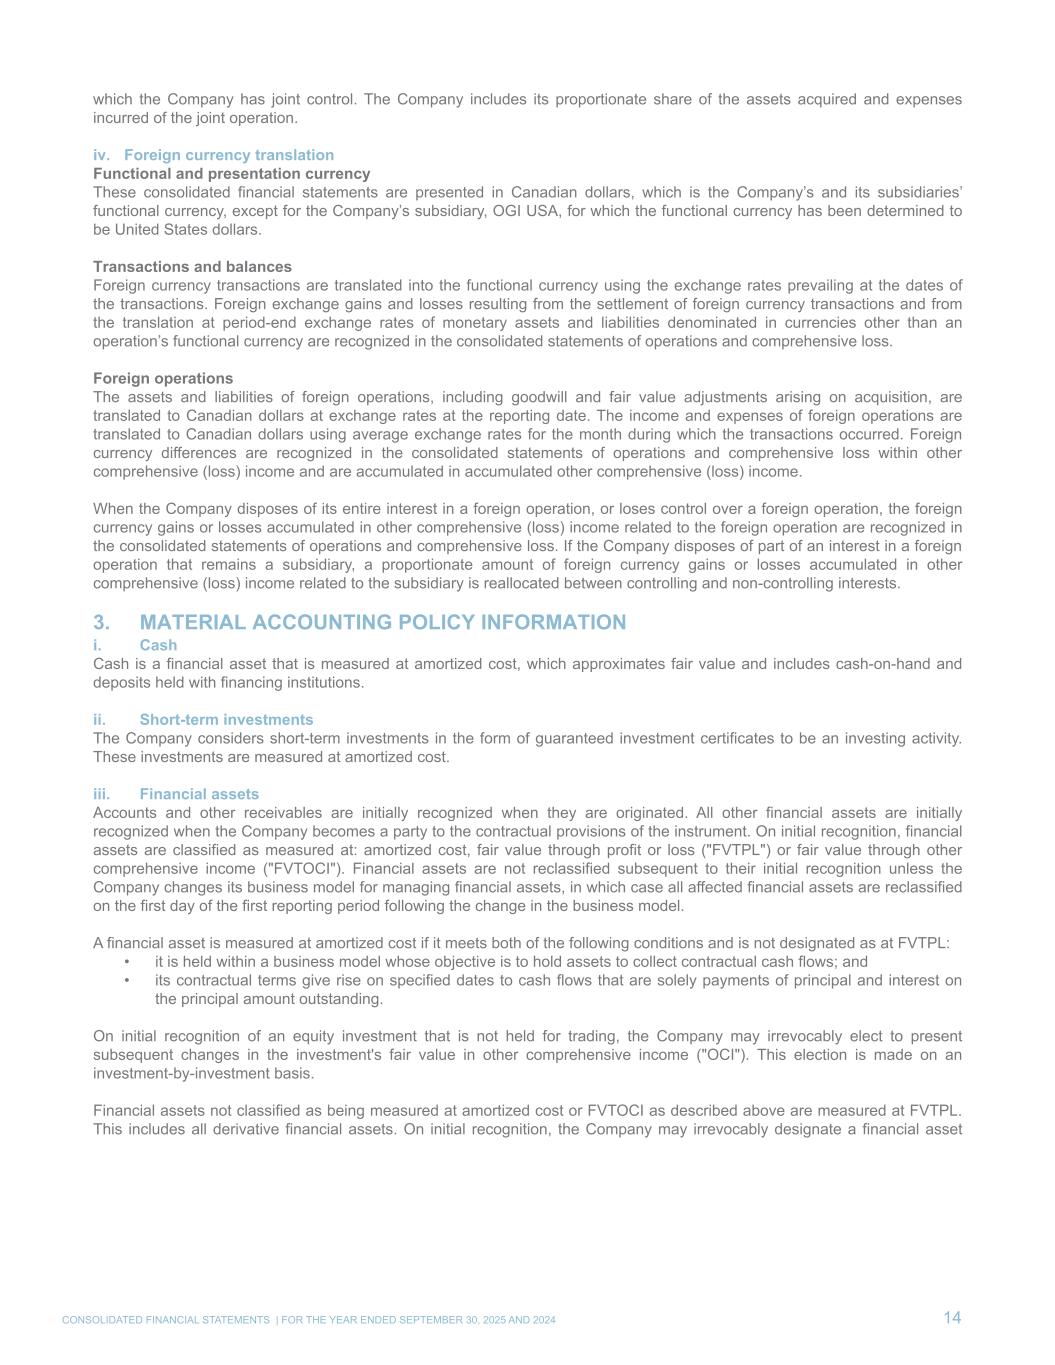
which the Company has joint control. The Company includes its proportionate share of the assets acquired and expenses incurred of the joint operation. iv. Foreign currency translation Functional and presentation currency These consolidated financial statements are presented in Canadian dollars, which is the Company’s and its subsidiaries’ functional currency, except for the Company’s subsidiary, OGI USA, for which the functional currency has been determined to be United States dollars. Transactions and balances Foreign currency transactions are translated into the functional currency using the exchange rates prevailing at the dates of the transactions. Foreign exchange gains and losses resulting from the settlement of foreign currency transactions and from the translation at period-end exchange rates of monetary assets and liabilities denominated in currencies other than an operation’s functional currency are recognized in the consolidated statements of operations and comprehensive loss. Foreign operations The assets and liabilities of foreign operations, including goodwill and fair value adjustments arising on acquisition, are translated to Canadian dollars at exchange rates at the reporting date. The income and expenses of foreign operations are translated to Canadian dollars using average exchange rates for the month during which the transactions occurred. Foreign currency differences are recognized in the consolidated statements of operations and comprehensive loss within other comprehensive (loss) income and are accumulated in accumulated other comprehensive (loss) income. When the Company disposes of its entire interest in a foreign operation, or loses control over a foreign operation, the foreign currency gains or losses accumulated in other comprehensive (loss) income related to the foreign operation are recognized in the consolidated statements of operations and comprehensive loss. If the Company disposes of part of an interest in a foreign operation that remains a subsidiary, a proportionate amount of foreign currency gains or losses accumulated in other comprehensive (loss) income related to the subsidiary is reallocated between controlling and non-controlling interests. 3. MATERIAL ACCOUNTING POLICY INFORMATION i. Cash Cash is a financial asset that is measured at amortized cost, which approximates fair value and includes cash-on-hand and deposits held with financing institutions. ii. Short-term investments The Company considers short-term investments in the form of guaranteed investment certificates to be an investing activity. These investments are measured at amortized cost. iii. Financial assets Accounts and other receivables are initially recognized when they are originated. All other financial assets are initially recognized when the Company becomes a party to the contractual provisions of the instrument. On initial recognition, financial assets are classified as measured at: amortized cost, fair value through profit or loss ("FVTPL") or fair value through other comprehensive income ("FVTOCI"). Financial assets are not reclassified subsequent to their initial recognition unless the Company changes its business model for managing financial assets, in which case all affected financial assets are reclassified on the first day of the first reporting period following the change in the business model. A financial asset is measured at amortized cost if it meets both of the following conditions and is not designated as at FVTPL: • it is held within a business model whose objective is to hold assets to collect contractual cash flows; and • its contractual terms give rise on specified dates to cash flows that are solely payments of principal and interest on the principal amount outstanding. On initial recognition of an equity investment that is not held for trading, the Company may irrevocably elect to present subsequent changes in the investment's fair value in other comprehensive income ("OCI"). This election is made on an investment-by-investment basis. Financial assets not classified as being measured at amortized cost or FVTOCI as described above are measured at FVTPL. This includes all derivative financial assets. On initial recognition, the Company may irrevocably designate a financial asset CONSOLIDATED FINANCIAL STATEMENTS | FOR THE YEAR ENDED SEPTEMBER 30, 2025 AND 2024 14
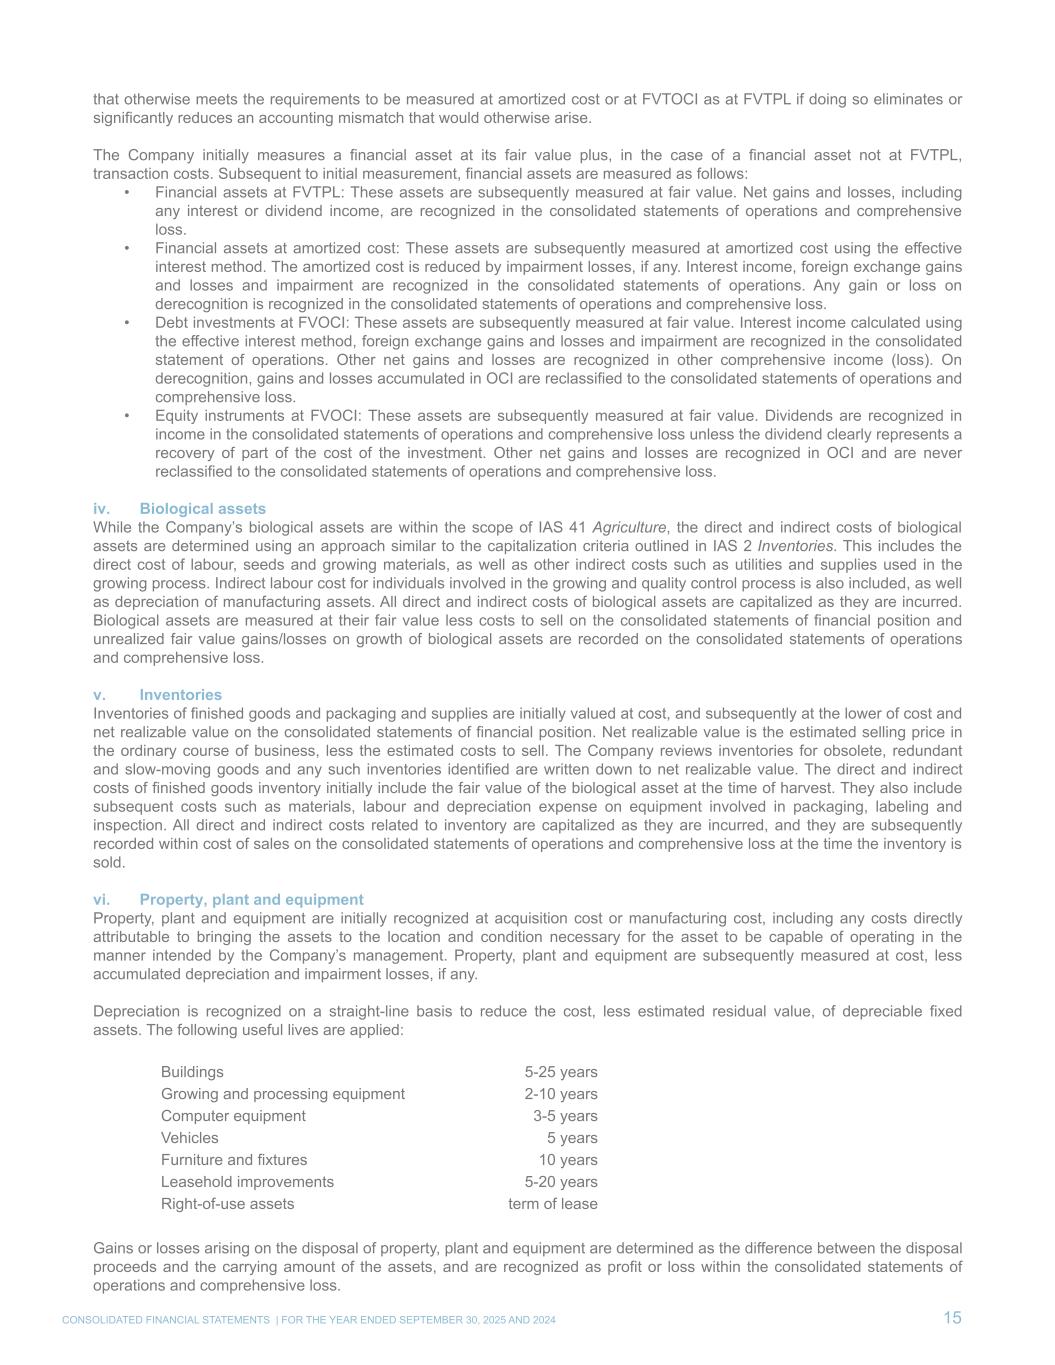
that otherwise meets the requirements to be measured at amortized cost or at FVTOCI as at FVTPL if doing so eliminates or significantly reduces an accounting mismatch that would otherwise arise. The Company initially measures a financial asset at its fair value plus, in the case of a financial asset not at FVTPL, transaction costs. Subsequent to initial measurement, financial assets are measured as follows: • Financial assets at FVTPL: These assets are subsequently measured at fair value. Net gains and losses, including any interest or dividend income, are recognized in the consolidated statements of operations and comprehensive loss. • Financial assets at amortized cost: These assets are subsequently measured at amortized cost using the effective interest method. The amortized cost is reduced by impairment losses, if any. Interest income, foreign exchange gains and losses and impairment are recognized in the consolidated statements of operations. Any gain or loss on derecognition is recognized in the consolidated statements of operations and comprehensive loss. • Debt investments at FVOCI: These assets are subsequently measured at fair value. Interest income calculated using the effective interest method, foreign exchange gains and losses and impairment are recognized in the consolidated statement of operations. Other net gains and losses are recognized in other comprehensive income (loss). On derecognition, gains and losses accumulated in OCI are reclassified to the consolidated statements of operations and comprehensive loss. • Equity instruments at FVOCI: These assets are subsequently measured at fair value. Dividends are recognized in income in the consolidated statements of operations and comprehensive loss unless the dividend clearly represents a recovery of part of the cost of the investment. Other net gains and losses are recognized in OCI and are never reclassified to the consolidated statements of operations and comprehensive loss. iv. Biological assets While the Company’s biological assets are within the scope of IAS 41 Agriculture, the direct and indirect costs of biological assets are determined using an approach similar to the capitalization criteria outlined in IAS 2 Inventories. This includes the direct cost of labour, seeds and growing materials, as well as other indirect costs such as utilities and supplies used in the growing process. Indirect labour cost for individuals involved in the growing and quality control process is also included, as well as depreciation of manufacturing assets. All direct and indirect costs of biological assets are capitalized as they are incurred. Biological assets are measured at their fair value less costs to sell on the consolidated statements of financial position and unrealized fair value gains/losses on growth of biological assets are recorded on the consolidated statements of operations and comprehensive loss. v. Inventories Inventories of finished goods and packaging and supplies are initially valued at cost, and subsequently at the lower of cost and net realizable value on the consolidated statements of financial position. Net realizable value is the estimated selling price in the ordinary course of business, less the estimated costs to sell. The Company reviews inventories for obsolete, redundant and slow-moving goods and any such inventories identified are written down to net realizable value. The direct and indirect costs of finished goods inventory initially include the fair value of the biological asset at the time of harvest. They also include subsequent costs such as materials, labour and depreciation expense on equipment involved in packaging, labeling and inspection. All direct and indirect costs related to inventory are capitalized as they are incurred, and they are subsequently recorded within cost of sales on the consolidated statements of operations and comprehensive loss at the time the inventory is sold. vi. Property, plant and equipment Property, plant and equipment are initially recognized at acquisition cost or manufacturing cost, including any costs directly attributable to bringing the assets to the location and condition necessary for the asset to be capable of operating in the manner intended by the Company’s management. Property, plant and equipment are subsequently measured at cost, less accumulated depreciation and impairment losses, if any. Depreciation is recognized on a straight-line basis to reduce the cost, less estimated residual value, of depreciable fixed assets. The following useful lives are applied: Buildings 5-25 years Growing and processing equipment 2-10 years Computer equipment 3-5 years Vehicles 5 years Furniture and fixtures 10 years Leasehold improvements 5-20 years Right-of-use assets term of lease Gains or losses arising on the disposal of property, plant and equipment are determined as the difference between the disposal proceeds and the carrying amount of the assets, and are recognized as profit or loss within the consolidated statements of operations and comprehensive loss. CONSOLIDATED FINANCIAL STATEMENTS | FOR THE YEAR ENDED SEPTEMBER 30, 2025 AND 2024 15
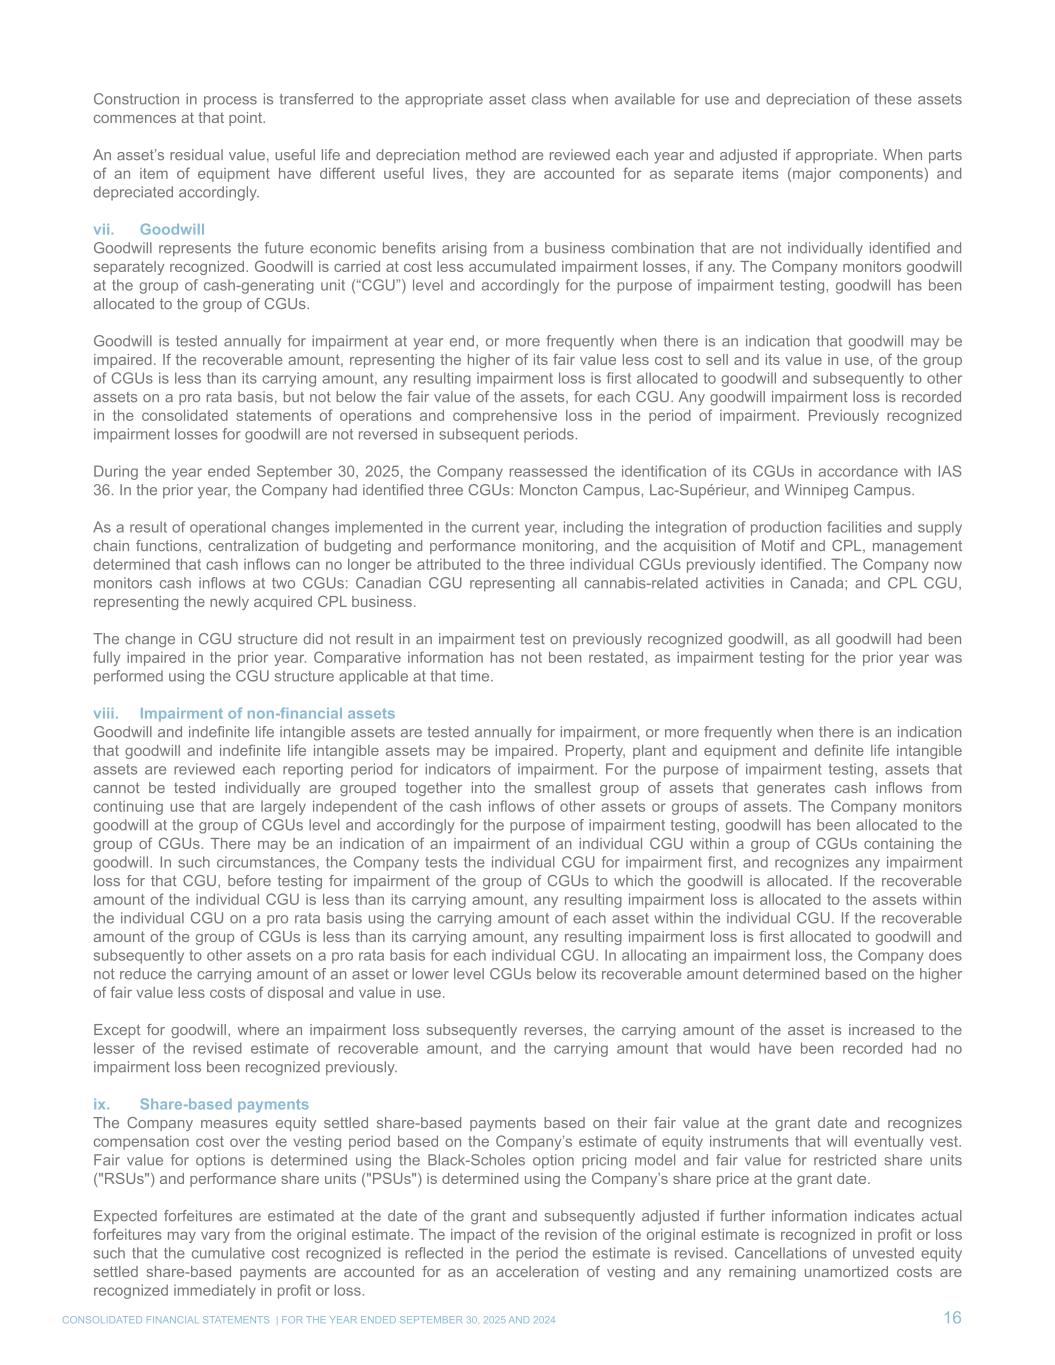
Construction in process is transferred to the appropriate asset class when available for use and depreciation of these assets commences at that point. An asset’s residual value, useful life and depreciation method are reviewed each year and adjusted if appropriate. When parts of an item of equipment have different useful lives, they are accounted for as separate items (major components) and depreciated accordingly. vii. Goodwill Goodwill represents the future economic benefits arising from a business combination that are not individually identified and separately recognized. Goodwill is carried at cost less accumulated impairment losses, if any. The Company monitors goodwill at the group of cash-generating unit (“CGU”) level and accordingly for the purpose of impairment testing, goodwill has been allocated to the group of CGUs. Goodwill is tested annually for impairment at year end, or more frequently when there is an indication that goodwill may be impaired. If the recoverable amount, representing the higher of its fair value less cost to sell and its value in use, of the group of CGUs is less than its carrying amount, any resulting impairment loss is first allocated to goodwill and subsequently to other assets on a pro rata basis, but not below the fair value of the assets, for each CGU. Any goodwill impairment loss is recorded in the consolidated statements of operations and comprehensive loss in the period of impairment. Previously recognized impairment losses for goodwill are not reversed in subsequent periods. During the year ended September 30, 2025, the Company reassessed the identification of its CGUs in accordance with IAS 36. In the prior year, the Company had identified three CGUs: Moncton Campus, Lac-Supérieur, and Winnipeg Campus. As a result of operational changes implemented in the current year, including the integration of production facilities and supply chain functions, centralization of budgeting and performance monitoring, and the acquisition of Motif and CPL, management determined that cash inflows can no longer be attributed to the three individual CGUs previously identified. The Company now monitors cash inflows at two CGUs: Canadian CGU representing all cannabis-related activities in Canada; and CPL CGU, representing the newly acquired CPL business. The change in CGU structure did not result in an impairment test on previously recognized goodwill, as all goodwill had been fully impaired in the prior year. Comparative information has not been restated, as impairment testing for the prior year was performed using the CGU structure applicable at that time. viii. Impairment of non-financial assets Goodwill and indefinite life intangible assets are tested annually for impairment, or more frequently when there is an indication that goodwill and indefinite life intangible assets may be impaired. Property, plant and equipment and definite life intangible assets are reviewed each reporting period for indicators of impairment. For the purpose of impairment testing, assets that cannot be tested individually are grouped together into the smallest group of assets that generates cash inflows from continuing use that are largely independent of the cash inflows of other assets or groups of assets. The Company monitors goodwill at the group of CGUs level and accordingly for the purpose of impairment testing, goodwill has been allocated to the group of CGUs. There may be an indication of an impairment of an individual CGU within a group of CGUs containing the goodwill. In such circumstances, the Company tests the individual CGU for impairment first, and recognizes any impairment loss for that CGU, before testing for impairment of the group of CGUs to which the goodwill is allocated. If the recoverable amount of the individual CGU is less than its carrying amount, any resulting impairment loss is allocated to the assets within the individual CGU on a pro rata basis using the carrying amount of each asset within the individual CGU. If the recoverable amount of the group of CGUs is less than its carrying amount, any resulting impairment loss is first allocated to goodwill and subsequently to other assets on a pro rata basis for each individual CGU. In allocating an impairment loss, the Company does not reduce the carrying amount of an asset or lower level CGUs below its recoverable amount determined based on the higher of fair value less costs of disposal and value in use. Except for goodwill, where an impairment loss subsequently reverses, the carrying amount of the asset is increased to the lesser of the revised estimate of recoverable amount, and the carrying amount that would have been recorded had no impairment loss been recognized previously. ix. Share-based payments The Company measures equity settled share-based payments based on their fair value at the grant date and recognizes compensation cost over the vesting period based on the Company’s estimate of equity instruments that will eventually vest. Fair value for options is determined using the Black-Scholes option pricing model and fair value for restricted share units ("RSUs") and performance share units ("PSUs") is determined using the Company’s share price at the grant date. Expected forfeitures are estimated at the date of the grant and subsequently adjusted if further information indicates actual forfeitures may vary from the original estimate. The impact of the revision of the original estimate is recognized in profit or loss such that the cumulative cost recognized is reflected in the period the estimate is revised. Cancellations of unvested equity settled share-based payments are accounted for as an acceleration of vesting and any remaining unamortized costs are recognized immediately in profit or loss. CONSOLIDATED FINANCIAL STATEMENTS | FOR THE YEAR ENDED SEPTEMBER 30, 2025 AND 2024 16
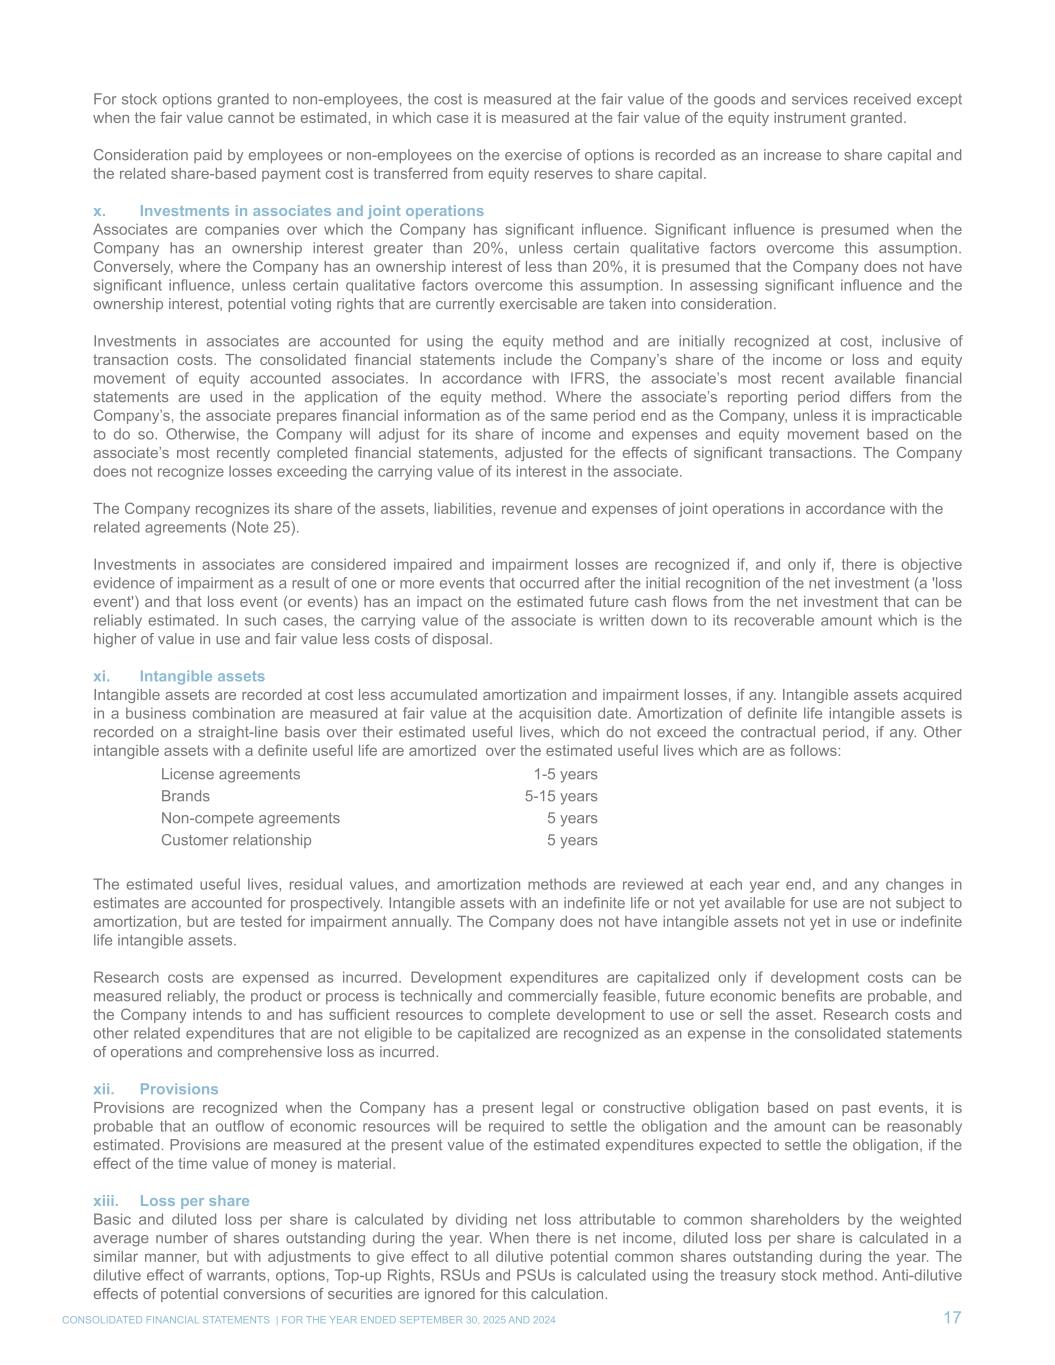
For stock options granted to non-employees, the cost is measured at the fair value of the goods and services received except when the fair value cannot be estimated, in which case it is measured at the fair value of the equity instrument granted. Consideration paid by employees or non-employees on the exercise of options is recorded as an increase to share capital and the related share-based payment cost is transferred from equity reserves to share capital. x. Investments in associates and joint operations Associates are companies over which the Company has significant influence. Significant influence is presumed when the Company has an ownership interest greater than 20%, unless certain qualitative factors overcome this assumption. Conversely, where the Company has an ownership interest of less than 20%, it is presumed that the Company does not have significant influence, unless certain qualitative factors overcome this assumption. In assessing significant influence and the ownership interest, potential voting rights that are currently exercisable are taken into consideration. Investments in associates are accounted for using the equity method and are initially recognized at cost, inclusive of transaction costs. The consolidated financial statements include the Company’s share of the income or loss and equity movement of equity accounted associates. In accordance with IFRS, the associate’s most recent available financial statements are used in the application of the equity method. Where the associate’s reporting period differs from the Company’s, the associate prepares financial information as of the same period end as the Company, unless it is impracticable to do so. Otherwise, the Company will adjust for its share of income and expenses and equity movement based on the associate’s most recently completed financial statements, adjusted for the effects of significant transactions. The Company does not recognize losses exceeding the carrying value of its interest in the associate. The Company recognizes its share of the assets, liabilities, revenue and expenses of joint operations in accordance with the related agreements (Note 25). Investments in associates are considered impaired and impairment losses are recognized if, and only if, there is objective evidence of impairment as a result of one or more events that occurred after the initial recognition of the net investment (a 'loss event') and that loss event (or events) has an impact on the estimated future cash flows from the net investment that can be reliably estimated. In such cases, the carrying value of the associate is written down to its recoverable amount which is the higher of value in use and fair value less costs of disposal. xi. Intangible assets Intangible assets are recorded at cost less accumulated amortization and impairment losses, if any. Intangible assets acquired in a business combination are measured at fair value at the acquisition date. Amortization of definite life intangible assets is recorded on a straight-line basis over their estimated useful lives, which do not exceed the contractual period, if any. Other intangible assets with a definite useful life are amortized over the estimated useful lives which are as follows: License agreements 1-5 years Brands 5-15 years Non-compete agreements 5 years Customer relationship 5 years The estimated useful lives, residual values, and amortization methods are reviewed at each year end, and any changes in estimates are accounted for prospectively. Intangible assets with an indefinite life or not yet available for use are not subject to amortization, but are tested for impairment annually. The Company does not have intangible assets not yet in use or indefinite life intangible assets. Research costs are expensed as incurred. Development expenditures are capitalized only if development costs can be measured reliably, the product or process is technically and commercially feasible, future economic benefits are probable, and the Company intends to and has sufficient resources to complete development to use or sell the asset. Research costs and other related expenditures that are not eligible to be capitalized are recognized as an expense in the consolidated statements of operations and comprehensive loss as incurred. xii. Provisions Provisions are recognized when the Company has a present legal or constructive obligation based on past events, it is probable that an outflow of economic resources will be required to settle the obligation and the amount can be reasonably estimated. Provisions are measured at the present value of the estimated expenditures expected to settle the obligation, if the effect of the time value of money is material. xiii. Loss per share Basic and diluted loss per share is calculated by dividing net loss attributable to common shareholders by the weighted average number of shares outstanding during the year. When there is net income, diluted loss per share is calculated in a similar manner, but with adjustments to give effect to all dilutive potential common shares outstanding during the year. The dilutive effect of warrants, options, Top-up Rights, RSUs and PSUs is calculated using the treasury stock method. Anti-dilutive effects of potential conversions of securities are ignored for this calculation. CONSOLIDATED FINANCIAL STATEMENTS | FOR THE YEAR ENDED SEPTEMBER 30, 2025 AND 2024 17
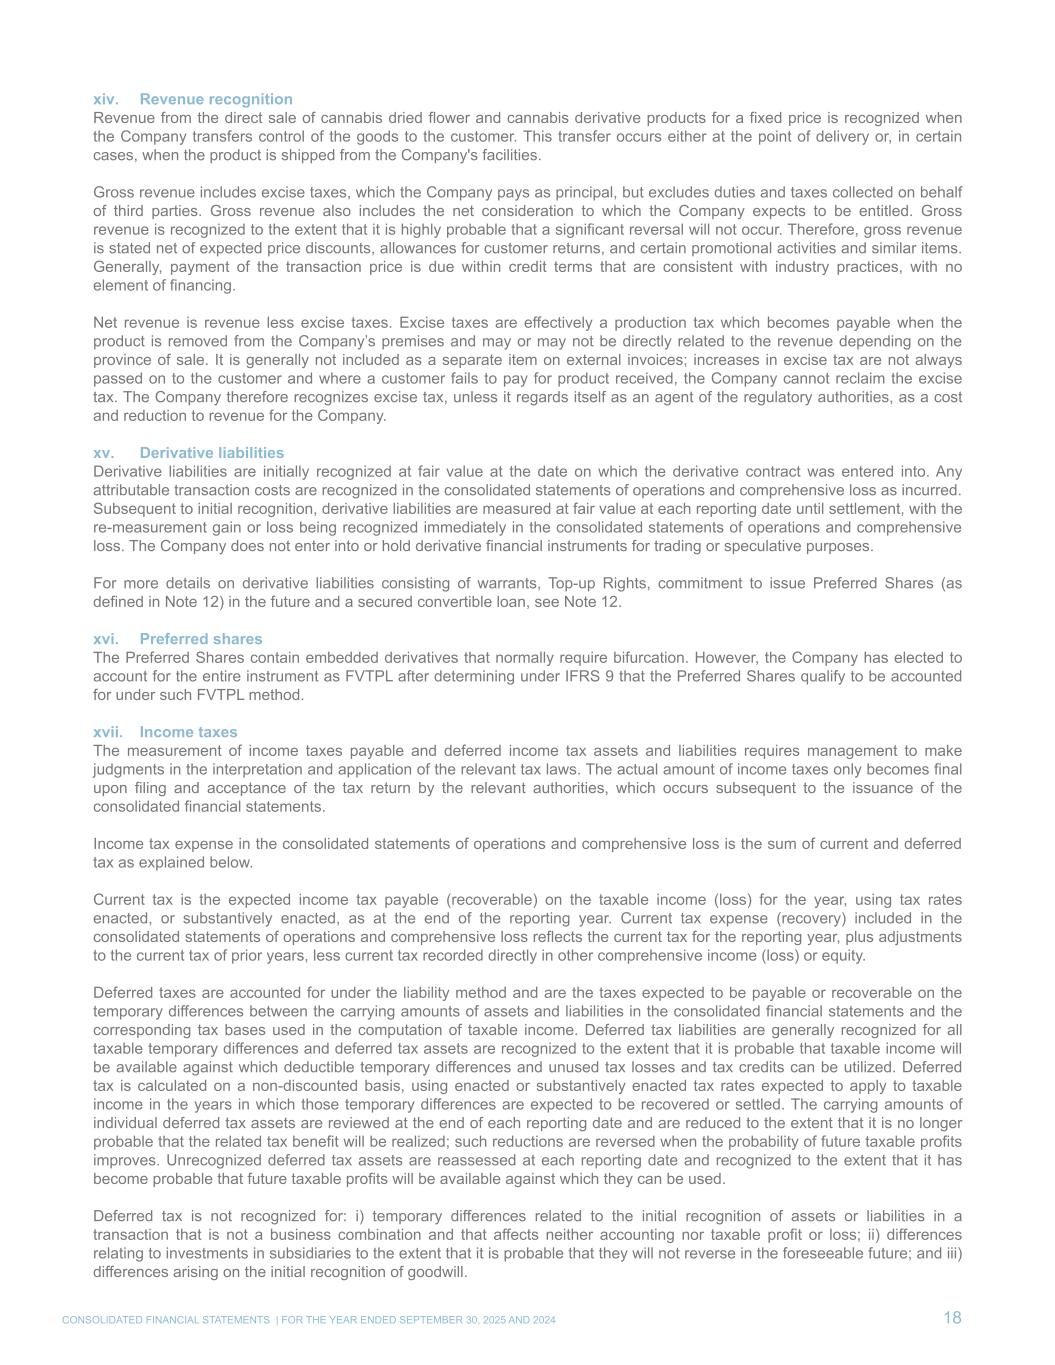
xiv. Revenue recognition Revenue from the direct sale of cannabis dried flower and cannabis derivative products for a fixed price is recognized when the Company transfers control of the goods to the customer. This transfer occurs either at the point of delivery or, in certain cases, when the product is shipped from the Company's facilities. Gross revenue includes excise taxes, which the Company pays as principal, but excludes duties and taxes collected on behalf of third parties. Gross revenue also includes the net consideration to which the Company expects to be entitled. Gross revenue is recognized to the extent that it is highly probable that a significant reversal will not occur. Therefore, gross revenue is stated net of expected price discounts, allowances for customer returns, and certain promotional activities and similar items. Generally, payment of the transaction price is due within credit terms that are consistent with industry practices, with no element of financing. Net revenue is revenue less excise taxes. Excise taxes are effectively a production tax which becomes payable when the product is removed from the Company’s premises and may or may not be directly related to the revenue depending on the province of sale. It is generally not included as a separate item on external invoices; increases in excise tax are not always passed on to the customer and where a customer fails to pay for product received, the Company cannot reclaim the excise tax. The Company therefore recognizes excise tax, unless it regards itself as an agent of the regulatory authorities, as a cost and reduction to revenue for the Company. xv. Derivative liabilities Derivative liabilities are initially recognized at fair value at the date on which the derivative contract was entered into. Any attributable transaction costs are recognized in the consolidated statements of operations and comprehensive loss as incurred. Subsequent to initial recognition, derivative liabilities are measured at fair value at each reporting date until settlement, with the re-measurement gain or loss being recognized immediately in the consolidated statements of operations and comprehensive loss. The Company does not enter into or hold derivative financial instruments for trading or speculative purposes. For more details on derivative liabilities consisting of warrants, Top-up Rights, commitment to issue Preferred Shares (as defined in Note 12) in the future and a secured convertible loan, see Note 12. xvi. Preferred shares The Preferred Shares contain embedded derivatives that normally require bifurcation. However, the Company has elected to account for the entire instrument as FVTPL after determining under IFRS 9 that the Preferred Shares qualify to be accounted for under such FVTPL method. xvii. Income taxes The measurement of income taxes payable and deferred income tax assets and liabilities requires management to make judgments in the interpretation and application of the relevant tax laws. The actual amount of income taxes only becomes final upon filing and acceptance of the tax return by the relevant authorities, which occurs subsequent to the issuance of the consolidated financial statements. Income tax expense in the consolidated statements of operations and comprehensive loss is the sum of current and deferred tax as explained below. Current tax is the expected income tax payable (recoverable) on the taxable income (loss) for the year, using tax rates enacted, or substantively enacted, as at the end of the reporting year. Current tax expense (recovery) included in the consolidated statements of operations and comprehensive loss reflects the current tax for the reporting year, plus adjustments to the current tax of prior years, less current tax recorded directly in other comprehensive income (loss) or equity. Deferred taxes are accounted for under the liability method and are the taxes expected to be payable or recoverable on the temporary differences between the carrying amounts of assets and liabilities in the consolidated financial statements and the corresponding tax bases used in the computation of taxable income. Deferred tax liabilities are generally recognized for all taxable temporary differences and deferred tax assets are recognized to the extent that it is probable that taxable income will be available against which deductible temporary differences and unused tax losses and tax credits can be utilized. Deferred tax is calculated on a non-discounted basis, using enacted or substantively enacted tax rates expected to apply to taxable income in the years in which those temporary differences are expected to be recovered or settled. The carrying amounts of individual deferred tax assets are reviewed at the end of each reporting date and are reduced to the extent that it is no longer probable that the related tax benefit will be realized; such reductions are reversed when the probability of future taxable profits improves. Unrecognized deferred tax assets are reassessed at each reporting date and recognized to the extent that it has become probable that future taxable profits will be available against which they can be used. Deferred tax is not recognized for: i) temporary differences related to the initial recognition of assets or liabilities in a transaction that is not a business combination and that affects neither accounting nor taxable profit or loss; ii) differences relating to investments in subsidiaries to the extent that it is probable that they will not reverse in the foreseeable future; and iii) differences arising on the initial recognition of goodwill. CONSOLIDATED FINANCIAL STATEMENTS | FOR THE YEAR ENDED SEPTEMBER 30, 2025 AND 2024 18
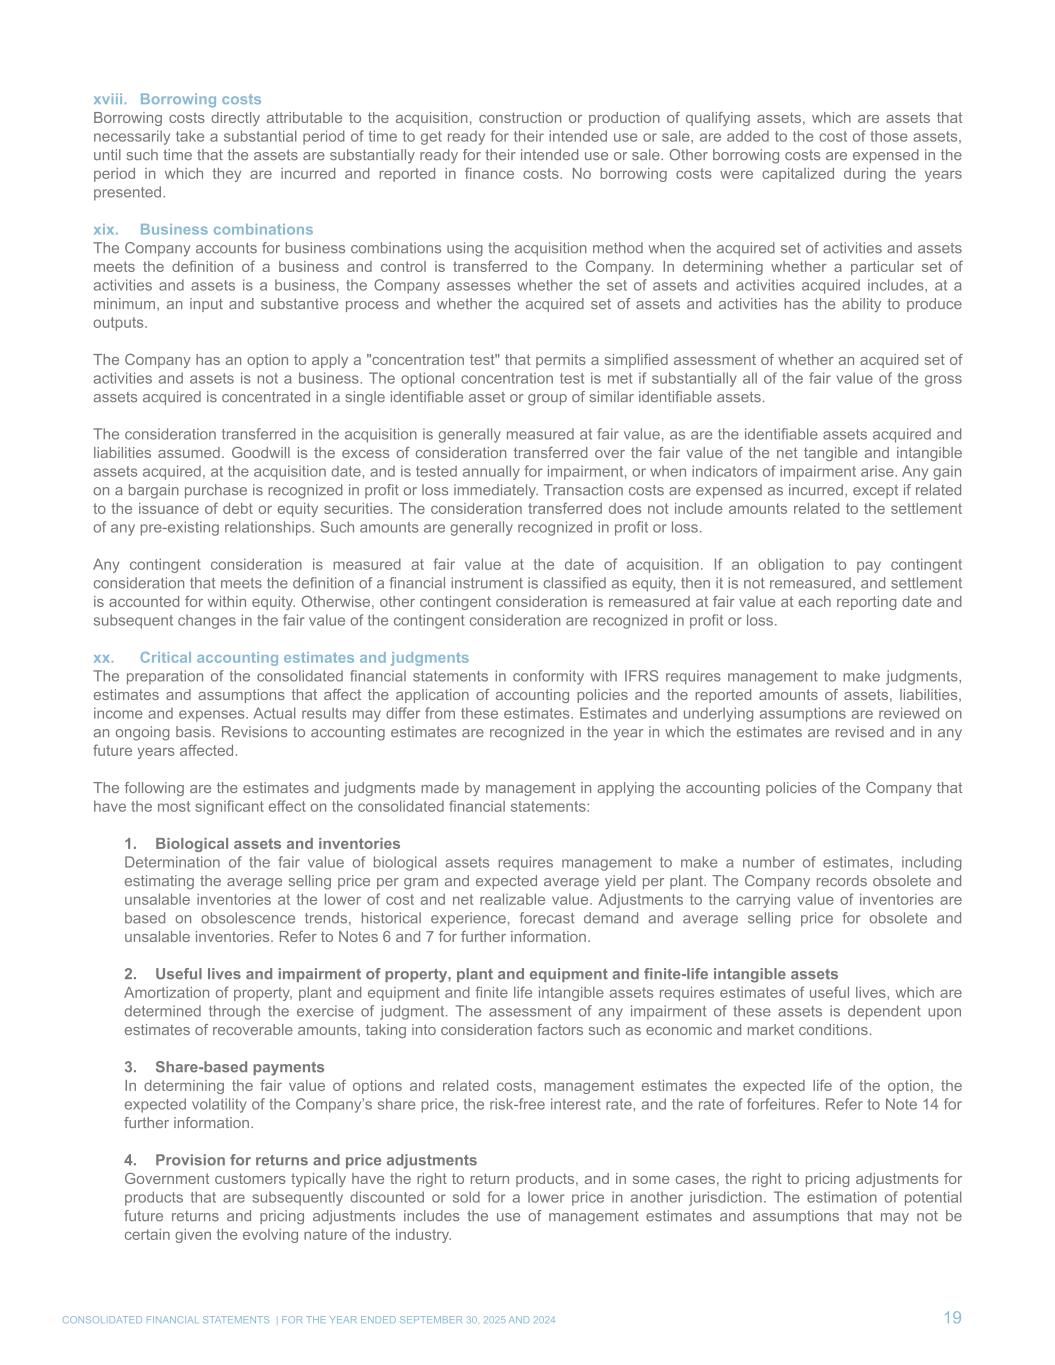
xviii. Borrowing costs Borrowing costs directly attributable to the acquisition, construction or production of qualifying assets, which are assets that necessarily take a substantial period of time to get ready for their intended use or sale, are added to the cost of those assets, until such time that the assets are substantially ready for their intended use or sale. Other borrowing costs are expensed in the period in which they are incurred and reported in finance costs. No borrowing costs were capitalized during the years presented. xix. Business combinations The Company accounts for business combinations using the acquisition method when the acquired set of activities and assets meets the definition of a business and control is transferred to the Company. In determining whether a particular set of activities and assets is a business, the Company assesses whether the set of assets and activities acquired includes, at a minimum, an input and substantive process and whether the acquired set of assets and activities has the ability to produce outputs. The Company has an option to apply a "concentration test" that permits a simplified assessment of whether an acquired set of activities and assets is not a business. The optional concentration test is met if substantially all of the fair value of the gross assets acquired is concentrated in a single identifiable asset or group of similar identifiable assets. The consideration transferred in the acquisition is generally measured at fair value, as are the identifiable assets acquired and liabilities assumed. Goodwill is the excess of consideration transferred over the fair value of the net tangible and intangible assets acquired, at the acquisition date, and is tested annually for impairment, or when indicators of impairment arise. Any gain on a bargain purchase is recognized in profit or loss immediately. Transaction costs are expensed as incurred, except if related to the issuance of debt or equity securities. The consideration transferred does not include amounts related to the settlement of any pre-existing relationships. Such amounts are generally recognized in profit or loss. Any contingent consideration is measured at fair value at the date of acquisition. If an obligation to pay contingent consideration that meets the definition of a financial instrument is classified as equity, then it is not remeasured, and settlement is accounted for within equity. Otherwise, other contingent consideration is remeasured at fair value at each reporting date and subsequent changes in the fair value of the contingent consideration are recognized in profit or loss. xx. Critical accounting estimates and judgments The preparation of the consolidated financial statements in conformity with IFRS requires management to make judgments, estimates and assumptions that affect the application of accounting policies and the reported amounts of assets, liabilities, income and expenses. Actual results may differ from these estimates. Estimates and underlying assumptions are reviewed on an ongoing basis. Revisions to accounting estimates are recognized in the year in which the estimates are revised and in any future years affected. The following are the estimates and judgments made by management in applying the accounting policies of the Company that have the most significant effect on the consolidated financial statements: 1. Biological assets and inventories Determination of the fair value of biological assets requires management to make a number of estimates, including estimating the average selling price per gram and expected average yield per plant. The Company records obsolete and unsalable inventories at the lower of cost and net realizable value. Adjustments to the carrying value of inventories are based on obsolescence trends, historical experience, forecast demand and average selling price for obsolete and unsalable inventories. Refer to Notes 6 and 7 for further information. 2. Useful lives and impairment of property, plant and equipment and finite-life intangible assets Amortization of property, plant and equipment and finite life intangible assets requires estimates of useful lives, which are determined through the exercise of judgment. The assessment of any impairment of these assets is dependent upon estimates of recoverable amounts, taking into consideration factors such as economic and market conditions. 3. Share-based payments In determining the fair value of options and related costs, management estimates the expected life of the option, the expected volatility of the Company’s share price, the risk-free interest rate, and the rate of forfeitures. Refer to Note 14 for further information. 4. Provision for returns and price adjustments Government customers typically have the right to return products, and in some cases, the right to pricing adjustments for products that are subsequently discounted or sold for a lower price in another jurisdiction. The estimation of potential future returns and pricing adjustments includes the use of management estimates and assumptions that may not be certain given the evolving nature of the industry. CONSOLIDATED FINANCIAL STATEMENTS | FOR THE YEAR ENDED SEPTEMBER 30, 2025 AND 2024 19
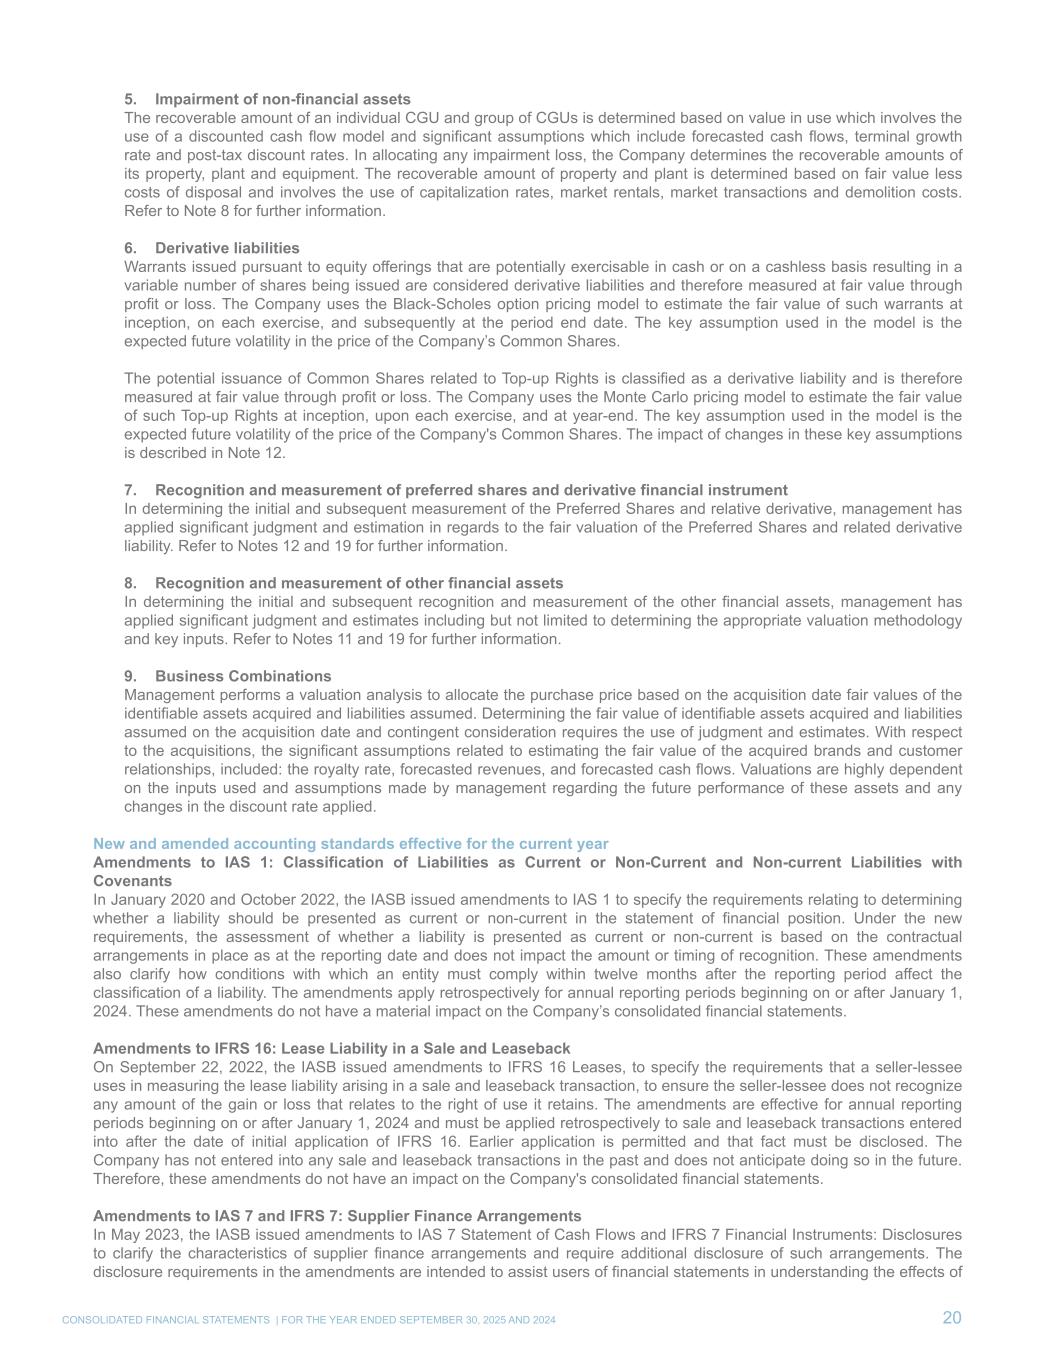
5. Impairment of non-financial assets The recoverable amount of an individual CGU and group of CGUs is determined based on value in use which involves the use of a discounted cash flow model and significant assumptions which include forecasted cash flows, terminal growth rate and post-tax discount rates. In allocating any impairment loss, the Company determines the recoverable amounts of its property, plant and equipment. The recoverable amount of property and plant is determined based on fair value less costs of disposal and involves the use of capitalization rates, market rentals, market transactions and demolition costs. Refer to Note 8 for further information. 6. Derivative liabilities Warrants issued pursuant to equity offerings that are potentially exercisable in cash or on a cashless basis resulting in a variable number of shares being issued are considered derivative liabilities and therefore measured at fair value through profit or loss. The Company uses the Black-Scholes option pricing model to estimate the fair value of such warrants at inception, on each exercise, and subsequently at the period end date. The key assumption used in the model is the expected future volatility in the price of the Company’s Common Shares. The potential issuance of Common Shares related to Top-up Rights is classified as a derivative liability and is therefore measured at fair value through profit or loss. The Company uses the Monte Carlo pricing model to estimate the fair value of such Top-up Rights at inception, upon each exercise, and at year-end. The key assumption used in the model is the expected future volatility of the price of the Company's Common Shares. The impact of changes in these key assumptions is described in Note 12. 7. Recognition and measurement of preferred shares and derivative financial instrument In determining the initial and subsequent measurement of the Preferred Shares and relative derivative, management has applied significant judgment and estimation in regards to the fair valuation of the Preferred Shares and related derivative liability. Refer to Notes 12 and 19 for further information. 8. Recognition and measurement of other financial assets In determining the initial and subsequent recognition and measurement of the other financial assets, management has applied significant judgment and estimates including but not limited to determining the appropriate valuation methodology and key inputs. Refer to Notes 11 and 19 for further information. 9. Business Combinations Management performs a valuation analysis to allocate the purchase price based on the acquisition date fair values of the identifiable assets acquired and liabilities assumed. Determining the fair value of identifiable assets acquired and liabilities assumed on the acquisition date and contingent consideration requires the use of judgment and estimates. With respect to the acquisitions, the significant assumptions related to estimating the fair value of the acquired brands and customer relationships, included: the royalty rate, forecasted revenues, and forecasted cash flows. Valuations are highly dependent on the inputs used and assumptions made by management regarding the future performance of these assets and any changes in the discount rate applied. New and amended accounting standards effective for the current year Amendments to IAS 1: Classification of Liabilities as Current or Non-Current and Non-current Liabilities with Covenants In January 2020 and October 2022, the IASB issued amendments to IAS 1 to specify the requirements relating to determining whether a liability should be presented as current or non-current in the statement of financial position. Under the new requirements, the assessment of whether a liability is presented as current or non-current is based on the contractual arrangements in place as at the reporting date and does not impact the amount or timing of recognition. These amendments also clarify how conditions with which an entity must comply within twelve months after the reporting period affect the classification of a liability. The amendments apply retrospectively for annual reporting periods beginning on or after January 1, 2024. These amendments do not have a material impact on the Company’s consolidated financial statements. Amendments to IFRS 16: Lease Liability in a Sale and Leaseback On September 22, 2022, the IASB issued amendments to IFRS 16 Leases, to specify the requirements that a seller-lessee uses in measuring the lease liability arising in a sale and leaseback transaction, to ensure the seller-lessee does not recognize any amount of the gain or loss that relates to the right of use it retains. The amendments are effective for annual reporting periods beginning on or after January 1, 2024 and must be applied retrospectively to sale and leaseback transactions entered into after the date of initial application of IFRS 16. Earlier application is permitted and that fact must be disclosed. The Company has not entered into any sale and leaseback transactions in the past and does not anticipate doing so in the future. Therefore, these amendments do not have an impact on the Company's consolidated financial statements. Amendments to IAS 7 and IFRS 7: Supplier Finance Arrangements In May 2023, the IASB issued amendments to IAS 7 Statement of Cash Flows and IFRS 7 Financial Instruments: Disclosures to clarify the characteristics of supplier finance arrangements and require additional disclosure of such arrangements. The disclosure requirements in the amendments are intended to assist users of financial statements in understanding the effects of CONSOLIDATED FINANCIAL STATEMENTS | FOR THE YEAR ENDED SEPTEMBER 30, 2025 AND 2024 20
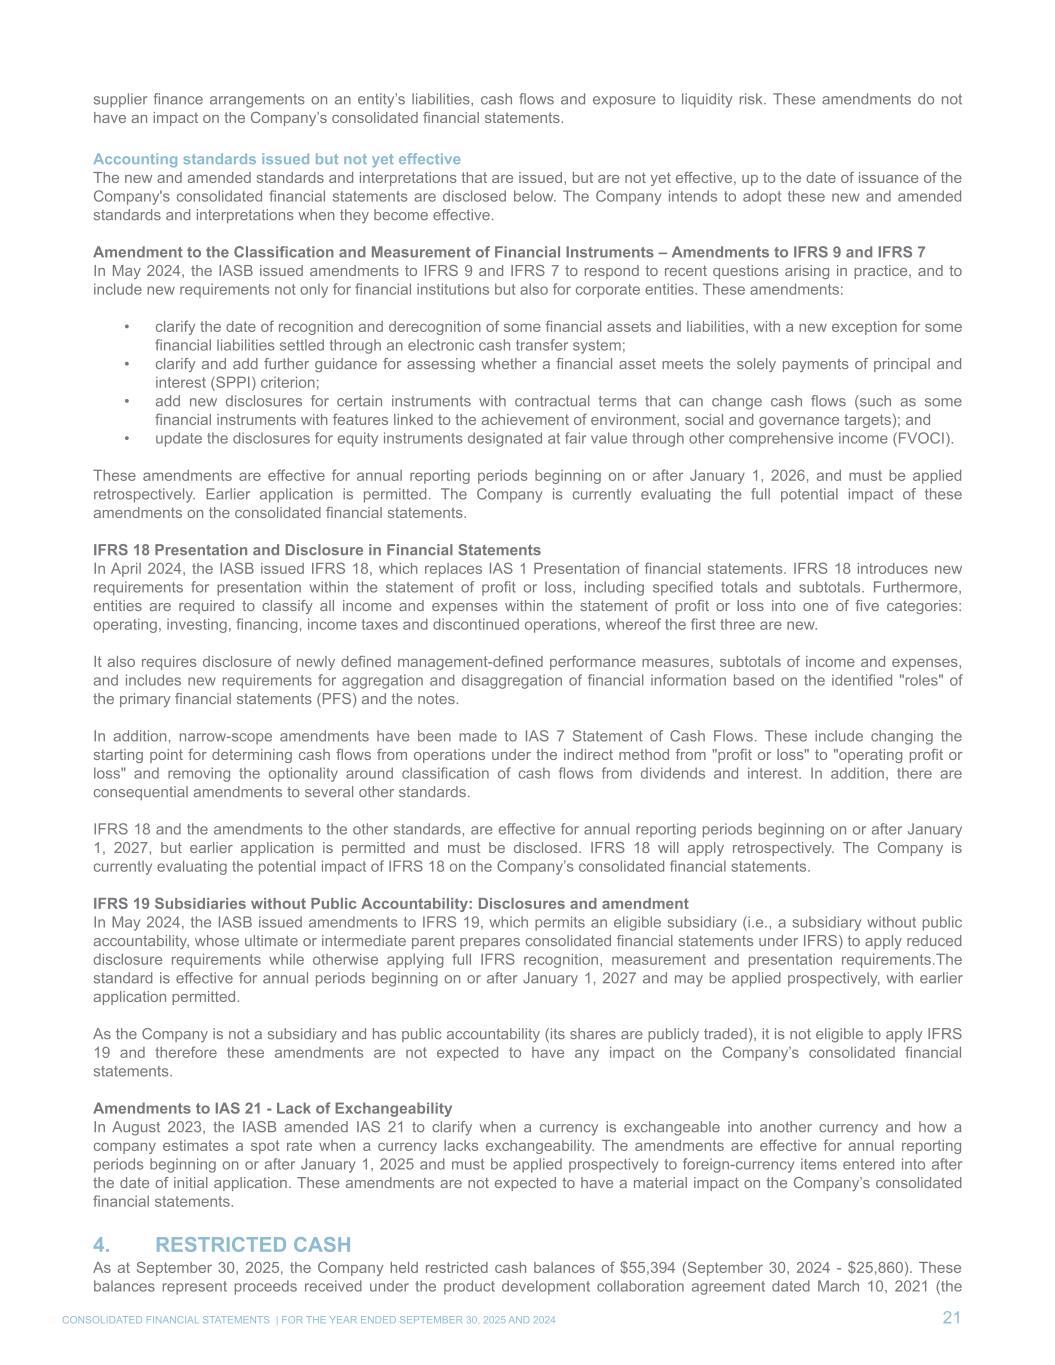
supplier finance arrangements on an entity’s liabilities, cash flows and exposure to liquidity risk. These amendments do not have an impact on the Company’s consolidated financial statements. Accounting standards issued but not yet effective The new and amended standards and interpretations that are issued, but are not yet effective, up to the date of issuance of the Company's consolidated financial statements are disclosed below. The Company intends to adopt these new and amended standards and interpretations when they become effective. Amendment to the Classification and Measurement of Financial Instruments – Amendments to IFRS 9 and IFRS 7 In May 2024, the IASB issued amendments to IFRS 9 and IFRS 7 to respond to recent questions arising in practice, and to include new requirements not only for financial institutions but also for corporate entities. These amendments: • clarify the date of recognition and derecognition of some financial assets and liabilities, with a new exception for some financial liabilities settled through an electronic cash transfer system; • clarify and add further guidance for assessing whether a financial asset meets the solely payments of principal and interest (SPPI) criterion; • add new disclosures for certain instruments with contractual terms that can change cash flows (such as some financial instruments with features linked to the achievement of environment, social and governance targets); and • update the disclosures for equity instruments designated at fair value through other comprehensive income (FVOCI). These amendments are effective for annual reporting periods beginning on or after January 1, 2026, and must be applied retrospectively. Earlier application is permitted. The Company is currently evaluating the full potential impact of these amendments on the consolidated financial statements. IFRS 18 Presentation and Disclosure in Financial Statements In April 2024, the IASB issued IFRS 18, which replaces IAS 1 Presentation of financial statements. IFRS 18 introduces new requirements for presentation within the statement of profit or loss, including specified totals and subtotals. Furthermore, entities are required to classify all income and expenses within the statement of profit or loss into one of five categories: operating, investing, financing, income taxes and discontinued operations, whereof the first three are new. It also requires disclosure of newly defined management-defined performance measures, subtotals of income and expenses, and includes new requirements for aggregation and disaggregation of financial information based on the identified "roles" of the primary financial statements (PFS) and the notes. In addition, narrow-scope amendments have been made to IAS 7 Statement of Cash Flows. These include changing the starting point for determining cash flows from operations under the indirect method from "profit or loss" to "operating profit or loss" and removing the optionality around classification of cash flows from dividends and interest. In addition, there are consequential amendments to several other standards. IFRS 18 and the amendments to the other standards, are effective for annual reporting periods beginning on or after January 1, 2027, but earlier application is permitted and must be disclosed. IFRS 18 will apply retrospectively. The Company is currently evaluating the potential impact of IFRS 18 on the Company’s consolidated financial statements. IFRS 19 Subsidiaries without Public Accountability: Disclosures and amendment In May 2024, the IASB issued amendments to IFRS 19, which permits an eligible subsidiary (i.e., a subsidiary without public accountability, whose ultimate or intermediate parent prepares consolidated financial statements under IFRS) to apply reduced disclosure requirements while otherwise applying full IFRS recognition, measurement and presentation requirements.The standard is effective for annual periods beginning on or after January 1, 2027 and may be applied prospectively, with earlier application permitted. As the Company is not a subsidiary and has public accountability (its shares are publicly traded), it is not eligible to apply IFRS 19 and therefore these amendments are not expected to have any impact on the Company’s consolidated financial statements. Amendments to IAS 21 - Lack of Exchangeability In August 2023, the IASB amended IAS 21 to clarify when a currency is exchangeable into another currency and how a company estimates a spot rate when a currency lacks exchangeability. The amendments are effective for annual reporting periods beginning on or after January 1, 2025 and must be applied prospectively to foreign-currency items entered into after the date of initial application. These amendments are not expected to have a material impact on the Company’s consolidated financial statements. 4. RESTRICTED CASH As at September 30, 2025, the Company held restricted cash balances of $55,394 (September 30, 2024 - $25,860). These balances represent proceeds received under the product development collaboration agreement dated March 10, 2021 (the CONSOLIDATED FINANCIAL STATEMENTS | FOR THE YEAR ENDED SEPTEMBER 30, 2025 AND 2024 21
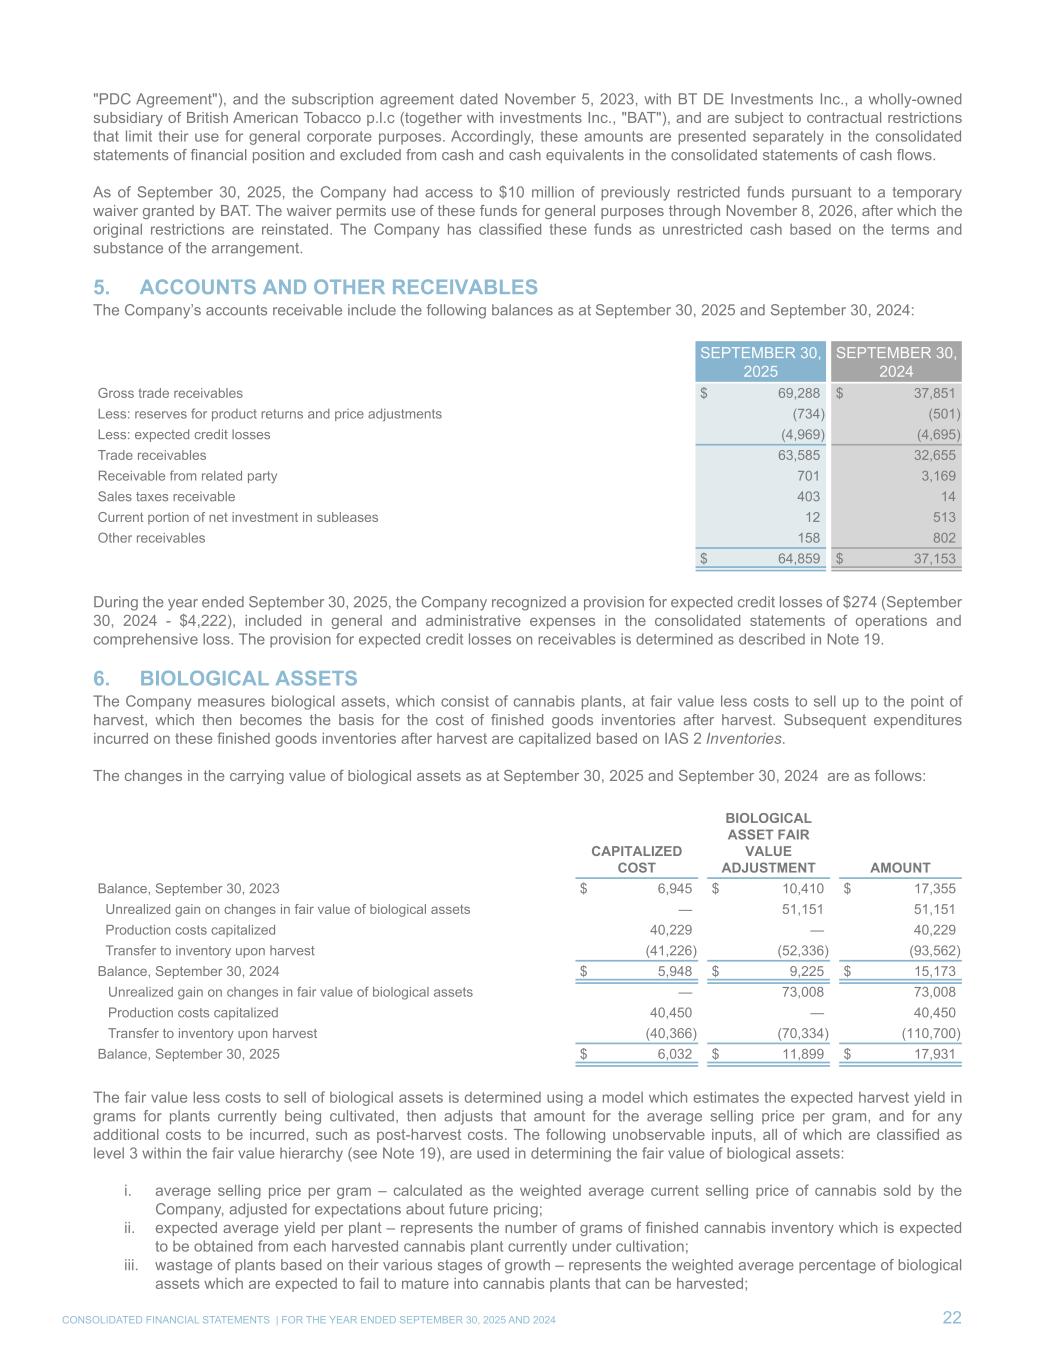
"PDC Agreement"), and the subscription agreement dated November 5, 2023, with BT DE Investments Inc., a wholly-owned subsidiary of British American Tobacco p.l.c (together with investments Inc., "BAT"), and are subject to contractual restrictions that limit their use for general corporate purposes. Accordingly, these amounts are presented separately in the consolidated statements of financial position and excluded from cash and cash equivalents in the consolidated statements of cash flows. As of September 30, 2025, the Company had access to $10 million of previously restricted funds pursuant to a temporary waiver granted by BAT. The waiver permits use of these funds for general purposes through November 8, 2026, after which the original restrictions are reinstated. The Company has classified these funds as unrestricted cash based on the terms and substance of the arrangement. 5. ACCOUNTS AND OTHER RECEIVABLES The Company’s accounts receivable include the following balances as at September 30, 2025 and September 30, 2024: SEPTEMBER 30, 2025 SEPTEMBER 30, 2024 Gross trade receivables $ 69,288 $ 37,851 Less: reserves for product returns and price adjustments (734) (501) Less: expected credit losses (4,969) (4,695) Trade receivables 63,585 32,655 Receivable from related party 701 3,169 Sales taxes receivable 403 14 Current portion of net investment in subleases 12 513 Other receivables 158 802 $ 64,859 $ 37,153 During the year ended September 30, 2025, the Company recognized a provision for expected credit losses of $274 (September 30, 2024 - $4,222), included in general and administrative expenses in the consolidated statements of operations and comprehensive loss. The provision for expected credit losses on receivables is determined as described in Note 19. 6. BIOLOGICAL ASSETS The Company measures biological assets, which consist of cannabis plants, at fair value less costs to sell up to the point of harvest, which then becomes the basis for the cost of finished goods inventories after harvest. Subsequent expenditures incurred on these finished goods inventories after harvest are capitalized based on IAS 2 Inventories. The changes in the carrying value of biological assets as at September 30, 2025 and September 30, 2024 are as follows: CAPITALIZED COST BIOLOGICAL ASSET FAIR VALUE ADJUSTMENT AMOUNT Balance, September 30, 2023 $ 6,945 $ 10,410 $ 17,355 Unrealized gain on changes in fair value of biological assets — 51,151 51,151 Production costs capitalized 40,229 — 40,229 Transfer to inventory upon harvest (41,226) (52,336) (93,562) Balance, September 30, 2024 $ 5,948 $ 9,225 $ 15,173 Unrealized gain on changes in fair value of biological assets — 73,008 73,008 Production costs capitalized 40,450 — 40,450 Transfer to inventory upon harvest (40,366) (70,334) (110,700) Balance, September 30, 2025 $ 6,032 $ 11,899 $ 17,931 The fair value less costs to sell of biological assets is determined using a model which estimates the expected harvest yield in grams for plants currently being cultivated, then adjusts that amount for the average selling price per gram, and for any additional costs to be incurred, such as post-harvest costs. The following unobservable inputs, all of which are classified as level 3 within the fair value hierarchy (see Note 19), are used in determining the fair value of biological assets: i. average selling price per gram – calculated as the weighted average current selling price of cannabis sold by the Company, adjusted for expectations about future pricing; ii. expected average yield per plant – represents the number of grams of finished cannabis inventory which is expected to be obtained from each harvested cannabis plant currently under cultivation; iii. wastage of plants based on their various stages of growth – represents the weighted average percentage of biological assets which are expected to fail to mature into cannabis plants that can be harvested; CONSOLIDATED FINANCIAL STATEMENTS | FOR THE YEAR ENDED SEPTEMBER 30, 2025 AND 2024 22
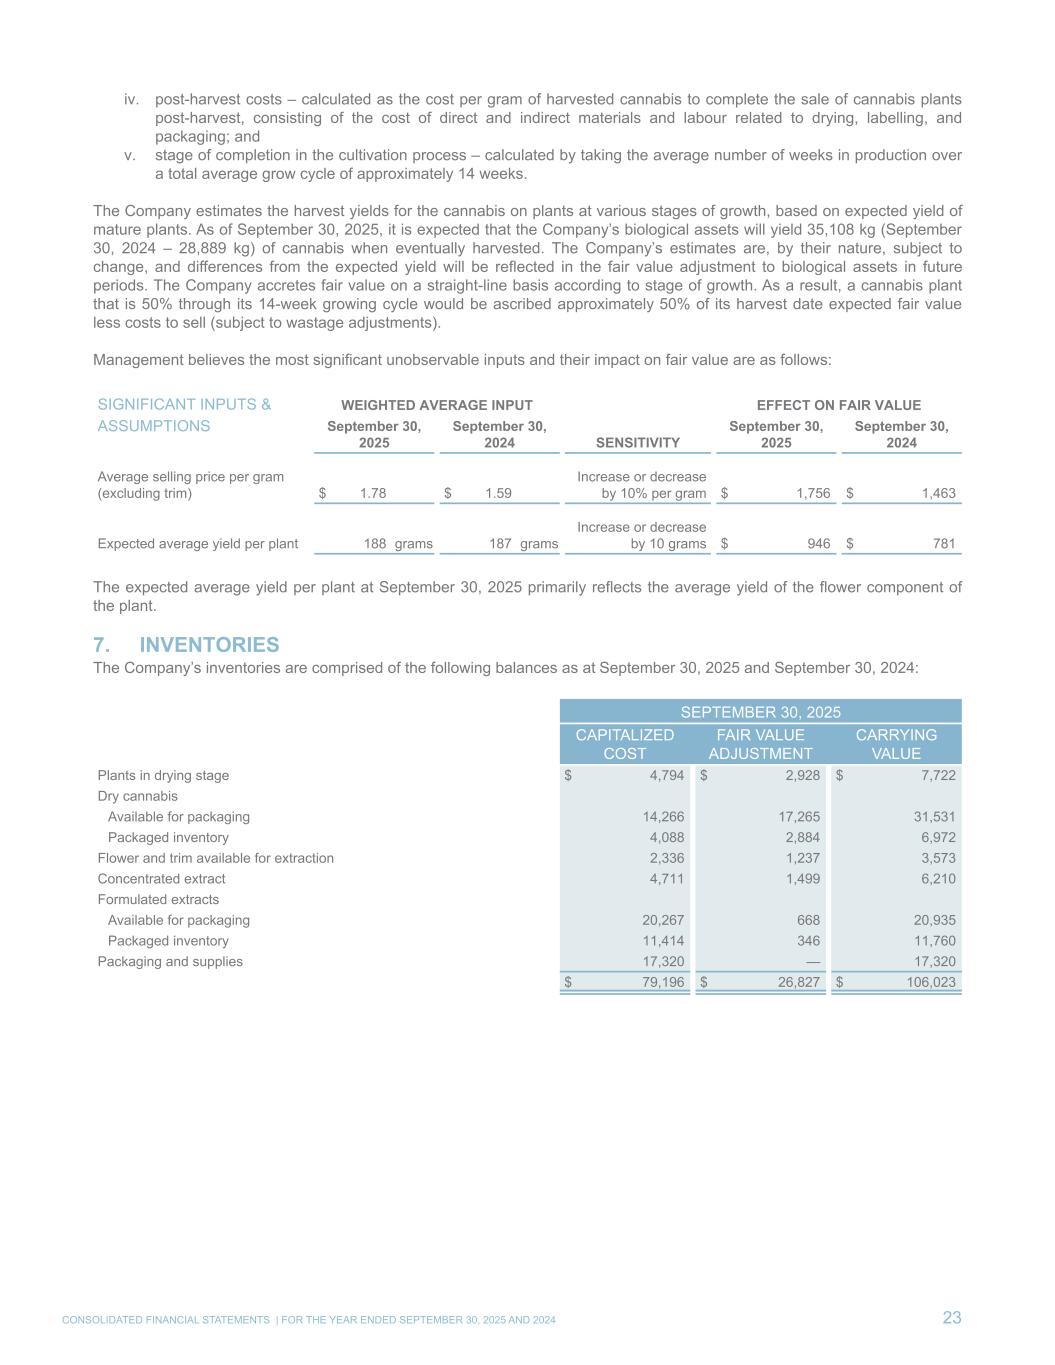
iv. post-harvest costs – calculated as the cost per gram of harvested cannabis to complete the sale of cannabis plants post-harvest, consisting of the cost of direct and indirect materials and labour related to drying, labelling, and packaging; and v. stage of completion in the cultivation process – calculated by taking the average number of weeks in production over a total average grow cycle of approximately 14 weeks. The Company estimates the harvest yields for the cannabis on plants at various stages of growth, based on expected yield of mature plants. As of September 30, 2025, it is expected that the Company’s biological assets will yield 35,108 kg (September 30, 2024 – 28,889 kg) of cannabis when eventually harvested. The Company’s estimates are, by their nature, subject to change, and differences from the expected yield will be reflected in the fair value adjustment to biological assets in future periods. The Company accretes fair value on a straight-line basis according to stage of growth. As a result, a cannabis plant that is 50% through its 14-week growing cycle would be ascribed approximately 50% of its harvest date expected fair value less costs to sell (subject to wastage adjustments). Management believes the most significant unobservable inputs and their impact on fair value are as follows: SIGNIFICANT INPUTS & WEIGHTED AVERAGE INPUT EFFECT ON FAIR VALUE ASSUMPTIONS September 30, 2025 September 30, 2024 SENSITIVITY September 30, 2025 September 30, 2024 Average selling price per gram (excluding trim) $ 1.78 $ 1.59 Increase or decrease by 10% per gram $ 1,756 $ 1,463 Expected average yield per plant 188 grams 187 grams Increase or decrease by 10 grams $ 946 $ 781 The expected average yield per plant at September 30, 2025 primarily reflects the average yield of the flower component of the plant. 7. INVENTORIES The Company’s inventories are comprised of the following balances as at September 30, 2025 and September 30, 2024: SEPTEMBER 30, 2025 CAPITALIZED COST FAIR VALUE ADJUSTMENT CARRYING VALUE Plants in drying stage $ 4,794 $ 2,928 $ 7,722 Dry cannabis Available for packaging 14,266 17,265 31,531 Packaged inventory 4,088 2,884 6,972 Flower and trim available for extraction 2,336 1,237 3,573 Concentrated extract 4,711 1,499 6,210 Formulated extracts Available for packaging 20,267 668 20,935 Packaged inventory 11,414 346 11,760 Packaging and supplies 17,320 — 17,320 $ 79,196 $ 26,827 $ 106,023 CONSOLIDATED FINANCIAL STATEMENTS | FOR THE YEAR ENDED SEPTEMBER 30, 2025 AND 2024 23
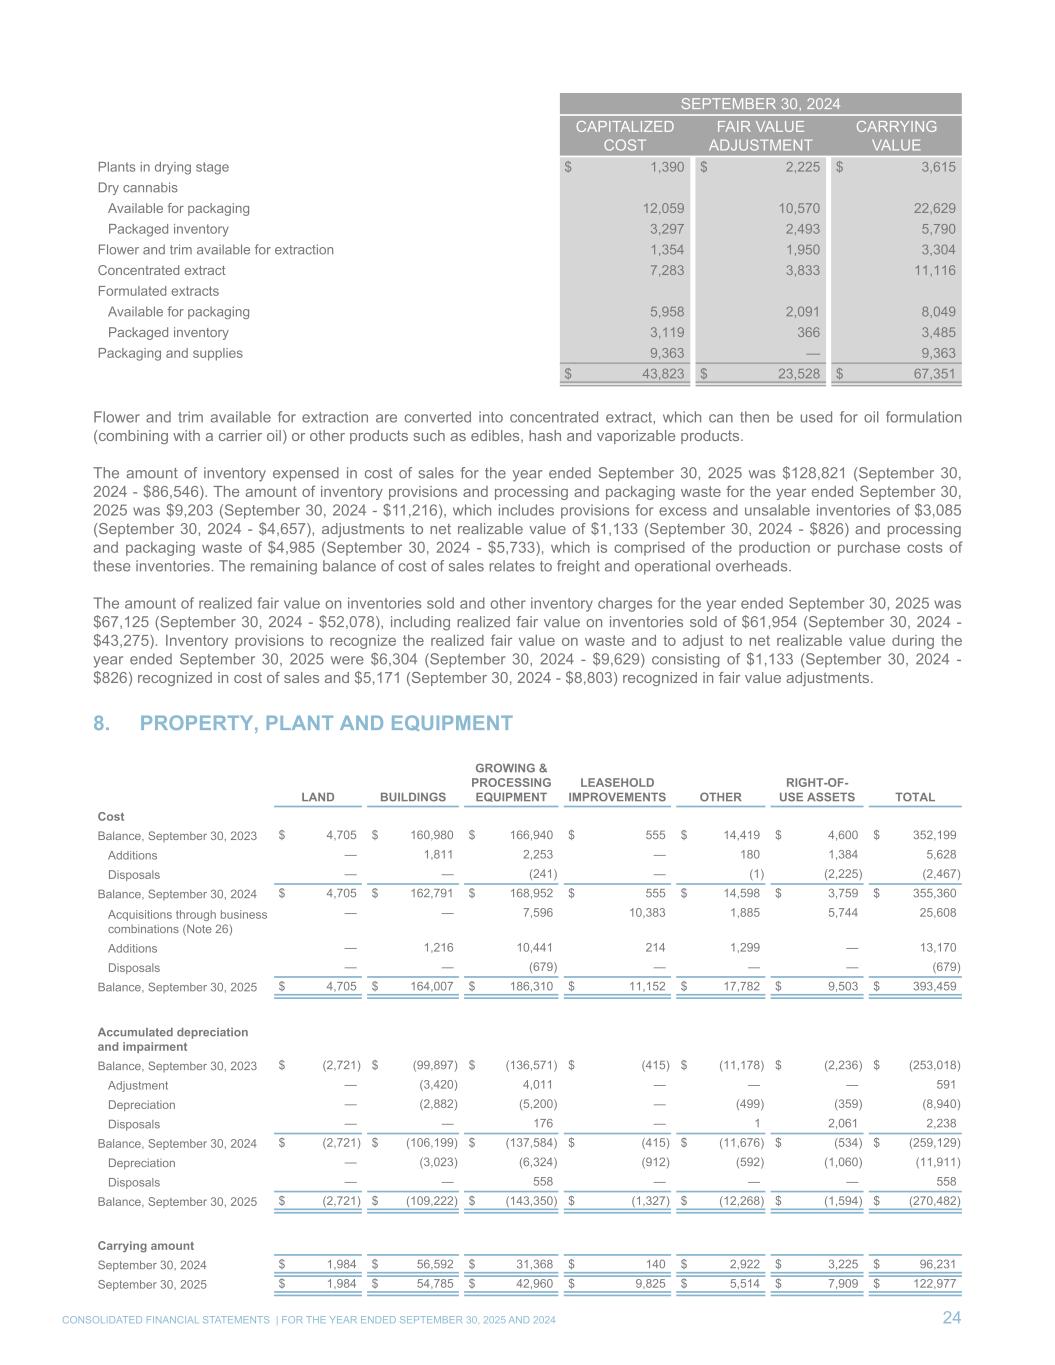
SEPTEMBER 30, 2024 CAPITALIZED COST FAIR VALUE ADJUSTMENT CARRYING VALUE Plants in drying stage $ 1,390 $ 2,225 $ 3,615 Dry cannabis Available for packaging 12,059 10,570 22,629 Packaged inventory 3,297 2,493 5,790 Flower and trim available for extraction 1,354 1,950 3,304 Concentrated extract 7,283 3,833 11,116 Formulated extracts Available for packaging 5,958 2,091 8,049 Packaged inventory 3,119 366 3,485 Packaging and supplies 9,363 — 9,363 $ 43,823 $ 23,528 $ 67,351 Flower and trim available for extraction are converted into concentrated extract, which can then be used for oil formulation (combining with a carrier oil) or other products such as edibles, hash and vaporizable products. The amount of inventory expensed in cost of sales for the year ended September 30, 2025 was $128,821 (September 30, 2024 - $86,546). The amount of inventory provisions and processing and packaging waste for the year ended September 30, 2025 was $9,203 (September 30, 2024 - $11,216), which includes provisions for excess and unsalable inventories of $3,085 (September 30, 2024 - $4,657), adjustments to net realizable value of $1,133 (September 30, 2024 - $826) and processing and packaging waste of $4,985 (September 30, 2024 - $5,733), which is comprised of the production or purchase costs of these inventories. The remaining balance of cost of sales relates to freight and operational overheads. The amount of realized fair value on inventories sold and other inventory charges for the year ended September 30, 2025 was $67,125 (September 30, 2024 - $52,078), including realized fair value on inventories sold of $61,954 (September 30, 2024 - $43,275). Inventory provisions to recognize the realized fair value on waste and to adjust to net realizable value during the year ended September 30, 2025 were $6,304 (September 30, 2024 - $9,629) consisting of $1,133 (September 30, 2024 - $826) recognized in cost of sales and $5,171 (September 30, 2024 - $8,803) recognized in fair value adjustments. 8. PROPERTY, PLANT AND EQUIPMENT LAND BUILDINGS GROWING & PROCESSING EQUIPMENT LEASEHOLD IMPROVEMENTS OTHER RIGHT-OF- USE ASSETS TOTAL Cost Balance, September 30, 2023 $ 4,705 $ 160,980 $ 166,940 $ 555 $ 14,419 $ 4,600 $ 352,199 Additions — 1,811 2,253 — 180 1,384 5,628 Disposals — — (241) — (1) (2,225) (2,467) Balance, September 30, 2024 $ 4,705 $ 162,791 $ 168,952 $ 555 $ 14,598 $ 3,759 $ 355,360 Acquisitions through business combinations (Note 26) — — 7,596 10,383 1,885 5,744 25,608 Additions — 1,216 10,441 214 1,299 — 13,170 Disposals — — (679) — — — (679) Balance, September 30, 2025 $ 4,705 $ 164,007 $ 186,310 $ 11,152 $ 17,782 $ 9,503 $ 393,459 Accumulated depreciation and impairment Balance, September 30, 2023 $ (2,721) $ (99,897) $ (136,571) $ (415) $ (11,178) $ (2,236) $ (253,018) Adjustment — (3,420) 4,011 — — — 591 Depreciation — (2,882) (5,200) — (499) (359) (8,940) Disposals — — 176 — 1 2,061 2,238 Balance, September 30, 2024 $ (2,721) $ (106,199) $ (137,584) $ (415) $ (11,676) $ (534) $ (259,129) Depreciation — (3,023) (6,324) (912) (592) (1,060) (11,911) Disposals — — 558 — — — 558 Balance, September 30, 2025 $ (2,721) $ (109,222) $ (143,350) $ (1,327) $ (12,268) $ (1,594) $ (270,482) Carrying amount September 30, 2024 $ 1,984 $ 56,592 $ 31,368 $ 140 $ 2,922 $ 3,225 $ 96,231 September 30, 2025 $ 1,984 $ 54,785 $ 42,960 $ 9,825 $ 5,514 $ 7,909 $ 122,977 CONSOLIDATED FINANCIAL STATEMENTS | FOR THE YEAR ENDED SEPTEMBER 30, 2025 AND 2024 24
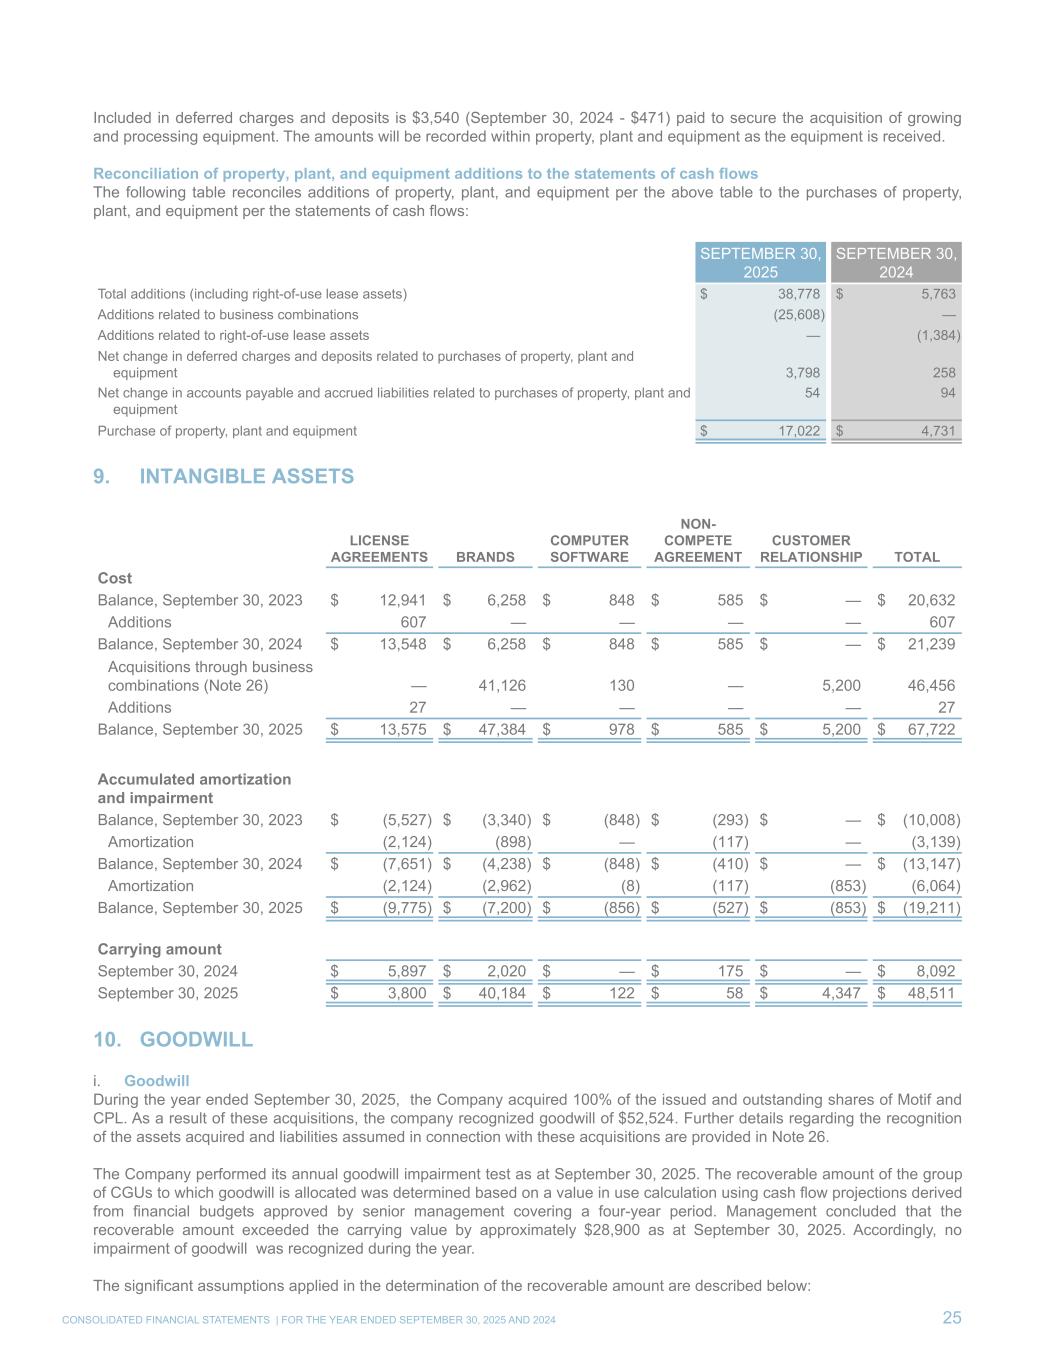
Included in deferred charges and deposits is $3,540 (September 30, 2024 - $471) paid to secure the acquisition of growing and processing equipment. The amounts will be recorded within property, plant and equipment as the equipment is received. Reconciliation of property, plant, and equipment additions to the statements of cash flows The following table reconciles additions of property, plant, and equipment per the above table to the purchases of property, plant, and equipment per the statements of cash flows: SEPTEMBER 30, 2025 SEPTEMBER 30, 2024 Total additions (including right-of-use lease assets) $ 38,778 $ 5,763 Additions related to business combinations (25,608) — Additions related to right-of-use lease assets — (1,384) Net change in deferred charges and deposits related to purchases of property, plant and equipment 3,798 258 Net change in accounts payable and accrued liabilities related to purchases of property, plant and equipment 54 94 Purchase of property, plant and equipment $ 17,022 $ 4,731 9. INTANGIBLE ASSETS LICENSE AGREEMENTS BRANDS COMPUTER SOFTWARE NON- COMPETE AGREEMENT CUSTOMER RELATIONSHIP TOTAL Cost Balance, September 30, 2023 $ 12,941 $ 6,258 $ 848 $ 585 $ — $ 20,632 Additions 607 — — — — 607 Balance, September 30, 2024 $ 13,548 $ 6,258 $ 848 $ 585 $ — $ 21,239 Acquisitions through business combinations (Note 26) — 41,126 130 — 5,200 46,456 Additions 27 — — — — 27 Balance, September 30, 2025 $ 13,575 $ 47,384 $ 978 $ 585 $ 5,200 $ 67,722 Accumulated amortization and impairment Balance, September 30, 2023 $ (5,527) $ (3,340) $ (848) $ (293) $ — $ (10,008) Amortization (2,124) (898) — (117) — (3,139) Balance, September 30, 2024 $ (7,651) $ (4,238) $ (848) $ (410) $ — $ (13,147) Amortization (2,124) (2,962) (8) (117) (853) (6,064) Balance, September 30, 2025 $ (9,775) $ (7,200) $ (856) $ (527) $ (853) $ (19,211) Carrying amount September 30, 2024 $ 5,897 $ 2,020 $ — $ 175 $ — $ 8,092 September 30, 2025 $ 3,800 $ 40,184 $ 122 $ 58 $ 4,347 $ 48,511 10. GOODWILL i. Goodwill During the year ended September 30, 2025, the Company acquired 100% of the issued and outstanding shares of Motif and CPL. As a result of these acquisitions, the company recognized goodwill of $52,524. Further details regarding the recognition of the assets acquired and liabilities assumed in connection with these acquisitions are provided in Note 26. The Company performed its annual goodwill impairment test as at September 30, 2025. The recoverable amount of the group of CGUs to which goodwill is allocated was determined based on a value in use calculation using cash flow projections derived from financial budgets approved by senior management covering a four-year period. Management concluded that the recoverable amount exceeded the carrying value by approximately $28,900 as at September 30, 2025. Accordingly, no impairment of goodwill was recognized during the year. The significant assumptions applied in the determination of the recoverable amount are described below: CONSOLIDATED FINANCIAL STATEMENTS | FOR THE YEAR ENDED SEPTEMBER 30, 2025 AND 2024 25
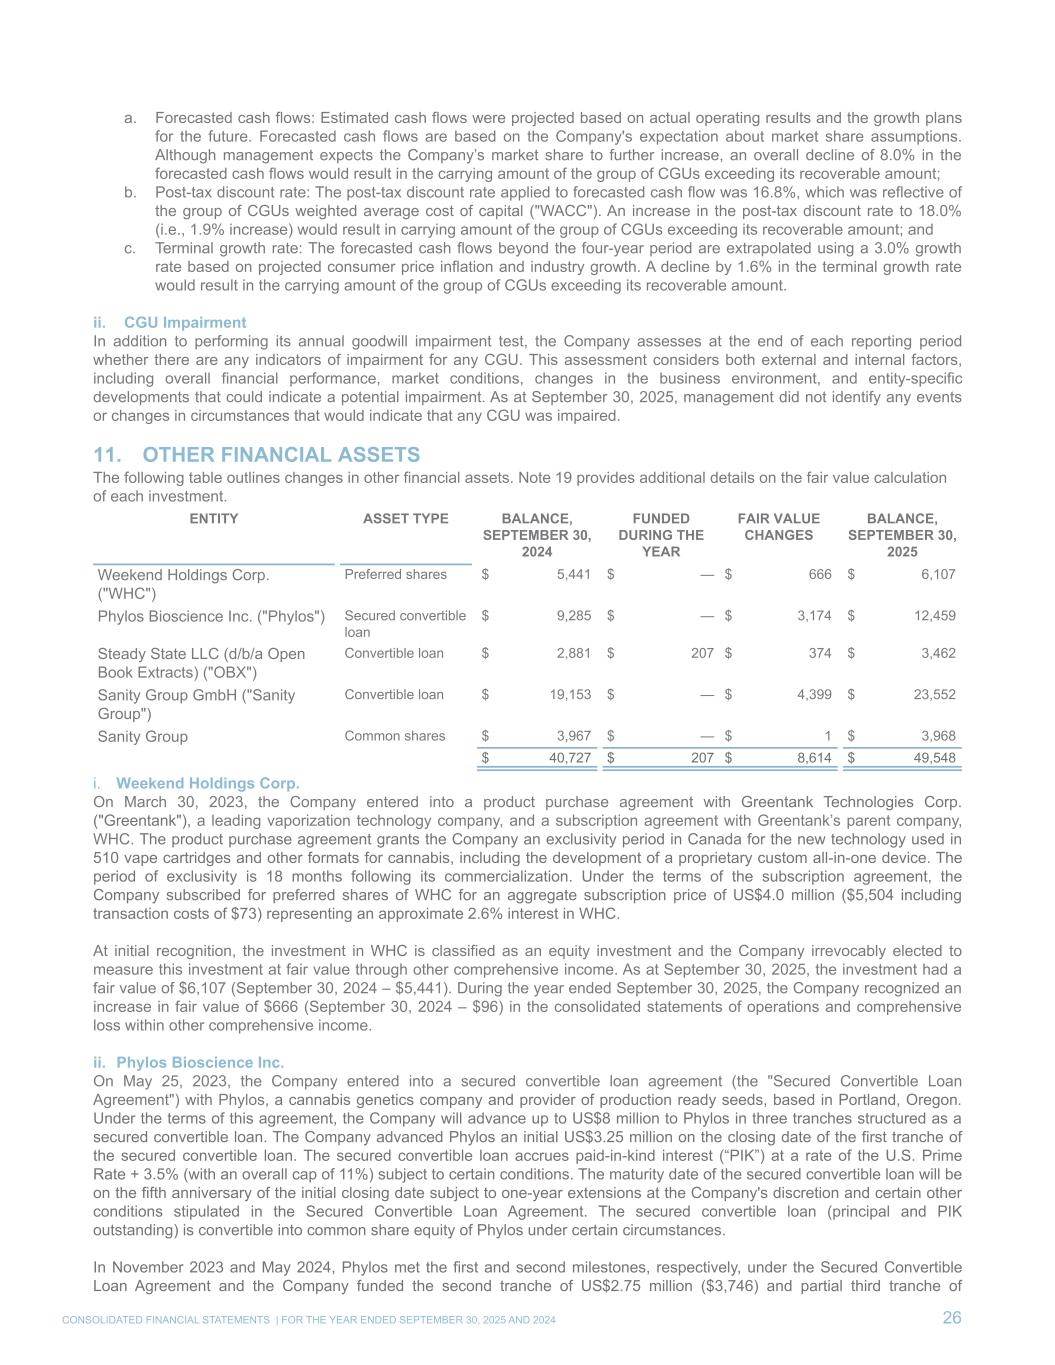
a. Forecasted cash flows: Estimated cash flows were projected based on actual operating results and the growth plans for the future. Forecasted cash flows are based on the Company's expectation about market share assumptions. Although management expects the Company’s market share to further increase, an overall decline of 8.0% in the forecasted cash flows would result in the carrying amount of the group of CGUs exceeding its recoverable amount; b. Post-tax discount rate: The post-tax discount rate applied to forecasted cash flow was 16.8%, which was reflective of the group of CGUs weighted average cost of capital ("WACC"). An increase in the post-tax discount rate to 18.0% (i.e., 1.9% increase) would result in carrying amount of the group of CGUs exceeding its recoverable amount; and c. Terminal growth rate: The forecasted cash flows beyond the four-year period are extrapolated using a 3.0% growth rate based on projected consumer price inflation and industry growth. A decline by 1.6% in the terminal growth rate would result in the carrying amount of the group of CGUs exceeding its recoverable amount. ii. CGU Impairment In addition to performing its annual goodwill impairment test, the Company assesses at the end of each reporting period whether there are any indicators of impairment for any CGU. This assessment considers both external and internal factors, including overall financial performance, market conditions, changes in the business environment, and entity-specific developments that could indicate a potential impairment. As at September 30, 2025, management did not identify any events or changes in circumstances that would indicate that any CGU was impaired. 11. OTHER FINANCIAL ASSETS The following table outlines changes in other financial assets. Note 19 provides additional details on the fair value calculation of each investment. ENTITY ASSET TYPE BALANCE, SEPTEMBER 30, 2024 FUNDED DURING THE YEAR FAIR VALUE CHANGES BALANCE, SEPTEMBER 30, 2025 Weekend Holdings Corp. ("WHC") Preferred shares $ 5,441 $ — $ 666 $ 6,107 Phylos Bioscience Inc. ("Phylos") Secured convertible loan $ 9,285 $ — $ 3,174 $ 12,459 Steady State LLC (d/b/a Open Book Extracts) ("OBX") Convertible loan $ 2,881 $ 207 $ 374 $ 3,462 Sanity Group GmbH ("Sanity Group") Convertible loan $ 19,153 $ — $ 4,399 $ 23,552 Sanity Group Common shares $ 3,967 $ — $ 1 $ 3,968 $ 40,727 $ 207 $ 8,614 $ 49,548 i. Weekend Holdings Corp. On March 30, 2023, the Company entered into a product purchase agreement with Greentank Technologies Corp. ("Greentank"), a leading vaporization technology company, and a subscription agreement with Greentank’s parent company, WHC. The product purchase agreement grants the Company an exclusivity period in Canada for the new technology used in 510 vape cartridges and other formats for cannabis, including the development of a proprietary custom all-in-one device. The period of exclusivity is 18 months following its commercialization. Under the terms of the subscription agreement, the Company subscribed for preferred shares of WHC for an aggregate subscription price of US$4.0 million ($5,504 including transaction costs of $73) representing an approximate 2.6% interest in WHC. At initial recognition, the investment in WHC is classified as an equity investment and the Company irrevocably elected to measure this investment at fair value through other comprehensive income. As at September 30, 2025, the investment had a fair value of $6,107 (September 30, 2024 – $5,441). During the year ended September 30, 2025, the Company recognized an increase in fair value of $666 (September 30, 2024 – $96) in the consolidated statements of operations and comprehensive loss within other comprehensive income. ii. Phylos Bioscience Inc. On May 25, 2023, the Company entered into a secured convertible loan agreement (the "Secured Convertible Loan Agreement") with Phylos, a cannabis genetics company and provider of production ready seeds, based in Portland, Oregon. Under the terms of this agreement, the Company will advance up to US$8 million to Phylos in three tranches structured as a secured convertible loan. The Company advanced Phylos an initial US$3.25 million on the closing date of the first tranche of the secured convertible loan. The secured convertible loan accrues paid-in-kind interest (“PIK”) at a rate of the U.S. Prime Rate + 3.5% (with an overall cap of 11%) subject to certain conditions. The maturity date of the secured convertible loan will be on the fifth anniversary of the initial closing date subject to one-year extensions at the Company's discretion and certain other conditions stipulated in the Secured Convertible Loan Agreement. The secured convertible loan (principal and PIK outstanding) is convertible into common share equity of Phylos under certain circumstances. In November 2023 and May 2024, Phylos met the first and second milestones, respectively, under the Secured Convertible Loan Agreement and the Company funded the second tranche of US$2.75 million ($3,746) and partial third tranche of CONSOLIDATED FINANCIAL STATEMENTS | FOR THE YEAR ENDED SEPTEMBER 30, 2025 AND 2024 26
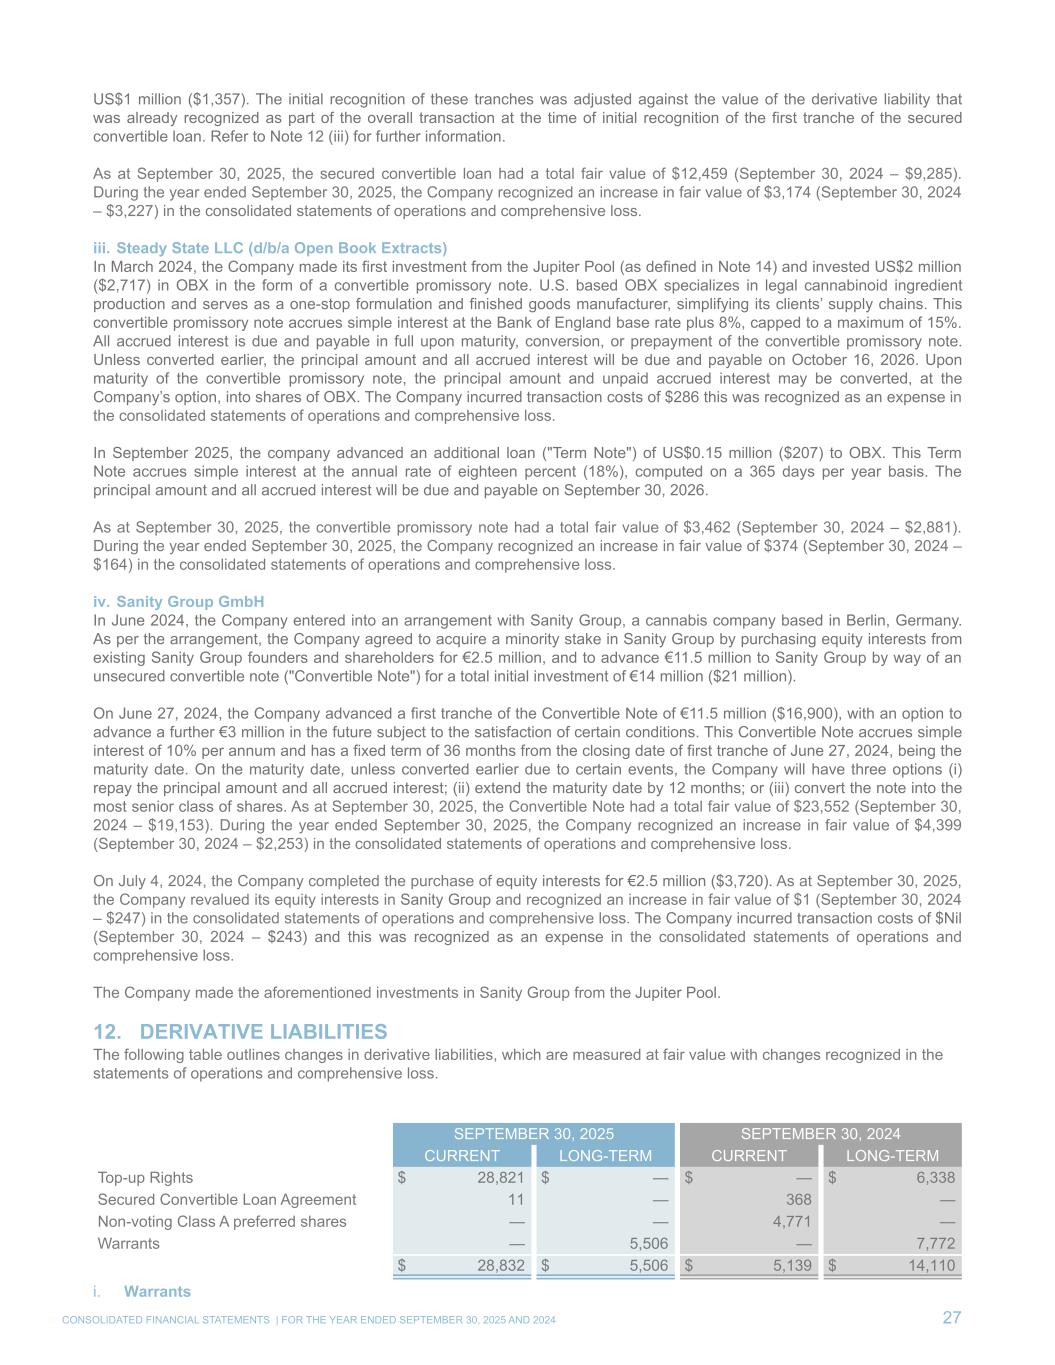
US$1 million ($1,357). The initial recognition of these tranches was adjusted against the value of the derivative liability that was already recognized as part of the overall transaction at the time of initial recognition of the first tranche of the secured convertible loan. Refer to Note 12 (iii) for further information. As at September 30, 2025, the secured convertible loan had a total fair value of $12,459 (September 30, 2024 – $9,285). During the year ended September 30, 2025, the Company recognized an increase in fair value of $3,174 (September 30, 2024 – $3,227) in the consolidated statements of operations and comprehensive loss. iii. Steady State LLC (d/b/a Open Book Extracts) In March 2024, the Company made its first investment from the Jupiter Pool (as defined in Note 14) and invested US$2 million ($2,717) in OBX in the form of a convertible promissory note. U.S. based OBX specializes in legal cannabinoid ingredient production and serves as a one-stop formulation and finished goods manufacturer, simplifying its clients’ supply chains. This convertible promissory note accrues simple interest at the Bank of England base rate plus 8%, capped to a maximum of 15%. All accrued interest is due and payable in full upon maturity, conversion, or prepayment of the convertible promissory note. Unless converted earlier, the principal amount and all accrued interest will be due and payable on October 16, 2026. Upon maturity of the convertible promissory note, the principal amount and unpaid accrued interest may be converted, at the Company’s option, into shares of OBX. The Company incurred transaction costs of $286 this was recognized as an expense in the consolidated statements of operations and comprehensive loss. In September 2025, the company advanced an additional loan ("Term Note") of US$0.15 million ($207) to OBX. This Term Note accrues simple interest at the annual rate of eighteen percent (18%), computed on a 365 days per year basis. The principal amount and all accrued interest will be due and payable on September 30, 2026. As at September 30, 2025, the convertible promissory note had a total fair value of $3,462 (September 30, 2024 – $2,881). During the year ended September 30, 2025, the Company recognized an increase in fair value of $374 (September 30, 2024 – $164) in the consolidated statements of operations and comprehensive loss. iv. Sanity Group GmbH In June 2024, the Company entered into an arrangement with Sanity Group, a cannabis company based in Berlin, Germany. As per the arrangement, the Company agreed to acquire a minority stake in Sanity Group by purchasing equity interests from existing Sanity Group founders and shareholders for €2.5 million, and to advance €11.5 million to Sanity Group by way of an unsecured convertible note ("Convertible Note") for a total initial investment of €14 million ($21 million). On June 27, 2024, the Company advanced a first tranche of the Convertible Note of €11.5 million ($16,900), with an option to advance a further €3 million in the future subject to the satisfaction of certain conditions. This Convertible Note accrues simple interest of 10% per annum and has a fixed term of 36 months from the closing date of first tranche of June 27, 2024, being the maturity date. On the maturity date, unless converted earlier due to certain events, the Company will have three options (i) repay the principal amount and all accrued interest; (ii) extend the maturity date by 12 months; or (iii) convert the note into the most senior class of shares. As at September 30, 2025, the Convertible Note had a total fair value of $23,552 (September 30, 2024 – $19,153). During the year ended September 30, 2025, the Company recognized an increase in fair value of $4,399 (September 30, 2024 – $2,253) in the consolidated statements of operations and comprehensive loss. On July 4, 2024, the Company completed the purchase of equity interests for €2.5 million ($3,720). As at September 30, 2025, the Company revalued its equity interests in Sanity Group and recognized an increase in fair value of $1 (September 30, 2024 – $247) in the consolidated statements of operations and comprehensive loss. The Company incurred transaction costs of $Nil (September 30, 2024 – $243) and this was recognized as an expense in the consolidated statements of operations and comprehensive loss. The Company made the aforementioned investments in Sanity Group from the Jupiter Pool. 12. DERIVATIVE LIABILITIES The following table outlines changes in derivative liabilities, which are measured at fair value with changes recognized in the statements of operations and comprehensive loss. SEPTEMBER 30, 2025 SEPTEMBER 30, 2024 CURRENT LONG-TERM CURRENT LONG-TERM Top-up Rights $ 28,821 $ — $ — $ 6,338 Secured Convertible Loan Agreement 11 — 368 — Non-voting Class A preferred shares — — 4,771 — Warrants — 5,506 — 7,772 $ 28,832 $ 5,506 $ 5,139 $ 14,110 i. Warrants CONSOLIDATED FINANCIAL STATEMENTS | FOR THE YEAR ENDED SEPTEMBER 30, 2025 AND 2024 27
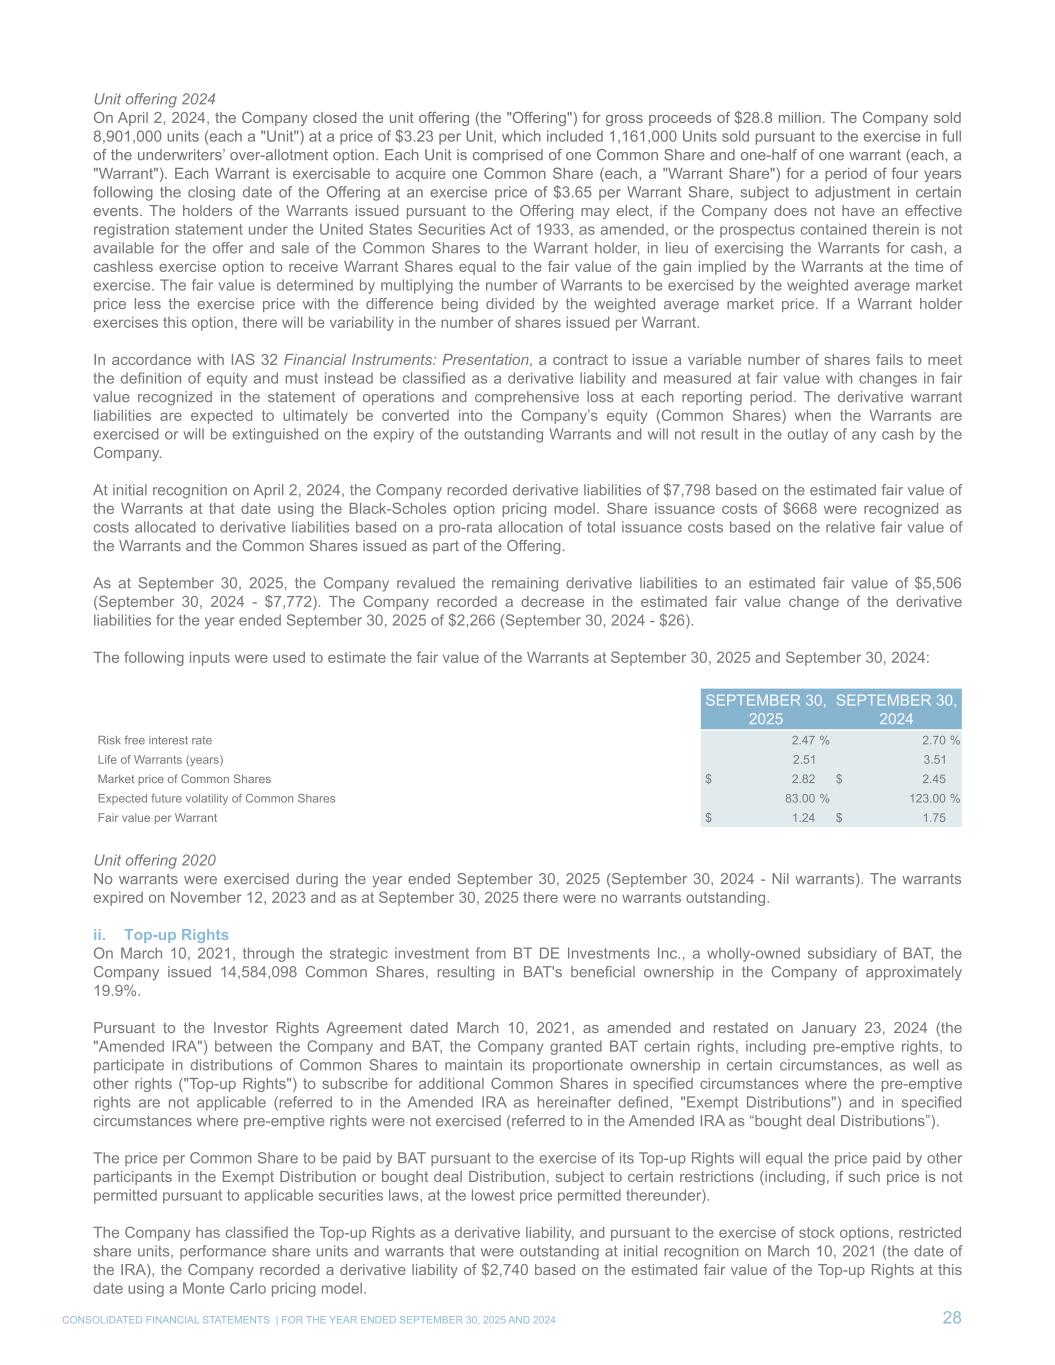
Unit offering 2024 On April 2, 2024, the Company closed the unit offering (the "Offering") for gross proceeds of $28.8 million. The Company sold 8,901,000 units (each a "Unit") at a price of $3.23 per Unit, which included 1,161,000 Units sold pursuant to the exercise in full of the underwriters’ over-allotment option. Each Unit is comprised of one Common Share and one-half of one warrant (each, a "Warrant"). Each Warrant is exercisable to acquire one Common Share (each, a "Warrant Share") for a period of four years following the closing date of the Offering at an exercise price of $3.65 per Warrant Share, subject to adjustment in certain events. The holders of the Warrants issued pursuant to the Offering may elect, if the Company does not have an effective registration statement under the United States Securities Act of 1933, as amended, or the prospectus contained therein is not available for the offer and sale of the Common Shares to the Warrant holder, in lieu of exercising the Warrants for cash, a cashless exercise option to receive Warrant Shares equal to the fair value of the gain implied by the Warrants at the time of exercise. The fair value is determined by multiplying the number of Warrants to be exercised by the weighted average market price less the exercise price with the difference being divided by the weighted average market price. If a Warrant holder exercises this option, there will be variability in the number of shares issued per Warrant. In accordance with IAS 32 Financial Instruments: Presentation, a contract to issue a variable number of shares fails to meet the definition of equity and must instead be classified as a derivative liability and measured at fair value with changes in fair value recognized in the statement of operations and comprehensive loss at each reporting period. The derivative warrant liabilities are expected to ultimately be converted into the Company’s equity (Common Shares) when the Warrants are exercised or will be extinguished on the expiry of the outstanding Warrants and will not result in the outlay of any cash by the Company. At initial recognition on April 2, 2024, the Company recorded derivative liabilities of $7,798 based on the estimated fair value of the Warrants at that date using the Black-Scholes option pricing model. Share issuance costs of $668 were recognized as costs allocated to derivative liabilities based on a pro-rata allocation of total issuance costs based on the relative fair value of the Warrants and the Common Shares issued as part of the Offering. As at September 30, 2025, the Company revalued the remaining derivative liabilities to an estimated fair value of $5,506 (September 30, 2024 - $7,772). The Company recorded a decrease in the estimated fair value change of the derivative liabilities for the year ended September 30, 2025 of $2,266 (September 30, 2024 - $26). The following inputs were used to estimate the fair value of the Warrants at September 30, 2025 and September 30, 2024: SEPTEMBER 30, 2025 SEPTEMBER 30, 2024 Risk free interest rate 2.47 % 2.70 % Life of Warrants (years) 2.51 3.51 Market price of Common Shares $ 2.82 $ 2.45 Expected future volatility of Common Shares 83.00 % 123.00 % Fair value per Warrant $ 1.24 $ 1.75 Unit offering 2020 No warrants were exercised during the year ended September 30, 2025 (September 30, 2024 - Nil warrants). The warrants expired on November 12, 2023 and as at September 30, 2025 there were no warrants outstanding. ii. Top-up Rights On March 10, 2021, through the strategic investment from BT DE Investments Inc., a wholly-owned subsidiary of BAT, the Company issued 14,584,098 Common Shares, resulting in BAT's beneficial ownership in the Company of approximately 19.9%. Pursuant to the Investor Rights Agreement dated March 10, 2021, as amended and restated on January 23, 2024 (the "Amended IRA") between the Company and BAT, the Company granted BAT certain rights, including pre-emptive rights, to participate in distributions of Common Shares to maintain its proportionate ownership in certain circumstances, as well as other rights ("Top-up Rights") to subscribe for additional Common Shares in specified circumstances where the pre-emptive rights are not applicable (referred to in the Amended IRA as hereinafter defined, "Exempt Distributions") and in specified circumstances where pre-emptive rights were not exercised (referred to in the Amended IRA as “bought deal Distributions”). The price per Common Share to be paid by BAT pursuant to the exercise of its Top-up Rights will equal the price paid by other participants in the Exempt Distribution or bought deal Distribution, subject to certain restrictions (including, if such price is not permitted pursuant to applicable securities laws, at the lowest price permitted thereunder). The Company has classified the Top-up Rights as a derivative liability, and pursuant to the exercise of stock options, restricted share units, performance share units and warrants that were outstanding at initial recognition on March 10, 2021 (the date of the IRA), the Company recorded a derivative liability of $2,740 based on the estimated fair value of the Top-up Rights at this date using a Monte Carlo pricing model. CONSOLIDATED FINANCIAL STATEMENTS | FOR THE YEAR ENDED SEPTEMBER 30, 2025 AND 2024 28
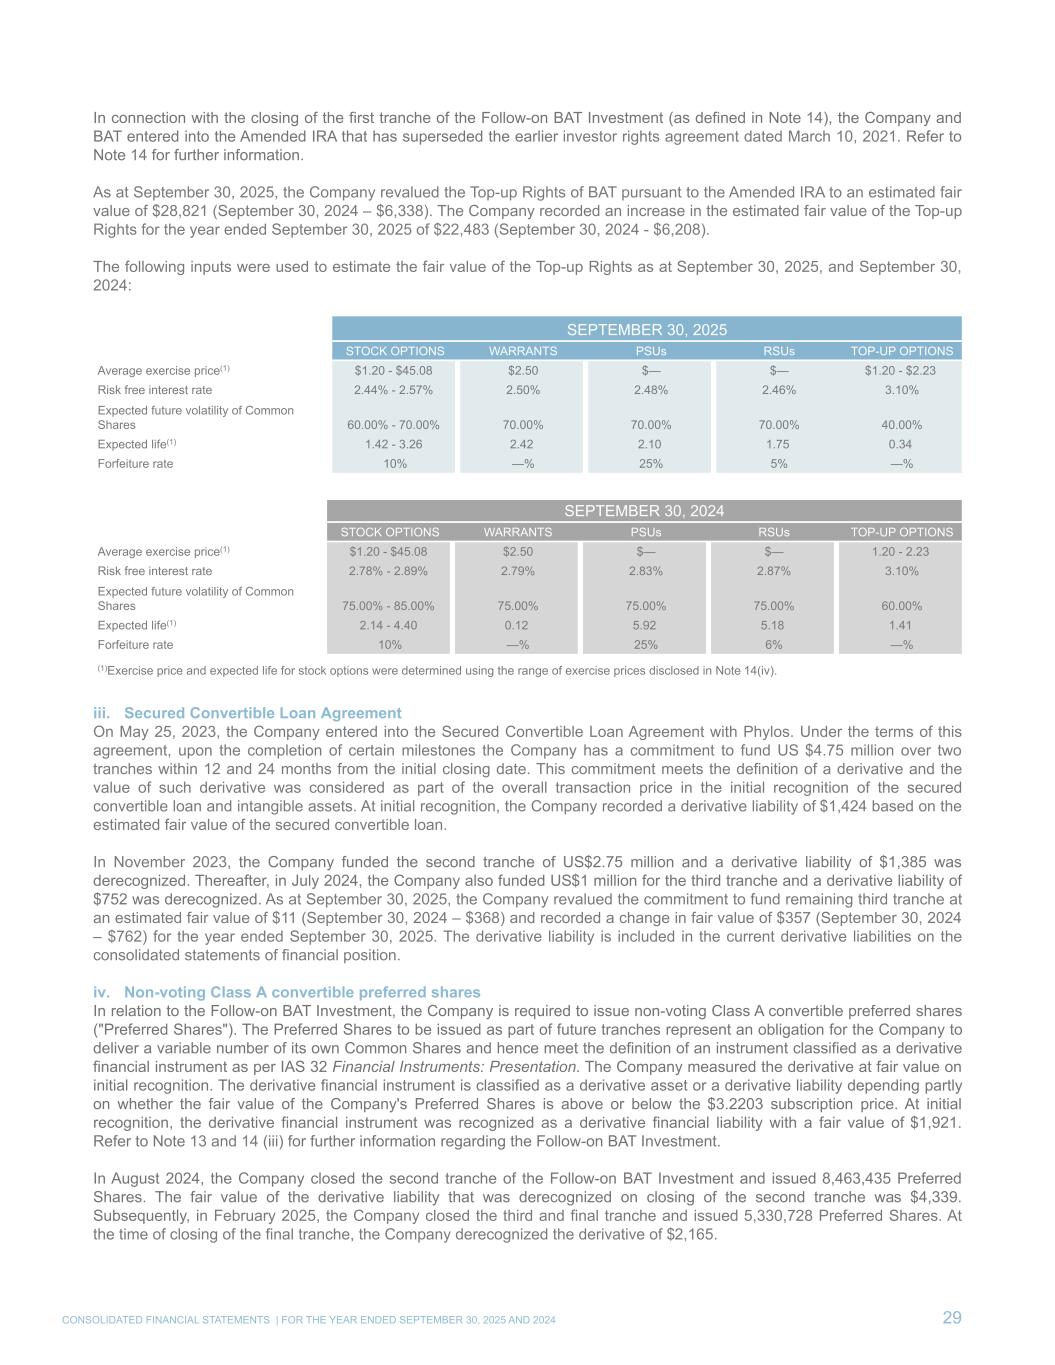
In connection with the closing of the first tranche of the Follow-on BAT Investment (as defined in Note 14), the Company and BAT entered into the Amended IRA that has superseded the earlier investor rights agreement dated March 10, 2021. Refer to Note 14 for further information. As at September 30, 2025, the Company revalued the Top-up Rights of BAT pursuant to the Amended IRA to an estimated fair value of $28,821 (September 30, 2024 – $6,338). The Company recorded an increase in the estimated fair value of the Top-up Rights for the year ended September 30, 2025 of $22,483 (September 30, 2024 - $6,208). The following inputs were used to estimate the fair value of the Top-up Rights as at September 30, 2025, and September 30, 2024: SEPTEMBER 30, 2025 STOCK OPTIONS WARRANTS PSUs RSUs TOP-UP OPTIONS Average exercise price(1) $1.20 - $45.08 $2.50 $— $— $1.20 - $2.23 Risk free interest rate 2.44% - 2.57% 2.50% 2.48% 2.46% 3.10% Expected future volatility of Common Shares 60.00% - 70.00% 70.00% 70.00% 70.00% 40.00% Expected life(1) 1.42 - 3.26 2.42 2.10 1.75 0.34 Forfeiture rate 10% —% 25% 5% —% SEPTEMBER 30, 2024 STOCK OPTIONS WARRANTS PSUs RSUs TOP-UP OPTIONS Average exercise price(1) $1.20 - $45.08 $2.50 $— $— 1.20 - 2.23 Risk free interest rate 2.78% - 2.89% 2.79% 2.83% 2.87% 3.10% Expected future volatility of Common Shares 75.00% - 85.00% 75.00% 75.00% 75.00% 60.00% Expected life(1) 2.14 - 4.40 0.12 5.92 5.18 1.41 Forfeiture rate 10% —% 25% 6% —% (1)Exercise price and expected life for stock options were determined using the range of exercise prices disclosed in Note 14(iv). iii. Secured Convertible Loan Agreement On May 25, 2023, the Company entered into the Secured Convertible Loan Agreement with Phylos. Under the terms of this agreement, upon the completion of certain milestones the Company has a commitment to fund US $4.75 million over two tranches within 12 and 24 months from the initial closing date. This commitment meets the definition of a derivative and the value of such derivative was considered as part of the overall transaction price in the initial recognition of the secured convertible loan and intangible assets. At initial recognition, the Company recorded a derivative liability of $1,424 based on the estimated fair value of the secured convertible loan. In November 2023, the Company funded the second tranche of US$2.75 million and a derivative liability of $1,385 was derecognized. Thereafter, in July 2024, the Company also funded US$1 million for the third tranche and a derivative liability of $752 was derecognized. As at September 30, 2025, the Company revalued the commitment to fund remaining third tranche at an estimated fair value of $11 (September 30, 2024 – $368) and recorded a change in fair value of $357 (September 30, 2024 – $762) for the year ended September 30, 2025. The derivative liability is included in the current derivative liabilities on the consolidated statements of financial position. iv. Non-voting Class A convertible preferred shares In relation to the Follow-on BAT Investment, the Company is required to issue non-voting Class A convertible preferred shares ("Preferred Shares"). The Preferred Shares to be issued as part of future tranches represent an obligation for the Company to deliver a variable number of its own Common Shares and hence meet the definition of an instrument classified as a derivative financial instrument as per IAS 32 Financial Instruments: Presentation. The Company measured the derivative at fair value on initial recognition. The derivative financial instrument is classified as a derivative asset or a derivative liability depending partly on whether the fair value of the Company's Preferred Shares is above or below the $3.2203 subscription price. At initial recognition, the derivative financial instrument was recognized as a derivative financial liability with a fair value of $1,921. Refer to Note 13 and 14 (iii) for further information regarding the Follow-on BAT Investment. In August 2024, the Company closed the second tranche of the Follow-on BAT Investment and issued 8,463,435 Preferred Shares. The fair value of the derivative liability that was derecognized on closing of the second tranche was $4,339. Subsequently, in February 2025, the Company closed the third and final tranche and issued 5,330,728 Preferred Shares. At the time of closing of the final tranche, the Company derecognized the derivative of $2,165. CONSOLIDATED FINANCIAL STATEMENTS | FOR THE YEAR ENDED SEPTEMBER 30, 2025 AND 2024 29
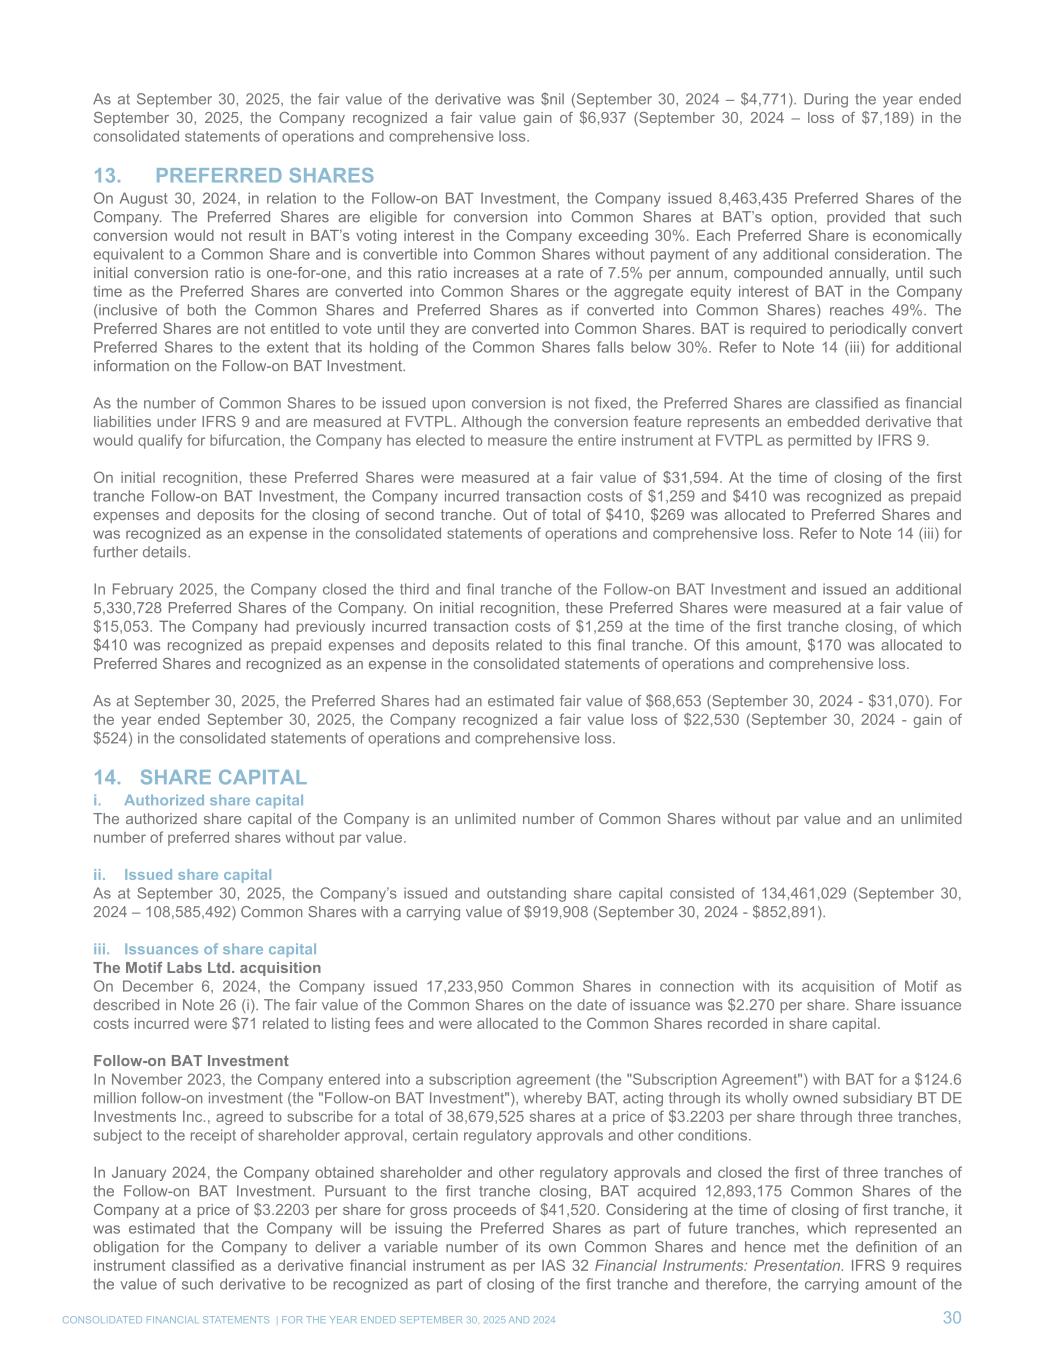
As at September 30, 2025, the fair value of the derivative was $nil (September 30, 2024 – $4,771). During the year ended September 30, 2025, the Company recognized a fair value gain of $6,937 (September 30, 2024 – loss of $7,189) in the consolidated statements of operations and comprehensive loss. 13. PREFERRED SHARES On August 30, 2024, in relation to the Follow-on BAT Investment, the Company issued 8,463,435 Preferred Shares of the Company. The Preferred Shares are eligible for conversion into Common Shares at BAT’s option, provided that such conversion would not result in BAT’s voting interest in the Company exceeding 30%. Each Preferred Share is economically equivalent to a Common Share and is convertible into Common Shares without payment of any additional consideration. The initial conversion ratio is one-for-one, and this ratio increases at a rate of 7.5% per annum, compounded annually, until such time as the Preferred Shares are converted into Common Shares or the aggregate equity interest of BAT in the Company (inclusive of both the Common Shares and Preferred Shares as if converted into Common Shares) reaches 49%. The Preferred Shares are not entitled to vote until they are converted into Common Shares. BAT is required to periodically convert Preferred Shares to the extent that its holding of the Common Shares falls below 30%. Refer to Note 14 (iii) for additional information on the Follow-on BAT Investment. As the number of Common Shares to be issued upon conversion is not fixed, the Preferred Shares are classified as financial liabilities under IFRS 9 and are measured at FVTPL. Although the conversion feature represents an embedded derivative that would qualify for bifurcation, the Company has elected to measure the entire instrument at FVTPL as permitted by IFRS 9. On initial recognition, these Preferred Shares were measured at a fair value of $31,594. At the time of closing of the first tranche Follow-on BAT Investment, the Company incurred transaction costs of $1,259 and $410 was recognized as prepaid expenses and deposits for the closing of second tranche. Out of total of $410, $269 was allocated to Preferred Shares and was recognized as an expense in the consolidated statements of operations and comprehensive loss. Refer to Note 14 (iii) for further details. In February 2025, the Company closed the third and final tranche of the Follow-on BAT Investment and issued an additional 5,330,728 Preferred Shares of the Company. On initial recognition, these Preferred Shares were measured at a fair value of $15,053. The Company had previously incurred transaction costs of $1,259 at the time of the first tranche closing, of which $410 was recognized as prepaid expenses and deposits related to this final tranche. Of this amount, $170 was allocated to Preferred Shares and recognized as an expense in the consolidated statements of operations and comprehensive loss. As at September 30, 2025, the Preferred Shares had an estimated fair value of $68,653 (September 30, 2024 - $31,070). For the year ended September 30, 2025, the Company recognized a fair value loss of $22,530 (September 30, 2024 - gain of $524) in the consolidated statements of operations and comprehensive loss. 14. SHARE CAPITAL i. Authorized share capital The authorized share capital of the Company is an unlimited number of Common Shares without par value and an unlimited number of preferred shares without par value. ii. Issued share capital As at September 30, 2025, the Company’s issued and outstanding share capital consisted of 134,461,029 (September 30, 2024 – 108,585,492) Common Shares with a carrying value of $919,908 (September 30, 2024 - $852,891). iii. Issuances of share capital The Motif Labs Ltd. acquisition On December 6, 2024, the Company issued 17,233,950 Common Shares in connection with its acquisition of Motif as described in Note 26 (i). The fair value of the Common Shares on the date of issuance was $2.270 per share. Share issuance costs incurred were $71 related to listing fees and were allocated to the Common Shares recorded in share capital. Follow-on BAT Investment In November 2023, the Company entered into a subscription agreement (the "Subscription Agreement") with BAT for a $124.6 million follow-on investment (the "Follow-on BAT Investment"), whereby BAT, acting through its wholly owned subsidiary BT DE Investments Inc., agreed to subscribe for a total of 38,679,525 shares at a price of $3.2203 per share through three tranches, subject to the receipt of shareholder approval, certain regulatory approvals and other conditions. In January 2024, the Company obtained shareholder and other regulatory approvals and closed the first of three tranches of the Follow-on BAT Investment. Pursuant to the first tranche closing, BAT acquired 12,893,175 Common Shares of the Company at a price of $3.2203 per share for gross proceeds of $41,520. Considering at the time of closing of first tranche, it was estimated that the Company will be issuing the Preferred Shares as part of future tranches, which represented an obligation for the Company to deliver a variable number of its own Common Shares and hence met the definition of an instrument classified as a derivative financial instrument as per IAS 32 Financial Instruments: Presentation. IFRS 9 requires the value of such derivative to be recognized as part of closing of the first tranche and therefore, the carrying amount of the CONSOLIDATED FINANCIAL STATEMENTS | FOR THE YEAR ENDED SEPTEMBER 30, 2025 AND 2024 30
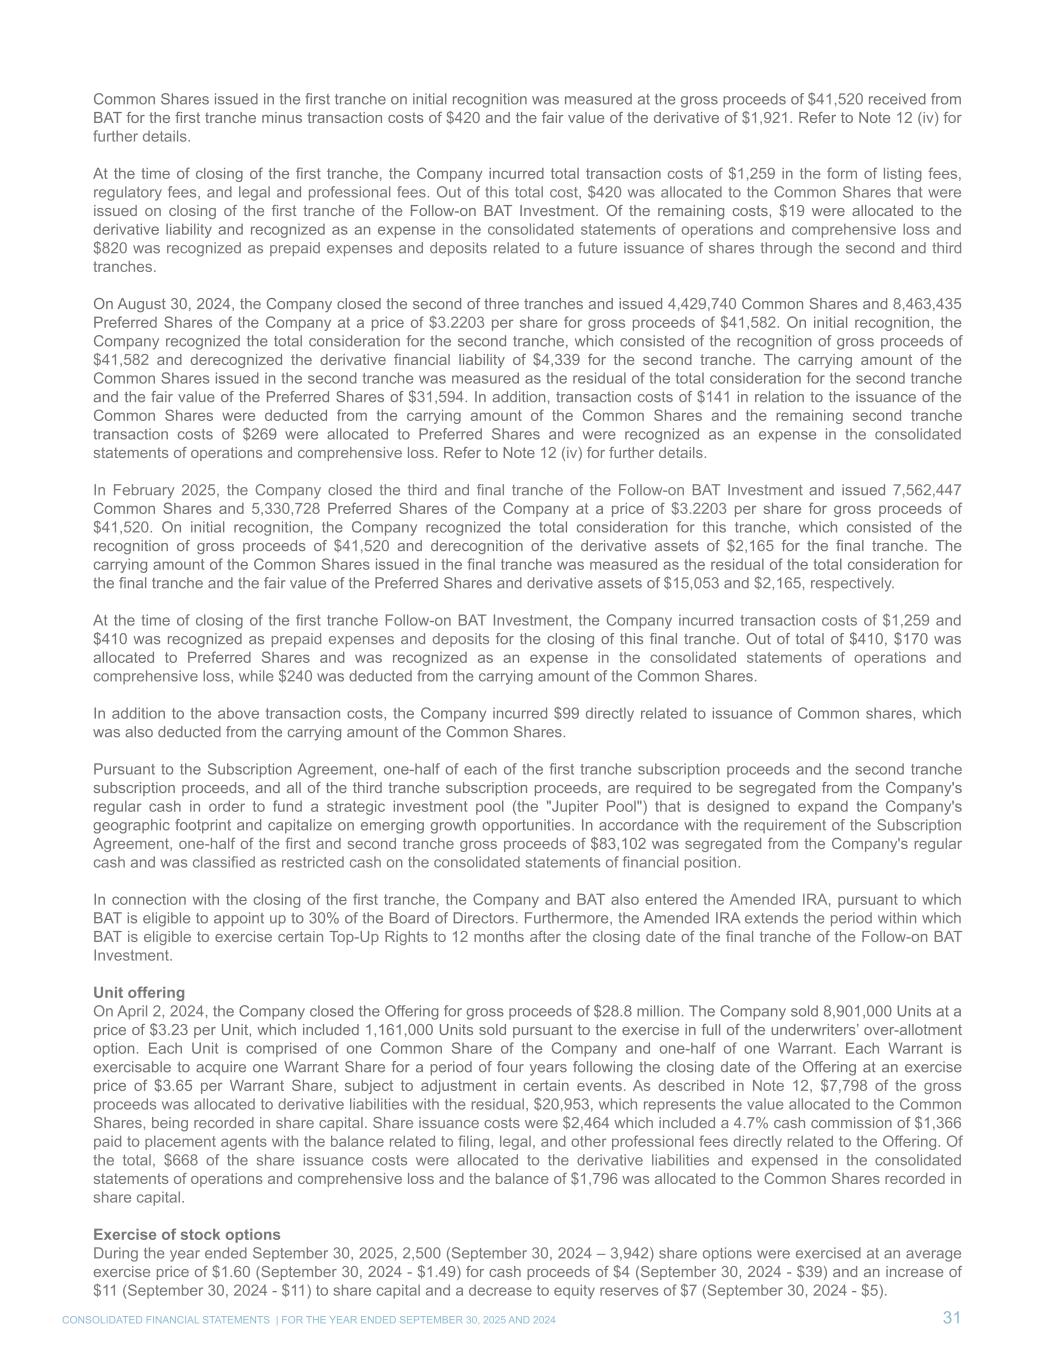
Common Shares issued in the first tranche on initial recognition was measured at the gross proceeds of $41,520 received from BAT for the first tranche minus transaction costs of $420 and the fair value of the derivative of $1,921. Refer to Note 12 (iv) for further details. At the time of closing of the first tranche, the Company incurred total transaction costs of $1,259 in the form of listing fees, regulatory fees, and legal and professional fees. Out of this total cost, $420 was allocated to the Common Shares that were issued on closing of the first tranche of the Follow-on BAT Investment. Of the remaining costs, $19 were allocated to the derivative liability and recognized as an expense in the consolidated statements of operations and comprehensive loss and $820 was recognized as prepaid expenses and deposits related to a future issuance of shares through the second and third tranches. On August 30, 2024, the Company closed the second of three tranches and issued 4,429,740 Common Shares and 8,463,435 Preferred Shares of the Company at a price of $3.2203 per share for gross proceeds of $41,582. On initial recognition, the Company recognized the total consideration for the second tranche, which consisted of the recognition of gross proceeds of $41,582 and derecognized the derivative financial liability of $4,339 for the second tranche. The carrying amount of the Common Shares issued in the second tranche was measured as the residual of the total consideration for the second tranche and the fair value of the Preferred Shares of $31,594. In addition, transaction costs of $141 in relation to the issuance of the Common Shares were deducted from the carrying amount of the Common Shares and the remaining second tranche transaction costs of $269 were allocated to Preferred Shares and were recognized as an expense in the consolidated statements of operations and comprehensive loss. Refer to Note 12 (iv) for further details. In February 2025, the Company closed the third and final tranche of the Follow-on BAT Investment and issued 7,562,447 Common Shares and 5,330,728 Preferred Shares of the Company at a price of $3.2203 per share for gross proceeds of $41,520. On initial recognition, the Company recognized the total consideration for this tranche, which consisted of the recognition of gross proceeds of $41,520 and derecognition of the derivative assets of $2,165 for the final tranche. The carrying amount of the Common Shares issued in the final tranche was measured as the residual of the total consideration for the final tranche and the fair value of the Preferred Shares and derivative assets of $15,053 and $2,165, respectively. At the time of closing of the first tranche Follow-on BAT Investment, the Company incurred transaction costs of $1,259 and $410 was recognized as prepaid expenses and deposits for the closing of this final tranche. Out of total of $410, $170 was allocated to Preferred Shares and was recognized as an expense in the consolidated statements of operations and comprehensive loss, while $240 was deducted from the carrying amount of the Common Shares. In addition to the above transaction costs, the Company incurred $99 directly related to issuance of Common shares, which was also deducted from the carrying amount of the Common Shares. Pursuant to the Subscription Agreement, one-half of each of the first tranche subscription proceeds and the second tranche subscription proceeds, and all of the third tranche subscription proceeds, are required to be segregated from the Company's regular cash in order to fund a strategic investment pool (the "Jupiter Pool") that is designed to expand the Company's geographic footprint and capitalize on emerging growth opportunities. In accordance with the requirement of the Subscription Agreement, one-half of the first and second tranche gross proceeds of $83,102 was segregated from the Company's regular cash and was classified as restricted cash on the consolidated statements of financial position. In connection with the closing of the first tranche, the Company and BAT also entered the Amended IRA, pursuant to which BAT is eligible to appoint up to 30% of the Board of Directors. Furthermore, the Amended IRA extends the period within which BAT is eligible to exercise certain Top-Up Rights to 12 months after the closing date of the final tranche of the Follow-on BAT Investment. Unit offering On April 2, 2024, the Company closed the Offering for gross proceeds of $28.8 million. The Company sold 8,901,000 Units at a price of $3.23 per Unit, which included 1,161,000 Units sold pursuant to the exercise in full of the underwriters’ over-allotment option. Each Unit is comprised of one Common Share of the Company and one-half of one Warrant. Each Warrant is exercisable to acquire one Warrant Share for a period of four years following the closing date of the Offering at an exercise price of $3.65 per Warrant Share, subject to adjustment in certain events. As described in Note 12, $7,798 of the gross proceeds was allocated to derivative liabilities with the residual, $20,953, which represents the value allocated to the Common Shares, being recorded in share capital. Share issuance costs were $2,464 which included a 4.7% cash commission of $1,366 paid to placement agents with the balance related to filing, legal, and other professional fees directly related to the Offering. Of the total, $668 of the share issuance costs were allocated to the derivative liabilities and expensed in the consolidated statements of operations and comprehensive loss and the balance of $1,796 was allocated to the Common Shares recorded in share capital. Exercise of stock options During the year ended September 30, 2025, 2,500 (September 30, 2024 – 3,942) share options were exercised at an average exercise price of $1.60 (September 30, 2024 - $1.49) for cash proceeds of $4 (September 30, 2024 - $39) and an increase of $11 (September 30, 2024 - $11) to share capital and a decrease to equity reserves of $7 (September 30, 2024 - $5). CONSOLIDATED FINANCIAL STATEMENTS | FOR THE YEAR ENDED SEPTEMBER 30, 2025 AND 2024 31
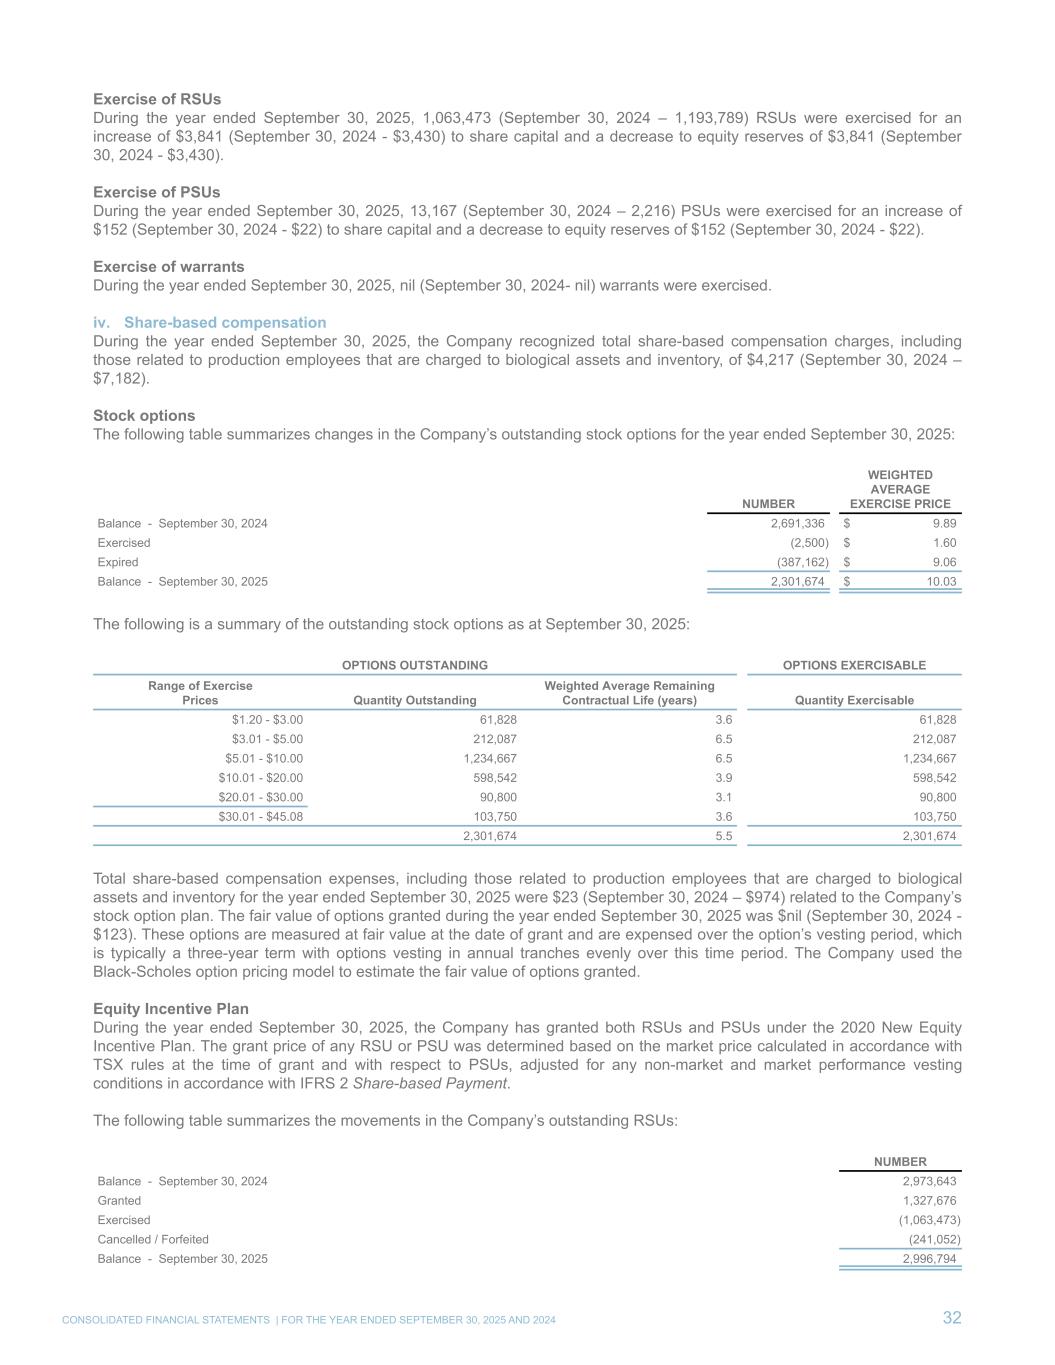
Exercise of RSUs During the year ended September 30, 2025, 1,063,473 (September 30, 2024 – 1,193,789) RSUs were exercised for an increase of $3,841 (September 30, 2024 - $3,430) to share capital and a decrease to equity reserves of $3,841 (September 30, 2024 - $3,430). Exercise of PSUs During the year ended September 30, 2025, 13,167 (September 30, 2024 – 2,216) PSUs were exercised for an increase of $152 (September 30, 2024 - $22) to share capital and a decrease to equity reserves of $152 (September 30, 2024 - $22). Exercise of warrants During the year ended September 30, 2025, nil (September 30, 2024- nil) warrants were exercised. iv. Share-based compensation During the year ended September 30, 2025, the Company recognized total share-based compensation charges, including those related to production employees that are charged to biological assets and inventory, of $4,217 (September 30, 2024 – $7,182). Stock options The following table summarizes changes in the Company’s outstanding stock options for the year ended September 30, 2025: NUMBER WEIGHTED AVERAGE EXERCISE PRICE Balance - September 30, 2024 2,691,336 $ 9.89 Exercised (2,500) $ 1.60 Expired (387,162) $ 9.06 Balance - September 30, 2025 2,301,674 $ 10.03 The following is a summary of the outstanding stock options as at September 30, 2025: OPTIONS OUTSTANDING OPTIONS EXERCISABLE Range of Exercise Prices Quantity Outstanding Weighted Average Remaining Contractual Life (years) Quantity Exercisable $1.20 - $3.00 61,828 3.6 61,828 $3.01 - $5.00 212,087 6.5 212,087 $5.01 - $10.00 1,234,667 6.5 1,234,667 $10.01 - $20.00 598,542 3.9 598,542 $20.01 - $30.00 90,800 3.1 90,800 $30.01 - $45.08 103,750 3.6 103,750 2,301,674 5.5 2,301,674 Total share-based compensation expenses, including those related to production employees that are charged to biological assets and inventory for the year ended September 30, 2025 were $23 (September 30, 2024 – $974) related to the Company’s stock option plan. The fair value of options granted during the year ended September 30, 2025 was $nil (September 30, 2024 - $123). These options are measured at fair value at the date of grant and are expensed over the option’s vesting period, which is typically a three-year term with options vesting in annual tranches evenly over this time period. The Company used the Black-Scholes option pricing model to estimate the fair value of options granted. Equity Incentive Plan During the year ended September 30, 2025, the Company has granted both RSUs and PSUs under the 2020 New Equity Incentive Plan. The grant price of any RSU or PSU was determined based on the market price calculated in accordance with TSX rules at the time of grant and with respect to PSUs, adjusted for any non-market and market performance vesting conditions in accordance with IFRS 2 Share-based Payment. The following table summarizes the movements in the Company’s outstanding RSUs: NUMBER Balance - September 30, 2024 2,973,643 Granted 1,327,676 Exercised (1,063,473) Cancelled / Forfeited (241,052) Balance - September 30, 2025 2,996,794 CONSOLIDATED FINANCIAL STATEMENTS | FOR THE YEAR ENDED SEPTEMBER 30, 2025 AND 2024 32
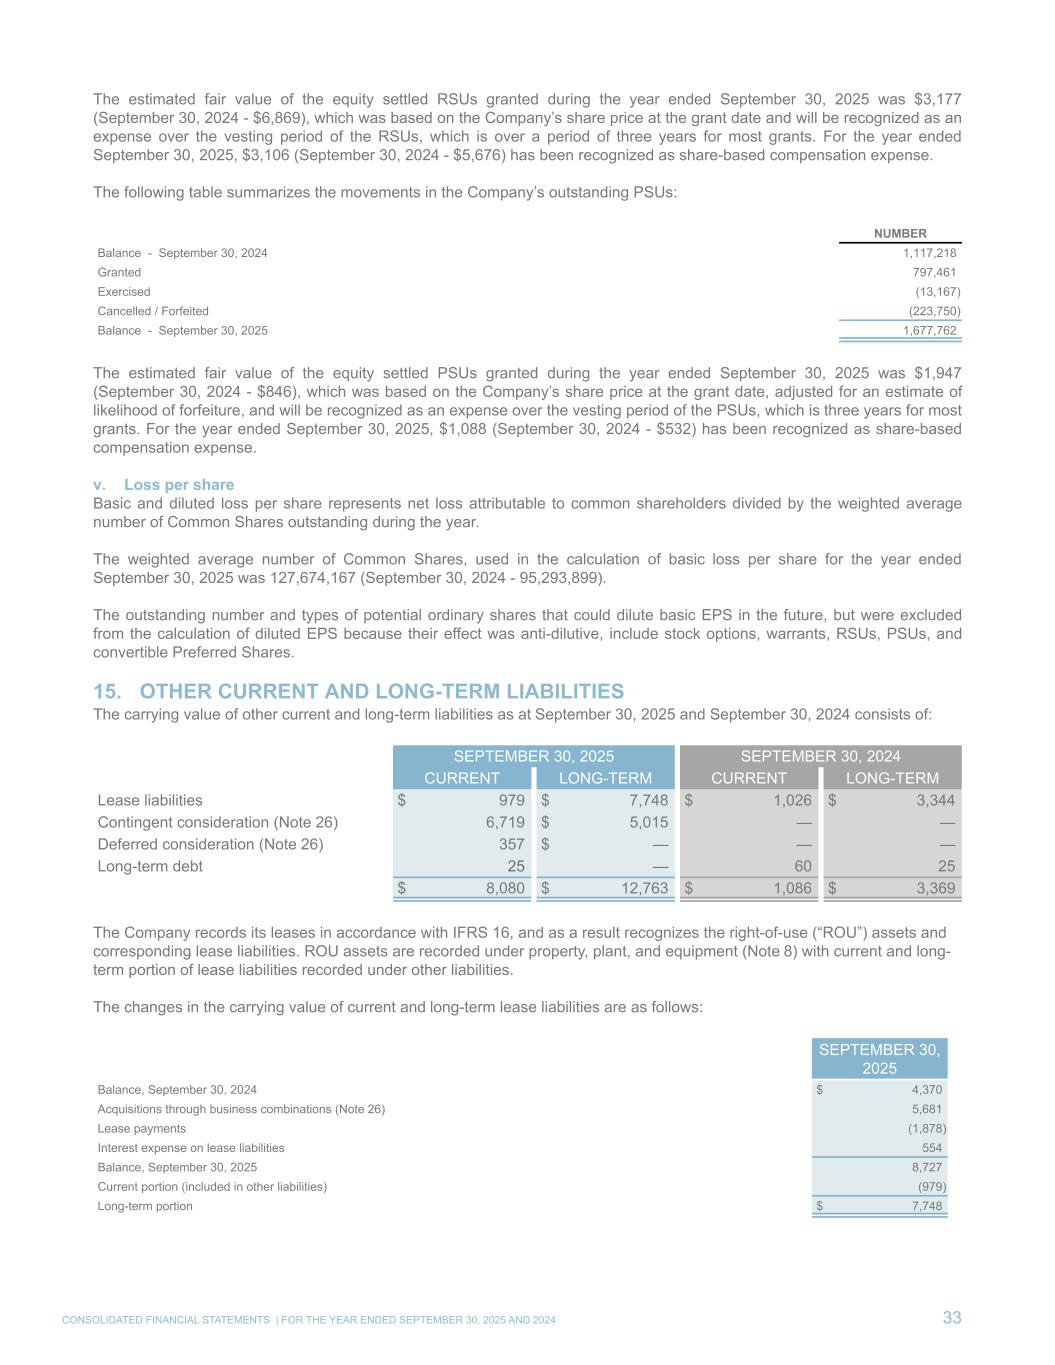
The estimated fair value of the equity settled RSUs granted during the year ended September 30, 2025 was $3,177 (September 30, 2024 - $6,869), which was based on the Company’s share price at the grant date and will be recognized as an expense over the vesting period of the RSUs, which is over a period of three years for most grants. For the year ended September 30, 2025, $3,106 (September 30, 2024 - $5,676) has been recognized as share-based compensation expense. The following table summarizes the movements in the Company’s outstanding PSUs: NUMBER Balance - September 30, 2024 1,117,218 Granted 797,461 Exercised (13,167) Cancelled / Forfeited (223,750) Balance - September 30, 2025 1,677,762 The estimated fair value of the equity settled PSUs granted during the year ended September 30, 2025 was $1,947 (September 30, 2024 - $846), which was based on the Company’s share price at the grant date, adjusted for an estimate of likelihood of forfeiture, and will be recognized as an expense over the vesting period of the PSUs, which is three years for most grants. For the year ended September 30, 2025, $1,088 (September 30, 2024 - $532) has been recognized as share-based compensation expense. v. Loss per share Basic and diluted loss per share represents net loss attributable to common shareholders divided by the weighted average number of Common Shares outstanding during the year. The weighted average number of Common Shares, used in the calculation of basic loss per share for the year ended September 30, 2025 was 127,674,167 (September 30, 2024 - 95,293,899). The outstanding number and types of potential ordinary shares that could dilute basic EPS in the future, but were excluded from the calculation of diluted EPS because their effect was anti-dilutive, include stock options, warrants, RSUs, PSUs, and convertible Preferred Shares. 15. OTHER CURRENT AND LONG-TERM LIABILITIES The carrying value of other current and long-term liabilities as at September 30, 2025 and September 30, 2024 consists of: SEPTEMBER 30, 2025 SEPTEMBER 30, 2024 CURRENT LONG-TERM CURRENT LONG-TERM Lease liabilities $ 979 $ 7,748 $ 1,026 $ 3,344 Contingent consideration (Note 26) 6,719 $ 5,015 — — Deferred consideration (Note 26) 357 $ — — — Long-term debt 25 — 60 25 $ 8,080 $ 12,763 $ 1,086 $ 3,369 The Company records its leases in accordance with IFRS 16, and as a result recognizes the right-of-use (“ROU”) assets and corresponding lease liabilities. ROU assets are recorded under property, plant, and equipment (Note 8) with current and long- term portion of lease liabilities recorded under other liabilities. The changes in the carrying value of current and long-term lease liabilities are as follows: SEPTEMBER 30, 2025 Balance, September 30, 2024 $ 4,370 Acquisitions through business combinations (Note 26) 5,681 Lease payments (1,878) Interest expense on lease liabilities 554 Balance, September 30, 2025 8,727 Current portion (included in other liabilities) (979) Long-term portion $ 7,748 CONSOLIDATED FINANCIAL STATEMENTS | FOR THE YEAR ENDED SEPTEMBER 30, 2025 AND 2024 33
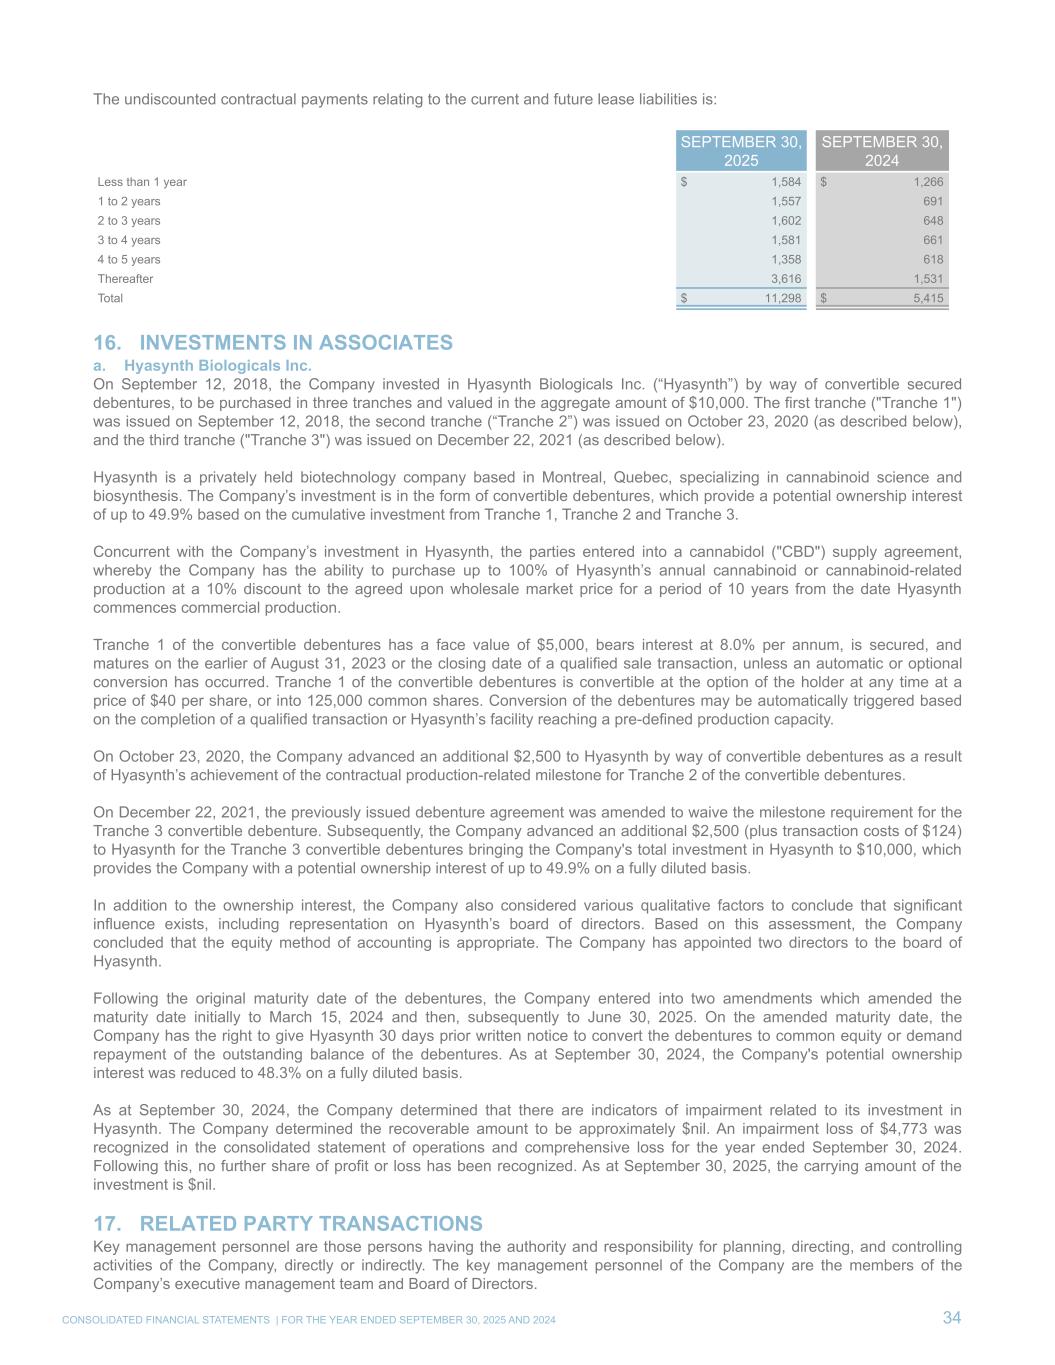
The undiscounted contractual payments relating to the current and future lease liabilities is: SEPTEMBER 30, 2025 SEPTEMBER 30, 2024 Less than 1 year $ 1,584 $ 1,266 1 to 2 years 1,557 691 2 to 3 years 1,602 648 3 to 4 years 1,581 661 4 to 5 years 1,358 618 Thereafter 3,616 1,531 Total $ 11,298 $ 5,415 16. INVESTMENTS IN ASSOCIATES a. Hyasynth Biologicals Inc. On September 12, 2018, the Company invested in Hyasynth Biologicals Inc. (“Hyasynth”) by way of convertible secured debentures, to be purchased in three tranches and valued in the aggregate amount of $10,000. The first tranche ("Tranche 1") was issued on September 12, 2018, the second tranche (“Tranche 2”) was issued on October 23, 2020 (as described below), and the third tranche ("Tranche 3") was issued on December 22, 2021 (as described below). Hyasynth is a privately held biotechnology company based in Montreal, Quebec, specializing in cannabinoid science and biosynthesis. The Company’s investment is in the form of convertible debentures, which provide a potential ownership interest of up to 49.9% based on the cumulative investment from Tranche 1, Tranche 2 and Tranche 3. Concurrent with the Company’s investment in Hyasynth, the parties entered into a cannabidol ("CBD") supply agreement, whereby the Company has the ability to purchase up to 100% of Hyasynth’s annual cannabinoid or cannabinoid-related production at a 10% discount to the agreed upon wholesale market price for a period of 10 years from the date Hyasynth commences commercial production. Tranche 1 of the convertible debentures has a face value of $5,000, bears interest at 8.0% per annum, is secured, and matures on the earlier of August 31, 2023 or the closing date of a qualified sale transaction, unless an automatic or optional conversion has occurred. Tranche 1 of the convertible debentures is convertible at the option of the holder at any time at a price of $40 per share, or into 125,000 common shares. Conversion of the debentures may be automatically triggered based on the completion of a qualified transaction or Hyasynth’s facility reaching a pre-defined production capacity. On October 23, 2020, the Company advanced an additional $2,500 to Hyasynth by way of convertible debentures as a result of Hyasynth’s achievement of the contractual production-related milestone for Tranche 2 of the convertible debentures. On December 22, 2021, the previously issued debenture agreement was amended to waive the milestone requirement for the Tranche 3 convertible debenture. Subsequently, the Company advanced an additional $2,500 (plus transaction costs of $124) to Hyasynth for the Tranche 3 convertible debentures bringing the Company's total investment in Hyasynth to $10,000, which provides the Company with a potential ownership interest of up to 49.9% on a fully diluted basis. In addition to the ownership interest, the Company also considered various qualitative factors to conclude that significant influence exists, including representation on Hyasynth’s board of directors. Based on this assessment, the Company concluded that the equity method of accounting is appropriate. The Company has appointed two directors to the board of Hyasynth. Following the original maturity date of the debentures, the Company entered into two amendments which amended the maturity date initially to March 15, 2024 and then, subsequently to June 30, 2025. On the amended maturity date, the Company has the right to give Hyasynth 30 days prior written notice to convert the debentures to common equity or demand repayment of the outstanding balance of the debentures. As at September 30, 2024, the Company's potential ownership interest was reduced to 48.3% on a fully diluted basis. As at September 30, 2024, the Company determined that there are indicators of impairment related to its investment in Hyasynth. The Company determined the recoverable amount to be approximately $nil. An impairment loss of $4,773 was recognized in the consolidated statement of operations and comprehensive loss for the year ended September 30, 2024. Following this, no further share of profit or loss has been recognized. As at September 30, 2025, the carrying amount of the investment is $nil. 17. RELATED PARTY TRANSACTIONS Key management personnel are those persons having the authority and responsibility for planning, directing, and controlling activities of the Company, directly or indirectly. The key management personnel of the Company are the members of the Company’s executive management team and Board of Directors. CONSOLIDATED FINANCIAL STATEMENTS | FOR THE YEAR ENDED SEPTEMBER 30, 2025 AND 2024 34
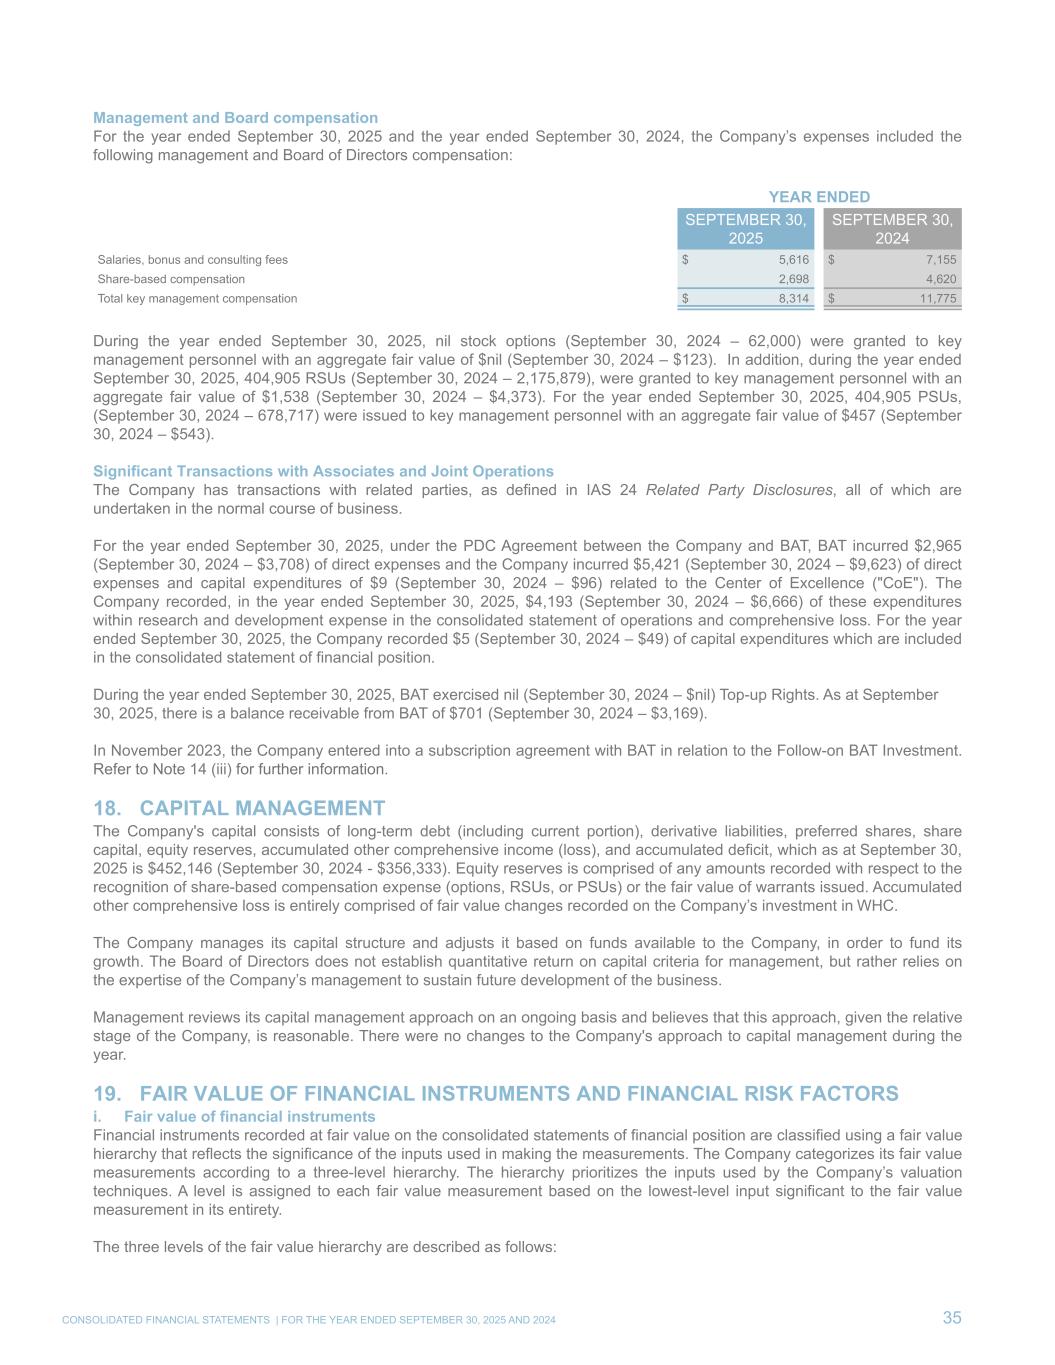
Management and Board compensation For the year ended September 30, 2025 and the year ended September 30, 2024, the Company’s expenses included the following management and Board of Directors compensation: YEAR ENDED SEPTEMBER 30, 2025 SEPTEMBER 30, 2024 Salaries, bonus and consulting fees $ 5,616 $ 7,155 Share-based compensation 2,698 4,620 Total key management compensation $ 8,314 $ 11,775 During the year ended September 30, 2025, nil stock options (September 30, 2024 – 62,000) were granted to key management personnel with an aggregate fair value of $nil (September 30, 2024 – $123). In addition, during the year ended September 30, 2025, 404,905 RSUs (September 30, 2024 – 2,175,879), were granted to key management personnel with an aggregate fair value of $1,538 (September 30, 2024 – $4,373). For the year ended September 30, 2025, 404,905 PSUs, (September 30, 2024 – 678,717) were issued to key management personnel with an aggregate fair value of $457 (September 30, 2024 – $543). Significant Transactions with Associates and Joint Operations The Company has transactions with related parties, as defined in IAS 24 Related Party Disclosures, all of which are undertaken in the normal course of business. For the year ended September 30, 2025, under the PDC Agreement between the Company and BAT, BAT incurred $2,965 (September 30, 2024 – $3,708) of direct expenses and the Company incurred $5,421 (September 30, 2024 – $9,623) of direct expenses and capital expenditures of $9 (September 30, 2024 – $96) related to the Center of Excellence ("CoE"). The Company recorded, in the year ended September 30, 2025, $4,193 (September 30, 2024 – $6,666) of these expenditures within research and development expense in the consolidated statement of operations and comprehensive loss. For the year ended September 30, 2025, the Company recorded $5 (September 30, 2024 – $49) of capital expenditures which are included in the consolidated statement of financial position. During the year ended September 30, 2025, BAT exercised nil (September 30, 2024 – $nil) Top-up Rights. As at September 30, 2025, there is a balance receivable from BAT of $701 (September 30, 2024 – $3,169). In November 2023, the Company entered into a subscription agreement with BAT in relation to the Follow-on BAT Investment. Refer to Note 14 (iii) for further information. 18. CAPITAL MANAGEMENT The Company's capital consists of long-term debt (including current portion), derivative liabilities, preferred shares, share capital, equity reserves, accumulated other comprehensive income (loss), and accumulated deficit, which as at September 30, 2025 is $452,146 (September 30, 2024 - $356,333). Equity reserves is comprised of any amounts recorded with respect to the recognition of share-based compensation expense (options, RSUs, or PSUs) or the fair value of warrants issued. Accumulated other comprehensive loss is entirely comprised of fair value changes recorded on the Company’s investment in WHC. The Company manages its capital structure and adjusts it based on funds available to the Company, in order to fund its growth. The Board of Directors does not establish quantitative return on capital criteria for management, but rather relies on the expertise of the Company’s management to sustain future development of the business. Management reviews its capital management approach on an ongoing basis and believes that this approach, given the relative stage of the Company, is reasonable. There were no changes to the Company's approach to capital management during the year. 19. FAIR VALUE OF FINANCIAL INSTRUMENTS AND FINANCIAL RISK FACTORS i. Fair value of financial instruments Financial instruments recorded at fair value on the consolidated statements of financial position are classified using a fair value hierarchy that reflects the significance of the inputs used in making the measurements. The Company categorizes its fair value measurements according to a three-level hierarchy. The hierarchy prioritizes the inputs used by the Company’s valuation techniques. A level is assigned to each fair value measurement based on the lowest-level input significant to the fair value measurement in its entirety. The three levels of the fair value hierarchy are described as follows: CONSOLIDATED FINANCIAL STATEMENTS | FOR THE YEAR ENDED SEPTEMBER 30, 2025 AND 2024 35
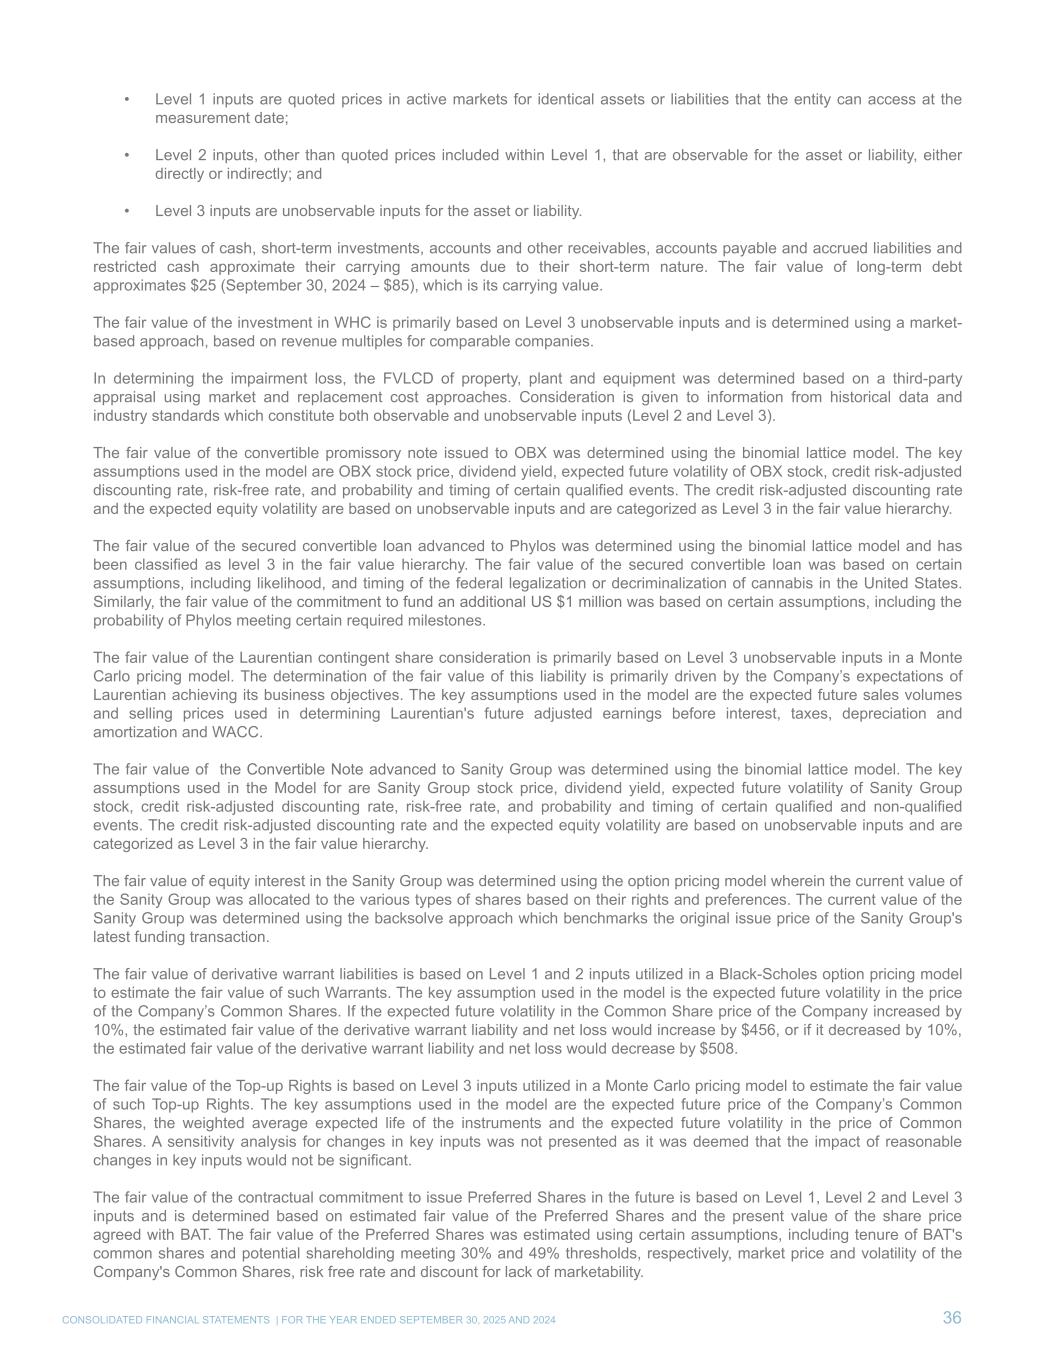
• Level 1 inputs are quoted prices in active markets for identical assets or liabilities that the entity can access at the measurement date; • Level 2 inputs, other than quoted prices included within Level 1, that are observable for the asset or liability, either directly or indirectly; and • Level 3 inputs are unobservable inputs for the asset or liability. The fair values of cash, short-term investments, accounts and other receivables, accounts payable and accrued liabilities and restricted cash approximate their carrying amounts due to their short-term nature. The fair value of long-term debt approximates $25 (September 30, 2024 – $85), which is its carrying value. The fair value of the investment in WHC is primarily based on Level 3 unobservable inputs and is determined using a market- based approach, based on revenue multiples for comparable companies. In determining the impairment loss, the FVLCD of property, plant and equipment was determined based on a third-party appraisal using market and replacement cost approaches. Consideration is given to information from historical data and industry standards which constitute both observable and unobservable inputs (Level 2 and Level 3). The fair value of the convertible promissory note issued to OBX was determined using the binomial lattice model. The key assumptions used in the model are OBX stock price, dividend yield, expected future volatility of OBX stock, credit risk-adjusted discounting rate, risk-free rate, and probability and timing of certain qualified events. The credit risk-adjusted discounting rate and the expected equity volatility are based on unobservable inputs and are categorized as Level 3 in the fair value hierarchy. The fair value of the secured convertible loan advanced to Phylos was determined using the binomial lattice model and has been classified as level 3 in the fair value hierarchy. The fair value of the secured convertible loan was based on certain assumptions, including likelihood, and timing of the federal legalization or decriminalization of cannabis in the United States. Similarly, the fair value of the commitment to fund an additional US $1 million was based on certain assumptions, including the probability of Phylos meeting certain required milestones. The fair value of the Laurentian contingent share consideration is primarily based on Level 3 unobservable inputs in a Monte Carlo pricing model. The determination of the fair value of this liability is primarily driven by the Company’s expectations of Laurentian achieving its business objectives. The key assumptions used in the model are the expected future sales volumes and selling prices used in determining Laurentian's future adjusted earnings before interest, taxes, depreciation and amortization and WACC. The fair value of the Convertible Note advanced to Sanity Group was determined using the binomial lattice model. The key assumptions used in the Model for are Sanity Group stock price, dividend yield, expected future volatility of Sanity Group stock, credit risk-adjusted discounting rate, risk-free rate, and probability and timing of certain qualified and non-qualified events. The credit risk-adjusted discounting rate and the expected equity volatility are based on unobservable inputs and are categorized as Level 3 in the fair value hierarchy. The fair value of equity interest in the Sanity Group was determined using the option pricing model wherein the current value of the Sanity Group was allocated to the various types of shares based on their rights and preferences. The current value of the Sanity Group was determined using the backsolve approach which benchmarks the original issue price of the Sanity Group's latest funding transaction. The fair value of derivative warrant liabilities is based on Level 1 and 2 inputs utilized in a Black-Scholes option pricing model to estimate the fair value of such Warrants. The key assumption used in the model is the expected future volatility in the price of the Company’s Common Shares. If the expected future volatility in the Common Share price of the Company increased by 10%, the estimated fair value of the derivative warrant liability and net loss would increase by $456, or if it decreased by 10%, the estimated fair value of the derivative warrant liability and net loss would decrease by $508. The fair value of the Top-up Rights is based on Level 3 inputs utilized in a Monte Carlo pricing model to estimate the fair value of such Top-up Rights. The key assumptions used in the model are the expected future price of the Company’s Common Shares, the weighted average expected life of the instruments and the expected future volatility in the price of Common Shares. A sensitivity analysis for changes in key inputs was not presented as it was deemed that the impact of reasonable changes in key inputs would not be significant. The fair value of the contractual commitment to issue Preferred Shares in the future is based on Level 1, Level 2 and Level 3 inputs and is determined based on estimated fair value of the Preferred Shares and the present value of the share price agreed with BAT. The fair value of the Preferred Shares was estimated using certain assumptions, including tenure of BAT's common shares and potential shareholding meeting 30% and 49% thresholds, respectively, market price and volatility of the Company's Common Shares, risk free rate and discount for lack of marketability. CONSOLIDATED FINANCIAL STATEMENTS | FOR THE YEAR ENDED SEPTEMBER 30, 2025 AND 2024 36
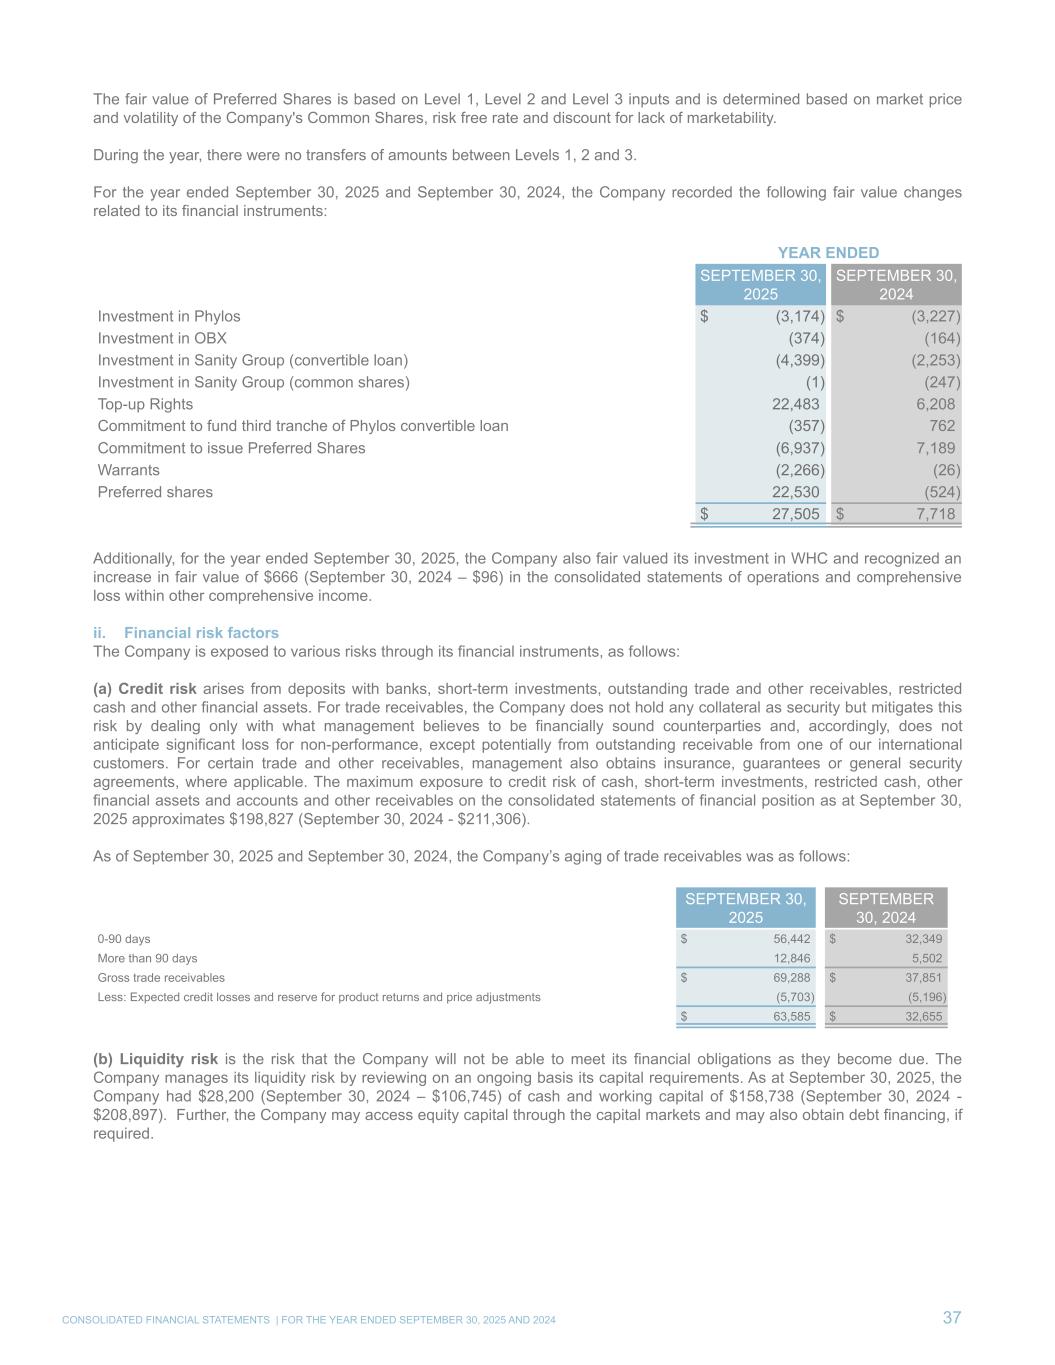
The fair value of Preferred Shares is based on Level 1, Level 2 and Level 3 inputs and is determined based on market price and volatility of the Company's Common Shares, risk free rate and discount for lack of marketability. During the year, there were no transfers of amounts between Levels 1, 2 and 3. For the year ended September 30, 2025 and September 30, 2024, the Company recorded the following fair value changes related to its financial instruments: YEAR ENDED SEPTEMBER 30, 2025 SEPTEMBER 30, 2024 Investment in Phylos $ (3,174) $ (3,227) Investment in OBX (374) (164) Investment in Sanity Group (convertible loan) (4,399) (2,253) Investment in Sanity Group (common shares) (1) (247) Top-up Rights 22,483 6,208 Commitment to fund third tranche of Phylos convertible loan (357) 762 Commitment to issue Preferred Shares (6,937) 7,189 Warrants (2,266) (26) Preferred shares 22,530 (524) $ 27,505 $ 7,718 Additionally, for the year ended September 30, 2025, the Company also fair valued its investment in WHC and recognized an increase in fair value of $666 (September 30, 2024 – $96) in the consolidated statements of operations and comprehensive loss within other comprehensive income. ii. Financial risk factors The Company is exposed to various risks through its financial instruments, as follows: (a) Credit risk arises from deposits with banks, short-term investments, outstanding trade and other receivables, restricted cash and other financial assets. For trade receivables, the Company does not hold any collateral as security but mitigates this risk by dealing only with what management believes to be financially sound counterparties and, accordingly, does not anticipate significant loss for non-performance, except potentially from outstanding receivable from one of our international customers. For certain trade and other receivables, management also obtains insurance, guarantees or general security agreements, where applicable. The maximum exposure to credit risk of cash, short-term investments, restricted cash, other financial assets and accounts and other receivables on the consolidated statements of financial position as at September 30, 2025 approximates $198,827 (September 30, 2024 - $211,306). As of September 30, 2025 and September 30, 2024, the Company’s aging of trade receivables was as follows: SEPTEMBER 30, 2025 SEPTEMBER 30, 2024 0-90 days $ 56,442 $ 32,349 More than 90 days 12,846 5,502 Gross trade receivables $ 69,288 $ 37,851 Less: Expected credit losses and reserve for product returns and price adjustments (5,703) (5,196) $ 63,585 $ 32,655 (b) Liquidity risk is the risk that the Company will not be able to meet its financial obligations as they become due. The Company manages its liquidity risk by reviewing on an ongoing basis its capital requirements. As at September 30, 2025, the Company had $28,200 (September 30, 2024 – $106,745) of cash and working capital of $158,738 (September 30, 2024 - $208,897). Further, the Company may access equity capital through the capital markets and may also obtain debt financing, if required. CONSOLIDATED FINANCIAL STATEMENTS | FOR THE YEAR ENDED SEPTEMBER 30, 2025 AND 2024 37
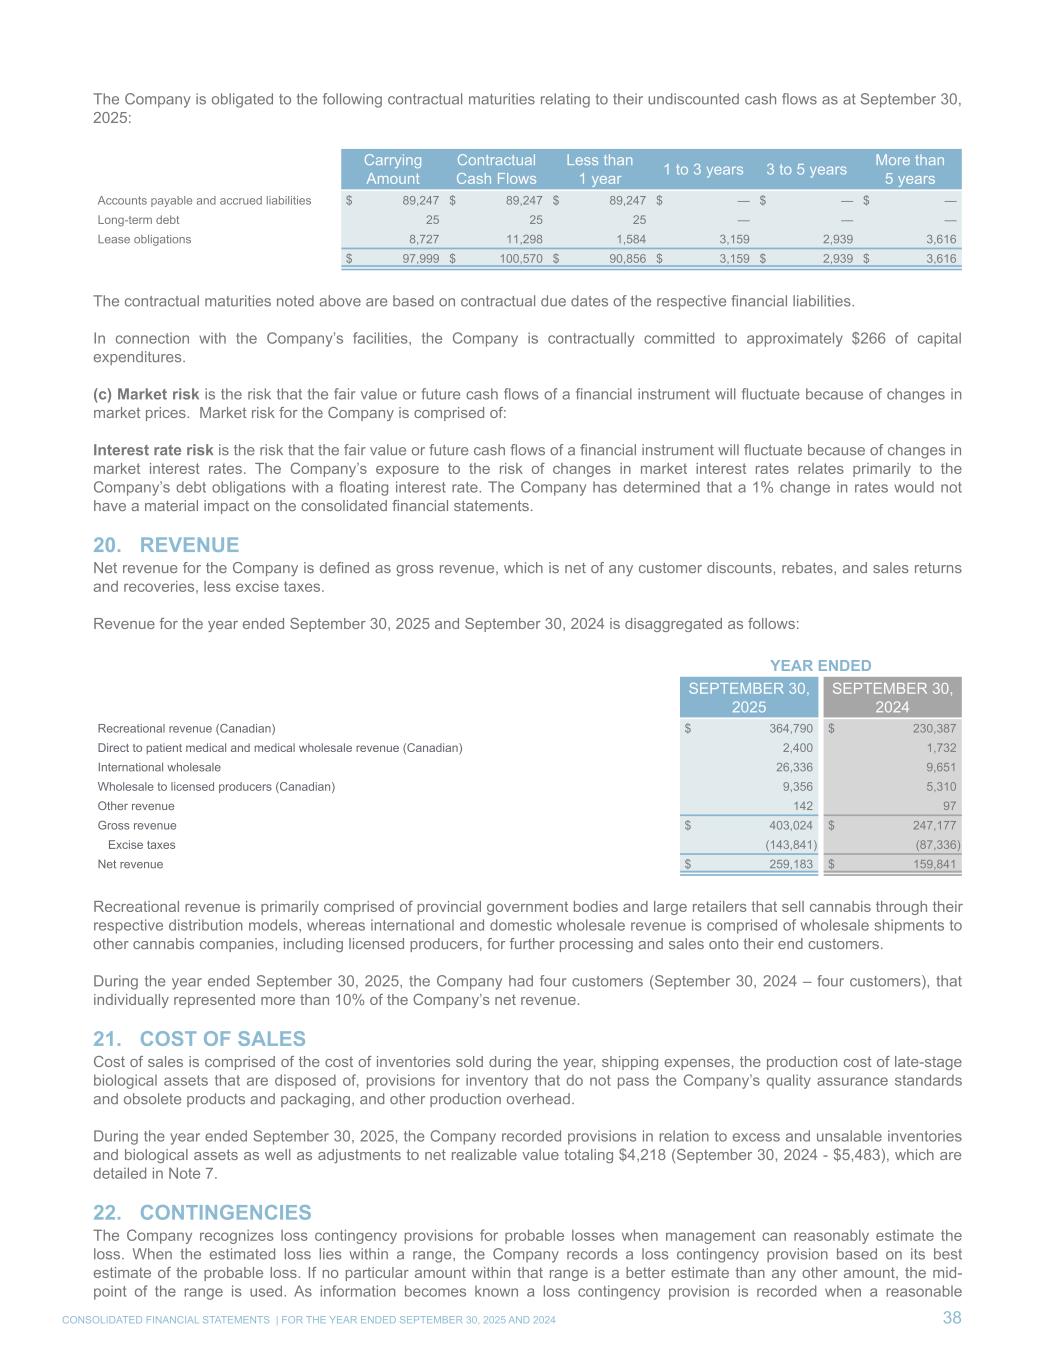
The Company is obligated to the following contractual maturities relating to their undiscounted cash flows as at September 30, 2025: Carrying Amount Contractual Cash Flows Less than 1 year 1 to 3 years 3 to 5 years More than 5 years Accounts payable and accrued liabilities $ 89,247 $ 89,247 $ 89,247 $ — $ — $ — Long-term debt 25 25 25 — — — Lease obligations 8,727 11,298 1,584 3,159 2,939 3,616 $ 97,999 $ 100,570 $ 90,856 $ 3,159 $ 2,939 $ 3,616 The contractual maturities noted above are based on contractual due dates of the respective financial liabilities. In connection with the Company’s facilities, the Company is contractually committed to approximately $266 of capital expenditures. (c) Market risk is the risk that the fair value or future cash flows of a financial instrument will fluctuate because of changes in market prices. Market risk for the Company is comprised of: Interest rate risk is the risk that the fair value or future cash flows of a financial instrument will fluctuate because of changes in market interest rates. The Company’s exposure to the risk of changes in market interest rates relates primarily to the Company’s debt obligations with a floating interest rate. The Company has determined that a 1% change in rates would not have a material impact on the consolidated financial statements. 20. REVENUE Net revenue for the Company is defined as gross revenue, which is net of any customer discounts, rebates, and sales returns and recoveries, less excise taxes. Revenue for the year ended September 30, 2025 and September 30, 2024 is disaggregated as follows: YEAR ENDED SEPTEMBER 30, 2025 SEPTEMBER 30, 2024 Recreational revenue (Canadian) $ 364,790 $ 230,387 Direct to patient medical and medical wholesale revenue (Canadian) 2,400 1,732 International wholesale 26,336 9,651 Wholesale to licensed producers (Canadian) 9,356 5,310 Other revenue 142 97 Gross revenue $ 403,024 $ 247,177 Excise taxes (143,841) (87,336) Net revenue $ 259,183 $ 159,841 Recreational revenue is primarily comprised of provincial government bodies and large retailers that sell cannabis through their respective distribution models, whereas international and domestic wholesale revenue is comprised of wholesale shipments to other cannabis companies, including licensed producers, for further processing and sales onto their end customers. During the year ended September 30, 2025, the Company had four customers (September 30, 2024 – four customers), that individually represented more than 10% of the Company’s net revenue. 21. COST OF SALES Cost of sales is comprised of the cost of inventories sold during the year, shipping expenses, the production cost of late-stage biological assets that are disposed of, provisions for inventory that do not pass the Company’s quality assurance standards and obsolete products and packaging, and other production overhead. During the year ended September 30, 2025, the Company recorded provisions in relation to excess and unsalable inventories and biological assets as well as adjustments to net realizable value totaling $4,218 (September 30, 2024 - $5,483), which are detailed in Note 7. 22. CONTINGENCIES The Company recognizes loss contingency provisions for probable losses when management can reasonably estimate the loss. When the estimated loss lies within a range, the Company records a loss contingency provision based on its best estimate of the probable loss. If no particular amount within that range is a better estimate than any other amount, the mid- point of the range is used. As information becomes known a loss contingency provision is recorded when a reasonable CONSOLIDATED FINANCIAL STATEMENTS | FOR THE YEAR ENDED SEPTEMBER 30, 2025 AND 2024 38
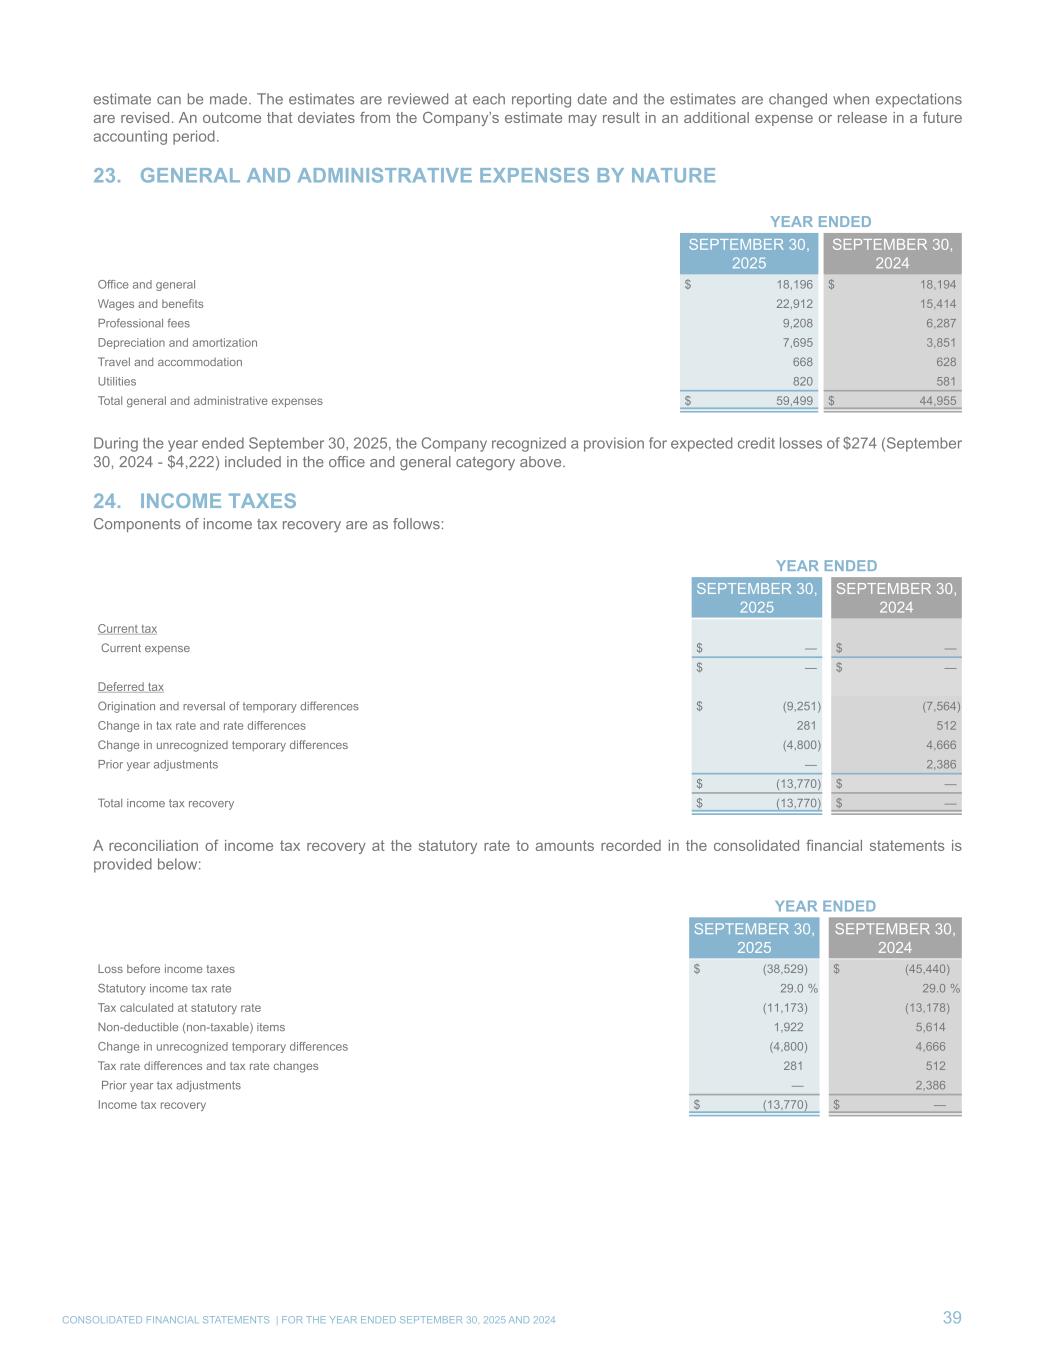
estimate can be made. The estimates are reviewed at each reporting date and the estimates are changed when expectations are revised. An outcome that deviates from the Company’s estimate may result in an additional expense or release in a future accounting period. 23. GENERAL AND ADMINISTRATIVE EXPENSES BY NATURE YEAR ENDED SEPTEMBER 30, 2025 SEPTEMBER 30, 2024 Office and general $ 18,196 $ 18,194 Wages and benefits 22,912 15,414 Professional fees 9,208 6,287 Depreciation and amortization 7,695 3,851 Travel and accommodation 668 628 Utilities 820 581 Total general and administrative expenses $ 59,499 $ 44,955 During the year ended September 30, 2025, the Company recognized a provision for expected credit losses of $274 (September 30, 2024 - $4,222) included in the office and general category above. 24. INCOME TAXES Components of income tax recovery are as follows: YEAR ENDED SEPTEMBER 30, 2025 SEPTEMBER 30, 2024 Current tax Current expense $ — $ — $ — $ — Deferred tax Origination and reversal of temporary differences $ (9,251) (7,564) Change in tax rate and rate differences 281 512 Change in unrecognized temporary differences (4,800) 4,666 Prior year adjustments — 2,386 $ (13,770) $ — Total income tax recovery $ (13,770) $ — A reconciliation of income tax recovery at the statutory rate to amounts recorded in the consolidated financial statements is provided below: YEAR ENDED SEPTEMBER 30, 2025 SEPTEMBER 30, 2024 Loss before income taxes $ (38,529) $ (45,440) Statutory income tax rate 29.0 % 29.0 % Tax calculated at statutory rate (11,173) (13,178) Non-deductible (non-taxable) items 1,922 5,614 Change in unrecognized temporary differences (4,800) 4,666 Tax rate differences and tax rate changes 281 512 Prior year tax adjustments — 2,386 Income tax recovery $ (13,770) $ — CONSOLIDATED FINANCIAL STATEMENTS | FOR THE YEAR ENDED SEPTEMBER 30, 2025 AND 2024 39
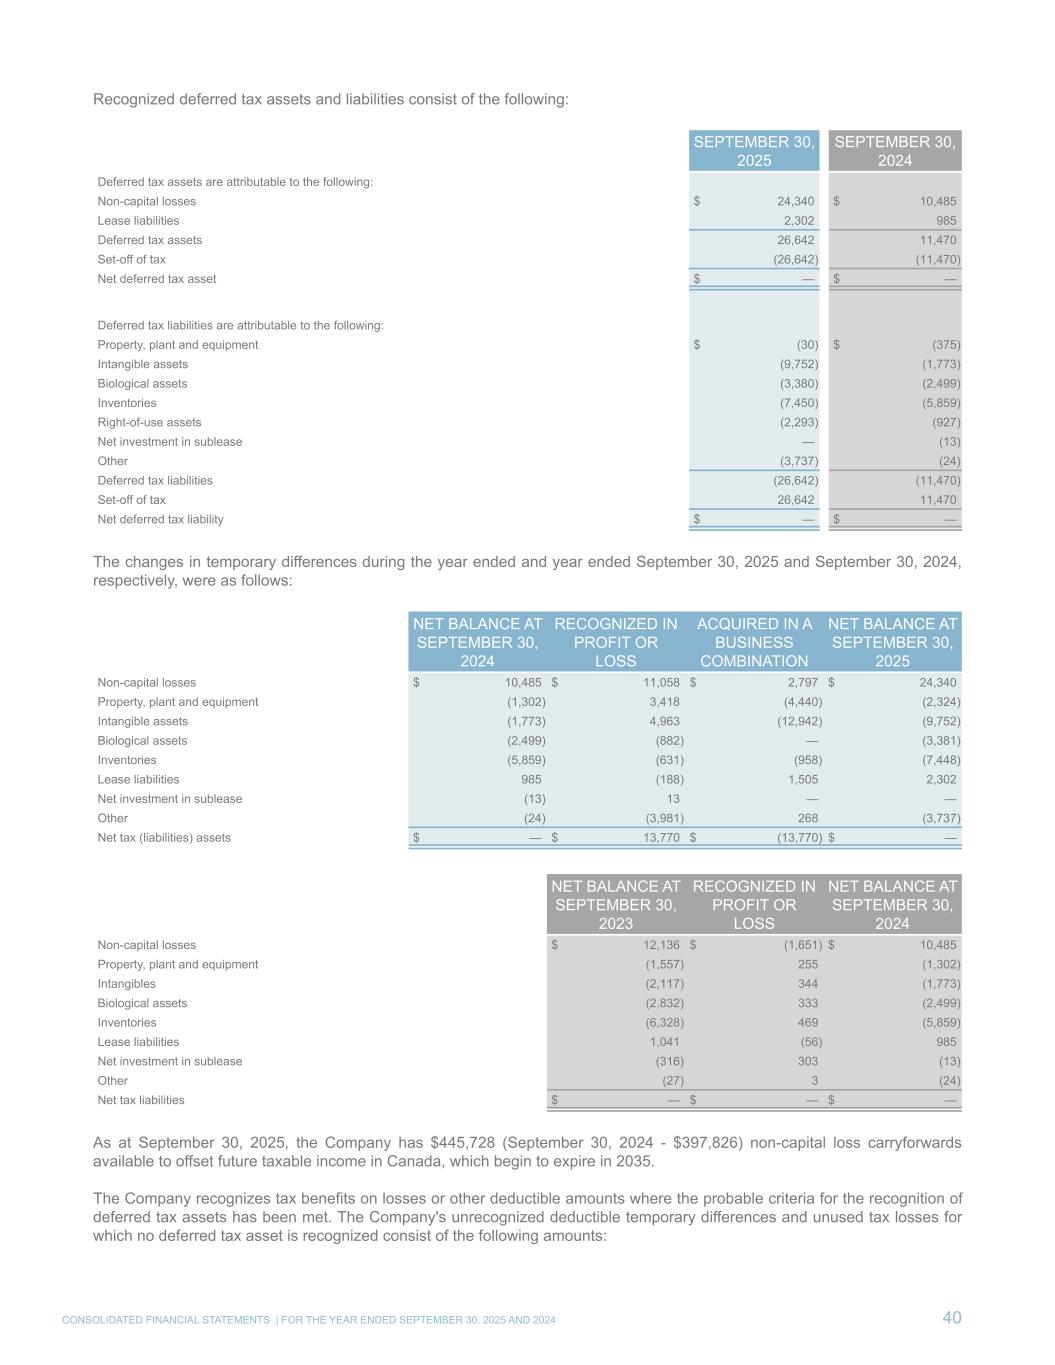
Recognized deferred tax assets and liabilities consist of the following: SEPTEMBER 30, 2025 SEPTEMBER 30, 2024 Deferred tax assets are attributable to the following: Non-capital losses $ 24,340 $ 10,485 Lease liabilities 2,302 985 Deferred tax assets 26,642 11,470 Set-off of tax (26,642) (11,470) Net deferred tax asset $ — $ — Deferred tax liabilities are attributable to the following: Property, plant and equipment $ (30) $ (375) Intangible assets (9,752) (1,773) Biological assets (3,380) (2,499) Inventories (7,450) (5,859) Right-of-use assets (2,293) (927) Net investment in sublease — (13) Other (3,737) (24) Deferred tax liabilities (26,642) (11,470) Set-off of tax 26,642 11,470 Net deferred tax liability $ — $ — The changes in temporary differences during the year ended and year ended September 30, 2025 and September 30, 2024, respectively, were as follows: NET BALANCE AT SEPTEMBER 30, 2024 RECOGNIZED IN PROFIT OR LOSS ACQUIRED IN A BUSINESS COMBINATION NET BALANCE AT SEPTEMBER 30, 2025 Non-capital losses $ 10,485 $ 11,058 $ 2,797 $ 24,340 Property, plant and equipment (1,302) 3,418 (4,440) (2,324) Intangible assets (1,773) 4,963 (12,942) (9,752) Biological assets (2,499) (882) — (3,381) Inventories (5,859) (631) (958) (7,448) Lease liabilities 985 (188) 1,505 2,302 Net investment in sublease (13) 13 — — Other (24) (3,981) 268 (3,737) Net tax (liabilities) assets $ — $ 13,770 $ (13,770) $ — NET BALANCE AT SEPTEMBER 30, 2023 RECOGNIZED IN PROFIT OR LOSS NET BALANCE AT SEPTEMBER 30, 2024 Non-capital losses $ 12,136 $ (1,651) $ 10,485 Property, plant and equipment (1,557) 255 (1,302) Intangibles (2,117) 344 (1,773) Biological assets (2,832) 333 (2,499) Inventories (6,328) 469 (5,859) Lease liabilities 1,041 (56) 985 Net investment in sublease (316) 303 (13) Other (27) 3 (24) Net tax liabilities $ — $ — $ — As at September 30, 2025, the Company has $445,728 (September 30, 2024 - $397,826) non-capital loss carryforwards available to offset future taxable income in Canada, which begin to expire in 2035. The Company recognizes tax benefits on losses or other deductible amounts where the probable criteria for the recognition of deferred tax assets has been met. The Company's unrecognized deductible temporary differences and unused tax losses for which no deferred tax asset is recognized consist of the following amounts: CONSOLIDATED FINANCIAL STATEMENTS | FOR THE YEAR ENDED SEPTEMBER 30, 2025 AND 2024 40
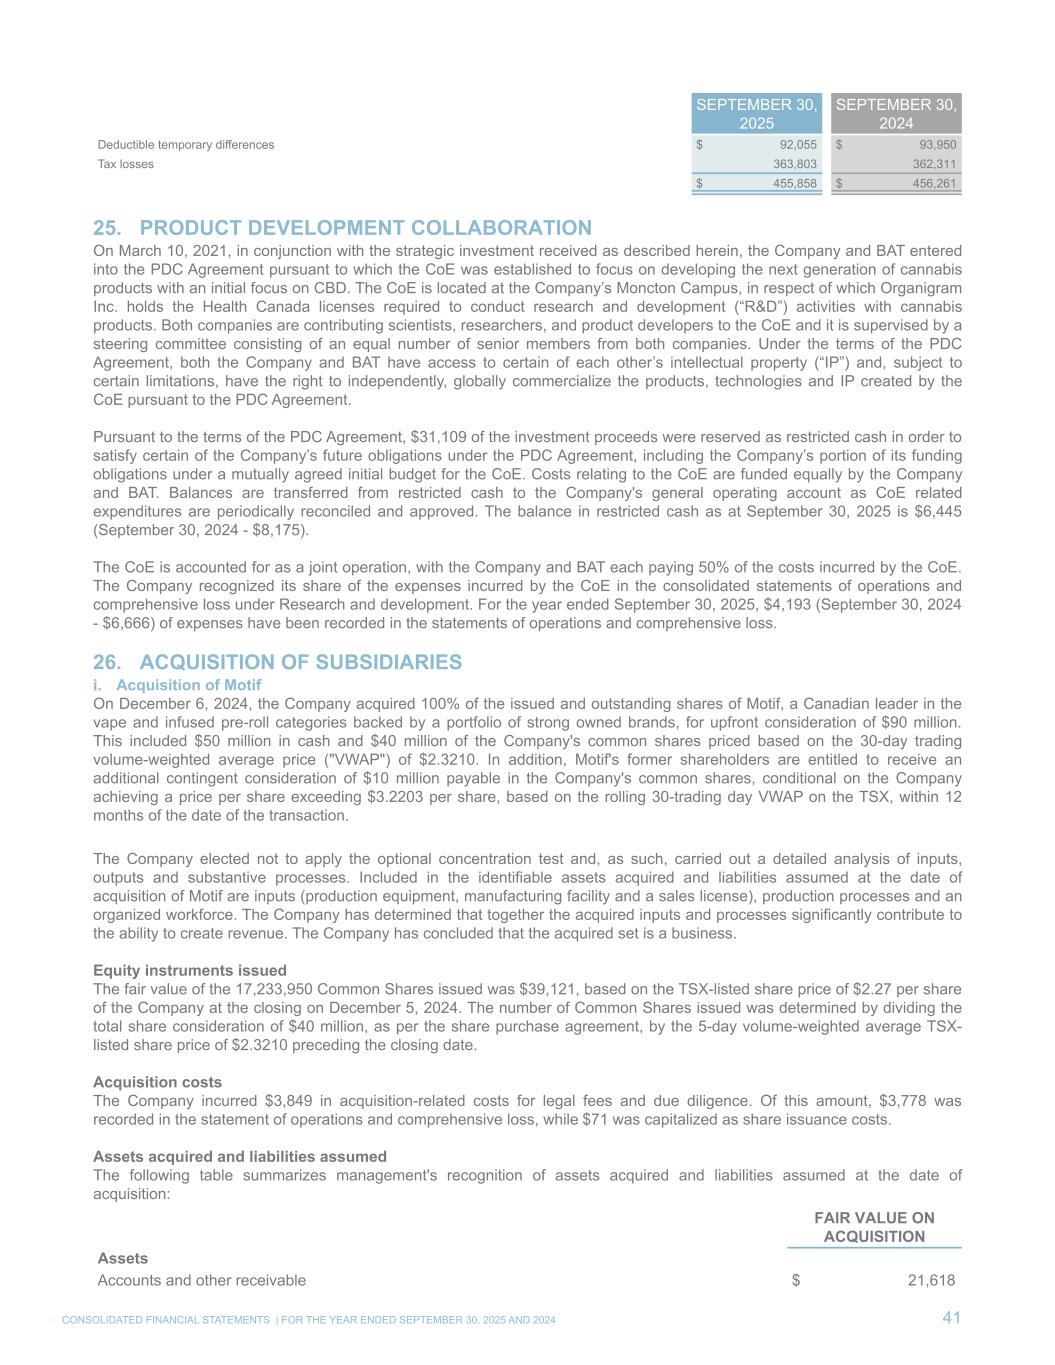
SEPTEMBER 30, 2025 SEPTEMBER 30, 2024 Deductible temporary differences $ 92,055 $ 93,950 Tax losses 363,803 362,311 $ 455,858 $ 456,261 25. PRODUCT DEVELOPMENT COLLABORATION On March 10, 2021, in conjunction with the strategic investment received as described herein, the Company and BAT entered into the PDC Agreement pursuant to which the CoE was established to focus on developing the next generation of cannabis products with an initial focus on CBD. The CoE is located at the Company’s Moncton Campus, in respect of which Organigram Inc. holds the Health Canada licenses required to conduct research and development (“R&D”) activities with cannabis products. Both companies are contributing scientists, researchers, and product developers to the CoE and it is supervised by a steering committee consisting of an equal number of senior members from both companies. Under the terms of the PDC Agreement, both the Company and BAT have access to certain of each other’s intellectual property (“IP”) and, subject to certain limitations, have the right to independently, globally commercialize the products, technologies and IP created by the CoE pursuant to the PDC Agreement. Pursuant to the terms of the PDC Agreement, $31,109 of the investment proceeds were reserved as restricted cash in order to satisfy certain of the Company’s future obligations under the PDC Agreement, including the Company’s portion of its funding obligations under a mutually agreed initial budget for the CoE. Costs relating to the CoE are funded equally by the Company and BAT. Balances are transferred from restricted cash to the Company's general operating account as CoE related expenditures are periodically reconciled and approved. The balance in restricted cash as at September 30, 2025 is $6,445 (September 30, 2024 - $8,175). The CoE is accounted for as a joint operation, with the Company and BAT each paying 50% of the costs incurred by the CoE. The Company recognized its share of the expenses incurred by the CoE in the consolidated statements of operations and comprehensive loss under Research and development. For the year ended September 30, 2025, $4,193 (September 30, 2024 - $6,666) of expenses have been recorded in the statements of operations and comprehensive loss. 26. ACQUISITION OF SUBSIDIARIES i. Acquisition of Motif On December 6, 2024, the Company acquired 100% of the issued and outstanding shares of Motif, a Canadian leader in the vape and infused pre-roll categories backed by a portfolio of strong owned brands, for upfront consideration of $90 million. This included $50 million in cash and $40 million of the Company's common shares priced based on the 30-day trading volume-weighted average price ("VWAP") of $2.3210. In addition, Motif's former shareholders are entitled to receive an additional contingent consideration of $10 million payable in the Company's common shares, conditional on the Company achieving a price per share exceeding $3.2203 per share, based on the rolling 30-trading day VWAP on the TSX, within 12 months of the date of the transaction. The Company elected not to apply the optional concentration test and, as such, carried out a detailed analysis of inputs, outputs and substantive processes. Included in the identifiable assets acquired and liabilities assumed at the date of acquisition of Motif are inputs (production equipment, manufacturing facility and a sales license), production processes and an organized workforce. The Company has determined that together the acquired inputs and processes significantly contribute to the ability to create revenue. The Company has concluded that the acquired set is a business. Equity instruments issued The fair value of the 17,233,950 Common Shares issued was $39,121, based on the TSX-listed share price of $2.27 per share of the Company at the closing on December 5, 2024. The number of Common Shares issued was determined by dividing the total share consideration of $40 million, as per the share purchase agreement, by the 5-day volume-weighted average TSX- listed share price of $2.3210 preceding the closing date. Acquisition costs The Company incurred $3,849 in acquisition-related costs for legal fees and due diligence. Of this amount, $3,778 was recorded in the statement of operations and comprehensive loss, while $71 was capitalized as share issuance costs. Assets acquired and liabilities assumed The following table summarizes management's recognition of assets acquired and liabilities assumed at the date of acquisition: FAIR VALUE ON ACQUISITION Assets Accounts and other receivable $ 21,618 CONSOLIDATED FINANCIAL STATEMENTS | FOR THE YEAR ENDED SEPTEMBER 30, 2025 AND 2024 41
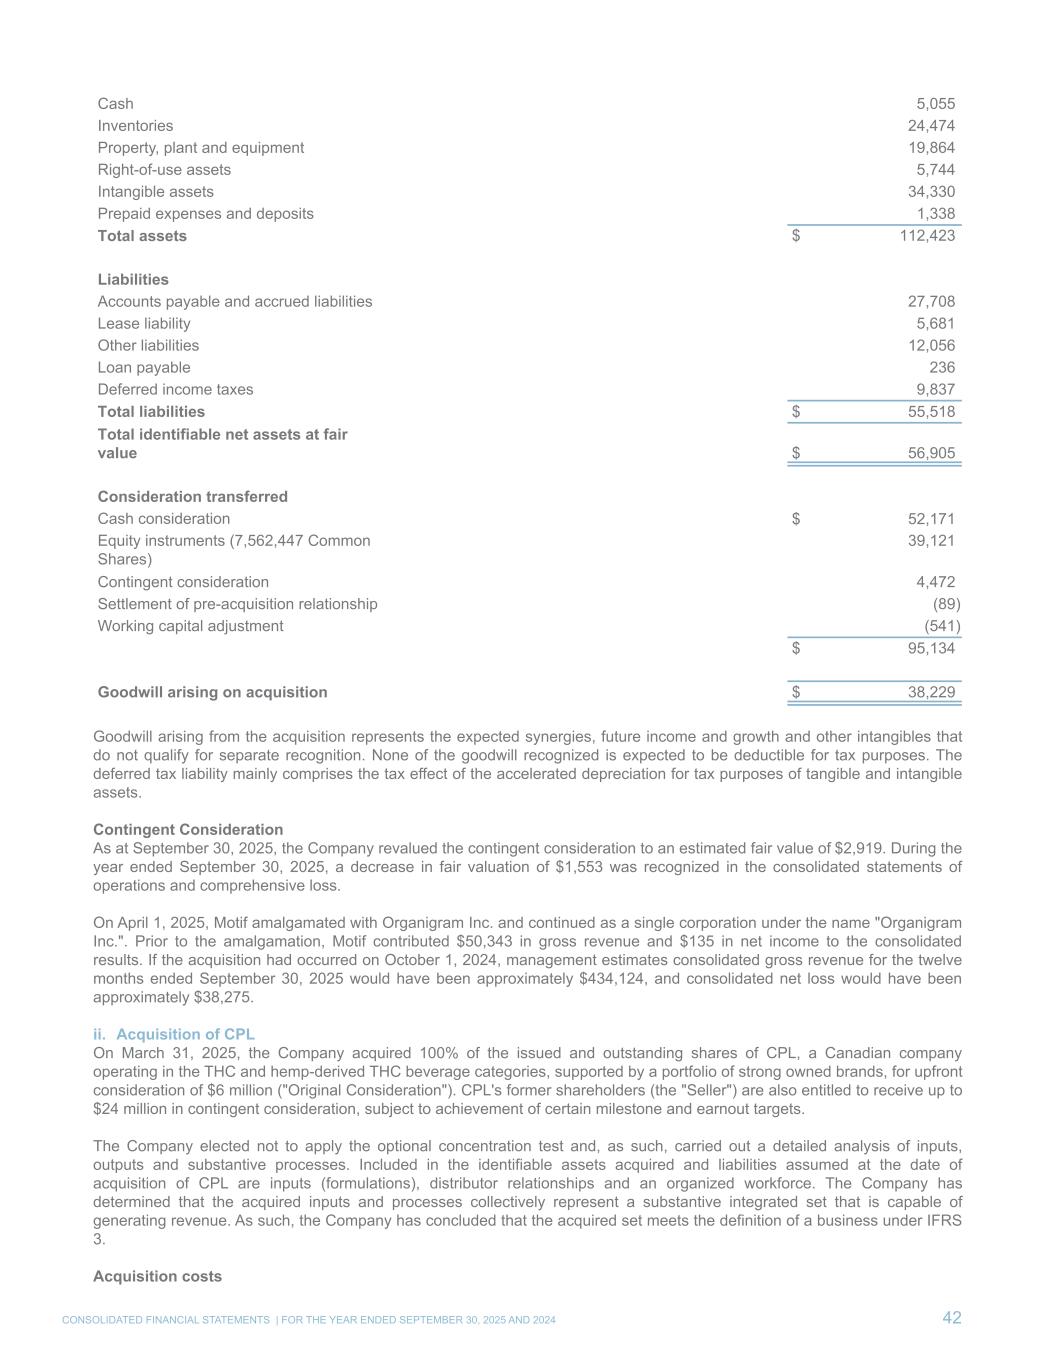
Cash 5,055 Inventories 24,474 Property, plant and equipment 19,864 Right-of-use assets 5,744 Intangible assets 34,330 Prepaid expenses and deposits 1,338 Total assets $ 112,423 Liabilities Accounts payable and accrued liabilities 27,708 Lease liability 5,681 Other liabilities 12,056 Loan payable 236 Deferred income taxes 9,837 Total liabilities $ 55,518 Total identifiable net assets at fair value $ 56,905 Consideration transferred Cash consideration $ 52,171 Equity instruments (7,562,447 Common Shares) 39,121 Contingent consideration 4,472 Settlement of pre-acquisition relationship (89) Working capital adjustment (541) $ 95,134 Goodwill arising on acquisition $ 38,229 Goodwill arising from the acquisition represents the expected synergies, future income and growth and other intangibles that do not qualify for separate recognition. None of the goodwill recognized is expected to be deductible for tax purposes. The deferred tax liability mainly comprises the tax effect of the accelerated depreciation for tax purposes of tangible and intangible assets. Contingent Consideration As at September 30, 2025, the Company revalued the contingent consideration to an estimated fair value of $2,919. During the year ended September 30, 2025, a decrease in fair valuation of $1,553 was recognized in the consolidated statements of operations and comprehensive loss. On April 1, 2025, Motif amalgamated with Organigram Inc. and continued as a single corporation under the name "Organigram Inc.". Prior to the amalgamation, Motif contributed $50,343 in gross revenue and $135 in net income to the consolidated results. If the acquisition had occurred on October 1, 2024, management estimates consolidated gross revenue for the twelve months ended September 30, 2025 would have been approximately $434,124, and consolidated net loss would have been approximately $38,275. ii. Acquisition of CPL On March 31, 2025, the Company acquired 100% of the issued and outstanding shares of CPL, a Canadian company operating in the THC and hemp-derived THC beverage categories, supported by a portfolio of strong owned brands, for upfront consideration of $6 million ("Original Consideration"). CPL's former shareholders (the "Seller") are also entitled to receive up to $24 million in contingent consideration, subject to achievement of certain milestone and earnout targets. The Company elected not to apply the optional concentration test and, as such, carried out a detailed analysis of inputs, outputs and substantive processes. Included in the identifiable assets acquired and liabilities assumed at the date of acquisition of CPL are inputs (formulations), distributor relationships and an organized workforce. The Company has determined that the acquired inputs and processes collectively represent a substantive integrated set that is capable of generating revenue. As such, the Company has concluded that the acquired set meets the definition of a business under IFRS 3. Acquisition costs CONSOLIDATED FINANCIAL STATEMENTS | FOR THE YEAR ENDED SEPTEMBER 30, 2025 AND 2024 42
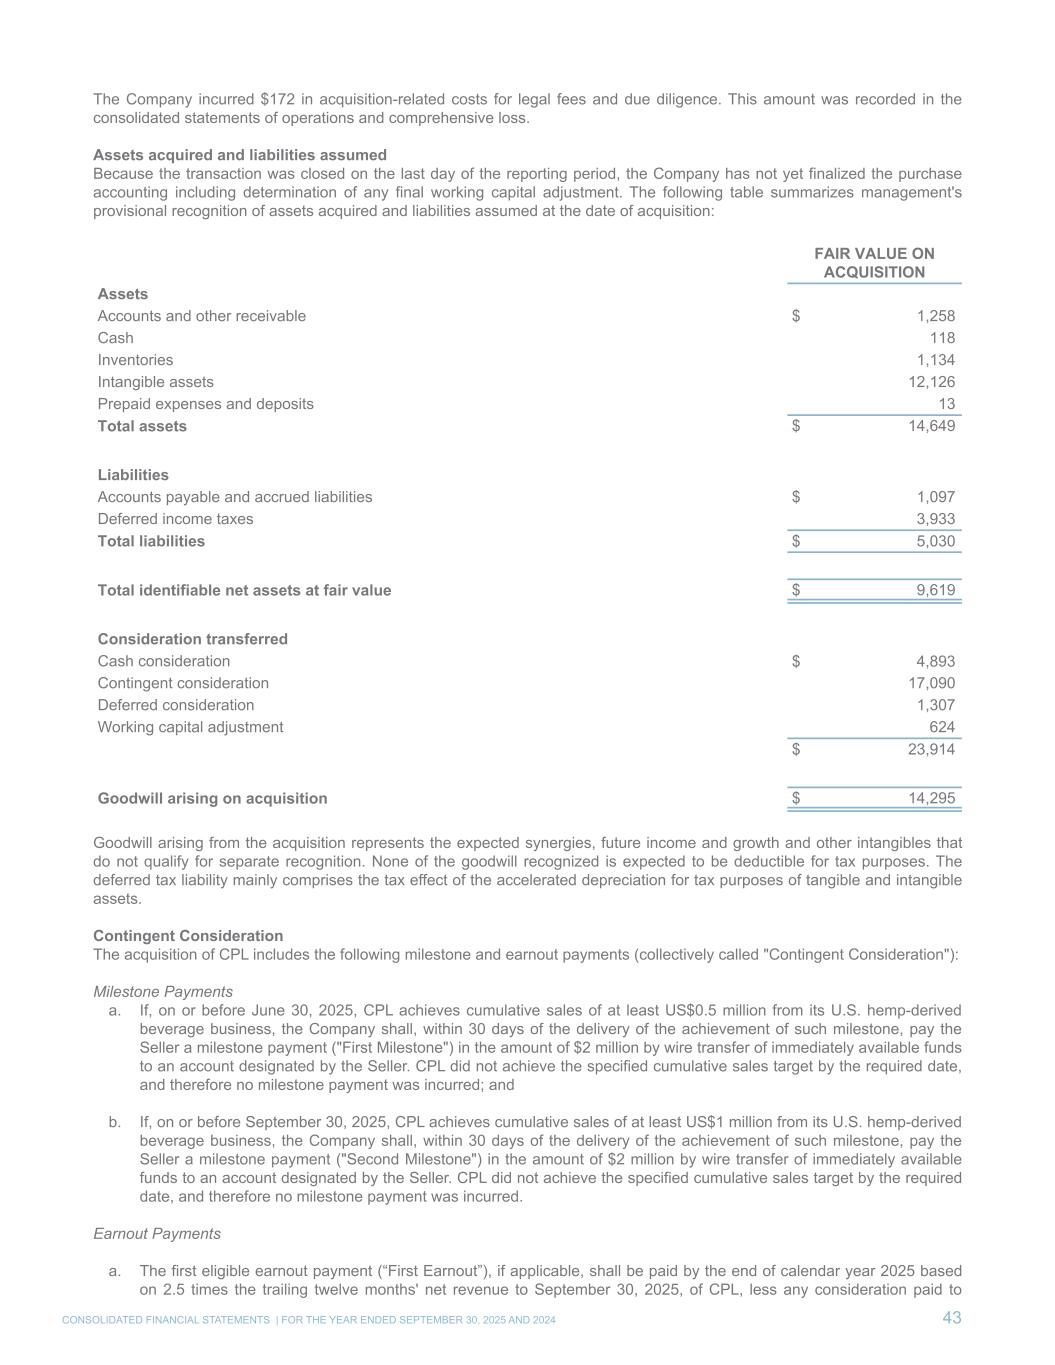
The Company incurred $172 in acquisition-related costs for legal fees and due diligence. This amount was recorded in the consolidated statements of operations and comprehensive loss. Assets acquired and liabilities assumed Because the transaction was closed on the last day of the reporting period, the Company has not yet finalized the purchase accounting including determination of any final working capital adjustment. The following table summarizes management's provisional recognition of assets acquired and liabilities assumed at the date of acquisition: FAIR VALUE ON ACQUISITION Assets Accounts and other receivable $ 1,258 Cash 118 Inventories 1,134 Intangible assets 12,126 Prepaid expenses and deposits 13 Total assets $ 14,649 Liabilities Accounts payable and accrued liabilities $ 1,097 Deferred income taxes 3,933 Total liabilities $ 5,030 Total identifiable net assets at fair value $ 9,619 Consideration transferred Cash consideration $ 4,893 Contingent consideration 17,090 Deferred consideration 1,307 Working capital adjustment 624 $ 23,914 Goodwill arising on acquisition $ 14,295 Goodwill arising from the acquisition represents the expected synergies, future income and growth and other intangibles that do not qualify for separate recognition. None of the goodwill recognized is expected to be deductible for tax purposes. The deferred tax liability mainly comprises the tax effect of the accelerated depreciation for tax purposes of tangible and intangible assets. Contingent Consideration The acquisition of CPL includes the following milestone and earnout payments (collectively called "Contingent Consideration"): Milestone Payments a. If, on or before June 30, 2025, CPL achieves cumulative sales of at least US$0.5 million from its U.S. hemp-derived beverage business, the Company shall, within 30 days of the delivery of the achievement of such milestone, pay the Seller a milestone payment ("First Milestone") in the amount of $2 million by wire transfer of immediately available funds to an account designated by the Seller. CPL did not achieve the specified cumulative sales target by the required date, and therefore no milestone payment was incurred; and b. If, on or before September 30, 2025, CPL achieves cumulative sales of at least US$1 million from its U.S. hemp-derived beverage business, the Company shall, within 30 days of the delivery of the achievement of such milestone, pay the Seller a milestone payment ("Second Milestone") in the amount of $2 million by wire transfer of immediately available funds to an account designated by the Seller. CPL did not achieve the specified cumulative sales target by the required date, and therefore no milestone payment was incurred. Earnout Payments a. The first eligible earnout payment (“First Earnout”), if applicable, shall be paid by the end of calendar year 2025 based on 2.5 times the trailing twelve months' net revenue to September 30, 2025, of CPL, less any consideration paid to CONSOLIDATED FINANCIAL STATEMENTS | FOR THE YEAR ENDED SEPTEMBER 30, 2025 AND 2024 43
date, including the Original Consideration, First Milestone and Second Milestone. The First Earnout, if applicable, is to be paid 50% in cash and 50% in the Company's Common Shares priced at the five-day TSX VWAP the day prior to settlement. As at September 30, 2025, the Company expects to pay approximately $3.8 million for the First Earnout and this amount is included in the other current liabilities; and b. The second eligible earnout payment (“Second Earnout”), if applicable, shall be paid by the end of calendar 2026 based on 2.5 times the trailing twelve months' net revenue to September 30, 2026, of CPL, less any consideration paid to date, including the Original Consideration, First Milestone, Second Milestone and the First Earnout. The Second Earnout, if applicable, is to be paid 50% in cash and 50% in the Company's Common Shares priced at the five-day TSX VWAP the day prior to settlement. As at the acquisition date, the fair value of the Contingent Consideration was estimated to be $17,090. As at September 30, 2025, the Contingent Consideration was adjusted to $8,815. During the year ended September 30, 2025, the Company recognized a decrease in fair valuation of $8,190 in the consolidated statements of operations and comprehensive loss. Of the total contingent consideration, $6,925 is included in the other current liabilities and the remaining amount is included in other long term liabilities. 27. OPERATING SEGMENTS An operating segment is a component of the Company for which discrete financial information is available and whose operating results are regularly reviewed by the Company's chief operating decision maker, to make decisions about resources to be allocated to the segment and assess its performance, and that engages in business activities from which it may earn revenue and incur expenses. The Company only has one operating segment. 28. COMPARATIVE FIGURES Certain reclassifications have been made to the prior periods comparative figures to enhance comparability with the current period financial statements, none of the reclassifications result in a change to net loss or shareholders' equity. CONSOLIDATED FINANCIAL STATEMENTS | FOR THE YEAR ENDED SEPTEMBER 30, 2025 AND 2024 44