
Investor Presentation September 2025
Forward-Looking Statements This presentation contains “forward-looking statements” within the meaning of the securities laws. All statements, other than statements of historical fact, included in this presentation that address activities, events, or developments that Black Stone Minerals, L.P. (“Black Stone Minerals,” “Black Stone,” “the Partnership,” or “BSM”) expects, believes, or anticipates will or may occur in the future are forward-looking statements. The words “believe,” “expect,” “may,” “estimates,” “will,” “anticipate,” “plan,” “intend,” “foresee,” “should,” “would,” “could,” or other similar expressions are intended to identify forward-looking statements, which are generally not historical in nature. However, the absence of these words does not mean that the statements are not forward-looking. These statements are based on certain assumptions made by Black Stone Minerals based on management’s expectations and perception of historical trends, current conditions, anticipated future developments, and other factors believed to be appropriate. Although Black Stone Minerals believes that these assumptions were reasonable when made, because assumptions are inherently subject to significant uncertainties and contingencies, which are difficult or impossible to predict and are beyond its control, Black Stone Minerals cannot give assurance that it will achieve or accomplish these expectations, beliefs, or intentions. Such statements are subject to a number of assumptions, risks, and uncertainties, many of which are beyond the control of Black Stone Minerals, which may cause actual results to differ materially from those implied or expressed by the forward-looking statements. These include the factors discussed or referenced in the “Risk Factors” and “Forward- Looking Statements” sections of the filings Black Stone Minerals has made with the Securities and Exchange Commission, including its annual report on Form 10-K and quarterly reports on Form 10-Q, as well as risks relating to the Partnership’s ability to execute its business strategies; the volatility of realized oil and natural gas prices; the level of production on the Partnership’s properties; overall supply and demand for oil and natural gas, as well as regional supply and demand factors, delays, or interruptions of production; domestic and foreign trade policies, including tariffs and other controls on imports or exports of goods, including energy products; conservation measures and general concern about the environmental impact of the production and use of fossil fuels; the Partnership’s ability to replace its oil and natural gas reserves; general economic, business, or industry conditions including slowdowns, domestically and internationally, and volatility in the securities, capital or credit markets; cybersecurity incidents, including data security breaches or computer viruses; competition in the oil and natural gas industry; the availability or cost of rigs, equipment, raw materials, supplies, oilfield services or personnel; the level of drilling activity by the Partnership's operators, particularly in areas such as the Haynesville where the Partnership has concentrated acreage positions; and other important factors that could cause actual results to differ materially from those projected. When considering the forward-looking statements, you should keep in mind the risk factors and other cautionary statements in filings Black Stone Minerals has made with the SEC. You are cautioned not to place undue reliance on forward-looking statements, which speak only as of the date on which such statement is made, and Black Stone Minerals undertakes no obligation to correct or update any forward-looking statement, whether as a result of new information, future events or otherwise, except as required by applicable law. All forward-looking statements attributable to Black Stone Minerals are qualified in their entirety by this cautionary statement.
Non-GAAP Financial Measures In addition to GAAP financial measures, this presentation includes non-GAAP measures, such as Adjusted EBITDA and Distributable Cash Flow. These measures are used by Black Stone’s management, investors, research analysts, and other external users of the Partnership’s financial statements to assess the financial performance of its assets and its ability to sustain distributions over the long term, independent of financing methods, capital structure, or historical cost basis. The Partnership defines Adjusted EBITDA as net income (loss) before interest expense, income taxes, and depreciation, depletion, and amortization adjusted for impairment of oil and natural gas properties, if any, accretion of asset retirement obligations, unrealized gains and losses on commodity derivative instruments, non-cash equity-based compensation, and gains and losses on sales of assets, if any. Black Stone defines Distributable Cash Flow as Adjusted EBITDA plus or minus amounts for certain non-cash operating activities, cash interest expense, distributions to preferred unitholders, and restructuring charges, if any. Adjusted EBITDA and Distributable Cash Flow should not be considered an alternative to, or more meaningful than, net income (loss), income (loss) from operations, cash flows from operating activities, or any other measure of financial performance presented in accordance with U.S. GAAP as measures of the Partnership's financial performance. Adjusted EBITDA and Distributable Cash Flow have important limitations as analytical tools because they exclude some but not all items that affect net income (loss), the most directly comparable U.S. GAAP financial measure. The Partnership's computation of Adjusted EBITDA and Distributable Cash Flow may differ from computations of similarly titled measures of other companies. Reconciliations to the most comparable GAAP measures are included in the Appendix to this presentation. The Partnership is not providing a quantitative reconciliation of its forward-looking estimate of Adjusted EBITDA to its most directly comparable GAAP financial measure because such GAAP measure, which is not included in the Partnership’s outlook, is difficult to reliably predict or estimate without unreasonable effort due to its dependence on future uncertainties such as the items noted under the heading “Forward-Looking Statements.” In addition, we believe such a reconciliation could imply a degree of precision that might be confusing or misleading to investors.
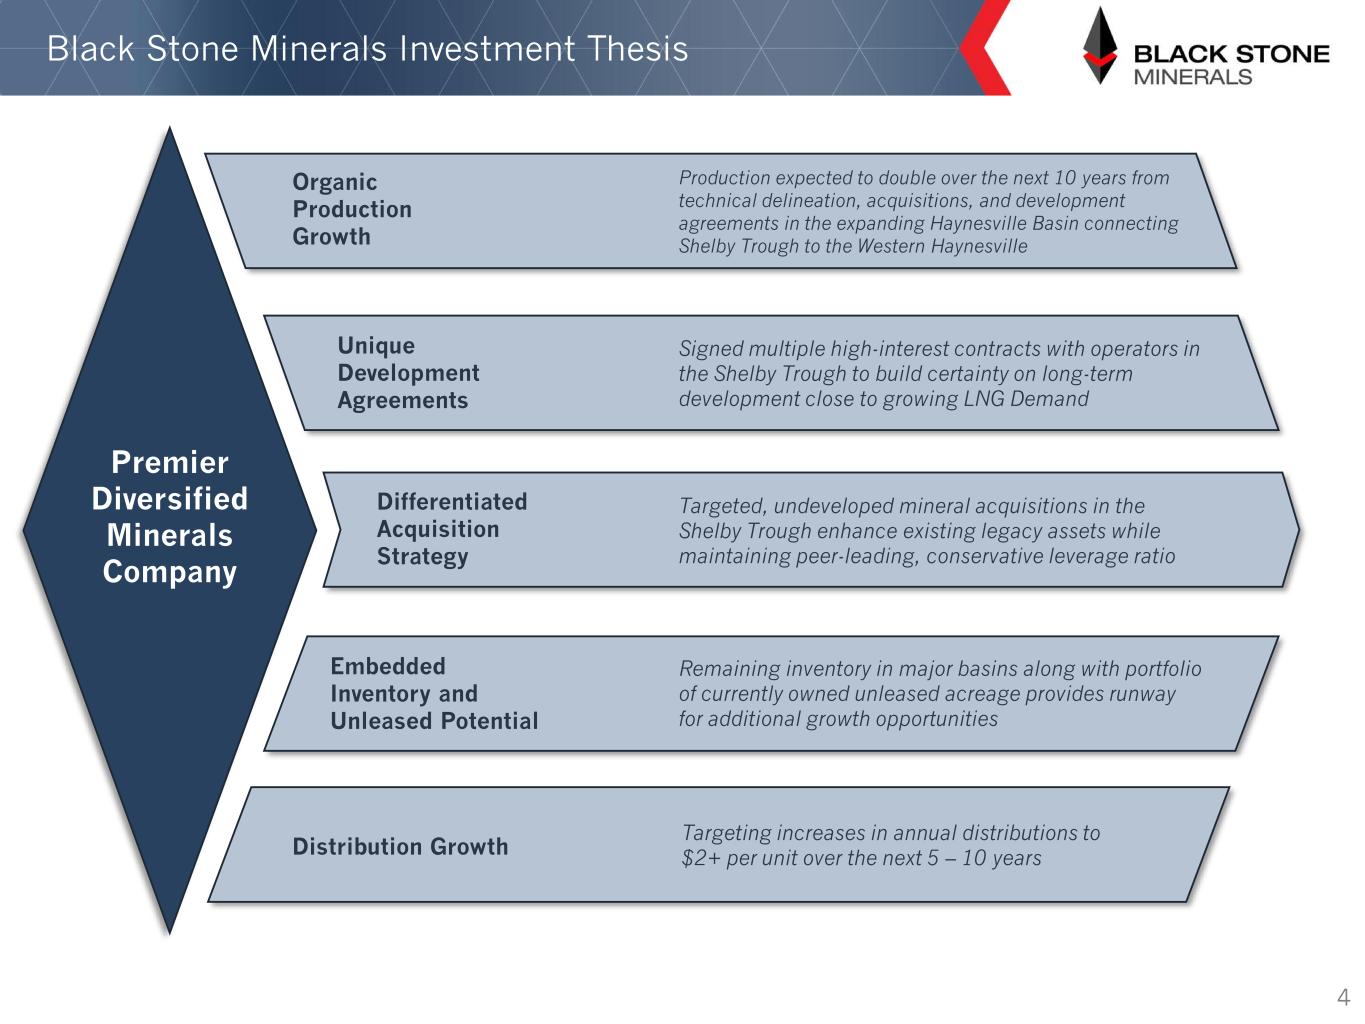
Black Stone Minerals Investment Thesis 4 Organic Production Growth Production expected to double over the next 10 years from technical delineation, acquisitions, and development agreements in the expanding Haynesville Basin connecting Shelby Trough to the Western Haynesville Unique Development Agreements Differentiated Acquisition Strategy Distribution Growth Signed multiple high-interest contracts with operators in the Shelby Trough to build certainty on long-term development close to growing LNG Demand Targeted, undeveloped mineral acquisitions in the Shelby Trough enhance existing legacy assets while maintaining peer-leading, conservative leverage ratio Remaining inventory in major basins along with portfolio of currently owned unleased acreage provides runway for additional growth opportunities Targeting increases in annual distributions to $2+ per unit over the next 5 – 10 years Premier Diversified Minerals Company Embedded Inventory and Unleased Potential

~$2.7 B Equity Value ~$3.1 B Enterprise Value(1) ~10% Distribution Yield(2) Black Stone Minerals is the Premier U.S. Diversified Upstream Minerals Company 1) Based on unit price of $12.59 on September 15, 2025; Enterprise value includes preferred equity. 2) Distribution yield calculated by annualizing the common distribution for 2Q’25 of $0.30 per unit and DCF yield calculated by annualizing DCF per unit for 2Q’25 of $0.353; respective yields calculated using the unit price of $12.59 per unit on September 15, 2025 3) Gross Mineral and Royalty Acres as of 06/30/2025, inclusive of mineral interests, NPRIs, and ORRIs. BSM AT A GLANCE Ownership2Q’25 Production 34.6 MBoe/d BSM Acreage BSM Ownership Counties Permian (3) ~632,000 Gross Acres Haynesville (3) ~662,000 Gross Acres Williston(3) ~500,000 Gross Acres 96% Royalty ~25% Haynesville/Bossier 73% Gas >25% Insiders >89% Legacy Owners ~11% DCF Yield(2) ~20+ Inventory Life (years) 5
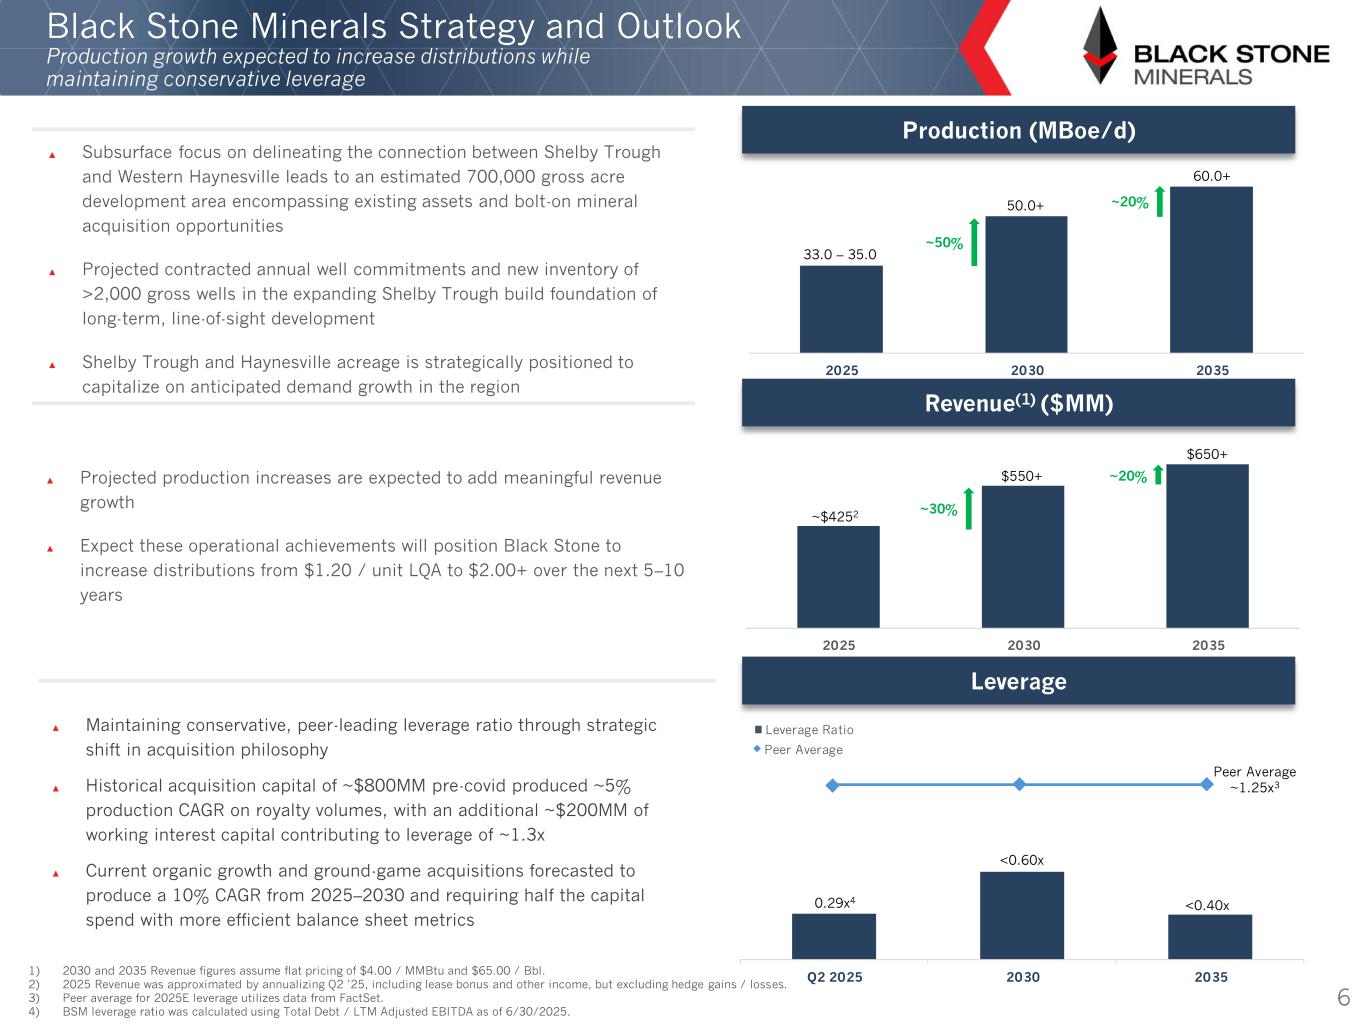
2 25 2 2 5 Black Stone Minerals Strategy and Outlook Production growth expected to increase distributions while maintaining conservative leverage ▲ Maintaining conservative, peer-leading leverage ratio through strategic shift in acquisition philosophy ▲ Historical acquisition capital of ~$800MM pre-covid produced ~5% production CAGR on royalty volumes, with an additional ~$200MM of working interest capital contributing to leverage of ~1.3x ▲ Current organic growth and ground-game acquisitions forecasted to produce a 10% CAGR from 2025–2030 and requiring half the capital spend with more efficient balance sheet metrics 6 Production (MBoe/d) Revenue(1) ($MM) Leverage 2 25 2 2 5 ~50% ~20% ~30% ~20% Q2 2 25 2 2 5 ▲ Subsurface focus on delineating the connection between Shelby Trough and Western Haynesville leads to an estimated 700,000 gross acre development area encompassing existing assets and bolt-on mineral acquisition opportunities ▲ Projected contracted annual well commitments and new inventory of >2,000 gross wells in the expanding Shelby Trough build foundation of long-term, line-of-sight development ▲ Shelby Trough and Haynesville acreage is strategically positioned to capitalize on anticipated demand growth in the region ▲ Projected production increases are expected to add meaningful revenue growth ▲ Expect these operational achievements will position Black Stone to increase distributions from $1.20 / unit LQA to $2.00+ over the next 5–10 years 1) 2030 and 2035 Revenue figures assume flat pricing of $4.00 / MMBtu and $65.00 / Bbl. 2) 2025 Revenue was approximated by annualizing Q2 ’25, including lease bonus and other income, but excluding hedge gains / losses. 3) Peer average for 2025E leverage utilizes data from FactSet. 4) BSM leverage ratio was calculated using Total Debt / LTM Adjusted EBITDA as of 6/30/2025. 33.0 – 35.0 50.0+ 60.0+ ~$4252 $550+ $650+ 0.29x4 <0.60x <0.40x Peer Average ~1.25x3 Peer Average Leverage Ratio

Robust return of capital driven by limited capital needs and prudent capital structure TX OK AL MS AR LA Uniquely positioned to benefit from growing natural gas demand Differentiated organic growth strategy points to 20+ years of inventory Development agreements in the Shelby Trough limit uncertainty of long-term activity levels on high-interest acreage 1) Distribution yield calculated by annualizing the common distribution for 2Q’25 of $0.30 per unit using the unit price of $12.59 per unit on September 15, 2025 2) Leverage ratio was calculated using Total Debt / LTM Adjusted EBITDA as of 6/30/2025. L N G L N G Acreage is close to drivers of gas demand growth: ▲ LNG Export Terminals ▲ Data Center Projects ▲ Industrial Hubs ~10% Production CAGR (2025E- 2030E) ~10% LQA Distribution Yield (1) ~0.3x Total Debt/LTM Adj. EBITDA (2) Embedded Upside from Natural Gas Demand Significant Position in Heart of U.S. Gas Growth 7
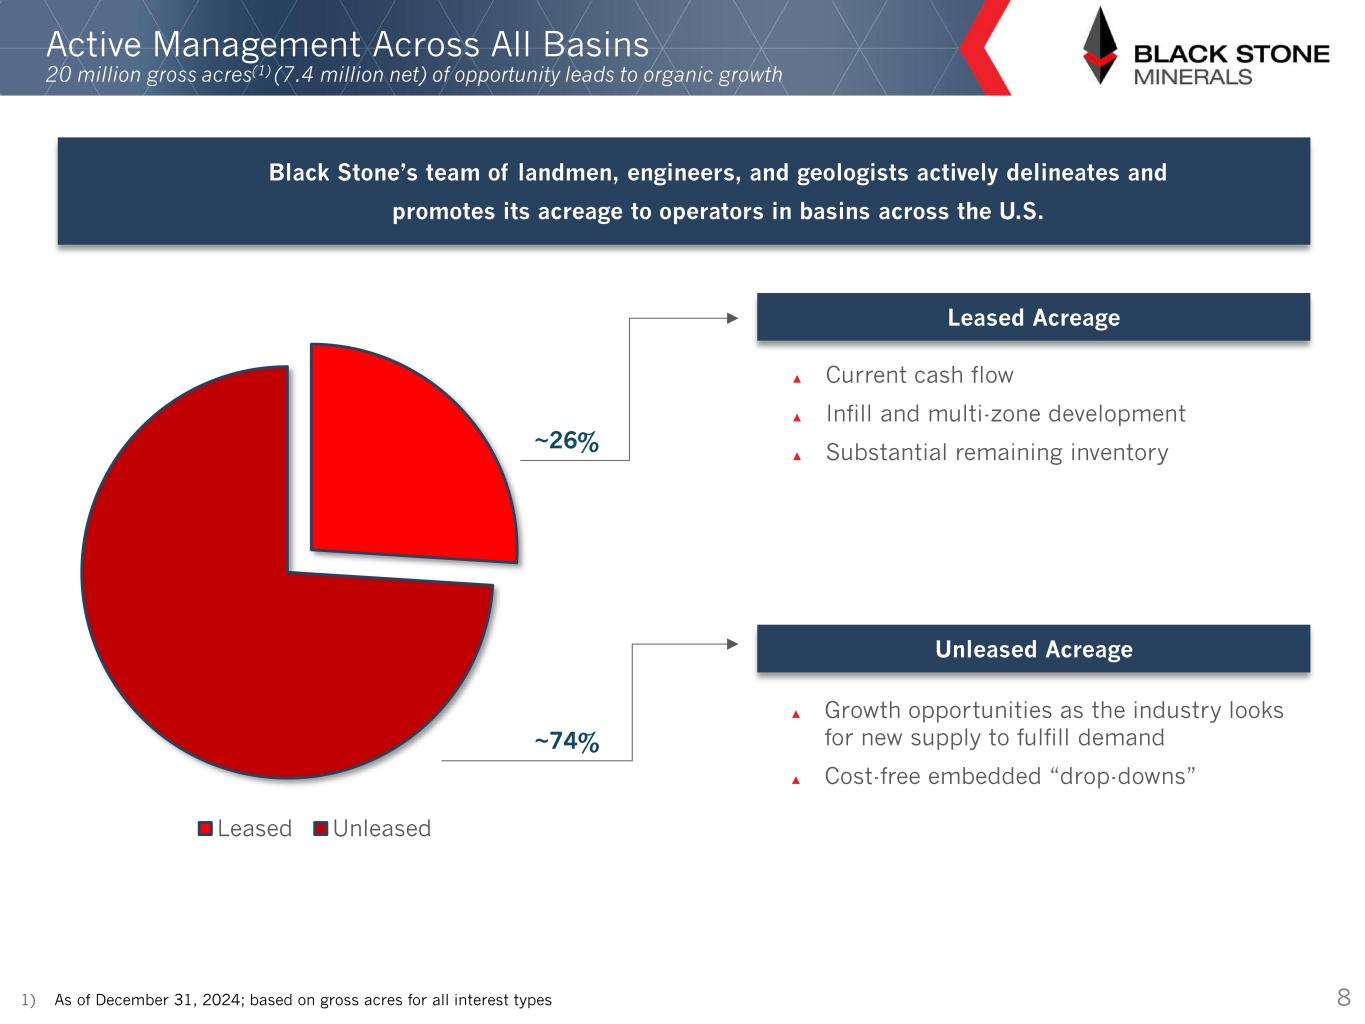
Leased Unleased ▲ Current cash flow ▲ Infill and multi-zone development ▲ Substantial remaining inventory Active Management Across All Basins 20 million gross acres(1) (7.4 million net) of opportunity leads to organic growth ▲ Growth opportunities as the industry looks for new supply to fulfill demand ▲ Cost-free embedded “drop-downs” ~26% ~74% 1) As of December 31, 2024; based on gross acres for all interest types 8 Black Stone’s team of landmen, engineers, and geologists actively delineates and promotes its acreage to operators in basins across the U.S. Leased Acreage Unleased Acreage
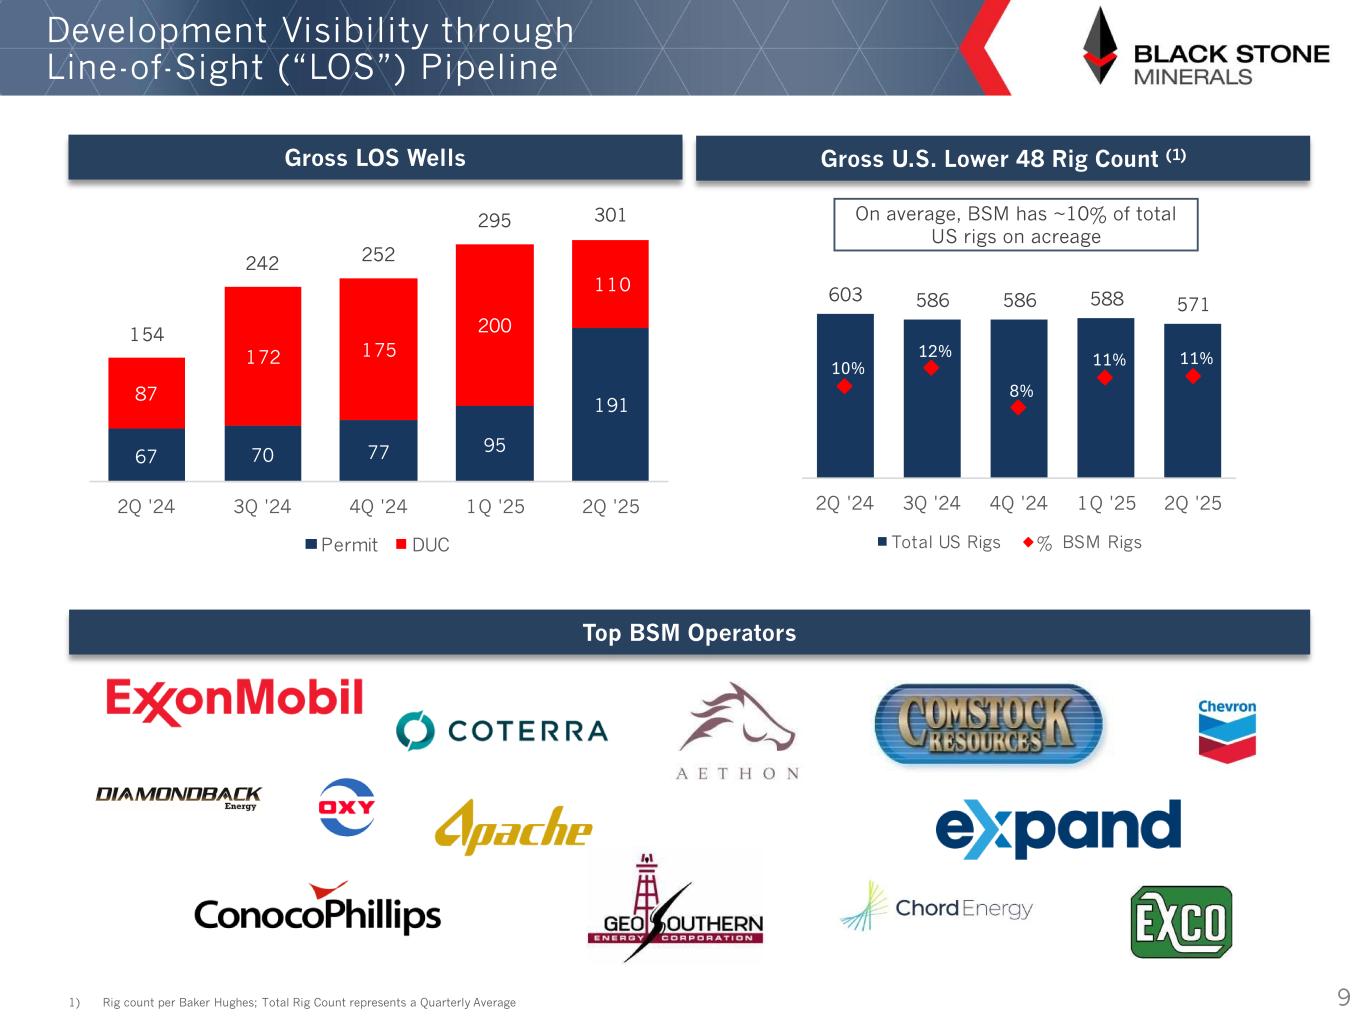
Gross LOS Wells Top Operators LOS Well Pipeline 0 5 5 5 5 0 0 20 0 00 2Q 2 Q 2 Q 2 Q 25 2Q 25 Total S Rigs BSM Rigs 0 5 2 5 200 0 5 2 2 252 2 5 0 2Q 2 Q 2 Q 2 Q 25 2Q 25 Permit D C On average, BSM has ~10% of total US rigs on acreage Development Visibility through Line-of-Sight (“LOS”) Pipeline Gross U.S. Lower 48 Rig Count (1) Top BSM Operators 91) Rig count per Baker Hughes; Total Rig Count represents a Quarterly Average
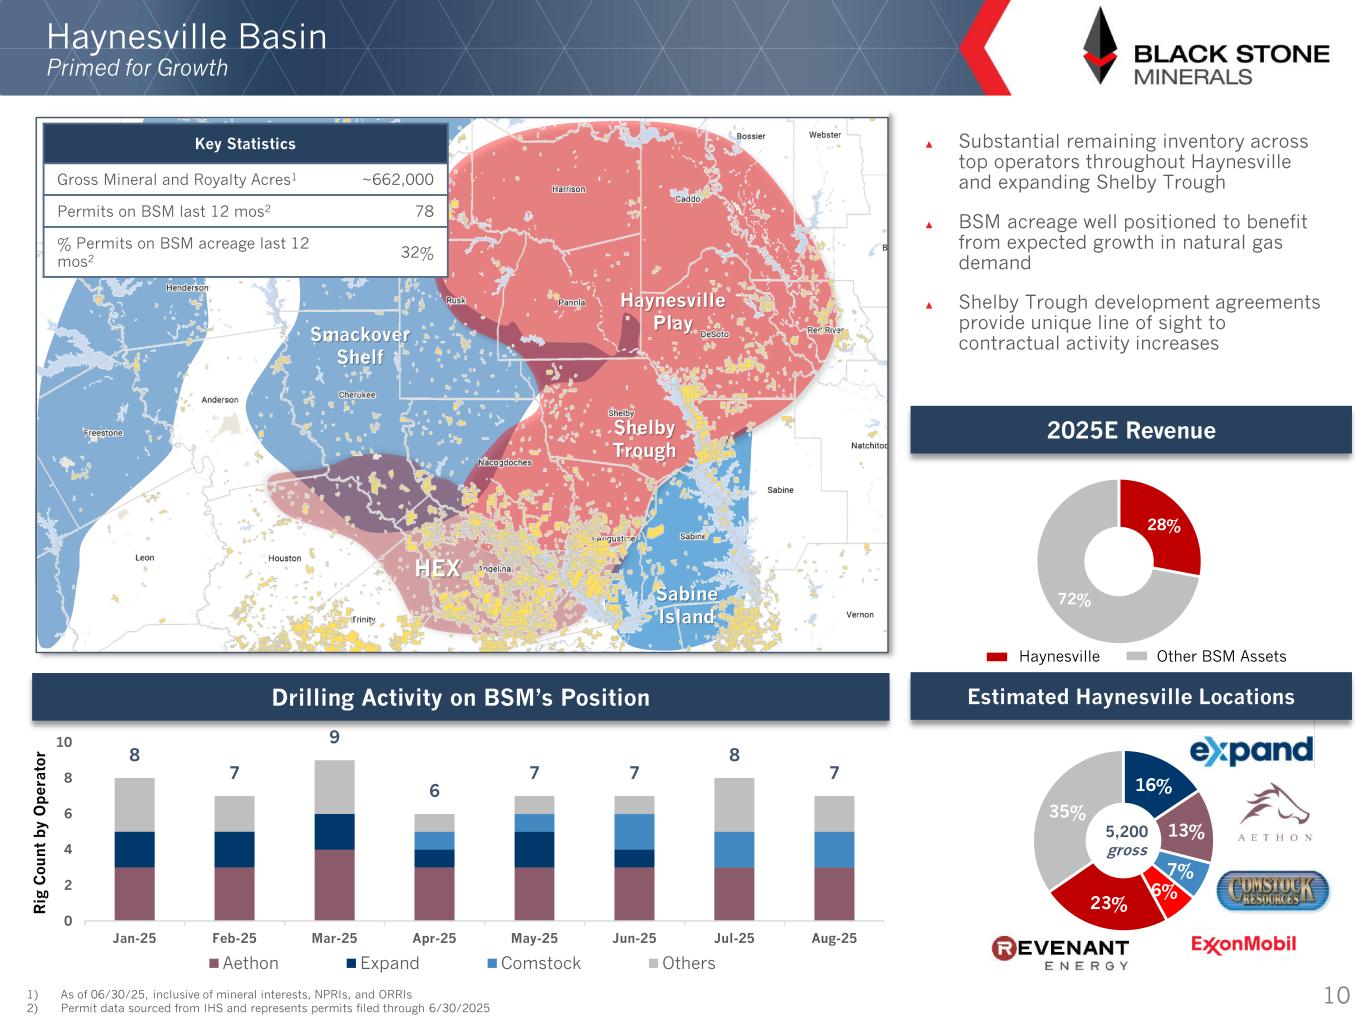
16% 13% 7% 6% 23% 35% 28% 72% Haynesville Basin Primed for Growth 101) As of 06/30/25, inclusive of mineral interests, NPRIs, and ORRIs 2) Permit data sourced from IHS and represents permits filed through 6/30/2025 5,200 gross 8 7 9 6 7 7 8 7 0 2 4 6 8 10 Jan-25 Feb-25 Mar-25 Apr-25 May-25 Jun-25 Jul-25 Aug-25 Aethon Expand Comstock Others R ig C o u n t b y O p e ra to r ▲ Substantial remaining inventory across top operators throughout Haynesville and expanding Shelby Trough ▲ BSM acreage well positioned to benefit from expected growth in natural gas demand ▲ Shelby Trough development agreements provide unique line of sight to contractual activity increases Drilling Activity on BSM’s Position Estimated Haynesville Locations 2025E Revenue Sabine Island Shelby Trough Haynesville Play Smackover Shelf HEX Key Statistics Gross Mineral and Royalty Acres1 ~662,000 Permits on BSM last 12 mos2 78 % Permits on BSM acreage last 12 mos2 32% Haynesville Other BSM Assets
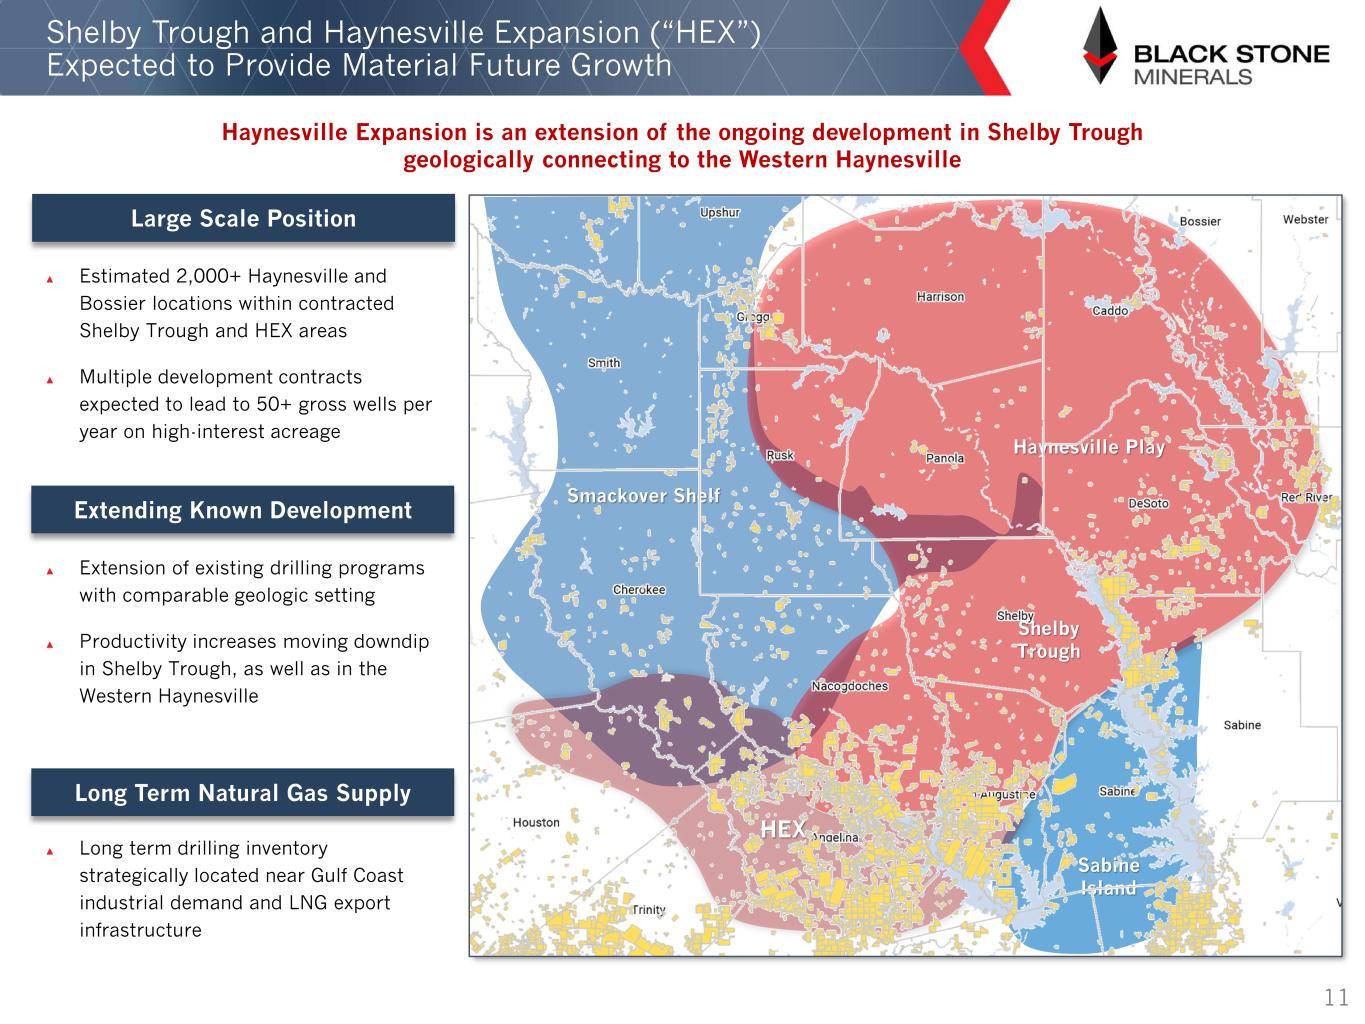
Sabine Island Shelby Trough Haynesville Play Smackover Shelf HEX Shelby Trough and Haynesville Expansion (“HEX”) Expected to Provide Material Future Growth 11 Haynesville Expansion is an extension of the ongoing development in Shelby Trough geologically connecting to the Western Haynesville Large Scale Position ▲ Estimated 2,000+ Haynesville and Bossier locations within contracted Shelby Trough and HEX areas ▲ Multiple development contracts expected to lead to 50+ gross wells per year on high-interest acreage Extending Known Development ▲ Extension of existing drilling programs with comparable geologic setting ▲ Productivity increases moving downdip in Shelby Trough, as well as in the Western Haynesville Long Term Natural Gas Supply ▲ Long term drilling inventory strategically located near Gulf Coast industrial demand and LNG export infrastructure
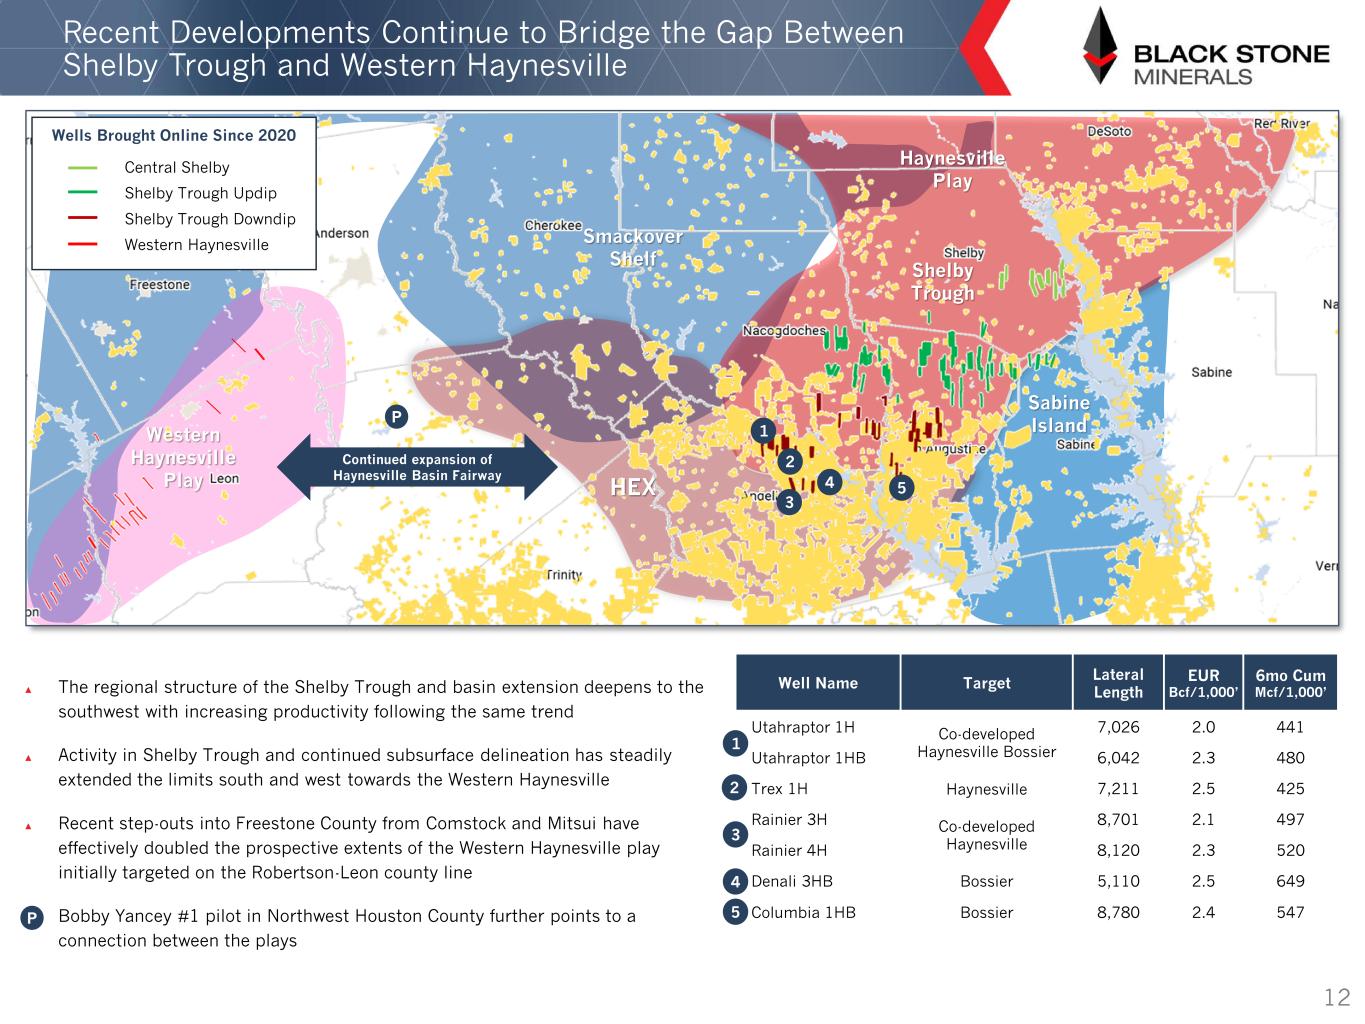
12 ▲ The regional structure of the Shelby Trough and basin extension deepens to the southwest with increasing productivity following the same trend ▲ Activity in Shelby Trough and continued subsurface delineation has steadily extended the limits south and west towards the Western Haynesville ▲ Recent step-outs into Freestone County from Comstock and Mitsui have effectively doubled the prospective extents of the Western Haynesville play initially targeted on the Robertson-Leon county line ▲ Bobby Yancey #1 pilot in Northwest Houston County further points to a connection between the plays Recent Developments Continue to Bridge the Gap Between Shelby Trough and Western Haynesville Central Shelby Shelby Trough Updip Shelby Trough Downdip Western Haynesville Wells Brought Online Since 2020 HEX Sabine Island Shelby Trough Haynesville Play Smackover Shelf Western Haynesville Play Well Name Target Lateral Length EUR Bcf/1, ’ 6mo Cum Mcf/1, ’ Utahraptor 1H Co-developed Haynesville Bossier 7,026 2.0 441 Utahraptor 1HB 6,042 2.3 480 Trex 1H Haynesville 7,211 2.5 425 Rainier 3H Co-developed Haynesville 8,701 2.1 497 Rainier 4H 8,120 2.3 520 Denali 3HB Bossier 5,110 2.5 649 Columbia 1HB Bossier 8,780 2.4 547 1 P 1 2 2 3 3 4 4 5 Continued expansion of Haynesville Basin Fairway 5P
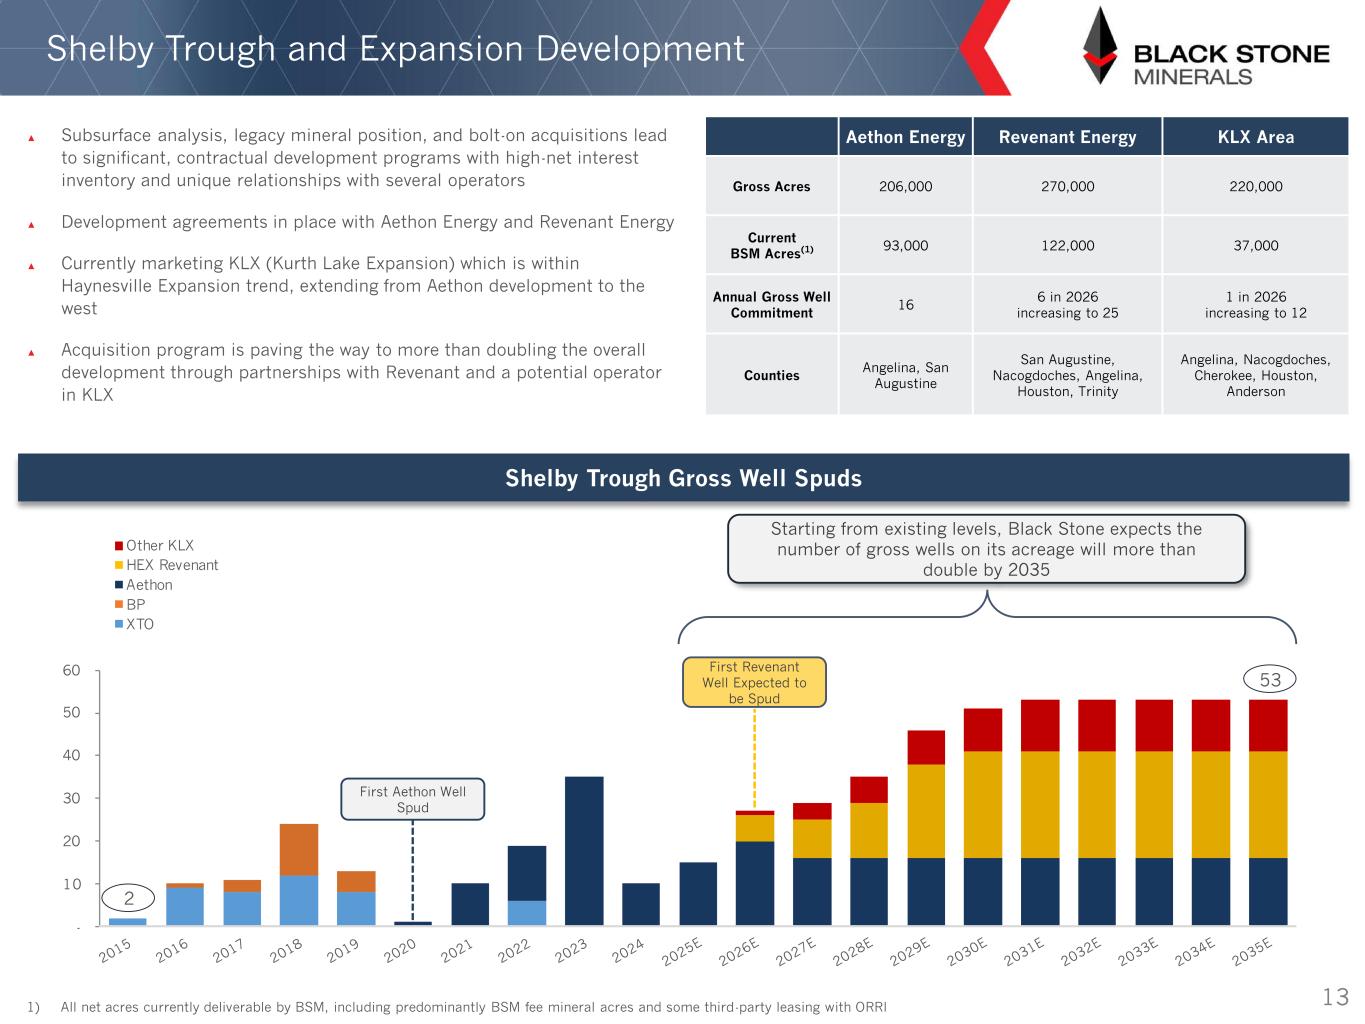
Shelby Trough Gross Well Spuds Shelby Trough and Expansion Development ▲ Subsurface analysis, legacy mineral position, and bolt-on acquisitions lead to significant, contractual development programs with high-net interest inventory and unique relationships with several operators ▲ Development agreements in place with Aethon Energy and Revenant Energy ▲ Currently marketing KLX (Kurth Lake Expansion) which is within Haynesville Expansion trend, extending from Aethon development to the west ▲ Acquisition program is paving the way to more than doubling the overall development through partnerships with Revenant and a potential operator in KLX 13 2 5 0 20 0 0 50 0 Other LX HEX Revenant Aethon BP XTO Starting from existing levels, Black Stone expects the number of gross wells on its acreage will more than double by 2035 First Revenant Well Expected to be Spud First Aethon Well Spud Aethon Energy Revenant Energy KLX Area Gross Acres 206,000 270,000 220,000 Current BSM Acres(1) 93,000 122,000 37,000 Annual Gross Well Commitment 16 6 in 2026 increasing to 25 1 in 2026 increasing to 12 Counties Angelina, San Augustine San Augustine, Nacogdoches, Angelina, Houston, Trinity Angelina, Nacogdoches, Cherokee, Houston, Anderson 1) All net acres currently deliverable by BSM, including predominantly BSM fee mineral acres and some third-party leasing with ORRI

12% 88% 8 8 7 6 6 6 10 10 9 12 7 7 9 14 15 8 20 26 17 21 21 30 39 27 0 5 10 15 20 25 30 35 40 45 Jan-25 Feb-25 Mar-25 Apr-25 May-25 Jun-25 Jul-25 Aug-25 Diamondback ExxonMobil ConocoPhillips Occidental Petroleum APA Corp Others Central Basin Platform Northwest Shelf Delaware Basin Midland Basin 2025E Revenue 14 ▲ Deep bench of inventory broadly distributed throughout the core of the basin ▲ Significant remaining inventory is anchored by Exxon and Diamondback, who have had a combined average of 17 rigs a month on BSM acreage in 2025 1) As of 6/30/2025, inclusive of mineral interests, NPRIs, and ORRIs 2) Permit data sourced from IHS and represents permits filed through 06/30/25 R ig C o u n t b y O p e ra to r Key Statistics Gross Mineral and Royalty Acres1 ~451,000 Permits on BSM last 12 mos2 445 % Permits on BSM acreage last 12 mos2 20% Drilling Activity on BSM’s Position Permian Basin Position: Midland Expected to Contribute Significant Oil Volumes Over the Next Decade 37% 19% 6% 6% 4% 28% 5,700 gross Estimated Midland Basin Locations Midland Other BSM Assets
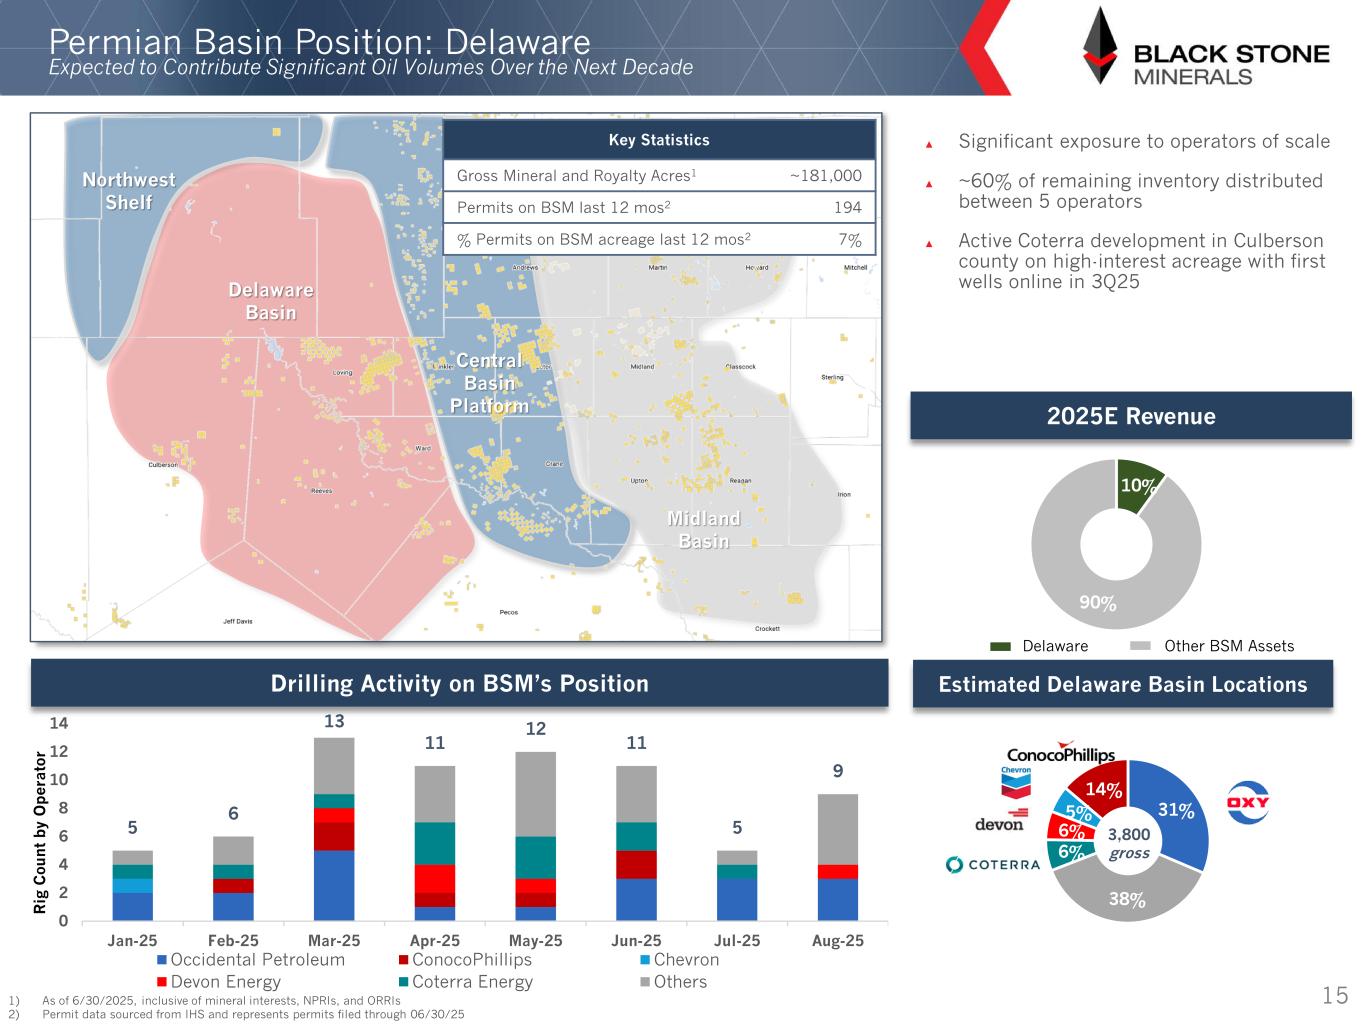
10% 90% Central Basin Platform Northwest Shelf Delaware Basin Midland Basin 5 6 13 11 12 11 5 9 0 2 4 6 8 10 12 14 Jan-25 Feb-25 Mar-25 Apr-25 May-25 Jun-25 Jul-25 Aug-25 Occidental Petroleum ConocoPhillips Chevron Devon Energy Coterra Energy Others 31% 38% 6% 6% 5% 14% 3,800 gross Estimated Delaware Basin Locations 2025E Revenue 15 ▲ Significant exposure to operators of scale ▲ ~60% of remaining inventory distributed between 5 operators ▲ Active Coterra development in Culberson county on high-interest acreage with first wells online in 3Q25 1) As of 6/30/2025, inclusive of mineral interests, NPRIs, and ORRIs 2) Permit data sourced from IHS and represents permits filed through 06/30/25 R ig C o u n t b y O p e ra to r Key Statistics Gross Mineral and Royalty Acres1 ~181,000 Permits on BSM last 12 mos2 194 % Permits on BSM acreage last 12 mos2 7% Drilling Activity on BSM’s Position Permian Basin Position: Delaware Expected to Contribute Significant Oil Volumes Over the Next Decade Delaware Other BSM Assets
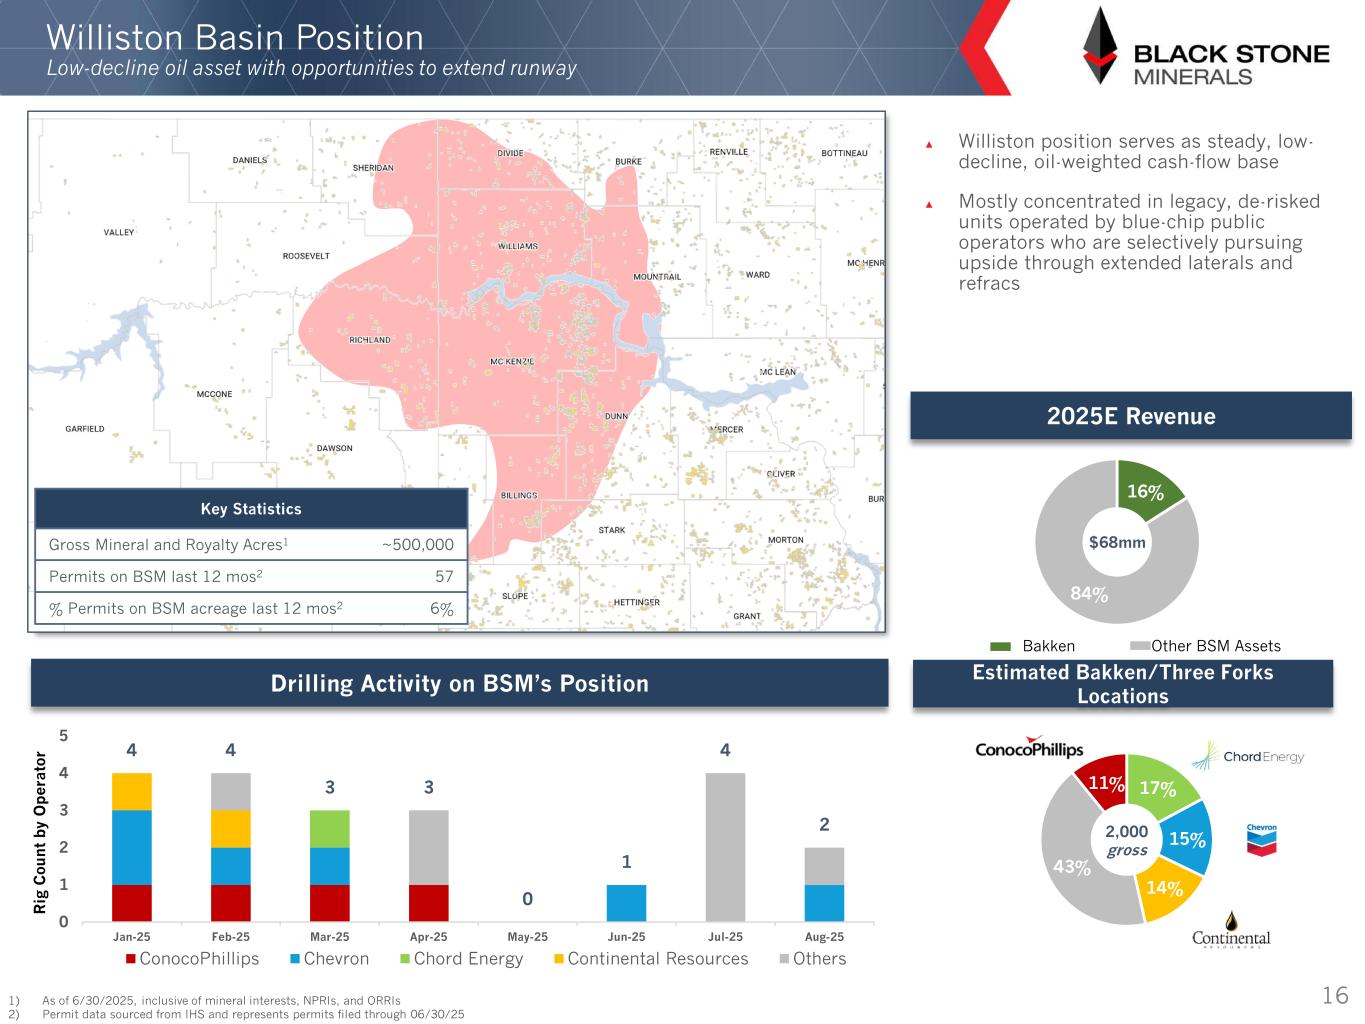
Estimated Bakken/Three Forks Locations 2025E Revenue 4 4 3 3 0 1 4 2 0 1 2 3 4 5 Jan-25 Feb-25 Mar-25 Apr-25 May-25 Jun-25 Jul-25 Aug-25 ConocoPhillips Chevron Chord Energy Continental Resources Others 17% 15% 14% 43% 11% Williston Basin Position Low-decline oil asset with opportunities to extend runway 16 ▲ Williston position serves as steady, low- decline, oil-weighted cash-flow base ▲ Mostly concentrated in legacy, de-risked units operated by blue-chip public operators who are selectively pursuing upside through extended laterals and refracs 16% 84% 1) As of 6/30/2025, inclusive of mineral interests, NPRIs, and ORRIs 2) Permit data sourced from IHS and represents permits filed through 06/30/25 $68mm 2,000 gross R ig C o u n t b y O p e ra to r Key Statistics Gross Mineral and Royalty Acres1 ~500,000 Permits on BSM last 12 mos2 57 % Permits on BSM acreage last 12 mos2 6% Drilling Activity on BSM’s Position Bakken Other BSM Assets
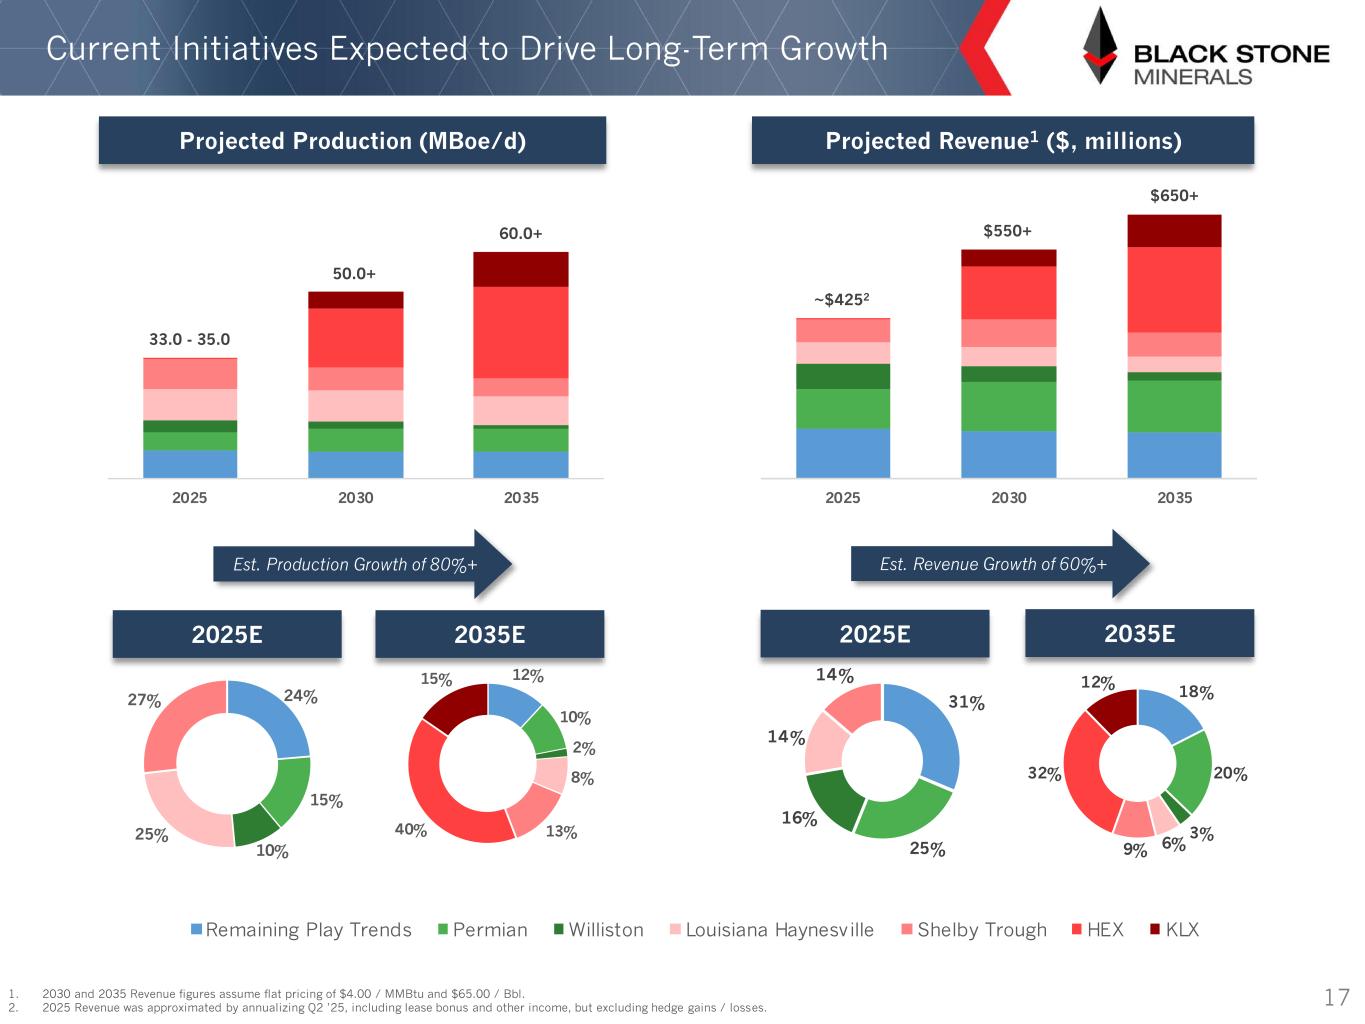
2035E 1 2 2 12 2035E Projected Revenue1 ($, millions)Projected Production (MBoe/d) 1 25 1 1 1 Current Initiatives Expected to Drive Long-Term Growth Remaining Play Trends Permian illiston Louisiana Haynesville Shelby Trough HEX LX 17 Est. Revenue Growth of 60%+ 2 25 2 2 52 25 2 2 5 Est. Production Growth of 80%+ 15 12 1 2 1 2 15 1 25 2 33.0 - 35.0 50.0+ 60.0+ ~$4252 $550+ $650+ 2025E 2025E 1. 2030 and 2035 Revenue figures assume flat pricing of $4.00 / MMBtu and $65.00 / Bbl. 2. 2025 Revenue was approximated by annualizing Q2 ’25, including lease bonus and other income, but excluding hedge gains / losses.
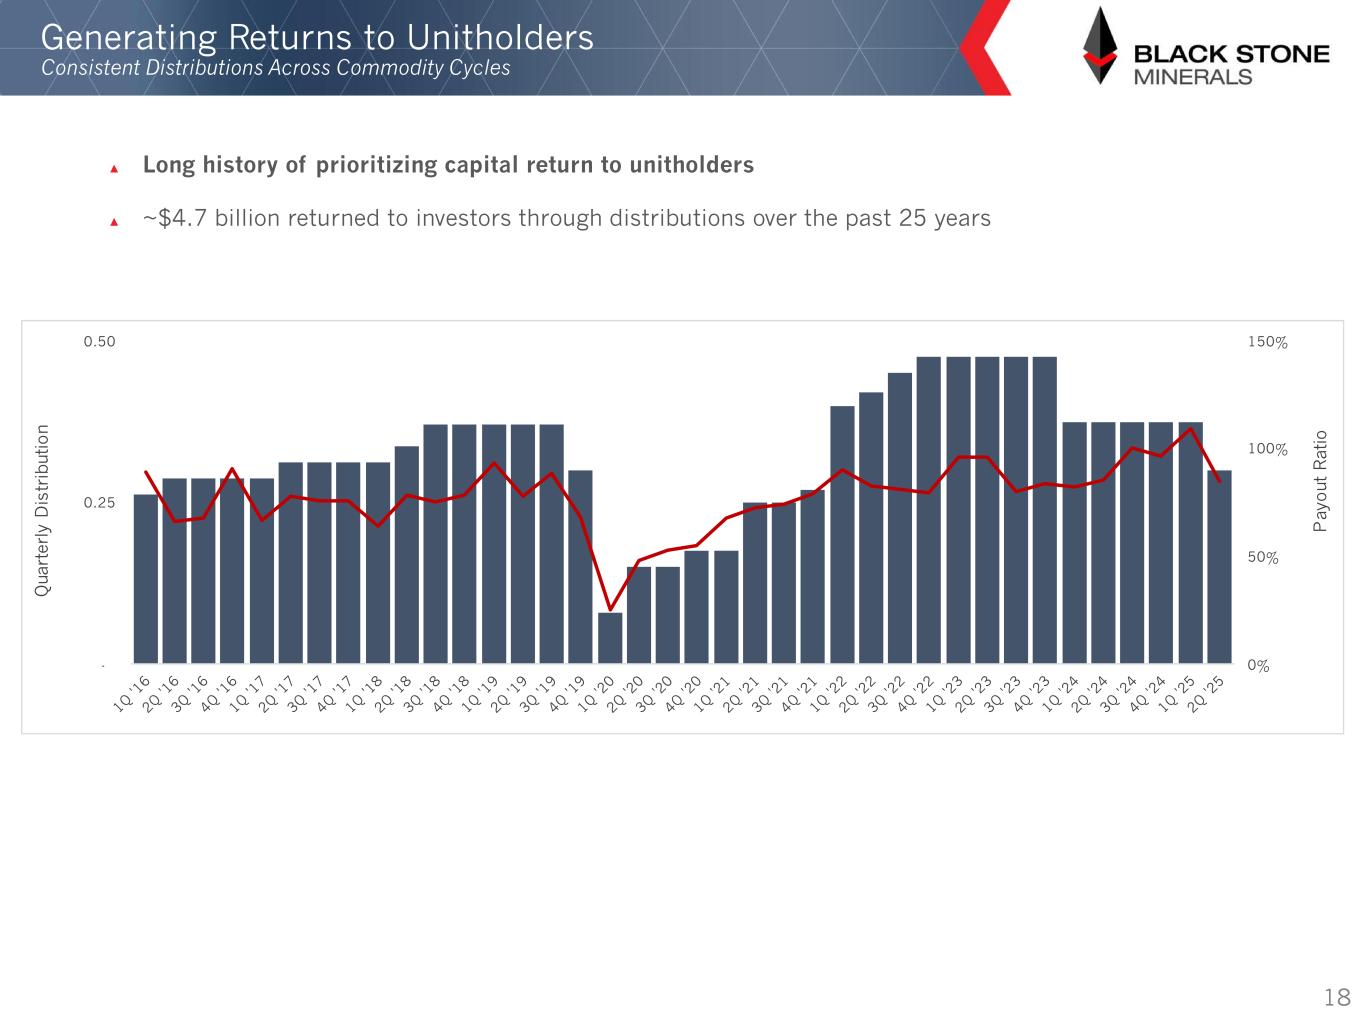
Generating Returns to Unitholders Consistent Distributions Across Commodity Cycles ▲ Long history of prioritizing capital return to unitholders ▲ ~$4.7 billion returned to investors through distributions over the past 25 years 0 50 00 50 0.25 0.50 P a y o u t R a ti o Q u a rt e rl y D is tr ib u ti o n 18
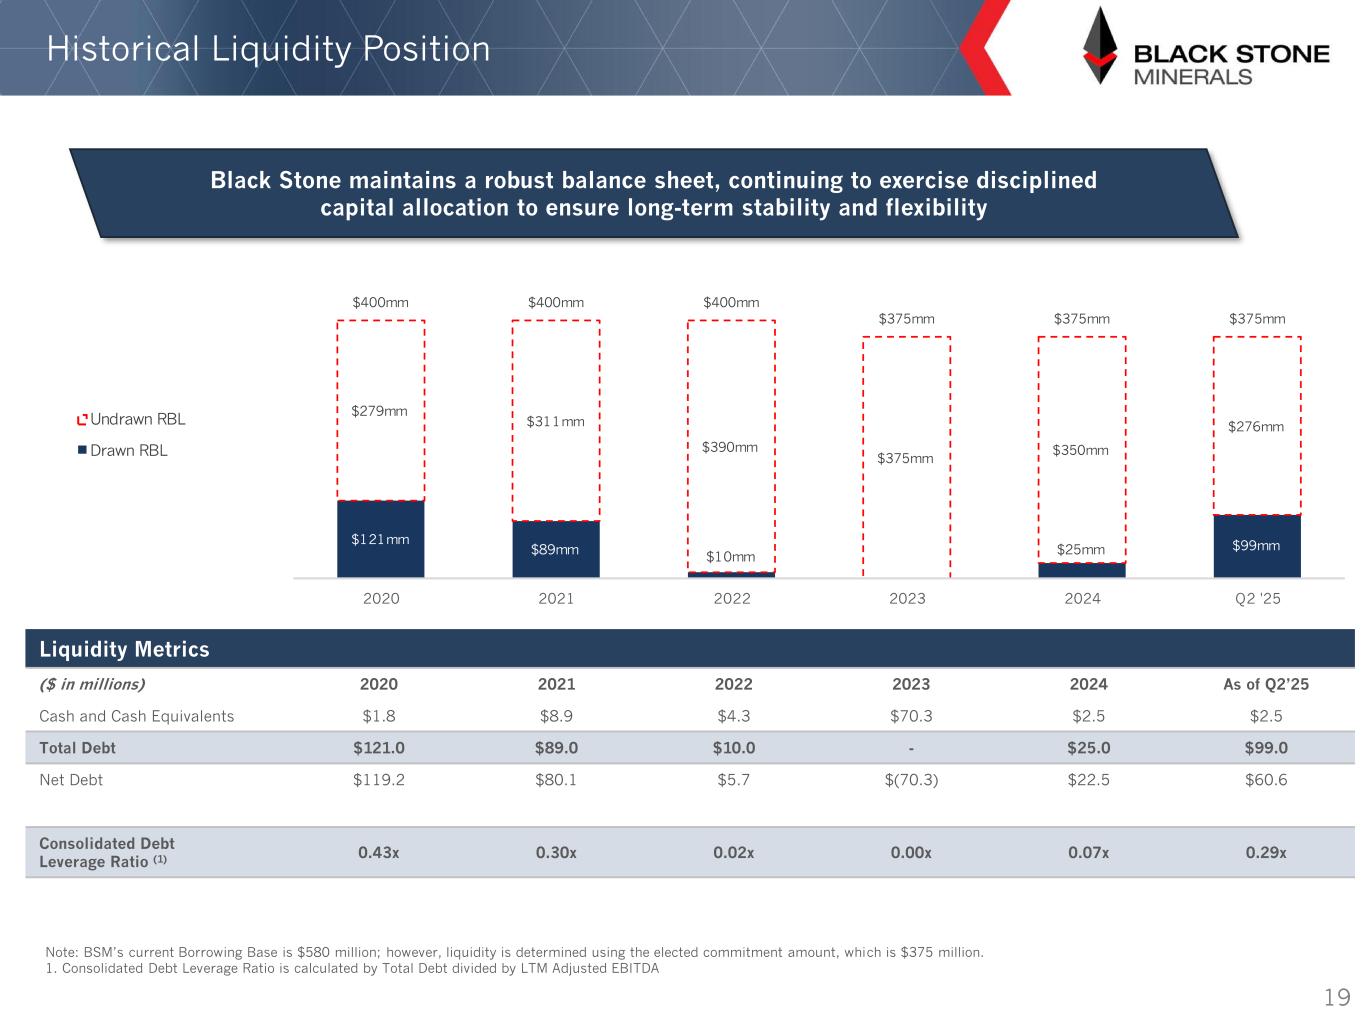
Historical Liquidity Position Liquidity Metrics ($ in millions) 2020 2021 2022 2023 2024 As of Q2’25 Cash and Cash Equivalents $1.8 $8.9 $4.3 $70.3 $2.5 $2.5 Total Debt $121.0 $89.0 $10.0 - $25.0 $99.0 Net Debt $119.2 $80.1 $5.7 $(70.3) $22.5 $60.6 Consolidated Debt Leverage Ratio (1) 0.43x 0.30x 0.02x 0.00x 0.07x 0.29x Note: BSM’s current Borrowing Base is $5 0 million; however, liquidity is determined using the elected commitment amount, which is $375 million. 1. Consolidated Debt Leverage Ratio is calculated by Total Debt divided by LTM Adjusted EBITDA 19 $ 2 mm $ mm $ 0mm $25mm $ mm $2 mm $ mm $ 0mm $ 5mm $ 50mm $2 mm $ 00mm $ 00mm $ 00mm $ 5mm $ 5mm $ 5mm 2020 202 2022 202 202 Q2 25 ndrawn RBL Drawn RBL Black Stone maintains a robust balance sheet, continuing to exercise disciplined capital allocation to ensure long-term stability and flexibility
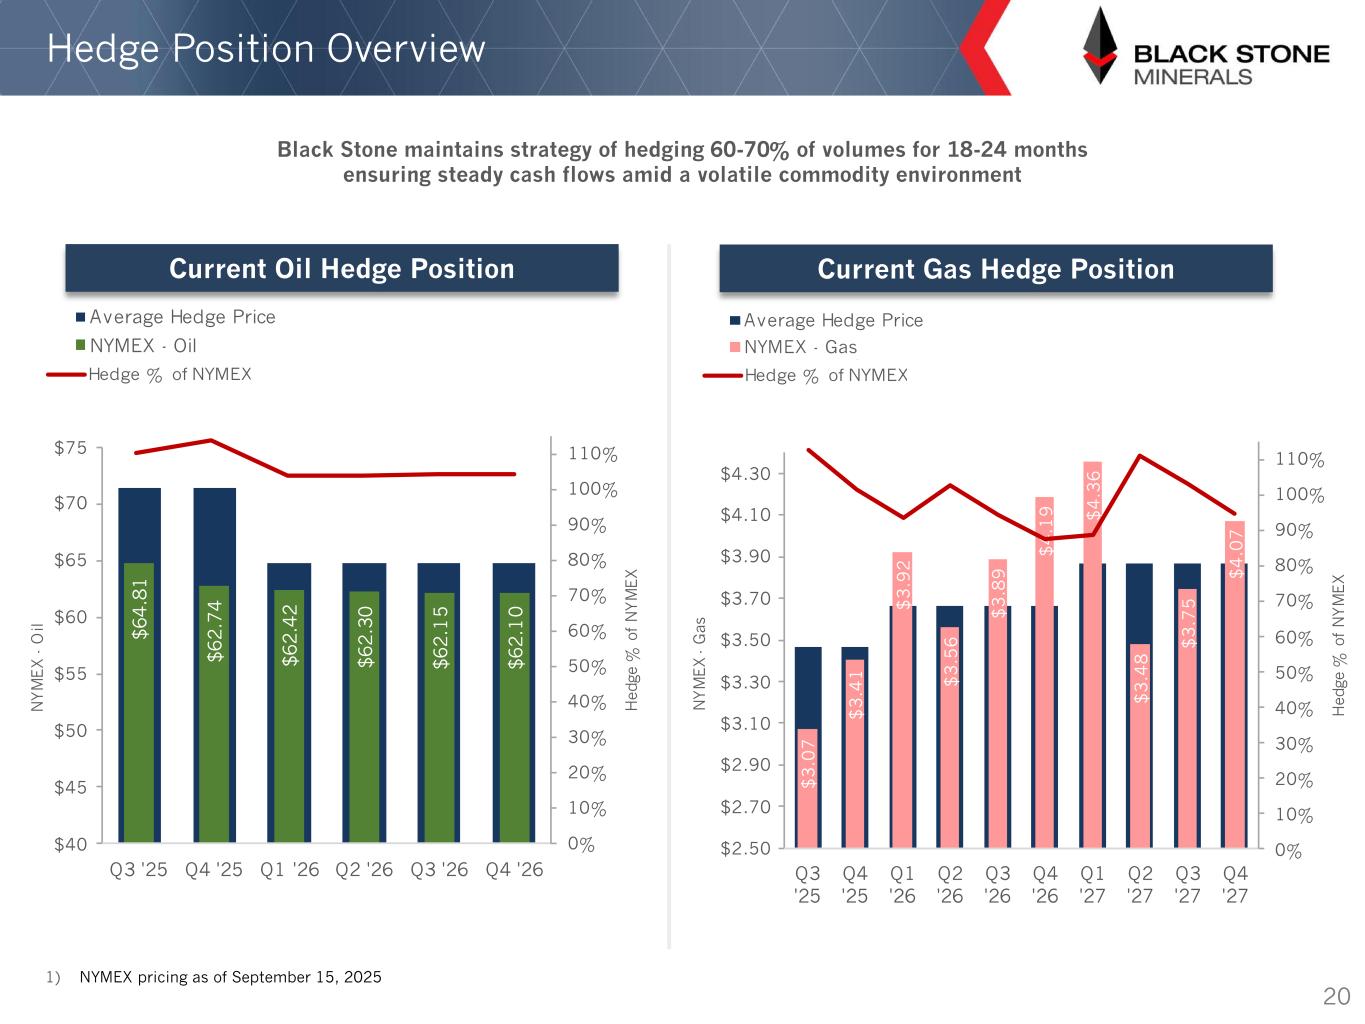
Hedge Position Overview 1) NYMEX pricing as of September 15, 2025 Black Stone maintains strategy of hedging 60-70% of volumes for 18-24 months ensuring steady cash flows amid a volatile commodity environment 20 $ . $ 2 . $ 2 . 2 $ 2 . 0 $ 2 . 5 $ 2 . 0 $ 0 $ 5 $50 $55 $ 0 $ 5 $ 0 $ 5 Q 25 Q 25 Q 2 Q2 2 Q 2 Q 2 N M E X O il Average Hedge Price N MEX Oil Average Hedge Price N MEX Gas Current Oil Hedge Position Current Gas Hedge Position Hedge of N MEX Hedge of N MEX $ .0 $ . $ . 2 $ .5 $ . $ . $ . $ . $ . 5 $ .0 $2.50 $2. 0 $2. 0 $ . 0 $ . 0 $ .50 $ . 0 $ . 0 $ . 0 $ . 0 Q 25 Q 25 Q 2 Q2 2 Q 2 Q 2 Q 2 Q2 2 Q 2 Q 2 N M E X G a s 0 0 20 0 0 50 0 0 0 0 00 0 H e d g e o f N M E X 0 0 20 0 0 50 0 0 0 0 00 0 H e d g e o f N M E X

Expect doubling production will lead to $2.00+/unit distribution while maintaining conservative leverage Key Takeaways 21 33–35 MBoe/d 60+ MBoe/d 2025 2035 Focus on long-term unitholder value and distribution growth while maintaining conservative leverage Organic production growth with differentiated acquisition strategy Multiple unique development agreements on high-interest acreage with long-term inventory Projected substantial remaining inventory across major basins in addition to large-scale, unleased acreage Well positioned to benefit from growing natural gas demand
Appendix 22
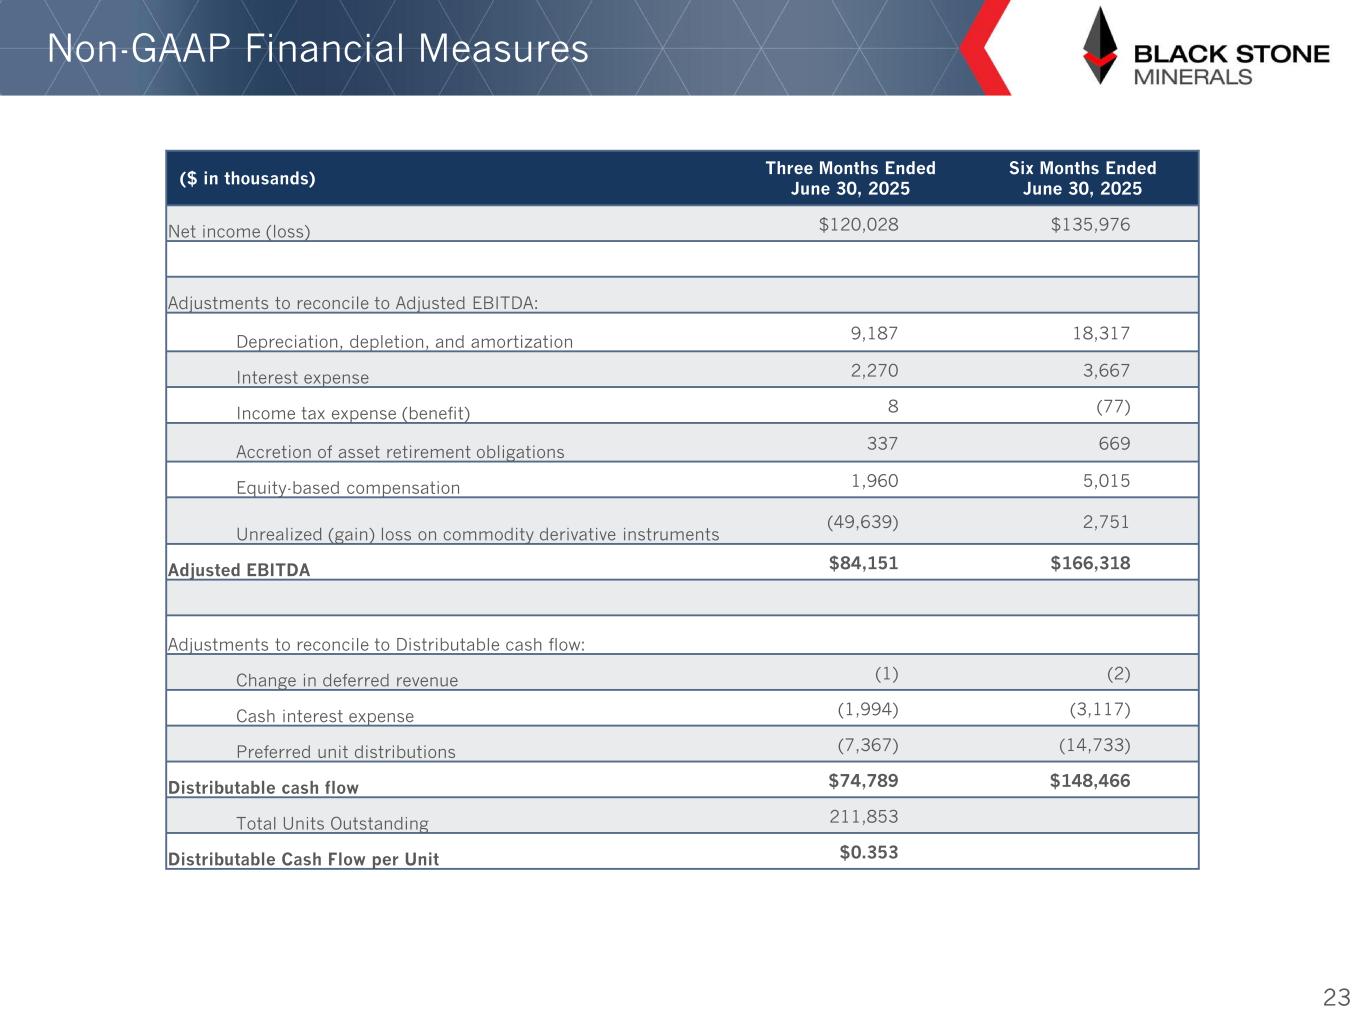
Non-GAAP Financial Measures ($ in thousands) Three Months Ended June 30, 2025 Six Months Ended June 30, 2025 Net income (loss) $120,028 $135,976 Adjustments to reconcile to Adjusted EBITDA: Depreciation, depletion, and amortization 9,187 18,317 Interest expense 2,270 3,667 Income tax expense (benefit) 8 (77) Accretion of asset retirement obligations 337 669 Equity-based compensation 1,960 5,015 Unrealized (gain) loss on commodity derivative instruments (49,639) 2,751 Adjusted EBITDA $84,151 $166,318 Adjustments to reconcile to Distributable cash flow: Change in deferred revenue (1) (2) Cash interest expense (1,994) (3,117) Preferred unit distributions (7,367) (14,733) Distributable cash flow $74,789 $148,466 Total Units Outstanding 211,853 Distributable Cash Flow per Unit $0.353 23