.2
Disclaimers |
|
|
|
Forward-looking Statement
We make statements in this Supplemental Information Package that are considered “forward-looking statements” within the meaning of Section 27A of the Securities Act of 1933, as amended, or the Securities Act, and Section 21E of the Securities Exchange Act of 1934, as amended, or the Exchange Act, which are usually identified by the use of words such as “anticipates,” “believes,” “estimates,” “expects,” “intends,” “may,” “plans,” “projects,” “seeks,” “should,” “will,” and variations of such words or similar expressions. We intend these forward-looking statements to be covered by the safe harbor provisions for forward-looking statements contained in the Private Securities Litigation Reform Act of 1995 and are including this statement in this Supplemental Information Package for purposes of complying with those safe harbor provisions. These forward-looking statements reflect our current views about our plans, intentions, expectations, strategies and prospects, which are based on the information currently available to us and on assumptions we have made. Although we believe that our plans, intentions, expectations, strategies and prospects as reflected in or suggested by those forward-looking statements are reasonable, we can give no assurance that the plans, intentions, expectations or strategies will be attained or achieved. Furthermore, actual results may differ materially from those described in the forward-looking statements and will be affected by a variety of risks and factors that are beyond our control including, without limitation: risks associated with our dependence on the U.S. Government and its agencies for substantially all of our revenues, including credit risk and risk that the U.S. Government reduces its spending on real estate or that it changes its preference away from leased properties, including as a result of or in connection with any shutdown of the U.S. Government; risks associated with ownership and development of real estate; the risk of decreased rental rates or increased vacancy rates; the loss of key personnel; general volatility of the capital and credit markets and the market price of our common stock; the risk we may lose one or more major tenants; difficulties in completing and successfully integrating acquisitions; failure of acquisitions or development projects to occur at anticipated levels or yield anticipated results; risks associated with our joint venture activities; risks associated with actual or threatened terrorist attacks; intense competition in the real estate market that may limit our ability to attract or retain tenants or re-lease space; insufficient amounts of insurance or exposure to events that are either uninsured or underinsured; uncertainties and risks related to adverse weather conditions, natural disasters and climate change; exposure to liability relating to environmental and health and safety matters; limited ability to dispose of assets because of the relative illiquidity of real estate investments and the nature of our assets; exposure to litigation or other claims; risks associated with breaches of our data security; risks associated with our indebtedness, including failure to refinance current or future indebtedness on favorable terms, or at all, failure to meet the restrictive covenants and requirements in our existing and new debt agreements, fluctuations in interest rates and increased costs to refinance or issue new debt; risks associated with derivatives or hedging activity; risks associated with mortgage debt or unsecured financing or the unavailability thereof, which could make it difficult to finance or refinance properties and could subject us to foreclosure; adverse impacts from any future pandemic, epidemic or outbreak of any highly infectious disease on the U.S., regional and global economies and the financial condition and results of operations of the Company; and other risks and uncertainties detailed in the “Risk Factors” section of our Form 10-K for the year ended December 31, 2024, filed with the Securities and Exchange Commission, or the SEC, on February 25, 2025 and included under the heading “Risk Factors” in our other public filings. In addition, our qualification as a real estate investment trust involves the application of highly technical and complex provisions of the Internal Revenue Code of 1986, or the Code, and depends on our ability to meet the various requirements imposed by the Code through actual operating results, distribution levels and diversity of stock ownership. We assume no obligation to update publicly any forward-looking statements, whether as a result of new information, future events or otherwise.
2
Disclaimers |
|
|
|
Ratings
Ratings are not recommendations to buy, sell or hold the Company’s securities.
The following discussion related to the consolidated financial statements of the Company should be read in conjunction with the financial statements for the quarter ended September 30, 2025 that will be released in our Form 10-Q to be filed with the SEC on or about October 27, 2025. Share, share price and per share data have been adjusted for all periods presented to reflect a 1-for-2.5 reverse stock split, effective April 28, 2025, and a reduction in authorized shares of common stock from 200,000,000 to 80,000,000, in proportion to the 1-for 2.5 reverse stock split, effective May 8, 2025.
3
Supplemental Definitions |
|
|
|
This section contains definitions of certain non-GAAP financial measures and other terms that the Company uses in this Supplemental Information Package and, where applicable, the reasons why management believes these non-GAAP financial measures provide useful information to investors about the Company’s financial condition and results of operations and the other purposes for which management uses the measures. These measures should not be considered in isolation or as a substitute for measures of performance in accordance with GAAP. Additional detail can be found in the Company’s most recent quarterly report on Form 10-Q and the Company’s most recent annual report on Form 10-K, as well as other documents filed with or furnished to the SEC from time to time. We present certain financial information and metrics “at Easterly’s Share,” which is calculated on an entity-by-entity basis. “At Easterly’s Share” information, which we also refer to as being “at share,” “pro rata,” “our pro rata share” or “our share” is not, and is not intended to be, a presentation in accordance with GAAP.
Annualized lease income is defined as the annualized contractual base rent for the last month in a specified period, plus the annualized straight-line rent adjustments for the last month in such period and the annualized net expense reimbursements earned by us for the last month in such period.
Cash Available for Distribution (CAD) is a non-GAAP financial measure that is not intended to represent cash flow for the period and is not indicative of cash flow provided by operating activities as determined under GAAP. CAD is calculated in accordance with the current Nareit definition as FFO minus normalized recurring real estate-related expenditures and other non-cash items, nonrecurring expenditures and the unconsolidated real estate venture’s allocated share of these adjustments. CAD is presented solely as a supplemental disclosure because the Company believes it provides useful information regarding the Company’s ability to fund its dividends. Because all companies do not calculate CAD the same way, the presentation of CAD may not be comparable to similarly titled measures of other companies.
Cash fixed charge coverage ratio is calculated as EBITDA divided by the sum of principal amortization and interest expense, excluding amortization of premiums / discounts and deferred financing fees, for the most recent quarter.
Cash interest coverage ratio is calculated as EBITDA divided by interest expense, excluding amortization of premiums / discounts and deferred financing fees, for the most recent quarter.
Core Funds from Operations (Core FFO) adjusts FFO to present an alternative measure of the Company's operating performance, which, when applicable, excludes items which it believes are not representative of ongoing operating results, such as liability management related costs (including losses on extinguishment of debt and modification costs), catastrophic event charges, depreciation of non-real estate assets, provision for (recovery of) credit losses, and the unconsolidated real estate venture's allocated share of these adjustments. In future periods, the Company may also exclude other items from Core FFO that it believes may help investors compare its results. The Company believes Core FFO more accurately reflects the ongoing operational and financial performance of the Company's core business.
EBITDA is calculated as the sum of net income (loss) before interest expense, taxes, depreciation and amortization, (gain) loss on the sale of operating properties, impairment loss, and the unconsolidated real estate venture’s allocated share of these adjustments. EBITDA is not intended to represent cash flow for the period, is not presented as an alternative to operating income as an indicator of operating performance, should not be considered in isolation or as a substitute for measures of performance prepared in accordance with GAAP, is not indicative of operating income or cash provided by operating activities as determined under GAAP and may be presented on a pro forma basis. EBITDA is presented solely as a supplemental disclosure with respect to liquidity because the Company believes it provides useful information regarding the Company's ability to service or incur debt. Because all companies do not calculate EBITDA the same way, the presentation of EBITDA may not be comparable to similarly titled measures of other companies.
Fully diluted basis assumes the exchange of all outstanding common units representing limited partnership interests in the Company’s operating partnership, or common units, the full vesting of all shares of restricted stock, and the exchange of all earned and vested LTIP units in the Company’s operating partnership for shares of common stock on a one-for-one basis, which is not the same as the meaning of “fully diluted” under GAAP.
4
Supplemental Definitions |
|
|
|
Funds From Operations (FFO) is defined, in accordance with the Nareit FFO White Paper - 2018 Restatement, as net income (loss), calculated in accordance with GAAP, excluding depreciation and amortization related to real estate, gains and losses from the sale of certain real estate assets, gains and losses from change in control and impairment write-downs of certain real estate assets and investments in entities when the impairment is directly attributable to decreases in the value of depreciable real estate held by the entity. FFO includes the Company’s share of FFO generated by unconsolidated affiliates. FFO is a widely recognized measure of REIT performance. Although FFO is a non-GAAP financial measure, the Company believes that information regarding FFO is helpful to shareholders and potential investors.
Net Debt and Adjusted Net Debt Net Debt represents the Company's consolidated debt and its share of unconsolidated debt adjusted to exclude its share of unamortized premiums and discounts and deferred financing fees, less its share of cash and cash equivalents and property acquisition closing escrow, net of deposit. By excluding these items, the result provides an estimate of the contractual amount of borrowed capital to be repaid, net of cash available to repay it. The Company believes this calculation constitutes a beneficial supplemental non-GAAP financial disclosure to investors in understanding its financial condition. Adjusted Net Debt is Net Debt reduced by 1) for each project under construction or in design, the lesser of i) outstanding lump-sum reimbursement amounts and ii) the cost to date, 2) 40% times the amount by which the cost to date exceeds total lump-sum reimbursement amounts for each project under construction or in design and 3) outstanding lump-sum reimbursement amounts for projects previously completed. These adjustments are made to 1) remove the estimated portion of each project under construction, in design or previously completed that has been financed with debt which may be repaid with outstanding cost reimbursement payments from the US Government and 2) remove the estimated portion of each project under construction or in design, in excess of total lump-sum reimbursements, that has been financed with debt but has not yet produced earnings. See page 27 for further information. The Company’s method of calculating Net Debt and Adjusted Net Debt may be different from methods used by other REITs and may be presented on a pro forma basis. Accordingly, the Company's method may not be comparable to such other REITs.
Net Operating Income (NOI) and Cash NOI NOI is calculated as net income adjusted to exclude depreciation and amortization, acquisition costs, corporate general and administrative costs, recovery of credit losses, interest expense, gains or losses from sales of property, impairment loss, and the unconsolidated real estate venture’s allocated share of these adjustments. Cash NOI excludes from NOI straight-line rent, amortization of above-/below-market leases, amortization of deferred revenue (which results from landlord assets funded by tenants), and the unconsolidated real estate venture’s allocated share of these adjustments. NOI and Cash NOI presented by the Company may not be comparable to NOI and Cash NOI reported by other REITs that define NOI and Cash NOI differently. The Company believes that NOI and Cash NOI provide investors with useful measures of the operating performance of its properties. NOI and Cash NOI should not be considered an alternative to net income as an indication of the Company's performance or to cash flows as a measure of the Company's liquidity or its ability to make distributions.
5
Table of Contents |
|
|
|
Overview |
|
|
|
|
|
|
7 |
|
|
|
|
|
8 |
|
|
|
|
Corporate Financials |
|
|
|
|
|
|
9 |
|
|
|
|
|
10 |
|
|
|
|
|
11 |
|
|
|
|
|
12 |
|
|
|
|
|
13 |
|
|
|
|
|
14 |
|
|
|
|
Debt |
|
|
|
|
|
|
16 |
|
|
|
|
|
18 |
|
|
|
|
Properties |
|
|
|
|
|
|
19 |
|
|
|
|
|
23 |
|
|
|
|
|
25 |
|
|
|
|
|
27 |
|
|
|
|
6
Corporate Information and Analyst Coverage |
|
|
|
Corporate Information |
|||
|
|
|
|
Corporate Headquarters |
Stock Exchange Listing |
Information Requests |
Investor Relations |
2001 K Street NW |
New York Stock Exchange |
Please contact ir@easterlyreit.com |
Allison Marino |
Suite 775 North |
|
or 202-830-3349 to request an |
EVP, CFO |
Washington, DC 20006 |
Ticker |
Investor Relations package |
|
202-595-9500 |
DEA |
|
|
Executive Team |
|
Board of Directors |
|
Darrell Crate, President & CEO |
Mark Bauer, EVP Development |
William Binnie, Chairman |
Emil Henry Jr. |
Michael Ibe, Vice-Chairman & EVP |
Franklin Logan, GC |
Darrell Crate |
Michael Ibe |
Allison Marino, CFO |
Andrew Pulliam, EVP Acquisitions |
Cynthia Fisher |
Tara Innes |
Stuart Burns, EVP Government Relations |
Brian Colantuoni, CAO |
Scott Freeman |
|
Nick Nimerala, SVP Chief Asset Officer |
Christopher Wang, EVP Acquisitions |
|
|
Equity Research Coverage |
|
|
|
|
|
Citigroup |
Raymond James & Associates |
RBC Capital Markets |
Seth Bergey & Nick Joseph |
Jonathan Hughes |
Michael Carroll |
212-816-2066 & 212-816-1909 |
727-567-2438 |
440-715-2649 |
|
|
|
Jefferies |
Truist Securities |
Compass Point Research & Trading, LLC |
Joe Dickstein |
Michael R. Lewis |
Merrill Ross |
212-778-8771 |
212-319-5659 |
202-534-1392 |
|
|
|
BMO Capital Markets |
|
|
John P. Kim |
|
|
212-885-4115 |
|
|
Any opinions, estimates, forecasts or predictions regarding Easterly Government Properties, Inc.’s performance made by these analysts are theirs alone and do not represent opinions, estimates, forecasts or predictions of Easterly Government Properties, Inc. or its management. Easterly Government Properties, Inc. does not by its reference above or distribution imply its endorsement of or concurrence with such opinions, estimates, forecasts or predictions.
7
Executive Summary (In thousands, except share and per share amounts) |
|
|
|
Outstanding Classes of Stock and Partnership Units - Fully Diluted Basis |
At September 30, 2025 |
|
|
Earnings |
Three months ended September 30, 2025 |
|
Three months ended September 30, 2024 |
|
|||
Common shares |
|
46,047,193 |
|
|
Net income available to Easterly Government Properties, Inc. |
$ |
1,213 |
|
$ |
4,863 |
|
Unvested restricted shares |
|
61,186 |
|
|
Net income available to Easterly Government Properties, Inc. |
|
|
|
|
||
Common partnership and vested LTIP units |
|
1,774,405 |
|
|
per share: |
|
|
|
|
||
Total - fully diluted basis |
|
47,882,784 |
|
|
Basic |
$ |
0.02 |
|
$ |
0.11 |
|
|
|
|
|
Diluted |
$ |
0.02 |
|
$ |
0.11 |
|
|
|
|
|
|
|
|
|
|
|
|||
Market Capitalization |
At September 30, 2025 |
|
|
Net income |
$ |
1,247 |
|
$ |
5,115 |
|
|
Price of Common Shares |
$ |
22.93 |
|
|
Net income, per share - fully diluted basis |
$ |
0.03 |
|
$ |
0.12 |
|
Total equity market capitalization - fully diluted basis |
$ |
1,097,952 |
|
|
Funds From Operations (FFO) |
$ |
34,769 |
|
$ |
30,634 |
|
Net Debt |
$ |
1,642,281 |
|
|
FFO, per share - fully diluted basis |
$ |
0.74 |
|
$ |
0.71 |
|
Total enterprise value |
$ |
2,740,233 |
|
|
|
|
|
|
|
||
|
|
|
|
Core FFO |
$ |
35,623 |
|
$ |
32,172 |
|
|
|
|
|
|
Core FFO, per share - fully diluted basis |
$ |
0.76 |
|
$ |
0.74 |
|
|
Ratios |
At September 30, 2025 |
|
|
|
|
|
|
|
|||
Net debt to total enterprise value |
|
59.9 |
% |
|
Cash Available for Distribution (CAD) |
$ |
29,300 |
|
$ |
25,102 |
|
Net debt to annualized quarterly EBITDA |
|
7.6 |
x |
|
|
|
|
|
|
||
Adjusted Net Debt to annualized quarterly pro forma EBITDA |
|
7.2 |
x |
|
Liquidity |
At September 30, 2025 |
|
||||
Cash interest coverage ratio |
|
3.0 |
x |
|
Cash and cash equivalents |
|
|
$ |
6,397 |
|
|
Cash fixed charge coverage ratio |
|
2.8 |
x |
|
Available under $400 million senior unsecured 2024 revolving credit facility(1) |
|
$ |
228,975 |
|
||
|
|
|
|
|
|
|
|
|
|||
(1) 2024 revolving credit facility has an accordion feature that provides additional capacity, subject to syndication of the increase and the satisfaction of customary terms and conditions, of up to $300 million, for a total revolving credit facility size of not more than $700 million.
8
Balance Sheets (Unaudited, in thousands, except share amounts) |
|
|
|
|
|
September 30, 2025 |
|
|
December 31, 2024 |
|
||
Assets |
|
|
|
|
|
|
||
Real estate properties, net |
|
$ |
2,709,517 |
|
|
$ |
2,572,095 |
|
Cash and cash equivalents |
|
|
4,355 |
|
|
|
19,353 |
|
Restricted cash |
|
|
9,854 |
|
|
|
8,451 |
|
Tenant accounts receivable |
|
|
65,784 |
|
|
|
71,172 |
|
Investment in unconsolidated real estate venture |
|
|
306,526 |
|
|
|
316,521 |
|
Real estate loan receivable, net |
|
|
34,792 |
|
|
|
34,081 |
|
Intangible assets, net |
|
|
190,652 |
|
|
|
161,425 |
|
Interest rate swaps |
|
|
- |
|
|
|
717 |
|
Prepaid expenses and other assets |
|
|
59,949 |
|
|
|
39,256 |
|
Total assets |
|
$ |
3,381,429 |
|
|
$ |
3,223,071 |
|
|
|
|
|
|
|
|
||
Liabilities |
|
|
|
|
|
|
||
Revolving credit facility |
|
|
170,900 |
|
|
|
274,550 |
|
Term loan facilities, net |
|
|
296,971 |
|
|
|
274,009 |
|
Notes payable, net |
|
|
1,018,640 |
|
|
|
894,676 |
|
Mortgage notes payable, net |
|
|
152,316 |
|
|
|
155,586 |
|
Intangible liabilities, net |
|
|
12,636 |
|
|
|
14,885 |
|
Deferred revenue |
|
|
220,529 |
|
|
|
120,977 |
|
Interest rate swaps |
|
|
3,046 |
|
|
|
- |
|
Accounts payable, accrued expenses and other liabilities |
|
|
121,568 |
|
|
|
101,271 |
|
Total liabilities |
|
|
1,996,606 |
|
|
|
1,835,954 |
|
|
|
|
|
|
|
|
||
Equity |
|
|
|
|
|
|
||
Common stock, par value $0.01, 80,000,000 shares authorized, |
|
|
461 |
|
|
|
432 |
|
Additional paid-in capital(1) |
|
|
1,952,689 |
|
|
|
1,874,193 |
|
Retained earnings |
|
|
140,265 |
|
|
|
131,854 |
|
Cumulative dividends |
|
|
(755,273 |
) |
|
|
(686,044 |
) |
Accumulated other comprehensive income (loss) |
|
|
(4,641 |
) |
|
|
683 |
|
Total stockholders' equity |
|
|
1,333,501 |
|
|
|
1,321,118 |
|
Non-controlling interest in Operating Partnership |
|
|
51,322 |
|
|
|
65,999 |
|
Total equity |
|
|
1,384,823 |
|
|
|
1,387,117 |
|
Total liabilities and equity |
|
$ |
3,381,429 |
|
|
$ |
3,223,071 |
|
|
|
|
|
|
|
|
||
(1) As of December 31, 2024, the Company reclassified $0.6 million from Common Stock to Additional Paid-in-Capital due to the reduction in shares outstanding in connection with the Reverse Stock Split effective April 28, 2025.
9
Income Statements (Unaudited, in thousands, except share and per share amounts) |
|
|
|
|
|
Three Months Ended |
|
|
Nine Months Ended |
|
||||||||||
|
|
September 30, 2025 |
|
|
September 30, 2024 |
|
|
September 30, 2025 |
|
|
September 30, 2024 |
|
||||
Revenues |
|
|
|
|
|
|
|
|
|
|
|
|
||||
Rental income |
|
$ |
82,210 |
|
|
$ |
72,536 |
|
|
$ |
238,123 |
|
|
$ |
215,465 |
|
Tenant reimbursements |
|
|
1,700 |
|
|
|
663 |
|
|
|
4,621 |
|
|
|
4,494 |
|
Asset management income |
|
|
623 |
|
|
|
579 |
|
|
|
1,867 |
|
|
|
1,680 |
|
Other income |
|
|
1,618 |
|
|
|
1,003 |
|
|
|
4,449 |
|
|
|
2,163 |
|
Total revenues |
|
|
86,151 |
|
|
|
74,781 |
|
|
|
249,060 |
|
|
|
223,802 |
|
|
|
|
|
|
|
|
|
|
|
|
|
|
||||
Expenses |
|
|
|
|
|
|
|
|
|
|
|
|
||||
Property operating |
|
|
20,715 |
|
|
|
16,710 |
|
|
|
57,724 |
|
|
|
51,420 |
|
Real estate taxes |
|
|
8,814 |
|
|
|
8,000 |
|
|
|
25,257 |
|
|
|
24,072 |
|
Depreciation and amortization |
|
|
28,946 |
|
|
|
23,795 |
|
|
|
84,277 |
|
|
|
71,681 |
|
Acquisition costs |
|
|
293 |
|
|
|
600 |
|
|
|
962 |
|
|
|
1,427 |
|
Corporate general and administrative |
|
|
5,808 |
|
|
|
4,667 |
|
|
|
18,830 |
|
|
|
18,032 |
|
Provision for (recovery of) credit losses |
|
|
302 |
|
|
|
1,260 |
|
|
|
(475 |
) |
|
|
1,478 |
|
Total expenses |
|
|
64,878 |
|
|
|
55,032 |
|
|
|
186,575 |
|
|
|
168,110 |
|
|
|
|
|
|
|
|
|
|
|
|
|
|
||||
Other income (expense) |
|
|
|
|
|
|
|
|
|
|
|
|
||||
Income from unconsolidated real estate venture |
|
|
1,556 |
|
|
|
1,575 |
|
|
|
5,218 |
|
|
|
4,367 |
|
Interest expense, net |
|
|
(19,037 |
) |
|
|
(16,209 |
) |
|
|
(56,374 |
) |
|
|
(45,210 |
) |
Impairment loss |
|
|
(2,545 |
) |
|
|
- |
|
|
|
(2,545 |
) |
|
|
- |
|
Net income |
|
|
1,247 |
|
|
|
5,115 |
|
|
|
8,784 |
|
|
|
14,849 |
|
|
|
|
|
|
|
|
|
|
|
|
|
|
||||
Non-controlling interest in Operating Partnership |
|
|
(34 |
) |
|
|
(252 |
) |
|
|
(373 |
) |
|
|
(749 |
) |
Net income available to Easterly Government |
|
|
|
|
|
|
|
|
|
|
|
|
||||
Properties, Inc. |
|
$ |
1,213 |
|
|
$ |
4,863 |
|
|
$ |
8,411 |
|
|
$ |
14,100 |
|
|
|
|
|
|
|
|
|
|
|
|
|
|
||||
Net income available to Easterly Government |
|
|
|
|
|
|
|
|
|
|
|
|
||||
Properties, Inc. per share: |
|
|
|
|
|
|
|
|
|
|
|
|
||||
Basic |
|
$ |
0.02 |
|
|
$ |
0.11 |
|
|
$ |
0.18 |
|
|
$ |
0.33 |
|
Diluted |
|
$ |
0.02 |
|
|
$ |
0.11 |
|
|
$ |
0.18 |
|
|
$ |
0.33 |
|
|
|
|
|
|
|
|
|
|
|
|
|
|
||||
Weighted-average common shares outstanding: |
|
|
|
|
|
|
|
|
|
|
|
|
||||
Basic |
|
|
45,337,184 |
|
|
|
41,406,098 |
|
|
|
44,532,044 |
|
|
|
41,068,552 |
|
Diluted |
|
|
45,485,375 |
|
|
|
41,561,832 |
|
|
|
44,650,747 |
|
|
|
41,192,398 |
|
|
|
|
|
|
|
|
|
|
|
|
|
|
||||
Net income, per share - fully diluted basis |
|
$ |
0.03 |
|
|
$ |
0.12 |
|
|
$ |
0.19 |
|
|
$ |
0.34 |
|
|
|
|
|
|
|
|
|
|
|
|
|
|
||||
Weighted average common shares outstanding - |
|
|
|
|
|
|
|
|
|
|
|
|
||||
fully diluted basis |
|
|
47,169,281 |
|
|
|
43,395,442 |
|
|
|
46,551,029 |
|
|
|
43,265,186 |
|
10
Net Operating Income (Unaudited, in thousands) |
|
|
|
|
|
Three Months Ended |
|
|
Nine Months Ended |
|
||||||||||
|
|
September 30, 2025 |
|
|
September 30, 2024 |
|
|
September 30, 2025 |
|
|
September 30, 2024 |
|
||||
|
|
|
|
|
|
|
|
|
|
|
|
|
||||
Net income |
|
$ |
1,247 |
|
|
$ |
5,115 |
|
|
$ |
8,784 |
|
|
$ |
14,849 |
|
Depreciation and amortization |
|
|
28,946 |
|
|
|
23,795 |
|
|
|
84,277 |
|
|
|
71,681 |
|
Acquisition costs |
|
|
293 |
|
|
|
600 |
|
|
|
962 |
|
|
|
1,427 |
|
Corporate general and administrative |
|
|
5,808 |
|
|
|
4,667 |
|
|
|
18,830 |
|
|
|
18,032 |
|
Provision for (recovery of) credit losses |
|
|
302 |
|
|
|
1,260 |
|
|
|
(475 |
) |
|
|
1,478 |
|
Interest expense |
|
|
19,037 |
|
|
|
16,209 |
|
|
|
56,374 |
|
|
|
45,210 |
|
Impairment loss |
|
|
2,545 |
|
|
|
- |
|
|
|
2,545 |
|
|
|
- |
|
Unconsolidated real estate venture allocated share of above adjustments |
|
|
2,365 |
|
|
|
2,038 |
|
|
|
7,086 |
|
|
|
6,194 |
|
Net Operating Income |
|
|
60,543 |
|
|
|
53,684 |
|
|
|
178,383 |
|
|
|
158,871 |
|
Adjustments to Net Operating Income: |
|
|
|
|
|
|
|
|
|
|
|
|
||||
Straight-line rent and other non-cash adjustments |
|
|
(317 |
) |
|
|
(1,336 |
) |
|
|
(332 |
) |
|
|
(3,087 |
) |
Amortization of above-/below-market leases |
|
|
(421 |
) |
|
|
(390 |
) |
|
|
(1,427 |
) |
|
|
(1,464 |
) |
Amortization of deferred revenue |
|
|
(1,892 |
) |
|
|
(1,762 |
) |
|
|
(5,517 |
) |
|
|
(5,125 |
) |
Unconsolidated real estate venture allocated share of above adjustments |
|
|
26 |
|
|
|
(4 |
) |
|
|
74 |
|
|
|
44 |
|
Cash Net Operating Income |
|
$ |
57,939 |
|
|
$ |
50,192 |
|
|
$ |
171,181 |
|
|
$ |
149,239 |
|
11
EBITDA (Unaudited, in thousands) |
|
|
|
|
|
Three Months Ended |
|
|
Nine Months Ended |
|
||||||||||
|
|
September 30, 2025 |
|
|
September 30, 2024 |
|
|
September 30, 2025 |
|
|
September 30, 2024 |
|
||||
Net income |
|
$ |
1,247 |
|
|
$ |
5,115 |
|
|
$ |
8,784 |
|
|
$ |
14,849 |
|
Depreciation and amortization |
|
|
28,946 |
|
|
|
23,795 |
|
|
|
84,277 |
|
|
|
71,681 |
|
Interest expense |
|
|
19,037 |
|
|
|
16,209 |
|
|
|
56,374 |
|
|
|
45,210 |
|
Tax expense |
|
|
79 |
|
|
|
(431 |
) |
|
|
435 |
|
|
|
(458 |
) |
Impairment loss |
|
|
2,545 |
|
|
|
- |
|
|
|
2,545 |
|
|
|
- |
|
Unconsolidated real estate venture allocated share of above adjustments |
|
|
2,323 |
|
|
|
1,999 |
|
|
|
7,005 |
|
|
|
6,154 |
|
EBITDA |
|
$ |
54,177 |
|
|
$ |
46,687 |
|
|
$ |
159,420 |
|
|
$ |
137,436 |
|
|
|
|
|
|
|
|
|
|
|
|
|
|
||||
Pro forma adjustments(1) |
|
|
643 |
|
|
|
|
|
|
|
|
|
|
|||
Pro forma EBITDA |
|
$ |
54,820 |
|
|
|
|
|
|
|
|
|
|
|||
(1) Pro forma assuming a full quarter of operations from the one operating property acquired in the third quarter of 2025 and as if the one property disposed of in the third quarter of 2025 were disposed of at the beginning of the quarter.
12
FFO and CAD (Unaudited, in thousands, except share and per share amounts) |
|
|
|
|
|
Three Months Ended |
|
|
Nine Months Ended |
|
||||||||||
|
|
September 30, 2025 |
|
|
September 30, 2024 |
|
|
September 30, 2025 |
|
|
September 30, 2024 |
|
||||
|
|
|
|
|
|
|
|
|
|
|
|
|
||||
Net income |
|
$ |
1,247 |
|
|
$ |
5,115 |
|
|
$ |
8,784 |
|
|
$ |
14,849 |
|
Depreciation of real estate assets |
|
|
28,695 |
|
|
|
23,543 |
|
|
|
83,523 |
|
|
|
70,926 |
|
Impairment loss |
|
|
2,545 |
|
|
|
- |
|
|
|
2,545 |
|
|
|
- |
|
Unconsolidated real estate venture allocated share of above adjustments |
|
|
2,282 |
|
|
|
1,976 |
|
|
|
6,841 |
|
|
|
5,984 |
|
FFO |
|
$ |
34,769 |
|
|
$ |
30,634 |
|
|
$ |
101,693 |
|
|
$ |
91,759 |
|
Adjustments to FFO: |
|
|
|
|
|
|
|
|
|
|
|
|
||||
Loss on extinguishment of debt and modification costs |
|
$ |
241 |
|
|
$ |
2 |
|
|
$ |
1,141 |
|
|
$ |
260 |
|
Provision for (recovery of) credit losses |
|
|
302 |
|
|
|
1,260 |
|
|
|
(475 |
) |
|
|
1,478 |
|
Natural disaster event expense, net of recovery |
|
|
44 |
|
|
|
7 |
|
|
|
114 |
|
|
|
(1 |
) |
Depreciation of non-real estate assets |
|
|
251 |
|
|
|
252 |
|
|
|
754 |
|
|
|
755 |
|
Unconsolidated real estate venture allocated share of above adjustments |
|
|
16 |
|
|
|
17 |
|
|
|
49 |
|
|
|
50 |
|
Core FFO |
|
$ |
35,623 |
|
|
$ |
32,172 |
|
|
$ |
103,276 |
|
|
$ |
94,301 |
|
|
|
|
|
|
|
|
|
|
|
|
|
|
||||
FFO, per share - fully diluted basis |
|
$ |
0.74 |
|
|
$ |
0.71 |
|
|
$ |
2.18 |
|
|
$ |
2.12 |
|
Core FFO, per share - fully diluted basis |
|
$ |
0.76 |
|
|
$ |
0.74 |
|
|
$ |
2.22 |
|
|
$ |
2.18 |
|
|
|
|
|
|
|
|
|
|
|
|
|
|
||||
Core FFO |
|
$ |
35,623 |
|
|
$ |
32,172 |
|
|
$ |
103,276 |
|
|
$ |
94,301 |
|
Straight-line rent and other non-cash adjustments |
|
|
(337 |
) |
|
|
(1,349 |
) |
|
|
(386 |
) |
|
|
(3,123 |
) |
Amortization of above-/below-market leases |
|
|
(421 |
) |
|
|
(390 |
) |
|
|
(1,427 |
) |
|
|
(1,464 |
) |
Amortization of deferred revenue |
|
|
(1,892 |
) |
|
|
(1,762 |
) |
|
|
(5,517 |
) |
|
|
(5,125 |
) |
Non-cash interest expense |
|
|
855 |
|
|
|
662 |
|
|
|
2,470 |
|
|
|
1,358 |
|
Non-cash compensation |
|
|
1,633 |
|
|
|
(180 |
) |
|
|
4,449 |
|
|
|
2,209 |
|
Natural Disaster event expense, net of recovery |
|
|
(44 |
) |
|
|
(7 |
) |
|
|
(114 |
) |
|
|
1 |
|
Principal amortization |
|
|
(1,156 |
) |
|
|
(1,093 |
) |
|
|
(3,420 |
) |
|
|
(3,288 |
) |
Maintenance capital expenditures |
|
|
(2,897 |
) |
|
|
(2,672 |
) |
|
|
(6,902 |
) |
|
|
(8,209 |
) |
Contractual tenant improvements |
|
|
(2,060 |
) |
|
|
(287 |
) |
|
|
(2,672 |
) |
|
|
(860 |
) |
Unconsolidated real estate venture allocated share of above adjustments |
|
|
(4 |
) |
|
|
8 |
|
|
|
(14 |
) |
|
|
(7 |
) |
Cash Available for Distribution (CAD) |
|
$ |
29,300 |
|
|
$ |
25,102 |
|
|
$ |
89,743 |
|
|
$ |
75,793 |
|
|
|
|
|
|
|
|
|
|
|
|
|
|
||||
Weighted average common shares outstanding - fully diluted basis |
|
|
47,169,281 |
|
|
|
43,395,442 |
|
|
|
46,551,029 |
|
|
|
43,265,186 |
|
13
Unconsolidated Real Estate Venture
(Unaudited, in thousands)
|
Balance Sheet Information |
Balance Sheet |
|
|
Easterly's Share(2) |
|
||
|
September 30, 2025 |
|
|
September 30, 2025 |
|
||
Real estate properties - net |
$ |
492,867 |
|
|
$ |
261,220 |
|
Total assets |
|
590,250 |
|
|
|
312,833 |
|
Total liabilities |
|
12,481 |
|
|
|
6,616 |
|
Total preferred stockholders' equity |
|
125 |
|
|
|
66 |
|
Total common stockholders' equity |
|
577,644 |
|
|
|
306,151 |
|
Basis difference(1) |
|
- |
|
|
|
375 |
|
Total equity |
$ |
577,769 |
|
|
$ |
306,526 |
|
(1) This amount represents the aggregate difference between the Company’s historical cost basis and basis reflected at the joint venture level.
(2) The Company owns 53.0% of the properties through the unconsolidated joint venture.
14
Unconsolidated Real Estate Venture (Cont.) (Unaudited, in thousands) |
|
|
|
Income Statement Information |
Three Months Ended |
|
|
Easterly's Share(1) |
|
|
Nine Months Ended |
|
|
Easterly's Share(1) |
|
||||
|
September 30, 2025 |
|
|
September 30, 2025 |
|
|
September 30, 2025 |
|
|
September 30, 2025 |
|
||||
Revenues |
|
|
|
|
|
|
|
|
|
|
|
||||
Rental income |
$ |
12,647 |
|
|
$ |
6,702 |
|
|
$ |
37,864 |
|
|
$ |
20,067 |
|
Other income |
|
43 |
|
|
|
23 |
|
|
|
122 |
|
|
|
65 |
|
Total Revenues |
|
12,690 |
|
|
|
6,725 |
|
|
|
37,986 |
|
|
|
20,132 |
|
Operating expenses |
|
|
|
|
|
|
|
|
|
|
|
||||
Property operating |
|
3,102 |
|
|
|
1,644 |
|
|
|
8,271 |
|
|
|
4,384 |
|
Real estate taxes |
|
1,568 |
|
|
|
831 |
|
|
|
4,635 |
|
|
|
2,457 |
|
Depreciation and amortization |
|
4,336 |
|
|
|
2,299 |
|
|
|
12,999 |
|
|
|
6,891 |
|
Acquisition costs |
|
- |
|
|
|
- |
|
|
|
5 |
|
|
|
3 |
|
Asset management fees |
|
623 |
|
|
|
330 |
|
|
|
1,866 |
|
|
|
989 |
|
Corporate general and administrative |
|
80 |
|
|
|
43 |
|
|
|
235 |
|
|
|
124 |
|
Total expenses |
|
9,709 |
|
|
|
5,147 |
|
|
|
28,011 |
|
|
|
14,848 |
|
Other expenses |
|
|
|
|
|
|
|
|
|
|
|
||||
Interest expense |
|
(41 |
) |
|
|
(22 |
) |
|
|
(123 |
) |
|
|
(66 |
) |
Net income |
$ |
2,940 |
|
|
$ |
1,556 |
|
|
$ |
9,852 |
|
|
$ |
5,218 |
|
|
|
|
|
|
|
|
|
|
|
|
|
||||
Depreciation and amortization |
|
4,336 |
|
|
|
2,299 |
|
|
|
12,999 |
|
|
|
6,891 |
|
Interest expense |
|
41 |
|
|
|
22 |
|
|
|
123 |
|
|
|
66 |
|
Tax expense |
|
2 |
|
|
|
1 |
|
|
|
89 |
|
|
|
47 |
|
EBITDA |
$ |
7,319 |
|
|
$ |
3,878 |
|
|
$ |
23,063 |
|
|
$ |
12,222 |
|
|
|
|
|
|
|
|
|
|
|
|
|
||||
Net income |
$ |
2,940 |
|
|
$ |
1,556 |
|
|
$ |
9,852 |
|
|
$ |
5,218 |
|
Depreciation of real estate assets |
|
4,306 |
|
|
|
2,282 |
|
|
|
12,907 |
|
|
|
6,841 |
|
FFO |
$ |
7,246 |
|
|
$ |
3,838 |
|
|
$ |
22,759 |
|
|
$ |
12,059 |
|
Adjustments to FFO: |
|
|
|
|
|
|
|
|
|
|
|
||||
Depreciation of non-real estate assets |
|
31 |
|
|
|
16 |
|
|
|
93 |
|
|
|
49 |
|
Core FFO |
$ |
7,277 |
|
|
$ |
3,854 |
|
|
$ |
22,852 |
|
|
$ |
12,108 |
|
Adjustments to Core FFO: |
|
|
|
|
|
|
|
|
|
|
|
||||
Straight-line rent and other non-cash adjustments |
|
47 |
|
|
|
25 |
|
|
|
139 |
|
|
|
74 |
|
Non-cash interest expense |
|
41 |
|
|
|
22 |
|
|
|
123 |
|
|
|
65 |
|
Maintenance capital expenditures |
|
(96 |
) |
|
|
(51 |
) |
|
|
(235 |
) |
|
|
(125 |
) |
Contractual tenant improvements |
|
- |
|
|
|
- |
|
|
|
(52 |
) |
|
|
(28 |
) |
Cash Available for Distribution (CAD) |
$ |
7,269 |
|
|
$ |
3,850 |
|
|
$ |
22,827 |
|
|
$ |
12,094 |
|
(1) The Company owns 53.0% of the properties through the unconsolidated joint venture.
15
Debt Schedules (Unaudited, in thousands) |
|
|
|
Debt Instrument |
Maturity Date |
|
September 30, 2025 |
September 30, 2025 |
|
September 30, 2025 |
|
Unsecured debt |
|
|
|
|
|
|
|
2024 Revolving Credit facility |
3-Jun-28(2) |
|
S + 155 bps |
|
170,900 |
|
10.4% |
2016 Term Loan facility |
28-Jan-28(3) |
|
5.36%(4) |
|
100,000 |
|
6.1% |
2018 Term Loan facility |
21-Aug-28(5) |
|
5.19%(6) |
|
200,000 |
|
12.1% |
2017 Series A Senior Notes |
25-May-27 |
|
4.05% |
|
95,000 |
|
5.8% |
2017 Series B Senior Notes |
25-May-29 |
|
4.15% |
|
50,000 |
|
3.0% |
2017 Series C Senior Notes |
25-May-32 |
|
4.30% |
|
30,000 |
|
1.8% |
2019 Series A Senior Notes |
12-Sep-29 |
|
3.73% |
|
85,000 |
|
5.2% |
2019 Series B Senior Notes |
12-Sep-31 |
|
3.83% |
|
100,000 |
|
6.1% |
2019 Series C Senior Notes |
12-Sep-34 |
|
3.98% |
|
90,000 |
|
5.5% |
2021 Series A Senior Notes |
14-Oct-28 |
|
2.62% |
|
50,000 |
|
3.0% |
2021 Series B Senior Notes |
14-Oct-30 |
|
2.89% |
|
200,000 |
|
12.1% |
2024 Series A Senior Notes |
28-May-33 |
|
6.56% |
|
150,000 |
|
9.1% |
2024 Series B Senior Notes |
13-Aug-33 |
|
6.56% |
|
50,000 |
|
3.0% |
2025 Series A Senior Notes |
20-Mar-30 |
|
6.13% |
|
25,000 |
|
1.5% |
2025 Series B Senior Notes |
20-Mar-32 |
|
6.33%(7) |
|
100,000 |
|
6.1% |
Total unsecured debt |
4.7 years(8) |
|
4.77% |
$ |
1,495,900 |
|
90.8% |
|
(wtd-avg maturity) |
|
(wtd-avg rate) |
|
|
|
|
|
|
|
|
|
|
|
|
Secured mortgage debt |
|
|
|
|
|
|
|
USFS II - Albuquerque |
14-Jul-26 |
|
4.46% |
|
8,044 |
|
0.5% |
ICE - Charleston |
15-Jan-27 |
|
4.21% |
|
9,319 |
|
0.6% |
VA - Loma Linda |
6-Jul-27 |
|
3.59% |
|
127,500 |
|
7.7% |
CBP - Savannah |
10-Jul-33 |
|
3.40% |
|
8,015 |
|
0.4% |
Total secured mortgage debt |
2.0 years |
|
3.66% |
$ |
152,878 |
|
9.2% |
|
(wtd-avg maturity) |
|
(wtd-avg rate) |
|
|
|
|
(1) Excludes unamortized premiums / discounts and deferred financing fees.
(2) 2024 revolving credit facility has two six-month as-of-right extension options, subject to certain conditions and the payment of an extension fee.
(3) 2016 term loan facility has two one-year as-of-right extension options, subject to certain conditions and the payment of an extension fee.
(4) Calculated based on three interest rate swaps with a total notional value of $100.0 million, which effectively fixes the interest rate at 5.36% annually based on the Company’s current consolidated leverage ratio. The interest rate swaps mature on December 23, 2027, which is not coterminous with the maturity date of the 2016 term loan facility.
(5) 2018 term loan facility has two one-year as-of-right extension options, subject to certain conditions and the payment of an extension fee.
(6) Calculated based on three interest rate swaps with an aggregate notional value of $200.0 million, which effectively fixes the interest rate at 5.19% annually based on the Company’s current consolidated leverage ratio. The three interest rate swaps mature on April 1, 2028, July 1, 2028 and July 1, 2028, none of which are coterminous with the maturity date of the 2018 term loan facility.
(7) We entered into two $50.0 million treasury lock agreements to fix the Treasury rate of our 2025 series B senior notes.
(8) Assuming the as-of-right extension options are exercised on our 2024 revolving credit facility, 2016 term loan facility and 2018 term loan facility, the weighted-average maturity of our unsecured debt is 5.2 years.
16
Debt Schedules (Cont.) (Unaudited, in thousands) |
|
|
|
Debt Statistics |
September 30, 2025 |
|
|
|
|
September 30, 2025 |
|
||
Variable rate debt - unhedged |
$ |
170,900 |
|
|
% Variable rate debt - unhedged |
|
10.4 |
% |
|
Fixed rate debt |
|
1,477,878 |
|
|
% Fixed rate debt(3) |
|
89.6 |
% |
|
Total Debt(1) |
$ |
1,648,778 |
|
|
|
|
|
|
|
Less: cash and cash equivalents |
|
(6,397 |
) |
|
Weighted average maturity |
4.4 years |
|
||
Less: property acquisition closing escrow, net of deposit |
|
(100 |
) |
|
Weighted average interest rate |
|
4.7 |
% |
|
Net Debt |
$ |
1,642,281 |
|
|
|
|
|
|
|
Less: Adjustment for development(2) |
|
(56,902 |
) |
|
|
|
|
|
|
Adjusted Net Debt |
$ |
1,585,379 |
|
|
|
|
|
|
|
(1) Excludes unamortized premiums / discounts and deferred financing fees.
(2) See definition of Adjusted Net Debt on Page 4.
(3) Includes the Company's secured mortgage debt and 2016 and 2018 term loan facilities, which are effectively swapped to fixed interest rates. Note the associated swaps are not coterminous with maturity dates of the respective term loan facilities. See Page 16 for further detail.
17
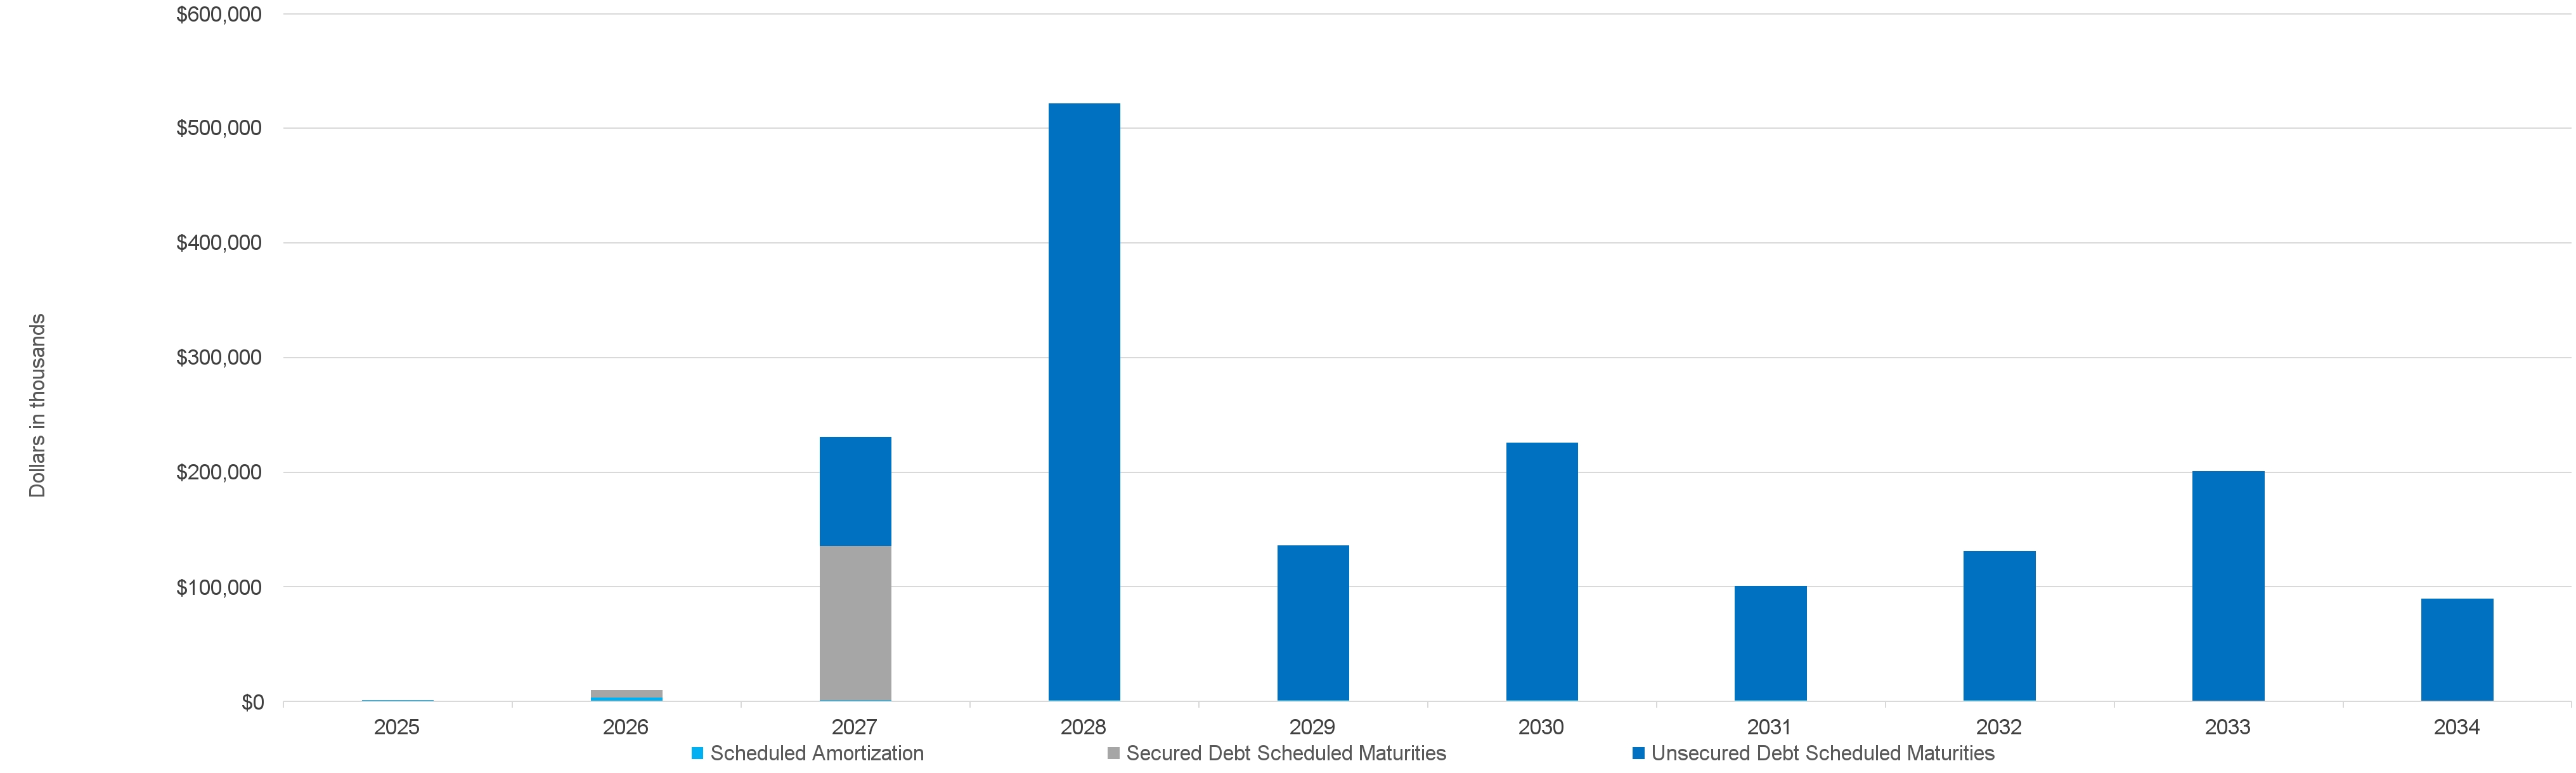
Debt Maturities (Unaudited, in thousands) |
|
|
|
|
|
Secured Debt |
|
|
Unsecured Debt |
|
|
|
|
|
|
|
|
|
|
|||||||||
Year |
|
Scheduled |
|
|
Scheduled |
|
|
Scheduled |
|
|
Total |
|
|
Percentage of |
|
|
Weighted Average |
|
||||||
2025 |
|
|
1,178 |
|
|
|
- |
|
|
|
- |
|
|
|
1,178 |
|
|
|
0.0 |
% |
|
|
0.00 |
% |
2026 |
|
|
3,686 |
|
|
|
6,368 |
|
|
|
- |
|
|
|
10,054 |
|
|
|
0.4 |
% |
|
|
4.46 |
% |
2027 |
|
|
1,093 |
|
|
|
134,640 |
|
|
|
95,000 |
|
|
|
230,733 |
|
|
|
14.0 |
% |
|
|
3.80 |
% |
2028 |
|
|
983 |
|
|
|
- |
|
|
|
520,900 |
|
|
|
521,883 |
|
|
|
31.8 |
% |
|
|
5.13 |
% |
2029 |
|
|
1,016 |
|
|
|
- |
|
|
|
135,000 |
|
|
|
136,016 |
|
|
|
8.2 |
% |
|
|
3.89 |
% |
2030 |
|
|
1,049 |
|
|
|
- |
|
|
|
225,000 |
|
|
|
226,049 |
|
|
|
13.7 |
% |
|
|
3.25 |
% |
2031 |
|
|
1,081 |
|
|
|
- |
|
|
|
100,000 |
|
|
|
101,081 |
|
|
|
6.1 |
% |
|
|
3.83 |
% |
2032 |
|
|
1,116 |
|
|
|
- |
|
|
|
130,000 |
|
|
|
131,116 |
|
|
|
7.9 |
% |
|
|
5.86 |
% |
2033 |
|
|
668 |
|
|
|
- |
|
|
|
200,000 |
|
|
|
200,668 |
|
|
|
12.3 |
% |
|
|
6.44 |
% |
2034 |
|
|
- |
|
|
|
- |
|
|
|
90,000 |
|
|
|
90,000 |
|
|
|
5.6 |
% |
|
|
3.98 |
% |
Total |
|
$ |
11,870 |
|
|
$ |
141,008 |
|
|
$ |
1,495,900 |
|
|
$ |
1,648,778 |
|
|
|
100.0 |
% |
|
|
|
|
18
Leased Operating Property Overview (As of September 30, 2025, unaudited) |
|
|
|
Property Name |
|
Location |
|
Property Type |
|
Tenant |
|
Year Built / |
|
Leased |
|
|
Annualized |
|
|
Percentage |
|
|
Annualized |
|
||||
|
|
|
|
|
|
|
|
|
|
|
|
|
|
|
|
|
|
|
|
|
||||
Wholly Owned U.S. Government Leased Properties |
|
|||||||||||||||||||||||
VA - Loma Linda |
|
Loma Linda, CA |
|
Outpatient Clinic |
|
2036 |
|
2016 |
|
|
327,614 |
|
|
$ |
16,774,664 |
|
|
|
4.4 |
% |
|
$ |
51.20 |
|
USCIS - Kansas City |
|
Lee's Summit, MO |
|
Office |
|
2028 - 2042(1) |
|
1969 / 1999 |
|
|
417,945 |
|
|
|
10,502,950 |
|
|
|
2.8 |
% |
|
|
25.13 |
|
JSC - Suffolk |
|
Suffolk, VA |
|
Specialized Facility |
|
2028(2) |
|
1993 / 2004 |
|
|
403,737 |
|
|
|
8,556,069 |
|
|
|
2.3 |
% |
|
|
21.19 |
|
Various GSA - Chicago |
|
Des Plaines, IL |
|
Office |
|
2026 |
|
1971 / 1999 |
|
|
188,768 |
|
|
|
7,801,422 |
|
|
|
2.1 |
% |
|
|
41.33 |
|
IRS - Fresno |
|
Fresno, CA |
|
Office |
|
2033 |
|
2003 |
|
|
180,481 |
|
|
|
6,966,712 |
|
|
|
1.9 |
% |
|
|
38.60 |
|
FBI - Salt Lake |
|
Salt Lake City, UT |
|
Specialized Facility |
|
2032 |
|
2012 |
|
|
169,542 |
|
|
|
6,839,099 |
|
|
|
1.8 |
% |
|
|
40.34 |
|
Various GSA - Buffalo |
|
Buffalo, NY |
|
Office |
|
2026 - 2039 |
|
2004 |
|
|
239,924 |
|
|
|
6,315,045 |
|
|
|
1.7 |
% |
|
|
26.32 |
|
Various GSA - Portland |
|
Portland, OR |
|
Office |
|
2025 - 2039(3) |
|
2002 |
|
|
175,214 |
|
|
|
5,926,533 |
|
|
|
1.6 |
% |
|
|
33.82 |
|
VA - San Jose |
|
San Jose, CA |
|
Outpatient Clinic |
|
2038 |
|
2018 |
|
|
90,085 |
|
|
|
5,815,446 |
|
|
|
1.6 |
% |
|
|
64.56 |
|
EPA - Lenexa |
|
Lenexa, KS |
|
Office |
|
2027(2) |
|
2007 / 2012 |
|
|
169,585 |
|
|
|
5,796,626 |
|
|
|
1.5 |
% |
|
|
34.18 |
|
FBI - Tampa |
|
Tampa, FL |
|
Specialized Facility |
|
2040 |
|
2005 |
|
|
138,000 |
|
|
|
5,314,468 |
|
|
|
1.4 |
% |
|
|
38.51 |
|
FBI - San Antonio |
|
San Antonio, TX |
|
Specialized Facility |
|
2025 |
|
2007 |
|
|
148,584 |
|
|
|
5,258,653 |
|
|
|
1.4 |
% |
|
|
35.39 |
|
FDA - Alameda |
|
Alameda, CA |
|
Laboratory |
|
2039 |
|
2019 |
|
|
69,624 |
|
|
|
5,020,369 |
|
|
|
1.3 |
% |
|
|
72.11 |
|
FBI / DEA - El Paso |
|
El Paso, TX |
|
Specialized Facility |
|
2028 |
|
1998 - 2005 |
|
|
203,683 |
|
|
|
4,920,871 |
|
|
|
1.3 |
% |
|
|
24.16 |
|
PTO - Arlington |
|
Arlington, VA |
|
Specialized Facility |
|
2035 |
|
2009 |
|
|
190,546 |
|
|
|
4,773,569 |
|
|
|
1.3 |
% |
|
|
25.05 |
|
USCIS - Lincoln |
|
Lincoln, NE |
|
Office |
|
2026 |
|
2005 |
|
|
137,671 |
|
|
|
4,663,260 |
|
|
|
1.2 |
% |
|
|
33.87 |
|
FEMA - Tracy |
|
Tracy, CA |
|
Warehouse |
|
2038 |
|
2018 |
|
|
210,373 |
|
|
|
4,652,865 |
|
|
|
1.2 |
% |
|
|
22.12 |
|
TREAS - Parkersburg |
|
Parkersburg, WV |
|
Office |
|
2041 |
|
2004 / 2006 |
|
|
182,500 |
|
|
|
4,419,018 |
|
|
|
1.2 |
% |
|
|
24.21 |
|
FDA - Lenexa |
|
Lenexa, KS |
|
Laboratory |
|
2040 |
|
2020 |
|
|
59,690 |
|
|
|
4,342,421 |
|
|
|
1.2 |
% |
|
|
72.75 |
|
FBI - Mobile |
|
Mobile, AL |
|
Specialized Facility |
|
2029(2) |
|
2001 |
|
|
76,112 |
|
|
|
4,293,743 |
|
|
|
1.1 |
% |
|
|
56.41 |
|
ICE - Dallas |
|
Irvine, TX |
|
Specialized Facility |
|
2032 / 2040(4) |
|
2000 / 2020 |
|
|
135,200 |
|
|
|
4,277,647 |
|
|
|
1.1 |
% |
|
|
31.64 |
|
VA - South Bend |
|
Mishakawa, IN |
|
Outpatient Clinic |
|
2032 |
|
2017 |
|
|
86,363 |
|
|
|
4,159,720 |
|
|
|
1.1 |
% |
|
|
48.17 |
|
FBI - Pittsburgh |
|
Pittsburgh, PA |
|
Specialized Facility |
|
2027 |
|
2001 |
|
|
100,054 |
|
|
|
4,153,110 |
|
|
|
1.1 |
% |
|
|
41.51 |
|
FBI - New Orleans |
|
New Orleans, LA |
|
Specialized Facility |
|
2029(5) |
|
1999 / 2006 |
|
|
137,679 |
|
|
|
4,005,179 |
|
|
|
1.1 |
% |
|
|
29.09 |
|
FBI - Omaha |
|
Omaha, NE |
|
Specialized Facility |
|
2044 |
|
2009 |
|
|
112,196 |
|
|
|
3,981,453 |
|
|
|
1.1 |
% |
|
|
35.49 |
|
VA - Mobile |
|
Mobile, AL |
|
Outpatient Clinic |
|
2033 |
|
2018 |
|
|
79,212 |
|
|
|
3,968,533 |
|
|
|
1.1 |
% |
|
|
50.10 |
|
FBI - Albany |
|
Albany, NY |
|
Specialized Facility |
|
2036 |
|
1998 |
|
|
69,476 |
|
|
|
3,592,965 |
|
|
|
1.0 |
% |
|
|
51.72 |
|
FBI - Birmingham |
|
Birmingham, AL |
|
Specialized Facility |
|
2042 |
|
2005 |
|
|
96,278 |
|
|
|
3,592,319 |
|
|
|
1.0 |
% |
|
|
37.31 |
|
EPA - Kansas City |
|
Kansas City, KS |
|
Laboratory |
|
2043 |
|
2003 |
|
|
55,833 |
|
|
|
3,574,925 |
|
|
|
1.0 |
% |
|
|
64.03 |
|
FBI - Knoxville |
|
Knoxville, TN |
|
Specialized Facility |
|
2025 |
|
2010 |
|
|
99,130 |
|
|
|
3,516,228 |
|
|
|
0.9 |
% |
|
|
35.47 |
|
USFS II - Albuquerque |
|
Albuquerque, NM |
|
Office |
|
2031 |
|
2011 |
|
|
98,720 |
|
|
|
3,447,901 |
|
|
|
0.9 |
% |
|
|
34.93 |
|
DOT - Lakewood |
|
Lakewood, CO |
|
Office |
|
2039 |
|
2004 |
|
|
116,046 |
|
|
|
3,404,199 |
|
|
|
0.9 |
% |
|
|
29.33 |
|
ICE - Charleston |
|
North Charleston, SC |
|
Specialized Facility |
|
2027 |
|
1994 / 2012 |
|
|
65,124 |
|
|
|
3,392,940 |
|
|
|
0.9 |
% |
|
|
52.10 |
|
FBI - Richmond |
|
Richmond, VA |
|
Specialized Facility |
|
2041 |
|
2001 |
|
|
96,607 |
|
|
|
3,360,867 |
|
|
|
0.9 |
% |
|
|
34.79 |
|
VA - Chico |
|
Chico, CA |
|
Outpatient Clinic |
|
2034 |
|
2019 |
|
|
51,647 |
|
|
|
3,348,155 |
|
|
|
0.9 |
% |
|
|
64.83 |
|
DEA - Sterling |
|
Sterling, VA |
|
Laboratory |
|
2038 |
|
2001 |
|
|
57,692 |
|
|
|
3,282,887 |
|
|
|
0.9 |
% |
|
|
56.90 |
|
FBI - Little Rock |
|
Little Rock, AR |
|
Specialized Facility |
|
2041 |
|
2001 |
|
|
102,377 |
|
|
|
3,262,032 |
|
|
|
0.9 |
% |
|
|
31.86 |
|
19
Leased Operating Property Overview (Cont.) (As of September 30, 2025, unaudited) |
|
|
|
Property Name |
|
Location |
|
Property Type |
|
Tenant |
|
Year Built / |
|
Leased |
|
|
Annualized |
|
|
Percentage |
|
|
Annualized |
|
||||
|
|
|
|
|
|
|
|
|
|
|
|
|
|
|
|
|
|
|
|
|
||||
Wholly Owned U.S. Government Leased Properties (Cont.) |
|
|||||||||||||||||||||||
USCIS - Tustin |
|
Tustin, CA |
|
Office |
|
2034 |
|
1979 / 2019 |
|
|
66,818 |
|
|
|
3,238,830 |
|
|
|
0.9 |
% |
|
|
48.47 |
|
JUD - Del Rio |
|
Del Rio, TX |
|
Federal Courthouse |
|
2041 |
|
1992 / 2004 |
|
|
89,880 |
|
|
|
3,197,759 |
|
|
|
0.9 |
% |
|
|
35.58 |
|
DEA - Vista |
|
Vista, CA |
|
Laboratory |
|
2035 |
|
2002 |
|
|
52,293 |
|
|
|
3,147,780 |
|
|
|
0.8 |
% |
|
|
60.20 |
|
VA - Indianapolis |
|
Brownsburg, IN |
|
Outpatient Clinic |
|
2041 |
|
2021 |
|
|
80,000 |
|
|
|
2,973,092 |
|
|
|
0.8 |
% |
|
|
37.16 |
|
VA - Orange |
|
Orange, CT |
|
Outpatient Clinic |
|
2034 |
|
2019 |
|
|
56,330 |
|
|
|
2,965,921 |
|
|
|
0.8 |
% |
|
|
52.65 |
|
ICE - Albuquerque |
|
Albuquerque, NM |
|
Specialized Facility |
|
2027 |
|
2011 |
|
|
71,100 |
|
|
|
2,857,704 |
|
|
|
0.8 |
% |
|
|
40.19 |
|
SSA - Charleston |
|
Charleston, WV |
|
Office |
|
2029 |
|
1959 / 2000 |
|
|
110,000 |
|
|
|
2,838,184 |
|
|
|
0.8 |
% |
|
|
25.80 |
|
JUD - El Centro |
|
El Centro, CA |
|
Federal Courthouse |
|
2034 |
|
2004 |
|
|
43,345 |
|
|
|
2,814,240 |
|
|
|
0.8 |
% |
|
|
64.93 |
|
DEA - Dallas Lab |
|
Dallas, TX |
|
Laboratory |
|
2038 |
|
2001 |
|
|
49,723 |
|
|
|
2,805,697 |
|
|
|
0.7 |
% |
|
|
56.43 |
|
DEA - Pleasanton |
|
Pleasanton, CA |
|
Laboratory |
|
2035 |
|
2015 |
|
|
42,480 |
|
|
|
2,788,150 |
|
|
|
0.7 |
% |
|
|
65.63 |
|
DEA - Upper Marlboro |
|
Upper Marlboro, MD |
|
Laboratory |
|
2037 |
|
2002 |
|
|
50,978 |
|
|
|
2,776,446 |
|
|
|
0.7 |
% |
|
|
54.46 |
|
DHS - Burlington |
|
Williston, VT |
|
Specialized Facility |
|
2031(2) |
|
2000 |
|
|
74,549 |
|
|
|
2,738,632 |
|
|
|
0.7 |
% |
|
|
36.74 |
|
NARA - Broomfield |
|
Broomfield, CO |
|
Warehouse |
|
2032 |
|
2012 |
|
|
161,730 |
|
|
|
2,697,002 |
|
|
|
0.7 |
% |
|
|
16.68 |
|
TREAS - Birmingham |
|
Birmingham, AL |
|
Office |
|
2029 |
|
2014 |
|
|
83,676 |
|
|
|
2,632,456 |
|
|
|
0.7 |
% |
|
|
31.46 |
|
DHS - Atlanta |
|
Atlanta, GA |
|
Specialized Facility |
|
2031 - 2038(6) |
|
2008 / 2023 |
|
|
91,185 |
|
|
|
2,590,303 |
|
|
|
0.7 |
% |
|
|
28.41 |
|
USAO - Louisville |
|
Louisville, KY |
|
Specialized Facility |
|
2031 |
|
2011 |
|
|
60,000 |
|
|
|
2,549,994 |
|
|
|
0.7 |
% |
|
|
42.50 |
|
JUD - Charleston |
|
Charleston, SC |
|
Federal Courthouse |
|
2040 |
|
1999 |
|
|
52,339 |
|
|
|
2,536,155 |
|
|
|
0.7 |
% |
|
|
48.46 |
|
JUD - Jackson |
|
Jackson, TN |
|
Federal Courthouse |
|
2043 |
|
1998 |
|
|
75,043 |
|
|
|
2,418,461 |
|
|
|
0.6 |
% |
|
|
32.23 |
|
IRS - Ogden |
|
Ogden, UT |
|
Warehouse |
|
2029(7) |
|
1996 |
|
|
100,000 |
|
|
|
2,373,650 |
|
|
|
0.6 |
% |
|
|
23.74 |
|
Various GSA - Cleveland |
|
Brooklyn Heights, OH |
|
Office |
|
2028 - 2040(8) |
|
1981 / 2021 |
|
|
61,384 |
|
|
|
2,338,869 |
|
|
|
0.6 |
% |
|
|
38.10 |
|
CBP - Savannah |
|
Savannah, GA |
|
Laboratory |
|
2033 |
|
2013 |
|
|
35,000 |
|
|
|
2,306,216 |
|
|
|
0.6 |
% |
|
|
65.89 |
|
DEA - Dallas |
|
Dallas, TX |
|
Specialized Facility |
|
2041 |
|
2001 |
|
|
71,827 |
|
|
|
2,189,642 |
|
|
|
0.6 |
% |
|
|
30.48 |
|
NWS - Kansas City |
|
Kansas City, MO |
|
Specialized Facility |
|
2033(2) |
|
1998 / 2020 |
|
|
94,378 |
|
|
|
2,163,306 |
|
|
|
0.6 |
% |
|
|
22.92 |
|
DEA - Santa Ana |
|
Santa Ana, CA |
|
Specialized Facility |
|
2029 |
|
2004 |
|
|
39,905 |
|
|
|
2,030,670 |
|
|
|
0.5 |
% |
|
|
50.89 |
|
GSA - Clarksburg |
|
Clarksburg, WV |
|
Office |
|
2039(2) |
|
1999 |
|
|
70,495 |
|
|
|
1,934,924 |
|
|
|
0.5 |
% |
|
|
27.45 |
|
DEA - North Highlands |
|
Sacramento, CA |
|
Specialized Facility |
|
2033 |
|
2002 |
|
|
37,975 |
|
|
|
1,893,254 |
|
|
|
0.5 |
% |
|
|
49.86 |
|
JUD - Aberdeen |
|
Aberdeen, MS |
|
Federal Courthouse |
|
2040 |
|
2005 |
|
|
45,194 |
|
|
|
1,890,909 |
|
|
|
0.5 |
% |
|
|
41.84 |
|
DEA - Riverside |
|
Riverside, CA |
|
Specialized Facility |
|
2032 |
|
1997 |
|
|
34,354 |
|
|
|
1,873,897 |
|
|
|
0.5 |
% |
|
|
54.55 |
|
NPS - Omaha |
|
Omaha, NE |
|
Specialized Facility |
|
2029 |
|
2004 |
|
|
62,772 |
|
|
|
1,873,659 |
|
|
|
0.5 |
% |
|
|
29.85 |
|
ICE - Orlando |
|
Orlando, FL |
|
Specialized Facility |
|
2040 |
|
1996 / 2010 |
|
|
49,420 |
|
|
|
1,861,991 |
|
|
|
0.5 |
% |
|
|
37.68 |
|
VA - Golden |
|
Golden, CO |
|
Warehouse |
|
2036(2) |
|
1996 / 2011 |
|
|
56,753 |
|
|
|
1,783,879 |
|
|
|
0.5 |
% |
|
|
31.43 |
|
JUD - Newport News |
|
Newport News, VA |
|
Federal Courthouse |
|
2033 |
|
2008 |
|
|
35,005 |
|
|
|
1,684,773 |
|
|
|
0.4 |
% |
|
|
48.13 |
|
USCG - Martinsburg |
|
Martinsburg, WV |
|
Specialized Facility |
|
2027 |
|
2007 |
|
|
59,547 |
|
|
|
1,634,284 |
|
|
|
0.4 |
% |
|
|
27.45 |
|
VA - Charleston |
|
North Charleston, SC |
|
Warehouse |
|
2040 |
|
2020 |
|
|
97,718 |
|
|
|
1,511,163 |
|
|
|
0.4 |
% |
|
|
15.46 |
|
USAO - Springfield |
|
Springfield, IL |
|
Specialized Facility |
|
2038 |
|
2002 |
|
|
43,600 |
|
|
|
1,399,201 |
|
|
|
0.4 |
% |
|
|
32.09 |
|
JUD - Council Bluffs |
|
Council Bluffs, IA |
|
Federal Courthouse |
|
2041(7) |
|
2021 |
|
|
28,900 |
|
|
|
1,368,503 |
|
|
|
0.4 |
% |
|
|
47.35 |
|
DEA - Birmingham |
|
Birmingham, AL |
|
Specialized Facility |
|
2038 |
|
2005 |
|
|
35,616 |
|
|
|
1,260,657 |
|
|
|
0.3 |
% |
|
|
35.40 |
|
20
Leased Operating Property Overview (Cont.) (As of September 30, 2025, unaudited) |
|
|
|
Property Name |
|
Location |
|
Property Type |
|
Tenant |
|
Year Built / |
|
Leased |
|
|
Annualized |
|
|
Percentage |
|
|
Annualized |
|
||||
|
|
|
|
|
|
|
|
|
|
|
|
|
|
|
|
|
|
|
|
|
||||
Wholly Owned U.S. Government Leased Properties (Cont.) |
|
|||||||||||||||||||||||
DEA - Albany |
|
Albany, NY |
|
Specialized Facility |
|
2042 |
|
2004 |
|
|
31,976 |
|
|
|
1,185,675 |
|
|
|
0.3 |
% |
|
|
37.08 |
|
HSI - Orlando |
|
Orlando, FL |
|
Specialized Facility |
|
2036 |
|
2006 |
|
|
27,840 |
|
|
|
1,082,677 |
|
|
|
0.3 |
% |
|
|
38.89 |
|
SSA - Dallas |
|
Dallas, TX |
|
Specialized Facility |
|
2035 |
|
2005 |
|
|
27,200 |
|
|
|
1,073,940 |
|
|
|
0.3 |
% |
|
|
39.48 |
|
JUD - South Bend |
|
South Bend, IN |
|
Federal Courthouse |
|
2027 |
|
1996 / 2011 |
|
|
30,119 |
|
|
|
811,838 |
|
|
|
0.2 |
% |
|
|
26.95 |
|
ICE - Louisville |
|
Louisville, KY |
|
Specialized Facility |
|
2036 |
|
2011 |
|
|
17,420 |
|
|
|
662,835 |
|
|
|
0.2 |
% |
|
|
38.05 |
|
DEA - San Diego |
|
San Diego, CA |
|
Warehouse |
|
2032 |
|
1999 |
|
|
16,100 |
|
|
|
563,532 |
|
|
|
0.2 |
% |
|
|
35.00 |
|
DEA - Bakersfield |
|
Bakersfield, CA |
|
Specialized Facility |
|
2038 |
|
2000 |
|
|
9,800 |
|
|
|
496,834 |
|
|
|
0.1 |
% |
|
|
50.70 |
|
SSA - San Diego |
|
San Diego, CA |
|
Specialized Facility |
|
2032 |
|
2003 |
|
|
10,059 |
|
|
|
452,860 |
|
|
|
0.1 |
% |
|
|
45.02 |
|
|
|
|
|
|
|
|
|
|
|
|
|
|
|
|
|
|
|
|
|
|
||||
Subtotal |
|
|
|
|
|
|
|
|
|
|
7,881,138 |
|
|
$ |
283,545,307 |
|
|
|
75.6 |
% |
|
$ |
35.98 |
|
|
|
|
|
|
|
|
|
|
|
|
|
|
|
|
|
|
|
|
|
|
||||
Wholly Owned State and Local Government Leased Property |
|
|||||||||||||||||||||||
DC - Capitol Plaza |
|
Washington, DC |
|
Office |
|
2027 - 2038(9) |
|
2006 |
|
|
284,688 |
|
|
|
18,345,138 |
|
|
|
4.9 |
% |
|
|
64.44 |
|
Wake County III - Cary |
|
Cary, NC |
|
Office |
|
2027 / 2034(10) |
|
1997 |
|
|
113,722 |
|
|
|
3,495,663 |
|
|
|
0.9 |
% |
|
|
30.74 |
|
CA - Anaheim |
|
Anaheim, CA |
|
Office |
|
2033 / 2034 |
|
1991 / 2020 |
|
|
95,273 |
|
|
|
3,364,379 |
|
|
|
0.9 |
% |
|
|
35.31 |
|
Wake County II - Cary |
|
Cary, NC |
|
Office |
|
2034(11) |
|
1994 |
|
|
98,340 |
|
|
|
2,840,676 |
|
|
|
0.8 |
% |
|
|
28.89 |
|
Wake County I - Cary |
|
Cary, NC |
|
Office |
|
2034(11) |
|
1991 |
|
|
75,401 |
|
|
|
2,222,073 |
|
|
|
0.6 |
% |
|
|
29.47 |
|
USFS I - Albuquerque |
|
Albuquerque, NM |
|
Office |
|
2035(7) |
|
2006 |
|
|
29,032 |
|
|
|
108,000 |
|
|
|
0.0 |
% |
|
|
3.72 |
|
|
|
|
|
|
|
|
|
|
|
|
|
|
|
|
|
|
|
|
|
|
||||
Subtotal |
|
|
|
|
|
|
|
|
|
|
696,456 |
|
|
$ |
30,375,929 |
|
|
|
8.1 |
% |
|
$ |
43.62 |
|
|
|
|
|
|
|
|
|
|
|
|
|
|
|
|
|
|
|
|
|
|
||||
Wholly Owned Privately Leased Property |
|
|||||||||||||||||||||||
York Space Systems - Greenwood Village |
|
Greenwood Village, CO |
|
Specialized Facility |
|
2031(5) |
|
1982 / 2020 |
|
|
138,125 |
|
|
|
5,012,523 |
|
|
|
1.3 |
% |
|
|
36.29 |
|
Northrop Grumman - Dayton |
|
Beavercreek, OH |
|
Specialized Facility |
|
2029(7) |
|
2012 |
|
|
99,246 |
|
|
|
2,629,161 |
|
|
|
0.7 |
% |
|
|
26.49 |
|
Northrop Grumman - Aurora |
|
Aurora, CO |
|
Specialized Facility |
|
2032(7) |
|
2002 |
|
|
104,136 |
|
|
|
2,368,386 |
|
|
|
0.6 |
% |
|
|
22.74 |
|
501 East Hunter Street - Lummus Corporation |
|
Lubbock, TX |
|
Warehouse |
|
2028(7) |
|
2013 |
|
|
70,078 |
|
|
|
410,390 |
|
|
|
0.1 |
% |
|
|
5.86 |
|
|
|
|
|
|
|
|
|
|
|
|
|
|
|
|
|
|
|
|
|
|
||||
Subtotal |
|
|
|
|
|
|
|
|
|
|
411,585 |
|
|
$ |
10,420,460 |
|
|
|
2.7 |
% |
|
$ |
25.32 |
|
|
|
|
|
|
|
|
|
|
|
|
|
|
|
|
|
|
|
|
|
|
||||
Wholly Owned Properties Total / Weighted Average |
|
|
|
|
8,989,179 |
|
|
$ |
324,341,696 |
|
|
|
86.4 |
% |
|
$ |
36.08 |
|
||||||
21
Leased Operating Property Overview (Cont.) (As of September 30, 2025, unaudited) |
|
|
|
Property Name |
|
Location |
|
Property Type |
|
Tenant |
|
Year Built / |
|
Leased |
|
|
Annualized |
|
|
Percentage |
|
|
Annualized |
|
||||
U.S Government Leased to Unconsolidated Real Estate Venture |
|
|||||||||||||||||||||||
VA - Phoenix(12) |
|
Phoenix, AZ |
|
Outpatient Clinic |
|
2042 |
|
2022 |
|
|
257,294 |
|
|
|
10,836,673 |
|
|
|
2.9 |
% |
|
|
42.12 |
|
VA - San Antonio(12) |
|
San Antonio, TX |
|
Outpatient Clinic |
|
2041 |
|
2021 |
|
|
226,148 |
|
|
|
9,334,456 |
|
|
|
2.5 |
% |
|
|
41.28 |
|
VA - Jacksonville(12) |
|
Jacksonville, FL |
|
Outpatient Clinic |
|
2043 |
|
2023 |
|
|
193,100 |
|
|
|
7,372,700 |
|
|
|
2.0 |
% |
|
|
38.18 |
|
VA - Chattanooga(12) |
|
Chattanooga, TN |
|
Outpatient Clinic |
|
2035 |
|
2020 |
|
|
94,566 |
|
|
|
4,371,201 |
|
|
|
1.2 |
% |
|
|
46.22 |
|
VA - Lubbock(12)(13) |
|
Lubbock, TX |
|
Outpatient Clinic |
|
2040 |
|
2020 |
|
|
120,916 |
|
|
|
4,259,993 |
|
|
|
1.1 |
% |
|
|
35.23 |
|
VA - Marietta(12) |
|
Marietta, GA |
|
Outpatient Clinic |
|
2041 |
|
2021 |
|
|
76,882 |
|
|
|
3,892,927 |
|
|
|
1.0 |
% |
|
|
50.64 |
|
VA - Birmingham(12) |
|
Irondale, AL |
|
Outpatient Clinic |
|
2041 |
|
2021 |
|
|
77,128 |
|
|
|
3,192,361 |
|
|
|
0.9 |
% |
|
|
41.39 |
|
VA - Corpus Christi(12) |
|
Corpus Christi, TX |
|
Outpatient Clinic |
|
2042 |
|
2022 |
|
|
69,276 |
|
|
|
2,974,771 |
|
|
|
0.8 |
% |
|
|
42.94 |
|
VA - Columbus(12) |
|
Columbus, GA |
|
Outpatient Clinic |
|
2042 |
|
2022 |
|
|
67,793 |
|
|
|
2,925,752 |
|
|
|
0.8 |
% |
|
|
43.16 |
|
VA - Lenexa(12) |
|
Lenexa, KS |
|
Outpatient Clinic |
|
2041 |
|
2021 |
|
|
31,062 |
|
|
|
1,355,340 |
|
|
|
0.4 |
% |
|
|
43.63 |
|
Subtotal |
|
|
|
|
|
|
|
|
|
|
1,214,165 |
|
|
$ |
50,516,174 |
|
|
|
13.6 |
% |
|
$ |
41.61 |
|
|
|
|
|
|
|
|
|
|
|
|
|
|
|
|
|
|
|
|
|
|
||||
Total / Weighted Average |
|
|
10,203,344 |
|
|
$ |
374,857,870 |
|
|
|
100.0 |
% |
|
$ |
36.74 |
|
||||||||
|
|
|
|
|
|
|
|
|
|
|
|
|
|
|
|
|
|
|
|
|
||||
Total / Weighted Average at Easterly's Share |
|
|
|
|
|
|
9,632,685 |
|
|
$ |
351,115,269 |
|
|
|
|
|
$ |
36.45 |
|
|||||
(1) 316,318 square feet leased to U.S. Citizenship and Immigration Services ("USCIS") will expire on February 19, 2042 and contains two five-year renewal options. 47,034 square feet leased to two private tenants will expire between 2028-2030 and each contains renewal options.
(2) Lease contains one five-year renewal option.
(3) 33,407 square feet leased to the U.S. Army Corps of Engineers ("ACOE") will expire on February 19, 2030 and contains one five-year renewal options. 21,646 square feet leased to the Federal Bureau of Investigation ("FBI") will expire on December 31, 2029 and contains one five-year renewal option. 11,061 square feet leased to five private tenants will expire between 2026-2030 and each contains renewal options. 4,846 square feet leased to the Department of Energy ("DOE") will expire on April 14, 2033 and contains one ten-year renewal option.
(4) 80,523 square feet leased to the U.S. Immigration and Customs Enforcement ("ICE") will expire on September 14, 2040. 29,074 square feet leased to a private tenant will expire on September 30, 2032 and contains one five-year renewal option. 25,603 square feet leased to a private tenant will expire on January 31, 2032 and contains one five-year renewal option.
(5) Lease contains one ten-year renewal option.
(6) 29,737 square feet leased to the U.S. Customs and Border Protection ("CBP") will expire on April 30, 2038. 17,373 square feet leased to a private tenant will expire on December 31, 2031 and contains two five-year renewal options. 49,125 square feet leased to the Transportation Security Administration ("TSA") will expire on December 14, 2038 and contains one five-year renewal option.
(7) Lease contains two five-year renewal options.
(8) 40,502 square feet leased to the U.S. Immigration and Customs Enforcement ("ICE") will expire on August 31, 2031. 11,402 square feet leased to a private tenant will expire on December 31, 2028 and contains two five-year renewal options. 9,480 square feet leased to the U.S. National Oceanic and Atmospheric Administration ("NOAA") will expire on September 13, 2040.
(9) 237,118 square feet leased to the District of Columbia Government will expire on February 28, 2038 and contains one five-year renewal option. 20,299 square feet leased to four private tenants will expire between 2027-2031 and each contains renewal options. 26,327 square feet leased to the Internal Revenue Service ("IRS") will expire on December 21, 2029.
(10) 75,864 square feet leased to Wake County Public School System will expire on June 30, 2034 and contains two eight-year renewal options. 37,858 square feet leased to a private tenant will expire on December 31, 2027 and contains one five-year renewal option.
(11) Lease contains two eight-year renewal options.
(12) The Company owns 53.0% of the property through an unconsolidated joint venture.
(13) Asset is subject to a ground lease where the unconsolidated joint venture is the lessee.
22
Tenants (As of September 30, 2025, unaudited) |
|
|
|
Tenant |
|
Weighted |
|
|
Leased |
|
|
Percentage |
|
|
Annualized |
|
|
Percentage |
|
|||||
|
|
|
|
|
|
|
|
|
|
|
|
|
|
|
|
|||||
U.S. Government |
|
|
|
|
|
|
|
|
|
|
|
|
|
|
|
|||||
Department of Veteran Affairs ("VA") |
|
|
13.7 |
|
|
|
2,251,131 |
|
|
|
22.0 |
% |
|
$ |
96,418,303 |
|
|
|
25.6 |
% |
Federal Bureau of Investigation ("FBI") |
|
|
8.2 |
|
|
|
1,498,607 |
|
|
|
14.7 |
% |
|
|
54,952,391 |
|
|
|
14.7 |
% |
Drug Enforcement Administration ("DEA") |
|
|
10.0 |
|
|
|
607,290 |
|
|
|
6.0 |
% |
|
|
28,413,449 |
|
|
|
7.6 |
% |
Judiciary of the U.S. ("JUD") |
|
|
13.4 |
|
|
|
399,825 |
|
|
|
3.9 |
% |
|
|
16,722,638 |
|
|
|
4.5 |
% |
U.S. Citizenship and Immigration Services ("USCIS") |
|
|
11.3 |
|
|
|
520,807 |
|
|
|
5.1 |
% |
|
|
15,933,850 |
|
|
|
4.3 |
% |
Immigration and Customs Enforcement ("ICE") |
|
|
7.6 |
|
|
|
388,386 |
|
|
|
3.8 |
% |
|
|
15,178,122 |
|
|
|
4.0 |
% |
Internal Revenue Service ("IRS") |
|
|
6.3 |
|
|
|
359,661 |
|
|
|
3.5 |
% |
|
|
12,051,651 |
|
|
|
3.2 |
% |
Environmental Protection Agency ("EPA") |
|
|
5.9 |
|
|
|
225,418 |
|
|
|
2.2 |
% |
|
|
9,371,551 |
|
|
|
2.5 |
% |
Food and Drug Administration ("FDA") |
|
|
14.4 |
|
|
|
129,314 |
|
|
|
1.3 |
% |
|
|
9,362,790 |
|
|
|
2.5 |
% |
U.S. Joint Staff Command ("JSC") |
|
|
2.7 |
|
|
|
403,737 |
|
|
|
4.0 |
% |
|
|
8,556,069 |
|
|
|
2.3 |
% |
Federal Aviation Administration ("FAA") |
|
|
1.1 |
|
|
|
188,768 |
|
|
|
1.9 |
% |
|
|
7,801,422 |
|
|
|
2.1 |
% |
Bureau of the Fiscal Service ("BFS") |
|
|
11.9 |
|
|
|
266,176 |
|
|
|
2.6 |
% |
|
|
7,051,474 |
|
|
|
1.9 |
% |
Social Security Administration ("SSA") |
|
|
7.3 |
|
|
|
192,185 |
|
|
|
1.9 |
% |
|
|
5,598,061 |
|
|
|
1.5 |
% |
Patent and Trademark Office ("PTO") |
|
|
9.3 |
|
|
|
190,546 |
|
|
|
1.9 |
% |
|
|
4,773,569 |
|
|
|
1.3 |
% |
Federal Emergency Management Agency ("FEMA") |
|
|
13.0 |
|
|
|
210,373 |
|
|
|
2.1 |
% |
|
|
4,652,865 |
|
|
|
1.2 |
% |
U.S. Attorney Office ("USAO") |
|
|
9.2 |
|
|
|
110,776 |
|
|
|
1.1 |
% |
|
|
4,146,163 |
|
|
|
1.1 |
% |
U.S. Forest Service ("USFS") |
|
|
5.8 |
|
|
|
98,720 |
|
|
|
1.0 |
% |
|
|
3,447,901 |
|
|
|
0.9 |
% |
Department of Transportation ("DOT") |
|
|
13.7 |
|
|
|
116,046 |
|
|
|
1.1 |
% |
|
|
3,404,199 |
|
|
|
0.9 |
% |
Customs and Border Protection ("CBP") |
|
|
9.9 |
|
|
|
64,737 |
|
|
|
0.6 |
% |
|
|
3,247,339 |
|
|
|
0.9 |
% |
National Archives and Records Administration ("NARA") |
|
|
6.6 |
|
|
|
161,730 |
|
|
|
1.6 |
% |
|
|
2,697,002 |
|
|
|
0.7 |
% |
National Weather Service ("NWS") |
|
|
8.2 |
|
|
|
94,378 |
|
|
|
0.9 |
% |
|
|
2,163,306 |
|
|
|
0.6 |
% |
U.S. Department of Agriculture ("USDA") |
|
|
2.3 |
|
|
|
60,257 |
|
|
|
0.6 |
% |
|
|
1,887,983 |
|
|
|
0.5 |
% |
National Park Service ("NPS") |
|
|
3.7 |
|
|
|
62,772 |
|
|
|
0.6 |
% |
|
|
1,873,659 |
|
|
|
0.5 |
% |
U.S. Coast Guard ("USCG") |
|
|
2.2 |
|
|
|
59,547 |
|
|
|
0.6 |
% |
|
|
1,634,284 |
|
|
|
0.4 |
% |
National Oceanic and Atmospheric Administration ("NOAA") |
|
|
5.9 |
|
|
|
33,403 |
|
|
|
0.3 |
% |
|
|
1,419,050 |
|
|
|
0.4 |
% |
General Services Administration - Other |
|
|
10.0 |
|
|
|
22,053 |
|
|
|
0.2 |
% |
|
|
1,277,785 |
|
|
|
0.3 |
% |
Transportation Security Administration ("TSA") |
|
|
8.2 |
|
|
|
44,075 |
|
|
|
0.4 |
% |
|
|
1,168,569 |
|
|
|
0.3 |
% |
Homeland Security Investigations ("HSI") |
|
|
10.5 |
|
|
|
27,840 |
|
|
|
0.3 |
% |
|
|
1,082,677 |
|
|
|
0.3 |
% |
Small Business Administration ("SBA") |
|
|
13.8 |
|
|
|
44,969 |
|
|
|
0.4 |
% |
|
|
1,024,510 |
|
|
|
0.3 |
% |
23
|
|
|
|
Tenant |
|
Weighted |
|
|
Leased |
|
|
Percentage |
|
|
Annualized |
|
|
Percentage |
|
|||||
|
|
|
|
|
|
|
|
|
|
|
|
|
|
|
|
|||||
U.S. Government (Cont.) |
|
|
|
|
|
|
|
|
|
|
|
|
|
|
|
|||||
U.S. Army Corps of Engineers ("ACOE") |
|
|
4.4 |
|
|
|
33,407 |
|
|
|
0.3 |
% |
|
|
974,264 |
|
|
|
0.3 |
% |
Bureau of Alcohol, Tobacco, Firearms and Explosives ("ATF") |
|
|
7.4 |
|
|
|
23,775 |
|
|
|
0.2 |
% |
|
|
730,519 |
|
|
|
0.2 |
% |
Department of Energy ("DOE") |
|
|
7.5 |
|
|
|
4,846 |
|
|
|
0.0 |
% |
|
|
277,782 |
|
|
|
0.1 |
% |
Federal Energy Regulatory Commission ("FERC") |
|
|
13.9 |
|
|
|
6,214 |
|
|
|
0.1 |
% |
|
|
244,142 |
|
|
|
0.1 |
% |
U.S. Probation Office ("USPO") |
|
|
13.3 |
|
|
|
6,621 |
|
|
|
0.1 |
% |
|
|
181,745 |
|
|
|
0.0 |
% |
U.S. Marshals Service ("USMS") |
|
|
1.3 |
|
|
|
1,054 |
|
|
|
0.0 |
% |
|
|
50,898 |
|
|
|
0.0 |
% |
Department of Labor ("DOL") |
|
|
13.3 |
|
|
|
574 |
|
|
|
0.0 |
% |
|
|
15,762 |
|
|
|
0.0 |
% |
|
|
|
|
|
|
|
|
|
|
|
|
|
|
|
|
|||||
Subtotal |
|
|
9.8 |
|
|
|
8,910,018 |
|
|
|
87.3 |
% |
|
$ |
329,787,744 |
|
|
|
88.0 |
% |
|
|
|
|
|
|
|
|
|
|
|
|
|
|
|
|
|||||
State and Local Government |
|
|
|
|
|
|
|
|
|
|
|
|
|
|
|
|||||
District of Columbia Government |
|
|
12.4 |
|
|
|
238,062 |
|
|
|
2.3 |
% |
|
|
15,525,862 |
|
|
|
4.2 |
% |
Wake County Public Schools |
|
|
8.8 |
|
|
|
249,605 |
|
|
|
2.4 |
% |
|
|
7,425,132 |
|
|
|
2.0 |
% |
State of California Employee Development Department |
|
|
8.4 |
|
|
|
65,133 |
|
|
|
0.6 |
% |
|
|
2,296,631 |
|
|
|
0.6 |
% |
State of California Department of Industrial Relations |
|
|
8.1 |
|
|
|
30,140 |
|
|
|
0.3 |
% |
|
|
1,067,748 |
|
|
|
0.3 |
% |
New York State Court of Claims |
|
|
1.0 |
|
|
|
14,274 |
|
|
|
0.1 |
% |
|
|
390,934 |
|
|
|
0.1 |
% |
State of New Mexico Health Care Authority |
|
|
10.3 |
|
|
|
29,032 |
|
|
|
0.3 |
% |
|
|
108,000 |
|
|
|
0.0 |
% |
|
|
|
|
|
|
|
|
|
|
|
|
|
|
|
|
|||||
Subtotal |
|
|
10.0 |
|
|
|
626,246 |
|
|
|
6.0 |
% |
|
$ |
26,814,307 |
|
|
|
7.2 |
% |
|
|
|
|
|
|
|
|
|
|
|
|
|
|
|
|
|||||
Private Tenants |
|
|
|
|
|
|
|
|
|
|
|
|
|
|
|
|||||
York Space Systems |
|
|
6.3 |
|
|
|
138,125 |
|
|
|
1.4 |
% |
|
|
5,012,523 |
|
|
|
1.3 |
% |
Northrup Grumman Systems Corporation |
|
|
5.2 |
|
|
|
203,382 |
|
|
|
2.0 |
% |
|
|
4,997,547 |
|
|
|
1.3 |
% |
Other Private Tenants |
|
|
3.7 |
|
|
|
67,081 |
|
|
|
0.7 |
% |
|
|
2,202,905 |
|
|
|
0.6 |
% |
Caremark, L.L.C |
|
|
4.8 |
|
|
|
41,462 |
|
|
|
0.4 |
% |
|
|
1,320,627 |
|
|
|
0.4 |
% |
Jacobs Engineering Group, Inc. |
|
|
2.3 |
|
|
|
37,858 |
|
|
|
0.4 |
% |
|
|
1,133,280 |
|
|
|
0.3 |
% |
Saint Luke's Health System, Inc. |
|
|
1.3 |
|
|
|
32,043 |
|
|
|
0.3 |
% |
|
|
973,131 |
|
|
|
0.3 |
% |
Pate Rehabilitation Endeavors, LLC |
|
|
6.3 |
|
|
|
25,603 |
|
|
|
0.3 |
% |
|
|
926,636 |
|
|
|
0.2 |
% |
HUB International Midwest Limited |
|
|
7.0 |
|
|
|
29,074 |
|
|
|
0.3 |
% |
|
|
812,455 |
|
|
|
0.2 |
% |
University of Central Missouri |
|
|
6.7 |
|
|
|
22,374 |
|
|
|
0.2 |
% |
|
|
466,325 |
|
|
|
0.1 |
% |
Lummus Corporation |
|
|
2.8 |
|
|
|
70,078 |
|
|
|
0.7 |
% |
|
|
410,390 |
|
|
|
0.1 |
% |
|
|
|
|
|
|
|
|
|
|
|
|
|
|
|
|
|||||
Subtotal |
|
|
4.8 |
|
|
|
667,080 |
|
|
|
6.7 |
% |
|
$ |
18,255,819 |
|
|
|
4.8 |
% |
|
|
|
|
|
|
|
|
|
|
|
|
|
|
|
|
|||||
Total / Weighted Average |
|
|
9.5 |
|
|
|
10,203,344 |
|
|
|
100.0 |
% |
|
$ |
374,857,870 |
|
|
|
100.0 |
% |
(1) Weighted based on leased square feet.
24
Lease Expirations (As of September 30, 2025, unaudited) |
|
|
|
Year of Lease Expiration (1) |
|
Number of |
|
Leased Square |
|
|
Percentage of |
|
|
Annualized |
|
|
Percentage of |
|
|
Annualized |
|
|||||
2025 |
|
3 |
|
|
248,912 |
|
|
|
2.4 |
% |
|
|
8,814,154 |
|
|
|
2.4 |
% |
|
|
35.41 |
|
2026 |
|
5 |
|
|
377,030 |
|
|
|
3.7 |
% |
|
|
13,984,837 |
|
|
|
3.7 |
% |
|
|
37.09 |
|
2027 |
|
10 |
|
|
538,438 |
|
|
|
5.3 |
% |
|
|
20,021,541 |
|
|
|
5.3 |
% |
|
|
37.18 |
|
2028 |
|
12 |
|
|
807,610 |
|
|
|
7.9 |
% |
|
|
18,138,687 |
|
|
|
4.8 |
% |
|
|
22.46 |
|
2029 |
|
10 |
|
|
757,363 |
|
|
|
7.4 |
% |
|
|
24,903,154 |
|
|
|
6.6 |
% |
|
|
32.88 |
|
2030 |
|
4 |
|
|
67,202 |
|
|
|
0.7 |
% |
|
|
1,741,048 |
|
|
|
0.5 |
% |
|
|
25.91 |
|
2031 |
|
8 |
|
|
442,851 |
|
|
|
4.3 |
% |
|
|
16,736,280 |
|
|
|
4.5 |
% |
|
|
37.79 |
|
2032 |
|
11 |
|
|
712,188 |
|
|
|
7.0 |
% |
|
|
22,330,286 |
|
|
|
6.0 |
% |
|
|
31.35 |
|
2033 |
|
10 |
|
|
566,197 |
|
|
|
5.5 |
% |
|
|
22,379,733 |
|
|
|
6.0 |
% |
|
|
39.53 |
|
2034 |
|
10 |
|
|
507,793 |
|
|
|
5.0 |
% |
|
|
21,206,069 |
|
|
|
5.7 |
% |
|
|
41.76 |
|
Thereafter |
|
59 |
|
|
5,177,760 |
|
|
|
50.8 |
% |
|
|
204,602,081 |
|
|
|
54.5 |
% |
|
|
39.52 |
|
Total / Weighted Average |
|
142 |
|
|
10,203,344 |
|
|
|
100.0 |
% |
|
$ |
374,857,870 |
|
|
|
100.0 |
% |
|
$ |
36.74 |
|
(1) The year of lease expiration is pursuant to current contract terms. Some tenants have the right to vacate their space during a specified period, or "soft term," before the stated terms of their leases expire. As of September 30, 2025, five tenants occupying approximately 1.8% of our leased square feet and contributing approximately 1.6% of our annualized lease income are currently operating under lease provisions that allow them to exercise their right to terminate their lease before the stated term of their respective lease expires.
25
Lease Expirations (As of September 30, 2025, unaudited) |
|
|
|
26
Summary of Re/Development Projects (As of September 30, 2025, unaudited, in thousands, except square feet) |
|
|
|
Projects Under Construction(1) |
||||||||||||||||||||||||||||||||
Property Name |
|
Location |
|
|
Property Type |
|
|
Total Leased Square Feet |
|
|
Lease Term |
|
|
Anticipated Total Cost(2) |
|
|
Cost to Date |
|
|
Anticipated Lump-Sum Reimbursement(3) |
|
|
Anticipated Completion Date |
|
Anticipated Lease Commencement |
|||||||
FDA - Atlanta(4) |
|
Atlanta, GA |
|
|
Laboratory |
|
|
|
162,000 |
|
|
20-Year |
|
|
$ |
247,191 |
|
|
$ |
222,460 |
|
|
$ |
151,994 |
|
|
4Q 2025 |
|
4Q 2025 |
|||
JUD - Flagstaff |
|
Flagstaff, AZ |
|
|
Courthouse |
|
|
|
50,777 |
|
|
20-Year |
|
|
$ |
68,263 |
|
|
$ |
23,372 |
|
|
$ |
34,805 |
|
|
1Q 2027 |
|
1Q 2027 |
|||
FL - Fort Myers |
|
Fort Myers, FL |
|
|
Laboratory |
|
|
|
64,000 |
|
|
25-Year |
|
|
$ |
49,257 |
|
|
$ |
17,759 |
|
|
$ |
- |
|
|
4Q 2026 |
|
4Q 2026 |
|||
Total |
|
|
|
|
|
|
|
|
276,777 |
|
|
|
|
|
$ |
364,711 |
|
|
$ |
263,591 |
|
|
$ |
186,799 |
|
|
|
|
|
|||
|
|
|
|
|
|
|
|
|
|
|
|
|
|
|
|
|
|
|
|
|
|
|
|
|
|
|||||||
|
|
|
|
|
|
|
|
|
|
|
|
|
|
|
|
|
|
|
|
|
|
|
|
|
|
|||||||
Projects in Design(5) |
|
|
|
|
|
|
|
|
||||||||||||||||||||||||
Property Name |
|
Location |
|
|
Property Type |
|
|
Total Estimated Leased Square Feet |
|
|
Lease Term |
|
|
Anticipated Completion Date |
|
|
Anticipated Lease Commencement |
|
|
|
|
|
|
|
|
|||||||
JUD - Medford |
|
Medford, OR |
|
|
Courthouse |
|
|
|
40,035 |
|
|
20-Year |
|
|
2H 2027 |
|
|
2H 2027 |
|
|
|
|
|
|
|
|
||||||
|
|
|
|
|
|
|
|
|
|
|
|
|
|
|
|
|
|
|
|
|
|
|
|
|
|
|||||||
|
|
|
|
|
|
|
|
|
|
|
|
|
|
|
|
|
|
|
|
|
|
|
|
|
|
|||||||
Projects Previously Completed with Outstanding Lump-Sum Reimbursements(3) |
|
|
|
|
|
|||||||||||||||||||||||||||
Property Name |
|
Location |
|
|
Property Type |
|
|
Total Leased Square Feet |
|
|
Lease Term |
|
|
Outstanding Lump-Sum Reimbursement(3) |
|
|
Completion Date |
|
|
Lease Commencement |
|
|
|
|
|
|||||||
N/A |
|
|
- |
|
|
|
- |
|
|
|
- |
|
|
|
- |
|
|
$ |
- |
|
|
|
- |
|
|
|
- |
|
|
|
|
|
(1) Includes properties under construction for which design is complete.
(2) Includes the total cost to construct the building, as well as projected leasing capital and interest costs as of quarter-end.
(3) Includes reimbursement of lump-sum tenant improvement costs and development fees.
(4) Total lump sum reimbursements received for the project as of September 30, 2025 are $138.1 million.
(5) Includes projects in the design phase for which project scope is not fully determined.
27