.2

.2
|
First Quarter 2020 |
|
1 |
| 3 | |
|
|
|
| 5 | |
|
|
|
| 9 | |
|
|
|
| 10 | |
|
|
|
| 11 | |
|
|
|
| 12 | |
|
|
|
| 13 | |
|
|
|
| 17 | |
|
|
|
| 18 | |
|
|
|
| 19 | |
|
|
|
| 20 |
|
First Quarter 2020 |
|
2 |
This Supplemental Information package contains forward-looking statements within the meaning of the Private Securities Litigation Reform Act of 1995 (set forth in Section 27A of the Securities Act of 1933, as amended (the “Securities Act”) and Section 21E of the Securities Exchange Act of 1934, as amended (the “Exchange Act”)). These forward-looking statements include, without limitation, statements about our estimates, expectations, predictions and forecasts of our future business plans and financial and operating performance and/or results, including the duration, severity and impact of the COVID-19 pandemic and resulting economic downturn, our ability to successfully source, structure, negotiate and close investments in and acquisitions of self-storage facilities, our management team’s views of the self-storage market generally, the market dynamics of the MSAs in which our investments are located, our ability to fund our outstanding future investment commitments, our ability to own and manage our real estate assets, the availability, terms and our rate of deployment of equity capital, our ability to increase the borrowing base and use the accordion feature of our credit facility, our expectations about receiving certificates of occupancy on our properties, as well as statements of management’s goals and objectives and other similar expressions concerning matters that are not historical facts. When we use the words “may,” “should,” “could,” “would,” “predicts,” “potential,” “continue,” “expects,” “anticipates,” “future,” “intends,” “plans,” “believes,” “estimates” or similar expressions or their negatives, as well as statements in future tense, we intend to identify forward-looking statements. Although we believe that the expectations reflected in such forward-looking statements are based upon reasonable assumptions, beliefs and expectations, such forward-looking statements are not predictions of future events or guarantees of future performance and our actual financial and operating results could differ materially from those set forth in the forward-looking statements. Some factors that might cause such differences are described in the section entitled “Risk Factors” in our most recent Annual Report on Form 10-K, and those set forth in our other reports and information filed with the Securities and Exchange Commission (“SEC”), which factors include, without limitation, the following:
|
· |
the negative impact of the ongoing COVID-19 pandemic and the measures intended to prevent its spread, which, in addition to exacerbating the risks set forth below, may result in: |
|
o |
a prolonged global economic downturn, recession or depression; |
|
o |
reductions in move-ins at the properties that we own; |
|
o |
slower increases in physical occupancy, or decreases in occupancy, due to declines in discretionary household income and rates of consumption; |
|
o |
temporary holds on existing customer rental rate increases and the deferral of auctions of delinquent tenants initiated by our third-party managers, as well as slower rent collections and potential increases in uncollectible accounts; |
|
o |
the delay in construction or development of certain of our investments and the cancellation of certain potential investments; |
|
o |
adverse impacts on the value of our debt investments due to impairment of our developers’ ability to make timely payments and disruptions in the capital markets that have negatively impacted the values of debt instruments; |
|
o |
adverse impacts on assumptions made in evaluating our investments accounted for using the fair value method; |
|
o |
the interplay of the pandemic and over-development in the self-storage industry; and |
|
o |
the adverse impacts on developers and development with respect to which we have made investments; |
|
· |
our ability to successfully source, structure, negotiate and close investments in and acquisitions of self-storage facilities; |
|
· |
changes in our business strategy and the market’s acceptance of our investment terms; |
|
· |
our ability to fund our outstanding and future investment commitments; |
|
· |
our ability to acquire our developers’ interests on favorable terms; |
|
· |
our ability to complete construction, obtain certificates of occupancy and complete leasing for self-storage development projects in which we invest; |
|
· |
our ability to increase rental rates; |
|
· |
the future availability of borrowings under our credit facility (including borrowing base capacity, compliance with covenants and the availability of the accordion feature); |
|
· |
availability and terms of equity and debt capital, as well as our rate of deployment of such capital (which may worsen as result of the COVID-19 pandemic); |
|
· |
our ability to hire and retain qualified personnel; |
|
· |
our ability to recognize the anticipated benefits from the internalization of our manager; |
|
· |
changes in the self-storage industry, interest rates or the general economy; |
|
· |
the degree and nature of our competition; |
|
· |
volatility in the value of our assets carried at fair market value created by the current economic turmoil or otherwise; |
|
· |
potential limitations on our ability to pay dividends at expected rates or other changes to our dividend rate; |
|
· |
limitations in our existing and future debt agreements on our ability to pay distributions; |
|
· |
the impact of our outstanding preferred stock on our ability to execute our business plan and pay distributions on our common stock; and |
|
· |
general volatility of the capital markets (which has significantly increased as a result of the COVID-19 pandemic) and the market price of our common stock. |
Given these uncertainties, undue reliance should not be placed on our forward-looking statements. We assume no duty or responsibility to publicly update or revise any forward-looking statement that may be made to reflect future events or circumstances or to reflect the occurrence of unanticipated events. We urge you to review the disclosures concerning risks in the sections entitled “Risk Factors” and “Management’s Discussion and Analysis of Financial Condition and Results of Operations” in our most recent Annual Report on Form 10-K and in other documents that we file from time-to-time with the SEC.
|
First Quarter 2020 |
|
3 |
Non-GAAP Financial Measures
Adjusted Earnings (loss) is a non-GAAP measure and is defined as net income (loss) attributable to common stockholders plus stock dividends to preferred stockholders, stock-based compensation expense, net loss attributable to non-controlling interests, fees to Manager, depreciation and amortization on real estate assets, depreciation and amortization on SL1 Venture real estate assets, goodwill impairment loss, and internalization expenses which are generally non-comparable and which represent expenses not substantially related to our ongoing business operations. Fees to manager have been included in Adjusted Earnings (loss) for all periods through December 31, 2019 as at that time they related to our then-ongoing business operations as an externally-managed company. For periods subsequent to December 31, 2019, Fees to manager are not included in Adjusted Earnings (loss) as they no longer relate to our ongoing business operations as an internally-managed company following the Internalization. We have paid a prorated management fee to the Manager for the period during the first quarter of 2020 prior to the completion of the Internalization and will no longer pay management fees going forward. Management uses Adjusted Earnings (loss) and Adjusted Earnings (loss) per share as key performance indicators in evaluating the operations of the Company's business. The Company is a capital provider to self-storage developers and believes that these measures are useful to management and investors as a starting point in measuring its operational performance because they exclude various equity-based payments (including stock dividends) and other items included in net income (loss) that do not relate to or are not indicative of its present and future operating performance, which can make periodic and peer analyses of operating performance more difficult. The Company’s computation of Adjusted Earnings (loss) and Adjusted Earnings (loss) per share may not be comparable to other key performance indicators reported by other REITs or real estate companies. Reconciliations of Adjusted Earnings (loss) and Adjusted Earnings (loss) per share to Net income (loss) attributable to common stockholders and Earnings (loss) per share, respectively, are provided in the attached table entitled “Calculation of Adjusted Earnings (loss).”
|
First Quarter 2020 |
|
4 |
Jernigan Capital Reports First Quarter Results
MEMPHIS, Tennessee, May 7, 2020 / Business Wire / Jernigan Capital, Inc. (NYSE: JCAP), an owner of self-storage facilities and a leading capital partner for self-storage entrepreneurs nationwide, today announced results for the quarter ended March 31, 2020.
First Quarter Highlights include:
|
§ |
$(2.53) loss per share, including $(0.46) related to change in fair value of investments and $(1.84) related to internalization expenses, goodwill impairment and the final payment of management fees to JCAP Advisors LLC for the period prior to internalization. |
|
§ |
Adjusted loss per share of $(0.42), including $(0.46) related to change in fair value of investments. |
|
§ |
Enhanced shareholder/management alignment of interests and reduced run-rate G&A expense by approximately 40% with the internalization of JCAP Advisors LLC, the Company’s external advisor, on February 20, 2020. |
|
§ |
Enhanced liquidity position by increasing size of revolving credit facility from $235 million to $375 million, reducing interest rate, improving covenants and attracting new banks. |
|
§ |
Increased the number of wholly owned self-storage facilities on its balance sheet or in its SL1 Joint Venture from 20 to 29 through developer buyouts of nine development property investments including the Fort Lauderdale, Boston 2, Atlanta 4, Atlanta 6, Atlanta 5, Atlanta 3, Charlotte 2, Knoxville, and Louisville 1 development property investments. |
|
§ |
Commenced leasing of Generation V self-storage facilities underlying two development property investments in which the Company has an aggregate committed investment of $25.5 million, 49.9% profits interests and ROFRs. |
Subsequent Events include:
|
§ |
Acquired 100% of the Class A membership units of the LLCs that own the Raleigh and Jacksonville 3 development property investments. With these acquisitions, the Company now wholly owns 31 facilities on its balance sheet or in its SL1 Joint Venture, representing approximately 41% of its total portfolio by net rentable square feet. |
|
§ |
Entered into a $100 million interest rate swap and a $100 million interest rate cap on the Company’s $375 million senior secured revolving line of credit, locking in a maximum one-month LIBOR of 0.43% on $200 million of debt capital through March 24, 2023. With these contracts in place, the Company has locked in a maximum cost of debt on $200 million of debt capital at approximately 3.1%, which it anticipates will decrease as investments underlying the borrowing base mature. |
“The year started very strongly for JCAP,” stated John Good, Chairman and Chief Executive Officer. “We accomplished a major goal set at the time of our IPO in March 2015 with the internalization of JCAP Advisors on February 20th in a transaction that we believe was very beneficial to shareholders and positioned the Company for future success through the alignment of interests and the right-sizing of corporate G&A. We improved the balance sheet by opportunistically issuing $15.4 million of common stock in the first few days of the year, and subsequently by upsizing our credit facility to $375 million and improving the pricing and covenants in the early days of the COVID-19 pandemic. Between cash on the balance sheet, increased availability on the credit facility, reduced commitments and cost savings, we are confident that we will have sufficient liquidity to cover all our commitments for the foreseeable future.”
“We continued to effectively execute the Company’s business plan of consolidating ownership of the projects we finance by acquiring the developers’ interests in nine newly developed, state-of-the-art Generation V self-storage properties that we had previously financed. Our best-of-class portfolio of Generation V self-storage properties continued to lease-up well and increase rates, resulting in revenue exceeding the top end of our guidance range and net operating income exceeding expectations on our owned properties by 31%. Our facilities that we wholly owned on balance sheet as of March 31, 2020, excluding those placed in service during the quarter, gained 388 basis points of occupancy during the quarter.”
“While the start to 2020 was strong, we, like the rest of the world have been profoundly impacted by the COVID-19 pandemic,” continued Mr. Good. “Since the outbreak began, our priority has been and remains the health and safety of our teammates, our customers, our developer partners and the employees staffing our stores for our operating partners. We encouraged teammates to work from home beginning the week of March 16th and officially closed our corporate offices in Memphis on March 25th to promote social distancing. We experienced a seamless transition to our new remote working conditions and have continued to function very well with state-of-the-art technology. Our third-party operating partners continue to safely and effectively operate each of our facilities with initiatives in-place to promote social distancing and the well-being of the communities in which we operate. All of our stores have remained open throughout this pandemic and are actively fulfilling the needs of both
|
First Quarter 2020 |
|
5 |
new and existing customers. We are thankful to be in the self-storage sector, a business that reliably meets essential needs of customers during times of uncertainty and change.”
“We have been very proactive in making sure the Company is well positioned to not only withstand the impacts of the pandemic, but to prosper in any resulting environment,” continued Mr. Good. “Actions taken since the pandemic began include:
|
· |
evaluating and suspending non-essential expenditures; |
|
· |
increasing the capacity of the credit facility, improving the terms and fixing the interest rate on $200 million of debt at a maximum of approximately 3.1% through March 24, 2023; |
|
· |
increasing the frequency of communication with our third-party managers to interactively monitor operations and overall performance; |
|
· |
re-assessing five development projects for which either development or construction had not yet commenced and agreeing with developers to discontinue funding those projects; and |
|
· |
actively engaging with developer partners and increasing discussions with potential joint venture partners to take advantage of the pending acquisitions cycle. |
These efforts have increased our cash position, bolstered liquidity and eliminated unnecessary costs in a time of uncertainty, while allowing for the continued execution of the business plan.”
“While we believe we are doing all the right things to address the dramatic effect of the pandemic on our lives and our business, we, like everyone else, have suffered what we believe to be a temporary loss of customers, operating momentum and asset value. Looking forward, it is too early to project the ultimate impact of the pandemic and resulting economic downturn on our operations. We are certain that core operations for the remainder of the year will be below original expectations and it will take longer to stabilize our properties in lease up. Accordingly, we have adjusted downward the fair values of our development property investments to take into account longer lease-up periods and lower short-term rental rates due to the COVID-19 pandemic occurring during a period of elevated supply and interrupting the 2020 leasing season, as well as the effect of a dramatic widening of credit spreads at the onset of the pandemic. The extent of the lingering impact to our operations and fair value will largely depend on the duration and magnitude of the pandemic and the eventual recovery. With this general uncertainty and lack of visibility, we are withdrawing our earnings per share and adjusted earnings per share guidance ranges for the full-year 2020, and we will reevaluate our guidance at such time as visibility improves and we can predict with better certainty our results of operations.”
“To be clear, our fair value write-down and withdrawal of guidance should in no respect be viewed as a loss of confidence in our portfolio or in the longer-term performance of self-storage properties. Many of our properties are in states that were among the earliest to relax “safer-at-home” orders, namely Colorado, Florida, Georgia, Minnesota, South Carolina and Texas. Notwithstanding the economic trauma and the far-reaching impact of the COVID-19 pandemic, the self-storage industry is equipped to perform better than most other sectors of commercial real estate because of its low capital expenditures, the multitude of demand drivers and the power of branding,” continued Mr. Good. “The pandemic will drive changes in peoples’ lives, and change drives storage demand. We are confident in our portfolio of newly developed self-storage facilities, our underlying business strategy, and the brands and management capabilities of our third-party managers.”
Financial Highlights
Total revenues for the quarter ended March 31, 2020 were $11.7 million representing an increase of $1.8 million, or 18%, over total revenues for the quarter ended March 31, 2019. Total interest income from investments for the three months ended March 31, 2020 was $7.8 million, a decrease of approximately $0.5 million, or 6%, from the three months ended March 31, 2019. The decrease is primarily attributable to a decrease in the principal amount of development loans and bridge loans outstanding as a result of our acquisitions of developer interests in 17 additional self-storage facilities. At the same time, rental revenue was $3.9 million for the three months ended March 31, 2020, an increase of $2.4 million, or 167%, over rental revenue of $1.5 million reported for the same period in 2019. This increase is the result of 17 acquisitions of our developer’s interests during 2019 and the three months ended March 31, 2020 coupled with increased property net operating income on existing real estate owned resulting from higher occupancy and rental rates.
Total general and administrative expenses, including fees to manager, for the three months ended March 31, 2020 were $4.0 million, an increase of $0.2 million, or 6%, from the three months ended March 31, 2019, primarily due to annual compensation increases, as well as the addition of two professional employees during the third quarter of 2019 who were hired for various functions rendered necessary by our conversion to an equity REIT. However, on a linked quarterly basis (first quarter 2020 compared to fourth quarter 2019), total general and administrative expenses declined approximately 8%, from $4.3 million in the fourth quarter 2019 to $4.0 million in the first quarter 2020. Compensation and benefits included non-cash expense of stock-based compensation of $0.6 million and $0.3 million for the three months ended March 31, 2020 and 2019, respectively. The Company consummated the internalization on February 20, 2020, and incurred $1.2 million of management fees up to that date. Beginning with the second quarter 2020, the Company will no longer incur fees to manager.
The Company incurred a net unrealized loss on investments of $11.0 million for the three months ended March 31, 2020, compared to a net unrealized gain of $8.8 million for the comparable period in 2019. The loss, and decrease compared to prior year, is attributable to (1) a significant decrease in the number of investments carried at fair value due to a significant increase in the number of properties owned outright, (2) fewer facilities achieving substantial completion in the 2020 period on account of reduced construction/development activity and delays due to the pandemic, (3) a prolonged economic stabilization of properties underlying investments carried at fair value, including longer physical lease-up
|
First Quarter 2020 |
|
6 |
periods and lower rates, due to the COVID-19 pandemic and its occurrence during a period of elevated new supply, and (4) a significant widening of credit spreads near the end of the first quarter caused by the pandemic and the resulting dramatic and rapid economic downturn.
Internalization expenses were $37.8 million for the quarter ended March 31, 2020 and were comprised of $37.4 million of expenses for the settlement of the pre-existing contractual agreement with the Manager and $0.4 million of acquisition-related expenses, both of which related to the Internalization. The Internalization also resulted in the Company recording goodwill of $4.7 million in its Consolidated Balance Sheets as of the date of acquisition. Generally accepted accounting principles (“GAAP”) require that the Company evaluate goodwill for impairment annually unless a triggering event occurs prior to that date. The Company determined that triggering events had occurred as a result of the COVID-19 pandemic and analyzed the goodwill for impairment. The Company determined that as of the measurement date the carrying value of its single reporting unit exceeded the fair value, resulting in a goodwill impairment loss of $4.7 million.
Loss per share and adjusted loss per share for the quarter ended March 31, 2020 were $(2.53) and $(0.42), respectively. Net loss attributable to common stockholders for the quarter ended March 31, 2020 was $58.0 million, compared to $7.1 million net income attributable to common stockholders for the comparable quarter in 2019. The decrease is largely attributable to the expense of internalization of $37.8 million, the goodwill impairment of $4.7 million and the net unrealized loss on investments carried at fair value, all as previously discussed.
Capital Markets, Capital Recycling & Liquidity Update
In January, the Company issued an aggregate $15.4 million of common stock under the Company’s at-the-market program at a weighted average share price of $19.07.
On March 26, 2020, the Company entered into an amended and restated senior secured revolving credit facility of up to $375 million with a syndicate of banks led by KeyBank National Association and BMO Harris Bank N.A. The $375 million credit facility, which has an accordion feature permitting expansion up to $750 million, subject to certain conditions including obtaining additional commitments from lenders, has a three-year term that expires March 24, 2023 and two one-year extension options.
|
· |
Upsized to $375 million from $235 million |
|
· |
Credit spreads lowered by 15-25 basis points |
|
· |
Maturity extended by approximately 1 ¼ years to March 24, 2023, plus two one-year extensions |
|
· |
Financial covenant package updated to support the Company’s growth plan |
|
· |
Added three new banks including Truist Bank, Synovus Bank and IberiaBank |
Borrowings under the credit facility are secured by three separate pools of collateral: one consisting of the Company’s development property investments, one consisting of non-stabilized self-storage properties wholly-owned by the Company, and the last consisting of stabilized self-storage properties wholly-owned by the Company. Advances under the credit agreement bear interest at rates between 210 and 300 basis points over 30-day LIBOR. These spreads are 15 to 25 basis points lower than the spreads under the previous credit facility, which were between 225 and 325 basis points. The Company’s weighted average spread based on its current borrowing base as of March 31, 2020 was 2.65%.
On May 4, 2020 and May 6, 2020, the Company entered into a $100 million interest rate swap and a $100 million interest rate cap on the Company’s senior secured line of credit, respectively, locking in a maximum one-month LIBOR of 0.43% on $200 million of outstanding credit facility through March 24, 2023 (the maturity date of the credit facility). With these contracts in place, the Company has locked in a maximum cost of debt on $200 million of debt capital at approximately 3.1%, which it expects to decline as the assets constituting the borrowing base mature.
In February, the Company’s only land loan was repaid for net proceeds to the Company of $3.8 million. The loan had been categorized on the Company’s consolidated balance sheet as part of other loans.
“We continue to monitor the effect of the pandemic on our operations and liquidity during these unprecedented times,” noted Kelly Luttrell, SVP and Chief Financial Officer. “With our upsized $375 million credit facility, ATM sales prior to the pandemic, and closed as well as potential capital recycling opportunities, we believe we are well positioned to fund our existing development commitments, opportunistically acquire developers’ interests and operate our core business as planned. Our contractual investment commitments in our development pipeline are now fully covered at conservative leverage levels for the foreseeable future, and we have the ability to continue to execute developer buy-outs opportunistically. As of the close of business on May 7, 2020, we have approximately $225 million drawn on the line with an additional $25 million of availability. We also have approximately $16 million of unrestricted cash on hand. By the end of the year, we expect borrowing base availability to be between $280 million and $310 million.”
Dividends
On February 21, 2020 the Company declared cash and stock dividends on its Series A Preferred Stock. The cash dividend of $2.4 million was paid on April 15, 2020 to holders of record on April 1, 2020. A stock dividend of 2,125 shares of additional Series A Preferred Stock was issued on April 15, 2020 to holders of record on April 1, 2020 for an aggregate value of $2.1 million pursuant to the terms of the Stock Purchase Agreement.
|
First Quarter 2020 |
|
7 |
On February, 21 2020, the Company declared a cash dividend on its Series B Preferred Stock. The cash dividend of $0.7 million was paid on April 15, 2020 to holders of record on April 1, 2020.
On February, 21 2020, the Company declared a dividend of $0.23 per common share. The dividend was paid on April 15, 2020 to common stockholders of record on April 1, 2020.
Suspending Full-Year 2020 Guidance
COVID-19 was characterized on March 11, 2020 by the World Health Organization as a pandemic. The extent to which the COVID-19 pandemic impacts our future operations, financial condition and financial results will depend on future developments, which are highly uncertain, including the scope, severity and duration of the pandemic, the actions taken to contain the pandemic or mitigate its impact, and the direct and indirect economic effects of the pandemic and containment measures. With the uncertainty and lack of visibility with respect to economic recovery, the Company is withdrawing our earnings per share and adjusted earnings per share guidance ranges for the full-year 2020, and will revisit earnings guidance at such time as visibility improves and the Company can predict with better certainty our results of operations.
|
First Quarter 2020 |
|
8 |
Jernigan Capital, Inc.
Financial Highlights- Trailing Five Quarters
(unaudited, in thousands, except share and per share data)
|
|
|
Three months ended |
|||||||||||||
|
|
|
March 31, |
|
December 31, |
|
September 30, |
|
June 30, |
|
March 31, |
|||||
|
|
|
2020 |
|
2019 |
|
2019 |
|
2019 |
|
2019 |
|||||
|
Operating Data: |
|
|
|
|
|
|
|
|
|
|
|
|
|
|
|
|
Interest income, rental-related income and other revenues |
|
$ |
11,697 |
|
$ |
12,128 |
|
$ |
12,249 |
|
$ |
10,832 |
|
$ |
9,884 |
|
JV income |
|
|
(165) |
|
|
160 |
|
|
165 |
|
|
85 |
|
|
156 |
|
Total revenues and JV income |
|
|
11,532 |
|
|
12,288 |
|
|
12,414 |
|
|
10,917 |
|
|
10,040 |
|
General & administrative expenses |
|
|
(3,994) |
|
|
(4,341) |
|
|
(4,268) |
|
|
(4,442) |
|
|
(3,765) |
|
Property operating expenses of real estate owned |
|
|
(2,047) |
|
|
(1,456) |
|
|
(989) |
|
|
(786) |
|
|
(762) |
|
Depreciation and amortization of real estate owned |
|
|
(3,584) |
|
|
(2,704) |
|
|
(1,372) |
|
|
(1,090) |
|
|
(1,029) |
|
Interest expense |
|
|
(3,212) |
|
|
(2,965) |
|
|
(2,546) |
|
|
(1,776) |
|
|
(1,213) |
|
Subtotal |
|
|
(1,305) |
|
|
822 |
|
|
3,239 |
|
|
2,823 |
|
|
3,271 |
|
Net unrealized gain (loss) on investments |
|
|
(10,962) |
|
|
7,555 |
|
|
7,974 |
|
|
12,043 |
|
|
8,830 |
|
Internalization expenses |
|
|
(37,783) |
|
|
(1,918) |
|
|
(268) |
|
|
- |
|
|
- |
|
Goodwill impairment loss |
|
|
(4,738) |
|
|
- |
|
|
- |
|
|
- |
|
|
- |
|
Other interest income |
|
|
6 |
|
|
6 |
|
|
9 |
|
|
8 |
|
|
13 |
|
Net income (loss) |
|
|
(54,782) |
|
|
6,465 |
|
|
10,954 |
|
|
14,874 |
|
|
12,114 |
|
Net income attributable to preferred stockholders |
|
|
(5,207) |
|
|
(5,195) |
|
|
(5,157) |
|
|
(5,094) |
|
|
(5,032) |
|
Less: Net loss attributable to non-controlling interests |
|
|
1,947 |
|
|
- |
|
|
- |
|
|
- |
|
|
- |
|
Net income (loss) attributable to common stockholders |
|
$ |
(58,042) |
|
$ |
1,270 |
|
$ |
5,797 |
|
$ |
9,780 |
|
$ |
7,082 |
|
Plus: stock dividends to preferred stockholders |
|
|
2,125 |
|
|
2,125 |
|
|
2,125 |
|
|
2,125 |
|
|
2,125 |
|
Plus: stock-based compensation |
|
|
606 |
|
|
553 |
|
|
549 |
|
|
719 |
|
|
328 |
|
Plus: net loss attributable to non-controlling interests |
|
|
(1,947) |
|
|
- |
|
|
- |
|
|
- |
|
|
- |
|
Plus: fees to Manager |
|
|
1,230 |
|
|
- |
|
|
- |
|
|
- |
|
|
- |
|
Plus: depreciation and amortization on real estate assets |
|
|
3,584 |
|
|
2,704 |
|
|
1,372 |
|
|
1,090 |
|
|
1,029 |
|
Plus: depreciation and amortization on SL1 Venture real estate assets |
|
|
63 |
|
|
93 |
|
|
82 |
|
|
82 |
|
|
56 |
|
Plus: goodwill impairment loss |
|
|
4,738 |
|
|
- |
|
|
- |
|
|
- |
|
|
- |
|
Plus: internalization expenses |
|
|
37,783 |
|
|
1,918 |
|
|
268 |
|
|
- |
|
|
- |
|
Adjusted Earnings (loss) |
|
$ |
(9,860) |
|
$ |
8,663 |
|
$ |
10,193 |
|
$ |
13,796 |
|
$ |
10,620 |
|
|
|
|
|
|
|
|
|
|
|
|
|
|
|
|
|
|
Basic earnings (loss) per share attributable to common stockholders |
|
$ |
(2.53) |
|
$ |
0.06 |
|
$ |
0.26 |
|
$ |
0.46 |
|
$ |
0.35 |
|
Diluted earnings (loss) per share attributable to common stockholders |
|
$ |
(2.53) |
|
$ |
0.06 |
|
$ |
0.26 |
|
$ |
0.46 |
|
$ |
0.35 |
|
|
|
|
|
|
|
|
|
|
|
|
|
|
|
|
|
|
Adjusted Earnings (loss) per share attributable to common and OC unit stockholders – diluted |
|
$ |
(0.42) |
|
$ |
0.39 |
|
$ |
0.46 |
|
$ |
0.65 |
|
$ |
0.52 |
|
|
|
|
|
|
|
|
|
|
|
|
|
|
|
|
|
|
Dividends declared per share of common stock |
|
$ |
0.23 |
|
$ |
0.35 |
|
$ |
0.35 |
|
$ |
0.35 |
|
$ |
0.35 |
|
|
|
|
|
|
|
|
|
|
|
|
|
|
|
|
|
|
Weighted-average shares of common stock outstanding: |
|
|
|
|
|
|
|
|
|
|
|
|
|
|
|
|
Basic |
|
|
22,973,028 |
|
|
22,035,950 |
|
|
22,019,875 |
|
|
21,185,484 |
|
|
20,297,551 |
|
Diluted |
|
|
22,973,028 |
|
|
22,252,115 |
|
|
22,233,594 |
|
|
21,387,462 |
|
|
20,455,116 |
|
Shares of common stock outstanding: |
|
|
23,271,859 |
|
|
22,423,283 |
|
|
22,236,871 |
|
|
22,133,290 |
|
|
20,567,694 |
|
|
|
|
|
|
|
|
|
|
|
|
|
|
|
|
|
|
Weighted-average OC Units outstanding |
|
|
854,929 |
|
|
- |
|
|
- |
|
|
- |
|
|
- |
|
OC Units outstanding |
|
|
1,877,398 |
|
|
- |
|
|
- |
|
|
- |
|
|
- |
|
|
|
|
|
|
|
|
|
|
|
|
|
|
|
|
|
|
Balance Sheet Data: |
|
|
|
|
|
|
|
|
|
|
|
|
|
|
|
|
Cash and cash equivalents |
|
$ |
7,341 |
|
$ |
3,278 |
|
$ |
6,961 |
|
$ |
4,169 |
|
$ |
3,860 |
|
Self-Storage Investment Portfolio: |
|
|
|
|
|
|
|
|
|
|
|
|
|
|
|
|
Development property investments at fair value |
|
|
427,435 |
|
|
549,684 |
|
|
508,887 |
|
|
476,889 |
|
|
405,999 |
|
Bridge investments at fair value |
|
|
- |
|
|
- |
|
|
- |
|
|
89,478 |
|
|
87,046 |
|
Self-storage real estate owned |
|
|
398,100 |
|
|
240,936 |
|
|
240,209 |
|
|
112,099 |
|
|
111,297 |
|
Accumulated depreciation on self-storage real estate owned |
|
|
(13,676) |
|
|
(10,092) |
|
|
(7,387) |
|
|
(6,016) |
|
|
(4,926) |
|
Self-storage real estate owned, net |
|
|
384,424 |
|
|
230,844 |
|
|
232,822 |
|
|
106,083 |
|
|
106,371 |
|
Investment in and advances to self-storage real estate venture |
|
|
6,113 |
|
|
11,247 |
|
|
11,027 |
|
|
12,416 |
|
|
12,360 |
|
Total assets |
|
|
841,409 |
|
|
812,777 |
|
|
776,233 |
|
|
703,292 |
|
|
630,632 |
|
Gross assets |
|
|
855,085 |
|
|
822,869 |
|
|
783,620 |
|
|
709,308 |
|
|
635,558 |
|
|
|
|
|
|
|
|
|
|
|
|
|
|
|
|
|
|
Secured revolving credit facility |
|
|
198,000 |
|
|
162,000 |
|
|
125,000 |
|
|
62,900 |
|
|
27,000 |
|
Term loans, net of unamortized costs |
|
|
40,851 |
|
|
40,791 |
|
|
40,735 |
|
|
33,711 |
|
|
33,716 |
|
Total liabilities |
|
|
257,305 |
|
|
223,903 |
|
|
186,816 |
|
|
116,437 |
|
|
77,831 |
|
|
|
|
|
|
|
|
|
|
|
|
|
|
|
|
|
|
Total Jernigan Capital, Inc. stockholders' equity |
|
|
551,191 |
|
|
588,874 |
|
|
589,417 |
|
|
586,855 |
|
|
552,801 |
|
Non-controlling interests |
|
|
32,913 |
|
|
- |
|
|
- |
|
|
- |
|
|
- |
|
Total equity |
|
|
584,104 |
|
|
588,874 |
|
|
589,417 |
|
|
586,855 |
|
|
552,801 |
|
First Quarter 2020 |
|
9 |
Jernigan Capital, Inc.
Consolidated Balance Sheets-Trailing Five Quarters
(unaudited, in thousands)
|
|
|
As of |
|||||||||||||
|
|
|
March 31, |
|
December 31, |
|
September 30, |
|
June 30, |
|
March 31, |
|||||
|
|
|
2020 |
|
2019 |
|
2019 |
|
2019 |
|
2019 |
|||||
|
Assets: |
|
|
|
|
|
|
|
|
|
|
|
|
|
|
|
|
Cash and cash equivalents |
|
$ |
7,341 |
|
$ |
3,278 |
|
$ |
6,961 |
|
$ |
4,169 |
|
$ |
3,860 |
|
Self-Storage Investment Portfolio: |
|
|
|
|
|
|
|
|
|
|
|
|
|
|
|
|
Development property investments at fair value |
|
|
427,435 |
|
|
549,684 |
|
|
508,887 |
|
|
476,889 |
|
|
405,999 |
|
Bridge investments at fair value |
|
|
- |
|
|
- |
|
|
- |
|
|
89,478 |
|
|
87,046 |
|
Self-storage real estate owned, net |
|
|
384,424 |
|
|
230,844 |
|
|
232,822 |
|
|
106,083 |
|
|
106,371 |
|
Investment in and advances to self-storage real estate venture |
|
|
6,113 |
|
|
11,247 |
|
|
11,027 |
|
|
12,416 |
|
|
12,360 |
|
Other loans, at cost |
|
|
219 |
|
|
4,713 |
|
|
4,417 |
|
|
4,576 |
|
|
5,025 |
|
Deferred financing costs |
|
|
7,752 |
|
|
4,154 |
|
|
4,090 |
|
|
4,327 |
|
|
4,404 |
|
Prepaid expenses and other assets |
|
|
7,925 |
|
|
8,654 |
|
|
7,813 |
|
|
5,129 |
|
|
5,348 |
|
Fixed assets, net |
|
|
200 |
|
|
203 |
|
|
216 |
|
|
225 |
|
|
219 |
|
Total assets |
|
$ |
841,409 |
|
$ |
812,777 |
|
$ |
776,233 |
|
$ |
703,292 |
|
$ |
630,632 |
|
|
|
|
|
|
|
|
|
|
|
|
|
|
|
|
|
|
Liabilities: |
|
|
|
|
|
|
|
|
|
|
|
|
|
|
|
|
Secured revolving credit facility |
|
$ |
198,000 |
|
$ |
162,000 |
|
$ |
125,000 |
|
$ |
62,900 |
|
$ |
27,000 |
|
Term loans, net of unamortized costs |
|
|
40,851 |
|
|
40,791 |
|
|
40,735 |
|
|
33,711 |
|
|
33,716 |
|
Due to Manager |
|
|
- |
|
|
3,164 |
|
|
2,749 |
|
|
2,453 |
|
|
2,267 |
|
Accounts payable, accrued expenses and other liabilities |
|
|
7,703 |
|
|
4,817 |
|
|
5,392 |
|
|
4,526 |
|
|
2,612 |
|
Dividends payable |
|
|
10,751 |
|
|
13,131 |
|
|
12,940 |
|
|
12,847 |
|
|
12,236 |
|
Total liabilities |
|
$ |
257,305 |
|
$ |
223,903 |
|
$ |
186,816 |
|
$ |
116,437 |
|
$ |
77,831 |
|
|
|
|
|
|
|
|
|
|
|
|
|
|
|
|
|
|
Equity: |
|
|
|
|
|
|
|
|
|
|
|
|
|
|
|
|
Series A Cumulative preferred stock |
|
$ |
132,762 |
|
$ |
130,637 |
|
$ |
128,512 |
|
$ |
126,387 |
|
$ |
124,262 |
|
Series B Cumulative preferred stock |
|
|
37,298 |
|
|
37,298 |
|
|
37,298 |
|
|
37,298 |
|
|
37,298 |
|
Common stock |
|
|
232 |
|
|
224 |
|
|
222 |
|
|
221 |
|
|
205 |
|
Additional paid-in capital |
|
|
450,318 |
|
|
426,129 |
|
|
422,240 |
|
|
419,760 |
|
|
389,431 |
|
Retained earnings (accumulated deficit) |
|
|
(68,417) |
|
|
(5,021) |
|
|
1,645 |
|
|
3,630 |
|
|
1,605 |
|
Accumulated other comprehensive income (loss) |
|
|
(1,002) |
|
|
(393) |
|
|
(500) |
|
|
(441) |
|
|
- |
|
Total Jernigan Capital, Inc. stockholders' equity |
|
|
551,191 |
|
|
588,874 |
|
|
589,417 |
|
|
586,855 |
|
|
552,801 |
|
Non-controlling interests |
|
|
32,913 |
|
|
- |
|
|
- |
|
|
- |
|
|
- |
|
Total equity |
|
|
584,104 |
|
|
588,874 |
|
|
589,417 |
|
|
586,855 |
|
|
552,801 |
|
Total liabilities and equity |
|
$ |
841,409 |
|
$ |
812,777 |
|
$ |
776,233 |
|
$ |
703,292 |
|
$ |
630,632 |
|
First Quarter 2020 |
|
10 |
Jernigan Capital, Inc.
Consolidated Statements of Operations
(unaudited, in thousands, except per share data)
|
|
|
Three months ended |
||||
|
|
|
March 31, |
||||
|
|
|
2020 |
|
2019 |
||
|
Revenues: |
|
|
|
|
||
|
Interest income from investments |
|
$ |
7,758 |
|
$ |
8,212 |
|
Rental and other property-related income from real estate owned |
|
|
3,878 |
|
|
1,450 |
|
Other revenues |
|
|
61 |
|
|
222 |
|
Total revenues |
|
|
11,697 |
|
|
9,884 |
|
|
|
|
|
|
|
|
|
Costs and expenses: |
|
|
|
|
|
|
|
General and administrative expenses |
|
|
2,764 |
|
|
1,762 |
|
Fees to Manager |
|
|
1,230 |
|
|
2,003 |
|
Property operating expenses of real estate owned |
|
|
2,047 |
|
|
762 |
|
Depreciation and amortization of real estate owned |
|
|
3,584 |
|
|
1,029 |
|
Goodwill impairment loss |
|
|
4,738 |
|
|
- |
|
Internalization expenses |
|
|
37,783 |
|
|
- |
|
Total costs and expenses |
|
|
52,146 |
|
|
5,556 |
|
|
|
|
|
|
|
|
|
Operating income (loss) |
|
|
(40,449) |
|
|
4,328 |
|
|
|
|
|
|
|
|
|
Other income (expense): |
|
|
|
|
|
|
|
Equity in earnings (losses) from unconsolidated real estate venture |
|
|
(165) |
|
|
156 |
|
Net unrealized gain (loss) on investments |
|
|
(10,962) |
|
|
8,830 |
|
Interest expense |
|
|
(3,212) |
|
|
(1,213) |
|
Other interest income |
|
|
6 |
|
|
13 |
|
Total other income (loss) |
|
|
(14,333) |
|
|
7,786 |
|
Net income (loss) |
|
$ |
(54,782) |
|
$ |
12,114 |
|
Net income attributable to preferred stockholders |
|
|
(5,207) |
|
|
(5,032) |
|
Less: Net loss attributable to non-controlling interests |
|
|
1,947 |
|
|
- |
|
Net income (loss) attributable to common stockholders |
|
$ |
(58,042) |
|
$ |
7,082 |
|
|
|
|
|
|
|
|
|
Basic earnings (loss) per share attributable to common stockholders |
|
$ |
(2.53) |
|
$ |
0.35 |
|
Diluted earnings (loss) per share attributable to common stockholders |
|
$ |
(2.53) |
|
$ |
0.35 |
|
|
|
|
|
|
|
|
|
Dividends declared per share of common stock |
|
$ |
0.23 |
|
$ |
0.35 |
|
First Quarter 2020 |
|
11 |
Jernigan Capital, Inc.
Calculation of Adjusted Earnings (Loss) and Reconciliation to Net Income (Loss) Attributable to Common Stockholders
(unaudited, in thousands, except share and per share data)
|
|
|
Three months ended |
|||||||||||||
|
|
|
March 31, |
|
December 31, |
|
September 30, |
|
June 30, |
|
March 31, |
|||||
|
|
|
2020 |
|
2019 |
|
2019 |
|
2019 |
|
2019 |
|||||
|
Net income (loss) attributable to common stockholders |
|
$ |
(58,042) |
|
$ |
1,270 |
|
$ |
5,797 |
|
$ |
9,780 |
|
$ |
7,082 |
|
Plus: stock dividends to preferred stockholders |
|
|
2,125 |
|
|
2,125 |
|
|
2,125 |
|
|
2,125 |
|
|
2,125 |
|
Plus: stock-based compensation |
|
|
606 |
|
|
553 |
|
|
549 |
|
|
719 |
|
|
328 |
|
Plus: net loss attributable to non-controlling interests |
|
|
(1,947) |
|
|
- |
|
|
- |
|
|
- |
|
|
- |
|
Plus: fees to Manager |
|
|
1,230 |
|
|
- |
|
|
- |
|
|
- |
|
|
- |
|
Plus: depreciation and amortization on real estate assets |
|
|
3,584 |
|
|
2,704 |
|
|
1,372 |
|
|
1,090 |
|
|
1,029 |
|
Plus: depreciation and amortization on SL1 Venture real estate assets |
|
|
63 |
|
|
93 |
|
|
82 |
|
|
82 |
|
|
56 |
|
Plus: goodwill impairment loss |
|
|
4,738 |
|
|
- |
|
|
- |
|
|
- |
|
|
- |
|
Plus: internalization expenses |
|
|
37,783 |
|
|
1,918 |
|
|
268 |
|
|
- |
|
|
- |
|
Adjusted Earnings (loss) |
|
$ |
(9,860) |
|
$ |
8,663 |
|
$ |
10,193 |
|
$ |
13,796 |
|
$ |
10,620 |
|
|
|
|
|
|
|
|
|
|
|
|
|
|
|
|
|
|
Adjusted Earnings (loss) per share attributable to common and OC unit stockholders – diluted |
|
$ |
(0.42) |
|
$ |
0.39 |
|
$ |
0.46 |
|
$ |
0.65 |
|
$ |
0.52 |
|
|
|
|
|
|
|
|
|
|
|
|
|
|
|
|
|
|
Weighted average shares of common stock and OC units outstanding – diluted |
|
|
23,827,957 |
|
|
22,252,115 |
|
|
22,233,594 |
|
|
21,387,462 |
|
|
20,455,116 |
|
First Quarter 2020 |
|
12 |
As of March 31, 2020
(unaudited, dollars in thousands)
|
Location |
|
|
|
|
|
|
|
|
|
|
|
|
|
|
|
|
(MSA) |
|
Date |
|
Date |
|
Size |
|
Months |
|
% Physical |
|
|
JCAP Capital |
||
|
Address |
|
Opened |
|
Acquired |
|
(NRSF) (1) |
|
Open (2) |
|
Occupancy (2) |
|
|
Investment (3) |
||
|
Atlanta 2 |
|
5/24/2016 |
|
2/2/2018 |
|
66,187 |
|
47 |
|
83.6 |
% |
|
|
|
8,766 |
|
Atlanta 1 |
|
5/25/2016 |
|
2/2/2018 |
|
71,718 |
|
47 |
|
87.2 |
% |
|
|
|
10,467 |
|
Atlanta 4 |
|
7/12/2018 |
|
2/21/2020 |
|
104,072 |
|
22 |
|
42.2 |
% |
|
|
|
17,611 |
|
Atlanta 6 |
|
10/15/2018 |
|
2/10/2020 |
|
82,690 |
|
19 |
|
43.4 |
% |
|
|
|
15,031 |
|
Atlanta 5 |
|
4/8/2019 |
|
2/10/2020 |
|
87,150 |
|
13 |
|
32.1 |
% |
|
|
|
21,910 |
|
Atlanta 3 |
|
8/6/2019 |
|
2/10/2020 |
|
93,283 |
|
9 |
|
27.3 |
% |
|
|
|
16,790 |
|
Atlanta MSA |
|
|
|
|
|
505,100 |
|
26 |
|
49.7 |
% |
(4) |
|
$ |
90,575 |
|
Miami 6 |
|
8/12/2016 |
|
9/17/2019 |
|
76,765 |
|
45 |
|
85.0 |
% |
|
|
|
- |
|
Miami 4 |
|
10/9/2016 |
|
9/17/2019 |
|
74,635 |
|
43 |
|
93.5 |
% |
|
|
|
- |
|
Miami 8 |
|
12/12/2016 |
|
9/17/2019 |
|
51,923 |
|
41 |
|
90.4 |
% |
|
|
|
- |
|
Miami 7 |
|
3/26/2018 |
|
9/17/2019 |
|
86,450 |
|
25 |
|
69.7 |
% |
|
|
|
- |
|
Miami 5 |
|
8/13/2018 |
|
9/17/2019 |
|
77,075 |
|
21 |
|
66.0 |
% |
|
|
|
- |
|
Miami |
|
2/10/2020 |
|
7/2/2019 |
|
69,739 |
|
3 |
|
12.9 |
% |
|
|
|
20,574 |
|
Miami MSA |
|
|
|
|
|
436,587 |
|
29 |
|
69.2 |
% |
(4) |
|
$ |
110,190 |
|
Charlotte 1 |
|
8/18/2016 |
|
8/31/2018 |
|
86,750 |
|
45 |
|
69.1 |
% |
|
|
|
10,525 |
|
Charlotte 2 |
|
8/30/2018 |
|
2/10/2020 |
|
76,545 |
|
20 |
|
54.1 |
% |
|
|
|
15,260 |
|
Charlotte MSA |
|
|
|
|
|
163,295 |
|
32 |
|
62.1 |
% |
(4) |
|
$ |
25,785 |
|
Jacksonville 1 |
|
8/12/2016 |
|
1/10/2018 |
|
59,848 |
|
45 |
|
85.7 |
% |
|
|
|
8,687 |
|
Jacksonville 2 |
|
3/27/2018 |
|
8/16/2019 |
|
70,255 |
|
25 |
|
73.6 |
% |
|
|
|
9,491 |
|
Jacksonville MSA |
|
|
|
|
|
130,103 |
|
35 |
|
79.2 |
% |
(4) |
|
$ |
18,178 |
|
Orlando 1/2 |
|
5/1/2016 |
|
8/9/2017 |
|
93,965 |
|
48 |
|
91.6 |
% |
|
|
|
12,049 |
|
New Haven |
|
12/16/2016 |
|
3/8/2019 |
|
64,225 |
|
41 |
|
85.1 |
% |
|
|
|
9,511 |
|
Pittsburgh |
|
5/11/2017 |
|
2/20/2018 |
|
47,828 |
|
36 |
|
68.6 |
% |
|
|
|
8,100 |
|
New York City 1 |
|
9/29/2017 |
|
12/21/2018 |
|
105,272 |
|
31 |
|
73.6 |
% |
|
|
|
20,440 |
|
Louisville 1 |
|
8/15/2018 |
|
2/10/2020 |
|
65,871 |
|
21 |
|
52.7 |
% |
|
|
|
10,137 |
|
Knoxville |
|
11/30/2018 |
|
2/10/2020 |
|
72,455 |
|
17 |
|
66.5 |
% |
|
|
|
11,139 |
|
Boston 2 |
|
3/19/2019 |
|
2/14/2020 |
|
76,606 |
|
13 |
|
46.5 |
% |
|
|
|
10,889 |
|
Fort Lauderdale |
|
5/2/2019 |
|
2/14/2020 |
|
80,569 |
|
12 |
|
57.9 |
% |
|
|
|
14,459 |
|
Total Owned Properties |
|
|
|
1,841,876 |
|
29 |
|
63.7 |
% |
(4) |
|
$ |
341,452 |
||
|
(1) |
The net rentable square feet (“NRSF”) includes only climate controlled and non-climate controlled storage space. It does not include retail space, office space, non-covered RV space or parking spaces. |
|
(2) |
As of May 3, 2020. |
|
(3) |
JCAP Capital Investment represents the sum of the funded principal balance of the loan (net of unamortized origination fees), cash consideration (inclusive of transaction costs), assumed liabilities, net property working capital acquired, all as of the date of acquisition, and any capital costs spent after the date of acquisition. |
|
(4) |
Average weighted based on NRSF. |
|
First Quarter 2020 |
|
13 |
JCAP Development Property Investments Open and Operating, at Fair Value
As of March 31, 2020
(unaudited, dollars in thousands)
|
Location |
|
|
|
|
|
|
|
|
|
|
|
|
|
|
|
|
|
|
Remaining |
|
|
|
|
|
(MSA) |
|
Investment |
Date |
|
Months |
|
Size |
|
% Physical |
|
|
|
|
|
Funded |
|
Unfunded |
|
Fair |
||||
|
Address |
|
Date |
Opened |
|
Open (1) |
|
(NRSF) (2) |
|
Occupancy (1) |
|
|
Commitment |
|
Investment |
|
Commitment (3) |
|
Value |
|||||
|
Orlando 3 |
|
2/24/2017 |
7/26/2018 |
|
21 |
|
69,558 |
|
59.2 |
% |
|
|
$ |
8,056 |
|
$ |
7,905 |
|
$ |
151 |
|
$ |
9,741 |
|
Orlando 4 |
|
8/30/2017 |
1/16/2019 |
|
16 |
|
76,340 |
|
52.9 |
% |
|
|
|
9,037 |
|
|
8,156 |
|
|
881 |
|
|
10,132 |
|
Orlando 5 |
|
6/7/2018 |
12/27/2019 |
|
4 |
|
75,736 |
|
12.2 |
% |
|
|
|
12,969 |
|
|
11,206 |
|
|
1,763 |
|
|
12,480 |
|
Orlando MSA |
|
|
|
|
14 |
|
221,634 |
|
41.0 |
% |
(7) |
|
$ |
30,062 |
|
$ |
27,267 |
|
$ |
2,795 |
|
$ |
32,353 |
|
Tampa 4 |
|
6/12/2017 |
10/9/2018 |
|
19 |
|
72,665 |
|
61.0 |
% |
|
|
|
10,266 |
|
|
9,808 |
|
|
458 |
|
|
12,748 |
|
Tampa 3 |
|
5/19/2017 |
11/29/2018 |
|
17 |
|
70,574 |
|
54.0 |
% |
|
|
|
9,224 |
|
|
8,470 |
|
|
754 |
|
|
10,079 |
|
Tampa 2 |
|
5/2/2017 |
5/9/2019 |
|
12 |
|
70,967 |
|
43.7 |
% |
|
|
|
8,091 |
|
|
7,776 |
|
|
315 |
|
|
9,156 |
|
Tampa MSA |
|
|
|
|
16 |
|
214,206 |
|
53.0 |
% |
(7) |
|
$ |
27,581 |
|
$ |
26,054 |
|
$ |
1,527 |
|
$ |
31,983 |
|
Minneapolis 2 |
|
2/8/2018 |
3/14/2019 |
|
14 |
|
83,648 |
|
32.6 |
% |
|
|
|
10,543 |
|
|
10,077 |
|
|
466 |
|
|
10,368 |
|
Minneapolis 1 |
|
11/21/2017 |
9/3/2019 |
|
8 |
|
88,898 |
|
16.0 |
% |
|
|
|
12,674 |
|
|
11,281 |
|
|
1,393 |
|
|
12,079 |
|
Minneapolis 3 |
|
4/6/2018 |
12/13/2019 |
|
5 |
|
87,375 |
|
9.2 |
% |
|
|
|
12,883 |
|
|
10,898 |
|
|
1,985 |
|
|
11,713 |
|
Minneapolis MSA |
|
|
|
|
9 |
|
259,921 |
|
19.1 |
% |
(7) |
|
$ |
36,100 |
|
$ |
32,256 |
|
$ |
3,844 |
|
$ |
34,160 |
|
Denver 2 |
|
4/20/2017 |
7/31/2018 |
|
21 |
|
74,307 |
|
56.2 |
% |
|
|
|
11,164 |
|
|
11,009 |
|
|
155 |
|
|
10,904 |
|
Denver 1 |
|
4/20/2017 |
6/28/2019 |
|
10 |
|
59,524 |
|
31.5 |
% |
|
|
|
9,806 |
|
|
9,789 |
|
|
17 |
|
|
10,420 |
|
Denver MSA |
|
|
|
|
16 |
|
133,831 |
|
45.2 |
% |
(7) |
|
$ |
20,970 |
|
$ |
20,798 |
|
$ |
172 |
|
$ |
21,324 |
|
New York City 2 (5) |
|
6/30/2017 |
12/28/2018 |
|
16 |
|
40,951 |
|
40.3 |
% |
|
|
|
27,982 |
|
|
29,692 |
|
|
163 |
|
|
29,063 |
|
New York City 5 |
|
12/28/2017 |
3/9/2020 |
|
2 |
|
90,575 |
|
5.8 |
% |
|
|
|
16,073 |
|
|
14,991 |
|
|
1,082 |
|
|
17,657 |
|
New York City MSA |
|
|
|
|
9 |
|
131,526 |
|
16.6 |
% |
(7) |
|
$ |
44,055 |
|
$ |
44,683 |
|
$ |
1,245 |
|
$ |
46,720 |
|
Milwaukee |
|
7/2/2015 |
10/9/2016 |
|
43 |
|
81,489 |
|
76.3 |
% |
|
|
|
7,650 |
|
|
7,648 |
|
|
2 |
|
|
8,503 |
|
Austin |
|
10/27/2015 |
3/16/2017 |
|
38 |
|
76,134 |
|
94.0 |
% |
|
|
|
8,658 |
|
|
8,136 |
|
|
522 |
|
|
8,111 |
|
Raleigh (8) |
|
8/14/2015 |
3/8/2018 |
|
26 |
|
60,171 |
|
80.2 |
% |
|
|
|
8,792 |
|
|
8,789 |
|
|
3 |
|
|
8,558 |
|
Boston 1 (4) |
|
6/29/2017 |
8/8/2018 |
|
21 |
|
90,503 |
|
53.9 |
% |
|
|
|
- |
|
|
- |
|
|
- |
|
|
3,700 |
|
Louisville 2 |
|
9/28/2017 |
8/31/2018 |
|
20 |
|
76,603 |
|
48.9 |
% |
|
|
|
9,940 |
|
|
9,695 |
|
|
245 |
|
|
11,252 |
|
Jacksonville 3 (8) |
|
7/27/2017 |
11/6/2018 |
|
18 |
|
68,100 |
|
46.7 |
% |
|
|
|
8,096 |
|
|
7,889 |
|
|
207 |
|
|
10,061 |
|
Baltimore 1 (5) |
|
6/19/2017 |
11/20/2018 |
|
17 |
|
83,560 |
|
36.9 |
% |
|
|
|
10,775 |
|
|
11,204 |
|
|
162 |
|
|
13,421 |
|
New Orleans |
|
2/24/2017 |
12/21/2018 |
|
16 |
|
86,545 |
|
48.7 |
% |
|
|
|
12,549 |
|
|
12,148 |
|
|
401 |
|
|
14,383 |
|
Philadelphia (5)(6) |
|
3/30/2018 |
4/25/2019 |
|
12 |
|
69,930 |
|
37.9 |
% |
|
|
|
14,338 |
|
|
11,536 |
|
|
3,264 |
|
|
11,807 |
|
Houston (6) |
|
3/1/2017 |
5/21/2019 |
|
11 |
|
131,845 |
|
18.6 |
% |
|
|
|
14,825 |
|
|
14,825 |
|
|
- |
|
|
17,820 |
|
Stamford (5) |
|
3/15/2019 |
10/24/2019 |
|
6 |
|
38,650 |
|
19.5 |
% |
|
|
|
2,904 |
|
|
3,115 |
|
|
- |
|
|
5,167 |
|
Kansas City |
|
5/23/2018 |
12/12/2019 |
|
5 |
|
76,822 |
|
15.6 |
% |
|
|
|
9,968 |
|
|
8,423 |
|
|
1,545 |
|
|
9,750 |
|
Atlanta 7 |
|
5/15/2018 |
3/23/2020 |
|
1 |
|
73,972 |
|
1.7 |
% |
|
|
|
9,418 |
|
|
6,923 |
|
|
2,495 |
|
|
8,045 |
|
Total Completed Development Investments |
|
15 |
|
1,975,442 |
|
39.5 |
% |
(7) |
|
$ |
276,681 |
|
$ |
261,389 |
|
$ |
18,429 |
|
$ |
297,118 | |||
|
(1) |
As of May 3, 2020. |
|
(2) |
The NRSF includes only climate controlled and non-climate controlled storage space. It does not include retail space, office space, non-covered RV space or parking spaces. |
|
(3) |
Commitment is fixed during underwriting at an amount deemed sufficient to cover interest carry and excess operating expenses over rental revenue during lease-up and deferred developer’s fees (if any) payable upon stabilization. Remaining unfunded commitment on completed projects is expected to be utilized primarily for such purposes. To the extent not needed for such purposes, such commitment will not be advanced. |
|
(4) |
This loan was repaid in full through a refinancing negotiated by our partner. The investment represents our 49.9% Profits Interest which was retained during the transaction. |
|
(5) |
The funded amount of these investments include PIK interest accrued on our loan or interest accrued on our preferred equity investment, as applicable. These interest amounts are not included in the commitment amount for each investment. |
|
(6) |
The Company has commenced foreclosure proceedings against the borrower. |
|
(7) |
Average weighted based on NRSF. |
|
(8) |
Subsequent to March 31, 2020, the Company purchased its partner’s 50.1% Profits Interest in these investments. |
|
First Quarter 2020 |
|
14 |
JCAP Development Property Investments Under Construction, at Fair Value
As of March 31, 2020
(unaudited, dollars in thousands)
The COVID-19 pandemic could delay the estimated timing of completion of these projects, because many jurisdictions have shut down or delayed entitlement activities, and “shelter in place” orders could potentially delay construction activities. In addition, the COVID-19 pandemic could extend the timeframe for a newly developed facility to reach stabilized occupancies and cash flows. We continue to monitor our projects to ensure that they still meet our risk-adjusted yield expectations, and reduced project yield estimates due to the COVID-19 pandemic or other factors could result in the cancellation of these projects in the future.
Planned:
|
|
|
Location |
|
|
|
|
|
|
|
Remaining |
|
|
|
|
|
|
|
|
Estimated |
|
|
|
|
(MSA) |
|
|
|
|
Funded |
|
Unfunded |
|
Fair |
|
Size |
|
Construction |
|
C/O |
|||
|
Closing Date |
|
Address |
|
Commitment |
|
Investment |
|
Commitment |
|
Value |
|
(NRSF) (1) |
|
Start Date |
|
Quarter (3) |
||||
|
9/14/2017 |
|
Los Angeles 1 |
|
|
28,750 |
|
|
10,393 |
|
|
18,357 |
|
|
10,365 |
|
120,038 |
|
Q3 2020 |
|
Q3 2021 |
|
9/14/2017 |
|
Miami 1 |
|
|
14,657 |
|
|
13,417 |
|
|
1,240 |
|
|
14,215 |
|
69,555 |
|
Q2 2018 |
|
Q2 2020 |
|
11/16/2017 |
|
Miami 3 (3) |
|
|
20,168 |
|
|
13,714 |
|
|
6,879 |
|
|
14,979 |
|
96,295 |
|
Q4 2018 |
|
Q2 2020 |
|
12/15/2017 |
|
New York City 4 |
|
|
10,591 |
|
|
7,705 |
|
|
2,886 |
|
|
8,835 |
|
78,325 |
|
Q2 2018 |
|
Q3 2020 |
|
6/12/2018 |
|
Los Angeles 2 (3) |
|
|
9,298 |
|
|
9,332 |
|
|
649 |
|
|
9,579 |
|
117,097 |
|
Q1 2020 |
|
Q2 2021 |
|
3/1/2019 |
|
New York City 6 |
|
|
18,796 |
|
|
3,572 |
|
|
15,224 |
|
|
3,462 |
|
76,250 |
|
Q3 2020 |
|
Q3 2021 |
|
4/18/2019 |
|
New York City 7 (3) |
|
|
23,462 |
|
|
9,823 |
|
|
13,827 |
|
|
9,451 |
|
95,331 |
|
Q3 2019 |
|
Q1 2021 |
|
5/8/2019 |
|
New York City 8 (3) |
|
|
21,000 |
|
|
22,306 |
|
|
- |
|
|
22,384 |
|
193,763 |
|
Q4 2020 |
|
Q4 2021 |
|
7/11/2019 |
|
New York City 9 (3) |
|
|
13,095 |
|
|
13,751 |
|
|
- |
|
|
13,588 |
|
105,950 |
|
Q3 2020 |
|
Q2 2021 |
|
8/21/2019 |
|
New York City 10 (3) |
|
|
8,674 |
|
|
9,041 |
|
|
- |
|
|
8,933 |
|
76,775 |
|
Q3 2019 |
|
Q2 2021 |
|
Total Development Investments in Progress |
|
$ |
168,491 |
|
$ |
113,054 |
|
$ |
59,062 |
|
$ |
115,791 |
|
1,029,379 |
|
|
|
|
||
|
(1) |
The NRSF includes only climate controlled and non-climate controlled storage space. It does not include retail space, office space, non-covered RV space or parking spaces. |
|
(2) |
Estimated C/O dates represent the Company’s best estimate as of March 31, 2020 based on project specific information learned through underwriting and communications with respective developers. These dates are subject to change due to unexpected project delays/efficiencies. |
|
(3) |
The funded amount of these investments include PIK interest accrued on our loan or interest accrued on our preferred equity investment, as applicable. These interest amounts are not included in the commitment amount for each investment. |
To date, we have re-assessed five development projects for which either development or construction has not yet commenced and communicated our intent to forgo those projects with the respective developers. The aggregate committed principal amount of the five investments is approximately $56.6 million with an outstanding principal of $15.7 million as of March 31, 2020. We and our respective developer partners on these investments are in active dialogues concerning the repayment of our outstanding principal along with any current and future accrued interest, but, more importantly, we are no longer obligated to fund the balance of those commitments, which positively affects our liquidity.
Forgone:
|
|
|
|
|
|
|
|
|
|
|
Remaining |
|
|
|
|
|
|
|
Location |
|
Original |
|
|
|
|
Unfunded |
|
|
|
||
|
|
|
(MSA) |
|
Investment |
|
Funded |
|
Original |
|
Fair |
||||
|
Closing Date |
|
Address |
|
Commitment |
|
Investment |
|
Commitment (2) |
|
Value |
||||
|
10/12/2017 |
|
Miami 2 (1) |
|
|
9,459 |
|
|
1,528 |
|
|
8,023 |
|
|
1,287 |
|
10/30/2017 |
|
New York City 3 (1) |
|
|
15,301 |
|
|
6,932 |
|
|
8,717 |
|
|
6,426 |
|
12/27/2017 |
|
Boston 3 |
|
|
10,174 |
|
|
2,805 |
|
|
7,369 |
|
|
2,683 |
|
5/1/2018 |
|
Miami 9 (1) |
|
|
12,421 |
|
|
3,642 |
|
|
8,951 |
|
|
3,424 |
|
11/16/2018 |
|
Baltimore 2 |
|
|
9,247 |
|
|
770 |
|
|
8,477 |
|
|
706 |
|
Total Forgone Investments |
|
$ |
56,602 |
|
$ |
15,677 |
|
$ |
41,537 |
|
$ |
14,526 |
||
|
(1) |
The funded amount of these investments include PIK interest accrued on our loan. These interest amounts are not included in the commitment amount for each investment. |
|
(2) |
We expect minimal additional fundings on these investments as we and our respective developer partners are in active dialogues concerning the repayment of our outstanding principal along with any current and future accrued interest. |
|
First Quarter 2020 |
|
15 |
JCAP Development Property Investments in Heitman Joint Venture
As of March 31, 2020
(unaudited, dollars in thousands)
JV Owned Properties:
|
Location |
|
|
|
|
|
|
|
|
|
|
|
|
|
|
|
|
(MSA) |
|
Date |
|
Date |
|
Size |
|
Months |
|
% Physical |
|
JV Capital |
|
||
|
Address |
|
Opened |
|
Acquired |
|
(NRSF) (1) |
|
Open (2) |
|
Occupancy (2) |
|
Investment (3) |
|
||
|
Jacksonville |
|
7/26/2017 |
|
1/28/2019 |
|
80,621 |
|
33 |
|
87.1 |
% |
|
$ |
12,564 |
|
|
Atlanta 2 |
|
9/14/2017 |
|
1/28/2019 |
|
70,089 |
|
32 |
|
78.2 |
% |
|
|
10,079 |
|
|
Denver |
|
12/14/2017 |
|
1/28/2019 |
|
85,500 |
|
29 |
|
65.9 |
% |
|
|
13,899 |
|
|
Atlanta 1 |
|
4/12/2018 |
|
1/28/2019 |
|
71,147 |
|
25 |
|
60.6 |
% |
|
|
11,770 |
|
|
Raleigh |
|
6/8/2018 |
|
11/7/2019 |
|
64,108 |
|
23 |
|
62.9 |
% |
|
|
8,945 |
|
|
Total Owned Properties |
|
|
|
371,465 |
|
28 |
|
71.3 |
% |
|
$ |
57,257 |
(4) |
||
|
(1) |
The NRSF includes only climate controlled and non-climate controlled storage space. It does not include retail space, office space, non-covered RV space or parking spaces. |
|
(2) |
As of May 3, 2020. |
|
(3) |
JV Capital Investment represents the sum of the funded principal balance of the loan (net of unamortized origination fees), cash consideration (inclusive of transaction costs), assumed liabilities, and net property working capital acquired, all as of the date of acquisition. |
|
(4) |
Average weighted based on NRSF. |
Development Projects Completed (all open and operating, at fair value):
|
Location |
|
|
|
|
|
|
|
|
|
|
|
|
|
|
|
|
|
|
Remaining |
|
|
|
|
|
(MSA) |
|
Investment |
|
Date |
Months |
|
Size |
|
% Physical |
|
|
|
|
Funded |
|
Unfunded |
|
Fair |
|||||
|
Address |
|
Date |
|
Opened |
Open(1) |
|
(NRSF)(2) |
|
Occupancy(1) |
|
Commitment |
|
Investment |
|
Commitment(3) |
|
Value |
||||||
|
Columbia |
|
9/28/2016 |
|
8/23/2017 |
32 |
|
70,935 |
|
79.2 |
% |
|
|
$ |
9,199 |
|
$ |
9,073 |
|
$ |
126 |
|
$ |
10,199 |
|
Washington DC (4) |
|
4/15/2016 |
|
9/25/2017 |
31 |
|
90,405 |
|
74.6 |
% |
|
|
|
- |
|
|
- |
|
|
- |
|
|
3,795 |
|
Miami 1 (4) |
|
5/14/2015 |
|
2/23/2018 |
26 |
|
75,770 |
|
73.5 |
% |
|
|
|
- |
|
|
- |
|
|
- |
|
|
1,608 |
|
Fort Lauderdale (4) |
|
9/25/2015 |
|
7/26/2018 |
21 |
|
87,384 |
|
73.3 |
% |
|
|
|
- |
|
|
- |
|
|
- |
|
|
4,884 |
|
Miami 2 (4) |
|
5/14/2015 |
|
10/30/2018 |
18 |
|
73,890 |
|
76.2 |
% |
|
|
|
- |
|
|
- |
|
|
- |
|
|
1,661 |
|
New Jersey |
|
7/21/2016 |
|
1/24/2019 |
15 |
|
59,110 |
|
56.7 |
% |
|
|
|
7,828 |
|
|
7,429 |
|
|
399 |
|
|
8,559 |
|
Total Completed Development Investments |
24 |
|
457,494 |
|
72.8 |
% |
(5) |
|
$ |
17,027 |
|
$ |
16,502 |
|
$ |
525 |
|
$ |
30,706 |
||||
|
(1) |
As of May 3, 2020. |
|
(2) |
The NRSF includes only climate controlled and non-climate controlled storage space. It does not include retail space, office space, non-covered RV space or parking spaces. |
|
(3) |
Commitment is fixed during underwriting at an amount deemed sufficient to cover interest carry and excess operating expenses over rental revenue during lease-up and deferred developer’s fees (if any) payable upon stabilization. Remaining unfunded commitment on completed projects is expected to be utilized primarily for such purposes. To the extent not needed for such purposes, such commitment will not be advanced. |
|
(4) |
The SL1 Venture’s loan was repaid in full through a refinancing initiated by the SL1 Venture’s partner. This investment represents the SL1 Venture’s 49.9% Profits Interest which was retained during the transaction. |
|
(5) |
Average weighted based on NRSF. |
|
First Quarter 2020 |
|
16 |
As of March 31, 2020
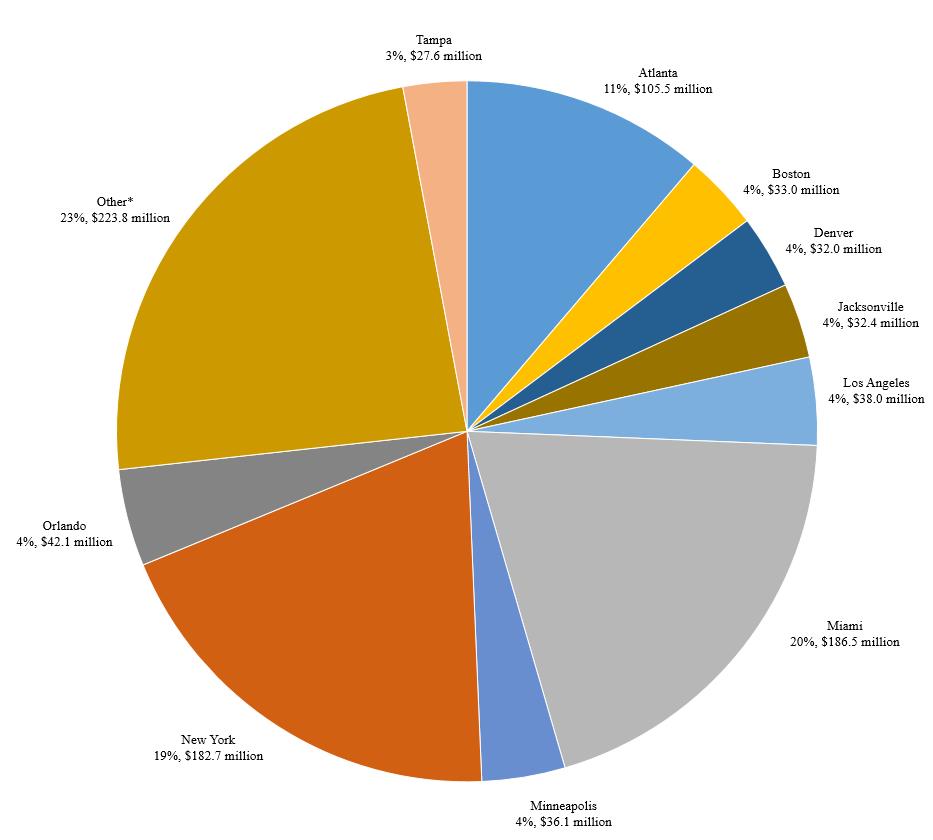
*Other markets include MSAs comprising of 2% (Baltimore, Charlotte, Fort Lauderdale, Houston, Louisville, Philadelphia, Raleigh, and Washington DC) and 1% (Austin, Columbia, Kansas City, Knoxville, Milwaukee, New Haven, New Orleans, Pittsburgh, and Stamford) of total closed investments.
Status of Investments:
|
|
|
# Properties |
|
# of Properties Open and Operating |
|
# of Properties Under Construction |
|
Size (NRSF) |
|
|
Total JCAP Investment Commitment |
|
On-balance sheet |
|
|
|
|
|
|
|
|
|
|
|
|
|
Wholly Owned Assets |
24 |
|
24 |
|
0 |
|
1,841,876 |
|
$ |
341,452 |
|
|
Development Property Investments |
36 |
|
26 |
|
10 |
|
3,004,821 |
|
$ |
445,172 |
|
|
Forgone Investments |
5 |
|
0 |
|
0 |
|
0 |
|
$ |
56,602 |
|
Joint Venture |
|
|
|
|
|
|
|
|
|
|
|
|
|
Wholly Owned Assets |
5 |
|
5 |
|
0 |
|
371,465 |
|
$ |
5,726 |
|
|
Development Property Investments |
6 |
|
6 |
|
0 |
|
457,494 |
|
$ |
1,703 |
|
First Quarter 2020 |
|
17 |
Capital Sources and Investment Uses
As of March 31, 2020
(dollars in millions)
|
Estimated Capital to be Used in Investing Activities (1) |
|
|
|
Contractual investment obligations: |
|
|
|
Development property investments (2) |
$ |
119 |
|
Less: Forgone investments |
|
(42) |
|
Total to Fund Investments |
$ |
77 |
|
|
|
|
|
|
|
|
|
Known/Committed Capital Sources |
|
|
|
Cash and cash equivalents as of March 31, 2020 |
$ |
7 |
|
Current net borrowing base capacity under credit facility (3) |
|
52 |
|
Total Known/Committed Sources |
$ |
59 |
|
|
|
|
|
Estimated Additional Sources of Capital |
|
|
|
Borrowing base additions under credit facility - within one year (3) |
$ |
30 - 60 |
|
Repayments on forgone investments |
|
16 |
|
Issuance of common stock under ATM (remaining ATM availability) |
|
81 |
|
Repayments/refinancings of existing JCAP mortgages - within one year |
|
15 - 25 |
|
Total Additional Sources |
$ |
142 - 182 |
|
(1) |
Does not include financing spend or operating cash flow. |
|
(2) |
Includes non-cash interest reserves of approximately $26 million. |
|
(3) |
As of March 31, 2020, the Company had $51.6 million of net borrowing base capacity under the Credit Facility after considering the $198.0 million outstanding. We expect the borrowing base capacity to increase by $30 - $60 million by March 31, 2021 as additional assets are added and assets are transferred within the borrowing base to wholly-owned collateral tranches. |
Timing of Funding $77 million of Committed Development Property Investments (1)
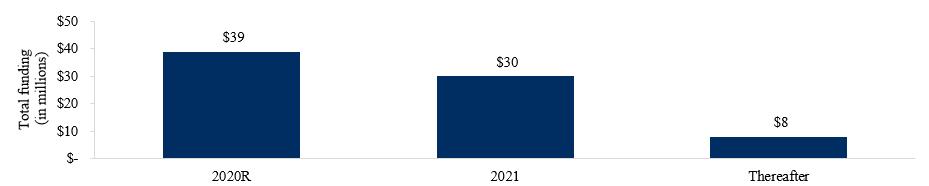
|
(1) |
Includes non-cash interest reserves of approximately $22 million. |
JCAP Capital Structure as a Percentage of Total Assets
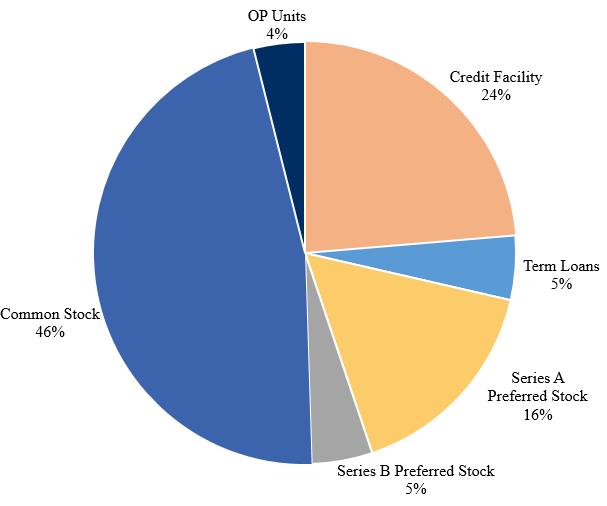
|
First Quarter 2020 |
|
18 |
As of March 31, 2020
(dollars in thousands)
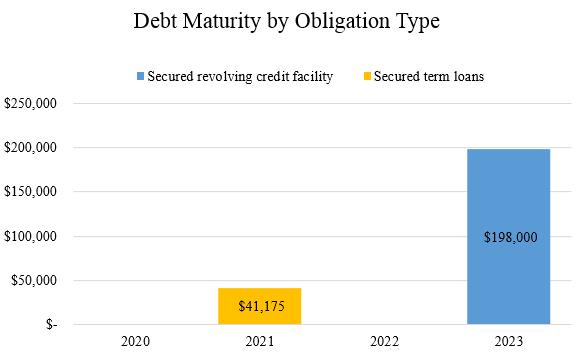
The following schedule depicts the impact of interest rate swaps and interest rate caps on our debt as of March 31, 2020:
|
|
Venture Level |
|
Company's Portion |
|
Debt Maturity Date |
|
|
Effective Interest Rate Prior to Hedging |
|
Effective Interest Rate After Hedging |
|
Hedge Effective Date |
|
Hedge Maturity Date |
||||
|
Secured revolving credit facility(1) |
|
n/a |
|
$ |
198,000 |
|
3/24/2023 |
|
|
4.33 |
% |
|
4.33 |
% |
|
(1) |
|
(1) |
|
Term loans 1-4 |
|
n/a |
|
|
34,088 |
|
8/1/2021 |
|
|
3.83 |
% |
|
4.54 |
% |
|
6/3/2019 |
|
8/1/2021 |
|
Term loan 5 |
|
n/a |
|
|
7,087 |
|
8/1/2021 |
|
|
3.83 |
% |
|
3.85 |
% |
|
8/13/2019 |
|
8/1/2021 |
|
Total Jernigan Capital Inc. before SL1 (% represent Weighted Average) |
|
|
|
|
239,175 |
|
|
|
|
4.24 |
% |
|
4.34 |
% |
|
|
|
|
|
SL1 Term Loan |
|
36,087 |
|
|
3,609 |
|
2/27/2022 |
|
|
3.73 |
% |
|
4.44 |
% |
|
4/1/2019 |
|
4/1/2021 |
|
SL1 Term Loan 2 |
|
3,250 |
|
|
325 |
|
2/27/2022 |
|
|
3.73 |
% |
|
3.73 |
% |
|
|
|
|
|
Total Debt |
$ |
39,337 |
|
$ |
243,109 |
|
|
|
|
4.23 |
% |
|
4.34 |
% |
|
|
|
|
|
(1) |
In May 2020, we entered into a $100 million interest rate swap with an effective rate of 0.36% and a $100 million interest rate cap with a strike price of 0.50% on the Secured revolving credit facility. Both interest rate instruments mature March 24, 2023. The facility is also subject to a $100 million interest rate cap with a strike price of 2.50% effective June 25, 2019 and a $20 million interest rate cap with a strike price of 1.50% effective March 18, 2020. Both of those interest rate caps mature December 28, 2021. With these contracts in place, we have locked in a maximum cost of debt on $200 million of debt capital at approximately 3.1%, which we anticipate will decrease as investments underlying the borrowing base mature. |
The terms of our Credit Facility contain certain financial covenants including the following:
|
|
|
Covenant Requirement as of March 31, 2020 |
|
|
Actual as of March 31, 2020 |
|
Total Leverage |
|
≤ 45.0% |
|
|
33.50% |
|
Fixed Charge Coverage |
|
≥ 1.15x |
|
|
1.32x |
|
Debt Service Coverage |
|
≥ 2.00x |
|
|
2.89x |
|
Min Net Worth |
|
$360.5M |
|
|
$487.2M |
|
Min Liquidity |
|
$25M |
|
|
$58.9M |
|
Min Borrowing Base # assets |
|
25 |
|
|
37 |
|
Min Borrowing Base % of assets in Tranche B & C |
|
20% |
|
|
61% |
|
First Quarter 2020 |
|
19 |
|
Company Information
|
||||||
|
|
|
|
|
|
|
|
|
Corporate Headquarters |
|
Trading Symbol |
|
Investor Relations |
|
Information Requests |
|
6410 Poplar Avenue |
|
Common shares: JCAP |
|
6410 Poplar Avenue |
|
To request an Investor Relations |
|
Suite 650 |
|
7.00% Series B Preferred Stock: JCAP-PR B |
|
Suite 650 |
|
package or annual report, please |
|
Memphis, TN 38119 |
|
Stock Exchange Listing |
|
Memphis, TN 38119 |
|
visit our website at |
|
901.567.9510 |
|
New York Stock Exchange |
|
901.567.9510 |
|
www.jernigancapital.com |
|
Executive Management |
||
|
|
|
|
|
John A. Good |
|
Jonathan Perry |
|
Chairman and Chief Executive Officer |
|
President and Chief Investment Officer |
|
|
|
|
|
Kelly P. Luttrell |
|
David Corak |
|
Senior Vice President, Chief Financial Officer, Treasurer and |
|
Senior Vice President of Corporate Finance |
|
Corporate Secretary |
|
|
|
|
|
|
|
Billy Perry |
|
|
|
Senior Vice President of Investment Management |
|
|
|
|
|
|
|
Independent Directors |
||
|
|
|
|
|
Mark O. Decker |
|
James D. Dondero |
|
Director |
|
Director |
|
|
|
|
|
Rebecca Owen |
|
Howard A. Silver |
|
Director |
|
Director |
|
|
|
|
|
Harry J. Thie |
|
|
|
Director |
|
|
|
|
|
|
|
Equity Research Coverage |
||
|
|
|
|
|
Baird Equity Research |
|
B. Riley FBR |
|
RJ Milligan |
|
Tim Hayes |
|
rjmilligan@rwbaird.com |
|
timothyhayes@brileyfbr.com |
|
|
|
|
|
Jefferies LLC |
|
KeyBanc Capital Markets |
|
Jonathan Petersen |
|
Todd M. Thomas |
|
jpetersen@jefferies.com |
|
tthomas@key.com |
|
|
|
|
|
Raymond James & Associates |
|
|
|
Jonathan Hughes |
|
|
|
jonathan.hughes@raymondjames.com |
|
|
Any opinions, estimates, forecasts or predictions regarding Jernigan Capital’s performance made by these analysts are theirs alone and do not represent opinions, estimates, forecasts or predictions of Jernigan Capital or its management. Jernigan Capital does not by its reference above or distribution imply its endorsement of or concurrence with such opinions, estimates, forecasts or predictions.
|
First Quarter 2020 |
|
20 |