
Investor Update Talen Energy Corporation | September 9, 2025
1 Disclaimers The information contained herein, as well as any information that has been supplied orally in connection herewith, speaks only as of the date of this presentation. Talen Energy Corporation (“Talen,” “TEC,” the “Company,” “we,” “our,” or “us”) and our affiliates and representatives expressly disclaim any obligation to update any information contained herein, whether as a result of new information or circumstances, future events or otherwise. The information contained herein is summary. For additional information, see the Company’s historical financial statements and other information included in its periodic reports and other filings with the U.S. Securities and Exchange Commission (the “SEC”) (available at www.sec.gov/edgar). Nothing contained herein should be construed as legal, business, tax, accounting or other professional advice, and you should consult your own advisors regarding such matters. These materials should not be relied upon for the maintenance of your books and records for any tax, accounting, legal or other procedures. Non-GAAP Financial Measures We include in this presentation Adjusted EBITDA and Adjusted Free Cash Flow, which we use as measures of our performance and liquidity, and which are not financial measures prepared under U.S. Generally Accepted Accounting Principles (“GAAP”). Non-GAAP financial measures, such as Adjusted EBITDA and Adjusted Free Cash Flow, do not have definitions under GAAP and may be defined differently by, and not be comparable to, similarly titled measures used by other companies or used in our credit facilities, the indentures governing our notes or any of our other debt agreements. Generally, a non-GAAP financial measure is a numerical measure of financial performance, financial position or cash flows that excludes (or includes) amounts that are included in (or excluded from) the most directly comparable measure calculated and presented in accordance with GAAP. Management cautions investors not to place undue reliance on such non-GAAP measures, but to consider them along with their most directly comparable GAAP measures. Adjusted EBITDA and Adjusted Free Cash Flow have limitations as analytical tools and should not be considered in isolation or as a substitute for analyzing our results as reported under GAAP. Please see the “Reconciliation of Non-GAAP Financial Measures” section of Appendix C for more detail. Due to the difficulty in predicting certain components of Adjusted EBITDA and Adjusted Free Cash Flow for Freedom and Guernsey, as well as for 2028E Outlook, with a reasonable degree of certainty, we are unable to reconcile certain related non-GAAP financial measures to the comparable GAAP measures without unreasonable efforts. Market and Industry Data This presentation includes market data and other information from independent industry publications, as well as surveys and our own research and knowledge of the industry. Some data is also based on management’s estimates, which are derived from our review of internal sources, as well as the independent sources described above. Although we believe these sources are reliable, the third-party information contained in this presentation has not been independently investigated, verified or audited and, therefore, we cannot guarantee the accuracy or completeness of such information. As a result, you should be aware that market share, ranking and other similar data set forth in this presentation, and estimates and beliefs based on such data, may not be reliable. Forward Looking Statements Statements contained in this presentation concerning expectations, beliefs, plans, objectives, goals, strategies, future events or performance, shareholder returns and underlying assumptions, and other statements that are not statements of historical fact are “forward-looking statements,” and should be considered estimates, assumptions or projections. These statements often include words such as “believe,” “expect,” “anticipate,” “intend,” “plan,” “estimate,” “target,” “project,” “forecast,” “seek,” “will,” “may,” “should,” “could,” “would,” “goal,” “predict,” “continue,” “potential” or similar expressions. Any such forward-looking statements reflect various estimates and assumptions. Although we believe that the expectations and assumptions reflected in these statements are reasonable, there can be no assurance that they will prove to be correct. No representations or warranties are made by Talen or any of its affiliates, shareholders, directors, officers, employees, agents, partners or professional advisors as to the accuracy or achievability of any such forward-looking statements. Except as otherwise required by law, Talen undertakes no obligation to update any forward-looking statement to reflect new information or circumstances, future events or otherwise after the date on which such statement is made. Forward-looking statements are subject to many risks and uncertainties, and actual results may differ materially due to many factors. New factors emerge from time to time, and it is not possible for us to predict all of these factors. In addition to the specific factors discussed in the sections entitled “Cautionary Note Regarding Forward-Looking Information” and “Risk Factors” in our periodic reports and other filings with the SEC, the following are among the important factors that could cause actual results to differ materially from forward-looking statements: Talen’s or its subsidiaries’ levels of indebtedness; the terms and conditions of debt instruments that may restrict Talen’s ability to operate its business; operational, price and credit risks in the wholesale and retail electricity markets (including as a result of increases in the supply of electricity generally due to new power or intermittent renewable power generation); the effectiveness of Talen’s risk management techniques, including hedging, with respect to electricity and fuel prices, interest rates and counterparty and joint venture partner credit and non-performance risks; methods of accounting and developments in or interpretations of accounting requirements that may impact reported results, including with respect to, but not limited to, hedging activity; Talen’s ability to forecast and provide the actual load needed to perform sales contracts; the effects of transmission congestion due to line maintenance outages and the performance of transmission facilities and any changes in the structure and operation of, or the pricing limitations imposed by, the Regional Transmission Organizations and Independent System Operators that operate those facilities; blackouts due to disruptions in neighboring interconnected systems; the impacts of federal, state, local and market legislation, regulation, proceedings and other actions, including but not limited to those related to energy, the environment and tax, the outcomes thereof and the costs of compliance therewith; the impacts of new or revised United States and/or international trade tariffs, treaties, policies, and regulations; the costs of complying with environmental, social and related worker health and safety laws and regulations; the impacts of climate change, including changes in regulation or their enforcement; the availability and cost of emission allowances; the performance of Talen’s subsidiaries and affiliates, on which our ability to meet our debt obligations largely depend; the risks inherent with variable rate indebtedness; disruption in or adverse developments of financial markets; acquisition or divestiture activities, including Talen’s ability to realize expected synergies and other benefits from such business transactions; Talen’s ability to achieve anticipated cost savings; the execution and development of proposed future enterprises, including the ability to permit, develop, construct and operate proposed renewable energy, energy storage and/or data center facilities, realization of assumptions underlying the statements regarding future enterprises, and realization of estimates of valuations of future enterprises; Talen’s ability to optimize its competitive power generation operations and the costs associated with any capital expenditures; the proposed Freedom and Guernsey acquisitions, including the financing, expected timing and completion (including required regulatory approvals), and anticipated impacts thereof; significant increases in operation and maintenance expenses, such as health care, and pension costs, including as a result of changes in interest rates; the loss of key personnel, the ability to hire and retain qualified employees, and the possibility of union strikes or work stoppages; war (including supply chain disruptions as a result of war, and including the effects of the Ukraine/Russia and Middle East conflicts, attendant sanctions and related disruptions in oil and natural gas production and the supply of nuclear fuel), armed conflicts or terrorist attacks, including cyber-based attacks; and pandemics, epidemics, and public health emergencies. Recipients are cautioned to not place undue reliance on such forward-looking statements.
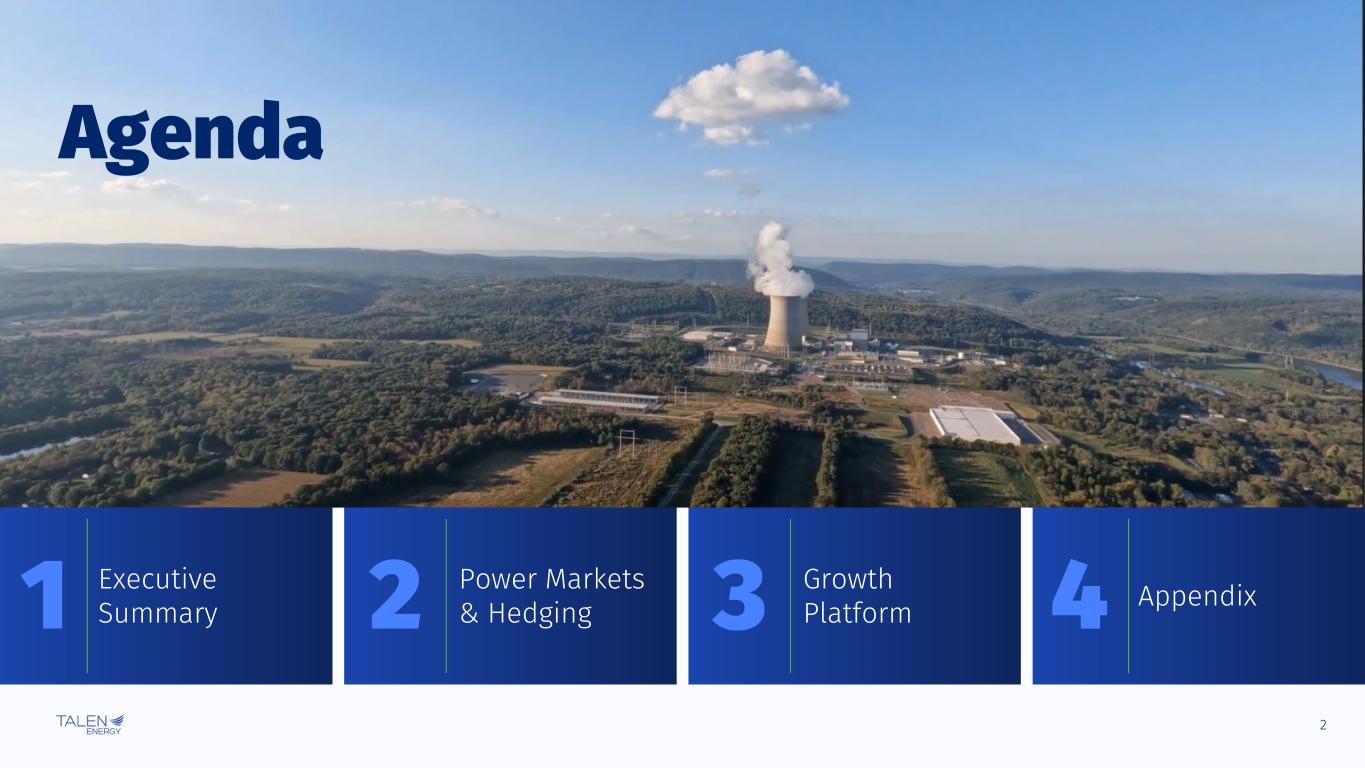
2 Agenda Executive Summary1 Growth Platform3 Appendix4Power Markets & Hedging2
Executive Summary
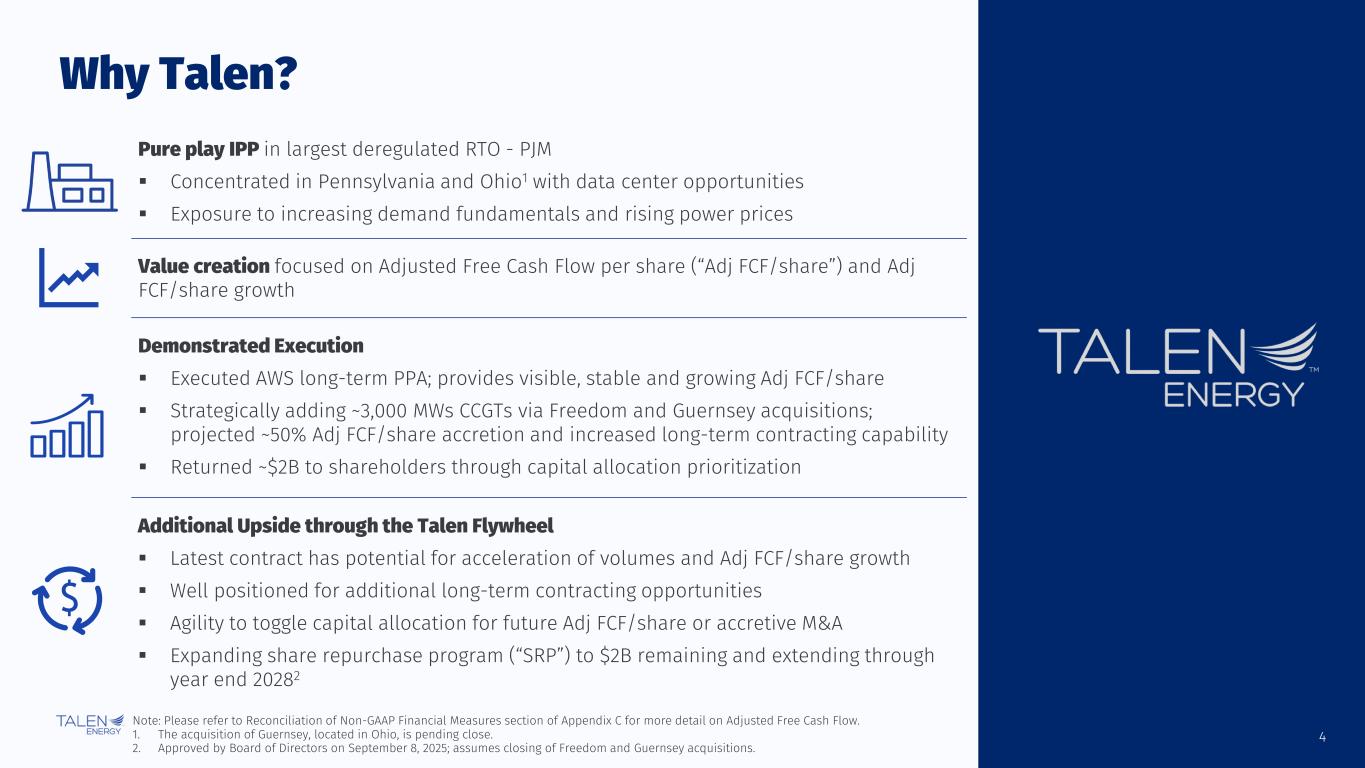
4 Why Talen? Pure play IPP in largest deregulated RTO - PJM Concentrated in Pennsylvania and Ohio1 with data center opportunities Exposure to increasing demand fundamentals and rising power prices Demonstrated Execution Executed AWS long-term PPA; provides visible, stable and growing Adj FCF/share Strategically adding ~3,000 MWs CCGTs via Freedom and Guernsey acquisitions; projected ~50% Adj FCF/share accretion and increased long-term contracting capability Returned ~$2B to shareholders through capital allocation prioritization Additional Upside through the Talen Flywheel Latest contract has potential for acceleration of volumes and Adj FCF/share growth Well positioned for additional long-term contracting opportunities Agility to toggle capital allocation for future Adj FCF/share or accretive M&A Expanding share repurchase program (“SRP”) to $2B remaining and extending through year end 20282 Value creation focused on Adjusted Free Cash Flow per share (“Adj FCF/share”) and Adj FCF/share growth $ 4 Note: Please refer to Reconciliation of Non-GAAP Financial Measures section of Appendix C for more detail on Adjusted Free Cash Flow. 1. The acquisition of Guernsey, located in Ohio, is pending close. 2. Approved by Board of Directors on September 8, 2025; assumes closing of Freedom and Guernsey acquisitions.
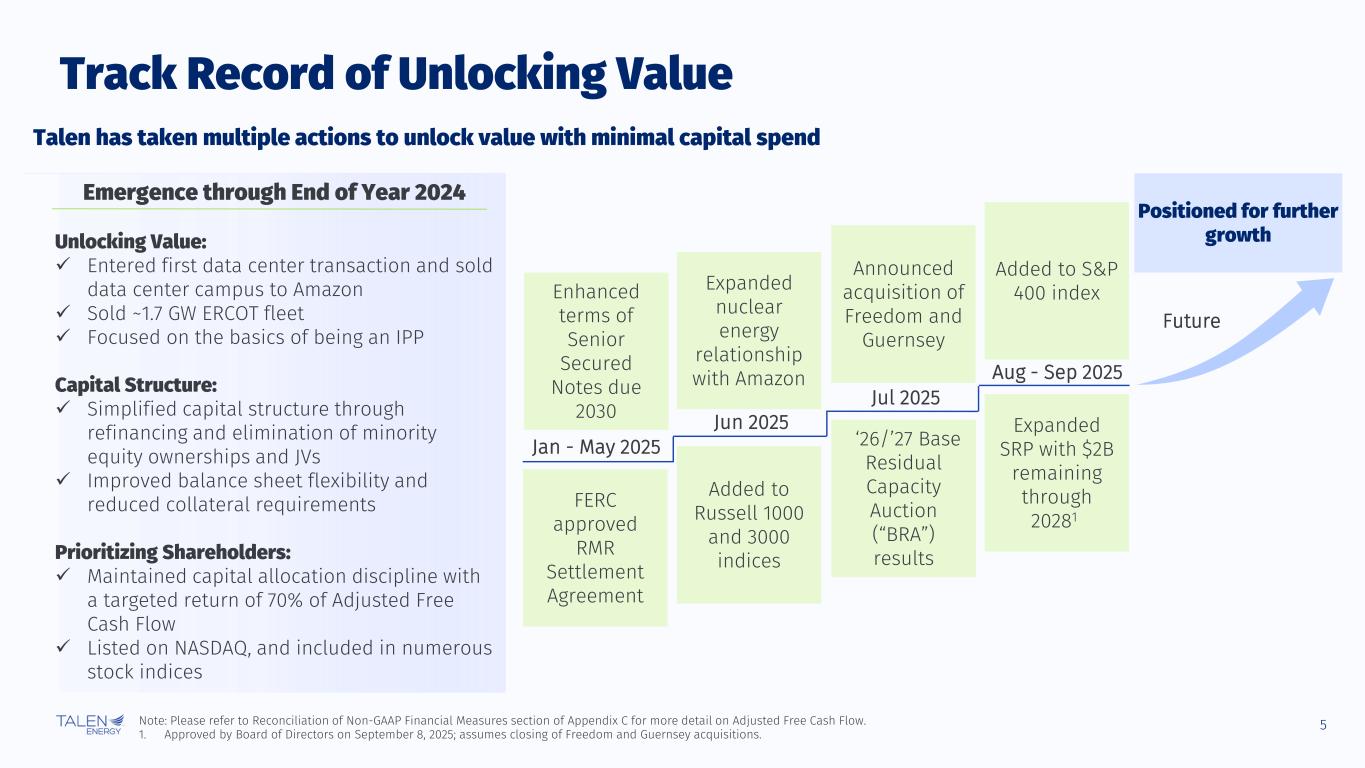
5 Track Record of Unlocking Value Talen has taken multiple actions to unlock value with minimal capital spend Future Jan - May 2025 Jun 2025 Jul 2025 Aug - Sep 2025 Positioned for further growth Announced acquisition of Freedom and Guernsey FERC approved RMR Settlement Agreement Expanded nuclear energy relationship with Amazon Added to S&P 400 index Added to Russell 1000 and 3000 indices ‘26/’27 Base Residual Capacity Auction (“BRA”) results Enhanced terms of Senior Secured Notes due 2030 Emergence through End of Year 2024 Unlocking Value: Entered first data center transaction and sold data center campus to Amazon Sold ~1.7 GW ERCOT fleet Focused on the basics of being an IPP Capital Structure: Simplified capital structure through refinancing and elimination of minority equity ownerships and JVs Improved balance sheet flexibility and reduced collateral requirements Prioritizing Shareholders: Maintained capital allocation discipline with a targeted return of 70% of Adjusted Free Cash Flow Listed on NASDAQ, and included in numerous stock indices Expanded SRP with $2B remaining through 20281 Note: Please refer to Reconciliation of Non-GAAP Financial Measures section of Appendix C for more detail on Adjusted Free Cash Flow. 1. Approved by Board of Directors on September 8, 2025; assumes closing of Freedom and Guernsey acquisitions.
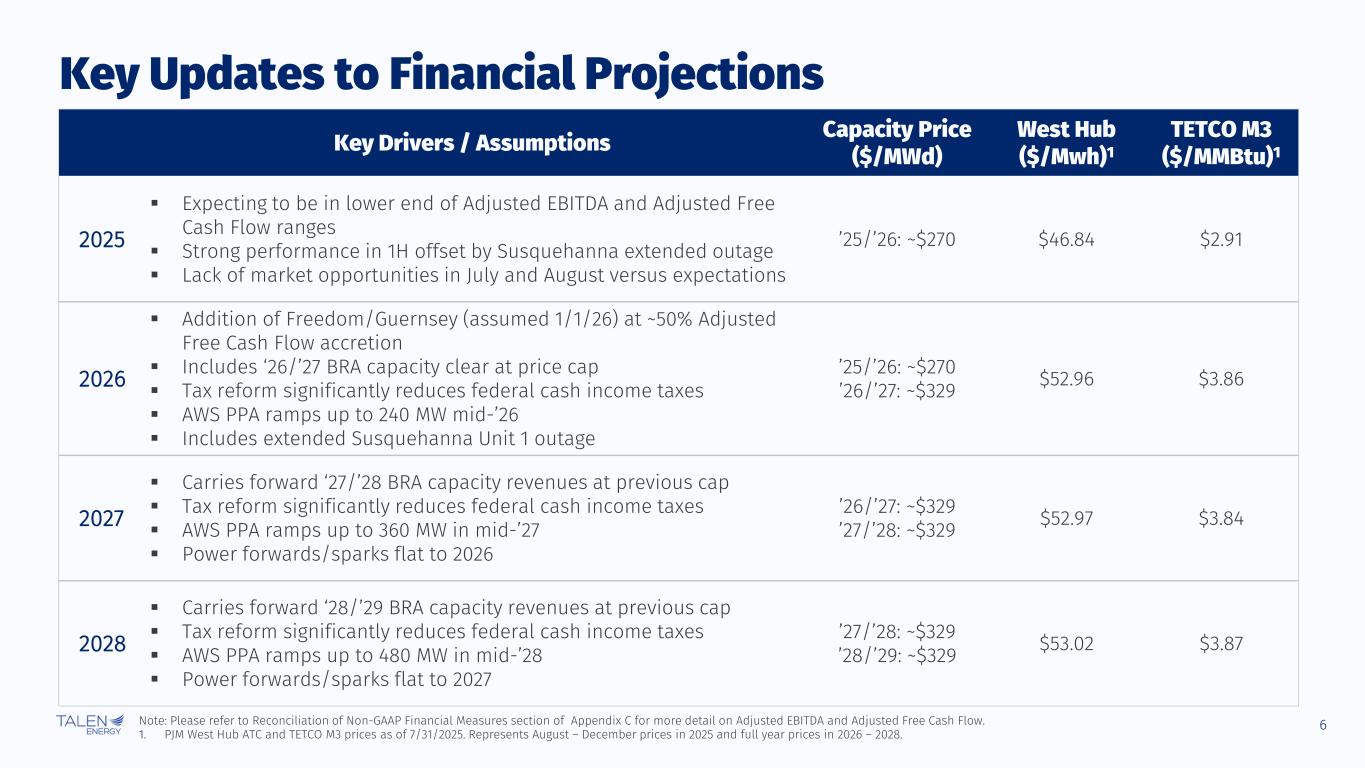
6 Key Updates to Financial Projections Key Drivers / Assumptions Capacity Price ($/MWd) West Hub ($/Mwh)1 TETCO M3 ($/MMBtu)1 2025 Expecting to be in lower end of Adjusted EBITDA and Adjusted Free Cash Flow ranges Strong performance in 1H offset by Susquehanna extended outage Lack of market opportunities in July and August versus expectations ’25/’26: ~$270 $46.84 $2.91 2026 Addition of Freedom/Guernsey (assumed 1/1/26) at ~50% Adjusted Free Cash Flow accretion Includes ‘26/’27 BRA capacity clear at price cap Tax reform significantly reduces federal cash income taxes AWS PPA ramps up to 240 MW mid-’26 Includes extended Susquehanna Unit 1 outage ’25/’26: ~$270 ’26/’27: ~$329 $52.96 $3.86 2027 Carries forward ‘27/’28 BRA capacity revenues at previous cap Tax reform significantly reduces federal cash income taxes AWS PPA ramps up to 360 MW in mid-’27 Power forwards/sparks flat to 2026 ’26/’27: ~$329 ’27/’28: ~$329 $52.97 $3.84 2028 Carries forward ‘28/’29 BRA capacity revenues at previous cap Tax reform significantly reduces federal cash income taxes AWS PPA ramps up to 480 MW in mid-’28 Power forwards/sparks flat to 2027 ’27/’28: ~$329 ’28/’29: ~$329 $53.02 $3.87 Note: Please refer to Reconciliation of Non-GAAP Financial Measures section of Appendix C for more detail on Adjusted EBITDA and Adjusted Free Cash Flow. 1. PJM West Hub ATC and TETCO M3 prices as of 7/31/2025. Represents August – December prices in 2025 and full year prices in 2026 – 2028.
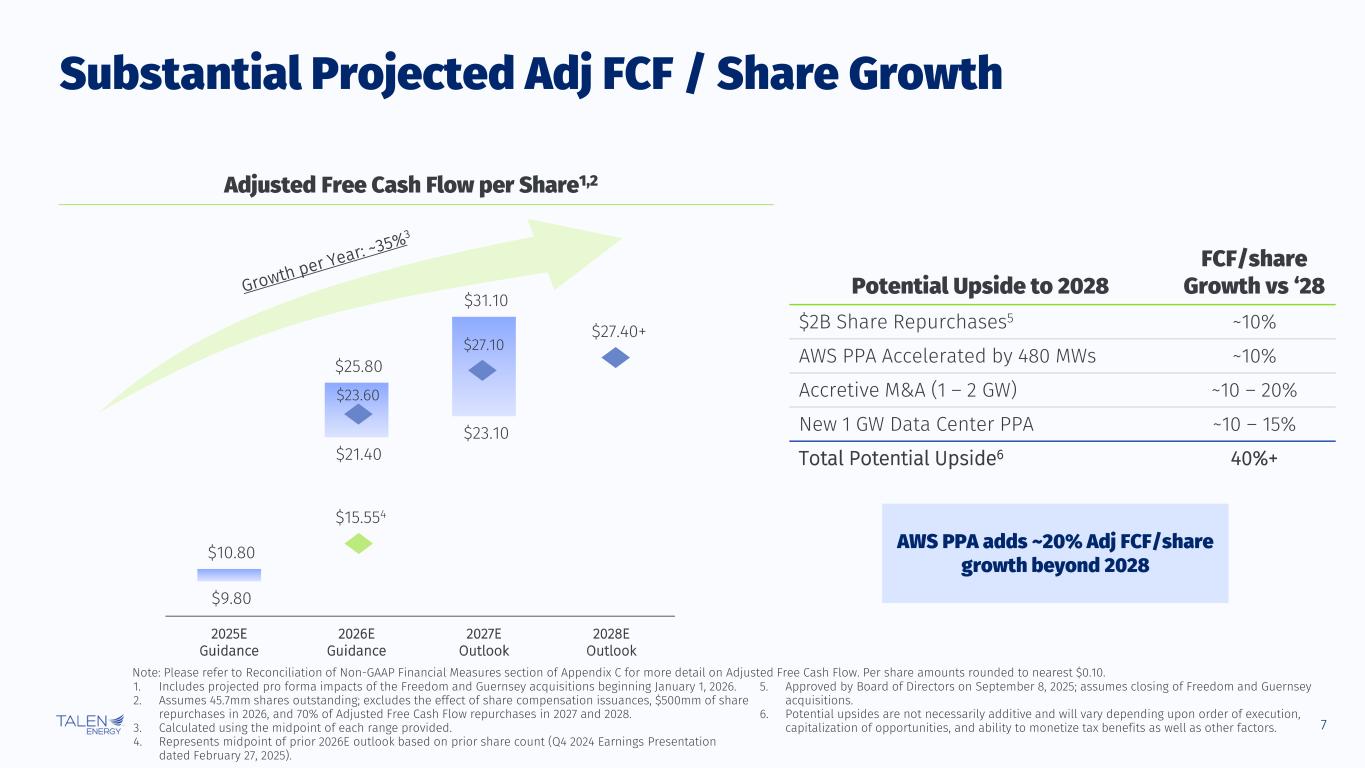
7 $9.80 $21.40 $23.10 $10.80 $25.80 $31.10 2025E Guidance 2026E Guidance 2027E Outlook 2028E Outlook $15.554 $27.40+ Substantial Projected Adj FCF / Share Growth Adjusted Free Cash Flow per Share1,2 1. Includes projected pro forma impacts of the Freedom and Guernsey acquisitions beginning January 1, 2026. 2. Assumes 45.7mm shares outstanding; excludes the effect of share compensation issuances, $500mm of share repurchases in 2026, and 70% of Adjusted Free Cash Flow repurchases in 2027 and 2028. 3. Calculated using the midpoint of each range provided. 4. Represents midpoint of prior 2026E outlook based on prior share count (Q4 2024 Earnings Presentation dated February 27, 2025). 5. Approved by Board of Directors on September 8, 2025; assumes closing of Freedom and Guernsey acquisitions. 6. Potential upsides are not necessarily additive and will vary depending upon order of execution, capitalization of opportunities, and ability to monetize tax benefits as well as other factors. Note: Please refer to Reconciliation of Non-GAAP Financial Measures section of Appendix C for more detail on Adjusted Free Cash Flow. Per share amounts rounded to nearest $0.10. AWS PPA adds ~20% Adj FCF/share growth beyond 2028 Potential Upside to 2028 FCF/share Growth vs ‘28 $2B Share Repurchases5 ~10% AWS PPA Accelerated by 480 MWs ~10% Accretive M&A (1 – 2 GW) ~10 – 20% New 1 GW Data Center PPA ~10 – 15% Total Potential Upside6 40%+ $23.60 $27.10
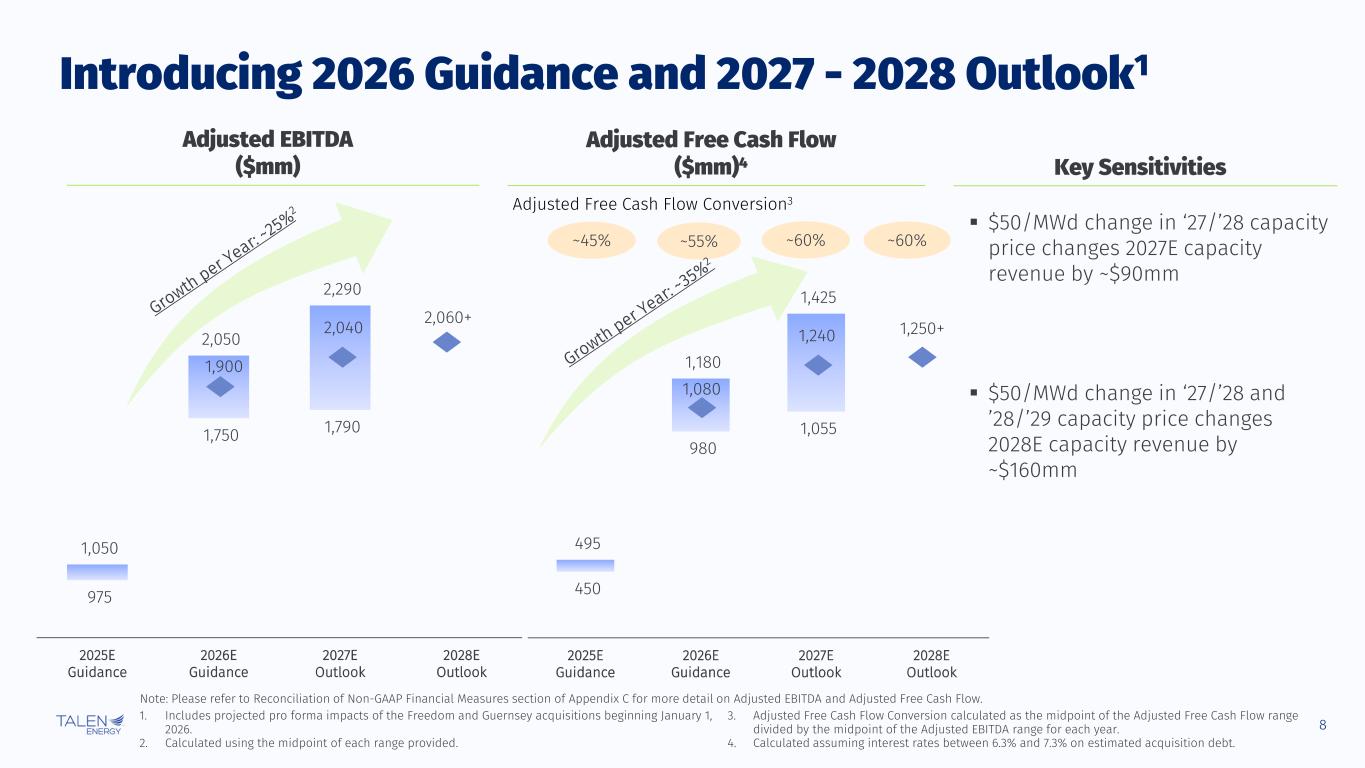
8 450 980 1,055 495 1,180 1,425 2025E Guidance 2026E Guidance 2027E Outlook 2028E Outlook 1,250+ 1,080 1,240 975 1,750 1,790 1,050 2,050 2,290 2025E Guidance 2026E Guidance 2027E Outlook 2028E Outlook 2,060+ 1,900 2,040 Introducing 2026 Guidance and 2027 - 2028 Outlook1 1. Includes projected pro forma impacts of the Freedom and Guernsey acquisitions beginning January 1, 2026. 2. Calculated using the midpoint of each range provided. 3. Adjusted Free Cash Flow Conversion calculated as the midpoint of the Adjusted Free Cash Flow range divided by the midpoint of the Adjusted EBITDA range for each year. 4. Calculated assuming interest rates between 6.3% and 7.3% on estimated acquisition debt. Adjusted EBITDA ($mm) Adjusted Free Cash Flow ($mm)4 ~45% ~55% ~60% Adjusted Free Cash Flow Conversion3 $50/MWd change in ‘27/’28 capacity price changes 2027E capacity revenue by ~$90mm $50/MWd change in ‘27/’28 and ’28/’29 capacity price changes 2028E capacity revenue by ~$160mm Key Sensitivities ~60% Note: Please refer to Reconciliation of Non-GAAP Financial Measures section of Appendix C for more detail on Adjusted EBITDA and Adjusted Free Cash Flow.

Power Markets & Hedging
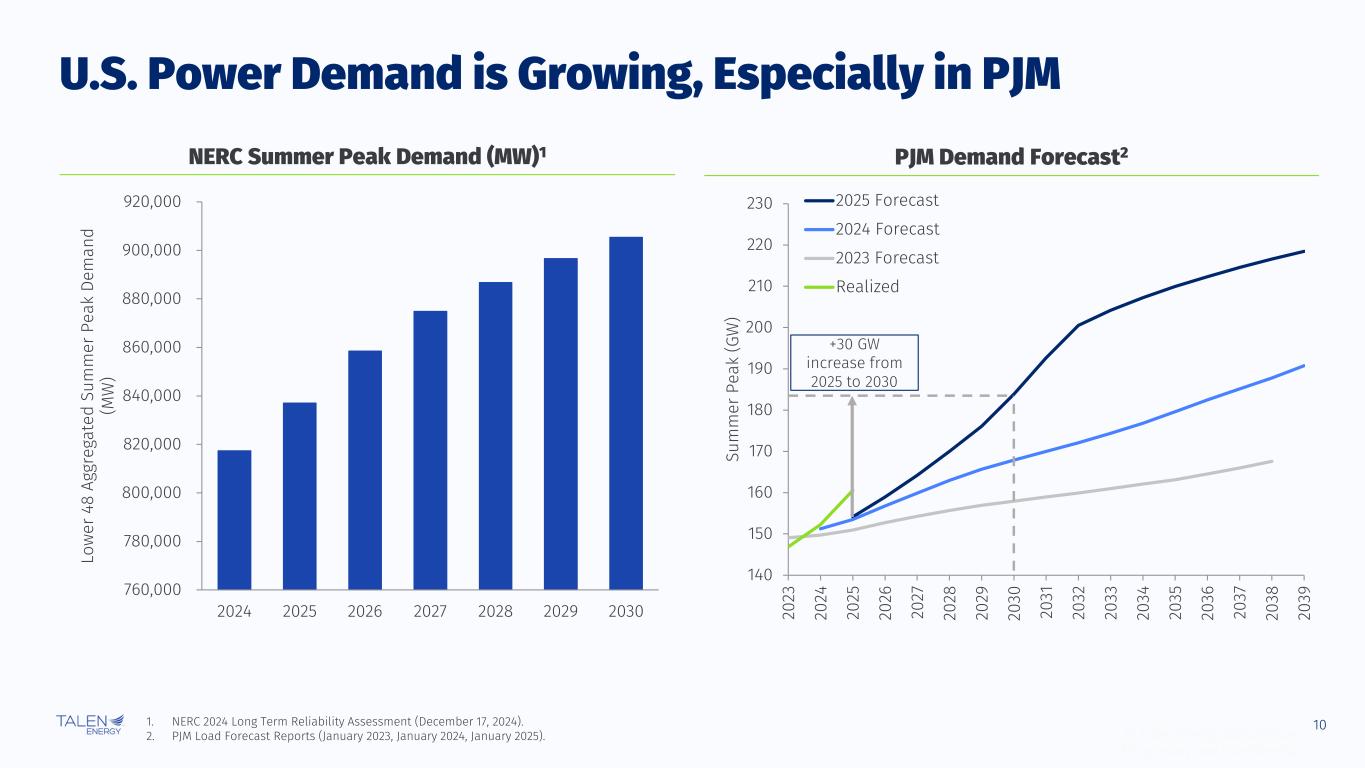
10 140 150 160 170 180 190 200 210 220 230 20 23 20 24 20 25 20 26 20 27 20 28 20 29 20 30 20 31 20 32 20 33 20 34 20 35 20 36 20 37 20 38 20 39 Su m m er P ea k (G W ) 2025 Forecast 2024 Forecast 2023 Forecast Realized +30 GW increase from 2025 to 2030 760,000 780,000 800,000 820,000 840,000 860,000 880,000 900,000 920,000 2024 2025 2026 2027 2028 2029 2030 Lo w er 4 8 Ag gr eg at ed S um m er P ea k De m an d (M W ) © Talen Energy Corporation Proprietary and Confidential U.S. Power Demand is Growing, Especially in PJM 1. NERC 2024 Long Term Reliability Assessment (December 17, 2024). 2. PJM Load Forecast Reports (January 2023, January 2024, January 2025). NERC Summer Peak Demand (MW)1 PJM Demand Forecast2
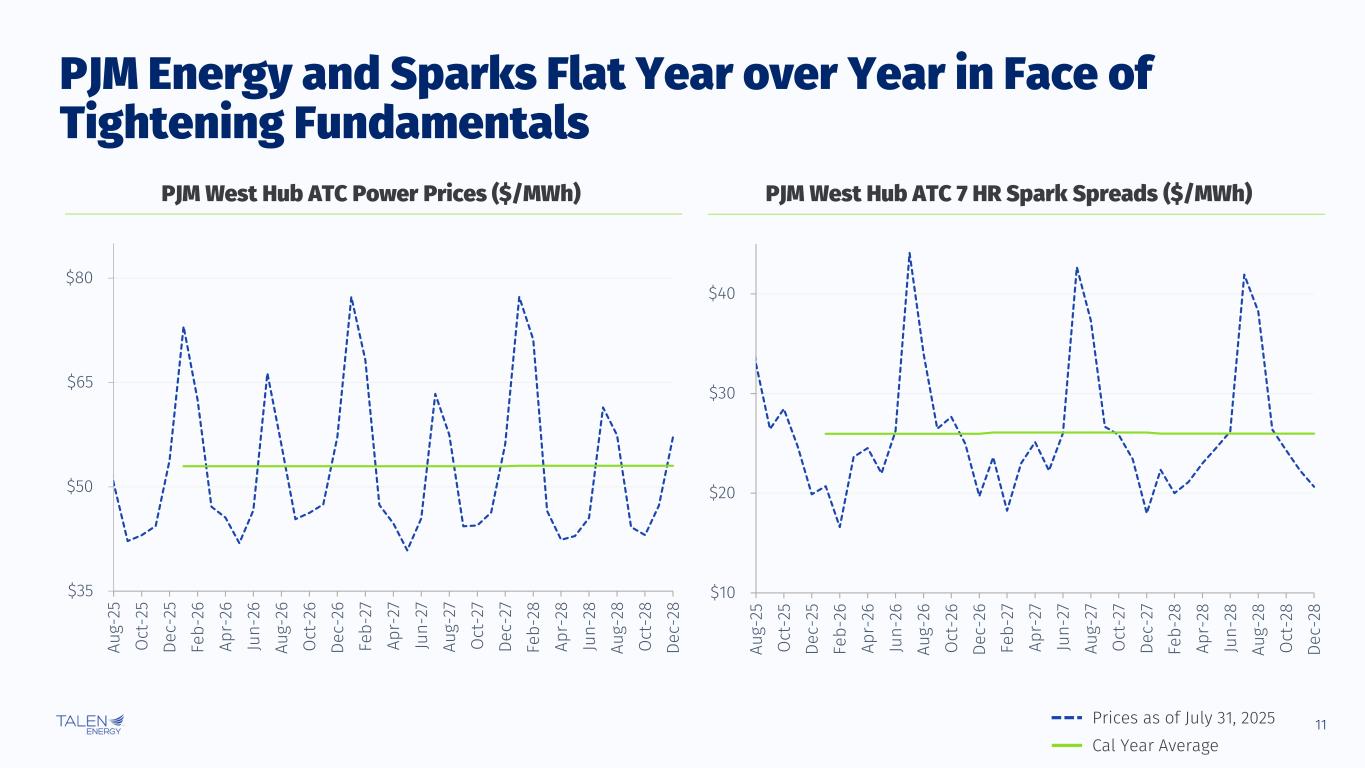
11 $10 $20 $30 $40 Au g- 25 O ct -2 5 De c- 25 Fe b- 26 Ap r- 26 Ju n- 26 Au g- 26 O ct -2 6 De c- 26 Fe b- 27 Ap r- 27 Ju n- 27 Au g- 27 O ct -2 7 De c- 27 Fe b- 28 Ap r- 28 Ju n- 28 Au g- 28 O ct -2 8 De c- 28 PJM Energy and Sparks Flat Year over Year in Face of Tightening Fundamentals PJM West Hub ATC Power Prices ($/MWh) PJM West Hub ATC 7 HR Spark Spreads ($/MWh) $35 $50 $65 $80 Au g- 25 O ct -2 5 De c- 25 Fe b- 26 Ap r- 26 Ju n- 26 Au g- 26 O ct -2 6 De c- 26 Fe b- 27 Ap r- 27 Ju n- 27 Au g- 27 O ct -2 7 De c- 27 Fe b- 28 Ap r- 28 Ju n- 28 Au g- 28 O ct -2 8 De c- 28 Prices as of July 31, 2025 Cal Year Average
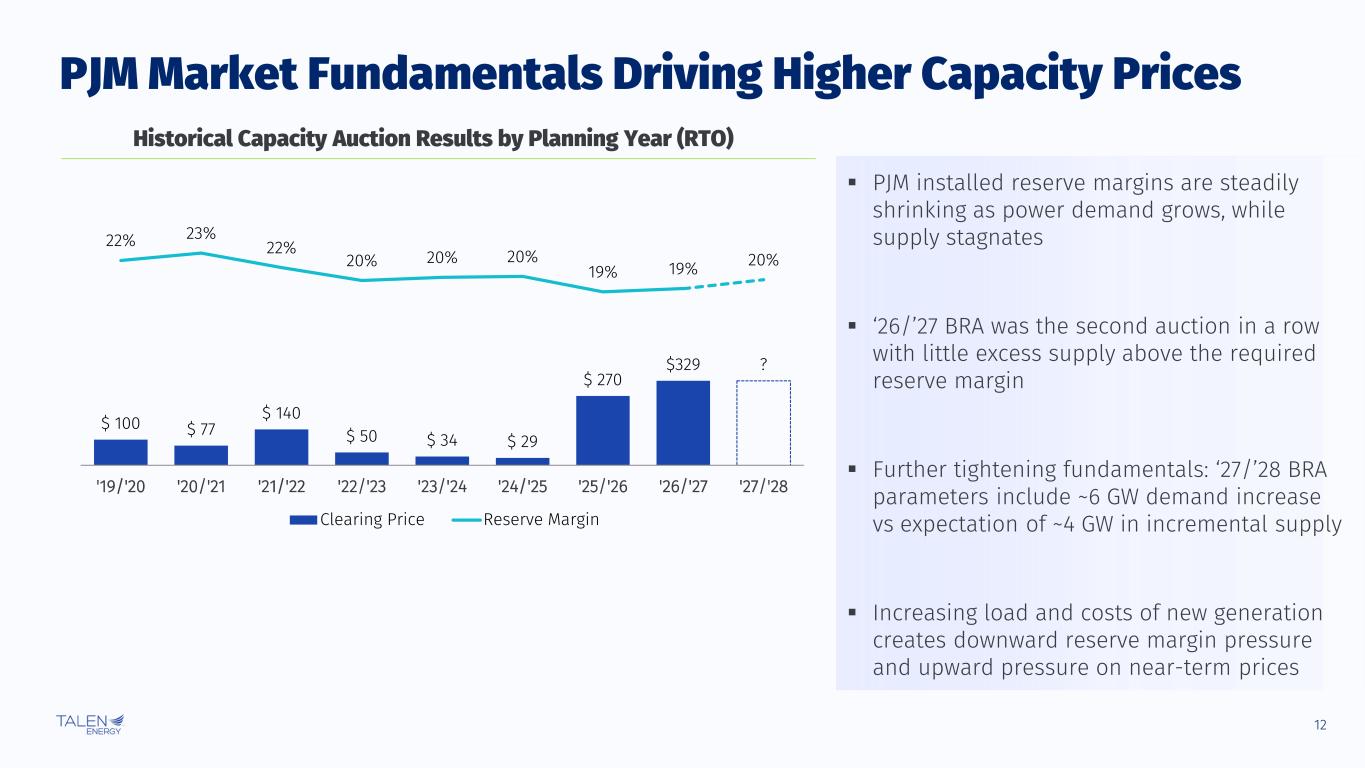
12 PJM Market Fundamentals Driving Higher Capacity Prices Historical Capacity Auction Results by Planning Year (RTO) PJM installed reserve margins are steadily shrinking as power demand grows, while supply stagnates ‘26/’27 BRA was the second auction in a row with little excess supply above the required reserve margin Further tightening fundamentals: ‘27/’28 BRA parameters include ~6 GW demand increase vs expectation of ~4 GW in incremental supply Increasing load and costs of new generation creates downward reserve margin pressure and upward pressure on near-term prices $ 100 $ 77 $ 140 $ 50 $ 34 $ 29 $ 270 $329 ? 22% 23% 22% 20% 20% 20% 19% 19% 20% '19/'20 '20/'21 '21/'22 '22/'23 '23/'24 '24/'25 '25/'26 '26/'27 '27/'28 Clearing Price Reserve Margin
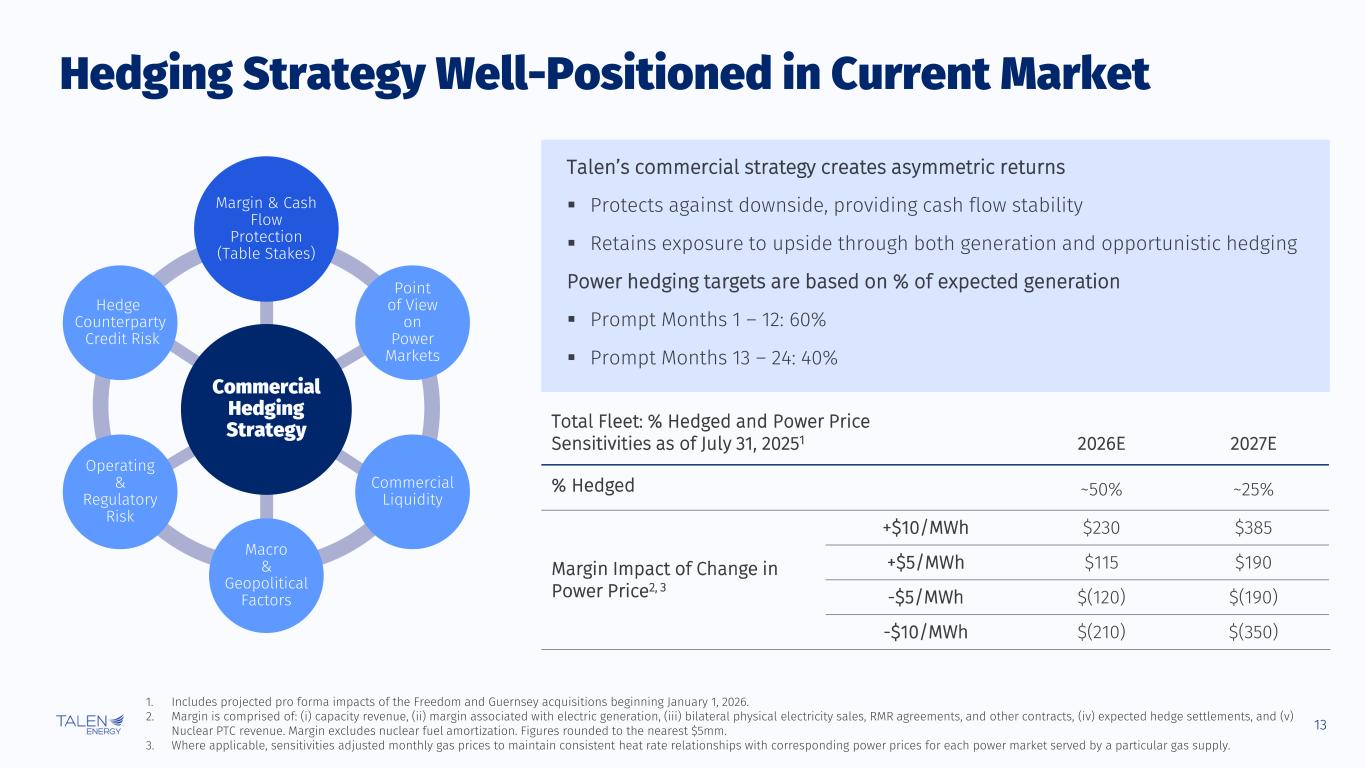
13 1. Includes projected pro forma impacts of the Freedom and Guernsey acquisitions beginning January 1, 2026. 2. Margin is comprised of: (i) capacity revenue, (ii) margin associated with electric generation, (iii) bilateral physical electricity sales, RMR agreements, and other contracts, (iv) expected hedge settlements, and (v) Nuclear PTC revenue. Margin excludes nuclear fuel amortization. Figures rounded to the nearest $5mm. 3. Where applicable, sensitivities adjusted monthly gas prices to maintain consistent heat rate relationships with corresponding power prices for each power market served by a particular gas supply. Hedging Strategy Well-Positioned in Current Market Total Fleet: % Hedged and Power Price Sensitivities as of July 31, 20251 2026E 2027E % Hedged ~50% ~25% Margin Impact of Change in Power Price2, 3 +$10/MWh $230 $385 +$5/MWh $115 $190 -$5/MWh $(120) $(190) -$10/MWh $(210) $(350) Commercial Hedging Strategy Margin & Cash Flow Protection (Table Stakes) Macro & Geopolitical Factors Point of View on Power Markets Commercial Liquidity Operating & Regulatory Risk Hedge Counterparty Credit Risk Talen’s commercial strategy creates asymmetric returns Protects against downside, providing cash flow stability Retains exposure to upside through both generation and opportunistic hedging Power hedging targets are based on % of expected generation Prompt Months 1 – 12: 60% Prompt Months 13 – 24: 40%

Growth Platform: Powering the Future
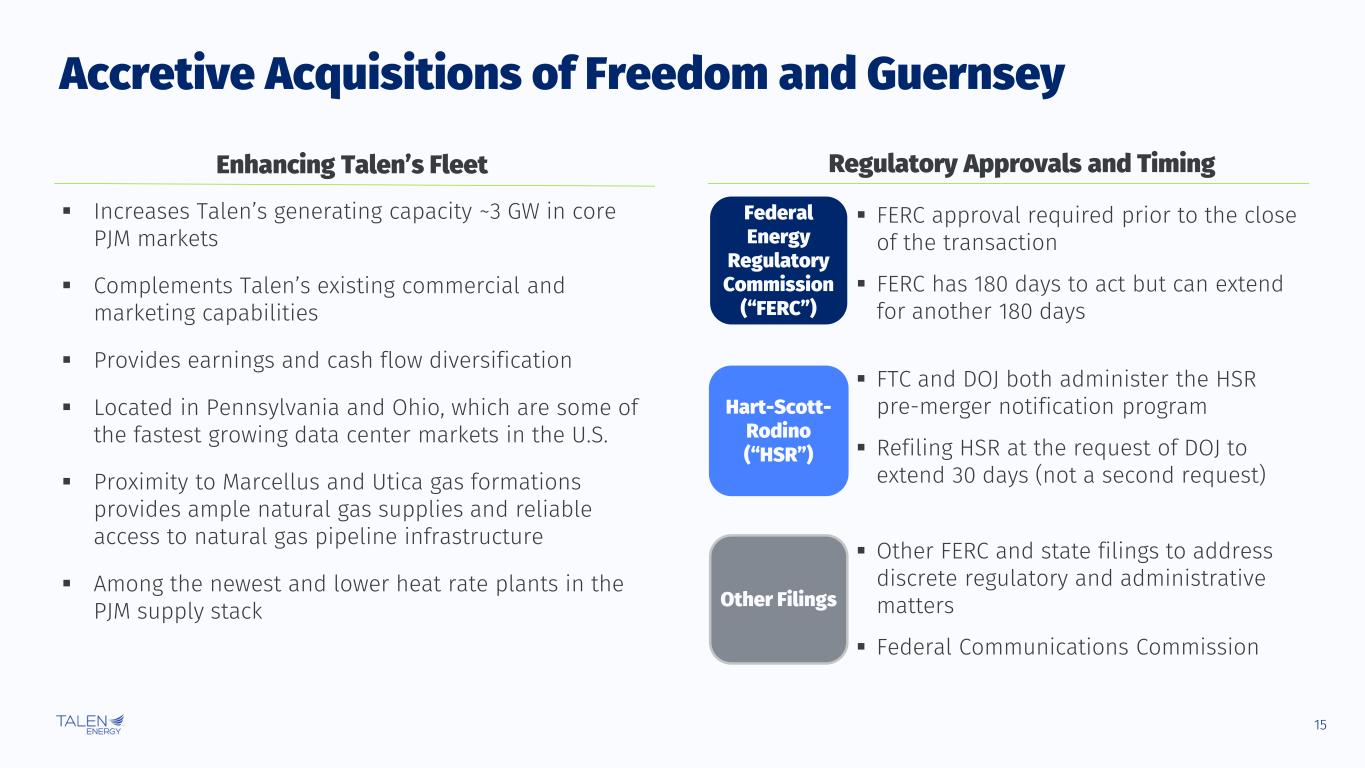
15 Increases Talen’s generating capacity ~3 GW in core PJM markets Complements Talen’s existing commercial and marketing capabilities Provides earnings and cash flow diversification Located in Pennsylvania and Ohio, which are some of the fastest growing data center markets in the U.S. Proximity to Marcellus and Utica gas formations provides ample natural gas supplies and reliable access to natural gas pipeline infrastructure Among the newest and lower heat rate plants in the PJM supply stack Accretive Acquisitions of Freedom and Guernsey Enhancing Talen’s Fleet Freedom Guernsey FERC approval required prior to the close of the transaction FERC has 180 days to act but can extend for another 180 days Federal Energy Regulatory Commission (“FERC”) Hart-Scott- Rodino (“HSR”) FTC and DOJ both administer the HSR pre-merger notification program Refiling HSR at the request of DOJ to extend 30 days (not a second request) Other Filings Other FERC and state filings to address discrete regulatory and administrative matters Federal Communications Commission Regulatory Approvals and Timing
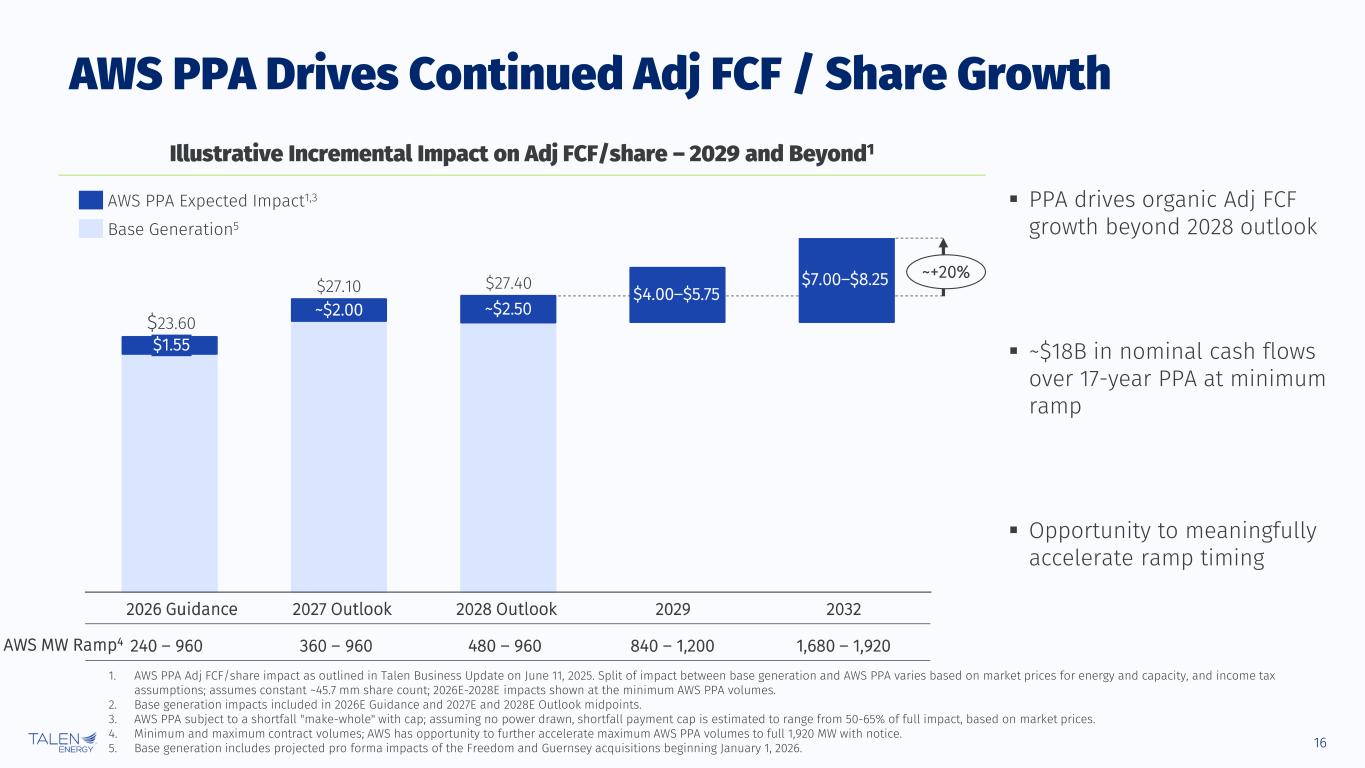
16 ~$2.00 ~$2.50 AWS PPA Drives Continued Adj FCF / Share Growth Illustrative Incremental Impact on Adj FCF/share – 2029 and Beyond1 1,680 – 1,920AWS MW Ramp4 840 – 1,200480 – 960360 – 960240 – 960 $1.55 2026 Guidance 2027 Outlook 2028 Outlook $4.00–$5.75 2029 $7.00–$8.25 2032 $23.60 $27.10 $27.40 ~+20% Base Generation5 AWS PPA Expected Impact1,3 1. AWS PPA Adj FCF/share impact as outlined in Talen Business Update on June 11, 2025. Split of impact between base generation and AWS PPA varies based on market prices for energy and capacity, and income tax assumptions; assumes constant ~45.7 mm share count; 2026E-2028E impacts shown at the minimum AWS PPA volumes. 2. Base generation impacts included in 2026E Guidance and 2027E and 2028E Outlook midpoints. 3. AWS PPA subject to a shortfall "make-whole" with cap; assuming no power drawn, shortfall payment cap is estimated to range from 50-65% of full impact, based on market prices. 4. Minimum and maximum contract volumes; AWS has opportunity to further accelerate maximum AWS PPA volumes to full 1,920 MW with notice. 5. Base generation includes projected pro forma impacts of the Freedom and Guernsey acquisitions beginning January 1, 2026. PPA drives organic Adj FCF growth beyond 2028 outlook ~$18B in nominal cash flows over 17-year PPA at minimum ramp Opportunity to meaningfully accelerate ramp timing
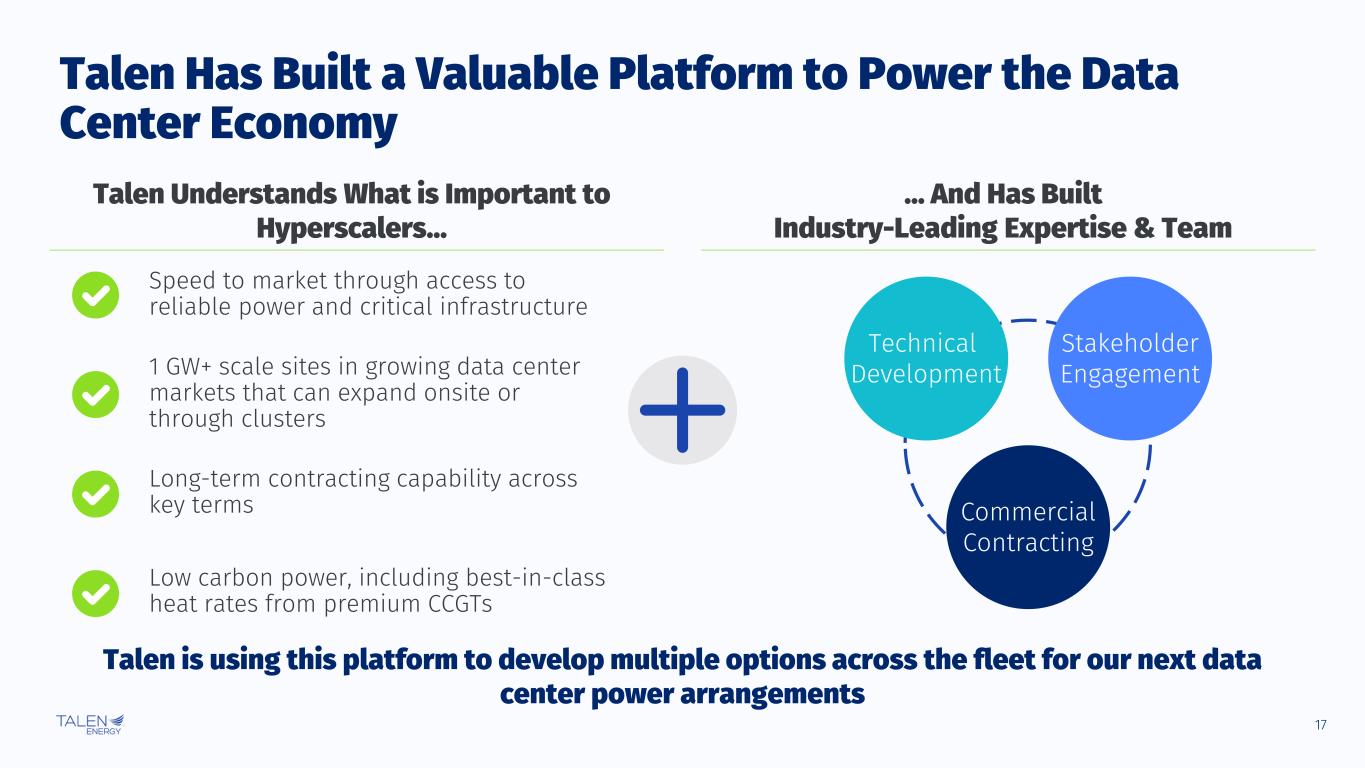
17 Talen Has Built a Valuable Platform to Power the Data Center Economy Talen Understands What is Important to Hyperscalers… … And Has Built Industry-Leading Expertise & Team Speed to market through access to reliable power and critical infrastructure 1 GW+ scale sites in growing data center markets that can expand onsite or through clusters Long-term contracting capability across key terms Technical Development Stakeholder Engagement Commercial Contracting Talen is using this platform to develop multiple options across the fleet for our next data center power arrangements Low carbon power, including best-in-class heat rates from premium CCGTs
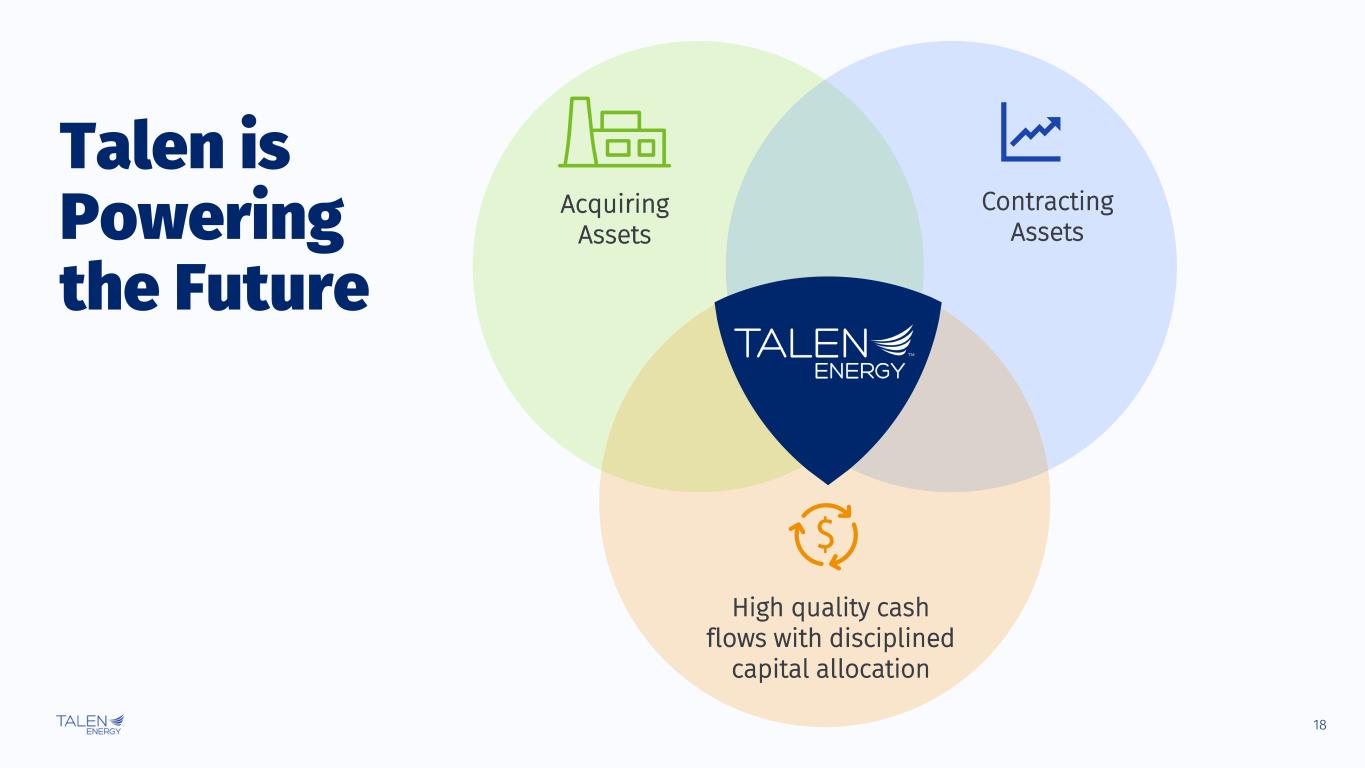
18 High quality cash flows with disciplined capital allocation Acquiring Assets Contracting Assets Talen is Powering the Future $

Appendix A: Modeling Assumptions
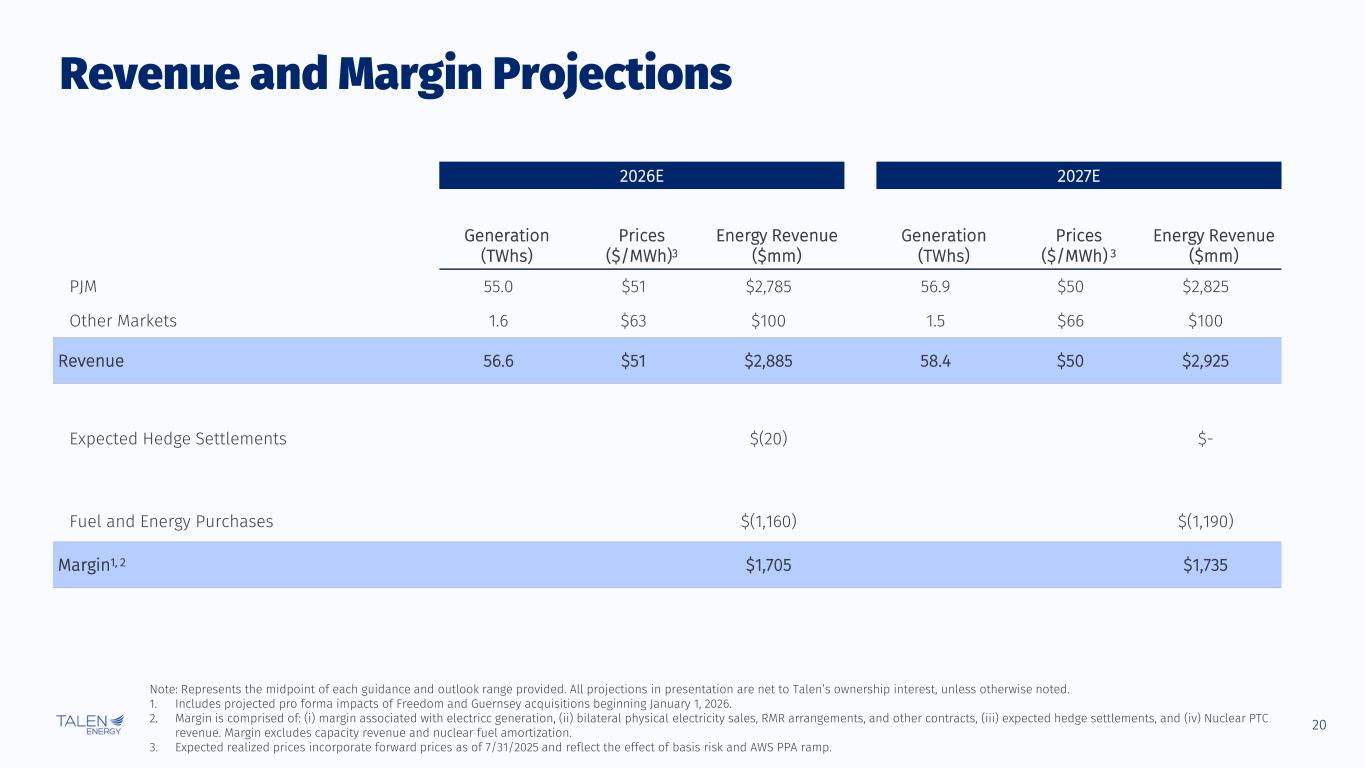
20 2026E 2027E Generation (TWhs) Prices ($/MWh)3 Energy Revenue ($mm) Generation (TWhs) Prices ($/MWh) 3 Energy Revenue ($mm) PJM 55.0 $51 $2,785 56.9 $50 $2,825 Other Markets 1.6 $63 $100 1.5 $66 $100 Revenue 56.6 $51 $2,885 58.4 $50 $2,925 Expected Hedge Settlements $(20) $- Fuel and Energy Purchases $(1,160) $(1,190) Margin1, 2 $1,705 $1,735 Note: Represents the midpoint of each guidance and outlook range provided. All projections in presentation are net to Talen’s ownership interest, unless otherwise noted. 1. Includes projected pro forma impacts of Freedom and Guernsey acquisitions beginning January 1, 2026. 2. Margin is comprised of: (i) margin associated with electricc generation, (ii) bilateral physical electricity sales, RMR arrangements, and other contracts, (iii) expected hedge settlements, and (iv) Nuclear PTC revenue. Margin excludes capacity revenue and nuclear fuel amortization. 3. Expected realized prices incorporate forward prices as of 7/31/2025 and reflect the effect of basis risk and AWS PPA ramp. Revenue and Margin Projections
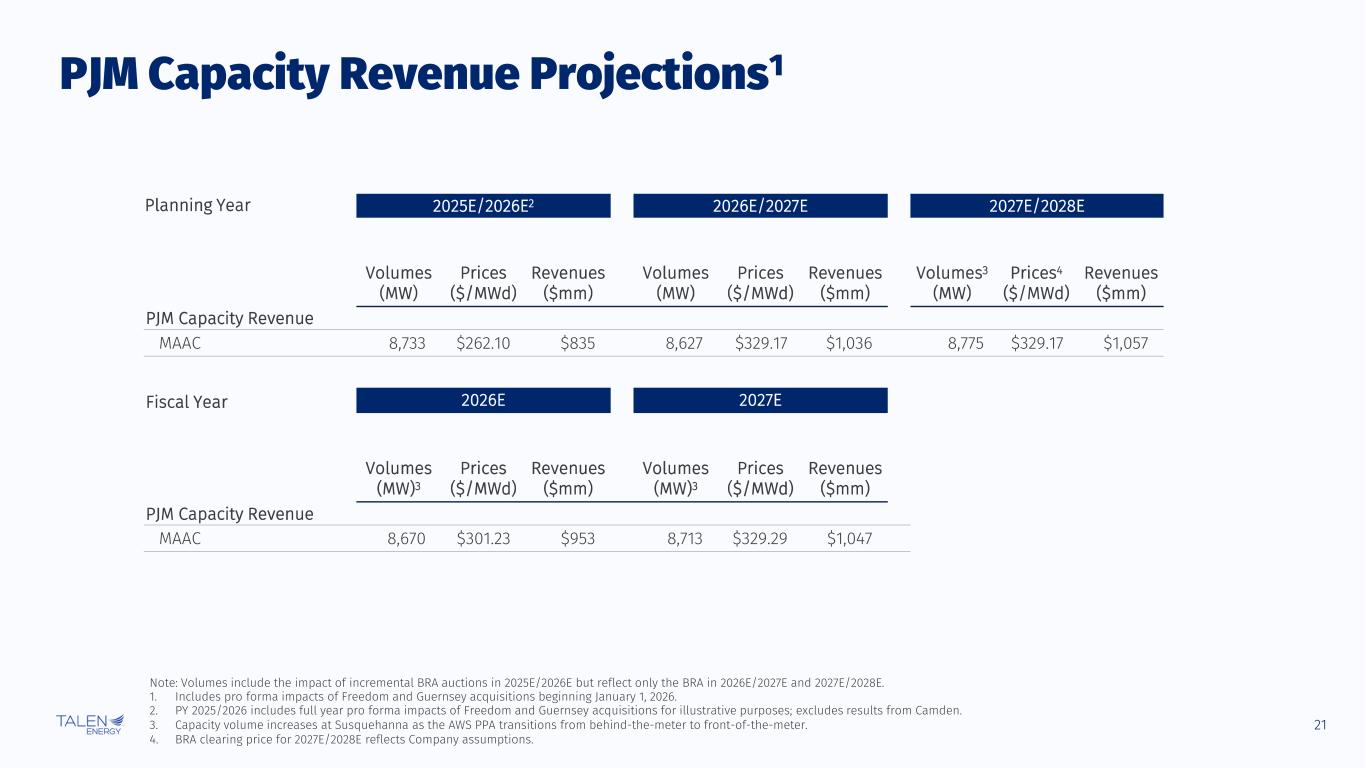
21 PJM Capacity Revenue Projections1 Note: Volumes include the impact of incremental BRA auctions in 2025E/2026E but reflect only the BRA in 2026E/2027E and 2027E/2028E. 1. Includes pro forma impacts of Freedom and Guernsey acquisitions beginning January 1, 2026. 2. PY 2025/2026 includes full year pro forma impacts of Freedom and Guernsey acquisitions for illustrative purposes; excludes results from Camden. 3. Capacity volume increases at Susquehanna as the AWS PPA transitions from behind-the-meter to front-of-the-meter. 4. BRA clearing price for 2027E/2028E reflects Company assumptions. Planning Year 2025E/2026E2 2026E/2027E 2027E/2028E Volumes (MW) Prices ($/MWd) Revenues ($mm) Volumes (MW) Prices ($/MWd) Revenues ($mm) Volumes3 (MW) Prices4 ($/MWd) Revenues ($mm) PJM Capacity Revenue MAAC 8,733 $262.10 $835 8,627 $329.17 $1,036 8,775 $329.17 $1,057 Fiscal Year 2026E 2027E Volumes (MW)3 Prices ($/MWd) Revenues ($mm) Volumes (MW)3 Prices ($/MWd) Revenues ($mm) PJM Capacity Revenue MAAC 8,670 $301.23 $953 8,713 $329.29 $1,047
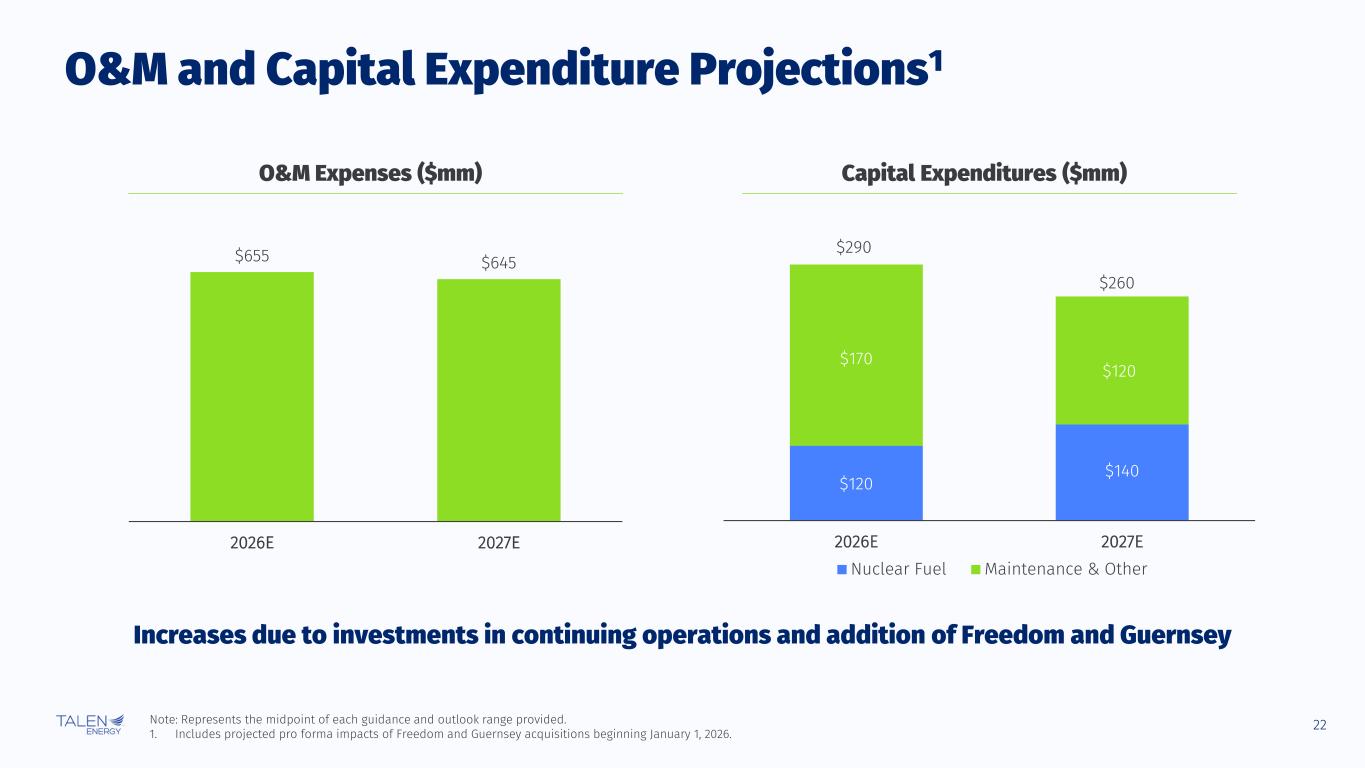
22 $655 $645 2026E 2027E $120 $140 $170 $120 2026E 2027E Nuclear Fuel Maintenance & Other $260 $290 Increases due to investments in continuing operations and addition of Freedom and Guernsey Note: Represents the midpoint of each guidance and outlook range provided. 1. Includes projected pro forma impacts of Freedom and Guernsey acquisitions beginning January 1, 2026. O&M and Capital Expenditure Projections1 O&M Expenses ($mm) Capital Expenditures ($mm)
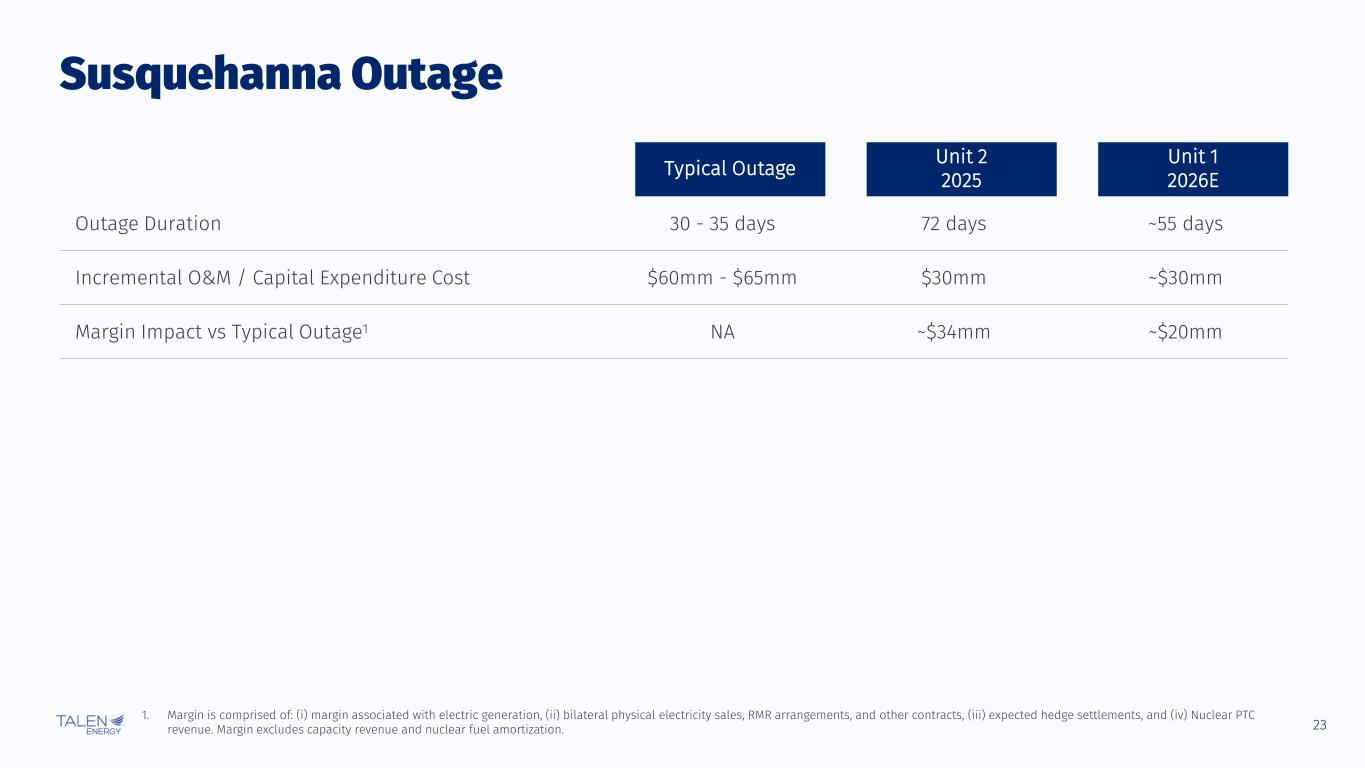
23 Typical Outage Unit 2 2025 Unit 1 2026E Outage Duration 30 - 35 days 72 days ~55 days Incremental O&M / Capital Expenditure Cost $60mm - $65mm $30mm ~$30mm Margin Impact vs Typical Outage1 NA ~$34mm ~$20mm Susquehanna Outage 1. Margin is comprised of: (i) margin associated with electric generation, (ii) bilateral physical electricity sales, RMR arrangements, and other contracts, (iii) expected hedge settlements, and (iv) Nuclear PTC revenue. Margin excludes capacity revenue and nuclear fuel amortization.
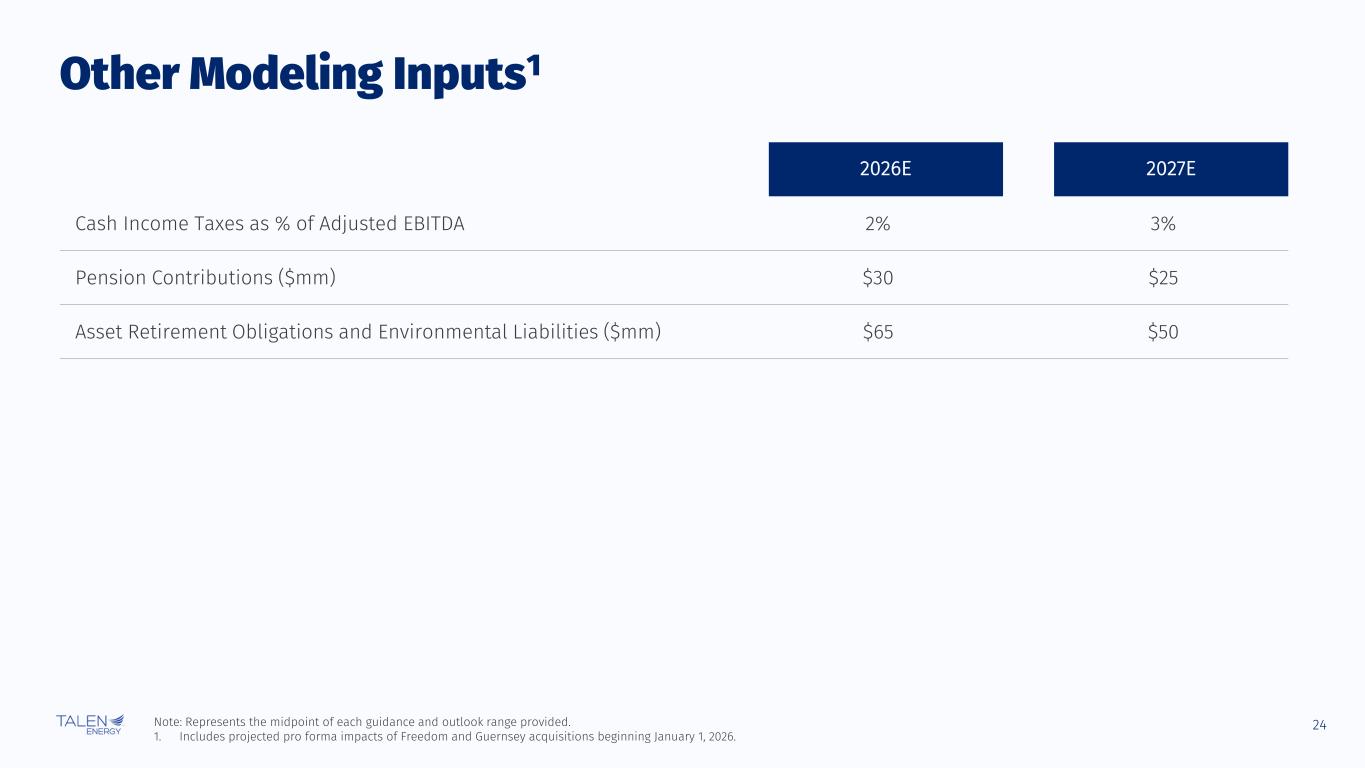
24 2026E 2027E Cash Income Taxes as % of Adjusted EBITDA 2% 3% Pension Contributions ($mm) $30 $25 Asset Retirement Obligations and Environmental Liabilities ($mm) $65 $50 Other Modeling Inputs1 Note: Represents the midpoint of each guidance and outlook range provided. 1. Includes projected pro forma impacts of Freedom and Guernsey acquisitions beginning January 1, 2026.
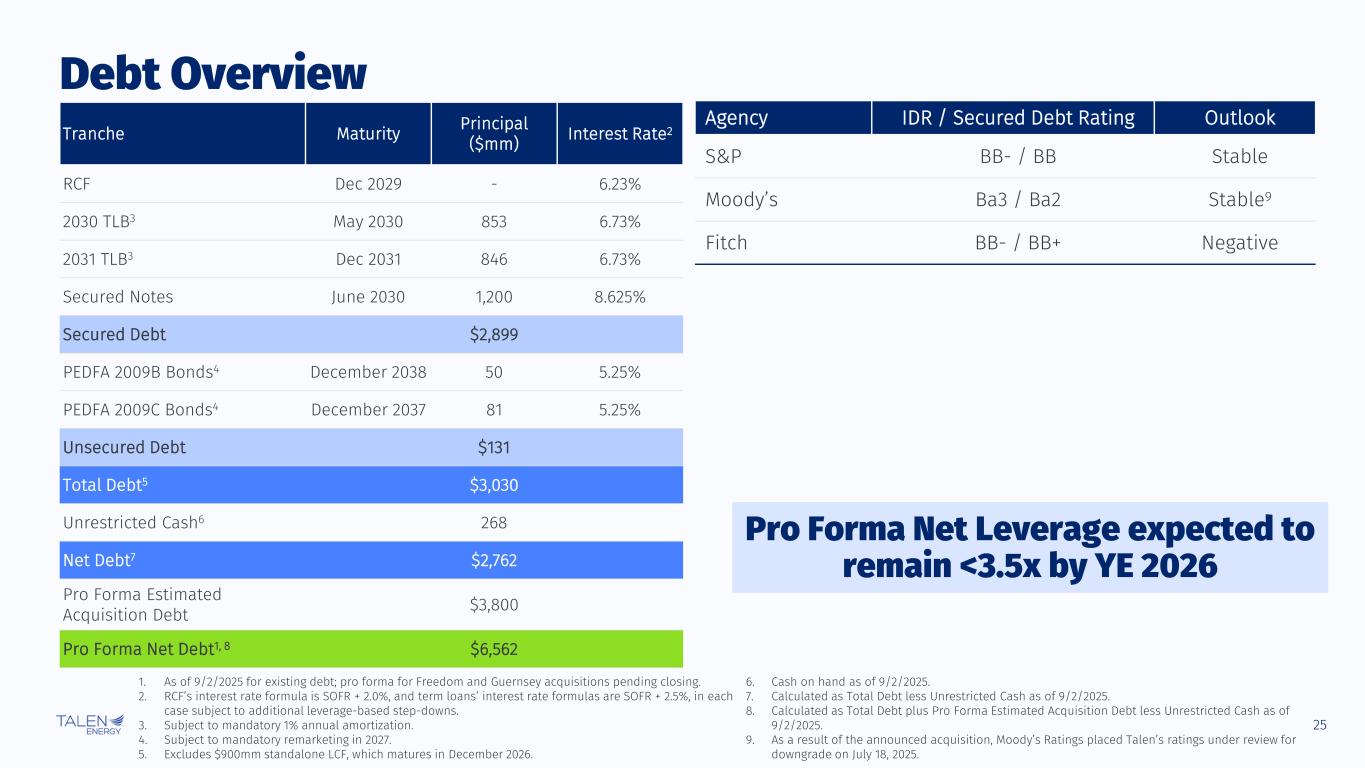
25 Agency IDR / Secured Debt Rating Outlook S&P BB- / BB Stable Moody’s Ba3 / Ba2 Stable9 Fitch BB- / BB+ Negative 1. As of 9/2/2025 for existing debt; pro forma for Freedom and Guernsey acquisitions pending closing. 2. RCF’s interest rate formula is SOFR + 2.0%, and term loans’ interest rate formulas are SOFR + 2.5%, in each case subject to additional leverage-based step-downs. 3. Subject to mandatory 1% annual amortization. 4. Subject to mandatory remarketing in 2027. 5. Excludes $900mm standalone LCF, which matures in December 2026. 6. Cash on hand as of 9/2/2025. 7. Calculated as Total Debt less Unrestricted Cash as of 9/2/2025. 8. Calculated as Total Debt plus Pro Forma Estimated Acquisition Debt less Unrestricted Cash as of 9/2/2025. 9. As a result of the announced acquisition, Moody’s Ratings placed Talen’s ratings under review for downgrade on July 18, 2025. Debt Overview Tranche Maturity Principal ($mm) Interest Rate2 RCF Dec 2029 - 6.23% 2030 TLB3 May 2030 853 6.73% 2031 TLB3 Dec 2031 846 6.73% Secured Notes June 2030 1,200 8.625% Secured Debt $2,899 PEDFA 2009B Bonds4 December 2038 50 5.25% PEDFA 2009C Bonds4 December 2037 81 5.25% Unsecured Debt $131 Total Debt5 $3,030 Unrestricted Cash6 268 Net Debt7 $2,762 Pro Forma Estimated Acquisition Debt $3,800 Pro Forma Net Debt1, 8 $6,562 Pro Forma Net Leverage expected to remain <3.5x by YE 2026

Appendix B: Supplemental Asset Detail
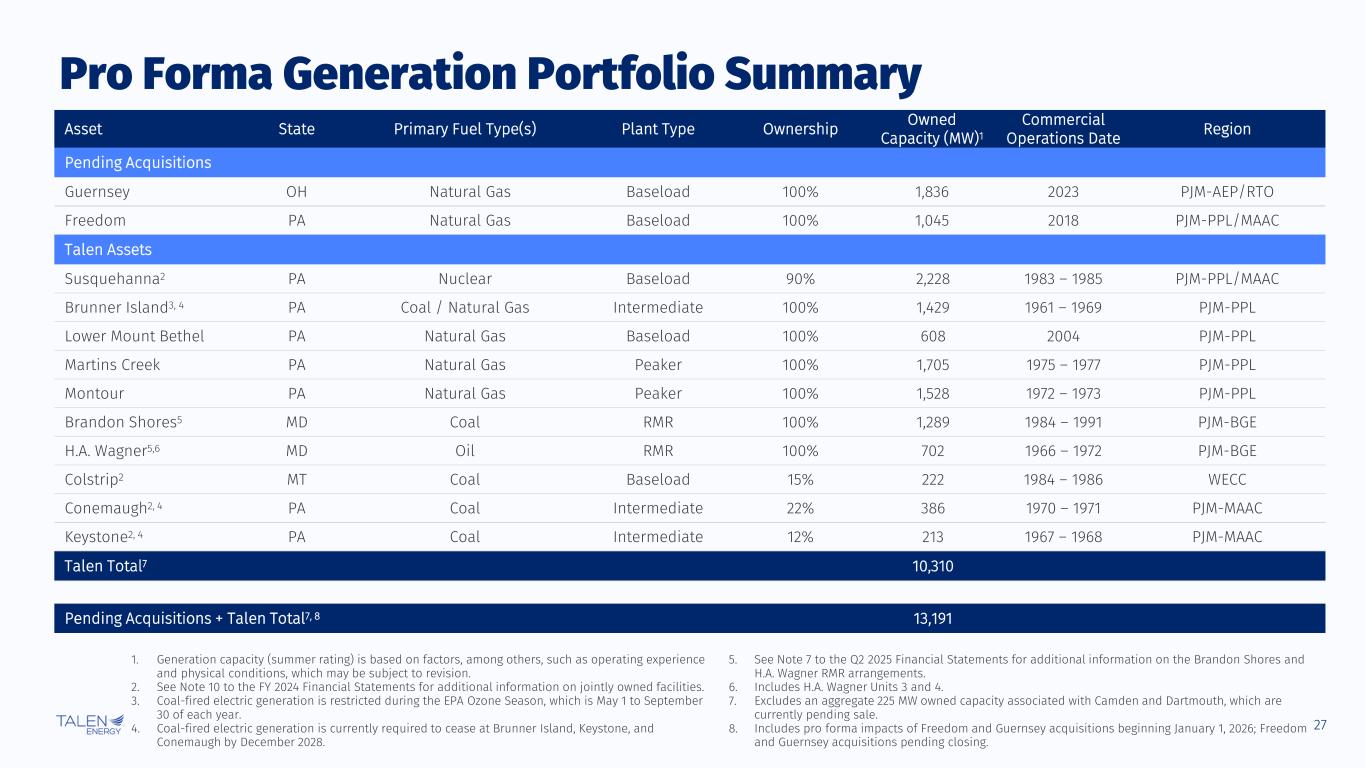
27 Asset State Primary Fuel Type(s) Plant Type Ownership Owned Capacity (MW)1 Commercial Operations Date Region Pending Acquisitions Guernsey OH Natural Gas Baseload 100% 1,836 2023 PJM-AEP/RTO Freedom PA Natural Gas Baseload 100% 1,045 2018 PJM-PPL/MAAC Talen Assets Susquehanna2 PA Nuclear Baseload 90% 2,228 1983 – 1985 PJM-PPL/MAAC Brunner Island3, 4 PA Coal / Natural Gas Intermediate 100% 1,429 1961 – 1969 PJM-PPL Lower Mount Bethel PA Natural Gas Baseload 100% 608 2004 PJM-PPL Martins Creek PA Natural Gas Peaker 100% 1,705 1975 – 1977 PJM-PPL Montour PA Natural Gas Peaker 100% 1,528 1972 – 1973 PJM-PPL Brandon Shores5 MD Coal RMR 100% 1,289 1984 – 1991 PJM-BGE H.A. Wagner5,6 MD Oil RMR 100% 702 1966 – 1972 PJM-BGE Colstrip2 MT Coal Baseload 15% 222 1984 – 1986 WECC Conemaugh2, 4 PA Coal Intermediate 22% 386 1970 – 1971 PJM-MAAC Keystone2, 4 PA Coal Intermediate 12% 213 1967 – 1968 PJM-MAAC Talen Total7 10,310 Pending Acquisitions + Talen Total7, 8 13,191 Pro Forma Generation Portfolio Summary 1. Generation capacity (summer rating) is based on factors, among others, such as operating experience and physical conditions, which may be subject to revision. 2. See Note 10 to the FY 2024 Financial Statements for additional information on jointly owned facilities. 3. Coal-fired electric generation is restricted during the EPA Ozone Season, which is May 1 to September 30 of each year. 4. Coal-fired electric generation is currently required to cease at Brunner Island, Keystone, and Conemaugh by December 2028. 5. See Note 7 to the Q2 2025 Financial Statements for additional information on the Brandon Shores and H.A. Wagner RMR arrangements. 6. Includes H.A. Wagner Units 3 and 4. 7. Excludes an aggregate 225 MW owned capacity associated with Camden and Dartmouth, which are currently pending sale. 8. Includes pro forma impacts of Freedom and Guernsey acquisitions beginning January 1, 2026; Freedom and Guernsey acquisitions pending closing.
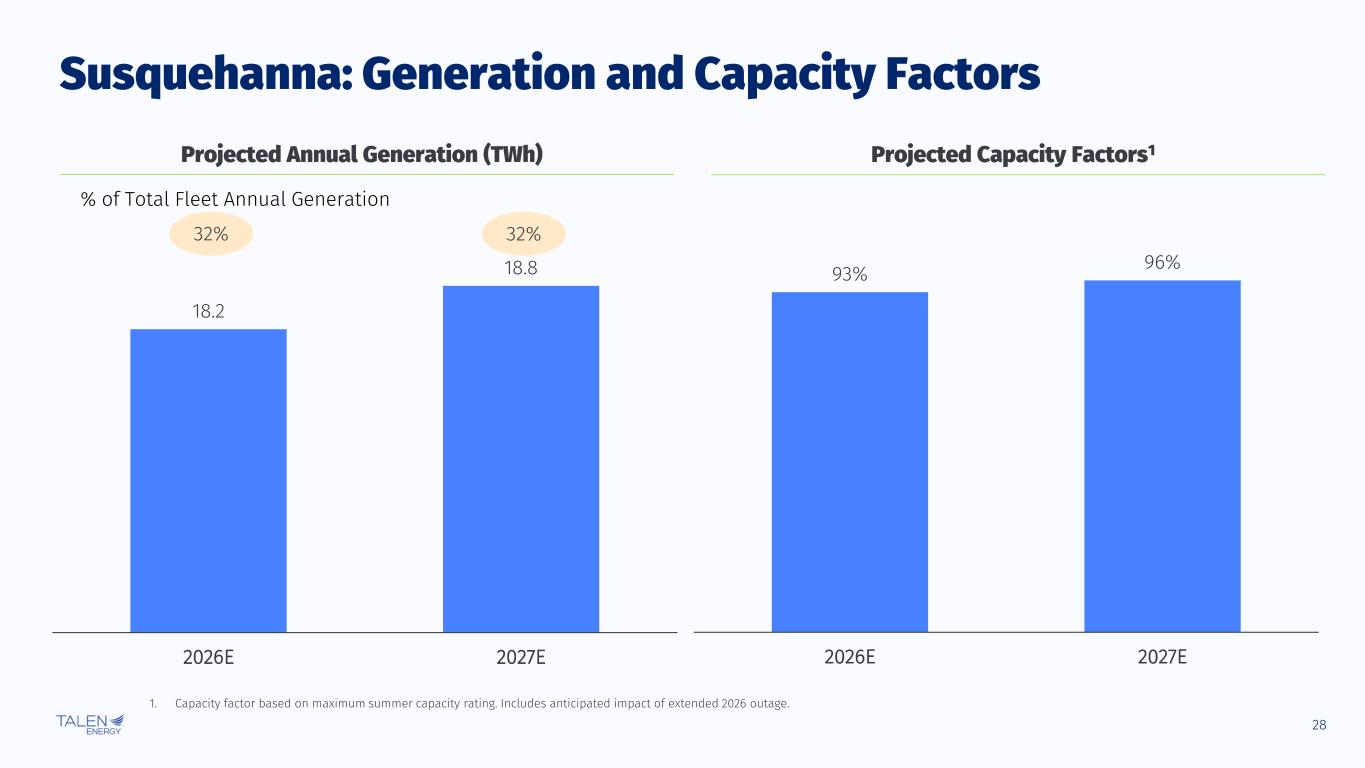
28 18.2 18.8 2026E 2027E Susquehanna: Generation and Capacity Factors % of Total Fleet Annual Generation 1. Capacity factor based on maximum summer capacity rating. Includes anticipated impact of extended 2026 outage. 32% Projected Annual Generation (TWh) Projected Capacity Factors1 93% 96% 2026E 2027E 32%
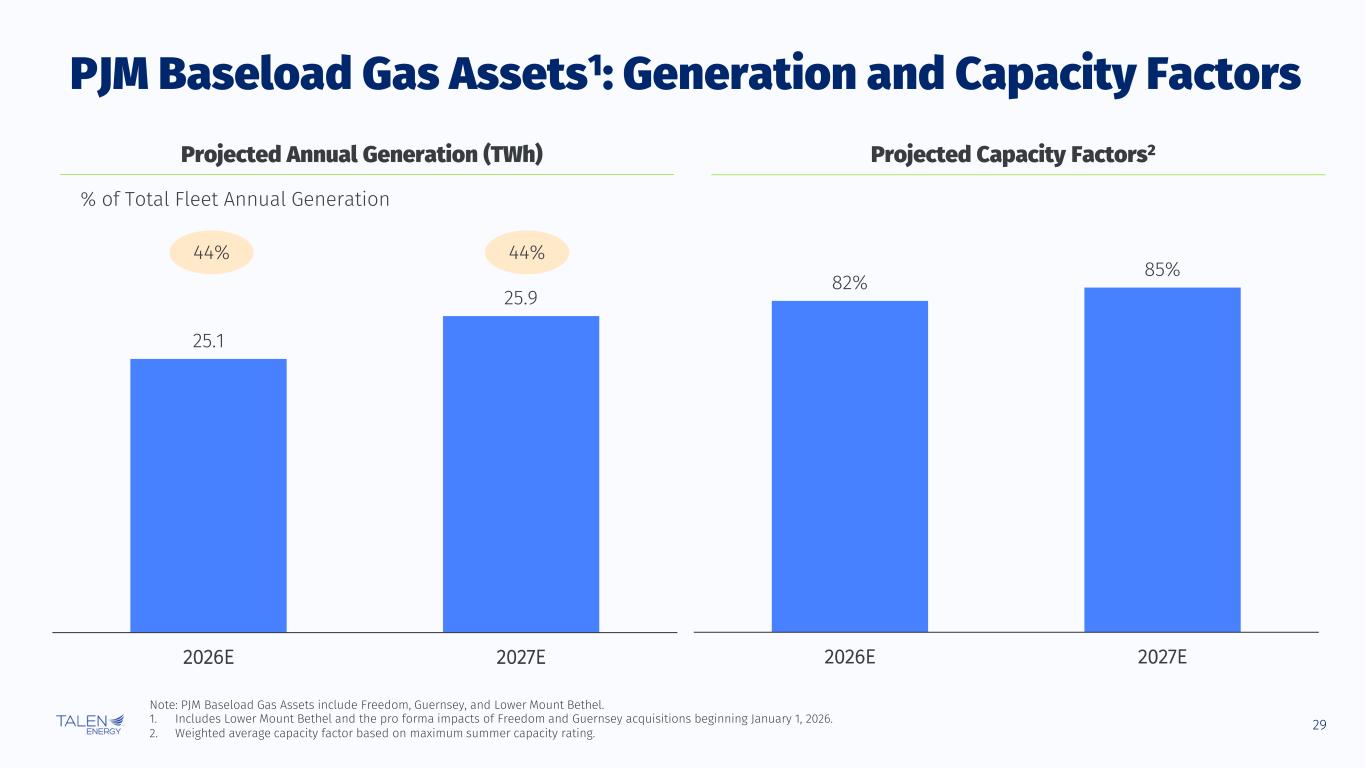
29 25.1 25.9 2026E 2027E PJM Baseload Gas Assets1: Generation and Capacity Factors % of Total Fleet Annual Generation Note: PJM Baseload Gas Assets include Freedom, Guernsey, and Lower Mount Bethel. 1. Includes Lower Mount Bethel and the pro forma impacts of Freedom and Guernsey acquisitions beginning January 1, 2026. 2. Weighted average capacity factor based on maximum summer capacity rating. Projected Annual Generation (TWh) Projected Capacity Factors2 44% 44% 82% 85% 2026E 2027E
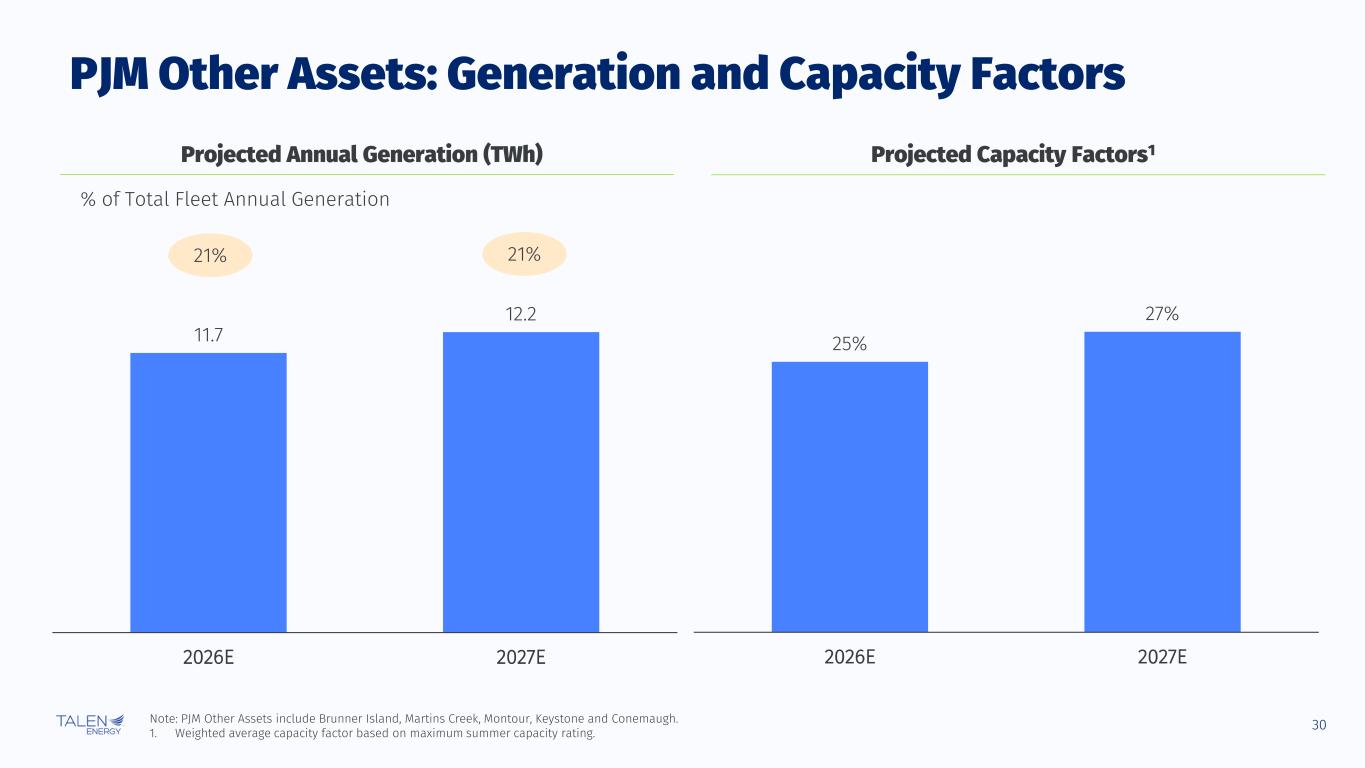
30 11.7 12.2 2026E 2027E PJM Other Assets: Generation and Capacity Factors % of Total Fleet Annual Generation Note: PJM Other Assets include Brunner Island, Martins Creek, Montour, Keystone and Conemaugh. 1. Weighted average capacity factor based on maximum summer capacity rating. Projected Annual Generation (TWh) Projected Capacity Factors1 21% 21% 25% 27% 2026E 2027E
Appendix C: Reconciliation of Non-GAAP Financial Measures
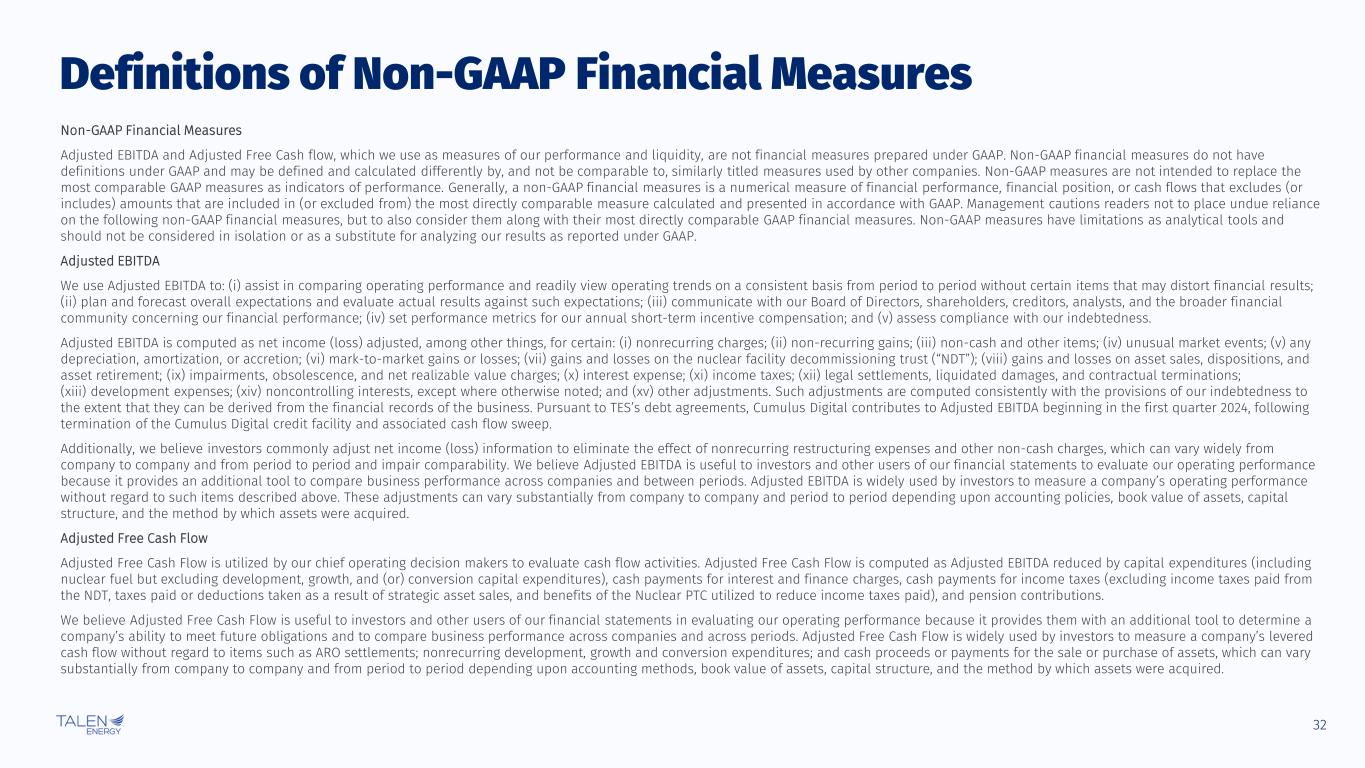
32 Definitions of Non-GAAP Financial Measures Non-GAAP Financial Measures Adjusted EBITDA and Adjusted Free Cash flow, which we use as measures of our performance and liquidity, are not financial measures prepared under GAAP. Non-GAAP financial measures do not have definitions under GAAP and may be defined and calculated differently by, and not be comparable to, similarly titled measures used by other companies. Non-GAAP measures are not intended to replace the most comparable GAAP measures as indicators of performance. Generally, a non-GAAP financial measures is a numerical measure of financial performance, financial position, or cash flows that excludes (or includes) amounts that are included in (or excluded from) the most directly comparable measure calculated and presented in accordance with GAAP. Management cautions readers not to place undue reliance on the following non-GAAP financial measures, but to also consider them along with their most directly comparable GAAP financial measures. Non-GAAP measures have limitations as analytical tools and should not be considered in isolation or as a substitute for analyzing our results as reported under GAAP. Adjusted EBITDA We use Adjusted EBITDA to: (i) assist in comparing operating performance and readily view operating trends on a consistent basis from period to period without certain items that may distort financial results; (ii) plan and forecast overall expectations and evaluate actual results against such expectations; (iii) communicate with our Board of Directors, shareholders, creditors, analysts, and the broader financial community concerning our financial performance; (iv) set performance metrics for our annual short-term incentive compensation; and (v) assess compliance with our indebtedness. Adjusted EBITDA is computed as net income (loss) adjusted, among other things, for certain: (i) nonrecurring charges; (ii) non-recurring gains; (iii) non-cash and other items; (iv) unusual market events; (v) any depreciation, amortization, or accretion; (vi) mark-to-market gains or losses; (vii) gains and losses on the nuclear facility decommissioning trust (“NDT”); (viii) gains and losses on asset sales, dispositions, and asset retirement; (ix) impairments, obsolescence, and net realizable value charges; (x) interest expense; (xi) income taxes; (xii) legal settlements, liquidated damages, and contractual terminations; (xiii) development expenses; (xiv) noncontrolling interests, except where otherwise noted; and (xv) other adjustments. Such adjustments are computed consistently with the provisions of our indebtedness to the extent that they can be derived from the financial records of the business. Pursuant to TES’s debt agreements, Cumulus Digital contributes to Adjusted EBITDA beginning in the first quarter 2024, following termination of the Cumulus Digital credit facility and associated cash flow sweep. Additionally, we believe investors commonly adjust net income (loss) information to eliminate the effect of nonrecurring restructuring expenses and other non-cash charges, which can vary widely from company to company and from period to period and impair comparability. We believe Adjusted EBITDA is useful to investors and other users of our financial statements to evaluate our operating performance because it provides an additional tool to compare business performance across companies and between periods. Adjusted EBITDA is widely used by investors to measure a company’s operating performance without regard to such items described above. These adjustments can vary substantially from company to company and period to period depending upon accounting policies, book value of assets, capital structure, and the method by which assets were acquired. Adjusted Free Cash Flow Adjusted Free Cash Flow is utilized by our chief operating decision makers to evaluate cash flow activities. Adjusted Free Cash Flow is computed as Adjusted EBITDA reduced by capital expenditures (including nuclear fuel but excluding development, growth, and (or) conversion capital expenditures), cash payments for interest and finance charges, cash payments for income taxes (excluding income taxes paid from the NDT, taxes paid or deductions taken as a result of strategic asset sales, and benefits of the Nuclear PTC utilized to reduce income taxes paid), and pension contributions. We believe Adjusted Free Cash Flow is useful to investors and other users of our financial statements in evaluating our operating performance because it provides them with an additional tool to determine a company’s ability to meet future obligations and to compare business performance across companies and across periods. Adjusted Free Cash Flow is widely used by investors to measure a company’s levered cash flow without regard to items such as ARO settlements; nonrecurring development, growth and conversion expenditures; and cash proceeds or payments for the sale or purchase of assets, which can vary substantially from company to company and from period to period depending upon accounting methods, book value of assets, capital structure, and the method by which assets were acquired. © Talen Energy Corporation
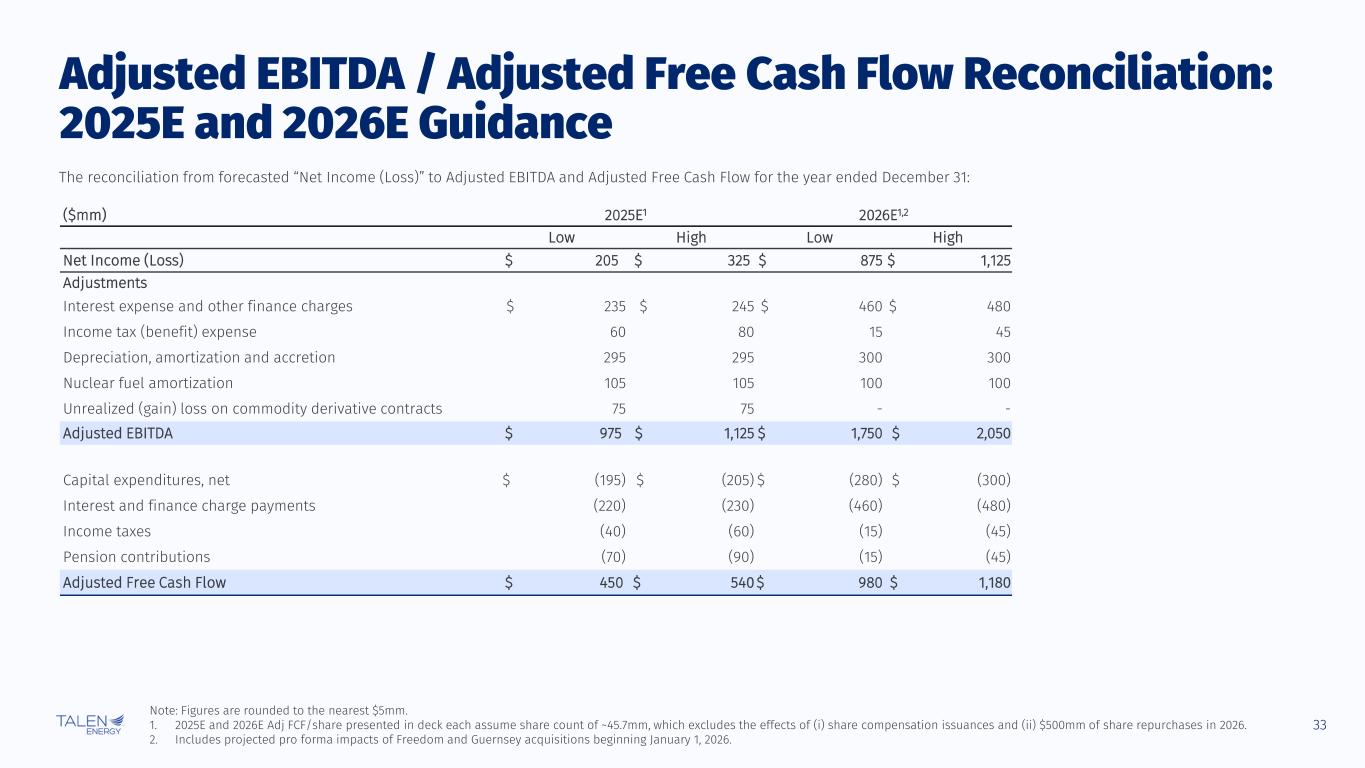
33 Adjusted EBITDA / Adjusted Free Cash Flow Reconciliation: 2025E and 2026E Guidance The reconciliation from forecasted “Net Income (Loss)” to Adjusted EBITDA and Adjusted Free Cash Flow for the year ended December 31: ($mm) 2025E1 2026E1,2 Low High Low High Net Income (Loss) $ 205 $ 325 $ 875 $ 1,125 Adjustments Interest expense and other finance charges $ 235 $ 245 $ 460 $ 480 Income tax (benefit) expense 60 80 15 45 Depreciation, amortization and accretion 295 295 300 300 Nuclear fuel amortization 105 105 100 100 Unrealized (gain) loss on commodity derivative contracts 75 75 - - Adjusted EBITDA $ 975 $ 1,125 $ 1,750 $ 2,050 Capital expenditures, net $ (195) $ (205) $ (280) $ (300) Interest and finance charge payments (220) (230) (460) (480) Income taxes (40) (60) (15) (45) Pension contributions (70) (90) (15) (45) Adjusted Free Cash Flow $ 450 $ 540 $ 980 $ 1,180 Note: Figures are rounded to the nearest $5mm. 1. 2025E and 2026E Adj FCF/share presented in deck each assume share count of ~45.7mm, which excludes the effects of (i) share compensation issuances and (ii) $500mm of share repurchases in 2026. 2. Includes projected pro forma impacts of Freedom and Guernsey acquisitions beginning January 1, 2026.
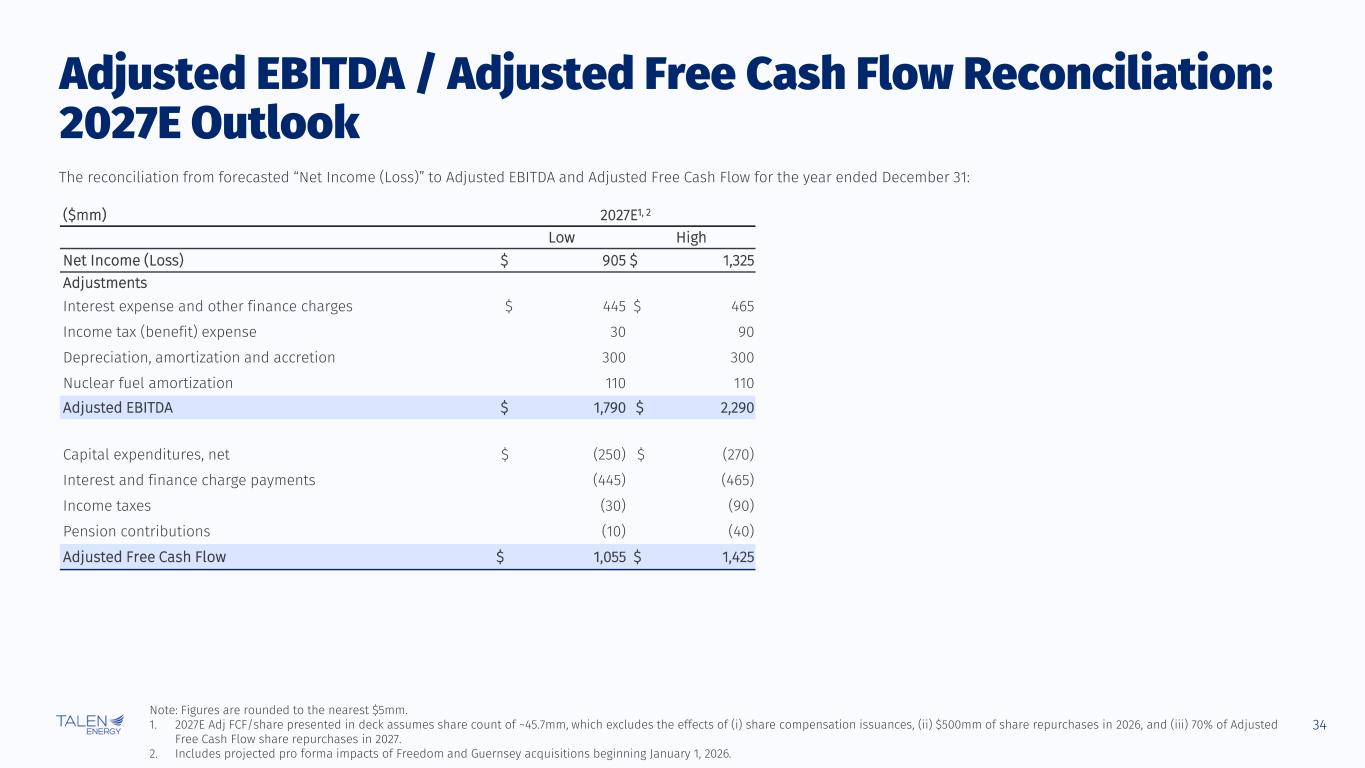
34 Adjusted EBITDA / Adjusted Free Cash Flow Reconciliation: 2027E Outlook The reconciliation from forecasted “Net Income (Loss)” to Adjusted EBITDA and Adjusted Free Cash Flow for the year ended December 31: ($mm) 2027E1, 2 Low High Net Income (Loss) $ 905 $ 1,325 Adjustments Interest expense and other finance charges $ 445 $ 465 Income tax (benefit) expense 30 90 Depreciation, amortization and accretion 300 300 Nuclear fuel amortization 110 110 Adjusted EBITDA $ 1,790 $ 2,290 Capital expenditures, net $ (250) $ (270) Interest and finance charge payments (445) (465) Income taxes (30) (90) Pension contributions (10) (40) Adjusted Free Cash Flow $ 1,055 $ 1,425 Note: Figures are rounded to the nearest $5mm. 1. 2027E Adj FCF/share presented in deck assumes share count of ~45.7mm, which excludes the effects of (i) share compensation issuances, (ii) $500mm of share repurchases in 2026, and (iii) 70% of Adjusted Free Cash Flow share repurchases in 2027. 2. Includes projected pro forma impacts of Freedom and Guernsey acquisitions beginning January 1, 2026.