
Management's
Discussions and Analysis
For the year
ended
December 31, 2025
| OR Royalties Inc. 2025 – Annual Report |
Management’s Discussion and Analysis |
The following management discussion and analysis ("MD&A") of the consolidated operations and financial position of OR Royalties Inc. ("OR Royalties" or the "Company") and its subsidiaries for the year ended December 31, 2025 should be read in conjunction with the Company's audited consolidated financial statements and related notes for the year ended December 31, 2025. The audited consolidated financial statements have been prepared in accordance with IFRS Accounting Standards as issued by the International Accounting Standards Board ("IASB"). Management is responsible for the preparation of the consolidated financial statements and other financial information relating to the Company included in this report. The Board of Directors is responsible for ensuring that management fulfills its responsibilities for financial reporting. In furtherance of the foregoing, the Board of Directors has appointed an Audit and Risk Committee composed of independent directors. The Audit Committee meets with management and the auditors in order to discuss results of operations and the financial condition of the Company prior to making recommendations and submitting the consolidated financial statements to the Board of Directors for its consideration and approval for issuance to shareholders. The information included in this MD&A is as of February 18, 2026, the date when the Board of Directors has approved the Company's audited consolidated financial statements for the year ended December 31, 2025 following the recommendation of the Audit and Risk Committee. All monetary amounts included in this report are expressed in U.S. dollars, the Company's reporting currency, unless otherwise noted. This MD&A contains forward-looking statements and should be read in conjunction with the risk factors described in the "Forward-Looking Statements" section.
Table of Contents
| OR Royalties Inc. 2025 – Annual Report |
Management’s Discussion and Analysis |
Description of the Business
At the annual and special meeting of shareholders held on May 8, 2025, the shareholders of the Company approved the resolution to amend the articles of the Company to change its name from "Osisko Gold Royalties Ltd" to "OR Royalties Inc.". The name change became effective on that date.
OR Royalties is engaged in the business of acquiring and managing royalties, streams and similar interests on precious metals and other commodities that fit the Company's risk/reward objectives. The Company owns a portfolio of royalties, streams, options on royalty/stream financings and exclusive rights to participate in future royalty/stream financings on various projects. The Company's cornerstone asset is a 3-5% net smelter return ("NSR") royalty on the Canadian Malartic Complex, located in Québec, Canada.
OR Royalties is a public company domiciled in the Province of Québec, Canada, whose shares trade on the Toronto Stock Exchange ("TSX") and the New York Stock Exchange ("NYSE") and is constituted under the Business Corporations Act (Québec). The address of its registered office is 1100, avenue des Canadiens-de-Montréal, Suite 300, Montréal, Québec.
Business Model and Strategy
OR Royalties is focused on acquiring high-quality, long-life precious metals royalties and streams on assets located in favourable jurisdictions that are operated by established mining companies. The Company deploys capital through the acquisition of royalty and stream investments on metal mining projects at various stages of operation and development. OR Royalties endeavours to provide investors with lower-risk precious metals exposure via a geographically and operationally diversified asset base. OR Royalties' objective is to deploy capital into new and accretive investment opportunities to further enhance its growth profile.
Highlights
Year 2025
1 GEOs are calculated on a quarterly basis and include royalties and streams. Silver ounces and copper tonnes earned from royalty and stream agreements are converted to gold equivalent ounces by multiplying the silver ounces or copper tonnes earned by the average silver price per ounce or copper price per tonne for the period and dividing by the average gold price per ounce for the period. Cash royalties, other metals and commodities are converted into gold equivalent ounces by dividing the associated revenue by the average gold price per ounce for the period. For average metal prices used, refer to the Portfolio of Royalty, Stream and Other Interests section of this MD&A.
2 "Adjusted earnings" and "Adjusted earnings per basic share" are non-IFRS financial performance measures which have no standard definition under IFRS Accounting Standards and might not be comparable to similar financial measures disclosed by other issuers. Refer to the non-IFRS measures provided under the Non-IFRS Financial Performance Measures section of this MD&A for further information and for a quantitative reconciliation of each non-IFRS financial measure to the most directly comparable IFRS financial measure.
| OR Royalties Inc. 2025 – Annual Report |
Management’s Discussion and Analysis |
Subsequent to December 31, 2025
Corporate Update
On January 29, 2026, the Company announced the appointment of Mr. Kevin Thomson as an Independent Director to its Board of Directors. Concurrently, the Company announced that Mr. William Murray John has resigned as a director of the Company, effective immediately.
Mr. Kevin Thomson brings over 40 years of senior strategic mergers and acquisitions experience in the mining industry. Most recently, Mr. Thomson served as Senior Executive Vice President, Strategic Matters for Barrick Gold Corporation ("Barrick") where he was involved in all matters of strategic significance, including the management of complex negotiations, development of Barrick's corporate strategy, involvement in complex legal issues, and governance-related matters.
Guidance for 2026 and 5-Year Outlook
2026 Guidance
OR Royalties expects GEOs earned to range between 80,000 to 90,000 in 2026 at an average cash margin3 of approximately 97%. For the 2026 guidance, deliveries of silver, copper, and cash royalties were converted to GEOs using commodity prices based on February 2026 consensus commodity prices and a gold/silver price ratio of 73:1.
The 2026 guidance assumed ramp-ups at both the Dalgaranga and San Gabriel mines, as well as first payments received under those gross revenue and NSR royalties from Ramelius Resources Ltd. and Buenaventura, respectively. The guidance also assumes increased payments associated GEOs earned from the Company's 2.0% NSR royalty covering Cardinal Namdini Mining Ltd.'s Namdini mine. In addition, the guidance assumes relatively consistent year-over-year GEO deliveries from Capstone Copper Corp.'s Mantos Blancos mine. Finally, the guidance assumes conservative estimates of GEOs expected to be earned from Harmony's CSA mine, as Harmony's ownership transition continues and the Harmony team continues to condition the asset for optimized performance over the long-term.
OR Royalties' 2026 guidance on royalty and stream interests is largely based on publicly available forecasts from its operating partners. When publicly available forecasts on properties are not available, OR Royalties obtains internal forecasts from the producers or uses management's best estimate.
5-Year Outlook
OR Royalties expects its portfolio to generate between 120,000 and 135,000 GEOs in 2030. The outlook assumes the commencement of production at Gold Fields' Windfall, South32 Limited's Hermosa/Taylor, Osisko Development Corp.'s Cariboo, Solidus Resources LLC's Spring Valley, United Gold's Amulsar and Orla Mining Ltd.'s South Railroad projects, respectively. It also assumes increased production from certain other operators that are advancing expansions including Alamos Gold Inc.'s Island Gold District Expansion, amongst others. The 5-year outlook assumes there will be no GEO contribution from the Eagle Gold mine, which remains in receivership.
3 Cash margin is a non-IFRS financial performance measure which has no standard definition under IFRS Accounting Standards and might not be comparable to similar financial measures disclosed by other issuers. It is calculated by deducting the cost of sales (excluding depletion) from the revenues. Please refer to the Non-IFRS Financial Performance Measures section of this MD&A for further information and for a quantitative reconciliation of each non-IFRS financial measure to the most directly comparable IFRS financial measure.
| OR Royalties Inc. 2025 – Annual Report |
Management’s Discussion and Analysis |
Beyond this growth profile, OR Royalties owns several other growth assets, which have not been factored into the 5-year outlook, as their respective development timelines are either longer, or difficult to reasonably forecast at this time. As these operators provide additional clarity on these respective assets, OR Royalties will seek to include them in future long-term outlooks.
The 5-year outlook is based on internal judgements of publicly available forecasts and other disclosure by the third-party owners and operators of the Company's assets and could differ materially from actual results. When publicly available forecasts on properties are not available, OR Royalties obtains internal forecasts from the operators or uses management's best estimate. The commodity price assumptions that were used in the 5-year outlook are based on current long-term consensus and a gold/silver price ratio of 82:1.
This 5-year outlook replaces the 5-year outlook previously released in February 2025, the latter of which should be considered as withdrawn. Investors should not use the current 5-year outlook to extrapolate forecast results to any year within the 5-year period (2026-2030).
Portfolio of Royalty, Stream and Other Interests
The following table details the GEOs earned by the Company's producing royalty, stream and other interests:
| Three months ended December 31, |
Year ended December 31, |
|||||||||||
| 2025 | 2024 | 2025 | 2024 | |||||||||
| Gold | ||||||||||||
| Canadian Malartic Complex royalty | 7,830 | 7,460 | 31,914 | 32,588 | ||||||||
| Éléonore royalty | 1,211 | 1,358 | 5,123 | 5,273 | ||||||||
| Island Gold District royalty | 823 | 765 | 3,274 | 3,011 | ||||||||
| Seabee royalty | 261 | 298 | 2,135 | 2,456 | ||||||||
| Ermitaño royalty | 477 | 652 | 1,967 | 2,419 | ||||||||
| Lamaque Complex royalty | 384 | 409 | 1,788 | 1,737 | ||||||||
| Namdini royalty (i) | 677 | - | 1,435 | - | ||||||||
| Pan royalty | 361 | 344 | 1,283 | 1,340 | ||||||||
| Tocantinzinho royalty (ii) | 305 | 120 | 1,102 | 120 | ||||||||
| Bald Mountain royalty | 357 | - | 825 | 869 | ||||||||
| Fruta del Norte royalty | 104 | 115 | 451 | 416 | ||||||||
| Eagle Gold royalty (iii) | - | - | - | 2,857 | ||||||||
| Others | 356 | 190 | 1,184 | 719 | ||||||||
| 13,146 | 11,711 | 52,481 | 53,805 | |||||||||
| Silver | ||||||||||||
| Mantos Blancos stream | 4,683 | 2,385 | 12,830 | 9,430 | ||||||||
| CSA stream | 1,483 | 1,545 | 4,782 | 5,407 | ||||||||
| Sasa stream | 1,130 | 1,094 | 4,406 | 4,286 | ||||||||
| Gibraltar stream | 747 | 472 | 2,217 | 2,132 | ||||||||
| Canadian Malartic Complex royalty | 61 | 46 | 191 | 175 | ||||||||
| Others | 54 | 63 | 210 | 180 | ||||||||
| 8,158 | 5,605 | 24,636 | 21,610 | |||||||||
| Copper and others | ||||||||||||
| CSA copper stream (iv) | 408 | 1,350 | 2,930 | 2,679 | ||||||||
| Renard diamond stream (v) | - | 285 | 646 | 1,529 | ||||||||
| Others | 23 | 1,054 | 82 | 1,117 | ||||||||
| 431 | 2,689 | 3,658 | 5,325 | |||||||||
| Total GEOs | 21,735 | 20,005 | 80,775 | 80,740 | ||||||||
(i) The Company received its first payment during the second quarter of 2025. The Namdini mine is currently ramping up production towards full design capacity.
(ii) G Mining Ventures Corp. announced its first gold production on July 9, 2024. Commercial production was declared on September 3, 2024, and the first royalty payment was received in the fourth quarter of 2024.
(iii) On June 24, 2024, Victoria Gold Corp. ("Victoria") announced a slope failure of its heap leach facility at the Eagle Gold mine and operations have since been suspended. Please refer to the Portfolio of Royalty, Stream and Other Interests section of this MD&A for more details.
(iv) The CSA copper stream was acquired on June 15, 2023, with an effective date of June 15, 2024. The first delivery of copper was received and sold by OR Royalties International (formerly Osisko Bermuda Limited) during the third quarter of 2024. Copper is delivered on the last day of each quarter, and may, in certain situations, be sold in the subsequent quarter.
(v) On October 27, 2023, Stornoway Diamonds (Canada) Inc. ("Stornoway"), the operator of the Renard diamond mine, announced it was suspending operations and placing itself under the protection of the Companies' Creditors Arrangement Act ("CCAA"). In 2024 and 2025, the Renard mine processed and sold a small number of diamonds as part of the care and maintenance plan.
| OR Royalties Inc. 2025 – Annual Report |
Management’s Discussion and Analysis |
2025 Actual Results vs Guidance
The following table compares the actual results with the guidance released in February 2025:
| Actual Results | Guidance | ||||||||||||||
| |
GEOs |
Cash Margin |
Low | High | Cash Margin |
||||||||||
| (%) | (GEOs) | (GEOs) | (%) | ||||||||||||
| Royalties and streams | 80,775 | 96.7% | 80,000 | 88,000 | 97.0 | ||||||||||
GEOs earned in 2025 were within the original guidance published in February 2025, despite being negatively affected by the higher gold to silver and gold to copper ratios (when compared to budgeted ratios used for the 2025 guidance).
GEOs earned, year-over-year, were stable in 2025. The stoppage of operations at the Eagle Gold mine in June 2024 (2,857 GEOs were earned from the Eagle Gold mine royalty in 2024) were more than offset by an increase in silver deliveries from the Mantos Blancos mine and an increase from the Tocantinzinho royalty payments, as the mine was ramping up its operations during the year. The Company also received its first payment from its Namdini royalty, where the operator was also ramping up its operations in 2025.
GEOs by Product
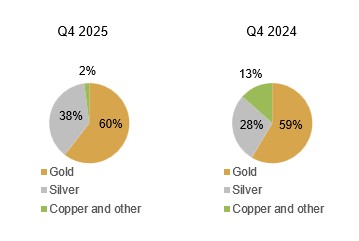 |
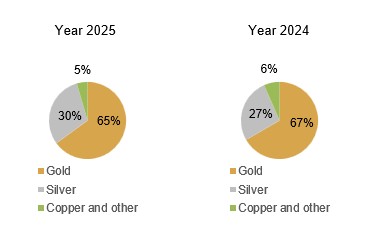 |
Average Metal Prices and Exchange Rate
| Three months ended December 31, | Year ended December 31, | |||||||||||||||||||||||
| 2025 | 2024 | 2025 | 2024 | |||||||||||||||||||||
| Realized | Average | Realized | Average | Realized | Average | Realized | Average | |||||||||||||||||
| Gold (i) | $4,122 | $4,135 | $2,656 | $2,663 | $3,425 | $3,432 | $2,361 | $2,386 | ||||||||||||||||
| Silver (ii) | $55 | $55 | $31 | $31 | $41 | $40 | $28 | $28 | ||||||||||||||||
| Copper (iii) | $11,750 | $11,092 | $8,880 | $9,193 | $10,153 | $9,945 | $8,920 | $9,147 | ||||||||||||||||
| Exchange rate (C$/US$) (iv) | n/a | 0.7170 | n/a | 0.7154 | n/a | 0.7157 | n/a | 0.730 | ||||||||||||||||
(i) The average price represents the London Bullion Market Association's PM price in U.S. dollars per ounce.
(ii) The average price represents the London Bullion Market Association's price in U.S. dollars per ounce.
(iii) The average price represents the London Metal Exchange's price in U.S. dollars per tonne.
(iv) Bank of Canada daily rate.
| OR Royalties Inc. 2025 – Annual Report |
Management’s Discussion and Analysis |
Royalty, Stream and Other Interests Portfolio Overview
As at February 18, 2026, OR Royalties owned a portfolio of 179 royalties, 15 streams and 3 offtakes, as well as 7 royalty options. Currently, the Company has 22 producing assets.
Portfolio by asset stage
| Asset stage | Royalties | Streams | Offtakes | Total number of assets |
||||||||
| Producing | 17 | 5 | - | 22 | ||||||||
| Development | 16 | 9 | 1 | 26 | ||||||||
| Exploration and evaluation | 146 | 1 | 2 | 149 | ||||||||
| 179 | 15 | 3 | 197 |
Producing assets (i)
| Asset | Operator | Interest (ii) | Commodity | Jurisdiction |
| North America | ||||
| Akasaba West (iii) | Agnico Eagle Mines Limited | 2.5% NSR royalty | Au, Cu | Canada |
| Bald Mtn. Alligator Ridge / Duke & Trapper |
Kinross Gold Corporation | 1% / 4% GSR (iv) royalty | Au | USA |
| Bralorne (v) | Talisker Resources Ltd. | 1.7% NSR royalty | Au | Canada |
| Canadian Malartic Complex | Agnico Eagle Mines Limited | 3 - 5% NSR royalty | Au, Ag | Canada |
| Éléonore | Dhilmar Ltd. | 2.2 - 3.5% NSR royalty | Au | Canada |
| Ermitaño | First Majestic Silver Corp. | 2% NSR royalty | Au, Ag | Mexico |
| Gibraltar | Taseko Mines Limited | 100% stream | Ag | Canada |
| Island Gold District | Alamos Gold Inc. | 1.38 - 3% NSR royalty | Au | Canada |
| Lamaque Complex | Eldorado Gold Corporation | 1% NSR royalty | Au | Canada |
| Macassa TH | Agnico Eagle Mines Limited | 1% NSR royalty | Au | Canada |
| Pan | Minera Alamos Inc. | 4% NSR royalty | Au | USA |
| Parral | GoGold Resources Inc. | 2.4% stream | Au, Ag | Mexico |
| Santana | Minera Alamos Inc. | 3% NSR royalty | Au | Mexico |
| Seabee | SSR Mining Inc. | 3% NSR royalty | Au | Canada |
| Outside of North America | ||||
| Brauna | Lipari Mineração Ltda | 1% GRR (vi) | Diamonds | Brazil |
| CSA | Harmony Gold Mining Company Limited | 100% stream 2.25 - 4.875% stream |
Ag Cu |
Australia |
| Dolphin Tungsten | Group 6 Metals Limited | 1.5% GRR | Tungsten (W) | Australia |
| Fruta del Norte | Lundin Gold Inc. | 0.1% NSR royalty | Au | Ecuador |
| Mantos Blancos | Capstone Copper Corp. | 100% stream | Ag | Chile |
| Namdini (vii) | Cardinal Namdini Mining Ltd. | 2% NSR royalty | Au | Ghana |
| Sasa | Central Asia Metals plc | 100% stream | Ag | North Macedonia |
| Tocantinzinho | G Mining Ventures Corp. | 0.75% NSR royalty | Au | Brazil |
| OR Royalties Inc. 2025 – Annual Report |
Management’s Discussion and Analysis |
Key exploration/evaluation and development assets
| Asset | Operator | Interest | Commodities | Jurisdiction |
| Altar | Aldebaran Resources Inc. and Sibanye-Stillwater Ltd. | 1% NSR royalty | Cu, Au | Argentina |
| Amulsar | United Gold (private) | 3.34% Au / 49.22% Ag streams | Au, Ag | Armenia |
| Arctic | South32 Limited / Trilogy Metals Inc. | 1% NSR royalty | Cu | USA |
| AntaKori | Regulus Resources Inc. | 0.75% - 1.5% NSR royalty | Cu, Au | Peru |
| Back Forty | Gold Resource Corporation | 18.5% Au / 85% Ag streams | Au, Ag | USA |
| Cariboo | Osisko Development Corp. | 5% NSR royalty | Au | Canada |
| Cascabel | SolGold plc (viii) | 6% stream 0.6% NSR royalty |
Au Cu, Au |
Ecuador |
| Casino | Western Copper & Gold Corporation | 2.75% NSR royalty | Au, Ag, Cu | Canada |
| Copperwood | Highland Copper Company Inc. | 1.5% NSR royalty 0.115% NSR royalty |
Cu Ag |
USA |
| Dalgaranga | Ramelius Resources Limited | 1.44% GRR | Au | Australia |
| Eagle Gold (ix) | Victoria Gold Corp. | 5% NSR royalty | Au | Canada |
| Hammond Reef | Agnico Eagle Mines Limited | 2% NSR royalty | Au | Canada |
| Hermosa (Taylor) | South32 Limited | 1% NSR royalty on sulphide ores | Zn, Pb, Ag | USA |
| Horne 5 | Falco Resources Ltd. | 90% - 100% stream | Ag | Canada |
| Marban | Agnico Eagle Mines Limited | 0.435-2% NSR royalty | Au | Canada |
| Marimaca MOD | Marimaca Copper Corp. | 1% NSR royalty | Cu | Chile |
| Pine Point | Pine Point Mining Limited | 3% NSR royalty | Zn, Pb | Canada |
| Shaakichiuwaanaan | PMET Resources Inc. | 2% NSR royalty | Lithium (Li) | Canada |
| South Railroad | Orla Mining Ltd. | 100% Ag stream | Ag | USA |
| Spring Valley (x) | Solidus Resources LLC | 0.5 - 3.5% NSR royalty | Au | USA |
| Upper Beaver | Agnico Eagle Mines Limited | 2% NSR royalty | Au, Cu | Canada |
| West Kenya | Saturn Resources Ltd. | 2% NSR royalty | Au | Kenya |
| Wharekirauponga (WKP) | OceanaGold Corporation | 2% NSR royalty | Au, Ag | New Zealand |
| White Pine | White Pine Copper LLC | 1.5% NSR royalty 11.5% NSR royalty |
Cu Ag |
USA |
| Windfall | Gold Fields Limited | 2.0 - 3.0% NSR royalty | Au | Canada |
(i) The Renard diamond stream is excluded from producing assets as deliveries received since 2023 are only related to residual production from the care and maintenance plan.
(ii) Excluding tail royalties and streams reduction, when applicable.
(iii) The royalty covers less than half of the planned open-pit mine surface area.
(iv) Gross smelter return ("GSR").
(v) In April 2025, Talisker Resources Ltd. announced that it has begun lateral development on the Alhambra Vein at the Bralorne gold project. The Company received its first royalty payment in April 2025.
(vi) Gross revenue royalty ("GRR").
(vii) During the second quarter of 2025, the Company received its first royalty payment from the Namdini gold mine. In January 2026, the Company acquired an additional 1% NSR royalty on the Namdini mine for a total royalty of 2%.
(viii) On December 24, 2025, SolGold plc announced it had agreed to be acquired by its largest shareholder, Jiangxi Copper Company Limited.
(ix) On June 24, 2024, Victoria announced a slope failure of its heap leach facility at the Eagle Gold mine and operations have since been suspended. On August 14, 2024, PricewaterhouseCoopers Inc., LIT was appointed as receiver and manager of Victoria Gold Corp. by the Ontario Superior Court of Justice. Please refer to the Portfolio of Royalty, Stream and Other Interests section of this MD&A for more details.
(x) A 2.5% to 3.0% NSR royalty is applicable to the core resource area; a separate 0.5% NSR royalty is applicable on the periphery of the property.
| OR Royalties Inc. 2025 – Annual Report |
Management’s Discussion and Analysis |
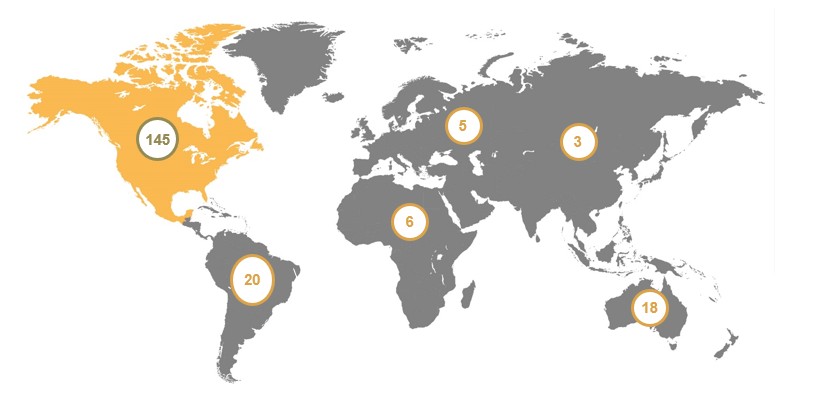
Main Producing Assets
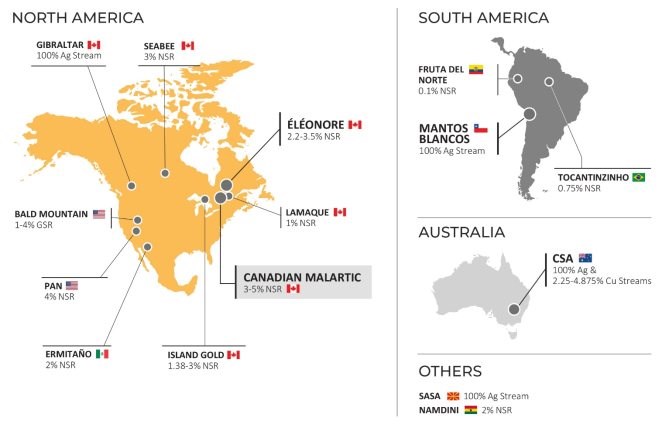
Geographical Distribution of Assets
| OR Royalties Inc. 2025 – Annual Report |
Management’s Discussion and Analysis |
Royalty, Stream and Other Interests - Main Transactions (2025)
In May 2025, OR Royalties International acquired a silver stream on Orla Mining Ltd.'s South Railroad project in Nevada, United States, from a third-party for $13.0 million. OR Royalties International will be entitled to receive 100% of the silver production from the Dark Star, Pinion and Jasperoid Wash deposits for the life of mine, in exchange for ongoing cash payments for refined silver equal to 15% of the silver spot price at the time of delivery.
In July 2025, OR Royalties International completed the second payment of $10.0 million on the Cascabel gold stream. The remaining deposit of $205.0 million will be paid as follows:
Royalty, Stream and Other Interests - Buy-back and Buy-down Rights
Some royalty, stream and other interests are subject to buy-back and/or buy-down rights held by the operators. The significant buy-back and buy-down rights are described below.
CSA copper stream
OR Royalties International owns separate silver and copper streams on the CSA mine. Specific to the copper stream agreement, OR Royalties International is entitled to receive refined copper equal to 3.0% of payable copper produced from the CSA mine until the 5th anniversary of the agreement, then 4.875% of payable copper produced from the CSA mine until 33,000 metric tonnes have been delivered in aggregate, and thereafter 2.25% of payable copper produced from the CSA mine for the remaining life of the mine.
On the 5th anniversary of the closing date (June 15, 2028), the owner of the mine will have the option to exercise certain buy-down rights by paying a one-time cash payment to OR Royalties International of $20.0 million to $40.0 million. If the option is exercised, OR Royalties International will still be entitled to receive refined copper equal to 3.25% - 4.0625% of payable copper produced from the CSA mine until 23,900 to 28,450 metric tonnes have been delivered in aggregate, and thereafter 1.5% - 1.875% of payable copper produced from the CSA mine for the remaining life of the mine.
Cascabel NSR royalty and gold stream
OR Royalties owns a 0.6% NSR royalty on the Cascabel project, which is subject to a buy-down option. On November 30, 2026, the owner of the Cascabel project may buy-down 1/3 of the NSR royalty in exchange for a one-time cash payment of approximately $35.0 million.
OR Royalties International owns a 6.0% gold stream on contained ounces of gold produced from the Cascabel project until 225,000 ounces of gold have been delivered, and 3.6% thereafter for the remaining life of the mine. On December 24, 2025, SolGold plc, the current owner of the Cascabel project, announced it had agreed to be acquired by its largest shareholder, Jiangxi Copper Company Limited. As a result of the change of control, the gold stream will be subject to a buy-down option once the transaction is completed. Prior to July 15, 2027, the new owner will have a one-time right to repurchase 50% of the gold stream for a one-time payment of gold equal to 50% of the then advanced amount of OR Royalties International's total pre-construction and construction deposits, plus certain adjustments.
| OR Royalties Inc. 2025 – Annual Report |
Management’s Discussion and Analysis |
Main Producing Assets - Updates
Canadian Malartic Complex Royalty (Agnico Eagle Mines Limited)
The Company holds a 3-5% NSR royalty on the Canadian Malartic mine, which is located in Malartic, Québec and is operated by Agnico Eagle Mines Limited ("Agnico Eagle"). OR Royalties also holds a 5.0% NSR royalty on the East Gouldie and Odyssey South underground deposits, a 3.0% NSR royalty on the Odyssey North underground deposit and a 3.0-5.0% NSR royalty on the East Malartic underground deposit, which are located adjacent to the Canadian Malartic mine. The Canadian Malartic mine and the Odyssey mine now form the Canadian Malartic Complex. In addition, a C$0.40 per tonne milling fee is payable to OR Royalties on ore processed from any property that was not part of the Canadian Malartic property at the time of the sale of the mine in 2014.
Guidance - 2026 and three-year forecast
On February 12, 2026, Agnico Eagle reported production guidance of 575,000 to 605,000 ounces of gold at Canadian Malartic for the year 2026, compared to 642,612 ounces of gold produced in 2025. The company's gold production is forecast to range between 640,000 to 670,000 ounces in 2027 and 720,000 - 750,000 ounces in 2028.
Agnico Eagle continues to advance the transition to underground mining with the construction of the Odyssey mine. Once the Barnat pit at Canadian Malartic is depleted in 2029, annual gold production is expected to be in the range of 550,000 to 600,000 ounces, supported by an underground mining rate of approximately 19,000 tpd from four deposits. At that time, the processing plant is expected to have approximately 40,000 tpd of excess capacity. The Company is advancing three projects to potentially utilize a portion of this excess capacity and position Canadian Malartic to ramp-up toward one million ounces of annual gold production starting in 2033. These projects include (i) a second shaft at Odyssey, (ii) the development of a satellite open pit at Marban and (iii) the development of the Wasamac underground project. Marban and Wasamac are located approximately 12 kilometres and 100 kilometres from the Canadian Malartic mill, respectively. In 2026, Canadian Malartic has planned four-day quarterly shutdowns for regular maintenance at the mill. OR Royalties owns several royalties over Marban that have a blended ~0.9% NSR royalty, and both Marban and Wasamac would be eligible to the C$0.40 toll milling fee for the Canadiam Malartic mill.
Update on operations
On February 12, 2026, Agnico Eagle reported gold production at the Canadian Malartic Complex of 153,433 ounces in the fourth quarter of 2025, compared to 146,485 ounces in the fourth quarter of 2024. For the full year 2025, production reached 642,612 ounces of gold compared to 655,654 ounces of gold in 2024.
Update on Odyssey
Exploration drilling in 2025 continued to expand the mineral reserves and mineral resources at the Odyssey mine, further demonstrating the quality and scale of the East Gouldie and Odyssey deposits. As of December 31, 2025, Mineral Reserves are estimated at 6.0 million ounces of gold (59.7 million tonnes grading 3.14 g/t Au). Measured and Indicated Resources are estimated at 3.4 million ounces of gold (57.8 million tonnes grading 1.85 g/t Au), and Inferred Resources are estimated at 12.7 million ounces of gold (177.7 million tonnes grading 2.21 g/t Au) and is undertaking a technical evaluation expected to be completed at the end of 2026.
The June 2023 technical update incorporated approximately 9.0 million ounces in the mine plan and envisioned a mine life extending to 2042. The significant growth of the mineral reserve and mineral resource base since December 31, 2022 supports the potential for a meaningful extension of the Odyssey mine life and provides a strong foundation for a larger, long-term production profile, with the addition of a new mining front supported by a second shaft. Agnico Eagle believes this positions Odyssey as a multi-decade, world-class asset.
Odyssey Shaft #1
Mine development continued to progress ahead of schedule in the fourth quarter of 2025, delivering record quarterly advancement at Odyssey. The focus remains on preparing East Gouldie for the start of ramp-based production, expected in the first quarter of 2026 (three months earlier than planned). Development of the production levels for the first mining area has been completed, with workings now accessing East Gouldie mineralization, and the main ramp has reached the bottom of the second mining sequence at level 111 (a depth of 1,112 metres). Installation of the paste distribution infrastructure and essential services is nearing completion. Ventilation development also advanced, with raise excavations to level 58 ongoing and construction of the main exhaust fan station underway.
Development of the material-handling infrastructure for the first shaft loading station between levels 102 and 114 continued to advance on schedule, supporting the expected start of shaft-hoisted production from East Gouldie in the second quarter of 2027. Shaft sinking progressed ahead of plan, reaching a depth of 1,466 metres as at December 31, 2025, reaching the top of the planned second loading station. Excavation of the material-handling infrastructure for the second loading station between levels 146 and 150 is now underway and is expected to continue through the third quarter of 2026. Shaft sinking remains on track to complete the first phase in the first quarter of 2027 at a planned depth of 1,600 metres, with the second loading station targeted for commissioning in 2029. A second phase of sinking is expected to resume in 2029 and be completed in 2031, extending the shaft to its final expected depth of 1,870 metres. The third loading station, located between levels 181 and 187, is expected to be completed and commissioned in 2031.
| OR Royalties Inc. 2025 – Annual Report |
Management’s Discussion and Analysis |
Construction of key surface infrastructure progressed on schedule and on budget. Fabrication of the production hoist is underway in Germany, with delivery expected in the second quarter of 2026. Construction progressed on phase two of the paste plant (designed for a 20,000 tpd capacity) and is expected to be completed in 2027.
Odyssey Shaft #2
Agnico Eagle is advancing a technical evaluation of a potential second shaft at the Odyssey mine, with the preferred shaft location now confirmed near Shaft #1 and close to the centre of gravity of the deposit. Drilling of the geotechnical pilot hole is progressing well, reaching a depth of 831 metres as at December 31, 2025, toward a planned depth of approximately 2,200 metres. The evaluation, which incorporates the year-end 2025 mineral resource update, will assess the potential for developing an 8,000 to 10,000 tpd operation, supported by a second shaft equipped with a friction hoist and dedicated service hoist, a configuration expected to lower operating costs and capital expenditures, accelerate start-up by requiring only one loading station and reduce the surface footprint.
The technical evaluation is expected to be completed at the end of 2026, with permitting studies scheduled to begin in the third quarter of 2026 and potential formal permit submission in early 2027. Approval of an amendment to the existing decree is expected to take approximately one year from submission of the application. Subject to permitting and board approval, construction, shaft sinking and development of the associated underground material-handling and production infrastructure would be expected to take place over a four-year period, positioning the project for potential initial production in 2033.
Marban - Satellite Open Pit
The Company holds a 0.435% - 2% NSR royalty on the Marban Deposit.
As part of Agnico Eagle's "fill-the-mill" strategy at the Canadian Malartic complex, the Marban property, located immediately northeast of the Canadian Malartic property, was acquired in March 2025 as an advanced exploration project that could potentially support an open pit mining operation similar to the Barnat open pit operation at Canadian Malartic.
In the fourth quarter of 2025, Agnico Eagle completed an internal evaluation on Marban, removing previous property-boundary constraints on the pit design, which resulted in the company's initial declaration of estimated probable mineral reserves of 1.58 million ounces of gold (51.6 million tonnes grading 0.95 g/t Au) at December 31, 2025. Additionally, drilling completed in the quarter confirmed and extended the Marban gold deposit onto the company's adjacent Callahan property to the east. The results of the drilling were not included in the 2025 mineral reserves and mineral resource estimates.
The technical evaluation envisions a 14,000 to 16,000 tpd open pit operation producing between 120,000 to 150,000 ounces of gold annually over a 12-year life of mine. In 2026, Agnico Eagle will integrate new drilling into an optimized pit design and assess opportunities to redeploy mobile equipment from the Barnat pit at Canadian Malartic to minimize capital expenditures for the project. The results of this evaluation, expected at the end of 2026, will support the permitting process which is expected to be completed in 2030. Project construction could begin in 2031, with the potential for initial production as early as 2033.
Update on exploration
On February 12, 2026, Agnico Eagle noted that at Odyssey in 2025, exploration drilling totalled 233,754 metres supplemented by an additional 34,672 metres of drilling dedicated to regional exploration around Canadian Malartic. Exploration drilling targeted multiple areas of the Odyssey mine, returning positive results in the eastern extension of the Odyssey South zone, the central, upper eastern, western and deeper areas of the East Gouldie deposit and in the Sheehan zone located west of the shaft.
Underground drilling in the upper eastern extension of the East Gouldie deposit was highlighted by hole UGED-071-029 intersecting 3.5 g/t Au over 19.8 metres at 1,010 metres depth, hole UGED-075-057 intersecting 4.9 g/t Au over 11.9 metres at 929 metres depth and hole UGED-095-004 intersecting 6.8 g/t Au over 9.3 metres at 990 metres depth. The results from this area of the deposit contributed to a large portion of the Mineral Reserves and Inferred Mineral Resources added to East Gouldie at year-end 2025.
Agnico Eagle expects to spend approximately $32.6 million for 190,700 metres of drilling at Canadian Malartic in 2026 with up to 20 drill rigs active at surface and underground to further assess the full potential of the Odyssey mine area and throughout the Canadian Malartic property package. The primary exploration targets remain the lateral extensions of the East Gouldie deposit and the Eclipse zone while at the Odyssey South and North zones infill drilling and the investigation of potential lateral extensions will continue. Studies are ongoing at the East Malartic deposit with the objective of converting mineral resources into mineral reserves as part of the Odyssey underground mine.
| OR Royalties Inc. 2025 – Annual Report |
Management’s Discussion and Analysis |
An additional $11 million for 45,000 metres of drilling will be spent in the Marban area for exploration and condemnation drilling around the Marban deposit under potential mining infrastructure, as well as for the purposes of mineral resource conversion and expansion of the Marban deposit.
Update on Mineral Reserve and Resource Estimates
Mineral Reserves and Mineral Resources at the Odyssey mine continued to grow significantly in 2025, further demonstrating the high-quality nature of the East Gouldie and Odyssey deposits. In total, the Odyssey mine hosted 6.0 million ounces of gold in Proven and Probable Mineral Reserves (59.7 million tonnes grading 3.14 g/t Au), 3.4 million ounces of gold in Measured and Indicated Mineral Resources (57.8 million tonnes grading 1.85 g/t Au) and 12.7 million ounces of gold in Inferred Mineral Resources (177.7 million tonnes grading 2.21 g/t Au) at December 31, 2025. These substantial Mineral Reserves and Mineral Resources continue to support the Company's vision for Canadian Malartic to potentially expand production in the future in combination with the development of satellite orebodies in the surrounding area.
At the Odyssey deposit's Odyssey South zone and Odyssey internal zone, positive reconciliation observed in the underground production and improvements to the Mineral Reserve model contributed to mineral reserves replacement at the Odyssey mine reaching 90%. As a result, the Mineral Reserves of the Odyssey deposit totalled 0.3 million ounces of gold (4.8 million tonnes grading 2.12 g/t Au) at December 31, 2025, similar to the previous year.
At the Canadian Malartic mine, the continued positive reconciliation observed in the open pit and improvements to the Mineral Reserve model contributed to the addition of 115,000 ounces of gold to Mineral Reserves in the open pit during 2025. As a result, the Mineral Reserve decreased by approximately 495,000 ounces of gold while the gold production accounted for 610,000 in-situ ounces of gold.
Exploration drilling during 2025 continued to extend the limits of the East Gouldie Inferred Mineral Resource laterally to the west and to the east. As a result, Inferred Mineral Resources at the East Gouldie deposit (including the sub-parallel Eclipse zone) increased by 62% (2.8 million ounces of gold) year over year to 7.4 million ounces of gold (94.3 million tonnes grading 2.43 g/t Au) at December 31, 2025.
Drilling targeting the Eclipse zone in 2025 resulted in the declaration at year-end of initial Inferred Mineral Resources of 0.6 million ounces of gold (6.7 million tonnes grading 2.74 g/t Au) within close proximity to the planned underground infrastructure.
For additional information, please refer to Agnico Eagle's press release dated February 12, 2026 titled "Agnico Eagle Reports Fourth Quarter And Full Year 2025 Results - Record Quarterly And Annual Free Cash Flow; 2025 Production Guidance Achieved; Total 2025 Shareholder Returns Of $1.4 Billion; Dividend Increased By 12.5%; Updated Three-Year Guidance" and Agnico Eagle's press release dated February 12, 2026 titled "Agnico Eagle Provides An Update On 2025 Exploration Results And 2026 Exploration Plans - Year Over Year Mineral Reserves Increase 2% To 55.4 Moz; Indicated Mineral Resources Increase 10% To 47.1 Moz And Inferred Mineral Resources Increase 15% To 41.8 Moz", both filed on www.sedarplus.ca.
Mantos Blancos Stream (Capstone Copper Corp.)
OR Royalties, through OR Royalties International, owns a 100% silver stream on the Mantos Blancos mine, an open-pit mine located in the Antofagasta region of Chile. The Mantos Blancos mine is owned and operated by Capstone Copper Corp. ("Capstone").
Under the stream, OR Royalties International will receive refined silver equal to 100% of the payable silver from the Mantos Blancos mine until 19.3 million ounces have been delivered (7.5 million ounces have been delivered as at December 31, 2025), after which the stream percentage will be reduced to 40%. The purchase price for the silver under the Mantos Blancos stream is 8% of the monthly average silver market price for each ounce of refined silver sold and delivered and/or credited by Capstone to OR Royalties International. OR Royalties International receives deliveries from Mantos Blancos production with a two-month lag.
Guidance - 2026
On February 17, 2026, Capstone reported production guidance of 48,000 to 56,000 tonnes of copper for the year 2026. Copper production at Mantos Blancos is forecast to decrease in 2026 when compared to a strong 2025 due to a one-year period of lower copper grades. Due to mine sequencing, sulphide copper grades are expected to approximate 0.70% in 2026, with higher copper grades expected to approximate 0.85% in 2027. Planned maintenance shutdowns are scheduled during the second quarter (4 days) and the third quarter of 2026 (3 days).
| OR Royalties Inc. 2025 – Annual Report |
Management’s Discussion and Analysis |
Update on operations
On January 15, 2026, Capstone reported that Mantos Blancos achieved record quarterly copper production of 16,861 tonnes in the fourth quarter, with an average sulphide plant throughput of approximately 21,391 tpd, exceeding design throughput levels for the second quarter in 2025. Total plant throughput averaged approximately 19,981 tpd in 2025, representing a 25% increase over 2024 driven by the successful ramp-up after the debottlenecking initiative. Annual copper production at Mantos Blancos was 61,919 tonnes, surpassing its 2025 production guidance range of 43,000 to 51,000 tonnes from its sulphides business and 6,000 to 8,000 tonnes from its cathode business, following a year of strong operations, and representing a 39% increase over 2024.
Capstone is currently evaluating the next phases of growth for Mantos Blancos, including the potential to increase the concentrator plant throughput to at least 27,000 tpd and increase cathode production from the underutilized SX-EW plant. A Mantos Blancos Phase II study focusing on the sulphide concentrator plant expansion is expected in the first half of 2026. The sulphide concentrator plant expansion is expected to utilize existing unused or underutilized process equipment, plus additional equipment for concentrate filtration, thickening and filtering of tailings.
Update on exploration
On October 30, 2025, Capstone reported that exploration drilling commenced at the Veronica and Nora-Quinta areas within and adjacent to the resource pit area. The program totals approximately 7,900 metres and was expected to be completed before year-end 2025. In parallel, infill drilling was undertaken during the third quarter of 2025, with activities focused on Phases 15 and 16. Sonic drilling over historic stockpiles was also completed early during the third quarter.
In addition, a passive seismic (ambient noise tomography) geophysical survey is underway at Mantos Blancos. Data acquisition has been completed along the pit area and in its immediate surrounding, with data processing and modelling scheduled for the fourth quarter of 2025. The survey aims to improve understanding of the local stratigraphy and may help identify new drill targets at depth or near the current deposit area.
For additional information, please refer to Capstone's press release dated October 30, 2025 titled "Capstone Copper Reports Third Quarter 2025 Results" and Capstone's press release dated January 15, 2026 titled "Capstone Copper Announces Record 2025 Production Results and Provides Update on Mantoverde Labour Negotiations", both filed on www.sedarplus.ca.
CSA Streams (Harmony Gold Mining Company Limited)
In May 2025, MAC Copper Limited ("MAC Copper") announced that it had entered into a binding scheme implementation deed with Harmony, under which it was proposed that Harmony Gold (Australia) Pty Ltd ("Harmony Australia") would acquire 100% of the issued share capital in MAC Copper in exchange for $12.25 cash per MAC Copper share. The Transaction closed in October 2025 and OR Royalties International received proceeds of $49.0 million in exchange for its equity investment, generating a gross profit of $9.0 million or 22% over a period of approximately 2 years.
OR Royalties, through OR Royalties International, holds a silver stream and a copper stream on the CSA copper mine, now operated by Harmony. OR Royalties International will purchase an amount of refined silver equal to 100% of the payable silver produced from CSA for the life of the mine and will make ongoing payments for refined silver delivered equal to 4% of the spot silver price at the time of delivery. OR Royalties International will also be entitled to purchase refined copper equal to 3.0% of payable copper produced from CSA until the 5th anniversary of the closing date (June 15, 2028), then 4.875% of payable copper produced from CSA until 33,000 metric tonnes have been delivered in aggregate, and thereafter 2.25% of payable copper produced from CSA for the remaining life of the mine. OR Royalties International will make ongoing payments for refined copper delivered equal to 4% of the spot copper price at the time of delivery. On the 5th anniversary of the closing date, Harmony will have the option to exercise certain buy-down rights on the copper stream by paying a one-time cash payment to OR Royalties International of $20.0 million to $40.0 million.
In July 2023, OR Royalties International received its first delivery of silver. The first delivery of copper under the CSA copper stream occurred in the first week of July 2024. As of December 31, 2025, a total of 1,748 tonnes of copper have been delivered to OR Royalties International under the stream agreement.
Guidance and operations
On February 24, 2025, MAC Copper maintained its production guidance for the next two years, which was originally released on July 22, 2024. Copper production was expected to range between 43,000 to 48,000 tonnes in 2025 and 48,000 to 53,000 tonnes in 2026. This two-year production guidance was based primarily on Mineral Reserves, but also on Measured and Indicated Mineral Resources (as at December 31, 2024).
| OR Royalties Inc. 2025 – Annual Report |
Management’s Discussion and Analysis |
The CSA copper mine is high grade in general, but a small number of very high-grade stopes (plus 8% copper) comprise an outsized proportion of annual production. The sequencing of these can have a significant impact on month-to-month production and along with typical summer storms and power interruptions, the March quarters are typically the weakest quarter in a year.
On October 24, 2025, Harmony noted that the integration of the CSA mine into the Harmony portfolio would commence. Over the next three months, Harmony embedded the mine into the broader Harmony Group, aligning its operations with its planning and performance frameworks. This process was designed to unlock synergies, enhance operational efficiency, and position CSA to contribute meaningfully to Harmony's long-term value creation. A detailed update on operational performance and key development milestones - including the ventilation project, upper Merrin mine development and exploration activities through December 2025 - is expected to be provided at Harmony's half-year results presentation scheduled for March 11, 2026. On February 3, 2026, Harmony noted that the integration activities at the CSA copper mine were progressing well, with initial activities focusing on integrating the mine into Harmony's systems, processes and culture.
Harmony's planning parameters for financial year 2027 will be embedded into CSA mine to develop its financial year life-of-mine plan, in alignment with the planning approach used across its other operations. The CSA mine life-of-mine plan will be released alongside the financial year 2026 results expected in August 2026.
Update on Mineral Reserve and Resource Estimates
On February 24, 2025, MAC Copper announced an updated 2024 Mineral Resources and Mineral Reserves statement, including an updated life-of-mine of 12 years based on Mineral Reserves only. As at December 31, 2024, Mineral Reserves were estimated at 545,000 tonnes of copper and 6.8 million ounces of silver (15.9 million tonnes grading 3.4% Cu and 13.3 g/t Ag), Measured and Indicated Mineral Resources were estimated at 286,000 tonnes of copper and 3 million ounces of silver (5.6 million tonnes grading 5.1% Cu and 16.7 g/t Ag), and Inferred Mineral Resources were estimated at 178,000 tonnes of copper and 3.9 million ounces of silver (5.4 million tonnes grading 3.3% Cu and 22 g/t Ag). The 2024 Mineral Reserves only extends 70 metres vertically below the current decline position requiring only minimal annual development.
For more information, refer to MAC Copper's press release dated February 24, 2025 titled "MAC Copper Limited Announces 2024 Resource and Reserve Statement and Production Guidance", MAC Copper's press release dated May 27, 2025 titled "MAC Copper Limited Enters Into Binding Scheme Implementation Deed With Harmony", and MAC Copper's press release dated July 29, 2025 titled "MAC Copper Limited Announces June 2025 Quarterly Report", all filed on www.sec.gov/edgar, Harmony's press release dated October 24, 2025 titled "Harmony completes MAC Copper acquisition, securing full ownership of CSA mine and unlocking immediate copper production" and Harmony's press release dated February 3, 2026 titled "Harmony's full year guidance on track; higher gold price boosts cash flows", available on Harmony's website (www.harmony.co.za)
Éléonore Royalty (Dhilmar Ltd.)
OR Royalties owns a sliding scale 1.8% to 3.5% NSR royalty on the Éléonore gold mine ("Éléonore") located in the Province of Québec and operated by Dhilmar Ltd. ("Dhilmar"). Dhilmar acquired Éléonore from Newmont Corporation ("Newmont") in the first quarter of 2025 for a cash consideration of $795 million. OR Royalties currently receives a NSR royalty of 2.2% on production at the Éléonore mine, until 3.0 million ounces of gold have been produced by the mine, at which point the royalty rate will increase to 2.45%. As of December 31, 2025, the mine has produced a cumulative total of 2.9 million ounces of gold.
Update on Reserve and Resource Estimates
On February 20, 2025, Newmont reported Proven and Probable Mineral Reserves at Éléonore comprising 10.1 million tonnes grading 5.05 g/t Au for 1.6 million ounces of gold as at December 31, 2024.
For additional information, please refer to Newmont's press release dated February 20, 2025 titled "Newmont Reports 2024 Mineral Reserves of 134.1 Million Gold Ounces and 13.5 Million Tonnes of Copper", filed on www.sedarplus.ca.
| OR Royalties Inc. 2025 – Annual Report |
Management’s Discussion and Analysis |
Sasa Stream (Central Asia Metals plc)
OR Royalties, through OR Royalties International, owns a 100% silver stream on the Sasa mine, operated by Central Asia Metals plc ("Central Asia") and located in North Macedonia. The Sasa mine is one of the largest zinc, lead and silver mines in Europe. OR Royalties International's entitlement under the Sasa stream applies to 100% of the payable silver production in exchange for $5 per ounce (plus refining costs) of refined silver delivered, increased for inflation annually from 2017 ($6.665 per ounce in 2026).
Guidance - 2026
Sasa's guidance for 2026 is forecast at 800,000 to 820,000 tonnes of ore mined and processed, and metal-in-concentrate production is estimated to 18,000 to 20,000 tonnes of zinc and 26,000 to 28,000 tonnes of lead.
Update on operations
On January 8, 2026, Central Asia reported sales of 94,655 ounces of silver to OR Royalties International in the fourth quarter of 2025, bringing the total for 2025 to 380,433 ounces. Sasa recorded increases in tonnes mined and milled during the fourth quarter of 2025, with both parameters exceeding the 820,000 tonnes per annum level on an annualized basis.
The Dry Stack Tailings Plant (the "DST Plant") continued to operate consistently in the fourth quarter of 2025, and by the end of December had produced over 260,000 tonnes of dry tailings. Since the DST Plant became operational at the end of the first quarter of 2025, tailings stored as dry tailings or underground as paste backfill represent approximately 75% of the total generated. This exceeds Central Asia's 2026 target of 70% of Sasa's tailings to be stored using these two more environmentally responsible methods.
Efforts are being made to improve near-term mine planning, as in addition to becoming typically narrower as mining has progressed, the orebody is also proving more variable. These include increasing the intensity of sampling of the working faces and additional external training of key personnel involved in orebody modelling. In addition, work is under way to improve management's knowledge of the orebody at depth, with a view to long-term mine planning.
For more information on the Sasa mine, refer to Central Asia's press release dated January 8, 2026, titled "2025 Operations Update", available on their website at www.centralasiametals.com.
Island Gold District Royalty (Alamos Gold Inc.)
OR Royalties owns NSR royalties ranging from 1.38% to 3.00% on the Island Gold mine property (nearly all current Island Gold Mineral Reserves and Resources are covered by the royalties), which is now included in the Island Gold District (regrouping the Island Gold and Magino properties), operated by Alamos Gold Inc. ("Alamos") and located in Ontario, Canada. OR Royalties also owns a 3% NSR over a small fraction at the eastern limit of the Magino open pit mine.
On February 3, 2026, Alamos reported that at Island Gold, the total effective NSR royalty averages approximately 2.6% over the life of mine, based on ounces produced, with approximately 90% of this royalty paid in-kind (the latest representing the royalty held by the Company). This implies that the royalties owned by OR Royalties over the Island Gold underground mine have a weighted average of 2.34% NSR royalty coverage over the new life of mine.
Guidance - 2026-2028
On February 4, 2026, Alamos released its three-year guidance. Gold production at the Island Gold District is expected to range between 290,000 and 330,000 ounces in 2026, down 9% from the previous guidance of 330,000 to 355,000 ounces, reflecting decreased milling rates from the Magino mill and a slightly slower ramp-up of underground mining rates at Island Gold to 2,400 tpd. With the shaft expected to be operational towards the end of 2026, mining rates are now expected to ramp-up to planned rates of 2,400 tpd early in 2027, compared to the fourth quarter of 2026 previously.
Gold production for the Island Gold District in 2027 increased to 380,000 - 420,000 ounces, from 375,000 - 400,000 ounces under the previous guidance. A first gold production guidance was also released for 2028 of 470,000 - 510,000 ounces. The guidance data has not been provided separately for the Island Gold and the Magino mines.
Update on operations
On January 14, 2026, Alamos reported production at the Island Gold District of 60,000 ounces of gold in the fourth quarter of 2025, an 8% increase from the prior year comparative period. The results of the fourth quarter were down from the third quarter and below plan due to lower underground grades and mining rates, as well as reduced mill throughput. For the full year, the Island Gold District produced 250,400 ounces, slightly below the low-end of the revised annual guidance.
| OR Royalties Inc. 2025 – Annual Report |
Management’s Discussion and Analysis |
At the Island Gold mine, underground mining rates averaged 1,157 tpd in the fourth quarter, below full year guidance and down from the third quarter reflecting additional rehabilitation work related to the seismic event in October, as well as downtime in late December due to severe winter weather. Severe snowstorms and subsequent road closures prevented delivery of supplies, and access to site by personnel and emergency services. This required a standdown of underground mining operations for a total of three days.
The majority of the underground rehabilitation work was completed during the quarter but was more extensive than originally anticipated, which impacted mining rates in the quarter. With substantial progress made through the end of November, underground mining rates improved to average 1,220 tpd for the month of December. Excluding the impact of the three days of weather-related downtime near the end of the quarter, mining rates would have averaged approximately 1,350 tpd in December. Completion of the rehabilitation positions the operation to meet the ramp up of mining rates through 2026 as part of the completion of the P3+ Expansion in the latter part of the year.
Underground grades mined averaged 10.61 g/t Au for the quarter and 11.44 g/t Au for the year, both in line with guidance. Milling rates were consistent with mining rates and recoveries of 98% were consistent with guidance.
Update on Island Gold District Expansion
In 2022, Alamos announced the Phase 3+ Expansion at Island Gold to 2,400 tpd from the current rate of 1,200 tpd, which included various infrastructure investments. These included the installation of a shaft, paste plant, as well as accelerated development to support the higher mining rates. Following the completion of the expansion in 2026, the operation was expected to transition from trucking ore and waste up the ramp to skipping ore and waste to surface through the new shaft infrastructure, driving production higher and costs significantly lower.
On June 23, 2025, Alamos announced the Base Case Life of Mine Plan ("Base Case LOM Plan") with the total growth capital estimate for the Phase 3+ Expansion revised to $835 million. This represented a 10% increase from the original growth capital estimate prepared in 2022. As at September 30, 2025, 84% of the total growth capital has been spent and committed on the Phase 3+ Expansion.
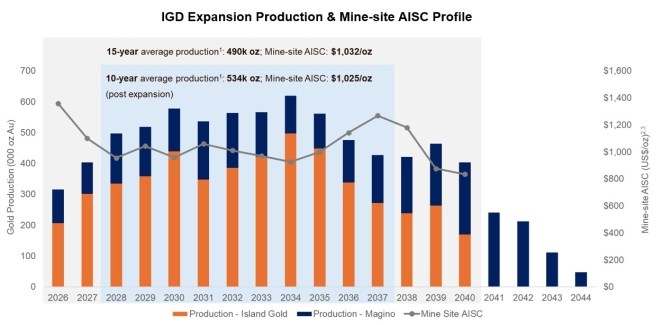
On February 3, 2026, Alamos reported the results of the Expansion Study ("IGD Expansion") completed on the Island Gold District operation. Compared to the Base Case LOM Plan, the IGD Expansion incorporates a 30% increase in Mineral Reserves, and an expansion of the Magino mill to 20,000 tpd supporting increased processing rates of 3,000 tpd of high-grade underground ore from Island Gold, and 17,000 tpd from the open pit at Magino. This is expected to drive production higher and create one of the largest, longest life, and most profitable gold operations in Canada. The IGD Expansion study highlighted increased gold production for an average annual production of 534,000 ounces over 10 years post expansion (2028+), a 27% increase from the Base Case LOM, and 113% increase from 2025. The average annual production is expected to reach 490,000 ounces of gold over 15 years during which both the open pit and underground are operating (based on Mineral Reserves only). The IGD Expansion is expected to be completed in 2028. The Phase 3+ Expansion remains on track for completion late in 2026, with the shaft and paste plant infrastructure designed to support higher underground mining rates of 3,000 tpd. Construction of the larger mill is well underway and sized for 20,000 tpd such that key components of the IGD Expansion are largely de-risked, as per Alamos management.
The Island Gold mill will continue operating in 2026 and 2027 and will be dedicated to processing approximately 1,265 tpd of higher-grade underground ore until the expected completion of the mill expansion in the first quarter of 2028. The remaining underground ore mined will be blended at increasing rates with open pit ore, and processed within the Magino mill. Following the completion of the IGD Expansion in 2028, the Island Gold mill will be shut down and all underground ore from Island Gold and open pit ore from Magino will be processed through the larger, centralized and more cost-effective Magino mill. Underground mining rates at Island Gold are expected to ramp up through 2026 from 1,400 tpd to 2,000 tpd by the end of the year. Following the expected completion of the Phase 3+ Expansion in the fourth quarter of 2026, underground mining will transition from trucking ore and waste to skipping ore and waste to surface through the new shaft infrastructure. This is expected to drive an increase in underground mining rates to 2,400 tpd in 2027. As part of the IGD Expansion, a further increase in underground mining rates to 3,000 tpd is expected by 2029, with the shaft and related infrastructure designed to support the higher mining rates. This will be processed through the expanded 20,000 tpd Magino mill with the remaining 17,000 tpd coming from the open pit at Magino. The new projected annual gold production contributions from the Island Gold mine is shown as the orange bars in the histogram below (provided in the February 3, 2026 press release).
| OR Royalties Inc. 2025 – Annual Report |
Management’s Discussion and Analysis |
Update on Reserve and Resource Estimates
On February 3, 2026, Alamos reported Proven and Probable Mineral Reserve of 15.1 million ounces of gold at Island Gold underground (15.1 million tonnes grading 10.61 g/t Au), representing a 25% increase from the 4.1 million ounces contained in the June 2025 update (11.8 million tonnes grading 10.85 g/t Au). The increase was driven by a successful delineation drilling program with the focus on converting a large portion of Mineral Resource base into Mineral Reserves. Measured and Indicated Mineral Resources decreased by 44% compared to the June 2025 update at Island Gold, to 0.6 million ounces of gold (2.1 million tonnes grading 8.77 g/t Au), as a result of the conversion to Mineral Reserves. Inferred Mineral Resources also decreased by 45% to 1.4 million ounces (16.9 million tonnes grading 2.57 g/t Au), also as a result of the conversion program.
Update on exploration
On February 2, 2026, Alamos reported new results from underground and surface drilling at Island Gold. Exploration drilling continues to extend high-grade gold mineralization across the Island Gold deposit, as well as within several hanging wall and footwall structures, and delineation drilling continues to support the conversion of high-grade Mineral Resources to high-grade Mineral Reserves. Based on the exploration ongoing success, and with the deposit open laterally and at depth, management expects the main Island Gold deposit to continue to grow well into the future.
A total of $24 million was spent on exploration at the Island Gold District in 2025, up from $20 million spent in 2024. Following up on a successful 2024 program, a total of 46,889 metres of underground drilling was completed in 180 holes in 2025 with a focus on defining new Mineral Reserves and Resources in proximity to existing production horizons and infrastructure. Additionally, 14,609 metres of surface exploration drilling was completed in 15 holes targeting the area between the Island Gold and Magino deposits, as well as the down-plunge extension of the Island Gold deposit, below a depth of 1,500 metres. A primary focus of the 2025 drill program was the conversion of a portion of the large Mineral Resource base to Mineral Reserves to be included in the Island Gold District Expansion Study. As part of that focus, a total of 33,964 metres of underground delineation drilling was completed in 117 holes, and 12,269 metres of surface delineation drilling was completed in 12 holes.
For more information, refer to Alamos' press release dated June 23, 2025 titled "Alamos Gold Announces Island Gold District Base Case Life of Mine Plan Outlining One of the Largest and Lowest-Cost Gold Mines in Canada with Significant Upside", Alamos' press release dated January 14, 2026 titled "Alamos Gold Reports Fourth Quarter and Annual 2025 Production", Alamos' press release dated February 2, 2026 titled "Alamos Gold Extends High-Grade Mineralization Across the Island Gold Deposit and Nearby Regional Targets Including Best Hole Ever at Cline-Pick, Intersecting 178 g/t Gold over 3.5 Metres", Alamos' press release dated February 3, 2026 titled "Alamos Gold Announces Island Gold District Expansion to 20,000 TPD, Creating One of Canada's Largest and Lowest Cost Gold Mines with Attractive Economics, including 69% After-Tax IRR and $12.2 Billion NPV at $4,500/oz Gold", and Alamos' press release dated February 4, 2026 titled "Alamos Gold Provides Three-Year Operating Guidance Outlining 46% Production Growth by 2028 at Significantly Lower Costs", all filed on www.sedarplus.ca.
| OR Royalties Inc. 2025 – Annual Report |
Management’s Discussion and Analysis |
Seabee Royalty (SSR Mining Inc.)
OR Royalties holds a 3% NSR royalty on the Seabee gold operations operated by SSR Mining Inc. ("SSR Mining") and located in Saskatchewan, Canada.
Guidance - 2026
On February 17, 2026, SSR Mining reported 2026 annual guidance for the Seabee mine of 60,000 to 70,000 ounces of gold. In 2026, production from Seabee is expected to be strongest in the fourth quarter due to higher grades. Over the course of the year, processed grades at Seabee are expected to average approximately 5.0 g/t Au, while process plant throughputs are expected to average approximately 1,200 tpd, inclusive of planned maintenance downtime in the second quarter.
Update on operations
On February 17, 2026, SSR Mining reported gold production at the Seabee mine of 8,869 ounces in the fourth quarter of 2025, compared to 27,811 ounces in the fourth quarter of 2024. Production for the year 2025 amounted to 54,986 ounces of gold, compared to 78,545 ounces of gold in 2024. Production from Seabee in 2025 reflected the temporary suspension of operations in the second quarter due to the impacts of regional forest fires, as well as the previously guided effort to prioritize underground mine development in the second half of the year.
Update on exploration
On February 17, 2026, SSR Mining announced that growth expenditures at Seabee are expected to total $15.0 million in 2026 as it advances near-mine drilling exploration and resource development activity at Santoy and progresses engineering at Porky ahead of potential development in 2027.
Update on Mineral Reserve and Resource Estimates
On February 17, 2026, SSR Mining reported updated Mineral Reserves estimates at Seabee as of December 31, 2025. Proven and Probable contained gold ounces increased by 192,000 ounces, or 64%. Factors contributing to the change include: (i) re-interpretation of the mineralized envelopes using the most updated drill hole information, (ii) change to optimization parameters in terms of cost changes and cut-off grade, (iii) inclusion of Porky West in Mineral Reserves, and (iv) depletion. An initial Mineral Reserve of 203,000 ounces of gold was declared at Porky in 2025 with the potential to represent a new underground mining front to further complement and extend the existing Seabee mine life. These ounces are within the Probable Reserves of 3.052 million tonnes of 4.55 g/t Au for 447,000 ounces of gold and Proven Reserves of 0.332 million tonnes of 5.33 g/t Au for 57,000 ounces of gold. Measured and Indicated Resources include 1.402 million tonnes of 3.58 g/t Au for 162,000 ounces of gold and Inferred Resources include 1.605 million tonnes of 3.94 g/t Au for 203,000 ounces of gold.
For more information, refer SSR Mining's press release dated February 17, 2026 titled "SSR Mining Reports Full-Year 2025 Results and 2026 Operating Guidance", filed on www.sedarplus.ca, as well as SSR Mining's Forms 10-K filed on EDGAR at www.sec.gov.
Ermitaño Royalty (First Majestic Silver Corp.)
OR Royalties holds a 2% NSR royalty on the Ermitaño underground gold and silver mine ("Ermitaño") operated by First Majestic Silver Corp. ("First Majestic") and located in Sonora State, Mexico.
Guidance - 2026
On January 15, 2026, First Majestic reported its annual guidance for Santa Elena of 1.3 million to 1.5 million ounces of silver and 64,000 to 71,000 ounces of gold. This production should be mostly from ore covered by the royalty held by OR Royalties on Ermitaño.
One of First Majestic's key initiatives for 2026 is the expansion of the Santa Elena processing plant, increasing capacity from 3,200 tpd to 3,500 tpd.
| OR Royalties Inc. 2025 – Annual Report |
Management’s Discussion and Analysis |
Update on operations
On January 15, 2026, First Majestic announced production of 358,185 ounces of silver and 25,083 ounces of gold in the fourth quarter of 2025 at Santa Elena. Silver production was down 6% while gold production was down 15% year-over-year primarily due to lower grade silver and gold ore from the lower levels of the Ermitaño mine, as expected under the 2025 mining plan.
The mill processed a quarterly record of 283,721 tonnes of ore, 4% higher than the same period last year, with average silver and gold head grades of 62 g/t and 2.91 g/t, respectively. Average silver ore grades decreased 7%, while gold ore grades declined 11% for the quarter, in line with the mine plan.
Silver and gold recoveries during the quarter averaged 64% and 95%, respectively, compared to 69% and 96% in the same period last year. Lower recoveries were anticipated and are a direct correlation to lower feed grades.
Update on exploration
On July 30, 2024, First Majestic announced the discovery of a significant new, vein-hosted gold and silver mineralized system at its Santa Elena property. This new high-grade discovery, the Navidad vein system ("Navidad"), was made at depth adjacent to the company's producing Ermitaño mine and is within OR Royalties' royalty boundaries. This is the most promising discovery at the Santa Elena property since Ermitaño was discovered in 2016.
During the fourth quarter of 2025, six drill rigs, consisting of three surface rigs and three underground rigs, completed 10,846 metres of drilling on the Santa Elena property. Drilling focused on testing extensions of the newly discovered Santo Niño and Navidad resources, and the conversion of Inferred Mineral Resources to Indicated Mineral Resources at Ermitaño-Luna.
At Santa Elena, approximately 78,000 metres of drilling is planned in 2026. Drilling at Santa Elena will focus on converting Inferred to Indicated Resources at the Santo Niño Discovery (not covered by the royalty held by OR Royalties), continuing to drill test extensions of Navidad (covered by the royalty held by OR Royalties) and testing several greenfield targets within a 10-kilometre radius around the processing plant where a new geologic understanding of district geology has highlighted the presence of large areas with exploration upside.
Update on Mineral Reserve and Resource Estimates
On March 31, 2025, First Majestic released updated 2024 Mineral Reserve and Mineral Resource estimates for the Ermitaño underground mine. Ermitaño's Proven Mineral Reserve is estimated at 2.2 million ounces of silver and 93,000 ounces of gold (797,000 tonnes grading 85 g/t Ag and 3.65 g/t Au) and Probable Mineral Reserve is estimated at 2.5 million ounces of silver and 105,000 ounces of gold (2.0 million tonnes grading 38 g/t Ag and 1.61 g/t Au).
The Navidad discovery at Santa Elena added 2.3 million tonnes of Inferred Mineral Resources containing 5.9 million ounces of silver and 249,000 ounces of gold with metal grades of 81 g/t Ag and 3.42 g/t Au, respectively. To date, only a portion of the newly delineated vein system has been classified within the resource estimate, with significant upside potential to be realized through additional drilling.
For more information, refer to First Majestic's press release dated July 30, 2024 titled "First Majestic Announces New High-Grade Gold and Silver Discovery at Santa Elena", First Majestic's press release dated March 31, 2025 titled "First Majestic Announces 2024 Mineral Reserve and Mineral Resource Estimates" and First Majestic's press release dated January 15, 2026 titled "First Majestic Reports 2025 Production and 2026 Outlook; Increases Dividend", all filed on www.sedarplus.ca.
Gibraltar Stream (Taseko Mines Limited)
OR Royalties owns a silver stream referenced to 100% of Gibraltar copper mine's production, operated by Taseko Mines Limited ("Taseko") and located in British Columbia, Canada, until a total of 6.8 million ounces of silver has been delivered, after which the refined silver to be delivered will be reduced to 35% of the payable silver produced. There is no cash transfer price payable by OR Royalties at the time of delivery for the silver ounces delivered. As of December 31, 2025, a total of 1.6 million ounces of silver have been delivered under the stream agreement.
Guidance - 2026
As of the date of this MD&A, Taseko has not yet released its 2026 production guidance.
| OR Royalties Inc. 2025 – Annual Report |
Management’s Discussion and Analysis |
Update on operations
On January 13, 2026, Taseko reported copper and molybdenum production for the 2025 year of 98 million pounds and 1.9 million pounds, respectively. Fourth quarter copper production was 31 million pounds of copper, a significant increase over the previous quarters of 2025. Production in the fourth quarter was impacted by unanticipated mill downtime, due to unscheduled maintenance activities and a serious accident which resulted in a temporary site wide shut down in November. Gibraltar production in the second half of the year was a notable improvement over the first half of the year with higher grades and better-quality ore. Looking ahead to 2026, Taseko management expects more consistent quarterly production, now that the company is better situated in the Connector pit, and higher overall copper production.
For more information, refer to Taseko's press release dated January 13, 2026 titled "Taseko Provides Update on Florence Copper Ramp-up and Gibraltar 2025 Production Results", filed on www.sedarplus.ca.
Lamaque Complex Royalty (Eldorado Gold Corporation)
OR Royalties owns a 1% NSR royalty on the producing Triangle deposit as well as the prospective Ormaque, Plug #4, and Parallel deposits of the Lamaque Complex. The Lamaque Complex, which includes the Triangle mine (upper and lower zones), the Ormaque mine, the Parallel deposit, the Plug #4 deposit, and the Sigma Mill, is operated by Eldorado Gold Corporation ("Eldorado") and is located in Québec, Canada. OR Royalties also holds a 2.5% NSR royalty on the Bourlamaque property.
Guidance - 2026
As of the date of this MD&A, Eldorado has not yet released its 2026 production guidance.
Update on operations
On January 20, 2026, Eldorado announced production at the Lamaque Complex of 49,307 ounces of gold, for a total of 187,208 ounces of gold in 2025. During the fourth quarter, production increased slightly over the third quarter, driven by higher ore grade and mill throughput. Production during the year benefited from the higher grade Ormaque bulk sample, record mill throughput and continued operational excellence.
Update on Mineral Reserve and Resource Estimates
On November 26, 2025, Eldorado released its updated Mineral Reserves and Mineral Resources as of September 30, 2025. Proven and Probable Mineral Reserves included 1.285 million tonnes of 5.78 g/t Au and 5.588 million tonnes of 7.53 g/t Au, respectively, for a total of 1.591 million ounces of gold. Measured and Indicated Resources included 2.185 million tonnes of 6.73 g/t Au and 8.605 million tonnes of 7.97 g/t Au, respectively, for a total of 2.677 million ounces of gold. Inferred Resources included 8.087 million tonnes of 7.69 g/t Au for 2.0 million ounces. The updated technical report outlines a Reserve Case with an 8-year mine life.
Mineral Reserves increased 25% at Lamaque, driven by conversion at Ormaque and Triangle, in addition to declaring initial Mineral Reserves at Plug #4. The increase in total Measured and Indicated Mineral Resources was primarily driven by conversion from Inferred Mineral Resources.
Update on exploration
On January 26, 2026, Eldorado announced the discovery of four new high-grade zones at the Lamaque Complex and the commencement of studies aimed at unlocking a potential expansion. Recent results confirmed high-grade mineralization across multiple deposits on the property, with Ormaque adding flexibility near existing infrastructure. These results, along with emerging targets on the wider Bourlamaque property highlight a compelling opportunity for low-risk, capital efficient organic growth and mine life extension. As a result of recent exploration success and the potential for additional resources in close proximity to the Sigma mill, Eldorado has commenced studies to expand throughput from its current capacity of approximately 2,500 tpd towards its fully permitted capacity of 5,000 tpd.
For more information, refer to Eldorado's press release dated November 26, 2025 titled "Eldorado Gold Releases Updated Mineral Reserve and Mineral Resource Statement; Offsetting Depletion and Increasing Mineral Reserves at Key Operations", Eldorado's press release dated January 20, 2026 titled "Eldorado Gold Achieves Higher-End of 2025 Production Guidance; Appoints Dr. Sally Eyre to the Board of Directors; Details 2026 Reporting Schedule and Provides Q4 2025 Conference Call Details", and Eldorado's press release dated January 26, 2026 titled "Eldorado Announces Strong Exploration Results of Multiple New High-Grade Zones in Canada and Greece and Increases 2026 Exploration Investment, Reinforcing Confidence in Discovery Strategy", all filed on www.sedarplus.ca.
| OR Royalties Inc. 2025 – Annual Report |
Management’s Discussion and Analysis |
Eagle Gold Royalty - Update
OR Royalties owns a 5% NSR royalty on the Dublin Gulch property, situated in central Yukon Territory, Canada, which hosts the Eagle Gold mine ("Eagle Gold"), on all metals until 97,500 ounces of gold have been delivered to OR Royalties and a 3% NSR royalty thereafter. As of December 31, 2024, a total of 32,667 ounces of gold have been delivered under the royalty agreement.
Heap leach facility failure
On June 24, 2024, Victoria announced that the heap leach facility at the Eagle Gold mine experienced a failure. Operations were suspended while the site operations team, along with management and the Yukon government officials continued to assess the situation and gathered information. Victoria confirmed that there had been some damage to infrastructure and a portion of the failure had left containment. Subsequently, on July 4, 2024, Victoria advised that it had received notices of default from its lenders under the credit agreement dated December 18, 2020. A default under the Eagle Royalty Agreement dated April 13, 2018 was also triggered and, consequently, OR Royalties provided a notice of default to Victoria on July 4, 2024. On July 12, 2024 and July 30, 2024, Victoria reported that there can be no assurance that the company will have the financial resources necessary to repair the damage to the equipment and facilities, to remediate the impacts caused by the incident or to restart production.
On August 14, 2024, the Ontario Superior Court of Justice appointed PricewaterhouseCoopers Inc. as receiver and manager (the "Receiver"), at the direction of the Yukon Government and under the supervision of the court, of all assets, undertakings and properties of Victoria, which properties include but is not limited to the Eagle Gold mine. A copy of the appointment order (the "Appointment Order") is available on the receivership website provided below.
An independent review board ("IRB") was created to identify the causes of the failure by performing an independent review of the design, construction, operation, maintenance and monitoring of the heap leach facility. The IRB released its report on July 2, 2025, which concluded that the cause of failure was the accumulation of a series of adverse conditions and events, starting with a local failure in the oversteepened area of the south slope. The report also includes recommendations for improved practices by industry and the regulators to help reduce the likelihood of a reoccurrence of similar events. For more information, please refer to the receivership website for the full report: https://www.pwc.com/ca/en/services/insolvency-assignments/victoriagold/independent-review-board-report.html.
On January 5, 2026, the credit agreement between the Government of Yukon and the Receiver was extended to April 1, 2026. As part of the receivership, BMO Nesbitt Burns Inc. has been appointed as the Receiver's financial advisor to assist in the development and implementation of a sale process for the Eagle Gold mine. The sale process remains ongoing with Phase 2 participants continuing their review during the latter half of 2025. More information is available on the receiver's website at https://www.pwc.com/ca/en/services/insolvency-assignments/victoriagold/sale-process.html.
For additional information, please refer to Victoria's press release dated June 24, 2024 titled "Victoria Gold: Eagle Gold Mine Heap Leach Pad Incident", Victoria's press release dated July 4, 2024 titled "Victoria Gold Provides Update on Eagle Gold Mine Incident", Victoria's press release dated July 12, 2024, titled "Victoria Gold: Update on Eagle Gold Mine" and Victoria's press release dated July 30, 2024, titled "Victoria Gold: Update on HLF Incident Management", all filed on www.sedarplus.ca, and refer to the receivership website: www.pwc.com/ca/victoriagold.
| OR Royalties Inc. 2025 – Annual Report |
Management’s Discussion and Analysis |
Equity Investments
The Company's assets include a portfolio of shares, mainly of publicly traded companies involved in the mining industry. In certain instances, OR Royalties may invest in equity of companies concurrently with the acquisition of royalty, stream or other similar interests or with the objective of improving its ability to acquire future royalties, streams or similar interests. Certain investment positions may be considered as associates under IFRS Accounting Standards as a result of the ownership held, nomination rights to the investee's board of directors and/or other facts and circumstances.
OR Royalties may, from time to time, and without further notice except as required by law or regulations, increase or decrease its investments at its discretion.
In 2025, OR Royalties acquired equity investments for $11.0 million and sold equity investments for $49.8 million, including proceeds of $49.0 million received by OR Royalties International from Harmony upon closing of Harmony's transaction to acquire MAC Copper Ltd. (4,000,000 shares at $12.25 per share).
Fair value of marketable securities
As at December 31, 2025, the Company had investments in marketable securities (excluding notes and warrants) having a carrying value4 and a fair value5 of $162.8 million.
Osisko Development Corp.
Until August 2025, the Company's principal investment in associates was Osisko Development Corp. ("Osisko Development"). Osisko Development is a Canadian gold mineral exploration and development company focused on the acquisition, exploration and development of precious metals resource properties in North America. The main projects held by Osisko Development are the Cariboo gold project ("Cariboo") in British Columbia, Canada and the Tintic property ("Tintic") in Utah, United States. OR Royalties owns a 5% NSR royalty on Cariboo and OR Royalties International owns a 2.5% metals stream on Tintic.
The Cariboo gold project has Probable Mineral Reserves of 2.03 million ounces of gold (16.7 million tonnes grading 3.78 g/t Au), Measured and Indicated Mineral Resources of 1.57 million ounces of gold (14.7 million tonnes grading 3.33 g/t Au) and Inferred Mineral Resources of 1.71 million ounces of gold (15.5 million tonnes grading 3.44 g/t Au).
On December 12, 2024, Osisko Development announced the granting of the Environmental Management Act permits for Cariboo. Together with the BC Mines Act permits secured on November 20, 2024, these approvals marked the successful completion of the permitting process for key approvals, solidifying Cariboo's shovel-ready status.
On April 28, 2025, Osisko Development released a NI 43-101 compliant optimized feasibility study ("2025 FS"), which outlined average annual gold production of approximately 190,000 ounces over a 10-year mine life, with an after-tax net present value of C$943 million at a 5% discount rate and an unlevered after-tax internal rate of return of 22.1% at $2,400 per ounce of gold. Using a spot gold price of $3,300 per ounce of gold, the after-tax net present value at a 5% discount rate increases to C$2.1 billion with an unlevered after-tax internal rate of return of 38.0%.
In August 2025, Osisko Development closed a private placement of $203 million and issued 99,065,330 units, consisting of one common share and one-half of one common share purchase warrant. OR Royalties did not participate in this financing. Consequently, its ownership percentage was reduced from 24.15% to 13.97%, which also impacted its nomination rights to the board of directors of Osisko Development. As a result of these changes, among other things, the Company has considered that it has lost its significant influence over Osisko Development for accounting purposes and that it was therefore no longer considered an associate. In August 2025, the retained interest in Osisko Development was revalued at its fair value, which generated a gain on deemed disposal of an associate of $54.4 million, and accumulated other comprehensive loss of $1.1 million was reclassified to the statement of income. The retained interest in Osisko Development has been designated as an equity investment at fair value through other comprehensive income or loss on initial recognition without subsequent reclassification to net income or loss.
As at December 31, 2025, the Company held 33,333,366 common shares (having a fair value of $113.1 million) representing a 13.1% interest in Osisko Development (24.4% as at December 31, 2024). The decrease in the percentage of ownership is due to private financings that were completed by Osisko Development in 2025, in which the Company did not participate.
For more information, please refer to Osisko Development's press releases and other public documents available on www.sedarplus.ca and on their website (www.osiskodev.com).
4 The carrying value corresponds to the amount recorded on the consolidated balance sheet, which is the equity method for investments in associates and the fair value for other investments, as per IAS 28 Investment in Associates and Joint Ventures and IFRS 9 Financial Instruments.
5 The fair value corresponds to the quoted price of the investments in a recognized stock exchange as at December 31, 2025.
| OR Royalties Inc. 2025 – Annual Report |
Management’s Discussion and Analysis |
MAC Copper Limited
OR Royalties International owned 4.0 million common shares of MAC Copper. In May 2025, MAC Copper announced that it had entered into a binding scheme implementation deed (the "Transaction") with Harmony and Harmony Australia, a wholly-owned subsidiary of Harmony, under which it was proposed that Harmony Australia would acquire 100% of the issued share capital in MAC Copper in exchange for $12.25 cash per MAC Copper share. The Transaction was closed in October 2025 and OR Royalties International received proceeds of $49.0 million in exchange for its 4.0 million shares of MAC Copper.
Sustainability Activities
As a capital provider, OR Royalties does not have direct control over the operation or sustainability activities of its mining partners operations. However, the Company recognizes that by supporting responsible operators, it can promote sustainable development through its investments.
In the second quarter of 2025, OR Royalties released the fifth edition of its sustainability report, Growing Responsibly, highlighting the Company's Environmental, Social and Governance ("ESG") initiatives and key performance metrics for 2024.
The following are select report highlights:
Environmental Stewardship:
Supporting our Employees and Communities:
Excellence in Governance and Oversight:
For a detailed review of OR Royalties' 2024 sustainability initiatives, refer to the fifth edition of OR Royalties' sustainability report, Growing Responsibly, published on April 17, 2025, and available on the Company's website (www.ORroyalties.com).
| OR Royalties Inc. 2025 – Annual Report |
Management’s Discussion and Analysis |
Dividends and Normal Course Issuer Bid
The following table provides details on the dividends declared by the Company for the years ended December 31, 2025 and 2024:
| Declaration date |
Dividend per share |
Record date |
Payment date |
Dividends declared |
|||||||||
| $ | $ | ||||||||||||
| February 19, 2025 (i) | $ | 0.046 | March 31, 2025 | April 15, 2025 | 8,475,000 | ||||||||
| May 7, 2025 | $ | 0.055 | June 30, 2025 | July 15, 2025 | 10,201,000 | ||||||||
| August 5, 2025 | $ | 0.055 | September 30, 2025 | October 15, 2025 | 10,492,000 | ||||||||
| November 5, 2025 | $ | 0.055 | December 31, 2025 | January 15, 2026 | 10,116,000 | ||||||||
| $ | 0.211 | 39,284,000 | |||||||||||
| February 20, 2024 | C$0.060 | March 28, 2024 | April 15, 2024 | 8,271,000 | |||||||||
| May 8, 2024 | C$0.065 | June 28, 2024 | July 15, 2024 | 8,843,000 | |||||||||
| August 6, 2024 | C$0.065 | September 30, 2024 | October 15, 2024 | 8,878,000 | |||||||||
| November 6, 2024 | C$0.065 | December 31, 2024 | January 15, 2025 | 8,673,000 | |||||||||
| Year 2024 | C$0.255 | 34,665,000 |
(i) Prior to May 2025, the dividends were declared in Canadian dollars. From May 2025, the quarterly dividend is declared in United States dollars. On February 19, 2025, the Board of Directors declared a quarterly dividend of C$0.065 to shareholders of record as of the close of business on March 31, 2025. Based on the foreign currency rate (C$/US$) on the declaration date, the corresponding dividend per share in U.S. dollars was $0.046.
Dividend Reinvestment Plan
The Company offers a dividend reinvestment plan ("DRIP") that allows Canadian and U.S. shareholders to reinvest their cash dividends into additional common shares either purchased on the open market through the facilities of the TSX or the NYSE, or issued directly from treasury by the Company, or acquired by a combination thereof. In the case of a treasury issuance, the price will be the weighted average price of the common shares on the TSX or the NYSE during the five trading days immediately preceding the dividend payment date, less a discount, if any, of up to 5%, at the Company's sole election.
As a result of the shareholder-approved corporate name change in May of this year, a new CUSIP number was assigned to the Company. Consequently, non-registered beneficial shareholders may have to re-register to continue to participate in the DRIP, and should contact their financial advisor, broker, investment dealer, bank or other financial institution that holds their common shares to inquire about the implication of the CUSIP number change and any actions that may required to continue to participate in the DRIP.
As at December 31, 2025, the holders of 13.3 million common shares had elected to participate in the DRIP, representing dividends payable of $0.7 million. During the year ended December 31, 2025, the Company issued 128,684 common shares under the DRIP, at a discount rate of 3% (205,741 common shares in 2024 at a discount rate of 3%). On January 15, 2026, 18,705 common shares were issued under the DRIP at a discount rate of 3%.
Normal Course Issuer Bid
In December 2025, OR Royalties renewed its normal course issuer bid ("NCIB") program. Under the terms of the NCIB program, OR Royalties may acquire up to 9,399,294 of its common shares from time to time in accordance with the normal course issuer bid procedures of the TSX. Repurchases under the 2025 NCIB program are authorized from December 12, 2025 until December 11, 2026. Daily purchases will be limited to 107,496 common shares, other than block purchase exemptions.
Under the terms of the previous NCIB program, OR Royalties was allowed to acquire up to 9,331,275 of its common shares from time to time, from December 12, 2024 to December 11, 2025. Daily purchases were limited to 73,283 common shares.
During the year ended December 31, 2025, the Company purchased for cancellation a total of 1.1 million common shares for $36.7 million (C$50.8 million; average acquisition price per share of C$47.86). During the year ended December 31, 2024, the Company purchased for cancellation a total of 26,000 common shares for $0.4 million (C$0.6 million; average acquisition price per share of C$22.48).
| OR Royalties Inc. 2025 – Annual Report |
Management’s Discussion and Analysis |
Gold Market and Currency
Gold Market
The gold market has continued to post strong gains in 2025 and gold prices, denominated in U.S. dollars, have risen 67% during the year, marking the largest annual increase since 1979, with similar increases across most currencies. The gold price averaged $3,432 per ounce in 2025, an increase of 44% compared to the average price per ounce of $2,386 in 2024. The gold price closed 2025 at $4,368 per ounce, compared to $2,609 per ounce at the end of 2024.
In the fourth quarter of 2025, the gold price averaged $4,135 per ounce, its highest ever quarterly average in nominal dollars and an increase of 19.6% when compared to the average in the third quarter of 2025. The gold price closed the fourth quarter at $4,368 per ounce, compared to $3,825 at the end of the third quarter, $3,287 per ounce at the end of the second quarter and $3,115 at the end of the first quarter.
The historical price is as follows:
| (per ounce of gold) | High | Low | Average | Close | ||||||||
| 2025 | $4,449 | $2,633 | $3,432 | $4,368 | ||||||||
| 2024 | 2,778 | 1,985 | 2,386 | 2,609 | ||||||||
| 2023 | 2,078 | 1,811 | 1,941 | 2,078 | ||||||||
| 2022 | 2,039 | 1,629 | 1,800 | 1,812 | ||||||||
| 2021 | 1,943 | 1,684 | 1,799 | 1,820 |
Currency
The exchange rates for the Canadian/U.S. dollar are outlined below:
| High | Low | Average | Close | |||||||||
| 2025 | 0.7376 | 0.6848 | 0.7157 | 0.7296 | ||||||||
| 2024 | 0.7510 | 0.6937 | 0.7302 | 0.6950 | ||||||||
| 2023 | 0.7617 | 0.7207 | 0.7410 | 0.7561 | ||||||||
| 2022 | 0.8031 | 0.7217 | 0.7692 | 0.7383 | ||||||||
| 2021 | 0.8306 | 0.7727 | 0.7980 | 0.7888 |
| OR Royalties Inc. 2025 – Annual Report |
Management’s Discussion and Analysis |
Selected Financial Information
(in thousands of dollars, except figures for ounces and amounts per ounce and per share) (1)
| 2025 | 2024 | 2023 | |||||||
| $ | $ | $ | |||||||
| Revenues | 277,370 | 191,157 | 183,228 | ||||||
| Cost of sales | (9,115 | ) | (6,738 | ) | (12,335 | ) | |||
| Depletion | (35,770 | ) | (32,607 | ) | (41,801 | ) | |||
| Gross profit | 232,485 | 151,812 | 129,092 | ||||||
| Impairment of royalty and stream interests | (5,495 | ) | (49,558 | ) | (35,711 | ) | |||
| Operating income | 196,765 | 78,324 | 64,463 | ||||||
| Net earnings (loss) | 206,088 | 16,267 | (37,426 | ) | |||||
| Net earnings (loss) per share - basic | 1.10 | 0.09 | (0.20 | ) | |||||
| Net earnings (loss) per share - diluted | 1.09 | 0.09 | (0.20 | ) | |||||
| Total assets | 1,566,479 | 1,377,634 | 1,486,472 | ||||||
| Total long-term debt | - | 93,900 | 145,080 | ||||||
| Operating cash flows | 245,596 | 159,925 | 138,437 | ||||||
| Dividend per common share (2) | $0.211 | C$0.255 | C$0.235 | ||||||
| Weighted average shares outstanding (in thousands) | |||||||||
| Basic | 187,775 | 186,290 | 185,036 | ||||||
| Diluted | 189,152 | 187,581 | 185,036 | ||||||
| Average realized price of gold (per ounce sold) | 3,425 | 2,361 | 1,943 | ||||||
(1) Unless otherwise noted, financial information is in United States dollars and prepared in accordance with IFRS Accounting Standards.
(2) Prior to May 2025, the dividends were declared in Canadian dollars. From May 2025, the quarterly dividend is declared in United States dollars. On February 19, 2025, the Board of Directors declared a quarterly dividend of C$0.065 to shareholders of record as of the close of business on March 31, 2025. Based on the foreign currency rate (C$/US$) on the declaration date, the corresponding dividend per share in U.S. dollars was $0.046.
| OR Royalties Inc. 2025 – Annual Report |
Management’s Discussion and Analysis |
Overview of Annual Financial Results
Financial Summary - Year 2025
Revenues from royalties and streams increased to $277.4 million in 2025, compared to $191.2 million in 2024, mainly as a result of higher metal prices.
Gross profit amounted to $232.5 million in 2025, compared to $151.8 million in 2024. Cost of sales increased, mainly due to higher metal prices, and depletion increased as a result of the mix of sales.
General and administrative ("G&A") expenses amounted to $20.9 million in 2025, compared to $18.3 million in 2024. The increased G&A expenses in 2025 were mainly the result of a higher compensation expense (including increased share-based compensation). Business development expenses amounted to $9.3 million in 2025, compared to $5.6 million in 2024. The increased business development expenses in 2025 were primarily the result of a higher compensation expense (including increased share-based compensation) and increased activities, which resulted in additional professional fees. The significant number of options exercised in 2025 also increased the social charges payable by the Company on the taxable gains realized by the holders of the share options, therefore increasing the total compensation expenses for 2025. The increase in share-based compensation for both G&A expenses and business development expenses was mainly due to higher performance results of the performance-based restricted share units.
In 2025, operating income reached $196.8 million, compared to $78.3 million in 2024. The increase was mainly the result of a higher gross profit, partially offset by higher G&A and business development expenses. In 2025, the Company recorded impairment charges on certain royalty interests totaling $5.5 million. These impairment charges resulted from the revision of certain operating parameters and the loss of royalty rights following the abandonment of properties by the respective operators. In 2024, the Company recorded a non-cash impairment loss of $49.6 million on the Eagle Gold mine royalty, which reduced the operating income for that period.
Net earnings in 2025 were $206.1 million, compared to $16.3 million in 2024. The increase in 2025 was mainly the result of a higher operating income, a gain on investments of $58.6 million (including a gain on the deemed disposal of an associate of $54.4 million and a change in fair value of financial assets at fair value through profit and loss of $5.3 million, partially offset by the reclassification to the statement of income of accumulated other comprehensive loss on the deemed disposal of an associate of $1.1 million), lower finance costs, a lower share of loss of associate and a gain on foreign exchange (compared to a loss on foreign exchange in 2024), partially offset by a higher income tax expense (in 2024, an income tax recovery of $13.1 million was recorded on the Eagle Gold mine royalty impairment of $49.6 million).
Adjusted earnings reached $165.5 million in 2025 compared to $97.3 million in 2024, mainly as a result of a higher gross profit and lower finance costs, partially offset by higher G&A and business development expenses and a higher income tax expense. A reconciliation of adjusted earnings is provided in the Non-IFRS Financial Performance Measures section of this MD&A.
Cash flows provided by operating activities in 2025 increased to $245.6 million from $159.9 million in 2024. The increase was mainly the result of higher revenues and lower finance costs, partially offset by higher cost of sales and increased G&A and business development expenses.
6 "Adjusted earnings" and "Adjusted earnings per basic share" are non-IFRS financial performance measures which have no standard definition under IFRS Accounting Standards and might not be comparable to similar financial measures disclosed by other issuers. Refer to the non-IFRS measures provided under the Non-IFRS Financial Performance Measures section of this MD&A for further information and for a quantitative reconciliation of each non-IFRS financial measure to the most directly comparable IFRS financial measure.
| OR Royalties Inc. 2025 – Annual Report |
Management’s Discussion and Analysis |
Consolidated Statements of Income
The following table presents summarized consolidated statements of income for the years ended December 31, 2025 and 2024 (in thousands of dollars):
| 2025 | 2024 | ||||||||
| $ | $ | ||||||||
| Revenues | (a) | 277,370 | 191,157 | ||||||
| Cost of sales | (b) | (9,115 | ) | (6,738 | ) | ||||
| Depletion | (c) | (35,770 | ) | (32,607 | ) | ||||
| Gross profit | (d) | 232,485 | 151,812 | ||||||
| Other operating expenses | |||||||||
| General and administrative | (e) | (20,932 | ) | (18,298 | ) | ||||
| Business development | (f) | (9,293 | ) | (5,632 | ) | ||||
| Impairment of royalty, stream and other interests | (g) | (5,495 | ) | (49,558 | ) | ||||
| Operating income | 196,765 | 78,324 | |||||||
| Other income (expenses), net | (h) | 44,620 | (48,182 | ) | |||||
| Earnings before income taxes | 241,385 | 30,142 | |||||||
| Income tax expense | (i) | (35,297 | ) | (13,875 | ) | ||||
| Net earnings | 206,088 | 16,267 |
(a) Revenues are comprised of the following:
| 2025 | 2024 | |||||||||||||||||
| Average selling price per ounce / tonne ($) |
Ounces / tonnes sold |
Total revenues ($000's) |
Average selling price per ounce / tonne ($) |
Ounces / tonnes sold |
Total revenues ($000's) |
|||||||||||||
| Gold sold | 3,425 | 42,492 | 145,555 | 2,361 | 46,696 | 110,237 | ||||||||||||
| Silver sold | 41.27 | 2,097,177 | 86,549 | 28.44 | 1,832,931 | 51,837 | ||||||||||||
| Copper sold | 10,153 | 1,000 | 10,153 | 8,920 | 748 | 6,671 | ||||||||||||
| Other (diamonds and paid in cash) | - | - | 35,113 | - | - | 22,412 | ||||||||||||
| 277,370 | 191,157 | |||||||||||||||||
The decrease in gold ounces sold in 2025 is mainly the result of the stoppage of operations at the Eagle Gold mine in June 2024. The increase in silver ounces sold in 2025 is mainly due to an increase in silver deliveries from the Mantos Blancos mine. The copper tonnes sold are related to the CSA copper stream, which had an economic effective date of June 17, 2024.
(b) Cost of sales mainly represents the acquisition price of the metals under the stream agreements, as well as deductions (when applicable) for governmental royalties, refining, insurance, transportation and other costs related to the metals received under royalty agreements. In 2025, cost of sales amounted to $9.1 million, compared to $6.7 million in 2024. The increase in 2025 is mainly due to higher metal prices.
(c) The royalties, streams and other interests are depleted using the units-of-production method over the estimated life of the properties or the life of the related agreements. The depletion expense increased to $35.8 million in 2025, compared to $32.6 million in 2024, mainly due to the mix of sales.
| OR Royalties Inc. 2025 – Annual Report |
Management’s Discussion and Analysis |
(d) The breakdown of cash margin7 and gross profit per type of interest is as follows (in thousands of dollars):
| 2025 | 2024 | ||||||
| $ | $ | ||||||
| Royalty interests | |||||||
| Revenues | 177,264 | 130,375 | |||||
| Less: cost of sales (excluding depletion) | (701 | ) | (413 | ) | |||
| Cash margin (in dollars) | 176,563 | 129,962 | |||||
| Depletion | (13,234 | ) | (12,208 | ) | |||
| Gross profit | 163,329 | 117,754 | |||||
| Stream interests | |||||||
| Revenues | 100,106 | 60,782 | |||||
| Less: cost of sales (excluding depletion) | (8,414 | ) | (6,325 | ) | |||
| Cash margin (in dollars) | 91,692 | 54,457 | |||||
| Depletion | (22,536 | ) | (20,399 | ) | |||
| Gross profit | 69,156 | 34,058 | |||||
| Royalty and stream interests Total cash margin (in dollars) |
268,255 | 184,419 | |||||
| Divided by: total revenues | 277,370 | 191,157 | |||||
| Cash margin (in percentage of revenues) | 96.7% | 96.5% | |||||
| Total - Gross profit | 232,485 | 151,812 |
(e) G&A expenses increased to $20.9 million in 2025 from $18.3 million in 2024, mainly as the result of a higher compensation expense (including increased share-based compensation). The significant number of options exercised during the year also increased the social charges payable by the Company on the taxable gains realized by the holders of the share options. The increase in share-based compensation was mainly due to higher performance results of the performance-based restricted share units.
(f) Business development expenses increased in 2025 to $9.3 million from $5.6 million in 2024. The increased expenses in 2025 were mainly the result of a higher compensation expense (including increased share-based compensation) and increased activities, which resulted in additional professional fees. The significant number of options exercised during the year also increased the social charges payable by the Company on the taxable gains realized by the holders of the share options. The increase in share-based compensation was mainly due to higher performance results of the performance-based restricted share units.
(g) In 2025, the Company recorded impairment charges on certain royalty interests totaling $5.5 million. These impairment charges resulted from the revision of certain operating parameters and the loss of royalty rights following the abandonment of properties by the respective operators. In 2024, as a result of the failure at the heap leach facility of the Eagle Gold mine, management performed an impairment assessment on the Eagle Gold mine royalty interest as at June 30, 2024 and recorded a non-cash impairment loss of $49.6 million.
7 Cash margin is a non-IFRS financial performance measure which has no standard definition under IFRS Accounting Standards and might not be comparable to similar financial measures disclosed by other issuers. It is calculated by deducting the cost of sales (excluding depletion) from the revenues. Please refer to the Non-IFRS Financial Performance Measures section of this MD&A for further information and for a quantitative reconciliation of each non-IFRS financial measure to the most directly comparable IFRS financial measure.
| OR Royalties Inc. 2025 – Annual Report |
Management’s Discussion and Analysis |
(h) Other income, net of $44.6 million in 2025 includes a gain on investments of $54.0 million (including a gain on the deemed disposal of an associate of $54.4 million and a change in fair value of financial assets at fair value through profit and loss of $5.3 million, partially offset by the reclassification to the statement of income of accumulated other comprehensive loss on the deemed disposal of an associate of $1.1 million), interest income of $4.0 million and a foreign exchange gain of $0.6 million, partially offset by a share of loss of associates of $14.2 million and finance costs of $4.5 million.
Other expenses, net of $48.2 million in 2024 include a share of loss of associates of $30.0 million, a loss on dilution of investments in an associate of $9.3 million, finance costs of $8.0 million and a foreign exchange loss of $4.4 million, partially offset by interest income of $4.2 million.
(i) The effective income tax rate in 2025 was 14.6%, compared to 46.0% in 2024. The statutory rate was 26.5% in 2025 and 2024. The elements that impacted the effective income tax rates are tax benefits not recognized on the non-cash gain on the deemed disposal of an associate, changes to unrecognized deferred tax assets, permanent differences on share-based compensation and revenues not taxable.
Current income taxes of $16.6 million were recognized in 2025, of which $3.1 million were paid on royalties earned in foreign jurisdictions. An amount of $13.5 million is related to income taxes payable in Canada for 2025. These income taxes will be payable in the first quarter of 2026, as it will be the first year that OR Royalties will be cash taxable in Canada since its creation in 2014. Starting in 2026, the Company will be required to make monthly tax instalments to the Federal and Provincial governments in Canada.
Liquidity and Capital Resources
As at December 31, 2025, the Company's cash position amounted to $142.1 million compared to $59.1 million as at December 31, 2024.
Significant variations in the liquidity and capital resources for the three months and the year ended December 31, 2025 are summarized below (in thousands of dollars) and explained under the Cash Flows section of this MD&A.
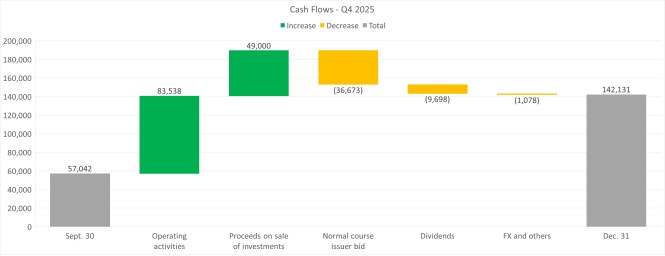
| OR Royalties Inc. 2025 – Annual Report |
Management’s Discussion and Analysis |
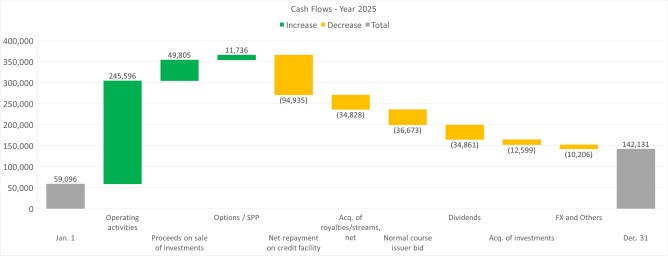
Revolving credit facility
In May 2025, the Company amended its existing revolving credit facility (the "Credit Facility"), including the conversion from a Canadian dollar denominated facility to a United States dollar denominated facility, as well as an increase in the overall size of the Credit Facility. Under the amended agreement, the Company has now access to a Credit Facility of $650.0 million with an additional uncommitted accordion of up to $200.0 million (subject to acceptance by the lenders). The previous credit facility agreement had a maximum amount of C$550.0 million with an uncommitted accordion of up to C$200.0 million.
The maturity date of the Facility was extended from April 30, 2028 to May 30, 2029. The Facility is to be used for general corporate purposes and investments in the mineral industry, including the acquisition of royalties, streams and other interests, and is secured by the Company's assets.
The Facility is subject to standby fees. Funds drawn bear interest based on the base rate, prime rate, Canadian Overnight Repo Rate Average ("CORRA") or Secured Overnight Financing Rate ("SOFR"), plus an applicable margin depending on the Company's leverage ratio.
The Facility includes quarterly covenants that require the Company to maintain certain financial ratios, including leverage ratios, and to meet certain non-financial requirements. As at December 31, 2025, all such ratios and requirements were met.
Financial liabilities
As at December 31, 2025, all financial liabilities to be settled in cash or by the transfer of other financial assets mature within 90 days, except for the revolving credit facility and the lease liabilities, which are described below:
| As at December 31, 2025 | |||||||||||||||||||||
| Total amount payable |
Estimated annual payments | ||||||||||||||||||||
| Maturity | 2026 | 2027 | 2028 | 2029 | 2030 | ||||||||||||||||
| $ | $ | $ | $ | $ | $ | ||||||||||||||||
| Revolving credit facility (i) | 4,698 | May 30, 2029 | 1,375 | 1,375 | 1,375 | 573 | - | ||||||||||||||
| Lease liabilities | 5,790 | December 31, 2029 | 1,548 | 1,544 | 1,388 | 1,310 | - | ||||||||||||||
| 10,488 | 2,923 | 2,919 | 2,763 | 1,883 | - | ||||||||||||||||
(i) Since the revolving credit facility was undrawn as of December 31, 2025, the amounts presented correspond only to the monthly standby fees payable on the unused portion of the revolving credit facility.
| OR Royalties Inc. 2025 – Annual Report |
Management’s Discussion and Analysis |
Cash Flows
The following table summarizes the cash flows for the years ended December 31, 2025 and 2024 (in thousands of dollars):
| 2025 | 2024 | |||||
| $ | $ | |||||
| Cash flows | ||||||
| Operations | 230,630 | 161,802 | ||||
| Working capital items | 14,966 | (1,877 | ) | |||
| Operating activities | 245,596 | 159,925 | ||||
| Investing activities | 1,352 | (75,642 | ) | |||
| Financing activities | (163,346 | ) | (74,868 | ) | ||
| Effects of exchange rate changes on cash | (567 | ) | (1,523 | ) | ||
| Net increase in cash | 83,035 | 7,892 | ||||
| Cash - beginning of period | 59,096 | 51,204 | ||||
| Cash - end of period | 142,131 | 59,096 | ||||
Operating Activities
In 2025, cash flows provided by operating activities amounted to $245.6 million compared to $159.9 million in 2024. The increase was mainly the result of higher revenues and lower finance costs, partially offset by higher cost of sales and higher G&A and business development expenses. The positive impact from working capital items in 2025 is mostly due to income taxes for the year 2025, which are payable in the first quarter of 2026.
Investing Activities
During the year 2025, cash flows provided by investing activities amounted to $1.4 million compared to cash flows used in investing activities of $75.6 million in 2024.
In 2025, OR Royalties invested a total of $36.9 million in royalty and stream interests, including $13.0 million to acquire a silver stream on the South Railroad project and the payment by OR Royalties International of the second installment of $10.0 million on the Cascabel gold stream, acquired equity investments for $11.0 million and other investments for $1.6 million. During the same period, the Company received $2.1 million following the exercise of a buy-down option on a royalty interest by an operator and sold equity investments for proceeds of $49.8 million, including $49.0 million received by OR Royalties International from the sale of the MAC Copper shares.
In 2024, $6.0 million were invested to acquire notes receivable from an associate (presented as other investments on the consolidated balance sheets). The disposal of equity investments generated proceeds of $2.4 million and another $1.4 million was received from the partial repayment of the Stornoway bridge loan, which was fully provisioned in 2023.
Financing Activities
During the year 2025, cash flows used in financing activities amounted to $163.3 million compared to $74.9 million in 2024.
In 2025, OR Royalties repaid a net amount of $94.9 million under its revolving credit facility, acquired common shares under NCIB program for $36.7 million, paid $34.9 million in dividends and $6.5 million in withholding taxes on the settlement of restricted and deferred share units. OR Royalties received proceeds from the exercise of share options and the share purchase plan for $11.7 million during the same period.
In 2024, OR Royalties repaid a net amount of $49.7 million under its revolving credit facility, paid $30.7 million in dividends and $2.4 million in withholding taxes on the settlement of restricted and deferred share units. OR Royalties received proceeds from the exercise of share options and the share purchase plan for $9.6 million and acquired shares under the NCIB program for $0.4 million during the same period.
| OR Royalties Inc. 2025 – Annual Report |
Management’s Discussion and Analysis |
Quarterly Information
The selected quarterly financial information(1) for the past eight financial quarters is outlined below:
(in thousands of dollars, except for amounts per share)
| 2025 | 2024 | |||||||||||||||||||||||
| Q4 | Q3 | Q2 | Q1 | Q4 | Q3 | Q2 | Q1 | |||||||||||||||||
| GEOs | 21,735 | 20,326 | 19,700 | 19,014 | 20,005 | 18,408 | 20,068 | 22,259 | ||||||||||||||||
| Cash | 142,131 | 57,042 | 49,626 | 63,070 | 59,096 | 43,366 | 48,018 | 52,104 | ||||||||||||||||
| Total assets | 1,566,479 | 1,516,753 | 1,442,191 | 1,388,729 | 1,377,634 | 1,385,713 | 1,382,089 | 1,444,017 | ||||||||||||||||
| Total long-term debt | - | - | 35,655 | 74,346 | 93,900 | 59,816 | 79,610 | 112,135 | ||||||||||||||||
| Equity | 1,432,041 | 1,396,189 | 1,290,360 | 1,213,894 | 1,188,953 | 1,215,186 | 1,215,186 | 1,237,585 | ||||||||||||||||
| Revenues | 90,465 | 71,625 | 60,364 | 54,916 | 56,742 | 41,977 | 47,391 | 45,047 | ||||||||||||||||
| Net cash flows from operating activities | 83,538 | 64,604 | 51,375 | 46,079 | 49,765 | 34,564 | 38,234 | 37,362 | ||||||||||||||||
| Impairment of assets, net of income taxes | - | 4,834 | - | - | - | - | 36,425 | - | ||||||||||||||||
| Net earnings (loss) | 65,245 | 82,845 | 32,358 | 25,640 | 7,105 | 13,409 | (15,416 | ) | 11,169 | |||||||||||||||
| Net earnings (loss) per share | ||||||||||||||||||||||||
| - Basic | 0.35 | 0.44 | 0.17 | 0.14 | 0.04 | 0.07 | (0.08 | ) | 0.06 | |||||||||||||||
| - Diluted | 0.34 | 0.44 | 0.17 | 0.14 | 0.04 | 0.07 | (0.08 | ) | 0.06 | |||||||||||||||
| Weighted average shares outstanding (000's) | ||||||||||||||||||||||||
| - Basic | 188,050 | 188,312 | 187,746 | 186,979 | 186,747 | 186,408 | 186,217 | 185,761 | ||||||||||||||||
| - Diluted | 189,310 | 189,519 | 189,081 | 188,425 | 188,180 | 187,732 | 186,217 | 186,870 | ||||||||||||||||
| Share price - TSX - closing (C$) | 48.62 | 55.78 | 35.00 | 30.37 | 26.03 | 25.05 | 21.32 | 22.23 | ||||||||||||||||
| Share price - NYSE - closing | 35.39 | 40.08 | 25.71 | 21.12 | 18.10 | 18.51 | 15.58 | 16.42 | ||||||||||||||||
| Price of gold (average) | 4,135 | 3,457 | 3,280 | 2,860 | 2,663 | 2,474 | 2,338 | 2,070 | ||||||||||||||||
| Closing exchange rate (2) (C$/US$) | 0.7296 | 0.7183 | 0.7330 | 0.6956 | 0.6950 | 0.7408 | 0.7306 | 0.7380 | ||||||||||||||||
(1) Unless otherwise noted, financial information is in U.S. dollars and prepared in accordance with IFRS Accounting Standards.
(2) Bank of Canada Daily Rate.
In the first, second and third quarters of 2025, the Company repaid net amounts of $19.6 million, $40.0 million and $35.4 million on its revolving credit facility, respectively.
During the fourth quarter of 2024, the Company drew $35.0 million on its revolving credit facility to finance the acquisition of royalty and stream interests. During the second quarter of 2024, the Company repaid $32.3 million on its revolving credit facility and recorded an impairment loss of $49.6 million ($36.4 million, net of income taxes) on its Eagle Gold mine royalty interest. During the first quarter of 2024, the Company repaid $32.4 million on its revolving credit facility.
| OR Royalties Inc. 2025 – Annual Report |
Management’s Discussion and Analysis |
Fourth Quarter Results
Financial Summary
Revenues from royalties and streams increased to $90.5 million in the fourth quarter of 2025, compared to $56.7 million in the fourth quarter of 2024, mainly as a result of higher metal prices and higher deliveries under the royalty and stream agreements.
Gross profit amounted to $77.6 million in the fourth quarter of 2025, compared to $45.1 million in the fourth quarter of 2024. Cost of sales increased, mainly due to higher metal prices and deliveries under the royalty and stream agreements. Depletion also increased, mainly as a result of higher deliveries and the mix of sales.
G&A expenses amounted to $5.1 million in the fourth quarter of 2025, compared to $4.2 million in the fourth quarter of 2024. The increased G&A expenses in the fourth quarter of 2025 were mainly the result of a higher share-based compensation expense and increased activities, which resulted in additional professional expenses. Business development expenses amounted to $2.4 million in the fourth quarter of 2025, compared to $2.0 million in the fourth quarter of 2024. The increased business development expenses in the fourth quarter of 2025 were primarily the result of a higher compensation expense (including increased share-based compensation). The increase in share-based compensation for both G&A expenses and business development expenses was mainly due to higher performance results of the performance-based restricted share units.
In the fourth quarter of 2025, operating income reached $70.1 million, compared to $38.9 million in the fourth quarter of 2024. The increase was driven by a higher gross profit, partially offset by higher G&A and business development expenses.
Net earnings in the fourth quarter of 2025 were $65.2 million, compared to $7.1 million in the fourth quarter of 2024. The increase in the fourth quarter of 2025 was mainly the result of a change in fair value of financial assets at fair value through profit and loss of $5.7 million, partially offset by a higher income tax expense. In the fourth quarter of 2024, the Company also recorded a share of loss of associates of $9.5 million and a loss on investments of $11.3 million (including a loss on dilution of an associate of $9.3 million).
Adjusted earnings reached $59.6 million in the fourth quarter of 2025, compared to $29.9 million in the fourth quarter of 2024, mainly a result of a higher gross profit, partially offset by higher G&A and business development expenses and a higher income tax expense. A reconciliation of adjusted earnings is provided in the Non-IFRS Financial Performance Measures section of this MD&A.
Cash flows provided by operating activities in the fourth quarter of 2025 increased to $83.5 million, compared to $49.8 million in the fourth quarter of 2024, mainly as a result of higher revenues, partially offset by higher G&A and business development expenses.
8 Three months ended December 31, 2024 ("Q4 2024").
9 "Adjusted earnings" and "Adjusted earnings per basic share" are non-IFRS financial performance measures which have no standard definition under IFRS Accounting Standards and might not be comparable to similar financial measures disclosed by other issuers. Refer to the non-IFRS measures provided under the Non-IFRS Financial Performance Measures section of this MD&A for further information and for a quantitative reconciliation of each non-IFRS financial measure to the most directly comparable IFRS financial measure."
| OR Royalties Inc. 2025 – Annual Report |
Management’s Discussion and Analysis |
Consolidated Statements of Income
The following table presents summarized consolidated statements of income for the three months ended December 31, 2025 and 2024 (in thousands of dollars):
| Three months ended December 31, |
||||||||||
| 2025 | 2024 | |||||||||
| $ | $ | |||||||||
| Revenues | (a) | 90,465 | 56,742 | |||||||
| Cost of sales | (b) | (2,569 | ) | (2,181 | ) | |||||
| Depletion | (c) | (10,254 | ) | (9,475 | ) | |||||
| Gross profit | (d) | 77,642 | 45,086 | |||||||
| Other operating expenses | ||||||||||
| General and administrative | (e) | (5,134 | ) | (4,209 | ) | |||||
| Business development | (f) | (2,372 | ) | (1,987 | ) | |||||
| Operating income | 70,136 | 38,890 | ||||||||
| Other revenues (expenses), net | (g) | 6,209 | (22,906 | ) | ||||||
| Earnings before income taxes | 76,345 | 15,984 | ||||||||
| Income tax expense | (h) | (11,100 | ) | (8,879 | ) | |||||
| Net earnings | 65,245 | 7,105 | ||||||||
| OR Royalties Inc. 2025 – Annual Report |
Management’s Discussion and Analysis |
(a) Revenues are comprised of the following:
| Three months ended December 31, | ||||||||||||||||||
| 2025 | 2024 | |||||||||||||||||
| Average selling price per ounce / tonne ($) |
Ounces / tonnes sold |
Total revenues ($000's) |
Average selling price per ounce / tonne ($) |
Ounces / tonnes sold |
Total revenues ($000's) |
|||||||||||||
| Gold sold | 4,122 | 10,799 | 44,508 | 2,656 | 10,524 | 27,953 | ||||||||||||
| Silver sold | 54.70 | 594,829 | 32,539 | 30.66 | 475,647 | 14,581 | ||||||||||||
| Copper sold | 11,750 | 152 | 1,783 | 8,880 | 674 | 5,980 | ||||||||||||
| Other (diamonds and paid in cash) | - | - | 11,635 | - | - | 8,228 | ||||||||||||
| 90,465 | 56,742 | |||||||||||||||||
The increase in silver ounces sold in the fourth quarter of 2025 is mainly due to an increase in silver deliveries from the Mantos Blancos mine. The decrease in copper tonnes sold in the fourth quarter of 2025 is due to lower deliveries from the CSA copper stream and the timing of sales in the fourth quarter of 2024 (the copper tonnes deliveries in the third quarter of 2024 were sold in the fourth quarter of 2024).
(b) Cost of sales mainly represents the acquisition price of the metals and diamonds under the stream agreements, as well as deductions (if applicable) for governmental royalties, refining, insurance, transportation and other costs related to the metals received under royalty agreements. In the fourth quarter of 2025, cost of sales amounted to $2.6 million, compared to $2.2 million in the fourth quarter of 2024. The increase in the fourth quarter of 2025 is mainly due to higher metal prices and higher deliveries.
(c) The royalty, stream and other interests are depleted using the units-of-production method over the estimated life of the properties or the life of the related agreements. The depletion expense increased to $10.3 million in the fourth quarter of 2025, compared to $9.5 million in the fourth quarter of 2024, mainly as a result of higher deliveries and the mix of sales.
(d) The breakdown of cash margin10 and gross profit per type of interest is as follows (in thousands of dollars):
| Three months ended December 31 |
|||||||
| 2025 | 2024 | ||||||
| $ | $ | ||||||
| Royalty interests | |||||||
| Revenues | 55,555 | 35,349 | |||||
| Less: cost of sales (excluding depletion) | (134 | ) | (180 | ) | |||
| Cash margin (in dollars) | 55,421 | 35,169 | |||||
| Depletion | (4,419 | ) | (2,160 | ) | |||
| Gross profit | 51,002 | 33,009 | |||||
| Stream interests | |||||||
| Revenues | 34,910 | 21,393 | |||||
| Less: cost of sales (excluding depletion) | (2,435 | ) | (2,001 | ) | |||
| Cash margin (in dollars) | 32,475 | 19,392 | |||||
| Depletion | (5,835 | ) | (7,315 | ) | |||
| Gross profit | 26,640 | 12,077 | |||||
| Royalty and stream interests | |||||||
| Total cash margin (in dollars) | 87,896 | 54,561 | |||||
| Divided by: total revenues | 90,465 | 56,742 | |||||
| Cash margin (in percentage of revenues) | 97.2% | 96.2% | |||||
| Total - Gross profit | 77,642 | 45,086 | |||||
10 Cash margin is a non-IFRS financial performance measure which has no standard definition under IFRS Accounting Standards and might not be comparable to similar financial measures disclosed by other issuers. It is calculated by deducting the cost of sales (excluding depletion) from the revenues. Please refer to the Non-IFRS Financial Performance Measures section of this MD&A for further information and for a quantitative reconciliation of each non-IFRS financial measure to the most directly comparable IFRS financial measure.
| OR Royalties Inc. 2025 – Annual Report |
Management’s Discussion and Analysis |
(e) G&A expenses increased to $5.1 million in the fourth quarter of 2025 from $4.2 million in the fourth quarter of 2024, mainly as the result of a higher share-based compensation and increased activities that translated into additional professional fees. The increase in share-based compensation was mainly due to higher performance results of the performance-based restricted share units.
(f) Business development expenses increased in the fourth quarter of 2025 to $2.4 million from $2.0 million in the fourth quarter of 2024. The increased expenses in the fourth quarter of 2025 were mainly the result of a higher compensation expense (including increased share-based compensation). The increase in share-based compensation was mainly due to higher performance results of the performance-based restricted share units.
(g) Other revenues, net of $6.2 million in the fourth quarter of 2025 include interest income of $1.7 million and a gain on investments of $5.7 million (including a change in fair value of financial assets at fair value through profit and loss of $5.3 million), partially offset by a loss on foreign exchange of $0.5 million and finance costs of $0.7 million.
Other expenses, net of $22.9 million in the fourth quarter of 2024 include finance costs of $1.5 million, a share of loss of associates of $9.5 million, a loss on dilution of investments in an associate of $9.3 million, a loss on foreign exchange of $1.8 million and other non-cash net losses of $2.0 million, partially offset by interest income of $1.1 million.
(h) The effective income tax rate in the fourth quarter of 2025 was 14.5%, compared to 55.5% in the fourth quarter of 2024. The statutory rate was 26.5% in 2025 and 2024. The elements that impacted the effective income tax rates are changes to unrecognized deferred tax assets, permanent differences on share-based compensation and revenues not taxable.
Current income taxes of $6.3 million were recognized in the fourth quarter of 2025, of which $1.0 million were paid on royalties earned in foreign jurisdictions. An amount of $5.3 million is related to income taxes payable in Canada for 2025. These income taxes will be payable in the first quarter of 2026, as it will be the first year that OR Royalties will be cash taxable in Canada since its creation in 2014. Starting in 2026, the Company will be required to make monthly tax instalments to the Federal and Provincial governments in Canada.
| OR Royalties Inc. 2025 – Annual Report |
Management’s Discussion and Analysis |
Segment Disclosure
The President and Chief Executive Officer (chief operating decision-maker) organizes and manages the business under a single operating segment, consisting of acquiring and managing precious metals and other royalties, streams and other interests. All of the Company's assets, liabilities, revenues, expenses and cash flows are attributable to this single operating segment. The following tables present segmented information for this single segment.
Geographic revenues
Geographic revenues, including revenues derived from the sale of metals and diamonds received or acquired from in-kind royalties, streams and other interests, are determined by the location of the mining operations giving rise to the royalty, stream or other interest. For the years ended December 31, 2025 and 2024, royalty, stream and other interest revenues were earned from the following jurisdictions (in thousands of dollars):
| North America (i) | South America | Australia | Africa | Europe | Total | |||||||||||||
| $ | $ | $ | $ | $ | $ | |||||||||||||
| 2025 | ||||||||||||||||||
| Royalties | 165,738 | 5,765 | 347 | 5,414 | - | 177,264 | ||||||||||||
| Streams | 11,883 | 45,831 | 27,029 | - | 15,363 | 100,106 | ||||||||||||
| 177,621 | 51,596 | 27,376 | 5,414 | 15,363 | 277,370 | |||||||||||||
| 2024 | ||||||||||||||||||
| Royalties | 126,101 | 1,338 | 240 | 2,696 | - | 130,375 | ||||||||||||
| Streams | 8,204 | 22,371 | 19,808 | - | 10,399 | 60,782 | ||||||||||||
| 134,305 | 23,709 | 20,048 | 2,696 | 10,399 | 191,157 | |||||||||||||
| (i) In 2025, revenues generated from Canada amounted to $160.1 million ($121.7 million in 2024). | ||||||||||||||||||
In 2025, two royalty/stream interests generated revenues of $154.1 million ($100.6 million in 2024), which represented 56% of revenues (53% of revenues in 2024), including one royalty interest that generated revenues of $108.2 million ($78.3 million in 2024).
In 2025, revenues generated from precious metals represented 95% of total revenues (94% in 2024).
| OR Royalties Inc. 2025 – Annual Report |
Management’s Discussion and Analysis |
Geographic net assets
The following table summarizes the royalty, stream and other interests by jurisdiction, as at December 31, 2025 and 2024, which is based on the location of the properties related to the royalty, stream or other interests (in thousands of dollars):
| North America (i) |
South America |
Australia |
Africa |
Asia |
Europe |
Total |
|||||||||||||||
| $ | $ | $ | $ | $ | $ | $ | |||||||||||||||
| December 31, 2025 | |||||||||||||||||||||
| Royalties | 404,599 | 131,823 | 58,078 | 48,841 | 5,248 | 10,847 | 659,436 | ||||||||||||||
| Streams | 161,176 | 128,907 | 127,252 | - | 22,300 | 30,184 | 469,819 | ||||||||||||||
| Offtakes | - | - | 7,067 | - | 3,704 | - | 10,771 | ||||||||||||||
| 565,775 | 260,730 | 192,397 | 48,841 | 31,252 | 41,031 | 1,140,026 | |||||||||||||||
| December 31, 2024 | |||||||||||||||||||||
| Royalties | 392,520 | 127,008 | 57,646 | 49,906 | - | 10,333 | 637,413 | ||||||||||||||
| Streams | 146,408 | 127,974 | 136,386 | - | 22,300 | 32,603 | 465,671 | ||||||||||||||
| Offtakes | - | - | 7,067 | - | 3,704 | - | 10,771 | ||||||||||||||
| 538,928 | 254,982 | 201,099 | 49,906 | 26,004 | 42,936 | 1,113,855 | |||||||||||||||
| (i) As at December 31, 2025, the carrying value of the net interests located in Canada amounted to $355.7 million ($338.5 million as at December 31, 2024). | |||||||||||||||||||||
Related Party Transactions
There were no material transactions with related parties during the year ended December 31, 2025 (a note receivable from an associate of $12.2 million was included in other investments as at December 31, 2024).
| OR Royalties Inc. 2025 – Annual Report |
Management’s Discussion and Analysis |
Contractual Obligations and Commitments
Investments in royalty and stream interests
As at December 31, 2025, significant commitments related to the acquisition of royalties and streams are detailed in the following table. The Company intends to meet these commitments by using its cash balance, from its expected operating cash flows to be generated from its operations and/or by drawdowns on its revolving credit facility.
| Company | Project (asset) | Installments | Triggering events |
| Gold Resource Corporation | Back Forty project (gold stream) |
$5.0 million | Receipt of all material permits for the construction and operation of the project. |
| $25.0 million | Pro rata to drawdowns with construction finance facility. | ||
| SolGold plc | Cascabel project (gold stream) |
$10.0 million | Achievement of operational milestones, including submission of all final permit applications for the construction and operation of the project. |
| $195.0 million | Pro rata to drawdowns with construction finance facility. | ||
| Falco Resources Ltd. | Horne 5 project (silver stream) |
C$45.0 million | Receipt of all necessary material third-party approvals, licenses, rights of way, surface rights on the property and all material construction permits, positive construction decision, and raising a minimum of C$135.0 million in non-debt financing and demonstrating that the financial assurance required to allow Falco to proceed with the commencement of mining activities can be satisfied, as applicable. |
| C$60.0 million | Upon total projected capital expenditure having been demonstrated to be financed. | ||
| C$40.0 million (optional) |
Payable with fourth installment, at sole election of OR Royalties, to increase the silver stream to 100% of payable silver (from 90%). | ||
| OR Royalties Inc. 2025 – Annual Report |
Management’s Discussion and Analysis |
Stream purchase agreements
The following table summarizes the significant commitments related to producing assets and assets in advance stage of development to pay for metals and other commodities to which OR Royalties has the contractual right pursuant to the associated purchase agreements:
| Attributable payable production to be purchased |
Per ounce/tonnes cash payment |
Term of agreement |
Date of contract |
|||||||||||||||
| Interest | Silver | Other | Silver | Other | ||||||||||||||
| CSA streams (1) | 100% | 2.25 - 4.875% (Copper) |
4% | 4% | Life of mine | June 2023 | ||||||||||||
| Gibraltar stream (2) | 100% | nil | Life of mine | March 2018 Amended Dec. 2024 |
||||||||||||||
| Mantos Blancos stream (3) | 100% | 8% spot | Life of mine | September 2015 Amended Aug. 2019 |
||||||||||||||
| Sasa stream (4) | 100% | $6.665 | 40 years | November 2015 | ||||||||||||||
(1) OR Royalties International will receive refined silver equal to 100% of the payable silver produced from the CSA mine for the life of the mine, and will be entitled to receive refined copper equal to 3.0% of payable copper produced from the CSA mine until the 5th anniversary of the agreements, then 4.875% of payable copper produced from the CSA mine until 33,000 metric tonnes have been delivered in aggregate, and thereafter 2.25% of payable copper produced from the CSA mine for the remaining life of the mine. On the 5th anniversary of the closing date (June 15, 2028), the owner will have the option to exercise certain buy-down rights by paying a one-time cash payment to OR Royalties International of $20.0 million to $40.0 million. If the option is exercised, OR Royalties International will still be entitled to receive refined copper equal to 3.25% - 4.0625% of payable copper produced from the CSA mine until 23,900 to 28,450 metric tonnes have been delivered in aggregate, and thereafter 1.5% - 1.875% of payable copper produced from the CSA mine for the remaining life of the mine. As of December 31, 2025, 1,748 tonnes of copper have been delivered to OR Royalties International under the stream agreement.
(2) OR Royalties will receive from Taseko an amount of silver production equal to 100% of Gibraltar mine's production, until reaching the delivery to OR Royalties of 6.8 million ounces of silver, and 35% of production thereafter. As of December 31, 2025, a total of 1.6 million ounces of silver have been delivered under the stream agreement.
(3) The stream percentage shall be payable on 100% of silver until 19,300,000 ounces have been delivered, after which the stream percentage will be 40%. As of December 31, 2025, a total of 7.5 million ounces of silver have been delivered to OR Royalties International under the stream agreement.
(4) Price subject to the lesser of 3% or inflation over the previous calendar year measured by the consumer price index (CPI) per ounce price escalation after 2016.
Off-Balance Sheet Items
There are no significant off-balance sheet arrangements, other than the contractual obligations and commitments mentioned above.
Outstanding Share Data
As of February 18, 2026, 187,510,731 common shares and 1,004,799 share options were issued and outstanding.
Subsequent Events to December 31, 2025
Acquisition of an additional 1% NSR royalty on Namdini
On January 29, 2026, the Company announced the acquisition of an additional 1.0% NSR royalty covering the producing Namdini Gold Mine ("Namdini") in Ghana, with an effective date of October 1, 2025. OR Royalties has closed the transaction with Savannah Mining Limited ("Savannah"), acquiring Savannah's remaining 50% interest in the 2.0% NSR royalty for total cash consideration of up to $103.5 million.
Acquisition of a portfolio of royalties and deferred payment obligations from Gold Fields Limited
On February 18, 2026, the Company announced that it has entered into a definitive agreement with Gold Fields to acquire a high-quality portfolio of precious metals assets consisting of eight royalties (the "Portfolio") for a total cash consideration of $115.0 million, anchored by a 1.5% NSR royalty on Compañía de Minas Buenaventura SAA's producing San Gabriel gold and silver mine located in the Province of General Sánchez Cerro, Region of Moquegua, Peru.
In addition to the Portfolio, the Company has agreed to pay Gold Fields $52.0 million in exchange for deferred payment obligations totalling $60.0 million payable by Galiano Gold Inc. ($30.0 million on or before December 31, 2026 and $30.0 million upon production of an aggregate of 100,000 ounces of gold from Asanko Gold Mine's Nkran deposit).
| OR Royalties Inc. 2025 – Annual Report |
Management’s Discussion and Analysis |
Dividend
On February 18, 2026, the Board of Directors declared a quarterly dividend of $0.055 per common share payable on April 15, 2026 to shareholders of record as of the close of business on March 31, 2026.
Risks and Uncertainties
The Company is a royalty, stream, and similar interests holder and investor that operates in an industry that is subject to a number of risk factors that include environmental, legal and political risks, the discovery of economically recoverable resources and the conversion of these mineral resources to mineral reserves and the ability of third-party partners to maintain an economic production. An investment in the Company's securities is subject to a number of risks and uncertainties. An investor should carefully consider the risks described in OR Royalties' most recent Annual Information Form, and the other information filed with the Canadian securities regulators and the U.S. Securities and Exchange Commission ("SEC"). If any of such described risks occur, or if others occur, the Company's business, operating results and financial condition could be seriously harmed and investors may lose a significant proportion of their investment.
There are important risks which management believes could impact the Company's business. For information on risks and uncertainties, please refer to the Risk Factors section of OR Royalties' most recent Annual Information Form other information filed with the Canadian securities regulators and the SEC on SEDAR+ at www.sedarplus.ca and on EDGAR at www.sec.gov.
Disclosure Controls and Procedures and Internal Control over Financial Reporting
Disclosure Controls and Procedures
The Chief Executive Officer (the "CEO") and the Chief Financial Officer (the "CFO") of the Company are responsible for establishing and maintaining the Company's disclosure controls and procedures ("DCP") including adherence to the Disclosure Policy adopted by the Company. The Disclosure Policy requires all staff to keep senior management fully apprised of all material information affecting the Company so that they may evaluate and discuss this information and determine the appropriateness and timing for public disclosure.
The Company maintains DCP designed to ensure that information required to be disclosed in reports filed under applicable Canadian securities laws and the U.S. Securities Exchange Act of 1934, as amended, is recorded, processed, summarized and reported within the appropriate time periods and that such information is accumulated and communicated to the Company's management, including the CEO and CFO, to allow for timely decisions regarding required disclosure.
In designing and evaluating DCP, the Company recognizes that any disclosure controls and procedures, no matter how well conceived or operated, can only provide reasonable, not absolute, assurance that the objectives of the control system are met, and management is required to exercise its judgement in evaluating the cost-benefit relationship of possible controls and procedures.
The CEO and CFO have evaluated whether there were changes to the DCP during the year ended December 31, 2025 that have materially affected, or are reasonably likely to materially affect, the DCP. No such changes were identified through their evaluation.
Internal Control over Financial Reporting
The Company's management, including the CEO and the CFO, are responsible for establishing and maintaining adequate internal control over financial reporting ("ICFR") for the Company to provide reasonable assurance regarding the reliability of financial reporting and the preparation of financial statements for external purposes in accordance with IFRS Accounting Standards. The fundamental issue is ensuring all transactions are properly authorized and identified and entered into a well-designed, robust and clearly understood accounting system on a timely basis to minimize risk of inaccuracy, failure to fairly reflect transactions, failure to fairly record transactions necessary to present financial statements in accordance with IFRS Accounting Standards, unauthorized receipts and expenditures, or the inability to provide assurance that unauthorized acquisitions or dispositions of assets can be detected.
The CEO and CFO have also evaluated the effectiveness of the Company's ICFR as required by National Instrument 52-109 issued by the Canadian Securities Administrators and rules 13a-15 and 15d-15 under the Exchange Act based on the framework and criteria established in Internal Control - Integrated Framework (2013) as issued by the Committee of Sponsoring Organizations (COSO) of the Treadway Commission. Based on this evaluation, the CEO and CFO concluded that the Company's ICFR was effective as of December 31, 2025.
| OR Royalties Inc. 2025 – Annual Report |
Management’s Discussion and Analysis |
The Company's ICFR may not prevent or detect all misstatements because of inherent limitations. Additionally, projections of any evaluation of effectiveness to future periods are subject to the risk that controls may become inadequate because changes in conditions or deterioration in the degree of compliance with the Company's policies and procedures.
The CEO and CFO have evaluated whether there were changes to the ICFR during the year ended December 31, 2025 that have materially affected, or are reasonably likely to materially affect, the ICFR. No such changes were identified through their evaluation.
The Company's independent registered public accounting firm, PricewaterhouseCoopers LLP, have audited the Company's consolidated financial statements for the year ended December 31, 2025 and have issued an audit report dated February 18, 2026 on the Company's ICFR based on the framework and criteria established in Internal Control - Integrated Framework (2013) as issued by COSO of the Treadway Commission.
Basis of Presentation of Consolidated Financial Statements
The consolidated financial statements for the year ended December 31, 2025 have been prepared in accordance with the IFRS Accounting Standards as issued by the IASB. The material accounting policies of OR Royalties are detailed in the notes to the audited consolidated financial statements for the years ended December 31, 2025 and 2024, filed on SEDAR+ at www.sedarplus.ca, EDGAR at www.sec.gov and on OR Royalties' website at www.ORroyalties.com. The accounting policies, methods of computation and presentation applied in the consolidated financial statements are consistent with those of the previous financial year.
Change in presentation currency
During the year ended December 31, 2024, the Company elected to change its presentation currency from Canadian dollars ("C$") to U.S. dollars. The change in presentation currency is to improve investors and other stakeholders' ability to compare the Company's financial results with other precious metals royalty and streaming companies, who mostly report their results in U.S. dollars.
In accordance with IAS 8, Accounting Policies, Changes in Accounting Estimates and Errors, this change in presentation currency was applied retrospectively as if the new presentation currency had always been the Company's presentation currency.
Accounting standards issued but not yet effective
The Company has not yet adopted certain standards, interpretations to existing standards and amendments which have been issued but have an effective date of later than December 31, 2025. These standards, interpretations to existing standards and amendments, other than IFRS 18 Presentation and Disclosure in Financial Statements and the amendments to IFRS 9 Financial Instruments and IFRS 7 Financial Instruments: Disclosures, which are presented below, are not expected to have any significant impact on the Company or are not considered material and are therefore not discussed herein.
IFRS 18 Presentation and Disclosure in Financial Statements
In April 2024, the IASB issued IFRS 18, the new standard on presentation and disclosure in financial statements, with a focus on updates to the statement of profit or loss. IFRS 18 was issued in response to investors' concerns about the comparability and transparency of entities' performance reporting. The new requirements introduced in IFRS 18 will help to achieve comparability of the financial performance of similar entities, especially related to how 'operating profit or loss' is defined. The new disclosures required for some management-defined performance measures will also enhance transparency. The key new concepts introduced in IFRS 18 relate to:
IFRS 18 will replace IAS 1; many of the other existing principles in IAS 1 are retained, with limited changes. IFRS 18 will not impact the recognition or measurement of items in the financial statements, but it might change what an entity reports as its 'operating profit or loss'.
IFRS 18 will apply for reporting periods beginning on or after January 1, 2027 and also applies to comparative information. Management is currently assessing the impact of the new standard on its consolidated financial statements.
| OR Royalties Inc. 2025 – Annual Report |
Management’s Discussion and Analysis |
Amendments - IFRS 9 Financial Instruments and IFRS 7 Financial Instruments: Disclosures
On May 30, 2024, the IASB issued targeted amendments to IFRS 9 and IFRS 7, which respond to recent questions arising in practice. The amendments were issued to:
The new requirements will apply from January 1, 2026, with early application permitted. These amendments are not expected to have a significant impact on the consolidated financial statements.
Critical Accounting Estimates and Significant Judgements
The preparation of consolidated financial statements in conformity with IFRS Accounting Standards requires the Company to make estimates and assumptions that affect the reported amounts of assets and liabilities and disclosure of contingent assets and liabilities at the date of the financial statements and the reported amounts of revenues and expenses during the reporting period. The Company also makes estimates and assumptions concerning the future. The critical accounting estimates and assumptions as well as significant judgements in applying the Company's accounting policies are detailed in the notes to the audited consolidated financial statements for the years ended December 31, 2025 and 2024, filed on SEDAR+ at www.sedarplus.ca, EDGAR at www.sec.gov and on OR Royalties' website at www.ORroyalties.com.
Financial Instruments
All financial instruments are required to be measured at fair value on initial recognition. The fair value is based on quoted market prices, unless the financial instruments are not traded in an active market. In this case, the fair value is determined by using valuation techniques like discounted cash flows, the Black-Scholes option pricing model or other valuation techniques. Measurement in subsequent periods depends on the classification of the financial instrument. A description of financial instruments and their fair value is included in the notes to the audited consolidated financial statements for the years ended December 31, 2025 and 2024, filed on SEDAR+ at www.sedarplus.ca, EDGAR at www.sec.gov and on OR Royalties' website at www.ORroyalties.com.
Technical Information
The scientific and technical information contained in this MD&A has been reviewed and approved by Mr. Guy Desharnais, Ph.D., P.Geo, Vice President, Project Evaluation at OR Royalties, who is a "Qualified Person" ("QP") as defined in National Instrument 43-101 - Standards of Disclosure for Mineral Projects.
| OR Royalties Inc. 2025 – Annual Report |
Management’s Discussion and Analysis |
Non-IFRS Financial Performance Measures
Cash margin (in dollars and in percentage of revenues)
Cash margin in dollars and in percentage of revenues are non-IFRS financial measures. Cash margin (in dollars) is defined by OR Royalties as revenues less cost of sales (excluding depletion). Cash margin (in percentage of revenues) is obtained from the cash margin (in dollars) divided by revenues.
Management uses cash margin in dollars and in percentage of revenues to evaluate OR Royalties' ability to generate positive cash flow from its royalty, stream and other interests. Management and certain investors also use this information, together with measures determined in accordance with IFRS Accounting Standards such as gross profit and operating cash flows, to evaluate OR Royalties' performance relative to peers in the mining industry who present these measures on a similar basis. Cash margin in dollars and in percentage of revenues are only intended to provide additional information to investors and analysts and should not be considered in isolation or as a substitute for measures of performance prepared in accordance with IFRS Accounting Standards. They do not have any standardized meaning under IFRS Accounting Standards and may not be comparable to similar measures presented by other issuers.
Reconciliations of the cash margin per type of interests (in dollars and in percentage of revenues) are presented under the Overview of Annual Financial Results and the Fourth Quarterly Results sections of this MD&A.
Adjusted earnings and adjusted earnings per basic share
Adjusted earnings and adjusted earnings per basic share are non-IFRS financial measures and are defined by OR Royalties by excluding the following items from net earnings (loss) and net earnings (loss) per share: foreign exchange gains (losses), impairment charges and reversals related to royalty, stream and other interests, changes in allowance for expected credit losses, write-offs and impairments of investments, gains (losses) on disposal of assets, gains (losses) on investments, share of income (loss) of associates, transaction costs and other items such as non-cash gains (losses), as well as the impact of income taxes on these items. Adjusted earnings per basic share is obtained from the adjusted earnings divided by the weighted average number of common shares outstanding for the period.
Management uses adjusted earnings and adjusted earnings per basic share to evaluate the underlying operating performance of OR Royalties as a whole for the reporting periods presented, to assist with the planning and forecasting of future operating results, and to supplement information in its consolidated financial statements. Management believes that in addition to measures prepared in accordance with IFRS Accounting Standards such as net earnings (loss) and net earnings (loss) per basic share, investors and analysts use adjusted earnings and adjusted earnings per basic share to evaluate the results of the underlying business of OR Royalties, particularly since the excluded items are typically not included in OR Royalties' annual guidance. While the adjustments to net earnings (loss) and net earnings (loss) per basic share in these measures include items that are both recurring and non-recurring, management believes that adjusted earnings and adjusted net earnings per basic share are useful measures of OR Royalties' performance because they adjust for items which may not relate to or have a disproportionate effect on the period in which they are recognized, impact the comparability of the core operating results from period to period, are not always reflective of the underlying operating performance of the business and/or are not necessarily indicative of future operating results. Adjusted net earnings and adjusted net earnings per basic share are intended to provide additional information to investors and analysts and should not be considered in isolation or as a substitute for measures of performance prepared in accordance with IFRS Accounting Standards. They do not have any standardized meaning under IFRS Accounting Standards and may not be comparable to similar measures presented by other issuers.
| OR Royalties Inc. 2025 – Annual Report |
Management’s Discussion and Analysis |
A reconciliation of net earnings to adjusted net earnings is presented below:
| Three months ended December 31, |
Year ended December 31, |
|||||||||||
| 2025 | 2024 | 2025 | 2024 | |||||||||
| (in thousands of dollars, except per share amounts) |
$ | $ | $ | $ | ||||||||
| Net earnings | 65,245 | 7,105 | 206,088 | 16,267 | ||||||||
| Adjustments: | ||||||||||||
| Impairment of royalty, stream and other interests | - | - | 5,495 | 49,558 | ||||||||
| Foreign exchange loss (gain) | 480 | 1,771 | (645 | ) | 4,424 | |||||||
| Share of loss of associates | - | 9,491 | 14,178 | 30,025 | ||||||||
| Changes in allowance for expected credit losses and write-offs | - | - | - | (1,399 | ) | |||||||
| (Gain) loss on investments | (5,681 | ) | 11,322 | (5,315 | ) | 11,319 | ||||||
| Gain on deemed disposal of an associate | - | - | (54,439 | ) | - | |||||||
| Reclassification of accumulated other comprehensive loss to the statement of income on the deemed disposal of an associate | - | - | 1,147 | - | ||||||||
| Tax impact of adjustments | (446 | ) | 164 | (1,032 | ) | (12,920 | ) | |||||
| Adjusted earnings | 59,598 | 29,853 | 165,477 | 97,274 | ||||||||
| Weighted average number of common shares outstanding (000's) | 188,050 | 186,747 | 187,775 | 186,290 | ||||||||
| Adjusted earnings per basic share | 0.32 | 0.16 | 0.88 | 0.52 | ||||||||
| OR Royalties Inc. 2025 – Annual Report |
Management’s Discussion and Analysis |
Forward-Looking Statements
Certain statements contained in this MD&A may be deemed "forward-looking statements" within the meaning of the United States Private Securities Litigation Reform Act of 1995 and "forward-looking information" within the meaning of applicable Canadian securities legislation. Forward-looking statements are statements other than statements of historical fact, that address, without limitation, future events, production estimates of OR Royalties' assets (including increase of production), the 2026 guidance on GEOs and cash margin and the 5-year outlook on GEOs included under "Guidance for 2026 and 5-Year Outlook" and other guidance based on disclosure from operators, OR Royalties' ability to continue to promote environmental stewardship, to support employees and communities and to achieve excellence in governance and oversight, timely developments of mining properties over which OR Royalties has royalties, streams, offtakes and investments, management's expectations regarding OR Royalties' growth, results of operations, estimated future revenues, production costs, carrying value of assets, ability to continue to pay dividend, requirements for additional capital, business prospects and opportunities, future demand for and fluctuation of prices of commodities (including outlook on gold, silver, diamonds, other commodities) currency, markets and general market conditions. In addition, statements and estimates (including data in tables) relating to mineral reserves and resources and statements and guidance as to gold equivalent ounces are forward-looking statements, as they involve implied assessment, based on certain estimates and assumptions, including the assumptions set out under "Guidance for 2026 and 5-Year Outlook", and no assurance can be given that the estimates or related guidance will be realized. Forward-looking statements are generally, but not always, identified by the words "expects", "plans", "anticipates", "believes", "intends", "estimates", "projects", "potential", "scheduled" and similar expressions or variations (including negative variations), or by statements that events or conditions "will", "would", "may", "could" or "should" occur. Forward-looking statements are subject to known and unknown risks, uncertainties and other factors, most of which are beyond the control of OR Royalties, and actual results may accordingly differ materially from those in forward-looking statements. Such risk factors include, without limitation, (i) with respect to properties in which OR Royalties holds a royalty, stream or other interest; risks related to: (a) the operators of the properties, (b) timely development, permitting, construction, commencement of production, ramp-up (including operating and technical challenges), (c) differences in rate and timing of production from resource estimates or production forecasts by operators, (d) differences in conversion rate from resources to reserves and ability to replace resources, (e) the unfavorable outcome of any challenges or litigation relating to title, permit or license, (f) hazards and uncertainty associated with the business of exploring, development and mining including, but not limited to unusual or unexpected geological and metallurgical conditions, slope failures or cave-ins, flooding and other natural disasters or civil unrest or other uninsured risks; (ii) with respect to other external factors: (a) fluctuations in the prices of the commodities that drive royalties, streams, offtakes and investments held by OR Royalties, (b) a trade war or new tariff barriers, (c) fluctuations in the value of the Canadian dollar relative to the U.S. dollar, (d) regulatory changes by national and local governments, including permitting and licensing regimes and taxation policies, regulations and political or economic developments in any of the countries where properties in which OR Royalties holds a royalty, stream or other interest are located or through which they are held, (e) continued availability of capital and financing to OR Royalties or the operators of properties, and general economic, market or business conditions, and (f) responses of relevant governments to infectious diseases outbreaks and the effectiveness of such response and the potential impact of such outbreaks on OR Royalties' business, operations and financial condition; (g) impact related to climate changes or technologies which may affect the implementation of OR Royalties' climate strategy and achievement of carbon neutrality, that criteria will continue to be met to achieve improved ESG ratings, that actual facts may significantly differs from hypothesis used in any assessment scenario analysis (iii) with respect to internal factors: (a) business opportunities that may or not become available to, or are pursued by OR Royalties, (b) the integration of acquired assets (c) the determination of OR Royalties' Passive Foreign Investment Company ("PFIC") status (d) OR Royalties' ability to deliver on its climate strategy, that OR Royalties' efforts in maintaining carbon neutrality will be achieved and that any efforts toward reducing OR Royalties' carbon emission or to support decarbonization efforts of OR Royalties' partners will be successful, or (e) the availability of funds to finance community investments. The forward-looking statements contained in this MD&A are based upon assumptions management believes to be reasonable, including, without limitation: the absence of significant change in the Company's ongoing income and assets relating to determination of its PFIC status; the absence of any other factors that could cause actions, events or results to differ from those anticipated, estimated or intended, OR Royalties' continued commitment toward improving sustainability goals, the continued validity of science and reasonableness of hypothesis relating to climate change and assessment scenario analysis, the absence of material changes to the regulatory framework relating to climate and climate related disclosure, the compliance by directors and employees to the corporate policies, the availability of funds to continue to support community investments and, with respect to properties in which OR Royalties holds a royalty, stream or other interest, (i) the ongoing operation of the properties by the owners or operators of such properties in a manner consistent with past practice and with public disclosure (including forecast of production), (ii) the accuracy of public statements and disclosures made by the owners or operators of such underlying properties (including expectations for the development of underlying properties that are not yet in production), (iii) no adverse development in respect of any significant property, (iv) that statements and estimates relating to mineral reserves and resources by owners and operators are accurate and (v) the implementation of an adequate plan for integration of acquired assets. All forward-looking statements contained in this Report are expressly qualified in their entirety by the cautionary statements contained or referred to in this section.
| OR Royalties Inc. 2025 – Annual Report |
Management’s Discussion and Analysis |
For additional information on risks, uncertainties and assumptions, please refer to the most recent Annual Information Form of OR Royalties filed on SEDAR+ at www.sedarplus.ca and EDGAR at www.sec.gov which also provides additional general assumptions in connection with these statements. OR Royalties cautions that the foregoing list of risk and uncertainties is not exhaustive. Investors and others should carefully consider the above factors as well as the uncertainties they represent and the risk they entail. OR Royalties believes that the assumptions reflected in those forward-looking statements are reasonable, but no assurance can be given that these expectations will prove to be accurate as actual results and prospective events could materially differ from those anticipated such the forward-looking statements and such forward-looking statements included in this MD&A are not guarantee of future performance and should not be unduly relied upon. In this MD&A, OR Royalties relies on information publicly disclosed by other issuers and third-parties pertaining to its assets and, therefore, assumes no liability for such third-party public disclosure. This MD&A includes website addresses and references to additional materials found on those websites. These websites and information contained on or accessible through these websites are not incorporated by reference into, and do not form a part of, this MD&A or any other report or document filed by OR Royalties with the Canadian securities regulators or the SEC, and any references to any websites are intended to be inactive textual references only. These statements speak only as of the date of this MD&A. OR Royalties undertakes no obligation to publicly update or revise any forward-looking statements, whether as a result of new information, future events or otherwise, other than as required by applicable law.
Cautionary Note to U.S. Investors Regarding the Use of Mineral Reserve and Mineral Resource Estimates
OR Royalties is subject to the reporting requirements of the applicable Canadian securities laws, and as a result, reports its mineral resources and reserves according to Canadian standards. Canadian reporting requirements for disclosure of mineral properties are governed by National Instrument 43-101 ("NI 43-101"). The definitions of NI 43-101 are adopted from those described by the Canadian Institute of Mining, Metallurgy and Petroleum ("CIM"). In a number of cases OR Royalties has disclosed resource and reserve estimates covering properties related to the mining assets that are not based on CIM definitions, but instead have been prepared in reliance upon JORC and S-K 1300 (collectively, the "Acceptable Foreign Codes"). Estimates based on Acceptable Foreign Codes are recognized under NI 43-101 in certain circumstances. New mining disclosure rules under Subpart 1300 of Regulation S-K ("S-K 1300") became mandatory for U.S. reporting companies beginning with the first fiscal year commencing on or after January 1, 2021. CIM definitions are not identical to those of the Acceptable Foreign Codes, the resource and reserve definitions and categories are substantively the same as the CIM definitions mandated in NI 43-101 and will typically result in reporting of substantially similar reserve and resource estimates. Nonetheless, readers are cautioned that there are differences between the terms and definitions of the CIM and the Acceptable Foreign Codes, and there is no assurance that mineral reserves or mineral resources would be identical had the owner or operator prepared the reserve or resource estimates under another code. As such, certain information contained in this MD&A concerning descriptions of mineralization and estimates of mineral reserves and mineral resources under Canadian standards is not comparable to similar information made public by United States companies subject to the S-K 1300. Readers are cautioned not to assume that all or any part of Measured Mineral Resources or Indicated Mineral Resources will ever be converted into Mineral Reserves. Readers are also cautioned not to assume that all or any part of an Inferred Mineral Resource exists, or is economically or legally mineable. Further, an "Inferred Mineral Resource" has a great amount of uncertainty as to its existence and as to its economic and legal feasibility, and a reader cannot assume that all or any part of an Inferred Mineral Resource will ever be upgraded to a higher category. Under Canadian rules, estimates of Inferred Mineral Resources may not form the basis of feasibility or other economic studies.
| OR Royalties Inc. 2025 – Annual Report |
Management’s Discussion and Analysis |
Corporate Information
| OR Royalties Inc. - Head Office | OR Royalties International Ltd. |
| 1100 av. des Canadiens-de-Montréal | Cumberland House |
| Suite 300 | 1 Victoria Street |
| Montréal, Québec, Canada H3B 2S2 | Hamilton HM11 |
| Tel.: (514) 940-0670 | Bermuda |
| Fax: (514) 940-0669 | Tel.: (441) 824-7474 |
| Email: info@ORroyalties.com | Fax: (441) 292-6140 |
| Web site: www.ORroyalties.com | Michael Spencer, President Brendan Pidcock, Vice President, Technical Services |
| OR Royalties Inc. - Toronto Office | |
| 100 King Street West | |
| Suite 5710 | |
| Toronto, Ontario, Canada M5X 1K1 | |
| Directors | Officers |
| Norman MacDonald, Chair | Jason Attew, President and Chief Executive Officer |
| Jason Attew, President and Chief Executive Officer | Guy Desharnais, Vice President, Project Evaluation |
| Edie Hofmeister | Iain Farmer, Vice President, Corporate Development |
| Pierre Labbé | André Le Bel, Vice President, Legal Affairs and |
| Wendy Louie | Corporate Secretary |
| Candace MacGibbon | Grant Moenting, Vice President, Capital Markets |
| David Smith | Frédéric Ruel, Vice President, Finance and Chief |
| Kevin Thomson | Financial Officer |
| Heather Taylor, Vice President, Sustainability and Communications |
|
| Qualified Person (as defined by NI 43-101) | |
| Guy Desharnais, Ph.D., P.Geo, Vice-President, Project Evaluation | |
Exchange listings - common shares
Toronto Stock Exchange: OR
New York Stock Exchange: OR
Dividend Reinvestment Plan
Information available at https://ORroyalties.com/dividends/drip/
Transfer Agents
Canada: TSX Trust Company (Canada)
United States of America: American Stock Transfer & Trust Company, LLC
Auditors
PricewaterhouseCoopers LLP1