
UNITED STATES
SECURITIES AND EXCHANGE COMMISSION
WASHINGTON, D.C. 20549
FORM N-CSR
CERTIFIED SHAREHOLDER REPORT OF REGISTERED
MANAGEMENT INVESTMENT COMPANIES
811-23016
(Investment Company Act file number)
Alternative Credit Income Fund
(Exact name of Registrant as specified in charter)
650 Madison Avenue, 3rd Floor
New York, NY 10022
(Address of principal executive offices) (Zip code)
The Corporation Trust Company
Corporation Trust Center, 1209 Orange Street
Wilmington, DE 19801
(Name and address of agent for service)
Registrant’s telephone number, including area code: (212) 891-2880
Date of fiscal year end: September 30
Date of reporting period: October 1, 2024– March 31, 2025
Item 1. Reports to Stockholders.
| (a) |
TABLE OF CONTENTS
| Shareholder Letter | 1 |
| Portfolio Update | 15 |
| Consolidated Schedule of Investments | 17 |
| Consolidated Statement of Assets and Liabilities | 24 |
| Consolidated Statement of Operations | 25 |
| Consolidated Statements of Changes in Net Assets | 26 |
| Consolidated Statement of Cash Flows | 28 |
| Financial Highlights | |
| Class A | 29 |
| Class C | 30 |
| Class W | 31 |
| Class I | 32 |
| Class L | 33 |
| Notes to Consolidated Financial Statements | 34 |
| Additional Information | 47 |
| Privacy Notice | 49 |

| Alternative Credit Income Fund | Shareholder Letter |
March 31, 2025 (Unaudited)
Dear Shareholders:
We are pleased to share this semi-annual letter for the Alternative Credit Income Fund (ticker: RCIIX) for six months ended March 31, 2025.
The Fund posted a total net return of -0.42% in the periodi, compared with Bank of America U.S. High Yield Index +1.1% and Morningstar LSTA Leveraged Loan Index of 2.76%.1
The fund's long-term performance --nearing ten years --handily outpaces fixed income benchmarks:
Cumulative returns RCIIX vs. Fixed Income Benchmarks
| Alternative Credit Income Fund (RCIIX) ii | 77.1% |
| Barclay's U.S. Aggregate Total Return Value Index iii | 15.5% |
| Morningstar / LSTA Loan Total Return Index iv | 63.8% |
| Bank of America High-Yield Index v | 65.3% |
Source: Bloomberg. Total return from 10/27/2015 through March 31, 2025
As discussed below, performance had been impacted by—with the trade war looming— the unexpected bankruptcy of Jo-Ann Stores (“JOAN”) as well as declines in loans backing cyber-security software company, Invanti.2
For JOAN, we are hopeful recovery will exceed our current mark. Separately, Invanti recently announced a capital market transaction that we believe will provide the capital and runway for recovery.
As a notable positive, we highlight that the Credit Income Fund paid a special distribution to our shareholders in the period. We emphasize that this income overage stemmed from outearning our dividend (not from realized or unrealized gains) and that the Fund remained largely unlevered throughout the six-month period (absent a modest currency hedge).
Before diving deeper into the Fund, however, we wanted to level-set our partners on how we view the broader macro environment. As always, we begin with our investment “Concerns”.
Macro Backdrop: The Concerning
Uncertainty Reigns
Investors have confronted near tragicomic uncertainty in early 2025 as policy shifts have threatened to unwind global trading patterns and security alliances. The resulting market selloff has witnessed a nuanced, but nevertheless potentially seismic, event—the decline of the U.S. dollar.
We believe, historically (and logically) the U.S. dollar should rise from tariffs as fewer purchases of overseas goods lowers demand for foreign currency. Additionally, the U.S. dollars has historically served as a haven during market turmoil as investors seek shelter. After the announcement of sweeping levies against Canada, China and Mexico in early March—prompting a selloff in risk-assets—the U.S. dollar, ominously, fell to the lowest level since early December.
One abnormal market response does not make a trend. However, one could surmise the unexpected dollar decline reflects dented confidence in the United States’ continued market leadership, broadly, and the U.S. dollar, in particular—both cornerstone of the world economy since Bretton Woods.
| 1 | Bloomberg, Bank of America U.S. High Yield (H0A0), 09/30/2024 – 03/31/2025, Total Return of 1.10% and Morningstar LSTA US Leveraged Loan TR (SPBDALB), 09/30/2024 – 03/31/2025, Total Return of 2.76%. |
All performance data is annualized and is reported net of the Fund's fees and expenses. You cannot invest directly in an index. Past performance benefited from an advantageous inception date for the Fund's strategy, as well as an outsized allocation to deeply discounted assets purchased from distressed sellers. The Fund's performance may differ substantially from the performance of an index. Because of these differences, the indices shown are not benchmarks, should not be relied upon as an accurate measure of comparison, and are shown only to present a comparison. There is no guarantee that such investment or market opportunities will repeat themselves in the future. Past performance does not guarantee future results and investment returns and principal value of the Fund will fluctuate so that shares, when redeemed, may be worth more or less than their original cost. Current performance may be higher or lower than the performance data quoted above. For performance information current to the most recent month-end, please call toll-free (833) 404-4103 or visit www.AltCIF.com.
| 2 | For a full list of Fund holdings please see schedule of investments included with this report. |
| Semi-Annual Report | March 31, 2025 | 1 |
| Alternative Credit Income Fund | Shareholder Letter |
March 31, 2025 (Unaudited)
This is not to suggest the potential emerging changes are unilaterally bad. As suggested by the chart below, U.S. manufacturing has been crushed by global trade:
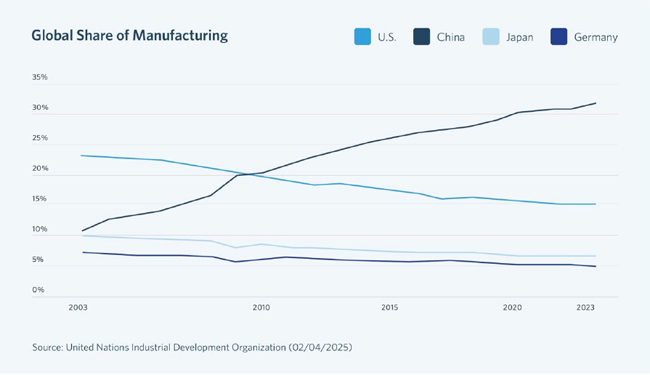
Source: United Nations Industrial Development Organization (02/04/2025)
The dollar’s haven-status has amplified the U.S. industrial demise by increasing the cost of exports.
| 2 | www.altcif.com |
| Alternative Credit Income Fund | Shareholder Letter |
March 31, 2025 (Unaudited)
Nevertheless, the era of free trade, dollar dominance and global security has yielded tremendous economic growth—much to the benefit of U.S. markets and investors, as highlighted in the following chart:
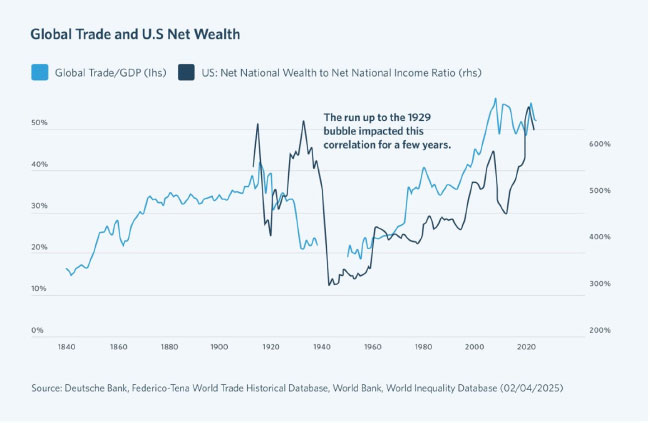
These benefits have broadly lifted U.S. prosperity but have yielded clear “winners” (e.g. investors) and “losers” (e.g. U.S. blue-collar workers). Trying to readdress this imbalance by re-ordering global trade could benefit U.S. manufacturing (in time), but it will likely be costly.
Lower margins from trade friction will weigh on valuations for many U.S. businesses—threatening the wealth effects our economy has become reliant. Plus, ending the era of “cheap stuff” will reduce discretionary spending by effectively taxing household income.
Beyond the big picture, the recent global unease will likely hinder near-term GDP.
At its core, doubt foments inactivity. Businesses will remain reluctant to make any meaningful capital spending if its source of raw materials and/or export markets remain unsettled. If the U.S. implement clear and specific tariffs, we believe businesses would plan accordingly. Publicly declaring levies, only to shortly thereafter announce their delay, has only prolonged the unknown.
Similarly, household consumption is fundamentally premised on confidence; choosing to spend today is based on optimism about tomorrow. Uncertainty can chill consumption, as reflected by the collapse of consumer sentiment data in recent weeks.
Adding to growth concerns, the potential for tariffs likely pulled forward purchases in the closing days of 2024, robbing GDP from early 2025.
With that backdrop and amid the current haze of uncertainty, we believe the U.S. will be lucky to escape 1H 2025 without a dramatic decline in GDP growth.
| Semi-Annual Report | March 31, 2025 | 3 |
| Alternative Credit Income Fund | Shareholder Letter |
March 31, 2025 (Unaudited)
Growth engine reversing gears
While headline numbers remain strong, the U.S. job market continues to reflect fractures.
As reflected below, 85% of recent payroll gains have stemmed from just three segments—government, education and healthcare:
Government and ‘education & health’ as % of payroll growth
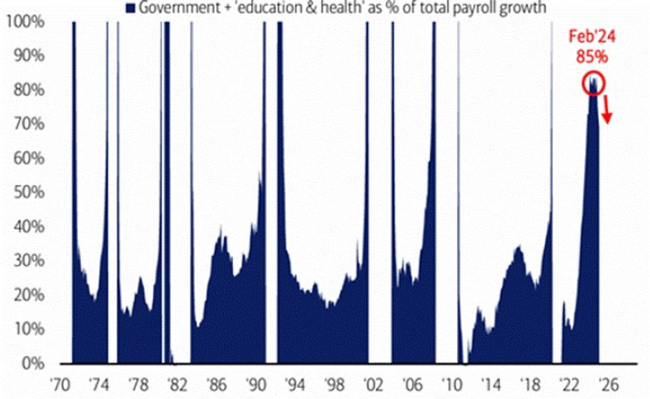
Source: BofA Global Investment Strategy, Bloomberg (03/03/2025)
With government workers getting DOGE’d, the U.S. Department of Education threatened with closure and Medicaid in the crosshairs, the sectors that once drove job growth, will likely now drive job losses. Further, data from placement firm Challenger, Gray & Christmas showed that planned layoffs increased 245% in February 2025, levels not seen since the last two recessions.3
Relatedly, many U.S. businesses have begun clamping down on remote work, with Amazon, Dell and Washington Post (among others) having announced stricter office mandates;4 JP Morgan’s Jamie Dimon captured frontpage news for his strident anti-WFH commentary.
We believe back-to-office provide businesses a backdoor for shrinking their workforce (though “elective attrition”) and therefore further reflects labor market deterioration.
Shifting fiscal landscape
The U.S. economy/markets have catapulted past global peers in recent years, in part, due to the (astonishing) $5.6T of tax cuts and spending programs unleashed in the pandemic. However, with debt-to-GDP ratios now at precarious levels (despite a heretofore strong economy) and the administration promising belt tightening, the U.S. fiscal impulse appears to be fading.
The mantle may be tilting to Europe.
The forces that have driven the post-war German economy (cheap Russian natural gas, Chinese demand for goods and U.S. military security) have simultaneously vanished. The resulting economic malaise (with consecutive years of negative GDP) and increased security concerns (amid the United State wavering commitment to Ukraine), may prompt dramatic change.
In recent weeks, Germany has taken steps to lift its constitutional “debt brake” (implemented under Angela Merkel, but whose psychological roots trace to the Weimar Republic), which limits structural deficit to 0.35% of GDP.5 Friedrich Merz, Germany’s next chancellor, announced plans for as much as €500bn of deficit spending for rearmament and infrastructure.
| 3 | Challenger Job-Cut Announcement, Reuters and LSEG Datastream (03/06/2025) |
| 4 | “An Update on Return to Office Policies As We Enter 2025,” Forbes, (12/12/2024) |
| 5 | Euro Strategy: Germany’s Major Fiscal Pivot, CreditSights (03/04/2025) |
| 4 | www.altcif.com |
| Alternative Credit Income Fund | Shareholder Letter |
March 31, 2025 (Unaudited)
In a world of large numbers, perspective can sometimes be challenging. To frame the capital significance of Merz’ proposal, €500bn represents roughly 11% of normal German GDP.6 The prospect of greater growth and greater debt issuance saw German bonds suffer their greatest sell-off since the 1990s.
Germany’s high savings rate (roughly 20.5% vs. 4.6% in the U.S.) could amplify the fiscal impact if optimism loosens household purse strings.7 Several other Euro nations have pledged greater defense spending as well. Plus, at some point, Ukraine will need to be rebuilt, likely on the back of other European balance sheets.
These changes across the pond could profoundly impact U.S. markets.
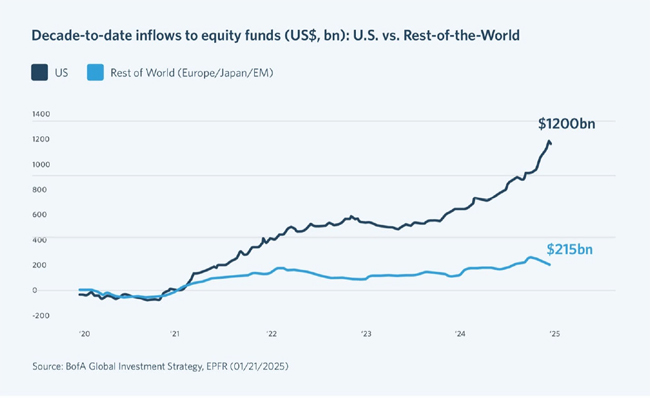
As starkly demonstrated below, amid otherwise languid global growth, the United States decade-to-date has enjoyed a wave of overseas capital into our equity markets:
| 6 | “Shifting Sands,” Alpine Macro (03/07/2025) |
| 7 | Euro Strategy: Germany’s Major Fiscal Pivot, CreditSights (03/04/2025) |
| Semi-Annual Report | March 31, 2025 | 5 |
| Alternative Credit Income Fund | Shareholder Letter |
March 31, 2025 (Unaudited)
These foreign inflows had helped lift the S&P 500 to multi-year highs:8
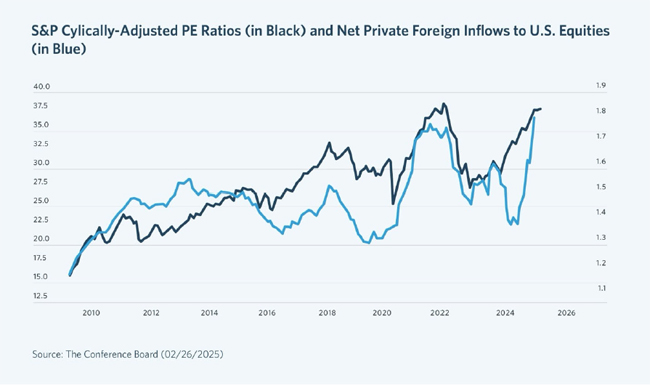
This international capital has amplified U.S. GDP through the flywheel of wealth effects.
A fiscal tilt to Europe could jeopardize this dynamic if economic growth prompts capital to flee U.S. markets (beset by uncertainty and high valuations) into lower priced overseas markets. Nationalist instincts could amplify this dynamic. Further, last year, a record number of European firms eschewed domestic exchanges to list on U.S. markets.9 We would envision this dynamic may reverse if (what we have previously characterized as) T.I.N.A. U. of A. unwinds.
Macro Backdrop: The Uncertain
Inflation and Rates: The $64,000 Question
Last quarter we noted that tariffs do not necessarily cause broad-based inflation due to changes in consumption, import substitution and FX response. However, we were remiss not to note that tariffs can (as we have seen in recent weeks) change inflation expectations.
Buffeted by tariff headlines (despite modest implementation), higher prices have seeped into the consciousness of U.S. consumers. Increasing egg prices, though wholly unrelated to tariffs, has contributed to this dynamic as grocery items are particularly salient; shoppers confront those prices daily (unlike a new car, for example).
| 8 | We noted that investors cannot invest direct in the S&P 500 Index. Additionally, PE Ratios refers to the ratio of price to earnings for the constituency of the S&P Index |
| 9 | PitchBook (02/02/2025) |
| 6 | www.altcif.com |
| Alternative Credit Income Fund | Shareholder Letter |
March 31, 2025 (Unaudited)
As shown below, inflation expectations have rocketed:
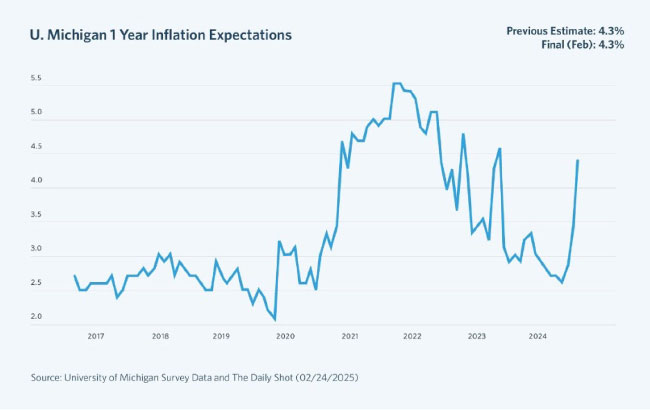
On-again, off-again tariffs further risks anchoring inflation by keeping the topic front of the news cycle.
The risk is clear. Whether real or perceived, inflation can mute economic activity by eroding consumer confidence. Tangentially, it can also provoke distrust of government institutions writ large, as evidenced by the global electorate punishing incumbents in recent year (i.e. Biden/Harris, Sunak, Trudeau).
Elevated inflation concerns and potential for sluggish GDP has surfaced the risk of Stagflation (the phenomena of higher prices and slower economic growth) as well.
Inflation can undermine GDP, but it nevertheless represents a solvable problem (albeit painfully). As Paul Volker demonstrated, higher rates can arrest higher prices, in time, by sacrificing aggregate demand.
Stagflation, however, is more pernicious because it can immobilize policy makers. Lowering rates (or fiscal stimulus) to jumpstart a lagging economy would only inflame higher prices, while rising rates (or tightening fiscal policy) would further drag GDP.
This backdrop decidedly complicates the interest rate outlook.
Nascent signs that the U.S. economy is losing steam, would seem to suggest the potential for rate cuts.10 Interestingly, the CME is pricing just 0.8% chance the Fed Fund’s rate remains at 4.25%-4.50% in December 2025.11
However, in our view, the bar for lowering rates will be high due to inflation expectations. Additionally, the diminished growth outlook has arguably been self-induced—driven by policy versus fundamental degradation. The Fed therefore may be reticent to respond to potentially transitory factors.
| 10 | Bloomberg, U.S. Generic Government 10 Year Index |
| 11 | CME Group FedWatch Tool (03/10/2025) |
| Semi-Annual Report | March 31, 2025 | 7 |
| Alternative Credit Income Fund | Shareholder Letter |
March 31, 2025 (Unaudited)
Arguably, 1Q 2025 may represent peak uncertainty as the market adjusts to the new administration and therefore recession and inflation concerns may soon fade. For now, we expect the Fed will be stuck in place.
Macro Backdrop: The Good
CAPEX Bacchanal
As well documented and evidenced below, U.S. mega-caps plan to ramp capex significantly in 2025, largely related to all things-AI:
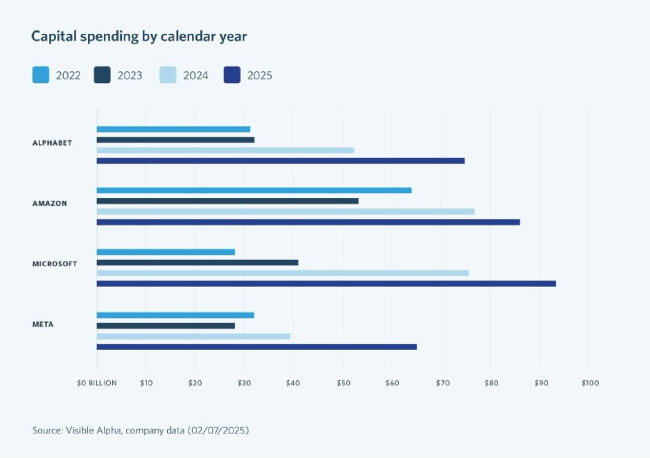
History demonstrates that emerging technologies represent a thin reed for markets to attach its hopes. That said, however long the current mania lasts, we believe AI will boost our economy through outsized capital investments and by lifting market values.
Further, even after the bubble pops, these AI enterprises will have built infrastructure that will hopefully accrue to the long-term benefit of our economy.
For instance, the U.S. overallocated to housing in the run-up to 2008. Much of the equity and some of debt got wiped out in the downturn, but the housing stock remained. Imagine how much worse the U.S. housing situation would be without the pre-GFC overbuild.
Any potential AI overinvestment will hopefully follow a similar path. Most companies will likely go bust, but, in time, the data centers, power generation and computing power will find productive uses.
As a final (tangential) thought on AI, Big Tech has gained spectacular wealth and influence in recent decades–perhaps broadly stifling competition. We would highlight that the U.S. government dismantled AT&T in 1984 on anti-competition ground. At its peak, AT&T commanded a $60bn market cap, or roughly $150bn in today’s dollars.12 Meanwhile, Apple eclipsed a once unfathomable $4T market cap in 2024.
| 12 | Parmy Olson, Supremacy: AI, ChatGPT and the Race That Will Change the World, St. Martin Press, New York (2024) |
| 8 | www.altcif.com |
| Alternative Credit Income Fund | Shareholder Letter |
March 31, 2025 (Unaudited)
An unintended consequence of Big Tech dominance, however, may have yielded the U.S. an edge in the artificial intelligence race. U.S. Mega tech’s monopoly-esque rents now provide a seemingly bottomless war-chest for private-sector AI investment, which, given the industry’s potential winner-take-all dynamics and the (purported) gains of DeepSeek, motivates them to spend.
Productivity Boost
The uptick in U.S. productivity represents another clear economic positive.
U.S. Labor Productivity increased for the ninth consecutive quarter in 4Q 2024 and annual productivity increased at that highest pace in 14 years (ex. COVID) in 2024:
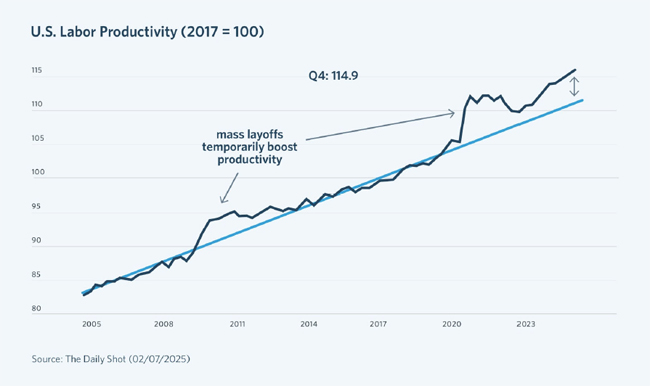
Source: The Daily Shot (02/07/2025)
It would be too early to attribute this leap to AI and more likely reflect two other COVID-related phenomena.
As noted earlier, the normalization of remote work has expanded the size the U.S. workforce. Additionally, difficulties in hiring during the pandemic prompted investment in labor-saving technologies (e.g. plant automation, kiosks at fast food), which have bolstered efficiency.
The recent productivity lift echoes the dot.com era where economic efficiency helped forestall inflation even as the economy roared, enabling Chairman Greenspan to keep interest rates flat.
If the current market regains its footing, this post-pandemic uplift would combat inflation and potentially contribute to the reemergence of the “higher for longer” rate outlook.
The Opportunity: Seek Shelter
Darkening equity outlook
We believe the shifting macro backdrop paints an ominous tableau for equity returns.
Again, reorienting supply chains will come at a cost: either businesses or households will be burdened with added expense. We believe that either path hurts markets.
| Semi-Annual Report | March 31, 2025 | 9 |
| Alternative Credit Income Fund | Shareholder Letter |
March 31, 2025 (Unaudited)
Further, pulling apart NATO would undermine the stability that has enabled post-war growth. Stability is indispensable for economic gains.
In the near-term, a muted U.S. fiscal outlook, waning consumer confidence and (potentially) resurgent Europe could reverse key factors that have propelled the United State’s post-COVID economy/markets.
Additionally, money plowed into equities immediately post-election ($140bn in January 2024 alone). Should the administration further signal that “growth” is not paramount, these dollars could cascade out of the market.
Finally, post-GFC, the Fed has seemed to step-in to quell market turmoil despite largely healthy economic conditions—with 2019 providing the most poignant example. After a sudden equity selloff in 4Q 2018, the Fed cut interest rates three times despite little sign of economic deterioration.
Low inflation has been the lodestone for this “Fed put.” However, the days of slashing rates with impunity may have died in COVID, limiting the Fed’s ability to intervene in the next downturn, which could accelerate a future selloff.
The Fed put is lower than the market believes, in our view.
Compelling Relative Value
After consecutive years of +20% returns, the earnings yield of the S&P 500 is hovering around 3.45%;13 this yield would further compress should earnings falter.
Stretched valuation amid an unsettled environment screams for investors to crystalize equity gains to increase their credit allocation. Credit will, in our view, provide greater absolute returns for investors while also muting future volatility.
High Yield spreads have backed up roughly ~150 basis points in 2025, but at roughly 454 basis points over Treasuries, remain only modestly wide to historical median and far from compelling value, in our view.14 We concede that all-in yield of 8.2% (helped by high risk-free rates) can be alluring, but believe investors risk downside-volatility if slowing growth ratchets defaults. Plus, High Yield can get mauled in risk-off markets and our investors recognized the structural flaws of many traditional credit vehicles.
We feel the opportunity remains titled towards private markets.
| 13 | S&P Returns, Bloomberg. Earnings yield for 4Q 2024, Bloomberg as of (04/09/2025) |
| 14 | Bank of America High Yield Index Spread (H0A0), as of (04/22/2025) and Median U.S. High Yield Spread 412bps “Spreads Stock and Vol Lower IG>HY,” Morgan Stanley (04/21/2025) |
| 10 | www.altcif.com |
| Alternative Credit Income Fund | Shareholder Letter |
March 31, 2025 (Unaudited)
Candidly, heading into 2025, we had a modicum of concern that deregulation would awaken small- and-medium sized banks. However, as the chart below shows, banks have continued to tighten:
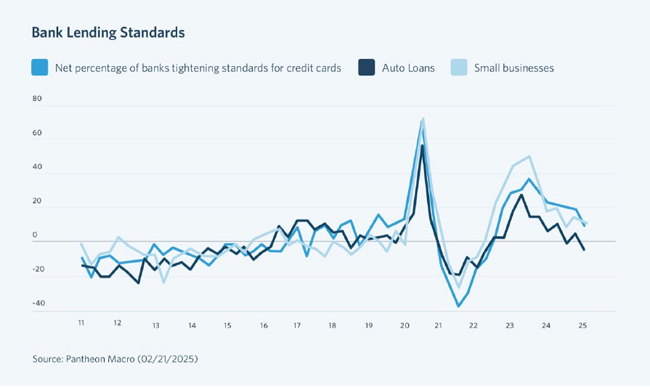
Growth risk will likely keep banks pinned to the sidelines.
We have said it before, and we will say it again: not all private credit solutions are the same. Much as there are growth and value equities that provide different attributes, there are different types of private credit.
As we’ve shared with our partners for years, the structure of the U.S. credit markets hinders potential returns. Unlike the equity markets, the credit space is dominated by monster firms and monster funds. There are limited returns to scale within fixed income. After a certain point, size can limit returns by hindering dexterity and shrinking the available universe.
This dynamic has recreated itself within private credit. The preponderance of capital in recent years has flowed to a handful of funds, whose size forces them to chase large opportunities. The backdrop will provide tough sledding for these strategies, in our view.
First, tight credits spreads enable fierce competition from the public market. Plus, private credit is no longer a new phenomenon and therefore the public markets have likely been picked over for “easy” private refinancing; adverse selection likely remains. Lastly, large and sponsor-based transactions require just that: transactions. Volatility and shifting macro dynamics will almost certainly chill deal activity, providing fewer opportunities for large cap private credit.
New Fund Investments
The Alternative Credit Income Fund continues to see a variety of opportunities in our wheelhouse of non-sponsor direct lending and specialty finance. Within specialty finance, the Fund recently provided financing to online content producer Pocket. Watch. The company repackages YouTube videos from its creators into 22 minute “shows” for broadcast on streaming platforms Prime and Hulu. Our facility contemplates a low-teen return for assuming Amazon and Hulu (majority owned by Disney) credit risk—arguably among the highest quality non-Sovereign counterparties in the world. Equipment-leasing and asset-backed lending remain a focus for the Alternative Credit Income Fund, as well. Within this private credit segment, active management and deal pipeline can unlock equity-like returns from 1st-dollar risk, we believe.
Further, these credits do not bear direct earnings risk. Even if a company “misses” on earnings, our investors collect our monthly lease payments. Should the company and/or market collapse (due to recession, trade war, etc.), equipment payments are typically the first-priority payment. Term Loan lenders may grant a forbearance, but a company needs to pay for critical equipment to keep its lights on. These payments are rarely interrupted in bankruptcy (to maintain estate value) and hard assets protect investors in the rare case of liquidation.
| Semi-Annual Report | March 31, 2025 | 11 |
| Alternative Credit Income Fund | Shareholder Letter |
March 31, 2025 (Unaudited)
We believe these are the risk/rewards investors should perhaps consider.
The Alternative Credit Income Fund recently purchased 60 Day vendor financing for Fulcrum U.S. Holdings, a Value Added Reseller (VAR) platform. This paper is both insured and enjoys “put rights” or the ability to sell back) to Fulcrum’s equity owners. Potential returns on this investment pencil to the context of 18-19% IRR—noteworthy in any market.
The last growth segment we would highlight is venture lending—also negatively correlated with the economy.
VC firms have been chasing all things AI, to the exclusion to nearly every segment, cooling valuations and capital availability for many growth businesses. Issuing equity in this backdrop has become punitively expensive, leading many firms to seek venture debt solutions.
These venture loans enjoy full collateralization and loan-to-values frequently 30% or lower from the last funding round. Yields typically begin in the mid-teens and with structured upside, total returns push into the high teens.
During the six-month period, the Fund invested in VertexOne, a software provider serving water, gas and electric utility companies; finding a more recession-resistant and trade-immune business would be challenging. Roughly 80% of revenue is recurring and VertexOne has greater than 100% net retention rates.
Finally, our deal benefits from tight covenants (requiring debt paydown sweeps), Board representation and significant equity cushion; we anticipate mid-teens returns with potential upside. We anticipate the potential for a deluge of opportunities if the economy slows.
Fund Specific Thoughts: Rocky out of the gate, but opportunity abounds
Again, the Fund suffered a disappointment in late 2024 and early 2025 with the restructuring of Jo-Ann Stores. With the trade war on the horizon, bank lenders throttled the company’s liquidity, impairing their ability to source peak seasonal inventory.
Long-time holders know that after the Credit Income Fund had previously purchased Jo-Ann Store loans in the 30s. In the pandemic, the company enjoyed a windfall from DIY mask-making, which enabled the company to repay its loans at par in late 2020.
We waded back to loans in the high 60s expecting the post-pandemic operating challenges would abate. Sadly, the drumbeat of trade conflict prompted the company’s demise. We hope our ultimate JOAN recovery will exceed our current mark.
Another detractor for the Fund in late 2024 / early 2025, had been loans of security software provider, Ivanti. The company’s loans slumped after suffering a cyberattack that temporarily disrupted its operations. Ivanti recently structured a capital solution (in which BC Partners participated) that will provide the company runway for recovery. We remain bullish on Ivanti and believe the recent “hack” will prove temporary.
Providing NAV “noise” during recent tariff-induce market volatility, public Business Development Companies (or “BDCs”) represent roughly 4.0% of our assets under management. Our shareholders know these assets can be notoriously volatile. We highlight the Fund has ratcheted down our BDC exposure to among the lowest in our history.
Investors, rightly, may ask why we own such (at times) fickle assets. Our answer is simple:
What is the biggest risk for funds? In our view, the answer is liquidity risk.
Funds go belly-up—and wealth is destroyed—if they are forced to sell assets in a downturn. A modest allocation to public BDCs helps reduce this (potentially ruinous) risk, in our view, and therefore justifies episodic NAV noise throughout a full cycle.
The Fund’s preferred holding in helmet manufacture Riddell gained 21.1% in the six-month period. We love this business’ monopolistic characteristics and (somewhat) jokingly refer to Riddell as a strategically important U.S. asset. Without Riddell, there is no football. Without football, life as we know it in the United States ceases to exist.
Kidding aside, we are in touch with management regarding the impact of tariffs. While levies remain a moving target, the company believes it has pricing power to offset potential higher raw material costs.
| 12 | www.altcif.com |
| Alternative Credit Income Fund | Shareholder Letter |
March 31, 2025 (Unaudited)
Other gainers include IT provider for the automarket, Autorola (+8.4%) as well as 1st Lien loans backing South Street Securities (+8.7%) on improved earnings—particularly in the company’s broker segment. Wrap-up: Amid the haze, the path is clear
Investors should never extrapolate long-term trends from a small amount of information. That said, the first several months of 2025 signal potential for dramatic shifts that could impact the U.S. economy. Markets are typically slow to react to big changes and then, often dramatically over-correct. Investors therefore have an incentive to move early.
Sluggish GDP and tempered equity gains seem increasingly like the base-case for 2025. Fortunately, this backdrop provides a straightforward path for investors: crystalize returns from the furious post-COVID equity rally and expand allocation to private solutions that will thrive amid a slowdown.
Should the market reaccelerate, “higher for longer” would return as market narrative, supporting continued high yield-based returns for our investors.
Lastly, we continue to highlight that, other than ~3.0% currency hedge, the Alternative Credit Income Fund remains unlevered. Because of that, the current market volatility, candidly, makes us extremely excited.
Our partners have seen how the Alternative Credit Income Fund has historically capitalized on unsettled markets. We aren’t there yet, but when the market-rolls over (roughly when credit spreads hit 800 basis points vs. ~450 basis points today), we will use that leverage to buy when the rest of the market is selling.
Many of our levered competitors may be unable to capitalize because they wasted their leverage in the “up” part of the cycle. We view this as a significant cost to their investors.
We are mindful that market turmoil often causes stress—and therefore we are mindful not to cheer the demise of others. Nevertheless, we have been anxiously awaiting a market reset that we believe may be long overdue. Our structure and strategy has been designed expressly with that backdrop in-mind.
Regards,
Michael Terwilliger, CFA
Portfolio Manager*
Alternative Credit Income Fund
| * | Effective October, 31, 2020, Sierra Crest Investment Management LLC (“Sierra Crest”) replaced Resource Alternative Advisor, LLC (“Resource”) as the Fund’s investment adviser. Michael Terwilliger has joined Sierra Crest as a portfolio manager to the Fund. |
| i | Fund performance refers to that of Class I. Reflects six-month returns through 03/31/2025. Past performance is not indicative of future results. The investment return and principal value of an investment will fluctuate. An investor’s shares when redeemed, may be worth more or less than the original cost. Total return is calculated assuming reinvestment of all dividends and distributions. Performance figures for periods less than one year are not annualized. For performance information current to the most recent month-end, please call toll-free 1-833-404-4103. The Adviser and the Fund have entered into an Expense Limitation Agreement under which the Adviser has agreed, until at least January 31, 2026 to waive its management fees (excluding any incentive fee) and to pay or absorb the ordinary annual operating expenses of the Fund (excluding incentive fees, all borrowing costs, dividends, amortization/accretion and interest on securities sold short, brokerage commissions, acquired fund fees and expenses and extraordinary expenses), to the extent that its management fees plus the Fund’s ordinary annual operating expenses exceed 2.34% per annum of the Fund’s average daily net assets attributable to Class I shares. Such Expense Limitation Agreement may not be terminated by the Adviser, but it may be terminated by the Board of Trustees, upon 60 days written notice to the Adviser. Any waiver or reimbursement by the Adviser is subject to repayment by the Fund within the three (3) years from the date the Adviser (or the previous investment adviser) waived any payment or reimbursed any expense, if the Fund is able to make the repayment without exceeding the lesser of the expense limitation in place at the time of the waiver or the current expense limitation and the repayment is approved by the Board of Trustees. See “Management of the Fund.” |
| ii | Fund performance refers to that of Class I. Reflects cumulative returns 10/29/2015 through 03/31/2025. Past performance is not indicative of future results. The investment return and principal value of an investment will fluctuate. An investor’s shares when redeemed, may be worth more or less than the original cost. Total return is calculated assuming reinvestment of all dividends and distributions. Performance figures for periods less than one year are not annualized. For performance information current to the most recent month-end, please call toll-free 1-833-404-4103. |
| iii | Barclays U.S. Aggregate Total Return Value Index – The Barclays U.S. Aggregate Total Return Value Index is a broad-based flagship benchmark that measures the investment grade, U.S. dollar-denominated, fixed-rate taxable bond market. The index includes Treasuries, government-related and corporate securities, MBS (agency fixed-rate and hybrid ARM pass-throughs), ABS and CMBS (agency and non-agency). Investors cannot invest directly in an index. Reflects cumulative return 10/28/2015 through 03/31/2025. |
| Semi-Annual Report | March 31, 2025 | 13 |
| Alternative Credit Income Fund | Shareholder Letter |
March 31, 2025 (Unaudited)
| iv | Morningstar LSTA US Leveraged Loan TR USD Index – The Morningstar LSTA US Leveraged Loan TR USD Index is a market value-weighted index designed to measure the performance of the U.S. leveraged loan market based upon market weightings, spreads and interest payments. Investors cannot invest directly in an index. Reflects cumulative return 10/28/2015 through 03/31/2025. |
| v | ICE BofA U.S. High Yield Index – The ICE BofA U.S. High Yield Index tracks the performance of US dollar denominated below investment grade corporate debt publicly issued in the U.S. domestic market. Investors cannot invest directly in an index. Reflects cumulative return 10/28/2015 through 03/31/2025. |
Important Information:
An investor should consider the investment objectives, risks, charges, and expenses of the Fund carefully before investing. To obtain a prospectus containing this and other information, please call (800) 806-9756 or download the file from www.AltCIF.com. Read the prospectus carefully before you invest.
The Fund is distributed by ALPS Distributors, Inc. (ALPS Distributors, Inc. 1290 Broadway, Suite 1100, Denver, CO 80203). Sierra Crest Investment Management, LLC (the Fund’s investment adviser), its affiliates, and ALPS Distributors, Inc. are not affiliated.
Investing involves risk. Investment return and principal value of an investment will fluctuate, and an investor’s shares, when redeemed, may be worth more or less than their original cost. Alternative investment funds, ETFs, interval funds, and closed-end funds are subject to management and other expenses, which will be indirectly paid by the Fund. Debt instruments are subject to credit risk and interest rate risk and may be subordinated to more senior debt instruments. Business Development Companies (BDCs) often use leverage to enhance returns and are subject to interest rate risk, credit risk, and liquidity risk. CLOs are debt instruments but also carry additional risks related to the complexity and leverage inherent in the CLO structure. The use of leverage, such as borrowing money to purchase securities, will cause the Fund to incur additional expenses and magnify the Fund’s gains or losses.
There currently is no secondary market for the Fund’s shares and the Fund expects that no secondary market will develop. Shares of the Fund will not be listed on any securities exchange, which makes them inherently illiquid. An investment in the Fund’s shares is not suitable for investors who cannot tolerate risk of loss or who require liquidity, other than the liquidity provided through the Fund’s repurchase policy. The Fund’s distributions policy may, under certain circumstances, have certain adverse consequences to the Fund and its shareholders because it may result in a return of capital, resulting in less of a shareholder’s assets being invested in the Fund, and, over time, increase the Fund’s expense ratio. Any invested capital that is returned to the shareholder will be reduced by the Fund’s fees and expenses, as well as the applicable sales load. Limited liquidity is provided to shareholders only through the Fund’s quarterly repurchase offers, regardless of how the Fund performs. Investments in lesser-known, small and medium capitalization companies may be more vulnerable than larger, more established organizations. The sales of securities to fund repurchases could reduce the market price of those securities, which in turn would reduce the Fund’s Net Asset Value (NAV).
An investment in the Fund’s shares is not suitable for investors who cannot tolerate risk of loss or who require liquidity, other than liquidity provided through the Fund’s repurchase policy.
The Fund’s distributions policy may, under certain circumstances, have certain adverse consequences to the Fund and its shareholders because it may result in a return of capital, resulting in less of a shareholder’s assets being invested in the Fund, and, over time, increase the Fund’s expense ratio.
| 14 | www.altcif.com |
| Alternative Credit Income Fund | Portfolio Update |
March 31, 2025 (Unaudited)
The Fund’s performance figures for the periods ended March 31, 2025, compared to its benchmark:
| Alternative Credit Income Fund | 1 Month | Quarter | 6 Month | YTD | 1 Year | 3 Year | 5 Year | Since Inception* | Inception |
| Class A Shares - Without Load | 0.17% | -0.79% | -0.51% | -0.79% | 3.64% | 1.78% | 8.77% | 5.65% | 4/17/15 |
| Class A Shares - With Load | -5.62% | -6.47% | -6.22% | -6.47% | -2.34% | -0.22% | 7.48% | 4.94% | 4/17/15 |
| Class C Shares - Without Load | 0.00% | -0.95% | -1.01% | -0.95% | 2.72% | 0.98% | 7.93% | 5.04% | 4/17/15 |
| Class C Shares - With Load(a) | -0.98% | -1.92% | -1.96% | -1.92% | 1.77% | 0.98% | 7.93% | 5.04% | 4/17/15 |
| Class W Shares - Without Load | 0.16% | -0.80% | -0.62% | -0.80% | 3.52% | 1.78% | 8.74% | 5.60% | 4/17/15 |
| Class I Shares - Without Load | 0.23% | -0.73% | -0.42% | -0.73% | 3.76% | 2.00% | 9.01% | 5.89% | 4/17/15 |
| Class L Shares - Without Load | 0.21% | -0.75% | -0.70% | -0.75% | 3.42% | 1.54% | 8.50% | 4.41% | 7/28/17 |
| Class L Shares - With Load | -4.02% | -5.00% | -4.91% | -5.00% | -1.00% | 0.09% | 7.57% | 3.82% | 7/28/17 |
| Morningstar LSTA US Leveraged Loan TR USD Index | -0.31% | 0.48% | 2.76% | 0.48% | 6.86% | 7.21% | 8.96% | 4.93% | 4/17/15 |
| * | Annualized total return |
| (a) | Effective as of December 23, 2016, Class C shares no longer have a sales charge. |
The Morningstar LSTA US Leveraged Loan TR USD Index is a market value-weighted index designed to measure the performance of the U.S. leveraged loan market based upon market weightings, spreads and interest payments. Investors cannot invest directly in an index.
Past performance is not indicative of future results. The investment return and principal value of an investment will fluctuate. An investor’s shares when redeemed, may be worth more or less than the original cost. Total return is calculated assuming reinvestment of all dividends and distributions. Performance figures for periods less than one year are not annualized. As of the Fund’s most recent prospectus dated January 28, 2025, the Fund’s total annual operating expenses, including acquired fund fees and expenses, before fee waivers is 5.21% for Class A, 5.99% for Class C, 5.26% for Class W, 5.07% for Class I and 5.56% for Class L shares. After fee waivers, the Fund’s total annual operating expense is 4.84% for Class A, 5.60% for Class C, 4.84% for Class W, 4.59% for Class I and 5.09% for Class L shares. Class A shares are subject to maximum sales loads of 5.75% imposed on purchases. Class L shares are subject to a maximum sales load of 4.25% imposed on purchases. Share repurchases within 365 days may be subject to an early withdrawal charge of 0.50% for Class A and 1.00% for Class C shares. For performance information current to the most recent month-end, please call toll-free 1-833-404-4103.
| Semi-Annual Report | March 31, 2025 | 15 |
| Alternative Credit Income Fund | Portfolio Update |
March 31, 2025 (Unaudited)
Comparison of the Change in Value of a $10,000 Investment
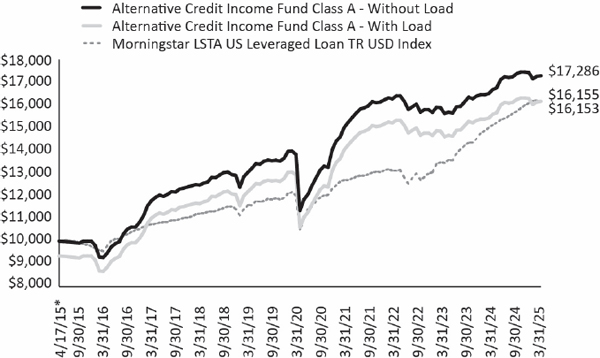
| * | Commencement of operations for Class A Shares. |
Consolidated Portfolio Composition as of March 31, 2025
| Asset Type | Percent of Net Assets |
| Bank Loans | 56.70% |
| Private Investment Funds | 18.38% |
| Common Equity | 9.55% |
| Asset Backed Securities | 3.93% |
| Short Term Investments | 3.70% |
| Preferred Stock | 3.57% |
| Corporate Bonds | 2.32% |
| Interval Fund | 2.02% |
| Equipment Financing | 0.57% |
| Warrants | 0.32% |
| Joint Venture | 0.19% |
| Total Investments | 101.25% |
| Liabilities in Excess of Other Assets | -1.25% |
| Net Assets | 100.00% |
Please see the Consolidated Schedule of Investments for a detailed listing of the Fund’s holdings.
| 16 | www.altcif.com |
| Alternative Credit Income Fund | Consolidated Schedule of Investments |
March 31, 2025 (Unaudited)
| Coupon | Reference Rate & Spread | Maturity | Principal | Value | ||||||||||||
| BANK LOANS (56.70%)(a)(b) | ||||||||||||||||
| Communication Services (2.68%) | ||||||||||||||||
| Next Flight Ventures, Delayed Draw Term Loan(c)(d)(e) | 14.57 | % | 3M SOFR + 10.00% | 12/26/2025 | $ | 992,203 | $ | 970,196 | ||||||||
| Next Flight Ventures, First Lien Term Loan(c)(d) | 14.56 | % | 14.56% PIK | 12/26/2025 | 4,650,895 | 4,559,737 | ||||||||||
| 5,529,933 | ||||||||||||||||
| Consumer Discretionary (4.41%) | ||||||||||||||||
| Arrow Purchaser, Inc., First Lien Initial Term Loan(c) | 11.19 | % | 3M SOFR + 6.75%, 1.00% Floor | 04/15/2026 | 2,041,667 | 1,857,917 | ||||||||||
| Lucky Bucks Holdings LLC, Subordinated Note(c)(f) | – | % | 3M SOFR + 4.75%, 0.75% Floor | 05/29/2028 | 10,013,460 | 1,938,606 | ||||||||||
| Needle Holdings LLC, First Lien Term Loan(c)(f) | – | % | 1M SOFR + 9.50% | 06/22/2027 | 2,354,542 | 623,953 | ||||||||||
| PMP OPCO, LLC, Delayed Draw Term Loan(c)(e)(g) | – | % | 1M SOFR + 8.50%, 2.00% Floor | 05/31/2029 | – | (39,066 | ) | |||||||||
| PMP OPCO, LLC, First Lien Term Loan(c)(g) | 12.82 | % | 1M SOFR + 8.50%, 2.00% Floor | 05/31/2029 | 1,256,133 | 1,185,413 | ||||||||||
| PMP OPCO, LLC, Revolver(c)(e)(g) | – | % | 1M SOFR + 8.50%, 2.00% Floor | 05/31/2029 | – | (7,917 | ) | |||||||||
| Riddell Inc., Delayed Draw Term Loan(c)(e)(g) | – | % | 1M SOFR + 6.00%, 1.00% Floor | 03/29/2029 | – | – | ||||||||||
| Riddell Inc., First Lien Term Loan(c)(g) | 10.32 | % | 1M SOFR + 6.00%, 1.00% Floor | 03/29/2029 | 3,545,455 | 3,545,455 | ||||||||||
| 9,104,361 | ||||||||||||||||
| Consumer Staples (6.51%) | ||||||||||||||||
| 8th Avenue Food & Provisions, Inc., Second Lien Term Loan(c) | 12.19 | % | 1M SOFR + 7.75% | 10/01/2026 | 2,500,000 | 2,315,238 | ||||||||||
| BrightPet, First Lien Term Loan(c)(d) | 11.44 | % | 3M SOFR + 4.00%, 3.00% PIK, 1.00% Floor | 10/06/2026 | 1,954,644 | 1,920,047 | ||||||||||
| BrightPet, Revolver(c)(d) | 11.45 | % | 3M SOFR + 4.00%, 3.00% PIK, 1.00% Floor | 10/06/2026 | 508,476 | 499,476 | ||||||||||
| Florida Food Products LLC, Second Lien Term Loan(c) | 12.56 | % | 3M SOFR + 8.00%, 0.75% Floor | 10/18/2029 | 5,652,174 | 4,253,261 | ||||||||||
| Phillips Feed Service, Inc., First Lien Term Loan(c) | 11.42 | % | 1M SOFR + 7.00% | 12/31/2026 | 5,250,000 | 4,464,075 | ||||||||||
| 13,452,097 | ||||||||||||||||
| Financials (10.34%) | ||||||||||||||||
| BetaNXT, Inc., First Lien Term Loan(c) | 10.05 | % | 3M SOFR + 5.75% | 07/01/2029 | 2,334,091 | 2,244,462 | ||||||||||
| Cor Leonis Limited, Revolver(c)(e) | 11.55 | % | 3M SOFR + 7.25%, 1.50% Floor | 05/15/2028 | 2,456,339 | 2,456,339 | ||||||||||
| DeltaDx Limited, LP - Barri/Dolex(c)(d) | 15.00 | % | 15.00% PIK | 06/14/2028 | 358,369 | 352,097 | ||||||||||
| H-CA II, LLC, First Lien Term Loan(c) | 16.00 | % | N/A | 09/01/2025 | 1,650,001 | 1,491,271 | ||||||||||
| Hunter Point Capital Structured Notes Issuer, LLC, Subordinated Delayed Draw Notes(c)(e) | N/A | N/A | 07/15/2052 | 2,319,510 | 2,950,575 | |||||||||||
| Irradiant Intermediate Holdings, LP, Delayed Draw Term Loan(c)(e) | 10.90 | % | 3M SOFR + 6.50%, 1.50% Floor | 06/08/2028 | 870,000 | 870,000 | ||||||||||
| Irradiant Intermediate Holdings, LP. First Lien Term Loan(c) | 10.90 | % | 3M SOFR + 6.50%, 1.50% Floor | 06/08/2028 | 1,450,000 | 1,450,000 | ||||||||||
| Money Transfer Acquisition Inc., First Lien Term Loan(c) | 12.67 | % | 1M SOFR + 8.25%, 1.00% Floor | 12/14/2027 | 5,963,863 | 5,839,814 | ||||||||||
| PocketWatch, Inc., First Lien Term Loan(c) | 16.00 | % | N/A | 07/15/2027 | 1,372,649 | 1,386,513 | ||||||||||
| SouthStreet Securities Holdings, Inc., First Lien Term Loan(c) | 9.00 | % | N/A | 09/20/2027 | 2,700,000 | 2,318,760 | ||||||||||
| 21,359,831 | ||||||||||||||||
| Health Care (8.09%) | ||||||||||||||||
| American Academy Holdings, LLC, Delayed Draw Term Loan(c)(d) | 14.19 | % | 1M SOFR + 4.50%, 5.25% PIK, 1.00% Floor | 06/30/2027 | 408,721 | 432,223 | ||||||||||
| American Academy Holdings, LLC, First Lien Term Loan(c)(d)14.19% | 1M SOFR + 4.50%, 5.25% PIK, 1.00% Floor | 06/30/2027 | 2,059,956 | 2,178,403 | ||||||||||||
| American Academy Holdings, LLC, Second Lien Term Loan(c)(d) | 14.50 | % | 14.50% PIK | 03/01/2028 | 4,390,712 | 4,308,606 | ||||||||||
| PhyNet Dermatology LLC, Delayed Draw Term Loan(c)(e) | – | % | 3M SOFR + 6.50%, 1.00% Floor | 10/20/2029 | – | 11,690 | ||||||||||
| PhyNet Dermatology LLC, First Lien Term Loan(c) | 10.79 | % | 3M SOFR + 6.50%, 1.00% Floor | 10/20/2029 | 1,936,096 | 1,928,932 | ||||||||||
| Upstream Rehabilitation, Inc., Second Lien Term Loan(c) | 12.89 | % | 3M SOFR + 8.50% | 11/22/2027 | 7,500,000 | 5,350,013 | ||||||||||
| VBC Spine Opco LLC (DxTx Pain and Spine LLC), Delayed Draw Term Loan(c)(e) | 12.44 | % | 3M SOFR + 8.00%, 2.00% Floor | 06/14/2028 | 619,742 | 621,803 | ||||||||||
| VBC Spine Opco LLC (DxTx Pain and Spine LLC), First Lien Term Loan(c) | 12.45 | % | 3M SOFR + 8.00%, 2.00% Floor | 06/14/2028 | 1,891,612 | 1,878,749 | ||||||||||
See Notes to Consolidated Financial Statements.
| Semi-Annual Report | March 31, 2025 | 17 |
| Alternative Credit Income Fund | Consolidated Schedule of Investments |
March 31, 2025 (Unaudited)
| Coupon | Reference Rate & Spread | Maturity | Principal | Value | ||||||||||||
| VBC Spine Opco LLC (DxTx Pain and Spine LLC), Revolver(c)(e) | – | % | 3M SOFR + 8.00%, 2.00% Floor | 06/14/2028 | $ | – | $ | (1,645 | ) | |||||||
| 16,708,774 | ||||||||||||||||
| Industrials (6.21%) | ||||||||||||||||
| Epic Staffing Group, First Lien Term Loan(c) | 10.31 | % | 3M SOFR + 6.00%, 0.50% Floor | 06/28/2029 | 1,949,185 | 1,759,140 | ||||||||||
| Marvel APS (Autorola Group Holding A/S), Delayed Draw Term Loan(c)(d)(h) | 10.00 | % | 10.00% PIK | 12/21/2027 | 3,449,768 | 4,072,681 | ||||||||||
| Material Handling Systems, Inc., First Lien Term Loan(c) | 9.76 | % | 3M SOFR + 5.50%, 0.50% Floor | 06/08/2029 | 1,887,263 | 1,606,061 | ||||||||||
| Newbury Franklin Industrials, LLC, Delayed Draw Term Loan(c)(e) | – | % | 3M SOFR + 7.00%, 2.00% Floor | 12/11/2029 | – | (12,336 | ) | |||||||||
| Newbury Franklin Industrials, LLC, First Lien Term Loan(c) | 11.18 | % | 3M SOFR + 7.00%, 2.00% Floor | 12/11/2029 | 4,003,125 | 3,903,047 | ||||||||||
| VORTEX OPCO, LLC, First Lien Term Loan (First Out)(c) | 10.55 | % | 3M SOFR + 6.25%, 0.50% Floor | 04/30/2030 | 720,000 | 740,099 | ||||||||||
| VORTEX OPCO, LLC, First Lien Term Loan (Second Out)(c)(f) | – | % | 3M SOFR + 4.25%, 0.50% Floor | 12/15/2028 | 1,579,879 | 768,216 | ||||||||||
| 12,836,908 | ||||||||||||||||
| Information Technology (18.46%) | ||||||||||||||||
| Accurate Background, LLC, First Lien Term Loan(c) | 10.56 | % | 3M SOFR + 6.00%, 1.00% Floor | 03/26/2029 | 4,355,901 | 4,320,183 | ||||||||||
| Ancile Solutions, Inc., First Lien Term Loan(c) | 14.56 | % | 3M SOFR + 10.00%, 1.00% Floor | 06/11/2026 | 3,410,780 | 3,410,780 | ||||||||||
| Colonnade Intermediate, LLC, Delayed Draw Term Loan(c)(f) | – | % | 1M SOFR + 7.00%, 1.00% Floor | 04/27/2024 | 1,473,901 | 1,055,313 | ||||||||||
| Colonnade Intermediate, LLC, First Lien Term Loan(c)(f) | – | % | 1M SOFR + 7.00%, 1.00% Floor | 04/27/2024 | 1,542,157 | 1,104,184 | ||||||||||
| DCert Buyer, Inc. First Amendment Term Loan Refinancing, Second Lien Term Loan(c) | 11.32 | % | 1M SOFR + 7.00% | 02/16/2029 | 3,600,000 | 2,943,000 | ||||||||||
| Diamanti, Inc., Subordinated Note(c)(d) | 15.00 | % | 15.00% PIK | 02/28/2025 | 4,262,544 | 4,312,416 | ||||||||||
| Fulcrum US Holdings, Inc., Revolver(c) | 13.50 | % | PRIME + 6.00%, 1.00% Floor | 05/20/2025 | 4,000,000 | 4,000,000 | ||||||||||
| Ivanti Software, Inc., Second Lien Initial Term Loan(c) | 11.82 | % | 3M SOFR + 7.25%, 0.50% Floor | 12/01/2028 | 4,000,000 | 1,896,560 | ||||||||||
| Kofax, Inc., Second Lien Term Loan(c) | 12.04 | % | 3M SOFR + 7.75%, 0.50% Floor | 07/20/2030 | 4,000,000 | 3,589,199 | ||||||||||
| Phoenix Finance, First Lien Term Loan(c) | 13.30 | % | 3M SOFR + 9.00%, 1.00% Floor | 08/14/2028 | 829,016 | 829,016 | ||||||||||
| Phoenix Finance, Second Lien Term Loan(c) | 11.95 | % | 3M SOFR + 7.50%, 1.00% Floor | 08/14/2028 | 1,233,913 | 1,233,913 | ||||||||||
| Precisely Software Incorporated, Second Lien Term Loan(c) | 11.80 | % | 3M SOFR + 7.25%, 0.75% Floor | 04/23/2029 | 3,000,000 | 2,898,120 | ||||||||||
| Spectrio, Delayed Draw Term Loan(c)(d) | 10.31 | % | 3M SOFR + 3.50%, 2.50% PIK, 1.00% Floor | 12/09/2026 | 1,171,700 | 1,057,459 | ||||||||||
| Spectrio, First Lien Term Loan(c)(d) | 10.31 | % | 3M SOFR + 3.50%, 2.50% PIK, 1.00% Floor | 12/09/2026 | 2,809,002 | 2,535,124 | ||||||||||
| VTX Intermediate Holdings, Inc., First Lien Term Loan(c)(d) | 11.56 | % | 1M SOFR + 6.00%, 1.00% PIK, 2.00% Floor | 12/12/2029 | 1,147,487 | 1,137,504 | ||||||||||
| VTX Intermediate Holdings, Inc., Second Lien Term Loan(c)(d) | 12.50 | % | 12.50% PIK | 12/12/2030 | 1,855,535 | 1,806,920 | ||||||||||
| 38,129,691 | ||||||||||||||||
| TOTAL BANK LOANS | ||||||||||||||||
| (Cost $134,455,172) | 117,121,595 | |||||||||||||||
| Shares | Value | |||||||||||||||
| COMMON EQUITY (9.55%)(b) | ||||||||||||||||
| Communication Services (–%) | ||||||||||||||||
| Next Flight Ventures(c)(i) | 88 | – | ||||||||||||||
| NFV Co-Pilot, Inc.(c)(i) | 441 | – | ||||||||||||||
| – | ||||||||||||||||
| Consumer Discretionary (0.53%) | ||||||||||||||||
| CEC Entertainment, Inc.(i) | 79,564 | 1,087,361 | ||||||||||||||
| JoAnn Inc.(c)(i) | 1,570,371 | – | ||||||||||||||
| 1,087,361 | ||||||||||||||||
| Diversified (5.48%) | ||||||||||||||||
| Ares Capital Corp. | 117,223 | 2,597,662 | ||||||||||||||
See Notes to Consolidated Financial Statements.
| 18 | www.altcif.com |
| Alternative Credit Income Fund | Consolidated Schedule of Investments |
March 31, 2025 (Unaudited)
| Shares | Value | |||||||||||||||
| COMMON EQUITY (9.55%)(b) (continued) | ||||||||||||||||
| Diversified (5.48%) (continued) | ||||||||||||||||
| CION Investment Corp. | 120,800 | $ | 1,250,280 | |||||||||||||
| Franklin BSP Capital Corp(c) | 66,100 | 933,786 | ||||||||||||||
| FS KKR Capital Corp. | 105,137 | 2,202,620 | ||||||||||||||
| Portman Ridge Finance Corp.(g) | 25,504 | 365,982 | ||||||||||||||
| SLR Investment Corp. | 115,211 | 1,942,457 | ||||||||||||||
| WhiteHorse Finance, Inc. | 207,328 | 2,000,715 | ||||||||||||||
| 11,293,502 | ||||||||||||||||
| Financials (0.80%) | ||||||||||||||||
| Aperture Dodge 18 LLC(c)(i) | 2,051,573 | 1,657,470 | ||||||||||||||
| Health Care (0.23%) | ||||||||||||||||
| American Academy Holdings. Inc., Common Units(c)(i)(j) | 0.05 | 278,039 | ||||||||||||||
| DxTx Pain and Spine LLC, Common Units(c)(i)(j) | 98,854 | 217,175 | ||||||||||||||
| 495,214 | ||||||||||||||||
| Industrials (0.50%) | ||||||||||||||||
| GreenPark Infrastructure, LLC Series M-1(c)(g)(i)(j) | 2,565 | 878,443 | ||||||||||||||
| Incora Top Holdco LLC(c)(i) | 5,350 | 162,260 | ||||||||||||||
| 1,040,703 | ||||||||||||||||
| Information Technology (0.01%) | ||||||||||||||||
| VTX Holdings, LLC(c)(i) | 932,474 | 27,173 | ||||||||||||||
| Real Estate (2.00%) | ||||||||||||||||
| Copper Property CTL Pass Through Trust(j) | 319,520 | 4,128,997 | ||||||||||||||
| TOTAL COMMON EQUITY | ||||||||||||||||
| (Cost $22,522,458) | 19,730,420 | |||||||||||||||
| ASSET BACKED SECURITIES (3.93%)(a)(b) | ||||||||||||||||
| Financials (3.93%) | ||||||||||||||||
| Canyon Capital CLO 2014-1, Ltd., Class ER(k) | 12.25 | % | 3M SOFR + 7.70% | 01/30/2031 | 1,000,000 | 659,564 | ||||||||||
| JMP Credit Advisors CLO IV, Ltd.(c) | – | % | N/A | 07/17/2029 | 4,836,540 | 161,540 | ||||||||||
| JMP Credit Advisors CLO V, Ltd.(c) | – | % | N/A | 07/17/2030 | 4,486,426 | 188,879 | ||||||||||
| Mount Logan Funding 2018-1 LP(c)(g)(k) | 22.14 | % | N/A | 01/22/2033 | 7,798,575 | 4,690,843 | ||||||||||
| Octagon Investment Partners 36, Ltd., Class F(k) | 12.31 | % | 3M SOFR + 7.75% | 04/15/2031 | 1,000,000 | 804,488 | ||||||||||
| Octagon Investment Partners XIV, Ltd., Class ER(k) | 12.91 | % | 3M SOFR + 8.35% | 07/15/2029 | 2,132,000 | 707,647 | ||||||||||
| Saranac CLO VII, Ltd., Class ER(k) | 11.30 | % | 3M SOFR + 6.72% | 11/20/2029 | 502,679 | 109,311 | ||||||||||
| Tralee CLO II, Ltd., Class ER(k) | 12.40 | % | 3M SOFR + 7.85% | 07/20/2029 | 1,000,000 | 796,999 | ||||||||||
| Tralee CLO II, Ltd., Class FR(f)(k) | – | % | 3M SOFR + 8.35% | 07/20/2029 | 1,000,000 | 139 | ||||||||||
| 8,119,410 | ||||||||||||||||
| TOTAL ASSET BACKED SECURITIES | ||||||||||||||||
| (Cost $14,286,097) | 8,119,410 | |||||||||||||||
| CORPORATE BONDS (2.32%)(a)(b) | ||||||||||||||||
| Communications (0.94%) | ||||||||||||||||
| Spanish Broadcasting System, Inc.(k) | 9.75 | % | N/A | 03/01/2026 | 3,000,000 | 1,936,975 | ||||||||||
| Consumer Discretionary (–%) | ||||||||||||||||
| Monitronics - Escrow(c) | – | % | N/A | 12/31/2049 | 2,650,000 | – | ||||||||||
See Notes to Consolidated Financial Statements.
| Semi-Annual Report | March 31, 2025 | 19 |
| Alternative Credit Income Fund | Consolidated Schedule of Investments |
March 31, 2025 (Unaudited)
| Shares | Value | ||||||||||||||||||
| CORPORATE BONDS (continued) | |||||||||||||||||||
| Financials (1.02%) | |||||||||||||||||||
| EJF CRT 2024-R1 LLC, Class R1(c) | 12.12 | % | N/A | 12/17/2055 | $ | 2,103,885 | $ | 2,103,885 | |||||||||||
| Industrials (0.36%) | |||||||||||||||||||
| Vortex Opco, LLC(f)(k) | – | % | 8.00% | 04/30/2030 | 3,135,000 | 752,400 | |||||||||||||
| TOTAL CORPORATE BONDS | |||||||||||||||||||
| (Cost $6,206,527) | 4,793,260 | ||||||||||||||||||
| EQUIPMENT FINANCING (0.57%) | |||||||||||||||||||
| Financials (0.57%) | |||||||||||||||||||
| White Oak Equipment Finance 1, LLC(b)(c)(j) | 10.75 | % | N/A | 01/01/2027 | 1,174,080 | 1,174,080 | |||||||||||||
| TOTAL EQUIPMENT FINANCING | |||||||||||||||||||
| (Cost $1,174,080) | 1,174,080 | ||||||||||||||||||
| Shares | Value | ||||||||||||||||||
| INTERVAL FUND (2.02%)(b) | |||||||||||||||||||
| Diversified (2.02%) | |||||||||||||||||||
| Opportunistic Credit Interval Fund(g) | 362,837 | 4,165,365 | |||||||||||||||||
| TOTAL INTERVAL FUND | |||||||||||||||||||
| (Cost $4,368,554) | 4,165,365 | ||||||||||||||||||
| Shares | Value | ||||||||||||||||||
| JOINT VENTURE (0.19%)(b) | |||||||||||||||||||
| Joint Venture (0.19%) | |||||||||||||||||||
| Great Lakes Funding II LLC, Series A(e)(g)(l)(m) | 408,051 | 391,098 | |||||||||||||||||
| TOTAL JOINT VENTURE | |||||||||||||||||||
| (Cost $408,051) | 391,098 | ||||||||||||||||||
| Shares | Value | ||||||||||||||||||
| PREFERRED STOCK (3.57%)(b) | |||||||||||||||||||
| Consumer Discretionary (3.39%) | |||||||||||||||||||
| EBSC Holdings LLC, Preferred(c)(d)(g) | 10.00% PIK | 1,103,518 | 1,269,046 | ||||||||||||||||
| Pennfoster(c)(d) | 15.19 | % | 5,670,969 | 5,545,074 | |||||||||||||||
| Princeton Medspa Partners, LLC(c)(d)(g)(j) | 12.50% PIK | 274,109 | 199,868 | ||||||||||||||||
| 7,013,988 | |||||||||||||||||||
| Health Care (0.08%) | |||||||||||||||||||
| American Academy Holdings. Inc., Preferred(c)(d)(j) | 18.00 | % | 90,970 | 156,469 | |||||||||||||||
| Industrials (0.10%) | |||||||||||||||||||
| GreenPark Infrastructure, LLC Series A, Preferred(c)(g)(i)(j) 400 | 200,000 | ||||||||||||||||||
| TOTAL PREFERRED STOCK | |||||||||||||||||||
| (Cost $7,139,683) | 7,370,457 | ||||||||||||||||||
| Shares | Value | ||||||||||||||||||
| PRIVATE INVESTMENT FUNDS (18.38%)(b) | |||||||||||||||||||
| BlackRock Global Credit Opportunities Fund, LP(e)(l)(n) | 8,629,530 | ||||||||||||||||||
| CVC European Mid-Market Solutions Fund(e)(l)(n) | 1,410,131 | ||||||||||||||||||
| EJF Financial Debt Strategies Fund LP(l) | 780,404 | ||||||||||||||||||
See Notes to Consolidated Financial Statements.
| 20 | www.altcif.com |
| Alternative Credit Income Fund | Consolidated Schedule of Investments |
March 31, 2025 (Unaudited)
| Shares | Value | |||||||
| PRIVATE INVESTMENT FUNDS (18.38%)(b) (continued) | ||||||||
| GSO Credit Alpha Fund II LP(e)(l)(n) | $ | 2,063,457 | ||||||
| Monroe Capital Private Credit Fund III LP(e)(l)(n) | 5,703,510 | |||||||
| Pelham S2K SBIC II, L.P.(e)(l)(n) | 356,545 | |||||||
| Tree Line Credit Strategies LP(l)(n) | 19,022,874 | |||||||
| 37,966,451 | ||||||||
| TOTAL PRIVATE INVESTMENT FUNDS | ||||||||
| (Cost $39,010,927) | 37,966,451 | |||||||
| WARRANTS (0.32%)(b) | ||||||||
| Consumer Discretionary (0.14%) | ||||||||
| CEC Entertainment, Inc. Warrants(i) | 237,941 | 273,632 | ||||||
| Princeton Medspa Partners, LLC, Warrants(c)(g)(i)(j) | 0.01 | 8,089 | ||||||
| 281,721 | ||||||||
| Financials (0.18%) | ||||||||
| SouthStreet Securities Holdings, Inc., Warrants(c) (i) | 3,400 | 376,924 | ||||||
| Information Technology (–%) | ||||||||
| Diamanti, Inc., Class A(c)(i) | 146,413 | – | ||||||
| TOTAL WARRANTS | ||||||||
| (Cost $390,456) | 658,645 | |||||||
| SHORT-TERM INVESTMENT (3.70%) | ||||||||
| Money Market Funds (3.70%) | ||||||||
| US BANK MMDA - USBGFS 9, 4.20%(b)(o) | 7,645,208 | 7,645,208 | ||||||
| TOTAL SHORT-TERM INVESTMENT | ||||||||
| (Cost $7,645,208) | 7,645,208 | |||||||
| Number
of Contracts | Value | |||||||
| DERIVATIVES (–%)(b) | ||||||||
| Consumer Discretionary (–%) | ||||||||
| Princeton Medspa Partners, LLC, Put Option(c)(g)(i)(j) | 250,000 | – | ||||||
| TOTAL DERIVATIVES | ||||||||
| (Cost $–) | – | |||||||
| INVESTMENTS, AT VALUE (101.25%) | ||||||||
| (Cost $237,607,213) | $ | 209,135,989 | ||||||
| Liabilities In Excess Of Other Assets (-1.25%) | (2,572,518 | ) | ||||||
| NET ASSETS (100.00%) | $ | 206,563,471 | ||||||
Investment Abbreviations:
SOFR - Secured Overnight Financing Rate
PIK - Payment in-Kind
Reference Rates:
1M SOFR - 1 Month US SOFR as of March 31, 2025 was 4.32%.
3M SOFR - 3 Month US SOFR as of March 31, 2025 was 4.28%.
6M SOFR - 6 Month US SOFR as of March 31, 2025 was 4.22%.
PRIME - US Prime Rate as of March 31, 2025 was 7.50%
See Notes to Consolidated Financial Statements.
| Semi-Annual Report | March 31, 2025 | 21 |
| Alternative Credit Income Fund | Consolidated Schedule of Investments |
March 31, 2025 (Unaudited)
| (a) | Variable rate investment. Interest rates reset periodically. Interest rate shown reflects the rate in effect at March 31, 2025. For securities based on a published reference rate and spread, the reference rate and spread are indicated in the description above. Certain variable rate securities are not based on a published reference rate and spread but are determined by the issuer or agent and are based on current market conditions. These securities do not indicate a reference rate and spread in their description above. |
| (b) | These investments are pledged to secure the Fund’s debt obligations. |
| (c) | As a result of the use of significant unobservable inputs to determine fair value, these investments have been classified as Level 3 assets. |
| (d) | Payment in-kind security which may pay interest in additional par. |
| (e) | All or a portion of this commitment was unfunded as of March 31, 2025. |
| (f) | Non-accrual investment. |
| (g) | Affiliate company. |
| (h) | Principal balance denominated in euros. |
| (i) | Non-income producing security. |
| (j) | Investment is held through ACIF Master Blocker, LLC, wholly-owned subsidiary. |
| (k) | Securities exempt from registration under Rule 144A of the Securities Act of 1933, as amended. These securities may be sold in the ordinary course of business in transactions exempt from registration, normally to qualified institutional buyers. As of March 31, 2025, the aggregate market value of those securities was $10,458,366, representing 5.06% of net assets. |
| (l) | Restricted security. |
| (m) | During the period ended March 31, 2025, the Fund invested $29,638 in Great Lakes Funding II, LLC - Series A units, received a return of capital distribution of $10,936, and reported change in unrealized appreciation of $35,810 on Great Lakes Funding II, LLC - Series A units. Additionally, Great Lakes Funding II LLC - Series A declared distributions of $28,706. during the period ended March 31, 2025 |
| (n) | Investment is held through CIF Investments LLC, a wholly-owned subsidiary. |
| (o) | Money market fund; interest rate reflects seven-day effective yield on March 31, 2025. |
Securities determined to be restricted under the procedures approved by the Fund's Board of Trustees are as follows.
| Date(s) of Purchase | Security | Cost | Value | % of Net Assets | ||||||||||
| 03/31/2018 - 09/30/2024 | BlackRock Global Credit Opportunities Fund, LP | $ | 9,797,727 | $ | 8,629,530 | 4.18 | % | |||||||
| 09/30/2017 - 09/30/2021 | CVC European Mid-Market Solutions Fund | 2,911,406 | 1,410,131 | 0.68 | % | |||||||||
| 06/30/2024 - 09/30/2024 | EJF Financial Debt Strategies Fund LP | 750,000 | 780,404 | 0.38 | % | |||||||||
| 08/05/2022 - 12/31/2024 | Great Lakes Funding II LLC, Series A | 408,051 | 391,098 | 0.19 | % | |||||||||
| 06/30/2018 - 03/31/2021 | GSO Credit Alpha Fund II LP | 875,997 | 2,063,457 | 1.00 | % | |||||||||
| 09/30/2018 - 12/31/2020 | Monroe Capital Private Credit Fund III LP | 5,316,167 | 5,703,510 | 2.76 | % | |||||||||
| 11/14/2022 - 03/31/2025 | Pelham S2K SBIC II, L.P. | 359,630 | 356,545 | 0.17 | % | |||||||||
| 12/31/2017 - 06/30/2019 | Tree Line Credit Strategies LP | 19,000,000 | 19,022,874 | 9.21 | % | |||||||||
| Total | $ | 39,418,978 | $ | 38,357,549 | 18.57 | % | ||||||||
Additional information on investments in private investment funds and unfunded commitments:
| Security | Value | Redemption Frequency | Redemption Notice(Days) | Unfunded Commitments as of March 31, 2025 | ||||||||
| BlackRock Global Credit Opportunities Fund, LP(a) | $ | 8,629,530 | N/A | N/A | $ | 3,871,980 | ||||||
| CVC European Mid-Market Solutions Fund(b) | 1,410,131 | N/A | N/A | 206,342 | ||||||||
| EJF Financial Debt Strategies Fund LP | 780,404 | N/A | N/A | N/A | ||||||||
| Great Lakes Funding II LLC, Series A(a) | 391,098 | N/A | N/A | 86,687 | ||||||||
| GSO Credit Alpha Fund II LP(a) | 2,063,457 | N/A | N/A | 7,382,124 | ||||||||
| Monroe Capital Private Credit Fund III LP(b) | 5,703,510 | N/A | N/A | 1,498,740 | ||||||||
| Pelham S2K SBIC II, L.P. | 356,545 | N/A | N/A | 1,640,370 | ||||||||
| Tree Line Credit Strategies LP | 19,022,874 | Quarterly | 90 | N/A | ||||||||
| Total | $ | 38,357,549 | $ | 14,686,243 | ||||||||
Unfunded Commitments:
| Security | Value | Maturity | Unfunded Commitment | |||||||||
| Cor Leonis Limited, Revolver | $ | 2,456,339 | 05/15/2028 | $ | 640,788 | |||||||
| Hunter Point Capital Structured Notes Issuer, LLC, Subordinated | ||||||||||||
| Delayed Draw Notes | 2,950,575 | 07/15/2052 | 3,375,195 | |||||||||
| Irradiant Intermediate Holdings, LP, Delayed Draw Term Loan | 870,000 | 06/08/2028 | 580,000 | |||||||||
| Newbury Franklin Industrials, LLC, Delayed Draw Term Loan | (12,336 | ) | 12/11/2029 | 986,842 | ||||||||
See Notes to Consolidated Financial Statements.
| 22 | www.altcif.com |
| Alternative Credit Income Fund | Consolidated Schedule of Investments |
March 31, 2025 (Unaudited)
| Security | Value | Maturity | Unfunded Commitment | |||||||||
| Next Flight Ventures, Delayed Draw Term Loan | $ | 970,196 | 12/26/2025 | $ | 266,700 | |||||||
| PhyNet Dermatology LLC, Delayed Draw Term Loan | 11,690 | 10/20/2029 | 1,034,483 | |||||||||
| PMP OPCO, LLC, Delayed Draw Term Loan | (39,066 | ) | 05/31/2029 | 843,750 | ||||||||
| PMP OPCO, LLC, Revolver | (7,917 | ) | 05/31/2029 | 140,625 | ||||||||
| Riddell Inc., Delayed Draw Term Loan | – | 03/29/2029 | 363,636 | |||||||||
| VBC Spine Opco LLC (DxTx Pain and Spine LLC), Delayed Draw Term Loan | 621,803 | 06/14/2028 | 475,382 | |||||||||
| VBC Spine Opco LLC (DxTx Pain and Spine LLC), Revolver | (1,645 | ) | 06/14/2028 | 241,936 | ||||||||
| Total | $ | 7,819,639 | $ | 8,949,337 | ||||||||
| Total Unfunded Commitments | $ | 23,635,580 | ||||||||||
| (a) | A voluntary withdrawal may be permitted at the General Partner's discretion with the General Partner's consent. |
| (b) | A voluntary withdrawal may be permitted with the General Partner's prior written consent. |
See Notes to Consolidated Financial Statements.
| Semi-Annual Report | March 31, 2025 | 23 |
| Alternative Credit Income Fund | Consolidated Statement of Assets and Liabilities |
March 31, 2025 (Unaudited)
| ASSETS | ||||
| Investments, at value (Cost $218,196,209) | $ | 192,283,370 | ||
| Affiliated investments, at value (Cost $19,411,004) | 16,852,619 | |||
| Cash | – | |||
| Foreign cash, at value (Cost $11,735) | 11,747 | |||
| Interest and distributions receivable | 2,783,867 | |||
| Receivable for fund shares sold | 13,586 | |||
| Due from Adviser | 205,160 | |||
| Prepaid expenses and other assets | 35,188 | |||
| Total assets | $ | 212,185,537 | ||
| LIABILITIES | ||||
| USB Credit Facility (Cost $5,054,410) | 4,960,170 | |||
| Interest on line of credit payable | 78,398 | |||
| Administration fees payable | 112,447 | |||
| Custody fees payable | 6,082 | |||
| Transfer agency fees payable | 64,920 | |||
| Accrued expenses and other liabilities | 400,049 | |||
| Total liabilities | 5,622,066 | |||
| NET ASSETS | $ | 206,563,471 | ||
| NET ASSETS CONSISTS OF | ||||
| Paid-in capital | $ | 243,998,930 | ||
| Total accumulated deficit | (37,435,459 | ) | ||
| NET ASSETS | $ | 206,563,471 | ||
| Common Shares: | ||||
| Class A | ||||
| Net assets | $ | 24,987,027 | ||
| Shares of beneficial interest outstanding (no par value; unlimited number of shares) | 2,734,157 | |||
| Net asset value(a) | $ | 9.14 | ||
| Maximum offering price per share (maximum sales charge of 5.75%) | $ | 9.67 | ||
| Class C | ||||
| Net assets | $ | 27,064,015 | ||
| Shares of beneficial interest outstanding (no par value; unlimited shares) | 2,921,130 | |||
| Net asset value(a) | $ | 9.26 | ||
| Class W | ||||
| Net assets | $ | 41,147,621 | ||
| Shares of beneficial interest outstanding (no par value; unlimited shares) | 4,506,271 | |||
| Net asset value | $ | 9.13 | ||
| Class I | ||||
| Net assets | $ | 105,019,396 | ||
| Shares of beneficial interest outstanding (no par value; unlimited shares) | 11,489,477 | |||
| Net asset value | $ | 9.14 | ||
| Class L | ||||
| Net assets | $ | 8,345,412 | ||
| Shares of beneficial interest outstanding (no par value; unlimited shares) | 912,301 | |||
| Net asset value | $ | 9.15 | ||
| Maximum offering price per share (maximum sales charge of 4.25%) | $ | 9.54 | ||
| (a) | Redemption price varies based on length of time held (Note 6). |
See Notes to Consolidated Financial Statements.
| 24 | www.altcif.com |
| Alternative Credit Income Fund | Consolidated Statement of Operations |
For the Six Months Ended March 31, 2025 (Unaudited)
| INVESTMENT INCOME | ||||
| Interest | $ | 6,209,719 | ||
| Interest from affiliated investments | 999,012 | |||
| Dividends | 2,684,194 | |||
| Dividends from affiliated investments | 249,957 | |||
| Payment-in-kind interest - Non-Affiliates | 1,704,209 | |||
| Payment-in-kind interest - Affiliates | 69,265 | |||
| Other Income | 10,449 | |||
| Total investment income | 11,926,805 | |||
| EXPENSES | ||||
| Investment advisory fees (Note 4) | 1,917,672 | |||
| Sub-administrative fees (Note 4) | 245,116 | |||
| Distribution fees (Note 4): | ||||
| Class C | 92,705 | |||
| Class L | 10,697 | |||
| Shareholder servicing fees (Note 4): | ||||
| Class A | 23,489 | |||
| Class C | 30,904 | |||
| Class W | 53,039 | |||
| Class L | 10,697 | |||
| Interest expense (Note 7) | 246,229 | |||
| Incentive fees (Note 4) | – | |||
| Transfer agent fees (Note 4) | 133,097 | |||
| Professional fees | 616,904 | |||
| Printing expense | 66,159 | |||
| Registration fees | 30,310 | |||
| Custody fees | 12,863 | |||
| Insurance expense | 63,756 | |||
| Trustee fees and expenses (Note 4) | 20,197 | |||
| Compliance services fees | 7,307 | |||
| Networking Fees: | ||||
| Class A | 3,234 | |||
| Class C | 4,489 | |||
| Class W | 299 | |||
| Class I | 12,887 | |||
| Class L | 1,963 | |||
| Other expenses | 10,123 | |||
| Total expenses | 3,614,136 | |||
| Fees waived by Adviser net of recoupment (Note 4) | (679,992 | ) | ||
| Total net expenses | 2,934,144 | |||
| NET INVESTMENT INCOME | 8,992,661 | |||
| Net realized loss on investments | (11,961,362 | ) | ||
| Net realized loss on affiliated investments | (67,239 | ) | ||
| Net realized loss on foreign currency transactions | (2,076 | ) | ||
| Total net realized loss | (12,030,677 | ) | ||
| Net change in unrealized appreciation on investments | 3,020,440 | |||
| Net change in unrealized depreciation on affiliated investments | (1,379,024 | ) | ||
| Net change in unrealized appreciation on translation of assets and liabilities in foreign currencies | – | |||
| Net change in unrealized appreciation on debt | 101,868 | |||
| Total net change in unrealized appreciation | 1,743,284 | |||
| NET REALIZED AND UNREALIZED LOSS ON INVESTMENTS | (10,287,393 | ) | ||
| NET DECREASE IN NET ASSETS RESULTING FROM OPERATIONS | $ | (1,294,732 | ) | |
See Notes to Consolidated Financial Statements.
| Semi-Annual Report | March 31, 2025 | 25 |
| Alternative Credit Income Fund | Consolidated
Statements of Changes in Net Assets |
| For the Six Months Ended March 31, 2025 (Unaudited) | For the Year Ended September 30, 2024 | |||||||
| OPERATIONS | ||||||||
| Net investment income | $ | 8,992,661 | $ | 23,494,018 | ||||
| Net realized loss on investments | (12,028,601 | ) | (5,376,469 | ) | ||||
| Net realized gain on securities sold short | – | 2,463,229 | ||||||
| Net realized gain/(loss) on foreign currency transactions | (2,076 | ) | 28,755 | |||||
| Net change in unrealized appreciation/(depreciation) on investments | 1,641,416 | (5,262,928 | ) | |||||
| Net change in unrealized depreciation on securities sold short | – | (703,228 | ) | |||||
| Net change in unrealized appreciation on debt | 101,868 | (7,676 | ) | |||||
| Net change in unrealized appreciation on translation of assets and liabilities in foreign currencies | – | 11 | ||||||
| Net increase/(decrease) in net assets resulting from operations | (1,294,732 | ) | 14,635,712 | |||||
| DISTRIBUTIONS TO SHAREHOLDERS | ||||||||
| Total Distributable Earnings | ||||||||
| Class A | (1,384,048 | ) | (2,200,085 | ) | ||||
| Class C | (1,341,603 | ) | (2,237,560 | ) | ||||
| Class W | (2,319,344 | ) | (3,500,561 | ) | ||||
| Class I | (5,940,587 | ) | (8,500,670 | ) | ||||
| Class L | (439,477 | ) | (671,503 | ) | ||||
| Total distributions to shareholders | (11,425,059 | ) | (17,110,379 | ) | ||||
| COMMON SHARE TRANSACTIONS | ||||||||
| Class A | ||||||||
| Proceeds from sales of shares | 555,029 | 1,838,587 | ||||||
| Distributions reinvested | 489,312 | 1,035,451 | ||||||
| Cost of shares redeemed | (2,081,990 | ) | (9,370,560 | ) | ||||
| Net transferred in(out) | (202,481 | ) | (1,642,125 | ) | ||||
| Net decrease from share transactions | (1,240,130 | ) | (8,138,647 | ) | ||||
| Class C | ||||||||
| Proceeds from sales of shares | 190,984 | 799,942 | ||||||
| Distributions reinvested | 698,255 | 941,668 | ||||||
| Cost of shares redeemed | (1,922,541 | ) | (5,485,249 | ) | ||||
| Net transferred in(out) | (417,648 | ) | (6,806,712 | ) | ||||
| Net decrease from share transactions | (1,450,950 | ) | (10,550,351 | ) | ||||
| Class W | ||||||||
| Proceeds from sales of shares | 2,395,074 | 3,832,922 | ||||||
| Distributions reinvested | 560,831 | 853,187 | ||||||
| Cost of shares redeemed | (6,611,980 | ) | (10,411,110 | ) | ||||
| Net transferred in(out) | 7,130 | 519,360 | ||||||
| Net decrease from share transactions | (3,648,945 | ) | (5,205,641 | ) | ||||
| Class I | ||||||||
| Proceeds from sales of shares | 6,535,393 | 22,395,998 | ||||||
| Distributions reinvested | 1,947,454 | 3,035,631 | ||||||
| Cost of shares redeemed | (11,249,631 | ) | (29,206,944 | ) | ||||
| Net transferred in(out) | 612,999 | 7,929,477 | ||||||
| Net increase/(decrease) from share transactions | (2,153,785 | ) | 4,154,162 | |||||
| Class L | ||||||||
| Proceeds from sales of shares | 9,332 | 46,391 | ||||||
| Distributions reinvested | 257,260 | 405,045 | ||||||
| Cost of shares redeemed | (289,206 | ) | (2,597,798 | ) | ||||
| Net decrease from share transactions | (22,614 | ) | (2,146,362 | ) | ||||
| Total net decrease in net assets | (21,236,215 | ) | (24,361,506 | ) | ||||
See Notes to Consolidated Financial Statements.
| 26 | www.altcif.com |
| Alternative Credit Income Fund | Consolidated
Statements of Changes in Net Assets (continued) |
| For the Six Months Ended March 31, 2025 (Unaudited) | For the Year Ended September 30, 2024 | |||||||
| NET ASSETS | ||||||||
| Beginning of period | 227,799,686 | 252,161,192 | ||||||
| End of period | $ | 206,563,471 | $ | 227,799,686 | ||||
| OTHER INFORMATION | ||||||||
| Common Shares Transactions | ||||||||
| Class A | ||||||||
| Issued | 58,128 | 187,886 | ||||||
| Distributions reinvested | 52,158 | 106,890 | ||||||
| Redeemed | (219,302 | ) | (965,710 | ) | ||||
| Net Transferred in(out) | (20,987 | ) | (167,276 | ) | ||||
| Net decrease in shares | (130,003 | ) | (838,210 | ) | ||||
| Class C | ||||||||
| Issued | 20,249 | 80,831 | ||||||
| Distributions reinvested | 73,216 | 96,071 | ||||||
| Redeemed | (201,308 | ) | (558,470 | ) | ||||
| Net Transferred in(out) | (43,417 | ) | (680,409 | ) | ||||
| Net decrease in shares | (151,260 | ) | (1,061,977 | ) | ||||
| Class W | ||||||||
| Issued | 253,588 | 393,655 | ||||||
| Distributions reinvested | 59,910 | 88,123 | ||||||
| Redeemed | (701,113 | ) | (1,072,366 | ) | ||||
| Net Transferred in(out) | 798 | 53,107 | ||||||
| Net decrease in shares | (386,817 | ) | (537,481 | ) | ||||
| Class I | ||||||||
| Issued | 691,351 | 2,302,423 | ||||||
| Distributions reinvested | 207,858 | 312,890 | ||||||
| Redeemed | (1,184,510 | ) | (3,003,478 | ) | ||||
| Net Transferred in(out) | 64,050 | 800,569 | ||||||
| Net increase/(decrease) in shares | (221,251 | ) | 412,402 | |||||
| Class L | ||||||||
| Issued | 996 | 4,775 | ||||||
| Distributions reinvested | 27,496 | 41,822 | ||||||
| Redeemed | (30,691 | ) | (268,131 | ) | ||||
| Net decrease in shares | (2,199 | ) | (221,534 | ) | ||||
See Notes to Consolidated Financial Statements.
| Semi-Annual Report | March 31, 2025 | 27 |
| Alternative Credit Income Fund | Consolidated Statement of Cash Flows |
For the Six Months Ended March 31, 2025 (Unaudited)
| CASH FLOWS FROM OPERATING ACTIVITIES: | ||||
| Net increase in net assets from operations | $ | (1,294,732 | ) | |
| Adjustments to reconcile net increase in net assets resulting from operations to net cash provided by operating activities: | ||||
| Purchase of investment securities | (17,547,989 | ) | ||
| Proceeds from sale of investment securities | 17,252,864 | |||
| Purchase of short-term investment securities - net | 12,380,861 | |||
| Amortization of discount and accretion of discount on investments | (1,368,850 | ) | ||
| Payment-in-kind income | (1,773,474 | ) | ||
| Net realized (gain)/loss on: | ||||
| Investments | 12,030,677 | |||
| Net change in unrealized (appreciation)/depreciation on: | ||||
| Investments | (1,641,416 | ) | ||
| Debt | (101,868 | ) | ||
| (Increase)/Decrease in assets: | ||||
| Interest and distributions receivable | 467,257 | |||
| Due from Adviser | (205,160 | ) | ||
| Prepaid expenses and other assets | 81,820 | |||
| Increase/(Decrease) in liabilities: | ||||
| Due to Adviser | (81,427 | ) | ||
| Interest on line of credit payable | (927 | ) | ||
| Administration fees payable | (102,854 | ) | ||
| Custody fees payable | 3,421 | |||
| Transfer agency fees payable | 3,056 | |||
| Accrued expenses and other liabilities | 16,693 | |||
| Net cash provided by operating activities | 18,117,952 | |||
| CASH FLOWS FROM FINANCING ACTIVITIES: | ||||
| Proceeds from sales of shares | 10,019,228 | |||
| Cost of shares redeemed | (22,155,348 | ) | ||
| Borrowings on US Bank Credit Facility | 1,500,000 | |||
| Repayment on US Bank Credit Facility | – | |||
| Cash distributions paid | (7,471,947 | ) | ||
| Net cash used in financing activities | (18,108,067 | ) | ||
| Net change in cash & cash equivalents | $ | 9,885 | ||
| Effect of foreign exchange rate changes on cash | (2,124 | ) | ||
| Restricted and unrestricted cash, beginning of period | 3,986 | |||
| Restricted and unrestricted cash, end of year | $ | 11,747 | ||
| SUPPLEMENTAL DISCLOSURE OF NON-CASH INVESTING AND FINANCING TRANSACTIONS | ||||
| Non-cash financing activities not included herein consist of reinvestment of distributions of: | $ | 3,953,112 | ||
| Cash paid for interest on line of credit during the period was: | $ | 245,302 | ||
See Notes to Consolidated Financial Statements.
| 28 | www.altcif.com |
| Alternative Credit Income Fund – Class A | Financial Highlights |
| For a Share Outstanding Throughout the Years Presented |
| For the Six Months Ended March 31, 2025 (Unaudited) | Year Ended September 30, 2024 | Year Ended September 30, 2023 | Year Ended September 30, 2022 | Year Ended September 30, 2021 | Year Ended September 30, 2020 | |||||||||||||||||||
| NET ASSET VALUE, BEGINNING OF PERIOD | $ | 9.69 | $ | 9.79 | $ | 10.09 | $ | 11.09 | $ | 9.75 | $ | 10.80 | ||||||||||||
| INCOME FROM INVESTMENT OPERATIONS | ||||||||||||||||||||||||
| Net investment income(a) | 0.40 | 0.97 | 0.93 | 0.61 | 0.74 | 0.69 | ||||||||||||||||||
| Net realized and unrealized gain/(loss) on investments | (0.45 | ) | (0.37 | ) | (0.53 | ) | (0.91 | ) | 1.30 | (0.92 | ) | |||||||||||||
| Total income/(loss) from investment operations | (0.05 | ) | 0.60 | 0.40 | (0.30 | ) | 2.04 | (0.23 | ) | |||||||||||||||
| DISTRIBUTIONS TO SHAREHOLDERS | ||||||||||||||||||||||||
| From net investment income | (0.50 | ) | (0.70 | ) | (0.70 | ) | (0.66 | ) | (0.63 | ) | (0.70 | ) | ||||||||||||
| From return of capital | – | – | – | (0.04 | ) | (0.07 | ) | (0.12 | ) | |||||||||||||||
| Total distributions | (0.50 | ) | (0.70 | ) | (0.70 | ) | (0.70 | ) | (0.70 | ) | (0.82 | ) | ||||||||||||
| INCREASE/(DECREASE) IN NET ASSET VALUE | (0.55 | ) | (0.10 | ) | (0.30 | ) | (1.00 | ) | 1.34 | (1.05 | ) | |||||||||||||
| NET ASSET VALUE, END OF PERIOD | $ | 9.14 | $ | 9.69 | $ | 9.79 | $ | 10.09 | $ | 11.09 | $ | 9.75 | ||||||||||||
| TOTAL RETURN(b) | (0.51 | )%(c) | 6.33 | %(c) | 4.19 | %(c) | (2.85 | )% | 21.33 | %(c) | (1.88 | )%(c)(d) | ||||||||||||
| RATIOS AND SUPPLEMENTAL DATA | ||||||||||||||||||||||||
| Net assets, end of period (in 000s) | $ | 24,987 | $ | 27,767 | $ | 36,233 | $ | 38,452 | $ | 41,519 | $ | 38,829 | ||||||||||||
| RATIOS TO AVERAGE NET ASSETS(e) | ||||||||||||||||||||||||
| Including incentive fees, interest expense and interest amortization/accretion on securities sold short: | ||||||||||||||||||||||||
| Expenses, gross | 3.37 | %(f) | 3.29 | % | 3.00 | % | 2.60 | % | 2.84 | % | 2.78 | % | ||||||||||||
| Expenses, net of fees waived/expenses reimbursed by Adviser | 2.77 | %(f) | 2.92 | % | 2.87 | % | 2.60 | % | 2.65 | % | 2.68 | % | ||||||||||||
| Excluding incentive fees, interest expense and interest amortization/accretion on securities sold short: | ||||||||||||||||||||||||
| Expenses, gross | 3.19 | %(f) | 2.96 | % | 2.72 | % | 2.59 | % | 2.78 | % | 2.69 | % | ||||||||||||
| Expenses, net of fees waived/expenses reimbursed by Adviser | 2.59 | %(f) | 2.59 | % | 2.59 | % | 2.59 | % | 2.59 | % | 2.59 | % | ||||||||||||
| Net investment income | 8.42 | %(f) | 9.91 | % | 9.36 | % | 5.60 | % | 6.87 | % | 6.93 | % | ||||||||||||
| PORTFOLIO TURNOVER RATE | 8 | %(g) | 19 | % | 23 | % | 26 | % | 49 | % | 39 | % | ||||||||||||
| BORROWINGS AT END OF YEAR | ||||||||||||||||||||||||
| Aggregate amount outstanding (000s) | $ | 4,960 | $ | 3,562 | $ | 3,879 | $ | – | $ | – | $ | – | ||||||||||||
| Asset coverage per $1,000 (000s) | $ | 42,644 | $ | 64,951 | $ | 66,093 | $ | – | $ | – | $ | – | ||||||||||||
| (a) | Per share numbers have been calculated using the average shares method. |
| (b) | Total returns shown are historical in nature and assume changes in share price, reinvestment of dividends and capital gains distribution, if any. Had the Adviser not absorbed a portion of Fund expenses, total returns would have been lower. Returns shown exclude applicable sales charges. |
| (c) | Includes adjustments in accordance with accounting principles generally accepted in the United States of America and, as such, the net asset values for financial reporting purposes and the returns based upon those net asset values may differ from net asset values and returns for shareholder transactions. |
| (d) | 0.10% of the Fund’s total return consists of a reimbursement by the Adviser for a loss on a transaction. Excluding this item, total return would have been (1.98)%. |
| (e) | Ratios do not include expenses of underlying investment companies and private investment funds in which the Fund invests. |
| (f) | Annualized. |
| (g) | Not annualized. |
See Notes to Consolidated Financial Statements.
| Semi-Annual Report | March 31, 2025 | 29 |
| Alternative Credit Income Fund – Class C | Financial Highlights |
| For a Share Outstanding Throughout the Years Presented |
| For the Six Months Ended March 31, 2025 (Unaudited) | Year Ended September 30, 2024 | Year Ended September 30, 2023 | Year Ended September 30, 2022 | Year Ended September 30, 2021 | Year Ended September 30, 2020 | |||||||||||||||||||
| NET ASSET VALUE, BEGINNING OF PERIOD | $ | 9.81 | $ | 9.90 | $ | 10.21 | $ | 11.21 | $ | 9.86 | $ | 10.92 | ||||||||||||
| INCOME FROM INVESTMENT OPERATIONS | ||||||||||||||||||||||||
| Net investment income(a) | 0.37 | 0.91 | 0.86 | 0.53 | 0.66 | 0.62 | ||||||||||||||||||
| Net realized and unrealized gain/(loss) on investments | (0.47 | ) | (0.37 | ) | (0.54 | ) | (0.90 | ) | 1.31 | (0.92 | ) | |||||||||||||
| Total income/(loss) from investment operations | (0.10 | ) | 0.54 | 0.32 | (0.37 | ) | 1.97 | (0.30 | ) | |||||||||||||||
| DISTRIBUTIONS TO SHAREHOLDERS | ||||||||||||||||||||||||
| From net investment income | (0.45 | ) | (0.63 | ) | (0.63 | ) | (0.59 | ) | (0.56 | ) | (0.66 | ) | ||||||||||||
| From return of capital | – | – | – | (0.04 | ) | (0.06 | ) | (0.10 | ) | |||||||||||||||
| Total distributions | (0.45 | ) | (0.63 | ) | (0.63 | ) | (0.63 | ) | (0.62 | ) | (0.76 | ) | ||||||||||||
| INCREASE/(DECREASE) IN NET ASSET VALUE | (0.55 | ) | (0.09 | ) | (0.31 | ) | (1.00 | ) | 1.35 | (1.06 | ) | |||||||||||||
| NET ASSET VALUE, END OF PERIOD | $ | 9.26 | $ | 9.81 | $ | 9.90 | $ | 10.21 | $ | 11.21 | $ | 9.86 | ||||||||||||
| TOTAL RETURN(b) | (1.01 | )%(c) | 5.64 | %(c) | 3.33 | %(c) | (3.48 | )% | 20.36 | %(c) | (2.61 | )%(c)(d) | ||||||||||||
| RATIOS AND SUPPLEMENTAL DATA | ||||||||||||||||||||||||
| Net assets, end of period (in 000s) | $ | 27,064 | $ | 30,135 | $ | 40,947 | $ | 43,391 | $ | 47,640 | $ | 43,984 | ||||||||||||
| RATIOS TO AVERAGE NET ASSETS(e) | ||||||||||||||||||||||||
| Including incentive fees, interest expense and interest amortization/accretion on securities sold short: | ||||||||||||||||||||||||
| Expenses, gross | 4.06 | %(f) | 4.06 | % | 3.74 | % | 3.38 | % | 3.59 | % | 3.53 | % | ||||||||||||
| Expenses, net of fees waived/expenses reimbursed by Adviser | 3.52 | %(f) | 3.68 | % | 3.62 | % | 3.35 | % | 3.40 | % | 3.43 | % | ||||||||||||
| Excluding incentive fees, interest expense and interest amortization/accretion on securities sold short: | ||||||||||||||||||||||||
| Expenses, gross | 3.88 | %(f) | 3.73 | % | 3.46 | % | 3.37 | % | 3.53 | % | 3.44 | % | ||||||||||||
| Expenses, net of fees waived/expenses reimbursed by Adviser | 3.34 | %(f) | 3.34 | % | 3.34 | % | 3.34 | % | 3.34 | % | 3.34 | % | ||||||||||||
| Net investment income | 7.67 | %(f) | 9.22 | % | 8.61 | % | 4.87 | % | 6.12 | % | 6.19 | % | ||||||||||||
| PORTFOLIO TURNOVER RATE | 8 | %(g) | 19 | % | 23 | % | 26 | % | 49 | % | 39 | % | ||||||||||||
| BORROWINGS AT END OF YEAR | ||||||||||||||||||||||||
| Aggregate amount outstanding (000s) | $ | 4,960 | $ | 3,562 | $ | 3,879 | $ | – | $ | – | $ | – | ||||||||||||
| Asset coverage per $1,000 (000s) | $ | 42,644 | $ | 64,951 | $ | 66,093 | $ | – | $ | – | $ | – | ||||||||||||
| (a) | Per share numbers have been calculated using the average shares method. |
| (b) | Total returns shown are historical in nature and assume changes in share price, reinvestment of dividends and capital gains distribution, if any. Had the Adviser not absorbed a portion of Fund expenses, total returns would have been lower. |
| (c) | Includes adjustments in accordance with accounting principles generally accepted in the United States of America and, as such, the net asset values for financial reporting purposes and the returns based upon those net asset values may differ from net asset values and returns for shareholder transactions. |
| (d) | 0.10% of the Fund’s total return consists of a reimbursement by the Adviser for a loss on a transaction. Excluding this item, total return would have been (2.71)%. |
| (e) | Ratios do not include expenses of underlying investment companies and private investment funds in which the Fund invests. |
| (f) | Annualized. |
| (g) | Not annualized. |
See Notes to Consolidated Financial Statements.
| 30 | www.altcif.com |
| Alternative Credit Income Fund – Class W | Financial Highlights |
| For a Share Outstanding Throughout the Years Presented |
| For the Six Months Ended March 31, 2025 (Unaudited) | Year Ended September 30, 2024 | Year Ended September 30, 2023 | Year Ended September 30, 2022 | Year Ended September 30, 2021 | Year Ended September 30, 2020 | |||||||||||||||||||
| NET ASSET VALUE, BEGINNING OF PERIOD | $ | 9.69 | $ | 9.78 | $ | 10.08 | $ | 11.08 | $ | 9.74 | $ | 10.79 | ||||||||||||
| INCOME FROM INVESTMENT OPERATIONS | ||||||||||||||||||||||||
| Net investment income(a) | 0.40 | 0.96 | 0.93 | 0.61 | 0.74 | 0.69 | ||||||||||||||||||
| Net realized and unrealized gain/(loss) on investments | (0.46 | ) | (0.35 | ) | (0.53 | ) | (0.91 | ) | 1.30 | (0.92 | ) | |||||||||||||
| Total income/(loss) from investment operations | (0.06 | ) | 0.61 | 0.40 | (0.30 | ) | 2.04 | (0.23 | ) | |||||||||||||||
| DISTRIBUTIONS TO SHAREHOLDERS | ||||||||||||||||||||||||
| From net investment income | (0.50 | ) | (0.70 | ) | (0.70 | ) | (0.66 | ) | (0.63 | ) | (0.70 | ) | ||||||||||||
| From return of capital | – | – | – | (0.04 | ) | (0.07 | ) | (0.12 | ) | |||||||||||||||
| Total distributions | (0.50 | ) | (0.70 | ) | (0.70 | ) | (0.70 | ) | (0.70 | ) | (0.82 | ) | ||||||||||||
| INCREASE/(DECREASE) IN NET ASSET VALUE | (0.56 | ) | (0.09 | ) | (0.30 | ) | (1.00 | ) | 1.34 | (1.05 | ) | |||||||||||||
| NET ASSET VALUE, END OF PERIOD | $ | 9.13 | $ | 9.69 | $ | 9.78 | $ | 10.08 | $ | 11.08 | $ | 9.74 | ||||||||||||
| TOTAL RETURN(b) | (0.62 | )%(c) | 6.44 | %(c) | 4.19 | %(c) | (2.86 | )% | 21.35 | %(c) | (1.89 | )%(c)(d) | ||||||||||||
| RATIOS AND SUPPLEMENTAL DATA | ||||||||||||||||||||||||
| Net assets, end of period (in 000s) | $ | 41,148 | $ | 47,398 | $ | 53,123 | $ | 58,382 | $ | 61,915 | $ | 69,993 | ||||||||||||
| RATIOS TO AVERAGE NET ASSETS(e) | ||||||||||||||||||||||||
| Including incentive fees, interest expense and interest amortization/accretion on securities sold short: | ||||||||||||||||||||||||
| Expenses, gross | 3.40 | %(f) | 3.34 | % | 2.98 | % | 2.60 | % | 2.81 | % | 2.75 | % | ||||||||||||
| Expenses, net of fees waived/expenses reimbursed by Adviser | 2.77 | %(f) | 2.92 | % | 2.87 | % | 2.60 | % | 2.65 | % | 2.68 | % | ||||||||||||
| Excluding incentive fees, interest expense and interest amortization/accretion on securities sold short: | ||||||||||||||||||||||||
| Expenses, gross | 3.22 | %(f) | 3.01 | % | 2.70 | % | 2.59 | % | 2.75 | % | 2.66 | % | ||||||||||||
| Expenses, net of fees waived/expenses reimbursed by Adviser | 2.59 | %(f) | 2.59 | % | 2.59 | % | 2.59 | % | 2.59 | % | 2.59 | % | ||||||||||||
| Net investment income | 8.42 | %(f) | 9.86 | % | 9.36 | % | 5.63 | % | 6.89 | % | 6.92 | % | ||||||||||||
| PORTFOLIO TURNOVER RATE | 8 | %(g) | 19 | % | 23 | % | 26 | % | 49 | % | 39 | % | ||||||||||||
| BORROWINGS AT END OF YEAR | ||||||||||||||||||||||||
| Aggregate amount outstanding (000s) | $ | 4,960 | $ | 3,562 | $ | 3,879 | $ | – | $ | – | $ | – | ||||||||||||
| Asset coverage per $1,000 (000s) | $ | 42,644 | $ | 64,951 | $ | 66,093 | $ | – | $ | – | $ | – | ||||||||||||
| (a) | Per share numbers have been calculated using the average shares method. |
| (b) | Total returns shown are historical in nature and assume changes in share price, reinvestment of dividends and capital gains distribution, if any. Had the Adviser not absorbed a portion of Fund expenses, total returns would have been lower. |
| (c) | Includes adjustments in accordance with accounting principles generally accepted in the United States of America and, as such, the net asset values for financial reporting purposes and the returns based upon those net asset values may differ from net asset values and returns for shareholder transactions. |
| (d) | 0.10% of the Fund’s total return consists of a reimbursement by the Adviser for a loss on a transaction. Excluding this item, total return would have been (1.99)%. |
| (e) | Ratios do not include expenses of underlying investment companies and private investment funds in which the Fund invests. |
| (f) | Annualized. |
| (g) | Not annualized. |
See Notes to Consolidated Financial Statements.
| Semi-Annual Report | March 31, 2025 | 31 |
| Alternative Credit Income Fund – Class I | Financial Highlights |
For a Share Outstanding Throughout the Years Presented
| For the Six Months Ended March 31, 2025 (Unaudited) | Year Ended September 30, 2024 | Year Ended September 30, 2023 | Year Ended September 30, 2022 | Year Ended September 30, 2021 | Year Ended September 30, 2020 | |||||||||||||||||||
| NET ASSET VALUE, BEGINNING OF PERIOD | $ | 9.70 | $ | 9.80 | $ | 10.11 | $ | 11.11 | $ | 9.77 | $ | 10.82 | ||||||||||||
| INCOME FROM INVESTMENT OPERATIONS | ||||||||||||||||||||||||
| Net investment income(a) | 0.40 | 0.98 | 0.95 | 0.63 | 0.76 | 0.72 | ||||||||||||||||||
| Net realized and unrealized gain/(loss) on investments | (0.44 | ) | (0.35 | ) | (0.53 | ) | (0.90 | ) | 1.30 | (0.92 | ) | |||||||||||||
| Total income/(loss) from investment operations | (0.04 | ) | 0.63 | 0.42 | (0.27 | ) | 2.06 | (0.20 | ) | |||||||||||||||
| DISTRIBUTIONS TO SHAREHOLDERS | ||||||||||||||||||||||||
| From net investment income | (0.52 | ) | (0.73 | ) | (0.73 | ) | (0.69 | ) | (0.65 | ) | (0.73 | ) | ||||||||||||
| From return of capital | – | – | – | (0.04 | ) | (0.07 | ) | (0.12 | ) | |||||||||||||||
| Total distributions | (0.52 | ) | (0.73 | ) | (0.73 | ) | (0.73 | ) | (0.72 | ) | (0.85 | ) | ||||||||||||
| INCREASE/(DECREASE) IN NET ASSET VALUE | (0.56 | ) | (0.10 | ) | (0.31 | ) | (1.00 | ) | 1.34 | (1.05 | ) | |||||||||||||
| NET ASSET VALUE, END OF PERIOD | $ | 9.14 | $ | 9.70 | $ | 9.80 | $ | 10.11 | $ | 11.11 | $ | 9.77 | ||||||||||||
| TOTAL RETURN(b) | (0.42 | )%(c) | 6.60 | %(c) | 4.36 | %(c) | (2.58 | )% | 21.61 | %(c) | (1.61 | )%(c)(d) | ||||||||||||
| RATIOS AND SUPPLEMENTAL DATA | ||||||||||||||||||||||||
| Net assets, end of period (in 000s) | $ | 105,019 | $ | 113,632 | $ | 110,739 | $ | 110,512 | $ | 93,970 | $ | 87,634 | ||||||||||||
| RATIOS TO AVERAGE NET ASSETS(e) | ||||||||||||||||||||||||
| Including incentive fees, interest expense and interest amortization/accretion on securities sold short: | ||||||||||||||||||||||||
| Expenses, gross | 3.19 | %(f) | 3.15 | % | 2.74 | % | 2.36 | % | 2.59 | % | 2.52 | % | ||||||||||||
| Expenses, net of fees waived/expenses reimbursed by Adviser | 2.52 | %(f) | 2.67 | % | 2.62 | % | 2.35 | % | 2.40 | % | 2.43 | % | ||||||||||||
| Excluding incentive fees, interest expense and interest amortization/accretion on securities sold short: | ||||||||||||||||||||||||
| Expenses, gross | 3.01 | %(f) | 2.82 | % | 2.46 | % | 2.35 | % | 2.53 | % | 2.43 | % | ||||||||||||
| Expenses, net of fees waived/expenses reimbursed by Adviser | 2.34 | %(f) | 2.34 | % | 2.34 | % | 2.34 | % | 2.34 | % | 2.34 | % | ||||||||||||
| Net investment income | 8.68 | %(f) | 10.05 | % | 9.63 | % | 5.78 | % | 7.12 | % | 7.20 | % | ||||||||||||
| PORTFOLIO TURNOVER RATE | 8 | %(g) | 19 | % | 23 | % | 26 | % | 49 | % | 39 | % | ||||||||||||
| BORROWINGS AT END OF YEAR | ||||||||||||||||||||||||
| Aggregate amount outstanding (000s) | $ | 4,960 | $ | 3,562 | $ | 3,879 | $ | – | $ | – | $ | – | ||||||||||||
| Asset coverage per $1,000 (000s) | $ | 42,644 | $ | 64,951 | $ | 66,093 | $ | – | $ | – | $ | – | ||||||||||||
| (a) | Per share numbers have been calculated using the average shares method. |
| (b) | Total returns shown are historical in nature and assume changes in share price, reinvestment of dividends and capital gains distribution, if any. Had the Adviser not absorbed a portion of Fund expenses, total returns would have been lower. |
| (c) | Includes adjustments in accordance with accounting principles generally accepted in the United States of America and, as such, the net asset values for financial reporting purposes and the returns based upon those net asset values may differ from net asset values and returns for shareholder transactions. |
| (d) | 0.10% of the Fund’s total return consists of a reimbursement by the Adviser for a loss on a transaction. Excluding this item, total return would have been (1.71)%. |
| (e) | Ratios do not include expenses of underlying investment companies and private investment funds in which the Fund invests. |
| (f) | Annualized. |
| (g) | Not annualized. |
See Notes to Consolidated Financial Statements.
| 32 | www.altcif.com |
| Alternative Credit Income Fund – Class L | Financial Highlights |
For a Share Outstanding Throughout the Years Presented
| For the Six Months Ended March 31, 2025 (Unaudited) | Year Ended September 30, 2024 | Year Ended September 30, 2023 | Year Ended September 30, 2022 | Year Ended September 30, 2021 | Year Ended September 30, 2020 | |||||||||||||||||||
| NET ASSET VALUE, BEGINNING OF YEAR | $ | 9.70 | $ | 9.79 | $ | 10.09 | $ | 11.08 | $ | 9.75 | $ | 10.79 | ||||||||||||
| INCOME/(LOSS) FROM INVESTMENT OPERATIONS | ||||||||||||||||||||||||
| Net investment income(a) | 0.38 | 0.95 | 0.90 | 0.58 | 0.71 | 0.67 | ||||||||||||||||||
| Net realized and unrealized gain/(loss) on investments | (0.44 | ) | (0.36 | ) | (0.53 | ) | (0.90 | ) | 1.29 | (0.91 | ) | |||||||||||||
| Total income/(loss) from investment operations | (0.06 | ) | 0.59 | 0.37 | (0.32 | ) | 2.00 | (0.24 | ) | |||||||||||||||
| DISTRIBUTIONS TO SHAREHOLDERS | ||||||||||||||||||||||||
| From net investment income | (0.49 | ) | (0.68 | ) | (0.67 | ) | (0.63 | ) | (0.60 | ) | (0.69 | ) | ||||||||||||
| From return of capital | – | – | – | (0.04 | ) | (0.07 | ) | (0.11 | ) | |||||||||||||||
| Total distributions | (0.49 | ) | (0.68 | ) | (0.67 | ) | (0.67 | ) | (0.67 | ) | (0.80 | ) | ||||||||||||
| INCREASE/(DECREASE) IN NET ASSET VALUE | (0.55 | ) | (0.09 | ) | (0.30 | ) | (0.99 | ) | 1.33 | (1.04 | ) | |||||||||||||
| NET ASSET VALUE, END OF YEAR | $ | 9.15 | $ | 9.70 | $ | 9.79 | $ | 10.09 | $ | 11.08 | $ | 9.75 | ||||||||||||
| TOTAL RETURN(b) | (0.70 | )%(c) | 6.17 | %(c) | 3.93 | %(c) | (3.01 | )% | 20.92 | %(c) | (2.04 | )%(c)(d) | ||||||||||||
| RATIOS AND SUPPLEMENTAL DATA | ||||||||||||||||||||||||
| Net assets, end of year or period (in 000s) | $ | 8,345 | $ | 8,868 | $ | 11,119 | $ | 11,930 | $ | 14,026 | $ | 12,656 | ||||||||||||
| RATIOS TO AVERAGE NET ASSETS(e) | ||||||||||||||||||||||||
| Including incentive fees, interest expense and interest amortization/accretion on securities sold short: | ||||||||||||||||||||||||
| Expenses, gross | 3.71 | %(f) | 3.64 | % | 3.25 | % | 2.89 | % | 3.11 | % | 3.04 | % | ||||||||||||
| Expenses, net of fees waived/expenses reimbursed by Adviser | 3.02 | %(f) | 3.17 | % | 3.12 | % | 2.85 | % | 2.90 | % | 2.93 | % | ||||||||||||
| Excluding incentive fees, interest expense and interest amortization/accretion on securities sold short: | ||||||||||||||||||||||||
| Expenses, gross | 3.53 | %(f) | 3.31 | % | 2.97 | % | 2.88 | % | 3.05 | % | 2.95 | % | ||||||||||||
| Expenses, net of fees waived/expenses reimbursed by Adviser | 2.84 | %(f) | 2.84 | % | 2.84 | % | 2.84 | % | 2.84 | % | 2.84 | % | ||||||||||||
| Net investment income | 8.17 | %(f) | 9.69 | % | 9.11 | % | 5.37 | % | 6.61 | % | 6.66 | % | ||||||||||||
| PORTFOLIO TURNOVER RATE | 8 | %(g) | 19 | % | 23 | % | 26 | % | 49 | % | 39 | % | ||||||||||||
| BORROWINGS AT END OF YEAR OR PERIOD | ||||||||||||||||||||||||
| Aggregate amount outstanding (000s) | $ | 4,960 | $ | 3,562 | $ | 3,879 | $ | – | $ | – | $ | – | ||||||||||||
| Asset coverage per $1,000 (000s) | $ | 42,644 | $ | 64,951 | $ | 66,093 | $ | – | $ | – | $ | – | ||||||||||||
| (a) | Per share numbers have been calculated using the average shares method. |
| (b) | Total returns shown are historical in nature and assume changes in share price, reinvestment of dividends and capital gains distribution, if any. Had the Adviser not absorbed a portion of Fund expenses, total returns would have been lower. |
| (c) | Includes adjustments in accordance with accounting principles generally accepted in the United States of America and, as such, the net asset values for financial reporting purposes and the returns based upon those net asset values may differ from net asset values and returns for shareholder transactions. |
| (d) | 0.10% of the Fund’s total return consists of a reimbursement by the Adviser for a loss on a transaction. Excluding this item, total return would have been (2.14)%. |
| (e) | Ratios do not include expenses of underlying investment companies and private investment funds in which the Fund invests. |
| (f) | Annualized. |
| (g) | Not annualized. |
See Notes to Consolidated Financial Statements.
| Semi-Annual Report | March 31, 2025 | 33 |
| Alternative Credit Income Fund | Notes to Consolidated Financial Statements |
March 31, 2025 (Unaudited)
1. ORGANIZATION
Alternative Credit Income Fund (the “Fund”) is a closed-end, diversified management Investment Company that is registered under the Investment Company Act of 1940, as amended (the "1940 Act"). The Fund is structured as an interval fund and continuously offers its shares. The Fund was organized as a Delaware statutory trust on December 11, 2014.
The Fund’s investment objectives are to produce current income and to achieve capital preservation with moderate volatility and low to moderate correlation to the broader equity markets. The Fund pursues its investment objectives by investing, under normal circumstances, at least 80% of its assets (defined as net assets plus the amount of any borrowing for investment purposes) in fixed-income and fixed-income related securities.
Sierra Crest Investment Management LLC (the “Adviser”) has served as the Fund’s investment adviser since October 31, 2020.
On February 3, 2020, the Fund formed a wholly-owned subsidiary, CIF Investments LLC, a Delaware corporation. To the extent permitted by the 1940 Act, the Fund may make investments through CIF Investments LLC, which is a pass-through entity.
On March 22, 2022, the Fund formed a wholly-owned taxable subsidiary, ACIF Master Blocker, LLC (the “Taxable Subsidiary”), a Delaware corporation, which is taxed as a corporation for U.S. federal income tax purposes. The Taxable Subsidiary allows the Fund to make equity investments in companies organized as pass-through entities while continuing to satisfy the requirements of a Regulated Investment Company under Subchapter M of the Internal Revenue Code of 1986, as amended (the “Code”).
2. SIGNIFICANT ACCOUNTING POLICIES
The following is a summary of significant accounting policies followed by the Fund in preparation of its consolidated financial statements. These policies are in conformity with U.S. generally accepted accounting principles (“U.S. GAAP”). The Fund is an investment company and follows the accounting and reporting guidance under Financial Accounting Standards Board (“FASB”) Accounting Standards Codification (“ASC”) Topic 946, Financial Services – Investment Companies. These consolidated financial statements reflect adjustments that in the opinion of the Fund are necessary for the fair presentation of the financial position and results of operations as of and for the periods presented herein.
The Fund is considered an investment company for financial reporting purposes under U.S. GAAP and therefore applies the accounting and reporting guidance applicable to investment companies. The preparation of the consolidated financial statements requires management to make estimates and assumptions that affect the reported amounts of assets and liabilities and disclosure of contingent assets and liabilities at the date of the financial statements and the reported amounts of income and expenses for the year. Actual results could differ from those estimates, and such difference could be material. In accordance with U.S. GAAP guidance on consolidation, the Fund will generally not consolidate its investment in a portfolio company other than an investment company subsidiary or a controlled operating company whose business consists of providing services to the Fund. Accordingly, the Fund consolidated the accounts of the Fund’s wholly-owned subsidiaries, CIF Investments LLC and the Taxable Subsidiary, in its consolidated financial statements. All significant intercompany balances and transactions have been eliminated in consolidation. All references made to the “Fund” herein include Alternative Credit Income Fund and its consolidated subsidiaries, except as stated otherwise.
Securities Transactions and Investment Income – Investment transactions are recorded on the trade date. Realized gains or losses on investments are calculated using the specific identification method for both financial statement and federal income tax purposes. Dividend income is recorded on the ex-dividend date and interest income is recorded on an accrual basis. Premiums on securities are amortized to the earliest call date and purchase discounts are accreted over the life of the respective securities using the effective interest method.
Loans are generally placed on non-accrual status when there is reasonable doubt that principal or interest will be collected in full. The Fund considers many factors relevant to an investment when placing it on or removing it from non-accrual status including, but not limited to, the delinquency status of the investment, economic and business conditions, the overall financial condition of the underlying investment, the value of the underlying collateral, bankruptcy status, if any, and any other facts or circumstances relevant to the investment. Accrued interest is generally reversed when a loan is placed on non-accrual status. Payments received on non-accrual loans may be recognized as income or applied to principal depending upon management’s judgment regarding collectability of the outstanding principal and interest. Generally non-accrual loans may be restored to accrual status when past due principal and interest is paid current and are likely to remain current based on management’s judgment.
Securities Valuation – Securities listed on an exchange are valued at the last reported sale price at the close of the regular trading session of the exchange on the business day the value is being determined, or in the case of securities listed on NASDAQ, at the NASDAQ Official Closing Price. In the absence of a sale, such securities shall be valued at the mid-price. Short-term investments that mature in 60 days or less may be valued at amortized cost, provided such valuations represent fair value. Investments in money market funds are valued at their respective net asset value (“NAV”).
| 34 | www.altcif.com |
| Alternative Credit Income Fund | Notes to Consolidated Financial Statements |
March 31, 2025 (Unaudited)
Structured credit and other similar debt securities including, but not limited to, collateralized loan obligations (“CLO”) debt and equity securities, asset-backed securities (“ABS”), commercial mortgage-backed securities (“CMBS”) and other securitized investments backed by certain debt or other receivables (collectively, “Structured Credit Securities”), are valued on the basis of valuations provided by dealers in those instruments and/or independent pricing services recommended by the Adviser and approved by the Fund’s board of trustees (the "Board", "Trustees", or "Board of Trustees"). In determining fair value, dealers and pricing services will generally use information with respect to transactions in the securities being valued, quotations from other dealers, market transactions in comparable securities, analyses and evaluations of various relationships between securities and yield to maturity information. The Adviser will, based on its reasonable judgment, select the dealer or pricing service quotation that most accurately reflects the fair market value of the Structured Credit Security while taking into account the information utilized by the dealer or pricing service to formulate the quotation in addition to any other relevant factors. In the event that there is a material discrepancy between quotations received from third-party dealers or the pricing services, the Adviser may (i) use an average of the quotations received or (ii) select an individual quotation that the Adviser, based upon its reasonable judgment, determines to be reasonable.
When price quotations for certain securities are not readily available, or if the available quotations are not believed to be reflective of market value by the Adviser, those securities will be valued at fair value as determined in good faith by the Adviser in its capacity as the Board of Trustees’ valuation designee pursuant to Rule 2a-5 under the 1940 Act. As fair valuation involves subjective judgments, the Fund cannot ensure that fair values determined by the Board or persons acting in their direction would accurately reflect the price that the Fund could obtain for a security if the security was sold. As the valuation designee, the Adviser acts under the Board of Trustees’ oversight. The Adviser’s fair valuation policies and procedures are approved by the Board of Trustees.
Fair valuation procedures may be used to value a substantial portion of the assets of the Fund. The Fund may use the fair value of a security to calculate its NAV when, for example, (1) a portfolio security is not traded in a public market or the principal market in which the security trades is closed, (2) trading in a portfolio security is suspended and not resumed prior to the normal market close, (3) a portfolio security is not traded in significant volume for a substantial period, or (4) the Adviser determines that the quotation or price for a portfolio security provided by a broker-dealer or independent pricing service is inaccurate.
The fair value of securities may be difficult to determine and thus judgment plays a greater role in the valuation process. The fair valuation methodology may include or consider the following guidelines, as appropriate: (1) evaluation of all relevant factors, including but not limited to, pricing history, current market level and supply and demand of the respective security; (2) comparison to the values and current pricing of securities that have comparable characteristics; (3) knowledge of historical market information with respect to the security; and (4) other factors relevant to the security which would include, but not be limited to, duration, yield, fundamental analytical data, the Treasury yield curve and credit quality.
Valuation of Private Investment Funds – The Fund invests a portion of its assets in private investment funds (“Private Investment Funds”). Private Investment Funds, including an investment in Great Lakes Funding II LLC (“Great Lakes II Joint Venture”), value their investment assets at fair value and generally report a NAV or its equivalent in accordance with U.S. GAAP on a calendar quarter basis. The Fund has elected to apply the practical expedient and to value its investments in Private Investment Funds at their respective NAVs at each quarter-end in accordance with U.S. GAAP. For non-calendar quarter-end days, the Valuation Committee estimates the fair value of each Private Investment Fund by adjusting the most recent NAV for such Private Investment Fund, as necessary, by the change in a relevant benchmark that the Valuation Committee has deemed to be representative of the underlying securities in the Private Investment Fund.
Loan Participation and Assignments – The Fund invests in debt instruments, which are interests in amounts owed to lenders (the “Lenders”) by corporate, governmental or other borrowers. The Fund’s investments in loans may be in the form of direct investments, loans originated by the Fund, participations in loans or assignments of all or a portion of the loans from third parties or exposure to investments in loans through investment in Private Investment Funds or other pooled investment vehicles. When the Fund purchases an interest in a loan in the form of an assignment, the Fund acquires all of the direct rights and obligations of a lender (as such term is defined in the related credit agreement), including the right to vote on amendments or waivers of such credit agreement. However, the Fund generally has no right to enforce compliance with the terms of the loan agreement with the borrower. Instead, the administration of the loan agreement is often performed by a bank or other financial institution (the “Agent”) that acts as agent for the Lenders. Circumstances may arise in connection with which the Agent takes action that contradicts the will of the Lenders. For example, under certain circumstances, an Agent may refuse to declare the borrower in default, despite having received a notice of default from the Lenders. When the Fund purchases an interest in a loan in the form of a participation, the Fund purchases such participation interest from another existing Lender, and consequently, the Fund does not obtain the rights and obligations of the Lenders under the credit agreement, such as the right to vote on amendments or waivers. The Fund has the right to receive payments of principal, interest and any fees to which it is entitled only from the Lender from which the Fund has received that participation interest. In this instance, the Fund is subject to both the credit risk of the borrower and the credit risk of the Lender that sold the Fund such participation interest.
| Semi-Annual Report | March 31, 2025 | 35 |
| Alternative Credit Income Fund | Notes to Consolidated Financial Statements |
March 31, 2025 (Unaudited)
Unfunded Commitments – The Fund may enter into unfunded loan commitments, which are contractual obligations for future funding, such as delayed draw term loans or revolving credit arrangements. Unfunded loan commitments represent a future obligation in full, even though a percentage of the notional loan amounts may not be utilized by the borrower. The Fund may receive a commitment fee based on the undrawn portion of the underlying line of credit portion of a floating rate loan.
Additionally, when the Fund invests in a Private Investment Fund, the Fund makes a commitment to invest a specified amount of capital in the applicable Private Investment Fund. The capital commitment may be drawn by the general partner of the Private Investment Fund either all at once or through a series of capital calls at the discretion of the general partner. The unfunded commitment represents the portion of the Fund’s overall capital commitment to a particular Private Investment Fund that has not yet been called by the general partner of the Private Investment Fund.
As of March 31, 2025, the Fund had unfunded commitments of $23,635,580.
Short Sales – The Fund may sell securities short. To do this the Fund will borrow and then sell (take short positions in) securities. To complete such a transaction, the Fund must borrow the security to deliver to the buyer. The Fund is then obligated to replace, or cover, the security borrowed by purchasing it in the open market at some later date. The Fund will generally have to pay a fee or premium to borrow a security and be obligated to repay the lender any dividend or interest that accrues on those securities during the period of the loan. The Fund bears the risk of a loss, unlimited in size, if the market price of the security increases between the date of the short sale and the date on which the Fund replaces the borrowed security. The Fund will realize a gain, limited to the price that the Fund sold the security short, if the security declines in value between those dates. There can be no assurance that securities necessary to cover a short position will be available for purchase. To mitigate leverage risk, the Fund will segregate liquid assets (which may include its long positions) at least equal to its short position exposure, marked-to-market daily.
Foreign Currency–Investment securities and other assets and liabilities denominated in foreign currencies are translated into U.S. dollar amounts at the date of valuation. Purchases and sales of investment securities and income and expense items denominated in foreign currencies are translated into U.S. dollar amounts on the respective dates of such transactions. The Fund does not isolate that portion of the results of operations resulting from changes in foreign exchange rates on investments from the fluctuations arising from changes in market prices of securities held. Such fluctuations are included with the net realized and unrealized gain or loss from investments. Reported net realized foreign exchange gains or losses arise from sales of foreign currencies, currency gains or losses realized between the trade and settlement dates on securities transactions, and the difference between the amounts of dividends, interest, and foreign withholding taxes recorded on the Fund's books and the U.S. dollar equivalent of the amounts actually received or paid. Net unrealized foreign exchange gains and losses arise from changes in the fair values of assets and liabilities, other than investments in securities at fiscal period end, resulting from changes in exchange rates.
Fair Value Measurements – A three-tier hierarchy has been established to classify fair value measurements for disclosure purposes. Inputs refer broadly to the assumptions that market participants would use in pricing the asset or liability, including assumptions about risk. Inputs may be observable or unobservable. Observable inputs are inputs that reflect the assumptions market participants would use in pricing the asset or liability that are developed based on market data obtained from sources independent of the reporting entity. Unobservable inputs are inputs that reflect the reporting entity’s own assumptions about the assumptions market participants would use in pricing the asset or liability that are developed based on the best information available. In accordance with U.S. GAAP guidance on fair value measurements and disclosure, the Fund discloses the fair value of its investments in a hierarchy that categorizes the inputs to valuation techniques used to measure the fair value.
Various inputs are used in determining the fair value of the Fund’s investments. These inputs are categorized in the following hierarchy under applicable accounting guidance:
| Level 1 – | Unadjusted quoted prices in active markets for identical, unrestricted assets or liabilities that the Fund has the ability to access at the measurement date; |
| Level 2 – | Quoted prices in markets that are not active, or quoted prices for similar assets or liabilities in active markets, or inputs other than quoted prices that are observable (either directly or indirectly) for substantially the full term of the asset or liability at the measurement date; and |
| Level 3 – | Significant unobservable prices or inputs (including the Fund’s own assumptions in determining the fair value of investments) where there is little or no market activity for the asset or liability at the measurement date. |
The availability of observable inputs can vary from security to security and is affected by a wide variety of factors, including, for example, the type of security, whether the security is new and not yet established in the marketplace, the liquidity of markets and other characteristics particular to the security. To the extent that valuation is based on models or inputs that are less observable or unobservable in the market, the determination of fair value requires more judgment. Accordingly, the degree of judgment exercised in determining fair value is greatest for instruments categorized in Level 3.
| 36 | www.altcif.com |
| Alternative Credit Income Fund | Notes to Consolidated Financial Statements |
March 31, 2025 (Unaudited)
An investment level within the fair value hierarchy is based on the lowest level input, individually or in the aggregate, that is significant to fair value measurement. The valuation techniques used by the Fund to measure fair value maximizes the use of observable inputs and minimizes the use of unobservable inputs.
The inputs or methodologies used for valuing securities are not necessarily an indication of the risk or liquidity associated with investing in those securities. The following is a summary of the fair values according to the inputs used in valuing the Fund’s investments as of March 31, 2025:
| Investments in Securities at Value | Level 1 | Level 2 | Level 3 | Total | ||||||||||||
| Bank Loans(a) | ||||||||||||||||
| Communication Services | $ | – | $ | – | $ | 5,529,933 | $ | 5,529,933 | ||||||||
| Consumer Discretionary | – | – | 9,104,361 | 9,104,361 | ||||||||||||
| Consumer Staples | – | – | 13,452,097 | 13,452,097 | ||||||||||||
| Financials | – | – | 21,359,831 | 21,359,831 | ||||||||||||
| Health Care | – | – | 16,708,774 | 16,708,774 | ||||||||||||
| Industrials | – | – | 12,836,908 | 12,836,908 | ||||||||||||
| Information Technology | – | – | 38,129,691 | 38,129,691 | ||||||||||||
| Common Equity(a) | ||||||||||||||||
| Communication Services | – | – | – | – | ||||||||||||
| Consumer Discretionary | – | 1,087,361 | – | 1,087,361 | ||||||||||||
| Diversified | 10,359,716 | – | 933,786 | 11,293,502 | ||||||||||||
| Financials | – | – | 1,657,470 | 1,657,470 | ||||||||||||
| Health Care | – | – | 495,214 | 495,214 | ||||||||||||
| Industrials | – | – | 1,040,703 | 1,040,703 | ||||||||||||
| Information Technology | – | – | 27,173 | 27,173 | ||||||||||||
| Real Estate | – | 4,128,997 | – | 4,128,997 | ||||||||||||
| Asset Backed Securities(a) | ||||||||||||||||
| Financials | – | 3,078,148 | 5,041,262 | 8,119,410 | ||||||||||||
| Corporate Bonds(a) | ||||||||||||||||
| Communications | – | 1,936,975 | – | 1,936,975 | ||||||||||||
| Consumer Discretionary | – | – | – | – | ||||||||||||
| Financials | – | – | 2,103,885 | 2,103,885 | ||||||||||||
| Industrials | – | 752,400 | – | 752,400 | ||||||||||||
| Equipment Financing(a) | ||||||||||||||||
| Financials | – | – | 1,174,080 | 1,174,080 | ||||||||||||
| Interval Fund(a) | ||||||||||||||||
| Diversified | 4,165,365 | – | – | 4,165,365 | ||||||||||||
| Preferred Stock(a) | ||||||||||||||||
| Consumer Discretionary | – | – | 7,013,988 | 7,013,988 | ||||||||||||
| Health Care | – | – | 156,469 | 156,469 | ||||||||||||
| Industrials | – | – | 200,000 | 200,000 | ||||||||||||
| Warrants(a) | ||||||||||||||||
| Consumer Discretionary | – | 273,632 | 8,089 | 281,721 | ||||||||||||
| Financials | – | – | 376,924 | 376,924 | ||||||||||||
| Information Technology | – | – | – | – | ||||||||||||
| Short-Term Investment | 7,645,208 | – | – | 7,645,208 | ||||||||||||
| Derivatives(a) | ||||||||||||||||
| Consumer Discretionary | – | – | – | – | ||||||||||||
| TOTAL | $ | 22,170,289 | $ | 11,257,513 | $ | 137,350,638 | $ | 170,778,440 | ||||||||
| Investments measured at net asset value(a) | $ | 38,357,549 | ||||||||||||||
| Total Investments, at fair value | $ | 209,135,989 | ||||||||||||||
| (a) | For detailed descriptions, see the accompanying Consolidated Schedule of Investments. |
| Semi-Annual Report | March 31, 2025 | 37 |
| Alternative Credit Income Fund | Notes to Consolidated Financial Statements |
March 31, 2025 (Unaudited)
The following table provides a reconciliation of the beginning and ending balances of investments for which the Fund has used Level 3 inputs to determine the fair value:
| Investments in Securities at Value | Fair Value as of September 30, 2024 | Purchases | Sales | Accretion of original issue discount | Realized Gain (Loss) | Change in Unrealized Appreciation/ (Depreciation) | Fair Value as of March 31, 2025 | Net change in unrealized appreciation/ (depreciation) included in the Statement of Operations attributable to Level 3 investments held at March 31, 2025 | ||||||||||||||||||||||||
| Bank Loans | ||||||||||||||||||||||||||||||||
| Communication Services | $ | 7,294,705 | $ | 899,373 | $ | (2,732,134 | ) | $ | 109,004 | $ | - | $ | (41,015 | ) | $ | 5,529,933 | $ | (15,630 | ) | |||||||||||||
| Consumer Discretionary | 10,744,850 | - | (81,692 | ) | 11,486 | - | (1,570,283 | ) | 9,104,361 | (1,570,283 | ) | |||||||||||||||||||||
| Consumer Staples | 13,031,158 | 453,952 | (10,000 | ) | (93,225 | ) | - | 70,212 | 13,452,097 | 70,212 | ||||||||||||||||||||||
| Financials | 19,968,011 | 1,916,698 | (641,001 | ) | 59,445 | - | 56,678 | 21,359,831 | 56,678 | |||||||||||||||||||||||
| Healthcare | 17,109,639 | 526,538 | (557,197 | ) | 20,981 | - | (391,187 | ) | 16,708,774 | (391,187 | ) | |||||||||||||||||||||
| Industrials | 12,995,900 | 4,091,023 | (3,944,103 | ) | 172,498 | (71,673 | ) | (406,737 | ) | 12,836,908 | (364,140 | ) | ||||||||||||||||||||
| Information Technology | 30,999,246 | 9,371,484 | (1,351,299 | ) | 96,659 | (261,739 | ) | (724,660 | ) | 38,129,691 | (1,053,094 | ) | ||||||||||||||||||||
| Common Equity | ||||||||||||||||||||||||||||||||
| Communication Services | 21,504 | - | - | - | - | (21,504 | ) | - | (21,504 | ) | ||||||||||||||||||||||
| Consumer Discretionary | 4,846,156 | - | - | - | - | (4,846,156 | ) | - | (4,846,156 | ) | ||||||||||||||||||||||
| Diversified | - | 750,235 | - | - | - | 183,551 | 933,786 | 183,551 | ||||||||||||||||||||||||
| Financials | 1,945,982 | 3,151 | - | - | - | (291,663 | ) | 1,657,470 | (291,663 | ) | ||||||||||||||||||||||
| Healthcare | 436,136 | - | - | - | - | 59,078 | 495,214 | 59,078 | ||||||||||||||||||||||||
| Industrials | 70,630 | 972,204 | - | - | - | (2,131 | ) | 1,040,703 | (2,131 | ) | ||||||||||||||||||||||
| Information Technology | - | - | - | - | - | 27,173 | 27,173 | 27,173 | ||||||||||||||||||||||||
| Asset Backed Securities | ||||||||||||||||||||||||||||||||
| Financials | 6,498,805 | - | (814,791 | ) | 792,664 | - | (1,435,416 | ) | 5,041,262 | (1,435,416 | ) | |||||||||||||||||||||
| Corporate Bonds | ||||||||||||||||||||||||||||||||
| Financials | 2,187,886 | - | (84,001 | ) | - | - | - | 2,103,885 | - | |||||||||||||||||||||||
| Equipment Financing | ||||||||||||||||||||||||||||||||
| Financials | 1,456,280 | - | (282,200 | ) | - | - | - | 1,174,080 | - | |||||||||||||||||||||||
| Preferred Stock | ||||||||||||||||||||||||||||||||
| Consumer Discretionary | 6,639,500 | 235,243 | - | 186 | - | 139,059 | 7,013,988 | 139,059 | ||||||||||||||||||||||||
| Healthcare | 135,546 | - | - | - | - | 20,923 | 156,469 | 20,923 | ||||||||||||||||||||||||
| Industrials | 200,000 | - | - | - | - | - | 200,000 | - | ||||||||||||||||||||||||
| Warrants | ||||||||||||||||||||||||||||||||
| Consumer Discretionary | 18,560 | - | - | - | - | (10,471 | ) | 8,089 | (10,471 | ) | ||||||||||||||||||||||
| Financials | 386,070 | - | - | - | - | (9,146 | ) | 376,924 | (9,146 | ) | ||||||||||||||||||||||
| Information Technology | - | - | - | - | - | - | - | - | ||||||||||||||||||||||||
| Derivatives | ||||||||||||||||||||||||||||||||
| Consumer Discretionary | - | - | - | - | - | - | - | - | ||||||||||||||||||||||||
| Total | $ | 136,986,564 | $ | 19,219,901 | $ | (10,498,418 | ) | $ | 1,169,698 | $ | (333,412 | ) | $ | (9,193,695 | ) | $ | 137,350,638 | $ | (9,454,147 | ) | ||||||||||||
| 38 | www.altcif.com |
| Alternative Credit Income Fund | Notes to Consolidated Financial Statements |
March 31, 2025 (Unaudited)
There are significant unobservable valuation inputs for material Level 3 investments, and a change to the unobservable input may result in a significant change to the value of the investment. Level 3 investment valuation techniques and inputs as of March 31, 2025 are as follows:
| Asset Category | Fair Value at March 31, 2025 | Valuation Technique | Unobservable Input(a) | Range of Input (Weighted Average)(b) | ||||||||
| Bank Loans | ||||||||||||
| Communication Services | $ | 5,529,933 | Discounted Cash Flows | Market Yield | 13.4% | |||||||
| Consumer Discretionary | 4,683,885 | Discounted Cash Flows | Market Yield | 9.8% - 15.2% (11.1%) | ||||||||
| Consumer Discretionary | 2,481,870 | Market | Broker/Dealer Quotes | N/A | ||||||||
| Consumer Discretionary | 1,938,606 | Enterprise Market Value | Recovery Percentage | 19.40% | ||||||||
| Consumer Staples | 11,136,859 | Discounted Cash Flows | Market Yield | 11.9% - 25.0% (20.3%) | ||||||||
| Consumer Staples | 2,315,238 | Market | Broker/Dealer Quotes | N/A | ||||||||
| Financials | 21,359,831 | Discounted Cash Flows | Market Yield | 7.1% - 18.5% (12.6%) | ||||||||
| Healthcare | 11,358,761 | Discounted Cash Flows | Market Yield | 12.9% - 16.6% (14.6%) | ||||||||
| Healthcare | 5,350,013 | Market | Broker/Dealer Quotes | N/A | ||||||||
| Industrials | 9,722,532 | Discounted Cash Flows | Market Yield | 12.1% - 17.3% (14.5%) | ||||||||
| Industrials | 3,114,376 | Market | Broker/Dealer Quotes | N/A | ||||||||
| Information Technology | 22,169,585 | Discounted Cash Flows | Market Yield | 7.4% - 30.1% (15.4%) | ||||||||
| Information Technology | 2,159,497 | Enterprise Market Value | EBITDA Multiple | 6.1x | ||||||||
| Information Technology | 7,737,680 | Market | Broker/Dealer Quotes | N/A | ||||||||
| Information Technology | 6,062,929 | Recent Transaction | Transaction Price | $1.0 | ||||||||
| Asset Backed Securities | ||||||||||||
| Financials | 5,041,262 | Discounted Cash Flows | Market Yield | 0.0% - 18.6% (17.3%) | ||||||||
| Corporate Bonds | ||||||||||||
| Financials | 2,103,885 | Discounted Cash Flows | Market Yield | 12.8% | ||||||||
| Common Equity | ||||||||||||
| Financials | 1,657,470 | Enterprise Market Value | EBITDA Multiple | 7.5x | ||||||||
| Financials | 933,786 | Market | Broker/Dealer Quotes | N/A | ||||||||
| Healthcare | 495,214 | Enterprise Market Value | EBITDA Multiple | 10.2x - 17.8x (14.4x) | ||||||||
| Industrials | 878,443 | Enterprise Value | Book value of equity (asset) | 1.0x | ||||||||
| Industrials | 162,260 | Recent Transaction | Transaction Price | $1.0 | ||||||||
| Information Technology | 27,173 | Waterfall Analysis | LTM / NCY Revenue Multiple | 2.74x | ||||||||
| Equipment Financing | ||||||||||||
| Financials | 1,174,080 | Discounted Cash Flows | Market Yield | 10.8% | ||||||||
| Preferred Stock | ||||||||||||
| Consumer Discretionary | 5,545,074 | Discounted Cash Flows | Market Yield | 13.0% | ||||||||
| Consumer Discretionary | 1,468,914 | Enterprise Value | Stock Price | $1,840 - $43,280,000.0 | ||||||||
| ($5,890,489.2) | ||||||||||||
| Time | 3.0 - 4.7 (3.2) | |||||||||||
| Volatility | 54.5% - 58.6% (55.1%) | |||||||||||
| Healthcare | 156,469 | Discounted Cash Flows | Market Yield | 18.1% | ||||||||
| Industrials | 200,000 | Enterprise Value | Book value of equity (asset) | 1.0x | ||||||||
| Warrants | ||||||||||||
| Consumer Discretionary | 8,089 | Enterprise Value | Stock Price | $43,280,000 | ||||||||
| Time | 4.7 | |||||||||||
| Volatility | 58.6% | |||||||||||
| Financials | 376,924 | Enterprise Value | Stock Price | $111.8 | ||||||||
| Time | 2.0 | |||||||||||
| Volatility | 35.0% | |||||||||||
| Total | $ | 137,350,638 | ||||||||||
| (a) | An increase in market yield would result in a decrease in fair value. A decrease in market yield would result in an increase in fair value. An increase in the transaction price would result in an increase in fair value. A decrease in the transaction price would result in a decrease in fair value. An increase in the EBITDA or Revenue multiple would result in an increase in fair value. A decrease in the EBITDA or Revenue multiple would result in a decrease in fair value. |
| (b) | The weighted averages disclosed in the table above were weighted by their relative fair value. |
Concentration of Credit Risk – The Fund places its cash with one banking institution, which is insured by the Federal Deposit Insurance Corporation (“FDIC”). The FDIC limit is $250,000. At various times throughout the year, the amount on deposit may exceed the FDIC limit and subject the Fund to a credit risk.
| Semi-Annual Report | March 31, 2025 | 39 |
| Alternative Credit Income Fund | Notes to Consolidated Financial Statements |
March 31, 2025 (Unaudited)
Federal and Other Taxes – No provision for income taxes, except for the Taxable Subsidiary, is included in the accompanying consolidated financial statements, as the Fund intends to distribute to shareholders all taxable investment income and realized gains and otherwise comply with Subchapter M of the Internal Revenue Code of 1986, as amended (the “Code”), applicable to regulated investment companies.
The Fund evaluates tax positions taken (or expected to be taken) in the course of preparing the Fund’s tax provisions to determine whether these positions meet a “more-likely-than-not” standard that, based on the technical merits, have a more than fifty percent likelihood of being sustained by a taxing authority upon examination. A tax position that meets the “more-likely-than-not” recognition threshold is measured to determine the amount of benefit to recognize in the consolidated financial statements.
As of and during the period ended March 31, 2025, the Fund did not have a liability for any unrecognized tax benefits. The Fund and the Taxable Subsidiary file U.S. federal, state and local tax returns as required. The Fund’s tax returns are subject to examination by the relevant tax authorities until expiration of the applicable statute of limitations, which is generally three years after the filing of the tax return for federal purposes and four years for most state returns. Tax returns for open years have incorporated no uncertain tax positions that require a provision for income taxes.
The Taxable Subsidiary records deferred tax assets or liabilities related to temporary book versus tax differences on the income or loss generated by the underlying equity investments held by the Taxable Subsidiary.
Distributions to Shareholders – Distributions from net investment income, if any, are declared and paid quarterly. Distributions from net realized capital gains, if any, are declared and paid annually and are recorded on the ex-dividend date. The character of income and gains to be distributed is determined in accordance with income tax regulations, which may differ from U.S. GAAP.
Early Withdrawal Charge – Selling brokers, or other financial intermediaries that have entered into distribution agreements with the Distributor (as defined below in Note 4), will receive a commission of (a) up to 1.00% of the purchase price of Class C shares and (b) up to 0.50% of the purchase of Class A shares of $1 million or more. Shareholders who tender for repurchase of such shareholder's Class C shares fewer than 365 days after the original purchase date will be subject to an early withdrawal charge of 1.00% of the original purchase price. Shareholders tendering Class A shares fewer than 365 days after the original purchase date will be subject to an early withdrawal charge of 0.50% of the original purchase price, which will be deducted from repurchase proceeds, if (i) the original purchase was for amounts of $1 million or more and (ii) the selling broker received the reallowance of the dealer-manager fee. The Distributor may waive the imposition of the early withdrawal charge in the event of shareholder death or shareholder disability. Any such waiver does not imply that the early withdrawal charge will be waived at any time in the future or that such early withdrawal charge will be waived for any other shareholder. Class A shares (with respect to purchases of less than $1 million) will not be subject to an early withdrawal charge.
Indemnification – The Fund indemnifies its officers and Trustees for certain liabilities that may arise from the performance of their duties to the Fund. Additionally, in the normal course of business, the Fund enters into contracts that contain a variety of representations and warranties and which provide general indemnities. The Fund’s maximum exposure under these arrangements is unknown, as this would involve future claims that may be made against the Fund that have not yet occurred. However, based on industry experience, the Fund expects the risk of loss due to these warranties and indemnities to be remote.
Segment Reporting - In accordance with ASC Topic 280 - Segment Reporting (“ASC 280”), the Company has determined that it has a single operating and reporting segment, the “Investment Management Segment”. As a result, the Company’s segment accounting policies are the same as described herein and the Company does not have any intra-segment sales or transfers of assets.
Recent Accounting Pronouncements - In November 2024, the FASB issued ASU 2024-03, Income Statement—Reporting Comprehensive Income—Expense Disaggregation Disclosures (“ASU 2024-03”), which requires disaggregated disclosure of certain costs and expenses, including purchases of inventory, employee compensation, depreciation, amortization and depletion, within relevant income statement captions. ASU 2024-03 is effective for fiscal years beginning after December 15, 2026, and interim periods beginning in the first quarter ended March 31, 2028. Early adoption and retrospective application is permitted. The Company is currently assessing the impact of this guidance, however, the Company does not expect a material impact on its consolidated financial statements.
| 40 | www.altcif.com |
| Alternative Credit Income Fund | Notes to Consolidated Financial Statements |
March 31, 2025 (Unaudited)
3. GREAT LAKES FUNDING II LLC
In August 2022, the Fund invested in Series A of Great Lakes Funding II LLC (the “Great Lakes II Joint Venture”), a joint venture with an investment strategy to underwrite and hold senior, secured unitranche loans made to middle-market companies. The Fund treats its investment in the Great Lakes II Joint Venture as a joint venture since an affiliate of the Adviser controls a 50% voting interest in the Great Lakes II Joint Venture. In connection with the launch of the Great Lakes II Joint Venture, the Fund entered into a series of transactions pursuant to which the Fund’s prior investment in BCP Great Lakes Holdings LP, a vehicle formed as a co-investment vehicle to facilitate the participation of certain co-investors to invest, directly or indirectly, in BCP Great Lakes Funding, LLC (the “Prior Great Lakes Joint Venture”) which the Fund invested in during the fourth quarter of 2022, and the corresponding assets held by the Prior Great Lakes Joint Venture in respect of the Fund’s investment in BCP Great Lakes Holdings LP, were transferred to the Great Lakes II Joint Venture in complete redemption of the Fund’s investment in BCP Great Lakes Holdings LP.
The Great Lakes II Joint Venture is a Delaware series limited liability company, and pursuant to the terms of the Great Lakes Funding II LLC Limited Liability Company Agreement (the “Great Lakes II LLC Agreement”), prior to the end of the investment period with respect to each series established under the Great Lakes II LLC Agreement, each member of the predecessor series would be offered the opportunity to roll its interests into any subsequent series of the Great Lakes II Joint Venture. The Fund does not pay any advisory fees in connection with its investment in the Great Lakes II Joint Venture. Certain other funds managed by the Adviser or its affiliates have also invested in the Great Lakes II Joint Venture.
The fair value of the Fund’s investment in the Great Lakes II Joint Venture as of March 31, 2025 was $391,098. Fair value has been determined utilizing the practical expedient in accordance with U.S. GAAP. Pursuant to the terms of the Great Lakes II LLC Agreement, the Fund generally may not affect any direct or indirect sale, transfer, assignment, hypothecation, pledge or other disposition of or encumbrance upon its interests in the Great Lakes II Joint Venture, except that the Fund may sell or otherwise transfer its interests with the consent of the managing members of the Great Lakes II Joint Venture or to an affiliate or a successor to substantially all of the assets of the Fund.
As of March 31, 2025, the Fund had a $86,687 unfunded commitment to the Great Lakes II Joint Venture.
4. ADVISORY FEES AND OTHER TRANSACTIONS WITH SERVICE PROVIDERS
Advisory Fees – On October 31, 2020, the Fund entered into a management agreement (the “Management Agreement”) with the Adviser. Under the terms of the Management Agreement, the Adviser provides certain investment advisory and administrative services to the Fund and in consideration of the advisory services provided, the Adviser is entitled to a fee consisting of two components — a base management fee and an incentive fee, or collectively "investment advisory fees".
The base management fee is payable monthly in arrears at an annual rate of 1.85% of the average daily net assets of the Fund. For the six months ended March 31, 2025, the Fund incurred $1,917,672 in base management fees.
The incentive fee is calculated and payable quarterly in arrears based upon the Fund’s “pre-incentive fee net investment income” for the immediately preceding quarter and is subject to a hurdle rate, expressed as a rate of return on the Fund’s “adjusted capital,” equal to 2.25% per quarter (or an annualized hurdle rate of 9.0%), subject to a “catch-up” feature. For this purpose, “pre-incentive fee net investment income” means interest income, dividend income and any other income accrued during the calendar quarter, less the Fund’s operating expenses for the quarter (including the management fee, expenses reimbursed to the Adviser and any interest expenses and distributions paid on any issued and outstanding preferred shares, but excluding the incentive fee). Pre-incentive fee net investment income includes, in the case of investments with a deferred interest feature (such as OID, debt instruments with paid-in-kind (“PIK”) interest and zero coupon securities), accrued income that the Fund has not yet received in cash. Pre-incentive fee net investment income does not include any realized capital gains, realized capital losses or unrealized capital appreciation or depreciation. “Adjusted capital” means the cumulative gross proceeds received by the Fund from the sale of shares (including pursuant to the Fund’s distribution reinvestment plan), reduced by amounts paid in connection with purchases of shares pursuant to the Fund’s share repurchase program.
No incentive fee is payable in any calendar quarter in which the Fund’s pre-incentive fee net investment income does not exceed the quarterly hurdle rate of 2.25%. For any calendar quarter in which the Fund’s pre-incentive fee net investment income is greater than the hurdle rate, but less than or equal to 2.8125%, the incentive fee will equal the amount of the Fund’s pre-incentive fee net investment income in excess of the hurdle rate. This portion of the Fund’s pre-incentive fee net investment income which exceeds the hurdle rate but is less than or equal to 2.8125% is referred to as the “catch-up.” The “catch-up” provision is intended to provide the Adviser with an incentive fee of 20.0% on all of the Fund’s pre-incentive fee net investment income when the Fund’s pre-incentive fee net investment income reaches 2.8125% in any calendar quarter. For any calendar quarter in which the Fund’s pre-incentive fee net investment income exceeds 2.8125% of adjusted capital, the incentive fee will equal 20.0% of pre-incentive fee net investment income. For the six months ended March 31, 2025, the Advisor earned an incentive fee of $0.
| Semi-Annual Report | March 31, 2025 | 41 |
| Alternative Credit Income Fund | Notes to Consolidated Financial Statements |
March 31, 2025 (Unaudited)
Under the Expense Limitation Agreement, dated October 31, 2020, the Adviser has contractually agreed to waive all or part of its management fees (excluding any incentive fee) and/or make payments to limit Fund expenses (excluding incentive fees, all borrowing costs, dividends, amortization/accretion and interest on securities sold short, brokerage commissions, acquired fund fees and expenses and extraordinary expenses) at least until January 31, 2026, such that the total annual operating expenses of the Fund do not exceed 2.59% per annum of Class A average daily net assets, 3.34% per annum of Class C average daily net assets, 2.59% per annum of Class W average daily net assets, 2.34% per annum of Class I average daily net assets, and 2.84% per annum of Class L average daily net assets. Fee waivers and expense payments may be recovered by the Adviser from the Fund, for a period of up to three years following the date of waiver or expense payment, if the Fund is able to make the repayment without exceeding the expense limitation in place at the time of waiver and the current expense limitation and the repayment is approved by the Board. For the six months ended March 31, 2025, the Adviser waived fees of $683,768 in accordance with the expense limitation agreement.
As of March 31, 2025, the following amounts may be subject to reimbursement to the Adviser based upon their potential expiration dates:
| 2025 | 2026 | 2027 | 2028 | |||||||||||||
| Alternative Credit Income Fund | $ | 2,469 | $ | 360,993 | $ | 1,054,309 | $ | 683,768 | ||||||||
During the six months ended March 31, 2025, the Adviser recovered previously waived fees under the Expense Limitation Agreement of $3,774.
During the six months ended March 31, 2025, the Adviser did not recover $264,355 of previously waived fees under the Expense Limitation Agreement which expired.
Fund Accounting Fees and Expenses – ALPS Fund Services, Inc. (“ALPS”) serves as the Fund’s administrator and accounting agent (the “Administrator”) and receives customary fees from the Fund for such services.
Transfer Agent – SS&C Global Investor & Distribution Solutions, Inc. (“SS&C GIDS”) (the “Transfer Agent”), an affiliate of ALPS, serves as transfer, dividend paying and shareholder servicing agent for the Fund.
Distributor – The Fund has entered into a distribution agreement with ALPS Distributors, Inc. (the “Distributor”), an affiliate of ALPS, to provide distribution services to the Fund. There are no fees paid to the Distributor pursuant to the distribution agreement. The Board has adopted, on behalf of the Fund, a shareholder servicing plan under which the Fund may compensate financial industry professionals for providing ongoing services in respect of clients with whom they have distributed shares of the Fund. Under the shareholder servicing plan, Class A, Class C, Class W and Class L shares are subject to a shareholder servicing fee at an annual rate of 0.25% of the average daily net assets attributable to that share class. For the six months ended March 31, 2025, the Class A, Class C, Class W and Class L shares incurred shareholder servicing fees of $118,129. The Class C and Class L shares also pay to the Distributor a distribution fee, pursuant to a distribution plan adopted by the Board, that are subject to annual rates equal to 0.75% and 0.25%, respectively, of the Fund’s average daily net assets attributable to Class C and Class L shares, respectively, and is payable on a quarterly basis. Class A, Class I and Class W shares are not currently subject to a distribution fee. For the six months ended March 31, 2025, Class C and Class L shares incurred $103,402 in distribution fees.
The Distributor acts as the Fund’s principal underwriter in a continuous public offering of the Fund’s shares. During the six months ended March 31, 2025, no fees were retained by the Distributor.
Trustees – Each Trustee who is not affiliated with the Fund or the Adviser receives an annual fee of $10,000, an additional $2,000 for attending the annual in-person meeting of the Board, and $500 for attending each of the remaining telephonic meetings, as well as reimbursement for any reasonable expenses incurred attending the meetings. None of the executive officers or interested Trustees receives compensation from the Fund.
5. INVESTMENT TRANSACTIONS
The cost of purchases and proceeds from the sale of securities, other than short-term securities, for the six months ended March 31, 2025 amounted to $17,547,989 and $17,252,864, respectively.
| 42 | www.altcif.com |
| Alternative Credit Income Fund | Notes to Consolidated Financial Statements |
March 31, 2025 (Unaudited)
6. CAPITAL SHARES
The Fund, pursuant to an exemptive order granted by the SEC on July 22, 2014, offers multiple classes of shares. Class A, Class C, Class W, and Class I shares commenced operations on April 20, 2015. Class L shares commenced operations on July 28, 2017. Class C, Class W and Class I shares are offered at NAV. Class A shares are offered at NAV plus a maximum sales charge of 5.75% and may also be subject to a 0.50% early withdrawal charge, which will be deducted from repurchase proceeds, for shareholders tendering shares fewer than 365 days after the original purchase date, if (i) the original purchase was for amounts of $1 million or more and (ii) the selling broker received the reallowance of the dealer-manager fee. Class C shares are subject to a 1.00% early withdrawal charge. Class L shares are offered at NAV plus a maximum sales charge of 4.25%. Each class represents an interest in the same assets of the Fund and classes are identical except for differences in their sales charge structures, ongoing service and distribution charges and early withdrawal charges. All classes of shares have equal voting privileges except that each class has exclusive voting rights with respect to its service and/or distribution plans. The Fund’s income, non-class specific expenses and realized and unrealized gains and losses are allocated proportionately daily based upon the relative net assets of each class. Class specific expenses, where applicable, include distribution fees, shareholder servicing fees, and networking fees.
Share Repurchase Program - As an interval fund, the Fund offers its shareholders the option of redeeming shares on a quarterly basis, at NAV, no less than 5% of the Fund’s issued and outstanding shares as of the close of regular business hours on the New York Stock Exchange on the Repurchase Pricing Date. If shareholders tender for repurchase more than 5% of the outstanding shares of the Fund, the Fund may, but is not required to, repurchase up to an additional 2% of the outstanding shares of the Fund. If the Fund determines not to repurchase up to an additional 2% of the outstanding shares of the Fund, or if more than 7% of the outstanding shares of the Fund are tendered, then the Fund will repurchase shares on a pro rata basis based upon the number of shares tendered by each shareholder. There can be no assurance that the Fund will be able to repurchase all shares that each shareholder has tendered. In the event of an oversubscribed offer, shareholders may not be able to tender all shares that they wish to tender and may have to wait until the next quarterly repurchase offer to tender the remaining shares, subject to any proration. Subsequent repurchase requests will not be given priority over other shareholder requests.
For the six-months ended March 31, 2025, the Fund completed two quarterly repurchase offers. In these repurchase offers, the Fund offered to repurchase up to 5% of the number of its outstanding shares (up to 7% at the discretion of the officers of the Fund) as of the Repurchase Pricing Dates. For the six-months ended March 31, 2025, each of the quarterly repurchase offers were oversubscribed such that pro-ration was required.
The result of those repurchase offers were as follows:
| Repurchase Offer # 1 | Repurchase Offer # 2 | |
| Commencement Date | September 12, 2024 | December 11, 2024 |
| Repurchase Request Deadline | October 10, 2024 | January 10, 2025 |
| Repurchase Pricing Date | October 10, 2024 | January 10, 2025 |
| Amount Repurchased | $11,388,002 | $10,767,346 |
| Shares Repurchased | 1,173,916 | 1,163,036 |
7. BANK LINE OF CREDIT
On October 4, 2023, the Fund entered into a revolving bank line of credit (the “Credit Facility”) with U.S. Bank National Association (“USB”). The Credit Facility has a committed, available facility size of $50 million. The Credit Facility is an evergreen facility terminable by either party upon 179 days of receipt of written notice. The Credit Facility is secured by a first-priority perfected security interest in all the Fund's assets with a facility fee of 0.25% per annum, payable quarterly, pro-rated for the life of the Credit Facility. If the Credit Facility is terminated, a commitment fee of 0.35% on the unused portion of the maximum facility size and the interest on the used portion is based on the Fund's option, either daily simple SOFR, 1 month SOFR plus the applicable margin of 1.80% or the USB Prime rate.
During the six months ended March 31, 2025, the Fund incurred $246,229 of interest and financing expenses related to the Credit Facility. Average borrowings during the six months ended March 31, 2025, and the average interest rate for the days the line of credit was outstanding during the six months ended March 31, 2025, were $4,057,390 and 4.96%, respectively. The largest outstanding borrowing during the six months ended March 31, 2025, was $5,002,895. As of March 31, 2025, the Fund had borrowings of $4,960,170 and an average stated interest rate of 4.75%. As of March 31, 2025, the Fund has borrowings denominated in a foreign currency of $3,460,170 (Cost: $3,554,410). As collateral for the Credit Facility, the Fund grants USB a first position security interest in and lien on substantially all securities of any kind or description held by the Fund in the pledge account.
Under the 1940 Act, the Fund is not permitted to incur indebtedness, including through the issuance of debt securities, unless immediately thereafter the Fund will have an asset coverage of at least 300%. In general, the term “asset coverage” for this purpose means the ratio which the value of the total assets of the Fund, less all liabilities and indebtedness not represented by senior securities, bears to the aggregate amount of senior securities representing indebtedness of the Fund. In addition, the Fund may be limited in its ability to declare any cash distribution on its capital stock or purchase its capital stock unless, at the time of such declaration or purchase, the Fund has an asset coverage (on its indebtedness) of at least 300% after deducting the amount of such distribution or purchase price, as applicable. As of March 31, 2025, our asset coverage ratio was 4,264%.
| Semi-Annual Report | March 31, 2025 | 43 |
| Alternative Credit Income Fund | Notes to Consolidated Financial Statements |
March 31, 2025 (Unaudited)
8. TAX BASIS INFORMATION
For the six months ended March 31, 2025, there were no permanent book- and tax-basis differences that resulted in reclassifications to paid-in capital.
The following information is computed on a tax basis for each item as of March 31, 2025:
| Gross Appreciation | Gross Depreciation (excess of tax cost over value) | Net Depreciation | Cost of Investments for Income Tax Purposes | |||||||||||||
| $ | 7,910,753 | $ | (35,367,624 | ) | $ | (27,456,871 | ) | $ | 236,592,860 | |||||||
The difference between book basis and tax basis distributable earnings and unrealized appreciation/(depreciation) is primarily attributable to the tax deferral of losses, investments in partnerships and certain other investments.
The tax characteristics of distributions paid for the year ended September 30, 2024, were as follows:
| Ordinary Income | Long-Term Capital Gain | Return of Capital | ||||||||||
| $ | 17,892,985 | $ | – | $ | – | |||||||
Under current law, capital losses maintain their character as short-term or long-term and are carried forward to the next tax year without expiration. As of the most recent fiscal year end, the following amounts are available as carry forwards to the next tax year:
| Short-Term Capital Losses | Long-Term Capital Losses | |||||||
| $ | 706,426 | $ | 9,739,116 | |||||
The Fund has formed a Taxable Subsidiary, which is taxed as a corporation for income tax purposes. The Taxable Subsidiary allows the Fund to make equity investments in companies organized as pass-through entities while continuing to satisfy the requirements of a RIC under the Code. The Taxable Subsidiary is a wholly owned subsidiary and consolidated in these financial statement statements for financial reporting purposes.
Deferred U.S. federal income taxes reflect the net tax effect of temporary differences between the carrying amount of assets and liabilities for financial reporting and U.S. federal income tax purposes. Components of deferred tax assets (liabilities) as of March 31, 2025, were as follows:
| As of March 31, 2025 | ||||
| Deferred tax assets: | ||||
| Net operating loss carryforwards | $ | - | ||
| Capital loss carryforwards | - | |||
| Other deferred tax assets | - | |||
| Less valuation allowance | - | |||
| Total deferred tax assets | $ | - | ||
| Deferred tax liabilities: | ||||
| Net unrealized appreciation/(depreciation) on investments | $ | 65,572 | ||
| Total deferred tax liabilities | $ | 65,572 | ||
| Net deferred tax liability | $ | 65,572 | ||
The Fund's income tax provision consists of the following as of March 31, 2025:
As of March 31, 2025 | ||||
| Current: | ||||
| Federal | $ | 46,198 | ||
| $ | 46,198 | |||
| Deferred and other: | ||||
| Federal and state | $ | 65,572 | ||
| $ | 65,572 | |||
| 44 | www.altcif.com |
| Alternative Credit Income Fund | Notes to Consolidated Financial Statements |
March 31, 2025 (Unaudited)
9. RISK FACTORS
In the normal course of business, the Fund faces certain risks and uncertainties. Set forth below is a summary of certain principal risks associated with the Fund. The following is not intended to be a complete list of all the potential risks associated with the Fund. For a more comprehensive list of potential risks the Fund may be subject to, please refer to the Fund’s Prospectus and Statement of Additional Information.
Credit Risk - It is possible that the Fund’s debt investments may not make scheduled interest and/or principal payments on their loans and/or debt securities, which may result in losses or reduced cash flow to the Fund, either or both of which may cause the Net Asset Value of, or the distributions by, the Fund to decrease. In addition, the credit quality of securities held by the Fund may fall if the underlying borrowers’ financial condition deteriorates. This also may negatively impact the value of and the Fund’s returns on its investment in such securities.
Debt Securities and Interest Rate Risks - Because the Fund invests in debt securities, the value of your investment in the Fund may fluctuate with changes in interest rates. Typically, a rise in market interest rates will cause a decline in the value of fixed rate or other debt instruments. If market interest rates increase, there is a significant risk that the value of the Fund’s investment in fixed rate debt securities may fall, and that it may be more difficult for the Fund to raise capital. Related risks include credit risk (the debtor may default) and prepayment risk (the debtor may pay its obligation early, reducing the amount of interest payments).
Investment Risk - An investment in the Fund involves a considerable amount of risk. Before making an investment decision, a prospective investor should (i) consider the suitability of this investment with respect to his, her or its investment objectives and personal situation and (ii) consider factors such as his, her or its personal net worth, income, age, risk tolerance and liquidity needs. An investment in the Fund’s shares is subject to investment risk, including the possible loss of the entire principal amount invested. At any point in time, an investment in the Fund’s shares may be worth less than the original amount invested, even after taking into account distributions paid by the Fund and the ability of shareholders to reinvest dividends
Leverage Risk - The Fund is permitted to obtain leverage using any form or combination of financial leverage instruments, including through funds borrowed from banks or other financial institutions (i.e., a credit facility), margin facilities, the issuance of preferred shares or notes and leverage attributable to reverse repurchase agreements, dollar rolls or similar transactions. The Fund may use leverage opportunistically and may choose to increase or decrease its leverage, or use different types or combinations of leveraging instruments, at any time based on the Fund’s assessment of market conditions and the investment environment. The use of leverage, such as borrowing money to purchase securities, will cause the Fund (or a Public Investment Fund or Private Investment Fund in which the Fund has invested) to incur additional expenses and significantly magnify the Fund’s losses in the event of underperformance of the Fund’s (or Public Investment Fund’s or Private Investment Fund’s) underlying investments.
Market Disruption Risk - Unexpected local, regional or global events, such as war; acts of terrorism; financial, political or social disruptions; natural, environmental or man-made disasters; climate-change and climate-related events; the spread of infectious illnesses or other public health issues; recessions and depressions; or other events may result in market volatility, may have long-term effects on the United States and worldwide financial markets and may cause further economic uncertainties in the United States and worldwide. The Fund cannot predict the effects of such events in the future on the U.S. economy and securities markets.
Public Investment Funds Risk - The Fund’s performance depends in part upon the performance of the Public Investment Fund managers and selected strategies, the adherence by such Public Investment Fund managers to such selected strategies, the instruments used by such Public Investment Fund managers and the Adviser’s ability to select Public Investment Fund managers and strategies and effectively allocate Fund assets among them. Fund shareholders will bear two layers of fees and expenses: (1) asset-based fees, incentive allocations or fees, and expenses at the Fund level and (2) asset-based fees, incentive allocations or fees, and expenses at the Public Investment Fund level.
Private Investment Funds Risk - The Fund’s performance depends in part upon the performance of the Private Investment Fund managers and selected strategies, the adherence by such Private Investment Fund managers to such selected strategies, the instruments used by such Private Investment Fund managers and the Adviser’s ability to select Private Investment Fund managers and strategies and effectively allocate Fund assets among them. Fund shareholders will bear two layers of fees and expenses: asset-based fees, incentive fees and allocations, and expenses at the Fund level, and asset-based fees, incentive fees and allocations, and expenses at the Private Investment Fund level.
| Semi-Annual Report | March 31, 2025 | 45 |
| Alternative Credit Income Fund | Notes to Consolidated Financial Statements |
March 31, 2025 (Unaudited)
Structured Products Risk - The Fund may invest in CDOs and other structured products, consisting of CBOs, CLOs and credit-linked notes. Holders of structured products bear risks of the underlying investments, index or reference obligation and are subject to counterparty risk. While certain structured products enable the investor to acquire interests in a pool of securities without the brokerage and other expenses associated with directly holding the same securities, investors in structured products generally pay their share of the structured product’s administrative and other expenses. Although it is difficult to predict whether the prices of indices and securities underlying structured products will rise or fall, these prices (and, therefore, the prices of structured products) will be influenced by the same types of political and economic events that affect issuers of securities and capital markets generally. If the issuer of a structured product uses shorter term financing to purchase longer term securities, the issuer may be forced to sell its securities at below market prices if it experiences difficulty in obtaining short-term financing, which may adversely affect the value of the structured products owned by the Fund. Certain structured products may be thinly traded or have a limited trading market. CLOs and credit-linked notes are typically privately offered and sold.
10. AFFILIATE TRANSACTIONS
The following investments represent affiliated investments transactions during the six months ended March 31, 2025, and the related positions as of March 31, 2025:
| Security Name | Fair Value as of September 30, 2024 | Purchases(a) | Sales(b) | Realized Gain (Loss) | Change in Unrealized Appreciation /(Depreciation) | Fair Value as of March 31, 2025 | Share/ Balance as of March 31, 2025 | Interest income/ Dividends / Payment-in-kind income | ||||||||||||||||||||||||
| EBSC Holdings LLC (Riddell, Inc.), Preferred | $ | 1,047,858 | $ | 53,219 | $ | – | $ | – | $ | 167,969 | $ | 1,269,046 | 1,103,518 | $ | 53,033 | |||||||||||||||||
| Great Lakes Funding II LLC, Series A | 392,756 | 35,810 | (10,936 | ) | – | (26,532 | ) | 391,098 | 408,051 | 28,706 | ||||||||||||||||||||||
| GreenPark Infrastructure, LLC Series A | 200,000 | – | – | – | – | 200,000 | 400 | – | ||||||||||||||||||||||||
| GreenPark Infrastructure, LLC Series M-1 | 70,630 | 809,944 | – | – | (2,131 | ) | 878,443 | 2,565 | (2,025 | ) | ||||||||||||||||||||||
| Mount Logan Funding 2018-1 LP | 5,536,208 | 710,711 | (228,741 | ) | – | (1,327,335 | ) | 4,690,843 | 7,798,575 | 710,711 | ||||||||||||||||||||||
| Opportunistic Credit Interval Fund | 5,676,149 | – | (1,481,162 | ) | (67,239 | ) | 37,617 | 4,165,365 | 362,837 | 191,906 | ||||||||||||||||||||||
| PMP OPCO, LLC, Delayed Draw Term Loan | (7,341 | ) | – | – | – | (31,725 | ) | (39,066 | ) | – | 6,469 | |||||||||||||||||||||
| PMP OPCO, LLC, First Lien Term Loan | 1,241,958 | 2,093 | (9,492 | ) | – | (49,146 | ) | 1,185,413 | 1,256,133 | 85,041 | ||||||||||||||||||||||
| PMP OPCO, LLC, Revolver | (2,630 | ) | – | – | – | (5,287 | ) | (7,917 | ) | – | 539 | |||||||||||||||||||||
| Portman Ridge Finance Corp. | 473,099 | – | – | – | (107,117 | ) | 365,982 | 25,504 | 31,370 | |||||||||||||||||||||||
| Princeton Medspa Partners, LLC, Preferred | 246,846 | 16,232 | – | – | (63,210 | ) | 199,868 | 274,109 | 16,232 | |||||||||||||||||||||||
| Princeton Medspa Partners, LLC, Put Option | – | – | – | – | – | – | 250,000 | – | ||||||||||||||||||||||||
| Princeton Medspa Partners, LLC, Warrant | 18,560 | – | – | – | (10,471 | ) | 8,089 | 0.01 | – | |||||||||||||||||||||||
| Riddell Inc., Delayed Draw Term Loan | (4,073 | ) | – | – | – | 4,073 | – | – | – | |||||||||||||||||||||||
| Riddell Inc., First Lien Term Loan | 3,550,691 | 5,947 | (45,454 | ) | – | 34,271 | 3,545,455 | 3,545,455 | 196,252 | |||||||||||||||||||||||
| Total | $ | 18,440,711 | $ | 1,633,956 | $ | (1,775,785 | ) | $ | (67,239 | ) | $ | (1,379,024 | ) | $ | 16,852,619 | $ | 1,318,234 | |||||||||||||||
| (a) | Purchases include increases in the cost basis of investments resulting from new portfolio investments, follow-on investments, accrued PIK and accretion of original issue discount. Purchases also include transfers into Affiliate classification. |
| (b) | Sales include decreases in the cost basis of investments resulting from principal repayments and sales. Sales also include transfers out of Affiliate classification. |
11. SUBSEQUENT EVENTS
The Fund has evaluated subsequent events through the date of issuance of the financial statements and has determined that there have been no events that have occurred that would require adjustments to our disclosures in the financial statements.
46 |
www.altcif.com |
| Alternative Credit Income Fund | Additional Information |
March 31, 2025 (Unaudited)
1. PROXY VOTING POLICIES AND VOTING RECORD
A description of the policies and procedures that the Fund uses to vote proxies relating to portfolio securities is available without charge upon request by calling toll-free 833-404-4103, or on the Securities and Exchange Commission’s (“SEC”) website at http://www.sec.gov. Information regarding how the Fund voted proxies relating to portfolio securities during the most recent 12-month period ended June 30th is available without charge upon request by calling toll-free 833-404-4103, or on the SEC’s website at http://www.sec.gov.
2. QUARTERLY PORTFOLIO HOLDINGS
The Fund files a complete listing of portfolio holdings for the Fund with the SEC as of the first and third quarters of each fiscal year on Form N-PORT. The filings are available upon request by calling 833-404-4103. Furthermore, you may obtain a copy of the filing on the SEC’s website at http://www.sec.gov.
3. APPROVAL OF INVESTMENT ADVISORY AGREEMENT
At a meeting held on November 26, 2024, the Board, including a majority of the Trustees who are not “interested persons” (as that term is defined in the 1940 Act) of the Fund (the “Independent Trustees”), considered the renewal of the Management Agreement between the Fund and the Adviser. In considering the renewal of the Management Agreement, the Trustees received materials specifically relating to the Adviser and the Management Agreement.
The Trustees considered the following material factors during their deliberations: (1) the nature, extent and quality of the services provided by the Adviser; (2) the investment performance of the Fund and other accounts managed by the Adviser; (3) the cost of services provided and the profits to be realized by the Adviser and its affiliates from the relationship with the Fund; (4) the extent to which economies of scale will be realized as the Fund grows; and (5) whether the fee levels reflect these economies of scale for the benefit of investors. The Trustees relied upon the advice of counsel and their own business judgment in determining the before-mentioned material factors to be considered in evaluating the Management Agreement and the weight to be given to each factor considered. The conclusions reached by the Trustees were based on a comprehensive evaluation of all of the information provided, including the Adviser’s responses to the Section 15(c) questionnaires provided in the Materials, and were not the result of any one factor. Moreover, each Trustee may have afforded different weight to the various factors in reaching his conclusions with respect to the renewal of the Management Agreement.
Nature, Extent and Quality of Service. The Board reviewed the Adviser’s business and current staffing and organizational structure, and discussed the nature, extent and quality of the services provided by the Adviser under the Management Agreement. The Board discussed the nature of the Adviser’s operations, the quality of the Adviser’s compliance infrastructure and the experience and background of all key personnel of its fund management team. The Board noted that the Adviser was an affiliate of BC Partners, and the Adviser leveraged the established fund support and administration infrastructure of the broader BC Partners/Sierra Crest organization, including its ability to leverage the collective scale of the Adviser and its affiliates when sourcing investment opportunities, receiving allocations and negotiating with third-party vendors. The Board discussed the organization’s significant investment in and commitment to hiring and retaining high quality professional personnel to support the Fund. The Board noted only one change to the key personnel serving the Fund since the last approval of the Management Agreement. The Board discussed the seasoned investment team, the role of the portfolio manager, and the oversight provided by the investment committee. The Board noted that the Adviser had reported no regulatory actions or compliance matters that would adversely impact the Adviser’s ability to serve as adviser to the Fund. The Board discussed cybersecurity initiatives undertaken by the Adviser to mitigate cybersecurity risks. The Board further considered the key risks associated with the Fund’s investment strategy and the policies and procedures adopted by the Adviser to mitigate those risks. They also discussed the Adviser’s services as Valuation Designee. The Board concluded that the Adviser had sufficient quality and depth of personnel, resources, investment methods and compliance policies and procedures essential to the continued performance of its duties under the Management Agreement. Accordingly, the Board agreed that the nature, overall quality and extent of the management services provided by the Adviser to the Fund were satisfactory.
Performance. The Board considered the performance of the Fund. Referring to the materials provided by the Adviser, the Board noted the Fund’s positive return of 6.82% for the 1-year period ended September 30, 2024, underperforming the peer funds selected by the Adviser. The Board also noted that the Fund’s Class I share underperformed the ICE BofA US High Yield Index and the Morningstar/LSTA Leveraged Loan index over the 1-year period ended September 30, 2024, but outperformed both benchmarks from Fund inception through September 30, 2024. They discussed the Adviser’s commentary regarding the factors that contributed to Fund performance, including among other things, limited use of leverage, which reduced downside risk amid market volatility during the period, a weighting toward floating rate loans in a high interest rate environment, and allocations to directly originated loans. The Board considered the objective of the Fund, and concluded that the Fund’s performance was satisfactory.
| Semi-Annual Report | March 31, 2025 | 47 |
| Alternative Credit Income Fund | Additional Information |
March 31, 2025 (Unaudited)
Fees and Expenses. The Board noted that the Adviser charged a 1.85% annual advisory fee based on the average net assets of the Fund and was entitled to a performance fee if income exceeded certain hurdles. They further noted that while the fee was higher than the average of the Adviser selected peer group, it was within the range of the Adviser selected peer group, and the Adviser had agreed to waive its fees to limit total annual Fund operating expenses, exclusive of certain fees, so as not to exceed 2.59%, 3.34%, 2.59%, 2.34% and 2.84% per annum of the Fund’s average daily net assets attributable to Class A, Class C, Class W, Class I and Class L shares, respectively. The Board considered the potential impact of the performance incentive fee which is calculated based upon the Fund’s pre-incentive fee net investment income for the immediately preceding quarter, and is subject to a hurdle rate, noting that during the last twelve months, the Adviser earned an incentive fee. The Board concluded that the advisory fee was not unreasonable.
Economies of Scale. The Board considered whether the Adviser had realized material economies of scale with respect to the management of the Fund. The Board discussed the growth projections provided by the Adviser in the 15(c) response materials and discussed the Adviser’s willingness to cap Fund operating expenses. The Board then discussed the benefit to shareholders of reduced overall expenses with continued Fund growth. After further discussion, the Board concluded that the absence of breakpoints at this time was acceptable, but that economies of scale would be revisited in the future should the Fund grow materially in size.
Profitability. The Board reviewed the summary financial information provided by the Adviser and noted that the Adviser made a profit (excluding interest expense and certain non-recurring expenses) related to the Fund during the twelve months ended September 30, 2024. It was noted that the profit margin was lower than other larger public asset managers. The Board discussed the costs associated with managing the Fund and noted that the profit of the Adviser did not appear unreasonable for the experience and resources of the Adviser, and the business risk assumed by the Adviser when it sponsored the launch of the Fund. The Board concluded that the Adviser’s profitability was not excessive.
Conclusion. Having requested and received such information from the Adviser as the Board of the Fund believed to be reasonably necessary to evaluate the terms of the Management Agreement, and as assisted by the advice of counsel, the Board concluded that renewal of the Management Agreement was in the best interests of the shareholders of the Fund.
| 48 | www.altcif.com |
| Alternative Credit Income Fund | Privacy Notice |
| March 31, 2025 (Unaudited) |
| FACTS | WHAT DOES ALTERNATIVE CREDIT INCOME FUND DO WITH YOUR PERSONAL INFORMATION? | |||
| Why? | Financial companies choose how they share your personal information. Federal law gives consumers the right to limit some but not all sharing. Federal law also requires us to tell you how we collect, share, and protect your personal information. Please read this notice carefully to understand what we do. | |||
| What? | The types of personal information we collect and share depend on the product or service you have with us. This information can include: | |||
| • | Social Security number | • | Purchase History | |
| • | Assets | • | Account Balances | |
| • | Retirement Assets | • | Account Transactions | |
| • | Transaction History | • | Wire Transfer Instructions | |
| • | Checking Account Information | |||
|
When you are no longer our customer, we continue to share your information as described in this notice. | ||||
| How? | All financial companies need to share customers’ personal information to run their everyday business. In the section below, we list the reasons financial companies can share their customers’ personal information; the reasons Alternative Credit Income Fund chooses to share; and whether you can limit this sharing. | |||
| REASONS WE CAN SHARE YOUR PERSONAL INFORMATION | Does
Alternative Credit Income Fund share? |
Can
you limit this sharing? | |
| For our everyday business purposes — such as to process your transactions, maintain your account(s), respond to court orders and legal investigations, or report to credit bureaus | Yes | No | |
| For our marketing purposes — to offer our products and services to you | No | We don’t share | |
| For joint marketing with other financial companies | No | We don’t share | |
| For our affiliates’ everyday business purposes — information about your transactions and experiences | No | We don’t share | |
| For our affiliates’ everyday business purposes — information about your creditworthiness | No | We don’t share | |
| For non-affiliates to market to you | No | We don’t share | |
| QUESTIONS? | Call 1-833-404-4103 | ||
| Semi-Annual Report | March 31, 2025 | 49 |
| Alternative Credit Income Fund | Privacy Notice |
March 31, 2025 (Unaudited)
| WHO WE ARE | |
| Who is providing this notice? | Alternative Credit Income Fund |
| WHAT WE DO | |
| How does Alternative Credit Income Fund protect my personal information? | To protect your personal information from unauthorized access and use, we use security measures that comply with federal law. These measures include computer safeguards and secured files and buildings.
Our service providers are held accountable for adhering to strict policies and procedures to prevent any misuse of your nonpublic personal information. |
| We collect your personal information, for example, when you | |
How does Alternative Credit Income Fund collect my personal information? |
• Open an account • Provide account information • Give us your contact information • Make deposits or withdrawals from your account • Make a wire transfer • Tell us where to send the money • Tells us who receives the money • Show your government-issued ID • Show your driver’s license |
| We also collect your personal information from other companies. | |
| Federal law gives you the right to limit only | |
Why can’t I limit all sharing?
|
• Sharing for affiliates’ everyday business purposes – information about your creditworthiness • Affiliates from using your information to market to you • Sharing for non-affiliates to market to you
State laws and individual companies may give you additional rights to limit sharing. |
DEFINITIONS |
|
Affiliates |
Companies related by common ownership or control. They can be financial and nonfinancial companies.
• Alternative Credit Income Fund does not share with our affiliates. |
Nonaffiliates |
Companies not related by common ownership or control. They can be financial and nonfinancial companies.
• Alternative Credit Income Fund does not share with non-affiliates so they can market to you. |
Joint marketing |
A formal agreement between nonaffiliated financial companies that together market financial products or services to you.
• Alternative Credit Income Fund doesn’t jointly market. |
| 50 | www.altcif.com |
This Page Intentionally Left Blank

| (b) | Not applicable. |
Item 2. Code of Ethics.
Not applicable to this report.
Item 3. Audit Committee Financial Expert.
Not applicable to this report.
Item 4. Principal Accountant Fees and Services.
Not applicable to this report.
Item 5. Audit Committee of Listed Registrants.
Not applicable to the Registrant.
Item 6. Investments.
| (a) | The schedule of investments is included as part of the Reports to Shareholders filed under Item 1(a) of this report. |
| (b) | Not applicable to the Registrant. |
Item 7. Financial Statements and Financial Highlights for Open-End Management Investment Companies.
Not applicable to the Registrant.
Item 8. Changes in and Disagreements with Accountants for Open-End Management Investment Companies.
Not applicable to the Registrant.
Item 9. Proxy Disclosures for Open-End Management Investment Companies.
Not applicable to the Registrant.
Item 10. Remuneration Paid to Directors, Officers, and Others of Open-End Management Investment Companies.
Not applicable to the Registrant.
Item 11. Statement Regarding Basis for Approval of Investment Advisory Contract.
A statement regarding the basis for approval of the Fund’s investment advisory contract is included as part of the Report to Stockholders filed under Item 1 of this report.
Item 12. Disclosure of Proxy Voting Policies and Procedures for Closed-End Management Investment Companies.
Not applicable to this report.
Item 13. Portfolio Managers of Closed-End Management Investment Companies.
| (a) | Not applicable to this report. |
| (b) | Not applicable to this report. |
Item 14. Purchases of Equity Securities by Closed-End Management Investment Company and Affiliates Purchasers.
None.
Item 15. Submission of Matters to a Vote of Security Holders.
None.
Item 16. Controls and Procedures.
| (a) | Based on an evaluation of the Registrant’s disclosure controls and procedures as of a date within 90 days of the filing date of this report, the Registrant’s principal executive officer and principal financial officer have concluded that the disclosure controls and procedures are reasonably designed to ensure that the information required in filings on Form N-CSR is recorded, processed, summarized and reported by the filing date, including that information required to be disclosed is accumulated and communicated to the Registrant’s management, including the Registrant’s principal executive officer and principal financial officer, as appropriate to allow timely decisions regarding required disclosure. |
| (b) | There were no significant changes in the Registrant’s internal control over financial reporting that occurred during the period covered by this report that have materially affected, or are reasonably likely to materially affect, the Registrant’s internal control over financial reporting. |
Item 17. Disclosure of Securities Lending Activities for Closed-End Management Investment Companies.
None.
Item 18. Recovery of Erroneously Awarded Compensation.
| (a) | Not applicable. |
| (b) | Not applicable. |
Item 19. Exhibits.
| (a)(1) | Not applicable. |
| (a)(2) | Not applicable. |
| (a)(3) | Certifications pursuant to Rule 30a-2(a) under the 1940 Act are attached hereto as Exhibit 99.CERT. |
| (a)(4) | None. |
| (a)(5) | Not applicable. |
| (b) | Certifications pursuant to Rule 30a-2(b) under the 1940 Act are attached hereto as Exhibit 99.906CERT. |
SIGNATURES
Pursuant to the requirements of the Securities Exchange Act of 1934 and the Investment Company Act of 1940, the Registrant has duly caused this report to be signed on its behalf by the undersigned, thereunto duly authorized.
ALTERNATIVE CREDIT INCOME FUND
| By: | /s/ Edward Goldthorpe | |
| Edward Goldthorpe | ||
President and Chief Executive Officer (Principal Executive Officer) | ||
Date: June 5, 2025
Pursuant to the requirements of the Securities Exchange Act of 1934 and the Investment Company Act of 1940, this report has been signed below by the following persons on behalf of the Registrant and in the capacities and on the dates indicated.
| By: | /s/ Edward Goldthorpe | |
| Edward Goldthorpe | ||
President and Chief Executive Officer (Principal Executive Officer) | ||
Date: June 5, 2025
| By: | /s/ Brandon Satoren | |
| Brandon Satoren | ||
Chief Financial Officer (Principal Financial Officer) | ||
Date: June 5, 2025