UNITED STATES
SECURITIES AND EXCHANGE COMMISSION
WASHINGTON, D.C. 20549
FORM N-CSR
CERTIFIED SHAREHOLDER REPORT OF REGISTERED
MANAGEMENT INVESTMENT COMPANIES
811-23016
(Investment Company Act file number)
Alternative Credit Income Fund
(Exact name of Registrant as specified in charter)
650 Madison Avenue, 3rd Floor
New York, NY 10022
(Address of principal executive offices) (Zip code)
The Corporation Trust Company
Corporation Trust Center, 1209 Orange Street
Wilmington, DE 19801
(Name and address of agent for service)
Registrant’s telephone number, including area code: (212) 891-2880
Date of fiscal year end: September 30
Date of reporting period: October 1, 2024– September 30, 2025
Item 1. Reports to Stockholders.
| (a) |
Table of Contents
| Shareholder Letter | 3 |
| Portfolio Update | 15 |
| Consolidated Schedule of Investments | 17 |
| Consolidated Statement of Assets and Liabilities | 23 |
| Consolidated Statement of Operations | 24 |
| Consolidated Statements of Changes in Net Assets | 25 |
| Consolidated Statement of Cash Flows | 27 |
| Financial Highlights | |
| Class A | 28 |
| Class C | 29 |
| Class I | 30 |
| Class L | 31 |
| Class W | 32 |
| Notes to Consolidated Financial Statements | 33 |
| Report of Independent Registered Public Accounting Firm | 48 |
| Additional Information | 49 |
| Trustees & Officers | 50 |
| Privacy Notice | 53 |

| Alternative Credit Income Fund | Shareholder Letter |
September 30, 2025
Dear Shareholders,
We are excited to share with our partners the annual shareholder letter for the Alternative Credit Income Fund (ticker: RCIXX) for the period ended September 30, 2025.
The Fund gained 3.3% in the periodi, inclusive of a special distribution to our shareholders at the end of calendar 2024.
Macro Backdrop
We tortured our Thesaurus writing this shareholder letter trying to find sufficient synonyms for “uncertainty,” which was a prevailing force shaping markets over the past 12 months.
The Concerning
Job market dead stop:
The weakening U.S. job market that we’ve highlighted in recent quarters jumped from the subtext to the front page with the July jobs report.
The headline unemployment rate remained low at 4.2%, but this figure was likely boosted by a shrinking labor force. Deportations have had a twin impact on the U.S. labor supply by literally removing workers and prompting others not to seek employment.
What grabbed attention in the July data, echoed in the chart below, was evidence that the U.S. job creation engine has stalled.
Change in Rate of Payroll Growth:
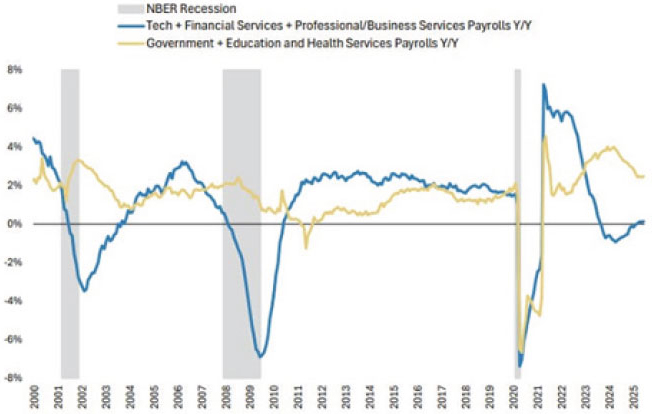
Source: Haver, Morgan Stanley Research (07/30/2025)
The August report, showing the addition of just 22,000 jobs, underscored the dearth of job creation and ongoing weakness in NFIB hiring intentions portend continued subdued activity.
Identifying causality remains the central challenge for all market watchers, but the pall of uncertainty has been central to job market deterioration, in our view. Businesses will only expand within their immediate planning horizon. Until companies have greater clarity on trade and tariffs, we expect anemic employment trends to persist.
| Annual Report | September 30, 2025 | 3 |
| Alternative Credit Income Fund | Shareholder Letter |
September 30, 2025
Fortunately, as previously noted, we believe the shadow of COVID may delay layoffs. After businesses battled to rebuild workforce’s post-pandemic, many will be slow to fire this cycle. This has been evident in initial claims and WARN data, which reflects fraying, not dramatic decay. Post-pandemic labor hoarding may forestall job losses, but it will not eliminate them should the economy downshift.
“Risk-on” rate cuts?
By signaling a rate cut in September, the Fed substantiated fading job trends.
We observed the perverse logic of the market rally after the Fed’s dovish tilt and believe a rate cut with inflation well above target, combined with lofty asset values, should presage caution, not “risk-on.” The Fed will only cut if trends dramatically slow, which is not a reason to celebrate.
Underscoring another market inconsistency, CME FedWatch forecasts 100 basis points (“bps”) of cuts through September 2026, a level of reduction that might be associated with recessionary concerns, of which credit spreads and equity values reveal no signs.1 Only an uber bullish scenario of inflation easing with no economic damage—despite incremental monetary accommodation—would justify this market signal.
Perhaps most importantly, rate cuts may fail to heal what ails our economy. Lowering front-end rates will steepen the yield curve if it stokes inflation and/ or if the market perceives the Fed as having capitulated to political pressure (a risk amplified by recent incursions to Fed independence).
Given that mortgages are benchmarked to the long end of the curve, rate cuts could, paradoxically, hurt the U.S.’s moribund housing market.
Additionally, rates remain a global phenomenon and Japanese, German, French and U.K. 30-year sovereign yields are hovering near multi-decade highs. U.S. front-end cuts will do little to counter the global interplay of long-term rates.
Lastly and most importantly, the malaise of uncertainty cannot be solved through monetary policy. It is not cost of capital, but a general lack of certainty that has restrained recent economic activity.
Final Sales — Reflect a downshift
Tariff-related import/export activity has skewed recent GDP figures, making them a less reliable near-term gage. Final domestic sales (which exclude inventory changes) garnered greater attention in recent quarters and have begun to show signs of deceleration, slowing to +1.2% in 2Q 2025 vs. +1.9% in 1Q 2025 and +2.9% in 2Q 2024.2
Separately, 2Q GDP revealed that businesses may have depleted pre-tariff inventories.
Change in private inventories ($bn):
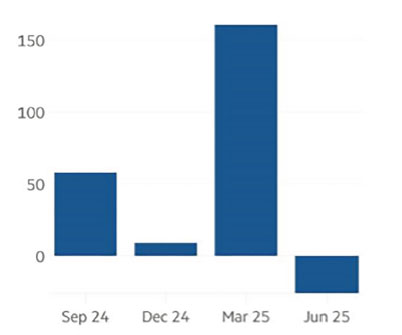
Source: Bloomberg, Bureau of Economic Analysis (08/12/2025); Note: Chained 2018 dollars
Businesses pushing through higher costs as the economy begins to slow would represent textbook definition stagflation—a brutal backdrop for an economy to escape.
| 4 | www.altcif.com |
| Alternative Credit Income Fund | Shareholder Letter |
September 30, 2025
Kozmo.com 2.0?
“AI” is the only word used more frequently than “uncertain” in 2025.
We want to revisit our AI bubble concerns with an analog from a bygone era: Kozmo.com
Launched during the peak dot-com boom of the late 1990s and early 2000s in 1998, Kozmo promised one-hour delivery of groceries and other items, without cumbersome (yet revenue-generating) fees. We distinctly remember Kozmo delivering a pint of Ben & Jerry’s to my desk during a marathon conference call.
Did Kozmo.com increase productivity? Unquestionably. Did it make money? Absolutely not. The company shuttered in 2001 after slaughtering $200mn of venture capital. The lesson: productivity tools are only sustainable if they can generate economic returns.
Does AI increase productivity? Speaking anecdotally, yes. However, does AI make money? While precise figures are elusive, evidence seems to suggest not.
Companies, predominantly Big Tech, will spend roughly $400bn on AI-related infrastructure this year.3 By comparison, market leader OpenAI said in August that its annualized revenue exceeds $13bn which marks impressive growth relative to 2024 sales of $5.5bn, but is dwarfish relative to capital spend.
Sam Altman has predicted “trillions” of AI capital expenditure (“capex”) spend and McKinsey recently estimated the need for $6.7tn of infrastructure investment by 2030 to keep pace with compute power.4
Hence, not unlike the VC dollars that subsidized the delivery of Chunky Monkey, each AI query is currently largely being financed by Big Tech and venture firms. The staggering magnitude of capital required calls into question the viability of AI, writ large.
AI kills the golden goose/geese?
Crucially, the current AI boom risks toppling the most sacrosanct names in the Standard and Poor’s 500 Index (“S&P 500”) iii, which creates significant systematic risk for U.S. investors. Given Big Tech’s monstrous index weighting, any waning of the mania risks collapsing the S&P’s lofty valuation.5
The rents earned by U.S. megacaps have provided the riches to fund AI investment, but for how long will the market countenance these outlays?
The S&P 500 has been boosted by a handful of companies with near mythical business models that have enabled growth with de minimis marginal costs and therefore powered mammoth cash generation. These businesses have enjoyed a virtuous cycle whereby sky-high valuations have lowered their cost of capital, reinforcing growth, margin and cash flows. Amazon arguably enjoyed an effective zero WACC before achieving scale and stumbling upon the AWS cash engine.
As depicted in the chart below, AI has already dimmed the magic of the S&P’s hegemons by consuming their vaunted cash flows.
Capex, FCF Margin and Revenue Growth: MSFT, AMZN, GOOG and META
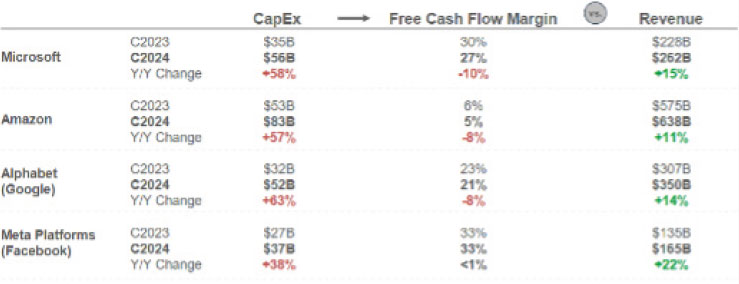
Source: BOND Capital (06/02/2025)
| Annual Report | September 30, 2025 | 5 |
| Alternative Credit Income Fund | Shareholder Letter |
September 30, 2025
Plus, massive capex today will create depreciation expenses (albeit non-cash) that will weigh on earnings per share (“EPS”) for years to come.
Thus far, the market has rewarded Big Tech’s spending, but at some point, chasing the chimera of AI riches with impunity may stop. Not unlike the market’s refusal to reward growth in oil & gas post-shale (thereby strangling access to capital), sentiment towards spending can shift rapidly.
Ominously, in their “The GenAI Divide: State of AI in Business 2025” dispatch, MIT NANDA (Networked Agents and Decentralized AI) reported that 95% of businesses are reporting zero return on their AI investments.6 The shot clock on AI may be ticking…
Fed war a core threat
The recent infringement on Federal Reserve independence, in our view, represents the biggest threat to U.S. monetary policy since Andrew Jackson killed the Second Bank of the United States (a Fed predecessor), which left the country without a centralized authority for more than seventy years.
More recently, the most notable political interference in monetary policy occurred when Richard Nixon cajoled Fed chair Arthur Burns to lower rates ahead of the 1972 election. While many factors contributed to amplify its impact (e.g. oil shocks, hangover from LBJ’s Guns and Butter programs), the Fed’s imprudent cuts nevertheless catalyzed the debilitating inflation that manacled the economy throughout the decade. It required the courage of Paul Volker to wrangle inflation through punishing rate hikes, which smoothed aggregate demand.
The U.S. economy paid a heavy price for the politicization of monetary policy. Nixon’s meddling appears picayune relative to the current administration’s attempt to fire a Fed governor to install a more dovish loyalist.
Turkey highlights the consequences of executive intrusion into monetary matters. President Erdogan has actively interfered with monetary policy, beginning with the appointment of his son-in-law as Turkey’s finance minister shortly after his election. During Erdogan’s tenure, which is ongoing, inflation averaged 26.7% (cumulative price change 967.8%) from 2014 through 2024.7
Paraphrasing renowned economist and former advisor to the New York Federal Reserve Kenneth Rogoff in his recent book Our Dollar, Your Problem, the global trust that the U.S. Federal Reserve will deliver stable prices “is the single most important bulwark that stands between global economic stability and the return of the macroeconomic stone ages—that is to say, the 1970s.” Politicizing monetary policy undermines this fundamental trust.
The market has largely ignored the administration’s efforts, reflecting the low likelihood of success on legal grounds. Further, we believe a galvanic negative bond market response could ultimately stomp out these incursions.
The Good
Market watchers always sound smarter emphasizing the negative; careers have been built on permabear narratives. Hence, we consciously attempt to provide balance to my commentary.
Hard to kill
The resilience of the U.S. economy amid a cavalcade of disorder has been astounding.
Global trade and security relationships have been reshuffled amid a protracted land war in Europe and the dramatic amplification of Middle East conflict, while U.S. rule of law, governance and monetary policy norms have been challenged by a rollback of both free-market orthodoxy and democratic institutions amid heightened cost of capital reflected by U.S. 10-year Treasury yields averaging 4.11% over the last three years compared to 1.54% in the previous three at the same time that American universities (the envy of the world) are under assault. (Editor’s note: intentional run-on sentence for dramatic effect)
Powering through this tumult is a testament to the U.S. economy’s underlying soundness, we believe a derivative of COVID. Rock-bottom interest rates and fiscal spending enabled household and corporate balance sheet repair and the ensuing market rally facilitated astounding wealth creation.
With confidence at the cornerstone of GDP growth, recent economic strength could become self-fulling if a perception of economic invulnerability takes hold. If this backdrop hasn’t toppled U.S. GDP, what will?
Relatedly, stimulus from the One Big Beautiful Bill Act—including provisions like the acceleration of depreciation expense—may provide fiscal fuel to reinvigorate the economy.
| 6 | www.altcif.com |
| Alternative Credit Income Fund | Shareholder Letter |
September 30, 2025
The leverage to leverage
The most traumatic economic episodes of the post-war era have given rise to today’s historically healthy household balance sheets, as demonstrated below.
U.S. Household Leverage (%)
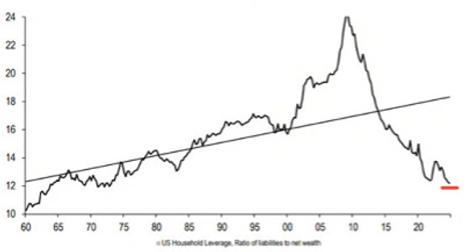
Source: Federal Reserve Board (07/10/2025)
The emotional wounds of the Great Financial Crisis (the market and economic downturn beginning in the 2007-2008 timeframe) and the subsequent decreased availability of subprime credit has driven significant consumer deleveraging, while elevated asset values from COVID have amplified net worth.
A boost in confidence could prompt releveraging, driving further growth. The healthy aggregate consumer profile may also mute the next downturn by providing spending power for displaced workers. Recall, the pain of GFC was in part derived from households being forced to deleverage amid job loss, obliterating discretionary spending.
Dry powder
As well documented, roughly $7tn of assets have flooded into money market funds (MMFs) since the Fed’s first hike in March 2022.
MMFs have historically moved in lock step with the federal funds rate (“fed funds rate”), meaning their yields should fall in lockstep with potential cuts. As rates decrease, these dollars in time migrate into other assets, providing firepower for markets.
However, a lower rate environment isn’t friction-free. A 100 bp decline in yields would wipe out $70bn of (near risk-free) interest income from investors’ portfolios. This could prompt investors to move out on the risk spectrum amid already lofty valuations, thus heightening asset bubble risk.
High-end consumer remains stalwart
Spending by high-end U.S. consumers shows little sign of slowing, as reflected in the graph below.
| Annual Report | September 30, 2025 | 7 |
| Alternative Credit Income Fund | Shareholder Letter |
September 30, 2025
U.S. Consumption by Income Cohort
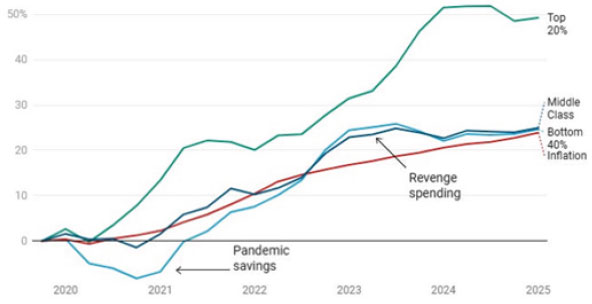
Source: Moody’s Analytics (08/12/2025)
Lower income consumers show clear signs of stress as evidenced by higher delinquencies across lending categories; credit card delinquencies are near GFC highs.8 These consumers will face further stress from provisions in the OBBB, including reductions of SNAP benefits and lost healthcare coverage.
Despite their economic strain, the lowest income cohort represents around 9% of U.S. consumption compared to 39% and 23% for the highest income quintile and fourth income quintile, respectively.9 Hence, strength at the high end has so far subsumed low end stress.
| 8 | www.altcif.com |
| Alternative Credit Income Fund | Shareholder Letter |
September 30, 2025
The Opportunity
Evidence of lofty public market valuations are both unambiguous and well documented.
Anecdotally, BC Partners in recent weeks has walked away from deals priced at levels we generously characterize as “aggressive.” In our specialty finance vertical, a company that filed for bankruptcy last year recently obtained financing at S+275 bps and a 92% advance rate (or providing capital up to 92% of total value). For perspective, that’s roughly the same yield as 10-year Indian sovereign debt. Deals like this could herald the top of the market in public credit.
Before delving into areas of opportunity for BC Partners’ investors, I want to highlight a key driver behind the growth of private credit: the marked rise of passive investing.
As illustrated below, passive vehicles captured significant share from active over the last decade.
U.S. Flow of Funds
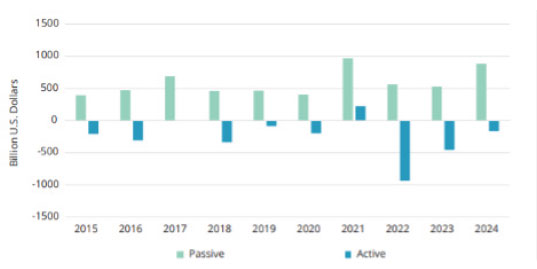
Source: Morningstar (year-end 2024)
Notably, in 2024, passive funds attracted $886bn of new capital while active vehicles lost $166bn of assets.10 Last year, passive surpassed active, comprising 53% market share compared to 47%.11
Asset selection has become a dying art as an increasing percentage of “buy” and “sell” decisions have become dictated solely by fund flows. Earnings and other signals have been muffled by cash inflows and outflows, stifling the market’s normal response mechanism.
As passive has crowded out fundamentals, daring hedge funds taking directional bets (short and long) have been replaced by factor-driven pod shops with nanosecond holding periods, amplifying the breakdown of market efficiency.
The silent coup d'état of passive has created market distortion like the once unthinkable prices of Big Tech. As shown below, NVIDIA’s valuation has steadily outpaced its revenue growth due in part to passive investing.
| Annual Report | September 30, 2025 | 9 |
| Alternative Credit Income Fund | Shareholder Letter |
September 30, 2025
NVIDIA Normalized Revenue vs. Normalized Market Cap (2025 represents year 1)
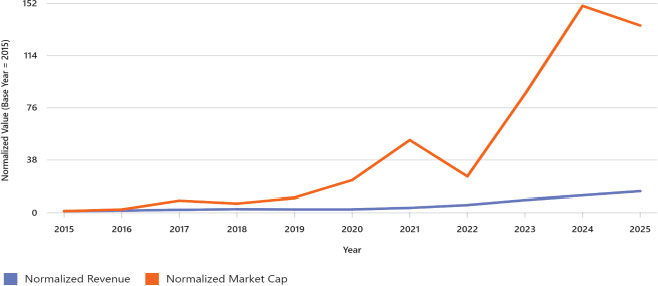
Source: Bloomberg, company financials and ChatGPT.
If a passive vehicle receives inflows, those dollars will buy a proportionate share of a stock in the reference index; from 1x sales or 1000x sales, valuation is irrelevant in that equation. This dynamic skews our economy by potentially rewarding large index constituents with a lower cost of capital that can stifle competitors.
Private credit has no equivalent. An investor cannot, for instance, passively buy, overhaul, and sell a jet engine. Structured equity entails hammering out a capital solution specific to each individual company; there is no formulaic approach. Asset based lending involves a double underwrite—both an assessment of the actual assets as well as the financial health of the borrower.
We believe a passive approach to such lending would be a manifest disaster for investors. Formulaic flows would perhaps sustain some struggling private borrowers, but more often would incinerate capital by providing more debt to businesses unable to service their borrowings.
In short, we believe private credit is among the last remaining corners of active management. As allocators—both institutional and individuals—push an increasing share of their equities into passive, private credit provides a compelling offset.
Of course, there are gradations of active management within private credit. Larger vehicles often serve as price-takers given the need to deploy hoards of capital, thereby forcing investors to sacrifice returns in exchange for the theoretical safety of big shops.
In contrast, as among the most prominent players in the middle market, BC Partners believes in engaging in fundamental analysis and capital structure assessment and/or formation for every name in our portfolio.
How we are making money
BC Partners benefits from our ability to write “small checks” by virtue of our size and leveraging our institutional platform to capture larger transactions as well.
The firm recently purchased a $1.2bn aviation portfolio. In isolation, this deal would comprise a sizable percentage of our AUM and potentially represent an imprudent check size, regardless of its return potential.
| 10 | www.altcif.com |
| Alternative Credit Income Fund | Shareholder Letter |
September 30, 2025
However, BC Partners populated the deal among internal vehicles and syndicated the remainder to our limited partners (“LPs”) as a co-invest. The flexibility to scale a deal, when appropriate, unlocks opportunities and rewards our largest partners with a direct investment. We followed a similar path with a recent first-lien deal in the healthcare technology space.
To be sure, BC Partners does not need to write big tickets, but we can when the opportunity presents itself, which is an ideal setup, in our view.
As previously noted, the dearth of private equity exits has boosted demand for BC Partners’ NAV lending and structured equity solutions. The difficult private equity (“PE”) backdrop has also uncovered bridge equity opportunities. BC Partners has been lending sponsors short-term capital on a first lien basis, which gets repaid at transaction closing.
Wrap-up
We are not macroeconomists, and our investment process is ultimately driven by fundamental credit selection, but a consideration of the backdrop underpins all of our investment decisions. We contrast our approach with that of passive peers.
Uncertainty looms, with stagflation potentially emerging, which could be worsened by a pullback in AI spending that could puncture the S&P 500. While rate cuts may reinvigorate GDP and jolt animal spirits, it may lead to further inflation and elevate asset bubble risk.
Regardless of the route, stretched public market asset prices provide a narrow path for investors, in our view. Deploying capital at higher valuations has historically resulted in underwhelming returns. Plus, should the market roll over, the downside descent could be steep.
As noted earlier, BC Partners has concerns that we may be at the top of the market which may pose a risk to investors who over allocate to passive funds. In our view, actively managed private credit funds provide a safe haven.
Fund Performance
The Fund gained 3.3% in the 12 months ending 9/30/2025, inclusive of a special distribution to our shareholders at the end of calendar 2024. Cumulative returns remains our focus, however, because they reflect the Fund’s longer-term investing perspective:
Cumulative Returns, Since Inception
Source: Bloomberg. Total return from 10/27/2015 through September 30, 2025
I would argue a Fund cannot beat its benchmark by more than 1.2x by focusing on quarterly performance.
What didn’t work (yet)
The largest detractor in the period was equity of Jo-Ann Stores (JoAnn Inc.), which sought bankruptcy protection after struggling to source inventory from China for the 2024 holiday season—a precursor to the trade war. The Fund received a disproportionate share of reorg equity by participating in the new money Term Loan during the company’s first restructuring. The rise and subsequent crash of this equity proved a headwind.
Shares of Aperture Dodge (Aperture Dodge 18 LLC)—a specialty finance business focused on overseas remittances (particularly to Mexico)— dropped during the period as the business adjusts to U.S. immigration uncertainty. The company has been outperforming the market, but remittance volumes have dropped materially in 2025.
What worked
The Credit Income Fund benefited from several strong gainers in the period.
| Annual Report | September 30, 2025 | 11 |
| Alternative Credit Income Fund | Shareholder Letter |
September 30, 2025
Online auto marketplace Autorola (Marvel APS, (Autorola Group Holding A/S), Delayed Draw Term Loan) was one of largest contributors, helped by strong underlying performance.
Preferred debt of education and training provider Pennfoster (Pennfoster) was a positive contributor to our shareholders in the period, helped by strong enrollment rates; in 2Q25, revenue and EBITDA gained 4.0% and 17.0% respectively. The company has launched a refinancing process for its 1L debt and the resulting lower cost of debt will benefit our Preferreds.
In addition to these names, the Fund enjoyed returns from other positions, demonstrating a breadth of positive credit selection. Further, the Fund has several existing loans poised for strong recovery in the coming months and quarters.
What we are excited about going forward
EagleView Technologies (Phoenix Finance, Inc., First Lien Term Loan & Phoenix Finance, Inc., Second Lien Term Loan), whose loans are marked at 90, should continue to climb as the company continues to post notable growth thanks to its new ARR contract model.
Physical therapy platform Upstream Rehab (Upstream Rehabilitation, Inc., Second Lien Term Loan) battled wage inflation, labor availability and poor operating performance last year. The company, whose second lien loans are marked in the 60s, will benefit from a contemplated Amend & Extend transaction as well as a management change which has refocused the business on operational execution; results have already started to recover after a disappointing 2024.
Food manufacturer Florida Food (Florida Food Products LLC, Second Lien Term Loan), whose loans are also marked in the 60s, recently received capital to support a new $100mn contract award in the coffee segment and the company has a new growth initiative in the energy drink segment. The combination of these new businesses as well as continued recovery in core products will drive ongoing recovery.
Spanish Broadcasters (Spanish Broadcasting System, Inc.) is the nation’s leading Hispanic radio systems. Bonds that we purchased in the 70s have traded into the 60s after a mildly disappointing 2024. Management has signaled intentions to sell their cash burning TV assets and non-core real estate to fund a sizable debt paydown. This will, we believe, result in improved trading of remaining bonds.
As for new deals, we funded an additional program for Pocket.Watch (PocketWatch, Inc., First Lien Term Loan), and our investors are being paid directly by Disney. We expect follow-on opportunities with Netflix before year end, enabling us to continue scaling.
We have been around this situation for a while, but we expect to close before year end an IP acquisition in the entertainment industry, which we believe has potential for returns measured in multiples, not percents.
Positioning
From a positioning standpoint, we highlight that the Fund liquidated its BDC portfolio to less than 1% of AUM. With significant market uncertainty and tight credit spreads, we believe it prudent to reduce our exposure to levered credit.
We, of course, did not anticipate the blow-ups of First Brand or Tricolor Holding, but our proactive selling proved prescient for our shareholders as the Van Eck BDC Index has declined 6.7% this year through 9/30/2025.12 We have further sidestepped the downside volatility after quarter end as well.
Our most important positioning remains in relation to leverage. Unlike most of our peers, the Credit Income Fund does not employ running leverage (except as a currency hedge). We look forward to using our facility to feast during the market’s inevitable next downturn. Our levered competitors—who have sacrificed long-term performance in exchange for near-term gains—will be sidelined when the market is most attractive.
| 12 | www.altcif.com |
| Alternative Credit Income Fund | Shareholder Letter |
September 30, 2025
Conclusion
I sometimes joke that the Credit Income Fund has been my “non-DNA child.” I have raised every single dollar, having forged incredible relationships with our partners along the way. Additionally, my children (my literal DNA children) also have their college dollars in the Fund as well.
Hence, I personally feel every disappointment of the Fund in a visceral way.
There is no ambiguity, our returns over the last year—although positive—remain well below our standards. As highlighted in the “What we are excited about” section, the Fund is extremely well positioned to rebound going forward and should benefit from its available leverage capacity.
As always, we look forward to our continued partnership.
Regards,
Michael Terwilliger, CFA
Portfolio Manager*
Alternative Credit Income Fund
| * | Effective October, 31, 2020, Sierra Crest Investment Management LLC (“Sierra Crest”) replaced Resource Alternative Advisor, LLC (“Resource”) as the Fund’s investment adviser. Michael Terwilliger has joined Sierra Crest as a portfolio manager to the Fund. |
| 1 | CME FedWatch (09/03/2025) |
| 2 | U.S. Bureau of Economic Analysis |
| 3 | “Who will pay for the trillion-dollar AI boom?” The Economist, July 31, 2025 |
| 4 | “The cost of compute: A $7 trillion race to scale data centers,” McKinsey quarterly, April 28, 2025 |
| 5 | “American Unexceptionalism,” GMO, (08/21/2025) Note: Big Tech comprises Apple, Microsoft, Alphabet, Amazon, Meta and Nvidia. |
| 6 | “The GenAI Divide: State of AI in Business 2025,” MIT NANDA (July 2025) |
| 7 | CPI Inflation Calculator |
| 8 | The Federal Reserve Bank of New York, Macrobook and Apollo Chief Economist (07/18/2025) |
| 9 | Haner Analytics and Apollo Chief Economist (07/18/2025) |
| 10 | “The Passive vs. Active Fund Monitor,” PWL Capital (year-end 2024, published winter 2025) |
| 11 | Morningstar report published in “The Passive vs. Active Fund Monitor,” PWL Capital (year-end 2024, published winter 2025) |
| 12 | Bloomberg (ticker: BIZD, 12/31/2024 – 09/30/2025, total return) |
| i | Fund performance refers to that of Class I. Reflects twelve-month returns through September 30, 2025. Past performance is not indicative of future results. The investment return and principal value of an investment will fluctuate. An investor’s shares when redeemed, may be worth more or less than the original cost. Total return is calculated assuming reinvestment of all dividends and distributions. Performance figures for periods less than one year are not annualized. For performance information current to the most recent month-end, please call toll-free 1-833-404-4103. The Adviser and the Fund have entered into an Expense Limitation Agreement under which the Adviser has agreed, until at least January 31, 2026 to waive its management fees (excluding any incentive fee) and to pay or absorb the ordinary annual operating expenses of the Fund (excluding incentive fees, all borrowing costs, dividends, amortization/accretion on securities sold short, brokerage commissions, acquired fund fees and expenses and extraordinary expenses), to the extent that its management fees plus the Fund’s ordinary annual operating expenses exceed 2.34% per annum of the Fund’s average daily net assets attributable to Class I shares. Such Expense Limitation Agreement may not be terminated by the Adviser, but it may be terminated by the Board of Trustees, upon 60 days written notice to the Adviser. Any waiver or reimbursement by the Adviser is subject to repayment by the Fund within the three (3) years from the date the Adviser (or the previous investment adviser) waived any payment or reimbursed any expense, if the Fund is able to make the repayment without exceeding the lesser of the expense limitation in place at the time of the waiver or the current expense limitation and the repayment is approved by the Board of Trustees. See “Management of the Fund.” |
| Annual Report | September 30, 2025 | 13 |
| Alternative Credit Income Fund | Shareholder Letter |
September 30, 2025
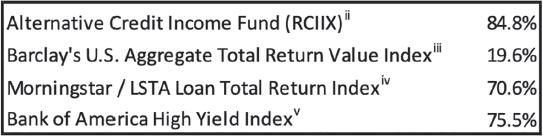
| ii | Fund performance refers to that of Class I. Reflects cumulative returns 10/29/2015 through 09/30/2025. Past performance is not indicative of future results. The investment return and principal value of an investment will fluctuate. An investor’s shares when redeemed, may be worth more or less than the original cost. Total return is calculated assuming reinvestment of all dividends and distributions. Performance figures for periods less than one year are not annualized. For performance information current to the most recent month-end, please call toll-free 1-833-404-4103. |
| iii | Barclays U.S. Aggregate Total Return Value Index – The Barclays U.S. Aggregate Total Return Value Index is a broad-based flagship benchmark that measures the investment grade, U.S. dollar-denominated, fixed-rate taxable bond market. The index includes Treasuries, government-related and corporate securities, MBS (agency fixed-rate and hybrid ARM pass-throughs), ABS and CMBS (agency and non-agency). Investors cannot invest directly in an index. Reflects cumulative return 10/28/2015 through 09/30/2025. |
| iv | Morningstar LSTA US Leveraged Loan TR USD Index - The Morningstar LSTA US Leveraged Loan TR USD Index is a market value-weighted index designed to measure the performance of the U.S. leveraged loan market based upon market weightings, spreads and interest payments. Investors cannot invest directly in an index. |
| V | Bank of America High Yield Index (H0A0), 10/28/2015 through 09/30/2025. |
Important information:
An investor should consider the investment objectives, risks, charges, and expenses of the Fund carefully before investing. To obtain a copy of the prospectus containing this and other information, please call (833) 404-4103 or download the file from www.opportunisticcreditintervalfund.com. Read the prospectus carefully before you invest. Past performance is not indicative of future results.
The Fund is distributed by ALPS Distributors, Inc. (ALPS Distributors, Inc. 1290 Broadway, Suite 1000, Denver, CO 80203). Sierra Crest (the Fund's investment adviser), its affiliates, and ALPS Distributors, Inc. are not affiliated. Investing involves risk. Investment return and the principal value of an investment will fluctuate, and an Investor’s shares, when redeemed, may be worth more or less than their original cost.
The Fund is subject to the general risks associated with investing in debt and loan instruments, including market, credit, liquidity, and interest rate risk. The Fund is subject to management and other expenses, which will be paid by the Fund. Because of the risks associated with the Fund’s ability to use leverage, an investment in the Fund should be considered speculative and involving a high degree of risk, including the risk of a substantial loss of investment. There currently is no secondary market for the Fund's shares and the Fund expects that no secondary market will develop. Shares of the Fund will not be listed on any securities exchange, which makes them inherently illiquid. An investment in the Fund's shares is not suitable for investors who cannot tolerate risk of loss or who require liquidity, other than the liquidity provided through the Fund's repurchase policy. Limited liquidity is provided to shareholders only through the Fund's quarterly repurchase offers, regardless of how the Fund performs.
The Fund's distributions policy may, under certain circumstances, have certain adverse consequences to the Fund and its shareholders because it may result in a return of capital, resulting in less of a shareholder's assets being invested in the Fund, and, over time, increase the Fund's expense ratio. Any invested capital that is returned to the shareholder will be reduced by the Fund's fees and expenses, as well as the applicable sales load. Investments in lesser-known, small and medium capitalization companies may be more vulnerable than larger, more established organizations. The sales of securities to fund repurchases could reduce the market price of those securities, which in turn would reduce the Fund's NAV.
| 14 | www.altcif.com |
| Alternative Credit Income Fund | Portfolio Update |
| September 30, 2025 (Unaudited) |
The Fund’s performance figures for the periods ended September 30, 2025, compared to its benchmark:
| 1 Month | Quarter | 6 Month | YTD | Inception | |
| Alternative Credit Income Fund - A - Without Load | -0.80% | 0.59% | 3.65% | 2.82% | 4/17/15 |
| Alternative Credit Income Fund - A - With Load | -6.49% | -5.16% | -2.34% | -3.06% | 4/17/15 |
| Alternative Credit Income Fund - C - Without Load | -0.85% | 0.42% | 3.36% | 2.38% | 4/17/15 |
| Alternative Credit Income Fund - C - With Load(a) | -1.83% | -0.57% | 2.36% | 1.41% | 4/17/15 |
| Alternative Credit Income Fund - I - Without Load | -0.74% | 0.66% | 3.78% | 3.02% | 4/17/15 |
| Alternative Credit Income Fund - W - Without Load | -0.81% | 0.59% | 3.64% | 2.82% | 4/17/15 |
| Alternative Credit Income Fund - L - Without Load | -0.76% | 0.53% | 3.51% | 2.74% | 7/28/17 |
| Alternative Credit Income Fund - L - With Load | -5.02% | -3.74% | -0.93% | -1.66% | 7/28/17 |
| Morningstar LSTA Leveraged Loan Index | 0.44% | 1.77% | 4.13% | 4.63% | 4/17/15 |
| 1 Year | 3 Year | 5 Year | Since Inception* | Inception | |
| Alternative Credit Income Fund - A - Without Load | 3.12% | 4.54% | 6.13% | 5.74% | 4/17/15 |
| Alternative Credit Income Fund - A - With Load | -2.80% | 2.48% | 4.89% | 5.05% | 4/17/15 |
| Alternative Credit Income Fund - C - Without Load | 2.32% | 3.75% | 5.35% | 5.13% | 4/17/15 |
| Alternative Credit Income Fund - C - With Load(a) | 1.37% | 3.75% | 5.35% | 5.13% | 4/17/15 |
| Alternative Credit Income Fund - I - Without Load | 3.34% | 4.76% | 6.38% | 5.97% | 4/17/15 |
| Alternative Credit Income Fund - W - Without Load | 3.00% | 4.53% | 6.13% | 5.69% | 4/17/15 |
| Alternative Credit Income Fund - L - Without Load | 2.79% | 4.29% | 5.87% | 4.58% | 7/28/17 |
| Alternative Credit Income Fund - L - With Load | -1.57% | 2.78% | 4.96% | 4.02% | 7/28/17 |
| Morningstar LSTA Leveraged Loan Index | 7.00% | 9.83% | 6.96% | 5.10% | 4/17/15 |
| * | Annualized total return |
| (a) | Effective as of December 23, 2016, Class C shares no longer have a sales charge. |
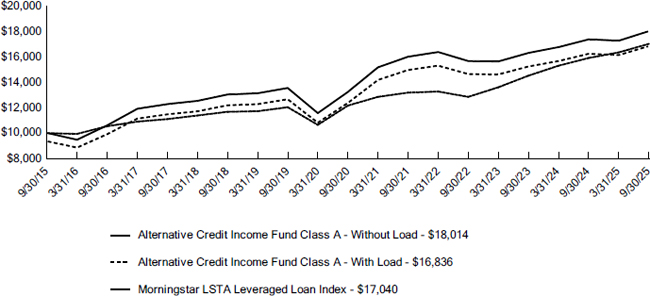
The Morningstar LSTA US Leveraged Loan TR USD Index is a market value-weighted index designed to measure the performance of the U.S. leveraged loan market based upon market weightings, spreads and interest payments. Investors cannot invest directly in an index.
Past performance is not indicative of future results. The investment return and principal value of an investment will fluctuate. An investor’s shares when redeemed, may be worth more or less than the original cost. Total return is calculated assuming reinvestment of all dividends and distributions. Performance figures for periods less than one year are not annualized. As of the Fund’s most recent prospectus dated January 28, 2025, the Fund’s total annual operating expenses, including acquired fund fees and expenses, before fee waivers is 5.21% for Class A, 5.99% for Class C, 5.26% for Class W, 5.07% for Class I and 5.56% for Class L shares. After fee waivers, the Fund’s total annual operating expense is 4.84% for Class A, 5.60% for Class C, 4.84% for Class W, 4.59% for Class I and 5.09% for Class L shares. Class A shares are subject to maximum sales loads of 5.75% imposed on purchases. Class L shares are subject to a maximum sales load of 4.25% imposed on purchases. Share repurchases within 365 days may be subject to an early withdrawal charge of 0.50% for Class A and 1.00% for Class C shares. For performance information current to the most recent month-end, please call toll-free 1-833-404-4103.
| Annual Report | September 30, 2025 | 15 |
| Alternative Credit Income Fund | Portfolio Update |
| September 30, 2025 (Unaudited) |
Comparison of the Change in Value of a $10,000 Investment
Consolidated Portfolio Composition as of September 30, 2025
| Asset Type | Percent of Net Assets |
| Bank Loans | 61.99% |
| Private Investment Funds | 17.25% |
| Common Equity | 8.27% |
| Preferred Stock | 4.58% |
| Asset-Backed Securities | 3.68% |
| Corporate Bonds | 2.23% |
| Interval Fund | 2.18% |
| Equipment Financing | 0.45% |
| Warrants | 0.25% |
| Joint Venture | 0.17% |
| Derivatives | –% |
| Total Investments | 101.05% |
| Liabilities in Excess of Other Net Assets | (1.05)% |
| Net Assets | 100.00% |
Please see the Consolidated Schedule of Investments for a detailed listing of the Fund’s holdings.
| 16 | www.altcif.com |
| Alternative Credit Income Fund | Consolidated Schedule of Investments |
September 30, 2025
| Coupon | Reference Rate & Spread | Maturity | Principal | Value | |||||||||||||
| BANK LOANS (61.99%)(a)(b) | |||||||||||||||||
| Communication Services (2.97%) | |||||||||||||||||
| Next Flight Ventures, Delayed Draw Term Loan(c)(d)(e) | 14.37 | % | 3M SOFR + 10.00% | 12/26/2025 | $ | 1,067,067 | $ | 1,019,985 | |||||||||
| Next Flight Ventures, First Lien Term Loan(c)(e) | 14.25 | % | 14.25% PIK | 12/26/2025 | 4,911,188 | 4,728,001 | |||||||||||
| 5,747,986 | |||||||||||||||||
| Consumer Discretionary (4.41%) | |||||||||||||||||
| Arrow Purchaser, Inc., First Lien Initial Term Loan(c) | 11.01 | % | 3M SOFR + 6.75%, 1.00% Floor | 04/15/2026 | 2,000,000 | 2,000,000 | |||||||||||
| Lucky Bucks Holdings LLC, Subordinated Note(c)(f) | – | % | 3M SOFR + 4.75%, 0.75% Floor | 05/29/2028 | 10,013,460 | 1,938,605 | |||||||||||
| Needle Holdings LLC, First Lien Term Loan(c)(f) | – | % | 1M SOFR + 9.50% | 06/22/2027 | 494,551 | 131,056 | |||||||||||
| PMP OPCO, LLC, Delayed Draw Term Loan(c)(d)(g) | – | % | 1M SOFR + 8.50%, 2.00% Floor | 05/31/2029 | – | (20,813 | ) | ||||||||||
| PMP OPCO, LLC, First Lien Term Loan(c)(g) | 12.70 | % | 1M SOFR + 8.50%, 2.00% Floor | 05/31/2029 | 1,123,242 | 1,067,080 | |||||||||||
| PMP OPCO, LLC, Revolver(c)(d)(g) | – | % | 1M SOFR + 8.50%, 2.00% Floor | 05/31/2029 | – | (7,031 | ) | ||||||||||
| Riddell Inc., First Lien Term Loan(c)(g) | 10.15 | % | 1M SOFR + 6.00%, 1.00% Floor | 03/29/2029 | 3,429,578 | 3,415,544 | |||||||||||
| 8,524,441 | |||||||||||||||||
| Consumer Staples (6.46%) | |||||||||||||||||
| BrightPet, First Lien Term Loan(c)(e) | 11.46 | % | 3M SOFR + 4.00%, 3.00% PIK, 1.00% Floor | 01/04/2028 | 1,906,281 | 1,855,193 | |||||||||||
| BrightPet, Revolver(c)(e) | 11.46 | % | 3M SOFR + 4.00%, 0.00% PIK, 1.00% Floor | 01/04/2028 | 518,811 | 504,907 | |||||||||||
| Florida Food Products LLC, Second Lien Term Loan(c) | 12.56 | % | 3M SOFR + 8.00%, 0.75% Floor | 10/08/2029 | 5,652,174 | 3,662,043 | |||||||||||
| Middle West Spirits Holdings, LLC, First Lien Term Loan(c) | 10.57 | % | 3M SOFR + 6.25% | 04/23/2030 | 1,895,833 | 1,860,097 | |||||||||||
| Middle West Spirits Holdings, LLC, Revolver(c)(d) | – | % | 3M SOFR + 6.25% | 04/23/2030 | – | (10,333 | ) | ||||||||||
| Phillips Feed Service, Inc., First Lien Term Loan(c) | 11.26 | % | 1M SOFR + 7.00% | 12/31/2026 | 5,250,000 | 4,633,125 | |||||||||||
| 12,505,032 | |||||||||||||||||
| Financials (12.69%) | |||||||||||||||||
| BetaNXT, Inc., First Lien Term Loan(c) | 9.75 | % | 3M SOFR + 5.75% | 07/01/2029 | 2,032,033 | 1,997,082 | |||||||||||
| Cor Leonis Limited, Revolver(c)(d) | 11.25 | % | 3M SOFR + 7.25%, 1.50% Floor | 05/15/2028 | 2,807,862 | 2,807,862 | |||||||||||
| DeltaDx Limited, LP - Barri/Dolex(c)(e) | 15.00 | % | 15.00% PIK | 06/14/2028 | 358,369 | 353,889 | |||||||||||
| Hunter Point Capital Structured Notes Issuer, LLC, Subordinated Delayed Draw Notes(c)(d) | – | % | N/A | 07/15/2052 | 3,216,416 | 4,637,429 | |||||||||||
| Money Transfer Acquisition Inc., First Lien Term Loan(c) | 12.51 | % | 1M SOFR + 8.25%, 1.00% Floor | 12/14/2027 | 5,926,255 | 5,881,808 | |||||||||||
| PMA Parent Holdings LLC(c) | 8.75 | % | 3M SOFR + 4.75%, 0.75% Floor | 01/31/2031 | 2,742,918 | 2,715,489 | |||||||||||
| PMA Parent Holdings LLC, Revolver(c)(d) | – | % | 3M SOFR + 4.75%, 0.75% Floor | 01/31/2031 | – | (2,501 | ) | ||||||||||
| PocketWatch, Inc., First Lien Term Loan(c) | 14.99 | % | N/A | 07/15/2027 | 1,708,063 | 1,708,063 | |||||||||||
| SouthStreet Securities Holdings, Inc., First Lien Term Loan(c) | 9.00 | % | N/A | 09/20/2027 | 2,700,000 | 2,453,760 | |||||||||||
| TA/WEG HOLDINGS, LLC, 2022 Delayed Draw Term Loan(c) | 8.79 | % | 3M SOFR + 4.50%, 5.50% Floor | 10/02/2028 | 2,000,000 | 1,994,000 | |||||||||||
| TA/WEG HOLDINGS, LLC, Revolver(c)(d) | 8.79 | % | 3M SOFR + 4.50%, 5.50% Floor | 10/02/2028 | – | (226 | ) | ||||||||||
| 24,546,655 | |||||||||||||||||
| Health Care (8.95%) | |||||||||||||||||
| American Academy Holdings, LLC, Delayed Draw Term Loan(c)(e) | 14.01 | % | 3M SOFR + 4.50%, 5.25% PIK, 1.00% Floor | 06/30/2027 | 415,207 | 439,082 | |||||||||||
| American Academy Holdings, LLC, First Lien Term Loan(c)(e) | 14.01 | % | 3M SOFR + 4.50%, 5.25% PIK, 1.00% Floor | 06/30/2027 | 2,102,411 | 2,223,300 | |||||||||||
| American Academy Holdings, LLC, Second Lien Term Loan(c)(e) | 14.50 | % | 14.50% PIK | 03/01/2028 | 4,715,712 | 4,621,398 | |||||||||||
| PhyNet Dermatology LLC, Delayed Draw Term Loan(c)(d) | – | % | 3M SOFR + 6.50%, 1.00% Floor | 10/20/2029 | – | (5,172 | ) | ||||||||||
| PhyNet Dermatology LLC, First Lien Term Loan(c) | 10.83 | % | 3M SOFR + 6.50%, 1.00% Floor | 10/20/2029 | 1,926,293 | 1,887,767 | |||||||||||
| Upstream Rehabilitation, Inc., Second Lien Term Loan(c) | 12.91 | % | 3M SOFR + 8.50% | 11/22/2027 | 7,500,000 | 4,781,250 | |||||||||||
| VBC Spine Opco LLC (DxTX Pain and Spine LLC), Delayed Draw Term Loan(c) | 10.77 | % | 1M SOFR + 6.50%, 2.00% Floor | 06/14/2028 | 1,091,559 | 1,091,559 | |||||||||||
| VBC Spine Opco LLC (DxTX Pain and Spine LLC), First Lien Term Loan(c) | 10.84 | % | 1M SOFR + 6.50%, 2.00% Floor | 06/14/2028 | 1,880,619 | 1,880,619 | |||||||||||
| VBC Spine Opco LLC (DxTX Pain and Spine LLC), Revolver(c) | 10.82 | % | 1M SOFR + 6.50%, 2.00% Floor | 06/14/2028 | 403,226 | 403,226 | |||||||||||
| 17,323,029 | |||||||||||||||||
| Industrials (7.04%) | |||||||||||||||||
| Epic Staffing Group, First Lien Term Loan(c) | 10.29 | % | 3M SOFR + 6.00%, 0.50% Floor | 06/28/2029 | 1,944,185 | 1,776,596 | |||||||||||
See Notes to Consolidated Financial Statements.
| Annual Report | September 30, 2025 | 17 |
| Alternative Credit Income Fund | Consolidated Schedule of Investments |
| September 30, 2025 |
| Coupon | Reference Rate & Spread | Maturity | Principal | Value | |||||||||||||
| BANK LOANS (61.99%)(a)(b) | |||||||||||||||||
| Industrials (7.04%) (continued) | |||||||||||||||||
| Marvel APS, (Autorola Group Holding A/S), Delayed Draw Term Loan(c)(e)(h) | 10.00 | % | 10.00% PIK | 12/21/2027 | $ | 3,627,359 | $ | 4,834,066 | |||||||||
| Material Handling Systems, Inc., First Lien Term Loan(c) | 9.72 | % | 3M SOFR + 5.50%, 0.50% Floor | 06/08/2029 | 1,872,783 | 1,558,155 | |||||||||||
| Newbury Franklin Industrials, LLC, Delayed Draw Term Loan(c)(d) | 10.97 | % | 6M SOFR + 7.00%, 2.00% Floor | 12/11/2029 | 453,947 | 441,760 | |||||||||||
| Newbury Franklin Industrials, LLC, First Lien Term Loan(c) | 10.86 | % | 3M SOFR + 7.00%, 2.00% Floor | 12/11/2029 | 3,983,059 | 3,906,983 | |||||||||||
| VORTEX OPCO, LLC, First Lien Term Loan (First Out)(c) | 10.25 | % | 3M SOFR + 6.25%, 0.50% Floor | 04/30/2030 | 720,000 | 726,840 | |||||||||||
| VORTEX OPCO, LLC, First Lien Term Loan (Second Out)(c)(f) | – | % | 3M SOFR + 4.25%, 0.50% Floor | 12/15/2028 | 1,575,926 | 370,343 | |||||||||||
| 13,614,743 | |||||||||||||||||
| Information Technology (19.47%) | |||||||||||||||||
| Accurate Background, LLC, First Lien Term Loan(c) | 10.26 | % | 3M SOFR + 6.00%, 1.00% Floor | 03/26/2029 | 4,333,173 | 4,333,173 | |||||||||||
| Ancile Solutions, Inc., First Lien Term Loan(c) | 14.28 | % | 3M SOFR + 10.00%, 1.00% Floor | 06/11/2026 | 3,298,146 | 3,364,109 | |||||||||||
| Colonnade Intermediate, LLC, Delayed Draw Term Loan(c)(f) | – | % | 1M SOFR + 7.00%, 1.00% Floor | 09/30/2026 | 1,698,897 | 1,178,865 | |||||||||||
| Colonnade Intermediate, LLC, First Lien Term Loan(c)(f) | – | % | 1M SOFR + 7.00%, 1.00% Floor | 09/30/2026 | 1,777,572 | 1,233,457 | |||||||||||
| DCert Buyer, Inc. First Amendment Term Loan Refinancing, Second Lien Term Loan(c) | 11.16 | % | 1M SOFR + 7.00% | 02/16/2029 | 3,600,000 | 3,285,000 | |||||||||||
| Diamanti, Inc., Subordinated Note(c)(e) | 15.00 | % | 15.00% PIK | 02/28/2025 | 4,585,503 | 4,640,071 | |||||||||||
| Dun & Bradstreet Holdings, Inc., First Lien Term Loan(c) | 9.67 | % | 1M SOFR + 5.50%, 0.75% Floor | 05/21/2032 | 1,696,690 | 1,679,723 | |||||||||||
| Dun & Bradstreet Holdings, Inc., Revolver(c)(d) | – | % | 1M SOFR + 5.50%, 0.75% Floor | 05/21/2032 | – | (1,697 | ) | ||||||||||
| Ivanti Security Holdings LLC, NewCo First Lien Term Loan(c) | 10.05 | % | 3M SOFR + 5.75%, 2.00% Floor | 06/01/2029 | 296,060 | 305,127 | |||||||||||
| Ivanti Software, Inc., Second Lien Initial Term Loan(c) | 11.81 | % | 3M SOFR + 7.25%, 1.00% Floor | 06/01/2029 | 4,040,000 | 1,881,125 | |||||||||||
| Kofax, Inc., Second Lien Term Loan(c) | 12.06 | % | 3M SOFR + 7.75%, 0.50% Floor | 07/20/2030 | 4,000,000 | 3,619,999 | |||||||||||
| Metrc, Delayed Draw Term Loan(c)(d) | – | % | 3M SOFR + 7.25%, 0.75% Floor | 09/30/2031 | – | – | |||||||||||
| Metrc, First Lien Term Loan(c) | 9.50 | % | 3M SOFR + 5.50%, 1.00% Floor | 09/30/2031 | 295,714 | 295,714 | |||||||||||
| Metrc, Revolver(c)(d) | – | % | 3M SOFR + 7.25%, 0.75% Floor | 09/30/2031 | – | – | |||||||||||
| Phoenix Finance, Inc., First Lien Term Loan(c) | 13.00 | % | 3M SOFR + 9.00%, 1.00% Floor | 08/14/2028 | 887,275 | 862,494 | |||||||||||
| Phoenix Finance, Inc., Second Lien Term Loan(c) | 11.65 | % | 3M SOFR + 7.50%, 1.00% Floor | 08/14/2028 | 1,589,927 | 1,443,519 | |||||||||||
| Precisely Software Incorporated, Second Lien Term Loan(c) | 11.82 | % | 3M SOFR + 7.25%, 0.75% Floor | 04/23/2029 | 3,000,000 | 2,884,380 | |||||||||||
| Spectrio, Delayed Draw Term Loan(c)(e) | 10.20 | % | 3M SOFR + 6.00%, 1.00% Floor | 12/09/2026 | 1,180,667 | 1,059,649 | |||||||||||
| Spectrio, First Lien Term Loan(c)(e) | 10.20 | % | 3M SOFR + 3.50%, 1.00% Floor | 12/09/2026 | 2,830,556 | 2,540,424 | |||||||||||
| VTX Intermediate Holdings, Inc., First Lien Term Loan(c)(e) | 12.30 | % | 1M SOFR + 7.00%, 1.00% PIK, 2.00% Floor | 12/12/2029 | 1,153,300 | 1,138,884 | |||||||||||
| VTX Intermediate Holdings, Inc., Second Lien Term Loan(c)(e) | 12.50 | % | 12.50% PIK | 12/12/2030 | 1,987,275 | 1,917,720 | |||||||||||
| 37,661,736 | |||||||||||||||||
| TOTAL BANK LOANS | |||||||||||||||||
| (Cost $135,096,403) | 119,923,622 | ||||||||||||||||
| CORPORATE BONDS (2.23%)(a)(b) | |||||||||||||||||
| Communications (1.03%) | |||||||||||||||||
| Spanish Broadcasting System, Inc.(i) | 9.75 | % | 9.75% | 03/01/2026 | 3,000,000 | 1,987,500 | |||||||||||
| Consumer Discretionary (–%) | |||||||||||||||||
| Monitronics - Escrow(c) | – | % | N/A | 12/31/2049 | 2,650,000 | – | |||||||||||
| Financials (1.03%) | |||||||||||||||||
| EJF CRT 2024-R1 LLC(c) | 11.86 | % | 1M CMTR + 7.75%, 7.75% Floor | 12/17/2055 | 1,990,791 | 1,990,791 | |||||||||||
| Industrials (0.17%) | |||||||||||||||||
| VORTEX OPCO, LLC(f)(i) | – | % | 8.00% | 04/30/2030 | 3,135,000 | 321,338 | |||||||||||
| TOTAL CORPORATE BONDS | |||||||||||||||||
| (Cost $6,100,255) | 4,299,629 | ||||||||||||||||
See Notes to Consolidated Financial Statements.
| 18 | www.altcif.com |
| Alternative Credit Income Fund | Consolidated Schedule of Investments |
| September 30, 2025 |
| Principal/ | |||||||||||||||||
| Coupon | Reference Rate & Spread | Maturity | Shares | Value | |||||||||||||
| EQUIPMENT FINANCING (0.45%)(a)(b) | |||||||||||||||||
| Financials (0.45%) | |||||||||||||||||
| White Oak Equipment Finance 1, LLC(c)(j) | 10.75 | % | N/A | 01/01/2027 | $ | 876,369 | $ | 876,369 | |||||||||
| TOTAL EQUIPMENT FINANCING | |||||||||||||||||
| (Cost $876,369) | 876,369 | ||||||||||||||||
| PREFERRED STOCK (4.58%)(b) | |||||||||||||||||
| Consumer Discretionary (3.94%) | |||||||||||||||||
| EBSC Holdings LLC (Riddell, Inc.), Preferred(a)(c)(e)(g) | 10.00% PIK | N/A | 1,159,538 | 1,316,076 | |||||||||||||
| Pennfoster(c)(e) | 14.89 | % | N/A | 6,106,592 | 6,106,591 | ||||||||||||
| Princeton Medspa Partners, LLC, Preferred(a)(c)(e)(g)(j) | 12.50% PIK | N/A | 291,654 | 202,962 | |||||||||||||
| 7,625,629 | |||||||||||||||||
| Consumer Staples (0.24%) | |||||||||||||||||
| Middle West Spirits Holdings, LLC, Preferred(a)(c)(e) | 10.00% PIK | N/A | 458,726 | 473,314 | |||||||||||||
| Health Care (0.09%) | |||||||||||||||||
| American Academy Holdings. Inc., Preferred(a)(c)(e)(j) | 18.00 | % | N/A | 90,970 | 170,791 | ||||||||||||
| Industrials (0.31%) | |||||||||||||||||
| GreenPark Infrastructure, LLC Series A(c)(g)(j)(k) | 400 | 200,000 | |||||||||||||||
| Phoenix Aviation Capital LLC, Preferred(a)(c)(e)(j) | 7.00% PIK | N/A | 446,908 | 395,513 | |||||||||||||
| 595,513 | |||||||||||||||||
| TOTAL PREFERRED STOCK | |||||||||||||||||
| (Cost $8,478,142) | 8,865,247 | ||||||||||||||||
| ASSET-BACKED SECURITIES (3.68%)(a)(b) | |||||||||||||||||
| Financials (3.68%) | |||||||||||||||||
| Canyon Capital CLO 2014-1, Ltd., Class ER(f)(i) | –% | 3M SOFR + 7.70% | 01/30/2031 | 1,000,000 | 595,504 | ||||||||||||
| JMP Credit Advisors CLO IV, Ltd.(c)(f) | –% | N/A | 07/17/2029 | 4,836,540 | 159,606 | ||||||||||||
| JMP Credit Advisors CLO V, Ltd.(c)(f) | –% | N/A | 07/17/2030 | 4,486,426 | 220,732 | ||||||||||||
| Mount Logan Funding 2018-1 LP(c)(g)(i) | 22.14 | % | N/A | 01/22/2033 | 7,798,575 | 4,745,433 | |||||||||||
| Octagon Investment Partners 36, Ltd., Class F(i) | 12.33 | % | 3M SOFR + 7.75% | 04/15/2031 | 1,000,000 | 652,576 | |||||||||||
| Saranac CLO VII, Ltd., Class ER(f)(i) | –% | 3M SOFR + 6.72% | 11/20/2029 | 508,648 | 65,222 | ||||||||||||
| Tralee CLO II, Ltd., Class ER, Class ER(i) | 12.44 | % | 3M SOFR + 7.85% | 07/20/2029 | 1,000,000 | 677,601 | |||||||||||
| Tralee CLO II, Ltd., Class FR, Class FR(f)(i) | –% | 3M SOFR + 8.85% | 07/20/2029 | 1,000,000 | 139 | ||||||||||||
| 7,116,813 | |||||||||||||||||
| TOTAL ASSET-BACKED SECURITIES | |||||||||||||||||
| (Cost $12,876,175) | 7,116,813 | ||||||||||||||||
| Shares | Value | |||||||
| COMMON EQUITY (8.27%)(b) | ||||||||
| Communication Services (0.04%) | ||||||||
| Next Flight Ventures(c)(k) | 88 | 63,766 | ||||||
| NFV Co-Pilot, Inc.(c)(k) | 441 | 20,755 | ||||||
| 84,521 | ||||||||
| Consumer Discretionary (0.53%) | ||||||||
| CEC Entertainment, Inc.(k) | 79,564 | 1,034,332 | ||||||
| JoAnn Inc.(c)(k) | 1,570,371 | – | ||||||
| 1,034,332 | ||||||||
| Consumer Staples (2.08%) | ||||||||
| Cooper OH Originations, LLC SPV(c)(j)(k) | 40,000 | 4,000,000 | ||||||
| Middle West Spirits Holdings, LLC, Common Stock(c)(k) | 46 | 29,260 | ||||||
| 4,029,260 | ||||||||
| Diversified (1.59%) | ||||||||
| BCP Investment Corp.(g) | 31,482 | 362,987 | ||||||
See Notes to Consolidated Financial Statements.
| Annual Report | September 30, 2025 | 19 |
| Alternative Credit Income Fund | Consolidated Schedule of Investments |
| September 30, 2025 |
| Shares | Value | |||||||
| Diversified (1.59%) (continued) | ||||||||
| CION Investment Corp. | 120,800 | $ | 1,145,184 | |||||
| Franklin BSP Capital Corp. | 60,385 | 833,061 | ||||||
| WhiteHorse Finance, Inc. | 107,328 | 742,710 | ||||||
| 3,083,942 | ||||||||
| Financials (0.65%) | ||||||||
| AIP Capital, LLC(c)(j)(k) | 30 | 12,368 | ||||||
| Aperture Dodge 18 LLC(c)(k) | 2,057,840 | 1,247,187 | ||||||
| 1,259,555 | ||||||||
| Health Care (0.23%) | ||||||||
| American Academy Holdings. Inc., Common Units(c)(j)(k) | 0.05 | 273,609 | ||||||
| DxTx Pain and Spine LLC, Common Units(c)(j)(k) | 98,854 | 164,098 | ||||||
| 437,707 | ||||||||
| Industrials (0.57%) | ||||||||
| GreenPark Infrastructure, LLC Series M-1(c)(g)(j)(k) | 2,565 | 878,444 | ||||||
| Incora Top Holdco LLC(c)(k) | 5,350 | 93,625 | ||||||
| Phoenix Aviation Capital LLC, Common Stock(c)(j)(k) | 1 | 129,677 | ||||||
| 1,101,746 | ||||||||
| Information Technology (0.53%) | ||||||||
| BGPT Maverick, L.P.(c)(k) | 1,000,000 | 1,000,000 | ||||||
| VTX Holdings, LLC(c)(k) | 932,474 | 8,324 | ||||||
| 1,008,324 | ||||||||
| Real Estate (2.05%) | ||||||||
| Copper Property CTL Pass Through Trust(j) | 319,520 | 3,965,243 | ||||||
| TOTAL COMMON EQUITY | ||||||||
| (Cost $21,827,570) | 16,004,630 | |||||||
| WARRANTS (0.25%)(b) | ||||||||
| Consumer Discretionary (0.01%) | ||||||||
| CEC Entertainment, Inc., Warrants | 237,941 | 13,087 | ||||||
| Princeton Medspa Partners, LLC, Warrants(c)(g)(j) | 0.09 | 7,029 | ||||||
| 20,116 | ||||||||
| Financials (0.24%) | ||||||||
| SouthStreet Securities Holdings, Inc., Warrants(c) | 3,400 | 460,972 | ||||||
| Information Technology (–%) | ||||||||
| Diamanti, Inc., Class A(c) | 146,413 | – | ||||||
| TOTAL WARRANTS | ||||||||
| (Cost $390,456) | 481,088 | |||||||
| Value | ||||
| PRIVATE INVESTMENT FUNDS (17.25%)(b) | ||||
| BlackRock Global Credit Opportunities Fund, LP(d)(l)(m) | 7,076,955 | |||
| CVC European Mid-Market Solutions Fund(d)(l)(m) | 1,128,687 | |||
| EJF Financial Debt Strategies Fund LP(m) | 817,738 | |||
| GSO Credit Alpha Fund II LP(d)(l)(m) | 1,551,899 | |||
| Monroe Capital Private Credit Fund III LP(d)(l)(m) | 4,111,002 | |||
| Pelham S2K SBIC II, L.P.(d)(l)(m) | 518,696 | |||
| Tree Line Credit Strategies LP(l)(m) | 18,160,617 | |||
| 33,365,594 | ||||
| TOTAL PRIVATE INVESTMENT FUNDS | ||||
| (Cost $36,490,703) | 33,365,594 | |||
See Notes to Consolidated Financial Statements.
| 20 | www.altcif.com |
| Alternative Credit Income Fund | Consolidated Schedule of Investments |
September 30, 2025
| Shares | Value | |||||||
| INTERVAL FUND (2.18%)(b) | ||||||||
| Diversified (2.18%) | ||||||||
| Opportunistic Credit Interval Fund(g) | 362,837 | $ | 4,219,791 | |||||
| TOTAL INTERVAL FUND | ||||||||
| (Cost $4,368,554) | 4,219,791 | |||||||
| JOINT VENTURE (0.17%)(b) | ||||||||
| Joint Venture (0.17%) | ||||||||
| Series B - Great Lakes Funding II LLC(d)(g)(m)(n) | 339,136 | 323,196 | ||||||
| TOTAL JOINT VENTURE | ||||||||
| (Cost $339,136) | 323,196 | |||||||
| Number of | ||||||||
| Contracts | Value | |||||||
| DERIVATIVES (–%)(b) | ||||||||
| Consumer Discretionary (–%) | ||||||||
| Princeton Medspa Partners, LLC, Put Option(c)(g)(j) | 250,000 | – | ||||||
| TOTAL DERIVATIVES | ||||||||
| (Cost $–) | – | |||||||
| INVESTMENTS, AT VALUE (101.05%) | ||||||||
| (COST $226,843,763) | $ | 195,475,979 | ||||||
| LIABILITIES IN EXCESS OF OTHER ASSETS (-1.05%) | (2,027,962 | ) | ||||||
| NET ASSETS - (100.00%) | $ | 193,448,017 | ||||||
Investment Abbreviations:
SOFR - Secured Overnight Financing Rate
PIK - Payment in-Kind
Reference Rates:
1M SOFR - 1 Month US SOFR as of September 30, 2025 was 4.12%.
3M SOFR - 3 Month US SOFR as of September 30, 2025 was 3.97%.
6M SOFR - 6 Month US SOFR as of September 30, 2025 was 3.84%.
1M CMTR - 1 Month Constant Maturity Treasury Rate was 4.11%
| (a) | Variable rate investment. Interest rates reset periodically. Interest rate shown reflects the rate in effect at September 30, 2025. For securities based on a published reference rate and spread, the reference rate and spread are indicated in the description above. Certain variable rate securities are not based on a published reference rate and spread but are determined by the issuer or agent and are based on current market conditions. These securities do not indicate a reference rate and spread in their description above. |
| (b) | These investments are pledged to secure the Fund’s debt obligations. |
| (c) | As a result of the use of significant unobservable inputs to determine fair value, these investments have been classified as Level 3 assets. |
| (d) | All or a portion of this commitment was unfunded as of September 30, 2025. |
| (e) | Payment in kind security which may pay interest in additional par. |
| (f) | Non-accrual investment. Beginning during the quarter ended June 30, 2025, the Company recognized interest income to the extent that it is received in cash on its loans to Colonnade Intermediate, LLC (cash basis income recognition). |
| (g) | Affiliate company. |
| (h) | Principal balance denominated in euros. |
| (i) | Securities exempt from registration under Rule 144A of the Securities Act of 1933, as amended. These securities may be sold in the ordinary course of business in transactions exempt from registration, normally to qualified institutional buyers. As of September 30, 2025, the aggregate market value of those securities was $9,045,313, representing 4.67% of net assets. |
| (j) | Investment is held through ACIF Master Blocker, LLC, wholly-owned subsidiary. |
See Notes to Consolidated Financial Statements.
| Annual Report | September 30, 2025 | 21 |
| Alternative Credit Income Fund | Consolidated Schedule of Investments |
| September 30, 2025 |
| (k) | Non-income producing security. |
| (l) | Investment is held through CIF Investments LLC, a wholly-owned subsidiary. |
| (m) | Restricted security. |
| (n) | During the year ended September 30, 2025, the Fund invested $363,727 in Series B – Great Lakes Funding II LLC units, received a return of capital distribution of $24,591, and reported change in unrealized depreciation of $15,940. Additionally, Series B – Great Lakes Funding II LLC declared distributions of $13,630 during the year ended September 30, 2025. |
Securities determined to be restricted under the procedures approved by the Fund's Board of Trustees are as follows.
| Date(s) of Purchases | Security | Cost | Value | % of Net Assets | |||||||||||
| 03/31/2018 - 06/30/2025 | BlackRock Global Credit Opportunities Fund, LP | $ | 9,158,434 | $ | 7,076,955 | 3.66 | % | ||||||||
| 09/30/2017 - 09/30/2021 | CVC European Mid-Market Solutions Fund | 2,911,407 | 1,128,687 | 0.58 | % | ||||||||||
| 06/30/2024 - 09/30/2024 | EJF Financial Debt Strategies Fund LP | 750,000 | 817,738 | 0.42 | % | ||||||||||
| 06/30/2018 - 03/31/2021 | GSO Credit Alpha Fund II LP | 421,968 | 1,551,899 | 0.80 | % | ||||||||||
| 09/30/2018 - 12/31/2020 | Monroe Capital Private Credit Fund III LP | 3,736,223 | 4,111,002 | 2.13 | % | ||||||||||
| 11/14/2022 - 06/30/2025 | Pelham S2K SBIC II, L.P. | 512,671 | 518,696 | 0.27 | % | ||||||||||
| 08/01/2025 - 09/30/2025 | Series B - Great Lakes Funding II LLC | 339,136 | 323,196 | 0.17 | % | ||||||||||
| 12/31/2017 - 06/30/2019 | Tree Line Credit Strategies LP | 19,000,000 | 18,160,617 | 9.39 | % | ||||||||||
| Total | $ | 36,829,839 | $ | 33,688,790 | 17.42 | % | |||||||||
Additional information on investments in private investment funds and unfunded commitments:
| Security | Value | Redemption Frequency | Redemption Notice(Days) | Unfunded Commitments as of September 30, 2025 | ||||||||||
| BlackRock Global Credit Opportunities Fund, LP(a) | $ | 7,076,955 | N/A | N/A | $ | 3,259,801 | ||||||||
| CVC European Mid-Market Solutions Fund | 1,128,687 | N/A | N/A | 206,342 | ||||||||||
| EJF Financial Debt Strategies Fund LP | 817,738 | N/A | N/A | – | ||||||||||
| GSO Credit Alpha Fund II LP(a) | 1,551,899 | N/A | N/A | 7,382,124 | ||||||||||
| Monroe Capital Private Credit Fund III LP | 4,111,002 | N/A | N/A | 1,498,740 | ||||||||||
| Pelham S2K SBIC II, L.P. | 518,696 | N/A | N/A | 1,487,329 | ||||||||||
| Series B - Great Lakes Funding II LLC | 323,196 | N/A | N/A | 137,320 | ||||||||||
| Tree Line Credit Strategies LP | 18,160,617 | Quarterly | 90 | – | ||||||||||
| Total | $ | 33,688,790 | $ | 13,971,656 | ||||||||||
Unfunded Commitments:
| Security | Value | Maturity | Unfunded Commitments as of September 30, 2025 | ||||||||
| Cor Leonis Limited, Revolver | $ | 2,807,862 | 05/15/2028 | $ | 289,264 | ||||||
| Dun & Bradstreet Holdings, Inc., Revolver | (1,697 | ) | 05/21/2032 | 169,669 | |||||||
| Hunter Point Capital Structured Notes Issuer, LLC, Subordinated Delayed Draw Notes | 4,637,429 | 07/15/2052 | 2,478,289 | ||||||||
| Metrc, Delayed Draw Term Loan | – | 09/30/2031 | 49,286 | ||||||||
| Metrc, Revolver | – | 09/30/2031 | 155,000 | ||||||||
| Middle West Spirits Holdings, LLC, Revolver | (10,333 | ) | 04/23/2030 | 555,556 | |||||||
| Newbury Franklin Industrials, LLC, Delayed Draw Term Loan | 441,760 | 12/11/2029 | 532,895 | ||||||||
| Next Flight Ventures, Delayed Draw Term Loan | 1,019,985 | 12/26/2025 | 266,700 | ||||||||
| PhyNet Dermatology LLC, Delayed Draw Term Loan | (5,172 | ) | 10/20/2029 | 1,034,483 | |||||||
| PMA Parent Holdings LLC, Revolver | (2,501 | ) | 01/31/2031 | 250,075 | |||||||
| PMP OPCO, LLC, Delayed Draw Term Loan | (20,813 | ) | 05/31/2029 | 520,313 | |||||||
| PMP OPCO, LLC, Revolver | (7,031 | ) | 05/31/2029 | 140,625 | |||||||
| TA/WEG HOLDINGS, LLC, Revolver | (226 | ) | 10/02/2028 | 75,248 | |||||||
| Total | $ | 8,859,263 | $ | 6,517,403 | |||||||
| Total Unfunded Commitments | $ | 20,489,059 | |||||||||
See Notes to Consolidated Financial Statements.
| 22 | www.altcif.com |
| Alternative Credit Income Fund | Consolidated Statement of Assets and Liabilities |
September 30, 2025
| ASSETS | ||||
| Investments, at value (Cost $206,875,911) | $ | 178,765,281 | ||
| Affiliated investments, at value (Cost $19,967,852) | 16,710,698 | |||
| Foreign currency, at value (Cost $73) | 73 | |||
| Cash | 4,205,118 | |||
| Interest and distributions receivable | 2,429,589 | |||
| Receivable for Fund shares sold | 47,370 | |||
| Prepaid expenses and other assets | 128,350 | |||
| Total Assets | 202,286,479 | |||
| LIABILITIES | ||||
| USB Credit Facility (Proceeds $7,554,410) | 7,756,971 | |||
| Interest on line of credit payable | 79,063 | |||
| Due to Adviser | 249,331 | |||
| Administration fees payable | 170,856 | |||
| Custody fees payable | 10,325 | |||
| Transfer agency fees payable | 31,246 | |||
| Accrued expenses and other liabilities | 540,670 | |||
| Total liabilities | 8,838,462 | |||
| Commitments and contingencies (Note 2) | ||||
| NET ASSETS | $ | 193,448,017 | ||
| NET ASSETS CONSIST OF | ||||
| Paid-in capital | $ | 229,211,643 | ||
| Total accumulated deficit | (35,763,626 | ) | ||
| NET ASSETS | $ | 193,448,017 | ||
| Common Shares: | ||||
| Class A: | ||||
| Net assets | $ | 23,560,806 | ||
| Shares of beneficial interest outstanding (no par value; unlimited shares) | 2,584,155 | |||
| Net asset value(a) | $ | 9.12 | ||
| Maximum offering price per share (maximum sales charge of 5.75%) | $ | 9.67 | ||
| Class C: | ||||
| Net assets | $ | 22,017,100 | ||
| Shares of beneficial interest outstanding (no par value; unlimited shares) | 2,380,407 | |||
| Net asset value(a) | $ | 9.25 | ||
| Class I: | ||||
| Net assets | $ | 100,819,389 | ||
| Shares of beneficial interest outstanding (no par value; unlimited shares) | 11,056,515 | |||
| Net asset value | $ | 9.12 | ||
| Class L: | ||||
| Net assets | $ | 8,090,249 | ||
| Shares of beneficial interest outstanding (no par value; unlimited shares) | 886,477 | |||
| Net asset value | $ | 9.13 | ||
| Maximum offering price per share (maximum sales charge of 4.25%) | $ | 9.53 | ||
| Class W: | ||||
| Net assets | $ | 38,960,473 | ||
| Shares of beneficial interest outstanding (no par value; unlimited shares) | 4,276,783 | |||
| Net asset value | $ | 9.11 | ||
| (a) | Redemption price varies based on length of time held (Note 6). |
See Notes to Consolidated Financial Statements.
| Annual Report | September 30, 2025 | 23 |
| Alternative Credit Income Fund | Consolidated Statement of Operations |
| For the Year Ended September 30, 2025 |
| INVESTMENT INCOME | ||||
| Interest - Non-Affiliated | $ | 13,432,387 | ||
| Interest - Affiliated | 1,975,819 | |||
| Dividends - Non-Affiliated | 4,470,390 | |||
| Dividends - Affiliated | 483,645 | |||
| Payment-in-kind interest - Non-Affiliated | 3,757,244 | |||
| Payment-in-kind interest - Affiliated | 142,831 | |||
| Other income | 118,353 | |||
| Total investment income | 24,380,669 | |||
| EXPENSES | ||||
| Investment advisory fees (Note 4) | 3,824,690 | |||
| Administrative fees (Note 4) | 496,701 | |||
| Transfer agent fees | 265,672 | |||
| Interest expense (Note 7) | 511,282 | |||
| Shareholder servicing fees (Note 4) | ||||
| Class A | 47,369 | |||
| Class C | 58,935 | |||
| Class L | 20,876 | |||
| Class W | 100,607 | |||
| Distribution fees (Note 4) | ||||
| Class C | 176,799 | |||
| Class L | 20,876 | |||
| Professional fees | 948,509 | |||
| Insurance expense | 132,044 | |||
| Printing expense | 116,545 | |||
| Registration fees | 75,442 | |||
| Trustee fees and expenses | 41,680 | |||
| Custody fees | 30,233 | |||
| Networking Fees: | ||||
| Class A | 6,328 | |||
| Class C | 5,718 | |||
| Class I | 17,479 | |||
| Class L | 2,812 | |||
| Class W | 219 | |||
| Other expenses | 55,177 | |||
| Total expenses | 6,955,993 | |||
| Contractual fees waived by Adviser (Note 4) | (1,165,375 | ) | ||
| Recoupment of previously waived fees (Note 4) | 3,774 | |||
| Voluntary fees waived by Adviser (Note 4) | (106,442 | ) | ||
| Total net expenses | 5,687,950 | |||
| NET INVESTMENT INCOME | 18,692,719 | |||
| REALIZED AND UNREALIZED GAIN/(LOSS) ON INVESTMENTS | ||||
| Net realized loss on investments - Non-Affiliated | (11,444,304 | ) | ||
| Net realized loss on investments - Affiliated | (85,521 | ) | ||
| Net realized loss on foreign currency transactions | (1,816 | ) | ||
| Total net realized loss | (11,531,641 | ) | ||
| Net change in unrealized appreciation on investments - Non-Affiliated | 822,649 | |||
| Net change in unrealized depreciation on investments - Affiliated | (2,077,793 | ) | ||
| Net change in unrealized appreciation on debt denominated in foreign currency | (194,668 | ) | ||
| Total net change in unrealized depreciation | (1,449,812 | ) | ||
| NET REALIZED AND UNREALIZED LOSS ON INVESTMENTS | (12,981,453 | ) | ||
| NET INCREASE IN NET ASSETS RESULTING FROM OPERATIONS | $ | 5,711,266 | ||
See Notes to Consolidated Financial Statements.
| 24 | www.altcif.com |
| Alternative Credit Income Fund | Consolidated Statements of Changes in Net Assets |
| For the Year Ended September 30, 2025 | For the Year Ended September 30, 2024 | |||||||
| OPERATIONS: | ||||||||
| Net investment income | $ | 18,692,719 | $ | 23,494,018 | ||||
| Net realized gain/(loss) on investments | (11,529,825 | ) | (5,376,469 | ) | ||||
| Net realized gain on securities sold short | — | 2,463,229 | ||||||
| Net realized gain/(loss) on foreign currency transactions | (1,816 | ) | 28,755 | |||||
| Net change in unrealized depreciation on investments | (1,255,144 | ) | (5,262,928 | ) | ||||
| Net change in unrealized appreciation on securities sold short | — | (703,228 | ) | |||||
| Net change in unrealized (appreciation)/depreciation on debt denominated in foreign currency | (194,668 | ) | (7,676 | ) | ||||
| Net change in unrealized depreciation on translation of assets and liabilities in foreign currencies | — | 11 | ||||||
| Net increase in net assets resulting from operations | 5,711,266 | 14,635,712 | ||||||
| DISTRIBUTIONS TO SHAREHOLDERS: | ||||||||
| Total distributable earnings | ||||||||
| Class A | (2,285,980 | ) | (2,200,085 | ) | ||||
| Class C | (2,133,118 | ) | (2,237,560 | ) | ||||
| Class I | (9,962,971 | ) | (8,500,670 | ) | ||||
| Class L | (736,556 | ) | (671,503 | ) | ||||
| Class W | (3,818,179 | ) | (3,500,561 | ) | ||||
| Total distributions to shareholders | (18,936,804 | ) | (17,110,379 | ) | ||||
| COMMON SHARE TRANSACTIONS | ||||||||
| Class A | ||||||||
| Proceeds from sales of shares | 912,274 | 1,838,587 | ||||||
| Distributions reinvested | 784,236 | 1,035,451 | ||||||
| Cost of shares redeemed | (4,042,556 | ) | (9,370,560 | ) | ||||
| Net transferred in(out) | (249,916 | ) | (1,642,125 | ) | ||||
| Net Decrease from share transactions | (2,595,962 | ) | (8,138,647 | ) | ||||
| Class C | ||||||||
| Proceeds from sales of shares | 303,044 | 799,942 | ||||||
| Distributions reinvested | 971,707 | 941,668 | ||||||
| Cost of shares redeemed | (3,669,897 | ) | (5,485,249 | ) | ||||
| Net transferred in(out) | (4,096,289 | ) | (6,806,712 | ) | ||||
| Net Decrease from share transactions | (6,491,435 | ) | (10,550,351 | ) | ||||
| Class I | ||||||||
| Proceeds from sales of shares | 9,529,278 | 22,395,998 | ||||||
| Distributions reinvested | 3,297,709 | 3,035,631 | ||||||
| Cost of shares redeemed | (23,222,126 | ) | (29,206,944 | ) | ||||
| Net transferred in(out) | 4,339,353 | 7,929,477 | ||||||
| Net Increase/(Decrease) from share transactions | (6,055,786 | ) | 4,154,162 | |||||
| Class L | ||||||||
| Proceeds from sales of shares | 16,974 | 46,391 | ||||||
| Distributions reinvested | 458,649 | 405,045 | ||||||
| Cost of shares redeemed | (731,688 | ) | (2,597,798 | ) | ||||
| Net Decrease from share transactions | (256,065 | ) | (2,146,362 | ) | ||||
| Class W | ||||||||
| Proceeds from sales of shares | 4,172,704 | 3,832,922 | ||||||
| Distributions reinvested | 953,870 | 853,187 | ||||||
| Cost of shares redeemed | (10,860,309 | ) | (10,411,110 | ) | ||||
| Net transferred in(out) | 6,852 | 519,360 | ||||||
| Net Decrease from share transactions | (5,726,883 | ) | (5,205,641 | ) | ||||
See Notes to Consolidated Financial Statements.
| Annual Report | September 30, 2025 | 25 |
| Alternative Credit Income Fund | Consolidated Statements of Changes in Net Assets |
| For the Year Ended September 30, 2025 | For the Year Ended September 30, 2024 | |||||||
| Total net decrease in net assets | (34,351,669 | ) | (24,361,506 | ) | ||||
| NET ASSETS | ||||||||
| Beginning of year | 227,799,686 | 252,161,192 | ||||||
| End of year | $ | 193,448,017 | $ | 227,799,686 | ||||
| Other Information | ||||||||
| Common Shares Transactions | ||||||||
| Class A | ||||||||
| Issued | 97,071 | 187,886 | ||||||
| Distributions reinvested | 84,478 | 106,890 | ||||||
| Redeemed | (435,487 | ) | (965,710 | ) | ||||
| Exchanged out | (26,066 | ) | (167,276 | ) | ||||
| Net decrease in shares | (280,004 | ) | (838,210 | ) | ||||
| Class C | ||||||||
| Issued | 32,317 | 80,831 | ||||||
| Distributions reinvested | 102,748 | 96,071 | ||||||
| Redeemed | (390,603 | ) | (558,470 | ) | ||||
| Exchanged out | (436,446 | ) | (680,409 | ) | ||||
| Net decrease in shares | (691,984 | ) | (1,061,977 | ) | ||||
| Class I | ||||||||
| Issued | 1,018,087 | 2,302,423 | ||||||
| Distributions reinvested | 355,819 | 312,890 | ||||||
| Redeemed | (2,495,275 | ) | (3,003,478 | ) | ||||
| Exchanged in | 467,156 | 800,569 | ||||||
| Net increase/(decrease) in shares | (654,213 | ) | 412,404 | |||||
| Class L | ||||||||
| Issued | 1,832 | 4,775 | ||||||
| Distributions reinvested | 49,542 | 41,822 | ||||||
| Redeemed | (79,397 | ) | (268,131 | ) | ||||
| Net decrease in shares | (28,023 | ) | (221,534 | ) | ||||
| Class W | ||||||||
| Issued | 448,454 | 393,655 | ||||||
| Distributions reinvested | 102,983 | 88,123 | ||||||
| Redeemed | (1,168,509 | ) | (1,072,366 | ) | ||||
| Exchanged in | 767 | 53,107 | ||||||
| Net decrease in shares | (616,305 | ) | (537,481 | ) | ||||
See Notes to Consolidated Financial Statements.
| 26 | www.altcif.com |
| Alternative Credit Income Fund | Consolidated Statement of Cash Flows |
For the Year Ended September 30, 2025
| For the Year Ended September 30, 2025 | ||||
| CASH FLOWS FROM OPERATING ACTIVITIES: | ||||
| Net increase in net assets from operations | $ | 5,711,266 | ||
| Adjustments to reconcile net increase in net assets resulting from operations to net cash provided by operating activities: | ||||
| Purchase of investments securities | (42,035,949 | ) | ||
| Proceeds from sale of investments securities | 48,621,363 | |||
| Proceeds from sale of short-term investment securities - net | 20,026,069 | |||
| Amortization of premium and accretion of discount on investments | (2,505,770 | ) | ||
| Payment-in-kind income | (3,900,075 | ) | ||
| Net realized (gain)/loss on: | ||||
| Investments | 11,529,825 | |||
| Foreign currency transactions | 1,816 | |||
| Net change in unrealized (appreciation)/depreciation on: | ||||
| Investments | 1,255,144 | |||
| Debt | 194,668 | |||
| (Increase)/Decrease in assets: | ||||
| Interest and distributions receivable | 821,535 | |||
| Prepaid expenses and other assets | (11,342 | ) | ||
| Increase/(Decrease) in liabilities: | ||||
| Due to Adviser | 167,904 | |||
| Interest on line of credit payable | (262 | ) | ||
| Administration fees payable | (44,445 | ) | ||
| Custody fees payable | 7,664 | |||
| Transfer agency fees payable | (30,618 | ) | ||
| Accrued expenses and other liabilities | 157,314 | |||
| Net cash provided by operating activities | $ | 39,966,107 | ||
| CASH FLOWS FROM FINANCING ACTIVITIES: | ||||
| Proceeds from sales of shares | 15,233,906 | |||
| Cost of shares redeemed | (42,526,576 | ) | ||
| Borrowings on US Bank Line of Credit | 9,500,000 | |||
| Repayment on US Bank Line of Credit | (5,500,000 | ) | ||
| Cash distributions paid | (12,470,633 | ) | ||
| Net cash used in financing activities | $ | (35,763,303 | ) | |
| Effect of exchange rate changes on cash | (1,599 | ) | ||
| Net Change in cash & cash equivalents | $ | 4,201,205 | ||
| Restricted and unrestricted cash, beginning of year | $ | 3,986 | ||
| Restricted and unrestricted cash, end of year* | $ | 4,205,191 | ||
| SUPPLEMENTAL DISCLOSURE OF CASH FLOW INFORMATION | ||||
| Cash paid for interest: | $ | 511,020 | ||
| SUPPLEMENTAL DISCLOSURE OF NON-CASH INVESTING AND FINANCING TRANSACTIONS | ||||
| Reinvestment of distributions: | $ | 6,466,171 | ||
| * | Consists of cash and foreign currency, at value. |
See Notes to Consolidated Financial Statements.
| Annual Report | September 30, 2025 | 27 |
| Alternative Credit Income Fund – Class A | Financial Highlights |
For a Share Outstanding Throughout the Years Presented
| For the Year Ended September 30, 2025 | For the Year Ended September 30, 2024 | For the Year Ended September 30, 2023 | For the Year Ended September 30, 2022 | For the Year Ended September 30, 2021 | ||||||||||||||||
| NET ASSET VALUE, BEGINNING OF YEAR | $ | 9.69 | $ | 9.79 | $ | 10.09 | $ | 11.09 | $ | 9.75 | ||||||||||
| INCOME FROM INVESTMENT OPERATIONS: | ||||||||||||||||||||
| Net investment income(a) | 0.85 | 0.97 | 0.93 | 0.61 | 0.74 | |||||||||||||||
| Net realized and unrealized gain/(loss) on investments | (0.57 | ) | (0.37 | ) | (0.53 | ) | (0.91 | ) | 1.30 | |||||||||||
| Total income/(loss) from investment operations | 0.28 | 0.60 | 0.40 | (0.30 | ) | 2.04 | ||||||||||||||
| DISTRIBUTIONS TO SHAREHOLDERS | ||||||||||||||||||||
| From net investment income | (0.85 | ) | (0.70 | ) | (0.70 | ) | (0.66 | ) | (0.63 | ) | ||||||||||
| From return of capital | – | – | – | (0.04 | ) | (0.07 | ) | |||||||||||||
| Total distributions | (0.85 | ) | (0.70 | ) | (0.70 | ) | (0.70 | ) | (0.70 | ) | ||||||||||
| INCREASE/(DECREASE) IN NET ASSET VALUE | (0.57 | ) | (0.10 | ) | (0.30 | ) | (1.00 | ) | 1.34 | |||||||||||
| NET ASSET VALUE, END OF YEAR | $ | 9.12 | $ | 9.69 | $ | 9.79 | $ | 10.09 | $ | 11.09 | ||||||||||
| TOTAL RETURN(b) | 3.12 | %(c)(d) | 6.33 | %(c) | 4.19 | %(c) | (2.85 | )% | 21.33 | %(c) | ||||||||||
| RATIOS AND SUPPLEMENTAL DATA: | ||||||||||||||||||||
| Net assets, end of period (000s) | $ | 23,561 | $ | 27,767 | $ | 36,233 | $ | 38,452 | $ | 41,519 | ||||||||||
| RATIOS TO AVERAGE NET ASSETS(e) | ||||||||||||||||||||
| Including incentive fees, interest expense and interest amortization/accretion on securities sold short: | ||||||||||||||||||||
| Expenses, gross | 3.38 | % | 3.29 | % | 3.00 | % | 2.60 | % | 2.84 | % | ||||||||||
| Expenses, net of voluntary incentive waiver | 3.32 | % | 3.29 | % | 3.00 | % | 2.60 | % | 2.84 | % | ||||||||||
| Expenses, net of all fees waived/expenses reimbursed by Adviser | 2.79 | % | 2.92 | % | 2.87 | % | 2.60 | % | 2.65 | % | ||||||||||
| Excluding incentive fees, interest expense and interest amortization/accretion on securities sold short: | ||||||||||||||||||||
| Expenses, gross | 3.13 | % | 2.96 | % | 2.72 | % | 2.59 | % | 2.78 | % | ||||||||||
| Expenses, net of voluntary incentive waiver | 3.08 | % | 2.96 | % | 2.72 | % | 2.59 | % | 2.78 | % | ||||||||||
| Expenses, net of all fees waived/expenses reimbursed by Adviser | 2.54 | % | 2.59 | % | 2.59 | % | 2.59 | % | 2.59 | % | ||||||||||
| Net investment income | 9.06 | % | 9.91 | % | 9.36 | % | 5.60 | % | 6.87 | % | ||||||||||
| Portfolio turnover rate | 21 | % | 19 | % | 23 | % | 26 | % | 49 | % | ||||||||||
| BORROWINGS AT END OF YEAR | ||||||||||||||||||||
| Aggregate amount outstanding (000s) | $ | 7,757 | $ | 3,562 | $ | 3,879 | $ | – | $ | – | ||||||||||
| Asset coverage per $1,000 (000s) | $ | 25,939 | $ | 64,951 | $ | 66,093 | $ | – | $ | – | ||||||||||
| (a) | Per share numbers have been calculated using the average shares method. |
| (b) | Total returns shown are historical in nature and assume changes in share price, reinvestment of dividends and capital gains distribution, if any. Had the Adviser not absorbed a portion of Fund expenses, total returns would have been lower. Returns shown exclude applicable sales charges. |
| (c) | Includes adjustments in accordance with accounting principles generally accepted in the United States of America and, as such, the net asset values for financial reporting purposes and the returns based upon those net asset values may differ from net asset values and returns for shareholder transactions. |
| (d) | 0.11% of the Fund’s total return consists of a reimbursement by the Adviser for a loss on a transaction. Excluding this item, total return would have been 3.01%. |
| (e) | Ratios do not include expenses of underlying investment companies and private investment funds in which the Fund invests. |
See Notes to Consolidated Financial Statements.
| 28 | www.altcif.com |
| Alternative Credit Income Fund – Class C | Financial Highlights |
For a Share Outstanding Throughout the Years Presented
| For the Year Ended September 30, 2025 | For the Year Ended September 30, 2024 | For the Year Ended September 30, 2023 | For the Year Ended September 30, 2022 | For the Year Ended September 30, 2021 | ||||||||||||||||
| NET ASSET VALUE, BEGINNING OF YEAR | $ | 9.81 | $ | 9.90 | $ | 10.21 | $ | 11.21 | $ | 9.86 | ||||||||||
| INCOME FROM INVESTMENT OPERATIONS: | ||||||||||||||||||||
| Net investment income(a) | 0.79 | 0.91 | 0.86 | 0.53 | 0.66 | |||||||||||||||
| Net realized and unrealized gain/(loss) on investments | (0.58 | ) | (0.37 | ) | (0.54 | ) | (0.90 | ) | 1.31 | |||||||||||
| Total income/(loss) from investment operations | 0.21 | 0.54 | 0.32 | (0.37 | ) | 1.97 | ||||||||||||||
| DISTRIBUTIONS TO SHAREHOLDERS | ||||||||||||||||||||
| From net investment income | (0.77 | ) | (0.63 | ) | (0.63 | ) | (0.59 | ) | (0.56 | ) | ||||||||||
| From return of capital | – | – | – | (0.04 | ) | (0.06 | ) | |||||||||||||
| Total distributions | (0.77 | ) | (0.63 | ) | (0.63 | ) | (0.63 | ) | (0.62 | ) | ||||||||||
| INCREASE/(DECREASE) IN NET ASSET VALUE | (0.56 | ) | (0.09 | ) | (0.31 | ) | (1.00 | ) | 1.35 | |||||||||||
| NET ASSET VALUE, END OF YEAR | $ | 9.25 | $ | 9.81 | $ | 9.90 | $ | 10.21 | $ | 11.21 | ||||||||||
| TOTAL RETURN(b) | 2.32 | %(c)(d) | 5.64 | %(c) | 3.33 | %(c) | (3.48 | )% | 20.36 | %(c) | ||||||||||
| RATIOS AND SUPPLEMENTAL DATA: | ||||||||||||||||||||
| Net assets, end of period (000s) | $ | 22,017 | $ | 30,135 | $ | 40,947 | $ | 43,391 | $ | 47,640 | ||||||||||
| RATIOS TO AVERAGE NET ASSETS(e) | ||||||||||||||||||||
| Including incentive fees, interest expense and interest amortization/accretion on securities sold short: | ||||||||||||||||||||
| Expenses, gross | 4.07 | % | 4.06 | % | 3.74 | % | 3.38 | % | 3.59 | % | ||||||||||
| Expenses, net of voluntary incentive waiver | 4.02 | % | 4.06 | % | 3.74 | % | 3.38 | % | 3.59 | % | ||||||||||
| Expenses, net of all fees waived/expenses reimbursed by Adviser | 3.54 | % | 3.68 | % | 3.62 | % | 3.35 | % | 3.40 | % | ||||||||||
| Excluding incentive fees, interest expense and interest amortization/accretion on securities sold short: | ||||||||||||||||||||
| Expenses, gross | 3.82 | % | 3.73 | % | 3.46 | % | 3.37 | % | 3.53 | % | ||||||||||
| Expenses, net of voluntary incentive waiver | 3.77 | % | 3.73 | % | 3.46 | % | 3.37 | % | 3.53 | % | ||||||||||
| Expenses, net of all fees waived/expenses reimbursed by Adviser | 3.29 | % | 3.34 | % | 3.34 | % | 3.34 | % | 3.34 | % | ||||||||||
| Net investment income | 8.30 | % | 9.22 | % | 8.61 | % | 4.87 | % | 6.12 | % | ||||||||||
| Portfolio turnover rate | 21 | % | 19 | % | 23 | % | 26 | % | 49 | % | ||||||||||
| BORROWINGS AT END OF YEAR | ||||||||||||||||||||
| Aggregate amount outstanding (000s) | $ | 7,757 | $ | 3,562 | $ | 3,879 | $ | – | $ | – | ||||||||||
| Asset coverage per $1,000 (000s) | $ | 25,939 | $ | 64,951 | $ | 66,093 | $ | – | $ | – | ||||||||||
| (a) | Per share numbers have been calculated using the average shares method. |
| (b) | Total returns shown are historical in nature and assume changes in share price, reinvestment of dividends and capital gains distribution, if any. Had the Adviser not absorbed a portion of Fund expenses, total returns would have been lower. Returns shown exclude applicable sales charges. |
| (c) | Includes adjustments in accordance with accounting principles generally accepted in the United States of America and, as such, the net asset values for financial reporting purposes and the returns based upon those net asset values may differ from net asset values and returns for shareholder transactions. |
| (d) | 0.11% of the Fund’s total return consists of a reimbursement by the Adviser for a loss on a transaction. Excluding this item, total return would have been 2.21%. |
| (e) | Ratios do not include expenses of underlying investment companies and private investment funds in which the Fund invests. |
See Notes to Consolidated Financial Statements.
| Annual Report | September 30, 2025 | 29 |
| Alternative Credit Income Fund – Class I | Financial Highlights |
For a Share Outstanding Throughout the Years Presented
| For the Year Ended September 30, 2025 | For the Year Ended September 30, 2024 | For the Year Ended September 30, 2023 | For the Year Ended September 30, 2022 | For the Year Ended September 30, 2021 | ||||||||||||||||
| NET ASSET VALUE, BEGINNING OF YEAR | $ | 9.70 | $ | 9.80 | $ | 10.11 | $ | 11.11 | $ | 9.77 | ||||||||||
| INCOME FROM INVESTMENT OPERATIONS: | ||||||||||||||||||||
| Net investment income(a) | 0.87 | 0.98 | 0.95 | 0.63 | 0.76 | |||||||||||||||
| Net realized and unrealized gain/(loss) on investments | (0.57 | ) | (0.35 | ) | (0.53 | ) | (0.90 | ) | 1.30 | |||||||||||
| Total income/(loss) from investment operations | 0.30 | 0.63 | 0.42 | (0.27 | ) | 2.06 | ||||||||||||||
| DISTRIBUTIONS TO SHAREHOLDERS | ||||||||||||||||||||
| From net investment income | (0.88 | ) | (0.73 | ) | (0.73 | ) | (0.69 | ) | (0.65 | ) | ||||||||||
| From return of capital | – | – | – | (0.04 | ) | (0.07 | ) | |||||||||||||
| Total distributions | (0.88 | ) | (0.73 | ) | (0.73 | ) | (0.73 | ) | (0.72 | ) | ||||||||||
| INCREASE/(DECREASE) IN NET ASSET VALUE | (0.58 | ) | (0.10 | ) | (0.31 | ) | (1.00 | ) | 1.34 | |||||||||||
| NET ASSET VALUE, END OF YEAR | $ | 9.12 | $ | 9.70 | $ | 9.80 | $ | 10.11 | $ | 11.11 | ||||||||||
| TOTAL RETURN(b) | 3.34 | %(c)(d) | 6.60 | %(c) | 4.36 | %(c) | (2.58 | )% | 21.61 | %(c) | ||||||||||
| RATIOS AND SUPPLEMENTAL DATA: | ||||||||||||||||||||
| Net assets, end of period (000s) | $ | 100,819 | $ | 113,632 | $ | 110,739 | $ | 110,512 | $ | 93,970 | ||||||||||
| RATIOS TO AVERAGE NET ASSETS(e) | ||||||||||||||||||||
| Including incentive fees, interest expense and interest amortization/accretion on securities sold short: | ||||||||||||||||||||
| Expenses, gross | 3.18 | % | 3.15 | % | 2.74 | % | 2.36 | % | 2.59 | % | ||||||||||
| Expenses, net of voluntary incentive waiver | 3.13 | % | 3.15 | % | 2.74 | % | 2.36 | % | 2.59 | % | ||||||||||
| Expenses, net of all fees waived/expenses reimbursed by Adviser | 2.54 | % | 2.67 | % | 2.62 | % | 2.35 | % | 2.40 | % | ||||||||||
| Excluding incentive fees, interest expense and interest amortization/accretion on securities sold short: | ||||||||||||||||||||
| Expenses, gross | 2.93 | % | 2.82 | % | 2.46 | % | 2.35 | % | 2.53 | % | ||||||||||
| Expenses, net of voluntary incentive waiver | 2.88 | % | 2.82 | % | 2.46 | % | 2.35 | % | 2.53 | % | ||||||||||
| Expenses, net of all fees waived/expenses reimbursed by Adviser | 2.29 | % | 2.34 | % | 2.34 | % | 2.34 | % | 2.34 | % | ||||||||||
| Net investment income | 9.33 | % | 10.05 | % | 9.63 | % | 5.78 | % | 7.12 | % | ||||||||||
| Portfolio turnover rate | 21 | % | 19 | % | 23 | % | 26 | % | 49 | % | ||||||||||
| BORROWINGS AT END OF YEAR | ||||||||||||||||||||
| Aggregate amount outstanding (000s) | $ | 7,757 | $ | 3,562 | $ | 3,879 | $ | – | $ | – | ||||||||||
| Asset coverage per $1,000 (000s) | $ | 25,939 | $ | 64,951 | $ | 66,093 | $ | – | $ | – | ||||||||||
| (a) | Per share numbers have been calculated using the average shares method. |
| (b) | Total returns shown are historical in nature and assume changes in share price, reinvestment of dividends and capital gains distribution, if any. Had the Adviser not absorbed a portion of Fund expenses, total returns would have been lower. Returns shown exclude applicable sales charges. |
| (c) | Includes adjustments in accordance with accounting principles generally accepted in the United States of America and, as such, the net asset values for financial reporting purposes and the returns based upon those net asset values may differ from net asset values and returns for shareholder transactions. |
| (d) | 0.11% of the Fund’s total return consists of a reimbursement by the Adviser for a loss on a transaction. Excluding this item, total return would have been 3.23%. |
| (e) | Ratios do not include expenses of underlying investment companies and private investment funds in which the Fund invests. |
See Notes to Consolidated Financial Statements.
| 30 | www.altcif.com |
| Alternative Credit Income Fund – Class L | Financial Highlights |
For a Share Outstanding Throughout the Years Presented
| For the Year Ended September 30, 2025 | For the Year Ended September 30, 2024 | For the Year Ended September 30, 2023 | For the Year Ended September 30, 2022 | For the Year Ended September 30, 2021 | ||||||||||||||||
| NET ASSET VALUE, BEGINNING OF YEAR | $ | 9.70 | $ | 9.79 | $ | 10.09 | $ | 11.08 | $ | 9.75 | ||||||||||
| INCOME FROM INVESTMENT OPERATIONS: | ||||||||||||||||||||
| Net investment income(a) | 0.82 | 0.95 | 0.90 | 0.58 | 0.71 | |||||||||||||||
| Net realized and unrealized gain/(loss) on investments | (0.57 | ) | (0.36 | ) | (0.53 | ) | (0.90 | ) | 1.29 | |||||||||||
| Total income/(loss) from investment operations | 0.25 | 0.59 | 0.37 | (0.32 | ) | 2.00 | ||||||||||||||
| DISTRIBUTIONS TO SHAREHOLDERS | ||||||||||||||||||||
| From net investment income | (0.82 | ) | (0.68 | ) | (0.67 | ) | (0.63 | ) | (0.60 | ) | ||||||||||
| From return of capital | – | – | – | (0.04 | ) | (0.07 | ) | |||||||||||||
| Total distributions | (0.82 | ) | (0.68 | ) | (0.67 | ) | (0.67 | ) | (0.67 | ) | ||||||||||
| INCREASE/(DECREASE) IN NET ASSET VALUE | (0.57 | ) | (0.09 | ) | (0.30 | ) | (0.99 | ) | 1.33 | |||||||||||
| NET ASSET VALUE, END OF YEAR | $ | 9.13 | $ | 9.70 | $ | 9.79 | $ | 10.09 | $ | 11.08 | ||||||||||
| TOTAL RETURN(b) | 2.79 | %(c)(d) | 6.17 | %(c) | 3.93 | %(c) | 3.01 | % | 20.92 | %(c) | ||||||||||
| RATIOS AND SUPPLEMENTAL DATA: | ||||||||||||||||||||
| Net assets, end of period (000s) | $ | 8,090 | $ | 8,868 | $ | 11,119 | $ | 11,930 | $ | 14,026 | ||||||||||
| RATIOS TO AVERAGE NET ASSETS(e) | ||||||||||||||||||||
| Including incentive fees, interest expense and interest amortization/accretion on securities sold short: | ||||||||||||||||||||
| Expenses, gross | 3.70 | % | 3.64 | % | 3.25 | % | 2.89 | % | 3.11 | % | ||||||||||
| Expenses, net of voluntary incentive waiver | 3.64 | % | 3.64 | % | 3.25 | % | 2.89 | % | 3.11 | % | ||||||||||
| Expenses, net of all fees waived/expenses reimbursed by Adviser | 3.04 | % | 3.17 | % | 3.12 | % | 2.85 | % | 2.90 | % | ||||||||||
| Excluding incentive fees, interest expense and interest amortization/accretion on securities sold short: | ||||||||||||||||||||
| Expenses, gross | 3.45 | % | 3.31 | % | 2.97 | % | 2.88 | % | 3.05 | % | ||||||||||
| Expenses, net of voluntary incentive waiver | 3.39 | % | 3.31 | % | 2.97 | % | 2.88 | % | 3.05 | % | ||||||||||
| Expenses, net of all fees waived/expenses reimbursed by Adviser | 2.79 | % | 2.84 | % | 2.84 | % | 2.84 | % | 2.84 | % | ||||||||||
| Net investment income | 8.82 | % | 9.69 | % | 9.11 | % | 5.37 | % | 6.61 | % | ||||||||||
| Portfolio turnover rate | 21 | % | 19 | % | 23 | % | 26 | % | 49 | % | ||||||||||
| BORROWINGS AT END OF YEAR | ||||||||||||||||||||
| Aggregate amount outstanding (000s) | $ | 7,757 | $ | 3,562 | $ | 3,879 | $ | – | $ | – | ||||||||||
| Asset coverage per $1,000 (000s) | $ | 25,939 | $ | 64,951 | $ | 66,093 | $ | – | $ | – | ||||||||||
| (a) | Per share numbers have been calculated using the average shares method. |
| (b) | Total returns shown are historical in nature and assume changes in share price, reinvestment of dividends and capital gains distribution, if any. Had the Adviser not absorbed a portion of Fund expenses, total returns would have been lower. Returns shown exclude applicable sales charges. |
| (c) | Includes adjustments in accordance with accounting principles generally accepted in the United States of America and, as such, the net asset values for financial reporting purposes and the returns based upon those net asset values may differ from net asset values and returns for shareholder transactions. |
| (d) | 0.11% of the Fund’s total return consists of a reimbursement by the Adviser for a loss on a transaction. Excluding this item, total return would have been 2.68%. |
| (e) | Ratios do not include expenses of underlying investment companies and private investment funds in which the Fund invests. |
See Notes to Consolidated Financial Statements.
| Annual Report | September 30, 2025 | 31 |
| Alternative Credit Income Fund – Class W | Financial Highlights |
For a Share Outstanding Throughout the Years Presented
| For the Year Ended September 30, 2025 | For the Year Ended September 30, 2024 | For the Year Ended September 30, 2023 | For the Year Ended September 30, 2022 | For the Year Ended September 30, 2021 | ||||||||||||||||
| NET ASSET VALUE, BEGINNING OF YEAR | $ | 9.69 | $ | 9.78 | $ | 10.08 | $ | 11.08 | $ | 9.74 | ||||||||||
| INCOME FROM INVESTMENT OPERATIONS: | ||||||||||||||||||||
| Net investment income(a) | 0.85 | 0.96 | 0.93 | 0.61 | 0.74 | |||||||||||||||
| Net realized and unrealized gain/(loss) on investments | (0.58 | ) | (0.35 | ) | (0.53 | ) | (0.91 | ) | 1.30 | |||||||||||
| Total income/(loss) from investment operations | 0.27 | 0.61 | 0.40 | (0.30 | ) | 2.04 | ||||||||||||||
| DISTRIBUTIONS TO SHAREHOLDERS | ||||||||||||||||||||
| From net investment income | (0.85 | ) | (0.70 | ) | (0.70 | ) | (0.66 | ) | (0.63 | ) | ||||||||||
| From return of capital | – | – | – | (0.04 | ) | (0.07 | ) | |||||||||||||
| Total distributions | (0.85 | ) | (0.70 | ) | (0.70 | ) | (0.70 | ) | (0.70 | ) | ||||||||||
| INCREASE/(DECREASE) IN NET ASSET VALUE | (0.58 | ) | (0.09 | ) | (0.30 | ) | (1.00 | ) | 1.34 | |||||||||||
| NET ASSET VALUE, END OF YEAR | $ | 9.11 | $ | 9.69 | $ | 9.78 | $ | 10.08 | $ | 11.08 | ||||||||||
| TOTAL RETURN(b) | 3.00 | %(c)(d) | 6.44 | %(c) | 4.19 | %(c) | (2.86 | )% | 21.35 | %(c) | ||||||||||
| RATIOS AND SUPPLEMENTAL DATA: | ||||||||||||||||||||
| Net assets, end of period (000s) | $ | 38,960 | $ | 47,398 | $ | 53,123 | $ | 58,382 | $ | 61,915 | ||||||||||
| RATIOS TO AVERAGE NET ASSETS(e) | ||||||||||||||||||||
| Including incentive fees, interest expense and interest amortization/accretion on securities sold short: | ||||||||||||||||||||
| Expenses, gross | 3.40 | % | 3.34 | % | 2.98 | % | 2.60 | % | 2.81 | % | ||||||||||
| Expenses, net of voluntary incentive waiver | 3.35 | % | 3.34 | % | 2.98 | % | 2.60 | % | 2.81 | % | ||||||||||
| Expenses, net of all fees waived/expenses reimbursed by Adviser | 2.79 | % | 2.92 | % | 2.87 | % | 2.60 | % | 2.65 | % | ||||||||||
| Excluding incentive fees, interest expense and interest amortization/accretion on securities sold short: | ||||||||||||||||||||
| Expenses, gross | 3.15 | % | 3.01 | % | 2.70 | % | 2.59 | % | 2.75 | % | ||||||||||
| Expenses, net of voluntary incentive waiver | 3.10 | % | 3.01 | % | 2.70 | % | 2.59 | % | 2.75 | % | ||||||||||
| Expenses, net of all fees waived/expenses reimbursed by Adviser | 2.54 | % | 2.59 | % | 2.59 | % | 2.59 | % | 2.59 | % | ||||||||||
| Net investment income | 9.06 | % | 9.86 | % | 9.36 | % | 5.63 | % | 6.89 | % | ||||||||||
| Portfolio turnover rate | 21 | % | 19 | % | 23 | % | 26 | % | 49 | % | ||||||||||
| BORROWINGS AT END OF YEAR | ||||||||||||||||||||
| Aggregate amount outstanding (000s) | $ | 7,757 | $ | 3,562 | $ | 3,879 | $ | – | $ | – | ||||||||||
| Asset coverage per $1,000 (000s) | $ | 25,939 | $ | 64,951 | $ | 66,093 | $ | – | $ | – | ||||||||||
| (a) | Per share numbers have been calculated using the average shares method. |
| (b) | Total returns shown are historical in nature and assume changes in share price, reinvestment of dividends and capital gains distribution, if any. Had the Adviser not absorbed a portion of Fund expenses, total returns would have been lower. Returns shown exclude applicable sales charges. |
| (c) | Includes adjustments in accordance with accounting principles generally accepted in the United States of America and, as such, the net asset values for financial reporting purposes and the returns based upon those net asset values may differ from net asset values and returns for shareholder transactions. |
| (d) | 0.11% of the Fund’s total return consists of a reimbursement by the Adviser for a loss on a transaction. Excluding this item, total return would have been 2.89%. |
| (e) | Ratios do not include expenses of underlying investment companies and private investment funds in which the Fund invests. |
See Notes to Consolidated Financial Statements.
| 32 | www.altcif.com |
| Alternative Credit Income Fund | Notes to Consolidated Financial Statements |
September 30, 2025
1. ORGANIZATION
Alternative Credit Income Fund (the “Fund”) is a closed-end, diversified management Investment Company that is registered under the Investment Company Act of 1940, as amended (the "1940 Act"). The Fund is structured as an interval fund and continuously offers its shares. The Fund was organized as a Delaware statutory trust on December 11, 2014.
The Fund’s investment objectives are to produce current income and to achieve capital preservation with moderate volatility and low to moderate correlation to the broader equity markets. The Fund pursues its investment objectives by investing, under normal circumstances, at least 80% of its assets (defined as net assets plus the amount of any borrowing for investment purposes) in fixed-income and fixed-income related securities.
Sierra Crest Investment Management LLC (the “Adviser”) has served as the Fund’s investment adviser since October 31, 2020.
On February 3, 2020, the Fund formed a wholly-owned subsidiary, CIF Investments LLC, a Delaware corporation. To the extent permitted by the 1940 Act, the Fund may make investments through CIF Investments LLC, which is a pass-through entity.
On March 22, 2022, the Fund formed a wholly-owned taxable subsidiary, ACIF Master Blocker, LLC (the “Taxable Subsidiary”), a Delaware corporation, which is taxed as a corporation for U.S. federal income tax purposes. The Taxable Subsidiary allows the Fund to make equity investments in companies organized as pass-through entities while continuing to satisfy the requirements of a Regulated Investment Company under Subchapter M of the Internal Revenue Code of 1986, as amended (the “Code”).
2. SIGNIFICANT ACCOUNTING POLICIES
The following is a summary of significant accounting policies followed by the Fund in preparation of its consolidated financial statements. These policies are in conformity with U.S. generally accepted accounting principles (“U.S. GAAP”). The Fund is an investment company and follows the accounting and reporting guidance under Financial Accounting Standards Board (“FASB”) Accounting Standards Codification (“ASC”) Topic 946, Financial Services – Investment Companies. These consolidated financial statements reflect adjustments that in the opinion of the Fund are necessary for the fair presentation of the financial position and results of operations as of and for the periods presented herein.
The Fund is considered an investment company for financial reporting purposes under U.S. GAAP and therefore applies the accounting and reporting guidance applicable to investment companies. The preparation of the consolidated financial statements requires management to make estimates and assumptions that affect the reported amounts of assets and liabilities and disclosure of contingent assets and liabilities at the date of the financial statements and the reported amounts of income and expenses for the year. Actual results could differ from those estimates, and such difference could be material. In accordance with U.S. GAAP guidance on consolidation, the Fund will generally not consolidate its investment in a portfolio company other than an investment company subsidiary or a controlled operating company whose business consists of providing services to the Fund. Accordingly, the Fund consolidated the accounts of the Fund’s wholly-owned subsidiaries, CIF Investments LLC and the Taxable Subsidiary, in its consolidated financial statements. All significant intercompany balances and transactions have been eliminated in consolidation. All references made to the “Fund” herein include Alternative Credit Income Fund and its consolidated subsidiaries, except as stated otherwise.
Securities Transactions and Investment Income – Investment transactions are recorded on the trade date. Realized gains or losses on investments are calculated using the specific identification method for both financial statement and federal income tax purposes. Dividend income is recorded on the ex-dividend date and interest income is recorded on an accrual basis. Premiums on securities are amortized to the earliest call date and purchase discounts are accreted over the life of the respective securities using the effective interest method.
Loans are generally placed on non-accrual status when there is reasonable doubt that principal or interest will be collected in full. The Fund considers many factors relevant to an investment when placing it on or removing it from non-accrual status including, but not limited to, the delinquency status of the investment, economic and business conditions, the overall financial condition of the underlying investment, the value of the underlying collateral, bankruptcy status, if any, and any other facts or circumstances relevant to the investment. Accrued interest is generally reversed when a loan is placed on non-accrual status. Payments received on non-accrual loans may be recognized as income or applied to principal depending upon management’s judgment regarding collectability of the outstanding principal and interest. Generally non-accrual loans may be restored to accrual status when past due principal and interest is paid current and are likely to remain current based on management’s judgment.
Securities Valuation – Securities listed on an exchange are valued at the last reported sale price at the close of the regular trading session of the exchange on the business day the value is being determined, or in the case of securities listed on NASDAQ, at the NASDAQ Official Closing Price. In the absence of a sale, such securities shall be valued at the mid-price. Short-term investments that mature in 60 days or less may be valued at amortized cost, provided such valuations represent fair value. Investments in money market funds are valued at their respective net asset value (“NAV”).
| Annual Report | September 30, 2025 | 33 |
| Alternative Credit Income Fund | Notes to Consolidated Financial Statements |
September 30, 2025
Structured credit and other similar debt securities including, but not limited to, collateralized loan obligations (“CLO”) debt and equity securities, asset-backed securities (“ABS”), commercial mortgage-backed securities (“CMBS”) and other securitized investments backed by certain debt or other receivables (collectively, “Structured Credit Securities”), are valued on the basis of valuations provided by dealers in those instruments and/or independent pricing services recommended by the Adviser and approved by the Fund’s board of trustees (the "Board", "Trustees", or "Board of Trustees"). In determining fair value, dealers and pricing services will generally use information with respect to transactions in the securities being valued, quotations from other dealers, market transactions in comparable securities, analyses and evaluations of various relationships between securities and yield to maturity information. The Adviser will, based on its reasonable judgment, select the dealer or pricing service quotation that most accurately reflects the fair market value of the Structured Credit Security while taking into account the information utilized by the dealer or pricing service to formulate the quotation in addition to any other relevant factors. In the event that there is a material discrepancy between quotations received from third-party dealers or the pricing services, the Adviser may (i) use an average of the quotations received or (ii) select an individual quotation that the Adviser, based upon its reasonable judgment, determines to be reasonable.
When price quotations for certain securities are not readily available, or if the available quotations are not believed to be reflective of market value by the Adviser, those securities will be valued at fair value as determined in good faith by the Adviser in its capacity as the Board of Trustees’ valuation designee pursuant to Rule 2a-5 under the 1940 Act. As fair valuation involves subjective judgments, the Fund cannot ensure that fair values determined by the Board or persons acting in their direction would accurately reflect the price that the Fund could obtain for a security if the security was sold. As the valuation designee, the Adviser acts under the Board of Trustees’ oversight. The Adviser’s fair valuation policies and procedures are approved by the Board of Trustees.
Fair valuation procedures may be used to value a substantial portion of the assets of the Fund. The Fund may use the fair value of a security to calculate its NAV when, for example, (1) a portfolio security is not traded in a public market or the principal market in which the security trades is closed, (2) trading in a portfolio security is suspended and not resumed prior to the normal market close, (3) a portfolio security is not traded in significant volume for a substantial period, or (4) the Adviser determines that the quotation or price for a portfolio security provided by a broker-dealer or independent pricing service is inaccurate.
The fair value of securities may be difficult to determine and thus judgment plays a greater role in the valuation process. The fair valuation methodology may include or consider the following guidelines, as appropriate: (1) evaluation of all relevant factors, including but not limited to, pricing history, current market level and supply and demand of the respective security; (2) comparison to the values and current pricing of securities that have comparable characteristics; (3) knowledge of historical market information with respect to the security; and (4) other factors relevant to the security which would include, but not be limited to, duration, yield, fundamental analytical data, the Treasury yield curve and credit quality.
Valuation of Private Investment Funds – The Fund invests a portion of its assets in private investment funds (“Private Investment Funds”). Private Investment Funds, including an investment in Great Lakes Funding II LLC (“Great Lakes II Joint Venture”), value their investment assets at fair value and generally report a NAV or its equivalent in accordance with U.S. GAAP on a calendar quarter basis. The Fund has elected to apply the practical expedient and to value its investments in Private Investment Funds at their respective NAVs at each quarter-end in accordance with U.S. GAAP. For non-calendar quarter-end days, the Valuation Committee estimates the fair value of each Private Investment Fund by adjusting the most recent NAV for such Private Investment Fund, as necessary, by the change in a relevant benchmark that the Valuation Committee has deemed to be representative of the underlying securities in the Private Investment Fund.
Loan Participation and Assignments – The Fund invests in debt instruments, which are interests in amounts owed to lenders (the “Lenders”) by corporate, governmental or other borrowers. The Fund’s investments in loans may be in the form of direct investments, loans originated by the Fund, participations in loans or assignments of all or a portion of the loans from third parties or exposure to investments in loans through investment in Private Investment Funds or other pooled investment vehicles. When the Fund purchases an interest in a loan in the form of an assignment, the Fund acquires all of the direct rights and obligations of a lender (as such term is defined in the related credit agreement), including the right to vote on amendments or waivers of such credit agreement. However, the Fund generally has no right to enforce compliance with the terms of the loan agreement with the borrower. Instead, the administration of the loan agreement is often performed by a bank or other financial institution (the “Agent”) that acts as agent for the Lenders. Circumstances may arise in connection with which the Agent takes action that contradicts the will of the Lenders. For example, under certain circumstances, an Agent may refuse to declare the borrower in default, despite having received a notice of default from the Lenders. When the Fund purchases an interest in a loan in the form of a participation, the Fund purchases such participation interest from another existing Lender, and consequently, the Fund does not obtain the rights and obligations of the Lenders under the credit agreement, such as the right to vote on amendments or waivers. The Fund has the right to receive payments of principal, interest and any fees to which it is entitled only from the Lender from which the Fund has received that participation interest. In this instance, the Fund is subject to both the credit risk of the borrower and the credit risk of the Lender that sold the Fund such participation interest.
Unfunded Commitments – The Fund may enter into unfunded loan commitments, which are contractual obligations for future funding, such as delayed draw term loans or revolving credit arrangements. Unfunded loan commitments represent a future obligation in full, even though a percentage of the notional loan amounts may not be utilized by the borrower. The Fund may receive a commitment fee based on the undrawn portion of the underlying line of credit portion of a floating rate loan.
| 34 | www.altcif.com |
| Alternative Credit Income Fund | Notes to Consolidated Financial Statements |
September 30, 2025
Additionally, when the Fund invests in a Private Investment Fund, the Fund makes a commitment to invest a specified amount of capital in the applicable Private Investment Fund. The capital commitment may be drawn by the general partner of the Private Investment Fund either all at once or through a series of capital calls at the discretion of the general partner. The unfunded commitment represents the portion of the Fund’s overall capital commitment to a particular Private Investment Fund that has not yet been called by the general partner of the Private Investment Fund.
As of September 30, 2025, the Fund had unfunded commitments of $20,489,059.
Short Sales – The Fund may sell securities short. To do this the Fund will borrow and then sell (take short positions in) securities. To complete such a transaction, the Fund must borrow the security to deliver to the buyer. The Fund is then obligated to replace, or cover, the security borrowed by purchasing it in the open market at some later date. The Fund will generally have to pay a fee or premium to borrow a security and be obligated to repay the lender any dividend or interest that accrues on those securities during the period of the loan. The Fund bears the risk of a loss, unlimited in size, if the market price of the security increases between the date of the short sale and the date on which the Fund replaces the borrowed security. The Fund will realize a gain, limited to the price that the Fund sold the security short, if the security declines in value between those dates. There can be no assurance that securities necessary to cover a short position will be available for purchase. To mitigate leverage risk, the Fund will segregate liquid assets (which may include its long positions) at least equal to its short position exposure, marked-to-market daily.
Foreign Currency – Investment securities and other assets and liabilities denominated in foreign currencies are translated into U.S. dollar amounts at the date of valuation. Purchases and sales of investment securities and income and expense items denominated in foreign currencies are translated into U.S. dollar amounts on the respective dates of such transactions. The Fund does not isolate that portion of the results of operations resulting from changes in foreign exchange rates on investments from the fluctuations arising from changes in market prices of securities held. Such fluctuations are included with the net realized and unrealized gain or loss from investments. Reported net realized foreign exchange gains or losses arise from sales of foreign currencies, currency gains or losses realized between the trade and settlement dates on securities transactions, and the difference between the amounts of dividends, interest, and foreign withholding taxes recorded on the Fund's books and the U.S. dollar equivalent of the amounts actually received or paid. Net unrealized foreign exchange gains and losses arise from changes in the fair values of assets and liabilities, other than investments in securities at fiscal period end, resulting from changes in exchange rates.
Fair Value Measurements – A three-tier hierarchy has been established to classify fair value measurements for disclosure purposes. Inputs refer broadly to the assumptions that market participants would use in pricing the asset or liability, including assumptions about risk. Inputs may be observable or unobservable. Observable inputs are inputs that reflect the assumptions market participants would use in pricing the asset or liability that are developed based on market data obtained from sources independent of the reporting entity. Unobservable inputs are inputs that reflect the reporting entity’s own assumptions about the assumptions market participants would use in pricing the asset or liability that are developed based on the best information available. In accordance with U.S. GAAP guidance on fair value measurements and disclosure, the Fund discloses the fair value of its investments in a hierarchy that categorizes the inputs to valuation techniques used to measure the fair value.
Various inputs are used in determining the fair value of the Fund’s investments. These inputs are categorized in the following hierarchy under applicable accounting guidance:
| Level 1 – | Unadjusted quoted prices in active markets for identical, unrestricted assets or liabilities that the Fund has the ability to access at the measurement date; |
| Level 2 – | Quoted prices in markets that are not active, or quoted prices for similar assets or liabilities in active markets, or inputs other than quoted prices that are observable (either directly or indirectly) for substantially the full term of the asset or liability at the measurement date; and |
| Level 3 – | Significant unobservable prices or inputs (including the Fund’s own assumptions in determining the fair value of investments) where there is little or no market activity for the asset or liability at the measurement date. |
The availability of observable inputs can vary from security to security and is affected by a wide variety of factors, including, for example, the type of security, whether the security is new and not yet established in the marketplace, the liquidity of markets and other characteristics particular to the security. To the extent that valuation is based on models or inputs that are less observable or unobservable in the market, the determination of fair value requires more judgment. Accordingly, the degree of judgment exercised in determining fair value is greatest for instruments categorized in Level 3.
An investment level within the fair value hierarchy is based on the lowest level input, individually or in the aggregate, that is significant to fair value measurement. The valuation techniques used by the Fund to measure fair value maximizes the use of observable inputs and minimizes the use of unobservable inputs.
| Annual Report | September 30, 2025 | 35 |
| Alternative Credit Income Fund | Notes to Consolidated Financial Statements |
September 30, 2025
The inputs or methodologies used for valuing securities are not necessarily an indication of the risk or liquidity associated with investing in those securities. The following is a summary of the fair values according to the inputs used in valuing the Fund’s investments as of September 30, 2025:
| Investments in Securities at Value | Level 1 | Level 2 | Level 3 | Total | ||||||||||||
| BANK LOANS(a) | ||||||||||||||||
| Communication Services | $ | – | $ | – | $ | 5,747,986 | $ | 5,747,986 | ||||||||
| Consumer Discretionary | – | – | 8,524,441 | 8,524,441 | ||||||||||||
| Consumer Staples | – | – | 12,505,032 | 12,505,032 | ||||||||||||
| Financials | – | – | 24,546,655 | 24,546,655 | ||||||||||||
| Health Care | – | – | 17,323,029 | 17,323,029 | ||||||||||||
| Industrials | – | – | 13,614,743 | 13,614,743 | ||||||||||||
| Information Technology | – | – | 37,661,736 | 37,661,736 | ||||||||||||
| CORPORATE BONDS(a) | ||||||||||||||||
| Communications | – | 1,987,500 | – | 1,987,500 | ||||||||||||
| Consumer Discretionary | – | – | – | – | ||||||||||||
| Financials | – | – | 1,990,791 | 1,990,791 | ||||||||||||
| Industrials | – | 321,338 | – | 321,338 | ||||||||||||
| EQUIPMENT FINANCING(a) | ||||||||||||||||
| Financials | – | – | 876,369 | 876,369 | ||||||||||||
| PREFERRED STOCK(a) | ||||||||||||||||
| Consumer Discretionary | – | – | 7,625,629 | 7,625,629 | ||||||||||||
| Consumer Staples | – | – | 473,314 | 473,314 | ||||||||||||
| Health Care | – | – | 170,791 | 170,791 | ||||||||||||
| Industrials | – | – | 595,513 | 595,513 | ||||||||||||
| ASSET-BACKED SECURITIES(a) | ||||||||||||||||
| Financials | – | 1,991,042 | 5,125,771 | 7,116,813 | ||||||||||||
| COMMON EQUITY(a) | ||||||||||||||||
| Communication Services | – | – | 84,521 | 84,521 | ||||||||||||
| Consumer Discretionary | – | 1,034,332 | – | 1,034,332 | ||||||||||||
| Consumer Staples | – | – | 4,029,260 | 4,029,260 | ||||||||||||
| Diversified | 2,250,881 | – | – | 2,250,881 | ||||||||||||
| Financials | – | – | 1,259,555 | 1,259,555 | ||||||||||||
| Health Care | – | – | 437,707 | 437,707 | ||||||||||||
| Industrials | – | – | 1,101,746 | 1,101,746 | ||||||||||||
| Information Technology | – | – | 1,008,324 | 1,008,324 | ||||||||||||
| Real Estate | – | 3,965,243 | – | 3,965,243 | ||||||||||||
| WARRANTS(a) | ||||||||||||||||
| Consumer Discretionary | – | 13,087 | 7,029 | 20,116 | ||||||||||||
| Financials | – | – | 460,972 | 460,972 | ||||||||||||
| Information Technology | – | – | – | – | ||||||||||||
| INTERVAL FUND(a) | ||||||||||||||||
| Diversified | 4,219,791 | – | – | 4,219,791 | ||||||||||||
| DERIVATIVES(a) | ||||||||||||||||
| Consumer Discretionary | – | – | – | – | ||||||||||||
| TOTAL | $ | 6,470,672 | $ | 9,312,542 | $ | 145,170,914 | $ | 160,954,128 | ||||||||
| Investments measured at net asset value(a) | $ | 34,521,851 | ||||||||||||||
| Total Investments, at fair value | $ | 195,475,979 | ||||||||||||||
| (a) | For detailed descriptions, see the accompanying Consolidated Schedule of Investments. |
| 36 | www.altcif.com |
| Alternative Credit Income Fund | Notes to Consolidated Financial Statements |
September 30, 2025
The following table provides a reconciliation of the beginning and ending balances of investments for which the Fund has used Level 3 inputs to determine the fair value:
| Investments in Securities at Value | Fair Value as of September 30, 2024 | Purchases | Sales | Accretion of original issue discount | Realized Gain (Loss) | Change in Unrealized Appreciation/ (Depreciation) | Fair Value as of September 30, 2025 | Net change in unrealized appreciation/ (depreciation) included in results of operations related to Level 3 investments still held at reporting date | ||||||||||||||||||||||||
| Bank Loans | ||||||||||||||||||||||||||||||||
| Communication Services | $ | 7,294,705 | $ | 1,326,999 | $ | (2,824,602 | ) | $ | 137,680 | $ | – | $ | (186,796 | ) | $ | 5,747,986 | $ | (161,411 | ) | |||||||||||||
| Consumer Discretionary | 10,744,850 | – | (2,232,122 | ) | 26,331 | – | (14,618 | ) | 8,524,441 | (14,618 | ) | |||||||||||||||||||||
| Consumer Staples | 13,031,158 | 2,408,007 | (2,645,787 | ) | (24,152 | ) | (3,764 | ) | (260,430 | ) | 12,505,032 | (553,723 | ) | |||||||||||||||||||
| Financials | 19,968,011 | 8,554,068 | (5,256,338 | ) | 151,678 | (34,794 | ) | 1,164,030 | 24,546,655 | 1,134,683 | ||||||||||||||||||||||
| Healthcare | 17,109,639 | 1,794,482 | (596,955 | ) | 38,655 | (1 | ) | (1,022,791 | ) | 17,323,029 | (1,022,791 | ) | ||||||||||||||||||||
| Industrials | 12,995,900 | 4,753,043 | (4,022,201 | ) | 130,216 | (1 | ) | (242,214 | ) | 13,614,743 | (199,617 | ) | ||||||||||||||||||||
| Information Technology | 30,999,246 | 12,252,433 | (5,453,617 | ) | 185,675 | (38,624 | ) | (283,377 | ) | 37,661,736 | (1,952,072 | ) | ||||||||||||||||||||
| Corporate Bonds | ||||||||||||||||||||||||||||||||
| Consumer Discretionary | – | – | – | – | – | – | – | – | ||||||||||||||||||||||||
| Financials | 2,187,886 | – | (197,095 | ) | – | – | – | 1,990,791 | – | |||||||||||||||||||||||
| Equipment Financing | ||||||||||||||||||||||||||||||||
| Financials | 1,456,280 | – | (579,911 | ) | – | – | – | 876,369 | – | |||||||||||||||||||||||
| Preferred Stock | ||||||||||||||||||||||||||||||||
| Consumer Discretionary | 6,639,500 | 744,430 | – | 380 | – | 241,319 | 7,625,629 | 241,319 | ||||||||||||||||||||||||
| Consumer Staples | – | 451,439 | – | – | – | 21,875 | 473,314 | 21,875 | ||||||||||||||||||||||||
| Healthcare | 135,546 | – | – | – | – | 35,245 | 170,791 | 35,245 | ||||||||||||||||||||||||
| Industrials | 200,000 | 377,639 | – | – | – | 17,874 | 595,513 | 17,874 | ||||||||||||||||||||||||
| Asset-Backed Securities | ||||||||||||||||||||||||||||||||
| Financials | 6,498,805 | – | (814,791 | ) | 1,509,027 | – | (2,067,270 | ) | 5,125,771 | (2,067,270 | ) | |||||||||||||||||||||
| Common Equity | ||||||||||||||||||||||||||||||||
| Communication Services | 21,504 | – | – | – | – | 63,017 | 84,521 | 63,017 | ||||||||||||||||||||||||
| Consumer Discretionary | 4,846,156 | – | – | – | – | (4,846,156 | ) | – | (4,846,156 | ) | ||||||||||||||||||||||
| Consumer Staples | – | 4,007,170 | – | – | – | 22,090 | 4,029,260 | 22,090 | ||||||||||||||||||||||||
| Financials | 1,945,982 | 21,786 | – | – | – | (708,213 | ) | 1,259,555 | (708,213 | ) | ||||||||||||||||||||||
| Healthcare | 436,136 | – | – | – | – | 1,571 | 437,707 | 1,571 | ||||||||||||||||||||||||
| Industrials | 70,630 | 1,109,445 | – | – | – | (78,329 | ) | 1,101,746 | (78,329 | ) | ||||||||||||||||||||||
| Information Technology | – | 1,000,000 | – | – | – | 8,324 | 1,008,324 | 8,324 | ||||||||||||||||||||||||
| Warrants | ||||||||||||||||||||||||||||||||
| Consumer Discretionary | 18,560 | – | – | – | – | (11,531 | ) | 7,029 | (11,531 | ) | ||||||||||||||||||||||
| Financials | 386,070 | – | – | – | – | 74,902 | 460,972 | 74,902 | ||||||||||||||||||||||||
| Information Technology | – | – | – | – | – | – | – | – | ||||||||||||||||||||||||
| Derivatives | ||||||||||||||||||||||||||||||||
| Consumer Discretionary | – | – | – | – | – | – | – | – | ||||||||||||||||||||||||
| Total | $ | 136,986,564 | $ | 38,800,941 | $ | (24,623,419 | ) | $ | 2,155,490 | $ | (77,184 | ) | $ | (8,071,478 | ) | $ | 145,170,914 | $ | (9,994,831 | ) | ||||||||||||
| Annual Report | September 30, 2025 | 37 |
| Alternative Credit Income Fund | Notes to Consolidated Financial Statements |
September 30, 2025
There are significant unobservable valuation inputs for material Level 3 investments, and a change to the unobservable input may result in a significant change to the value of the investment. Level 3 investment valuation techniques and inputs as of September 30, 2025 are as follows:
| Asset Category | Fair Value at September 30, 2025 | Valuation Technique | Unobservable Input(a) | Range of Input (Weighted Average)(b) | ||||||||
| Bank Loans | ||||||||||||
| Communication Services | $ | 5,747,986 | Discounted Cash Flows | Market Yield | 13.8% | |||||||
| Consumer Discretionary | 6,454,780 | Discounted Cash Flows | Market Yield | 9.4% - 13.5% (10.4%) | ||||||||
| Consumer Discretionary | 1,938,605 | Enterprise Market Value | Recovery Percentage | 19.4% | ||||||||
| Consumer Discretionary | 131,056 | Market | Broker/Dealer Quotes | N/A | ||||||||
| Consumer Staples | 12,505,032 | Discounted Cash Flows | Market Yield | 10.6% - 19.8% (16.4%) | ||||||||
| Financials | 24,546,655 | Discounted Cash Flows | Market Yield | 8.2% - 16.8% (12.8%) | ||||||||
| Healthcare | 12,541,779 | Discounted Cash Flows | Market Yield | 9.9% - 16.7% (13.2%) | ||||||||
| Healthcare | 4,781,250 | Market | Broker/Dealer Quotes | N/A | ||||||||
| Industrials | 10,959,405 | Discounted Cash Flows | Market Yield | 12.2% - 17.4% (14.5%) | ||||||||
| Industrials | 2,655,338 | Market | Broker/Dealer Quotes | N/A | ||||||||
| Information Technology | 24,920,042 | Discounted Cash Flows | Market Yield | 7.2% - 30.0% (16.8%) | ||||||||
| Information Technology | 2,412,322 | Enterprise Market Value | EBITDA Multiple | 6.0x | ||||||||
| Information Technology | 8,355,632 | Market | Broker/Dealer Quotes | N/A | ||||||||
| Information Technology | 1,973,740 | Recent Transaction | Transaction Price | $0.1 - $99.0 ($84.2) | ||||||||
| Corporate Bonds | ||||||||||||
| Financials | 1,990,791 | Discounted Cash Flows | Market Yield | 12.8% | ||||||||
| Equipment Financing | ||||||||||||
| Financials | 876,369 | Discounted Cash Flows | Market Yield | 10.8% | ||||||||
| Preferred Stock | ||||||||||||
| Consumer Discretionary | 6,106,591 | Discounted Cash Flows | Market Yield | 11.2% | ||||||||
| Consumer Discretionary | 1,519,038 | Enterprise Value | Stock Price | $1,840.0 - $44,715,082.0 | ||||||||
| ($5,976,074.4) | ||||||||||||
| Time (Years) | 2.5 - 4.2 (2.7) | |||||||||||
| Volatility | 56.6% - 58.9% (56.9%) | |||||||||||
| Consumer Staples | 473,314 | Enterprise Market Value | EBITDA Multiple | 8.0x | ||||||||
| Healthcare | 170,791 | Discounted Cash Flows | Market Yield | 18.2% | ||||||||
| Industrials | 395,513 | Discounted Cash Flows | Market Yield | 9.8% | ||||||||
| Industrials | 200,000 | Enterprise Market Value | Book Value Multiple | 1.0x | ||||||||
| Asset Backed Securities | ||||||||||||
| Financials | 5,125,771 | Discounted Cash Flows | Market Yield | 0.0% - 22.1% (20.5%) | ||||||||
| Common Equity | ||||||||||||
| Communication Services | 84,521 | Enterprise Market Value | EBITDA Multiple | 1.5x | ||||||||
| Consumer Staples | 29,260 | Enterprise Market Value | EBITDA Multiple | 8.0x | ||||||||
| Consumer Staples | 4,000,000 | Recent Transaction | Transaction Price | $100.0 | ||||||||
| Financials | 1,247,187 | Enterprise Market Value | EBITDA Multiple | 6.2x | ||||||||
| Financials | 12,368 | Recent Transaction | Transaction Price | $408.0 | ||||||||
| Healthcare | 437,707 | Enterprise Market Value | EBITDA Multiple | 10.2x - 17.5x (14.8x) | ||||||||
| Industrials | 1,008,121 | Enterprise Market Value | Book Value Multiple | 1x - 1.6x (1.1x) | ||||||||
| Industrials | 93,625 | Market | Broker/Dealer Quotes | N/A | ||||||||
| Information Technology | 8,324 | Enterprise Market Value | Revenue Multiple | 2.8x | ||||||||
| Information Technology | 1,000,000 | Recent Transaction | Transaction Price | $1.0 | ||||||||
| Warrants | ||||||||||||
| Consumer Discretionary | 7,029 | Enterprise Value | Stock Price | $44,715,082 | ||||||||
| Time (Years) | 4.2 | |||||||||||
| Volatility | 58.9% | |||||||||||
| Financials | 460,972 | Enterprise Value | Stock Price | $136.5 | ||||||||
| Time (Years) | 2.0 | |||||||||||
| Volatility | 35.0% | |||||||||||
| Total | $ | 145,170,914 | ||||||||||
| (a) | An increase in market yield would result in a decrease in fair value. A decrease in market yield would result in an increase in fair value. An increase in the transaction price would result in an increase in fair value. A decrease in the transaction price would result in a decrease in fair value. An increase in the EBITDA or Revenue multiple would result in an increase in fair value. A decrease in the EBITDA or Revenue multiple would result in a decrease in fair value. |
| (b) | The weighted averages disclosed in the table above were weighted by their relative fair value. |
| 38 | www.altcif.com |
| Alternative Credit Income Fund | Notes to Consolidated Financial Statements |
September 30, 2025
Concentration of Credit Risk – The Fund places its cash with one banking institution, which is insured by the Federal Deposit Insurance Corporation (“FDIC”). The FDIC limit is $250,000. At various times throughout the year, the amount on deposit may exceed the FDIC limit and subject the Fund to a credit risk.
Federal and Other Taxes – No provision for income taxes, except for the Taxable Subsidiary, is included in the accompanying consolidated financial statements, as the Fund intends to distribute to shareholders all taxable investment income and realized gains and otherwise comply with Subchapter M of the Internal Revenue Code of 1986, as amended (the “Code”), applicable to regulated investment companies.
The Fund evaluates tax positions taken (or expected to be taken) in the course of preparing the Fund’s tax provisions to determine whether these positions meet a “more-likely-than-not” standard that, based on the technical merits, have a more than fifty percent likelihood of being sustained by a taxing authority upon examination. A tax position that meets the “more-likely-than-not” recognition threshold is measured to determine the amount of benefit to recognize in the consolidated financial statements.
As of and during the year ended September 30, 2025, the Fund did not have a liability for any unrecognized tax benefits. The Fund and the Taxable Subsidiary file U.S. federal, state and local tax returns as required. The Fund’s tax returns are subject to examination by the relevant tax authorities until expiration of the applicable statute of limitations, which is generally three years after the filing of the tax return for federal purposes and four years for most state returns. Tax returns for open years have incorporated no uncertain tax positions that require a provision for income taxes.
The Taxable Subsidiary records deferred tax assets or liabilities related to temporary book versus tax differences on the income or loss generated by the underlying equity investments held by the Taxable Subsidiary.
Distributions to Shareholders – Distributions from net investment income, if any, are declared and paid quarterly. Distributions from net realized capital gains, if any, are declared and paid annually and are recorded on the ex-dividend date. The character of income and gains to be distributed is determined in accordance with income tax regulations, which may differ from U.S. GAAP.
Early Withdrawal Charge – Selling brokers, or other financial intermediaries that have entered into distribution agreements with the Distributor (as defined below in Note 4), will receive a commission of (a) up to 1.00% of the purchase price of Class C shares and (b) up to 0.50% of the purchase of Class A shares of $1 million or more. Shareholders who tender for repurchase of such shareholder's Class C shares fewer than 365 days after the original purchase date will be subject to an early withdrawal charge of 1.00% of the original purchase price. Shareholders tendering Class A shares fewer than 365 days after the original purchase date will be subject to an early withdrawal charge of 0.50% of the original purchase price, which will be deducted from repurchase proceeds, if (i) the original purchase was for amounts of $1 million or more and (ii) the selling broker received the reallowance of the dealer-manager fee. The Distributor may waive the imposition of the early withdrawal charge in the event of shareholder death or shareholder disability. Any such waiver does not imply that the early withdrawal charge will be waived at any time in the future or that such early withdrawal charge will be waived for any other shareholder. Class A shares (with respect to purchases of less than $1 million) will not be subject to an early withdrawal charge.
Indemnification – The Fund indemnifies its officers and Trustees for certain liabilities that may arise from the performance of their duties to the Fund. Additionally, in the normal course of business, the Fund enters into contracts that contain a variety of representations and warranties and which provide general indemnities. The Fund’s maximum exposure under these arrangements is unknown, as this would involve future claims that may be made against the Fund that have not yet occurred. However, based on industry experience, the Fund expects the risk of loss due to these warranties and indemnities to be remote.
Segment Reporting – In accordance with ASC Topic 280 - Segment Reporting (“ASC 280”), the Fund has determined that it has a single operating and reporting segment, the “Investment Management Segment”. As a result, the Fund’s segment accounting policies are the same as described herein and the Fund does not have any intra-segment sales or transfers of assets. The CODM is the Fund's chief executive officer, and the CODM assesses the performance and makes operating decisions of the Fund on a consolidated basis primarily based on the Fund's net increase in net assets resulting from operations (“net income”). Net income is comprised of total investment income (“segment revenues”) and total expenses (“significant segment expenses”), which are considered the key segment measures of profit or loss reviewed by the CODM. In addition to numerous other factors and metrics, the CODM utilizes net income as a key metric in determining the amount of dividends to be distributed to the Fund's shareholders, implementing investment policy decisions and strategic initiatives, managing the Fund's portfolio, allocating assets, and assessing the performance of the portfolio.
Recent Accounting Pronouncements – In November 2024, the FASB issued ASU 2024-03, Income Statement—Reporting Comprehensive Income—Expense Disaggregation Disclosures (“ASU 2024-03”), which requires disaggregated disclosure of certain costs and expenses, including purchases of inventory, employee compensation, depreciation, amortization and depletion, within relevant income statement captions. ASU 2024-03 is effective for fiscal years beginning after December 15, 2026, and interim periods beginning in the first quarter ended March 31, 2028. Early adoption and retrospective application is permitted. The Company is currently assessing the impact of this guidance, however, the Company does not expect a material impact on its consolidated financial statements.
| Annual Report | September 30, 2025 | 39 |
| Alternative Credit Income Fund | Notes to Consolidated Financial Statements |
September 30, 2025
3. GREAT LAKES FUNDING II LLC
In August 2022, the Fund invested in Series A ("Series A") of Great Lakes Funding II LLC (the “Great Lakes II Joint Venture”), a joint venture with an investment strategy to underwrite and hold senior, secured unitranche loans made to middle-market companies. The Fund treats its investment in the Great Lakes II Joint Venture as a joint venture since an affiliate of the Adviser controls a 50% voting interest in the Great Lakes II Joint Venture. In connection with the launch of the Great Lakes II Joint Venture, the Fund entered into a series of transactions pursuant to which the Fund’s prior investment in BCP Great Lakes Holdings LP, a vehicle formed as a co-investment vehicle to facilitate the participation of certain co-investors to invest, directly or indirectly, in BCP Great Lakes Funding, LLC (the “Prior Great Lakes Joint Venture”) which the Fund invested in during the fourth quarter of 2022, and the corresponding assets held by the Prior Great Lakes Joint Venture in respect of the Fund’s investment in BCP Great Lakes Holdings LP, were transferred to the Great Lakes II Joint Venture in complete redemption of the Fund’s investment in BCP Great Lakes Holdings LP.
The Great Lakes II Joint Venture is a Delaware series limited liability company, and pursuant to the terms of the Great Lakes Funding II LLC Limited Liability Company Agreement (the “Great Lakes II LLC Agreement”), prior to the end of the investment period with respect to each series established under the Great Lakes II LLC Agreement, each member of the predecessor series would be offered the opportunity to roll its interests into any subsequent series of the Great Lakes II Joint Venture. The Fund does not pay any advisory fees in connection with its investment in the Great Lakes II Joint Venture. Certain other funds managed by the Adviser or its affiliates have also invested in the Great Lakes II Joint Venture.
On August 1, 2025, pursuant to the Great Lakes II LLC Agreement, the Fund elected to participate in a rollover transaction from Series A of Great Lakes II Joint Venture to Series B (“Series B”) of Great Lakes II Joint Venture. As part of the transaction, the portion of the Fund's remaining unfunded commitment in Series A became the Fund's remaining unfunded commitment in Series B, thus reducing the Fund’s remaining unfunded commitment in Series A to zero. In connection with the rollover transaction, Series A transferred to Series B a pro rata portion of the underlying portfolio assets held by Series A that corresponded to the interest of the members of Series A who elected to participate in the transaction in addition to a pro rata portion of the principal outstanding under Great Lakes II Joint Venture's credit facility.
The fair value of the Fund’s investment in Series B as of September 30, 2025 was $323,196. Fair value has been determined utilizing the practical expedient in accordance with U.S. GAAP. Pursuant to the terms of the Great Lakes II LLC Agreement, the Fund generally may not affect any direct or indirect sale, transfer, assignment, hypothecation, pledge or other disposition of or encumbrance upon its interests in the Great Lakes II Joint Venture, except that the Fund may sell or otherwise transfer its interests with the consent of the managing members of the Great Lakes II Joint Venture or to an affiliate or a successor to substantially all of the assets of the Fund.
As of September 30, 2025, the Fund had a $137,320 unfunded commitment to the Great Lakes II Joint Venture.
4. ADVISORY FEES AND OTHER TRANSACTIONS WITH SERVICE PROVIDERS
Advisory Fees – On October 31, 2020, the Fund entered into a management agreement (the “Management Agreement”) with the Adviser. Under the terms of the Management Agreement, the Adviser provides certain investment advisory and administrative services to the Fund and in consideration of the advisory services provided, the Adviser is entitled to a fee consisting of two components — a base management fee and an incentive fee, or collectively "investment advisory fees".
The base management fee is payable monthly in arrears at an annual rate of 1.85% of the average daily net assets of the Fund. For the year ended September 30, 2025, the Fund incurred $3,824,690 in base management fees.
The incentive fee is calculated and payable quarterly in arrears based upon the Fund’s “pre-incentive fee net investment income” for the immediately preceding quarter and is subject to a hurdle rate, expressed as a rate of return on the Fund’s “adjusted capital,” equal to 2.25% per quarter (or an annualized hurdle rate of 9.0%), subject to a “catch-up” feature. For this purpose, “pre-incentive fee net investment income” means interest income, dividend income and any other income accrued during the calendar quarter, less the Fund’s operating expenses for the quarter (including the management fee, expenses reimbursed to the Adviser and any interest expenses and distributions paid on any issued and outstanding preferred shares, but excluding the incentive fee). Pre-incentive fee net investment income includes, in the case of investments with a deferred interest feature (such as OID, debt instruments with paid-in-kind (“PIK”) interest and zero coupon securities), accrued income that the Fund has not yet received in cash. Pre-incentive fee net investment income does not include any realized capital gains, realized capital losses or unrealized capital appreciation or depreciation. “Adjusted capital” means the cumulative gross proceeds received by the Fund from the sale of shares (including pursuant to the Fund’s distribution reinvestment plan), reduced by amounts paid in connection with purchases of shares pursuant to the Fund’s share repurchase program.
No incentive fee is payable in any calendar quarter in which the Fund’s pre-incentive fee net investment income does not exceed the quarterly hurdle rate of 2.25%. For any calendar quarter in which the Fund’s pre-incentive fee net investment income is greater than the hurdle rate, but less than or equal to 2.8125%, the incentive fee will equal the amount of the Fund’s pre-incentive fee net investment income in excess of the hurdle rate. This portion of the Fund’s pre-incentive fee net investment income which exceeds the hurdle rate but is less than or equal to 2.8125% is referred to as the “catch-up.” The “catch-up” provision is intended to provide the Adviser with an incentive fee of 20.0% on all of the Fund’s pre-incentive fee net investment income when the Fund’s pre-incentive fee net investment income reaches 2.8125% in any calendar quarter. For any calendar quarter in which the Fund’s pre-incentive fee net investment income exceeds 2.8125% of adjusted capital, the incentive fee will equal 20.0% of pre-incentive fee net investment income. For the year ended September 30, 2025, the Adviser didn't earn an incentive fee.
| 40 | www.altcif.com |
| Alternative Credit Income Fund | Notes to Consolidated Financial Statements |
September 30, 2025
Under the Expense Limitation Agreement, dated October 31, 2020, renewed on November 26, 2024, the Adviser has contractually agreed to waive all or part of its management fees (excluding any incentive fee) and/or make payments to limit Fund expenses (excluding incentive fees, all borrowing costs, dividends, amortization/accretion and interest on securities sold short, brokerage commissions, acquired fund fees and expenses and extraordinary expenses) at least until January 31, 2026, such that the total annual operating expenses of the Fund do not exceed 2.59% per annum of Class A average daily net assets, 3.34% per annum of Class C average daily net assets, 2.59% per annum of Class W average daily net assets, 2.34% per annum of Class I average daily net assets, and 2.84% per annum of Class L average daily net assets. Fee waivers and expense payments may be recovered by the Adviser from the Fund, for a period of up to three years following the date of waiver or expense payment, if the Fund is able to make the repayment without exceeding the expense limitation in place at the time of waiver and the current expense limitation and the repayment is approved by the Board. For the year ended September 30, 2025, the Adviser waived fees of $1,165,375 in accordance with the Expense Limitation Agreement.
As of September 30, 2025, the following amounts may be subject to reimbursement to the Adviser based upon their potential expiration dates:
| 2026 | 2027 | 2028 | |
| Alternative Credit Income Fund | $359,219 | $1,054,309 | $1,165,375 |
During the year ended September 30, 2025, the Adviser recovered previously waived fees under the Expense Limitation Agreement of $3,774.
During the year ended September 30, 2025, the Adviser did not recover $264,824 of previously waived fees under the Expense Limitation Agreement which expired.
The Adviser voluntarily waived $106,442 during the period which is not subject to reimbursement to the Adviser.
Fund Accounting Fees and Expenses – ALPS Fund Services, Inc. (“ALPS”) serves as the Fund’s administrator and accounting agent (the “Administrator”) and receives customary fees from the Fund for such services.
Transfer Agent – SS&C Global Investor & Distribution Solutions, Inc. (“SS&C GIDS”) (the “Transfer Agent”), an affiliate of ALPS, serves as transfer, dividend paying and shareholder servicing agent for the Fund.
Distributor – The Fund has entered into a distribution agreement with ALPS Distributors, Inc. (the “Distributor”), an affiliate of ALPS, to provide distribution services to the Fund. There are no fees paid to the Distributor pursuant to the distribution agreement. The Board has adopted, on behalf of the Fund, a shareholder servicing plan under which the Fund may compensate financial industry professionals for providing ongoing services in respect of clients with whom they have distributed shares of the Fund. Under the shareholder servicing plan, Class A, Class C, Class W and Class L shares are subject to a shareholder servicing fee at an annual rate of 0.25% of the average daily net assets attributable to that share class. For the year ended September 30, 2025, the Class A, Class C, Class W and Class L shares incurred shareholder servicing fees of $227,787. The Class C and Class L shares also pay to the Distributor a distribution fee, pursuant to a distribution plan adopted by the Board, that are subject to annual rates equal to 0.75% and 0.25%, respectively, of the Fund’s average daily net assets attributable to Class C and Class L shares, respectively, and is payable on a quarterly basis. Class A, Class I and Class W shares are not currently subject to a distribution fee. For the year ended September 30, 2025, Class C and Class L shares incurred $197,675 in distribution fees.
The Distributor acts as the Fund’s principal underwriter in a continuous public offering of the Fund’s shares. During the year ended September 30, 2025, no fees were retained by the Distributor.
Trustees – Each Trustee who is not affiliated with the Fund or the Adviser receives an annual fee of $10,000, an additional $2,000 for attending the annual in-person meeting of the Board, and $500 for attending each of the remaining telephonic meetings, as well as reimbursement for any reasonable expenses incurred attending the meetings. None of the executive officers or interested Trustees receives compensation from the Fund.
5. INVESTMENT TRANSACTIONS
The cost of purchases and proceeds from the sale of securities, other than short-term securities, for the year ended September 30, 2025 amounted to $42,035,949 and $48,621,363, respectively.
| Annual Report | September 30, 2025 | 41 |
| Alternative Credit Income Fund | Notes to Consolidated Financial Statements |
September 30, 2025
6. CAPITAL SHARES
The Fund, pursuant to an exemptive order granted by the SEC on July 22, 2014, offers multiple classes of shares. Class A, Class C, Class W, and Class I shares commenced operations on April 20, 2015. Class L shares commenced operations on July 28, 2017. Class C, Class W and Class I shares are offered at NAV. Class A shares are offered at NAV plus a maximum sales charge of 5.75% and may also be subject to a 0.50% early withdrawal charge, which will be deducted from repurchase proceeds, for shareholders tendering shares fewer than 365 days after the original purchase date, if (i) the original purchase was for amounts of $1 million or more and (ii) the selling broker received the reallowance of the dealer-manager fee. Class C shares are subject to a 1.00% early withdrawal charge. Class L shares are offered at NAV plus a maximum sales charge of 4.25%. Each class represents an interest in the same assets of the Fund and classes are identical except for differences in their sales charge structures, ongoing service and distribution charges and early withdrawal charges. All classes of shares have equal voting privileges except that each class has exclusive voting rights with respect to its service and/or distribution plans. The Fund’s income, non-class specific expenses and realized and unrealized gains and losses are allocated proportionately daily based upon the relative net assets of each class. Class specific expenses, where applicable, include distribution fees, shareholder servicing fees, and networking fees.
Share Repurchase Program - As an interval fund, the Fund offers its shareholders the option of redeeming shares on a quarterly basis, at NAV, no less than 5% of the Fund’s issued and outstanding shares as of the close of regular business hours on the New York Stock Exchange on the Repurchase Pricing Date. If shareholders tender for repurchase more than 5% of the outstanding shares of the Fund, the Fund may, but is not required to, repurchase up to an additional 2% of the outstanding shares of the Fund. If the Fund determines not to repurchase up to an additional 2% of the outstanding shares of the Fund, or if more than 7% of the outstanding shares of the Fund are tendered, then the Fund will repurchase shares on a pro rata basis based upon the number of shares tendered by each shareholder. There can be no assurance that the Fund will be able to repurchase all shares that each shareholder has tendered. In the event of an oversubscribed offer, shareholders may not be able to tender all shares that they wish to tender and may have to wait until the next quarterly repurchase offer to tender the remaining shares, subject to any proration. Subsequent repurchase requests will not be given priority over other shareholder requests.
For the year ended September 30, 2025, the Fund completed four quarterly repurchase offers. In these repurchase offers, the Fund offered to repurchase up to 5% of the number of its outstanding shares (up to 7% at the discretion of the officers of the Fund) as of the Repurchase Pricing Dates. For the year ended, each of the quarterly repurchase offers were oversubscribed such that pro-ration was required.
The result of those repurchase offers were as follows:
| Repurchase Offer # 1 | Repurchase Offer # 2 | Repurchase Offer # 3 | Repurchase Offer # 4 | |
| Commencement Date | September 12, 2024 | December 11, 2024 | March 14, 2025 | June 12, 2025 |
| Repurchase Request Deadline | October 10, 2024 | January 10, 2025 | April 10, 2025 | July 10, 2025 |
| Repurchase Pricing Date | October 10, 2024 | January 10, 2025 | April 10, 2025 | July 10, 2025 |
| Amount Repurchased | $ 11,388,001 | $ 10,767,345 | $ 10,208,262 | $ 10,162,968 |
| Shares Repurchased | 1,173,915 | 1,163,035 | 1,133,422 | 1,098,899 |
7. BANK LINE OF CREDIT
On October 4, 2023, the Fund entered into a multi-currency revolving bank line of credit (the “Credit Facility”) with U.S. Bank National Association (“USB”). The Credit Facility has a committed, available facility size of $50 million. The Credit Facility is an evergreen facility terminable by either party upon 364 days of receipt of written notice. The Credit Facility is secured by a first-priority perfected security interest in all the Fund's assets with a facility fee of 0.25% per annum, payable quarterly, pro-rated for the life of the Credit Facility if the Credit Facility is terminated, a commitment fee of 0.35% on the unused portion of the maximum facility size and the interest on the used portion is based on the Fund's option, either daily simple US SOFR, 1 month US SOFR plus the applicable margin of 1.80% or the USB Prime rate.
During the year ended September 30, 2025, the Fund incurred $511,282 of interest and financing expenses related to the Credit Facility. Average borrowings during the year ended September 30, 2025, and the average interest rate for the days the line of credit was outstanding during the year ended September 30, 2025, were $4,673,551 and 4.72%, respectively. The largest outstanding borrowing during the year ended September 30, 2025, was $9,154,887. As of September 30, 2025, the Fund had borrowings of $7,756,971 (Proceeds $7,754,410) and an average stated interest rate of 4.93%. Included in this amount is $3,756,971 (Proceeds $3,554,410) of borrowings denominated in euros. As collateral for the Credit Facility, the Fund grants USB a first position security interest in and lien on substantially all securities of any kind or description held by the Fund in the pledge account. The fair value of the USB Credit Facility was approximated at carrying value on the consolidated statement of assets and liabilities.
Under the 1940 Act, the Fund is not permitted to incur indebtedness, including through the issuance of debt securities, unless immediately thereafter the Fund will have an asset coverage of at least 300%. In general, the term “asset coverage” for this purpose means the ratio which the value of the total assets of the Fund, less all liabilities and indebtedness not represented by senior securities, bears to the aggregate amount of senior securities representing indebtedness of the Fund. In addition, the Fund may be limited in its ability to declare any cash distribution on its capital stock or purchase its capital stock unless, at the time of such declaration or purchase, the Fund has an asset coverage (on its indebtedness) of at least 300% after deducting the amount of such distribution or purchase price, as applicable. As of September 30, 2025, our asset coverage ratio was 2,594%.
| 42 | www.altcif.com |
| Alternative Credit Income Fund | Notes to Consolidated Financial Statements |
September 30, 2025
8. TAX BASIS INFORMATION
For the year ended September 30, 2025, the following reclassifications, which had no impact on results of operations or net assets, were recorded to reflect tax character. These differences were primarily attributed to the tax treatment of certain income items.
| Distributable Earnings | Paid-In Capital | ||||||||
| $ | 2,177,580 | $ | (2,177,580 | ) | |||||
The following information is computed on a tax basis for each item as of September 30, 2025:
| Gross Appreciation | Gross Depreciation (excess of tax cost over value) | Net Appreciation (Depreciation) of Line of Credit and Foreign Currency | Net Depreciation | Cost of Investments for Income Tax Purposes | ||||||||||||||||
| $ | 10,713,164 | $ | (37,419,086 | ) | $ | 46,474 | $ | (26,659,448 | ) | $ | 222,181,901 | |||||||||
The difference between book basis and tax basis distributable earnings and unrealized appreciation/(depreciation) is primarily attributable to the tax deferral of losses, investments in partnerships and certain other investments.
As of September 30, 2025, the components of accumulated earnings on a tax basis were as follows:
| Undistributed Ordinary Income | Accumulated Capital Gains/ (Losses) | Net Unrealized Appreciation/ (Depreciation) on Securities | Total Accumulated Deficit | |||||||||||||
| $ | 15,412,184 | $ | (24,516,362 | ) | $ | (26,659,448 | ) | $ | (35,763,626 | ) | ||||||
The tax characteristics of distributions paid for the years ended September 30, 2025 and September 30, 2024, were as follows:
| Year | Ordinary Income | Long-Term Capital Gain | Return of Capital | ||||||||||
| 2025 | $ | 18,936,804 | $ | – | $ | – | |||||||
| 2024 | 17,110,379 | – | – | ||||||||||
Under current law, capital losses maintain their character as short-term or long-term and are carried forward to the next tax year without expiration. As of September 30, 2025, the following amounts are available as carry forwards to the next tax year:
| Short-Term Capital Losses | Long-Term Capital Losses | |||||||
| $ | 690,149 | $ | 9,770,629 | |||||
The Fund has formed a Taxable Subsidiary, which is taxed as a corporation for income tax purposes. The Taxable Subsidiary allows the Fund to make equity investments in companies organized as pass-through entities while continuing to satisfy the requirements of a RIC under the Code. The Taxable Subsidiary is a wholly owned subsidiary and consolidated in these financial statement statements for financial reporting purposes.
| Annual Report | September 30, 2025 | 43 |
| Alternative Credit Income Fund | Notes to Consolidated Financial Statements |
September 30, 2025
Deferred U.S. federal income taxes reflect the net tax effect of temporary differences between the carrying amount of assets and liabilities for financial reporting and U.S. federal income tax purposes. Components of deferred tax assets (liabilities) as of September 30, 2025, were as follows:
| Deferred tax assets: | ||||
| Net operating loss carryforwards | $ | – | ||
| Capital loss carryforwards | – | |||
| Other deferred tax assets | – | |||
| Less valuation allowance | – | |||
| Total deferred tax assets | $ | – | ||
| Deferred tax liabilities: | ||||
| Unrealized appreciation on investments | 65,572 | |||
| Unrealized (depreciation) on investments | – | |||
| Total deferred tax liability | 65,572 | |||
| Net deferred tax liability | $ | 65,572 | ||
| The Fund's income tax provision consists of the following as of September 30, 2025: | ||||
| Current: | ||||
| Federal | $ | 46,198 | ||
| $ | 46,198 | |||
| Deferred and other: | ||||
| Federal and state | $ | 65,572 | ||
| $ | 65,572 | |||
9. RISK FACTORS
In the normal course of business, the Fund faces certain risks and uncertainties. Set forth below is a summary of certain principal risks associated with the Fund. The following is not intended to be a complete list of all the potential risks associated with the Fund. For a more comprehensive list of potential risks the Fund may be subject to, please refer to the Fund’s Prospectus and Statement of Additional Information.
Credit Risk - It is possible that the Fund’s debt investments may not make scheduled interest and/or principal payments on their loans and/or debt securities, which may result in losses or reduced cash flow to the Fund, either or both of which may cause the Net Asset Value of, or the distributions by, the Fund to decrease. In addition, the credit quality of securities held by the Fund may fall if the underlying borrowers’ financial condition deteriorates. This also may negatively impact the value of and the Fund’s returns on its investment in such securities.
Debt Securities and Interest Rate Risks - Because the Fund invests in debt securities, the value of your investment in the Fund may fluctuate with changes in interest rates. Typically, a rise in market interest rates will cause a decline in the value of fixed rate or other debt instruments. If market interest rates increase, there is a significant risk that the value of the Fund’s investment in fixed rate debt securities may fall, and that it may be more difficult for the Fund to raise capital. Related risks include credit risk (the debtor may default) and prepayment risk (the debtor may pay its obligation early, reducing the amount of interest payments).
Investment Risk - An investment in the Fund involves a considerable amount of risk. Before making an investment decision, a prospective investor should (i) consider the suitability of this investment with respect to his, her or its investment objectives and personal situation and (ii) consider factors such as his, her or its personal net worth, income, age, risk tolerance and liquidity needs. An investment in the Fund’s shares is subject to investment risk, including the possible loss of the entire principal amount invested. At any point in time, an investment in the Fund’s shares may be worth less than the original amount invested, even after taking into account distributions paid by the Fund and the ability of shareholders to reinvest dividends.
Leverage Risk - The Fund is permitted to obtain leverage using any form or combination of financial leverage instruments, including through funds borrowed from banks or other financial institutions (i.e., a credit facility), margin facilities, the issuance of preferred shares or notes and leverage attributable to reverse repurchase agreements, dollar rolls or similar transactions. The Fund may use leverage opportunistically and may choose to increase or decrease its leverage, or use different types or combinations of leveraging instruments, at any time based on the Fund’s assessment of market conditions and the investment environment. The use of leverage, such as borrowing money to purchase securities, will cause the Fund (or a Public Investment Fund or Private Investment Fund in which the Fund has invested) to incur additional expenses and significantly magnify the Fund’s losses in the event of underperformance of the Fund’s (or Public Investment Fund’s or Private Investment Fund’s) underlying investments.
Market Disruption Risk - Unexpected local, regional or global events, such as war; acts of terrorism; financial, political or social disruptions; natural, environmental or man-made disasters; climate-change and climate-related events; the spread of infectious illnesses or other public health issues; recessions and depressions; or other events may result in market volatility, may have long-term effects on the United States and worldwide financial markets and may cause further economic uncertainties in the United States and worldwide. The Fund cannot predict the effects of such events in the future on the U.S. economy and securities markets.
| 44 | www.altcif.com |
| Alternative Credit Income Fund | Notes to Consolidated Financial Statements |
September 30, 2025
Public Investment Funds Risk - The Fund’s performance depends in part upon the performance of the Public Investment Fund managers and selected strategies, the adherence by such Public Investment Fund managers to such selected strategies, the instruments used by such Public Investment Fund managers and the Adviser’s ability to select Public Investment Fund managers and strategies and effectively allocate Fund assets among them. Fund shareholders will bear two layers of fees and expenses: (1) asset-based fees, incentive allocations or fees, and expenses at the Fund level and (2) asset-based fees, incentive allocations or fees, and expenses at the Public Investment Fund level.
Private Investment Funds Risk - The Fund’s performance depends in part upon the performance of the Private Investment Fund managers and selected strategies, the adherence by such Private Investment Fund managers to such selected strategies, the instruments used by such Private Investment Fund managers and the Adviser’s ability to select Private Investment Fund managers and strategies and effectively allocate Fund assets among them. Fund shareholders will bear two layers of fees and expenses: asset-based fees, incentive fees and allocations, and expenses at the Fund level, and asset-based fees, incentive fees and allocations, and expenses at the Private Investment Fund level.
Structured Products Risk - The Fund may invest in CDOs and other structured products, consisting of CBOs, CLOs and credit-linked notes. Holders of structured products bear risks of the underlying investments, index or reference obligation and are subject to counterparty risk. While certain structured products enable the investor to acquire interests in a pool of securities without the brokerage and other expenses associated with directly holding the same securities, investors in structured products generally pay their share of the structured product’s administrative and other expenses. Although it is difficult to predict whether the prices of indices and securities underlying structured products will rise or fall, these prices (and, therefore, the prices of structured products) will be influenced by the same types of political and economic events that affect issuers of securities and capital markets generally. If the issuer of a structured product uses shorter term financing to purchase longer term securities, the issuer may be forced to sell its securities at below market prices if it experiences difficulty in obtaining short-term financing, which may adversely affect the value of the structured products owned by the Fund. Certain structured products may be thinly traded or have a limited trading market. CLOs and credit-linked notes are typically privately offered and sold.
| Annual Report | September 30, 2025 | 45 |
| Alternative Credit Income Fund | Notes to Consolidated Financial Statements |
September 30, 2025
10. AFFILIATE TRANSACTIONS
The following investments represent affiliated investments transactions during the year ended September 30, 2025, and the related positions as of September 30, 2025:
| Security Name | Fair Value as of September 30, 2024 | Purchases(a) | Sales(b) | Realized Gain (Loss) | Change in Unrealized Appreciation/ (Depreciation) | Fair Value as of September 30, 2025 | Share/ Balance as of September 30, 2025 | Interest income/ Dividends/ Payment-in-kind income | ||||||||||||||||||||||||
| BCP Investment Corporation | $ | 473,099 | $ | 73,176 | $ | – | $ | – | $ | (183,288 | ) | $ | 362,987 | 13,482 | $ | 55,854 | ||||||||||||||||
| EBSC Holdings LLC (Riddell, Inc.), Preferred | 1,047,858 | 109,433 | – | – | 158,785 | 1,316,076 | 1,159,538 | 109,054 | ||||||||||||||||||||||||
| Great Lakes Funding II LLC, Series A | 392,756 | 59,583 | (424,478 | ) | (18,282 | ) | (9,579 | ) | – | – | 40,837 | |||||||||||||||||||||
| GreenPark Infrastructure, LLC Series A | 200,000 | – | – | – | – | 200,000 | 400 | – | ||||||||||||||||||||||||
| GreenPark Infrastructure, LLC Series M-1 | 70,630 | 809,944 | – | – | (2,130 | ) | 878,444 | 2,565 | – | |||||||||||||||||||||||
| Mount Logan Funding 2018-1 LP | 5,536,208 | 1,427,072 | (228,741 | ) | – | (1,989,106 | ) | 4,745,433 | 7,798,575 | 1,427,072 | ||||||||||||||||||||||
| Opportunistic Credit Interval Fund | 5,676,149 | – | (1,481,162 | ) | (67,239 | ) | 92,043 | 4,219,791 | 362,837 | 373,324 | ||||||||||||||||||||||
| PMP OPCO, LLC, Delayed Draw Term Loan | (7,341 | ) | – | – | – | (13,472 | ) | (20,813 | ) | – | 10,138 | |||||||||||||||||||||
| PMP OPCO, LLC, First Lien Term Loan | 1,241,958 | 6,260 | (142,383 | ) | – | (38,755 | ) | 1,067,080 | 1,123,242 | 161,332 | ||||||||||||||||||||||
| PMP OPCO, LLC, Revolver | (2,630 | ) | – | – | – | (4,401 | ) | (7,031 | ) | – | 896 | |||||||||||||||||||||
| Princeton Medspa Partners, LLC, Preferred | 246,846 | 33,777 | – | – | (77,661 | ) | 202,962 | 291,654 | 33,777 | |||||||||||||||||||||||
| Princeton Medspa Partners, LLC, Put Option | – | – | – | – | – | – | 250,000 | – | ||||||||||||||||||||||||
| Princeton Medspa Partners, LLC, Warrants | 18,560 | – | – | – | (11,531 | ) | 7,029 | 0.09 | – | |||||||||||||||||||||||
| Riddell Inc., Delayed Draw Term Loan | (4,073 | ) | – | – | – | 4,073 | – | – | 4,576 | |||||||||||||||||||||||
| Riddell Inc., First Lien Term Loan | 3,550,691 | 13,015 | (161,331 | ) | – | 13,169 | 3,415,544 | 3,429,578 | 371,805 | |||||||||||||||||||||||
| Series B - Great Lakes Funding II LLC | – | 363,727 | (24,591 | ) | – | (15,940 | ) | 323,196 | 339,136 | 13,630 | ||||||||||||||||||||||
| Total | $ | 18,440,711 | $ | 2,895,987 | $ | (2,462,686 | ) | $ | (85,521 | ) | $ | (2,077,793 | ) | $ | 16,710,698 | $ | 2,602,295 | |||||||||||||||
| (a) | Purchases include increases in the cost basis of investments resulting from new portfolio investments, follow-on investments, accrued PIK and accretion of original issue discount. Purchases also include transfers into Affiliate classification. |
| (b) | Sales include decreases in the cost basis of investments resulting from principal repayments and sales. Sales also include transfers out of Affiliate classification. |
| 46 | www.altcif.com |
| Alternative Credit Income Fund | Notes to Consolidated Financial Statements |
September 30, 2025
11. SUBSEQUENT EVENTS
The Fund has evaluated subsequent events through the date of issuance of the financial statements and has determined that there have been no events that have occurred that would require adjustments to our disclosures in the financial statements except as stated below.
| Annual Report | September 30, 2025 | 47 |
| Alternative Credit Income Fund | Report
of Independent Registered Public Accounting Firm |
To the Shareholders and the Board of Trustees of Alternative Credit Income Fund
Opinion on the Financial Statements and Financial Highlights
We have audited the accompanying consolidated statement of assets and liabilities of Alternative Credit Income Fund and subsidiaries (the "Fund"), including the consolidated schedule of investments, as of September 30, 2025, the related consolidated statements of operations and cash flows for the year then ended, the consolidated statements of changes in net assets for each of the two years in the period then ended, financial highlights for each of the three years in the period then ended, and the related notes (collectively referred to as the ”financial statements and financial highlights”). In our opinion, the financial statements and financial highlights present fairly, in all material respects, the financial position of the Fund as of September 30, 2025, and the results of its operations and its cash flows for the year then ended, the changes in its net assets for each of the two years in the period then ended, and the financial highlights for each of the three years in the period then ended in conformity with accounting principles generally accepted in the United States of America. The financial highlights for the years ended September 30, 2022 and 2021 were audited by other auditors whose report, dated November 29, 2022, expressed an unqualified opinion on those financial highlights.
Basis for Opinion
These financial statements and financial highlights are the responsibility of the Fund's management. Our responsibility is to express an opinion on the Fund's financial statements and financial highlights based on our audits. We are a public accounting firm registered with the Public Company Accounting Oversight Board (United States) (PCAOB) and are required to be independent with respect to the Fund in accordance with the U.S. federal securities laws and the applicable rules and regulations of the Securities and Exchange Commission and the PCAOB.
We conducted our audits in accordance with the standards of the PCAOB. Those standards require that we plan and perform the audit to obtain reasonable assurance about whether the financial statements and financial highlights are free of material misstatement, whether due to error or fraud. The Fund is not required to have, nor were we engaged to perform, an audit of its internal control over financial reporting. As part of our audits, we are required to obtain an understanding of internal control over financial reporting but not for the purpose of expressing an opinion on the effectiveness of the Fund’s internal control over financial reporting. Accordingly, we express no such opinion.
Our audits included performing procedures to assess the risks of material misstatement of the financial statements and financial highlights, whether due to error or fraud, and performing procedures that respond to those risks. Such procedures included examining, on a test basis, evidence regarding the amounts and disclosures in the financial statements and financial highlights. Our audits also included evaluating the accounting principles used and significant estimates made by management, as well as evaluating the overall presentation of the financial statements and financial highlights. Our procedures included confirmation of securities owned as of September 30, 2025, by correspondence with the custodian and brokers; when replies were not received from brokers, we performed other auditing procedures. We believe that our audits provide a reasonable basis for our opinion.
| /s/ Deloitte & Touche LLP |
New York, New York
November 26, 2025
We have served as the Fund’s auditor since 2023.
| 48 | www.altcif.com |
| Alternative Credit Income Fund | Additional Information |
September 30, 2025 (Unaudited)
1. PROXY VOTING POLICIES AND VOTING RECORD
A description of the policies and procedures that the Fund uses to vote proxies relating to portfolio securities is available without charge upon request by calling toll-free 833-404-4103, or on the Securities and Exchange Commission’s (“SEC”) website at http://www.sec.gov. Information regarding how the Fund voted proxies relating to portfolio securities during the most recent 12-month period ended September 30, 2025, is available without charge upon request by calling toll-free 833-404-4103, or on the SEC’s website at http://www.sec.gov.
2. QUARTERLY PORTFOLIO HOLDINGS
The Fund files a complete listing of portfolio holdings for the Fund with the SEC as of the first and third quarters of each fiscal year on Form N-PORT. The filings are available upon request by calling 833-404-4103. Furthermore, you may obtain a copy of the filing on the SEC’s website at http://www.sec.gov.
| Annual Report | September 30, 2025 | 49 |
| Alternative Credit Income Fund | Trustees & Officers |
September 30, 2025 (Unaudited)
The business and affairs of the Fund are managed under the direction of the Trustees. Information concerning the Trustees and officers of the Fund as of its fiscal period end September 30, 2025 is set forth below. Generally, each Trustee and officer serves an indefinite term or until certain circumstances such as resignation, death or otherwise as specified in the Fund’s organizational documents. Any Trustee may be removed at a meeting of shareholders by a vote meeting the requirements of the Fund’s organization documents. The Statement of Additional Information of the Fund includes additional information about the Trustees and officers and is available, without charge, upon request by calling the Fund toll-free at 1-833-404-4103. Refer to Footnote 4 of the Fund’s financial statements for additional information on Independent Trustee Compensation. The Interested Trustees and officers do not receive compensation from the Fund for their services to the Fund.
INDEPENDENT TRUSTEES
Name, Address and Year of Birth* |
Position/ Term of Office** |
Principal Occupation During the Past Five Years |
Number of Portfolios in Fund Complex Overseen by Trustee |
Other Directorships held by Trustee During Last 5 Years |
Alexander Duka 1966 |
Trustee since October 2020 | Senior Advisor, Acceleration Bay LLC (a patent investment and technology acceleration business), January 2020 to present; Executive Vice President of Corporate Development, Acceleration Bay, 2017 to 2019; Senior Advisor, Texas Fabco Solutions LLC (oilfield services), 2019 to present; Bank/Managing Director, Citigroup Inc. (1997 to 2017). |
1 | BC Partners Lending Corp, 2018 to present
BCP Investment Corporation (f/k/a Portman Ridge Finance Corporation), 2019 to present
Bondhouse Investment Trust, 2019 to 2021
Logan Ridge Finance Corporation, 2021 to 2025
Opportunistic Credit Interval Fund, 2022 to present |
| Robert
Warshauer 1958 |
Trustee since October 2020 | Chief Executive Officer of BLST Holdings, LLC (a finance company) 2020-present. Former Managing Director and Head of Investment Banking-NY, Imperial Capital (an investment banking company), 2007 to 2020; Board Member, Icon Parking Holdings, LLC, 2020 to present, Global Knowledge (education service), 2020-2021, MD America (energy company), 2020; Board Member, Estrella Broadcasting (Spanish language media), 2019 to 2020. |
1 | BC Partners Lending Corp, 2018 to present
BCP Investment Corporation (f/k/a Portman Ridge Finance Corporation), 2019 to 2025
Logan Ridge Finance Corporation, 2021 to 2025
Opportunistic Credit Interval Fund, 2022 to present |
| 50 | www.altcif.com |
| Alternative Credit Income Fund | Trustees & Officers |
September 30, 2025 (Unaudited)
George Grunebaum 1963 |
Trustee since October 2020 | President, Ashmore Funds, 2010 to present; CEO, Ashmore Funds, 2008 to present; Director/President, Gordonstoun American Foundation (non-profit education), 2000 to present. | 1 | BC Partners Lending Corp, 2018 to present
BCP Investment Corporation (f/k/a Portman Ridge Finance Corporation), 2019 to present
Logan Ridge Finance Corporation, 2021 to 2025
Opportunistic Credit Interval Fund, 2022 to present |
INDEPENDENT TRUSTEES AND OFFICERS
Name, Address and Year of Birth |
Position/ Term of Office* |
Principal Occupation During the Past Five Years |
Number of Portfolios in Fund Complex Overseen by Trustee |
Other Directorships held by Trustee During Last 5 Years |
Edward Goldthorpe 1976 |
Chief Executive Officer (Principal Executive Officer), President, Trustee and Chairman of the Board since October 2020 | Partner and Head of Credit, BC Partners (an asset management firm), 2017 to present. | 1 | BC Partners Lending Corp, 2018 to present
BCP Investment Corporation (f/k/a Portman Ridge Finance Corporation), 2019 to present
Logan Ridge Finance Corporation, 2021 to 2025
Mount Logan Capital Inc., 2019 to present
Opportunistic Credit Interval Fund, 2022 to present |
| Brandon Satoren 1988 | Chief Financial Officer (Principal Financial Officer) since 2024, Treasurer and Secretary since 2021 | Mr. Satoren has served as the Chief Financial Officer (Principal Financial Officer) since 2024, Secretary and Treasurer of the Company since 2021. Mr. Satoren previously was a Vice President and Controller at PennantPark, a Vice President at AQR Capital Management, LLC and a Manager at PricewaterhouseCoopers LLP. He earned a Bachelor of Science in Accounting from the University of Central Florida in 2010. Mr. Satoren is a Certified Public Accountant licensed to practice in Colorado and is a member of the American Institute of Certified Public Accountants. |
N/A | N/A |
| Annual Report | September 30, 2025 | 51 |
| Alternative Credit Income Fund | Trustees & Officers |
September 30, 2025 (Unaudited)
| David Held 1970 | Chief Compliance Officer and AML Officer since 2021 | Mr. Held has served as Chief Compliance Officer of the Company since 2021. Since June 2021, Mr. Held has served as Chief Compliance Officer, Credit for BC Partners in New York City and has served as Chief Compliance Officer of Mount Logan Management. Between 2015 and 2021, he served as Chief Compliance Officer of Lyxor Asset Management Inc. |
N/A | N/A |
| * | Unless otherwise noted, the address of each Trustee and Officer is c/o Sierra Crest Investment Management LLC, 650 Madison Avenue, 3rd Floor, New York, NY 10022. |
| ** | The term of office for each Trustee and officer listed above will continue indefinitely. |
| 52 | www.altcif.com |
| Alternative Credit Income Fund | Privacy Notice |
| September 30, 2025 (Unaudited) |
| FACTS | WHAT DOES ALTERNATIVE CREDIT INCOME FUND DO WITH YOUR PERSONAL INFORMATION? | |||
| Why? | Financial companies choose how they share your personal information. Federal law gives consumers the right to limit some but not all sharing. Federal law also requires us to tell you how we collect, share, and protect your personal information. Please read this notice carefully to understand what we do. | |||
| What? | The types of personal information we collect and share depend on the product or service you have with us. This information can include: | |||
| ● | Social Security number | ● | Purchase History | |
| ● | Assets | ● | Account Balances | |
| ● | Retirement Assets | ● | Account Transactions | |
| ● | Transaction History | ● | Wire Transfer Instructions | |
| ● | Checking Account Information | |||
|
When you are no longer our customer, we continue to share your information as described in this notice. | ||||
| How? | All financial companies need to share customers’ personal information to run their everyday business. In the section below, we list the reasons financial companies can share their customers’ personal information; the reasons Alternative Credit Income Fund chooses to share; and whether you can limit this sharing. | |||
| REASONS WE CAN SHARE YOUR PERSONAL INFORMATION | Does
Alternative Credit Income Fund share? |
Can
you limit this sharing? | |
| For our everyday business purposes — such as to process your transactions, maintain your account(s), respond to court orders and legal investigations, or report to credit bureaus | Yes | No | |
| For our marketing purposes — to offer our products and services to you | No | We don't share | |
| For joint marketing with other financial companies | No | We don't share | |
| For our affiliates’ everyday business purposes — information about your transactions and experiences | No | We don't share | |
| For our affiliates’ everyday business purposes — information about your creditworthiness | No | We don't share | |
| For non-affiliates to market to you | No | We don't share | |
| QUESTIONS? | Call 1-833-404-4103 | ||
| Annual Report | September 30, 2025 | 53 |
| Alternative Credit Income Fund | Privacy Notice |
September 30, 2025 (Unaudited)
| WHO WE ARE | |
| Who is providing this notice? | Alternative Credit Interval Fund |
| WHAT WE DO | |
| How does Opportunistic Credit Interval Fund protect my personal information? | To protect your personal information from unauthorized access and use, we use security measures that comply with federal law. These measures include computer safeguards and secured files and buildings.
Our service providers are held accountable for adhering to strict policies and procedures to prevent any misuse of your nonpublic personal information. |
| We collect your personal information, for example, when you | |
How does Opportunistic Credit Interval Fund collect my personal information? |
● Open an account ● Provide account information ● Give us your contact information ● Make deposits or withdrawals from your account ● Make a wire transfer ● Tell us where to send the money ● Tells us who receives the money ● Show your government-issued ID ● Show your driver’s license |
| We also collect your personal information from other companies. | |
| Federal law gives you the right to limit only | |
Why can’t I limit all sharing?
|
● Sharing for affiliates’ everyday business purposes – information about your creditworthiness ● Affiliates from using your information to market to you ● Sharing for non-affiliates to market to you
State laws and individual companies may give you additional rights to limit sharing. |
DEFINITIONS |
|
Affiliates |
Companies related by common ownership or control. They can be financial and nonfinancial companies.
● Alternative Credit Income Fund does not share with our affiliates. |
Nonaffiliates |
Companies not related by common ownership or control. They can be financial and nonfinancial companies.
● Alternative Credit Income Fund does not share with non-affiliates so they can market to you. |
Joint marketing |
A formal agreement between nonaffiliated financial companies that together market financial products or services to you.
● Alternative Credit Income Fund doesn’t jointly market. |
| 54 | www.altcif.com |

| (b) | Not applicable. |
Item 2. Code of Ethics.
| (a) | As of the end of the period covered by this report, the Registrant has adopted a code of ethics that applies to the Registrant’s principal executive officer, principal financial officer, principal accounting officer or controller, or persons performing similar functions, regardless of whether these individuals are employed by the Registrant or a third party. |
| (b) | Not applicable. |
| (c) | During the period covered by this report, there have not been any amendments to the provisions of the code of ethics adopted in Item 2(a) of this report. |
| (d) | During the period covered by this report, the Registrant had not granted any express or implicit waivers from the provisions of the code of ethics adopted in Item 2(a) of this report. |
| (e) | Not applicable. |
| (f) | The Registrant’s Senior Code of Ethics is filed herewith as Exhibit 19(a)(1) to this Form N-CSR. |
Item 3. Audit Committee Financial Expert.
| (a)(1)(i) | The Board of Trustees of the Registrant has determined that the Registrant has at least one Audit Committee Financial Expert serving on its audit committee. |
| (a)(2) | The Board of Trustees of the Registrant has designated Mr. Robert Warshauer as the Registrant’s Audit Committee Financial Expert. Mr. Warshauer is “independent” as defined in paragraph (a)(2) of Item 3 to Form N-CSR. |
Item 4. Principal Accountant Fees and Services.
| (a) | Audit Fees: For the Registrant’s fiscal years ended September 30, 2025 and September 30, 2024, the aggregate fees billed for professional services rendered by the principal accountant for the audit of the Registrant’s annual financial statements or services that are normally provided by the accountant in connection with statutory and regulatory filings or engagements were $189,525 and $199,500, respectively. |
| (b) | Audit-Related Fees: For the Registrant’s fiscal years ended September 30, 2025 and September 30, 2024, the aggregate fees billed for assurance and related services by the principal accountant that are reasonably related to the performance of the audit of the Registrant’s financial statements and are not otherwise reported under paragraph (a) of this Item 4, were $0 and $0, respectively. |
| (c) | Tax Fees: For the Registrant’s fiscal years ended September 30, 2025 and September 30, 2024, the aggregate fees billed for professional services rendered by the principal accountant for tax compliance, tax advice and tax planning, which were comprised of the preparation of Federal and state income tax returns, assistance with calculation of required income, capital gain and excise distributions and preparation of Federal excise tax returns, were $0 and $0, respectively. |
| (d) | All Other Fees: For the Registrant’s fiscal years ended September 30, 2025 and September 30, 2024, the aggregate fees billed for products and services provided by the principal accountant, other than the services reported in paragraphs (a) through (c) of this Item 4, were $0 and $0, respectively. |
| (e)(1) | The Registrant’s audit committee is required to pre-approve all audit services and, when appropriate, any non-audit services (including audit-related, tax and all other services) to the Registrant. The Registrant’s audit committee also is required to pre-approve, when appropriate, any non-audit services (including audit-related, tax and all other services) to its adviser, or any entity controlling, controlled by or under common control with the adviser that provides ongoing services to the Registrant, to the extent that the services may be determined to have an impact on the operations or financial reporting of the Registrant. Services are reviewed on an engagement by engagement basis by the Audit Committee. |
| (2) | No services described in paragraphs (b) through (d) of this Item 4 were approved by the Registrant’s audit committee pursuant to paragraph (c)(7)(i)(C) of Rule 2-01 of Regulation S-X. |
| (f) | During the audit of Registrant’s financial statements for the most recent fiscal year, less than 50 percent of the hours expended on the principal accountant’s engagement were attributed to work performed by persons other than the principal accountant’s full-time, permanent employees. |
| (g) | For the Registrant’s fiscal years ended September 30, 2025 and September 30, 2024, the aggregate non-audit fees for services billed by the Registrant’s accountant for services rendered to the Registrant and rendered to the Registrant’s investment adviser (not including any sub-adviser whose role is primarily portfolio management and is subcontracted with or overseen by another investment adviser) and any entity controlling, controlled by, or under common control with the adviser that provides ongoing services to the Registrant were $0 and $0, respectively. |
| (h) | The Registrant’s audit committee has considered whether the provision of non-audit services to the Registrant’s investment adviser (not including any sub-adviser whose role is primarily portfolio management and is subcontracted with or overseen by another investment adviser), and any entity controlling, controlled by, or under common control with the investment adviser that provides ongoing services to the Registrant, that were not pre-approved pursuant to paragraph (c)(7)(ii) of Rule 2-01 of Regulation S-X, is compatible with maintaining the principal accountant’s independence. |
| (i) | Not applicable to the Registrant. |
| (j) | Not applicable to the Registrant. |
Item 5. Audit Committee of Listed Registrants.
Not applicable to the Registrant.
Item 6. Investments.
(a) The schedule of investments is included as part of the Report to Shareholders filed under Item 1(a) of this report.
(b) Not applicable to the Registrant.
Item 7. Financial Statements and Financial Highlights for Open-End Management Investment Companies.
Not applicable to the Registrant.
Item 8. Changes in and Disagreements with Accountants for Open-End Management Investment Companies.
Not applicable to the Registrant.
Item 9. Proxy Disclosures for Open-End Management Investment Companies.
Not applicable to the Registrant.
Item 10. Remuneration Paid to Directors, Officers, and Others of Open-End Management Investment Companies.
Not applicable to the Registrant.
Item 11. Statement Regarding Basis for Approval of Investment Advisory Contract.
Not applicable during the Registrant’s most recent fiscal half-year.
Item 12. Disclosure of Proxy Voting Policies and Procedures for Closed-End Management Investment Companies.
Summary
- As a registered investment adviser, Sierra Crest Investment Management LLC (“Sierra Crest”) is required to adopt a policy setting forth the principles and procedures by which Sierra Crest votes or gives consent with respect to the securities owned by the Funds.
- A “vote” for purposes of this policy means any proxy or shareholder consent, including a vote or consent of a private company that does not involve a proxy.
- The guiding principle by which Sierra Crest votes is to vote in the best interest of the relevant Fund by maximizing the economic value of the relevant Fund’s holdings, taking into account certain factors as set forth below.
- Sierra Crest may abstain on any particular vote if a determination is made that withholding is advisable and in the best interests of the relevant Fund.
- All staff should refer any votes where there is a conflict of interest to the CCO.
Purpose and General Statement
The purpose of these voting policies and procedures is to set forth the principles and procedures by which Sierra Crest votes or gives consents with respect to the securities owned by the funds advised by Sierra Crest (collectively, the “Funds”) for which Sierra Crest exercises voting authority and discretion (the “Votes”). For avoidance of doubt, a Vote includes any proxy and any shareholder vote or consent, including a vote or consent for a private company that does not involve a proxy. These policies and procedures have been designed to help ensure that Votes are voted in the best interests of the Funds in accordance with Sierra Crest’s fiduciary duties and Rule 206(4)-6 under the Investment Advisers Act of 1940, as amended (the “Advisers Act”).
Policy
Sierra Crest and its affiliates engage in a broad range of activities, including investment activities for the account of other investment funds or accounts and providing investment advisory and other services to funds and operating companies. In the ordinary course of conducting Sierra Crest’s activities, the interests of a Fund may conflict with the interests of Sierra Crest, other Funds and/or Sierra Crest’s affiliates and their clients. Any conflicts of interest relating to the voting of Votes, regardless of whether actual or perceived, will be addressed in accordance with these policies and procedures. The guiding principle by which Sierra Crest votes all Votes is to vote in the best interests of each Fund by maximizing the economic value of the relevant Fund’s holdings, taking into account the relevant Fund’s investment horizon, the contractual obligations under the relevant advisory agreements or comparable documents, and all other relevant facts and circumstances at the time of the vote. Sierra Crest does not permit voting decisions to be influenced in any manner that is contrary to, or dilutive of, this guiding principle.
It is the general policy of Sierra Crest to vote or give consent on all matters presented to security holders in any Vote, and these policies and procedures have been designated with that in mind. However, Sierra Crest reserves the right to abstain on any particular Vote or otherwise withhold its vote or consent on any matter if, in the judgment of the Sierra Crest’s Chief Compliance Officer (“CCO”) or the relevant Sierra Crest investment professional, the costs associated with voting such Vote outweigh the benefits to the relevant Funds or if the circumstances make such an abstention or withholding otherwise advisable and in the best interests of the relevant Funds. In connection with the voting of Votes, Sierra Crest’s personnel may, in their discretion, meet with members of a company’s management and discuss matters of importance to the Funds and their economic interests.
Procedures
Conflicts of Interest
Compliance has the responsibility to monitor Votes for any conflicts of interest, regardless of whether they are actual or perceived. All Sierra Crest investment professionals are expected to perform their tasks relating to the voting of Votes in accordance with the principles set forth above, according the first priority to the best interest of the relevant Funds. If at any time any investment professional becomes aware of any potential or actual conflict of interest or perceived conflict of interest regarding any particular Voting decision, he or she should contact the CCO. If any investment professional is pressured or lobbied either from within or outside of Sierra Crest with respect to any particular Voting decision, he or she should contact the CCO. The CCO will use his or her best judgment to address any such conflict of interest and ensure that it is resolved in accordance with his or her independent assessment of the best interests of the Funds.
Where the CCO deems appropriate in his or her sole discretion, unaffiliated third parties may be used to help resolve conflicts. In this regard, the CCO shall have the power to retain independent fiduciaries, consultants, or professionals to assist with voting decisions and/or to delegate voting or consent powers to such fiduciaries, consultants or professionals.
In the event that the CCO retains independent fiduciaries, consultants or professionals to assist with voting decisions and/or delegates such voting or consent power to such fiduciaries, consultants or professionals, the CCO will follow the procedures below regarding third party accountability to the Funds:
| ● | Ascertain whether the third party has the capacity and competency to adequately analyze proxy issues, including the adequacy of the third party’s personnel and policies and procedures with regard to identifying and addressing conflicts of interest; |
| ● | Ascertain whether the third party has the capacity and competency to adequately analyze proxy issues, including the adequacy of the third party’s personnel and policies and procedures with regard to identifying and addressing conflicts of interest; |
| ● | Adopt ongoing oversight policies of the third party to ensure the third party continues to vote proxies in the best interest of the Funds; |
| ● | Determine that the third party has the capacity and competency to adequately analyze proxy issues by providing materially accurate information. |
Voting
All Sierra Crest personnel are responsible for promptly forwarding all proxy materials, consent or voting requests or notices or materials related thereto to the CCO.
All Voting decisions initially are referred to the appropriate investment professional for a voting decision. In most cases, the relevant deal team member will make the decision as to the appropriate vote for any particular Vote. In making such decision, he or she may rely on any of the information and/or research available to him or her.
Recordkeeping
Sierra Crest’s Recordkeeping Policies and Procedures apply to Votes. Sierra Crest personnel should refer to the Recordkeeping Policies and Procedures for additional guidance and information.
Item 13. Portfolio Managers of Closed-End Management Investment Companies.
(a) Michael Terwilliger serves as the lead Portfolio Manager for the Fund, charged with the day to day management of the Fund. He has served the Fund as Portfolio Manager since October 2015. Mr. Terwilliger has more than a decade of credit investment experience, with expertise in a range of products including high yield bonds, distressed debt, structured securities, bank loans and convertibles. Mr. Terwilliger holds a Bachelor of Arts degree from Northwestern University and a Master of Business Administration from the University of Virginia Darden School Of Business. He is also a CFA charter holder.
As of September 30, 2025, Mr. Terwilliger did not manage any other accounts in addition to the Fund.
Edward Goldthorpe serves as Portfolio Manager for the Fund, charged with the day to day management of the Fund. He has served the Fund as Portfolio Manager since December 2020. Mr. Goldthorpe is currently a Partner at BC Partners Advisors LP (“BC Partners”), having launched the BC Partners Credit platform in February 2017, and also serves as the CEO and Chairman of Mount Logan Capital Inc. Mr. Goldthorpe holds a Bachelor of Commerce from Queen’s University.
As of September 30, 2025, Mr. Goldthorpe managed the following accounts in addition to the Fund:
Total Other Accounts Managed
| Registered Investment Company Accounts | Assets Managed | Pooled Investment Vehicle Accounts | Assets Managed | Other Accounts | Assets Managed |
| 4 | $1.1 billion | 8 | $6.3 billion | 3 | $0.9 billion |
Other Accounts Managed Subject to Performance-Based Fees
| Registered Investment Company Accounts | Assets Managed | Pooled Investment Vehicle Accounts | Assets Managed | Other Accounts | Assets Managed |
| 4 | $1.1 billion | 8 | $6.3 billion | 1 | <$0.1 billion |
As of September 30, 2025, Mr. Terwilliger owned between $100,001-$500,000 in Fund shares.
As of September 30, 2025, Mr. Goldthorpe owned between $100,001-$500,000 in Fund shares.
Portfolio Manager Compensation
As compensation, Mr. Terwilliger receives from the Adviser a fixed base salary. Mr. Terwilliger is also entitled to receive a discretionary bonus which may be based upon, among other things, individual performance and the performance of the Fund and the Adviser.
Mr. Goldthorpe, a Partner of BC Partners, is compensated based on the success of various fund and business platforms. As part of this compensation, he receives a carried interest from the firm’s activities that is distributed based on factors such as seniority, longevity and performance, including successful deal sourcing and execution. As a Partner of BC Partners, Mr. Goldthorpe’s compensation would increase if the Fund’s performance (and net asset value) increased due to his indirect interest in the Adviser, but such compensation is not tied to any specific metric.
(b) Not applicable to this report.
Item 14. Purchases of Equity Securities by Closed-End Management Investment Company and Affiliated Purchasers.
None.
Item 15. Submission of Matters to a Vote of Security Holders.
None.
Item 16. Controls and Procedures.
| (a) | Based on an evaluation of the Registrant’s disclosure controls and procedures as of a date within 90 days of the filing date of this report, the Registrant’s principal executive officer and principal financial officer have concluded that the disclosure controls and procedures are reasonably designed to ensure that the information required in filings on Form N-CSR is recorded, processed, summarized and reported by the filing date, including that information required to be disclosed is accumulated and communicated to the Registrant’s management, including the Registrant’s principal executive officer and principal financial officer, as appropriate to allow timely decisions regarding required disclosure. |
| (b) | There were no significant changes in the Registrant’s internal control over financial reporting that occurred during the period covered by this report that have materially affected, or are reasonably likely to materially affect, the Registrant’s internal control over financial reporting. |
Item 17. Disclosure of Securities Lending Activities for Closed-End Management Investment Companies.
None.
Item 18. Recovery of Erroneously Awarded Compensation.
| (a) | Not applicable. |
| (b) | Not applicable. |
Item 19. Exhibits.
| (a)(1) | Registrant’s Senior Code of Ethics is attached hereto as Exhibit 19(a)(1) in response to Item 2(f). |
| (a)(2) | Not applicable. |
| (a)(3) | Certifications pursuant to Rule 30a-2(a) under the 1940 Act are attached hereto as Exhibit 99.CERT. |
| (a)(4) | None. |
| (a)(5) | Not applicable. |
| (b) | Certifications pursuant to Rule 30a-2(b) under the 1940 Act are attached hereto as Exhibit 99.906CERT. |
SIGNATURES
Pursuant to the requirements of the Securities Exchange Act of 1934 and the Investment Company Act of 1940, the Registrant has duly caused this report to be signed on its behalf by the undersigned, thereunto duly authorized.
ALTERNATIVE CREDIT INCOME FUND
| By: | /s/ Edward Goldthorpe | |
| Edward Goldthorpe | ||
| President and Chief Executive Officer | ||
| (Principal Executive Officer) | ||
| Date: | December 5, 2025 | |
Pursuant to the requirements of the Securities Exchange Act of 1934 and the Investment Company Act of 1940, this report has been signed below by the following persons on behalf of the Registrant and in the capacities and on the dates indicated.
| By: | /s/ Edward Goldthorpe | |
| Edward Goldthorpe | ||
| President and Chief Executive Officer | ||
| (Principal Executive Officer) | ||
| Date: | December 5, 2025 | |
| By: | /s/ Brandon Satoren | |
| Brandon Satoren | ||
| Chief Financial Officer | ||
| (Principal Financial Officer) | ||
| Date: | December 5, 2025 |