
Third Quarter 2025 Supplemental .2
Disclaimers Forward-Looking Statements Certain statements contained in this supplemental, filed in conjunction with the Third Quarter 2025 Earnings Press Release, including statements relating to American Healthcare REIT, Inc.'s (the "Company") expectations regarding its performance, interest expense savings, balance sheet, net income or loss attributable to common shareholders and per diluted share, NAREIT FFO attributable to common shareholders and per diluted share, NFFO attributable to common shareholders and per diluted share, NOI growth, total portfolio Same-Store NOI growth, segment-level Same-Store NOI growth or decline, occupancy, revenue growth, margin expansion, purchases and sales of assets, development plans, and plans for Trilogy may be considered forward-looking statements within the meaning of Section 27A of the Securities Act of 1933, as amended, and Section 21E of the Securities Exchange Act of 1934, as amended. The Company intends for all such forward-looking statements to be covered by the applicable safe harbor provisions for forward-looking statements contained in those acts. Such forward-looking statements generally can be identified by the use of forward-looking terminology such as “may,” “will,” “can,” “expect,” “intend,” “anticipate,” “estimate,” “believe,” “continue,” “possible,” “initiatives,” “focus,” “seek,” “objective,” “goal,” “strategy,” “plan,” “potential,” “potentially,” “preparing,” “projected,” “future,” “long-term,” “once,” “should,” “could,” “would,” “might,” “uncertainty,” or other similar words. Readers are cautioned not to place undue reliance on these forward-looking statements, which speak only as of the date of this supplemental. Any such forward-looking statements are based on current expectations, estimates and projections about the industry and markets in which the Company operates and beliefs of, and assumptions made by, the Company's management and involve known and unknown risks and uncertainties that could cause actual results to differ materially from those expressed or implied therein, including, without limitation, changing macroeconomic conditions, domestic legal and fiscal policies, and geopolitical conditions and other risks disclosed in the Company’s periodic reports as filed with the Securities and Exchange Commission. Except as required by law, the Company does not undertake any obligation to update or revise any forward-looking statement. 2
Disclaimers Non-GAAP Financial Measures The Company’s reported results are presented in accordance with GAAP. The Company also discloses the following non-GAAP financial measures: EBITDA, Adjusted EBITDA, Net Debt-to-Annualized Adjusted EBITDA, NAREIT FFO, NFFO, NOI and Same-Store NOI. The Company believes these non-GAAP financial measures are useful supplemental measures of its operating performance and used by investors and analysts to compare the operating performance of the Company between periods and to other REITs or companies on a consistent basis without having to account for differences caused by unanticipated and/or incalculable items. Definitions of the non-GAAP financial measures used herein and reconciliations to the most directly comparable financial measure calculated in accordance with GAAP can be found at the end of this Supplemental. See below for further information regarding the Company's non-GAAP financial measures. EBITDA and Adjusted EBITDA Management uses earnings before interest, taxes, depreciation and amortization (“EBITDA”) and Adjusted EBITDA to facilitate internal and external comparisons to our historical operating results and in making operating decisions. EBITDA and Adjusted EBITDA are widely used by investors, lenders, credit and equity analysts in the valuation, comparison, and investment recommendations of companies. Additionally, EBITDA and Adjusted EBITDA are utilized by our Board of Directors to evaluate management. Neither EBITDA nor Adjusted EBITDA represents net income (loss) or cash flows provided by operating activities as determined in accordance with GAAP and should not be considered as alternative measures of profitability or liquidity. Finally, EBITDA and Adjusted EBITDA may not be comparable to similarly entitled items reported by other REITs or other companies. In addition, management uses Net Debt-to-Annualized Adjusted EBITDA as a measure of our ability to service our debt. NAREIT Funds from Operations (FFO) and Normalized Funds from Operations (NFFO) We believe that the use of FFO, which excludes the impact of real estate-related depreciation and amortization and impairments, provides a further understanding of our operating performance to investors, industry analysts and our management, and when compared year over year, reflects the impact on our operations from trends in occupancy rates, rental rates, operating costs, general and administrative expenses and interest costs, which may not be immediately apparent from net income (loss) as determined in accordance with GAAP. However, FFO and NFFO should not be construed to be (i) more relevant or accurate than the current GAAP methodology in calculating net income (loss) as an indicator of our operating performance, (ii) more relevant or accurate than GAAP cash flows from operations as an indicator of our liquidity or (iii) indicative of funds available to fund our cash needs, including our ability to make distributions to our stockholders. The method utilized to evaluate the value and performance of real estate under GAAP should be construed as a more relevant measure of operational performance and considered more prominently than the non-GAAP FFO and NFFO measures and the adjustments to GAAP in calculating FFO and NFFO. Presentation of this information is intended to provide useful information to investors, industry analysts and management as they compare the operating performance metrics used by the REIT industry, although it should be noted that some REITs may use different methods of calculating funds from operations and normalized funds from operations, so comparisons with such REITs may not be meaningful. Net Operating Income We believe that NOI, Cash NOI, Pro-Rata Cash NOI and Same-Store NOI are appropriate supplemental performance measures to reflect the performance of our operating assets because NOI, Cash NOI, Pro-Rata Cash NOI and Same-Store NOI exclude certain items that are not associated with the operations of the properties. We believe that NOI, Cash NOI, Pro-Rata Cash NOI and Same-Store NOI are widely accepted measures of comparative operating performance in the real estate community and are useful to investors in understanding the profitability and operating performance of our property portfolio. However, our use of the terms NOI, Cash NOI, Pro-Rata Cash NOI and Same- Store NOI may not be comparable to that of other real estate companies as they may have different methodologies for computing these amounts. NOI, Cash NOI, Pro-Rata Cash NOI and Same-Store NOI are not equivalent to our net income (loss) as determined under GAAP and may not be a useful measure in measuring operational income or cash flows. Furthermore, NOI, Cash NOI, Pro-Rata Cash NOI and Same-Store NOI should not be considered as alternatives to net income (loss) as an indication of our operating performance or as an alternative to cash flows from operations as an indication of our liquidity. NOI, Cash NOI, Pro-Rata Cash NOI and Same-Store NOI should not be construed to be more relevant or accurate than the GAAP methodology in calculating net income (loss). NOI, Cash NOI, Pro-Rata Cash NOI and Same-Store NOI should be reviewed in conjunction with other measurements as an indication of our performance. 3
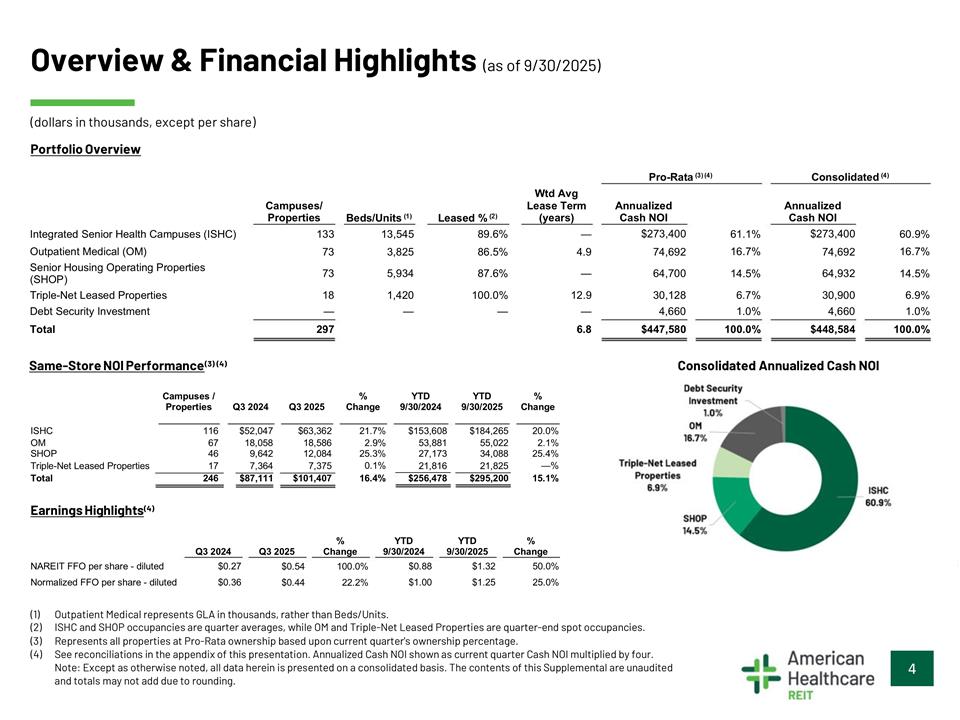
Overview & Financial Highlights (as of 9/30/2025) (dollars in thousands, except per share) Portfolio Overview Pro-Rata (3) (4) Consolidated (4) Wtd Avg Campuses/ Properties Lease Term (years) Annualized Cash NOI $273,400 Annualized Cash NOI $273,400 Beds/Units (1) Leased % (2) 89.6% Integrated Senior Health Campuses (ISHC) Outpatient Medical (OM) 133 13,545 — 61.1% 16.7% 60.9% 16.7% 73 73 3,825 5,934 86.5% 87.6% 4.9 — 74,692 64,700 74,692 64,932 Senior Housing Operating Properties (SHOP) 14.5% 14.5% Triple-Net Leased Properties Debt Security Investment 18 — 1,420 — 100.0% — 12.9 — 30,128 4,660 6.7% 1.0% 30,900 4,660 6.9% 1.0% Total 297 6.8 $447,580 100.0% $448,584 100.0% Same-Store NOI Performance (3) (4) Consolidated Annualized Cash NOI Campuses / % YTD YTD % Properties Q3 2024 Q3 2025 Change 9/30/2024 9/30/2025 Change ISHC OM SHOP 116 67 46 $52,047 18,058 9,642 $63,362 18,586 12,084 21.7% 2.9% 25.3% 0.1% $153,608 53,881 27,173 $184,265 55,022 34,088 20.0% 2.1% 25.4% —% Triple-Net Leased Properties 17 7,364 7,375 21,816 21,825 Total 246 $87,111 $101,407 16.4% $295,200 15.1% Earnings Highlights(4) % YTD 9/30/2024 YTD 9/30/2025 % Q3 2024 Q3 2025 $0.54 $0.44 Change 100.0% 22.2% Change NAREIT FFO per share - diluted Normalized FFO per share - diluted $0.27 $0.36 $0.88 $1.00 $1.32 $1.25 50.0% 25.0% (1) Outpatient Medical represents GLA in thousands, rather than Beds/Units. (2) ISHC and SHOP occupancies are quarter averages, while OM and Triple-Net Leased Properties are quarter-end spot occupancies. (3) Represents all properties at Pro-Rata ownership based upon current quarter's ownership percentage. (4) See reconciliations in the appendix of this presentation. Annualized Cash NOI shown as current quarter Cash NOI multiplied by four. Note: Except as otherwise noted, all data herein is presented on a consolidated basis. The contents of this Supplemental are unaudited and totals may not add due to rounding. 4 $256,478
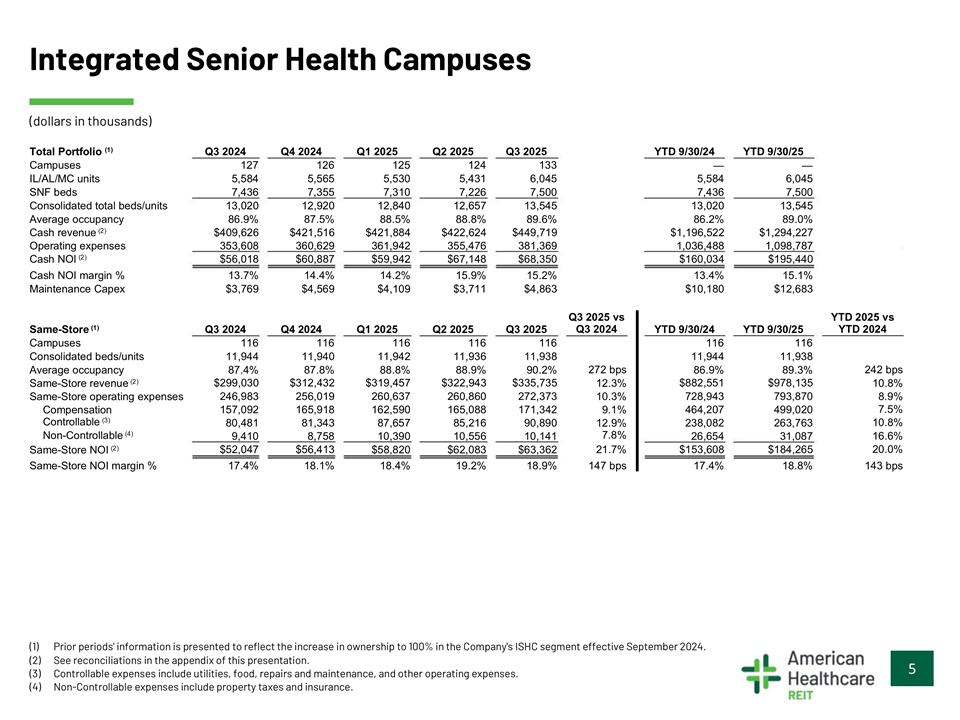
Integrated Senior Health Campuses (dollars in thousands) Total Portfolio (1) Campuses Q3 2024 127 Q4 2024 126 Q1 2025 125 Q2 2025 124 Q3 2025 133 YTD 9/30/24 YTD 9/30/25 — — IL/AL/MC units SNF beds 5,584 7,436 5,565 7,355 5,530 7,310 5,431 7,226 6,045 7,500 5,584 7,436 6,045 7,500 Consolidated total beds/units Average occupancy Cash revenue (2) Operating expenses Cash NOI (2) 13,020 86.9% $409,626 353,608 $56,018 12,920 87.5% $421,516 360,629 $60,887 12,840 88.5% $421,884 361,942 $59,942 12,657 88.8% $422,624 355,476 $67,148 13,545 89.6% $449,719 381,369 $68,350 13,020 86.2% $1,196,522 1,036,488 $160,034 13,545 89.0% $1,294,227 1,098,787 $195,440 Cash NOI margin % Maintenance Capex 13.7% $3,769 14.4% $4,569 14.2% $4,109 15.9% $3,711 15.2% $4,863 13.4% $10,180 15.1% $12,683 Q3 2025 vs Q3 2024 YTD 2025 vs YTD 2024 Same-Store (1) Campuses Q3 2024 116 Q4 2024 116 Q1 2025 116 Q2 2025 116 Q3 2025 116 YTD 9/30/24 116 YTD 9/30/25 116 Consolidated beds/units Average occupancy Same-Store revenue (2) Same-Store operating expenses Compensation Controllable (3) Non-Controllable (4) Same-Store NOI (2) 11,944 87.4% 11,940 87.8% 11,942 88.8% 11,936 88.9% 11,938 90.2% 11,944 86.9% 11,938 89.3% 272 bps 12.3% 10.3% 9.1% 12.9% 7.8% 242 bps 10.8% 8.9% $299,030 246,983 157,092 80,481 9,410 $312,432 256,019 165,918 81,343 8,758 $319,457 260,637 162,590 87,657 10,390 $58,820 $322,943 260,860 165,088 85,216 10,556 $62,083 $335,735 272,373 171,342 90,890 10,141 $63,362 $882,551 728,943 464,207 238,082 26,654 $978,135 793,870 499,020 263,763 31,087 7.5% 10.8% 16.6% 20.0% $52,047 $56,413 21.7% $153,608 $184,265 Same-Store NOI margin % 17.4% 18.1% 18.4% 19.2% 18.9% 147 bps 17.4% 18.8% 143 bps (1) Prior periods' information is presented to reflect the increase in ownership to 100% in the Company's ISHC segment effective September 2024. (2) See reconciliations in the appendix of this presentation. (3) Controllable expenses include utilities, food, repairs and maintenance, and other operating expenses. (4) Non-Controllable expenses include property taxes and insurance. 5
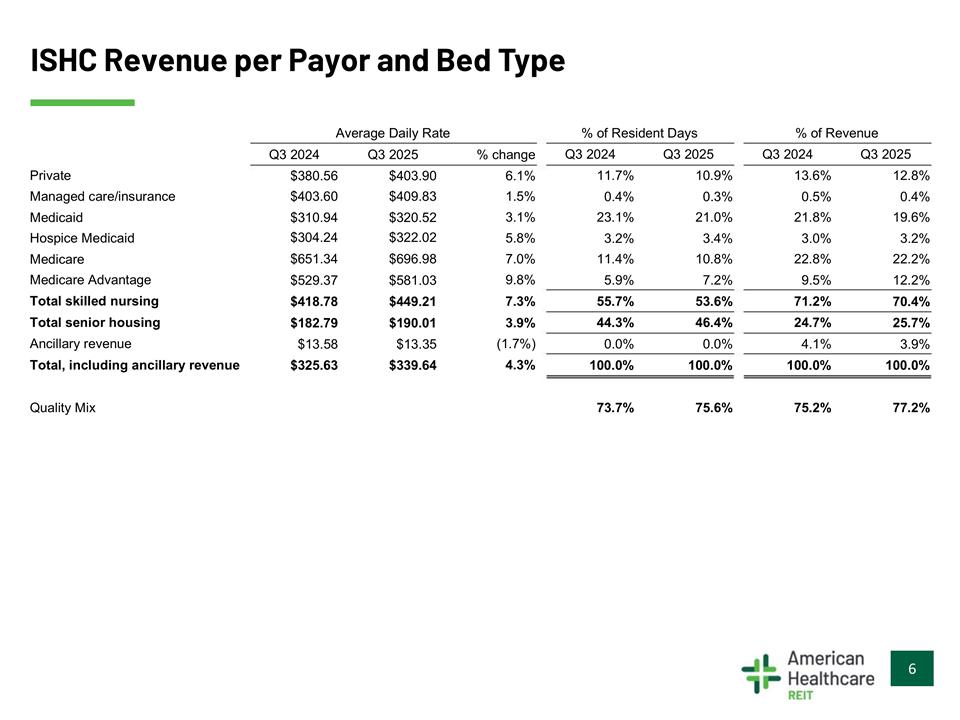
ISHC Revenue per Payor and Bed Type Average Daily Rate % of Resident Days Q3 2024 Q3 2025 % of Revenue Q3 2024 Q3 2025 Q3 2024 $380.56 Q3 2025 $403.90 % change 6.1% Private 11.7% 0.4% 10.9% 0.3% 13.6% 0.5% 12.8% 0.4% Managed care/insurance Medicaid $403.60 $310.94 $304.24 $651.34 $529.37 $418.78 $182.79 $13.58 $409.83 $320.52 $322.02 $696.98 $581.03 $449.21 $190.01 $13.35 1.5% 3.1% 23.1% 3.2% 21.0% 3.4% 21.8% 3.0% 19.6% 3.2% Hospice Medicaid Medicare 5.8% 7.0% 11.4% 5.9% 10.8% 7.2% 22.8% 9.5% 22.2% 12.2% 70.4% 25.7% 3.9% Medicare Advantage Total skilled nursing Total senior housing Ancillary revenue Total, including ancillary revenue 9.8% 7.3% 55.7% 44.3% 0.0% 53.6% 46.4% 0.0% 71.2% 24.7% 4.1% 3.9% (1.7%) 4.3% $325.63 $339.64 100.0% 100.0% 100.0% 100.0% Quality Mix 73.7% 75.6% 75.2% 77.2% 6

Outpatient Medical (dollars and square feet in thousands, except revenue per square foot and NOI per square foot) Total Portfolio Q3 2024 83 Q4 2024 81 Q1 2025 81 Q2 2025 Q3 2025 73 YTD 9/30/24 YTD 9/30/25 Properties 78 — — Consolidated GLA (sq ft) Ending occupancy Cash revenue (1) 4,400 88.1% 4,262 87.9% 4,260 87.4% 3,952 86.1% 3,825 86.5% 4,400 88.1% 3,825 86.5% $33,305 12,300 $21,005 $32,439 12,115 $20,324 $32,697 12,404 $20,293 $30,185 11,621 $18,564 $30,131 11,458 $18,673 $100,316 37,362 $93,013 35,483 $57,530 Operating expenses Cash NOI (1) $62,954 Cash NOI margin % 63.1% $30.28 $19.10 $2,962 62.7% $30.44 $19.07 $3,724 62.1% $30.70 $19.05 $7,355 61.5% $30.55 $18.79 $2,904 62.0% $31.51 $19.53 $4,924 62.8% $30.40 $19.08 $8,295 61.9% $32.42 $20.05 $15,183 Revenue per square foot Cash NOI per square foot Maintenance Capex Q3 2025 vs Q3 2024 YTD 2025 vs YTD 2024 Same-Store Q3 2024 Q4 2024 Q1 2025 Q2 2025 Q3 2025 YTD 9/30/24 YTD 9/30/25 Properties 67 3,493 67 3,493 67 3,490 67 3,493 67 3,493 67 67 Consolidated GLA (sq ft) Ending occupancy 3,493 92.1% 3,493 91.8% 92.1% 92.3% 92.2% 91.7% 91.8% (29 bps) 3.6% (29 bps) 2.5% Same-Store revenue (1) Same-Store operating expenses Same-Store NOI (1) $28,327 10,269 $18,058 $28,529 10,365 $18,164 $28,806 10,579 $18,227 $28,677 10,468 $18,209 $29,359 10,773 $18,586 $84,764 30,883 $53,881 $86,842 31,820 $55,022 4.9% 3.0% 2.9% 2.1% Same-Store NOI margin % 63.7% $32.44 $20.68 63.7% $32.67 $20.80 63.3% $33.02 $20.89 63.5% $32.84 $20.85 63.3% $33.62 $21.28 (44 bps) 63.6% $32.36 $20.57 63.4% $33.15 $21.00 (21 bps) Same-Store revenue per square foot Same-Store NOI per square foot (1) See reconciliations in the appendix of this presentation. 7
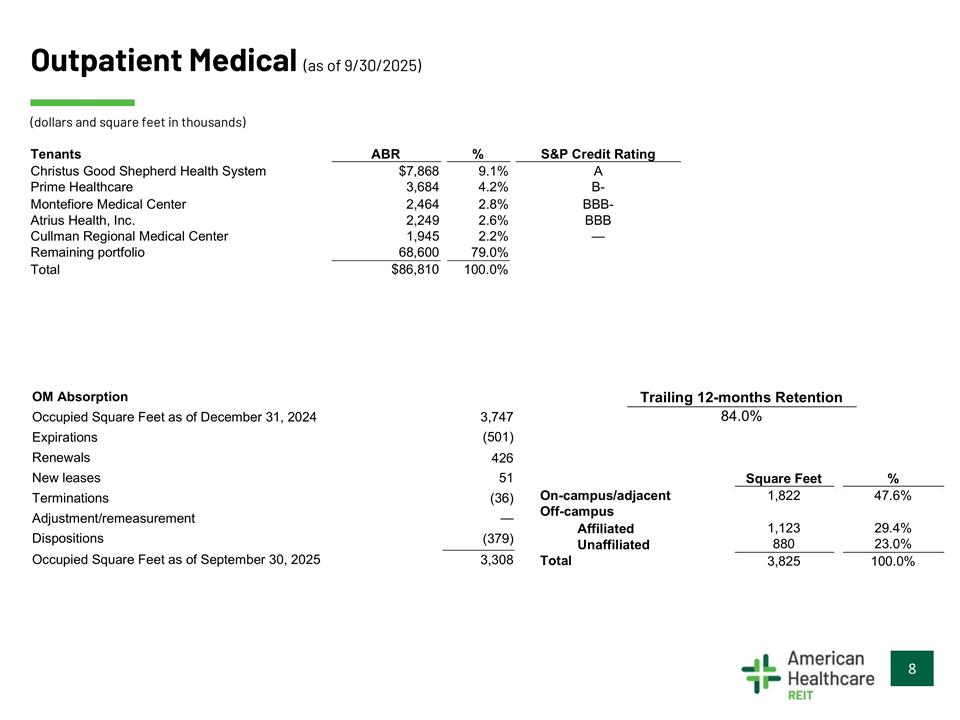
Outpatient Medical (as of 9/30/2025) (dollars and square feet in thousands) Tenants ABR % S&P Credit Rating Christus Good Shepherd Health System Prime Healthcare Montefiore Medical Center Atrius Health, Inc. Cullman Regional Medical Center Remaining portfolio Total $7,868 3,684 2,464 2,249 1,945 68,600 9.1% 4.2% 2.8% 2.6% 2.2% A B- BBB- BBB — 79.0% 100.0% $86,810 OM Absorption Trailing 12-months Retention 84.0% Occupied Square Feet as of December 31, 2024 3,747 (501) 426 Expirations Renewals New leases 51 Square Feet % On-campus/adjacent Off-campus Affiliated Unaffiliated Total 1,822 47.6% Terminations (36) — Adjustment/remeasurement Dispositions 1,123 880 3,825 29.4% 23.0% 100.0% (379) 3,308 Occupied Square Feet as of September 30, 2025 8
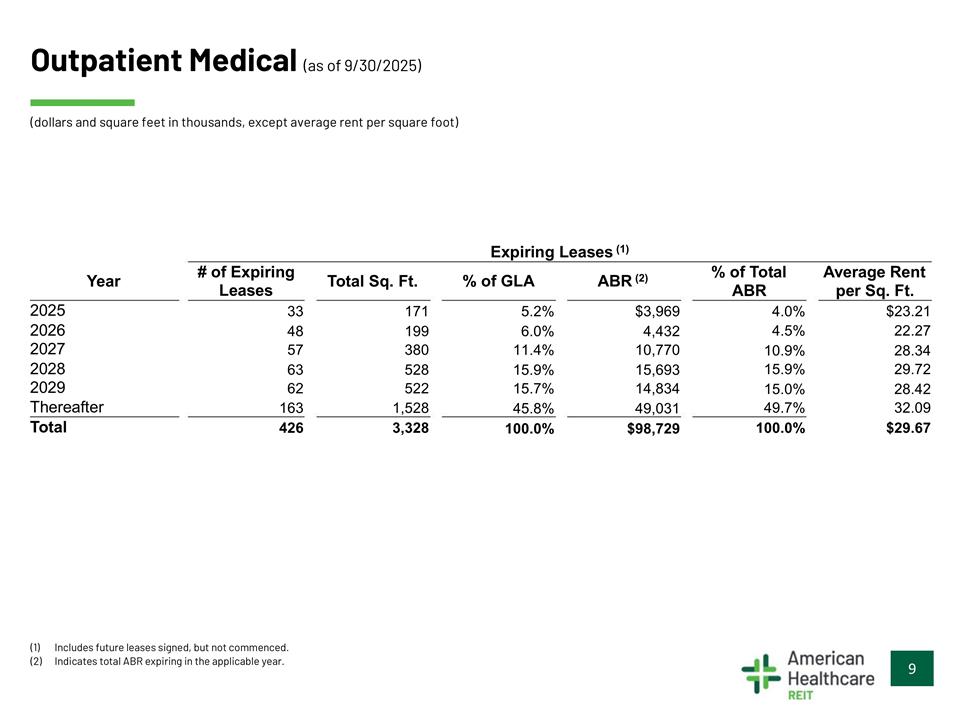
Outpatient Medical (as of 9/30/2025) (dollars and square feet in thousands, except average rent per square foot) Expiring Leases (1) % of GLA ABR (2) # of Expiring % of Total ABR Average Rent per Sq. Ft. $23.21 Year Total Sq. Ft. Leases 2025 2026 2027 2028 2029 33 48 57 63 62 171 199 380 528 522 5.2% 6.0% $3,969 4,432 4.0% 4.5% 10.9% 15.9% 15.0% 49.7% 100.0% 22.27 28.34 29.72 28.42 32.09 $29.67 11.4% 15.9% 15.7% 45.8% 100.0% 10,770 15,693 14,834 49,031 $98,729 Thereafter 163 426 1,528 3,328 Total (1) Includes future leases signed, but not commenced. (2) Indicates total ABR expiring in the applicable year. 9
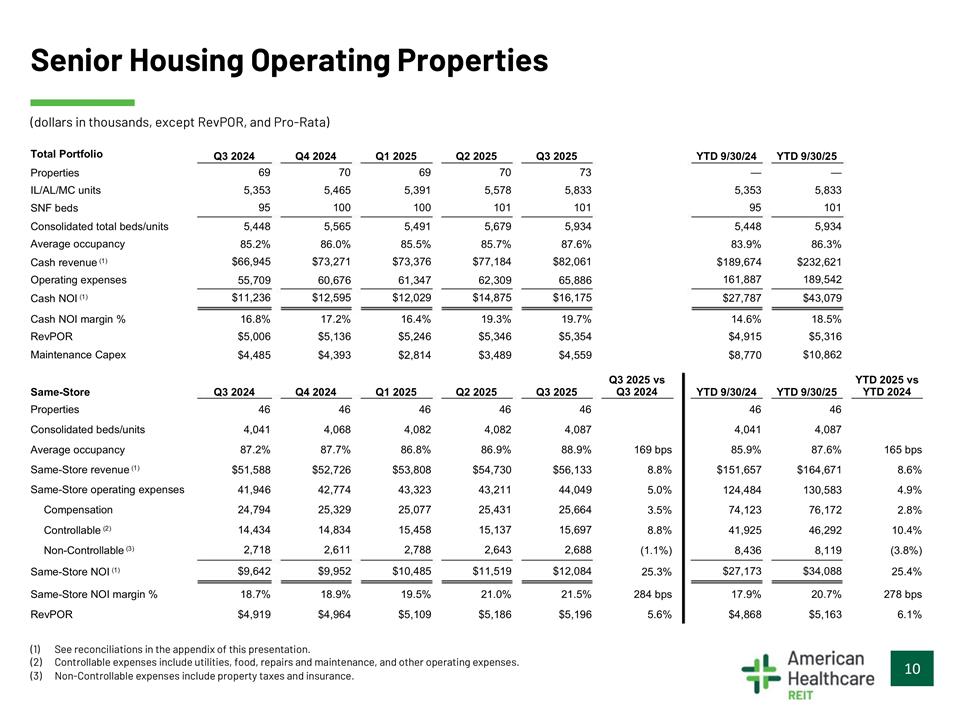
Senior Housing Operating Properties (dollars in thousands, except RevPOR, and Pro-Rata) Total Portfolio Properties Q3 2024 Q4 2024 Q1 2025 Q2 2025 Q3 2025 YTD 9/30/24 YTD 9/30/25 69 70 69 70 73 — — IL/AL/MC units 5,353 95 5,465 100 5,391 100 5,578 101 5,833 101 5,353 95 5,833 101 SNF beds Consolidated total beds/units Average occupancy Cash revenue (1) Operating expenses Cash NOI (1) 5,448 5,565 5,491 5,679 5,934 5,448 5,934 85.2% $66,945 55,709 $11,236 86.0% $73,271 60,676 $12,595 85.5% $73,376 61,347 $12,029 85.7% $77,184 62,309 $14,875 87.6% $82,061 65,886 $16,175 83.9% 86.3% $189,674 161,887 $27,787 $232,621 189,542 $43,079 Cash NOI margin % RevPOR 16.8% $5,006 $4,485 17.2% $5,136 $4,393 16.4% $5,246 $2,814 19.3% $5,346 $3,489 19.7% $5,354 $4,559 14.6% $4,915 $8,770 18.5% $5,316 Maintenance Capex $10,862 Q3 2025 vs Q3 2024 YTD 2025 vs YTD 2024 Same-Store Q3 2024 Q4 2024 Q1 2025 Q2 2025 Q3 2025 YTD 9/30/24 YTD 9/30/25 Properties 46 4,041 46 4,068 46 4,082 46 4,082 46 4,087 46 46 Consolidated beds/units Average occupancy Same-Store revenue (1) Same-Store operating expenses Compensation 4,041 85.9% 4,087 87.6% 87.2% $51,588 41,946 24,794 14,434 2,718 87.7% $52,726 42,774 25,329 14,834 2,611 86.8% $53,808 43,323 25,077 15,458 2,788 86.9% $54,730 43,211 25,431 15,137 2,643 88.9% $56,133 44,049 25,664 15,697 2,688 169 bps 8.8% 165 bps 8.6% $151,657 124,484 74,123 $164,671 130,583 76,172 5.0% 4.9% 3.5% 2.8% Controllable (2) 8.8% 41,925 46,292 10.4% (3.8%) 25.4% Non-Controllable (3) Same-Store NOI (1) (1.1%) 25.3% 8,436 8,119 $9,642 $9,952 $10,485 $11,519 $12,084 $27,173 $34,088 Same-Store NOI margin % RevPOR 18.7% $4,919 18.9% $4,964 19.5% $5,109 21.0% $5,186 21.5% $5,196 284 bps 5.6% 17.9% $4,868 20.7% $5,163 278 bps 6.1% (1) See reconciliations in the appendix of this presentation. (2) Controllable expenses include utilities, food, repairs and maintenance, and other operating expenses. (3) Non-Controllable expenses include property taxes and insurance. 10
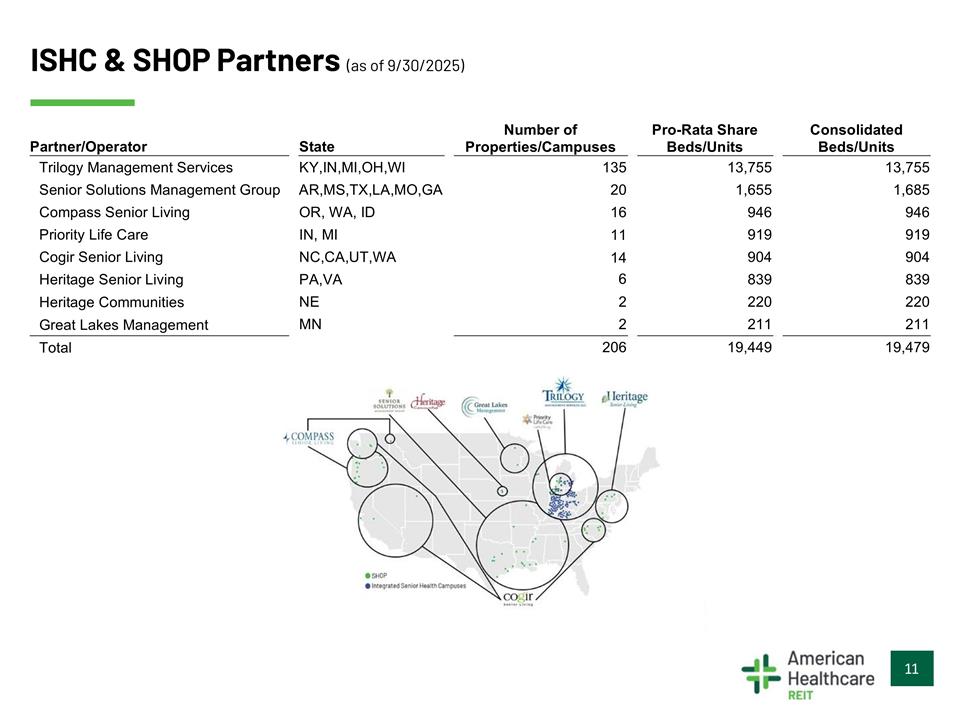
ISHC & SHOP Partners (as of 9/30/2025) Number of Properties/Campuses Pro-Rata Share Beds/Units Consolidated Beds/Units Partner/Operator State Trilogy Management Services KY,IN,MI,OH,WI 135 13,755 13,755 Senior Solutions Management Group AR,MS,TX,LA,MO,GA 20 16 11 14 6 1,655 946 1,685 946 Compass Senior Living Priority Life Care OR, WA, ID IN, MI 919 919 Cogir Senior Living Heritage Senior Living Heritage Communities Great Lakes Management Total NC,CA,UT,WA PA,VA 904 904 839 839 NE 2 220 220 MN 2 211 211 206 19,449 19,479 11
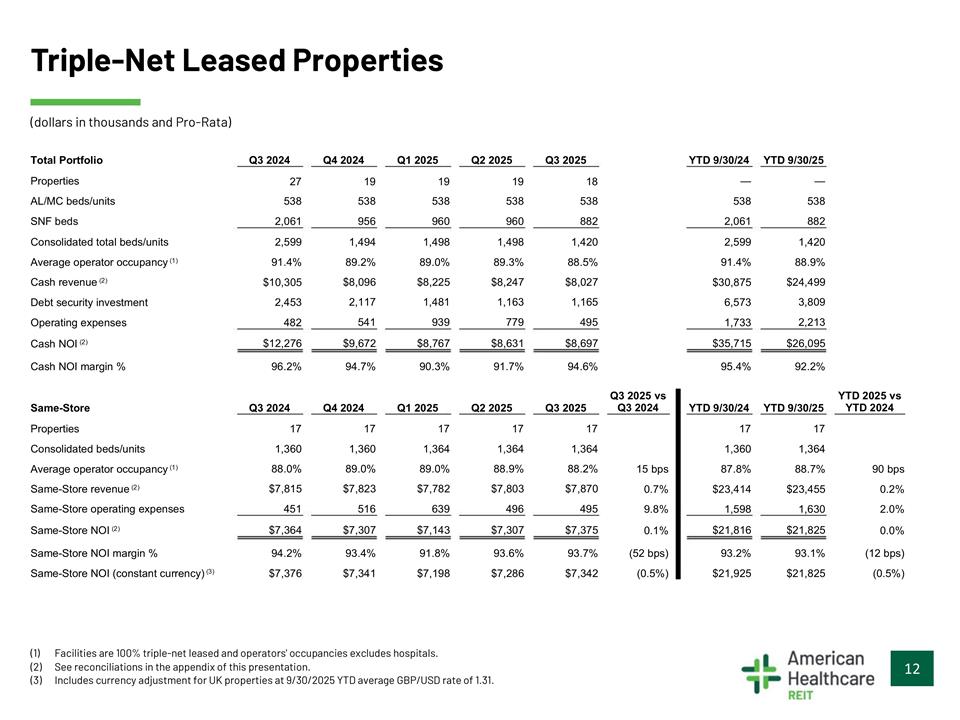
Triple-Net Leased Properties (dollars in thousands and Pro-Rata) Total Portfolio Q3 2024 27 Q4 2024 19 Q1 2025 19 Q2 2025 19 Q3 2025 18 YTD 9/30/24 YTD 9/30/25 Properties — 538 — 538 AL/MC beds/units SNF beds 538 2,061 538 956 538 960 538 960 538 882 2,061 882 Consolidated total beds/units Average operator occupancy (1) Cash revenue (2) 2,599 1,494 89.2% $8,096 2,117 541 1,498 89.0% $8,225 1,481 939 1,498 89.3% $8,247 1,163 779 1,420 88.5% $8,027 1,165 495 2,599 1,420 88.9% $24,499 3,809 2,213 $26,095 91.4% $10,305 2,453 91.4% $30,875 6,573 Debt security investment Operating expenses Cash NOI (2) 482 1,733 $12,276 $9,672 $8,767 $8,631 $8,697 $35,715 Cash NOI margin % 96.2% 94.7% 90.3% 91.7% 94.6% 95.4% 92.2% Q3 2025 vs Q3 2024 YTD 2025 vs YTD 2024 Same-Store Q3 2024 Q4 2024 Q1 2025 Q2 2025 Q3 2025 YTD 9/30/24 YTD 9/30/25 Properties 17 1,360 88.0% $7,815 451 17 1,360 89.0% $7,823 516 17 1,364 89.0% $7,782 639 17 1,364 88.9% $7,803 496 17 1,364 88.2% $7,870 495 17 1,360 17 1,364 Consolidated beds/units Average operator occupancy (1) Same-Store revenue (2) Same-Store operating expenses Same-Store NOI (2) 15 bps 0.7% 9.8% 0.1% 87.8% $23,414 1,598 88.7% $23,455 1,630 90 bps 0.2% 2.0% 0.0% $7,364 $7,307 $7,143 $7,307 $7,375 $21,816 $21,825 Same-Store NOI margin % 94.2% $7,376 93.4% $7,341 91.8% $7,198 93.6% $7,286 93.7% $7,342 (52 bps) (0.5%) 93.2% 93.1% (12 bps) (0.5%) Same-Store NOI (constant currency) (3) $21,925 $21,825 (1) Facilities are 100% triple-net leased and operators' occupancies excludes hospitals. (2) See reconciliations in the appendix of this presentation. (3) Includes currency adjustment for UK properties at 9/30/2025 YTD average GBP/USD rate of 1.31. 12

Triple-Net Leased Properties Rent Coverage Stratification Contribution to Pro-Rata Cash NOI at each Coverage Stratification for Q3 2025 (1) Tenant EBITDAR Coverage Tenant EBITDARM Coverage Weighted Weighted Senior Number of Leases Senior Number of Leases Average Maturity (years) Average Maturity (years) Coverage Housing- SNFs Hospital Total Leased Housing- SNFs Hospital Total Leased < 0.80x — — — — 1.7% — 1.7% — 11.7 1 — 1 — — — — 1.7% — 1.7% — 11.7 1 0.80x - 0.89x 0.90x - 0.99x 1.00x - 1.09x 1.10x - 1.19x 1.20x - 1.29x 1.30x - 1.39x 1.40x - 1.49x 1.50x - 1.59x 1.60x - 1.69x 1.70x - 1.79x 1.80x - 1.89x 1.90x - 1.99x > 2.00x — 6.7 — — — — — — 1 0.6% — — — 0.6% — — — — — — — — 1 — — — — — — 0.1% — — 0.1% 1.2% — 8.5 25.0 — 0.6% — — — 0.6% — 6.7 — 1.2% — — 1 — — — — 1 — — — — 1 — — — — — — — — — — 1.2% — — — 1.2% — 25.0 — — 1.6% — — 1.6% — 15.8 — — — — — 1 — — — — — 1 — — — — — — — — — — — 0.1% — — 0.1% — 8.5 — — — — — — — — — — 3 — 1.2% — — 1.2% 0.3% 6.7% 5.1 8.2 12.9 — — — — — — 0.3% 2.0% 1 — 2.8% 2.9% 0.3% 2.0% 3.1% 6.7% 12.3 12.9 Total 1.8% 2.9% 7 1.8% 7 Segment rent coverage (2) Tenant Occupancy 1.14x 1.68x 1.79x 1.58x 1.38x 2.16x 2.02x 1.92x N/A 88.5% 87.4% 89.2% N/A 88.5% 87.4% 89.2% (1) Represents trailing twelve month coverage metrics as of June 30, 2025. Percentages are based on Pro-Rata Cash NOI for the three months ended September 30, 2025. (2) Represents combined coverage metrics for all leases within each property type and total segment. 13

Revenue and Lease Expiration(1) (as of 9/30/2025) (dollars in thousands) ABR of Expiring Leases (2) as % of Total ABR Triple-Net Leased Year 2025 2026 2027 2028 OM $3,969 4,432 10,770 15,693 14,834 49,031 Properties Interest Income (3) Total $3,969 4,432 10,770 19,706 14,834 86,210 4.0% 4.5% 10.9% 15.9% 15.0% 49.7% $— — — — — 0.0% 0.0% 0.0% 0.0% 0.0% $— — — 0.0% 0.0% 0.0% 2.8% 3.2% 7.7% 14.1% 10.6% 61.6% 4,013 — 100.0% 0.0% 2029 Thereafter 37,179 100.0% — 0.0% Total $98,729 100.0% $37,179 100.0% $4,013 100.0% $139,921 100.0% (1) Excludes ISHC and SHOP. (2) Total ABR expiring in the applicable year. Month-to-month leases are included as expirations in 2025. (3) Represents total interest income from debt security investment. 14
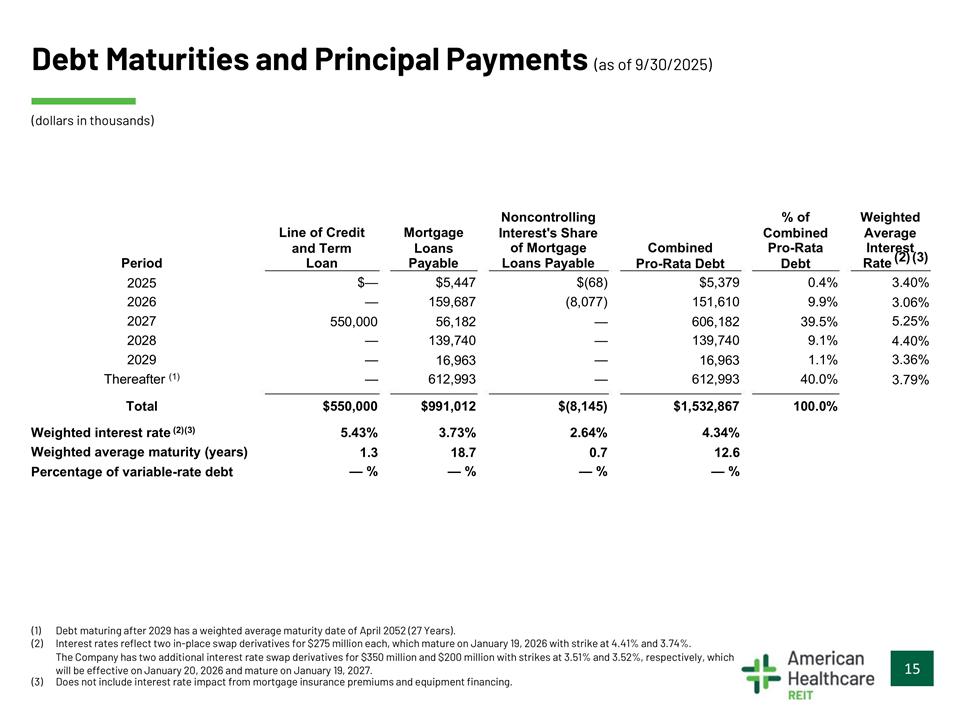
Debt Maturities and Principal Payments (as of 9/30/2025) (dollars in thousands) Noncontrolling Interest's Share of Mortgage % of Combined Pro-Rata Debt Weighted Average Interest Line of Credit and Term Loan Mortgage Loans Payable Combined Pro-Rata Debt Period 2025 Loans Payable Rate (2) (3) $— $5,447 $(68) $5,379 0.4% 3.40% 3.06% 5.25% 4.40% 3.36% 3.79% 2026 — 550,000 — 159,687 56,182 (8,077) — 151,610 606,182 139,740 16,963 9.9% 39.5% 9.1% 2027 2028 139,740 16,963 — 2029 — — 1.1% Thereafter (1) — 612,993 — 612,993 40.0% Total $550,000 $991,012 $(8,145) $1,532,867 100.0% Weighted interest rate (2) (3) 5.43% 1.3 3.73% 18.7 2.64% 0.7 4.34% 12.6 Weighted average maturity (years) Percentage of variable-rate debt — % — % — % — % (1) Debt maturing after 2029 has a weighted average maturity date of April 2052 (27 Years). (2) Interest rates reflect two in-place swap derivatives for $275 million each, which mature on January 19, 2026 with strike at 4.41% and 3.74%. The Company has two additional interest rate swap derivatives for $350 million and $200 million with strikes at 3.51% and 3.52%, respectively, which will be effective on January 20, 2026 and mature on January 19, 2027. 15 (3) Does not include interest rate impact from mortgage insurance premiums and equipment financing.
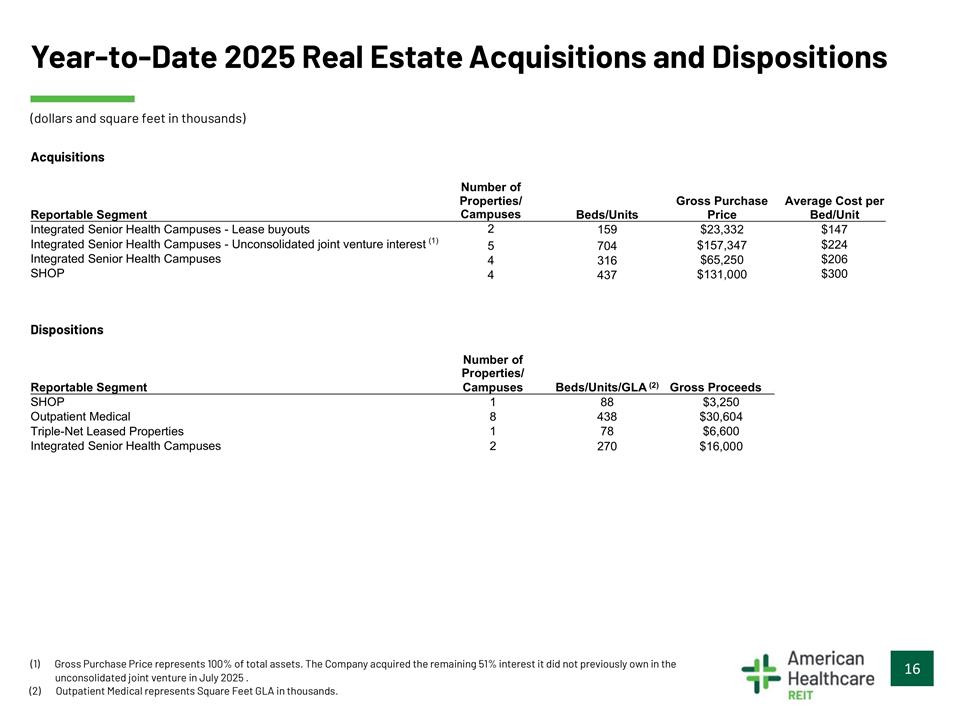
Year-to-Date 2025 Real Estate Acquisitions and Dispositions (dollars and square feet in thousands) Acquisitions Number of Properties/ Campuses 2 Gross Purchase Average Cost per Reportable Segment Integrated Senior Health Campuses - Lease buyouts Beds/Units Price Bed/Unit 159 $23,332 $147 Integrated Senior Health Campuses - Unconsolidated joint venture interest (1) 5 4 4 704 316 437 $157,347 $65,250 $131,000 $224 $206 $300 Integrated Senior Health Campuses SHOP Dispositions Number of Properties/ Reportable Segment SHOP Outpatient Medical Triple-Net Leased Properties Integrated Senior Health Campuses Campuses Beds/Units/GLA (2) Gross Proceeds 1 8 1 2 88 438 78 $3,250 $30,604 $6,600 270 $16,000 (1) Gross Purchase Price represents 100% of total assets. The Company acquired the remaining 51% interest it did not previously own in the unconsolidated joint venture in July 2025 . (2) Outpatient Medical represents Square Feet GLA in thousands. 16
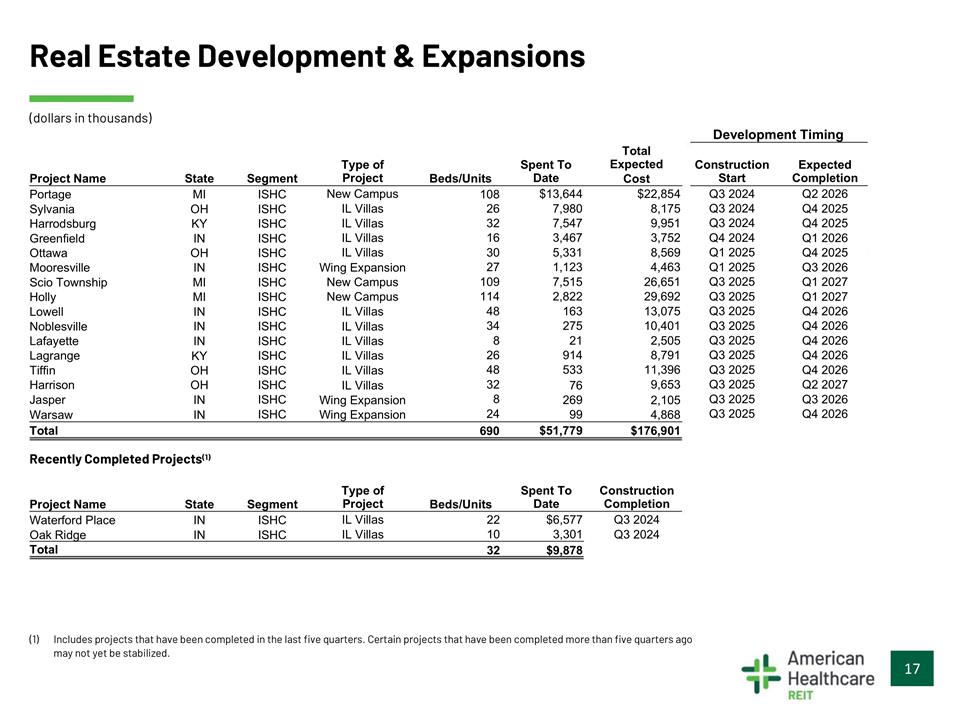
Real Estate Development & Expansions (dollars in thousands) Development Timing Total Expected Cost Type of Project New Campus IL Villas Spent To Date Construction Start Expected Completion Q2 2026 Q4 2025 Q4 2025 Q1 2026 Q4 2025 Q3 2026 Q1 2027 Q1 2027 Q4 2026 Q4 2026 Q4 2026 Q4 2026 Q4 2026 Q2 2027 Q3 2026 Q4 2026 Project Name Portage Sylvania Harrodsburg Greenfield Ottawa Mooresville Scio Township Holly State MI OH KY IN OH IN MI MI IN IN IN Segment ISHC ISHC ISHC ISHC ISHC ISHC ISHC ISHC ISHC ISHC ISHC ISHC ISHC ISHC ISHC ISHC Beds/Units 108 $13,644 $22,854 Q3 2024 Q3 2024 Q3 2024 Q4 2024 Q1 2025 Q1 2025 Q3 2025 Q3 2025 Q3 2025 Q3 2025 Q3 2025 Q3 2025 Q3 2025 Q3 2025 Q3 2025 Q3 2025 26 32 16 30 27 109 114 48 34 8 26 48 32 8 24 7,980 7,547 3,467 5,331 1,123 7,515 2,822 163 275 21 914 533 8,175 9,951 3,752 8,569 4,463 26,651 29,692 13,075 10,401 2,505 8,791 11,396 9,653 IL Villas IL Villas IL Villas Wing Expansion New Campus New Campus IL Villas Lowell Noblesville Lafayette Lagrange Tiffin Harrison Jasper IL Villas IL Villas IL Villas IL Villas KY OH OH IN IL Villas 76 269 99 $51,779 Wing Expansion Wing Expansion 2,105 4,868 $176,901 Warsaw Total IN Recently Completed Projects(1) Type of Project IL Villas IL Villas Spent To Date Construction Completion Q3 2024 Project Name Waterford Place Oak Ridge Total State IN IN Segment ISHC ISHC Beds/Units 22 10 32 $6,577 3,301 $9,878 Q3 2024 (1) Includes projects that have been completed in the last five quarters. Certain projects that have been completed more than five quarters ago may not yet be stabilized. 17 690
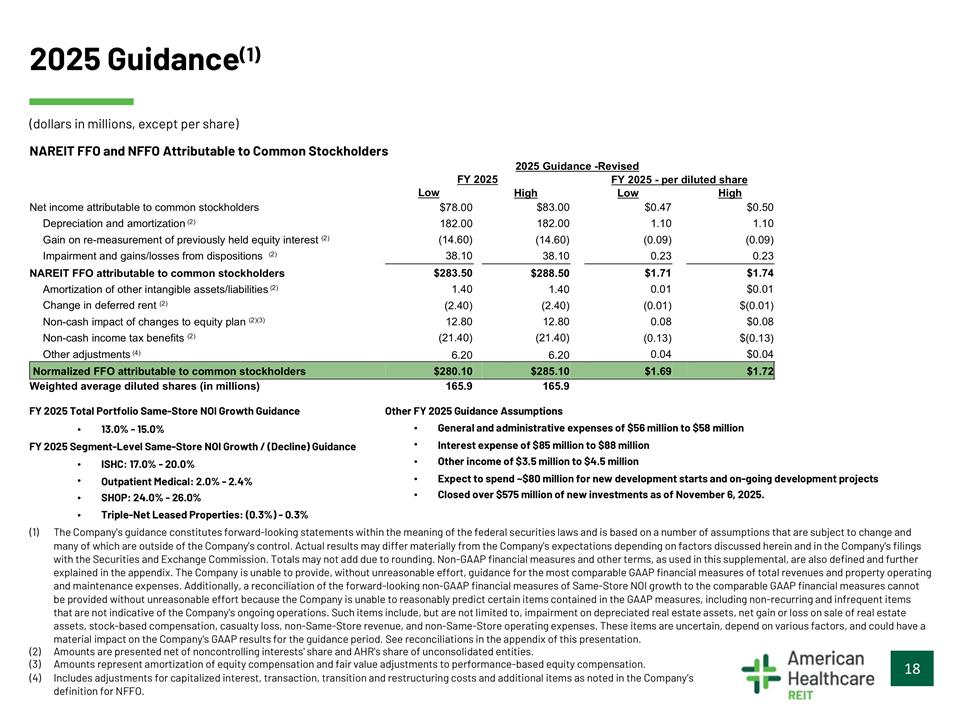
2025 Guidance(1) (dollars in millions, except per share) NAREIT FFO and NFFO Attributable to Common Stockholders 2025 Guidance -Revised FY 2025 - per diluted share High Low High FY 2025 $78.00 Low Net income attributable to common stockholders Depreciation and amortization (2) $83.00 182.00 $0.47 1.10 $0.50 1.10 182.00 (14.60) 38.10 Gain on re-measurement of previously held equity interest (2) Impairment and gains/losses from dispositions (2) NAREIT FFO attributable to common stockholders Amortization of other intangible assets/liabilities (2) Change in deferred rent (2) (14.60) 38.10 $288.50 1.40 (0.09) 0.23 (0.09) 0.23 $283.50 1.40 $1.71 0.01 $1.74 $0.01 (2.40) 12.80 (21.40) 6.20 (2.40) 12.80 (21.40) 6.20 (0.01) 0.08 $(0.01) $0.08 Non-cash impact of changes to equity plan (2)(3) Non-cash income tax benefits (2) (0.13) 0.04 $(0.13) $0.04 Other adjustments (4) Normalized FFO attributable to common stockholders Weighted average diluted shares (in millions) $280.10 165.9 $285.10 165.9 $1.69 $1.72 FY 2025 Total Portfolio Same-Store NOI Growth Guidance Other FY 2025 Guidance Assumptions 13.0% - 15.0% FY 2025 Segment-Level Same-Store NOI Growth / (Decline) Guidance • • • • • General and administrative expenses of $56 million to $58 million Interest expense of $85 million to $88 million Other income of $3.5 million to $4.5 million Expect to spend ~$80 million for new development starts and on-going development projects Closed over $575 million of new investments as of November 6, 2025. • • • • • ISHC: 17.0% - 20.0% Outpatient Medical: 2.0% - 2.4% SHOP: 24.0% - 26.0% Triple-Net Leased Properties: (0.3%) - 0.3% (1) The Company's guidance constitutes forward-looking statements within the meaning of the federal securities laws and is based on a number of assumptions that are subject to change and many of which are outside of the Company's control. Actual results may differ materially from the Company's expectations depending on factors discussed herein and in the Company's filings with the Securities and Exchange Commission. Totals may not add due to rounding. Non-GAAP financial measures and other terms, as used in this supplemental, are also defined and further explained in the appendix. The Company is unable to provide, without unreasonable effort, guidance for the most comparable GAAP financial measures of total revenues and property operating and maintenance expenses. Additionally, a reconciliation of the forward-looking non-GAAP financial measures of Same-Store NOI growth to the comparable GAAP financial measures cannot be provided without unreasonable effort because the Company is unable to reasonably predict certain items contained in the GAAP measures, including non-recurring and infrequent items that are not indicative of the Company's ongoing operations. Such items include, but are not limited to, impairment on depreciated real estate assets, net gain or loss on sale of real estate assets, stock-based compensation, casualty loss, non-Same-Store revenue, and non-Same-Store operating expenses. These items are uncertain, depend on various factors, and could have a material impact on the Company's GAAP results for the guidance period. See reconciliations in the appendix of this presentation. (2) Amounts are presented net of noncontrolling interests' share and AHR's share of unconsolidated entities. (3) Amounts represent amortization of equity compensation and fair value adjustments to performance-based equity compensation. (4) Includes adjustments for capitalized interest, transaction, transition and restructuring costs and additional items as noted in the Company’s definition for NFFO. 18
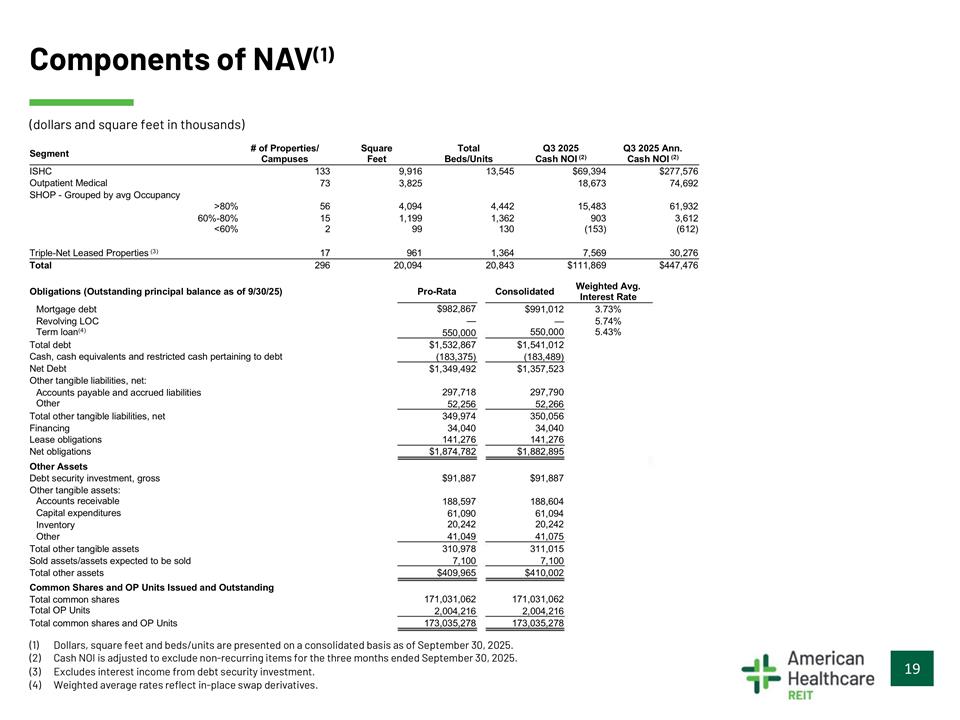
Components of NAV(1) (dollars and square feet in thousands) # of Properties/ Campuses Square Feet Total Beds/Units Q3 2025 Cash NOI (2) Q3 2025 Ann. Cash NOI (2) Segment ISHC 133 73 9,916 3,825 13,545 $69,394 18,673 $277,576 74,692 Outpatient Medical SHOP - Grouped by avg Occupancy >80% 60%-80% <60% 56 15 2 4,094 1,199 99 4,442 1,362 130 15,483 903 (153) 61,932 3,612 (612) Triple-Net Leased Properties (3) 17 961 1,364 7,569 30,276 Total 296 20,094 20,843 $111,869 $447,476 Weighted Avg. Interest Rate Obligations (Outstanding principal balance as of 9/30/25) Pro-Rata $982,867 Consolidated Mortgage debt Revolving LOC Term loan(4) $991,012 — 550,000 3.73% 5.74% 5.43% — 550,000 Total debt $1,532,867 (183,375) $1,349,492 $1,541,012 (183,489) $1,357,523 Cash, cash equivalents and restricted cash pertaining to debt Net Debt Other tangible liabilities, net: Accounts payable and accrued liabilities Other 297,718 52,256 297,790 52,266 Total other tangible liabilities, net Financing 349,974 34,040 350,056 34,040 Lease obligations Net obligations 141,276 $1,874,782 141,276 $1,882,895 Other Assets Debt security investment, gross Other tangible assets: Accounts receivable Capital expenditures Inventory $91,887 $91,887 188,597 61,090 20,242 188,604 61,094 20,242 Other 41,049 41,075 Total other tangible assets Sold assets/assets expected to be sold Total other assets 310,978 7,100 $409,965 311,015 7,100 $410,002 Common Shares and OP Units Issued and Outstanding Total common shares Total OP Units 171,031,062 2,004,216 171,031,062 2,004,216 Total common shares and OP Units 173,035,278 173,035,278 (1) Dollars, square feet and beds/units are presented on a consolidated basis as of September 30, 2025. (2) Cash NOI is adjusted to exclude non-recurring items for the three months ended September 30, 2025. (3) Excludes interest income from debt security investment. (4) Weighted average rates reflect in-place swap derivatives. 19
Third Quarter 2025 Supplemental Appendix Non-GAAP Reconciliations and Defined Terms 20
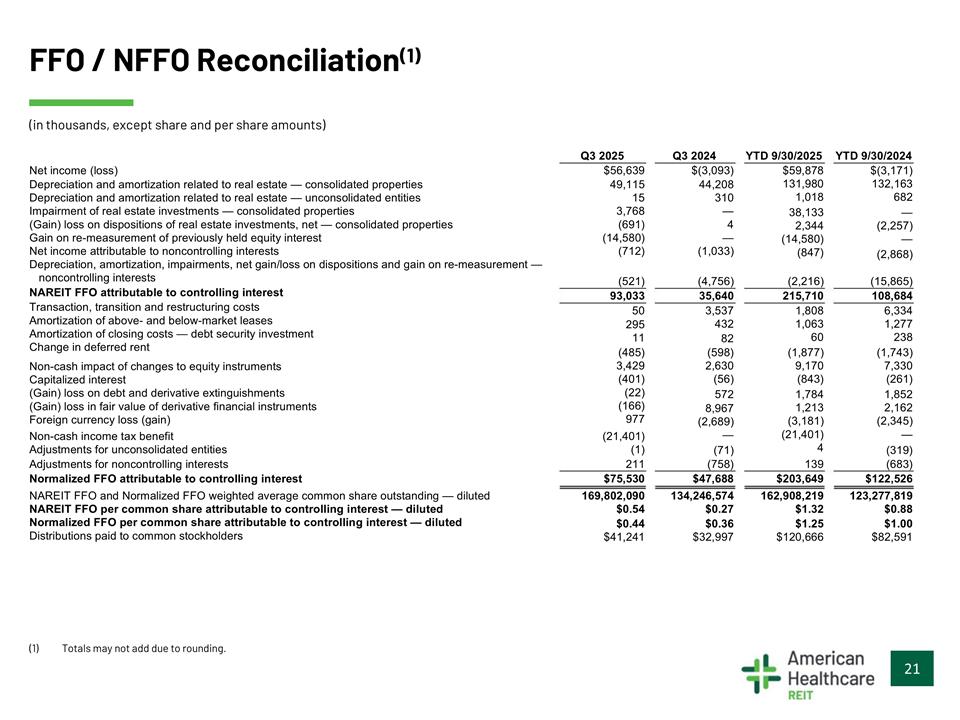
FFO / NFFO Reconciliation(1) (in thousands, except share and per share amounts) Q3 2025 $56,639 Q3 2024 $(3,093) YTD 9/30/2025 YTD 9/30/2024 Net income (loss) $59,878 131,980 1,018 $(3,171) 132,163 682 Depreciation and amortization related to real estate — consolidated properties Depreciation and amortization related to real estate — unconsolidated entities Impairment of real estate investments — consolidated properties (Gain) loss on dispositions of real estate investments, net — consolidated properties Gain on re-measurement of previously held equity interest Net income attributable to noncontrolling interests Depreciation, amortization, impairments, net gain/loss on dispositions and gain on re-measurement — noncontrolling interests NAREIT FFO attributable to controlling interest Transaction, transition and restructuring costs Amortization of above- and below-market leases Amortization of closing costs — debt security investment Change in deferred rent 49,115 15 3,768 (691) (14,580) (712) 44,208 310 — 4 — (1,033) 38,133 2,344 (14,580) (847) — (2,257) — (2,868) (521) 93,033 50 (4,756) 35,640 3,537 432 (2,216) 215,710 1,808 1,063 60 (15,865) 108,684 6,334 1,277 238 295 11 82 (485) 3,429 (401) (22) (166) 977 (598) 2,630 (56) (1,877) 9,170 (843) (1,743) 7,330 (261) Non-cash impact of changes to equity instruments Capitalized interest (Gain) loss on debt and derivative extinguishments (Gain) loss in fair value of derivative financial instruments Foreign currency loss (gain) 572 1,784 1,213 (3,181) (21,401) 4 1,852 2,162 (2,345) — 8,967 (2,689) — Non-cash income tax benefit Adjustments for unconsolidated entities (21,401) (1) (71) (319) Adjustments for noncontrolling interests Normalized FFO attributable to controlling interest 211 $75,530 (758) $47,688 139 $203,649 (683) $122,526 NAREIT FFO and Normalized FFO weighted average common share outstanding — diluted NAREIT FFO per common share attributable to controlling interest — diluted Normalized FFO per common share attributable to controlling interest — diluted Distributions paid to common stockholders 169,802,090 $0.54 134,246,574 $0.27 162,908,219 $1.32 123,277,819 $0.88 $0.44 $41,241 $0.36 $32,997 $1.25 $120,666 $1.00 $82,591 (1) Totals may not add due to rounding. 21
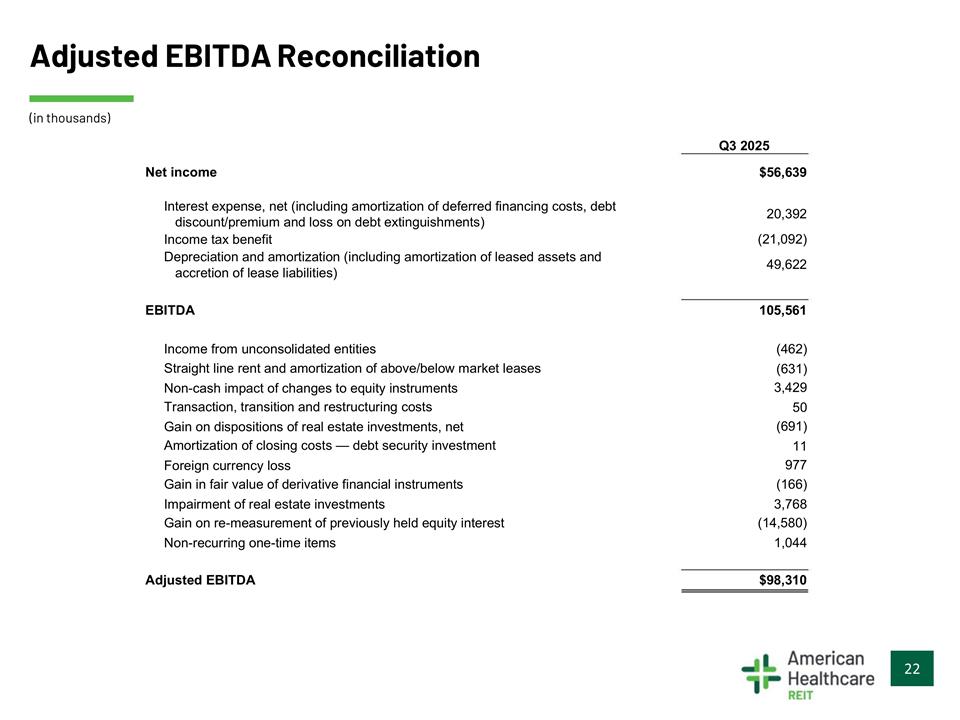
Adjusted EBITDA Reconciliation (in thousands) Q3 2025 $56,639 Net income Interest expense, net (including amortization of deferred financing costs, debt discount/premium and loss on debt extinguishments) Income tax benefit Depreciation and amortization (including amortization of leased assets and accretion of lease liabilities) 20,392 (21,092) 49,622 EBITDA 105,561 Income from unconsolidated entities (462) (631) 3,429 50 Straight line rent and amortization of above/below market leases Non-cash impact of changes to equity instruments Transaction, transition and restructuring costs Gain on dispositions of real estate investments, net Amortization of closing costs — debt security investment Foreign currency loss (691) 11 977 Gain in fair value of derivative financial instruments Impairment of real estate investments (166) 3,768 (14,580) 1,044 Gain on re-measurement of previously held equity interest Non-recurring one-time items Adjusted EBITDA $98,310 22
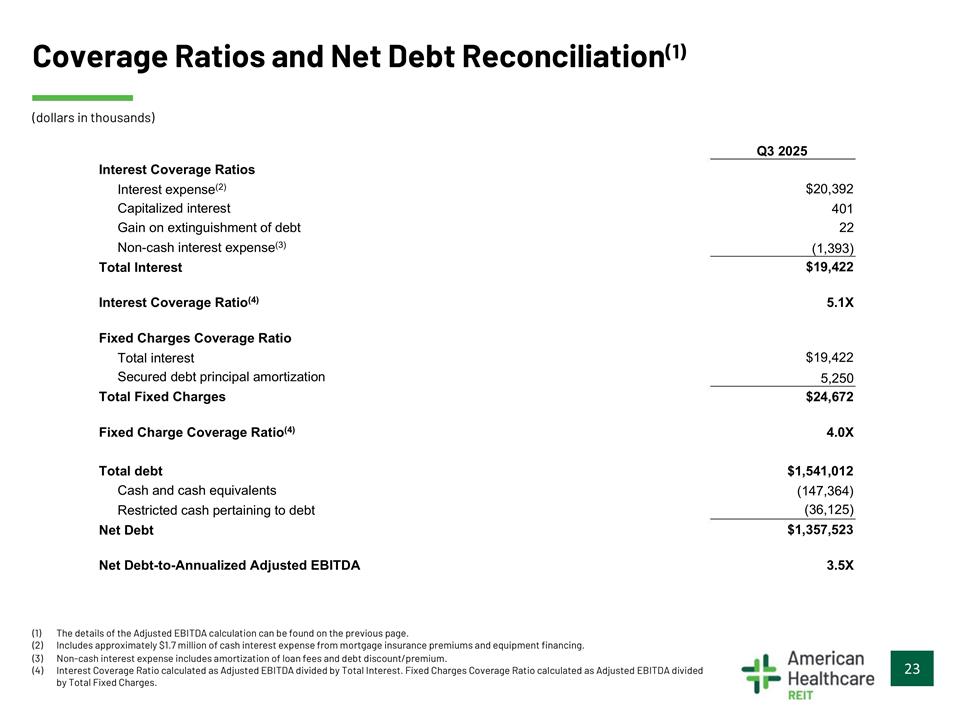
Coverage Ratios and Net Debt Reconciliation(1) (dollars in thousands) Q3 2025 Interest Coverage Ratios Interest expense(2) $20,392 401 Capitalized interest Gain on extinguishment of debt Non-cash interest expense(3) Total Interest 22 (1,393) $19,422 Interest Coverage Ratio(4) 5.1X Fixed Charges Coverage Ratio Total interest $19,422 Secured debt principal amortization Total Fixed Charges 5,250 $24,672 Fixed Charge Coverage Ratio(4) 4.0X Total debt $1,541,012 (147,364) (36,125) Cash and cash equivalents Restricted cash pertaining to debt Net Debt $1,357,523 Net Debt-to-Annualized Adjusted EBITDA 3.5X (1) The details of the Adjusted EBITDA calculation can be found on the previous page. (2) Includes approximately $1.7 million of cash interest expense from mortgage insurance premiums and equipment financing. (3) Non-cash interest expense includes amortization of loan fees and debt discount/premium. (4) Interest Coverage Ratio calculated as Adjusted EBITDA divided by Total Interest. Fixed Charges Coverage Ratio calculated as Adjusted EBITDA divided by Total Fixed Charges. 23
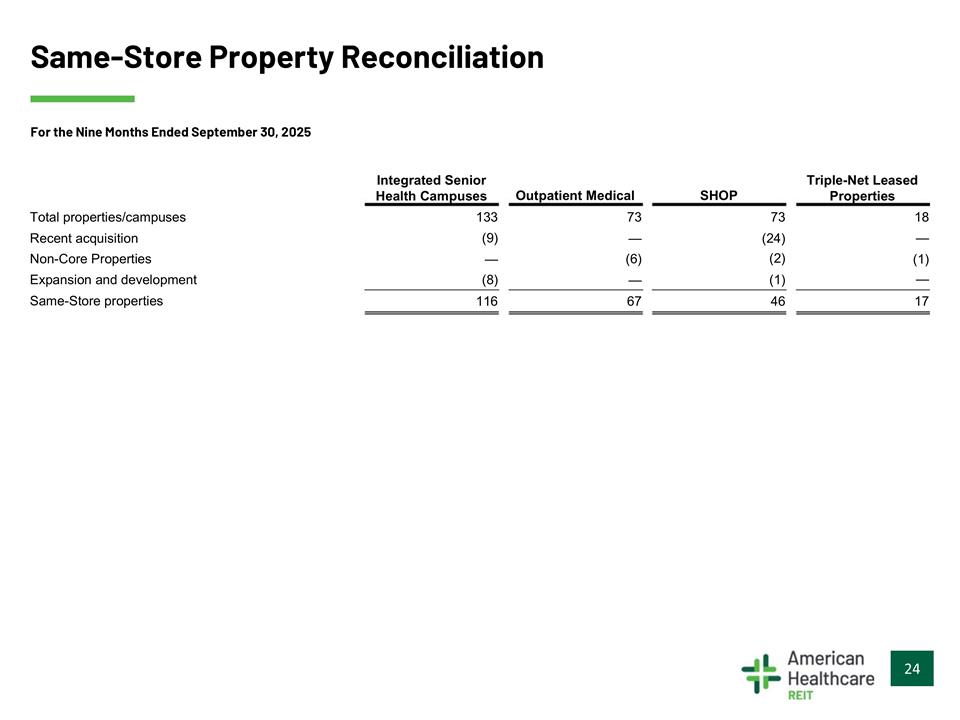
Same-Store Property Reconciliation For the Nine Months Ended September 30, 2025 Integrated Senior Health Campuses Triple-Net Leased Properties Outpatient Medical SHOP Total properties/campuses Recent acquisition 133 73 — 73 (24) (2) 18 (9) — — (1) — Non-Core Properties (6) — Expansion and development Same-Store properties (8) (1) 116 67 46 17 24
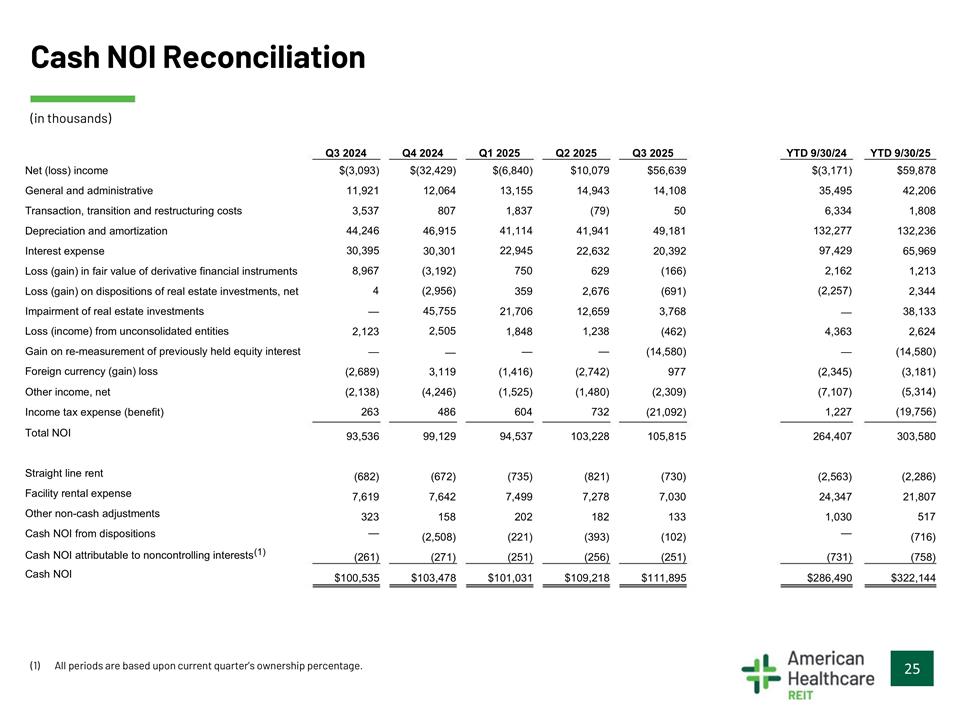
Cash NOI Reconciliation (in thousands) Q3 2024 Q4 2024 Q1 2025 $(6,840) Q2 2025 $10,079 Q3 2025 $56,639 YTD 9/30/24 YTD 9/30/25 Net (loss) income $(3,093) $(32,429) $(3,171) $59,878 General and administrative 11,921 3,537 44,246 30,395 8,967 4 12,064 807 13,155 1,837 41,114 22,945 750 14,943 (79) 14,108 50 35,495 6,334 132,277 97,429 2,162 (2,257) — 42,206 1,808 Transaction, transition and restructuring costs Depreciation and amortization 46,915 30,301 (3,192) (2,956) 45,755 2,505 — 41,941 22,632 629 49,181 20,392 (166) 132,236 65,969 1,213 Interest expense Loss (gain) in fair value of derivative financial instruments Loss (gain) on dispositions of real estate investments, net Impairment of real estate investments Loss (income) from unconsolidated entities Gain on re-measurement of previously held equity interest Foreign currency (gain) loss 359 2,676 12,659 1,238 — (691) 2,344 — 21,706 1,848 — 3,768 (462) 38,133 2,624 2,123 — 4,363 — (14,580) 977 (14,580) (3,181) (5,314) (19,756) (2,689) (2,138) 263 3,119 (4,246) 486 (1,416) (1,525) 604 (2,742) (1,480) 732 (2,345) (7,107) 1,227 Other income, net (2,309) (21,092) Income tax expense (benefit) Total NOI 93,536 99,129 94,537 103,228 105,815 264,407 303,580 Straight line rent (682) 7,619 (672) 7,642 (735) 7,499 (821) 7,278 (730) 7,030 (2,563) 24,347 (2,286) 21,807 517 Facility rental expense Other non-cash adjustments 323 — 158 202 182 133 1,030 — Cash NOI from dispositions (1) (2,508) (271) (221) (393) (102) (716) Cash NOI attributable to noncontrolling interests Cash NOI (261) (251) (256) (251) (731) (758) $100,535 $103,478 $101,031 $109,218 $111,895 $286,490 $322,144 (1) All periods are based upon current quarter’s ownership percentage. 25
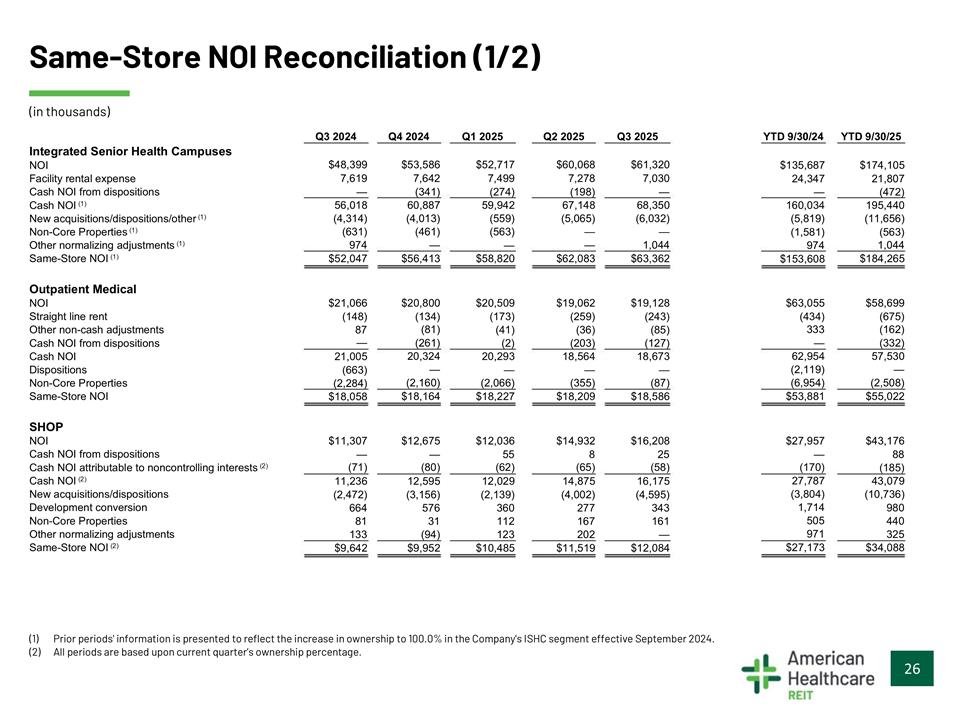
Same-Store NOI Reconciliation (1/2) (in thousands) Q3 2024 $48,399 Q4 2024 $53,586 Q1 2025 $52,717 Q2 2025 $60,068 Q3 2025 $61,320 YTD 9/30/24 YTD 9/30/25 Integrated Senior Health Campuses NOI Facility rental expense Cash NOI from dispositions Cash NOI (1) New acquisitions/dispositions/other (1) Non-Core Properties (1) Other normalizing adjustments (1) Same-Store NOI (1) $135,687 24,347 — 160,034 (5,819) (1,581) 974 $174,105 21,807 (472) 195,440 (11,656) (563) 7,619 — 56,018 (4,314) (631) 7,642 (341) 60,887 (4,013) (461) 7,499 (274) 59,942 (559) (563) — $58,820 7,278 (198) 67,148 (5,065) — 7,030 — 68,350 (6,032) — 974 $52,047 — $56,413 — $62,083 1,044 $63,362 1,044 $184,265 $153,608 Outpatient Medical NOI Straight line rent Other non-cash adjustments Cash NOI from dispositions Cash NOI Dispositions Non-Core Properties Same-Store NOI $21,066 (148) 87 $20,800 (134) $20,509 (173) (41) (2) 20,293 — $19,062 (259) (36) (203) 18,564 — $19,128 (243) (85) (127) 18,673 — $63,055 (434) $58,699 (675) (81) (261) 20,324 — (2,160) $18,164 333 — 62,954 (2,119) (6,954) $53,881 (162) (332) 57,530 — (2,508) $55,022 — 21,005 (663) (2,284) $18,058 (2,066) $18,227 (355) $18,209 (87) $18,586 SHOP NOI $11,307 — $12,675 — $12,036 55 $14,932 8 $16,208 25 $27,957 — $43,176 88 (185) 43,079 (10,736) 980 440 325 $34,088 Cash NOI from dispositions Cash NOI attributable to noncontrolling interests (2) Cash NOI (2) New acquisitions/dispositions Development conversion Non-Core Properties Other normalizing adjustments Same-Store NOI (2) (71) (80) (62) (65) (58) (170) 27,787 (3,804) 1,714 505 11,236 (2,472) 664 81 133 $9,642 12,595 (3,156) 576 31 (94) $9,952 12,029 (2,139) 360 112 123 $10,485 14,875 (4,002) 277 167 202 $11,519 16,175 (4,595) 343 161 — $12,084 971 $27,173 (1) Prior periods' information is presented to reflect the increase in ownership to 100.0% in the Company's ISHC segment effective September 2024. (2) All periods are based upon current quarter’s ownership percentage. 26
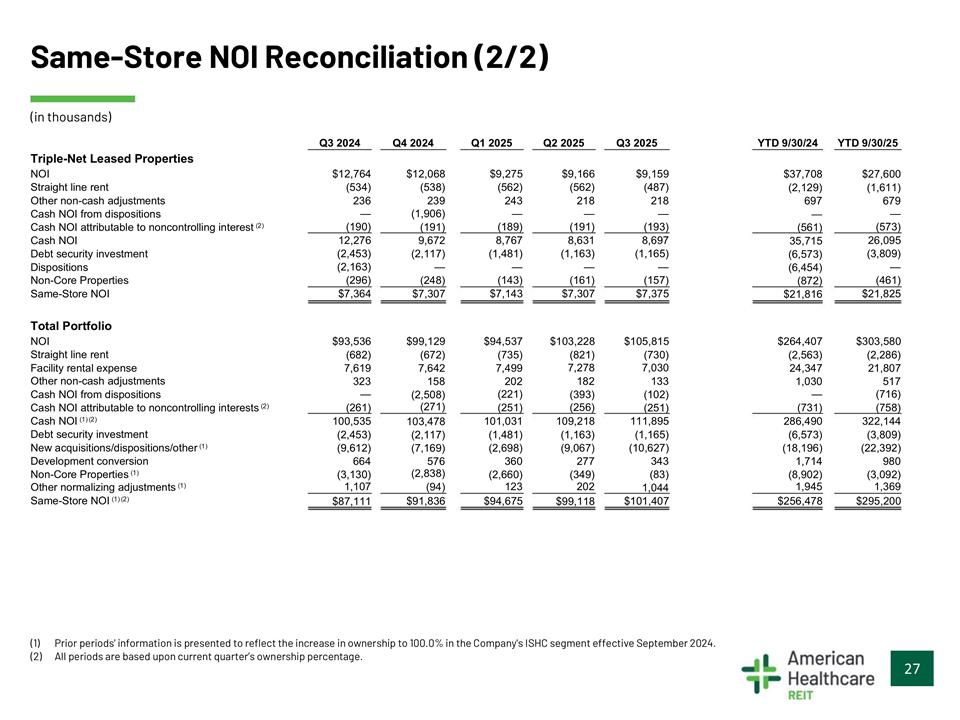
Same-Store NOI Reconciliation (2/2) (in thousands) Q3 2024 $12,764 Q4 2024 $12,068 Q1 2025 $9,275 Q2 2025 $9,166 Q3 2025 $9,159 YTD 9/30/24 YTD 9/30/25 Triple-Net Leased Properties NOI Straight line rent Other non-cash adjustments Cash NOI from dispositions Cash NOI attributable to noncontrolling interest (2) Cash NOI Debt security investment Dispositions $37,708 (2,129) 697 — (561) 35,715 (6,573) (6,454) (872) $27,600 (1,611) 679 (534) 236 (538) 239 (562) 243 (562) 218 (487) 218 — (1,906) (191) 9,672 (2,117) — — — — — (190) 12,276 (2,453) (2,163) (296) $7,364 (189) 8,767 (1,481) — (143) $7,143 (191) 8,631 (1,163) — (161) $7,307 (193) 8,697 (1,165) — (157) $7,375 (573) 26,095 (3,809) — (461) $21,825 Non-Core Properties Same-Store NOI (248) $7,307 $21,816 Total Portfolio NOI $93,536 (682) 7,619 323 $99,129 (672) 7,642 158 (2,508) (271) 103,478 (2,117) (7,169) 576 (2,838) (94) $94,537 (735) 7,499 202 $103,228 (821) $105,815 (730) $264,407 (2,563) 24,347 1,030 $303,580 (2,286) 21,807 517 Straight line rent Facility rental expense 7,278 182 (393) 7,030 133 (102) (251) 111,895 (1,165) (10,627) 343 (83) 1,044 Other non-cash adjustments Cash NOI from dispositions Cash NOI attributable to noncontrolling interests (2) Cash NOI (1) (2) Debt security investment New acquisitions/dispositions/other (1) Development conversion Non-Core Properties (1) — (261) (221) (251) — (731) (716) (758) (256) 100,535 (2,453) (9,612) 664 (3,130) 1,107 $87,111 101,031 (1,481) (2,698) 360 (2,660) 123 109,218 (1,163) (9,067) 277 (349) 202 $99,118 286,490 (6,573) (18,196) 1,714 (8,902) 1,945 322,144 (3,809) (22,392) 980 (3,092) 1,369 Other normalizing adjustments (1) Same-Store NOI (1) (2) $91,836 $94,675 $101,407 $256,478 $295,200 (1) Prior periods' information is presented to reflect the increase in ownership to 100.0% in the Company's ISHC segment effective September 2024. (2) All periods are based upon current quarter’s ownership percentage. 27
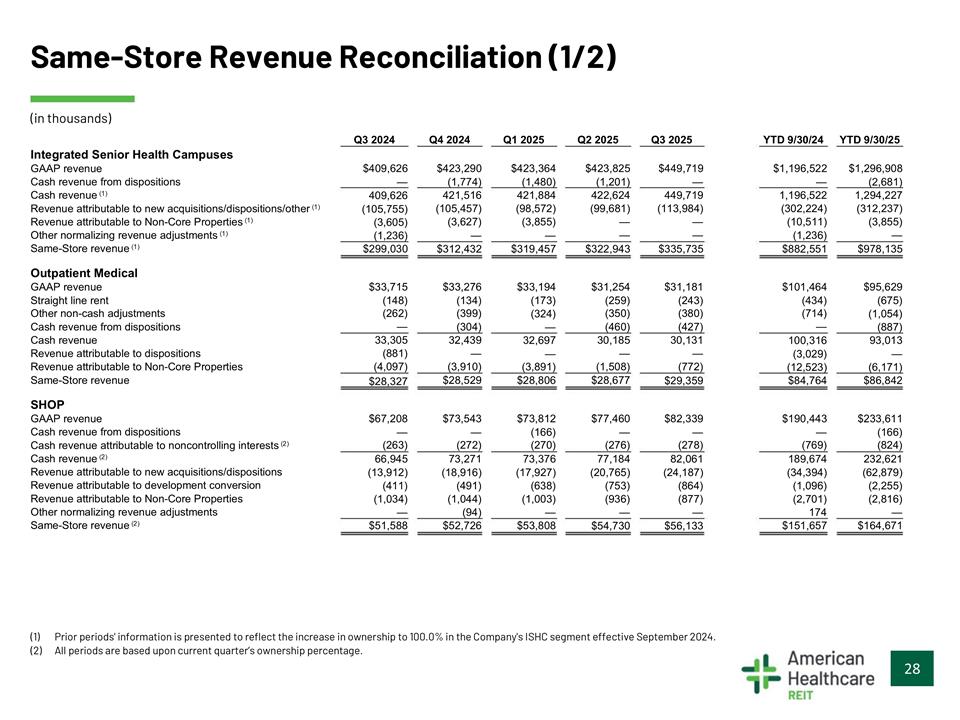
Same-Store Revenue Reconciliation (1/2) (in thousands) Q3 2024 Q4 2024 Q1 2025 Q2 2025 Q3 2025 YTD 9/30/24 YTD 9/30/25 Integrated Senior Health Campuses GAAP revenue Cash revenue from dispositions Cash revenue (1) Revenue attributable to new acquisitions/dispositions/other (1) Revenue attributable to Non-Core Properties (1) Other normalizing revenue adjustments (1) Same-Store revenue (1) $409,626 — $423,290 (1,774) 421,516 (105,457) (3,627) — $423,364 (1,480) 421,884 (98,572) (3,855) — $423,825 (1,201) 422,624 (99,681) — $449,719 — 449,719 (113,984) — $1,196,522 — 1,196,522 (302,224) (10,511) (1,236) $1,296,908 (2,681) 1,294,227 (312,237) (3,855) 409,626 (105,755) (3,605) (1,236) $299,030 — — — $312,432 $319,457 $322,943 $335,735 $882,551 $978,135 Outpatient Medical GAAP revenue Straight line rent $33,715 (148) $33,276 (134) $33,194 (173) (324) — 32,697 — $31,254 (259) $31,181 (243) $101,464 (434) $95,629 (675) (1,054) (887) 93,013 — (6,171) $86,842 Other non-cash adjustments Cash revenue from dispositions Cash revenue Revenue attributable to dispositions Revenue attributable to Non-Core Properties Same-Store revenue (262) (399) (304) 32,439 — (3,910) $28,529 (350) (460) 30,185 — (1,508) $28,677 (380) (427) 30,131 — (772) (714) — 33,305 (881) (4,097) $28,327 — 100,316 (3,029) (12,523) $84,764 (3,891) $28,806 $29,359 SHOP GAAP revenue $67,208 — $73,543 — $73,812 (166) $77,460 — $82,339 — $190,443 — $233,611 (166) Cash revenue from dispositions Cash revenue attributable to noncontrolling interests (2) Cash revenue (2) Revenue attributable to new acquisitions/dispositions Revenue attributable to development conversion Revenue attributable to Non-Core Properties Other normalizing revenue adjustments Same-Store revenue (2) (263) (272) (270) (276) (278) (769) (824) 66,945 (13,912) (411) (1,034) — 73,271 (18,916) (491) (1,044) (94) 73,376 (17,927) (638) (1,003) — 77,184 (20,765) (753) (936) — $54,730 82,061 (24,187) (864) (877) — $56,133 189,674 (34,394) (1,096) (2,701) 174 232,621 (62,879) (2,255) (2,816) — $51,588 $52,726 $53,808 $151,657 $164,671 (1) Prior periods' information is presented to reflect the increase in ownership to 100.0% in the Company's ISHC segment effective September 2024. (2) All periods are based upon current quarter’s ownership percentage. 28
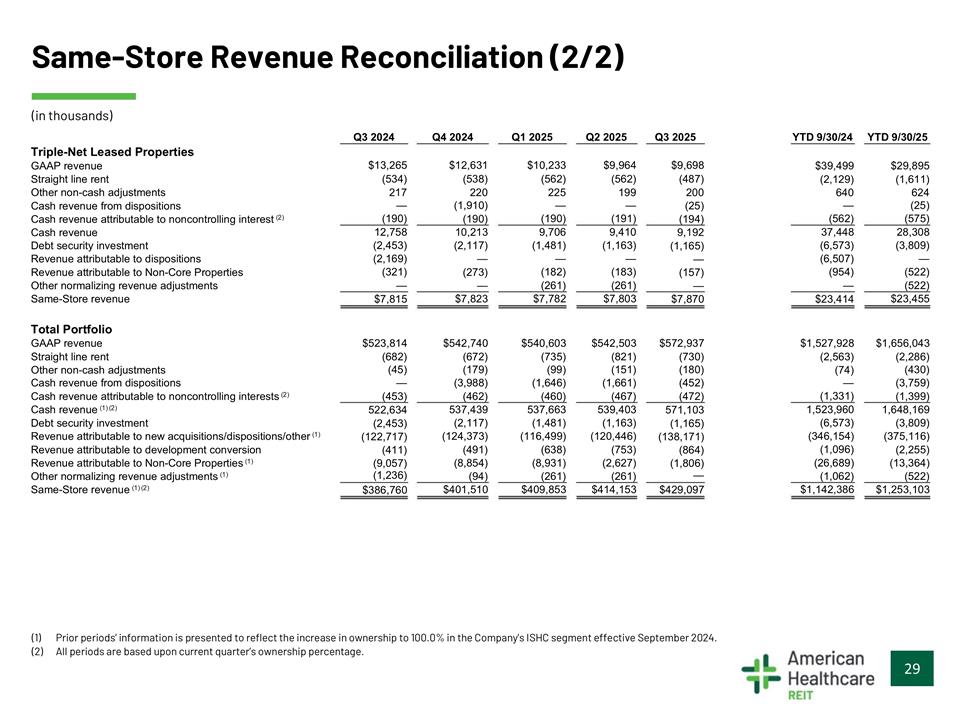
Same-Store Revenue Reconciliation (2/2) (in thousands) Q3 2024 $13,265 Q4 2024 $12,631 Q1 2025 $10,233 Q2 2025 $9,964 Q3 2025 $9,698 YTD 9/30/24 YTD 9/30/25 Triple-Net Leased Properties GAAP revenue Straight line rent Other non-cash adjustments Cash revenue from dispositions Cash revenue attributable to noncontrolling interest (2) Cash revenue $39,499 (2,129) 640 $29,895 (1,611) 624 (534) 217 (538) 220 (562) 225 (562) 199 (487) 200 (25) (194) 9,192 (1,165) — (157) — — (1,910) (190) 10,213 (2,117) — (273) — $7,823 — — — (25) (190) 12,758 (2,453) (2,169) (321) — (190) 9,706 (1,481) — (182) (261) $7,782 (191) 9,410 (1,163) — (183) (261) $7,803 (562) 37,448 (6,573) (6,507) (954) — (575) 28,308 (3,809) — (522) (522) $23,455 Debt security investment Revenue attributable to dispositions Revenue attributable to Non-Core Properties Other normalizing revenue adjustments Same-Store revenue $7,815 $7,870 $23,414 Total Portfolio GAAP revenue Straight line rent Other non-cash adjustments $523,814 (682) $542,740 (672) $540,603 (735) $542,503 (821) $572,937 (730) $1,527,928 (2,563) (74) $1,656,043 (2,286) (45) (179) (99) (151) (180) (430) Cash revenue from dispositions Cash revenue attributable to noncontrolling interests (2) Cash revenue (1) (2) — (453) (3,988) (462) 537,439 (2,117) (124,373) (491) (8,854) (94) $401,510 (1,646) (460) 537,663 (1,481) (116,499) (638) (8,931) (261) $409,853 (1,661) (467) 539,403 (1,163) (120,446) (753) (2,627) (261) $414,153 (452) (472) — (3,759) (1,399) 1,648,169 (3,809) (375,116) (2,255) (13,364) (522) $1,253,103 (1,331) 1,523,960 (6,573) (346,154) (1,096) (26,689) (1,062) $1,142,386 522,634 (2,453) (122,717) (411) (9,057) (1,236) $386,760 571,103 (1,165) (138,171) (864) (1,806) — Debt security investment Revenue attributable to new acquisitions/dispositions/other (1) Revenue attributable to development conversion Revenue attributable to Non-Core Properties (1) Other normalizing revenue adjustments (1) Same-Store revenue (1) (2) $429,097 (1) Prior periods' information is presented to reflect the increase in ownership to 100.0% in the Company's ISHC segment effective September 2024. (2) All periods are based upon current quarter’s ownership percentage. 29
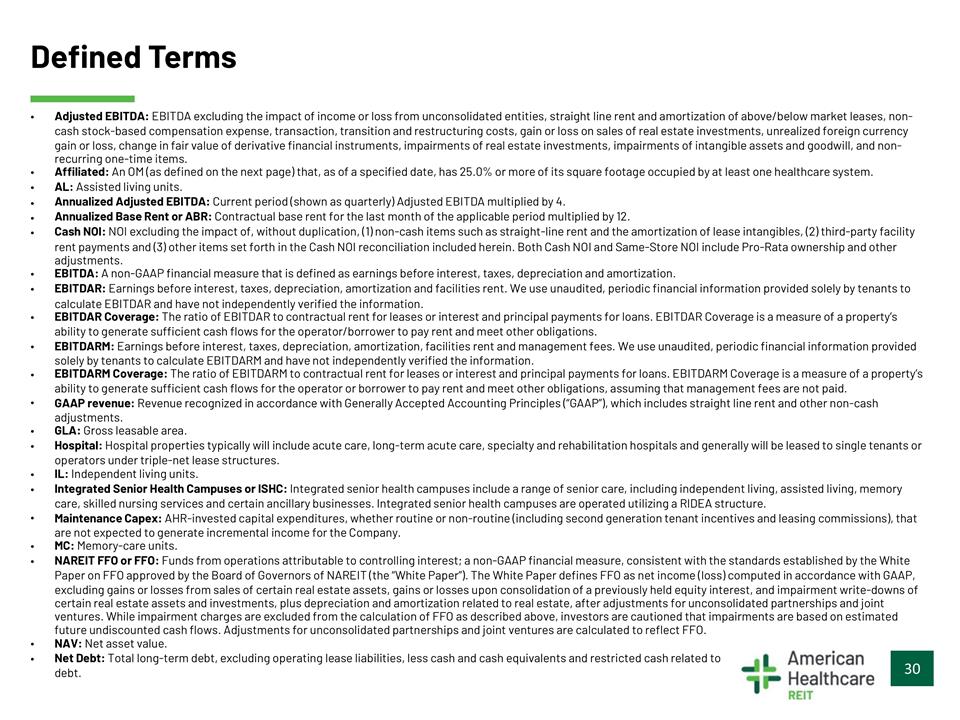
Defined Terms • Adjusted EBITDA: EBITDA excluding the impact of income or loss from unconsolidated entities, straight line rent and amortization of above/below market leases, non- cash stock-based compensation expense, transaction, transition and restructuring costs, gain or loss on sales of real estate investments, unrealized foreign currency gain or loss, change in fair value of derivative financial instruments, impairments of real estate investments, impairments of intangible assets and goodwill, and non- recurring one-time items. • • • • • Affiliated: An OM (as defined on the next page) that, as of a specified date, has 25.0% or more of its square footage occupied by at least one healthcare system. AL: Assisted living units. Annualized Adjusted EBITDA: Current period (shown as quarterly) Adjusted EBITDA multiplied by 4. Annualized Base Rent or ABR: Contractual base rent for the last month of the applicable period multiplied by 12. Cash NOI: NOI excluding the impact of, without duplication, (1) non-cash items such as straight-line rent and the amortization of lease intangibles, (2) third-party facility rent payments and (3) other items set forth in the Cash NOI reconciliation included herein. Both Cash NOI and Same-Store NOI include Pro-Rata ownership and other adjustments. • • EBITDA: A non-GAAP financial measure that is defined as earnings before interest, taxes, depreciation and amortization. EBITDAR: Earnings before interest, taxes, depreciation, amortization and facilities rent. We use unaudited, periodic financial information provided solely by tenants to calculate EBITDAR and have not independently verified the information. • • • • EBITDAR Coverage: The ratio of EBITDAR to contractual rent for leases or interest and principal payments for loans. EBITDAR Coverage is a measure of a property’s ability to generate sufficient cash flows for the operator/borrower to pay rent and meet other obligations. EBITDARM: Earnings before interest, taxes, depreciation, amortization, facilities rent and management fees. We use unaudited, periodic financial information provided solely by tenants to calculate EBITDARM and have not independently verified the information. EBITDARM Coverage: The ratio of EBITDARM to contractual rent for leases or interest and principal payments for loans. EBITDARM Coverage is a measure of a property’s ability to generate sufficient cash flows for the operator or borrower to pay rent and meet other obligations, assuming that management fees are not paid. GAAP revenue: Revenue recognized in accordance with Generally Accepted Accounting Principles (“GAAP”), which includes straight line rent and other non-cash adjustments. • • GLA: Gross leasable area. Hospital: Hospital properties typically will include acute care, long-term acute care, specialty and rehabilitation hospitals and generally will be leased to single tenants or operators under triple-net lease structures. • • IL: Independent living units. Integrated Senior Health Campuses or ISHC: Integrated senior health campuses include a range of senior care, including independent living, assisted living, memory care, skilled nursing services and certain ancillary businesses. Integrated senior health campuses are operated utilizing a RIDEA structure. Maintenance Capex: AHR-invested capital expenditures, whether routine or non-routine (including second generation tenant incentives and leasing commissions), that are not expected to generate incremental income for the Company. • • • MC: Memory-care units. NAREIT FFO or FFO: Funds from operations attributable to controlling interest; a non-GAAP financial measure, consistent with the standards established by the White Paper on FFO approved by the Board of Governors of NAREIT (the “White Paper”). The White Paper defines FFO as net income (loss) computed in accordance with GAAP, excluding gains or losses from sales of certain real estate assets, gains or losses upon consolidation of a previously held equity interest, and impairment write-downs of certain real estate assets and investments, plus depreciation and amortization related to real estate, after adjustments for unconsolidated partnerships and joint ventures. While impairment charges are excluded from the calculation of FFO as described above, investors are cautioned that impairments are based on estimated future undiscounted cash flows. Adjustments for unconsolidated partnerships and joint ventures are calculated to reflect FFO. NAV: Net asset value. • • Net Debt: Total long-term debt, excluding operating lease liabilities, less cash and cash equivalents and restricted cash related to debt. 30
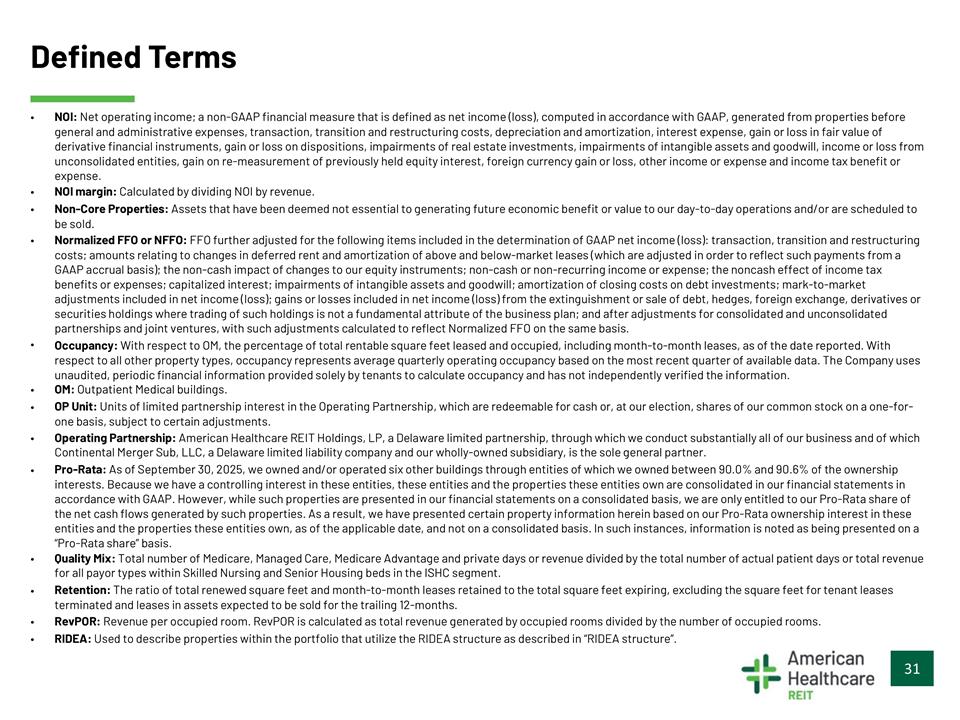
Defined Terms • NOI: Net operating income; a non-GAAP financial measure that is defined as net income (loss), computed in accordance with GAAP, generated from properties before general and administrative expenses, transaction, transition and restructuring costs, depreciation and amortization, interest expense, gain or loss in fair value of derivative financial instruments, gain or loss on dispositions, impairments of real estate investments, impairments of intangible assets and goodwill, income or loss from unconsolidated entities, gain on re-measurement of previously held equity interest, foreign currency gain or loss, other income or expense and income tax benefit or expense. • • NOI margin: Calculated by dividing NOI by revenue. Non-Core Properties: Assets that have been deemed not essential to generating future economic benefit or value to our day-to-day operations and/or are scheduled to be sold. • • Normalized FFO or NFFO: FFO further adjusted for the following items included in the determination of GAAP net income (loss): transaction, transition and restructuring costs; amounts relating to changes in deferred rent and amortization of above and below-market leases (which are adjusted in order to reflect such payments from a GAAP accrual basis); the non-cash impact of changes to our equity instruments; non-cash or non-recurring income or expense; the noncash effect of income tax benefits or expenses; capitalized interest; impairments of intangible assets and goodwill; amortization of closing costs on debt investments; mark-to-market adjustments included in net income (loss); gains or losses included in net income (loss) from the extinguishment or sale of debt, hedges, foreign exchange, derivatives or securities holdings where trading of such holdings is not a fundamental attribute of the business plan; and after adjustments for consolidated and unconsolidated partnerships and joint ventures, with such adjustments calculated to reflect Normalized FFO on the same basis. Occupancy: With respect to OM, the percentage of total rentable square feet leased and occupied, including month-to-month leases, as of the date reported. With respect to all other property types, occupancy represents average quarterly operating occupancy based on the most recent quarter of available data. The Company uses unaudited, periodic financial information provided solely by tenants to calculate occupancy and has not independently verified the information. • • OM: Outpatient Medical buildings. OP Unit: Units of limited partnership interest in the Operating Partnership, which are redeemable for cash or, at our election, shares of our common stock on a one-for- one basis, subject to certain adjustments. • • Operating Partnership: American Healthcare REIT Holdings, LP, a Delaware limited partnership, through which we conduct substantially all of our business and of which Continental Merger Sub, LLC, a Delaware limited liability company and our wholly-owned subsidiary, is the sole general partner. Pro-Rata: As of September 30, 2025, we owned and/or operated six other buildings through entities of which we owned between 90.0% and 90.6% of the ownership interests. Because we have a controlling interest in these entities, these entities and the properties these entities own are consolidated in our financial statements in accordance with GAAP. However, while such properties are presented in our financial statements on a consolidated basis, we are only entitled to our Pro-Rata share of the net cash flows generated by such properties. As a result, we have presented certain property information herein based on our Pro-Rata ownership interest in these entities and the properties these entities own, as of the applicable date, and not on a consolidated basis. In such instances, information is noted as being presented on a “Pro-Rata share” basis. • • Quality Mix: Total number of Medicare, Managed Care, Medicare Advantage and private days or revenue divided by the total number of actual patient days or total revenue for all payor types within Skilled Nursing and Senior Housing beds in the ISHC segment. Retention: The ratio of total renewed square feet and month-to-month leases retained to the total square feet expiring, excluding the square feet for tenant leases terminated and leases in assets expected to be sold for the trailing 12-months. • • RevPOR: Revenue per occupied room. RevPOR is calculated as total revenue generated by occupied rooms divided by the number of occupied rooms. RIDEA: Used to describe properties within the portfolio that utilize the RIDEA structure as described in “RIDEA structure”. 31
Defined Terms • RIDEA structure: A structure permitted by the REIT Investment Diversification and Empowerment Act of 2007, pursuant to which we lease certain healthcare real estate properties to a wholly-owned taxable REIT subsidiary (TRS), which in turn contracts with an eligible independent contractor (EIK) to operate such properties for a fee. Under this structure, the EIK receives management fees, and the TRS receives revenue from the operation of the healthcare real estate properties and retains, as profit, any revenue remaining after payment of expenses (including intercompany rent paid to us and any taxes at the TRS level) necessary to operate the property. Through the RIDEA structure, in addition to receiving rental revenue from the TRS, we retain any after-tax profit from the operation of the healthcare real estate properties and benefit from any improved operational performance while bearing the risk of any decline in operating performance at the properties. • Same-Store or SS: Properties owned or consolidated the full year in both comparison years and that are not otherwise excluded. Properties are excluded from Same- Store if they are: (1) sold, classified as held for sale or properties whose operations were classified as discontinued operations in accordance with GAAP; (2) impacted by materially disruptive events, such as flood or fire for an extensive period of time; or (3) scheduled to undergo or currently undergoing major expansions/renovations or business model transitions or have transitioned business models after the start of the prior comparison period. • • Same-Store NOI or SS NOI: Cash NOI for our Same-Store properties. Same-Store NOI is used to evaluate the operating performance of our properties using a consistent population which controls for changes in the composition of our portfolio. Both Cash NOI and Same-Store NOI include ownership and other adjustments. Senior Housing-Leased: Senior housing facilities cater to different segments of the elderly population based upon their personal needs and include assisted living, memory care and independent living. Residents of assisted living facilities typically require limited medical care and need assistance with eating, bathing, dressing and/or medication management, and those services can be provided by staff at the facility. Resident programs offered at such facilities may include transportation, social activities and exercise and fitness programs. Our Senior Housing-Leased properties are triple-net leased. • • • • SHOP: Senior housing operating properties. SNFs: Skilled nursing facilities. Square Feet or Sq. Ft.: Net rentable square feet calculated utilizing Building Owners and Managers Association measurement standards. Total Debt: The principal balances of the Company’s revolving credit facility, term loan and secured indebtedness as reported in the Company’s consolidated financial statements. • • Trilogy: Trilogy Investors, LLC; in which we indirectly own a 100% interest in Trilogy as of September 30, 2025. Triple-Net Leased: A lease where the tenant is responsible for making rent payments, maintaining the leased property, and paying property taxes and other expenses. 32
