
Q4 2025 Earnings Presentation February 25, 2026
fidelisinsurance.com This presentation contains “forward-looking statements” which include all statements that do not relate solely to historical or current facts and which may concern our strategy, plans, targets, projections or intentions and are made pursuant to the safe harbor provisions of the U.S. Private Securities Litigation Reform Act of 1995. Forward-looking statements can be identified by words such as: “continue,” “grow,” “opportunity,” “create,” “anticipate,” “intend,” “plan,” “goal,” “seek,” “believe,” “project,” “estimate,” “target,” “tracking,” “expect,” “evolve,” “achieve,” “remain,” “proactive,” “pursue,” “optimize,” “emerge,” “build,” “looking ahead,” “commit,” “strategy,” “predict,” “potential,” “assumption,” “future,” “likely,” “may,” “should,” “could,” “will” and the negative of these and also similar terms and phrases. Forward-looking statements are neither historical facts nor assurances of future performance. Instead, they are qualified by these cautionary statements, because they are based only on our current beliefs, expectations and assumptions regarding the future of our business, future plans and strategies, targets, projections, anticipated events and trends, the economy and other future conditions, but are subject to significant business, economic, legal and competitive uncertainties, many of which are beyond our control or are subject to change. Our actual results and financial condition may differ materially from those indicated in the forward-looking statements. Therefore, you should not rely on any of these forward-looking statements. Forward-looking statements contained therein may include, among others, statements in relation to: targeted operating results such as return on equity, net income and earnings per share, underwriting profitability and target combined, loss and expense ratios, growth in gross premiums written and book value per share; our expectations regarding current settlement discussions, court cases and current settlement and litigation strategies; our expectations regarding our business, including the industries we operate in, and capital management strategy and the performance of our business; information regarding our estimates for catastrophes, claims and other loss events; our expectations regarding our partnerships and strategic agreements, including The Fidelis Partnership; anticipated market conditions, pricing cycles, and competitive positioning; sustainability and renewable energy initiatives; use of and exposure to emerging technologies; our management team and human capital; our share price performance and valuation; and our regulatory or listing status; our liquidity and capital resources; and expectations of the effect on our results of operations and financial condition of our loss claims, litigation, climate change impacts, contingent liabilities and governmental and regulatory investigations and proceedings. Our actual results in the future could differ materially from those anticipated in any forward-looking statements as a result of changes in assumptions, risks, uncertainties and other factors impacting us, many of which are outside our control, including: our ability to manage risks associated with macroeconomic conditions including any escalation of the Ukraine Conflict or those in the Middle East, or related sanctions and other geopolitical events globally; trends related to premium rate hardening or premium rate softening leading to a cyclical downturn of pricing in the (re)insurance industry; the impact of inflation (including social inflation) or deflation in relevant economies in which we operate; our ability to evaluate and measure our business, prospects and performance metrics and respond accordingly; the failure of our risk management policies and procedures to be adequate to identify, monitor and manage risks, which may leave us exposed to unidentified or unanticipated risks; any litigation to which we are party being resolved unfavorably to our prior expectations, whether through court decisions or otherwise through effecting settlements (where such settlements are capable of being achieved), based on emerging information, the actions of other parties or any other failure to resolve such litigation favorably; the inherent unpredictability of litigation and any related settlement negotiations which may or may not lead to an agreed settlement of particular matters; the outcomes of probabilistic models which are based on historical assumptions and which can differ from actual results or other emerging information as compared to such assumptions; the less developed data and parameter inputs for industry catastrophe models for perils such as wildfires and flood; the effect of climate change on our business, including the trend towards increasingly frequent and severe catastrophic events; the possibility of greater frequency or severity of claims and loss activity than our underwriting, reserving or investment practices have anticipated; the development and pattern of earned and written premiums impacting embedded premium value; the reliability of pricing, accumulation and estimated loss models; the impact of complex causation and coverage issues associated with attribution of losses; the actual development of losses and expenses impacting estimates for claims which arose as a result of loss activity, particularly for events where estimates are preliminary until the development of such reserves based on emerging information over time; our ability to successfully implement our long-term strategy and compete successfully with more established competitors and increased competition relating to consolidation in the reinsurance and insurance industries; any downgrades, potential downgrades or other negative actions by rating agencies relating to us or our industry; changes to our strategic relationship with The Fidelis Partnership and our dependence on the Delegated Underwriting Authority Agreements for our underwriting and claims-handling operations; our dependence on key executives and ability to attract qualified personnel; our dependence on letter of credit facilities that may not be available on commercially acceptable terms; our potential inability to pay dividends or distributions in accordance with our current dividend policy, due to changing conditions; availability of outwards reinsurance on commercially acceptable terms; the recovery of losses and reinstatement premiums from our reinsurance providers; our potential need for additional capital in the future and the potential unavailability of such capital to us on favorable terms or at all; our dependence on clients’ evaluation of risks associated with such clients’ insurance underwriting; the suspension or revocation of our subsidiaries’ insurance licenses; our potentially being subject to certain adverse tax or regulatory consequences in the U.S., U.K. or Bermuda; risks associated with our investment strategy such as market risk, interest rate risk, currency risk and credit default risk; the impact of tax reform and changes in the regulatory environment and the potential for greater regulatory scrutiny of the Group as a result of the outsourcing arrangements; heightened risk of cybersecurity incidents and their potential impact on our business; risks associated with our use or anticipated use of emerging technologies, such as artificial intelligence technologies, including potential legal, regulatory and operational risks; operational failures, including the operational risk associated with outsourcing to The Fidelis Partnership, failure of information systems or failure to protect the confidentiality of customer information, including by service providers, or losses due to defaults, errors or omissions by third parties and affiliates; risks relating to our ability to identify and execute opportunities for growth or our ability to complete transactions as planned or realize the anticipated benefits of our acquisitions or other investments; our status as a foreign private issuer means that it will be subject to the reporting obligations under the U.S. Securities Exchange Act of 1934, as amended, that, to some extent, are more lenient and less frequent than those of a U.S. domestic public company; our ability to maintain the listing of our common shares on NYSE or another national securities exchange; and the other risks, uncertainties and other factors disclosed under the section titled “Risk Factors” in our Annual Report on Form 20-F filed with the SEC on March 11, 2025, as well as subsequent Current Reports and other filings with the SEC available electronically at www.sec.gov. The foregoing factors should not be construed as exhaustive and should be read together with the other cautionary statements included in our filings with the SEC. All forward-looking statements included herein are expressly qualified in their entirety by the cautionary statements contained or referred to therein. The forward-looking statements contained in this press release are neither promises nor guarantees, and you should not place undue reliance on these forward-looking statements because they involve known and unknown risks, uncertainties, and other factors, many of which are beyond our control and which could cause actual results, performance or achievements to differ materially from those expressed or implied by these forward-looking statements. Any forward-looking statements, expectations, beliefs and projections made by us in this presentation speak only as of the date referenced on such date on which they are made and are expressed in good faith and our management believes that there is reasonable basis for them, based only on information currently available to us. There can be no assurance that management’s expectations, beliefs, and projections will be achieved and actual results may vary materially from what is expressed or indicated by the forward-looking statements. Furthermore, our past performance, and that of our management team and of The Fidelis Partnership, should not be construed as a guarantee of future performance. Except to the extent required by applicable laws and regulations, we undertake no obligation to update or revise any forward-looking statement contained in this press release, whether as a result of new information, future developments or otherwise. In light of these risks and uncertainties, you should keep in mind that any event described in a forward-looking statement might not occur. Basis of Presentation Cautionary Note Regarding Forward-Looking Statements 2
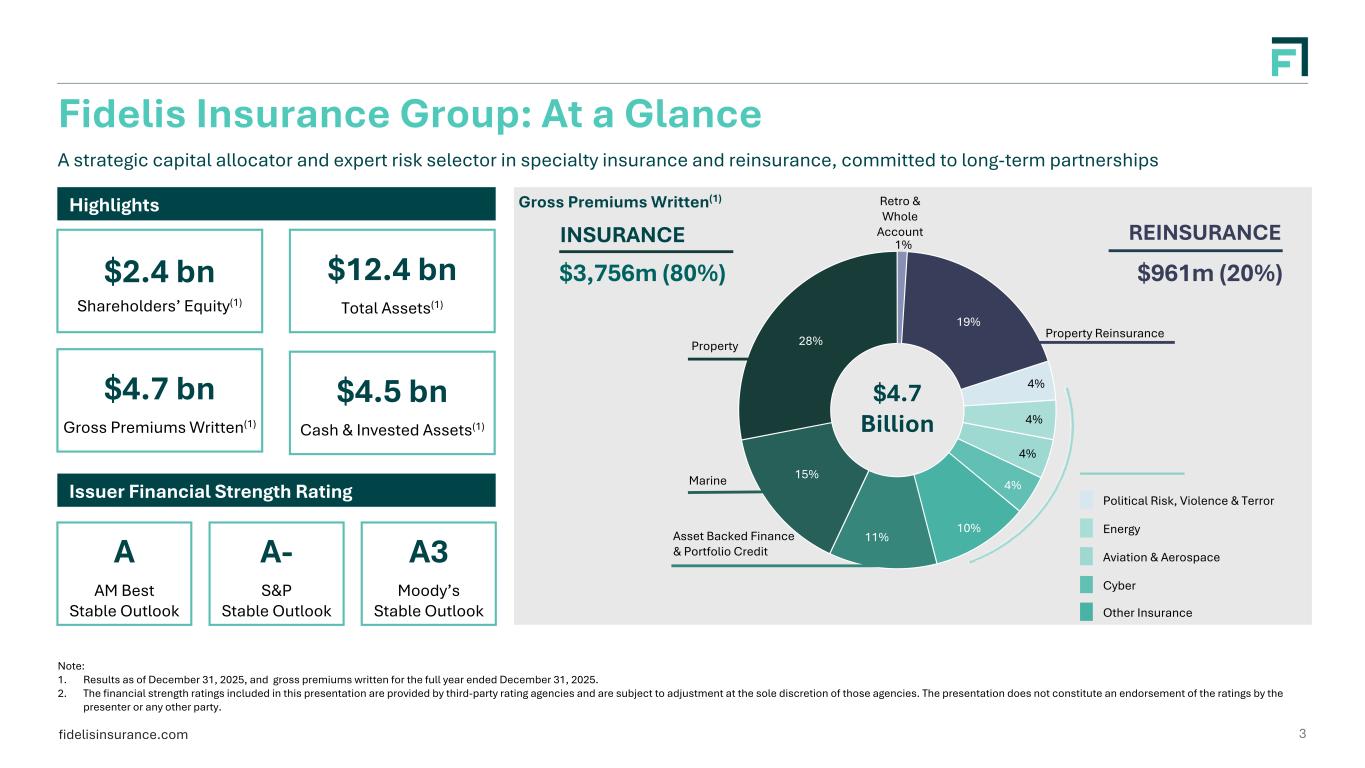
fidelisinsurance.com Fidelis Insurance Group: At a Glance Note: 1. Results as of December 31, 2025, and gross premiums written for the full year ended December 31, 2025. 2. The financial strength ratings included in this presentation are provided by third-party rating agencies and are subject to adjustment at the sole discretion of those agencies. The presentation does not constitute an endorsement of the ratings by the presenter or any other party. Highlights A strategic capital allocator and expert risk selector in specialty insurance and reinsurance, committed to long-term partnerships 3 $12.4 bn Total Assets(1) $2.4 bn Shareholders’ Equity(1) $4.5 bn Cash & Invested Assets(1) $4.7 bn Gross Premiums Written(1) Issuer Financial Strength Rating A AM Best Stable Outlook A- S&P Stable Outlook A3 Moody’s Stable Outlook 1% 19% 4% 4% 4% 4% 10% 11% 15% 28% $961m (20%) INSURANCE $3,756m (80%) $4.7 Billion REINSURANCE Retro & Whole Account Political Risk, Violence & Terror Energy Aviation & Aerospace Cyber Other Insurance 1% Property Marine Property Reinsurance Asset Backed Finance & Portfolio Credit Gross Premiums Written(1)
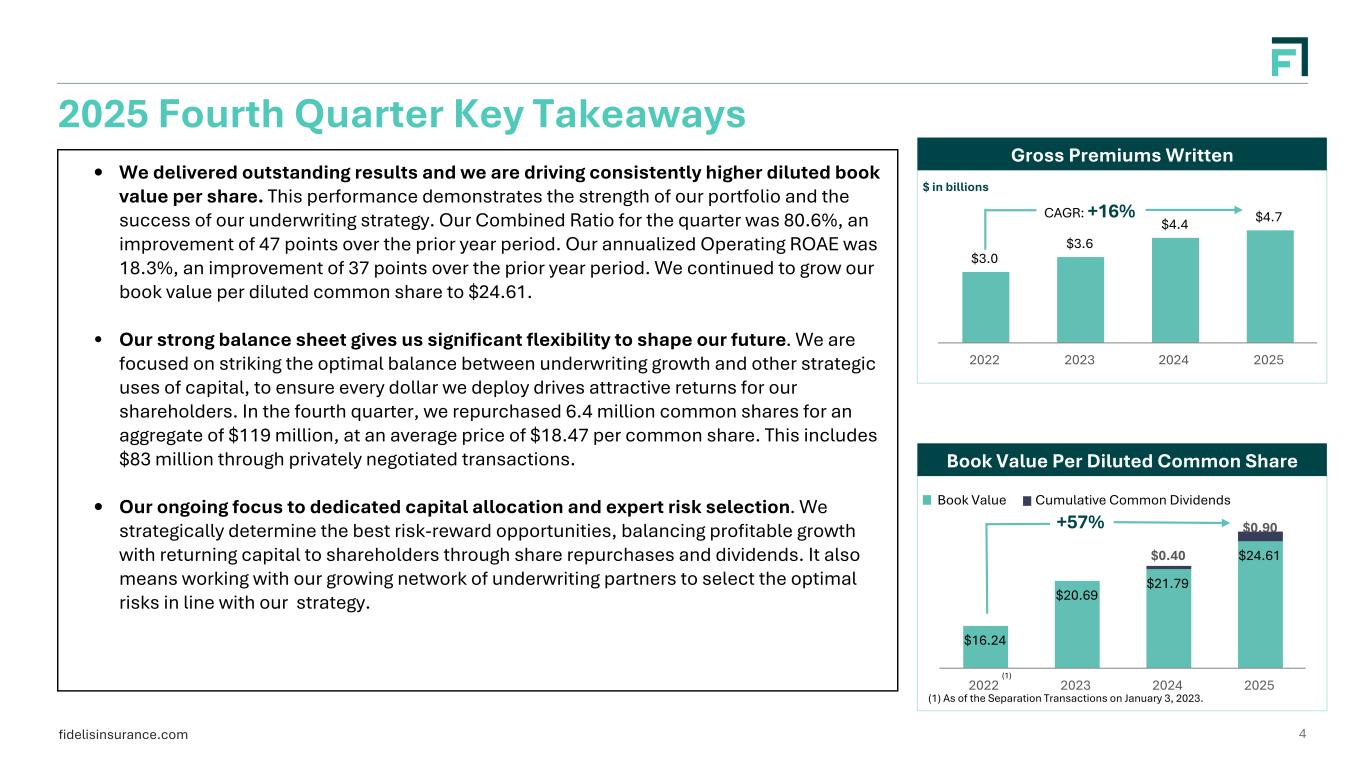
fidelisinsurance.com $16.24 $20.69 $21.79 $24.61$0.40 $0.90 2022 2023 2024 2025 2025 Fourth Quarter Key Takeaways 4 • We delivered outstanding results and we are driving consistently higher diluted book value per share. This performance demonstrates the strength of our portfolio and the success of our underwriting strategy. Our Combined Ratio for the quarter was 80.6%, an improvement of 47 points over the prior year period. Our annualized Operating ROAE was 18.3%, an improvement of 37 points over the prior year period. We continued to grow our book value per diluted common share to $24.61. • Our strong balance sheet gives us significant flexibility to shape our future. We are focused on striking the optimal balance between underwriting growth and other strategic uses of capital, to ensure every dollar we deploy drives attractive returns for our shareholders. In the fourth quarter, we repurchased 6.4 million common shares for an aggregate of $119 million, at an average price of $18.47 per common share. This includes $83 million through privately negotiated transactions. • Our ongoing focus to dedicated capital allocation and expert risk selection. We strategically determine the best risk-reward opportunities, balancing profitable growth with returning capital to shareholders through share repurchases and dividends. It also means working with our growing network of underwriting partners to select the optimal risks in line with our strategy. $3.0 $3.6 $4.4 $4.7 2022 2023 2024 2025 Gross Premiums Written CAGR: +16% Book Value Cumulative Common Dividends Book Value Per Diluted Common Share +57% (1) (1) As of the Separation Transactions on January 3, 2023. $ in billions
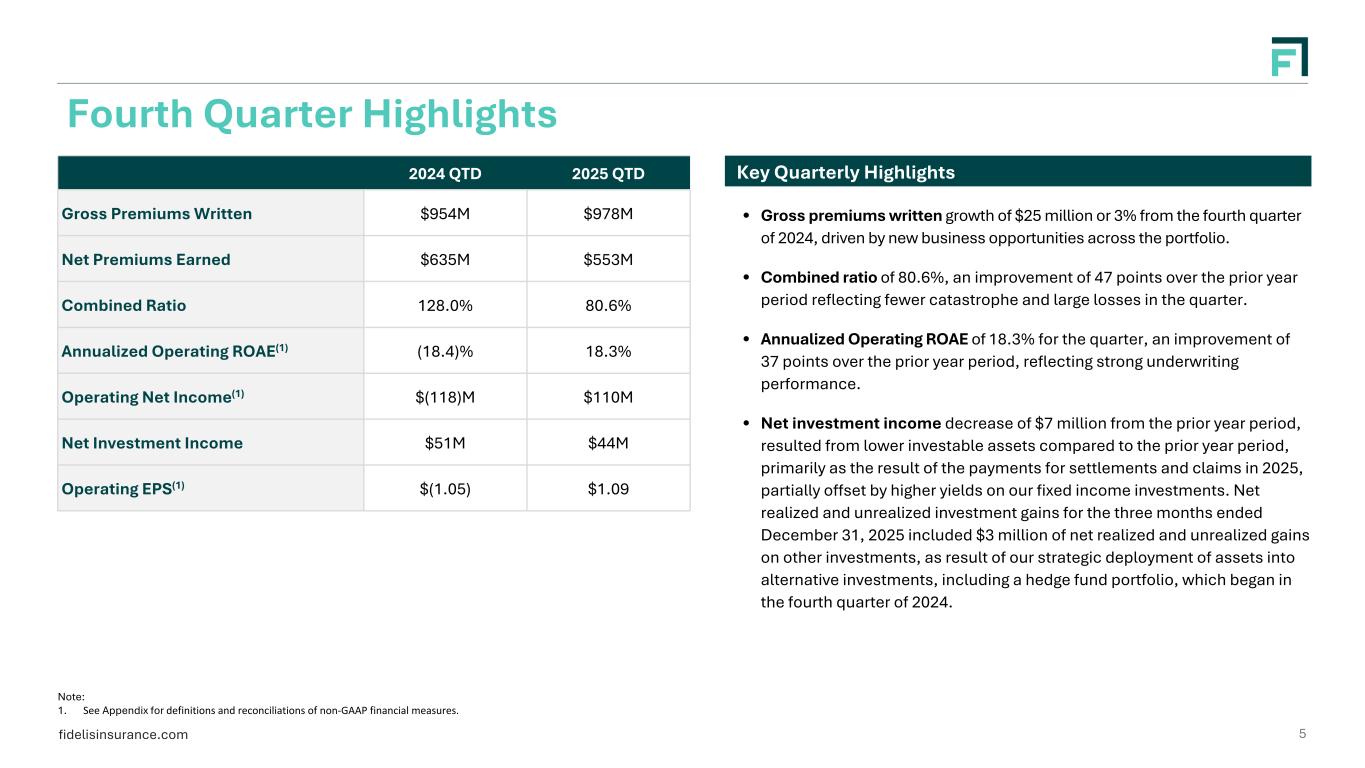
fidelisinsurance.com Key Quarterly Highlights Fourth Quarter Highlights Note: 1. See Appendix for definitions and reconciliations of non-GAAP financial measures. 2024 QTD 2025 QTD Gross Premiums Written $954M $978M Net Premiums Earned $635M $553M Combined Ratio 128.0% 80.6% Annualized Operating ROAE(1) (18.4)% 18.3% Operating Net Income(1) $(118)M $110M Net Investment Income $51M $44M Operating EPS(1) $(1.05) $1.09 • Gross premiums written growth of $25 million or 3% from the fourth quarter of 2024, driven by new business opportunities across the portfolio. • Combined ratio of 80.6%, an improvement of 47 points over the prior year period reflecting fewer catastrophe and large losses in the quarter. • Annualized Operating ROAE of 18.3% for the quarter, an improvement of 37 points over the prior year period, reflecting strong underwriting performance. • Net investment income decrease of $7 million from the prior year period, resulted from lower investable assets compared to the prior year period, primarily as the result of the payments for settlements and claims in 2025, partially offset by higher yields on our fixed income investments. Net realized and unrealized investment gains for the three months ended December 31, 2025 included $3 million of net realized and unrealized gains on other investments, as result of our strategic deployment of assets into alternative investments, including a hedge fund portfolio, which began in the fourth quarter of 2024. 5
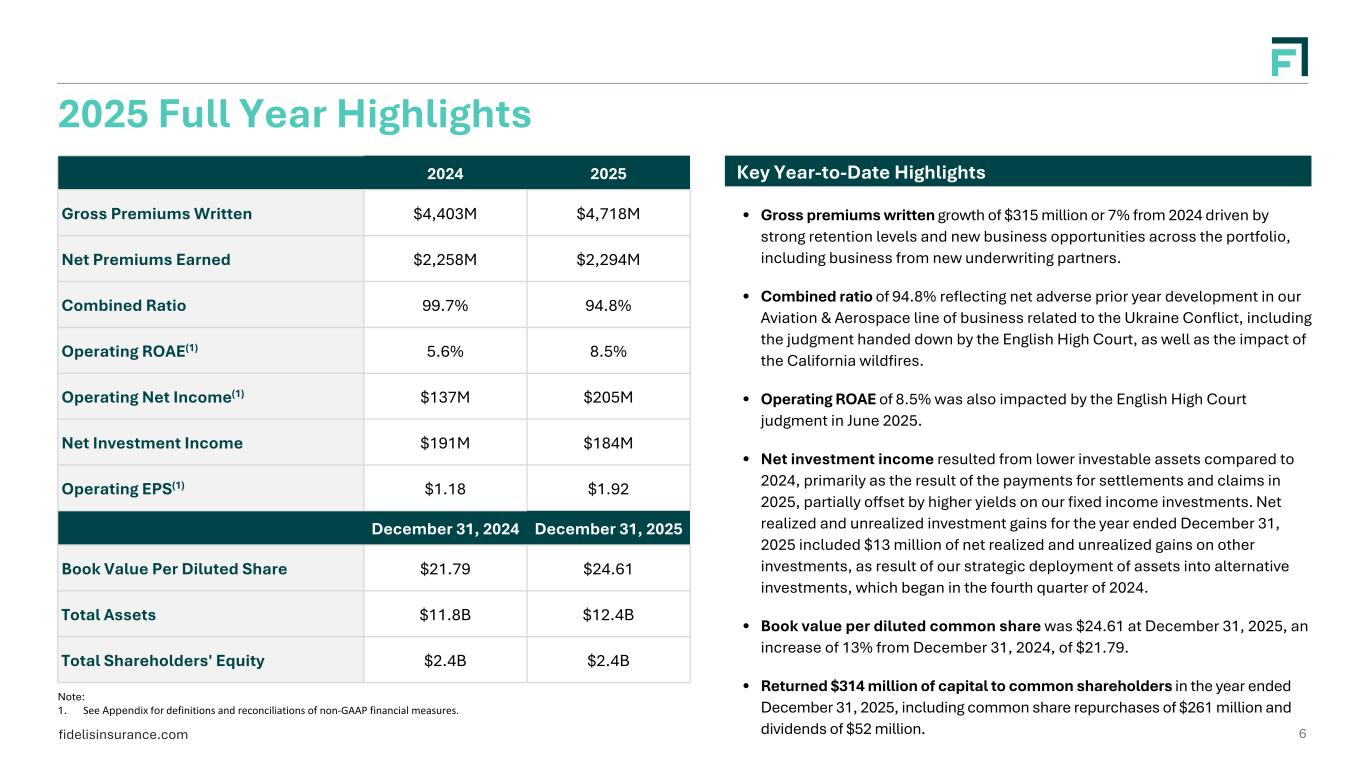
fidelisinsurance.com Key Year-to-Date Highlights 2025 Full Year Highlights Note: 1. See Appendix for definitions and reconciliations of non-GAAP financial measures. 2024 2025 Gross Premiums Written $4,403M $4,718M Net Premiums Earned $2,258M $2,294M Combined Ratio 99.7% 94.8% Operating ROAE(1) 5.6% 8.5% Operating Net Income(1) $137M $205M Net Investment Income $191M $184M Operating EPS(1) $1.18 $1.92 December 31, 2024 December 31, 2025 Book Value Per Diluted Share $21.79 $24.61 Total Assets $11.8B $12.4B Total Shareholders' Equity $2.4B $2.4B • Gross premiums written growth of $315 million or 7% from 2024 driven by strong retention levels and new business opportunities across the portfolio, including business from new underwriting partners. • Combined ratio of 94.8% reflecting net adverse prior year development in our Aviation & Aerospace line of business related to the Ukraine Conflict, including the judgment handed down by the English High Court, as well as the impact of the California wildfires. • Operating ROAE of 8.5% was also impacted by the English High Court judgment in June 2025. • Net investment income resulted from lower investable assets compared to 2024, primarily as the result of the payments for settlements and claims in 2025, partially offset by higher yields on our fixed income investments. Net realized and unrealized investment gains for the year ended December 31, 2025 included $13 million of net realized and unrealized gains on other investments, as result of our strategic deployment of assets into alternative investments, which began in the fourth quarter of 2024. • Book value per diluted common share was $24.61 at December 31, 2025, an increase of 13% from December 31, 2024, of $21.79. • Returned $314 million of capital to common shareholders in the year ended December 31, 2025, including common share repurchases of $261 million and dividends of $52 million. 6
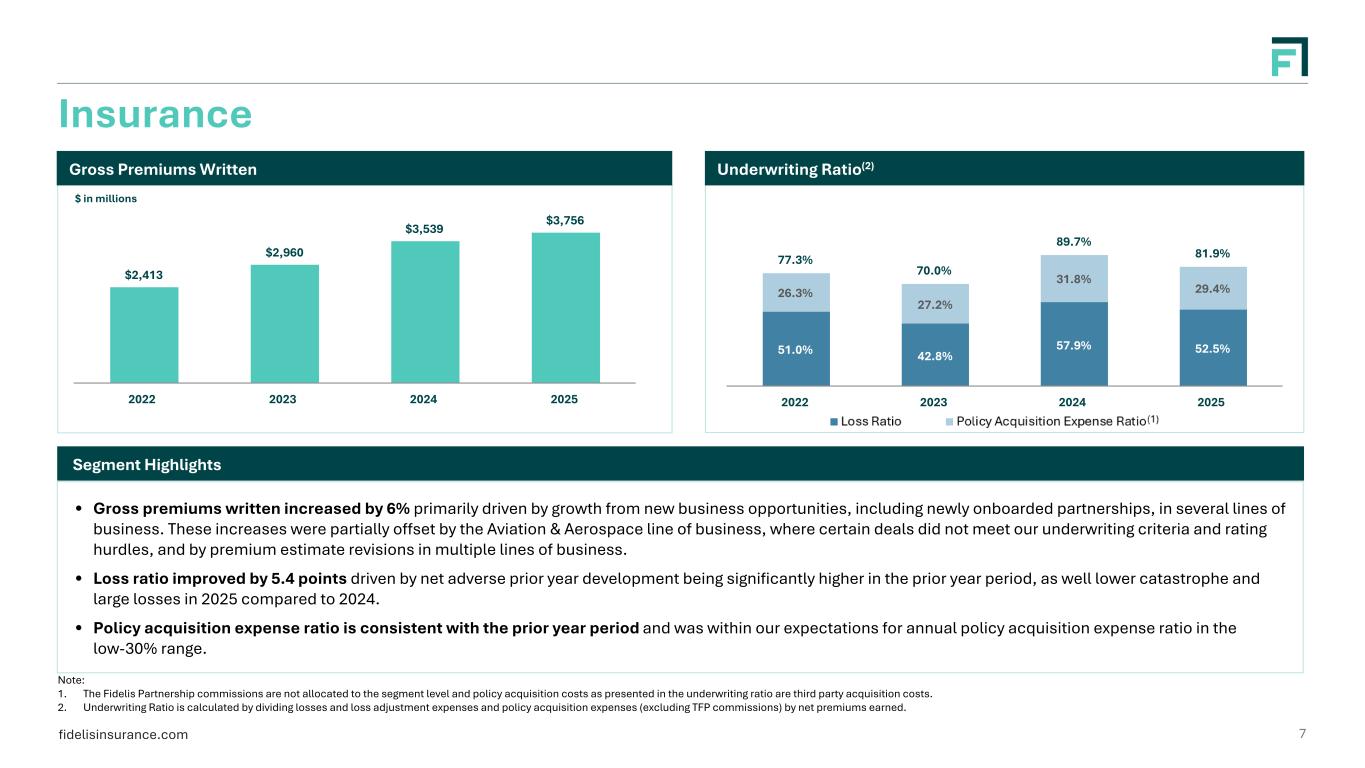
fidelisinsurance.com 77.3% 70.0% 89.7% 81.9% 51.0% 42.8% 57.9% 52.5% 26.3% 27.2% 31.8% 29.4% 2022 2023 2024 2025 $2,413 $2,960 $3,539 $3,756 2022 2023 2024 2025 7 Insurance Note: 1. The Fidelis Partnership commissions are not allocated to the segment level and policy acquisition costs as presented in the underwriting ratio are third party acquisition costs. 2. Underwriting Ratio is calculated by dividing losses and loss adjustment expenses and policy acquisition expenses (excluding TFP commissions) by net premiums earned. Gross Premiums Written Segment Highlights Underwriting Ratio(2) • Gross premiums written increased by 6% primarily driven by growth from new business opportunities, including newly onboarded partnerships, in several lines of business. These increases were partially offset by the Aviation & Aerospace line of business, where certain deals did not meet our underwriting criteria and rating hurdles, and by premium estimate revisions in multiple lines of business. • Loss ratio improved by 5.4 points driven by net adverse prior year development being significantly higher in the prior year period, as well lower catastrophe and large losses in 2025 compared to 2024. • Policy acquisition expense ratio is consistent with the prior year period and was within our expectations for annual policy acquisition expense ratio in the low-30% range. $ in millions
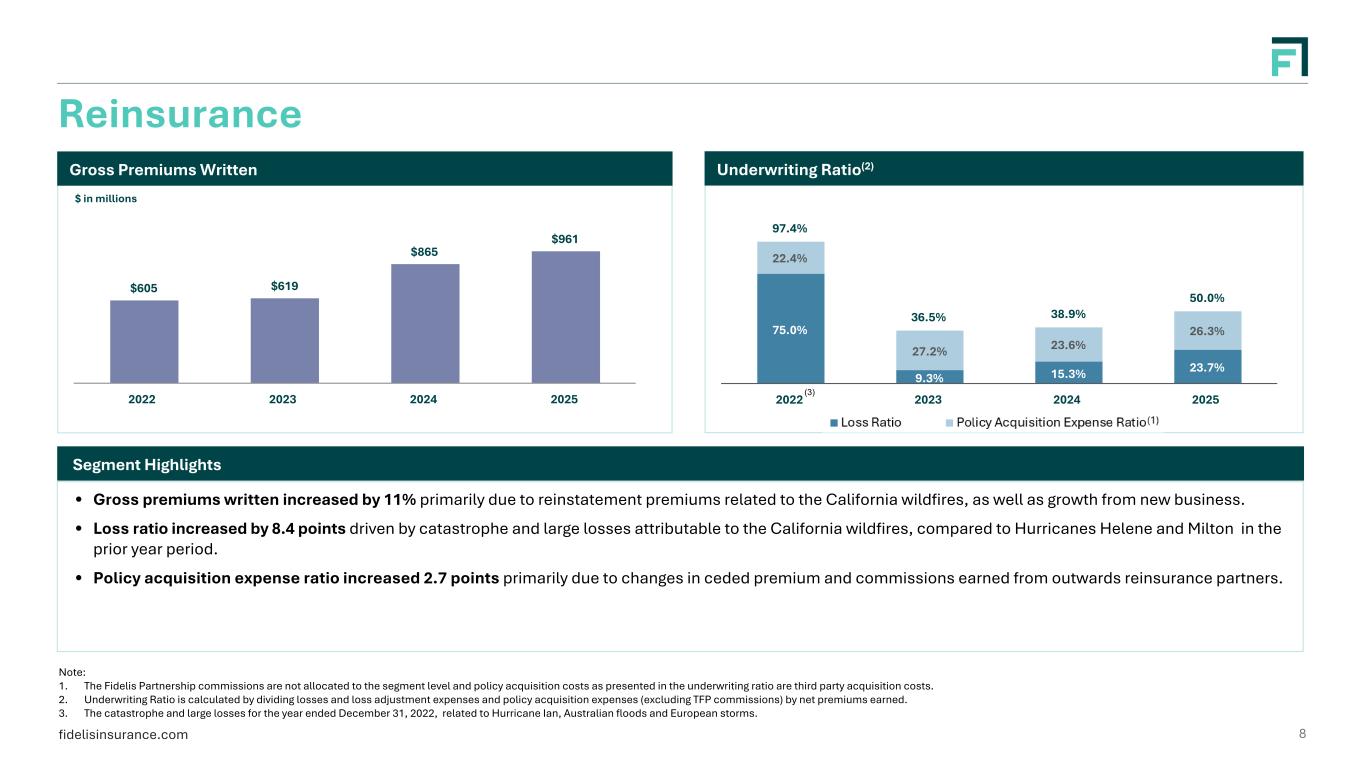
fidelisinsurance.com 97.4% 36.5% 38.9% 50.0% 75.0% 9.3% 15.3% 23.7% 22.4% 27.2% 23.6% 26.3% 2022 2023 2024 2025 $605 $619 $865 $961 2022 2023 2024 2025 8 Reinsurance Note: 1. The Fidelis Partnership commissions are not allocated to the segment level and policy acquisition costs as presented in the underwriting ratio are third party acquisition costs. 2. Underwriting Ratio is calculated by dividing losses and loss adjustment expenses and policy acquisition expenses (excluding TFP commissions) by net premiums earned. 3. The catastrophe and large losses for the year ended December 31, 2022, related to Hurricane Ian, Australian floods and European storms. • Gross premiums written increased by 11% primarily due to reinstatement premiums related to the California wildfires, as well as growth from new business. • Loss ratio increased by 8.4 points driven by catastrophe and large losses attributable to the California wildfires, compared to Hurricanes Helene and Milton in the prior year period. • Policy acquisition expense ratio increased 2.7 points primarily due to changes in ceded premium and commissions earned from outwards reinsurance partners. $ in millions Gross Premiums Written Segment Highlights Underwriting Ratio(2) (3)
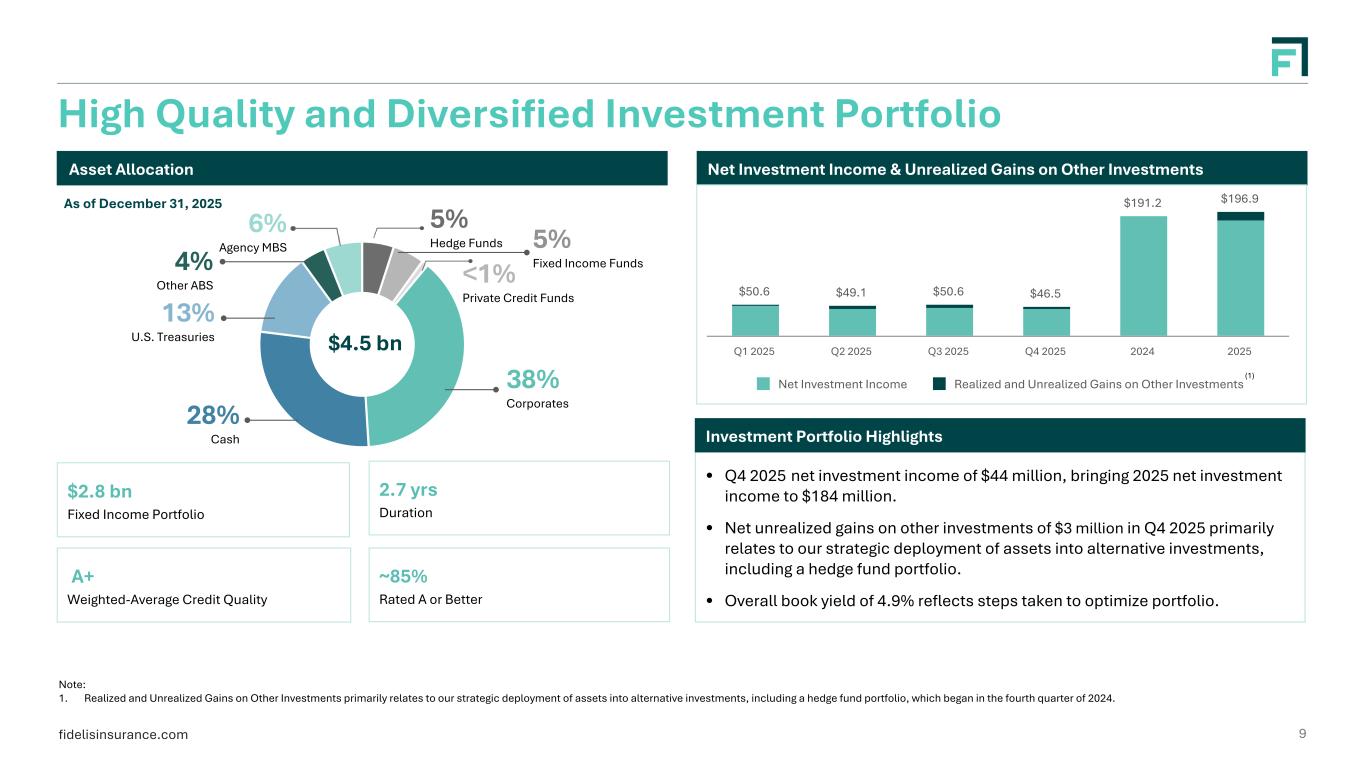
fidelisinsurance.com • Q4 2025 net investment income of $44 million, bringing 2025 net investment income to $184 million. • Net unrealized gains on other investments of $3 million in Q4 2025 primarily relates to our strategic deployment of assets into alternative investments, including a hedge fund portfolio. • Overall book yield of 4.9% reflects steps taken to optimize portfolio. High Quality and Diversified Investment Portfolio 9 Note: 1. Realized and Unrealized Gains on Other Investments primarily relates to our strategic deployment of assets into alternative investments, including a hedge fund portfolio, which began in the fourth quarter of 2024. Asset Allocation As of December 31, 2025 $2.8 bn Fixed Income Portfolio 2.7 yrs Duration A+ Weighted-Average Credit Quality ~85% Rated A or Better 38% Corporates 5% Hedge Funds 6% Agency MBS 4% Other ABS 13% U.S. Treasuries 28% Cash $4.5 bn Investment Portfolio Highlights Net Investment Income & Unrealized Gains on Other Investments $50.6 $49.1 $50.6 $46.5 $191.2 $196.9 Net Investment Income Realized and Unrealized Gains on Other Investments Q1 2025 Q2 2025 Q3 2025 Q4 2025 2024 2025 (1) 5% Fixed Income Funds<1% Private Credit Funds
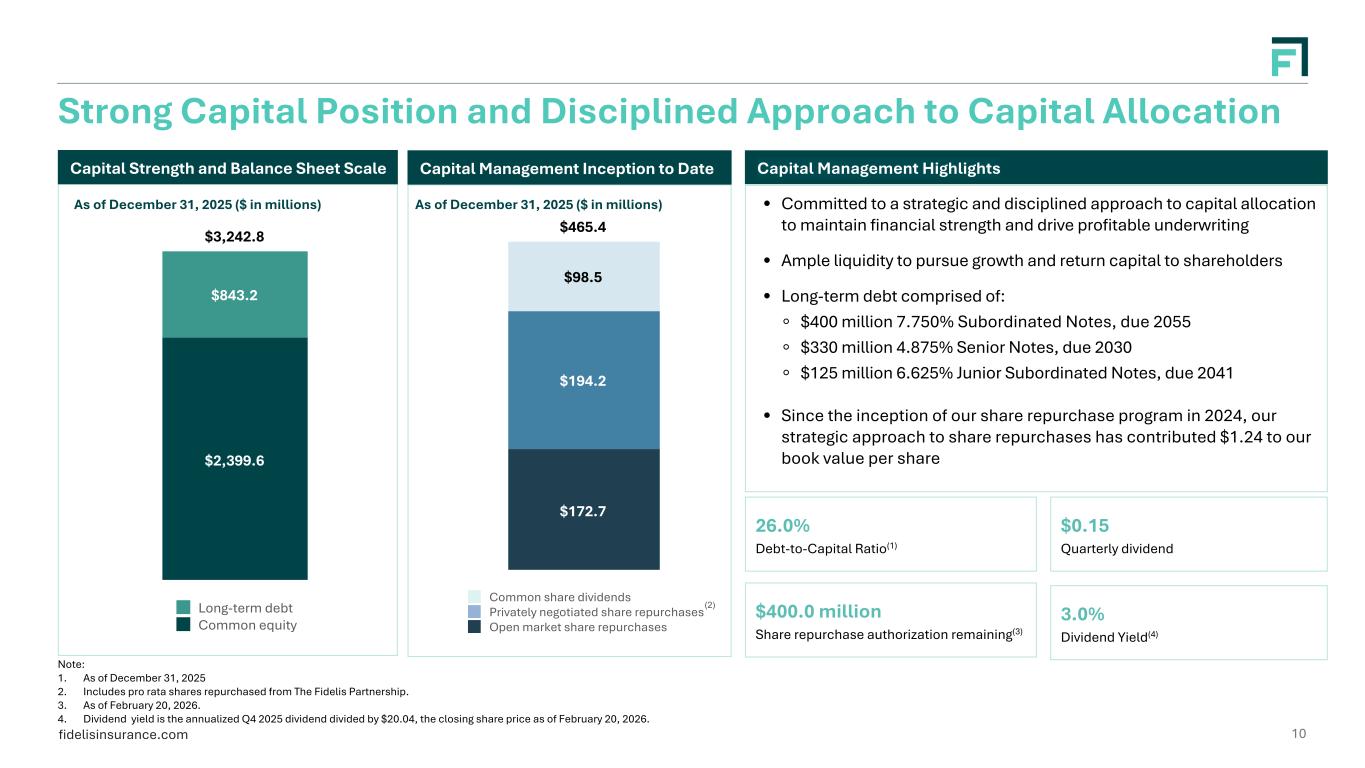
fidelisinsurance.com 10 • Committed to a strategic and disciplined approach to capital allocation to maintain financial strength and drive profitable underwriting • Ample liquidity to pursue growth and return capital to shareholders • Long-term debt comprised of: ◦ $400 million 7.750% Subordinated Notes, due 2055 ◦ $330 million 4.875% Senior Notes, due 2030 ◦ $125 million 6.625% Junior Subordinated Notes, due 2041 • Since the inception of our share repurchase program in 2024, our strategic approach to share repurchases has contributed $1.24 to our book value per share Capital Management HighlightsCapital Strength and Balance Sheet Scale Strong Capital Position and Disciplined Approach to Capital Allocation $465.4 $172.7 $194.2 $98.5 Common share dividends Privately negotiated share repurchases Open market share repurchases $3,242.8 $2,399.6 $843.2 Long-term debt Common equity Note: 1. As of December 31, 2025 2. Includes pro rata shares repurchased from The Fidelis Partnership. 3. As of February 20, 2026. 4. Dividend yield is the annualized Q4 2025 dividend divided by $20.04, the closing share price as of February 20, 2026. As of December 31, 2025 ($ in millions) Capital Management Inception to Date As of December 31, 2025 ($ in millions) (2) 26.0% Debt-to-Capital Ratio(1) $0.15 Quarterly dividend $400.0 million Share repurchase authorization remaining(3) 3.0% Dividend Yield(4)
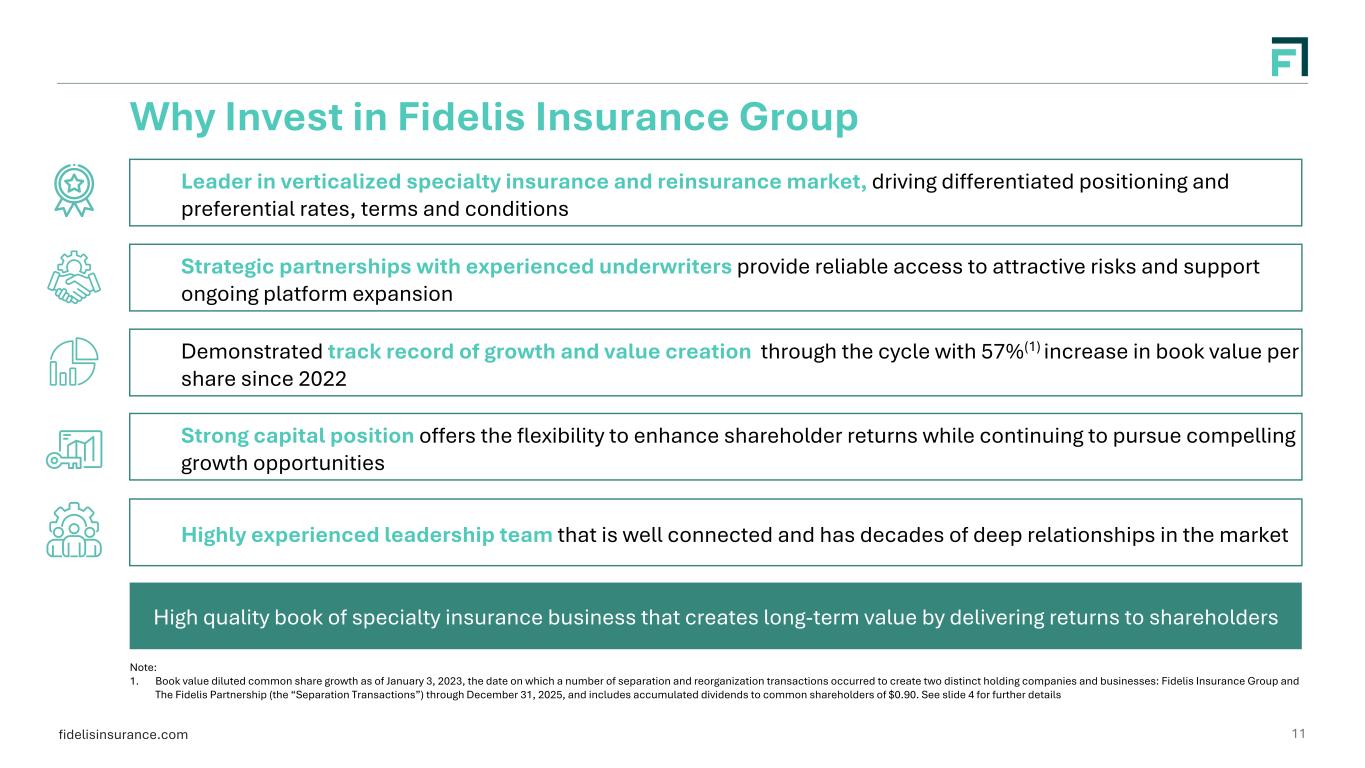
fidelisinsurance.com Leader in verticalized specialty insurance and reinsurance market, driving differentiated positioning and preferential rates, terms and conditions Strategic partnerships with experienced underwriters provide reliable access to attractive risks and support ongoing platform expansion Demonstrated track record of growth and value creation through the cycle with 57%(1) increase in book value per share since 2022 Strong capital position offers the flexibility to enhance shareholder returns while continuing to pursue compelling growth opportunities High quality book of specialty insurance business that creates long-term value by delivering returns to shareholders 11 Highly experienced leadership team that is well connected and has decades of deep relationships in the market Note: 1. Book value diluted common share growth as of January 3, 2023, the date on which a number of separation and reorganization transactions occurred to create two distinct holding companies and businesses: Fidelis Insurance Group and The Fidelis Partnership (the “Separation Transactions”) through December 31, 2025, and includes accumulated dividends to common shareholders of $0.90. See slide 4 for further details Why Invest in Fidelis Insurance Group
fidelisinsurance.com 12 Appendix
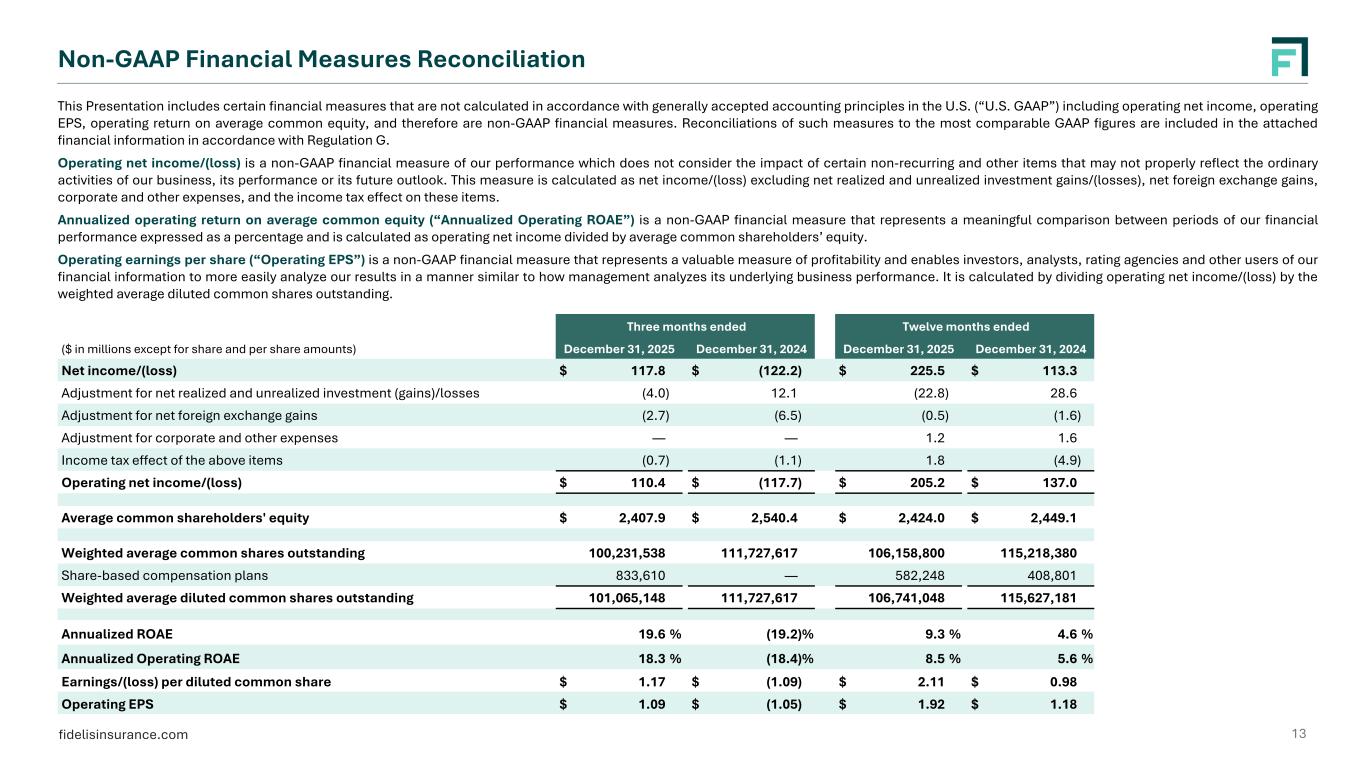
fidelisinsurance.com Non-GAAP Financial Measures Reconciliation Three months ended Twelve months ended ($ in millions except for share and per share amounts) December 31, 2025 December 31, 2024 December 31, 2025 December 31, 2024 Net income/(loss) $ 117.8 $ (122.2) $ 225.5 $ 113.3 Adjustment for net realized and unrealized investment (gains)/losses (4.0) 12.1 (22.8) 28.6 Adjustment for net foreign exchange gains (2.7) (6.5) (0.5) (1.6) Adjustment for corporate and other expenses — — 1.2 1.6 Income tax effect of the above items (0.7) (1.1) 1.8 (4.9) Operating net income/(loss) $ 110.4 $ (117.7) $ 205.2 $ 137.0 Average common shareholders' equity $ 2,407.9 $ 2,540.4 $ 2,424.0 $ 2,449.1 Weighted average common shares outstanding 100,231,538 111,727,617 106,158,800 115,218,380 Share-based compensation plans 833,610 — 582,248 408,801 Weighted average diluted common shares outstanding 101,065,148 111,727,617 106,741,048 115,627,181 Annualized ROAE 19.6 % (19.2) % 9.3 % 4.6 % Annualized Operating ROAE 18.3 % (18.4) % 8.5 % 5.6 % Earnings/(loss) per diluted common share $ 1.17 $ (1.09) $ 2.11 $ 0.98 Operating EPS $ 1.09 $ (1.05) $ 1.92 $ 1.18 13 This Presentation includes certain financial measures that are not calculated in accordance with generally accepted accounting principles in the U.S. (“U.S. GAAP”) including operating net income, operating EPS, operating return on average common equity, and therefore are non-GAAP financial measures. Reconciliations of such measures to the most comparable GAAP figures are included in the attached financial information in accordance with Regulation G. Operating net income/(loss) is a non-GAAP financial measure of our performance which does not consider the impact of certain non-recurring and other items that may not properly reflect the ordinary activities of our business, its performance or its future outlook. This measure is calculated as net income/(loss) excluding net realized and unrealized investment gains/(losses), net foreign exchange gains, corporate and other expenses, and the income tax effect on these items. Annualized operating return on average common equity (“Annualized Operating ROAE”) is a non-GAAP financial measure that represents a meaningful comparison between periods of our financial performance expressed as a percentage and is calculated as operating net income divided by average common shareholders’ equity. Operating earnings per share (“Operating EPS”) is a non-GAAP financial measure that represents a valuable measure of profitability and enables investors, analysts, rating agencies and other users of our financial information to more easily analyze our results in a manner similar to how management analyzes its underlying business performance. It is calculated by dividing operating net income/(loss) by the weighted average diluted common shares outstanding.