
Q1 2026 Earnings Presentation
This presentation contains “forward-looking statements” which include all statements that do not relate solely to historical or current facts and which may concern our strategy, plans, targets, projections or intentions and are made pursuant to the safe harbor provisions of the U.S. Private Securities Litigation Reform Act of 1995. Forward-looking statements can be identified by words such as: “continue,” “grow,” “opportunity,” “create,” “anticipate,” “intend,” “plan,” “goal,” “seek,” “believe,” “project,” “estimate,” “target,” “tracking,” “expect,” “evolve,” “achieve,” “remain,” “proactive,” “pursue,” “optimize,” “emerge,” “build,” “looking ahead,” “commit,” “strategy,” “predict,” “potential,” “assumption,” “future,” “likely,” “may,” “should,” “could,” “will” and the negative of these and also similar terms and phrases. Forward-looking statements are neither historical facts nor assurances of future performance. Instead, they are qualified by these cautionary statements, because they are based only on our current beliefs, expectations and assumptions regarding the future of our business, future plans and strategies, targets, projections, anticipated events and trends, the economy and other future conditions, but are subject to significant business, economic, legal and competitive uncertainties, many of which are beyond our control or are subject to change. Our actual results and financial condition may differ materially from those indicated in the forward-looking statements. Therefore, you should not rely on any of these forward-looking statements. Forward-looking statements contained therein may include, among others, statements in relation to: targeted operating results such as return on equity, net income and earnings per share, underwriting profitability and target combined, loss and expense ratios, growth in gross premiums written and book value per share; our expectations regarding current settlement discussions, court cases and current settlement and litigation strategies; our expectations regarding our business, including the industries we operate in, and capital management strategy and the performance of our business; information regarding our estimates for catastrophes, claims and other loss events; our expectations regarding our partnerships and strategic agreements, including The Fidelis Partnership; anticipated market conditions, pricing cycles, and competitive positioning; sustainability and renewable energy initiatives; use of and exposure to emerging technologies; our management team and human capital; our share price performance and valuation; and our regulatory or listing status; our liquidity and capital resources; and expectations of the effect on our results of operations and financial condition of our loss claims, litigation, climate change impacts, contingent liabilities and governmental and regulatory investigations and proceedings. Our actual results in the future could differ materially from those anticipated in any forward-looking statements as a result of changes in assumptions, risks, uncertainties and other factors impacting us, many of which are outside our control, including: the inherent uncertainty, volatility and unpredictability of underwriting insurance and reinsurance risks, including low-frequency, high-severity events and natural and non-natural catastrophic events; the frequency and severity of claims and loss activity, including the impact of climate change, inflation (including social inflation), emerging claims trends and complex causation or coverage issues; limitations in available data and the reliability of pricing, accumulation, catastrophe and other analytical models used to estimate losses and exposures; the adequacy of our loss reserves and the actual development of losses and loss adjustment expenses; macroeconomic, geopolitical and market conditions, sanctions and other global developments; cyclical changes in the insurance and reinsurance industry, including premium rate movements, competitive pressures and consolidation; our ability to implement our strategy, identify and execute growth opportunities and compete effectively; any downgrades, potential downgrades or other negative actions by rating agencies; the availability, affordability and collectability of reinsurance and retrocessional protections; litigation, arbitration and regulatory proceedings and the inherent uncertainty of their outcomes; our reliance on TFP and other third parties for underwriting, claims handling and other services, and the effectiveness of our risk management and oversight framework; operational risks, including system failures, cybersecurity incidents, data protection breaches and risks associated with emerging technologies, including artificial intelligence, and evolving regulatory requirements applicable thereto; risks relating to our investment portfolio, including market volatility, interest rate movements, credit risk, liquidity risk and currency fluctuations; our ability to access capital and liquidity, including through letters of credit and other financing arrangements, and our status as a holding company dependent on dividends and other distributions from our operating subsidiaries; regulatory developments, including changes in capital regimes, increased supervisory scrutiny and compliance with economic and trade sanctions, anti-bribery and similar laws; tax developments, including changes in tax laws, interpretations and international tax initiatives; our ability to attract and retain key personnel; our potential inability to pay dividends or distributions in accordance with our dividend policy; our ability to maintain the listing of our common shares on the NYSE or another national securities exchange; the Company’s status as a foreign private issuer; and the other risks, uncertainties and other factors disclosed under the section titled ‘Risk Factors’ in our Annual Report on Form 20-F filed with the SEC on March 5, 2026, as well as subsequent current reports and other filings with the SEC available electronically at www.sec.gov. The foregoing factors should not be construed as exhaustive and should be read together with the other cautionary statements included in our filings with the SEC. All forward-looking statements included herein are expressly qualified in their entirety by the cautionary statements contained or referred to therein. The forward-looking statements contained herein are neither promises nor guarantees, and you should not place undue reliance on these forward-looking statements because they involve known and unknown risks, uncertainties, and other factors, many of which are beyond our control and which could cause actual results, performance or achievements to differ materially from those expressed or implied by these forward-looking statements. Any forward-looking statements, expectations, beliefs and projections made by us herein speak only as of the date referenced on such date on which they are made and are expressed in good faith and our management believes that there is reasonable basis for them, based only on information currently available to us. There can be no assurance that management’s expectations, beliefs, and projections will be achieved and actual results may vary materially from what is expressed or indicated by the forward-looking statements. Furthermore, our past performance, and that of our management team and of TFP, should not be construed as a guarantee of future performance. Except to the extent required by applicable laws and regulations, we undertake no obligation to update or revise any forward-looking statements contained in the above discussion, whether as a result of new information, future developments or otherwise. In light of these risks and uncertainties, you should keep in mind that any event described in a forward-looking statement might not occur. Basis of Presentation Cautionary Note Regarding Forward-Looking Statements 2
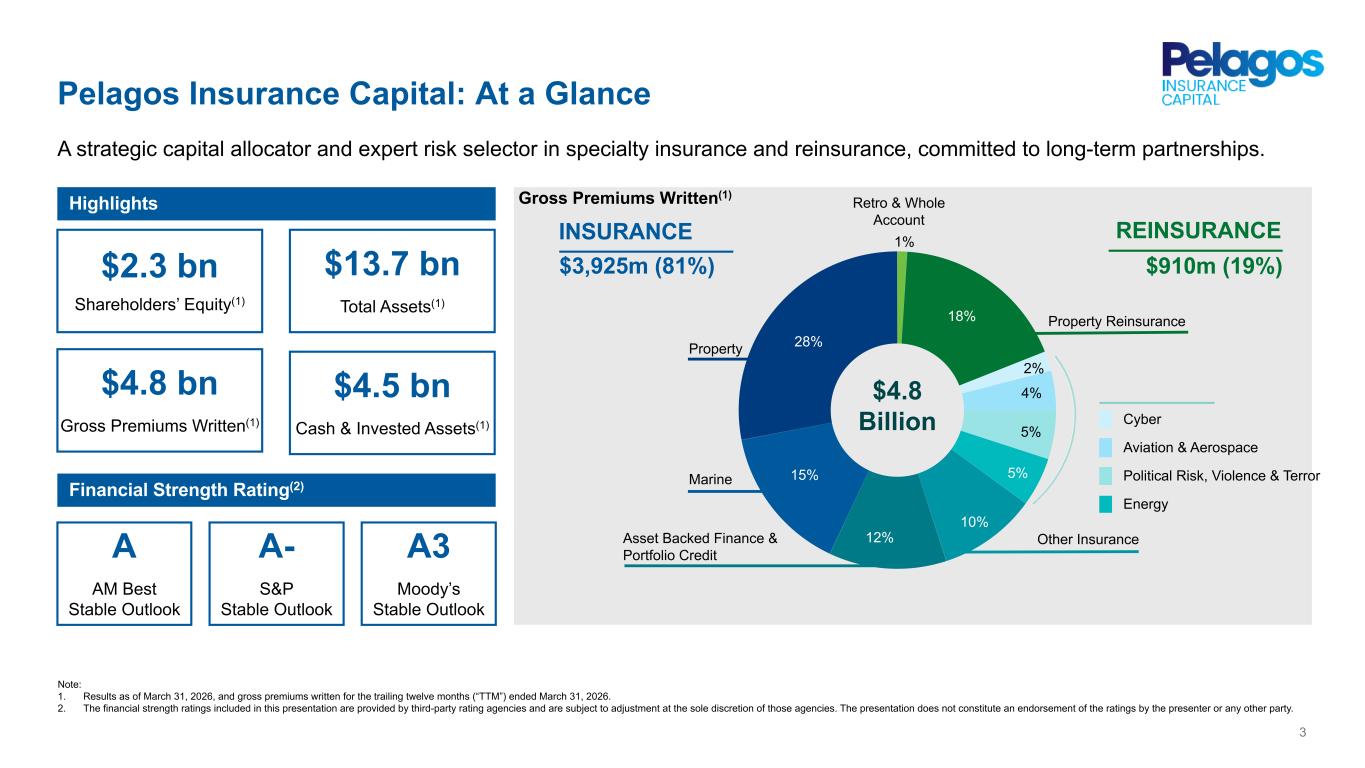
Pelagos Insurance Capital: At a Glance Note: 1. Results as of March 31, 2026, and gross premiums written for the trailing twelve months (“TTM”) ended March 31, 2026. 2. The financial strength ratings included in this presentation are provided by third-party rating agencies and are subject to adjustment at the sole discretion of those agencies. The presentation does not constitute an endorsement of the ratings by the presenter or any other party. Highlights A strategic capital allocator and expert risk selector in specialty insurance and reinsurance, committed to long-term partnerships. 3 $13.7 bn Total Assets(1) $2.3 bn Shareholders’ Equity(1) $4.5 bn Cash & Invested Assets(1) $4.8 bn Gross Premiums Written(1) Financial Strength Rating(2) A AM Best Stable Outlook A- S&P Stable Outlook A3 Moody’s Stable Outlook 18% 2% 4% 5% 5% 10% 12% 15% 28% $910m (19%) INSURANCE $3,925m (81%) $4.8 Billion REINSURANCE Retro & Whole Account Cyber Aviation & Aerospace Political Risk, Violence & Terror Energy 1% Property Marine Property Reinsurance Asset Backed Finance & Portfolio Credit Gross Premiums Written(1) Other Insurance
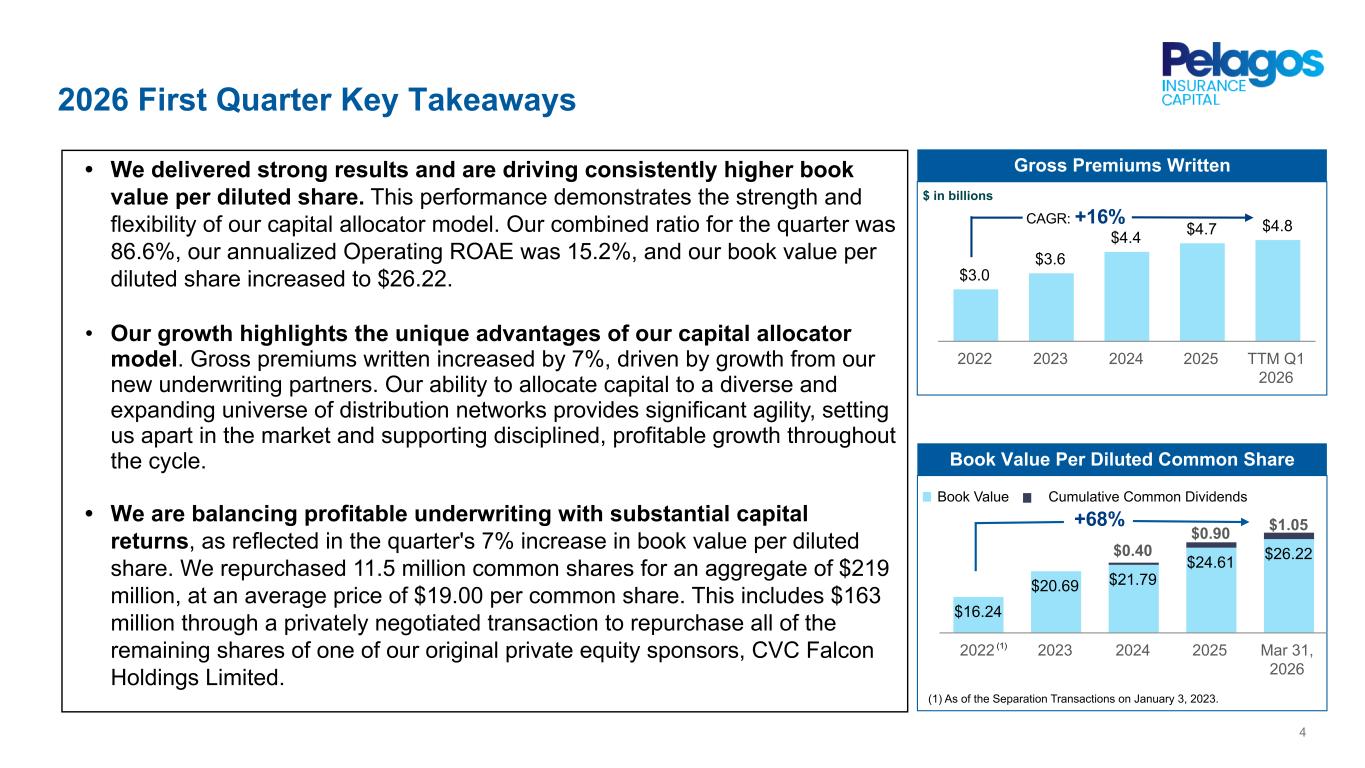
$16.24 $20.69 $21.79 $24.61 $26.22$0.40 $0.90 $1.05 2022 2023 2024 2025 Mar 31, 2026 2026 First Quarter Key Takeaways 4 • We delivered strong results and are driving consistently higher book value per diluted share. This performance demonstrates the strength and flexibility of our capital allocator model. Our combined ratio for the quarter was 86.6%, our annualized Operating ROAE was 15.2%, and our book value per diluted share increased to $26.22. • Our growth highlights the unique advantages of our capital allocator model. Gross premiums written increased by 7%, driven by growth from our new underwriting partners. Our ability to allocate capital to a diverse and expanding universe of distribution networks provides significant agility, setting us apart in the market and supporting disciplined, profitable growth throughout the cycle. • We are balancing profitable underwriting with substantial capital returns, as reflected in the quarter's 7% increase in book value per diluted share. We repurchased 11.5 million common shares for an aggregate of $219 million, at an average price of $19.00 per common share. This includes $163 million through a privately negotiated transaction to repurchase all of the remaining shares of one of our original private equity sponsors, CVC Falcon Holdings Limited. $3.0 $3.6 $4.4 $4.7 $4.8 2022 2023 2024 2025 TTM Q1 2026 Gross Premiums Written CAGR: +16% Book Value Cumulative Common Dividends Book Value Per Diluted Common Share +68% (1) (1) As of the Separation Transactions on January 3, 2023. $ in billions
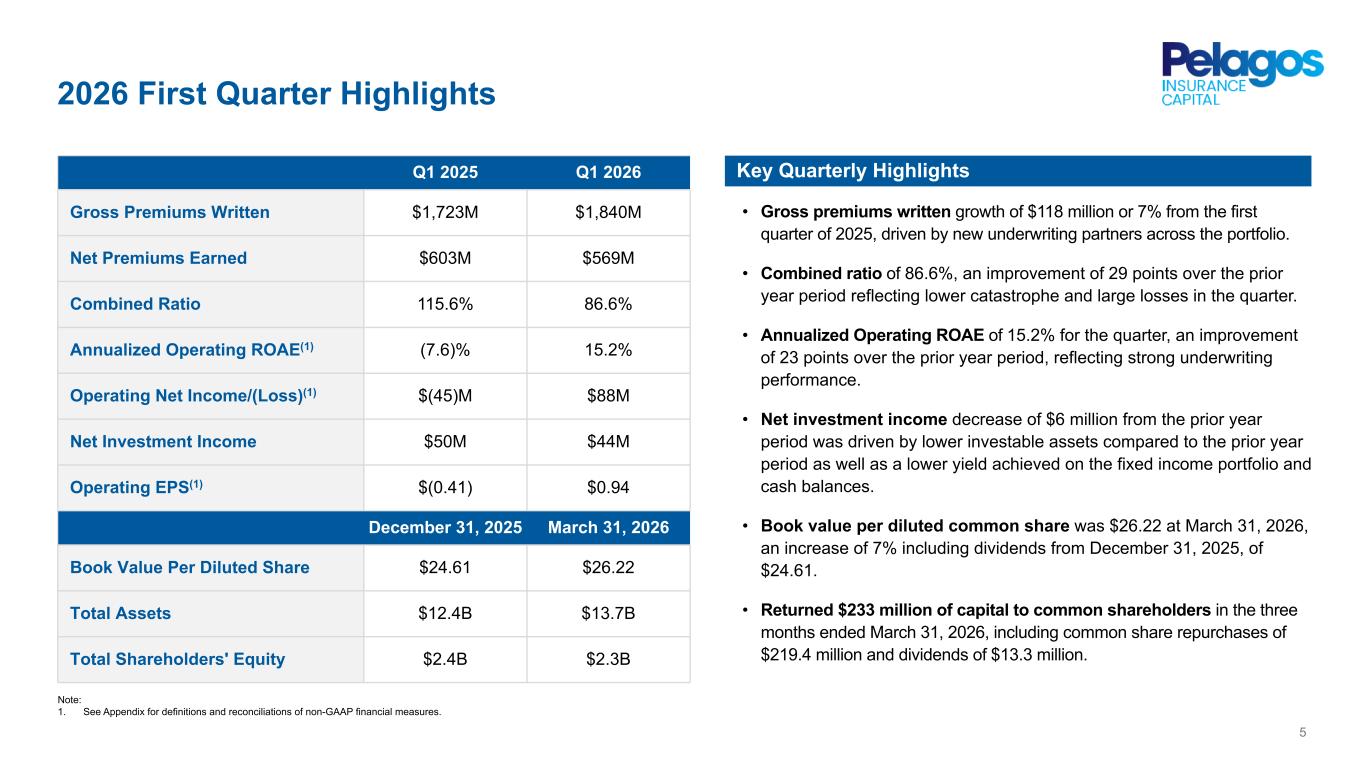
Key Quarterly Highlights 2026 First Quarter Highlights Note: 1. See Appendix for definitions and reconciliations of non-GAAP financial measures. Q1 2025 Q1 2026 Gross Premiums Written $1,723M $1,840M Net Premiums Earned $603M $569M Combined Ratio 115.6% 86.6% Annualized Operating ROAE(1) (7.6)% 15.2% Operating Net Income/(Loss)(1) $(45)M $88M Net Investment Income $50M $44M Operating EPS(1) $(0.41) $0.94 December 31, 2025 March 31, 2026 Book Value Per Diluted Share $24.61 $26.22 Total Assets $12.4B $13.7B Total Shareholders' Equity $2.4B $2.3B • Gross premiums written growth of $118 million or 7% from the first quarter of 2025, driven by new underwriting partners across the portfolio. • Combined ratio of 86.6%, an improvement of 29 points over the prior year period reflecting lower catastrophe and large losses in the quarter. • Annualized Operating ROAE of 15.2% for the quarter, an improvement of 23 points over the prior year period, reflecting strong underwriting performance. • Net investment income decrease of $6 million from the prior year period was driven by lower investable assets compared to the prior year period as well as a lower yield achieved on the fixed income portfolio and cash balances. • Book value per diluted common share was $26.22 at March 31, 2026, an increase of 7% including dividends from December 31, 2025, of $24.61. • Returned $233 million of capital to common shareholders in the three months ended March 31, 2026, including common share repurchases of $219.4 million and dividends of $13.3 million. 5
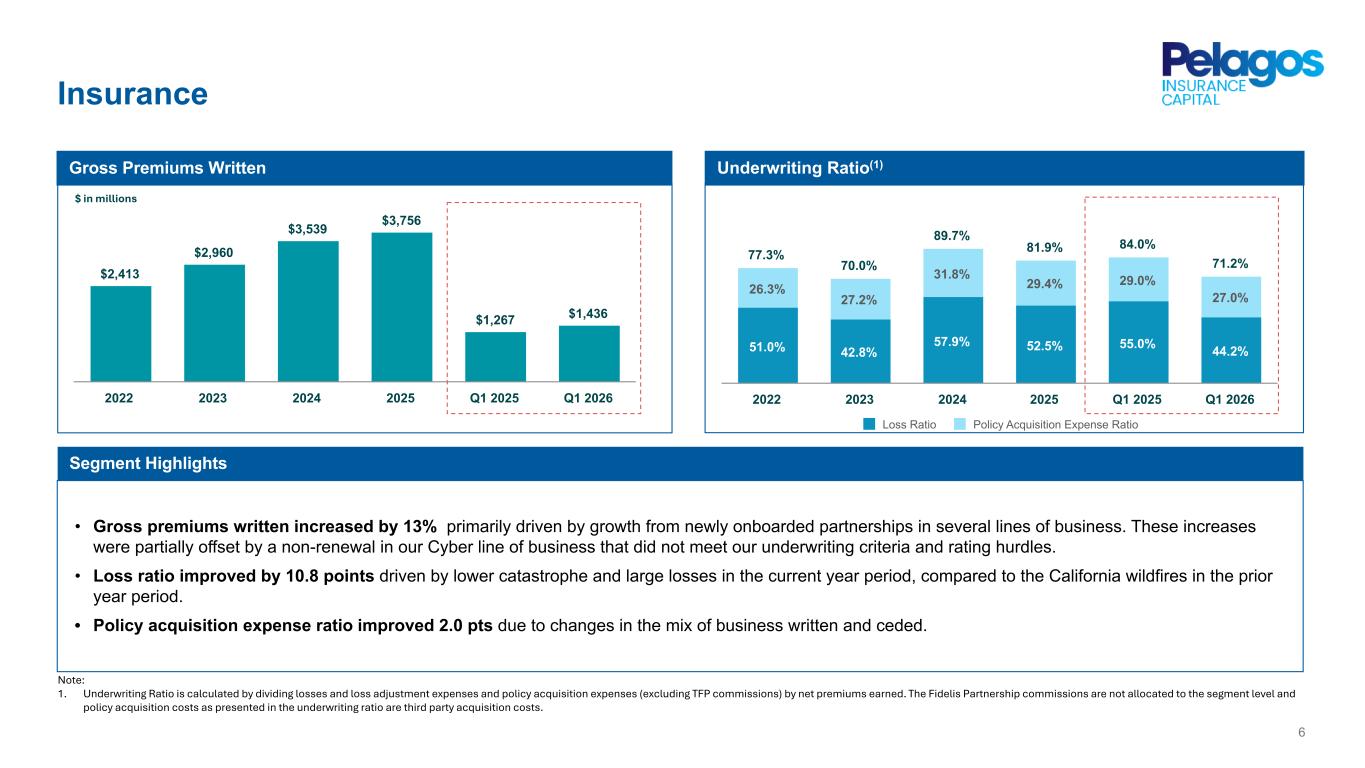
77.3% 70.0% 89.7% 81.9% 84.0% 71.2% 51.0% 42.8% 57.9% 52.5% 55.0% 44.2% 26.3% 27.2% 31.8% 29.4% 29.0% 27.0% Loss Ratio Policy Acquisition Expense Ratio 2022 2023 2024 2025 Q1 2025 Q1 2026 $2,413 $2,960 $3,539 $3,756 $1,267 $1,436 2022 2023 2024 2025 Q1 2025 Q1 2026 6 Insurance Note: 1. Underwriting Ratio is calculated by dividing losses and loss adjustment expenses and policy acquisition expenses (excluding TFP commissions) by net premiums earned. The Fidelis Partnership commissions are not allocated to the segment level and policy acquisition costs as presented in the underwriting ratio are third party acquisition costs. Gross Premiums Written Segment Highlights Underwriting Ratio(1) • Gross premiums written increased by 13% primarily driven by growth from newly onboarded partnerships in several lines of business. These increases were partially offset by a non-renewal in our Cyber line of business that did not meet our underwriting criteria and rating hurdles. • Loss ratio improved by 10.8 points driven by lower catastrophe and large losses in the current year period, compared to the California wildfires in the prior year period. • Policy acquisition expense ratio improved 2.0 pts due to changes in the mix of business written and ceded. $ in millions
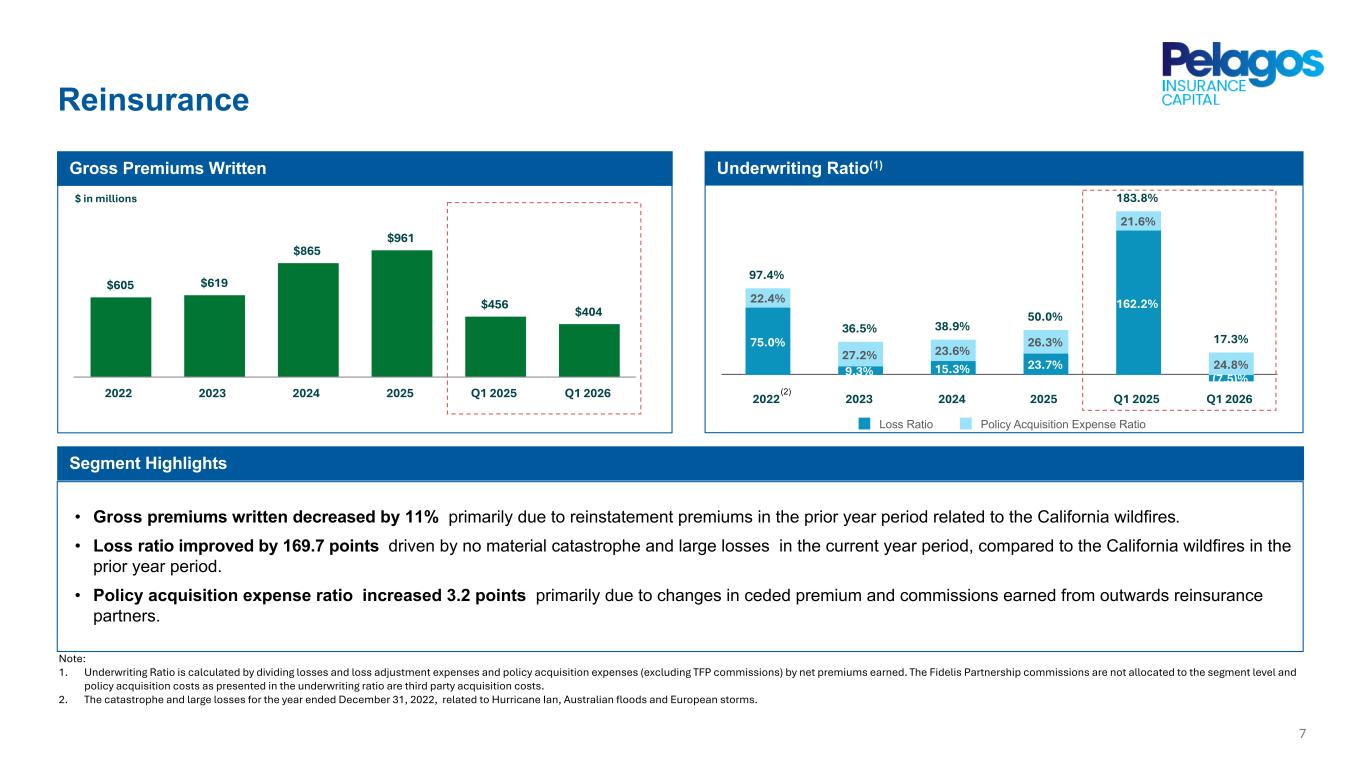
97.4% 36.5% 38.9% 50.0% 183.8% 17.3%75.0% 9.3% 15.3% 23.7% 162.2% (7.5)% 22.4% 27.2% 23.6% 26.3% 21.6% 24.8% Loss Ratio Policy Acquisition Expense Ratio 2022 2023 2024 2025 Q1 2025 Q1 2026 $605 $619 $865 $961 $456 $404 2022 2023 2024 2025 Q1 2025 Q1 2026 7 Reinsurance Note: 1. Underwriting Ratio is calculated by dividing losses and loss adjustment expenses and policy acquisition expenses (excluding TFP commissions) by net premiums earned. The Fidelis Partnership commissions are not allocated to the segment level and policy acquisition costs as presented in the underwriting ratio are third party acquisition costs. 2. The catastrophe and large losses for the year ended December 31, 2022, related to Hurricane Ian, Australian floods and European storms. • Gross premiums written decreased by 11% primarily due to reinstatement premiums in the prior year period related to the California wildfires. • Loss ratio improved by 169.7 points driven by no material catastrophe and large losses in the current year period, compared to the California wildfires in the prior year period. • Policy acquisition expense ratio increased 3.2 points primarily due to changes in ceded premium and commissions earned from outwards reinsurance partners. $ in millions Gross Premiums Written Segment Highlights Underwriting Ratio(1) (2)
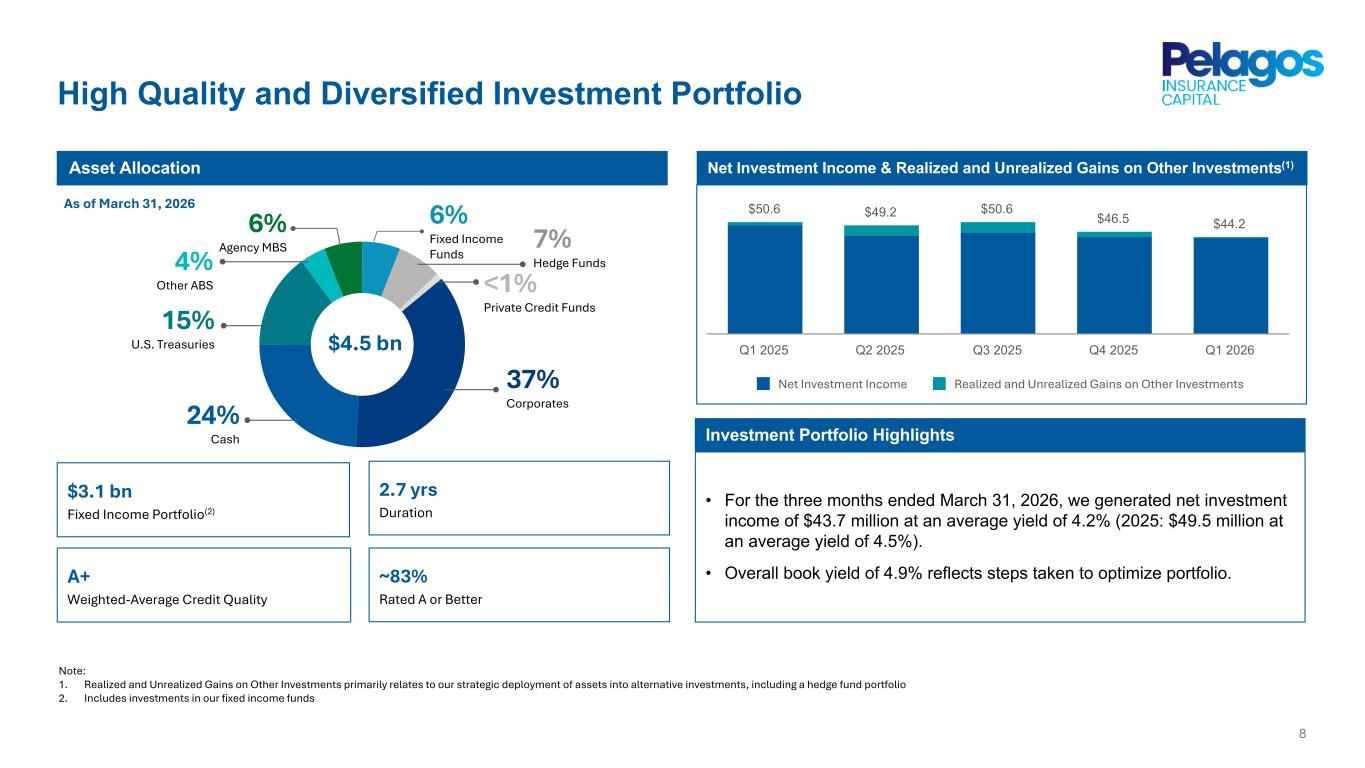
$50.6 $49.2 $50.6 $46.5 $44.2 Net Investment Income Realized and Unrealized Gains on Other Investments Q1 2025 Q2 2025 Q3 2025 Q4 2025 Q1 2026 • For the three months ended March 31, 2026, we generated net investment income of $43.7 million at an average yield of 4.2% (2025: $49.5 million at an average yield of 4.5%). • Overall book yield of 4.9% reflects steps taken to optimize portfolio. High Quality and Diversified Investment Portfolio 8 Note: 1. Realized and Unrealized Gains on Other Investments primarily relates to our strategic deployment of assets into alternative investments, including a hedge fund portfolio 2. Includes investments in our fixed income funds Asset Allocation As of March 31, 2026 $3.1 bn Fixed Income Portfolio(2) 2.7 yrs Duration A+ Weighted-Average Credit Quality ~83% Rated A or Better 37% Corporates 7% Hedge Funds 6% Agency MBS 4% Other ABS 15% U.S. Treasuries 24% Cash $4.5 bn Investment Portfolio Highlights Net Investment Income & Realized and Unrealized Gains on Other Investments(1) 6% Fixed Income Funds <1% Private Credit Funds
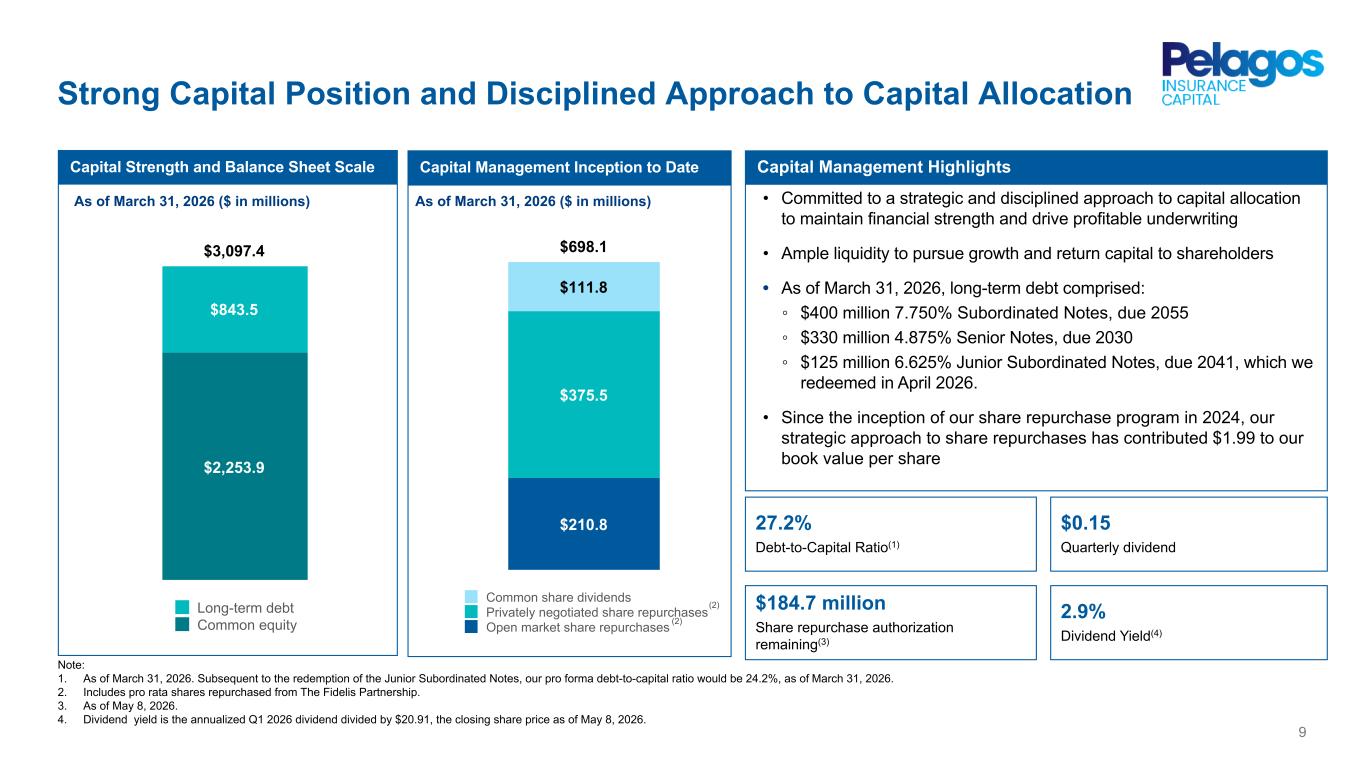
9 • Committed to a strategic and disciplined approach to capital allocation to maintain financial strength and drive profitable underwriting • Ample liquidity to pursue growth and return capital to shareholders • As of March 31, 2026, long-term debt comprised: ◦ $400 million 7.750% Subordinated Notes, due 2055 ◦ $330 million 4.875% Senior Notes, due 2030 ◦ $125 million 6.625% Junior Subordinated Notes, due 2041, which we redeemed in April 2026. • Since the inception of our share repurchase program in 2024, our strategic approach to share repurchases has contributed $1.99 to our book value per share Capital Management HighlightsCapital Strength and Balance Sheet Scale Strong Capital Position and Disciplined Approach to Capital Allocation $698.1 $210.8 $375.5 $111.8 Common share dividends Privately negotiated share repurchases Open market share repurchases $3,097.4 $2,253.9 $843.5 Long-term debt Common equity Note: 1. As of March 31, 2026. Subsequent to the redemption of the Junior Subordinated Notes, our pro forma debt-to-capital ratio would be 24.2%, as of March 31, 2026. 2. Includes pro rata shares repurchased from The Fidelis Partnership. 3. As of May 8, 2026. 4. Dividend yield is the annualized Q1 2026 dividend divided by $20.91, the closing share price as of May 8, 2026. As of March 31, 2026 ($ in millions) Capital Management Inception to Date As of March 31, 2026 ($ in millions) (2) 27.2% Debt-to-Capital Ratio(1) $0.15 Quarterly dividend $184.7 million Share repurchase authorization remaining(3) 2.9% Dividend Yield(4) (2)
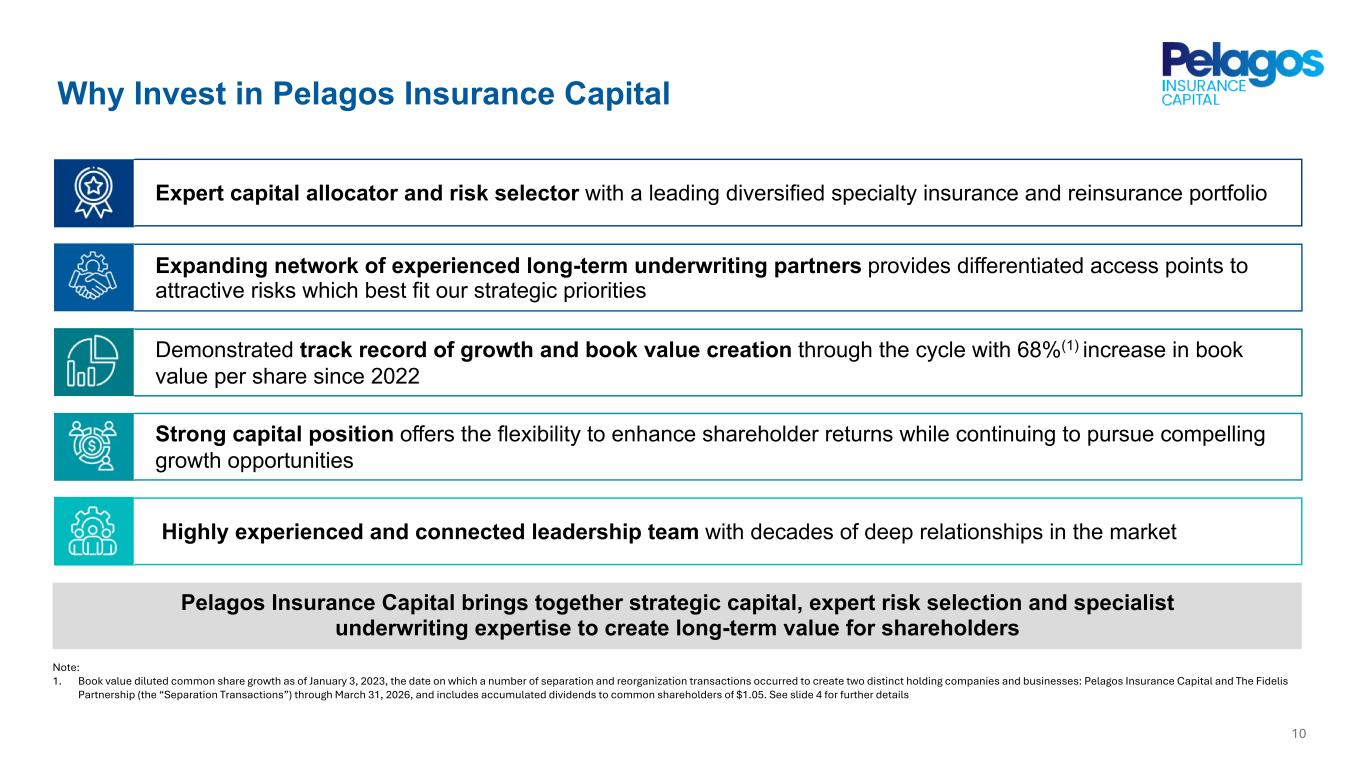
Expert capital allocator and risk selector with a leading diversified specialty insurance and reinsurance portfolio Expanding network of experienced long-term underwriting partners provides differentiated access points to attractive risks which best fit our strategic priorities Demonstrated track record of growth and book value creation through the cycle with 68%(1) increase in book value per share since 2022 Strong capital position offers the flexibility to enhance shareholder returns while continuing to pursue compelling growth opportunities Pelagos Insurance Capital brings together strategic capital, expert risk selection and specialist underwriting expertise to create long-term value for shareholders 10 Highly experienced and connected leadership team with decades of deep relationships in the market Note: 1. Book value diluted common share growth as of January 3, 2023, the date on which a number of separation and reorganization transactions occurred to create two distinct holding companies and businesses: Pelagos Insurance Capital and The Fidelis Partnership (the “Separation Transactions”) through March 31, 2026, and includes accumulated dividends to common shareholders of $1.05. See slide 4 for further details Why Invest in Pelagos Insurance Capital
Appendix
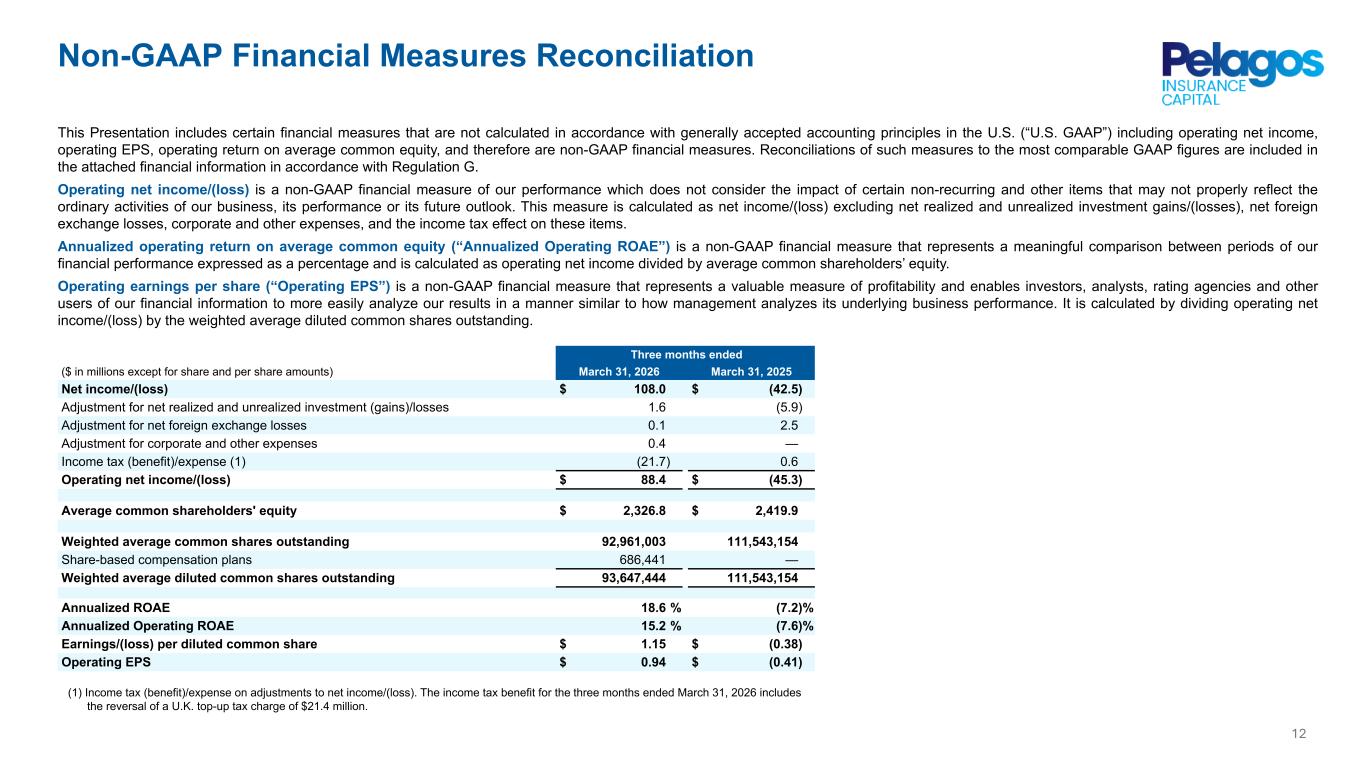
Non-GAAP Financial Measures Reconciliation Three months ended ($ in millions except for share and per share amounts) March 31, 2026 March 31, 2025 Net income/(loss) $ 108.0 $ (42.5) Adjustment for net realized and unrealized investment (gains)/losses 1.6 (5.9) Adjustment for net foreign exchange losses 0.1 2.5 Adjustment for corporate and other expenses 0.4 — Income tax (benefit)/expense (1) (21.7) 0.6 Operating net income/(loss) $ 88.4 $ (45.3) Average common shareholders' equity $ 2,326.8 $ 2,419.9 Weighted average common shares outstanding 92,961,003 111,543,154 Share-based compensation plans 686,441 — Weighted average diluted common shares outstanding 93,647,444 111,543,154 Annualized ROAE 18.6 % (7.2) % Annualized Operating ROAE 15.2 % (7.6) % Earnings/(loss) per diluted common share $ 1.15 $ (0.38) Operating EPS $ 0.94 $ (0.41) 12 This Presentation includes certain financial measures that are not calculated in accordance with generally accepted accounting principles in the U.S. (“U.S. GAAP”) including operating net income, operating EPS, operating return on average common equity, and therefore are non-GAAP financial measures. Reconciliations of such measures to the most comparable GAAP figures are included in the attached financial information in accordance with Regulation G. Operating net income/(loss) is a non-GAAP financial measure of our performance which does not consider the impact of certain non-recurring and other items that may not properly reflect the ordinary activities of our business, its performance or its future outlook. This measure is calculated as net income/(loss) excluding net realized and unrealized investment gains/(losses), net foreign exchange losses, corporate and other expenses, and the income tax effect on these items. Annualized operating return on average common equity (“Annualized Operating ROAE”) is a non-GAAP financial measure that represents a meaningful comparison between periods of our financial performance expressed as a percentage and is calculated as operating net income divided by average common shareholders’ equity. Operating earnings per share (“Operating EPS”) is a non-GAAP financial measure that represents a valuable measure of profitability and enables investors, analysts, rating agencies and other users of our financial information to more easily analyze our results in a manner similar to how management analyzes its underlying business performance. It is calculated by dividing operating net income/(loss) by the weighted average diluted common shares outstanding. (1) Income tax (benefit)/expense on adjustments to net income/(loss). The income tax benefit for the three months ended March 31, 2026 includes the reversal of a U.K. top-up tax charge of $21.4 million.

W: pelagosinsurancecapital.com T: +1 441 279 2590 Wellesley House South 4th Floor, 90 Pitts Bay Road, Pembroke HM 08 Bermuda