
Q4 2025 Update February 10th, 2026
Table of Contents Key Highlights Financial Summary MAUs &
Subscribers Product & Platform Outlook Financial Statements Executive Summary p.03 p.04 p.06 p.13 p.16 p.19 p.22
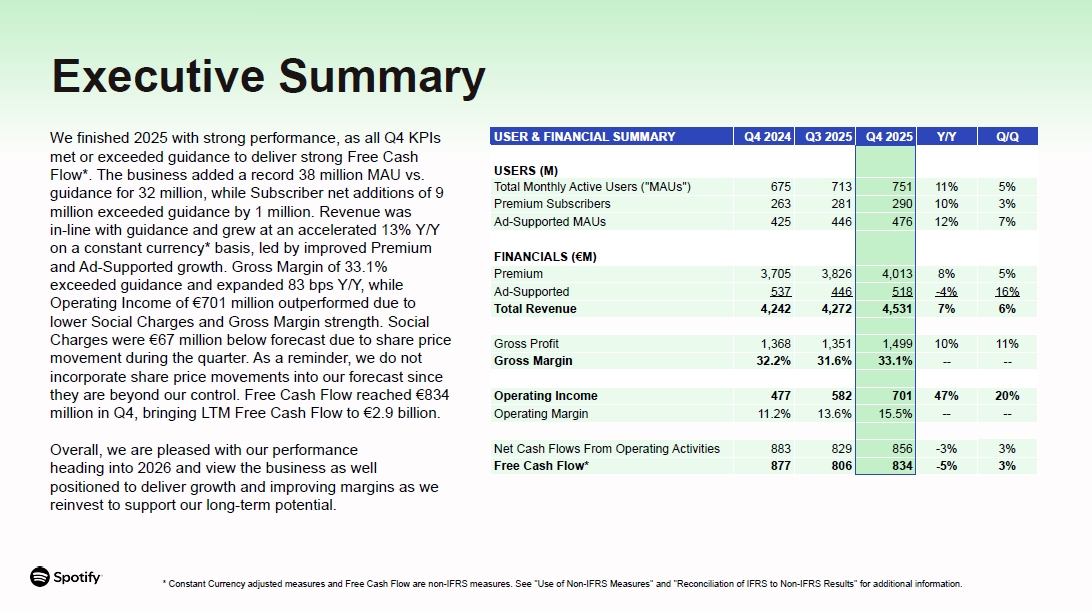
Executive Summary USER & FINANCIAL SUMMARY Q4 2024 Q3 2025 Q4
2025 Y/Y Q/Q USERS (M) Total Monthly Active Users ("MAUs") 675 713 751 11% 5% Premium Subscribers 263 281 290 10% 3% Ad-Supported MAUs 425 446 476 12% 7% FINANCIALS
(€M) Premium 3,705 3,826 4,013 8% 5% Ad-Supported 537 446 518 -4% 16% Total Revenue 4,242 4,272 4,531 7% 6% Gross Profit 1,368 1,351 1,499 10% 11% Gross Margin 32.2% 31.6% 33.1% -- -- Operating
Income 477 582 701 47% 20% Operating Margin 11.2% 13.6% 15.5% -- -- Net Cash Flows From Operating Activities 883 829 856 -3% 3% Free Cash Flow* 877 806 834 -5% 3% * Constant Currency adjusted measures and Free Cash
Flow are non-IFRS measures. See "Use of Non-IFRS Measures" and "Reconciliation of IFRS to Non-IFRS Results" for additional information. We finished 2025 with strong performance, as all Q4 KPIs met or exceeded guidance to deliver strong
Free Cash Flow*. The business added a record 38 million MAU vs. guidance for 32 million, while Subscriber net additions of 9 million exceeded guidance by 1 million. Revenue was in-line with guidance and grew at an accelerated 13% Y/Y on a
constant currency* basis, led by improved Premium and Ad-Supported growth. Gross Margin of 33.1% exceeded guidance and expanded 83 bps Y/Y, while Operating Income of €701 million outperformed due to lower Social Charges and Gross Margin
strength. Social Charges were €67 million below forecast due to share price movement during the quarter. As a reminder, we do not incorporate share price movements into our forecast since they are beyond our control. Free Cash Flow reached
€834 million in Q4, bringing LTM Free Cash Flow to €2.9 billion. Overall, we are pleased with our performance heading into 2026 and view the business as well positioned to deliver growth and improving margins as we reinvest to support our
long-term potential.
* Constant Currency adjusted measures and Free Cash Flow are non-IFRS
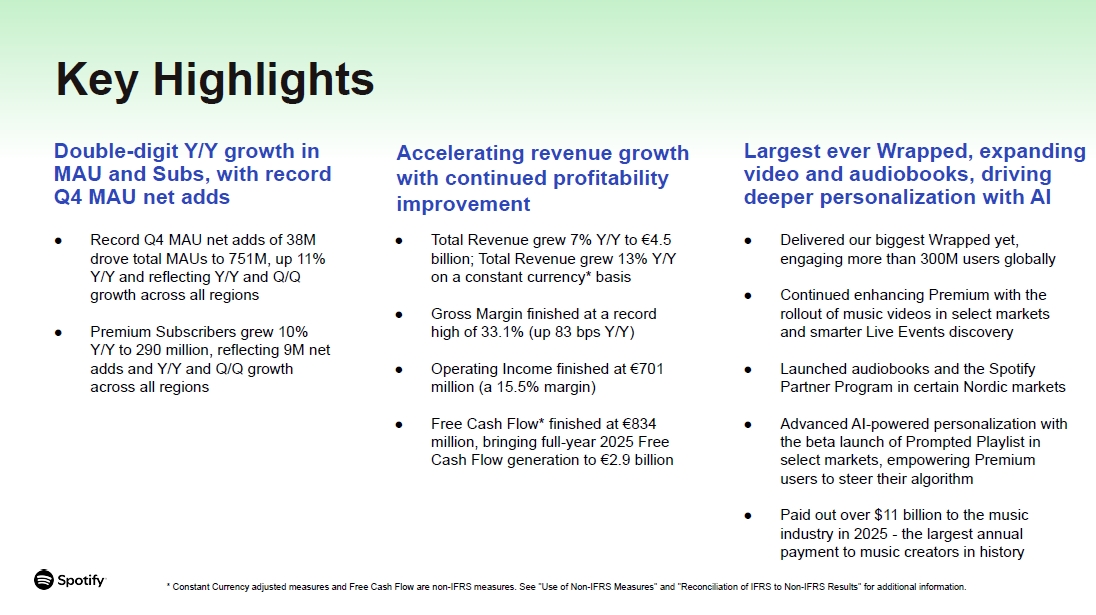
measures. See "Use of Non-IFRS Measures" and "Reconciliation of IFRS to Non-IFRS Results" for additional information. Double-digit Y/Y growth in MAU and Subs, with record Q4 MAU net adds Delivered our biggest Wrapped yet, engaging more
than 300M users globally Continued enhancing Premium with the rollout of music videos in select markets and smarter Live Events discovery Launched audiobooks and the Spotify Partner Program in certain Nordic markets Advanced AI-powered
personalization with the beta launch of Prompted Playlist in select markets, empowering Premium users to steer their algorithm Paid out over $11 billion to the music industry in 2025 - the largest annual payment to music creators in
history Key Highlights Accelerating revenue growth with continued profitability improvement Total Revenue grew 7% Y/Y to €4.5 billion; Total Revenue grew 13% Y/Y on a constant currency* basis Gross Margin finished at a record high of
33.1% (up 83 bps Y/Y) Operating Income finished at €701 million (a 15.5% margin) Free Cash Flow* finished at €834 million, bringing full-year 2025 Free Cash Flow generation to €2.9 billion Largest ever Wrapped, expanding video and
audiobooks, driving deeper personalization with AI Record Q4 MAU net adds of 38M drove total MAUs to 751M, up 11% Y/Y and reflecting Y/Y and Q/Q growth across all regions Premium Subscribers grew 10% Y/Y to 290 million, reflecting 9M net
adds and Y/Y and Q/Q growth across all regions
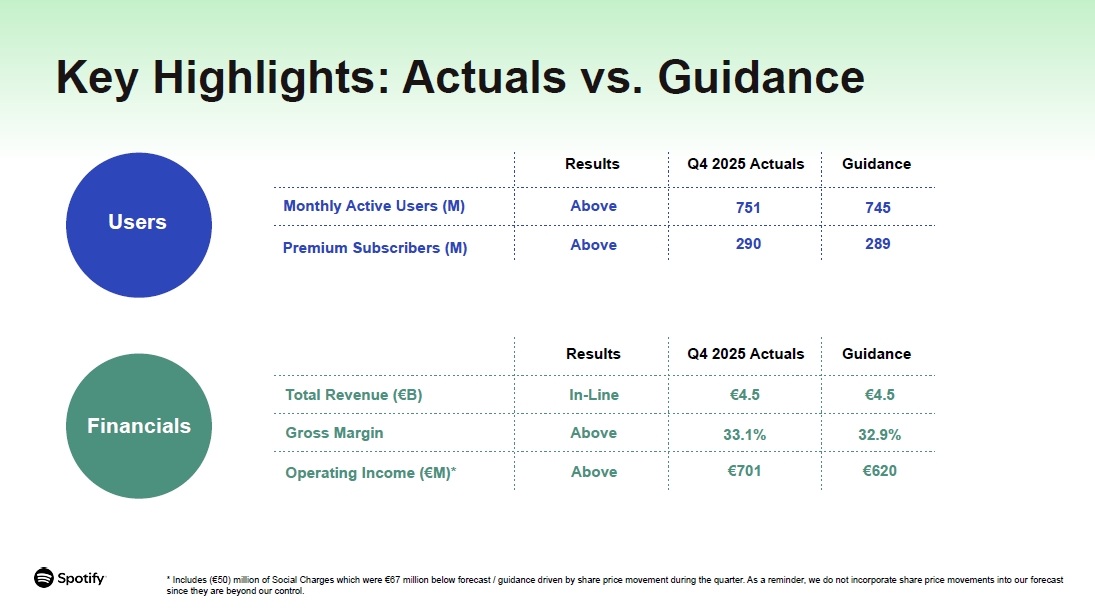
Results Q4 2025 Actuals Guidance Total Revenue
(€B) In-Line €4.5 €4.5 Gross Margin Above 33.1% 32.9% Operating Income (€M)* Above €701 €620 Key Highlights: Actuals vs. Guidance Users Results Q4 2025 Actuals Guidance Monthly Active Users (M) Above 751 745 Premium
Subscribers (M) Above 290 289 Financials * Includes (€50) million of Social Charges which were €67 million below forecast / guidance driven by share price movement during the quarter. As a reminder, we do not incorporate share price
movements into our forecast since they are beyond our control.

FINANCIAL SUMMARY
USER, FINANCIAL & LIQUIDITY SUMMARY Q4 2024 Q1 2025 Q2 2025 Q3 2025 Q4
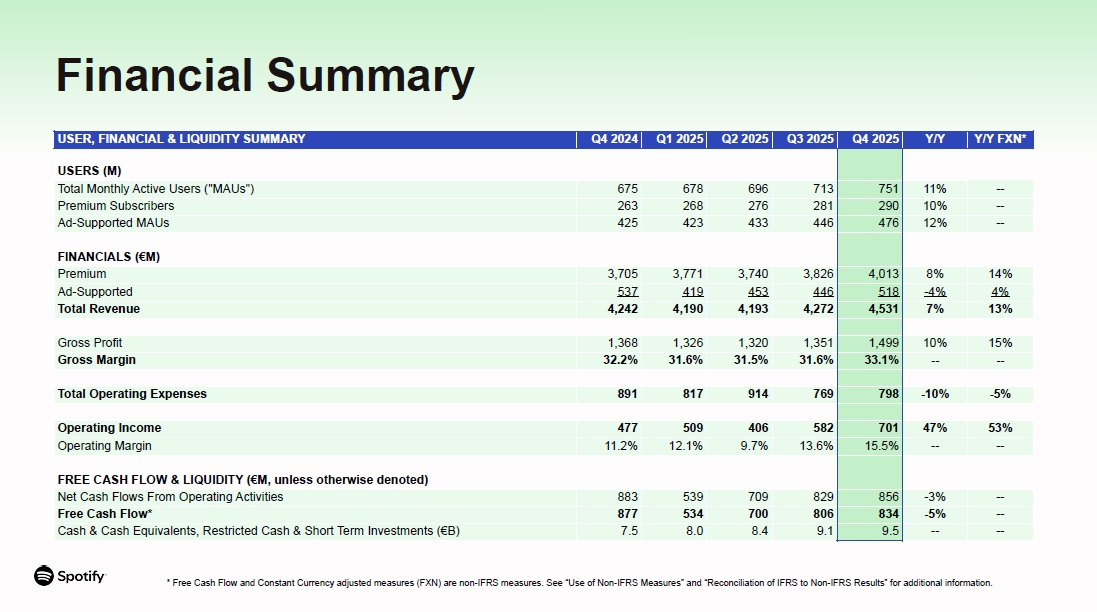
2025 Y/Y Y/Y FXN* USERS (M) Total Monthly Active Users ("MAUs") 675 678 696 713 751 11% -- Premium Subscribers 263 268 276 281 290 10% -- Ad-Supported MAUs 425 423 433 446 476 12% -- FINANCIALS
(€M) Premium 3,705 3,771 3,740 3,826 4,013 8% 14% Ad-Supported 537 419 453 446 518 -4% 4% Total Revenue 4,242 4,190 4,193 4,272 4,531 7% 13% Gross Profit 1,368 1,326 1,320 1,351 1,499 10% 15% Gross
Margin 32.2% 31.6% 31.5% 31.6% 33.1% -- -- Total Operating Expenses 891 817 914 769 798 -10% -5% Operating Income 477 509 406 582 701 47% 53% Operating Margin 11.2% 12.1% 9.7% 13.6% 15.5% -- -- FREE CASH FLOW
& LIQUIDITY (€M, unless otherwise denoted) Net Cash Flows From Operating Activities 883 539 709 829 856 -3% -- Free Cash Flow* 877 534 700 806 834 -5% -- Cash & Cash Equivalents, Restricted Cash & Short Term
Investments (€B) 7.5 8.0 8.4 9.1 9.5 -- -- Financial Summary * Free Cash Flow and Constant Currency adjusted measures (FXN) are non-IFRS measures. See “Use of Non-IFRS Measures” and “Reconciliation of IFRS to Non-IFRS Results” for
additional information.
Revenue Profitability Free Cash Flow & Liquidity Gross Margin was 33.1%
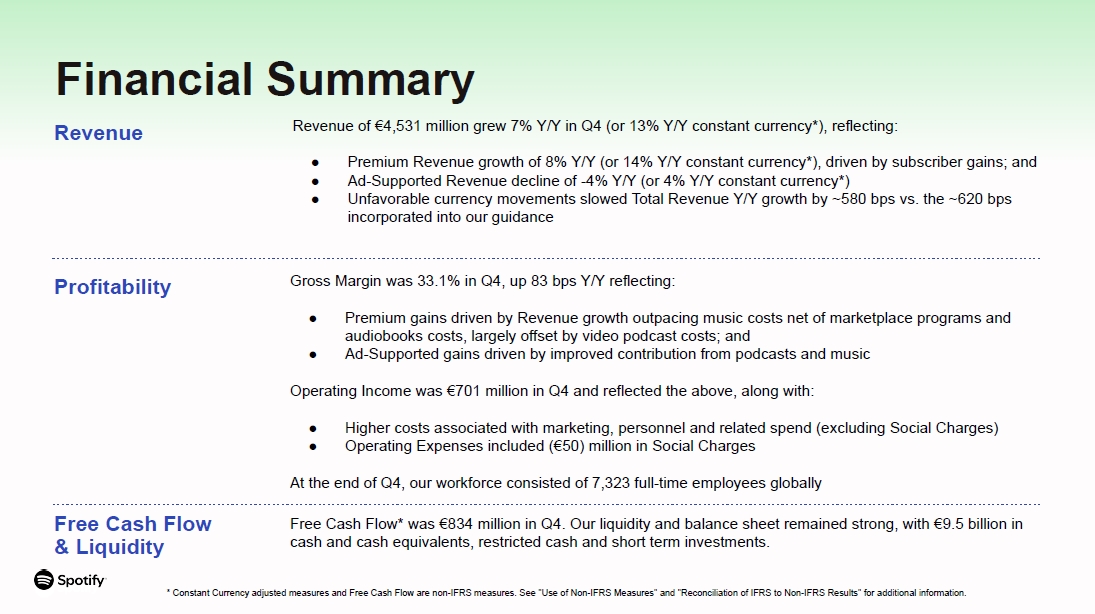
in Q4, up 83 bps Y/Y reflecting: Premium gains driven by Revenue growth outpacing music costs net of marketplace programs and audiobooks costs, largely offset by video podcast costs; and Ad-Supported gains driven by improved contribution
from podcasts and music Operating Income was €701 million in Q4 and reflected the above, along with: Higher costs associated with marketing, personnel and related spend (excluding Social Charges) Operating Expenses included (€50) million
in Social Charges At the end of Q4, our workforce consisted of 7,323 full-time employees globally Revenue of €4,531 million grew 7% Y/Y in Q4 (or 13% Y/Y constant currency*), reflecting: Premium Revenue growth of 8% Y/Y (or 14% Y/Y
constant currency*), driven by subscriber gains; and Ad-Supported Revenue decline of -4% Y/Y (or 4% Y/Y constant currency*) Unfavorable currency movements slowed Total Revenue Y/Y growth by ~580 bps vs. the ~620 bps incorporated into our
guidance Free Cash Flow* was €834 million in Q4. Our liquidity and balance sheet remained strong, with €9.5 billion in cash and cash equivalents, restricted cash and short term investments. Financial Summary * Constant Currency adjusted
measures and Free Cash Flow are non-IFRS measures. See "Use of Non-IFRS Measures" and "Reconciliation of IFRS to Non-IFRS Results" for additional information.
Advertising business transformation continues Ad-Supported Revenue declined
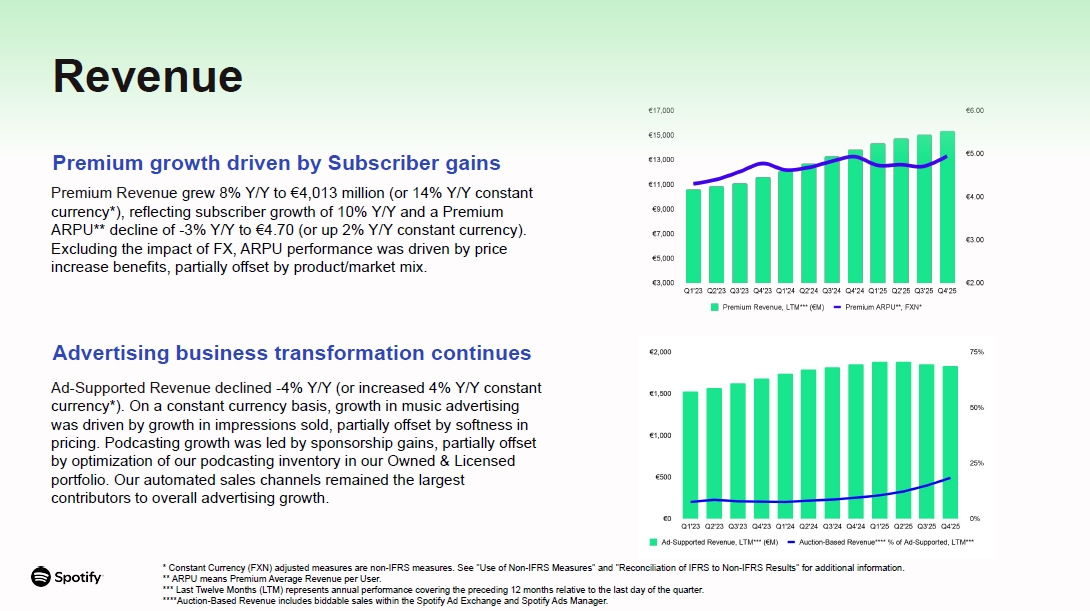
-4% Y/Y (or increased 4% Y/Y constant currency*). On a constant currency basis, growth in music advertising was driven by growth in impressions sold, partially offset by softness in pricing. Podcasting growth was led by sponsorship gains,
partially offset by optimization of our podcasting inventory in our Owned & Licensed portfolio. Our automated sales channels remained the largest contributors to overall advertising growth. Revenue * Constant Currency (FXN) adjusted
measures are non-IFRS measures. See "Use of Non-IFRS Measures" and "Reconciliation of IFRS to Non-IFRS Results" for additional information. ** ARPU means Premium Average Revenue per User. *** Last Twelve Months (LTM) represents annual
performance covering the preceding 12 months relative to the last day of the quarter. ****Auction-Based Revenue includes biddable sales within the Spotify Ad Exchange and Spotify Ads Manager. Premium growth driven by Subscriber
gains Premium Revenue grew 8% Y/Y to €4,013 million (or 14% Y/Y constant currency*), reflecting subscriber growth of 10% Y/Y and a Premium ARPU** decline of -3% Y/Y to €4.70 (or up 2% Y/Y constant currency). Excluding the impact of FX,
ARPU performance was driven by price increase benefits, partially offset by product/market mix.
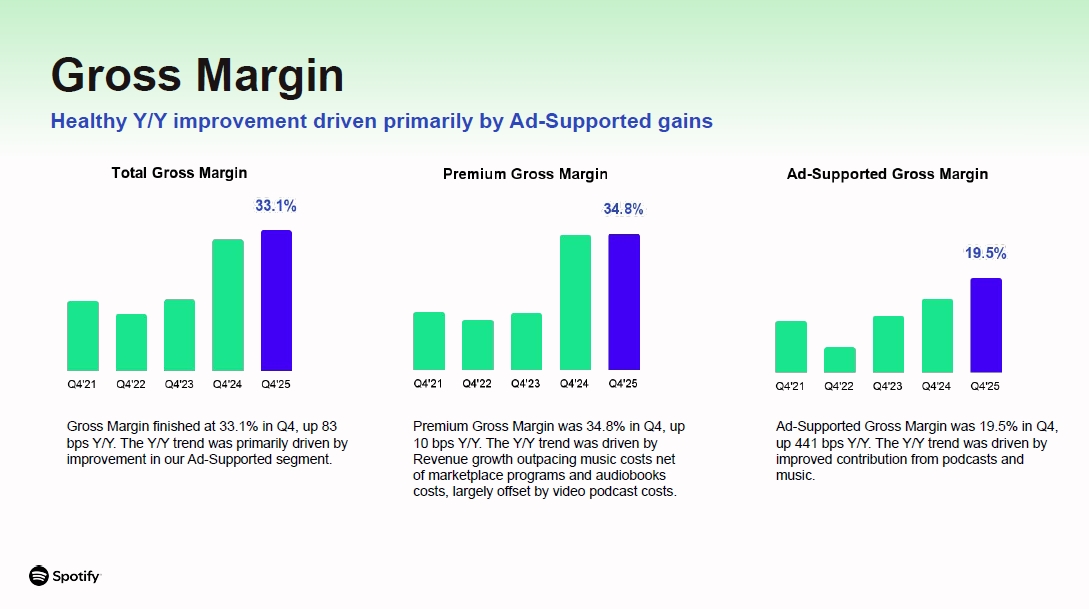
Premium Gross Margin was 34.8% in Q4, up 10 bps Y/Y. The Y/Y trend was driven
by Revenue growth outpacing music costs net of marketplace programs and audiobooks costs, largely offset by video podcast costs. Gross Margin Healthy Y/Y improvement driven primarily by Ad-Supported gains Gross Margin finished at 33.1%
in Q4, up 83 bps Y/Y. The Y/Y trend was primarily driven by improvement in our Ad-Supported segment. Ad-Supported Gross Margin was 19.5% in Q4, up 441 bps Y/Y. The Y/Y trend was driven by improved contribution from podcasts and music.
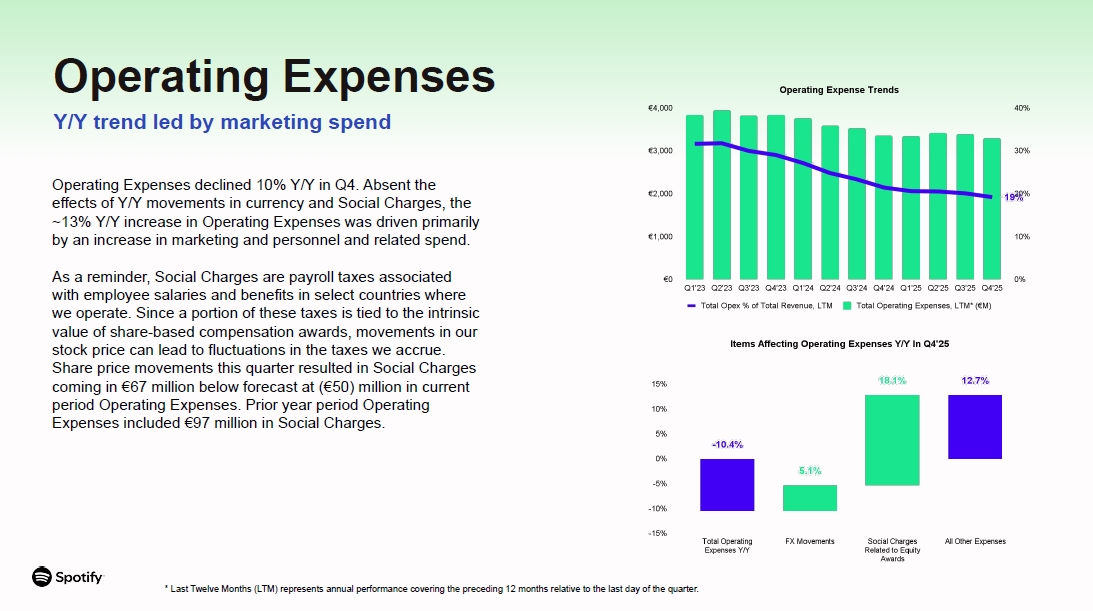
Operating Expenses declined 10% Y/Y in Q4. Absent the effects of Y/Y movements
in currency and Social Charges, the ~13% Y/Y increase in Operating Expenses was driven primarily by an increase in marketing and personnel and related spend. As a reminder, Social Charges are payroll taxes associated with employee
salaries and benefits in select countries where we operate. Since a portion of these taxes is tied to the intrinsic value of share-based compensation awards, movements in our stock price can lead to fluctuations in the taxes we
accrue. Share price movements this quarter resulted in Social Charges coming in €67 million below forecast at (€50) million in current period Operating Expenses. Prior year period Operating Expenses included €97 million in Social
Charges. Operating Expenses Y/Y trend led by marketing spend * Last Twelve Months (LTM) represents annual performance covering the preceding 12 months relative to the last day of the quarter.
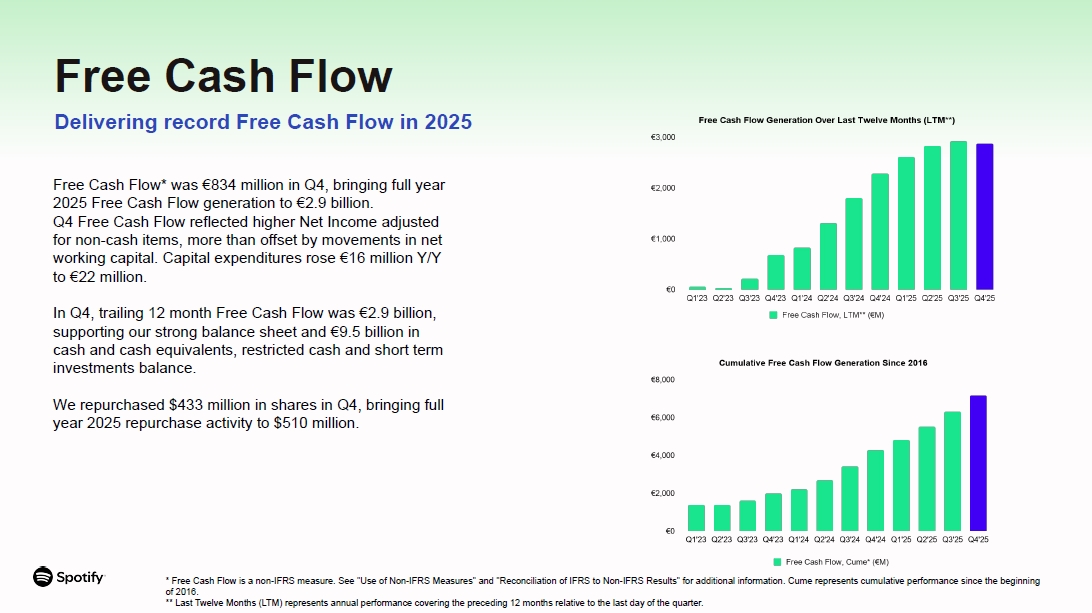
Free Cash Flow Delivering record Free Cash Flow in 2025 Free Cash Flow* was
€834 million in Q4, bringing full year 2025 Free Cash Flow generation to €2.9 billion. Q4 Free Cash Flow reflected higher Net Income adjusted for non-cash items, more than offset by movements in net working capital. Capital expenditures
rose €16 million Y/Y to €22 million. In Q4, trailing 12 month Free Cash Flow was €2.9 billion, supporting our strong balance sheet and €9.5 billion in cash and cash equivalents, restricted cash and short term investments balance. We
repurchased $433 million in shares in Q4, bringing full year 2025 repurchase activity to $510 million. * Free Cash Flow is a non-IFRS measure. See "Use of Non-IFRS Measures" and "Reconciliation of IFRS to Non-IFRS Results" for additional
information. Cume represents cumulative performance since the beginning of 2016. ** Last Twelve Months (LTM) represents annual performance covering the preceding 12 months relative to the last day of the quarter.

MAUS & SUBSCRIBERS
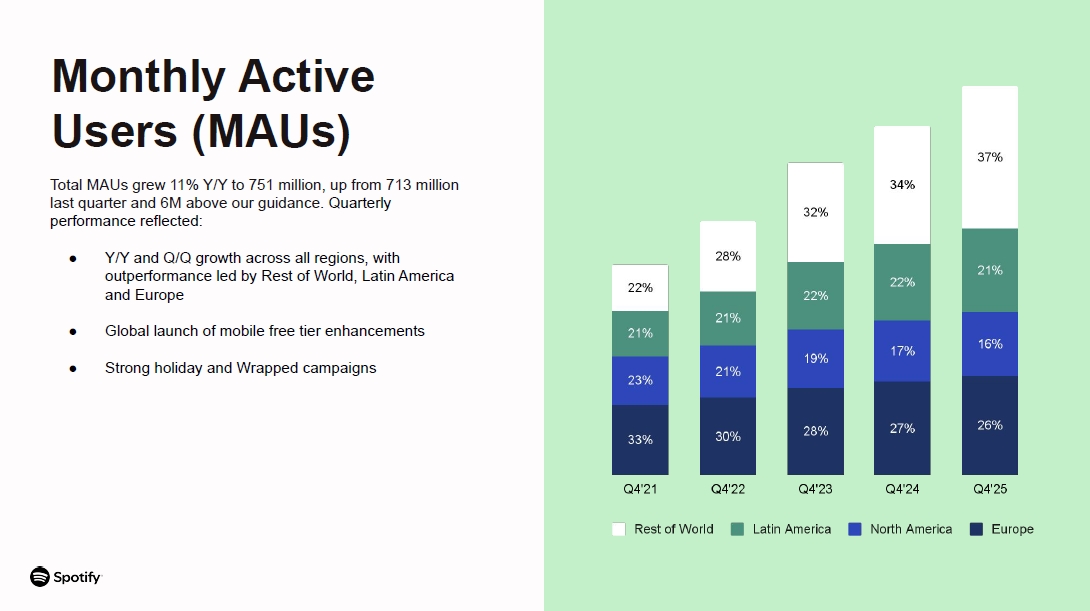
Total MAUs grew 11% Y/Y to 751 million, up from 713 million last quarter and
6M above our guidance. Quarterly performance reflected: Y/Y and Q/Q growth across all regions, with outperformance led by Rest of World, Latin America and Europe Global launch of mobile free tier enhancements Strong holiday and Wrapped
campaigns Monthly Active Users (MAUs)
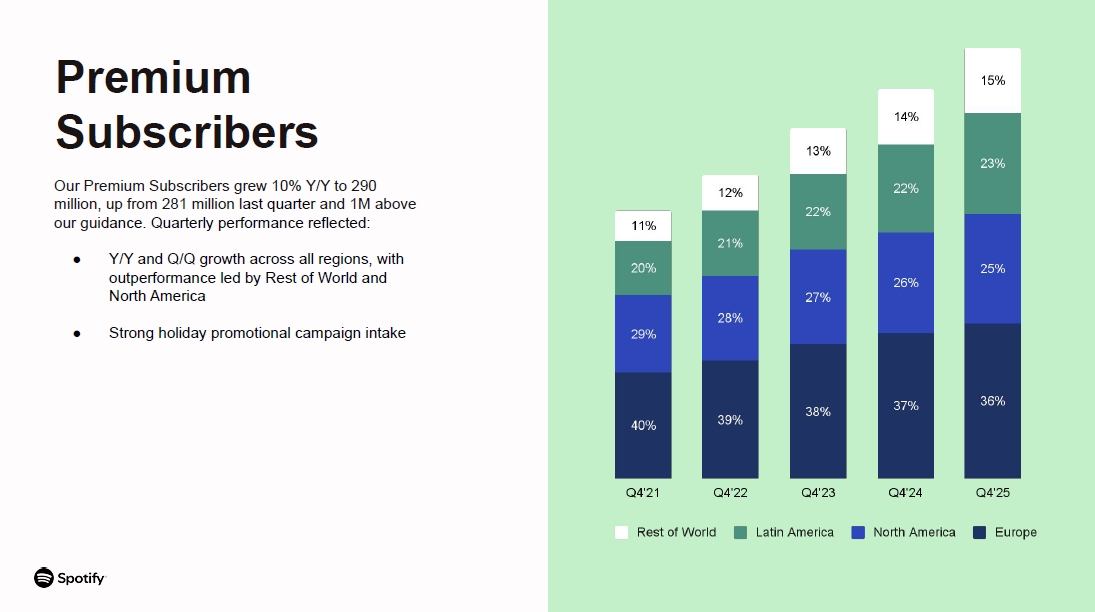
Our Premium Subscribers grew 10% Y/Y to 290 million, up from 281 million last
quarter and 1M above our guidance. Quarterly performance reflected: Y/Y and Q/Q growth across all regions, with outperformance led by Rest of World and North America Strong holiday promotional campaign intake Premium Subscribers

PRODUCT & PLATFORM

Fueling Culture and Connection Between Fans, Creators and Artists Celebrated
our biggest Wrapped yet. Our 11th annual Wrapped was bigger and bolder than ever before, celebrating fans, artists, creators and authors globally. Wrapped amassed more than 300 million engaged users and 630 million shares in 56 languages
globally. Enabling users to search for and follow their favorite venues, the Live Events feed delivers smarter and more personal recommendations with daily updates. All within the app, listeners can discover nearby spots and explore
upcoming lineups - powered by what users stream, where they live and the genres they love. Prompted Playlist puts the power of the algorithm directly into the hands of listeners, allowing Premium users in select markets to describe exactly
what they want to hear in their own words. Informed by listening history and real-time signals from music, culture and trends, the beta continues to expand to more Premium listeners.

Supporting Creators, Authors and Partners Across the Ecosystem Launched music
videos in beta for Premium users in North America, unlocking access to a growing catalog of official videos. The feature brings fans closer to artists and expands how music is experienced on Spotify. Music videos are now available in
Premium in 111 markets. Paid out more than $11 billion to the music industry in 2025 - the largest annual payment to music creators in history - with independent artists and labels accounting for half. We also helped artists generate over
$1 billion in ticket sales by connecting fans with live shows through our ticketing partners. Expanded audiobooks to more markets, adding hundreds of thousands of titles in Sweden, Denmark, Finland, Iceland and Monaco. We also unveiled the
Spotify Partner Program in the Nordics, giving creators new ways to earn, grow and connect with fans.

OUTLOOK
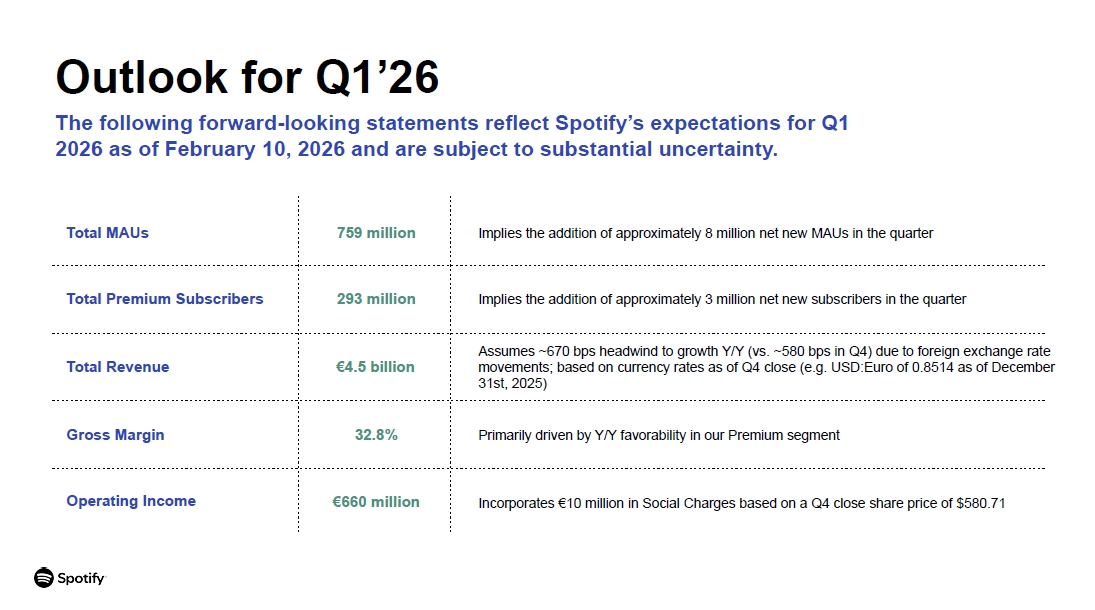
Outlook for Q1’26 The following forward-looking statements reflect Spotify’s
expectations for Q1 2026 as of February 10, 2026 and are subject to substantial uncertainty. Total MAUs 759 million Implies the addition of approximately 8 million net new MAUs in the quarter Total Premium Subscribers 293
million Implies the addition of approximately 3 million net new subscribers in the quarter Total Revenue €4.5 billion Assumes ~670 bps headwind to growth Y/Y (vs. ~580 bps in Q4) due to foreign exchange rate movements; based on currency
rates as of Q4 close (e.g. USD:Euro of 0.8514 as of Decembe 31st, 2025) Gross Margin 32.8% Primarily driven by Y/Y favorability in our Premium segment Operating Income €660 million Incorporates €10 million in Social Charges based on a
Q4 close share price of $580.71 r
Webcast Information We will host a live question and answer session starting
at 8:00 a.m. ET today on investors.spotify.com. Daniel Ek, our Founder and Executive Chairman, Alex Norström and Gustav Söderström, our Co-Chief Executive Officers and Christian Luiga, our Chief Financial Officer will be on hand to answer
questions. Questions can be submitted by going to slido.com and using the code #SpotifyEarningsQ425. Participants also may join using the listen-only conference line by registering through the following site:
https://registrations.events/direct/Q4I57050442. We use investors.spotify.com and newsroom.spotify.com websites as well as other social media listed in the “Resources – Social Media” tab of our Investors website to disclose material
company information. Use of Non-IFRS Measures To supplement our financial information presented in accordance with IFRS, we use the following non-IFRS financial measures: Revenue excluding foreign exchange effect, Premium revenue
excluding foreign exchange effect, Ad-Supported revenue excluding foreign exchange effect, gross profit excluding foreign exchange effect, Operating Income excluding foreign exchange effect, Operating expense excluding foreign exchange
effect, and Free Cash Flow. Management believes that Revenue excluding foreign exchange effect, Premium revenue excluding foreign exchange effect, Ad-Supported revenue excluding foreign exchange effect, gross profit excluding foreign
exchange effect, and Operating expense excluding foreign exchange effect, are useful to investors because they present measures that facilitate comparison to our historical performance. However, these should be considered in addition to,
not as a substitute for or superior to, Revenue, Premium revenue, Ad-Supported revenue, Gross Profit, Operating Income, Operating expense, or other financial measures prepared in accordance with IFRS. Management believes that Free Cash Flow
is useful to investors because it presents a measure that approximates the amount of cash generated that is available to repay debt obligations, to make investments, and for certain other activities that exclude certain infrequently
occurring and/or non-cash items. However, Free Cash Flow should be considered in addition to, not as a substitute for or superior to, net cash flows (used in)/from operating activities or other financial measures prepared in accordance with
IFRS. For more information on these non-IFRS financial measures, please see “Reconciliation of IFRS to Non-IFRS Results” section below. Forward Looking Statements This shareholder update contains estimates and forward-looking statements.
All statements other than statements of historical fact are forward-looking statements. The words “may,” “might,” “will,” “could,” “would,” “should,” “expect,” “plan,” “anticipate,” “intend,” “seek,” “believe,” “estimate,” “predict,”
“potential,” “continue,” “contemplate,” “possible,” and similar words are intended to identify estimates and forward-looking statements. Our estimates and forward-looking statements are mainly based on our current expectations and estimates
of future events and trends, which affect or may affect our businesses and operations. Although we believe that these estimates and forward-looking statements are based upon reasonable assumptions, they are subject to numerous risks and
uncertainties and are made in light of information currently available to us. Many important factors may adversely affect our results as indicated in forward-looking statements. These factors include, but are not limited to: our ability to
attract prospective users, retain existing users, and monetize our products and services; competition for users, their time, and advertisers; risks associated with our international operations and our ability to manage our growth and the
scope and complexity of our business; risks associated with our new products or services and our emphasis on long-term user engagement over short-term results; our ability to provide personalized content that our users enjoy; our ability to
sustain our revenue growth rate; our ability to convince advertisers of the benefits of our advertising offerings; our ability to forecast, optimize, or sell advertising inventory amid evolving industry trends in digital advertising; our
ability to successfully monetize and generate revenues from podcasts, audiobooks, and other non-music content; potential disputes or liabilities associated with content made available on our premium service and ad-supported service
(collectively, the “Service”); risks relating to acquisitions, investments, and divestitures; our dependence upon third-party licenses for most of the content we stream; our lack of control over third-party content providers who are
concentrated and can unilaterally affect our access to content; our ability to comply with complex license agreements; our ability to accurately estimate royalty payments under our license agreements and relevant statutes; the limitations
on our operating flexibility due to financial commitments required under certain of our license agreements; our ability to identify the compositions embodied in sound recordings and audiovisual works and ownership thereof in order to obtain
licenses or comply with existing license agreements; assertions by third parties of infringement or other violations by us of their intellectual property rights; our ability to protect our intellectual property; the dependence of streaming
on operating systems, online platforms, hardware, networks, regulations, and standards that we do not control; our ability to maintain the integrity of our technology infrastructure and systems or the security of confidential information;
undetected errors, misconfigurations, bugs, or vulnerabilities in our products and services; interruptions, delays, or discontinuations in service arising from our systems or systems of third parties; changes in laws or regulations
affecting us; risks relating to privacy and data security, content moderation, use of artificial intelligence, and third parties’ intentional misuse of our products and services; our ability to maintain, protect, and enhance our brand; our
ability to meet evolving stakeholder expectations relating to environmental, social, and governance matters; payment acceptance-related risks; our dependence on key personnel and ability to attract, retain, and motivate highly skilled
employees; our ability to access additional capital to support strategic objectives; risks relating to currency exchange rate fluctuations and foreign exchange controls; the impact of economic, social, or political conditions, including
slower growth or recession, inflation, changes in interest rates, changes in trade and tax policies, geopolitical conflicts, and related market uncertainty; our ability to accurately estimate user metrics and other estimates; our ability to
manage and remediate attempts to manipulate streams and attempts to gain or provide unauthorized access to certain features of our Service; risks related to our indebtedness, including risks related to our Exchangeable Notes; fluctuation of
our operating results and fair market value of ordinary shares; tax-related risks; the concentration of voting power among our founders, which limits shareholders’ ability to influence our governance and business; and risks related to our
status as a foreign private issuer and a Luxembourg company. A detailed discussion of these and other risks and uncertainties that could cause actual results and events to differ materially from our estimates and forward-looking statements
is included in our filings with the U.S. Securities and Exchange Commission (“SEC”), including our Annual Report on Form 20-F filed with the SEC on February 5, 2025, as updated by subsequent reports filed with the SEC. We undertake no
obligation to update forward-looking statements to reflect events or circumstances occurring after the date of this shareholder update. Rounding Certain monetary amounts, percentages, and other figures included in this update have been
subject to rounding adjustments. The sum of individual metrics may not always equal total amounts indicated due to rounding.

FINANCIAL STATEMENTS
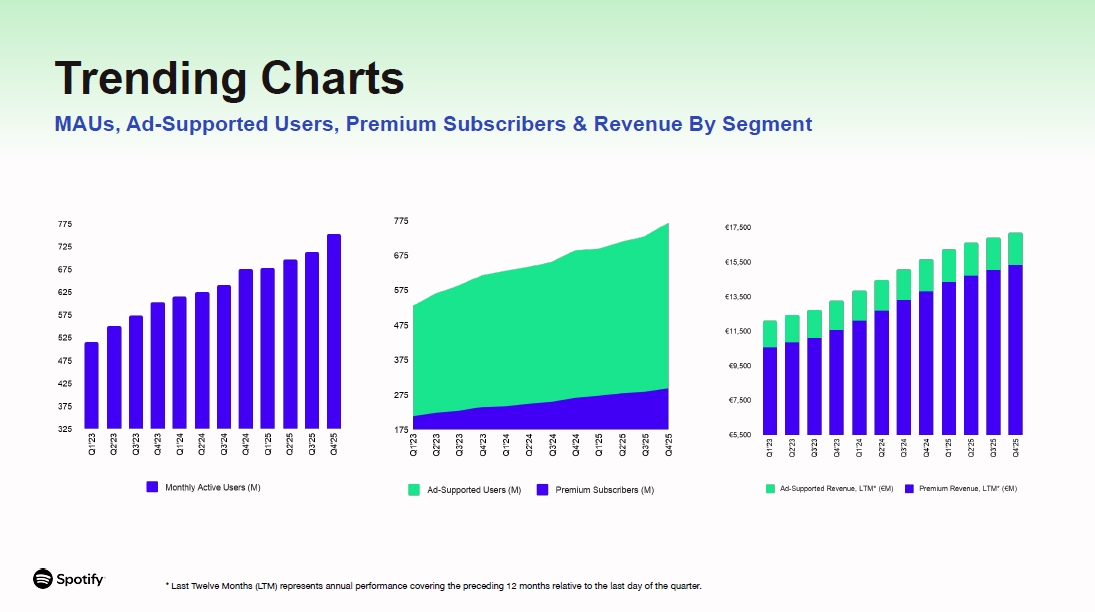
Trending Charts MAUs, Ad-Supported Users, Premium Subscribers & Revenue
By Segment * Last Twelve Months (LTM) represents annual performance covering the preceding 12 months relative to the last day of the quarter.
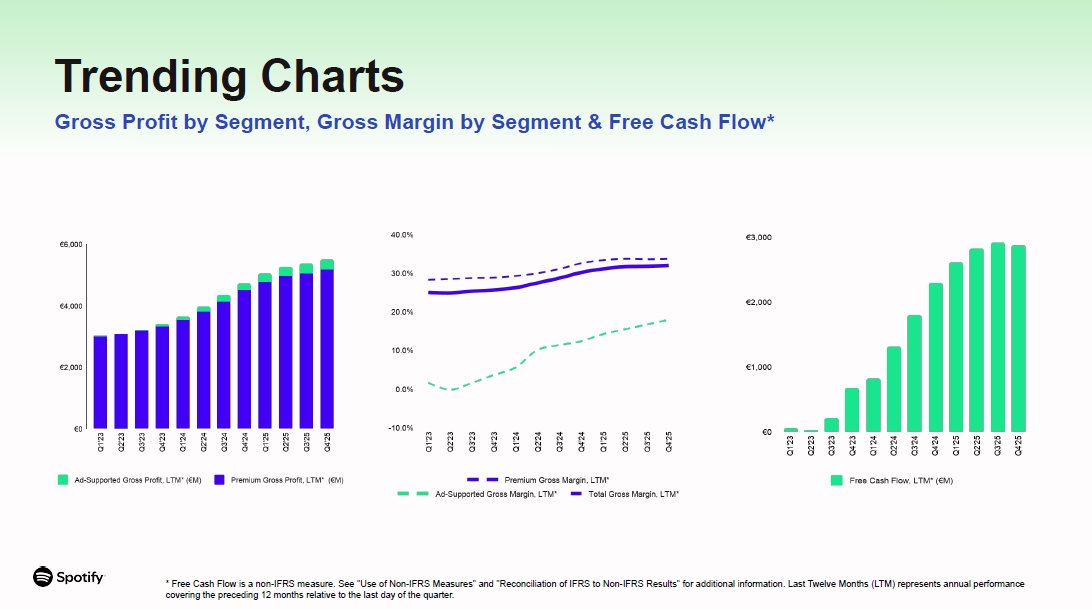
Trending Charts Gross Profit by Segment, Gross Margin by Segment & Free
Cash Flow* * Free Cash Flow is a non-IFRS measure. See "Use of Non-IFRS Measures" and "Reconciliation of IFRS to Non-IFRS Results" for additional information. Last Twelve Months (LTM) represents annual performance covering the preceding 12
months relative to the last day of the quarter.
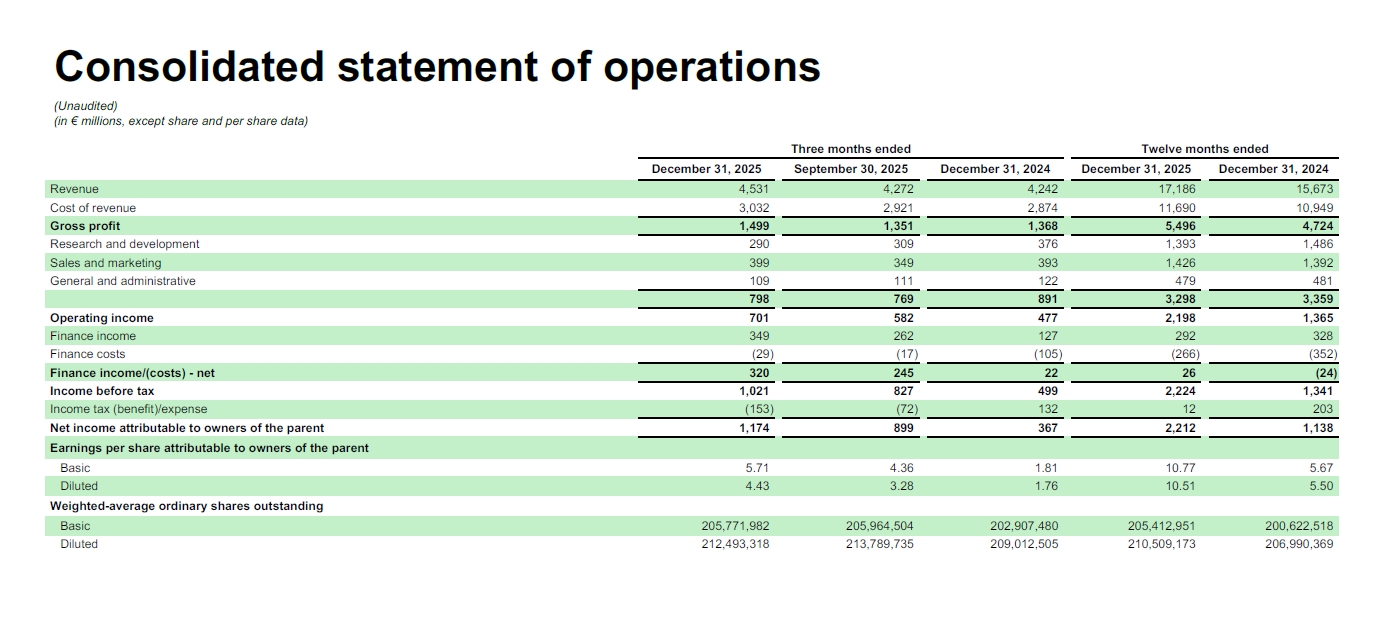
Consolidated statement of operations (Unaudited) (in € millions, except
share and per share data) Three months ended Twelve months ended Revenue December 31, 2025 4,531 September 30, 2025 4,272 December 31, 2024 4,242 December 31, 2025 17,186 December 31, 2024 15,673 Cost of
revenue 3,032 2,921 2,874 11,690 10,949 Gross profit 1,499 1,351 1,368 5,496 4,724 Research and development 290 309 376 1,393 1,486 Sales and marketing 399 349 393 1,426 1,392 General and
administrative 109 111 122 479 481 798 769 891 3,298 3,359 Operating income 701 582 477 2,198 1,365 Finance income 349 262 127 292 328 Finance costs (29) (17) (105) (266) (352) Finance income/(costs) -
net 320 245 22 26 (24) Income before tax 1,021 827 499 2,224 1,341 Income tax (benefit)/expense (153) (72) 132 12 203 Net income attributable to owners of the parent 1,174 899 367 2,212 1,138 Earnings per share
attributable to owners of the parent Basic 5.71 4.36 1.81 10.77 5.67 Diluted 4.43 3.28 1.76 10.51 5.50 Weighted-average ordinary shares
outstanding Basic 205,771,982 205,964,504 202,907,480 205,412,951 200,622,518 Diluted 212,493,318 213,789,735 209,012,505 210,509,173 206,990,369
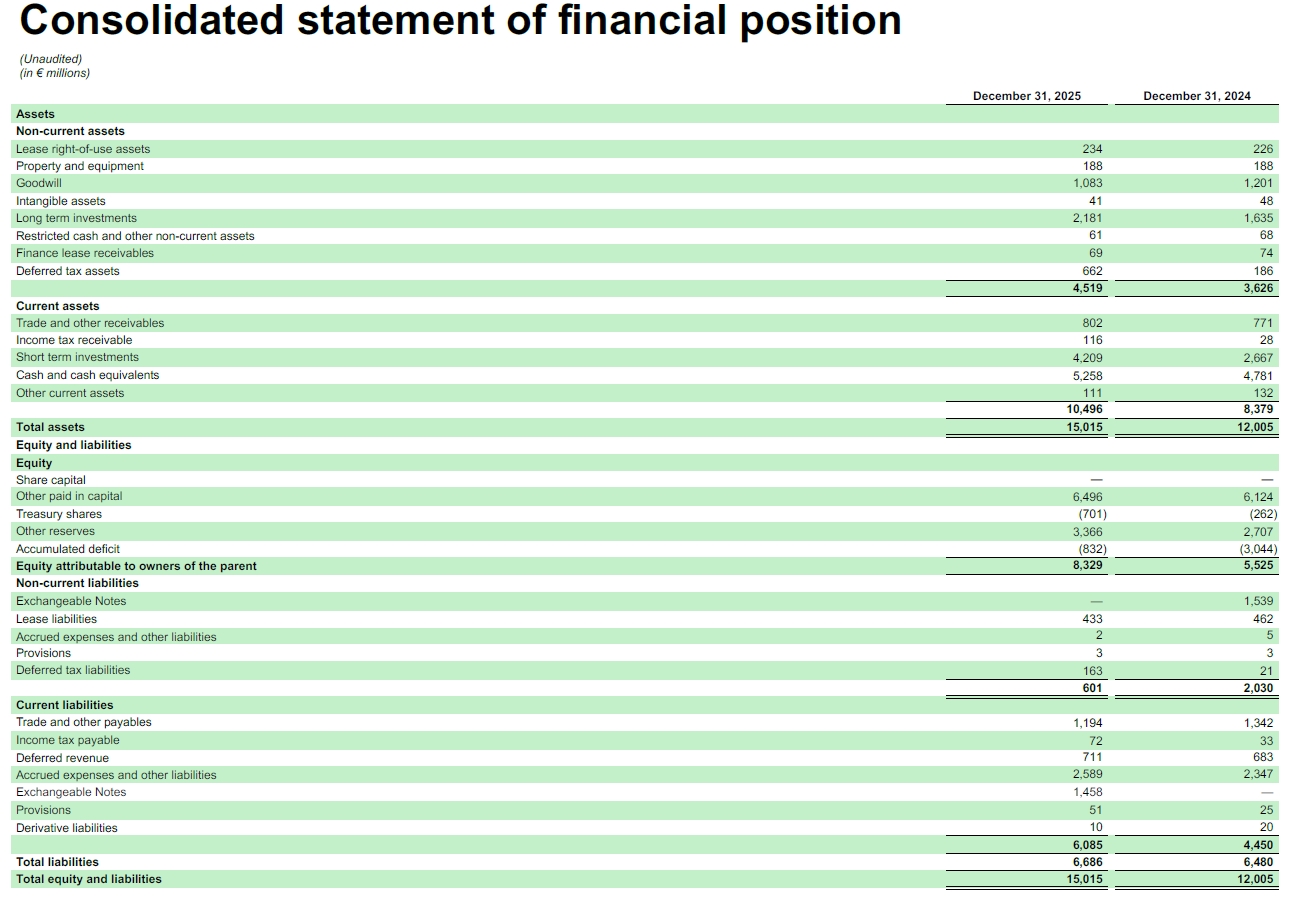
(Unaudited) (in € millions) December 31, 2025 December 31,
2024 Assets Non-current assets Lease right-of-use assets 234 226 Property and equipment 188 188 Goodwill 1,083 1,201 Intangible assets 41 48 Long term investments 2,181 1,635 Restricted cash and other non-current
assets 61 68 Finance lease receivables 69 74 Deferred tax assets 662 186 4,519 3,626 Current assets Trade and other receivables 802 771 Income tax receivable 116 28 Short term investments 4,209 2,667 Cash and cash
equivalents 5,258 4,781 Other current assets 111 132 10,496 8,379 Total assets 15,015 12,005 Equity and liabilities Equity Share capital — — Other paid in capital 6,496 6,124 Treasury shares (701) (262) Other
reserves 3,366 2,707 Accumulated deficit (832) (3,044) Equity attributable to owners of the parent 8,329 5,525 Non-current liabilities Exchangeable Notes — 1,539 Lease liabilities 433 462 Accrued expenses and other
liabilities 2 5 Provisions 3 3 Deferred tax liabilities 163 21 601 2,030 Current liabilities Trade and other payables 1,194 1,342 Income tax payable 72 33 Deferred revenue 711 683 Accrued expenses and other
liabilities 2,589 2,347 Exchangeable Notes 1,458 — Provisions 51 25 Derivative liabilities 10 20 6,085 4,450 Total liabilities 6,686 6,480 Total equity and liabilities 15,015 12,005 Consolidated statement of financial
position
December 31, 2024 Twelve months ended December 31, 2025 December 31,
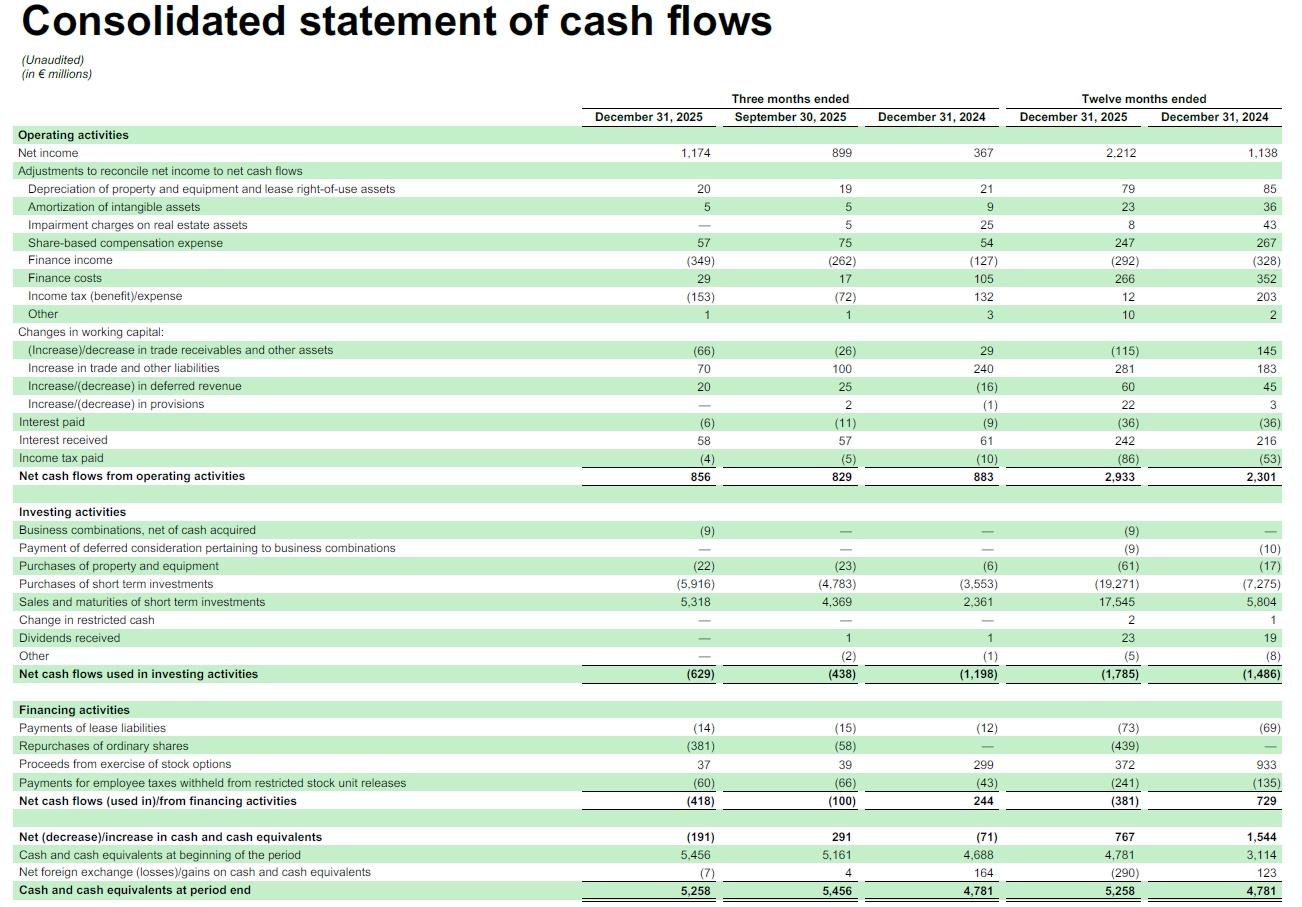
2024 Operating activities Net income 1,174 899 367 2,212 1,138 Adjustments to reconcile net income to net cash flows Depreciation of property and equipment and lease right-of-use assets 20 19 21 79 85 Amortization of
intangible assets 5 5 9 23 36 Impairment charges on real estate assets — 5 25 8 43 Share-based compensation expense 57 75 54 247 267 Finance income (349) (262) (127) (292) (328) Finance
costs 29 17 105 266 352 Income tax (benefit)/expense (153) (72) 132 12 203 Other 1 1 3 10 2 Changes in working capital: (Increase)/decrease in trade receivables and other assets (66) (26) 29 (115) 145 Increase in
trade and other liabilities 70 100 240 281 183 Increase/(decrease) in deferred revenue 20 25 (16) 60 45 Increase/(decrease) in provisions — 2 (1) 22 3 Interest paid (6) (11) (9) (36) (36) Interest
received 58 57 61 242 216 Income tax paid (4) (5) (10) (86) (53) Net cash flows from operating activities 856 829 883 2,933 2,301 Investing activities Business combinations, net of cash
acquired (9) — — (9) — Payment of deferred consideration pertaining to business combinations — — — (9) (10) Purchases of property and equipment (22) (23) (6) (61) (17) Purchases of short term
investments (5,916) (4,783) (3,553) (19,271) (7,275) Sales and maturities of short term investments 5,318 4,369 2,361 17,545 5,804 Change in restricted cash — — — 2 1 Dividends
received — 1 1 23 19 Other — (2) (1) (5) (8) Net cash flows used in investing activities (629) (438) (1,198) (1,785) (1,486) Financing activities Payments of lease liabilities (14) (15) (12) (73) (69) Repurchases of
ordinary shares (381) (58) — (439) — Proceeds from exercise of stock options 37 39 299 372 933 Payments for employee taxes withheld from restricted stock unit releases (60) (66) (43) (241) (135) Net cash flows (used
in)/from financing activities (418) (100) 244 (381) 729 Net (decrease)/increase in cash and cash equivalents (191) 291 (71) 767 1,544 Cash and cash equivalents at beginning of the period 5,456 5,161 4,688 4,781 3,114 Net
foreign exchange (losses)/gains on cash and cash equivalents (7) 4 164 (290) 123 Cash and cash equivalents at period end 5,258 5,456 4,781 5,258 4,781 (Unaudited) (in € millions) Three months ended December 31, 2025
September 30, 2025 Consolidated statement of cash flows
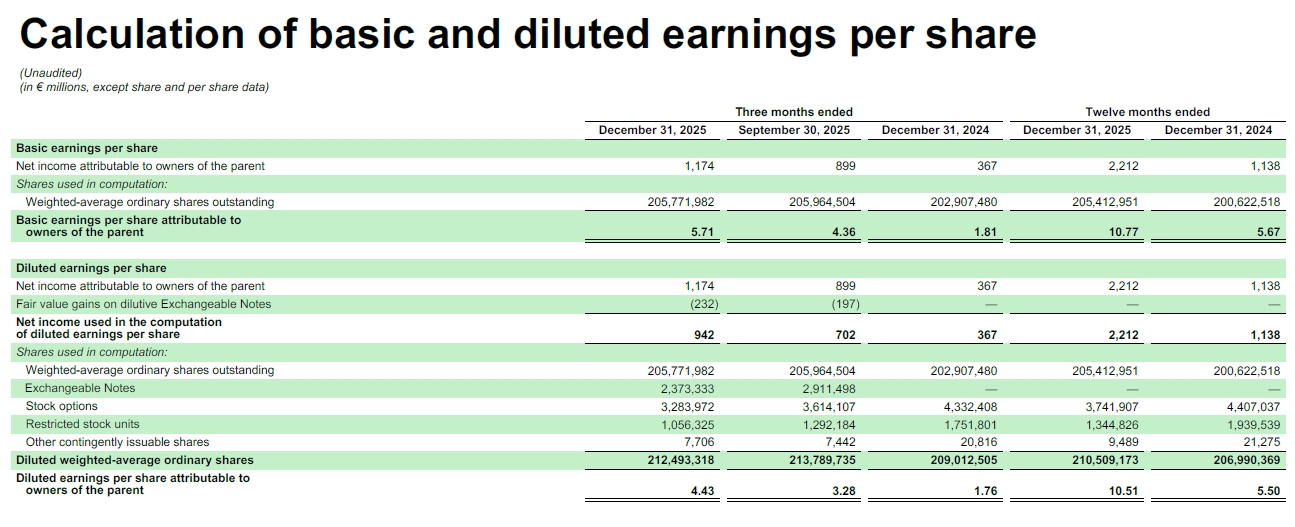
Twelve months ended December 31, 2025 September 30, 2025 December 31,
2024 December 31, 2025 December 31, 2024 Basic earnings per share Net income attributable to owners of the parent 1,174 899 367 2,212 1,138 Shares used in computation: Weighted-average ordinary shares outstanding
205,771,982 205,964,504 202,907,480 205,412,951 200,622,518 Basic earnings per share attributable to owners of the parent 5.71 4.36 1.81 10.77 5.67 Diluted earnings per share Net income attributable to owners of the parent
1,174 899 367 2,212 1,138 Fair value gains on dilutive Exchangeable Notes (232) (197) — — — Net income used in the computation of diluted earnings per share 942 702 367 2,212 1,138 Shares used in
computation: Weighted-average ordinary shares outstanding 205,771,982 205,964,504 202,907,480 205,412,951 200,622,518 Exchangeable Notes 2,373,333 2,911,498 — — — Stock
options 3,283,972 3,614,107 4,332,408 3,741,907 4,407,037 Restricted stock units 1,056,325 1,292,184 1,751,801 1,344,826 1,939,539 Other contingently issuable shares 7,706 7,442 20,816 9,489 21,275 Diluted weighted-average
ordinary shares 212,493,318 213,789,735 209,012,505 210,509,173 206,990,369 Diluted earnings per share attributable to owners of the parent 4.43 3.28 1.76 10.51 5.50 (Unaudited) (in € millions, except share and per share
data) Three months ended Calculation of basic and diluted earnings per share
Three months ended Twelve months ended December 31, 2025 December 31,
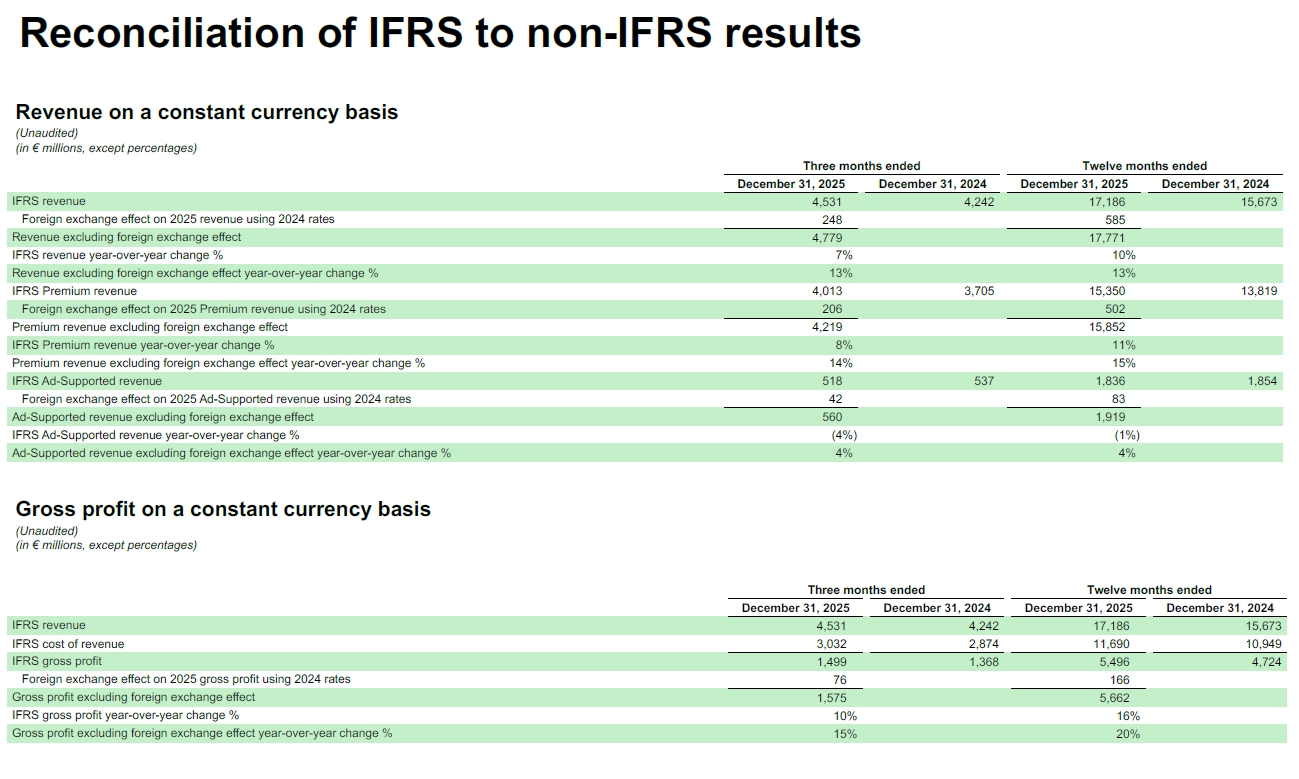
2024 December 31, 2025 December 31, 2024 IFRS revenue 4,531 4,242 17,186 15,673 Foreign exchange effect on 2025 revenue using 2024 rates 248 585 Revenue excluding foreign exchange effect 4,779 17,771 IFRS revenue
year-over-year change % 7% 10% Revenue excluding foreign exchange effect year-over-year change % 13% 13% IFRS Premium revenue 4,013 3,705 15,350 13,819 Foreign exchange effect on 2025 Premium revenue using 2024
rates 206 502 Premium revenue excluding foreign exchange effect 4,219 15,852 IFRS Premium revenue year-over-year change % 8% 11% Premium revenue excluding foreign exchange effect year-over-year change % 14% 15% IFRS Ad-Supported
revenue 518 537 1,836 1,854 Foreign exchange effect on 2025 Ad-Supported revenue using 2024 rates 42 83 Ad-Supported revenue excluding foreign exchange effect 560 1,919 IFRS Ad-Supported revenue year-over-year change
% (4%) (1%) Ad-Supported revenue excluding foreign exchange effect year-over-year change % 4% 4% Revenue on a constant currency basis (Unaudited) (in € millions, except percentages) Reconciliation of IFRS to non-IFRS results Gross
profit on a constant currency basis (Unaudited) (in € millions, except percentages) Three months ended Twelve months ended December 31, 2025 December 31, 2024 December 31, 2025 December 31, 2024 IFRS
revenue 4,531 4,242 17,186 15,673 IFRS cost of revenue 3,032 2,874 11,690 10,949 IFRS gross profit 1,499 1,368 5,496 4,724 Foreign exchange effect on 2025 gross profit using 2024 rates 76 166 Gross profit excluding foreign
exchange effect 1,575 5,662 IFRS gross profit year-over-year change % 10% 16% Gross profit excluding foreign exchange effect year-over-year change % 15% 20%
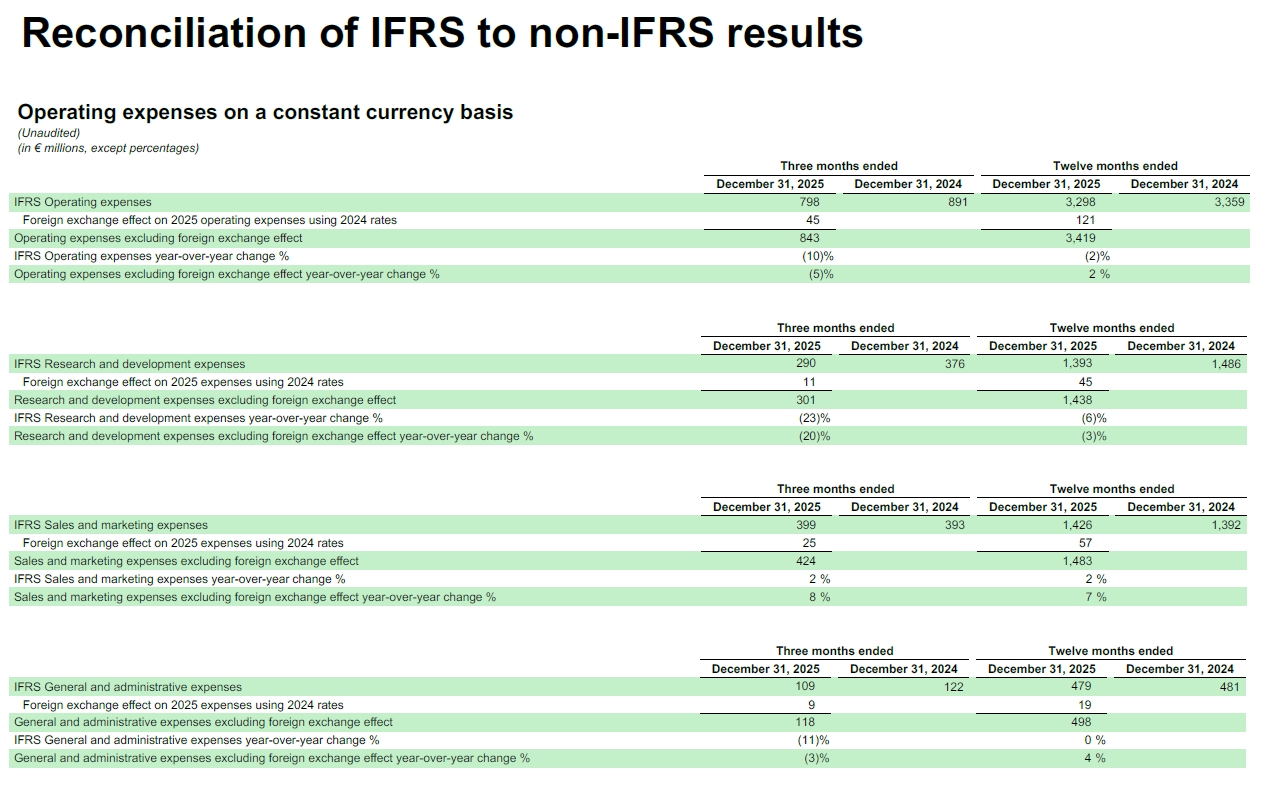
Operating expenses on a constant currency basis (Unaudited) (in € millions,
except percentages) Three months ended December 31, 2025 December 31, 2024 Twelve months ended December 31, 2025 December 31, 2024 IFRS Research and development expenses 290 376 1,393 1,486 Foreign exchange effect on 2025 expenses
using 2024 rates 11 45 Research and development expenses excluding foreign exchange effect 301 1,438 IFRS Research and development expenses year-over-year change % (23)% (6)% Research and development expenses excluding foreign
exchange effect year-over-year change % (20)% (3)% Reconciliation of IFRS to non-IFRS results Three months ended December 31, 2025 December 31, 2024 Twelve months ended December 31, 2025 December 31, 2024 IFRS Sales and marketing
expenses 399 393 1,426 1,392 Foreign exchange effect on 2025 expenses using 2024 rates 25 57 Sales and marketing expenses excluding foreign exchange effect 424 1,483 IFRS Sales and marketing expenses year-over-year change % 2
% 2 % Sales and marketing expenses excluding foreign exchange effect year-over-year change % 8 % 7 % Three months ended December 31, 2025 December 31, 2024 Twelve months ended December 31, 2025 December 31, 2024 IFRS General and
administrative expenses 109 122 479 481 Foreign exchange effect on 2025 expenses using 2024 rates 9 19 General and administrative expenses excluding foreign exchange effect 118 498 IFRS General and administrative expenses
year-over-year change % (11)% 0 % General and administrative expenses excluding foreign exchange effect year-over-year change % (3)% 4 % Three months ended December 31, 2025 December 31, 2024 Twelve months ended December 31, 2025
December 31, 2024 IFRS Operating expenses 798 891 3,298 3,359 Foreign exchange effect on 2025 operating expenses using 2024 rates 45 121 Operating expenses excluding foreign exchange effect 843 3,419 IFRS Operating expenses
year-over-year change % (10)% (2)% Operating expenses excluding foreign exchange effect year-over-year change % (5)% 2 %
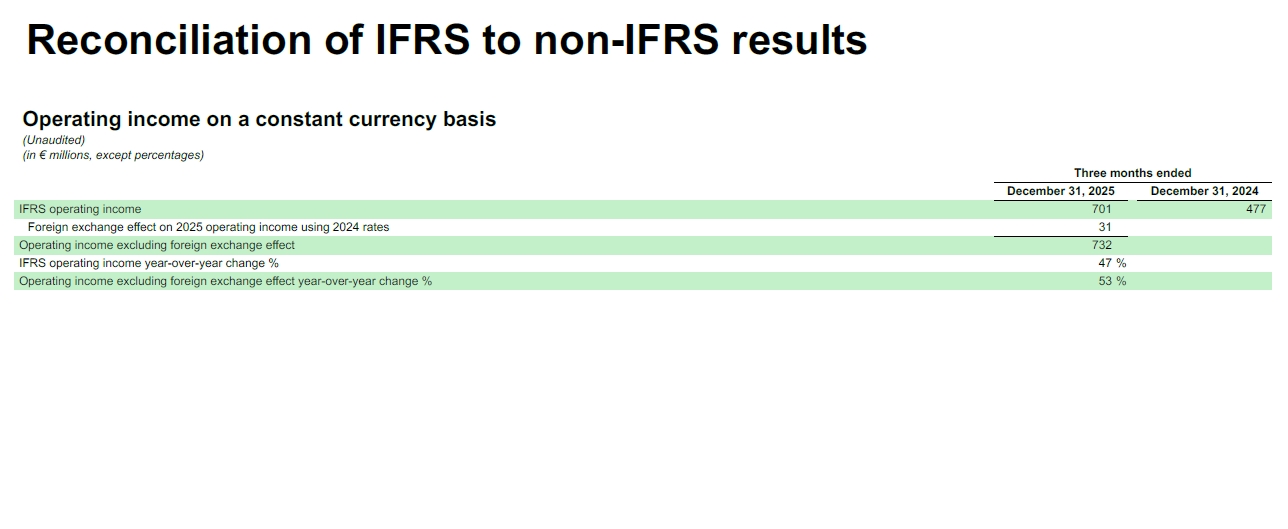
Reconciliation of IFRS to non-IFRS results Operating income on a constant
currency basis (Unaudited) (in € millions, except percentages) Three months ended December 31, 2025 December 31, 2024 IFRS operating income 701 477 Foreign exchange effect on 2025 operating income using 2024 rates 31 Operating
income excluding foreign exchange effect 732 IFRS operating income year-over-year change % 47 % Operating income excluding foreign exchange effect year-over-year change % 53 %
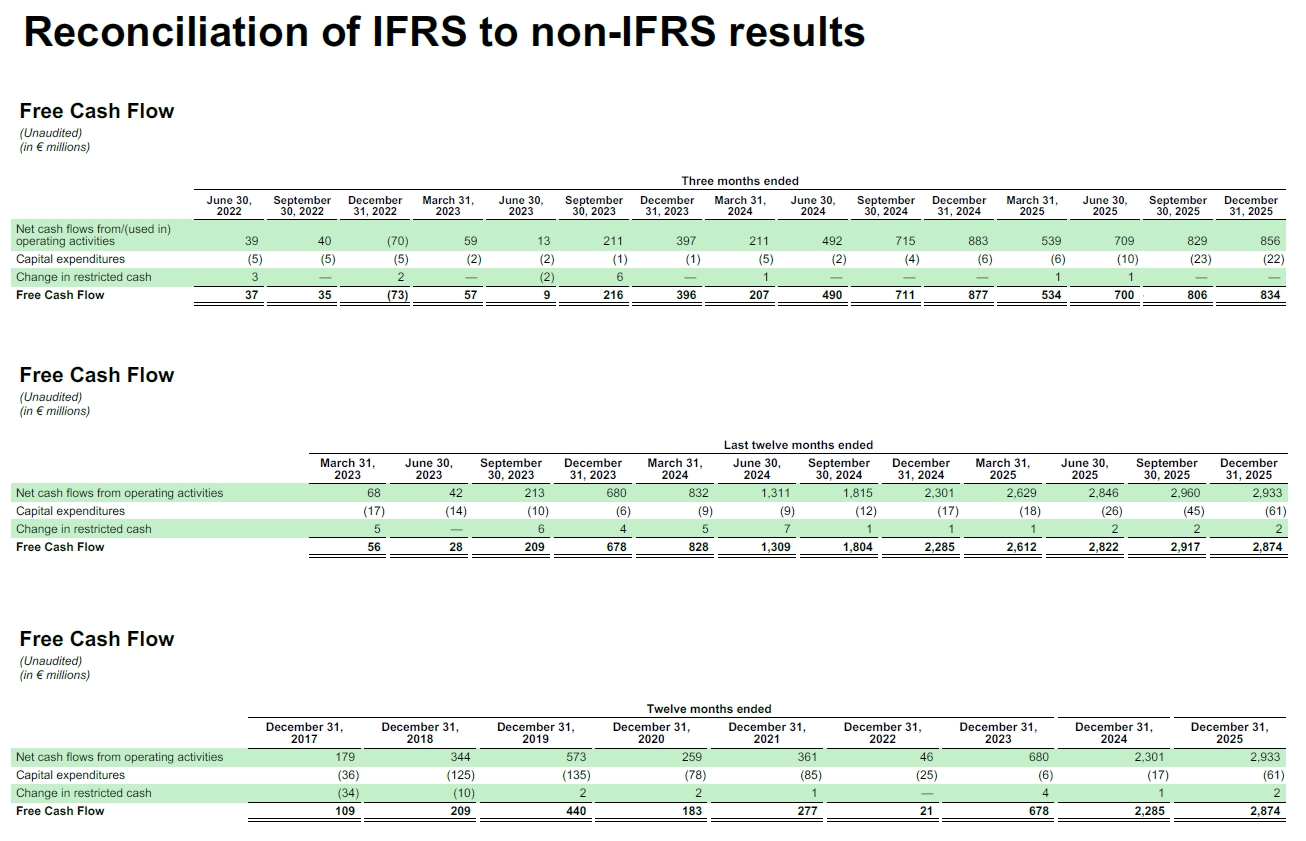
Three months ended June 30, 2022 September 30, 2022 December 31,
2022 March 31, 2023 June 30, 2023 September 30, 2023 December 31, 2023 March 31, 2024 June 30, 2024 September 30, 2024 December 31, 2024 March 31, 2025 June 30, 2025 September 30, 2025 December 31, 2025 Net cash flows
from/(used in) operating activities 39 40 (70) 59 13 211 397 211 492 715 883 539 709 829 856 Capital expenditures (5) (5) (5) (2) (2) (1) (1) (5) (2) (4) (6) (6) (10) (23) (22) Change in restricted
cash 3 — 2 — (2) 6 — 1 — — — 1 1 — — Free Cash Flow 37 35 (73) 57 9 216 396 207 490 711 877 534 700 806 834 Free Cash Flow (Unaudited) (in € millions) Last twelve months ended March 31, June
30, September December March 31, June 30, September December March 31, June 30, September December 2023 2023 30, 2023 31, 2023 2024 2024 30, 2024 31, 2024 2025 2025 30, 2025 31, 2025 Net cash flows from operating
activities 68 42 213 680 832 1,311 1,815 2,301 2,629 2,846 2,960 2,933 Capital expenditures (17) (14) (10) (6) (9) (9 ) (12) (17) (18) (26) (45) (61) Change in restricted
cash 5 — 6 4 5 7 1 1 1 2 2 2 Free Cash Flow 56 28 209 678 828 1,309 1,804 2,285 2,612 2,822 2,917 2,874 Reconciliation of IFRS to non-IFRS results Free Cash Flow (Unaudited) (in € millions) Twelve months
ended December 31, December 31, December 31, December 31, December 31, December 31, December 31, December 31, December 31, 2017 2018 2019 2020 2021 2022 2023 2024 2025 Net cash flows from operating
activities 179 344 573 259 361 46 680 2,301 2,933 Capital expenditures (36) (125) (135) (78) (85) (25) (6) (17) (61) Change in restricted cash (34) (10) 2 2 1 — 4 1 2 Free Cash
Flow 109 209 440 183 277 21 678 2,285 2,874 Free Cash Flow (Unaudited) (in € millions)

APPENDIX
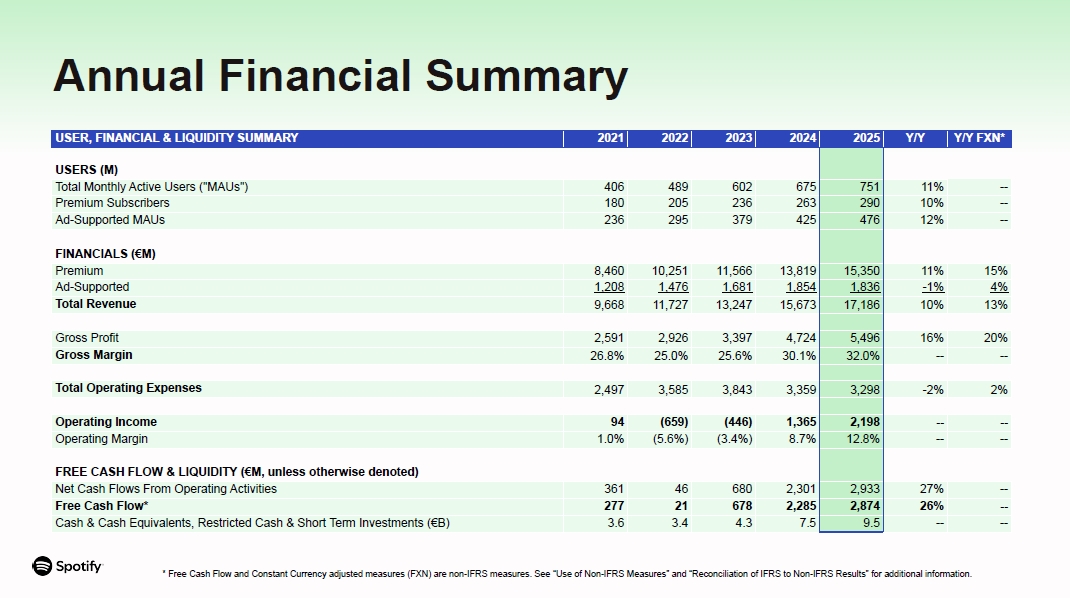
USER, FINANCIAL & LIQUIDITY SUMMARY 2021 2022 2023 2024 2025 Y/Y Y/Y
FXN* USERS (M) Total Monthly Active Users ("MAUs") 406 489 602 675 751 11% -- Premium Subscribers 180 205 236 263 290 10% -- Ad-Supported MAUs 236 295 379 425 476 12% -- FINANCIALS
(€M) Premium 8,460 10,251 11,566 13,819 15,350 11% 15% Ad-Supported 1,208 1,476 1,681 1,854 1,836 -1% 4% Total Revenue 9,668 11,727 13,247 15,673 17,186 10% 13% Gross
Profit 2,591 2,926 3,397 4,724 5,496 16% 20% Gross Margin 26.8% 25.0% 25.6% 30.1% 32.0% -- -- Total Operating Expenses 2,497 3,585 3,843 3,359 3,298 -2% 2% Operating
Income 94 (659) (446) 1,365 2,198 -- -- Operating Margin 1.0% (5.6%) (3.4%) 8.7% 12.8% -- -- FREE CASH FLOW & LIQUIDITY (€M, unless otherwise denoted) Net Cash Flows From Operating
Activities 361 46 680 2,301 2,933 27% -- Free Cash Flow* 277 21 678 2,285 2,874 26% -- Cash & Cash Equivalents, Restricted Cash & Short Term Investments (€B) 3.6 3.4 4.3 7.5 9.5 -- -- * Free Cash Flow and
Constant Currency adjusted measures (FXN) are non-IFRS measures. See “Use of Non-IFRS Measures” and “Reconciliation of IFRS to Non-IFRS Results” for additional information. Annual Financial Summary
Social Charges Sensitivity Meaningful movements in our stock price can lead
to Social Charge variance Our guidance incorporates the impact of Social Charges, the vast majority of which appear in Operating Expenses. The amount of Social Charges we accrue for and ultimately pay can be volatile, as they are tied to
the value of our share price. Since we do not forecast stock price changes in our guidance, meaningful movements in our stock price over the course of a quarter can lead to meaningful changes in Social Charges. As an example, at the Q4
close, our stock price was $580.71. In Q4, a 10% increase or decrease in our stock price compared to the quarter-end price would have an approximate +/- €30M impact on Social Charges.