
Investor Presentation May 2026 .2
Safe Harbor This presentation contains forward-looking statements, within the meaning of Section 27A of the Securities Act of 1933, as amended, and Section 21E of the Securities Exchange Act of 1934, as amended. All statements other than statements of historical fact contained in this presentation, including statements regarding our future results of operations and financial position, business strategy and plans, and objectives of management for future operations, are forward-looking statements. These statements involve known and unknown risks, uncertainties, and other important factors that may cause our actual results, performance or achievements to be materially different from any future results, performance, or achievements expressed or implied by the forward-looking statements. In some cases, you can identify forward-looking statements by terms such as “aim,” “may,” “should,” “expects,” “might,” “plans,” “anticipates,” “could,” “intends,” “goals,” “target,” “projects,” “contemplates,” “believes,” “estimates,” “predicts,” “potential,” “seek,” “will,” “would” or “continues,” or the negative of these terms or other similar expressions. The forward-looking statements in this presentation are only predictions. We have based these forward-looking statements largely on our current expectations and projections about future events and financial trends that we believe may affect our business, financial condition, liquidity and results of operations. Although we believe that the expectations reflected in the forward-looking statements are reasonable, we cannot guarantee that the future results, levels of activity, performance or events and circumstances reflected in the forward-looking statements will be achieved or occur. These forward-looking statements speak only as of the date of this presentation, and except as required by applicable law, we undertake no obligation to publicly update or revise any forward-looking statements contained herein, whether as a result of any new information, future events, or otherwise. We are subject to a number of risks, uncertainties and assumptions as described in our annual report on Form 10-K and our subsequent filings with the Securities and Exchange Commission. We qualify all of our forward-looking statements by these cautionary statements. The Company’s presentation also contains estimates, projections, & other information concerning the Company’s industry, the Company’s business & the markets for certain of the Company’s products & services, including data regarding the estimated size of those markets. The information concerning our industry contained in this presentation is based on our general knowledge of and expectations concerning the industry. The Company’s market position, market share and industry market size are based on estimates using our internal data and estimates, data from various industry analyses, our internal research and adjustments and assumptions that we believe to be reasonable. Information that is based on estimates, forecasts, projections, market research, or similar methodologies is inherently subject to uncertainties & actual events or circumstances may differ materially from events & circumstances reflected in this information. Unless otherwise expressly stated, the Company obtained this industry, business, market & other data from reports, research surveys, studies & similar data prepared by market research firms & other third parties, from industry, general publications, & from government data & similar sources. We have not independently verified data from these sources and cannot guarantee their accuracy or completeness.

We empower the largest Property & Casualty (P&C) insurance carriers and thousands of agents to grow market share by maximizing customer acquisition across digital channels. Our Mission
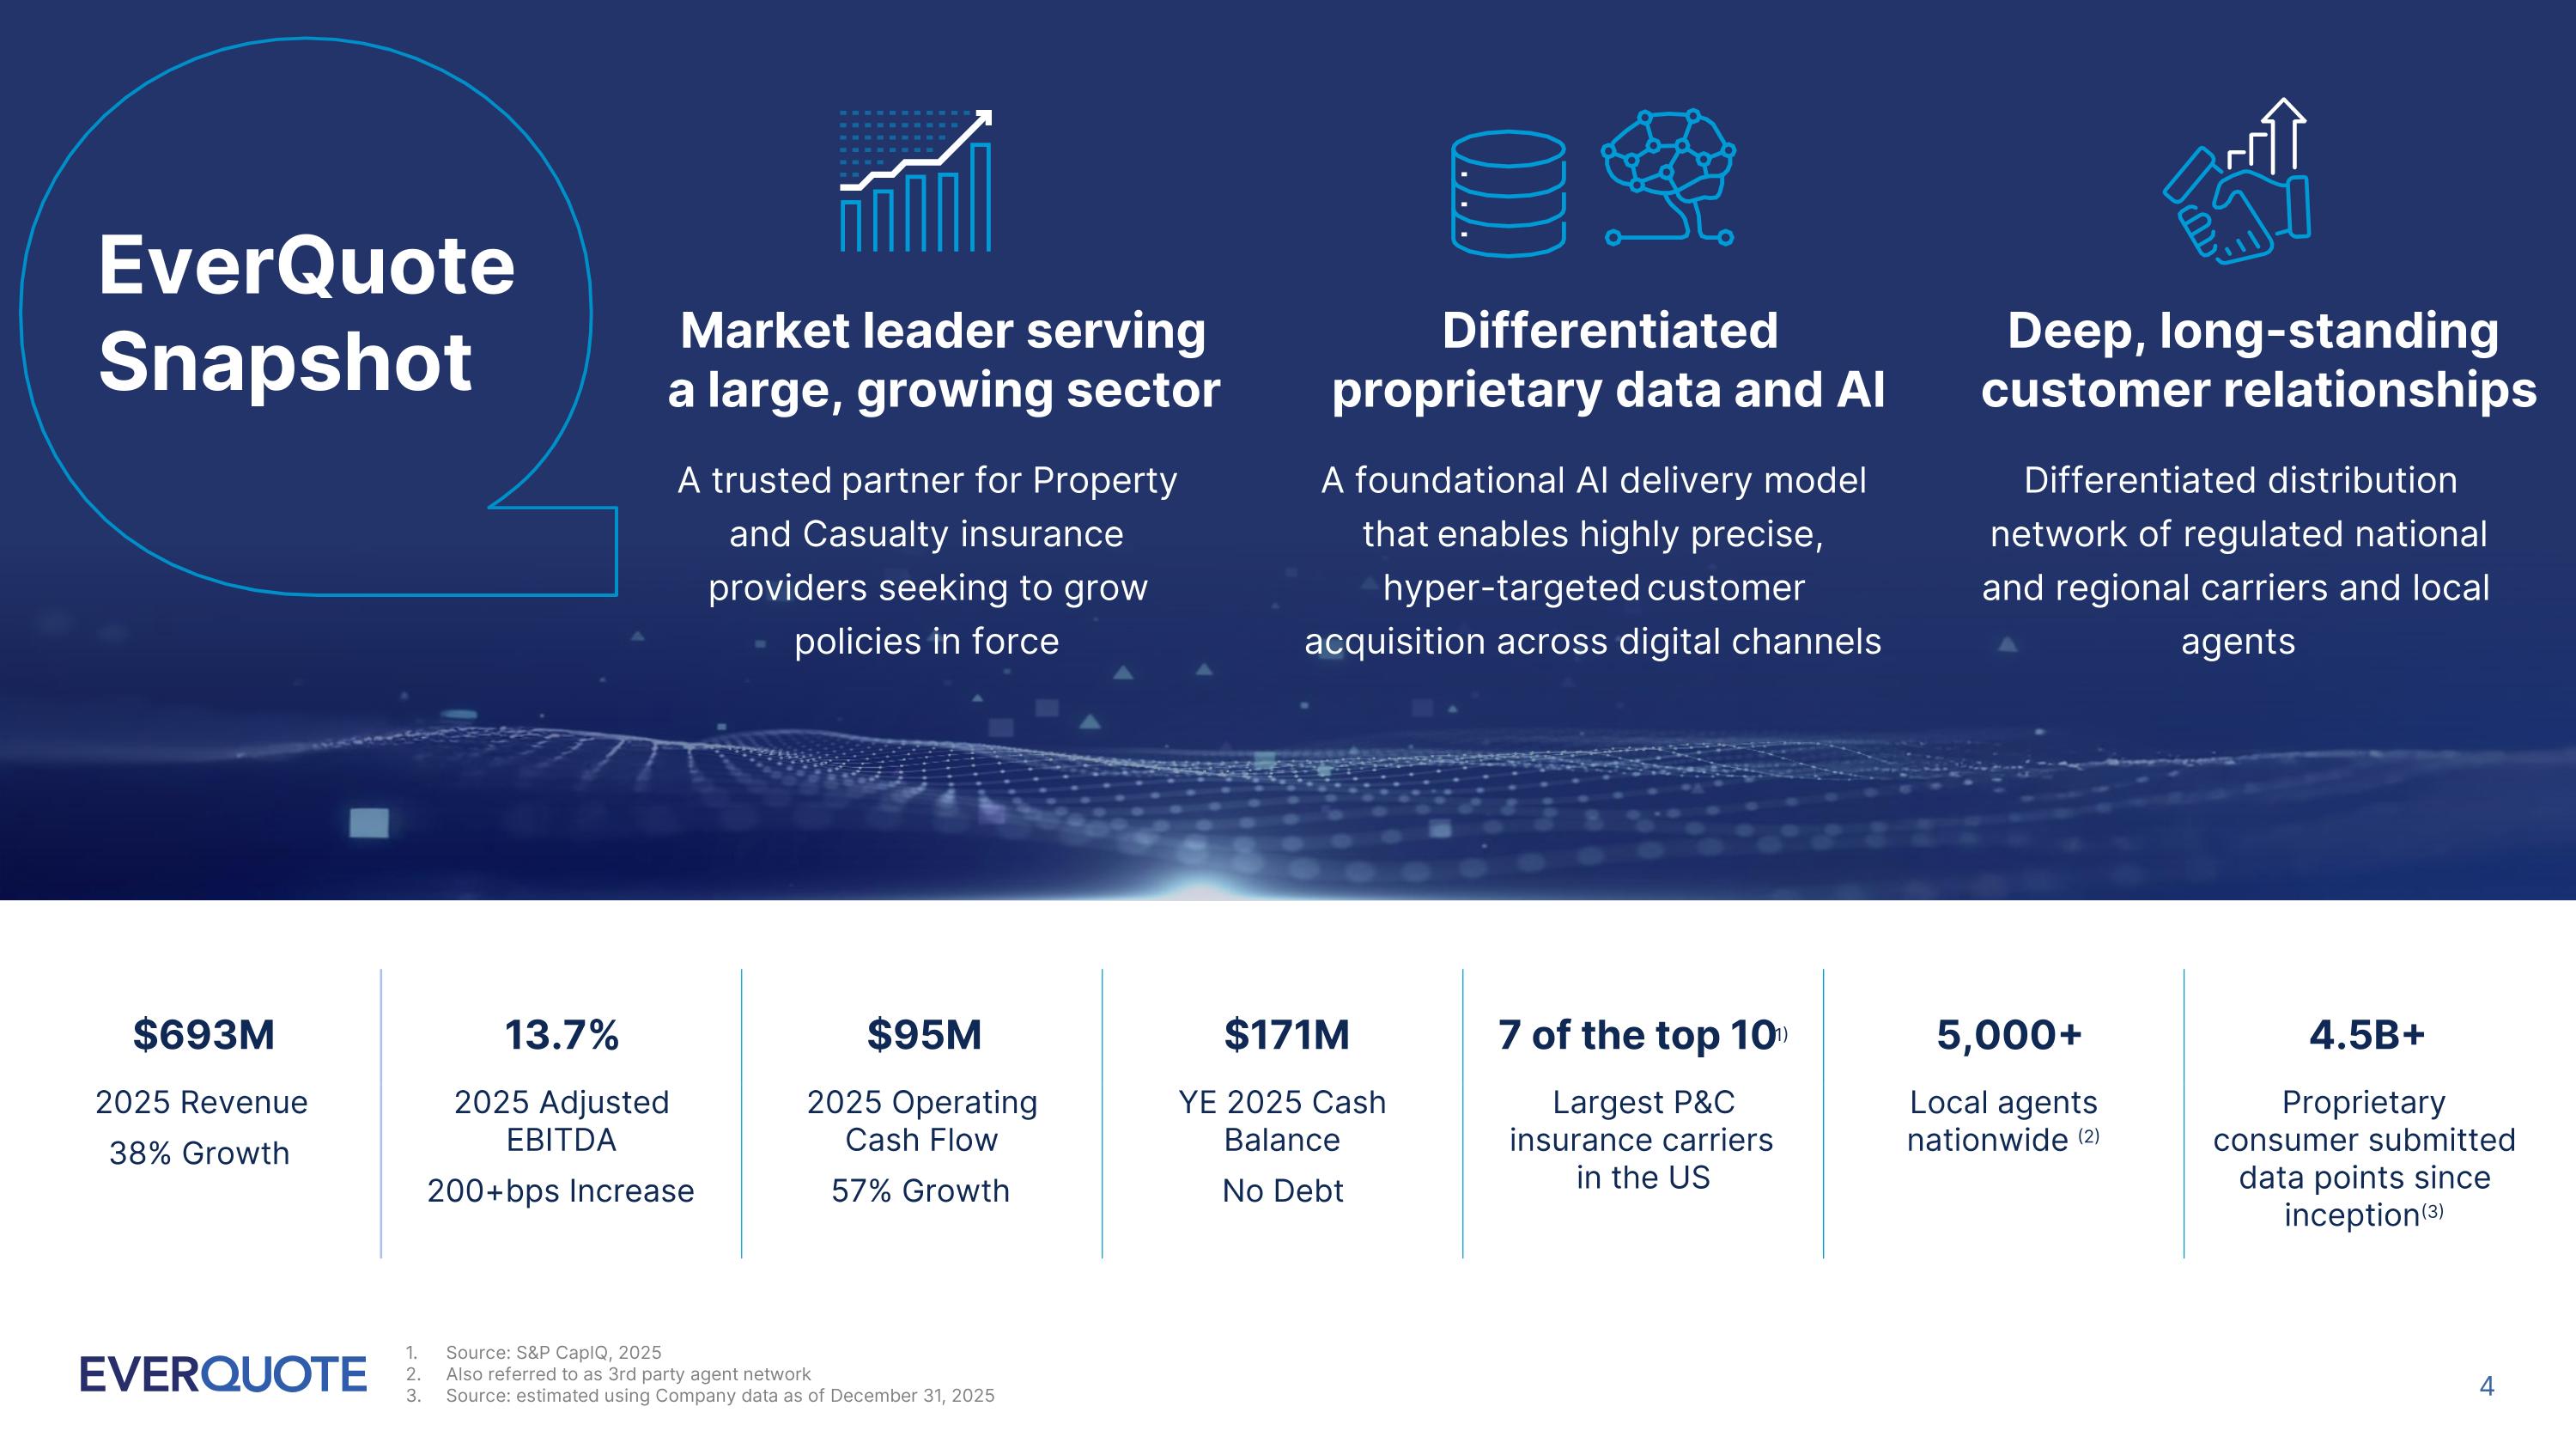
Source: S&P CapIQ, 2025 Also referred to as 3rd party agent network Source: estimated using Company data as of December 31, 2025 EverQuote Snapshot Market leader serving a large, growing sector A trusted partner for Property and Casualty insurance providers seeking to grow policies in force Differentiated proprietary data and AI A foundational AI delivery model that enables highly precise, hyper-targeted customer acquisition across digital channels Deep, long-standing customer relationships Differentiated distribution network of regulated national and regional carriers and local agents $693M 13.7% $95M $171M 7 of the top 10(1) 5,000+ 4.5B+ 2025 Revenue 38% Growth 2025 Adjusted EBITDA 200+bps Increase 2025 Operating Cash Flow 57% Growth YE 2025 Cash Balance No Debt Largest P&C insurance carriers in the US Local agents nationwide (2) Proprietary consumer submitted data points since inception(3)
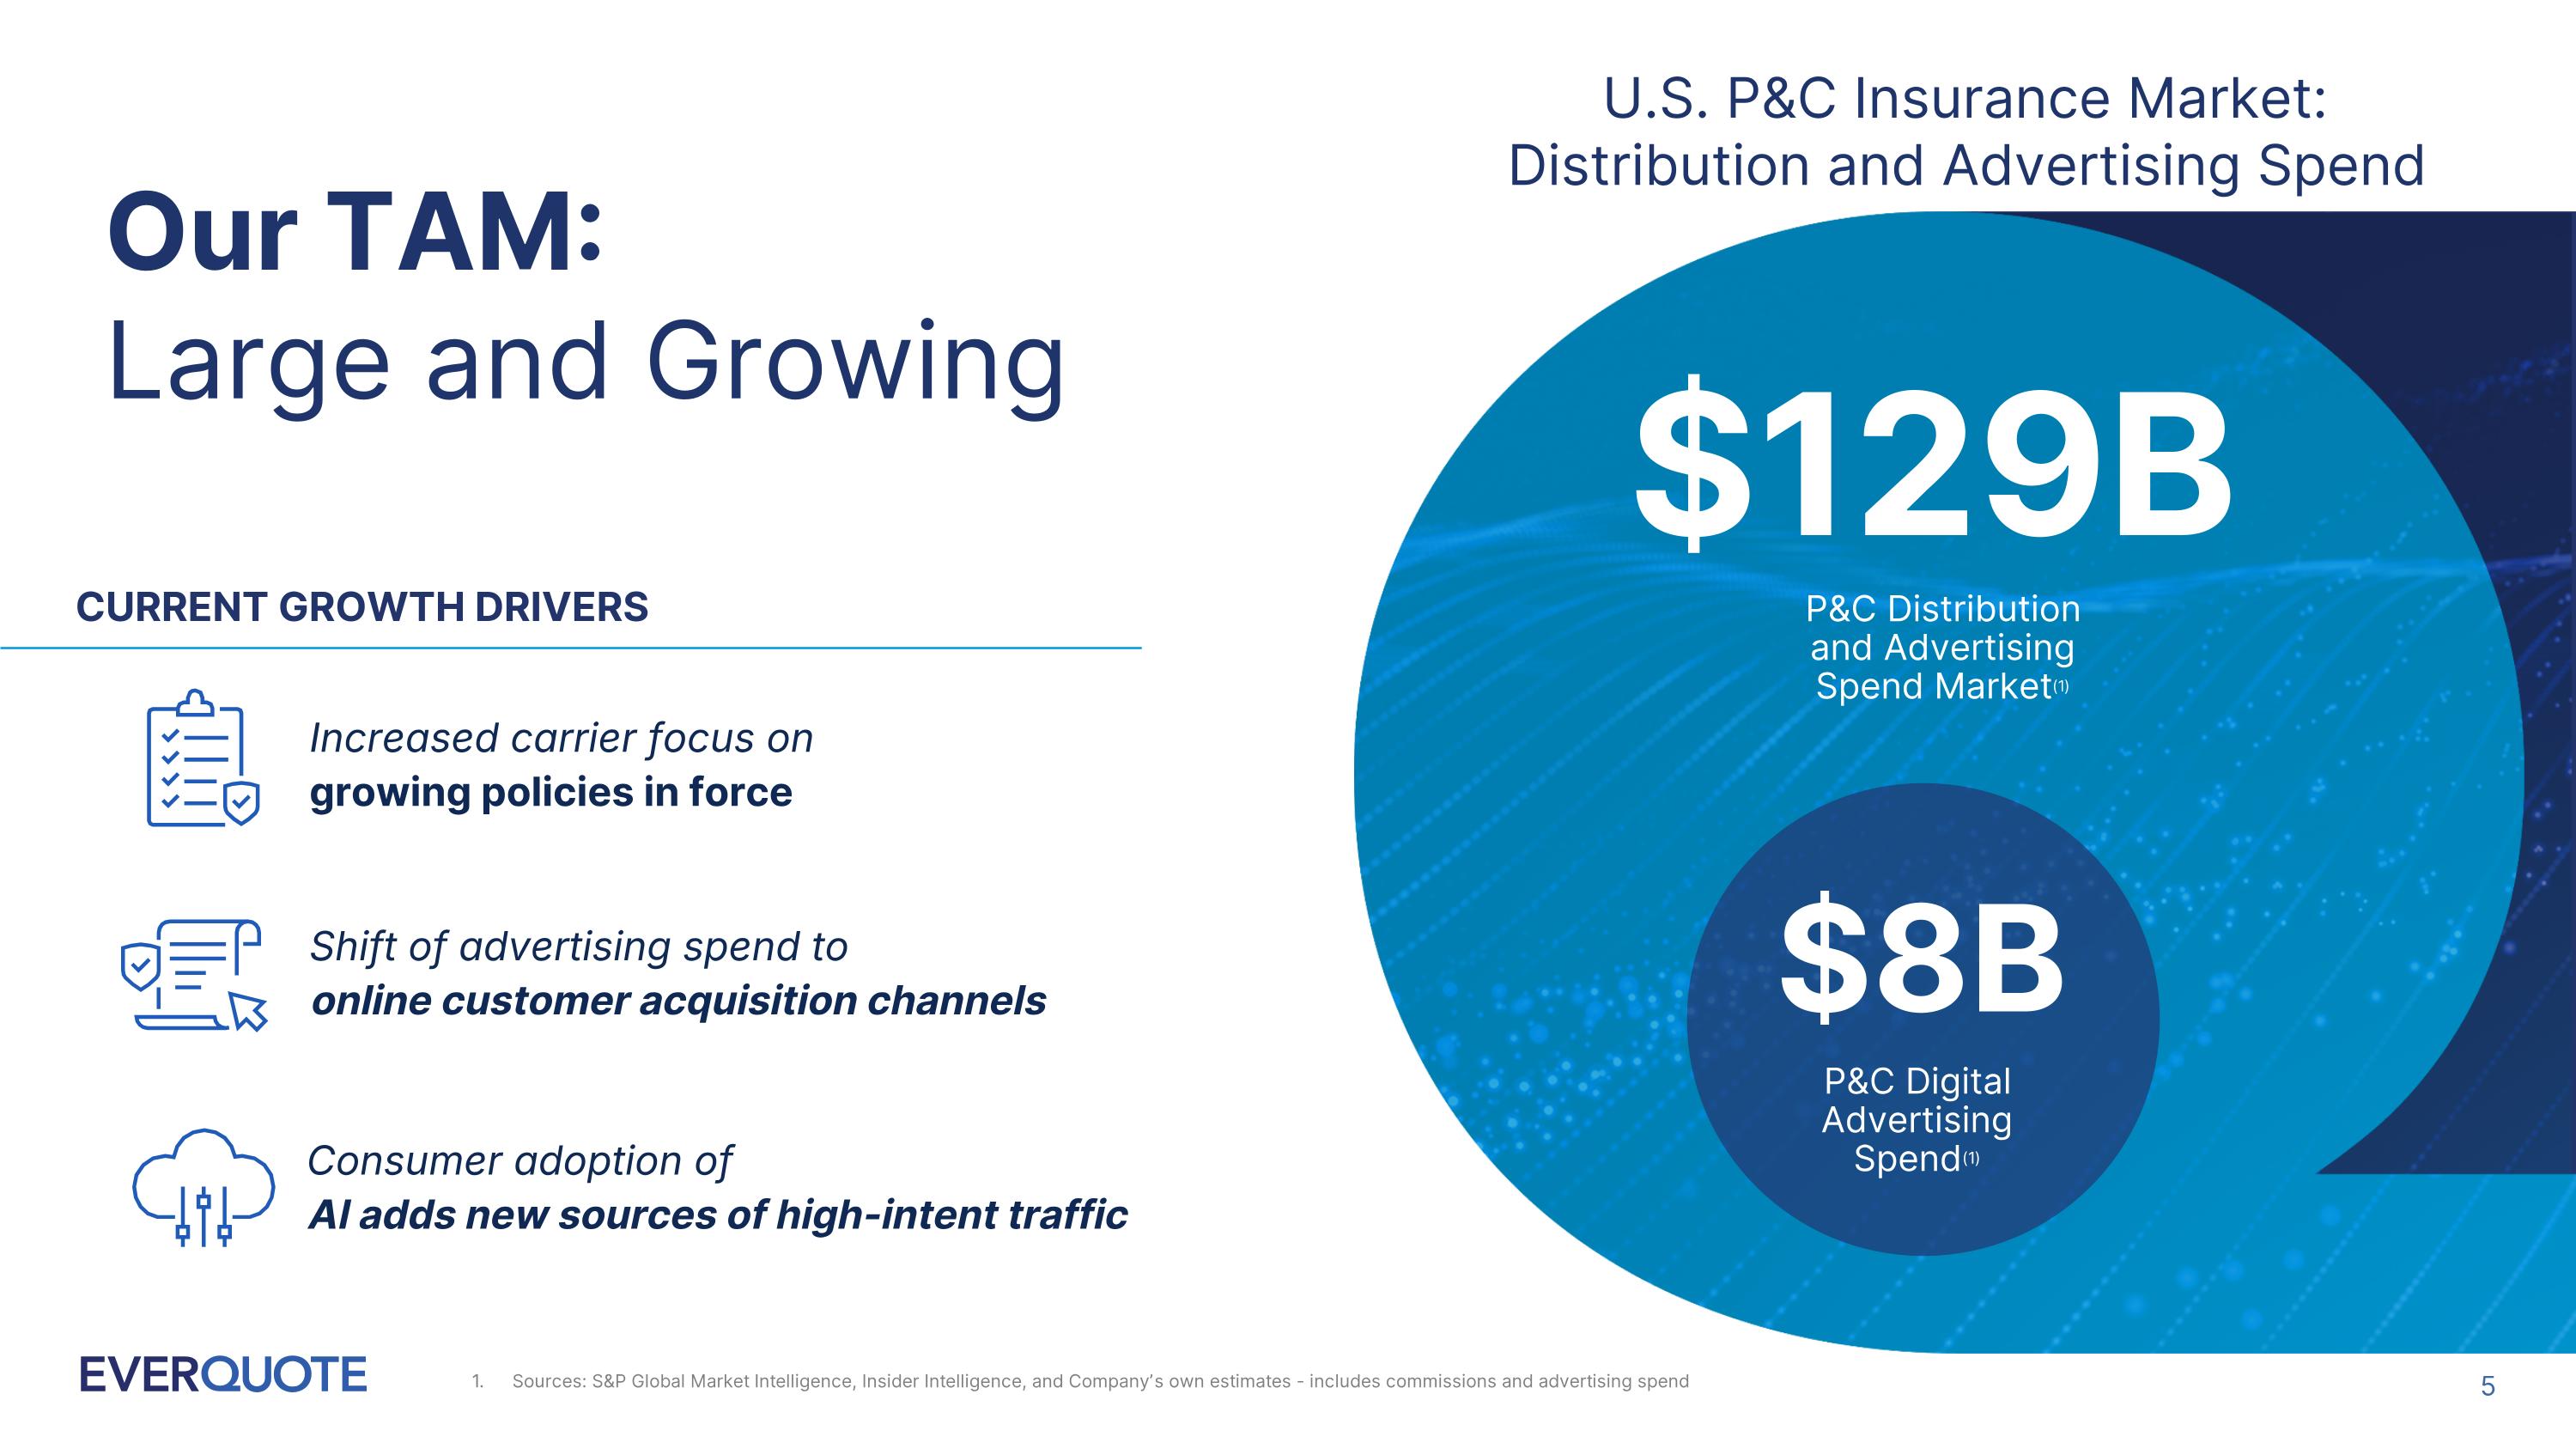
Our TAM: Large and Growing CURRENT GROWTH DRIVERS Increased carrier focus on growing policies in force Shift of advertising spend to online customer acquisition channels Consumer adoption of AI adds new sources of high-intent traffic $129B P&C Distribution and Advertising Spend Market(1) $8B P&C Digital Advertising Spend(1) U.S. P&C Insurance Market: Distribution and Advertising Spend Sources: S&P Global Market Intelligence, Insider Intelligence, and Company’s own estimates - includes commissions and advertising spend
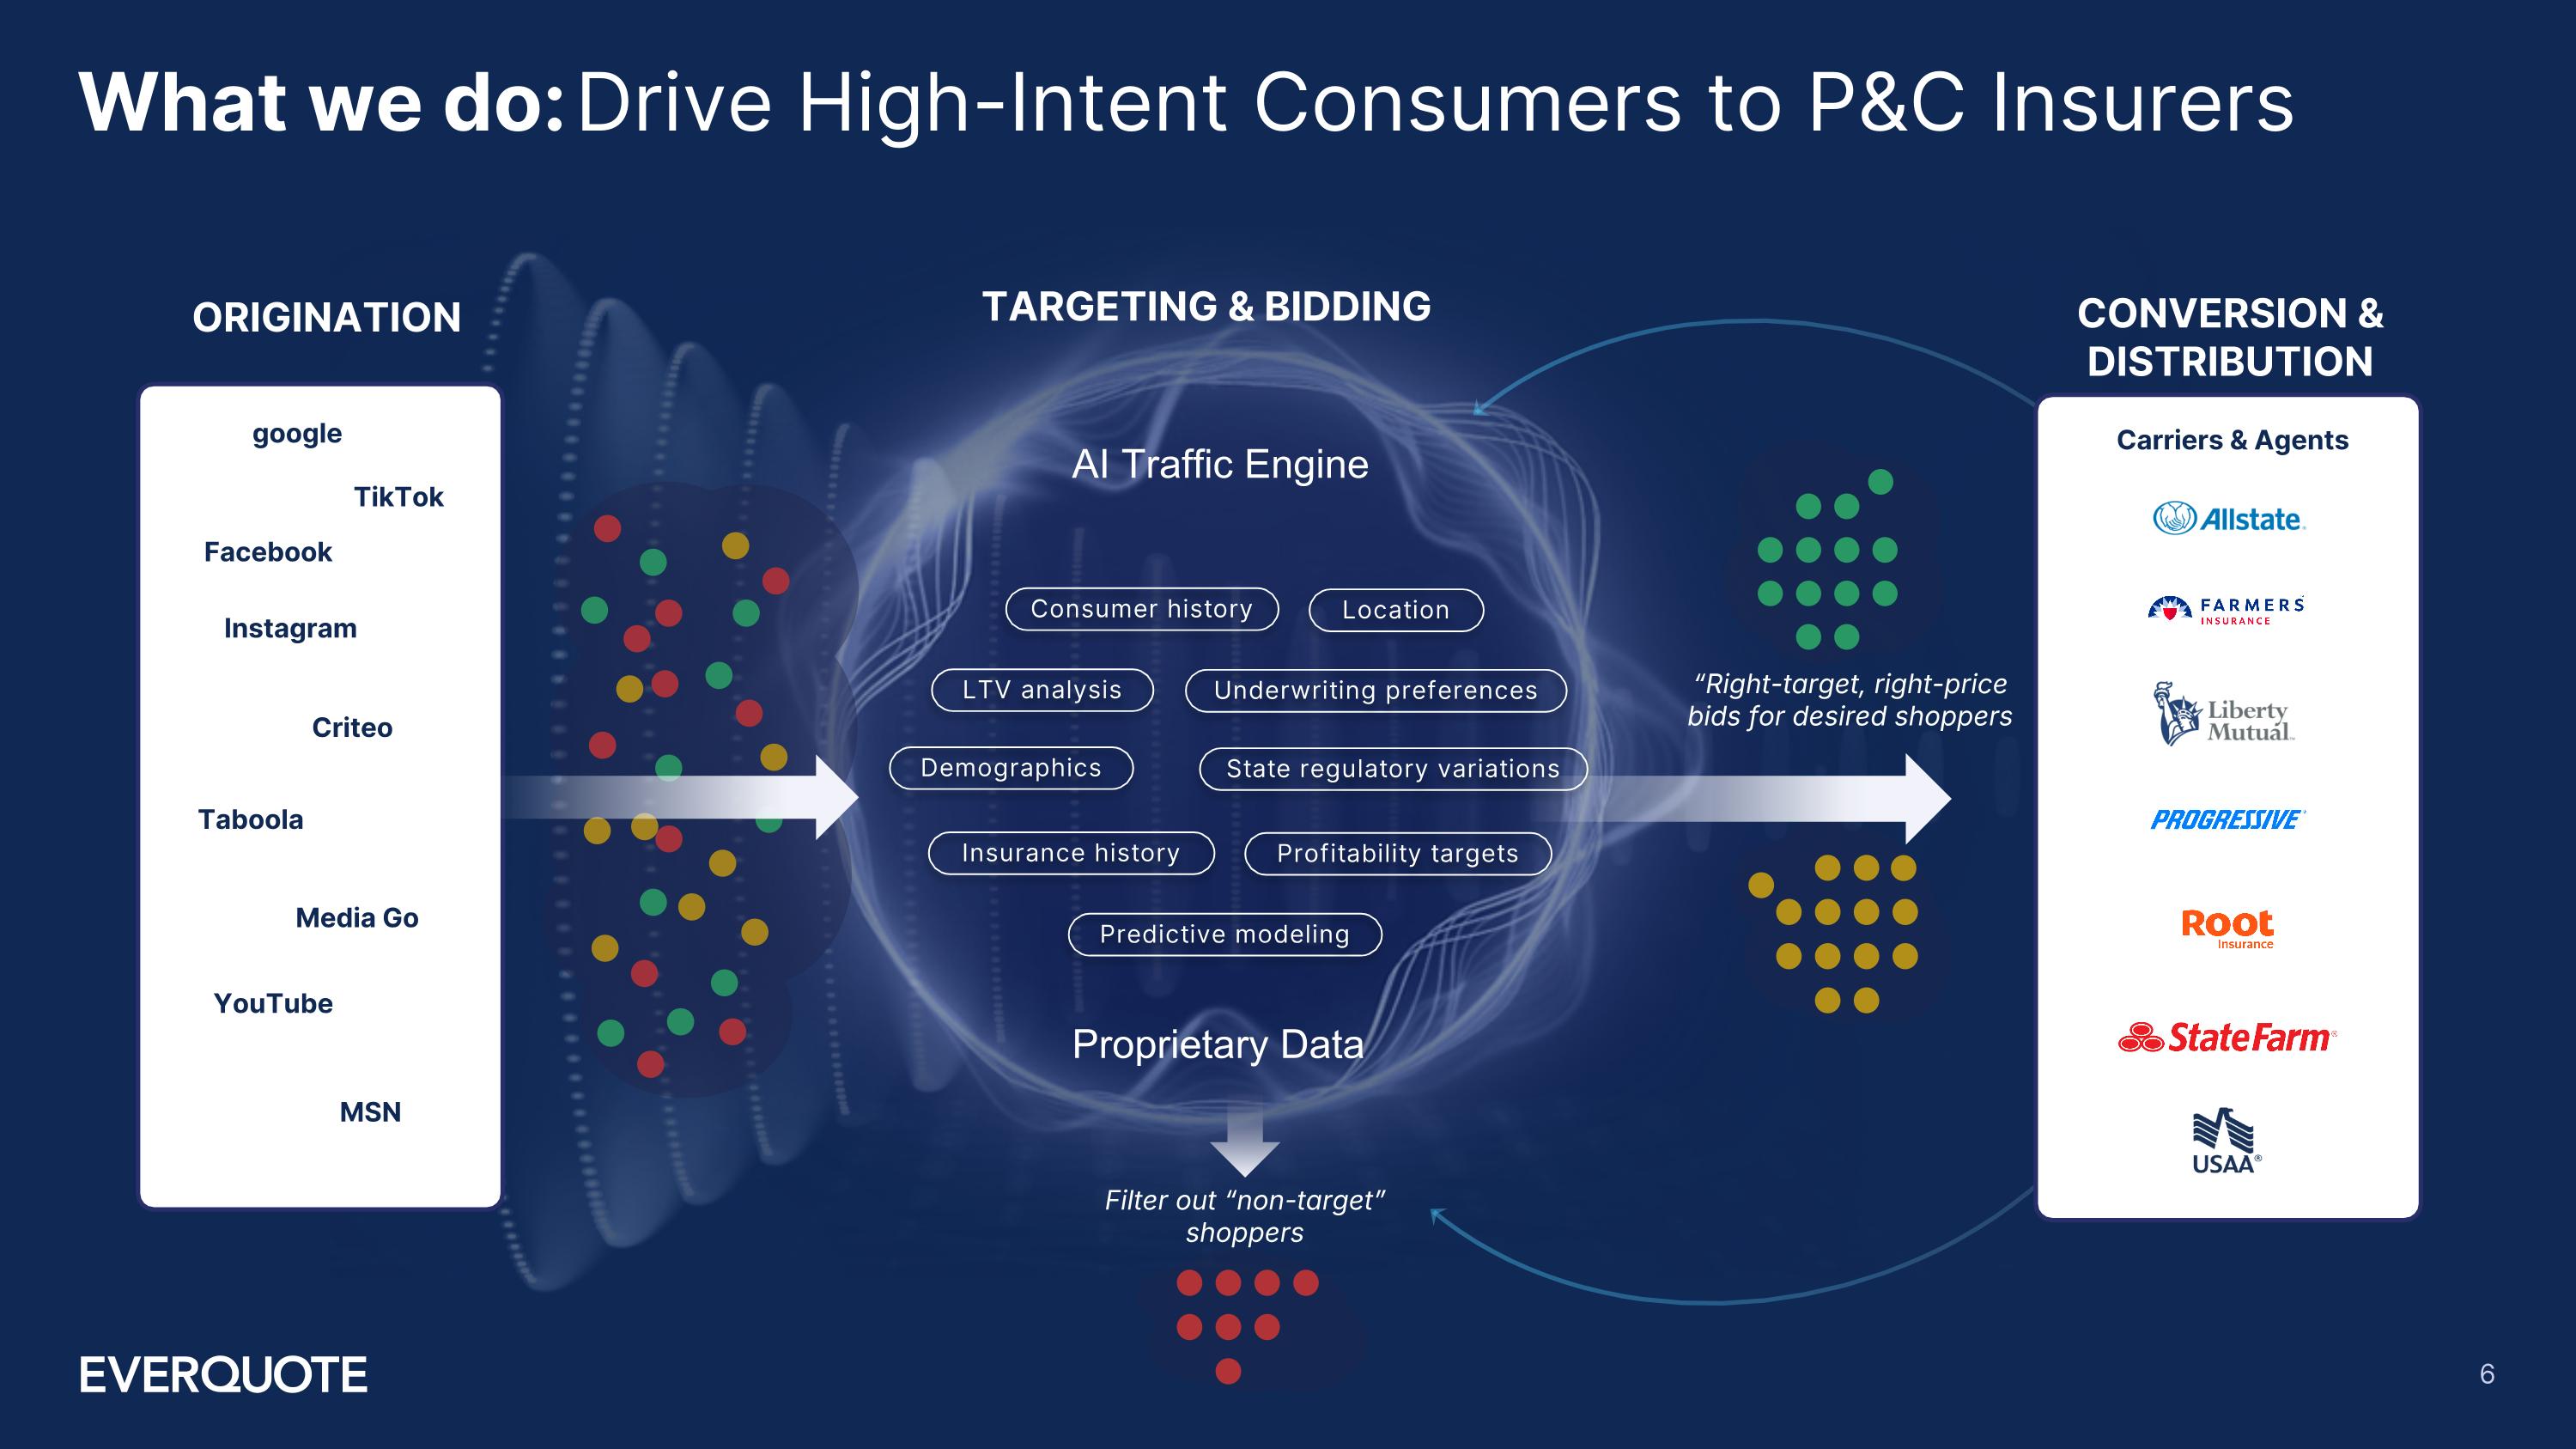
ORIGINATION “Right-target, right-price bids for desired shoppers CONVERSION & DISTRIBUTION TARGETING & BIDDING What we do: Drive High-Intent Consumers to P&C Insurers Consumer history Location Demographics Insurance history Underwriting preferences Profitability targets State regulatory variations LTV analysis Predictive modeling Carriers & Agents Filter out “non-target” shoppers Facebook Instagram TikTok Criteo Taboola Media Go YouTube MSN google AI Traffic Engine Proprietary Data
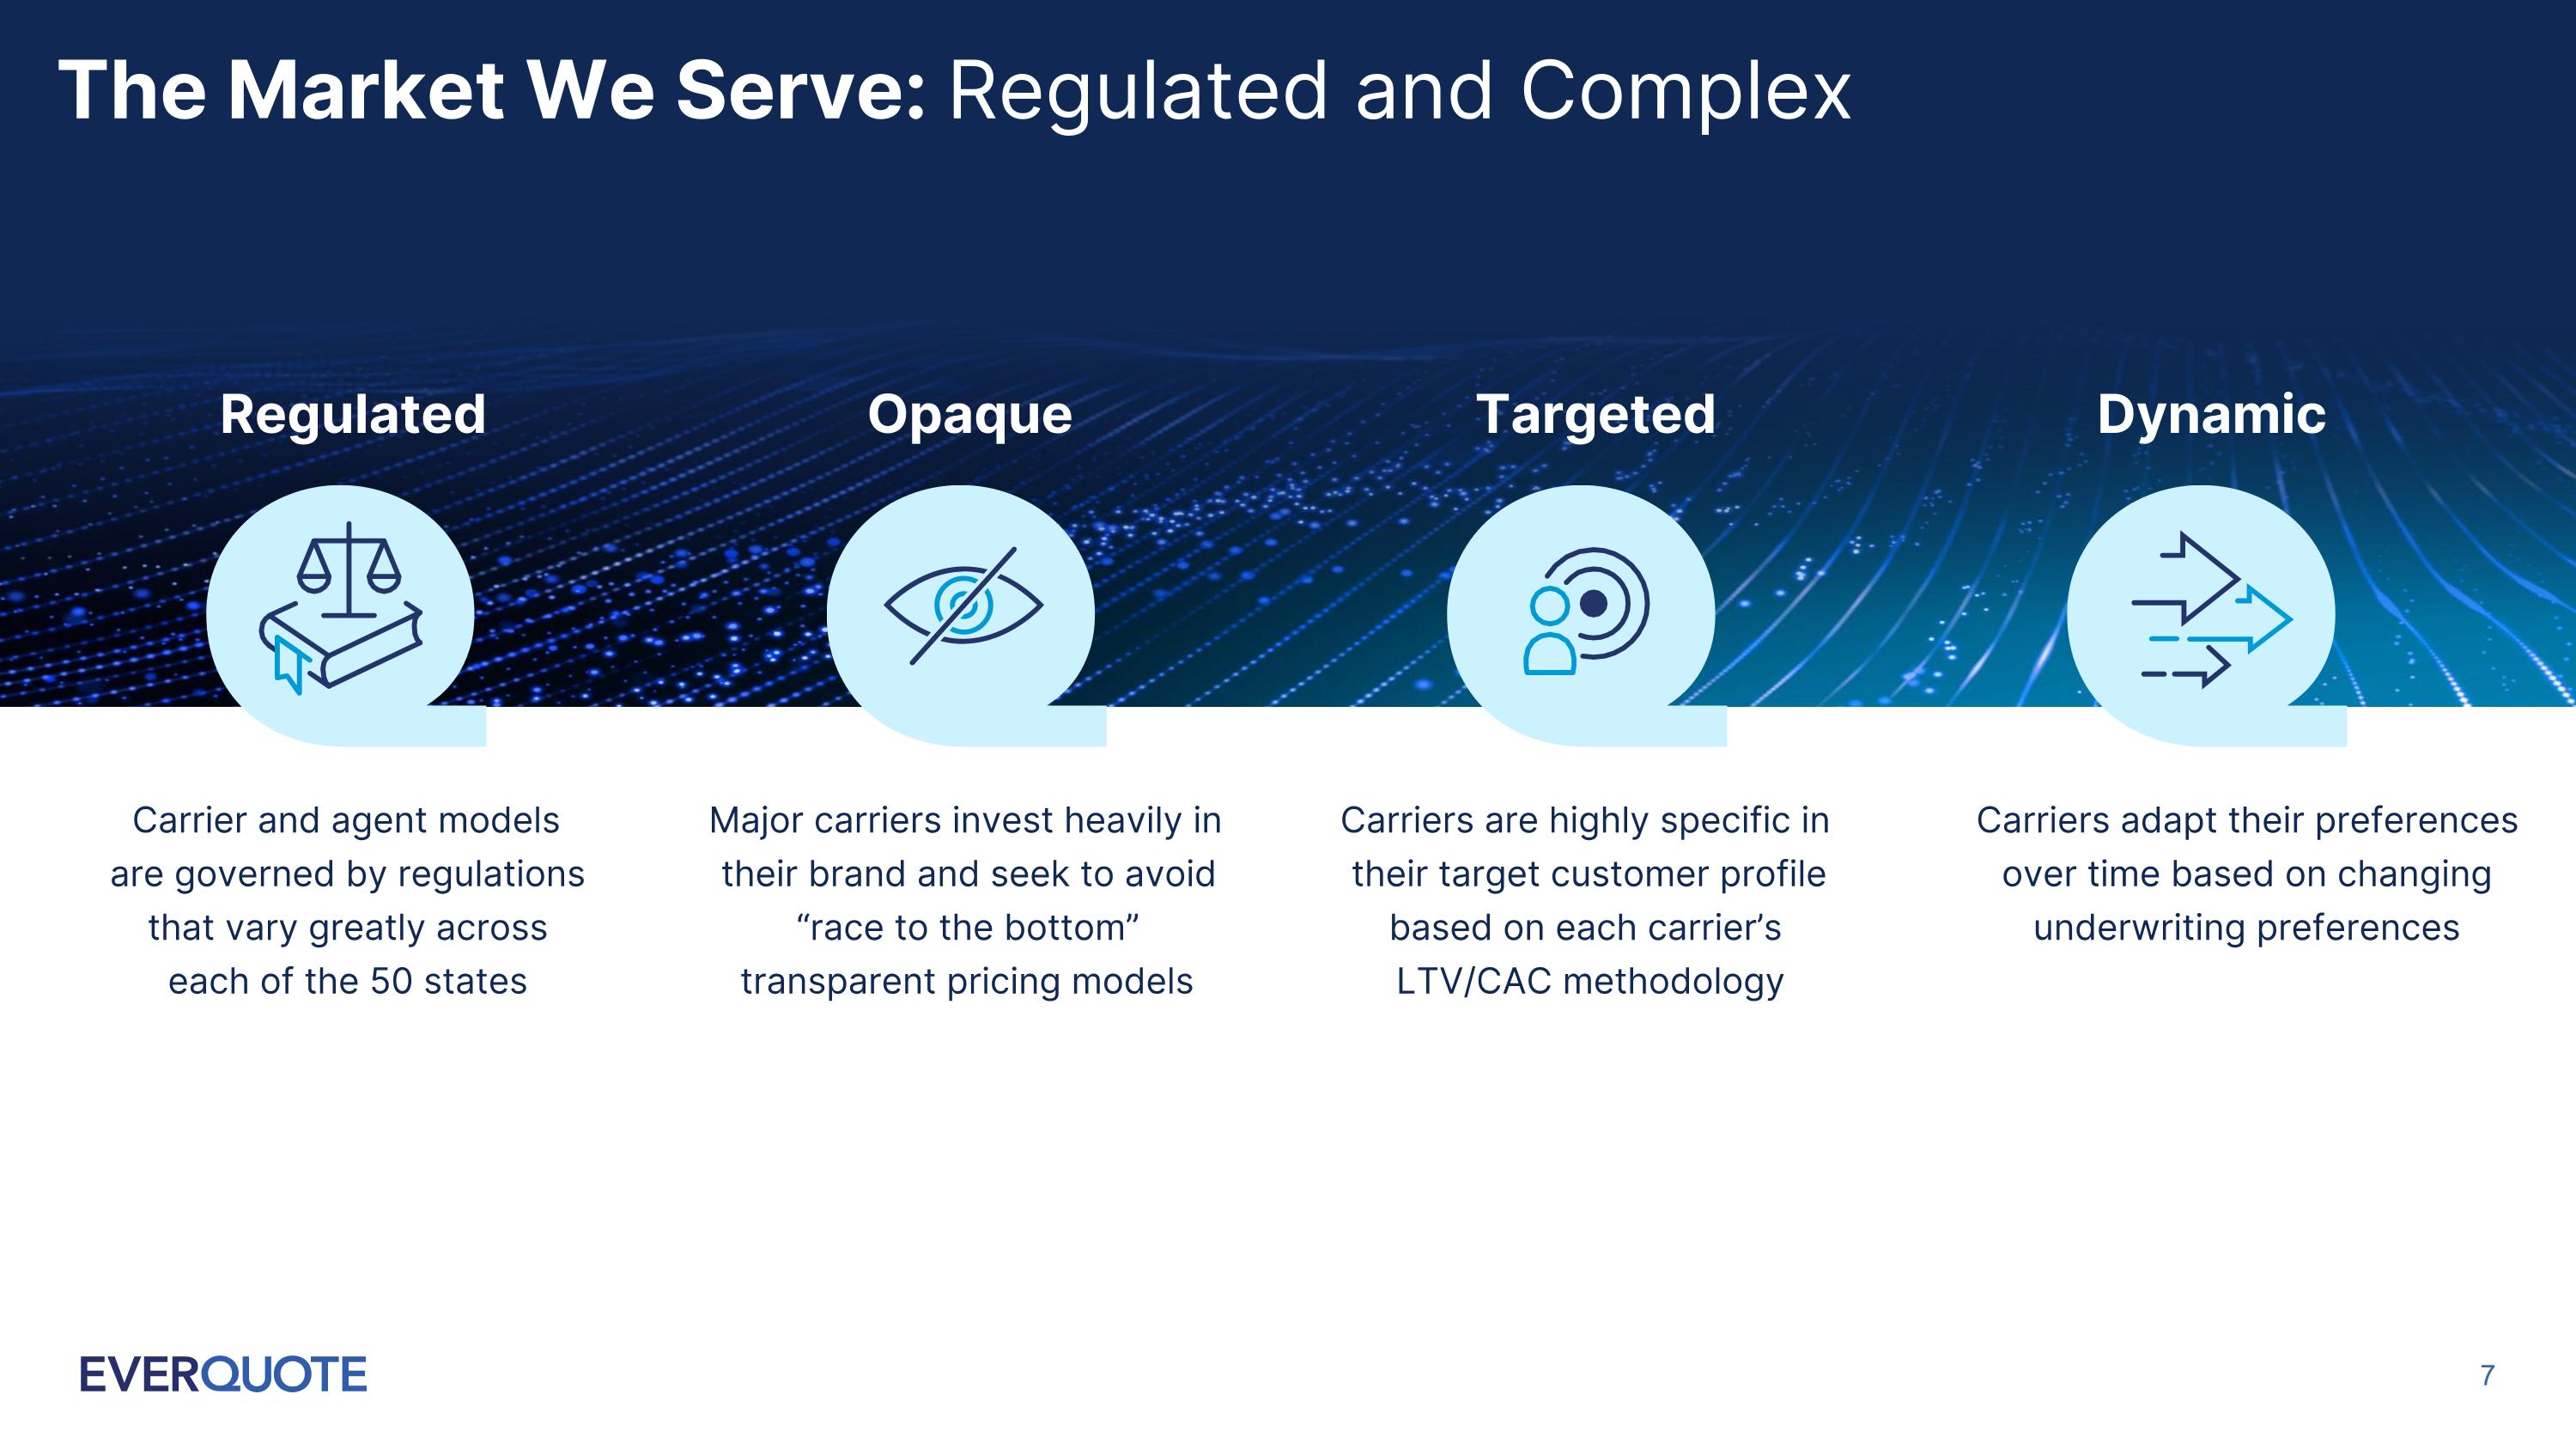
Regulated Carrier and agent models are governed by regulations that vary greatly across each of the 50 states The Market We Serve: Regulated and Complex Opaque Major carriers invest heavily in their brand and seek to avoid “race to the bottom” transparent pricing models Targeted Carriers are highly specific in their target customer profile based on each carrier’s LTV/CAC methodology Dynamic Carriers adapt their preferences over time based on changing underwriting preferences
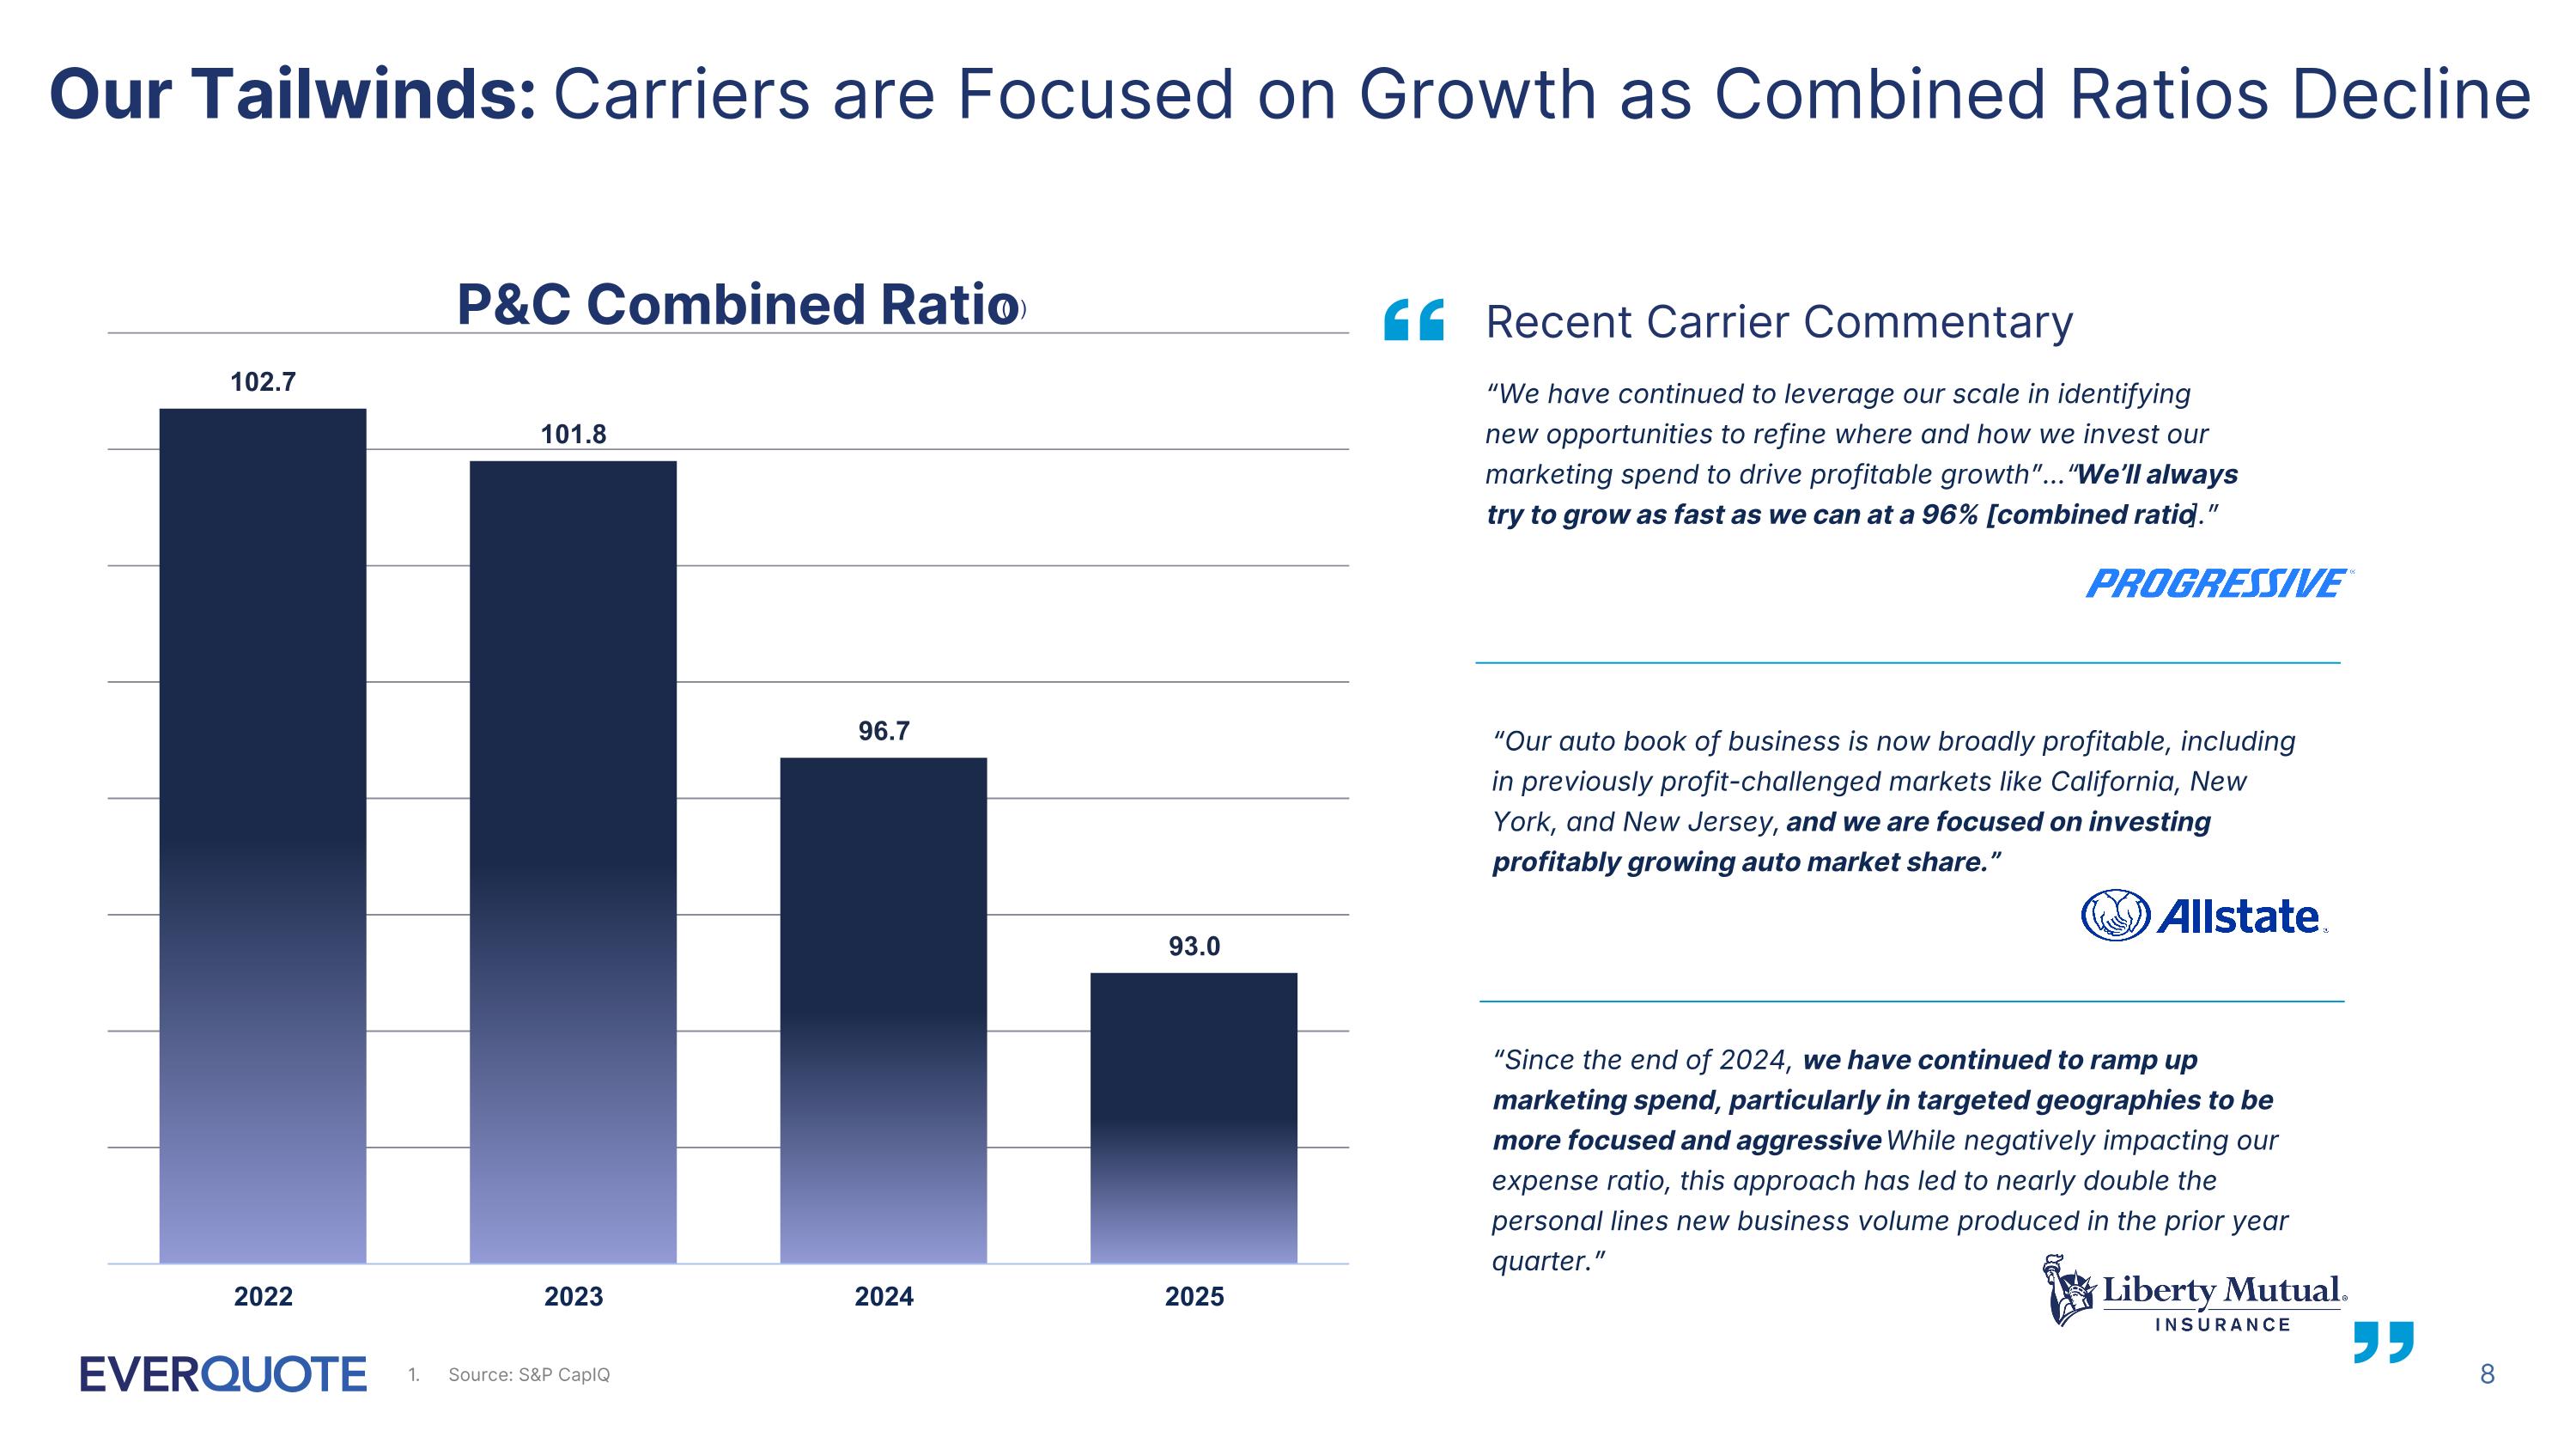
Our Tailwinds: Carriers are Focused on Growth as Combined Ratios Decline “We have continued to leverage our scale in identifying new opportunities to refine where and how we invest our marketing spend to drive profitable growth”…“We’ll always try to grow as fast as we can at a 96% [combined ratio].” “Our auto book of business is now broadly profitable, including in previously profit-challenged markets like California, New York, and New Jersey, and we are focused on investing profitably growing auto market share.” Recent Carrier Commentary “Since the end of 2024, we have continued to ramp up marketing spend, particularly in targeted geographies to be more focused and aggressive. While negatively impacting our expense ratio, this approach has led to nearly double the personal lines new business volume produced in the prior year quarter.” P&C Combined Ratio(1) Source: S&P CapIQ
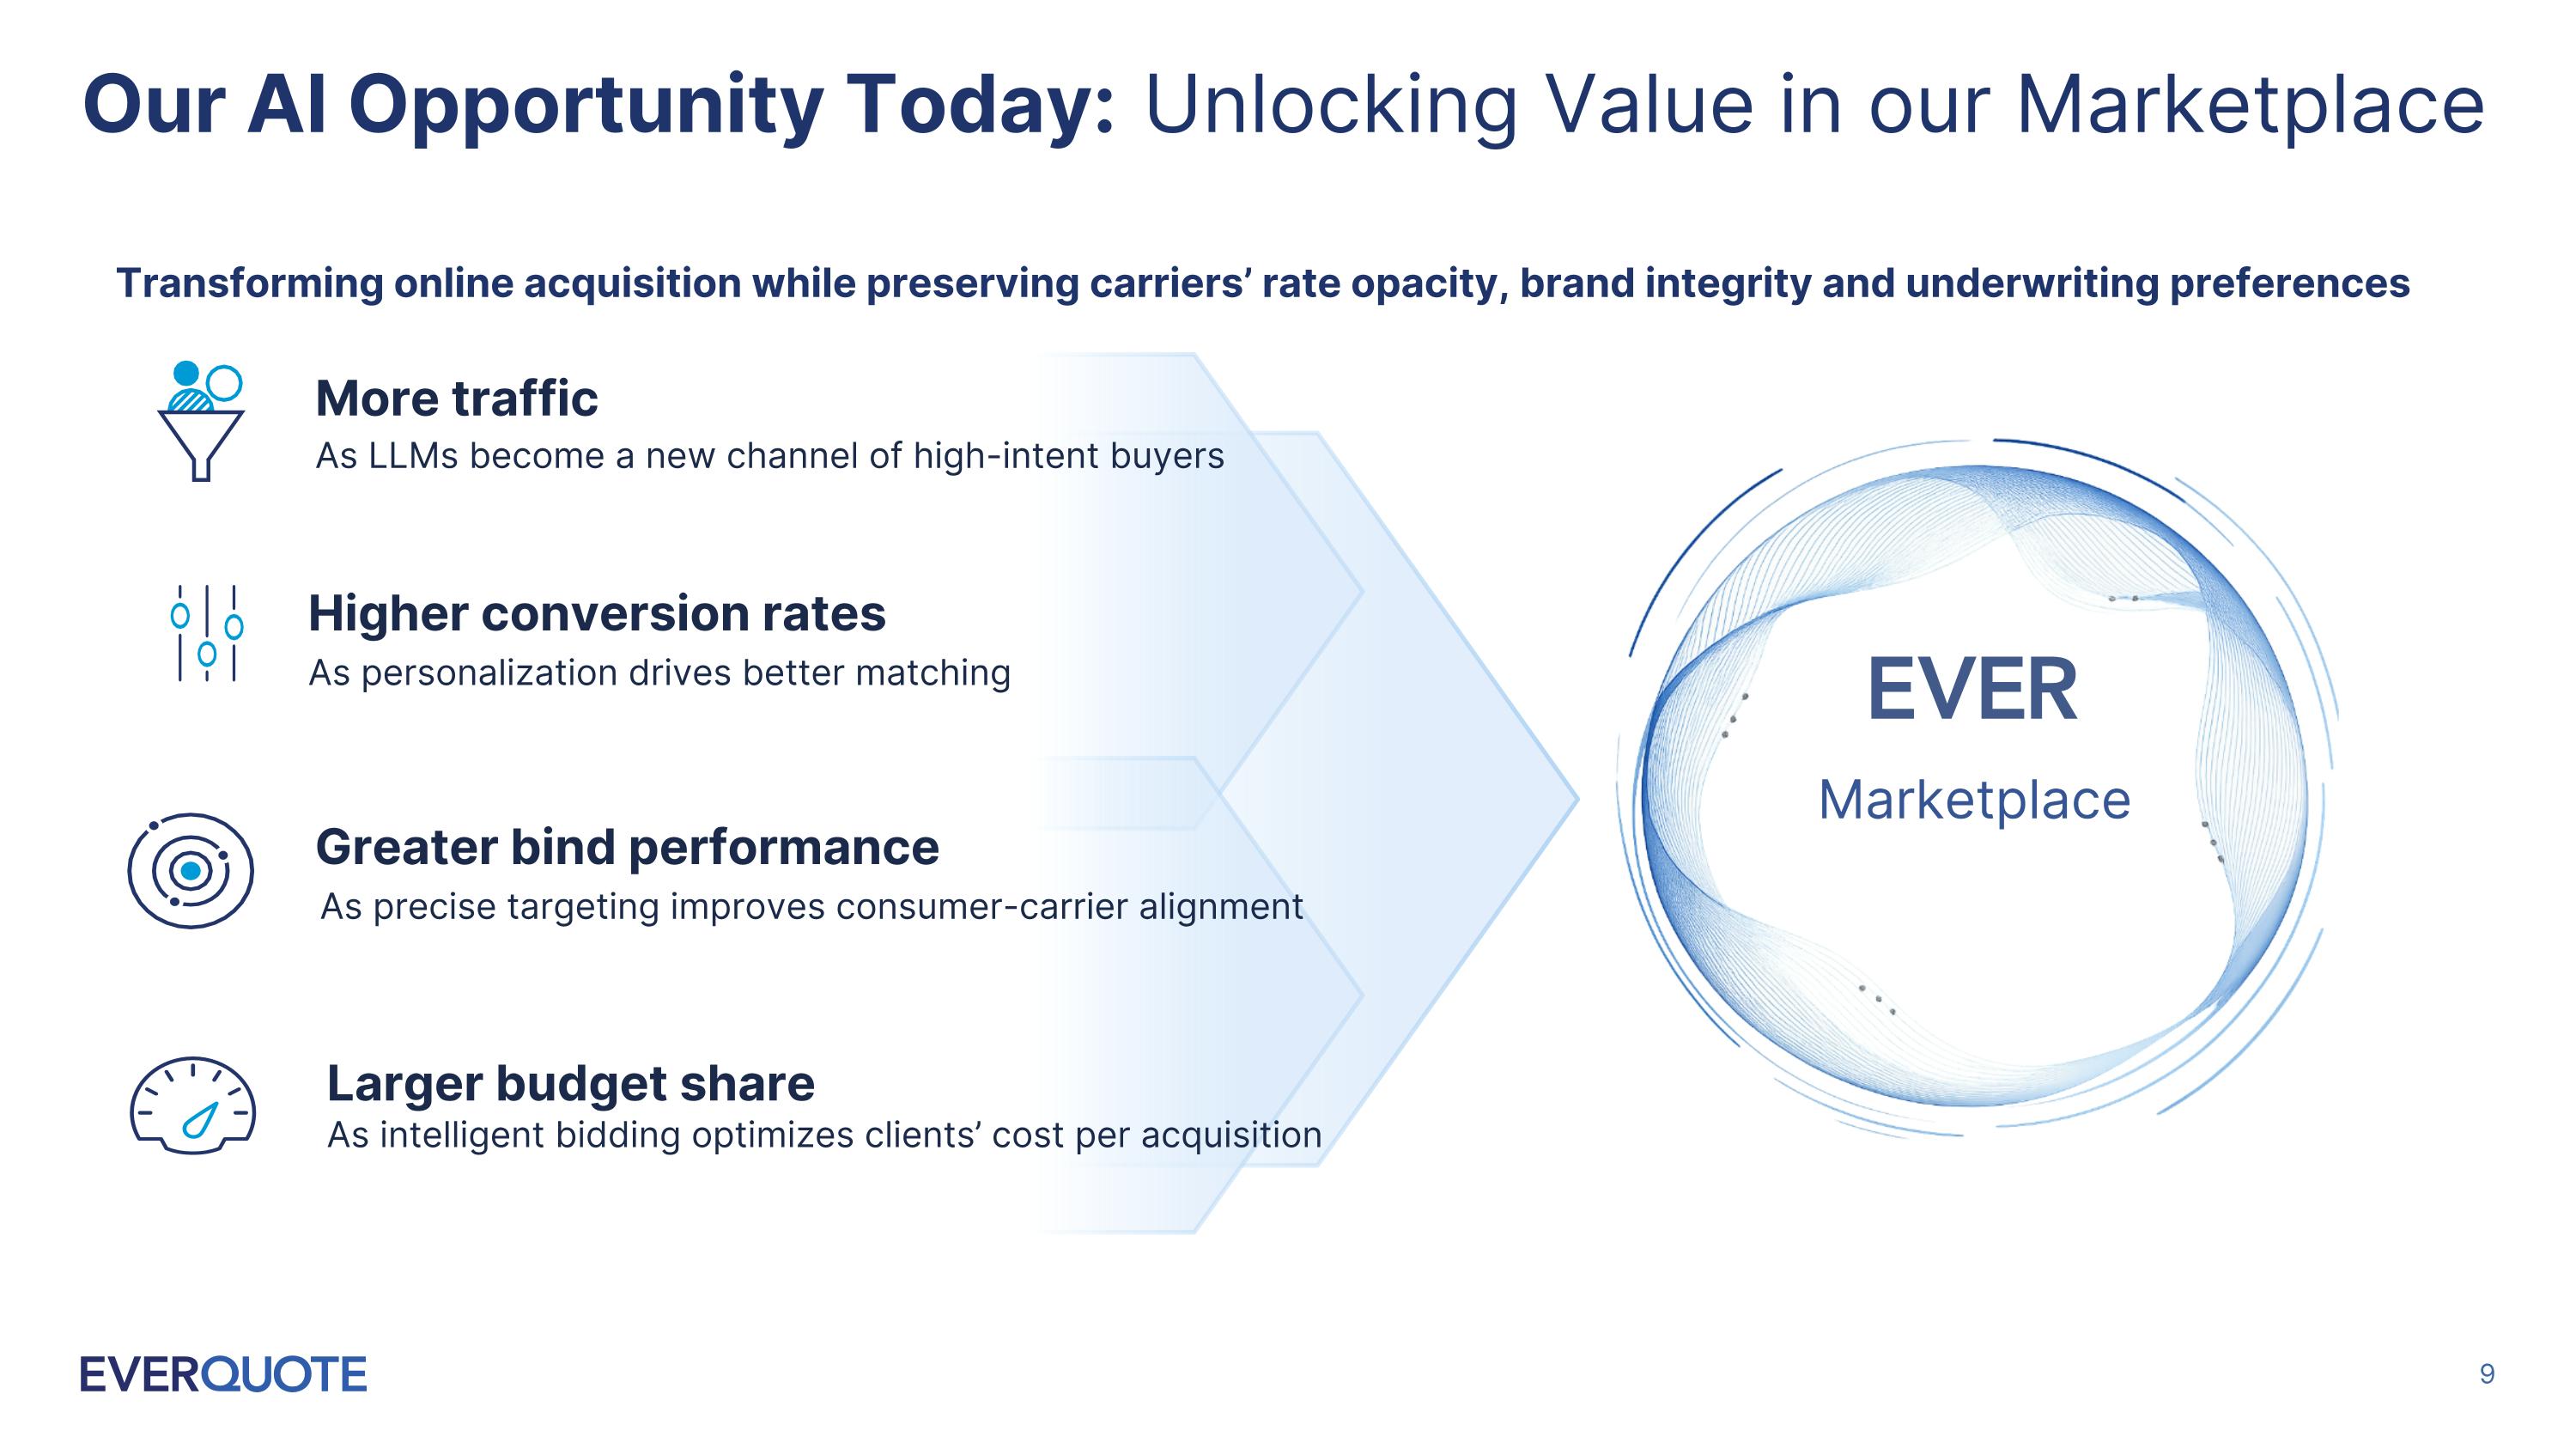
Marketplace Our AI Opportunity Today: Unlocking Value in our Marketplace Transforming online acquisition while preserving carriers’ rate opacity, brand integrity and underwriting preferences More traffic As LLMs become a new channel of high-intent buyers Higher conversion rates As personalization drives better matching Greater bind performance As precise targeting improves consumer-carrier alignment Larger budget share As intelligent bidding optimizes clients’ cost per acquisition
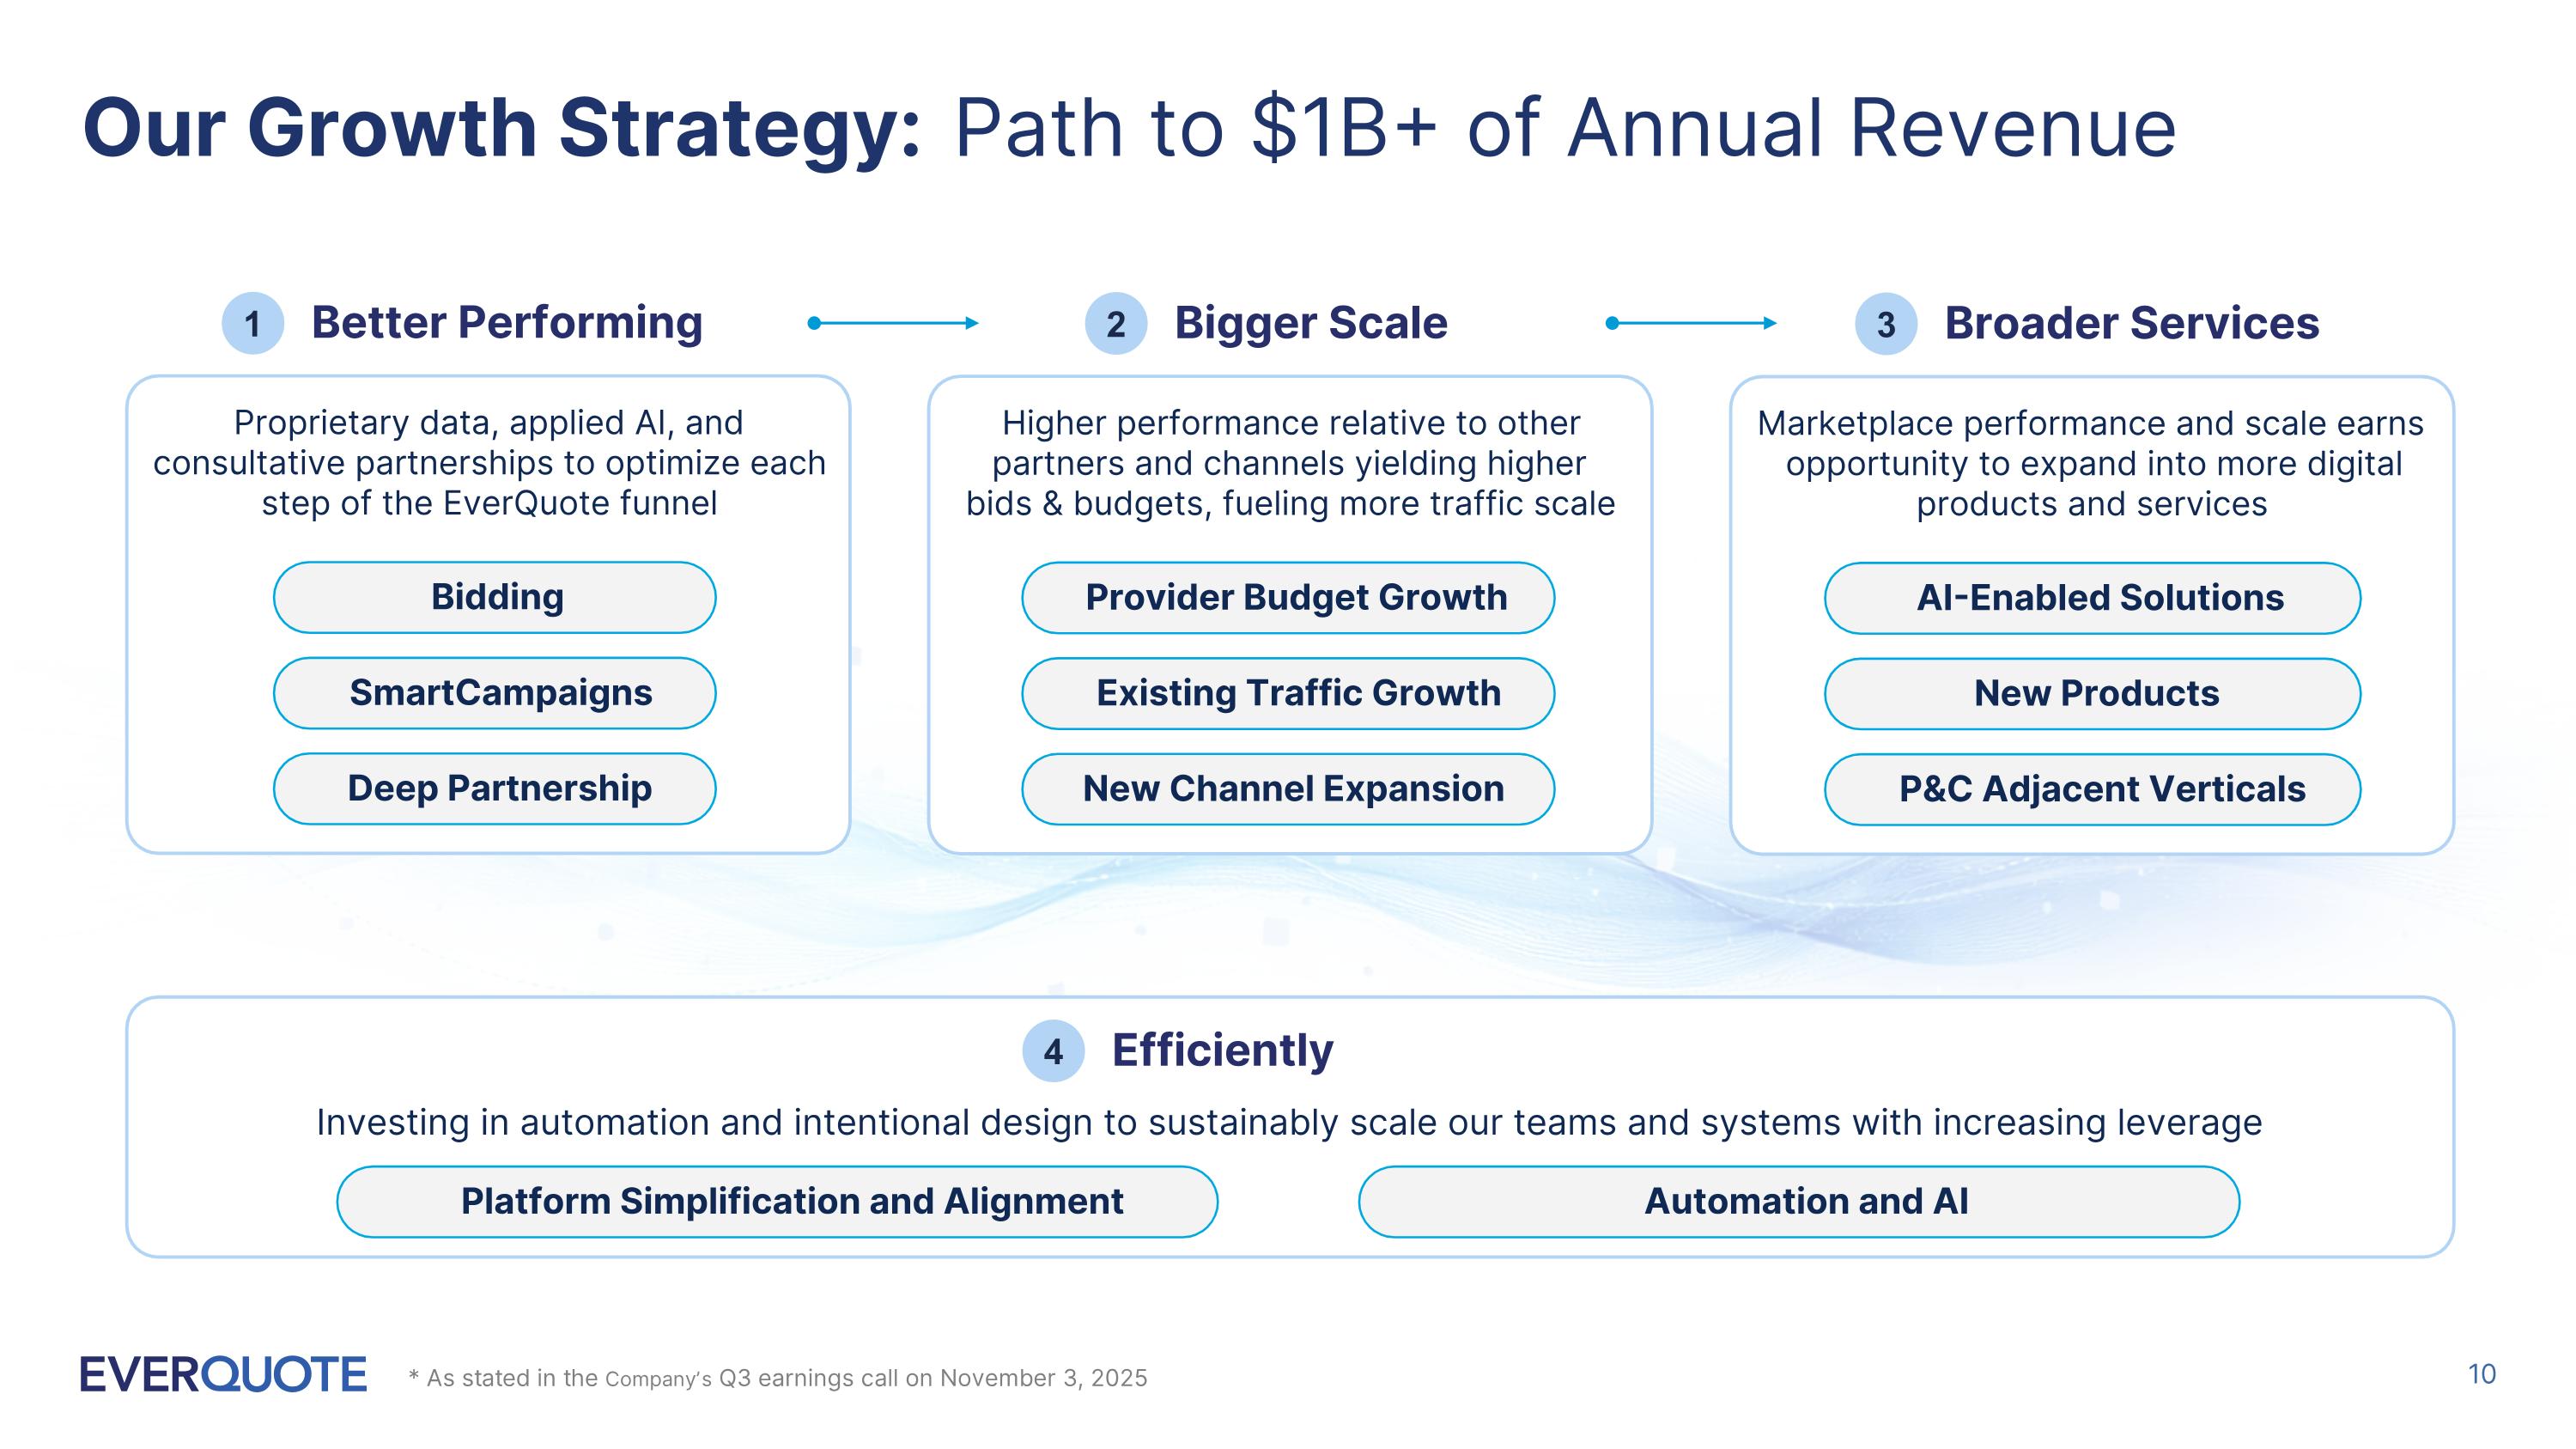
Our Growth Strategy: Path to $1B+ of Annual Revenue Proprietary data, applied AI, and consultative partnerships to optimize each step of the EverQuote funnel Bidding SmartCampaigns Deep Partnership Better Performing 1 Higher performance relative to other partners and channels yielding higher bids & budgets, fueling more traffic scale Provider Budget Growth Existing Traffic Growth New Channel Expansion Bigger Scale 2 Marketplace performance and scale earns opportunity to expand into more digital products and services AI-Enabled Solutions New Products P&C Adjacent Verticals Broader Services 3 Efficiently 4 Investing in automation and intentional design to sustainably scale our teams and systems with increasing leverage Platform Simplification and Alignment Automation and AI * As stated in the Company’s Q3 earnings call on November 3, 2025
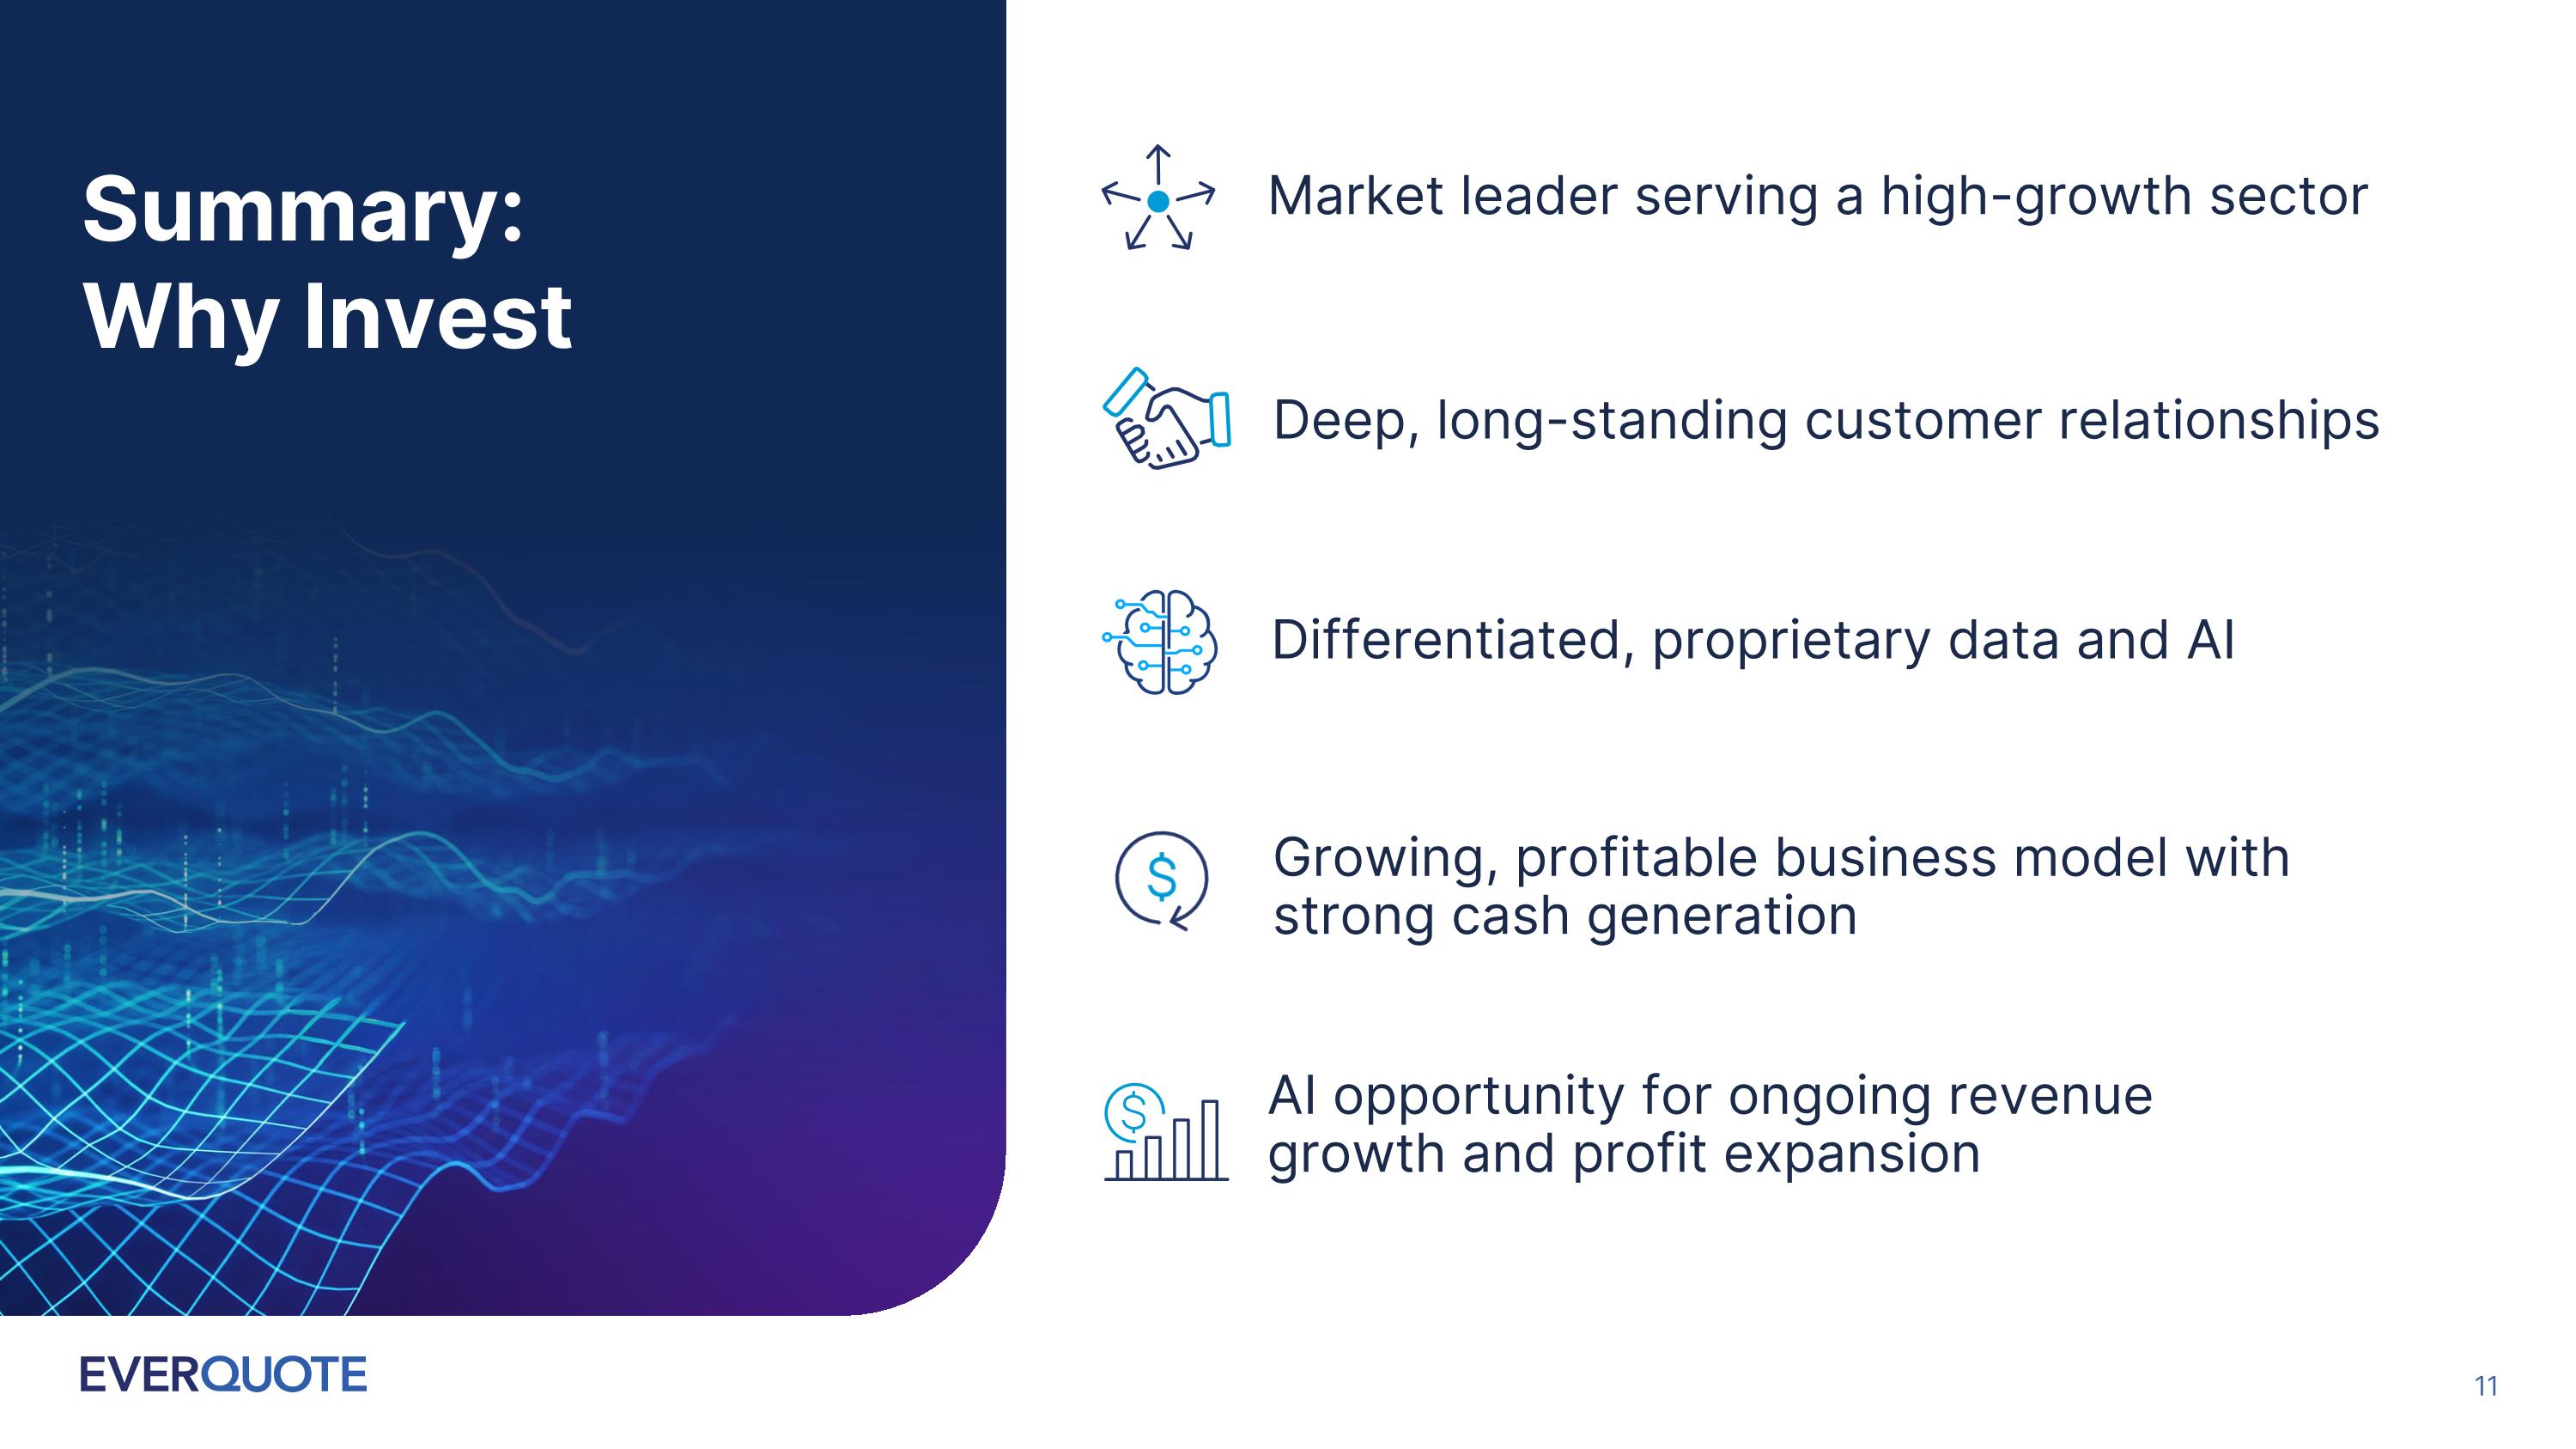
Summary: Why Invest Market leader serving a high-growth sector Deep, long-standing customer relationships Growing, profitable business model with strong cash generation Differentiated, proprietary data and AI AI opportunity for ongoing revenue growth and profit expansion

Q1 Summary and Financial Highlights
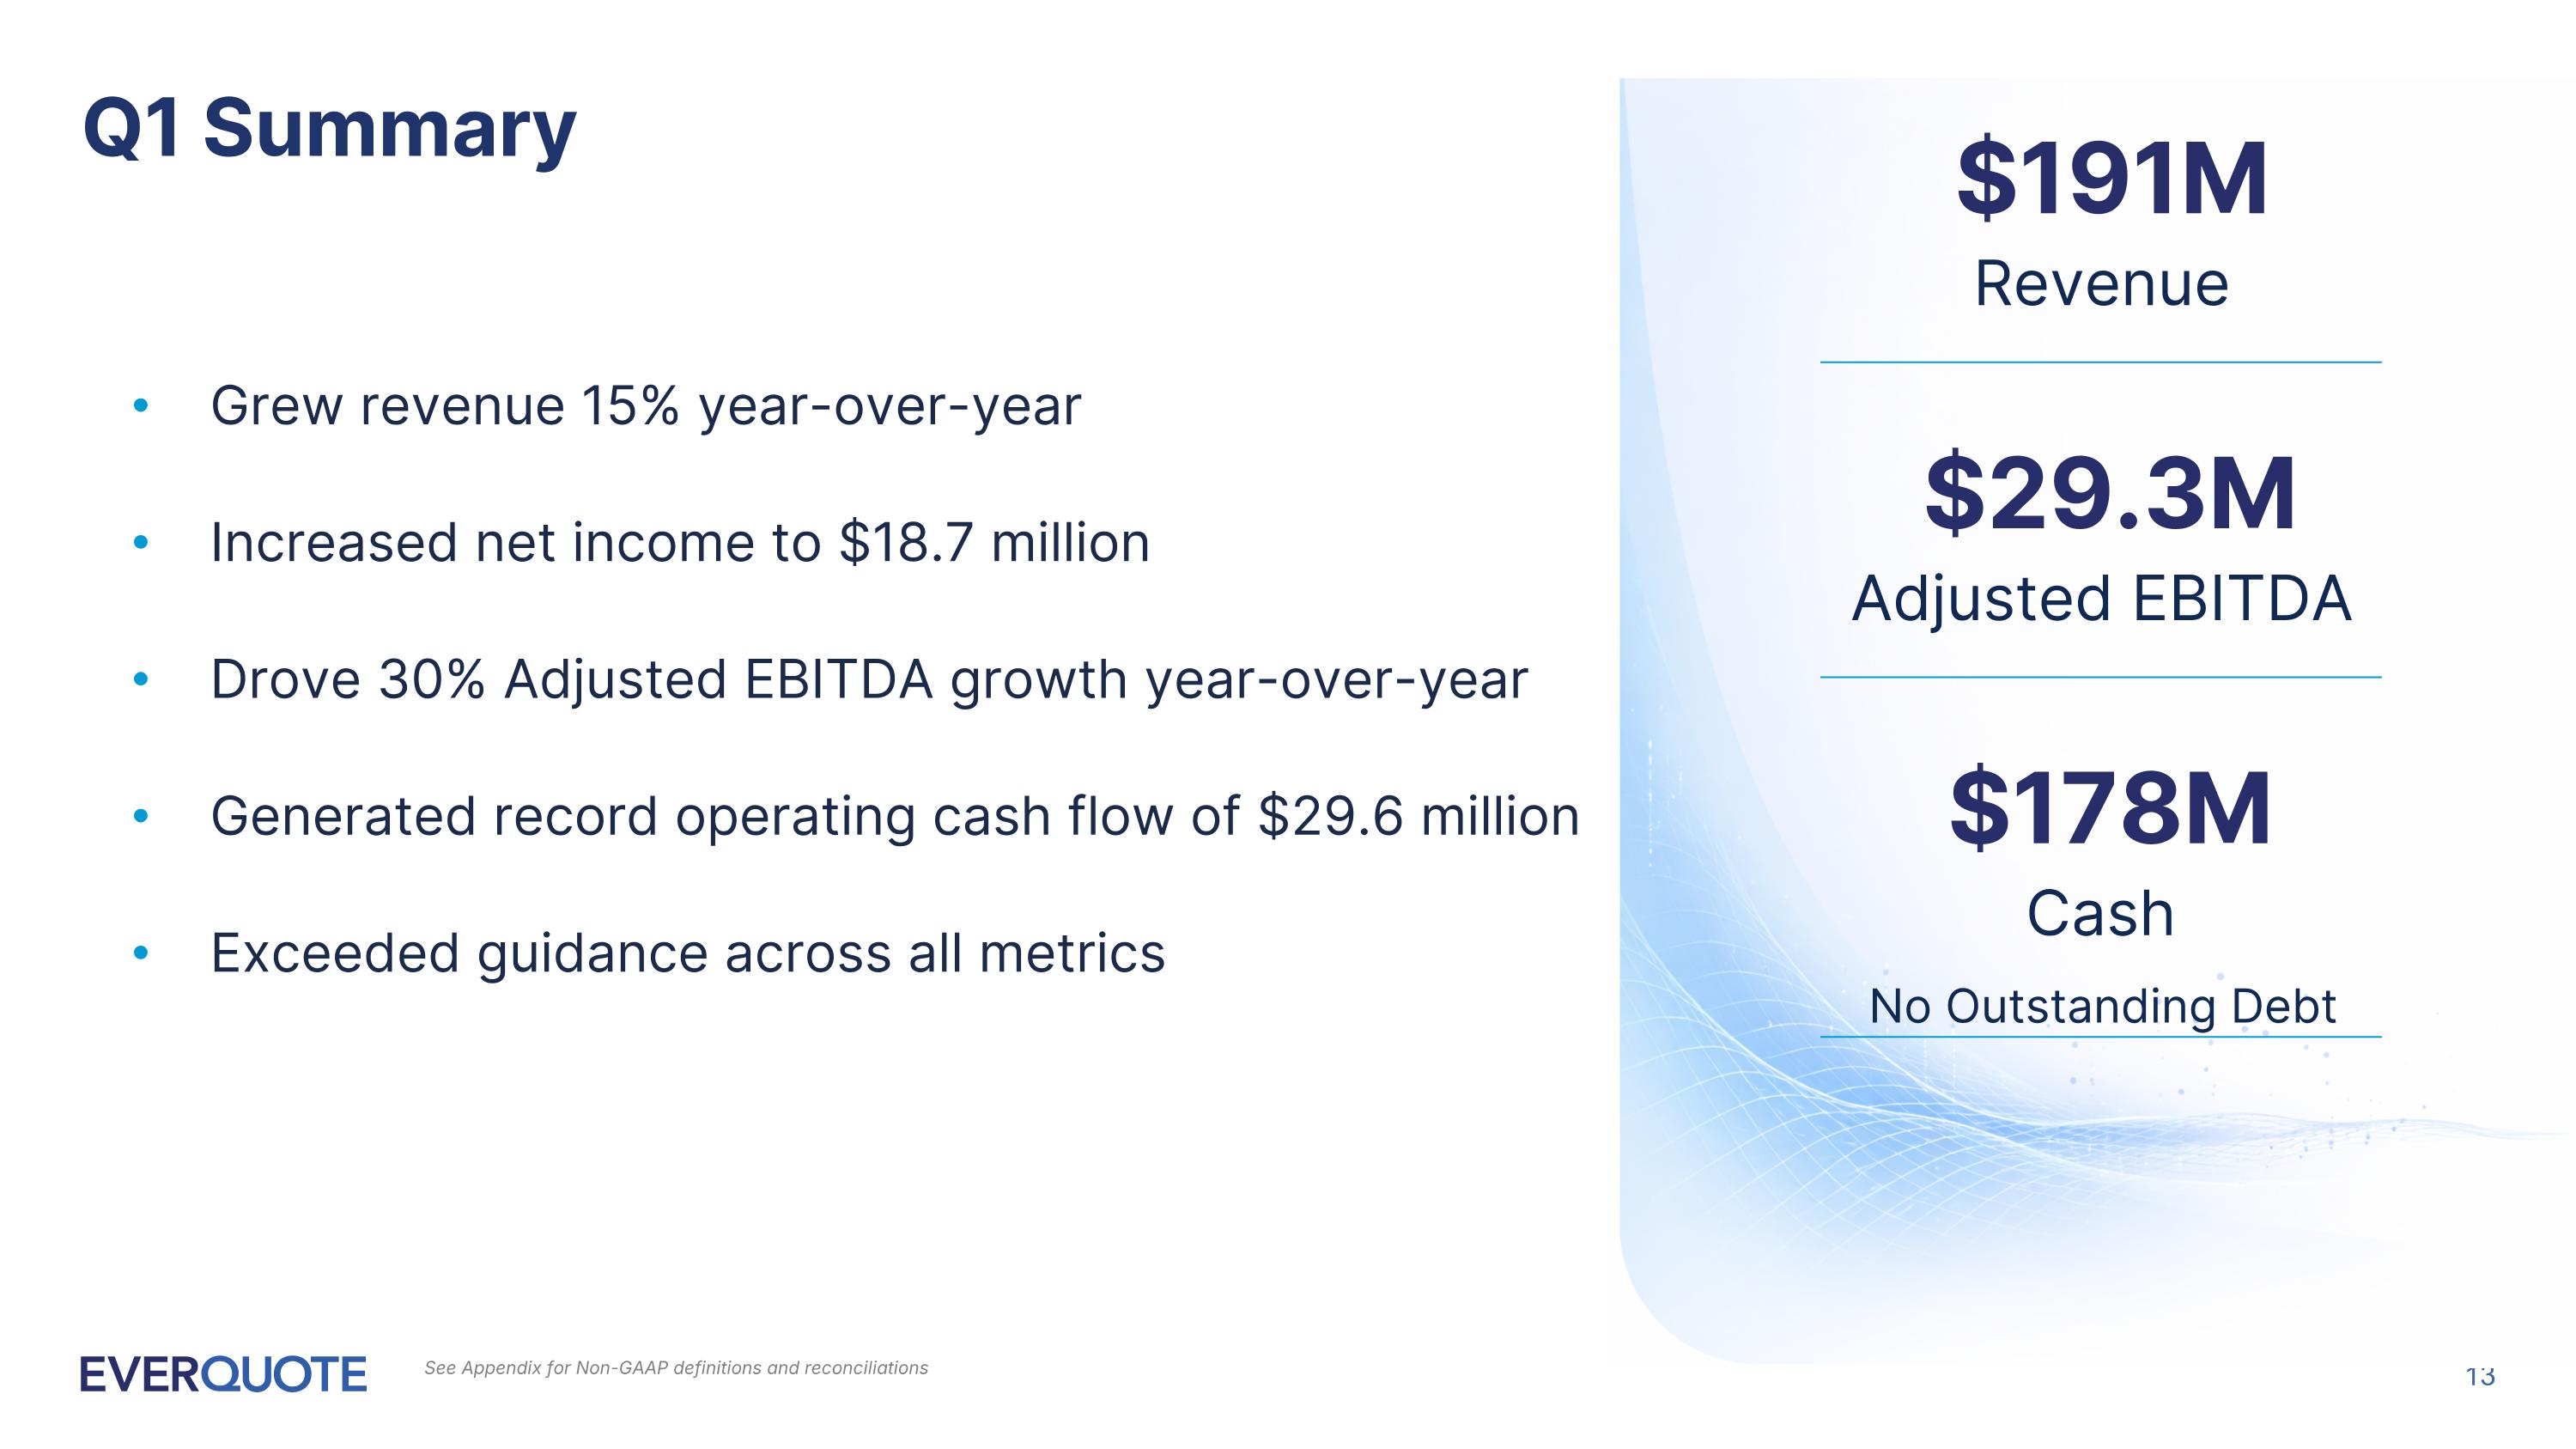
Grew revenue 15% year-over-year Increased net income to $18.7 million Drove 30% Adjusted EBITDA growth year-over-year Generated record operating cash flow of $29.6 million Exceeded guidance across all metrics Q1 Summary $191M Revenue $29.3M Adjusted EBITDA $178M Cash No Outstanding Debt See Appendix for Non-GAAP definitions and reconciliations
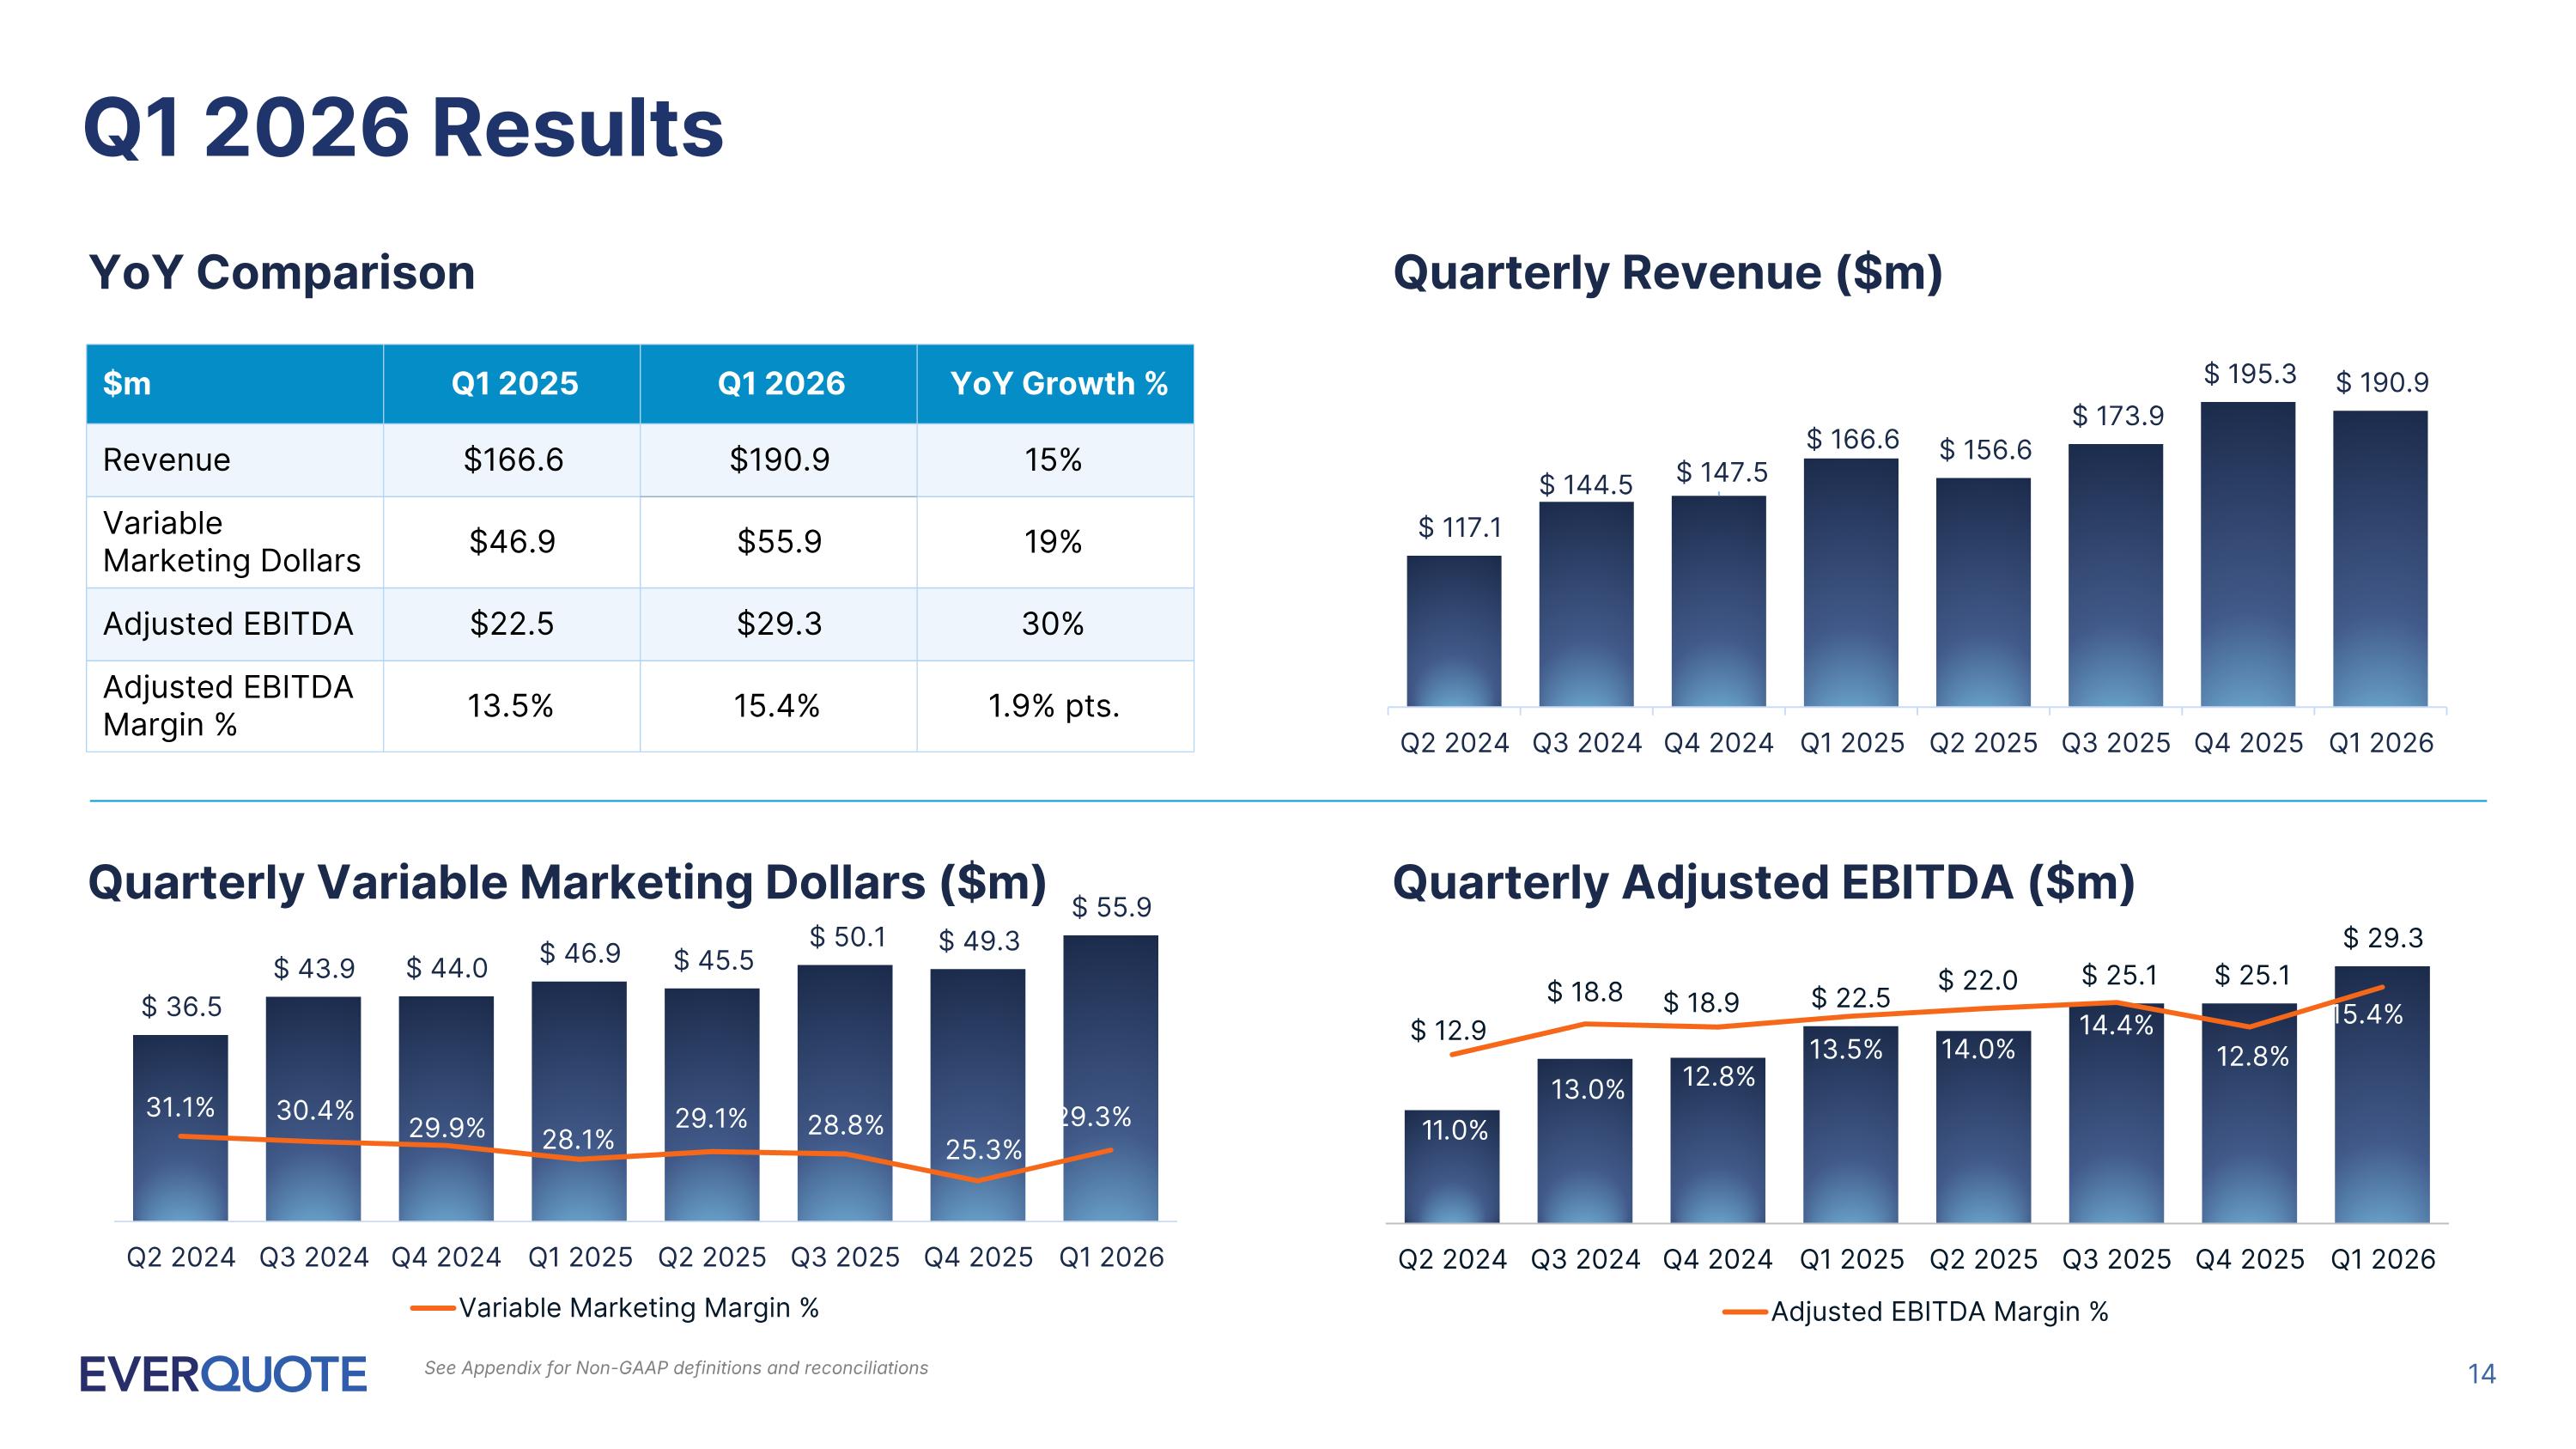
Q1 2026 Results $m Q1 2025 Q1 2026 YoY Growth % Revenue $166.6 $190.9 15% Variable Marketing Dollars $46.9 $55.9 19% Adjusted EBITDA $22.5 $29.3 30% Adjusted EBITDA Margin % 13.5% 15.4% 1.9% pts. YoY Comparison Quarterly Revenue ($m) Quarterly Variable Marketing Dollars ($m) Quarterly Adjusted EBITDA ($m) See Appendix for Non-GAAP definitions and reconciliations
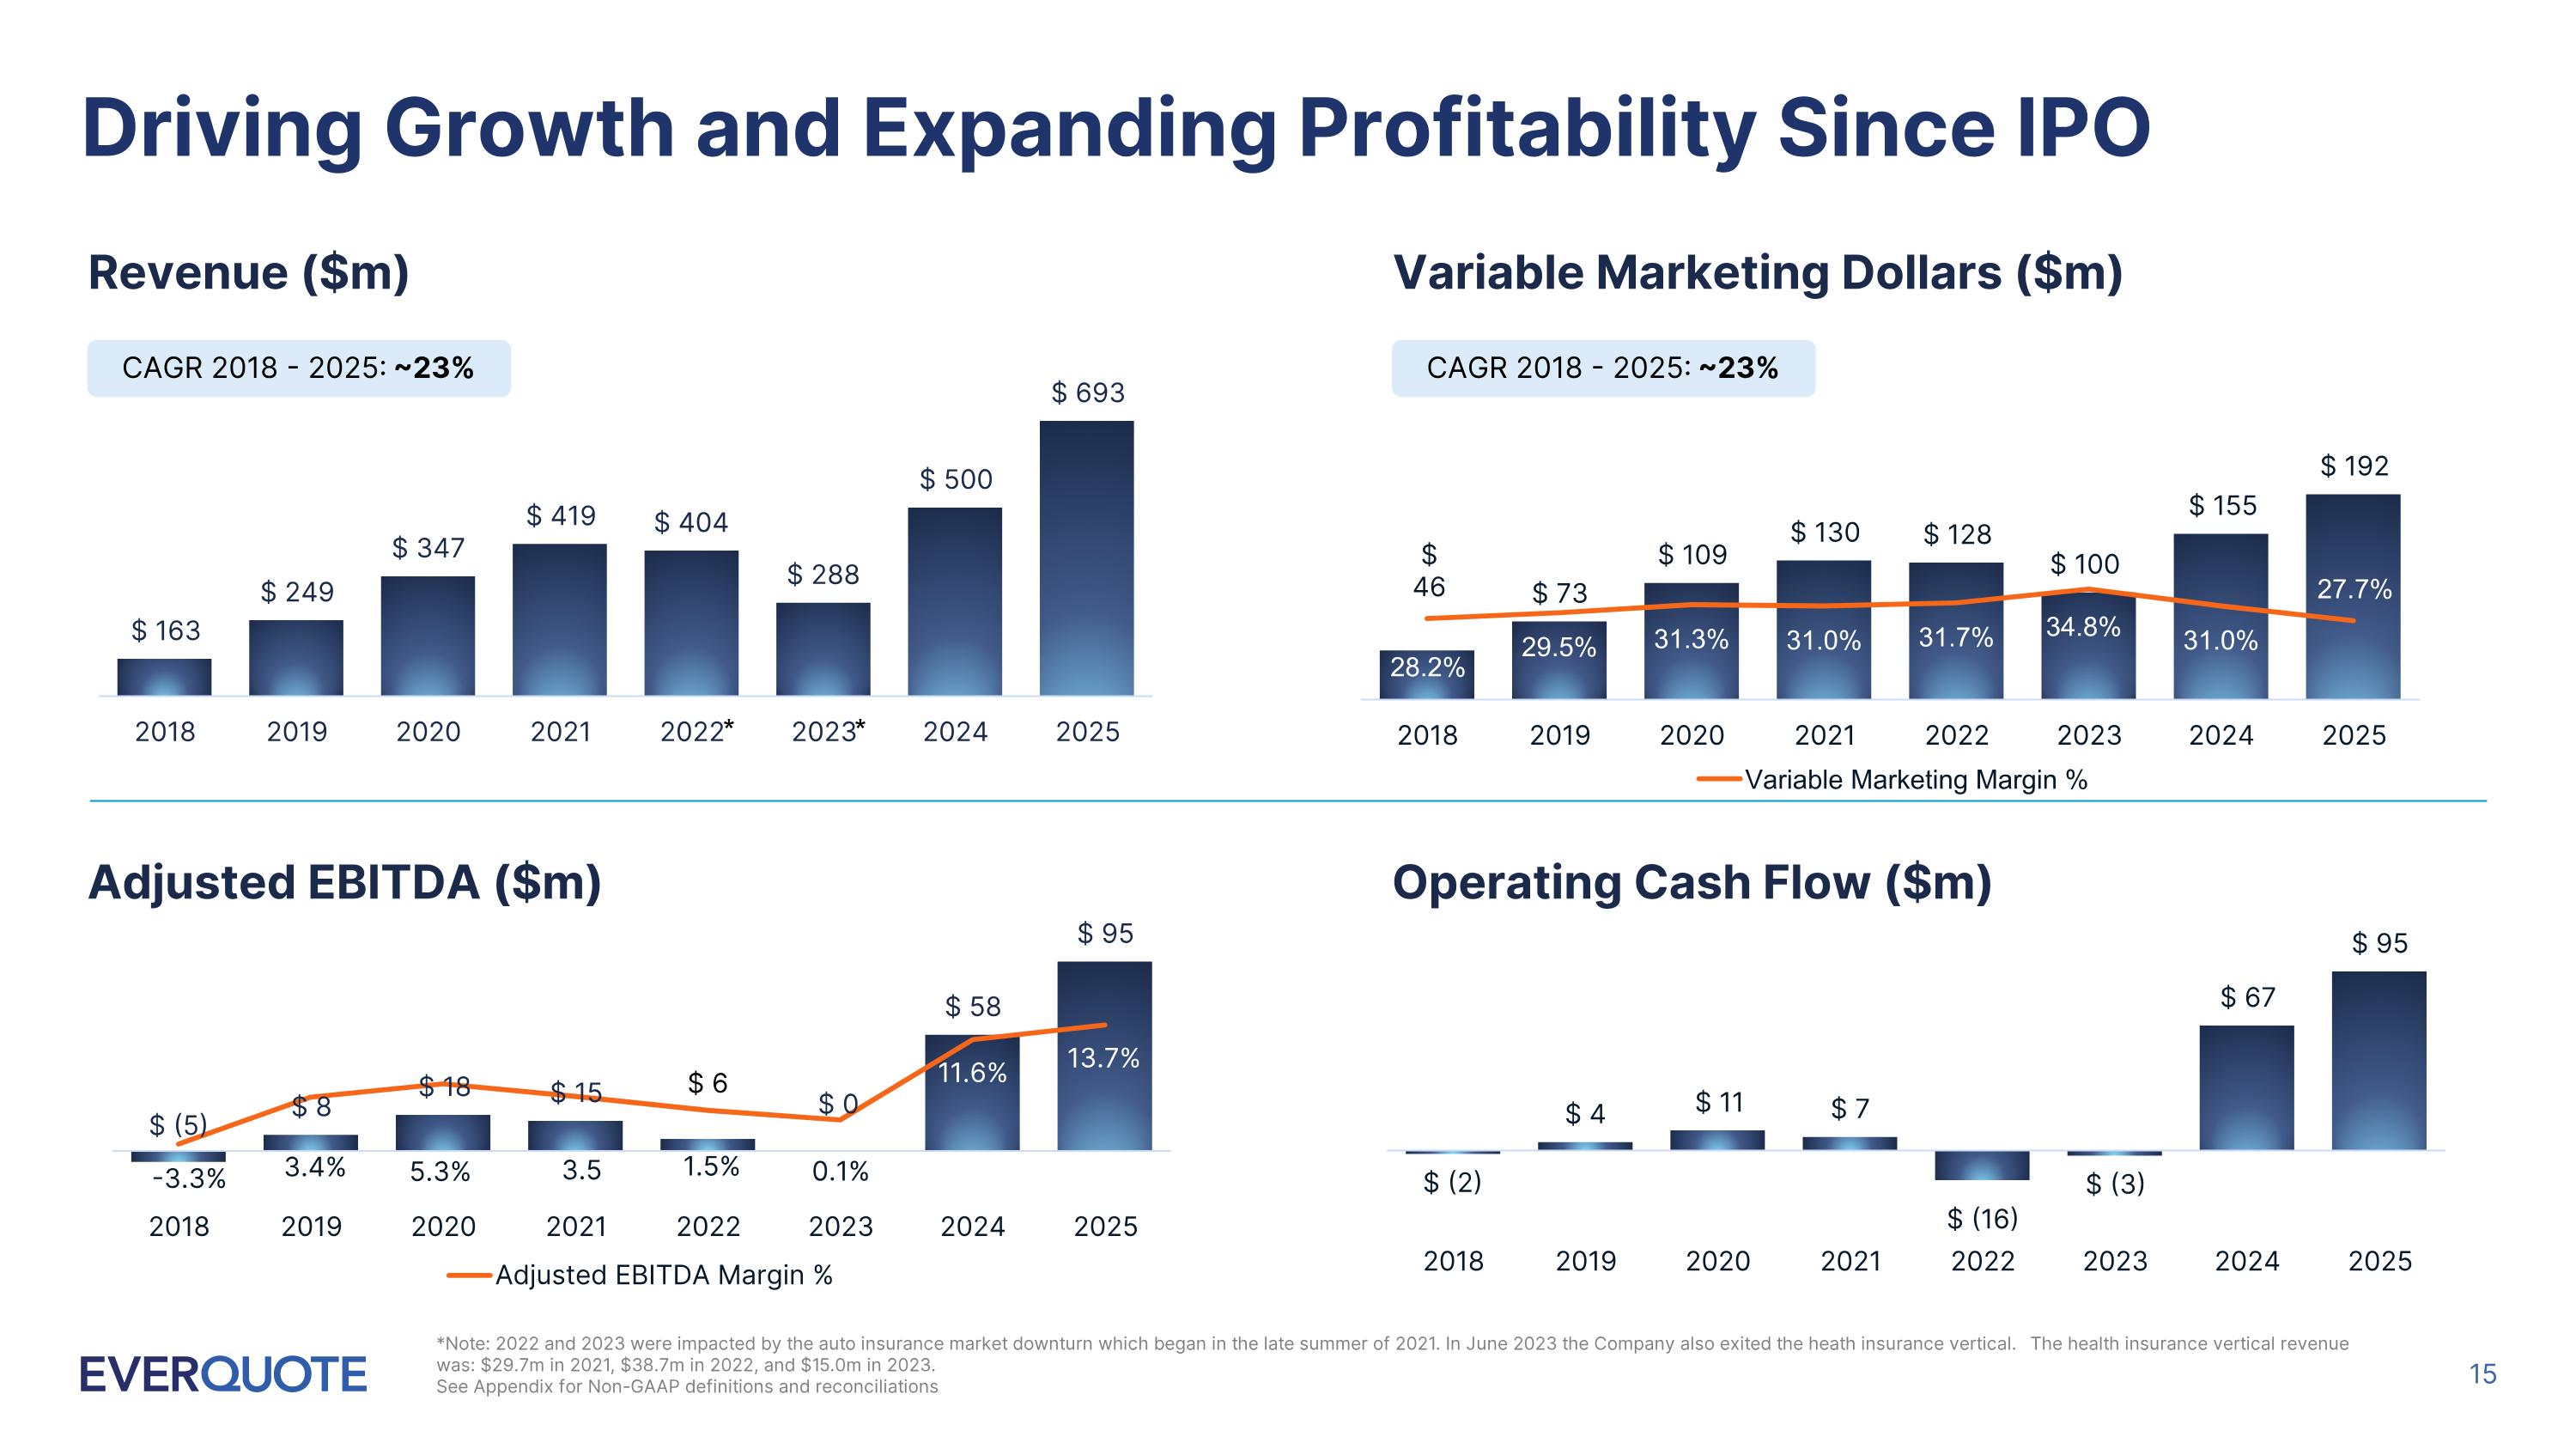
Driving Growth and Expanding Profitability Since IPO Revenue ($m) Variable Marketing Dollars ($m) Adjusted EBITDA ($m) Operating Cash Flow ($m) *Note: 2022 and 2023 were impacted by the auto insurance market downturn which began in the late summer of 2021. In June 2023 the Company also exited the heath insurance vertical. The health insurance vertical revenue was: $29.7m in 2021, $38.7m in 2022, and $15.0m in 2023. See Appendix for Non-GAAP definitions and reconciliations CAGR 2018 - 2025: ~23% CAGR 2018 - 2025: ~23% * *
NASDAQ: EVER investors.everquote.com

Appendix
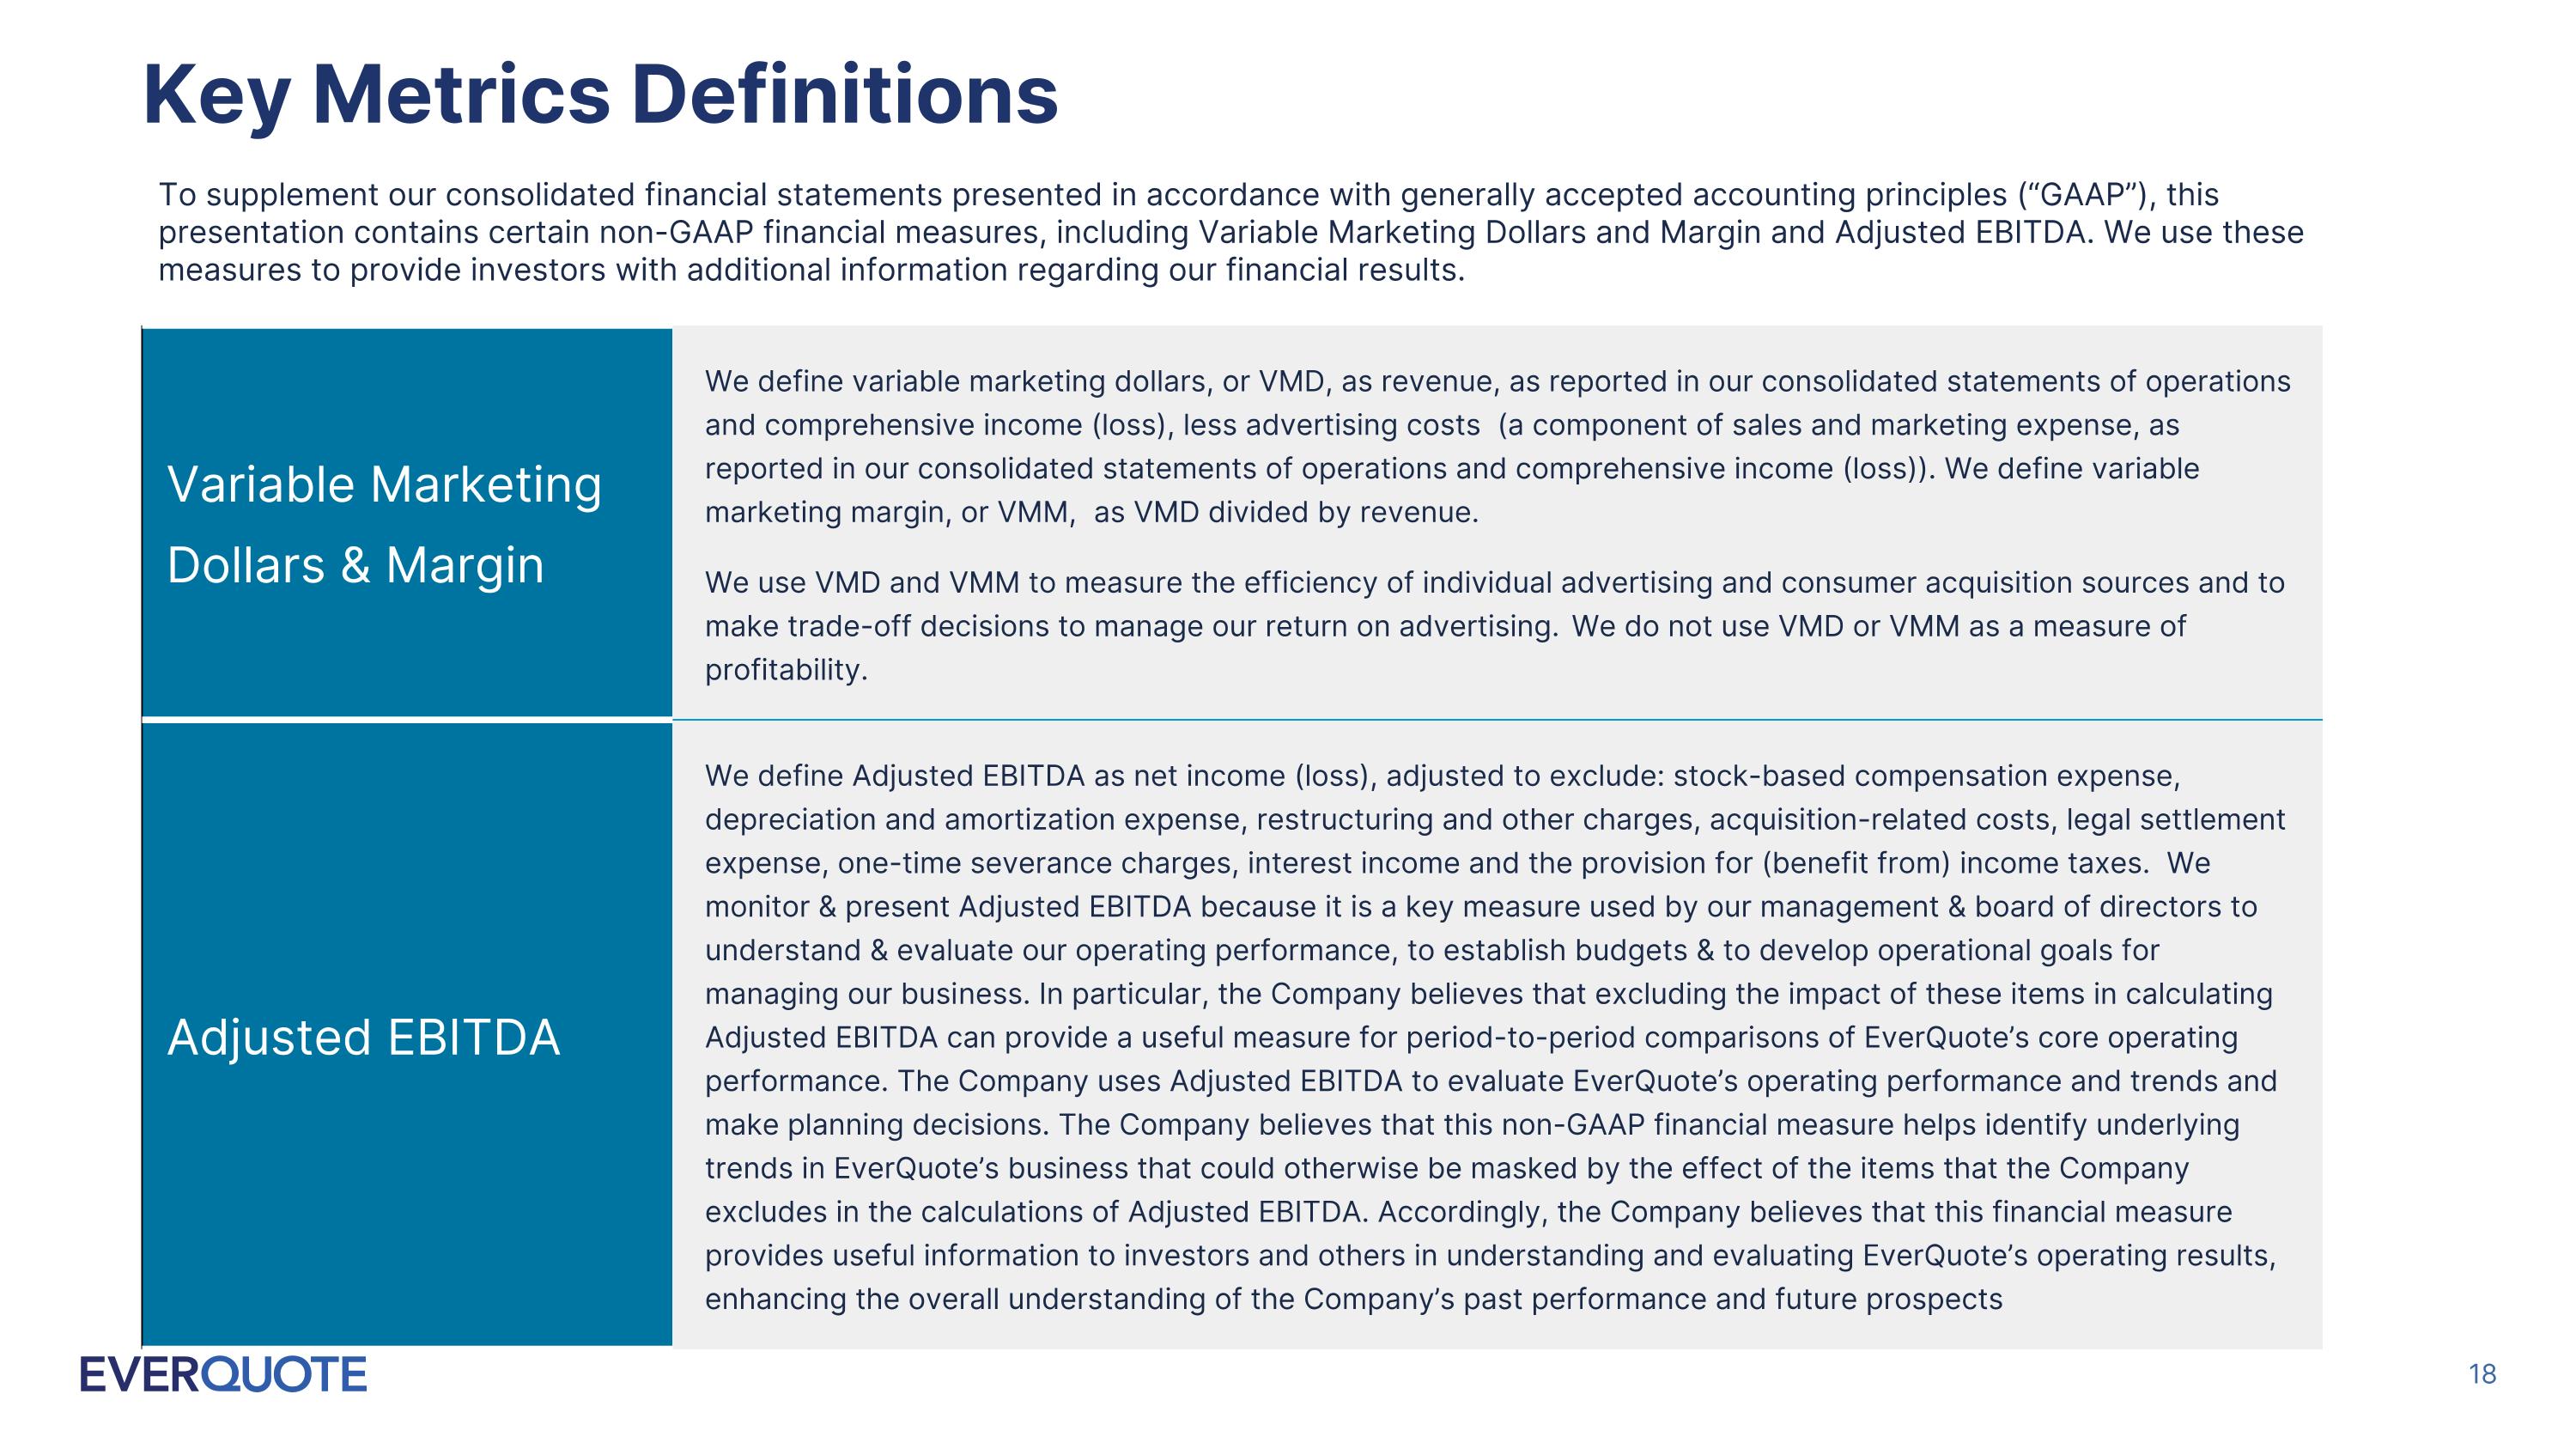
Key Metrics Definitions Variable Marketing Dollars & Margin We define variable marketing dollars, or VMD, as revenue, as reported in our consolidated statements of operations and comprehensive income (loss), less advertising costs (a component of sales and marketing expense, as reported in our consolidated statements of operations and comprehensive income (loss)). We define variable marketing margin, or VMM, as VMD divided by revenue. We use VMD and VMM to measure the efficiency of individual advertising and consumer acquisition sources and to make trade-off decisions to manage our return on advertising. We do not use VMD or VMM as a measure of profitability. Adjusted EBITDA We define Adjusted EBITDA as net income (loss), adjusted to exclude: stock-based compensation expense, depreciation and amortization expense, restructuring and other charges, acquisition-related costs, legal settlement expense, one-time severance charges, interest income and the provision for (benefit from) income taxes. We monitor & present Adjusted EBITDA because it is a key measure used by our management & board of directors to understand & evaluate our operating performance, to establish budgets & to develop operational goals for managing our business. In particular, the Company believes that excluding the impact of these items in calculating Adjusted EBITDA can provide a useful measure for period-to-period comparisons of EverQuote’s core operating performance. The Company uses Adjusted EBITDA to evaluate EverQuote’s operating performance and trends and make planning decisions. The Company believes that this non-GAAP financial measure helps identify underlying trends in EverQuote’s business that could otherwise be masked by the effect of the items that the Company excludes in the calculations of Adjusted EBITDA. Accordingly, the Company believes that this financial measure provides useful information to investors and others in understanding and evaluating EverQuote’s operating results, enhancing the overall understanding of the Company’s past performance and future prospects To supplement our consolidated financial statements presented in accordance with generally accepted accounting principles (“GAAP”), this presentation contains certain non-GAAP financial measures, including Variable Marketing Dollars and Margin and Adjusted EBITDA. We use these measures to provide investors with additional information regarding our financial results.
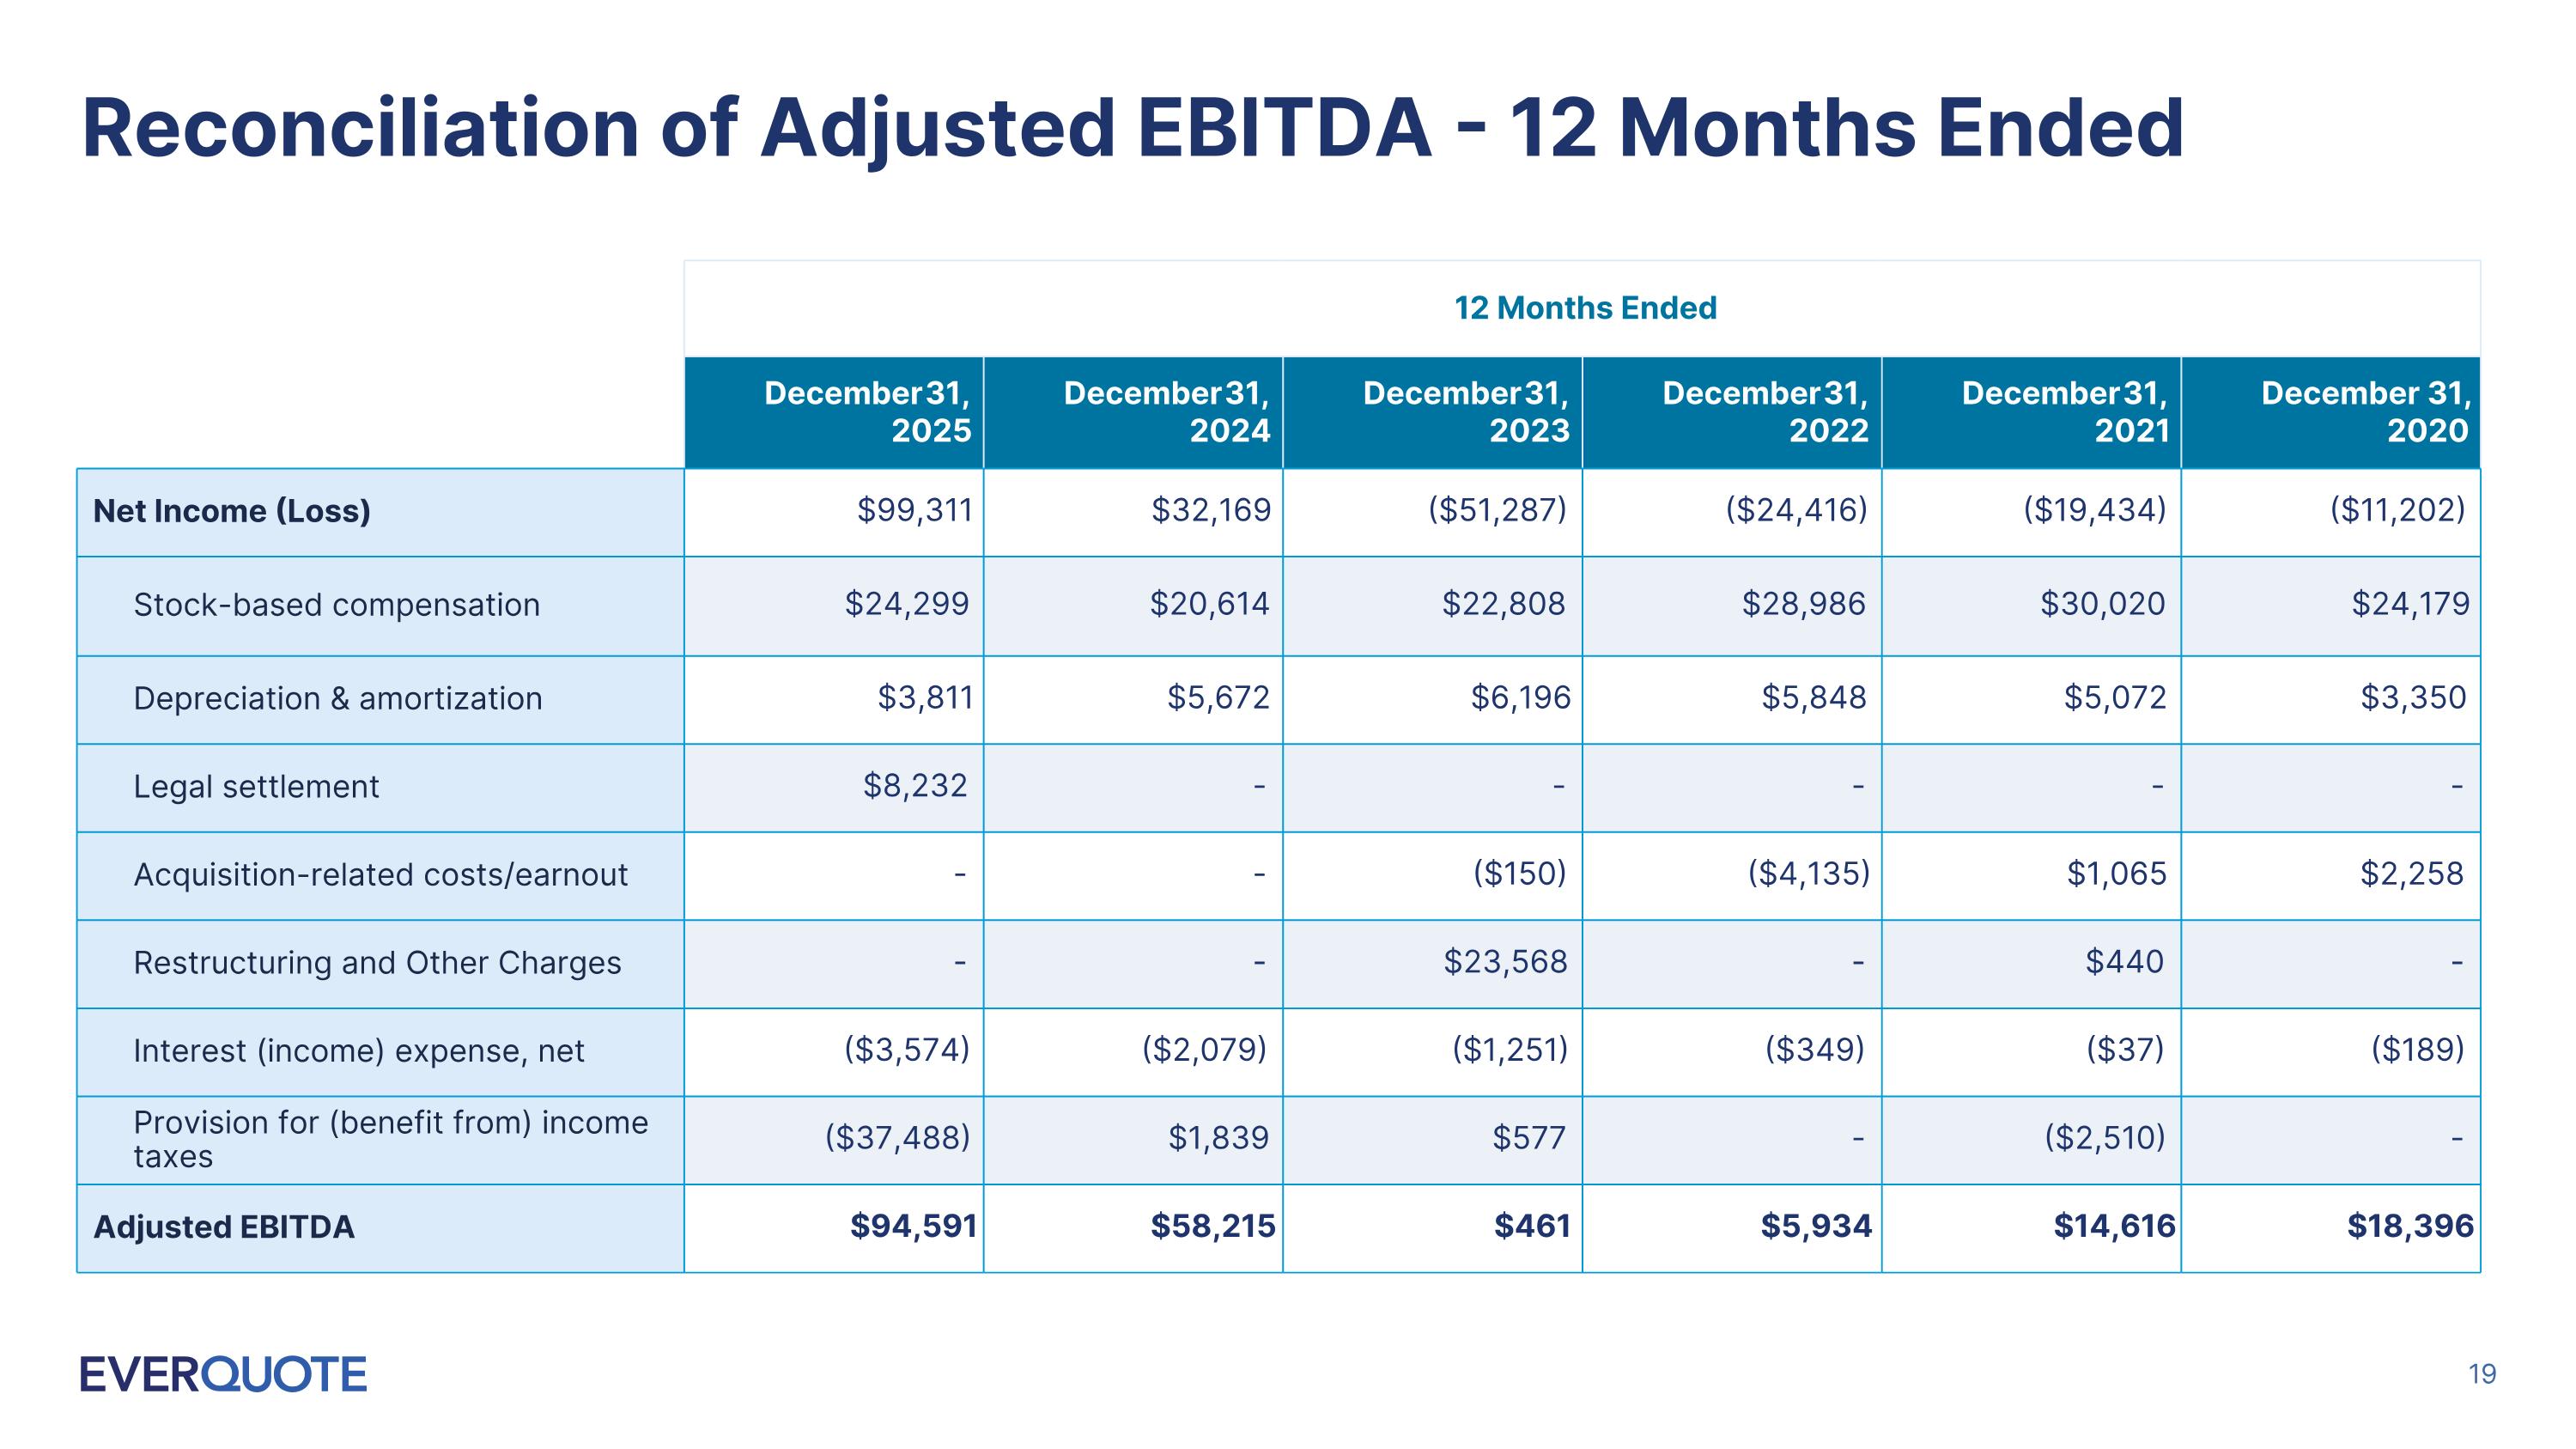
Reconciliation of Adjusted EBITDA - 12 Months Ended 12 Months Ended December 31, 2025 December 31, 2024 December 31, 2023 December 31, 2022 December 31, 2021 December 31, 2020 Net Income (Loss) $99,311 $32,169 ($51,287) ($24,416) ($19,434) ($11,202) Stock-based compensation $24,299 $20,614 $22,808 $28,986 $30,020 $24,179 Depreciation & amortization $3,811 $5,672 $6,196 $5,848 $5,072 $3,350 Legal settlement $8,232 - - - - - Acquisition-related costs/earnout - - ($150) ($4,135) $1,065 $2,258 Restructuring and Other Charges - - $23,568 - $440 - Interest (income) expense, net ($3,574) ($2,079) ($1,251) ($349) ($37) ($189) Provision for (benefit from) income taxes ($37,488) $1,839 $577 - ($2,510) - Adjusted EBITDA $94,591 $58,215 $461 $5,934 $14,616 $18,396
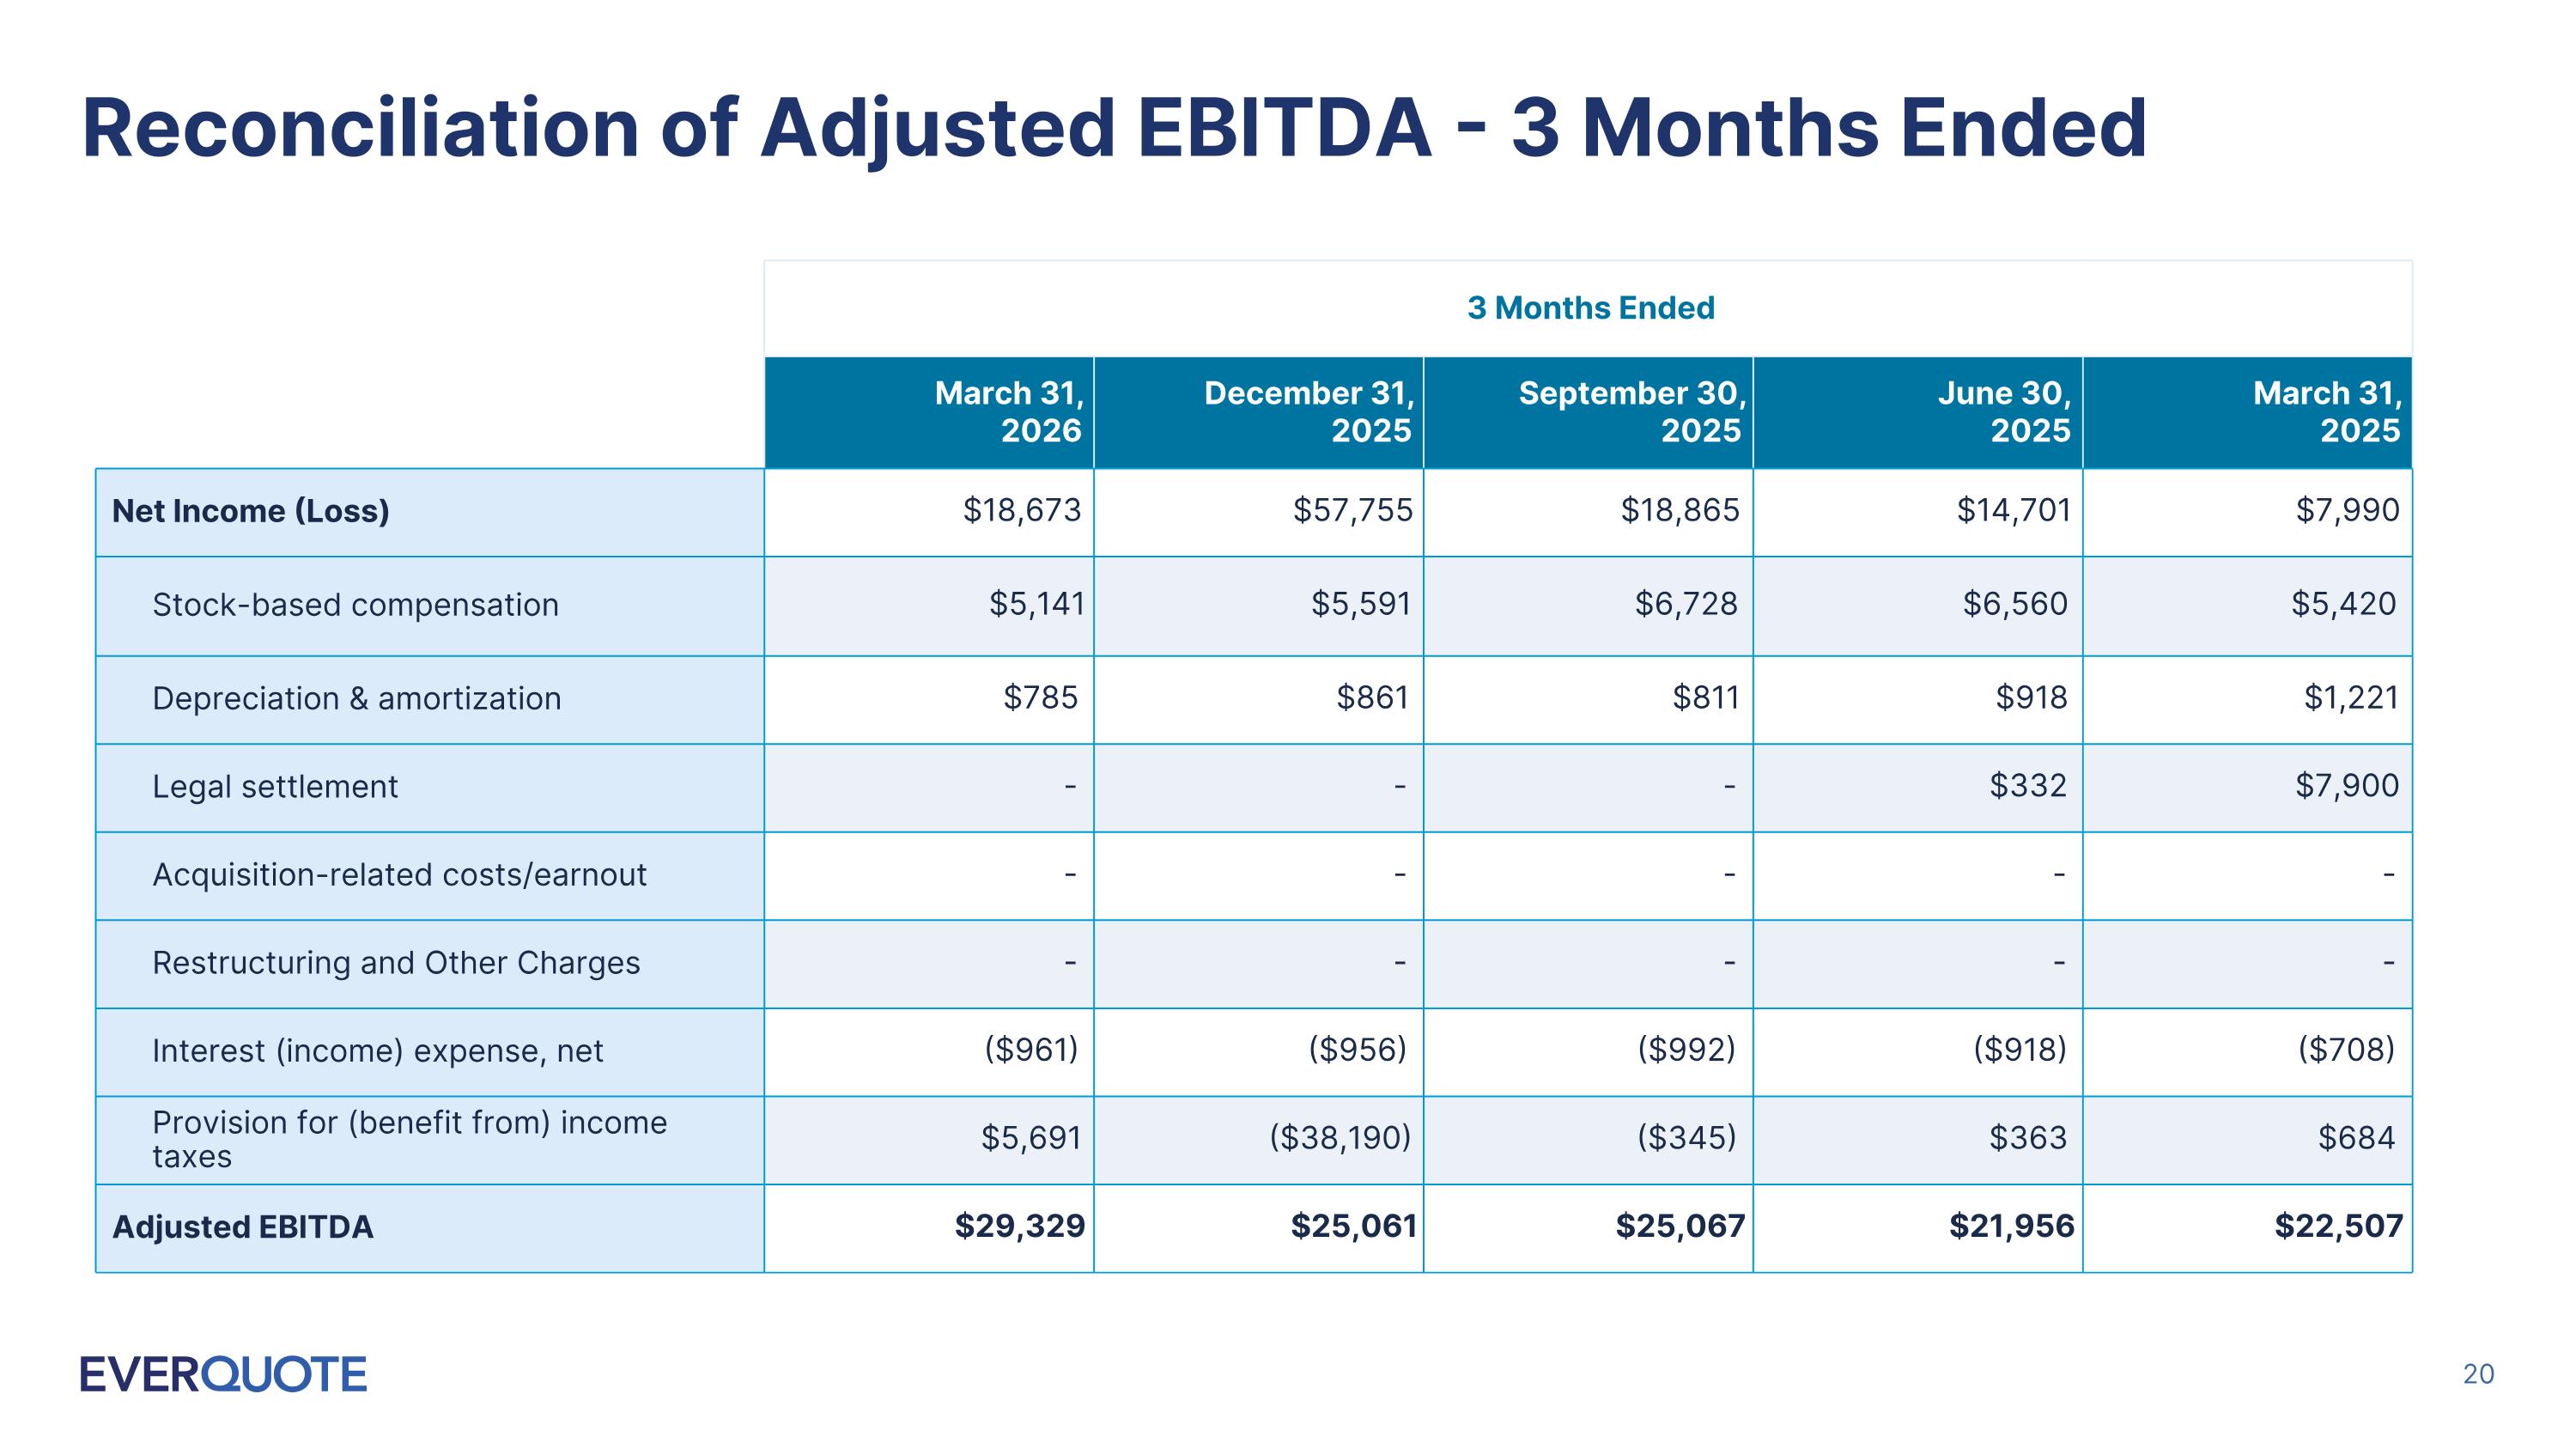
Reconciliation of Adjusted EBITDA - 3 Months Ended 3 Months Ended March 31, 2026 December 31, 2025 September 30, 2025 June 30, 2025 March 31, 2025 Net Income (Loss) $18,673 $57,755 $18,865 $14,701 $7,990 Stock-based compensation $5,141 $5,591 $6,728 $6,560 $5,420 Depreciation & amortization $785 $861 $811 $918 $1,221 Legal settlement - - - $332 $7,900 Acquisition-related costs/earnout - - - - - Restructuring and Other Charges - - - - - Interest (income) expense, net ($961) ($956) ($992) ($918) ($708) Provision for (benefit from) income taxes $5,691 ($38,190) ($345) $363 $684 Adjusted EBITDA $29,329 $25,061 $25,067 $21,956 $22,507