| 1 The RMR Group Investor Presentation April 2026 |
| 2 Overview of The RMR Group (Nasdaq: RMR) |
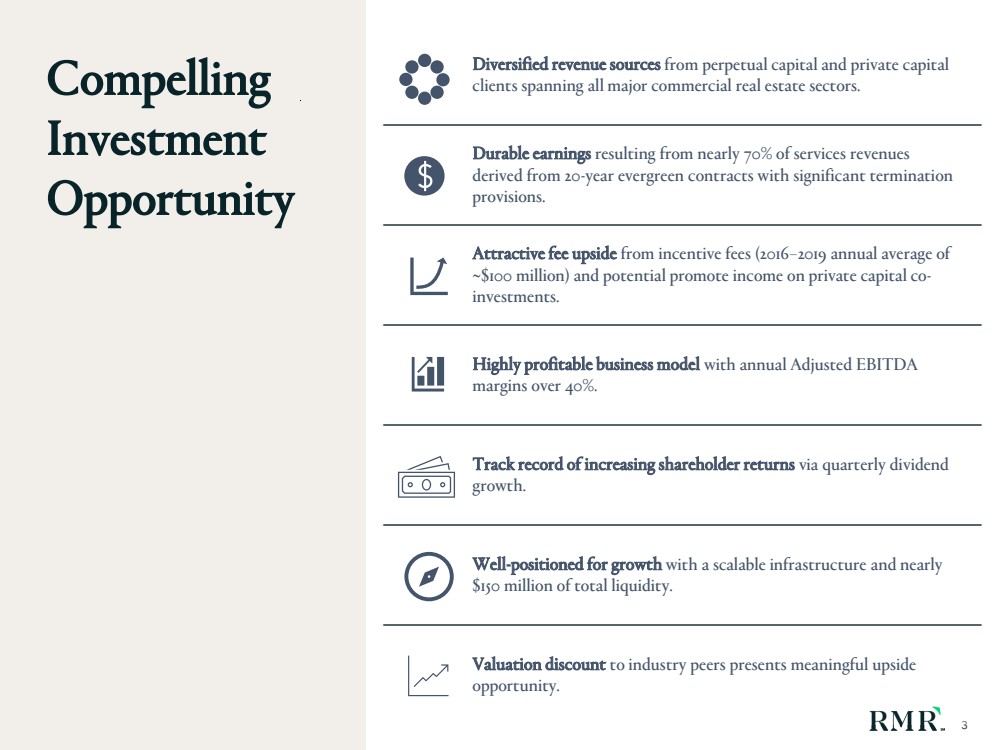
| 3 Diversified revenue sources from perpetual capital and private capital clients spanning all major commercial real estate sectors. Durable earnings resulting from nearly 70% of services revenues derived from 20-year evergreen contracts with significant termination provisions. Attractive fee upside from incentive fees (2016–2019 annual average of ~$100 million) and potential promote income on private capital co-investments. Highly profitable business model with annual Adjusted EBITDA margins over 40%. Track record of increasing shareholder returns via quarterly dividend growth. Well-positioned for growth with a scalable infrastructure and nearly $150 million of total liquidity. Valuation discount to industry peers presents meaningful upside opportunity. Compelling Investment Opportunity 3 |
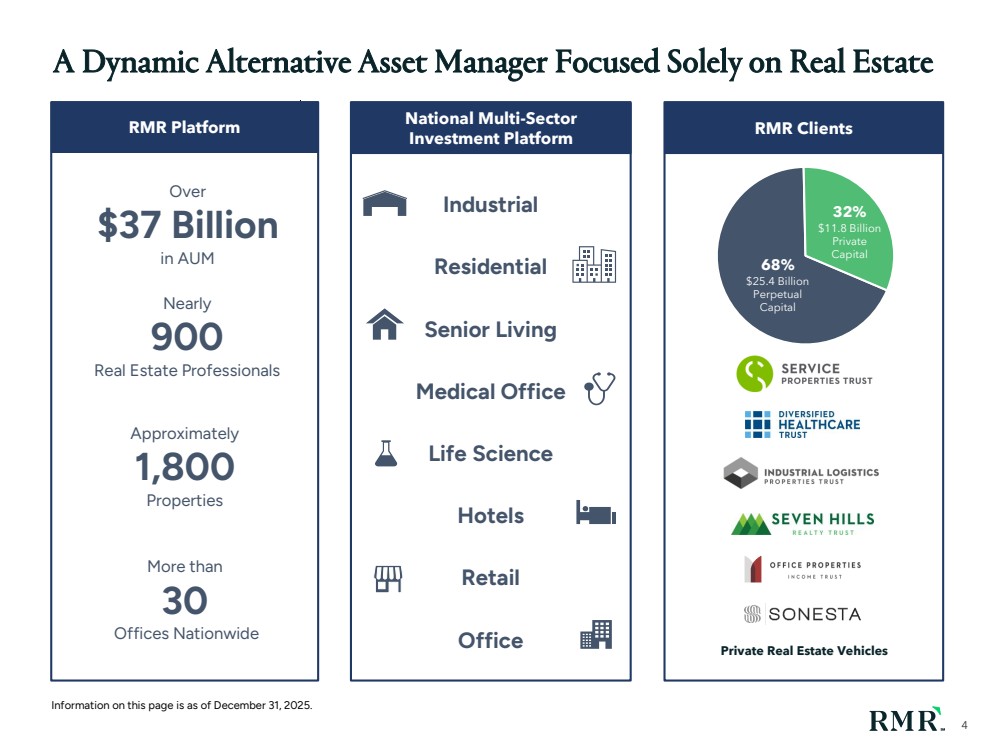
| 4 Industrial Residential Senior Living Medical Office Life Science Hotels Retail Office Over $37 Billion in AUM RMR Platform Nearly 900 Real Estate Professionals More than 30 Offices Nationwide Approximately 1,800 Properties National Multi-Sector Investment Platform RMR Clients Private Real Estate Vehicles 32% $11.8 Billion Private Capital 68% $25.4 Billion Perpetual Capital Information on this page is as of December 31, 2025. A Dynamic Alternative Asset Manager Focused Solely on Real Estate |
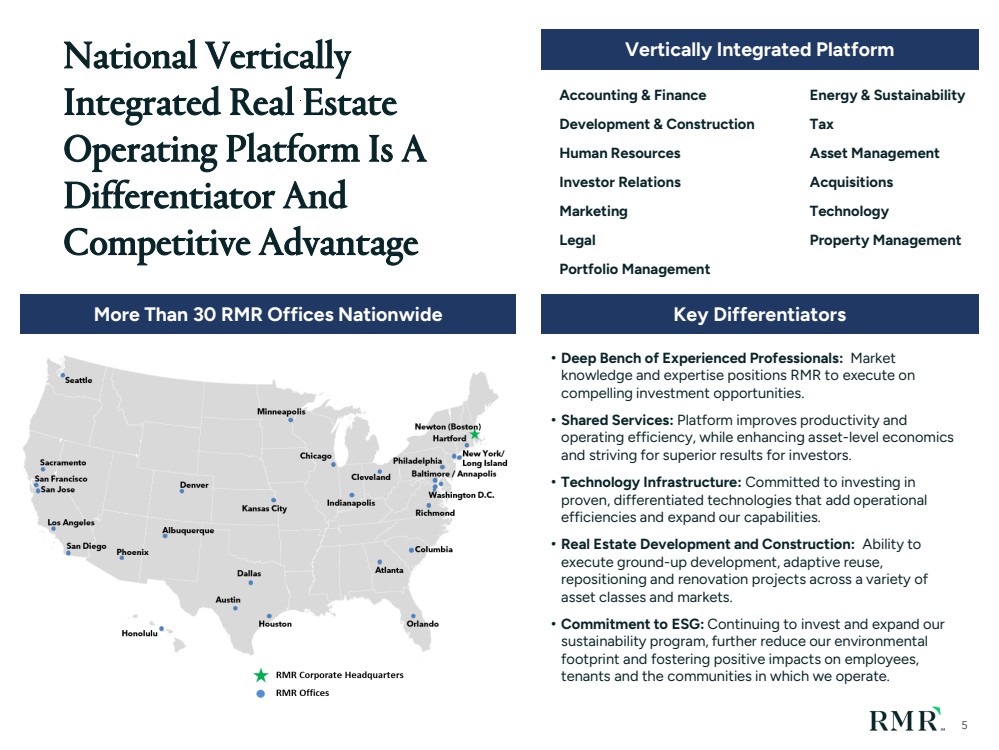
| 5 Key Differentiators • Deep Bench of Experienced Professionals: Market knowledge and expertise positions RMR to execute on compelling investment opportunities. • Shared Services: Platform improves productivity and operating efficiency, while enhancing asset-level economics and striving for superior results for investors. • Technology Infrastructure: Committed to investing in proven, differentiated technologies that add operational efficiencies and expand our capabilities. • Real Estate Development and Construction: Ability to execute ground-up development, adaptive reuse, repositioning and renovation projects across a variety of asset classes and markets. • Commitment to ESG: Continuing to invest and expand our sustainability program, further reduce our environmental footprint and fostering positive impacts on employees, tenants and the communities in which we operate. More Than 30 RMR Offices Nationwide National Vertically Integrated Real Estate Operating Platform Is A Differentiator And Competitive Advantage Vertically Integrated Platform Accounting & Finance Development & Construction Human Resources Investor Relations Marketing Legal Portfolio Management Energy & Sustainability Tax Asset Management Acquisitions Technology Property Management More Than 30 RMR Offices Nationwide Key Differentiators Vertically Integrated Platform |
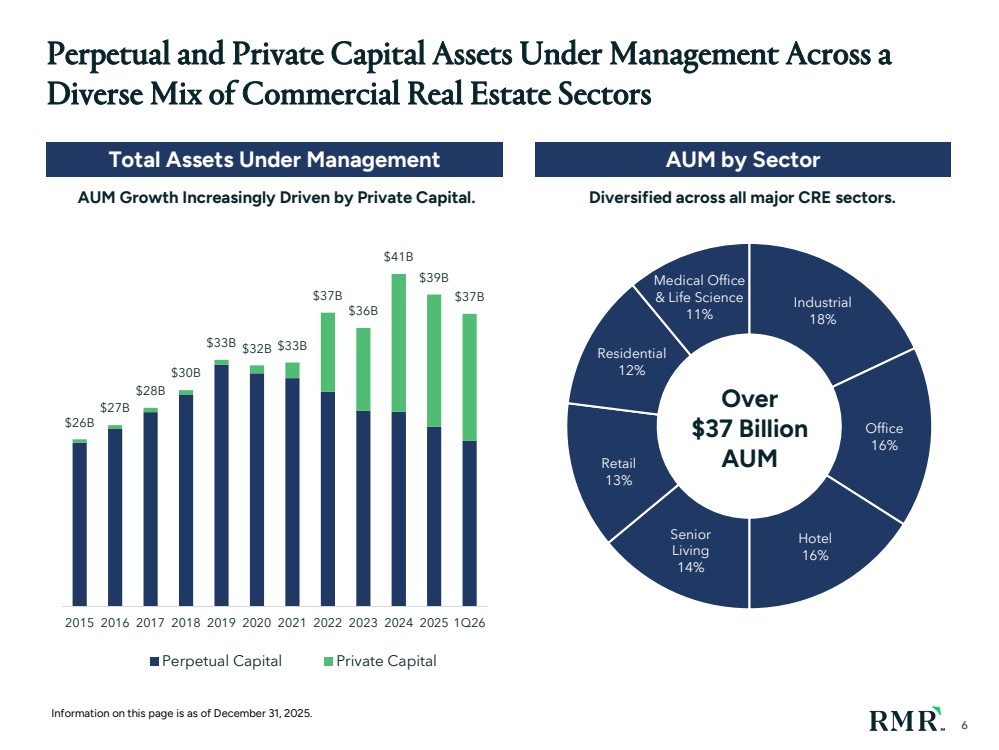
| 6 Industrial 18% Office 16% Hotel 16% Senior Living 14% Retail 13% Residential 12% Medical Office & Life Science 11% $26B $27B $28B $30B $33B $32B $33B $37B $36B $41B $39B $37B 2015 2016 2017 2018 2019 2020 2021 2022 2023 2024 2025 1Q26 Perpetual Capital Private Capital AUM by Sector Diversified across all major CRE sectors. Over $37 Billion AUM 6 Total Assets Under Management AUM Growth Increasingly Driven by Private Capital. Information on this page is as of December 31, 2025. Perpetual and Private Capital Assets Under Management Across a Diverse Mix of Commercial Real Estate Sectors |
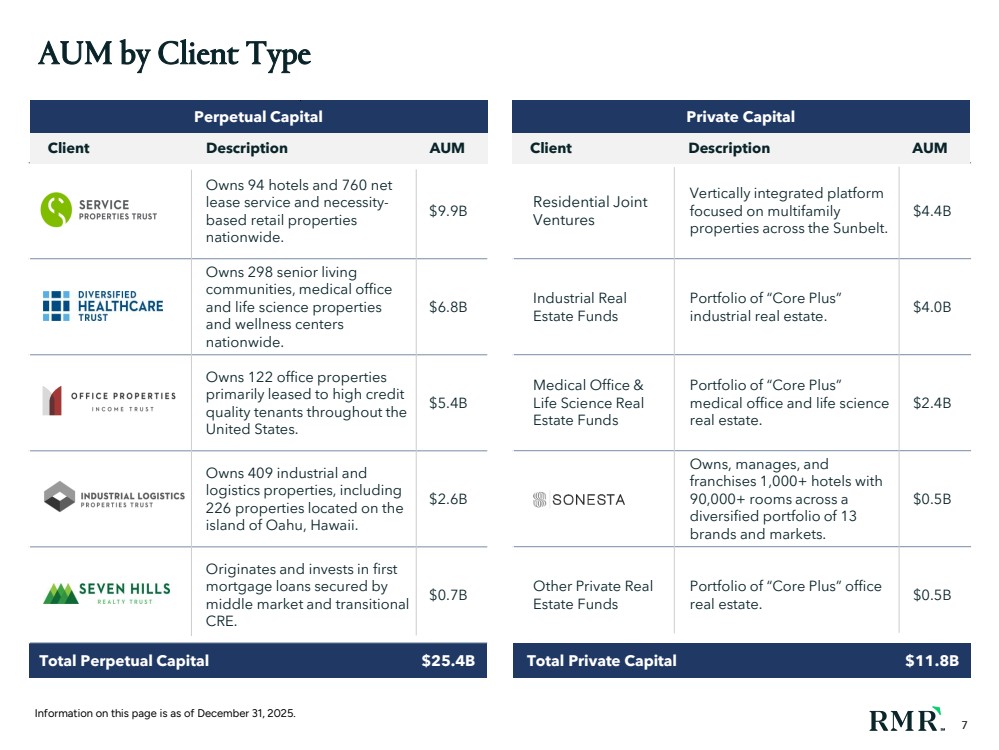
| 7 Residential Joint Ventures Vertically integrated platform focused on multifamily properties across the Sunbelt. $4.4B Industrial Real Estate Funds Portfolio of “Core Plus” industrial real estate. $4.0B Medical Office & Life Science Real Estate Funds Portfolio of “Core Plus” medical office and life science real estate. $2.4B Owns, manages, and franchises 1,000+ hotels with 90,000+ rooms across a diversified portfolio of 13 brands and markets. $0.5B Other Private Real Estate Funds Portfolio of “Core Plus” office real estate. $0.5B Total Private Capital $11.8B Client Description AUM 7 Private Capital Owns 94 hotels and 760 net lease service and necessity-based retail properties nationwide. $9.9B Owns 298 senior living communities, medical office and life science properties and wellness centers nationwide. $6.8B Owns 122 office properties primarily leased to high credit quality tenants throughout the United States. $5.4B Owns 409 industrial and logistics properties, including 226 properties located on the island of Oahu, Hawaii. $2.6B Originates and invests in first mortgage loans secured by middle market and transitional CRE. $0.7B Total Perpetual Capital $25.4B Client Description AUM Perpetual Capital AUM by Client Type Information on this page is as of December 31, 2025. |
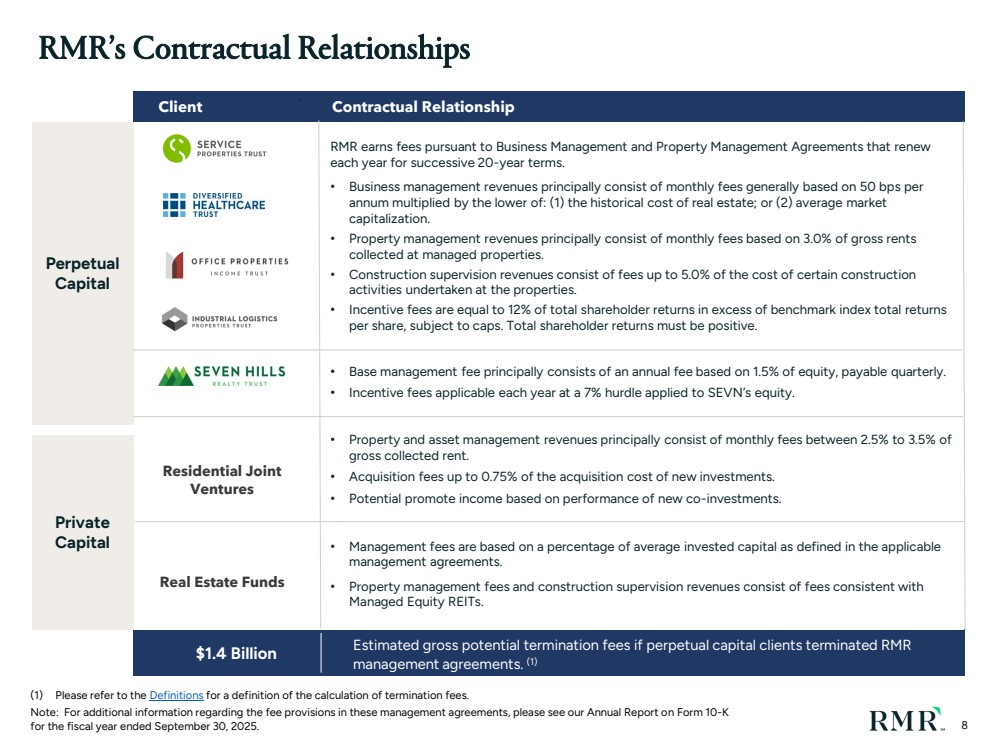
| 8 RMR earns fees pursuant to Business Management and Property Management Agreements that renew each year for successive 20-year terms. • Business management revenues principally consist of monthly fees generally based on 50 bps per annum multiplied by the lower of: (1) the historical cost of real estate; or (2) average market capitalization. • Property management revenues principally consist of monthly fees based on 3.0% of gross rents collected at managed properties. • Construction supervision revenues consist of fees up to 5.0% of the cost of certain construction activities undertaken at the properties. • Incentive fees are equal to 12% of total shareholder returns in excess of benchmark index total returns per share, subject to caps. Total shareholder returns must be positive. RMR’s Contractual Relationships (1) Please refer to the Definitions for a definition of the calculation of termination fees. Note: For additional information regarding the fee provisions in these management agreements, please see our Annual Report on Form 10-K for the fiscal year ended September 30, 2025. • Property and asset management revenues principally consist of monthly fees between 2.5% to 3.5% of gross collected rent. • Acquisition fees up to 0.75% of the acquisition cost of new investments. • Potential promote income based on performance of new co-investments. • Management fees are based on a percentage of average invested capital as defined in the applicable management agreements. • Property management fees and construction supervision revenues consist of fees consistent with Managed Equity REITs. Estimated gross potential termination fees if perpetual capital clients terminated RMR management agreements. (1) $1.4 Billion Client Contractual Relationship 8 Real Estate Funds • Base management fee principally consists of an annual fee based on 1.5% of equity, payable quarterly. • Incentive fees applicable each year at a 7% hurdle applied to SEVN’s equity. Perpetual Capital Private Capital Residential Joint Ventures |
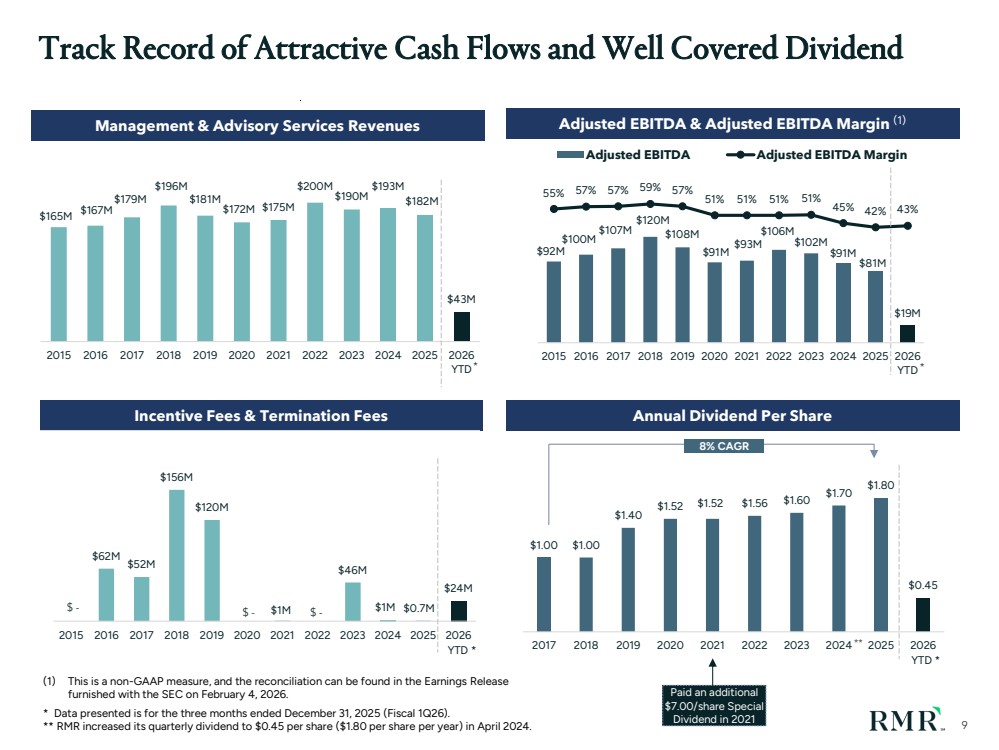
| 9 $92M $100M $107M $120M $108M $91M $93M $106M $102M $91M $81M $19M 55% 57% 57% 59% 57% 51% 51% 51% 51% 45% 42% 43% -40% -30% -20% -10% 0% 10% 20% 30% 40% 50% 60% $0 $20 $40 $60 $80 $100 $120 $140 $160 2015 2016 2017 2018 2019 2020 2021 2022 2023 2024 2025 2026 YTD Adjusted EBITDA Adjusted EBITDA Margin Track Record of Attractive Cash Flows and Well Covered Dividend Incentive Fees & Termination Fees Annual Dividend Per Share $62M $52M $156M $120M $1M $46M $1M $0.7M $24M 2015 2016 2017 2018 2019 2020 2021 2022 2023 2024 2025 2026 $ - $ - $ - $165M $167M $179M $196M $181M $172M $175M $200M $190M $193M $182M $43M 2015 2016 2017 2018 2019 2020 2021 2022 2023 2024 2025 2026 YTD Management & Advisory Services Revenues Adjusted EBITDA & Adjusted EBITDA Margin (1) (1) This is a non-GAAP measure, and the reconciliation can be found in the Earnings Release furnished with the SEC on February 4, 2026. * Data presented is for the three months ended December 31, 2025 (Fiscal 1Q26). ** RMR increased its quarterly dividend to $0.45 per share ($1.80 per share per year) in April 2024. * * YTD * $1.00 $1.00 $1.40 $1.52 $1.52 $1.56 $1.60 $1.70 $1.80 $0.45 2017 2018 2019 2020 2021 2022 2023 2024 ** 2025 2026 8% CAGR Paid an additional $7.00/share Special Dividend in 2021 YTD * |
| Positioned for Growth |

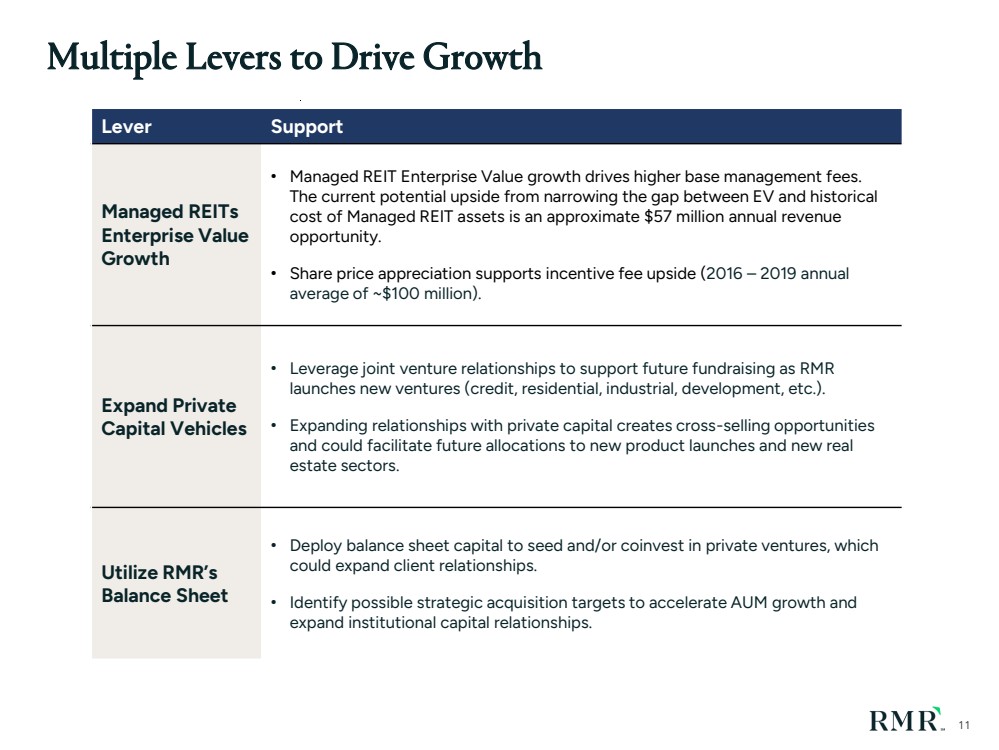
| 11 Multiple Levers to Drive Growth Lever Support Managed REITs Enterprise Value Growth • Managed REIT Enterprise Value growth drives higher base management fees. The current potential upside from narrowing the gap between EV and historical cost of Managed REIT assets is an approximate $57 million annual revenue opportunity. • Share price appreciation supports incentive fee upside (2016 – 2019 annual average of ~$100 million). Expand Private Capital Vehicles • Leverage joint venture relationships to support future fundraising as RMR launches new ventures (credit, residential, industrial, development, etc.). • Expanding relationships with private capital creates cross-selling opportunities and could facilitate future allocations to new product launches and new real estate sectors. Utilize RMR’s Balance Sheet • Deploy balance sheet capital to seed and/or coinvest in private ventures, which could expand client relationships. • Identify possible strategic acquisition targets to accelerate AUM growth and expand institutional capital relationships. |
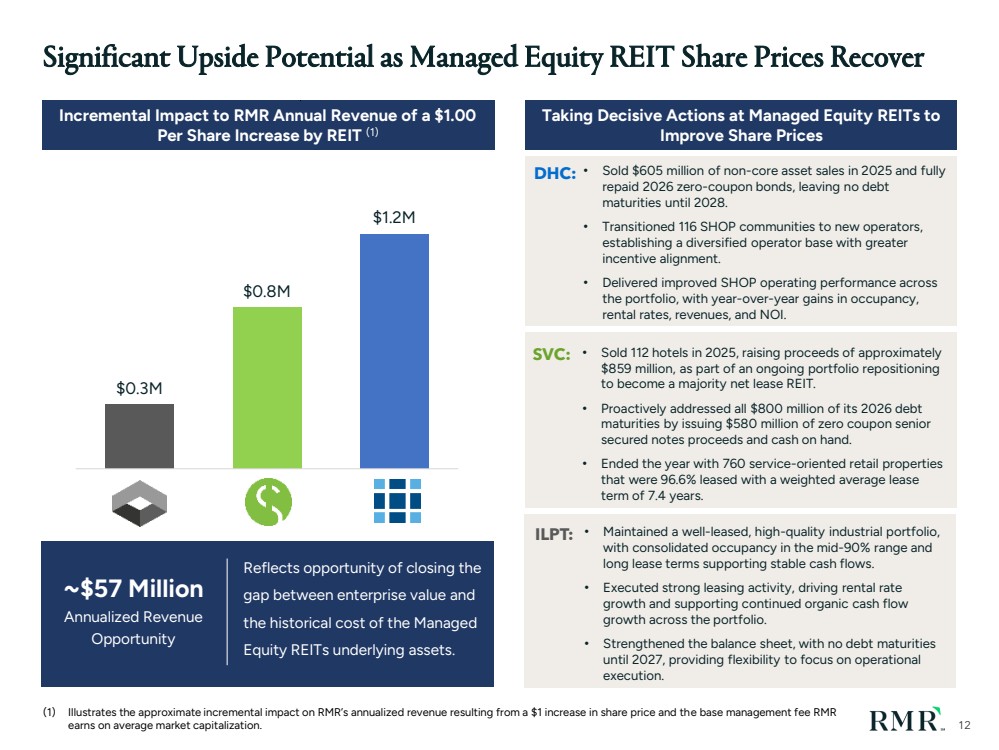
| 12 ILPT: • Maintained a well-leased, high-quality industrial portfolio, with consolidated occupancy in the mid-90% range and long lease terms supporting stable cash flows. • Executed strong leasing activity, driving rental rate growth and supporting continued organic cash flow growth across the portfolio. • Strengthened the balance sheet, with no debt maturities until 2027, providing flexibility to focus on operational execution. DHC: • Sold $605 million of non-core asset sales in 2025 and fully repaid 2026 zero-coupon bonds, leaving no debt maturities until 2028. • Transitioned 116 SHOP communities to new operators, establishing a diversified operator base with greater incentive alignment. • Delivered improved SHOP operating performance across the portfolio, with year-over-year gains in occupancy, rental rates, revenues, and NOI. SVC: • Sold 112 hotels in 2025, raising proceeds of approximately $859 million, as part of an ongoing portfolio repositioning to become a majority net lease REIT. • Proactively addressed all $800 million of its 2026 debt maturities by issuing $580 million of zero coupon senior secured notes proceeds and cash on hand. • Ended the year with 760 service-oriented retail properties that were 96.6% leased with a weighted average lease term of 7.4 years. Significant Upside Potential as Managed Equity REIT Share Prices Recover (1) Illustrates the approximate incremental impact on RMR’s annualized revenue resulting from a $1 increase in share price and the base management fee RMR earns on average market capitalization. $0.3M $0.8M $1.2M ILPT SVC DHC Reflects opportunity of closing the gap between enterprise value and the historical cost of the Managed Equity REITs underlying assets. ~$57 Million Annualized Revenue Opportunity Incremental Impact to RMR Annual Revenue of a $1.00 Per Share Increase by REIT (1) Taking Decisive Actions at Managed Equity REITs to Improve Share Prices |
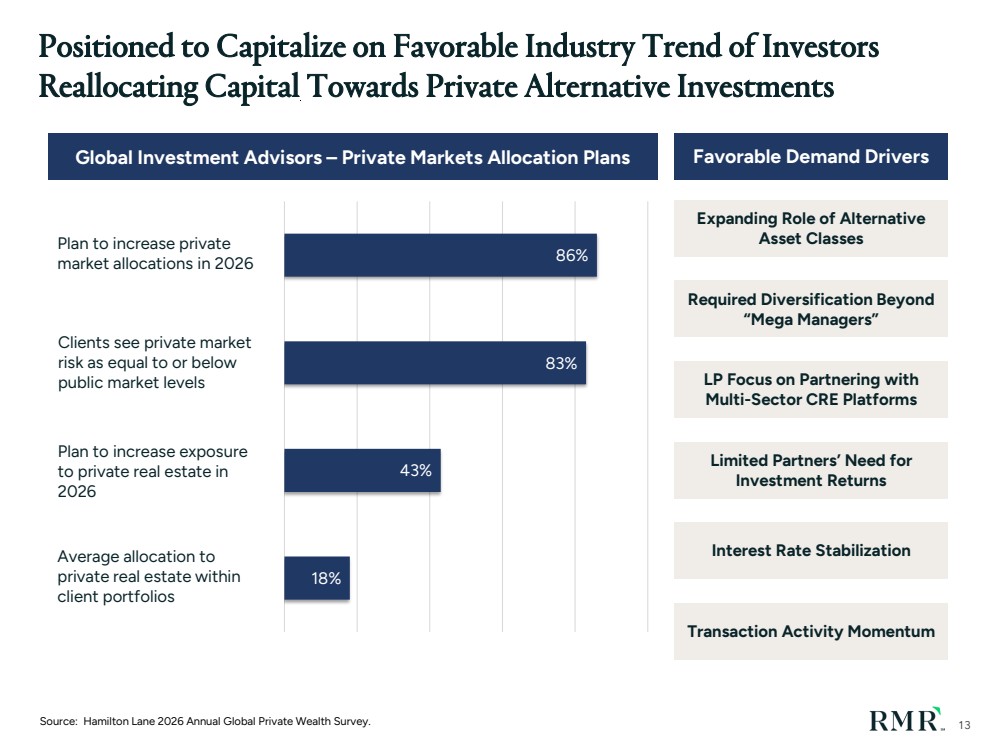
| 13 Positioned to Capitalize on Favorable Industry Trend of Investors Reallocating Capital Towards Private Alternative Investments Source: Hamilton Lane 2026 Annual Global Private Wealth Survey. Favorable Demand Drivers Expanding Role of Alternative Asset Classes Limited Partners’ Need for Investment Returns Interest Rate Stabilization Transaction Activity Momentum LP Focus on Partnering with Multi-Sector CRE Platforms Required Diversification Beyond “Mega Managers” 18% 43% 83% 86% Global Investment Advisors – Private Markets Allocation Plans Plan to increase private market allocations in 2026 Plan to increase exposure to private real estate in 2026 Clients see private market risk as equal to or below public market levels Average allocation to private real estate within client portfolios |
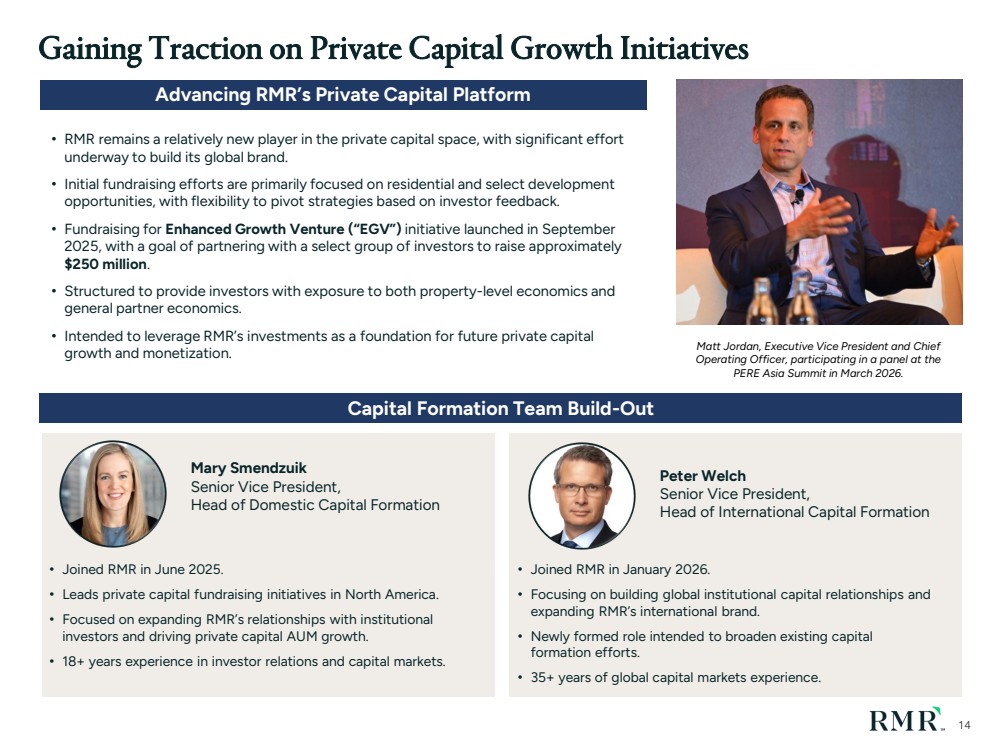
| 14 Gaining Traction on Private Capital Growth Initiatives Capital Formation Team Build-Out Mary Smendzuik Senior Vice President, Head of Domestic Capital Formation • Joined RMR in June 2025. • Leads private capital fundraising initiatives in North America. • Focused on expanding RMR’s relationships with institutional investors and driving private capital AUM growth. • 18+ years experience in investor relations and capital markets. Peter Welch Senior Vice President, Head of International Capital Formation • Joined RMR in January 2026. • Focusing on building global institutional capital relationships and expanding RMR’s international brand. • Newly formed role intended to broaden existing capital formation efforts. • 35+ years of global capital markets experience. • RMR remains a relatively new player in the private capital space, with significant effort underway to build its global brand. • Initial fundraising efforts are primarily focused on residential and select development opportunities, with flexibility to pivot strategies based on investor feedback. • Fundraising for Enhanced Growth Venture (“EGV”) initiative launched in September 2025, with a goal of partnering with a select group of investors to raise approximately $250 million. • Structured to provide investors with exposure to both property-level economics and general partner economics. • Intended to leverage RMR’s investments as a foundation for future private capital growth and monetization. Advancing RMR’s Private Capital Platform Matt Jordan, Executive Vice President and Chief Operating Officer, participating in a panel at the PERE Asia Summit in March 2026. |
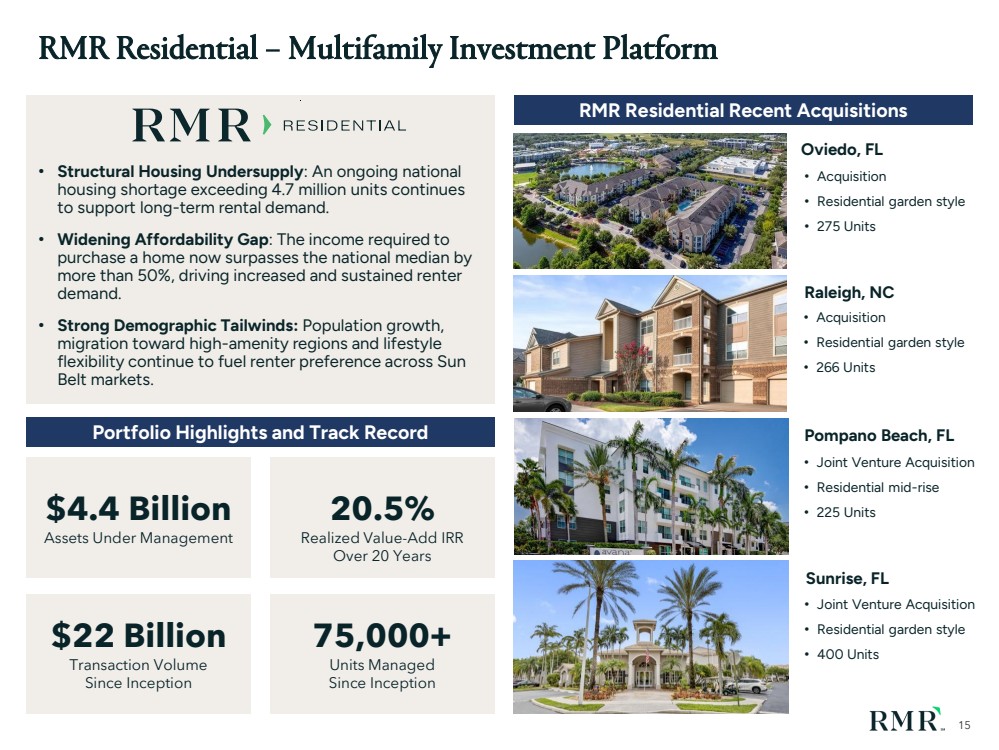
| 15 RMR Residential – Multifamily Investment Platform Raleigh, NC RMR Residential Recent Acquisitions Pompano Beach, FL • Acquisition • Residential garden style • 266 Units Oviedo, FL • Acquisition • Residential garden style • 275 Units • Joint Venture Acquisition • Residential mid-rise • 225 Units Sunrise, FL • Joint Venture Acquisition • Residential garden style • 400 Units $22 Billion Transaction Volume Since Inception 75,000+ Units Managed Since Inception $4.4 Billion Assets Under Management • Structural Housing Undersupply: An ongoing national housing shortage exceeding 4.7 million units continues to support long-term rental demand. • Widening Affordability Gap: The income required to purchase a home now surpasses the national median by more than 50%, driving increased and sustained renter demand. • Strong Demographic Tailwinds: Population growth, migration toward high-amenity regions and lifestyle flexibility continue to fuel renter preference across Sun Belt markets. 20.5% Realized Value-Add IRR Over 20 Years Portfolio Highlights and Track Record |
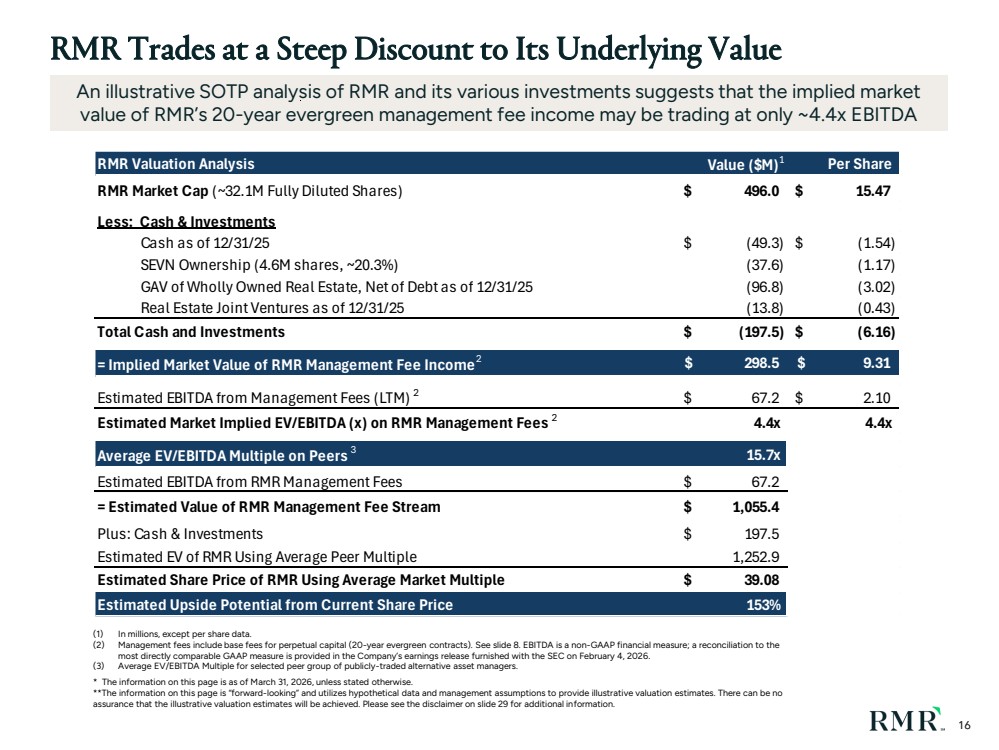
| 16 RMR Trades at a Steep Discount to Its Underlying Value (1) In millions, except per share data. (2) Management fees include base fees for perpetual capital (20-year evergreen contracts). See slide 8. EBITDA is a non-GAAP financial measure; a reconciliation to the most directly comparable GAAP measure is provided in the Company’s earnings release furnished with the SEC on February 4, 2026. (3) Average EV/EBITDA Multiple for selected peer group of publicly-traded alternative asset managers. * The information on this page is as of March 31, 2026, unless stated otherwise. **The information on this page is “forward-looking” and utilizes hypothetical data and management assumptions to provide illustrative valuation estimates. There can be no assurance that the illustrative valuation estimates will be achieved. Please see the disclaimer on slide 29 for additional information. An illustrative SOTP analysis of RMR and its various investments suggests that the implied market value of RMR’s 20-year evergreen management fee income may be trading at only ~4.4x EBITDA RMR Valuation Analysis Value ($M)1 Per Share RMR Market Cap (~32.1M Fully Diluted Shares) $ 496.0 $ 15.47 Less: Cash & Investments Cash as of 12/31/25 $ (49.3) $ (1.54) SEVN Ownership (4.6M shares, ~20.3%) (37.6) (1.17) GAV of Wholly Owned Real Estate, Net of Debt as of 12/31/25 (96.8) (3.02) Real Estate Joint Ventures as of 12/31/25 (13.8) (0.43) Total Cash and Investments $ (197.5) $ (6.16) = Implied Market Value of RMR Management Fee Income2 $ 298.5 $ 9.31 Estimated EBITDA from Management Fees (LTM) 2 $ 67.2 $ 2.10 Estimated Market Implied EV/EBITDA (x) on RMR Management Fees 2 4.4x 4.4x Average EV/EBITDA Multiple on Peers 3 15.7x Estimated EBITDA from RMR Management Fees $ 67.2 = Estimated Value of RMR Management Fee Stream $ 1,055.4 Plus: Cash & Investments $ 197.5 Estimated EV of RMR Using Average Peer Multiple 1,252.9 Estimated Share Price of RMR Using Average Market Multiple $ 39.08 Estimated Upside Potential from Current Share Price 153% |
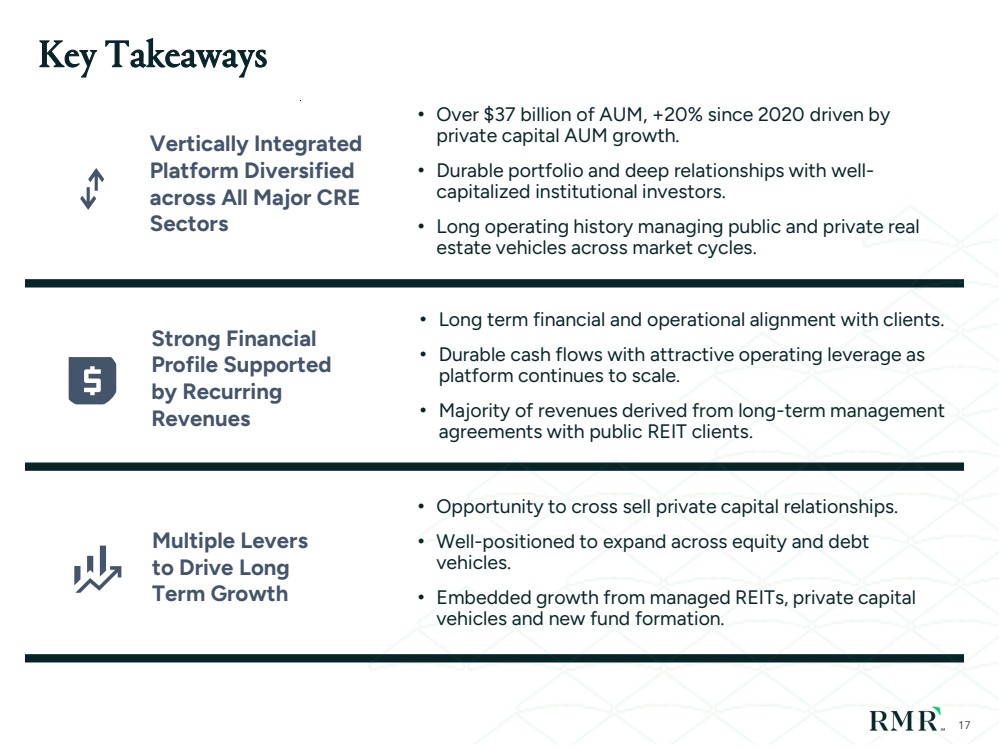
| 17 Key Takeaways Vertically Integrated Platform Diversified across All Major CRE Sectors • Over $37 billion of AUM, +20% since 2020 driven by private capital AUM growth. • Durable portfolio and deep relationships with well-capitalized institutional investors. • Long operating history managing public and private real estate vehicles across market cycles. Strong Financial Profile Supported by Recurring Revenues • Long term financial and operational alignment with clients. • Durable cash flows with attractive operating leverage as platform continues to scale. • Majority of revenues derived from long-term management agreements with public REIT clients. • Opportunity to cross sell private capital relationships. • Well-positioned to expand across equity and debt vehicles. • Embedded growth from managed REITs, private capital vehicles and new fund formation. Multiple Levers to Drive Long Term Growth |
| Appendix |

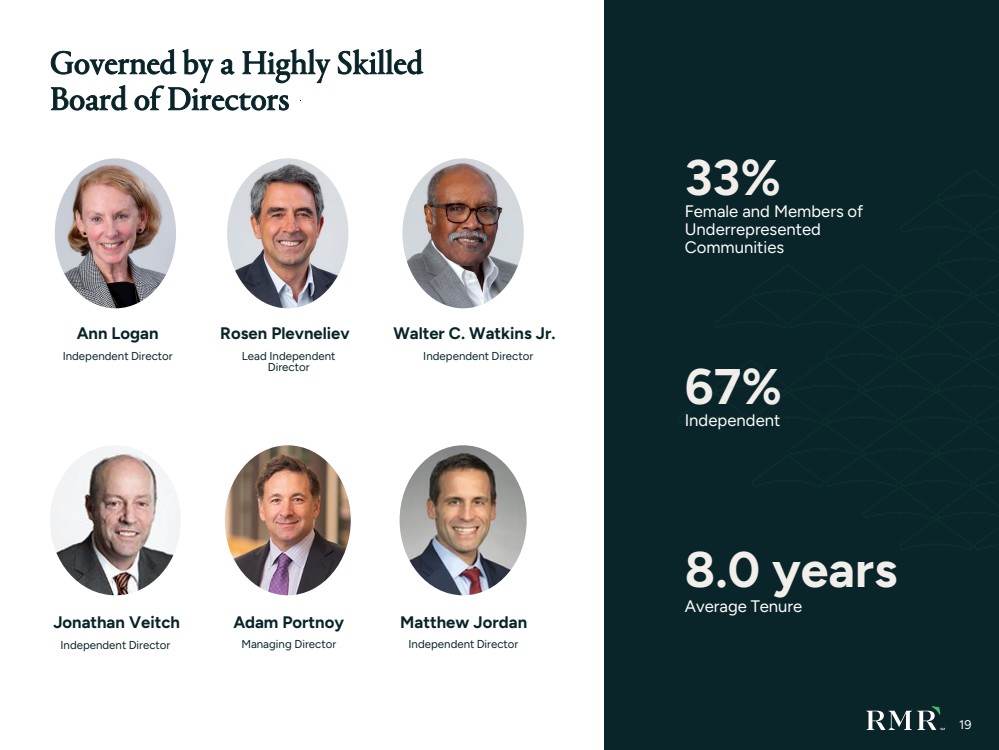
| Ann Logan Independent Director Rosen Plevneliev Lead Independent Director Walter C. Watkins Jr. Independent Director 33% Female and Members of Underrepresented Communities 67% Independent 8.0 years Average Tenure Governed by a Highly Skilled Board of Directors Jonathan Veitch Independent Director Adam Portnoy Managing Director Matthew Jordan Independent Director 19 |
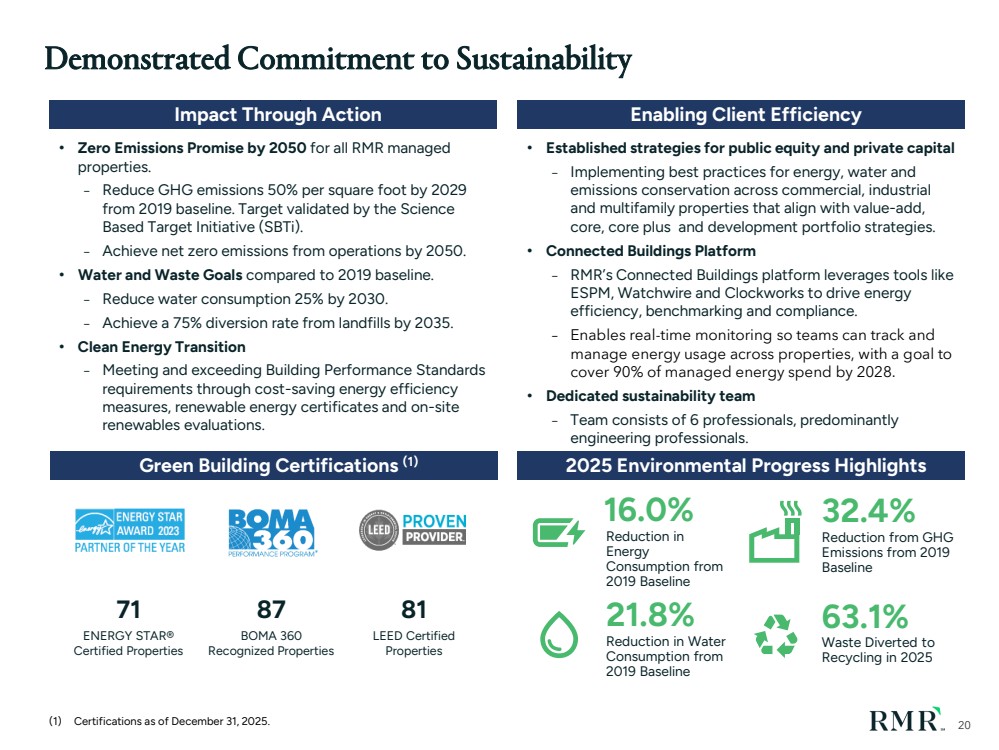
| 20 Demonstrated Commitment to Sustainability (1) Certifications as of December 31, 2025. • Established strategies for public equity and private capital – Implementing best practices for energy, water and emissions conservation across commercial, industrial and multifamily properties that align with value-add, core, core plus and development portfolio strategies. • Connected Buildings Platform – RMR’s Connected Buildings platform leverages tools like ESPM, Watchwire and Clockworks to drive energy efficiency, benchmarking and compliance. – Enables real-time monitoring so teams can track and manage energy usage across properties, with a goal to cover 90% of managed energy spend by 2028. • Dedicated sustainability team – Team consists of 6 professionals, predominantly engineering professionals. 71 ENERGY STAR® Certified Properties 87 BOMA 360 Recognized Properties 81 LEED Certified Properties Impact Through Action Enabling Client Efficiency Green Building Certifications (1) 2025 Environmental Progress Highlights • Zero Emissions Promise by 2050 for all RMR managed properties. – Reduce GHG emissions 50% per square foot by 2029 from 2019 baseline. Target validated by the Science Based Target Initiative (SBTi). – Achieve net zero emissions from operations by 2050. • Water and Waste Goals compared to 2019 baseline. – Reduce water consumption 25% by 2030. – Achieve a 75% diversion rate from landfills by 2035. • Clean Energy Transition – Meeting and exceeding Building Performance Standards requirements through cost-saving energy efficiency measures, renewable energy certificates and on-site renewables evaluations. 16.0% Reduction in Energy Consumption from 2019 Baseline 21.8% Reduction in Water Consumption from 2019 Baseline 32.4% Reduction from GHG Emissions from 2019 Baseline 63.1% Waste Diverted to Recycling in 2025 |
| 21 Annual Sustainability Report 2025 Annual Sustainability Report To access sustainability reports, visit RMR’s website at www.rmrgroup.com/corporate-sustainability |
| Financials |

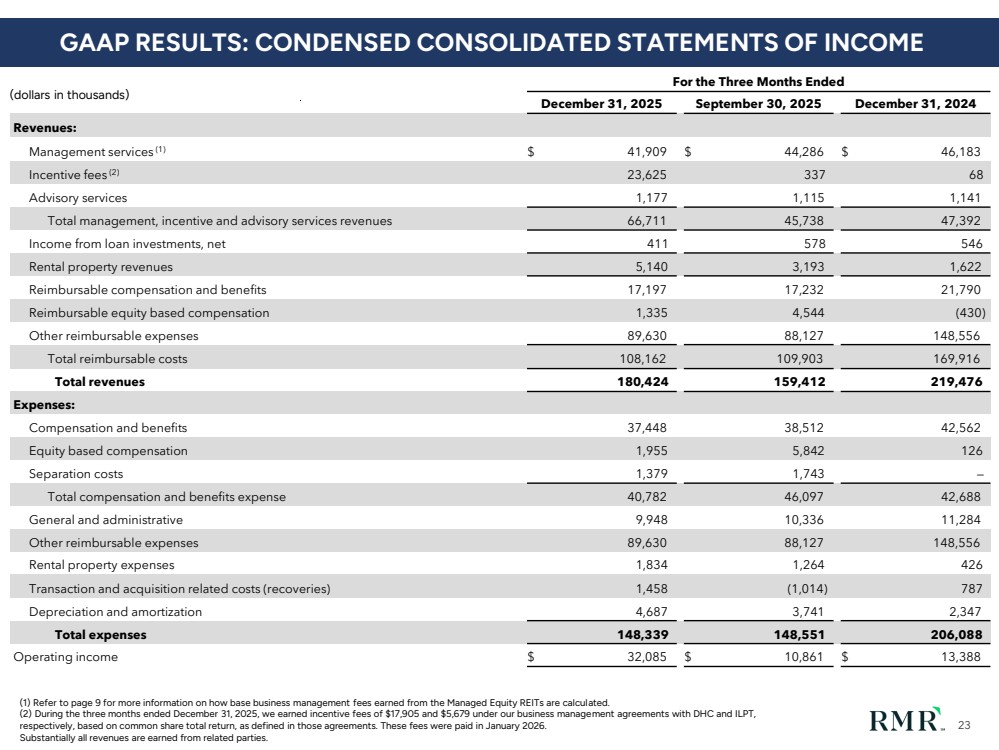
| 23 For the Three Months Ended December 31, 2025 September 30, 2025 December 31, 2024 Revenues: Management services (1) $ 41,909 $ 44,286 $ 46,183 Incentive fees (2) 23,625 337 68 Advisory services 1,177 1,115 1,141 Total management, incentive and advisory services revenues 66,711 45,738 47,392 Income from loan investments, net 411 578 546 Rental property revenues 5,140 3,193 1,622 Reimbursable compensation and benefits 17,197 17,232 21,790 Reimbursable equity based compensation 1,335 4,544 (430) Other reimbursable expenses 89,630 88,127 148,556 Total reimbursable costs 108,162 109,903 169,916 Total revenues 180,424 159,412 219,476 Expenses: Compensation and benefits 37,448 38,512 42,562 Equity based compensation 1,955 5,842 126 Separation costs 1,379 1,743 — Total compensation and benefits expense 40,782 46,097 42,688 General and administrative 9,948 10,336 11,284 Other reimbursable expenses 89,630 88,127 148,556 Rental property expenses 1,834 1,264 426 Transaction and acquisition related costs (recoveries) 1,458 (1,014) 787 Depreciation and amortization 4,687 3,741 2,347 Total expenses 148,339 148,551 206,088 Operating income $ 32,085 $ 10,861 $ 13,388 (dollars in thousands) (1) Refer to page 9 for more information on how base business management fees earned from the Managed Equity REITs are calculated. (2) During the three months ended December 31, 2025, we earned incentive fees of $17,905 and $5,679 under our business management agreements with DHC and ILPT, respectively, based on common share total return, as defined in those agreements. These fees were paid in January 2026. Substantially all revenues are earned from related parties. GAAP RESULTS: CONDENSED CONSOLIDATED STATEMENTS OF INCOME |
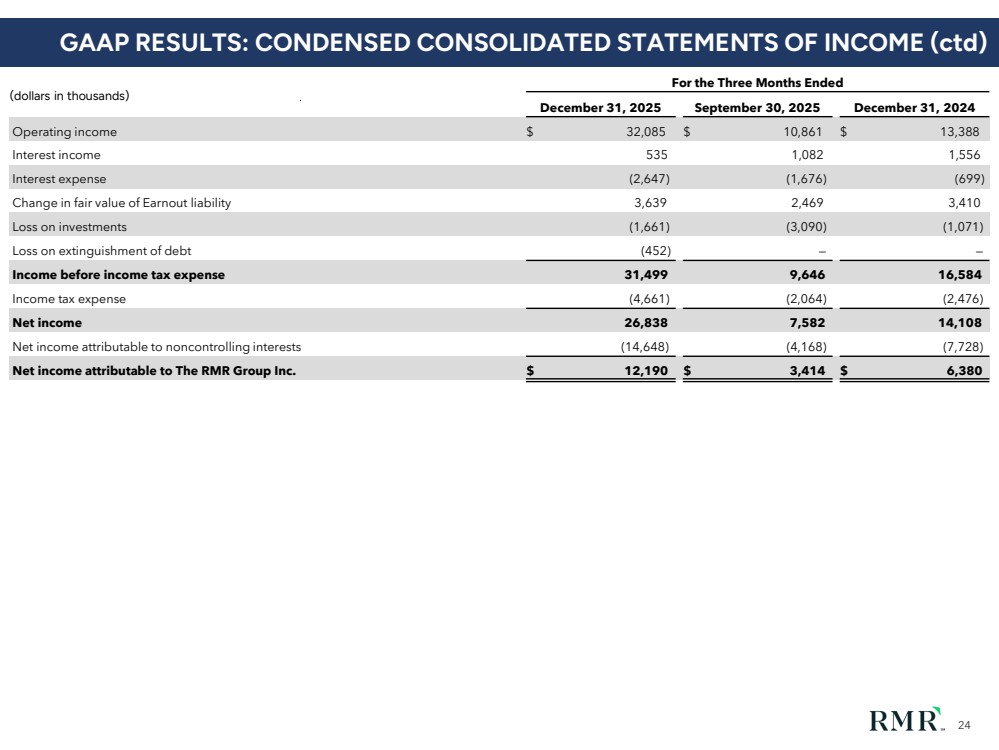
| 24 For the Three Months Ended December 31, 2025 September 30, 2025 December 31, 2024 Operating income $ 32,085 $ 10,861 $ 13,388 Interest income 535 1,082 1,556 Interest expense (2,647) (1,676) (699) Change in fair value of Earnout liability 3,639 2,469 3,410 Loss on investments (1,661) (3,090) (1,071) Loss on extinguishment of debt (452) — — Income before income tax expense 31,499 9,646 16,584 Income tax expense (4,661) (2,064) (2,476) Net income 26,838 7,582 14,108 Net income attributable to noncontrolling interests (14,648) (4,168) (7,728) Net income attributable to The RMR Group Inc. $ 12,190 $ 3,414 $ 6,380 (dollars in thousands) GAAP RESULTS: CONDENSED CONSOLIDATED STATEMENTS OF INCOME (ctd) |
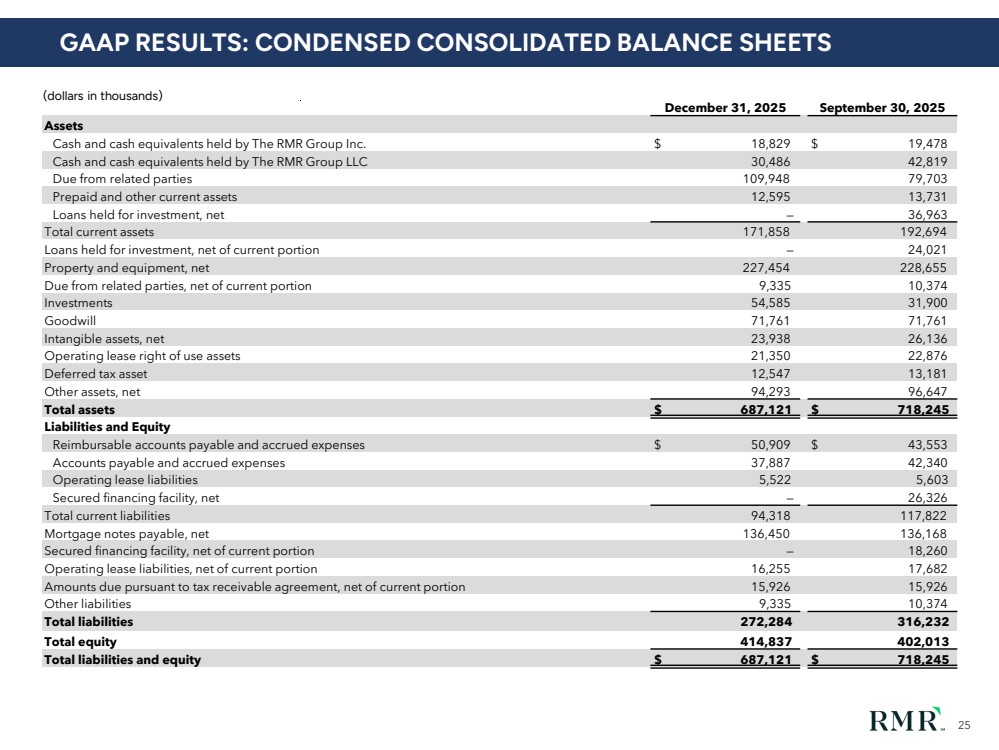
| 25 December 31, 2025 September 30, 2025 Assets Cash and cash equivalents held by The RMR Group Inc. $ 18,829 $ 19,478 Cash and cash equivalents held by The RMR Group LLC 30,486 42,819 Due from related parties 109,948 79,703 Prepaid and other current assets 12,595 13,731 Loans held for investment, net — 36,963 Total current assets 171,858 192,694 Loans held for investment, net of current portion — 24,021 Property and equipment, net 227,454 228,655 Due from related parties, net of current portion 9,335 10,374 Investments 54,585 31,900 Goodwill 71,761 71,761 Intangible assets, net 23,938 26,136 Operating lease right of use assets 21,350 22,876 Deferred tax asset 12,547 13,181 Other assets, net 94,293 96,647 Total assets $ 687,121 $ 718,245 Liabilities and Equity Reimbursable accounts payable and accrued expenses $ 50,909 $ 43,553 Accounts payable and accrued expenses 37,887 42,340 Operating lease liabilities 5,522 5,603 Secured financing facility, net — 26,326 Total current liabilities 94,318 117,822 Mortgage notes payable, net 136,450 136,168 Secured financing facility, net of current portion — 18,260 Operating lease liabilities, net of current portion 16,255 17,682 Amounts due pursuant to tax receivable agreement, net of current portion 15,926 15,926 Other liabilities 9,335 10,374 Total liabilities 272,284 316,232 Total equity 414,837 402,013 Total liabilities and equity $ 687,121 $ 718,245 (dollars in thousands) GAAP RESULTS: CONDENSED CONSOLIDATED BALANCE SHEETS |
| Definitions |

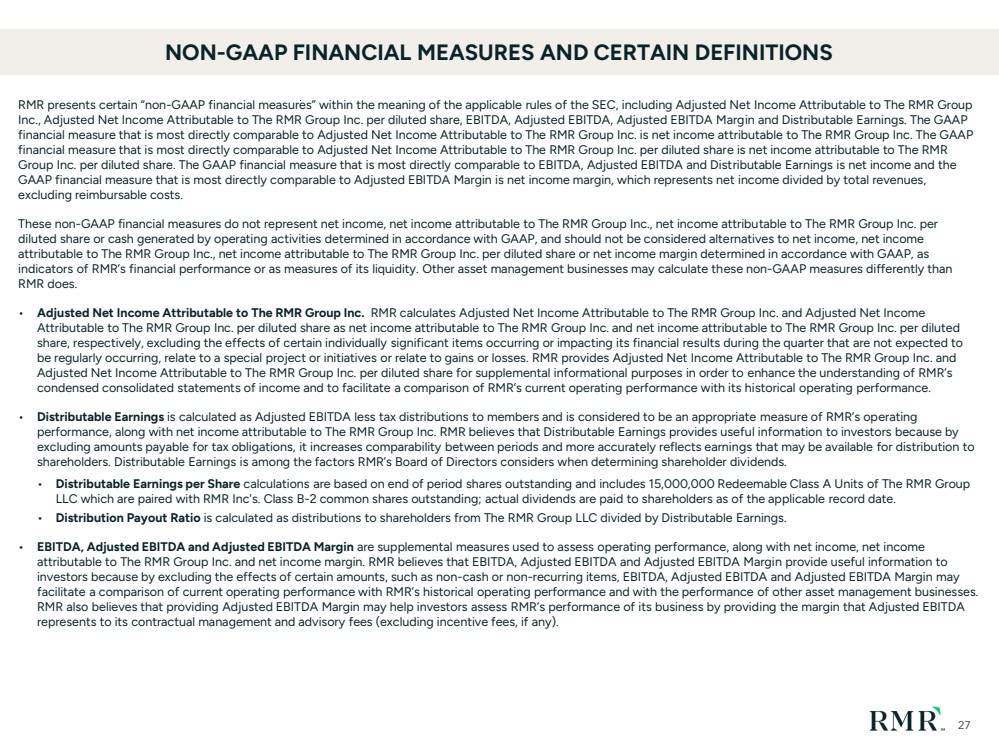
| 27 RMR presents certain “non-GAAP financial measures” within the meaning of the applicable rules of the SEC, including Adjusted Net Income Attributable to The RMR Group Inc., Adjusted Net Income Attributable to The RMR Group Inc. per diluted share, EBITDA, Adjusted EBITDA, Adjusted EBITDA Margin and Distributable Earnings. The GAAP financial measure that is most directly comparable to Adjusted Net Income Attributable to The RMR Group Inc. is net income attributable to The RMR Group Inc. The GAAP financial measure that is most directly comparable to Adjusted Net Income Attributable to The RMR Group Inc. per diluted share is net income attributable to The RMR Group Inc. per diluted share. The GAAP financial measure that is most directly comparable to EBITDA, Adjusted EBITDA and Distributable Earnings is net income and the GAAP financial measure that is most directly comparable to Adjusted EBITDA Margin is net income margin, which represents net income divided by total revenues, excluding reimbursable costs. These non-GAAP financial measures do not represent net income, net income attributable to The RMR Group Inc., net income attributable to The RMR Group Inc. per diluted share or cash generated by operating activities determined in accordance with GAAP, and should not be considered alternatives to net income, net income attributable to The RMR Group Inc., net income attributable to The RMR Group Inc. per diluted share or net income margin determined in accordance with GAAP, as indicators of RMR’s financial performance or as measures of its liquidity. Other asset management businesses may calculate these non-GAAP measures differently than RMR does. • Adjusted Net Income Attributable to The RMR Group Inc. RMR calculates Adjusted Net Income Attributable to The RMR Group Inc. and Adjusted Net Income Attributable to The RMR Group Inc. per diluted share as net income attributable to The RMR Group Inc. and net income attributable to The RMR Group Inc. per diluted share, respectively, excluding the effects of certain individually significant items occurring or impacting its financial results during the quarter that are not expected to be regularly occurring, relate to a special project or initiatives or relate to gains or losses. RMR provides Adjusted Net Income Attributable to The RMR Group Inc. and Adjusted Net Income Attributable to The RMR Group Inc. per diluted share for supplemental informational purposes in order to enhance the understanding of RMR’s condensed consolidated statements of income and to facilitate a comparison of RMR’s current operating performance with its historical operating performance. • Distributable Earnings is calculated as Adjusted EBITDA less tax distributions to members and is considered to be an appropriate measure of RMR’s operating performance, along with net income attributable to The RMR Group Inc. RMR believes that Distributable Earnings provides useful information to investors because by excluding amounts payable for tax obligations, it increases comparability between periods and more accurately reflects earnings that may be available for distribution to shareholders. Distributable Earnings is among the factors RMR’s Board of Directors considers when determining shareholder dividends. • Distributable Earnings per Share calculations are based on end of period shares outstanding and includes 15,000,000 Redeemable Class A Units of The RMR Group LLC which are paired with RMR Inc's. Class B-2 common shares outstanding; actual dividends are paid to shareholders as of the applicable record date. • Distribution Payout Ratio is calculated as distributions to shareholders from The RMR Group LLC divided by Distributable Earnings. • EBITDA, Adjusted EBITDA and Adjusted EBITDA Margin are supplemental measures used to assess operating performance, along with net income, net income attributable to The RMR Group Inc. and net income margin. RMR believes that EBITDA, Adjusted EBITDA and Adjusted EBITDA Margin provide useful information to investors because by excluding the effects of certain amounts, such as non-cash or non-recurring items, EBITDA, Adjusted EBITDA and Adjusted EBITDA Margin may facilitate a comparison of current operating performance with RMR’s historical operating performance and with the performance of other asset management businesses. RMR also believes that providing Adjusted EBITDA Margin may help investors assess RMR’s performance of its business by providing the margin that Adjusted EBITDA represents to its contractual management and advisory fees (excluding incentive fees, if any). NON-GAAP FINANCIAL MEASURES AND CERTAIN DEFINITIONS |
| 28 • Assets Under Management (AUM) All references in this presentation to AUM on, or as of, a date are calculated at a point in time. • AUM is calculated as: (i) the historical cost of real estate and related assets, excluding depreciation, amortization, impairment charges or other non-cash reserves, of the Managed Equity REITs and certain Private Capital clients, plus (ii) the gross book value of real estate assets, property and equipment of AlerisLife and Sonesta, excluding depreciation, amortization, impairment charges or other non-cash reserves, plus (iii) the carrying value of loans held for investment and real estate owned by SEVN, plus (iv) the fair value of RMR Residential, both owned and third-party managed assets. Upon deconsolidation from a Managed Equity REIT, the respective real estate and related assets are characterized as Private Capital and their historical cost represents the fair value of the real estate at the time of deconsolidation. • Fee-Earning AUM is calculated (i) monthly for the Managed Equity REITs, based upon the lower of the average historical cost of each REIT's properties and its average market capitalization, plus (ii) for all other clients and wholly owned properties, Fee-Earning AUM equals AUM and includes amounts that may differ from the measures used for purposes of calculating fees under the terms of the respective management agreements. For additional information on the calculation of AUM for purposes of the fee provisions of the business management agreements, see RMR's Annual Report on Form 10- K for the fiscal year ended September 30, 2025, filed with the SEC. RMR's SEC filings are available at the SEC website: www.sec.gov. • GAAP refers to U.S. generally accepted accounting principles. • Managed Equity REITs refers to Diversified Healthcare Trust (DHC), Industrial Logistics Properties Trust (ILPT), Office Properties Income Trust (OPI) and Service Properties Trust (SVC). • Perpetual Capital refers to capital with an indefinite duration, which may be terminated under certain conditions, and includes the Managed Equity REITs and Seven Hills Realty Trust (SEVN). • Private Capital consists of AlerisLife Inc. (AlerisLife) through December 31, 2025, Sonesta International Hotels Corporation (Sonesta), residential real estate RMR manages through RMR Residential and other private capital vehicles including ABP Trust and other private entities that own commercial real estate. Some of the Managed Equity REITs own minority interests in certain of these entities. As of December 31, 2025, AlerisLife ceased operations, was in the process of winding-down its operations, and transferred its management agreements with DHC for senior living communities to new operators. • Termination Fee Calculation: The $1.4 billion total estimated termination fee is the sum of the termination fees calculated under each of the applicable business and property management agreements based on the following assumptions: (a) assumed termination date of December 31, 2025; (b) for the Managed Equity REITs, monthly future fees were based on actual fees earned by RMR over the 12 months preceding the assumed termination date divided by twelve and, for purposes of determining present value, the monthly future fees were discounted using a rate equal to 1/12th of the sum of the applicable Treasury Rate for that future month plus 300bps. Additionally, in the event the management agreement is terminated by SEVN without a cause event or by Tremont Realty Capital LLC for a material breach, SEVN will be required to pay Tremont Realty Capital LLC a termination fee equal to (a) three times the sum of (i) the average annual base management fee and (ii) the average annual incentive fee, in each case paid or payable to Tremont Realty Capital LLC during the 24 month period immediately preceding the most recently completed calendar quarter prior to the date of termination or, if such termination occurs within 24 months of its initial commencement, the base management fee and the incentive fee will be annualized for such two year period based on such fees earned by Tremont Realty Capital LLC during such period, plus (b) $1.6 million. In addition, the initial organizational costs related to Tremont Mortgage Trust's formation and the costs of its initial public offering and the concurrent private placement that Tremont Mortgage Trust had paid pursuant to its management agreement with Tremont Realty Capital LLC will be included in the “Termination Fee” under and as defined in SEVN’s management agreement with Tremont Realty Capital LLC. No termination fee will be payable if the management agreement is terminated by SEVN for a cause event or by Tremont Realty Capital LLC without SEVN’s material breach. The estimated termination fee is presented for illustrative purposes only based on the assumptions described. Any actual termination fee may be higher or lower than the estimate depending on the actual calculation at the time, including then applicable fees, the then applicable discount rate and other factors. NON-GAAP FINANCIAL MEASURES AND CERTAIN DEFINITIONS (continued) |
| 29 This presentation contains forward-looking statements within the meaning of the Private Securities Litigation Reform Act of 1995 and other securities laws that are subject to risks and uncertainties. These statements may include words such as “believe”, “expect”, “anticipate”, “intend”, “plan”, “estimate”, "opportunity", “will”, “may”, "positioned", "potential" and negatives or derivatives of these or similar expressions. These forward-looking statements include, among others, statements about: RMR's business strategy; economic and industry conditions, including as a result of changing tariffs or trade policies and the related uncertainty thereof; the impact and opportunities for RMR and RMR's clients' businesses from business cycles in the U.S. real estate industry as well as economic and industry conditions, including interest rates; RMR's belief that it is possible to grow real estate based businesses in selected property types or geographic areas despite national trends; RMR's liquidity, including its sufficiency to pursue a range of capital allocation strategies and fund RMR's operations and enhance its technology infrastructure and limit risk exposure; RMR's future profitability; anticipated financial results, future prospects and estimated valuations and share prices; and RMR's sustainability practices. Forward-looking statements reflect RMR’s current expectations, are based on judgments and assumptions, are inherently uncertain and are subject to risks, uncertainties and other factors, which could cause RMR's actual results, performance or achievements to differ materially from expected future results, performance or achievements expressed or implied in those forward-looking statements. Some of the risks, uncertainties and other factors that may cause actual results, performance or achievements to differ materially from those expressed or implied by forward-looking statements include, but are not limited to, the following: The dependence of RMR's revenues on a limited number of clients; the variability of its revenues; risks related to supply chain constraints, commodity pricing and inflation, including inflation impacting wages and employee benefits; changing market conditions, practices and trends, which may adversely impact its clients and the fees RMR receives from them; OPI's voluntary chapter 11 process to restructure its debt obligations and capital structure, which may reduce RMR's management fee revenue over time and may result in reputational harm to RMR; potential terminations of the management agreements with its clients; uncertainty surrounding interest rates and sustained high interest rates, which may impact RMR's clients and significantly reduce RMR's revenues or impede its growth; RMR's dependence on the growth and performance of its clients; RMR's ability to obtain or create new clients for its business which is often dependent on circumstances beyond RMR's control; the ability of RMR's clients to operate their businesses profitably, optimize their capital structures, comply with the terms of their debt agreements and financial covenants and to grow and increase their market capitalizations and total shareholder returns; RMR's ability to successfully provide management services to its clients; RMR's ability to maintain or increase the distributions RMR pays to its shareholders; RMR's ability to successfully pursue and execute capital allocation and new business strategies; RMR's ability to prudently invest in its business to enhance its operations, services and competitive positioning; RMR's ability to successfully grow the RMR Residential business and realize RMR's expected returns on its investment within the anticipated timeframe; RMR's ability to successfully integrate acquired businesses and realize the expected returns on its investments; the ability of Tremont to identify and close suitable investments for SEVN and to monitor, service and administer existing investments; RMR's ability to obtain additional capital from third party investors for its private capital initiatives in order to make additional investments and to increase potential returns; changes to RMR's operating leverage or client diversity; risks related to the security of RMR's network and information technology; litigation risks; risks related to acquisitions, dispositions and other activities by RMR or among its clients; allegations, even if untrue, of any conflicts of interest arising from RMR's management activities; RMR's ability to retain the services of its managing directors and other key personnel; RMR's and its clients’ risks associated with RMR's and its clients' costs of compliance with laws and regulations, including securities regulations, exchange listing standards and other laws and regulations affecting public companies; and other matters. These risks, uncertainties and other factors are not exhaustive and should be read in conjunction with other cautionary statements that are included in RMR's periodic filings. The information contained in RMR’s filings with the Securities and Exchange Commission (SEC), including under the caption “Risk Factors” in its periodic reports, or incorporated therein, identifies important factors that could cause differences from the forward-looking statements in this presentation. RMR’s filings with the SEC are available on the SEC’s website at www.sec.gov. Disclaimer – Illustrative Valuation Analysis: Any information contained in this presentation about sum of the parts (SOTP) and illustrative valuations is "forward-looking" and utilizes hypothetical data and several management assumptions and estimates to provide an illustrative sum of the parts analysis and illustrative valuation estimates for RMR’s potential market valuation. It is important for readers to know that this illustrative analysis is not intended to be a prediction of the performance of RMR, its subsidiaries, affiliates or segments or its securities. Actual results could differ materially due to a variety of factors, including those discussed under “Risk Factors” in RMR’s periodic reports. In addition, a SOTP analysis is only one manner in which a company may be valued, and other parties may choose to value RMR differently. This illustrative analysis was internally prepared and there can be no assurance that any consensus value for RMR will be in line with this illustrative analysis (and any such consensus may be materially different). In addition, this illustrative analysis speaks only as of the date hereof. You are strongly encouraged to read RMR’s filings with the SEC for additional information about RMR and certain important risks and other factors that could affect RMR’s performance. You should not place undue reliance on forward-looking statements. Except as required by law, RMR does not intend to update or change any forward-looking statements as a result of new information, future events or otherwise. Warning Regarding Forward-Looking Statements |
| 30 Two Newton Place 255 Washington Street, Suite 300 Newton, MA 02458 RMRGROUP.COM |