Earnings Release | |
Company Operations | |
Selected Financial Information | |
Consolidated Balance Sheets | |
Consolidated Statements of Operations | |
Net Asset Value Components | |
Supplemental Operating Information | |
Leasing Summary | |
Occupancy Data | |
Comparable Net Operating Income (NOI) | |
NOI Detail | |
Summary of Corporate General and Administrative and Other NOI | |
Core Market NOI | |
Reconciliation of Earnings Before Income Taxes to NOI | |
Reconciliation of Net Earnings to FFO to Operating FFO | |
Reconciliation of Net Earnings attributable to Forest City Realty Trust, Inc. to Adjusted EBITDA attributable to Forest City Realty Trust, Inc. | |
Reconciliation of NOI to Operating FFO | |
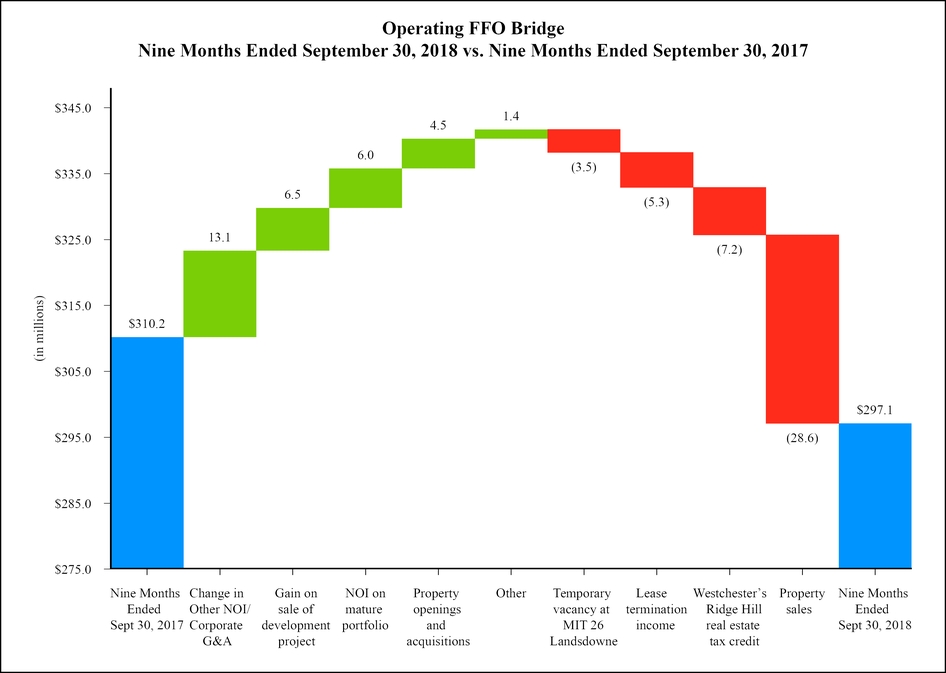
Operating FFO Bridges | |
Historical Trends | |
Development Pipeline | |
Appendix | |
AT THE COMPANY | ON THE WEB |
Mike Lonsway | www.forestcity.net |
Executive Vice President – Planning | |
216-416-3325 | |
Jeff Linton | |
Senior Vice President – Communication | |
216-416-3558 | |
• | Q3 Net earnings: $447.2 million ($1.63 per share) vs. $5.5 million ($0.02 per share) Q3 2017 |
• | Q3 FFO: $98.8 million ($0.36 per share) vs. $112.6 million ($0.42 per share) Q3 2017 |
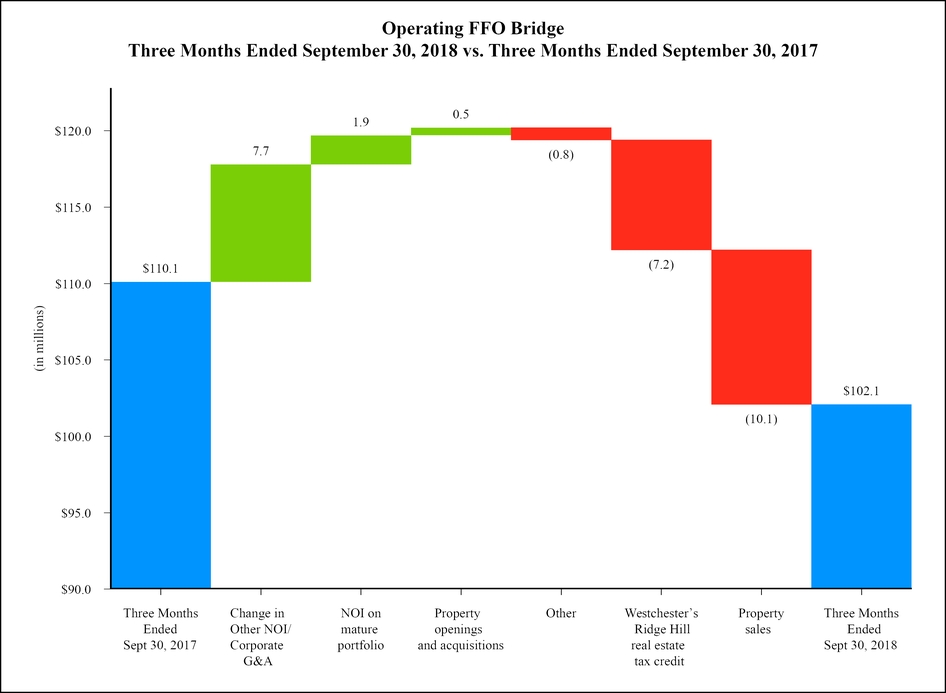
• | Q3 Operating FFO: $102.1 million ($0.38 per share) vs. $110.1 million ($0.41 per share) Q3 2017 |
• | Q3 Comp NOI up 1.7 percent, with office up 2.1 percent and apartments up 1.1 percent |
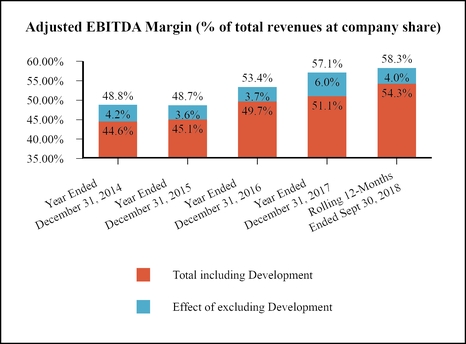
• | Adjusted EBITDA margins up 490 basis points vs. yearend 2016 benchmark, on a rolling 12-month basis |
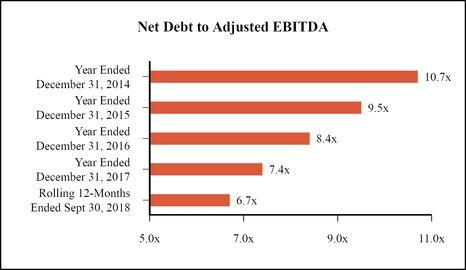
• | Q3 Net Debt to Adjusted EBITDA ratio 6.7 times vs. 7.8 times Q3 2017, on a rolling 12-month basis |
Three Months Ended September 30, | Nine Months Ended September 30, | ||||||||||||
2018 | 2017 | 2018 | 2017 | ||||||||||
(in thousands, except per share data) | |||||||||||||
Net earnings attributable to Forest City Realty Trust, Inc. (GAAP) | $ | 447,173 | $ | 5,454 | $ | 715,432 | $ | 103,124 | |||||
Net earnings attributable to common stockholders per share, diluted | $ | 1.63 | $ | 0.02 | $ | 2.62 | $ | 0.39 | |||||
Revenues | $ | 218,230 | $ | 233,544 | $ | 635,488 | $ | 685,992 | |||||
FFO attributable to Forest City Realty Trust, Inc. (Non-GAAP) | $ | 98,796 | $ | 112,558 | $ | 279,776 | $ | 308,301 | |||||
FFO per share, diluted | $ | 0.36 | $ | 0.42 | $ | 1.03 | $ | 1.15 | |||||
Operating FFO attributable to Forest City Realty Trust, Inc. (Non-GAAP) | $ | 102,099 | $ | 110,145 | $ | 297,116 | $ | 310,200 | |||||
Operating FFO per share, diluted | $ | 0.38 | $ | 0.41 | $ | 1.10 | $ | 1.16 | |||||
Percent Change to Prior Year | ||||||
Three Months Ended September 30, 2018 | Nine Months Ended September 30, 2018 | |||||
Comparable NOI (Non-GAAP) | ||||||
Office | 2.1 | % | 1.4 | % | ||
Apartments | 1.1 | % | 2.3 | % | ||
Total | 1.7 | % | 1.8 | % | ||
As of September 30, | ||||||
2018 | 2017 | |||||
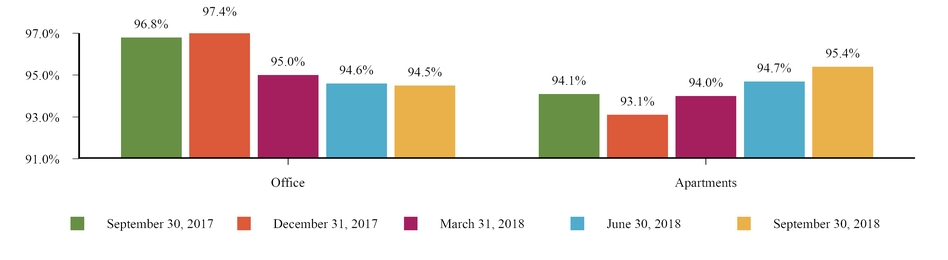
Comparable occupancy, Office | 94.5 | % | 97.0 | % | ||
Nine Months Ended September 30, 2018 | Nine Months Ended September 30, 2017 | |||||
Comparable economic occupancy, Apartments | 94.7 | % | 94.1 | % | ||
Comparable average rental rates, Apartments | $ | 1,553 | $ | 1,533 | ||
Comparable average Core Market rental rates, Apartments | $ | 2,031 | $ | 2,011 | ||
September 30, 2018 | December 31, 2017 | |||||
(in thousands) | ||||||
Assets | ||||||
Real Estate | ||||||
Completed rental properties | 7,413,450 | 7,154,607 | ||||
Projects under construction and development | 435,892 | 568,552 | ||||
Land inventory | 72,885 | 57,296 | ||||
Total Real Estate | 7,922,227 | 7,780,455 | ||||
Less accumulated depreciation | (1,554,126 | ) | (1,484,163 | ) | ||
Real Estate, net | 6,368,101 | 6,296,292 | ||||
Cash and equivalents | 485,941 | 204,260 | ||||
Restricted cash | 211,572 | 146,131 | ||||
Accounts receivable, net | 224,788 | 225,022 | ||||
Notes receivable | 423,737 | 398,785 | ||||
Investments in and advances to unconsolidated entities | 533,482 | 550,362 | ||||
Lease procurement costs, net | 66,386 | 59,810 | ||||
Prepaid expenses and other deferred costs, net | 59,274 | 75,839 | ||||
Intangible assets, net | 174,051 | 106,786 | ||||
Assets held for sale | 29,014 | — | ||||
Total Assets | $ | 8,576,346 | $ | 8,063,287 | ||
Liabilities and Equity | ||||||
Liabilities | ||||||
Nonrecourse mortgage debt and notes payable, net | 3,163,987 | 2,998,361 | ||||
Revolving credit facility | — | — | ||||
Term loan, net | 333,967 | 333,668 | ||||
Convertible senior debt, net | 31,802 | 112,637 | ||||
Construction payables | 71,286 | 76,045 | ||||
Operating accounts payable and accrued expenses | 494,730 | 561,132 | ||||
Accrued derivative liability | 12,020 | 12,845 | ||||
Total Accounts payable, accrued expenses and other liabilities | 578,036 | 650,022 | ||||
Cash distributions and losses in excess of investments in unconsolidated entities | 84,810 | 123,882 | ||||
Liabilities on assets held for sale | 10,022 | — | ||||
Total Liabilities | 4,202,624 | 4,218,570 | ||||
Equity | ||||||
Stockholders’ Equity | ||||||
Stockholders’ equity before accumulated other comprehensive loss | 4,145,154 | 3,436,997 | ||||
Accumulated other comprehensive loss | (3,750 | ) | (8,563 | ) | ||
Total Stockholders’ Equity | 4,141,404 | 3,428,434 | ||||
Noncontrolling interest | 232,318 | 416,283 | ||||
Total Equity | 4,373,722 | 3,844,717 | ||||
Total Liabilities and Equity | $ | 8,576,346 | $ | 8,063,287 | ||
Three Months Ended September 30, | Nine Months Ended September 30, | ||||||||||||
2018 | 2017 | 2018 | 2017 | ||||||||||
(in thousands) | |||||||||||||
Revenues | |||||||||||||
Rental | $ | 167,551 | $ | 167,682 | $ | 490,462 | $ | 496,095 | |||||
Tenant recoveries | 30,026 | 26,671 | 85,245 | 80,735 | |||||||||
Service and management fees | 1,911 | 8,152 | 9,765 | 29,642 | |||||||||
Parking and other | 10,822 | 9,253 | 26,657 | 34,212 | |||||||||
Land sales | 7,920 | 21,786 | 23,359 | 45,308 | |||||||||
Total revenues | 218,230 | 233,544 | 635,488 | 685,992 | |||||||||
Expenses | |||||||||||||
Property operating and management | 66,337 | 71,961 | 200,112 | 228,912 | |||||||||
Real estate taxes | 25,105 | 21,748 | 66,147 | 64,305 | |||||||||
Ground rent | 4,235 | 3,837 | 12,013 | 11,491 | |||||||||
Cost of land sales | 2,723 | 13,301 | 7,943 | 22,996 | |||||||||
Corporate general and administrative | 9,736 | 16,480 | 35,331 | 46,081 | |||||||||
Organizational transformation and termination benefits | 8,289 | 2,633 | 29,188 | 14,021 | |||||||||
116,425 | 129,960 | 350,734 | 387,806 | ||||||||||
Depreciation and amortization | 60,925 | 60,194 | 170,652 | 189,496 | |||||||||
Write-offs of abandoned development projects and demolition costs | — | — | — | 1,596 | |||||||||
Impairment of real estate | — | 44,288 | — | 44,288 | |||||||||
Total expenses | 177,350 | 234,442 | 521,386 | 623,186 | |||||||||
Operating income (loss) | 40,880 | (898 | ) | 114,102 | 62,806 | ||||||||
Interest and other income | 13,296 | 20,361 | 34,773 | 40,529 | |||||||||
Gain on change in control of interests | 219,666 | — | 337,377 | — | |||||||||
Interest expense | (30,882 | ) | (31,597 | ) | (86,849 | ) | (88,473 | ) | |||||
Amortization of mortgage procurement costs | (1,366 | ) | (1,338 | ) | (3,966 | ) | (4,067 | ) | |||||
Loss on extinguishment of debt | (19 | ) | — | (3,995 | ) | (2,843 | ) | ||||||
Earnings (loss) before income taxes and earnings from unconsolidated entities | 241,575 | (13,472 | ) | 391,442 | 7,952 | ||||||||
Equity in earnings | 7,369 | 8,295 | 12,038 | 23,834 | |||||||||
Net gain on disposition of interest in unconsolidated entities | 181,504 | 28,828 | 265,510 | 81,782 | |||||||||
Impairment | — | (10,600 | ) | — | (10,600 | ) | |||||||
188,873 | 26,523 | 277,548 | 95,016 | ||||||||||
Earnings before income taxes | 430,448 | 13,051 | 668,990 | 102,968 | |||||||||
Current income tax expense of taxable REIT subsidiaries | 2,981 | 304 | 3,940 | 4,817 | |||||||||
Earnings before gain on disposal of real estate, net of tax | 427,467 | 12,747 | 665,050 | 98,151 | |||||||||
Net gain (loss) on disposition of interest in development project | — | — | 6,227 | (113 | ) | ||||||||
Net gain (loss) on disposition of rental properties | 60,931 | (256 | ) | 84,038 | 13,573 | ||||||||
Net earnings | 488,398 | 12,491 | 755,315 | 111,611 | |||||||||
Noncontrolling interests, gross of tax | |||||||||||||
Earnings from continuing operations attributable to noncontrolling interests | (41,225 | ) | (7,037 | ) | (39,883 | ) | (8,487 | ) | |||||
Net earnings attributable to Forest City Realty Trust, Inc. | $ | 447,173 | $ | 5,454 | $ | 715,432 | $ | 103,124 | |||||
Completed Rental Properties - Operations | |||||||||||||||||||
Q3 2018 | Net Stabilized | Stabilized | Annualized | Nonrecourse | |||||||||||||||
(Dollars in millions) | NOI (1) | Adjustments (2) | NOI | Stabilized NOI | Debt, net (3) | ||||||||||||||
Operations | A | B | =A+B | ||||||||||||||||
Office Real Estate | |||||||||||||||||||
Life Science | |||||||||||||||||||
Cambridge | $ | 22.3 | $ | 2.1 | $ | 24.4 | $ | 97.6 | $ | (655.9 | ) | ||||||||
Other Life Science | 4.4 | — | 4.4 | 17.6 | (128.0 | ) | |||||||||||||
New York | |||||||||||||||||||
Manhattan | 14.4 | — | 14.4 | 57.6 | — | ||||||||||||||
Brooklyn | 22.9 | 0.4 | 23.3 | 93.2 | (349.0 | ) | |||||||||||||
Other Office | 7.3 | — | 7.3 | 29.2 | (111.6 | ) | |||||||||||||
Subtotal Office | $ | 71.3 | $ | 2.5 | $ | 73.8 | $ | 295.2 | $ | (1,244.5 | ) | ||||||||
Apartment Real Estate | |||||||||||||||||||
Apartments, Core Markets | $ | 35.8 | $ | 1.2 | $ | 37.0 | $ | 148.0 | $ | (1,469.9 | ) | ||||||||
Apartments, Non-Core Markets | 12.7 | — | 12.7 | 50.8 | (305.9 | ) | |||||||||||||
Subtotal Apartment Product Type | $ | 48.5 | $ | 1.2 | $ | 49.7 | $ | 198.8 | $ | (1,775.8 | ) | ||||||||
Retail Real Estate | |||||||||||||||||||
Other Retail | $ | 11.9 | $ | (1.7 | ) | $ | 10.2 | $ | 40.8 | $ | (434.0 | ) | |||||||
Subtotal | $ | 131.7 | $ | 2.0 | $ | 133.7 | $ | 534.8 | $ | (3,454.3 | ) | ||||||||
Straight-line rent adjustments | 4.0 | — | 4.0 | 16.0 | — | ||||||||||||||
Other Operations | (1.3 | ) | — | (1.3 | ) | (5.2 | ) | — | |||||||||||
Total Operations | $ | 134.4 | $ | 2.0 | $ | 136.4 | $ | 545.6 | $ | (3,454.3 | ) | ||||||||
Development | |||||||||||||||||||
Recently-Opened Properties/Redevelopment | $ | 2.6 | $ | 5.5 | $ | 8.1 | $ | 32.4 | $ | (350.9 | ) | ||||||||
Straight-line rent adjustments | 0.6 | — | 0.6 | 2.4 | — | ||||||||||||||
Other Development | (2.4 | ) | (1.6 | ) | (4.0 | ) | (16.0 | ) | — | ||||||||||
Total Development | $ | 0.8 | $ | 3.9 | $ | 4.7 | $ | 18.8 | $ | (350.9 | ) | ||||||||
Retail Dispositions | Gross Asset Value (4) | ||||||||||||||||||
QIC | $ | 869.0 | $ | (328.2 | ) | ||||||||||||||
Madison | 77.9 | (49.7 | ) | ||||||||||||||||
Total Retail Dispositions | $ | 946.9 | $ | (377.9 | ) | ||||||||||||||
Book Value (3) | |||||||||||||||||||
Projects under construction (5) | $ | 122.5 | $ | (61.0 | ) | ||||||||||||||
Projects under development | $ | 245.8 | $ | (8.6 | ) | ||||||||||||||
Land inventory: | |||||||||||||||||||
Stapleton | $ | 64.2 | $ | — | |||||||||||||||
Commercial Outlots | $ | 2.4 | $ | — | |||||||||||||||
Other Tangible Assets | |||||||||||||||||||
Cash and equivalents | $ | 521.4 | |||||||||||||||||
Restricted cash | $ | 145.3 | |||||||||||||||||
Accounts receivable, net (6) | $ | 265.5 | |||||||||||||||||
Notes receivable | $ | 526.5 | |||||||||||||||||
Net investments and advances to unconsolidated entities | $ | 10.8 | |||||||||||||||||
Prepaid expenses and other deferred costs, net | $ | 64.4 | |||||||||||||||||
Recourse Debt and Other Liabilities | |||||||||||||||||||
Revolving credit facility | $ | — | |||||||||||||||||
Term loan, net | $ | (334.0 | ) | ||||||||||||||||
Convertible senior debt, net | $ | (31.8 | ) | ||||||||||||||||
Less: convertible debt | $ | 31.8 | |||||||||||||||||
Construction payables | $ | (78.5 | ) | ||||||||||||||||
Operating accounts payable and accrued expenses (7) | $ | (552.4 | ) | ||||||||||||||||
Share Data (in millions) | |||||||||||||||||||
Diluted weighted average number of shares for the three months ended September 30, 2018 | 274.0 | ||||||||||||||||||
(1) | Q3 2018 Earnings Before Income Taxes is reconciled to NOI for the three months ended September 30, 2018 in the Supplemental Operating Information section of this supplemental package. Total NOI is reconciled below: |
Q3 2018 | |||
(Dollars in millions) | NOI | ||
Total Operations | $ | 134.4 | |
Total Development | 0.8 | ||
QIC | 9.8 | ||
Madison | 1.1 | ||
Grand Total | $ | 146.1 | |
(2) | The net stabilized adjustments column represents adjustments assumed to arrive at an estimated annualized stabilized NOI. We include stabilization adjustments to the Q3 2018 NOI as follows: |
a) | Due to the redevelopment of 26 Landsdowne Street (Life Science Office - Cambridge), we have included a stabilization adjustment to the Q3 2018 NOI to arrive at our estimate of annualized stabilized NOI prior to the commencement of our current redevelopment. |
b) | Additional NOI for the recently acquired ownership interests in three life science properties at University Park at MIT (Life Science Office - Cambridge) and DKLB BKLN (Apartments, Core Markets) has been included. |
c) | Partial period NOI for recently sold properties has been removed. |
d) | Due to the planned transfer of Charleston Town Center and Shops at Northern Boulevard (Other Retail) to the lenders in deed-in-lieu transactions, we have removed NOI and nonrecourse debt, net, related to these properties. |
e) | For recently-opened properties currently in initial lease-up periods included in the Development Segment, NOI is reflected at 5% of the company ownership cost. This assumption does not reflect our anticipated NOI, but rather is used in order to establish a hypothetical basis for an estimated valuation of leased-up properties. The following properties are currently in their initial lease-up periods: |
Cost at 100% | Cost at Company Share | Lease Commitment % as of | |||||
Property | October 25, 2018 | ||||||
(in millions) | |||||||
Office: | |||||||
The Bridge at Cornell Tech (New York Office) | $ | 159.6 | $ | 159.6 | 57% | ||
Apartments, Core Markets: | |||||||
Ardan | $ | 121.8 | $ | 38.0 | 16% | ||
Mint Town Center | $ | 94.8 | $ | 83.4 | 36% | ||
Axis | $ | 141.7 | $ | 43.1 | 56% | ||
VYV | $ | 211.6 | $ | 105.8 | 97% | ||
38 Sixth Avenue | $ | 197.3 | $ | 48.6 | 80% | ||
535 Carlton | $ | 168.2 | $ | 41.8 | 94% | ||
Eliot on 4th | $ | 136.6 | $ | 42.8 | 96% | ||
NorthxNorthwest | $ | 115.0 | $ | 33.7 | 94% | ||
Total Apartments | $ | 1,187.0 | $ | 437.2 | |||
Grand Total | $ | 1,346.6 | $ | 596.8 | |||
f) | Due to the redevelopment of Ballston Quarter (Development Segment; Recently-Opened Properties/Redevelopment), we have included a stabilization adjustment to the Q3 2018 NOI to arrive at $2.6 million, our estimate of annualized stabilized NOI prior to the commencement of our current redevelopment.. |
g) | Development Other includes a stabilization adjustment to arrive at our estimate of annualized net expensed development overhead. |
(3) | Amounts represent the company’s share of each respective balance sheet line item as of September 30, 2018 and may be calculated using the financial information contained in the Appendix of this supplemental package. Adjustments to these amounts include: |
a. | Due to the planned transfer of Charleston Town Center and Shops at Northern Boulevard to their lenders in deed in lieu transactions, we have removed nonrecourse debt, net, of $48.7 million and $17.0 million, respectively, related to these properties. |
(4) | Gross asset valued related to the retail portfolio dispositions: |
a. | Represents the gross asset value of the four remaining regional malls, based on the agreed upon pricing under the signed definitive agreement with QIC. |
b. | Represents the gross asset value of the remaining asset, based on agreed upon pricing under the signed definitive agreement with Madison. |
(5) | Stabilized NOI for the following properties is included under Recently-Opened Properties/Redevelopment. As such, we have removed the following from the book value of projects under construction: |
a. | $59.2 million, which represents the costs on the balance sheet associated with the ongoing redevelopment of Ballston Quarter. |
b. | $12.6 million, which represents costs on the balance sheet associated with the phased opening of Ardan. |
(6) | Includes $133.1 million of straight-line rent receivable (net of $6.6 million of allowance for doubtful accounts). |
(7) | Includes $48.4 million of straight-line rent payable. |
Net Asset Value Components - Stabilized NOI | |||||||||||||||||||
Stabilized Adjustments | |||||||||||||||||||
Property | |||||||||||||||||||
Q2 2018 | Openings/ | Property | Portfolio | Q3 2018 | |||||||||||||||
(Dollars in millions) | Stabilized NOI | Acquisitions | Sales | NOI Changes | Stabilized NOI | ||||||||||||||
Operations | |||||||||||||||||||
Office Real Estate | |||||||||||||||||||
Life Science | |||||||||||||||||||
Cambridge | $ | 24.4 | $ | — | $ | — | $ | — | $ | 24.4 | |||||||||
Other Life Science | 4.2 | — | — | 0.2 | 4.4 | ||||||||||||||
New York | |||||||||||||||||||
Manhattan | 14.5 | — | — | (0.1 | ) | 14.4 | |||||||||||||
Brooklyn | 23.4 | — | — | (0.1 | ) | 23.3 | |||||||||||||
Other Office | 7.5 | — | — | (0.2 | ) | 7.3 | |||||||||||||
Subtotal Office | $ | 74.0 | $ | — | $ | — | $ | (0.2 | ) | $ | 73.8 | ||||||||
Apartment Real Estate | |||||||||||||||||||
Apartments, Core Markets | $ | 38.0 | $ | 1.2 | $ | — | $ | (2.2 | ) | $ | 37.0 | ||||||||
Apartments, Non-Core Markets | 12.9 | — | — | (0.2 | ) | 12.7 | |||||||||||||
Subtotal Apartment Product Type | $ | 50.9 | $ | 1.2 | $ | — | $ | (2.4 | ) | $ | 49.7 | ||||||||
Federally Assisted Housing | — | — | — | — | — | ||||||||||||||
Subtotal Apartments | $ | 50.9 | $ | 1.2 | $ | — | $ | (2.4 | ) | $ | 49.7 | ||||||||
Retail Real Estate | |||||||||||||||||||
Other Retail | 9.9 | — | — | 0.3 | 10.2 | ||||||||||||||
Subtotal | $ | 134.8 | $ | 1.2 | $ | — | $ | (2.3 | ) | $ | 133.7 | ||||||||
Straight-line rent adjustments | 3.6 | — | — | 0.4 | 4.0 | ||||||||||||||
Other Operations | (3.0 | ) | — | — | 1.7 | (1.3 | ) | ||||||||||||
Total Operations | $ | 135.4 | $ | 1.2 | $ | — | $ | (0.2 | ) | $ | 136.4 | ||||||||
Development Pipeline | |||||||||||||||||||
Development | |||||||||||||||||||
Recently-Opened Properties/Redevelopment | $ | 8.1 | $ | — | $ | — | $ | — | $ | 8.1 | |||||||||
Straight-line rent adjustments | 0.8 | — | — | (0.2 | ) | 0.6 | |||||||||||||
Other Development | (4.0 | ) | — | — | — | (4.0 | ) | ||||||||||||
Total Development | $ | 4.9 | $ | — | $ | — | $ | (0.2 | ) | $ | 4.7 | ||||||||
Grand Total | $ | 140.3 | $ | 1.2 | $ | — | $ | (0.4 | ) | $ | 141.1 | ||||||||
Same-Space Leases | Other New Leases | ||||||||||||||||||||||
Quarter | Number of Leases Signed | GLA Signed | Contractual Rent Per SF (1) | Expired Rent Per SF (1) | Cash Basis % Change over Prior Rent | Number of Leases Signed | GLA Signed | Contractual Rent Per SF (1) | Total GLA Signed | ||||||||||||||
Q4 2017 | 14 | 340,532 | $ | 46.92 | $ | 39.39 | 19.1 | % | 3 | 1,186 | $ | 57.26 | 341,718 | ||||||||||
Q1 2018 | 13 | 183,331 | $ | 73.09 | $ | 63.36 | 15.4 | % | 3 | 7,172 | $ | 31.61 | 190,503 | ||||||||||
Q2 2018 | 12 | 208,502 | $ | 61.53 | $ | 49.23 | 25.0 | % | 3 | 39,530 | $ | 25.61 | 248,032 | ||||||||||
Q3 2018 | 8 | 103,667 | $ | 50.26 | $ | 46.23 | 8.7 | % | 4 | 10,103 | $ | 90.71 | 113,770 | ||||||||||
Total | 47 | 836,032 | $ | 56.72 | $ | 47.95 | 18.3 | % | 13 | 57,991 | $ | 38.34 | 894,023 | ||||||||||
(1) | Office contractual rent per square foot includes base rent and fixed additional charges for common area maintenance and real estate taxes as of rental commencement. For all expiring leases, contractual rent per square foot includes any applicable escalations. |
Monthly Average Apartment Rental Rates (2) | Economic Apartment Occupancy | |||||||||||||||||
Comparable Apartment | Leasable Units | Three Months Ended September 30, | Three Months Ended September 30, | |||||||||||||||
Communities (1) | at Company % (3) | 2018 | 2017 | % Change | 2018 | 2017 | % Change | |||||||||||
Core Markets | 8,857 | $ | 2,043 | $ | 2,027 | 0.8 | % | 95.8 | % | 94.3 | % | 1.5 | % | |||||
Non-Core Markets | 7,953 | $ | 1,029 | $ | 1,013 | 1.6 | % | 94.5 | % | 93.5 | % | 1.0 | % | |||||
Total Comparable Apartments | 16,810 | $ | 1,563 | $ | 1,547 | 1.0 | % | 95.4 | % | 94.0 | % | 1.4 | % | |||||
Monthly Average Apartment Rental Rates (2) | Economic Apartment Occupancy | |||||||||||||||||
Comparable Apartment | Leasable Units | Nine Months Ended September 30, | Nine Months Ended September 30, | |||||||||||||||
Communities (1) | at Company % (3) | 2018 | 2017 | % Change | 2018 | 2017 | % Change | |||||||||||
Core Markets | 8,857 | $ | 2,031 | $ | 2,011 | 1.0 | % | 95.1 | % | 94.6 | % | 0.5 | % | |||||
Non-Core Markets | 7,953 | $ | 1,020 | $ | 1,002 | 1.8 | % | 93.8 | % | 92.9 | % | 0.9 | % | |||||
Total Comparable Apartments | 16,810 | $ | 1,553 | $ | 1,533 | 1.3 | % | 94.7 | % | 94.1 | % | 0.6 | % | |||||
Monthly Average Apartment Rental Rates (2) | Economic Apartment Occupancy | |||||||||||||||||
Three Months Ended | Three Months Ended | |||||||||||||||||
Comparable Apartment | Leasable Units | September 30, | June 30, | September 30, | June 30, | |||||||||||||
Communities (1) | at Company % (3) | 2018 | 2018 | % Change | 2018 | 2018 | % Change | |||||||||||
Core Markets | 8,857 | $ | 2,043 | $ | 2,031 | 0.6 | % | 95.8 | % | 95.0 | % | 0.8 | % | |||||
Non-Core Markets | 7,953 | $ | 1,029 | $ | 1,016 | 1.3 | % | 94.5 | % | 94.1 | % | 0.4 | % | |||||
Total Comparable Apartments | 16,810 | $ | 1,563 | $ | 1,551 | 0.8 | % | 95.4 | % | 94.7 | % | 0.7 | % | |||||
(1) | Includes stabilized apartment communities completely opened and operated in the periods presented. These apartment communities include units leased at affordable apartment rates which provide a discount from average market rental rates. For the three months ended September 30, 2018, 14.4% of leasable units in core markets and 4.9% of leasable units in non-core markets were affordable housing units. |
(2) | Represents gross potential rent less concessions. |
(3) | Leasable units represent our share of comparable leasable units at the apartment community. |
Leased Occupancy | ||||
As of September 30, | ||||
Office | 2018 | 2017 | ||
Comparable | 94.5 | % | 97.0 | % |
Total | 94.3 | % | 95.8 | % |
Quarterly Historical Trends | |||||||||||||||
Three Months Ended | |||||||||||||||
September 30, 2018 | June 30, 2018 | March 31, 2018 | December 31, 2017 | September 30, 2017 | |||||||||||
Office | 2.1 | % | 0.8 | % | 1.2 | % | 6.4 | % | 4.3 | % | |||||
Apartments | 1.1 | % | 5.2 | % | (0.4 | )% | 5.6 | % | 5.0 | % | |||||
Total | 1.7 | % | 2.6 | % | 0.6 | % | 6.1 | % | 4.6 | % | |||||
Year-to-Date and Annual Historical Trends | |||||||||||||||
Nine Months Ended | Years Ended December 31, | ||||||||||||||
September 30, 2018 | 2017 | 2016 | 2015 | 2014 | |||||||||||
Office | 1.4 | % | 2.9 | % | 3.6 | % | 4.9 | % | 6.6 | % | |||||
Apartments | 2.3 | % | 3.3 | % | 3.3 | % | 4.7 | % | 4.3 | % | |||||
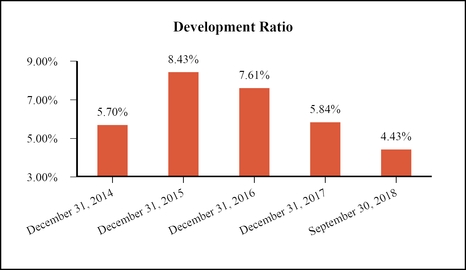
Total | 1.8 | % | 3.1 | % | 3.5 | % | 4.9 | % | 5.7 | % | |||||
Year-to-Date and Annual Historical Trends - Margins on Comparable NOI | |||||||||||||||
Nine Months Ended | Years Ended December 31, | ||||||||||||||
September 30, 2018 | 2017 | 2016 | 2015 | 2014 | |||||||||||
Office Segment | |||||||||||||||
Life Science | 68.6 | % | 68.6 | % | 60.1 | % | 58.7 | % | 58.5 | % | |||||
New York | |||||||||||||||
Manhattan | 73.9 | % | 73.9 | % | 73.5 | % | 72.1 | % | 73.2 | % | |||||
Brooklyn | 52.1 | % | 52.8 | % | 53.0 | % | 51.4 | % | 50.5 | % | |||||
Other Office | 66.7 | % | 63.7 | % | 55.6 | % | 53.8 | % | 53.4 | % | |||||
Total Office Segment | 62.6 | % | 62.2 | % | 59.0 | % | 57.3 | % | 57.1 | % | |||||
Apartment Segment | |||||||||||||||
Core Markets | 60.8 | % | 62.3 | % | 61.6 | % | 60.8 | % | 60.7 | % | |||||
Non-Core Markets | 49.9 | % | 49.7 | % | 48.9 | % | 46.3 | % | 47.0 | % | |||||
Total Apartment Segment | 57.6 | % | 58.6 | % | 57.8 | % | 56.7 | % | 56.7 | % | |||||
Total | 60.4 | % | 60.6 | % | 58.5 | % | 57.1 | % | 56.9 | % | |||||
Three Months Ended September 30, | Nine Months Ended September 30, | ||||||||||||||||
2018 | 2017 | % Change | 2018 | 2017 | % Change | ||||||||||||
Office Segment | |||||||||||||||||
Comparable NOI | 67,918 | 66,515 | 2.1 | % | 203,390 | 200,620 | 1.4 | % | |||||||||
Non-Comparable NOI | 3,427 | 367 | 4,668 | 8,787 | |||||||||||||
Office Product Type NOI | 71,345 | 66,882 | 208,058 | 209,407 | |||||||||||||
Other NOI (1) | 5,415 | 2,781 | 9,852 | 9,010 | |||||||||||||
Total Office Segment | 76,760 | 69,663 | 217,910 | 218,417 | |||||||||||||
Apartment Segment | |||||||||||||||||
Comparable NOI | 47,764 | 47,250 | 1.1 | % | 143,424 | 140,205 | 2.3 | % | |||||||||
Non-Comparable NOI | 741 | (26 | ) | 2,198 | (79 | ) | |||||||||||
Apartment Product Type NOI | 48,505 | 47,224 | 145,622 | 140,126 | |||||||||||||
Federally Assisted Housing | — | 1,532 | 124 | 9,813 | |||||||||||||
Other NOI (1) | (1,596 | ) | (869 | ) | (4,626 | ) | (2,692 | ) | |||||||||
Total Apartment Segment | 46,909 | 47,887 | 141,120 | 147,247 | |||||||||||||
Retail Segment | |||||||||||||||||
Retail NOI | 21,719 | 39,698 | 71,430 | 118,659 | |||||||||||||
Madison Preferred Return | 1,075 | — | 6,006 | — | |||||||||||||
Retail Product Type NOI | 22,794 | 39,698 | 77,436 | 118,659 | |||||||||||||
Other NOI (1) | (1,189 | ) | 56 | (523 | ) | (682 | ) | ||||||||||
Total Retail Segment | 21,605 | 39,754 | 76,913 | 117,977 | |||||||||||||
Operations | |||||||||||||||||
Comparable NOI | 115,682 | 113,765 | 1.7 | % | 346,814 | 340,825 | 1.8 | % | |||||||||
Retail NOI | 22,794 | 39,698 | 77,436 | 118,659 | |||||||||||||
Non-Comparable NOI (2) | 4,168 | 341 | 6,866 | 8,708 | |||||||||||||
Product Type NOI | 142,644 | 153,804 | 431,116 | 468,192 | |||||||||||||
Federally Assisted Housing | — | 1,532 | 124 | 9,813 | |||||||||||||
Other NOI (1): | |||||||||||||||||
Straight-line rent adjustments | 3,985 | 2,133 | 10,919 | 8,776 | |||||||||||||
Participation payments | (26 | ) | — | (1,160 | ) | — | |||||||||||
Other Operations | (1,329 | ) | (165 | ) | (5,056 | ) | (3,140 | ) | |||||||||
2,630 | 1,968 | 4,703 | 5,636 | ||||||||||||||
Total Operations | 145,274 | 157,304 | 435,943 | 483,641 | |||||||||||||
Development Segment | |||||||||||||||||
Recently-Opened Properties/Redevelopment | 2,646 | 2,542 | 7,392 | 1,188 | |||||||||||||
Other Development (3) | (1,803 | ) | (3,283 | ) | (9,378 | ) | (16,296 | ) | |||||||||
Total Development Segment | 843 | (741 | ) | (1,986 | ) | (15,108 | ) | ||||||||||
Grand Total | $ | 146,117 | $ | 156,563 | $ | 433,957 | $ | 468,533 | |||||||||
(1) | Includes straight-line rent adjustments, participation payments as a result of refinancing transactions on our properties and management and service company overhead, net of service fee revenues. |
(2) | Non-comparable NOI includes lease termination income of $495 and $936 for the three and nine months ended September 30, 2018, respectively, compared with $618 and $6,219 for the three and nine months ended September 30, 2017. |
(3) | Includes straight-line adjustments, non-capitalizable development overhead and other costs on our development projects. |
Three Months Ended September 30, | Nine Months Ended September 30, | ||||||||||||||||||||
2018 | 2017 | 2018 | 2017 | ||||||||||||||||||
NOI | % of Total | NOI | % of Total | NOI | % of Total | NOI | % of Total | ||||||||||||||
Office Segment | $ | 71,345 | 50.0 | % | $ | 66,882 | 43.5 | % | $ | 208,058 | 48.2 | % | $ | 209,407 | 44.7 | % | |||||
Apartment Segment | 48,505 | 34.0 | % | 47,224 | 30.7 | % | 145,622 | 33.8 | % | 140,126 | 29.9 | % | |||||||||
Retail Segment | 22,794 | 16.0 | % | 39,698 | 25.8 | % | 77,436 | 18.0 | % | 118,659 | 25.4 | % | |||||||||
Total Product Type NOI | $ | 142,644 | $ | 153,804 | $ | 431,116 | $ | 468,192 | |||||||||||||
Three Months Ended September 30, | Nine Months Ended September 30, | ||||||||||||||||||
2018 | 2017 | Change | 2018 | 2017 | Change | ||||||||||||||
Corporate General and Administrative | $ | (9,736 | ) | $ | (17,140 | ) | $ | 7,404 | $ | (39,949 | ) | $ | (48,061 | ) | $ | 8,112 | |||
Other Operations NOI | (1,329 | ) | (165 | ) | (1,164 | ) | (5,056 | ) | (3,140 | ) | (1,916 | ) | |||||||
Other Development NOI | (1,803 | ) | (3,283 | ) | 1,480 | (9,378 | ) | (16,296 | ) | 6,918 | |||||||||
$ | (12,868 | ) | $ | (20,588 | ) | $ | 7,720 | $ | (54,383 | ) | $ | (67,497 | ) | $ | 13,114 | ||||
Deferred gain (1) | — | 660 | (660 | ) | 4,618 | 1,980 | 2,638 | ||||||||||||
Total | $ | (12,868 | ) | $ | (19,928 | ) | $ | 7,060 | $ | (49,765 | ) | $ | (65,517 | ) | $ | 15,752 | |||
Nine Months Ended | Years Ended | |||||||||
September 30, 2018 | December 31, 2017 | December 31, 2016 | ||||||||
(in thousands) | ||||||||||
Corporate General and Administrative | $ | (39,949 | ) | $ | (64,788 | ) | $ | (63,343 | ) | |
Other Operations NOI | (5,056 | ) | (3,203 | ) | (1,593 | ) | ||||
Other Development NOI | (9,378 | ) | (18,611 | ) | (33,391 | ) | ||||
$ | (54,383 | ) | $ | (86,602 | ) | $ | (98,327 | ) | ||
Deferred gain (1) | 4,618 | 2,639 | 660 | |||||||
Ballston Quarter development fee | — | — | 5,500 | |||||||
Total | $ | (49,765 | ) | $ | (83,963 | ) | $ | (92,167 | ) | |
(1) | Deferred gain relates to a 2016 leaseback transaction at Terminal Tower, the Company’s former headquarters in Cleveland, Ohio. Upon vacating these premises in March 2018, the remaining deferred gain was recorded as a reduction to rent expense in accordance with GAAP. |
Nine Months Ended September 30, 2018 | Nine Months Ended September 30, 2017 | |
Product Type NOI | $ | 431,116 | Product Type NOI | $ | 468,192 | |||
Federally Assisted Housing | 124 | Federally Assisted Housing | 9,813 | |||||
Other NOI (3): | Other NOI (3): | |||||||
Straight-line rent adjustments | 10,919 | Straight-line rent adjustments | 8,776 | |||||
Participation payments | (1,160 | ) | Participation payments | — | ||||
Other Operations | (5,056 | ) | Other Operations | (3,140 | ) | |||
4,703 | 5,636 | |||||||
Recently-Opened Properties/Redevelopment | 7,392 | Recently-Opened Properties/Redevelopment | 1,188 | |||||
Development Segment (4) | (9,378 | ) | Development Segment (4) | (16,296 | ) | |||
Grand Total NOI | $ | 433,957 | Grand Total NOI | $ | 468,533 | |||
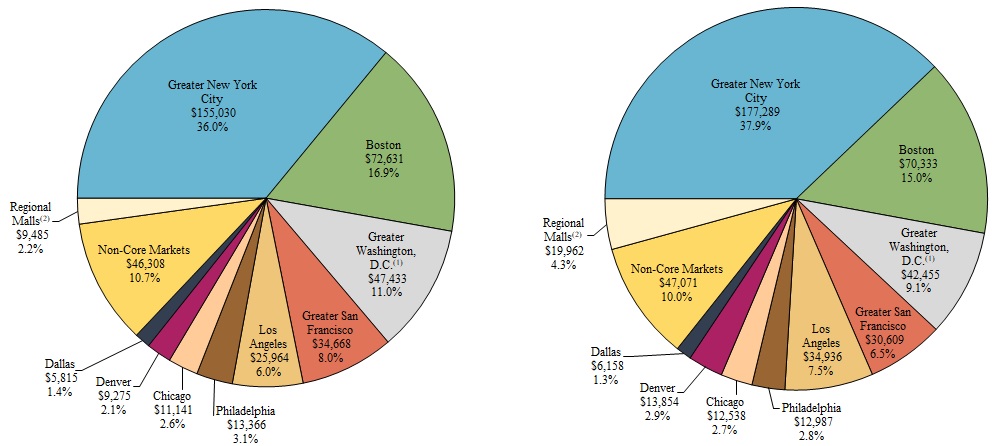
(1) | Includes Richmond, Virginia. |
(2) | Represents Regional Malls located in Non-Core Markets. Regional Malls located in Core Markets are included in their applicable Core Markets. |
(3) | Includes straight-line rent adjustments, participation payments as a result of refinancing transactions on our properties and management and service company overhead, net of service fee revenues. |
(4) | Includes straight-line adjustments, non-capitalizable development overhead and other costs on our development projects. |
Three Months Ended September 30, | Nine Months Ended September 30, | ||||||||||||
2018 | 2017 | 2018 | 2017 | ||||||||||
Earnings before income taxes (GAAP) | $ | 430,448 | $ | 13,051 | $ | 668,990 | $ | 102,968 | |||||
Earnings from unconsolidated entities | (188,873 | ) | (26,523 | ) | (277,548 | ) | (95,016 | ) | |||||
Earnings before income taxes and earnings from unconsolidated entities | 241,575 | (13,472 | ) | 391,442 | 7,952 | ||||||||
Land sales | (7,920 | ) | (21,786 | ) | (23,359 | ) | (45,308 | ) | |||||
Cost of land sales | 2,723 | 13,301 | 7,943 | 22,996 | |||||||||
Other land development revenues | (3,574 | ) | (1,781 | ) | (9,612 | ) | (4,748 | ) | |||||
Other land development expenses | 2,338 | 2,977 | 7,132 | 7,575 | |||||||||
Corporate general and administrative expenses | 9,736 | 16,480 | 35,331 | 46,081 | |||||||||
Organizational transformation and termination benefits | 8,289 | 2,633 | 29,188 | 14,021 | |||||||||
Depreciation and amortization | 60,925 | 60,194 | 170,652 | 189,496 | |||||||||
Write-offs of abandoned development projects and demolition costs | — | — | — | 1,596 | |||||||||
Impairment of real estate | — | 44,288 | — | 44,288 | |||||||||
Interest and other income | (13,296 | ) | (20,361 | ) | (34,773 | ) | (40,529 | ) | |||||
Gains on change in control of interests | (219,666 | ) | — | (337,377 | ) | — | |||||||
Interest expense | 30,882 | 31,597 | 86,849 | 88,473 | |||||||||
Amortization of mortgage procurement costs | 1,366 | 1,338 | 3,966 | 4,067 | |||||||||
Loss on extinguishment of debt | 19 | — | 3,995 | 2,843 | |||||||||
NOI related to noncontrolling interest (1) | (8,658 | ) | (10,583 | ) | (29,985 | ) | (30,737 | ) | |||||
NOI related to unconsolidated entities (2) | 41,378 | 51,738 | 132,565 | 160,467 | |||||||||
Net Operating Income (Non-GAAP) | $ | 146,117 | $ | 156,563 | $ | 433,957 | $ | 468,533 | |||||
(1) NOI related to noncontrolling interest: | |||||||||||||
Earnings from continuing operations attributable to noncontrolling interests (GAAP) | $ | (41,225 | ) | $ | (7,037 | ) | $ | (39,883 | ) | $ | (8,487 | ) | |
Exclude non-NOI activity from noncontrolling interests: | |||||||||||||
Land and non-rental activity, net | 652 | 3,565 | 1,753 | 4,943 | |||||||||
Interest and other income | 499 | 514 | 1,254 | 1,486 | |||||||||
Depreciation and amortization | (6,462 | ) | (6,079 | ) | (19,393 | ) | (19,628 | ) | |||||
Amortization of mortgage procurement costs | (239 | ) | (353 | ) | (900 | ) | (981 | ) | |||||
Interest expense and extinguishment of debt | (4,994 | ) | (4,585 | ) | (16,279 | ) | (12,119 | ) | |||||
Gain on disposition of rental properties and interest in unconsolidated entities | 43,111 | 3,392 | 43,463 | 4,049 | |||||||||
NOI related to noncontrolling interest | $ | (8,658 | ) | $ | (10,583 | ) | $ | (29,985 | ) | $ | (30,737 | ) | |
(2) NOI related to unconsolidated entities: | |||||||||||||
Equity in earnings (GAAP) | $ | 7,369 | $ | 8,295 | $ | 12,038 | $ | 23,834 | |||||
Exclude non-NOI activity from unconsolidated entities: | |||||||||||||
Land and non-rental activity, net | (907 | ) | (4,001 | ) | (1,857 | ) | (5,580 | ) | |||||
Interest and other income | (194 | ) | (2,117 | ) | (2,651 | ) | (4,093 | ) | |||||
Write offs of abandoned development projects and demolition costs | — | 1,179 | 6,282 | 1,926 | |||||||||
Depreciation and amortization | 17,369 | 23,736 | 58,592 | 69,123 | |||||||||
Amortization of mortgage procurement costs | 393 | 822 | 1,497 | 2,462 | |||||||||
Interest expense and extinguishment of debt | 17,348 | 23,824 | 58,664 | 72,795 | |||||||||
NOI related to unconsolidated entities | $ | 41,378 | $ | 51,738 | $ | 132,565 | $ | 160,467 | |||||
Three Months Ended September 30, | Nine Months Ended September 30, | ||||||||||||||
2018 | 2017 | % Change | 2018 | 2017 | % Change | ||||||||||
(in thousands) | (in thousands) | ||||||||||||||
Net earnings attributable to Forest City Realty Trust, Inc. (GAAP) | $ | 447,173 | $ | 5,454 | $ | 715,432 | $ | 103,124 | |||||||
Depreciation and Amortization—real estate | 70,847 | 77,164 | 207,198 | 236,913 | |||||||||||
Gain on change in control of interests | (219,666 | ) | — | (337,377 | ) | — | |||||||||
Gain on disposition of rental properties | (199,324 | ) | (25,180 | ) | (306,215 | ) | (91,498 | ) | |||||||
Impairment of depreciable rental properties | — | 54,888 | — | 54,888 | |||||||||||
Income tax expense (benefit) adjustment: | |||||||||||||||
Gain on disposition of rental properties | (234 | ) | 232 | 738 | 4,874 | ||||||||||
FFO attributable to Forest City Realty Trust, Inc. (Non-GAAP) | $ | 98,796 | $ | 112,558 | (12.2)% | $ | 279,776 | $ | 308,301 | (9.3)% | |||||
Write-offs of abandoned development projects and demolition costs | — | 1,179 | 6,282 | 3,522 | |||||||||||
Tax credit income | (3,430 | ) | (3,916 | ) | (10,854 | ) | (9,128 | ) | |||||||
Loss on extinguishment of debt | 19 | — | 3,495 | 4,468 | |||||||||||
Change in fair market value of nondesignated hedges | (613 | ) | 416 | (3,162 | ) | (1,387 | ) | ||||||||
Straight-line rent adjustments | (4,569 | ) | (2,797 | ) | (12,752 | ) | (9,732 | ) | |||||||
Participation payments | 26 | — | 1,160 | — | |||||||||||
Organizational transformation and termination benefits | 8,289 | 2,633 | 29,188 | 14,021 | |||||||||||
Income tax expense on FFO | 3,581 | 72 | 3,983 | 135 | |||||||||||
Operating FFO attributable to Forest City Realty Trust, Inc. (Non-GAAP) | $ | 102,099 | $ | 110,145 | (7.3)% | $ | 297,116 | $ | 310,200 | (4.2)% | |||||
Numerator Adjustments (in thousands): | |||||||||||||||
If-Converted Method (adjustments for interest): | |||||||||||||||
4.250% Notes due 2018 | 380 | 778 | 1,936 | 2,334 | |||||||||||
3.625% Notes due 2020 | 330 | 363 | 1,055 | 1,088 | |||||||||||
Total Adjustments | $ | 710 | $ | 1,141 | $ | 2,991 | $ | 3,422 | |||||||
FFO attributable to Forest City Realty Trust, Inc. (If-Converted) | $ | 99,506 | $ | 113,699 | $ | 282,767 | $ | 311,723 | |||||||
Operating FFO attributable to Forest City Realty Trust, Inc. (If-Converted) | $ | 102,809 | $ | 111,286 | $ | 300,107 | $ | 313,622 | |||||||
Denominator: | |||||||||||||||
Weighted average shares outstanding—Basic | 267,978,704 | 265,260,403 | 266,468,193 | 261,566,151 | |||||||||||
Effect of stock options, restricted stock and performance shares | 1,624,820 | 1,735,881 | 1,206,632 | 1,458,634 | |||||||||||
Effect of convertible debt | 3,326,824 | 5,153,214 | 4,637,923 | 5,153,242 | |||||||||||
Effect of convertible 2006 Class A Common Units | 1,111,044 | 1,566,465 | 1,111,044 | 1,757,072 | |||||||||||
Weighted average shares outstanding - Diluted | 274,041,392 | 273,715,963 | 273,423,792 | 269,935,099 | |||||||||||
FFO Per Share - Diluted | $ | 0.36 | $ | 0.42 | (14.3)% | $ | 1.03 | $ | 1.15 | (10.4)% | |||||
Operating FFO Per Share - Diluted | $ | 0.38 | $ | 0.41 | (7.3)% | $ | 1.10 | $ | 1.16 | (5.2)% | |||||
Three Months Ended September 30, | Nine Months Ended September 30, | ||||||||||||
2018 | 2017 | 2018 | 2017 | ||||||||||
(in thousands) | |||||||||||||
Net earnings attributable to Forest City Realty Trust, Inc. (GAAP) | $ | 447,173 | $ | 5,454 | $ | 715,432 | $ | 103,124 | |||||
Depreciation and amortization (1) | 71,832 | 77,851 | 209,851 | 238,991 | |||||||||
Interest expense (2) | 43,236 | 50,836 | 129,734 | 147,524 | |||||||||
Amortization of mortgage procurement costs | 1,520 | 1,807 | 4,563 | 5,548 | |||||||||
Income tax expense | 3,347 | 304 | 4,721 | 5,009 | |||||||||
Impairment of real estate | — | 54,888 | — | 54,888 | |||||||||
Net gain on disposition of rental properties | (199,324 | ) | (25,180 | ) | (306,215 | ) | (91,498 | ) | |||||
Gain on change in control of interests | (219,666 | ) | — | (337,377 | ) | — | |||||||
EBITDAre attributable to Forest City Realty Trust, Inc. (Non-GAAP) | $ | 148,118 | $ | 165,960 | $ | 420,709 | $ | 463,586 | |||||
Loss on extinguishment of debt | 19 | — | 3,495 | 4,468 | |||||||||
Organizational transformation and termination benefits | 8,289 | 2,633 | 29,188 | 14,021 | |||||||||
Adjusted EBITDA (Non-GAAP) | $ | 156,426 | $ | 168,593 | $ | 453,392 | $ | 482,075 | |||||
As of September 30, | As of September 30, | ||||||||||||
2018 | 2017 | 2018 | 2017 | ||||||||||
(in thousands) | |||||||||||||
Nonrecourse mortgage debt and notes payable, net | $ | 4,259,161 | $ | 4,939,820 | $ | 4,259,161 | $ | 4,939,820 | |||||
Nonrecourse mortgage debt, net, on assets held for sale | 9,521 | — | 9,521 | — | |||||||||
Revolving credit facility | — | — | — | — | |||||||||
Term loan, net | 333,967 | 333,568 | 333,967 | 333,568 | |||||||||
Convertible senior debt, net | 31,802 | 112,523 | 31,802 | 112,523 | |||||||||
Total debt | $ | 4,634,451 | $ | 5,385,911 | $ | 4,634,451 | $ | 5,385,911 | |||||
Less cash and cash equivalents | (521,411 | ) | (226,353 | ) | (521,411 | ) | (226,353 | ) | |||||
Net Debt | $ | 4,113,040 | $ | 5,159,558 | $ | 4,113,040 | $ | 5,159,558 | |||||
Net Debt to Adjusted EBITDA (Annualized) | 6.6 | x | 7.7 | x | 6.8 | x | 8.0 | x | |||||
(1) | The following table provides detail of depreciation expense: |
Three Months Ended September 30, | Nine Months Ended September 30, | ||||||||||||
2018 | 2017 | 2018 | 2017 | ||||||||||
(in thousands) | |||||||||||||
Full Consolidation | $ | 60,925 | $ | 60,194 | $ | 170,652 | $ | 189,496 | |||||
Noncontrolling interest | (6,462 | ) | (6,079 | ) | (19,393 | ) | (19,628 | ) | |||||
Unconsolidated | 17,369 | 23,736 | 58,592 | 69,123 | |||||||||
Company Share | 71,832 | 77,851 | 209,851 | 238,991 | |||||||||
Non-Real Estate | (985 | ) | (687 | ) | (2,653 | ) | (2,078 | ) | |||||
Real Estate at Company share | $ | 70,847 | $ | 77,164 | $ | 207,198 | $ | 236,913 | |||||
(2) | The following table provides detail of interest expense: |
Three Months Ended September 30, | Nine Months Ended September 30, | ||||||||||||
2018 | 2017 | 2018 | 2017 | ||||||||||
(in thousands) | |||||||||||||
Full consolidation | $ | 30,882 | $ | 31,597 | $ | 86,849 | $ | 88,473 | |||||
Noncontrolling interest | (4,994 | ) | (4,585 | ) | (15,300 | ) | (12,119 | ) | |||||
Unconsolidated entities at Company share | 17,348 | 23,824 | 58,185 | 71,170 | |||||||||
Company share | $ | 43,236 | $ | 50,836 | $ | 129,734 | $ | 147,524 | |||||
Three Months Ended September 30, | Nine Months Ended September 30, | ||||||||||||
2018 | 2017 | 2018 | 2017 | ||||||||||
(in thousands) | |||||||||||||
NOI attributable to Forest City Realty Trust, Inc. | $ | 146,117 | $ | 156,563 | $ | 433,957 | $ | 468,533 | |||||
Land sales | 18,836 | 36,191 | 47,248 | 82,374 | |||||||||
Other land development revenues | 3,217 | 1,753 | 9,044 | 4,818 | |||||||||
Cost of land sales | (12,793 | ) | (27,477 | ) | (31,381 | ) | (60,064 | ) | |||||
Other land development expenses | (2,206 | ) | (2,742 | ) | (6,545 | ) | (7,006 | ) | |||||
Corporate general and administrative expenses | (9,736 | ) | (16,480 | ) | (35,331 | ) | (46,081 | ) | |||||
Interest and other income | 12,991 | 21,964 | 36,170 | 43,136 | |||||||||
Interest expense | (43,236 | ) | (50,836 | ) | (129,734 | ) | (147,524 | ) | |||||
Amortization of mortgage procurement costs | (1,520 | ) | (1,807 | ) | (4,563 | ) | (5,548 | ) | |||||
Non-real estate depreciation and amortization | (985 | ) | (687 | ) | (2,653 | ) | (2,078 | ) | |||||
Tax credit income | (3,430 | ) | (3,916 | ) | (10,854 | ) | (9,128 | ) | |||||
Change in fair market value of nondesignated hedges | (613 | ) | 416 | (3,162 | ) | (1,387 | ) | ||||||
Straight-line rent adjustments | (4,569 | ) | (2,797 | ) | (12,752 | ) | (9,732 | ) | |||||
Participation payments | 26 | — | 1,160 | — | |||||||||
Net gain (loss) on sale of development project | — | — | 6,512 | (113 | ) | ||||||||
Operating FFO attributable to Forest City Realty Trust, Inc. | $ | 102,099 | $ | 110,145 | $ | 297,116 | $ | 310,200 | |||||
Cost at Completion (b) | Cost Incurred to Date (c) | ||||||||||||||||||||||||||||
Anticipated | Legal | Cost at | Cost at | ||||||||||||||||||||||||||
Opening | Ownership | Company | Cost | Company | Cost | Company | No. of | Lease % | |||||||||||||||||||||
Location | Date | (a) | % (a) | at 100% | Share | at 100% | Share | Units | GLA | (d) | |||||||||||||||||||
(in millions) | |||||||||||||||||||||||||||||
Projects Under Construction | |||||||||||||||||||||||||||||
Apartments: | |||||||||||||||||||||||||||||
Ballston Quarter Residential (e) | Arlington, VA | Q4-18/Q1-19 | 51 | % | (f) | 51 | % | $ | 173.6 | $ | 88.5 | $ | 129.2 | $ | 67.6 | 406 | 53,000 | ||||||||||||
Aster Conservatory Green North | Denver, CO | Q1-19 | 0 | % | (g) | 0 | % | 60.7 | 0.0 | 27.1 | 0.0 | 256 | — | ||||||||||||||||
The Yards - The Guild | Washington, D.C. | Q1-19 | 0 | % | (g) | 0 | % | 94.9 | 0.0 | 72.7 | 0.0 | 191 | 6,000 | ||||||||||||||||
Capper 769 | Washington, D.C. | Q1-19 | 25 | % | (f) | 25 | % | 72.2 | 18.0 | 46.8 | 12.3 | 179 | — | ||||||||||||||||
The Yards - L2 | Washington, D.C. | Q1-20 | 0 | % | (g) | 0 | % | 134.5 | 0.0 | 52.0 | 0.0 | 264 | 14,000 | ||||||||||||||||
VYV East Tower | Jersey City, NJ | Q4-20 | 50 | % | (f) | 50 | % | 228.8 | 114.4 | 43.8 | 23.6 | 432 | 19,000 | ||||||||||||||||
$ | 764.7 | $ | 220.9 | $ | 371.6 | $ | 103.5 | 1,728 | 92,000 | ||||||||||||||||||||
Retail: | |||||||||||||||||||||||||||||
Ballston Quarter Redevelopment | Arlington, VA | Q4-18 | 51 | % | (f) | 51 | % | $ | 115.6 | $ | 58.9 | $ | 103.5 | $ | 59.2 | — | 307,000 | 72 | % | ||||||||||
Total Projects Under Construction (h) | $ | 880.3 | $ | 279.8 | $ | 475.1 | $ | 162.7 | 1,728 | 399,000 | |||||||||||||||||||
Estimated Initial Yield on Cost (i): | 5.7% - 6.2% | ||||||||||||||||||||||||||||
Cost at Completion (b) | ||||||||||||||||||||||
Date | Legal | Cost | Cost at | No. of | ||||||||||||||||||
Location | Opened | Ownership (a) | Company % (a) | at 100% | Company Share | Units | GLA | Lease % (d) | ||||||||||||||
(in millions) | ||||||||||||||||||||||
2018 Property Openings | ||||||||||||||||||||||
Apartments: | ||||||||||||||||||||||
Mint Town Center | Denver, CO | Q4-17/Q3-18 | 88 | % | 88 | % | $ | 94.8 | $ | 83.4 | 399 | 7,000 | 36 | % | ||||||||
Arizona State Retirement System Joint Venture: | ||||||||||||||||||||||
Ardan | Dallas, TX | Q2-18/Q4-18 (j) | 30 | % | 30 | % | 121.8 | 38.0 | 389 | 4,250 | 16 | % | ||||||||||
Axis | Los Angeles, CA | Q3-17/Q2-18 | 30 | % | 30 | % | 141.7 | 43.1 | 391 | 15,000 | 56 | % | ||||||||||
Total Property Openings | $ | 358.3 | $ | 164.5 | 1,179 | 26,250 | ||||||||||||||||
(a) | The Company invests in certain real estate projects through joint ventures and, at times, may provide funding at percentages that differ from the Company’s legal ownership. |
(b) | Represents estimated project costs to achieve stabilization, at 100% and the Company’s share, respectively. Amounts exclude capitalized interest not allocated to the underlying joint venture. |
(c) | Represents total capitalized project costs incurred to date, at 100% and the Company’s share, respectively, including all capitalized interest related to the development project. |
(d) | Lease commitments as of October 25, 2018. |
(e) | The amenity retail component is expected to open Q4-18. As of October 25, 2018, the lease commitment related to this was 30%. |
(f) | Reported under the equity method of accounting. This method represents a GAAP measure for investments in which the Company is not deemed to have control or to be the primary beneficiary of its investments in a VIE. |
(g) | Represents an apartment community under construction in which the Company has a 0% legal ownership interest. However, the Company is the project developer, on a fee basis. In addition, the Company has issued a project completion guarantee to the first mortgagee and is funding a portion of the construction costs through a mezzanine loan to the owner. As a result, the Company determined it was the primary beneficiary of this variable interest entity and has consolidated the project. The Company has an exclusive option to purchase the constructed asset for an amount approximating cost at completion. |
(h) | Of the remaining project costs, the Company has undrawn construction loan commitments, net of construction payables, of $108.6 million at the company’s share ($296.4 million at 100%). |
(i) | Range of estimated initial yield on cost for projects under construction is calculated using estimated company-share initial stabilized NOI divided by the company’s share of project cost per above, net of anticipated subsidies and other cost adjustments. |
(j) | Opened in October 2018. |
1) | Pacific Park Brooklyn - Brooklyn, NY |
2) | The Yards - Washington, D.C. |
Developable Square Feet | Square Feet at 100% | Square Feet at Company Share | ||||||||||||||||||||||
Office | Apartments | Retail | Other | Total | Office | Apartments | Retail | Other | Total | Projects under development balance | ||||||||||||||
Development Projects - Core Markets | (in thousands) | |||||||||||||||||||||||
Pacific Park Brooklyn - Brooklyn, NY | 1,068,190 | 3,858,724 | — | 944,877 | 5,871,791 | 53,410 | 192,936 | — | 47,244 | 293,590 | $ | — | ||||||||||||
The Yards - Washington, D.C. | 1,838,702 | 1,686,963 | 224,009 | 213,421 | 3,963,095 | 1,838,702 | 1,686,963 | 224,009 | 213,421 | 3,963,095 | 68,874 | |||||||||||||
Waterfront Station - Washington, D.C. | — | 634,441 | 57,949 | — | 692,390 | — | 285,498 | 26,078 | — | 311,576 | 12,216 | |||||||||||||
Pier 70 - San Francisco, CA | 1,200,936 | 865,412 | 363,104 | 772,250 | 3,201,702 | 1,200,936 | 865,412 | 363,104 | 772,250 | 3,201,702 | 63,317 | |||||||||||||
5M - San Francisco, CA | 618,424 | 260,203 | 21,830 | — | 900,457 | 618,424 | 260,203 | 21,830 | — | 900,457 | 67,910 | |||||||||||||
Stapleton - Denver, CO | 3,564,444 | 2,022,222 | 200,000 | 270,000 | 6,056,666 | 3,208,000 | 1,820,000 | 180,000 | 243,000 | 5,451,000 | — | |||||||||||||
Hudson Exchange - Jersey City, NJ | — | 4,713,331 | 334,187 | — | 5,047,518 | — | 2,356,666 | 167,093 | — | 2,523,759 | — | |||||||||||||
Other | — | 935,000 | 230,000 | — | 1,165,000 | — | 467,500 | 230,000 | — | 697,500 | 6,617 | |||||||||||||
8,290,696 | 14,976,296 | 1,431,079 | 2,200,548 | 26,898,619 | 6,919,472 | 7,935,178 | 1,212,114 | 1,275,915 | 17,342,679 | $ | 218,934 | |||||||||||||
Development Projects - Non Core Markets | 1,590,895 | 374,217 | 99,744 | — | 2,064,856 | 1,590,895 | 374,217 | 99,744 | — | 2,064,856 | 26,905 | |||||||||||||
Total | 9,881,591 | 15,350,513 | 1,530,823 | 2,200,548 | 28,963,475 | 8,510,367 | 8,309,395 | 1,311,858 | 1,275,915 | 19,407,535 | $ | 245,839 | ||||||||||||
General Information | |
Definitions | |
Selected Financial Information | |
Asset, Liability and Equity Information | |
Revenue and Expense Information | |
Interest Expense Information | |
Capital Expenditures Information | |
Scheduled Maturities Schedule | |
Adjusted EBITDA and NOI by Segment - Fully Consolidated Entities, Noncontrolling Interest and Company Share of Unconsolidated Entities | |
• | The amounts shown in the Noncontrolling Interest and Company Share of Unconsolidated Entities columns were derived by applying our ownership percentage interest used to arrive at our share of net income during the period when applying the equity method of accounting and calculating income/loss to minority partners under noncontrolling interest accounting may not accurately depict the legal and economic implications of holding a non-controlling interest of an entity; and |
• | Other companies in our industry may calculate their total company ownership amounts differently than we do, limiting the usefulness as a comparative measure. |
September 30, 2018 | |||||||||
Full Consolidation (GAAP) | Noncontrolling Interest | Company Share of Unconsolidated Investments | |||||||
(in thousands) | |||||||||
Assets | |||||||||
Real Estate | |||||||||
Completed rental properties | |||||||||
Office | $ | 4,097,095 | $ | 108,208 | $ | 72,814 | |||
Apartments | 2,495,930 | 289,185 | 971,775 | ||||||
Retail | 88,658 | — | 1,161,372 | ||||||
Total Operations | 6,681,683 | 397,393 | 2,205,961 | ||||||
Recently-Opened Properties/Redevelopment | 713,595 | 318,548 | 214,255 | ||||||
Corporate | 18,172 | — | — | ||||||
Total completed rental properties | 7,413,450 | 715,941 | 2,420,216 | ||||||
Projects under construction | |||||||||
Office | — | — | — | ||||||
Apartments | 188,044 | 186,647 | 133,805 | ||||||
Retail | — | — | 59,138 | ||||||
Total projects under construction | 188,044 | 186,647 | 192,943 | ||||||
Projects under development | |||||||||
Office | 124,218 | — | 3,681 | ||||||
Apartments | 123,630 | 10,017 | 3,007 | ||||||
Retail | — | — | 1,320 | ||||||
Total projects under development | 247,848 | 10,017 | 8,008 | ||||||
Total projects under construction and development | 435,892 | 196,664 | 200,951 | ||||||
Land inventory | 72,885 | 6,892 | 597 | ||||||
Total Real Estate | 7,922,227 | 919,497 | 2,621,764 | ||||||
Less accumulated depreciation | (1,554,126 | ) | (108,021 | ) | (525,621 | ) | |||
Real Estate, net | 6,368,101 | 811,476 | 2,096,143 | ||||||
Cash and equivalents | 485,941 | 27,228 | 62,698 | ||||||
Restricted cash | 211,572 | 87,201 | 20,966 | ||||||
Accounts receivable, net | 224,788 | 6,388 | 47,096 | ||||||
Notes receivable | 423,737 | (96,277 | ) | 6,436 | |||||
Investments in and advances to unconsolidated entities | 533,482 | (65,223 | ) | (582,637 | ) | ||||
Lease procurement costs, net | 66,386 | 3,330 | 31,884 | ||||||
Prepaid expenses and other deferred costs, net | 59,274 | 4,910 | 10,080 | ||||||
Intangible assets, net | 174,051 | 12,213 | 2,266 | ||||||
Assets held for sale | 29,014 | 814 | — | ||||||
Total Assets | $ | 8,576,346 | $ | 792,060 | $ | 1,694,932 | |||
September 30, 2018 | |||||||||
Full Consolidation (GAAP) | Noncontrolling Interest | Company Share of Unconsolidated Investments | |||||||
(in thousands) | |||||||||
Liabilities and Equity | |||||||||
Liabilities | |||||||||
Nonrecourse mortgage debt and notes payable, net | |||||||||
Completed rental properties | |||||||||
Office | $ | 1,208,856 | $ | 28,380 | $ | 54,519 | |||
Apartments | 1,396,750 | 229,033 | 608,063 | ||||||
Retail | 29,000 | — | 798,875 | ||||||
Total Operations | 2,634,606 | 257,413 | 1,461,457 | ||||||
Recently-Opened Properties/Redevelopment | 419,611 | 198,376 | 129,658 | ||||||
Total completed rental properties | 3,054,217 | 455,789 | 1,591,115 | ||||||
Projects under construction | |||||||||
Office | — | — | — | ||||||
Apartments | 101,196 | 101,196 | 30,458 | ||||||
Retail | — | — | 30,586 | ||||||
Total projects under construction | 101,196 | 101,196 | 61,044 | ||||||
Projects under development | |||||||||
Office | — | — | — | ||||||
Apartments | 8,574 | — | — | ||||||
Retail | — | — | — | ||||||
Total projects under development | 8,574 | — | — | ||||||
Total projects under construction and development | 109,770 | 101,196 | 61,044 | ||||||
Land inventory | — | — | — | ||||||
Nonrecourse mortgage debt and notes payable, net | 3,163,987 | 556,985 | 1,652,159 | ||||||
Revolving credit facility | — | — | — | ||||||
Term loan, net | 333,967 | — | — | ||||||
Convertible senior debt, net | 31,802 | — | — | ||||||
Construction payables | 71,286 | 31,287 | 38,549 | ||||||
Operating accounts payable and accrued expenses | 494,730 | 48,914 | 106,549 | ||||||
Accrued derivative liability | 12,020 | 1,941 | 417 | ||||||
Total Accounts payable, accrued expenses and other liabilities | 578,036 | 82,142 | 145,515 | ||||||
Cash distributions and losses in excess of investments in unconsolidated entities | 84,810 | (23,212 | ) | (102,742 | ) | ||||
Liabilities on assets held for sale | 10,022 | 501 | — | ||||||
Total Liabilities | 4,202,624 | 616,416 | 1,694,932 | ||||||
Equity | |||||||||
Stockholders’ Equity | |||||||||
Stockholders’ equity before accumulated other comprehensive loss | 4,145,154 | — | — | ||||||
Accumulated other comprehensive loss | (3,750 | ) | — | — | |||||
Total Stockholders’ Equity | 4,141,404 | — | — | ||||||
Noncontrolling interest | 232,318 | 175,644 | — | ||||||
Total Equity | 4,373,722 | 175,644 | — | ||||||
Total Liabilities and Equity | $ | 8,576,346 | $ | 792,060 | $ | 1,694,932 | |||
Three Months Ended September 30, 2018 | Three Months Ended September 30, 2017 | ||||||||||||||||||
Full Consolidation (GAAP) | Noncontrolling Interest | Company Share of Unconsolidated Investments | Full Consolidation (GAAP) | Noncontrolling Interest | Company Share of Unconsolidated Investments | ||||||||||||||
(in thousands) | |||||||||||||||||||
Revenues | |||||||||||||||||||
Rental | $ | 167,551 | $ | 15,645 | $ | 51,689 | $ | 167,682 | $ | 17,546 | $ | 64,381 | |||||||
Tenant recoveries | 30,026 | 2,786 | 10,733 | 26,671 | 1,925 | 17,667 | |||||||||||||
Service and management fees | 1,911 | 62 | 1,369 | 8,152 | 51 | 2,004 | |||||||||||||
Parking and other | 10,822 | 1,107 | 3,936 | 9,253 | 958 | 4,752 | |||||||||||||
Land sales | 7,920 | 792 | 11,708 | 21,786 | 2,092 | 16,497 | |||||||||||||
Subsidized Senior Housing | — | — | — | — | — | 3,206 | |||||||||||||
Total revenues | 218,230 | 20,392 | 79,435 | 233,544 | 22,572 | 108,507 | |||||||||||||
Expenses | |||||||||||||||||||
Property operating and management | 66,337 | 7,418 | 19,965 | 71,961 | 7,541 | 26,419 | |||||||||||||
Real estate taxes | 25,105 | 3,349 | 5,853 | 21,748 | 2,423 | 9,131 | |||||||||||||
Ground rent | 4,235 | 48 | 629 | 3,837 | 49 | 2,635 | |||||||||||||
Cost of land sales | 2,723 | 267 | 10,337 | 13,301 | 1,305 | 15,481 | |||||||||||||
Subsidized Senior Housing operating | — | — | — | — | — | 1,996 | |||||||||||||
Corporate general and administrative | 9,736 | — | — | 16,480 | — | — | |||||||||||||
Organizational transformation and termination benefits | 8,289 | — | — | 2,633 | — | — | |||||||||||||
116,425 | 11,082 | 36,784 | 129,960 | 11,318 | 55,662 | ||||||||||||||
Depreciation and amortization | 60,925 | 6,462 | 17,369 | 60,194 | 6,079 | 23,736 | |||||||||||||
Write-offs of abandoned development projects and demolition costs | — | — | — | — | — | 1,179 | |||||||||||||
Impairment of real estate | — | — | — | 44,288 | — | 10,600 | |||||||||||||
Total expenses | 177,350 | 17,544 | 54,153 | 234,442 | 17,397 | 91,177 | |||||||||||||
Operating income | 40,880 | 2,848 | 25,282 | (898 | ) | 5,175 | 17,330 | ||||||||||||
Interest and other income | 13,296 | 499 | 194 | 20,361 | 514 | 2,117 | |||||||||||||
Net gain on disposition of interest in unconsolidated entities | — | — | 181,504 | — | — | 27,721 | |||||||||||||
Gain on change in control of interests | 219,666 | — | — | — | — | — | |||||||||||||
Interest expense | (30,882 | ) | (4,994 | ) | (17,348 | ) | (31,597 | ) | (4,585 | ) | (23,824 | ) | |||||||
Amortization of mortgage procurement costs | (1,366 | ) | (239 | ) | (393 | ) | (1,338 | ) | (353 | ) | (822 | ) | |||||||
Loss on extinguishment of debt | (19 | ) | — | — | — | — | — | ||||||||||||
Earnings (loss) before income taxes and earnings (loss) from unconsolidated entities | 241,575 | (1,886 | ) | 189,239 | (13,472 | ) | 751 | 22,522 | |||||||||||
Equity in earnings | 7,369 | — | (7,369 | ) | 8,295 | 2,894 | (5,401 | ) | |||||||||||
Net gain on disposition of interest in unconsolidated entities | 181,504 | — | (181,504 | ) | 28,828 | 1,107 | (27,721 | ) | |||||||||||
Impairment of real estate | — | — | — | (10,600 | ) | — | 10,600 | ||||||||||||
188,873 | — | (188,873 | ) | 26,523 | 4,001 | (22,522 | ) | ||||||||||||
Earnings (loss) before income taxes | 430,448 | (1,886 | ) | 366 | 13,051 | 4,752 | — | ||||||||||||
Current income tax expense of taxable REIT subsidiaries | 2,981 | — | 366 | 304 | — | — | |||||||||||||
Earnings (loss) before loss on disposal of real estate | 427,467 | (1,886 | ) | — | 12,747 | 4,752 | — | ||||||||||||
Net gain (loss) on disposition of rental properties, net of tax | 60,931 | 43,111 | — | (256 | ) | 2,285 | — | ||||||||||||
Net earnings | 488,398 | 41,225 | — | 12,491 | 7,037 | — | |||||||||||||
Noncontrolling interests, gross of tax | |||||||||||||||||||
Earnings from continuing operations attributable to noncontrolling interests | (41,225 | ) | (41,225 | ) | — | (7,037 | ) | (7,037 | ) | — | |||||||||
Net earnings attributable to Forest City Realty Trust, Inc. | $ | 447,173 | $ | — | $ | — | $ | 5,454 | $ | — | $ | — | |||||||
Nine Months Ended September 30, 2018 | Nine Months Ended September 30, 2017 | ||||||||||||||||||
Full Consolidation (GAAP) | Noncontrolling Interest | Company Share of Unconsolidated Investments | Full Consolidation (GAAP) | Noncontrolling Interest | Company Share of Unconsolidated Investments | ||||||||||||||
(in thousands) | |||||||||||||||||||
Revenues | |||||||||||||||||||
Rental | $ | 490,462 | $ | 49,665 | $ | 164,082 | $ | 496,095 | $ | 50,355 | $ | 191,950 | |||||||
Tenant recoveries | 85,245 | 7,859 | 37,080 | 80,735 | 5,790 | 53,002 | |||||||||||||
Service and management fees | 9,765 | 204 | 6,469 | 29,642 | 178 | 6,894 | |||||||||||||
Parking and other | 26,657 | 3,101 | 16,632 | 34,212 | 2,613 | 13,794 | |||||||||||||
Land sales | 23,359 | 2,334 | 26,223 | 45,308 | 3,999 | 41,065 | |||||||||||||
Subsidized Senior Housing | — | — | 1,903 | — | — | 22,684 | |||||||||||||
Total revenues | 635,488 | 63,163 | 252,389 | 685,992 | 62,935 | 329,389 | |||||||||||||
Expenses | |||||||||||||||||||
Property operating and management | 200,112 | 22,344 | 65,781 | 228,912 | 21,265 | 79,459 | |||||||||||||
Real estate taxes | 66,147 | 8,162 | 20,042 | 64,305 | 7,101 | 26,778 | |||||||||||||
Ground rent | 12,013 | 146 | 5,824 | 11,491 | 152 | 7,494 | |||||||||||||
Cost of land sales | 7,943 | 773 | 24,211 | 22,996 | 1,821 | 38,889 | |||||||||||||
Subsidized Senior Housing operating | — | — | 1,743 | — | — | 13,806 | |||||||||||||
Corporate general and administrative | 35,331 | — | — | 46,081 | — | — | |||||||||||||
Organizational transformation and termination benefits | 29,188 | — | — | 14,021 | — | — | |||||||||||||
350,734 | 31,425 | 117,601 | 387,806 | 30,339 | 166,426 | ||||||||||||||
Depreciation and amortization | 170,652 | 19,393 | 58,592 | 189,496 | 19,628 | 69,123 | |||||||||||||
Write-offs of abandoned development projects and demolition costs | — | — | 6,282 | 1,596 | — | 1,926 | |||||||||||||
Impairment of real estate | — | — | — | 44,288 | — | 10,600 | |||||||||||||
Total expenses | 521,386 | 50,818 | 182,475 | 623,186 | 49,967 | 248,075 | |||||||||||||
Operating income | 114,102 | 12,345 | 69,914 | 62,806 | 12,968 | 81,314 | |||||||||||||
Interest and other income | 34,773 | 1,254 | 2,651 | 40,529 | 1,486 | 4,093 | |||||||||||||
Net gain on disposition of interest in unconsolidated entities | — | — | 265,158 | — | — | 80,018 | |||||||||||||
Gain on change in control of interests | 337,377 | — | — | — | — | — | |||||||||||||
Interest expense | (86,849 | ) | (15,300 | ) | (58,185 | ) | (88,473 | ) | (12,119 | ) | (71,170 | ) | |||||||
Amortization of mortgage procurement costs | (3,966 | ) | (900 | ) | (1,497 | ) | (4,067 | ) | (981 | ) | (2,462 | ) | |||||||
Loss on extinguishment of debt | (3,995 | ) | (979 | ) | (479 | ) | (2,843 | ) | — | (1,625 | ) | ||||||||
Earnings (loss) before income taxes and earnings (loss) from unconsolidated entities | 391,442 | (3,580 | ) | 277,562 | 7,952 | 1,354 | 90,168 | ||||||||||||
Equity in earnings | 12,038 | — | (12,038 | ) | 23,834 | 3,084 | (20,750 | ) | |||||||||||
Net gain on disposition of interest in unconsolidated entities | 265,510 | 352 | (265,158 | ) | 81,782 | 1,764 | (80,018 | ) | |||||||||||
Impairment of real estate | — | — | — | (10,600 | ) | — | 10,600 | ||||||||||||
277,548 | 352 | (277,196 | ) | 95,016 | 4,848 | (90,168 | ) | ||||||||||||
Earnings (loss) before income taxes | 668,990 | (3,228 | ) | 366 | 102,968 | 6,202 | — | ||||||||||||
Current income tax expense of taxable REIT subsidiaries | 3,940 | — | 366 | 4,817 | — | — | |||||||||||||
Earnings (loss) before gain on disposal of real estate | 665,050 | (3,228 | ) | — | 98,151 | 6,202 | — | ||||||||||||
Net gain (loss) on disposition of interest in development project, net of tax | 6,227 | — | — | (113 | ) | — | — | ||||||||||||
Net gain on disposition of rental properties, net of tax | 84,038 | 43,111 | — | 13,573 | 2,285 | — | |||||||||||||
Net earnings | 755,315 | 39,883 | — | 111,611 | 8,487 | — | |||||||||||||
Noncontrolling interests, gross of tax | |||||||||||||||||||
Earnings from continuing operations attributable to noncontrolling interests | (39,883 | ) | (39,883 | ) | — | (8,487 | ) | (8,487 | ) | — | |||||||||
Net earnings attributable to Forest City Realty Trust, Inc. | $ | 715,432 | $ | — | $ | — | $ | 103,124 | $ | — | $ | — | |||||||
Three Months Ended September 30, 2018 | Three Months Ended September 30, 2017 | |||||||||||||||||
Full Consolidation (GAAP) | Noncontrolling Interest | Company Share of Unconsolidated Entities | Full Consolidation (GAAP) | Noncontrolling Interest | Company Share of Unconsolidated Entities | |||||||||||||
(in thousands) | ||||||||||||||||||
Amortization and mark-to-market adjustments of derivative instruments | $ | (181 | ) | $ | 4 | $ | — | $ | 958 | $ | 19 | $ | 9 | |||||
Interest incurred | 35,901 | 6,233 | 17,992 | 36,001 | 4,851 | 26,169 | ||||||||||||
Interest capitalized | (4,838 | ) | (1,243 | ) | (644 | ) | (5,362 | ) | (285 | ) | (2,354 | ) | ||||||
Net interest expense | $ | 30,882 | $ | 4,994 | $ | 17,348 | $ | 31,597 | $ | 4,585 | $ | 23,824 | ||||||
Nine Months Ended September 30, 2018 | Nine Months Ended September 30, 2017 | |||||||||||||||||
Full Consolidation (GAAP) | Noncontrolling Interest | Company Share of Unconsolidated Entities | Full Consolidation (GAAP) | Noncontrolling Interest | Company Share of Unconsolidated Entities | |||||||||||||
(in thousands) | ||||||||||||||||||
Amortization and mark-to-market adjustments of derivative instruments | $ | (1,791 | ) | $ | 40 | $ | — | $ | 131 | $ | 32 | $ | 9 | |||||
Interest incurred | 105,852 | 18,640 | 61,998 | 104,952 | 13,540 | 78,916 | ||||||||||||
Interest capitalized | (17,212 | ) | (3,380 | ) | (3,813 | ) | (16,610 | ) | (1,453 | ) | (7,755 | ) | ||||||
Net interest expense | $ | 86,849 | $ | 15,300 | $ | 58,185 | $ | 88,473 | $ | 12,119 | $ | 71,170 | ||||||
Nine Months Ended September 30, 2018 | Nine Months Ended September 30, 2017 | |||||||||||||||||
Full Consolidation (GAAP) | Noncontrolling Interest | Company Share of Unconsolidated Entities | Full Consolidation (GAAP) | Noncontrolling Interest | Company Share of Unconsolidated Entities | |||||||||||||
(in thousands) | ||||||||||||||||||
Operating properties: | ||||||||||||||||||
Office Segment | $ | 21,816 | $ | 161 | $ | 465 | $ | 15,246 | $ | 857 | $ | 441 | ||||||
Apartment Segment | 17,243 | 1,390 | 6,373 | 19,370 | 2,208 | 13,717 | ||||||||||||
Retail Segment | 1,054 | — | 3,960 | 475 | — | 11,435 | ||||||||||||
Total operating properties | 40,113 | 1,551 | 10,798 | 35,091 | 3,065 | 25,593 | ||||||||||||
Corporate Segment | 922 | — | — | 2,372 | — | — | ||||||||||||
Tenant improvements: | ||||||||||||||||||
Office Segment | 19,591 | 575 | 279 | 24,886 | 315 | 920 | ||||||||||||
Retail Segment | 958 | — | 4,750 | 2,598 | — | 10,968 | ||||||||||||
Total capital expenditures | $ | 61,584 | $ | 2,126 | $ | 15,827 | $ | 64,947 | $ | 3,380 | $ | 37,481 | ||||||
Year Ending December 31, 2018 | Year Ending December 31, 2019 | ||||||||||||||||||||||||
Full Consolidation | Noncontrolling Interest | Company Share of Unconsolidated Entities | Company Share | Full Consolidation | Noncontrolling Interest | Company Share of Unconsolidated Entities | Company Share | ||||||||||||||||||
Fixed: | |||||||||||||||||||||||||
Fixed-rate debt | $ | 7,513 | $ | 234 | $ | 65,759 | $ | 73,038 | $ | 124,239 | $ | 3,899 | $ | 73,756 | $ | 194,096 | |||||||||
Weighted average rate | 4.78 | % | 5.29 | % | 5.57 | % | 5.49 | % | 4.15 | % | 4.22 | % | 6.08 | % | 4.88 | % | |||||||||
Variable: | |||||||||||||||||||||||||
Variable-rate debt | 90,311 | 7,478 | 17,097 | 99,930 | 192,855 | 54,272 | 104,044 | 242,627 | |||||||||||||||||
Weighted average rate | 4.74 | % | 4.29 | % | 4.59 | % | 4.75 | % | 4.04 | % | 4.00 | % | 4.37 | % | 4.19 | % | |||||||||
Tax-Exempt | — | — | — | — | 8,500 | — | 20,000 | 28,500 | |||||||||||||||||
Weighted average rate | — | — | — | — | 4.63 | % | — | 3.15 | % | 3.59 | % | ||||||||||||||
Total variable-rate debt | 90,311 | 7,478 | 17,097 | 99,930 | 201,355 | 54,272 | 124,044 | 271,127 | |||||||||||||||||
Total Nonrecourse Debt | $ | 97,824 | $ | 7,712 | $ | 82,856 | $ | 172,968 | $ | 325,594 | $ | 58,171 | $ | 197,800 | $ | 465,223 | |||||||||
Weighted Average Rate | 4.74 | % | 4.32 | % | 5.37 | % | 5.06 | % | 4.10 | % | 4.02 | % | 4.88 | % | 4.44 | % | |||||||||
Year Ending December 31, 2020 | Year Ending December 31, 2021 | ||||||||||||||||||||||||
Full Consolidation | Noncontrolling Interest | Company Share of Unconsolidated Entities | Company Share | Full Consolidation | Noncontrolling Interest | Company Share of Unconsolidated Entities | Company Share | ||||||||||||||||||
Fixed: | |||||||||||||||||||||||||
Fixed-rate debt | $ | 132,265 | $ | 5,485 | $ | 83,650 | $ | 210,430 | $ | 170,940 | $ | 5,359 | $ | 8,540 | $ | 174,121 | |||||||||
Weighted average rate | 5.18 | % | 3.93 | % | 5.05 | % | 5.16 | % | 4.68 | % | 3.58 | % | 4.28 | % | 4.70 | % | |||||||||
Variable: | |||||||||||||||||||||||||
Variable-rate debt | 90,010 | — | 6,431 | 96,441 | 24,429 | — | 300 | 24,729 | |||||||||||||||||
Weighted average rate | 4.60 | % | — | 4.45 | % | 4.59 | % | 4.65 | % | — | 2.92 | % | 4.63 | % | |||||||||||
Tax-Exempt | — | — | — | — | — | — | — | — | |||||||||||||||||
Weighted average rate | — | — | — | — | — | — | — | — | |||||||||||||||||
Total variable-rate debt | 90,010 | — | 6,431 | 96,441 | 24,429 | — | 300 | 24,729 | |||||||||||||||||
Total Nonrecourse Debt | $ | 222,275 | $ | 5,485 | $ | 90,081 | $ | 306,871 | $ | 195,369 | $ | 5,359 | $ | 8,840 | $ | 198,850 | |||||||||
Weighted Average Rate | 4.95 | % | 3.93 | % | 5.01 | % | 4.98 | % | 4.68 | % | 3.58 | % | 4.23 | % | 4.69 | % | |||||||||
Year Ending December 31, 2022 | Thereafter | ||||||||||||||||||||||||
Full Consolidation | Noncontrolling Interest | Company Share of Unconsolidated Entities | Company Share | Full Consolidation | Noncontrolling Interest | Company Share of Unconsolidated Entities | Company Share | ||||||||||||||||||
Fixed: | |||||||||||||||||||||||||
Fixed-rate debt | $ | 208,477 | $ | 24,334 | $ | 85,980 | $ | 270,123 | $ | 1,377,611 | $ | 200,450 | $ | 1,064,845 | $ | 2,242,006 | |||||||||
Weighted average rate | 4.82 | % | 4.87 | % | 4.32 | % | 4.66 | % | 4.06 | % | 4.24 | % | 3.95 | % | 3.99 | % | |||||||||
Variable: | |||||||||||||||||||||||||
Variable-rate debt | 201 | — | — | 201 | 23,197 | — | — | 23,197 | |||||||||||||||||
Weighted average rate | 4.37 | % | — | — | 4.37 | % | 4.08 | % | — | — | 4.08 | % | |||||||||||||
Tax-Exempt | — | — | 24,683 | 24,683 | 752,974 | 265,918 | 112,094 | 599,150 | |||||||||||||||||
Weighted average rate | — | — | 2.46 | % | 2.46 | % | 2.47 | % | 2.42 | % | 3.06 | % | 2.61 | % | |||||||||||
Total variable-rate debt | 201 | — | 24,683 | 24,884 | 776,171 | 265,918 | 112,094 | 622,347 | |||||||||||||||||
Total Nonrecourse Debt | $ | 208,678 | $ | 24,334 | $ | 110,663 | $ | 295,007 | $ | 2,153,782 | $ | 466,368 | $ | 1,176,939 | $ | 2,864,353 | |||||||||
Weighted Average Rate | 4.82 | % | 4.87 | % | 3.90 | % | 4.47 | % | 3.51 | % | 3.20 | % | 3.87 | % | 3.70 | % | |||||||||
Total | |||||||||||||||||||||||||
Full Consolidation | Noncontrolling Interest | Company Share of Unconsolidated Entities | Company Share | ||||||||||||||||||||||
Fixed: | |||||||||||||||||||||||||
Fixed-rate debt | $ | 2,021,045 | $ | 239,761 | $ | 1,382,530 | $ | 3,163,814 | |||||||||||||||||
Weighted average rate | 4.27 | % | 4.28 | % | 4.24 | % | 4.26 | % | |||||||||||||||||
Variable: | |||||||||||||||||||||||||
Variable-rate debt | 421,003 | 61,750 | 127,872 | 487,125 | |||||||||||||||||||||
Weighted average rate | 4.35 | % | 4.04 | % | 4.40 | % | 4.40 | % | |||||||||||||||||
Tax-Exempt | 761,474 | 265,918 | 156,777 | 652,333 | |||||||||||||||||||||
Weighted average rate | 2.50 | % | 2.42 | % | 2.98 | % | 2.65 | % | |||||||||||||||||
Total variable-rate debt | 1,182,477 | 327,668 | 284,649 | 1,139,458 | |||||||||||||||||||||
Total Nonrecourse Debt | $ | 3,203,522 | $ | 567,429 | $ | 1,667,179 | $ | 4,303,272 | |||||||||||||||||
Net unamortized mortgage procurement costs | (29,513 | ) | (9,943 | ) | (15,020 | ) | (34,590 | ) | |||||||||||||||||
Total Nonrecourse Debt, net | $ | 3,174,009 | $ | 557,486 | $ | 1,652,159 | $ | 4,268,682 | |||||||||||||||||
Weighted Average Rate | 3.86 | % | 3.39 | % | 4.13 | % | 4.03 | % | |||||||||||||||||
Three Months Ended September 30, 2018 | |||||||||||||||||||||
Fully Consolidated Entities | Office | Apartments | Retail | Total Operations | Development | Corporate | Total | ||||||||||||||
(in thousands) | |||||||||||||||||||||
Revenues | |||||||||||||||||||||
Rental | $ | 93,557 | $ | 63,127 | $ | 1,771 | $ | 158,455 | $ | 9,096 | $ | — | $ | 167,551 | |||||||
Tenant recoveries | 25,874 | 2,752 | 1,156 | 29,782 | 244 | — | 30,026 | ||||||||||||||
Service and management fees | 444 | 199 | 653 | 1,296 | 615 | — | 1,911 | ||||||||||||||
Other revenues (includes Subsidized Senior Housing) | 2,568 | 3,346 | 1,398 | 7,312 | 11,430 | — | 18,742 | ||||||||||||||
122,443 | 69,424 | 4,978 | 196,845 | 21,385 | — | 218,230 | |||||||||||||||
Expenses | |||||||||||||||||||||
Property operating and management | (26,836 | ) | (26,493 | ) | (4,599 | ) | (57,928 | ) | (8,409 | ) | — | (66,337 | ) | ||||||||
Real estate taxes | (14,189 | ) | (8,082 | ) | (316 | ) | (22,587 | ) | (2,518 | ) | — | (25,105 | ) | ||||||||
Ground rent | (3,992 | ) | (484 | ) | (111 | ) | (4,587 | ) | 352 | — | (4,235 | ) | |||||||||
Other expenses (includes Subsidized Senior Housing) | — | — | — | — | (2,723 | ) | (18,025 | ) | (20,748 | ) | |||||||||||
(45,017 | ) | (35,059 | ) | (5,026 | ) | (85,102 | ) | (13,298 | ) | (18,025 | ) | (116,425 | ) | ||||||||
Less organizational transformation and termination benefits | — | — | — | — | — | 8,289 | 8,289 | ||||||||||||||
Interest and other income | — | — | — | — | — | 13,296 | 13,296 | ||||||||||||||
Adjusted EBITDA attributable to Fully Consolidated Entities | $ | 77,426 | $ | 34,365 | $ | (48 | ) | $ | 111,743 | $ | 8,087 | $ | 3,560 | $ | 123,390 | ||||||
Exclude: | |||||||||||||||||||||
Land sales | — | — | — | — | (7,920 | ) | — | (7,920 | ) | ||||||||||||
Other land development revenues | — | — | — | — | (3,574 | ) | — | (3,574 | ) | ||||||||||||
Cost of land sales | — | — | — | — | 2,723 | — | 2,723 | ||||||||||||||
Other land development expenses | — | — | — | — | 2,338 | — | 2,338 | ||||||||||||||
Corporate general and administrative expenses | — | — | — | — | — | 9,736 | 9,736 | ||||||||||||||
Interest and other income | — | — | — | — | — | (13,296 | ) | (13,296 | ) | ||||||||||||
Subtotal NOI exclusions | $ | — | $ | — | $ | — | $ | — | $ | (6,433 | ) | $ | (3,560 | ) | $ | (9,993 | ) | ||||
Net Operating Income attributable to Fully Consolidated Entities | $ | 77,426 | $ | 34,365 | $ | (48 | ) | $ | 111,743 | $ | 1,654 | $ | — | $ | 113,397 | ||||||
NOI exclusions per above | 9,993 | ||||||||||||||||||||
Depreciation and Amortization | (60,925 | ) | |||||||||||||||||||
Interest Expense | (30,882 | ) | |||||||||||||||||||
Amortization of mortgage procurement costs | (1,366 | ) | |||||||||||||||||||
Loss on extinguishment of debt | (19 | ) | |||||||||||||||||||
Net gain on disposition of interest in unconsolidated entities | — | ||||||||||||||||||||
Gains on change in control of interests | 219,666 | ||||||||||||||||||||
Organizational transformation and termination benefits | (8,289 | ) | |||||||||||||||||||
Earnings (loss) from unconsolidated entities | 188,873 | ||||||||||||||||||||
Earnings (loss) before income taxes | $ | 430,448 | |||||||||||||||||||
Margin % (based on Adjusted EBITDA) | 63.2 | % | 49.5 | % | (1.0 | )% | 56.8 | % | 37.8 | % | 0.0 | % | 56.5 | % | |||||||
Three Months Ended September 30, 2018 | |||||||||||||||||||||
Noncontrolling Interest | Office | Apartments | Retail | Total Operations | Development | Corporate | Total | ||||||||||||||
(in thousands) | |||||||||||||||||||||
Revenues | |||||||||||||||||||||
Rental | $ | 3,425 | $ | 8,908 | $ | — | $ | 12,333 | $ | 3,312 | $ | — | $ | 15,645 | |||||||
Tenant recoveries | 1,977 | 706 | — | 2,683 | 103 | — | 2,786 | ||||||||||||||
Service and management fees | — | 2 | — | 2 | 60 | — | 62 | ||||||||||||||
Other revenues (includes Subsidized Senior Housing) | 60 | 511 | — | 571 | 1,328 | — | 1,899 | ||||||||||||||
5,462 | 10,127 | — | 15,589 | 4,803 | — | 20,392 | |||||||||||||||
Expenses | |||||||||||||||||||||
Property operating and management | (1,792 | ) | (3,556 | ) | — | (5,348 | ) | (2,070 | ) | — | (7,418 | ) | |||||||||
Real estate taxes | (862 | ) | (1,226 | ) | — | (2,088 | ) | (1,261 | ) | — | (3,349 | ) | |||||||||
Ground rent | (81 | ) | 33 | — | (48 | ) | — | — | (48 | ) | |||||||||||
Other expenses (includes Subsidized Senior Housing) | — | — | — | — | (267 | ) | — | (267 | ) | ||||||||||||
(2,735 | ) | (4,749 | ) | — | (7,484 | ) | (3,598 | ) | — | (11,082 | ) | ||||||||||
Less organizational transformation and termination benefits | — | — | — | — | — | — | — | ||||||||||||||
Interest and other income | — | — | — | — | — | 499 | 499 | ||||||||||||||
Adjusted EBITDA attributable to Fully Consolidated Entities | $ | 2,727 | $ | 5,378 | $ | — | $ | 8,105 | $ | 1,205 | $ | 499 | $ | 9,809 | |||||||
Exclude: | |||||||||||||||||||||
Land sales | — | — | — | — | (792 | ) | — | (792 | ) | ||||||||||||
Other land development revenues | — | — | — | — | (357 | ) | — | (357 | ) | ||||||||||||
Cost of land sales | — | — | — | — | 267 | — | 267 | ||||||||||||||
Other land development expenses | — | — | — | — | 230 | — | 230 | ||||||||||||||
Corporate general and administrative expenses | — | — | — | — | — | — | — | ||||||||||||||
Interest and other income | — | — | — | — | — | (499 | ) | (499 | ) | ||||||||||||
Subtotal NOI exclusions | $ | — | $ | — | $ | — | $ | — | $ | (652 | ) | $ | (499 | ) | $ | (1,151 | ) | ||||
Net Operating Income attributable to Fully Consolidated Entities | $ | 2,727 | $ | 5,378 | $ | — | $ | 8,105 | $ | 553 | $ | — | $ | 8,658 | |||||||
NOI exclusions per above | 1,151 | ||||||||||||||||||||
Depreciation and Amortization | (6,462 | ) | |||||||||||||||||||
Interest Expense | (4,994 | ) | |||||||||||||||||||
Amortization of mortgage procurement costs | (239 | ) | |||||||||||||||||||
Loss on extinguishment of debt | — | ||||||||||||||||||||
Net gain on disposition of interest in unconsolidated entities | — | ||||||||||||||||||||
Gains on change in control of interests | — | ||||||||||||||||||||
Organizational transformation and termination benefits | — | ||||||||||||||||||||
Earnings (loss) from unconsolidated entities | — | ||||||||||||||||||||
Earnings (loss) before income taxes | $ | (1,886 | ) | ||||||||||||||||||
Margin % (based on Adjusted EBITDA) | 49.9 | % | 53.1 | % | 0.0 | % | 52.0 | % | 25.1 | % | 0.0 | % | 48.1 | % | |||||||
Three Months Ended September 30, 2018 | |||||||||||||||||||||
Company Share of Unconsolidated Entities | Office | Apartments | Retail | Total Operations | Development | Corporate | Total | ||||||||||||||
(in thousands) | |||||||||||||||||||||
Revenues | |||||||||||||||||||||
Rental | $ | 3,001 | $ | 24,657 | $ | 21,789 | $ | 49,447 | $ | 2,242 | $ | — | $ | 51,689 | |||||||
Tenant recoveries | 484 | 507 | 9,562 | 10,553 | 180 | — | 10,733 | ||||||||||||||
Service and management fees | (7 | ) | 1,342 | (23 | ) | 1,312 | 57 | — | 1,369 | ||||||||||||
Other revenues (includes Subsidized Senior Housing) | 247 | 1,198 | 2,397 | 3,842 | 11,802 | — | 15,644 | ||||||||||||||
3,725 | 27,704 | 33,725 | 65,154 | 14,281 | — | 79,435 | |||||||||||||||
Expenses | |||||||||||||||||||||
Property operating and management | (1,162 | ) | (8,547 | ) | (7,606 | ) | (17,315 | ) | (2,650 | ) | — | (19,965 | ) | ||||||||
Real estate taxes | (364 | ) | (2,068 | ) | (3,142 | ) | (5,574 | ) | (279 | ) | — | (5,853 | ) | ||||||||
Ground rent | (138 | ) | 833 | (1,324 | ) | (629 | ) | — | — | (629 | ) | ||||||||||
Other expenses (includes Subsidized Senior Housing) | — | — | — | — | (10,337 | ) | — | (10,337 | ) | ||||||||||||
(1,664 | ) | (9,782 | ) | (12,072 | ) | (23,518 | ) | (13,266 | ) | — | (36,784 | ) | |||||||||
Less organizational transformation and termination benefits | — | — | — | — | — | — | — | ||||||||||||||
Interest and other income | — | — | — | — | — | 194 | 194 | ||||||||||||||
Adjusted EBITDA attributable to Fully Consolidated Entities | $ | 2,061 | $ | 17,922 | $ | 21,653 | $ | 41,636 | $ | 1,015 | $ | 194 | $ | 42,845 | |||||||
Exclude: | |||||||||||||||||||||
Land sales | — | — | — | — | (11,708 | ) | — | (11,708 | ) | ||||||||||||
Other land development revenues | — | — | — | — | — | — | — | ||||||||||||||
Cost of land sales | — | — | — | — | 10,337 | — | 10,337 | ||||||||||||||
Other land development expenses | — | — | — | — | 98 | — | 98 | ||||||||||||||
Corporate general and administrative expenses | — | — | — | — | — | — | — | ||||||||||||||
Interest and other income | — | — | — | — | — | (194 | ) | (194 | ) | ||||||||||||
Subtotal NOI exclusions | $ | — | $ | — | $ | — | $ | — | $ | (1,273 | ) | $ | (194 | ) | $ | (1,467 | ) | ||||
Net Operating Income attributable to Fully Consolidated Entities | $ | 2,061 | $ | 17,922 | $ | 21,653 | $ | 41,636 | $ | (258 | ) | $ | — | $ | 41,378 | ||||||
NOI exclusions per above | 1,467 | ||||||||||||||||||||
Depreciation and Amortization | (17,369 | ) | |||||||||||||||||||
Interest Expense | (17,348 | ) | |||||||||||||||||||
Amortization of mortgage procurement costs | (393 | ) | |||||||||||||||||||
Loss on extinguishment of debt | — | ||||||||||||||||||||
Net gain on disposition of interest in unconsolidated entities | 181,504 | ||||||||||||||||||||
Gains on change in control of interests | — | ||||||||||||||||||||
Organizational transformation and termination benefits | — | ||||||||||||||||||||
Earnings (loss) from unconsolidated entities | (188,873 | ) | |||||||||||||||||||
Earnings (loss) before income taxes | $ | 366 | |||||||||||||||||||
Margin % (based on Adjusted EBITDA) | 55.3 | % | 64.7 | % | 64.2 | % | 63.9 | % | 7.1 | % | 0.0 | % | 53.9 | % | |||||||
Nine Months Ended September 30, 2018 | |||||||||||||||||||||
Fully Consolidated Entities | Office | Apartments | Retail | Total Operations | Development | Corporate | Total | ||||||||||||||
(in thousands) | |||||||||||||||||||||
Revenues | |||||||||||||||||||||
Rental | $ | 265,045 | $ | 194,118 | $ | 5,868 | $ | 465,031 | $ | 25,431 | $ | — | $ | 490,462 | |||||||
Tenant recoveries | 72,308 | 7,630 | 4,679 | 84,617 | 628 | — | 85,245 | ||||||||||||||
Service and management fees | 1,516 | 3,189 | 2,894 | 7,599 | 2,166 | — | 9,765 | ||||||||||||||
Other revenues (includes Subsidized Senior Housing) | 5,906 | 10,512 | 1,594 | 18,012 | 32,004 | — | 50,016 | ||||||||||||||
344,775 | 215,449 | 15,035 | 575,259 | 60,229 | — | 635,488 | |||||||||||||||
Expenses | |||||||||||||||||||||
Property operating and management | (80,362 | ) | (79,908 | ) | (11,277 | ) | (171,547 | ) | (28,565 | ) | — | (200,112 | ) | ||||||||
Real estate taxes | (39,073 | ) | (22,159 | ) | (1,055 | ) | (62,287 | ) | (3,860 | ) | — | (66,147 | ) | ||||||||
Ground rent | (10,179 | ) | (1,466 | ) | (332 | ) | (11,977 | ) | (36 | ) | — | (12,013 | ) | ||||||||
Other expenses (includes Subsidized Senior Housing) | — | — | — | — | (7,943 | ) | (64,519 | ) | (72,462 | ) | |||||||||||
(129,614 | ) | (103,533 | ) | (12,664 | ) | (245,811 | ) | (40,404 | ) | (64,519 | ) | (350,734 | ) | ||||||||
Less organizational transformation and termination benefits | — | — | — | — | — | 29,188 | 29,188 | ||||||||||||||
Write-offs of abandoned development projects and demolition costs | — | — | — | — | — | — | — | ||||||||||||||
Interest and other income | — | — | — | — | — | 34,773 | 34,773 | ||||||||||||||
Gain on disposition of interest in development project | — | — | — | — | 6,512 | — | 6,512 | ||||||||||||||
Adjusted EBITDA attributable to Fully Consolidated Entities | $ | 215,161 | $ | 111,916 | $ | 2,371 | $ | 329,448 | $ | 26,337 | $ | (558 | ) | $ | 355,227 | ||||||
Exclude: | |||||||||||||||||||||
Land sales | — | — | — | — | (23,359 | ) | — | (23,359 | ) | ||||||||||||
Other land development revenues | — | — | — | — | (9,612 | ) | — | (9,612 | ) | ||||||||||||
Cost of land sales | — | — | — | — | 7,943 | — | 7,943 | ||||||||||||||
Other land development expenses | — | — | — | — | 7,132 | — | 7,132 | ||||||||||||||
Corporate general and administrative expenses | — | — | — | — | — | 35,331 | 35,331 | ||||||||||||||
Write-offs of abandoned development projects and demolition costs | — | — | — | — | — | — | — | ||||||||||||||
Interest and other income | — | — | — | — | — | (34,773 | ) | (34,773 | ) | ||||||||||||
Gain on disposition of interest in development project | — | — | — | — | (6,512 | ) | — | (6,512 | ) | ||||||||||||
Subtotal NOI exclusions | $ | — | $ | — | $ | — | $ | — | $ | (24,408 | ) | $ | 558 | $ | (23,850 | ) | |||||
Net Operating Income attributable to Fully Consolidated Entities | $ | 215,161 | $ | 111,916 | $ | 2,371 | $ | 329,448 | $ | 1,929 | $ | — | $ | 331,377 | |||||||
NOI exclusions per above | 23,850 | ||||||||||||||||||||
Depreciation and Amortization | (170,652 | ) | |||||||||||||||||||
Interest Expense | (86,849 | ) | |||||||||||||||||||
Amortization of mortgage procurement costs | (3,966 | ) | |||||||||||||||||||
Loss on extinguishment of debt | (3,995 | ) | |||||||||||||||||||
Net gain on disposition of interest in unconsolidated entities | — | ||||||||||||||||||||
Gains on change in control of interests | 337,377 | ||||||||||||||||||||
Organizational transformation and termination benefits | (29,188 | ) | |||||||||||||||||||
Gain on disposition of interest in development project | (6,512 | ) | |||||||||||||||||||
Earnings (loss) from unconsolidated entities | 277,548 | ||||||||||||||||||||
Earnings (loss) before income taxes | $ | 668,990 | |||||||||||||||||||
Margin % (based on Adjusted EBITDA) | 62.4 | % | 51.9 | % | 15.8 | % | 57.3 | % | 43.7 | % | 0.0 | % | 55.9 | % | |||||||
Nine Months Ended September 30, 2018 | |||||||||||||||||||||
Noncontrolling Interest | Office | Apartments | Retail | Total Operations | Development | Corporate | Total | ||||||||||||||
(in thousands) | |||||||||||||||||||||
Revenues | |||||||||||||||||||||
Rental | $ | 10,199 | $ | 31,774 | $ | — | $ | 41,973 | $ | 7,692 | $ | — | $ | 49,665 | |||||||
Tenant recoveries | 5,815 | 1,820 | — | 7,635 | 224 | — | 7,859 | ||||||||||||||
Service and management fees | — | (2 | ) | — | (2 | ) | 206 | — | 204 | ||||||||||||
Other revenues (includes Subsidized Senior Housing) | 173 | 1,597 | — | 1,770 | 3,665 | — | 5,435 | ||||||||||||||
16,187 | 35,189 | — | 51,376 | 11,787 | — | 63,163 | |||||||||||||||
Expenses | |||||||||||||||||||||
Property operating and management | (5,366 | ) | (11,593 | ) | — | (16,959 | ) | (5,385 | ) | — | (22,344 | ) | |||||||||
Real estate taxes | (2,463 | ) | (3,706 | ) | — | (6,169 | ) | (1,993 | ) | — | (8,162 | ) | |||||||||
Ground rent | (241 | ) | 95 | — | (146 | ) | — | — | (146 | ) | |||||||||||
Other expenses (includes Subsidized Senior Housing) | — | — | — | — | (773 | ) | — | (773 | ) | ||||||||||||
(8,070 | ) | (15,204 | ) | — | (23,274 | ) | (8,151 | ) | — | (31,425 | ) | ||||||||||
Less organizational transformation and termination benefits | — | — | — | — | — | — | — | ||||||||||||||
Write-offs of abandoned development projects and demolition costs | — | — | — | — | — | — | — | ||||||||||||||
Interest and other income | — | — | — | — | — | 1,254 | 1,254 | ||||||||||||||
Gain on disposition of interest in development project | — | — | — | — | — | — | — | ||||||||||||||
Adjusted EBITDA attributable to Fully Consolidated Entities | $ | 8,117 | $ | 19,985 | $ | — | $ | 28,102 | $ | 3,636 | $ | 1,254 | $ | 32,992 | |||||||
Exclude: | |||||||||||||||||||||
Land sales | — | — | — | — | (2,334 | ) | — | (2,334 | ) | ||||||||||||
Other land development revenues | — | — | — | — | (959 | ) | — | (959 | ) | ||||||||||||
Cost of land sales | — | — | — | — | 773 | — | 773 | ||||||||||||||
Other land development expenses | — | — | — | — | 767 | — | 767 | ||||||||||||||
Corporate general and administrative expenses | — | — | — | — | — | — | — | ||||||||||||||
Write-offs of abandoned development projects and demolition costs | — | — | — | — | — | — | — | ||||||||||||||
Interest and other income | — | — | — | — | — | (1,254 | ) | (1,254 | ) | ||||||||||||
Gain on disposition of interest in development project | — | — | — | — | — | — | — | ||||||||||||||
Subtotal NOI exclusions | $ | — | $ | — | $ | — | $ | — | $ | (1,753 | ) | $ | (1,254 | ) | $ | (3,007 | ) | ||||
Net Operating Income attributable to Fully Consolidated Entities | $ | 8,117 | $ | 19,985 | $ | — | $ | 28,102 | $ | 1,883 | $ | — | $ | 29,985 | |||||||
NOI exclusions per above | 3,007 | ||||||||||||||||||||
Depreciation and Amortization | (19,393 | ) | |||||||||||||||||||
Interest Expense | (15,300 | ) | |||||||||||||||||||
Amortization of mortgage procurement costs | (900 | ) | |||||||||||||||||||
Loss on extinguishment of debt | (979 | ) | |||||||||||||||||||
Net gain on disposition of interest in unconsolidated entities | — | ||||||||||||||||||||
Gains on change in control of interests | — | ||||||||||||||||||||
Organizational transformation and termination benefits | — | ||||||||||||||||||||
Gain on disposition of interest in development project | — | ||||||||||||||||||||
Earnings (loss) from unconsolidated entities | 352 | ||||||||||||||||||||
Earnings (loss) before income taxes | $ | (3,228 | ) | ||||||||||||||||||
Margin % (based on Adjusted EBITDA) | 50.1 | % | 56.8 | % | 0.0% | 54.7 | % | 30.8 | % | 0.0 | % | 52.2 | % | ||||||||
Nine Months Ended September 30, 2018 | |||||||||||||||||||||
Company Share of Unconsolidated Entities | Office | Apartments | Retail | Total Operations | Development | Corporate | Total | ||||||||||||||
(in thousands) | |||||||||||||||||||||
Revenues | |||||||||||||||||||||
Rental | $ | 15,314 | $ | 71,461 | $ | 72,784 | $ | 159,559 | $ | 4,523 | $ | — | $ | 164,082 | |||||||
Tenant recoveries | 3,149 | 1,257 | 32,239 | 36,645 | 435 | — | 37,080 | ||||||||||||||
Service and management fees | 1,326 | 3,817 | 529 | 5,672 | 797 | — | 6,469 | ||||||||||||||
Other revenues (includes Subsidized Senior Housing) | 1,268 | 5,343 | 11,177 | 17,788 | 26,970 | — | 44,758 | ||||||||||||||
21,057 | 81,878 | 116,729 | 219,664 | 32,725 | — | 252,389 | |||||||||||||||
Expenses | |||||||||||||||||||||
Property operating and management | (5,668 | ) | (25,130 | ) | (27,313 | ) | (58,111 | ) | (7,670 | ) | — | (65,781 | ) | ||||||||
Real estate taxes | (2,080 | ) | (6,144 | ) | (11,165 | ) | (19,389 | ) | (653 | ) | — | (20,042 | ) | ||||||||
Ground rent | (2,443 | ) | 328 | (3,709 | ) | (5,824 | ) | — | — | (5,824 | ) | ||||||||||
Other expenses (includes Subsidized Senior Housing) | — | (1,743 | ) | — | (1,743 | ) | (24,211 | ) | — | (25,954 | ) | ||||||||||
(10,191 | ) | (32,689 | ) | (42,187 | ) | (85,067 | ) | (32,534 | ) | — | (117,601 | ) | |||||||||
Less organizational transformation and termination benefits | — | — | — | — | — | — | — | ||||||||||||||
Write-offs of abandoned development projects and demolition costs | — | — | — | — | (6,282 | ) | — | (6,282 | ) | ||||||||||||
Interest and other income | — | — | — | — | — | 2,651 | 2,651 | ||||||||||||||
Gain on disposition of interest in development project | — | — | — | — | — | — | — | ||||||||||||||
Adjusted EBITDA attributable to Fully Consolidated Entities | $ | 10,866 | $ | 49,189 | $ | 74,542 | $ | 134,597 | $ | (6,091 | ) | $ | 2,651 | $ | 131,157 | ||||||
Exclude: | |||||||||||||||||||||
Land sales | — | — | — | — | (26,223 | ) | — | (26,223 | ) | ||||||||||||
Other land development revenues | — | — | — | — | (391 | ) | — | (391 | ) | ||||||||||||
Cost of land sales | — | — | — | — | 24,211 | — | 24,211 | ||||||||||||||
Other land development expenses | — | — | — | — | 180 | — | 180 | ||||||||||||||
Corporate general and administrative expenses | — | — | — | — | — | — | — | ||||||||||||||
Write-offs of abandoned development projects and demolition costs | — | — | — | — | 6,282 | — | 6,282 | ||||||||||||||
Interest and other income | — | — | — | — | — | (2,651 | ) | (2,651 | ) | ||||||||||||
Gain on disposition of interest in development project | — | — | — | — | — | — | — | ||||||||||||||
Subtotal NOI exclusions | $ | — | $ | — | $ | — | $ | — | $ | 4,059 | $ | (2,651 | ) | $ | 1,408 | ||||||
Net Operating Income attributable to Fully Consolidated Entities | $ | 10,866 | $ | 49,189 | $ | 74,542 | $ | 134,597 | $ | (2,032 | ) | $ | — | $ | 132,565 | ||||||
NOI exclusions per above | (1,408 | ) | |||||||||||||||||||
Depreciation and Amortization | (58,592 | ) | |||||||||||||||||||
Interest Expense | (58,185 | ) | |||||||||||||||||||
Amortization of mortgage procurement costs | (1,497 | ) | |||||||||||||||||||
Loss on extinguishment of debt | (479 | ) | |||||||||||||||||||
Net gain on disposition of interest in unconsolidated entities | 265,158 | ||||||||||||||||||||
Gains on change in control of interests | — | ||||||||||||||||||||
Organizational transformation and termination benefits | — | ||||||||||||||||||||
Gain on disposition of interest in development project | — | ||||||||||||||||||||
Earnings (loss) from unconsolidated entities | (277,196 | ) | |||||||||||||||||||
Earnings (loss) before income taxes | $ | 366 | |||||||||||||||||||
Margin % (based on Adjusted EBITDA) | 51.6 | % | 60.1 | % | 63.9 | % | 61.3 | % | (18.6 | )% | 0.0 | % | 52.0 | % | |||||||