
October 13, 2026 2026 Third Quarter Earnings Presentation
1 Forward–looking statements Certain statements contained in this Presentation that are not historical in nature may be considered forward-looking statements within the meaning of the Private Securities Litigation Reform Act of 1995. Forward-looking statements represent the Company’s current expectations, plans or forecasts of its or its business segments’ future results, which may include, among other measures, revenue, liquidity, net interest income, other income, provision for credit losses, expenses, operating leverage, effective tax rate, efficiency ratio, capital measures, deposits and assets, as well as strategy, future business and economic conditions more generally, and other future matters. These statements can generally be identified by the use of the words and phrases “may,” “will,” “should,” “could,” “would,” “goal,” “plan,” “potential,” “estimate,” “project,” “believe,” “intend,” “anticipate,” “expect,” “target,” “aim,” “predict,” “continue,” “seek,” and other variations of such words and phrases and similar expressions. These forward-looking statements are not historical facts, and are based upon management’s current expectations, estimates, and projections, many of which, by their nature, are inherently uncertain and beyond the Company’s control. The inclusion of these forward-looking statements should not be regarded as a representation by the Company or any other person that such expectations, estimates, and projections will be achieved. Accordingly, the Company cautions shareholders and investors that any such forward-looking statements are not guarantees of future performance and are subject to risks, assumptions, and uncertainties that are difficult to predict. Actual results may prove to be materially different from the results expressed or implied by the forward-looking statements. A number of factors could cause actual results to differ materially from those contemplated by the forward-looking statements including, without limitation, (1) current and future economic conditions, including the effects of inflation, interest rate fluctuations, changes in the economy or global supply chain, supply-demand imbalances affecting local real estate prices, and high unemployment rates in the local or regional economies in which the Company operates and/or the US economy generally, (2) changes or the lack of changes in government interest rate policies and the associated impact on the Company’s business, net interest margin, funding costs, and mortgage operations, (3) increased competition for loans and deposits and the Company’s ability to sustain loan and deposit growth, (4) changes in the quality or composition of the Company’s loan or investment portfolios, including adverse developments in borrower industries or in the repayment ability of individual borrowers or issuers of investment securities, the impact of interest rates on the value of the Company’s investment securities portfolio, or the adequacy of the Company’s allowance for credit losses, (5) any deterioration in commercial real estate market fundamentals, (6) the Company’s ability to identify potential candidates for, consummate, and achieve synergies from acquisitions, including risks that cost savings and other synergies from completed or future acquisitions may not be realized (or may be less than or delayed from expectations), challenges in integrating acquired businesses, disruptions to customer, employee, or other relationships, diversion of management attention, and the ability to effectively manage larger or more complex operations post-transaction, (7) the Company’s ability to manage any unexpected outflows of uninsured deposits and to avoid selling investment securities or other assets at an unfavorable time or at a loss, (8) the Company’s ability to successfully execute its various business strategies, including its investments in talent and growth initiatives and the effect of those investments on expenses and operating leverage, (9) changes in state and federal legislation, regulations or policies applicable to banks and other financial service providers, and changes in accounting standards, (10) the effectiveness of the Company’s controls and procedures to detect, prevent, mitigate and otherwise manage the risk of fraud or misconduct by internal or external parties, including attempted physical-security and cybersecurity attacks, denial-of-service attacks, hacking, phishing, social-engineering attacks, malware intrusion, data-corruption attempts, system breaches, identity theft, ransomware attacks, environmental conditions, and intentional acts of destruction, (11) the Company’s dependence on information technology systems of third-party service providers and the risk of systems failures, interruptions, or breaches of security, (12) the impact, extent and timing of technological changes, including the adoption and use of artificial intelligence and other emerging technologies, (13) concentrations of credit or deposit exposure, (14) the impact of natural disasters, pandemics, acts or escalation of war or acts of terrorism, or other catastrophic events, (15) events giving rise to international or regional political instability, including the broader impacts of such events on financial markets and/or global macroeconomic environments, (16) the Company’s ability to attract and retain key employees in a competitive labor market, (17) the Company’s ability to access capital and liquidity on terms acceptable to the Company, to effectively deploy capital, including the proceeds of its recent subordinated debt issuance, and the amount and timing of any future share repurchases, (18) changes to the Company’s preliminary regulatory capital ratios as they are finalized, and/or (19) general competitive, economic, political, and market conditions. Further information regarding the Company and factors which could affect the forward-looking statements contained herein can be found in the Company’s Annual Report on Form 10-K for the fiscal year ended December 31, 2025, and in any of the Company’s subsequent filings with the SEC. Many of these factors are beyond the Company’s ability to control or predict. If one or more events related to these or other risks or uncertainties materialize, or if the underlying assumptions prove to be incorrect, actual results may differ materially from the forward-looking statements. Accordingly, shareholders and investors should not place undue reliance on any such forward-looking statements. Any forward-looking statement speaks only as of the date of this Presentation, and the Company undertakes no obligation to publicly update or review any forward-looking statement, whether as a result of new information, future developments or otherwise, except as required by law. New risks and uncertainties may emerge from time to time, and it is not possible for the Company to predict their occurrence or how they will affect the Company. The Company qualifies all forward-looking statements by these cautionary statements.
2 Use of non-GAAP financial measures This Presentation contains certain financial measures that are not measures recognized under U.S. generally accepted accounting principles (“GAAP”) and therefore are considered non-GAAP financial measures. These non-GAAP financial measures may include, without limitation, adjusted net income, adjusted diluted earnings per common share, adjusted pre-tax pre-provision net revenue, consolidated and segment adjusted revenue, consolidated and segment adjusted noninterest expense and adjusted noninterest income, consolidated and segment adjusted efficiency ratio (tax-equivalent basis), adjusted return on average assets and equity, and adjusted pre-tax pre-provision return on average assets. Each of these non-GAAP metrics excludes certain income and expense items that the Company’s management does not consider indicative of the Company's ongoing operating performance. The Company refers to these non-GAAP measures as adjusted measures. Also, the Company presents tangible assets, tangible common equity, tangible book value per common share, tangible common equity to tangible assets, on-balance sheet liquidity to tangible assets, return on average tangible common equity, and adjusted return on average tangible common equity. Each of these non-GAAP metrics excludes the impact of goodwill and other intangibles. The Company’s management uses these non-GAAP financial measures in their analysis of the Company’s performance, financial condition and the efficiency of its operations as management believes such measures facilitate period-to-period comparisons and provide meaningful indications of the Company’s operating performance as they eliminate both gains and charges that management views as non-recurring or not indicative of operating performance. Management believes that these non-GAAP financial measures provide a greater understanding of ongoing operations and enhance comparability of results with prior periods as well as demonstrate the effects of significant gains and charges excluded from the adjusted measures in the current and prior periods. The Company’s management also believes that investors find these non-GAAP financial measures useful as they assist investors in understanding the Company’s underlying operating performance and in the analysis of ongoing operating trends. In addition, because intangible assets such as goodwill and the other items excluded each vary extensively from company to company, the Company believes that the presentation of this information allows investors to more easily compare the Company’s results to the results of other companies. However, the non-GAAP financial measures discussed herein should not be considered in isolation or as a substitute for the most directly comparable or other financial measures calculated in accordance with GAAP. Moreover, the manner in which the Company calculates the non-GAAP financial measures discussed herein may differ from that of other companies reporting measures with similar names. Investors should understand how such other banking organizations calculate their financial measures with names similar to the non-GAAP financial measures the Company has discussed herein when comparing such non-GAAP financial measures. See the corresponding non-GAAP reconciliation tables below in this Presentation for additional discussion and reconciliation of these measures to the most directly comparable GAAP financial measures.
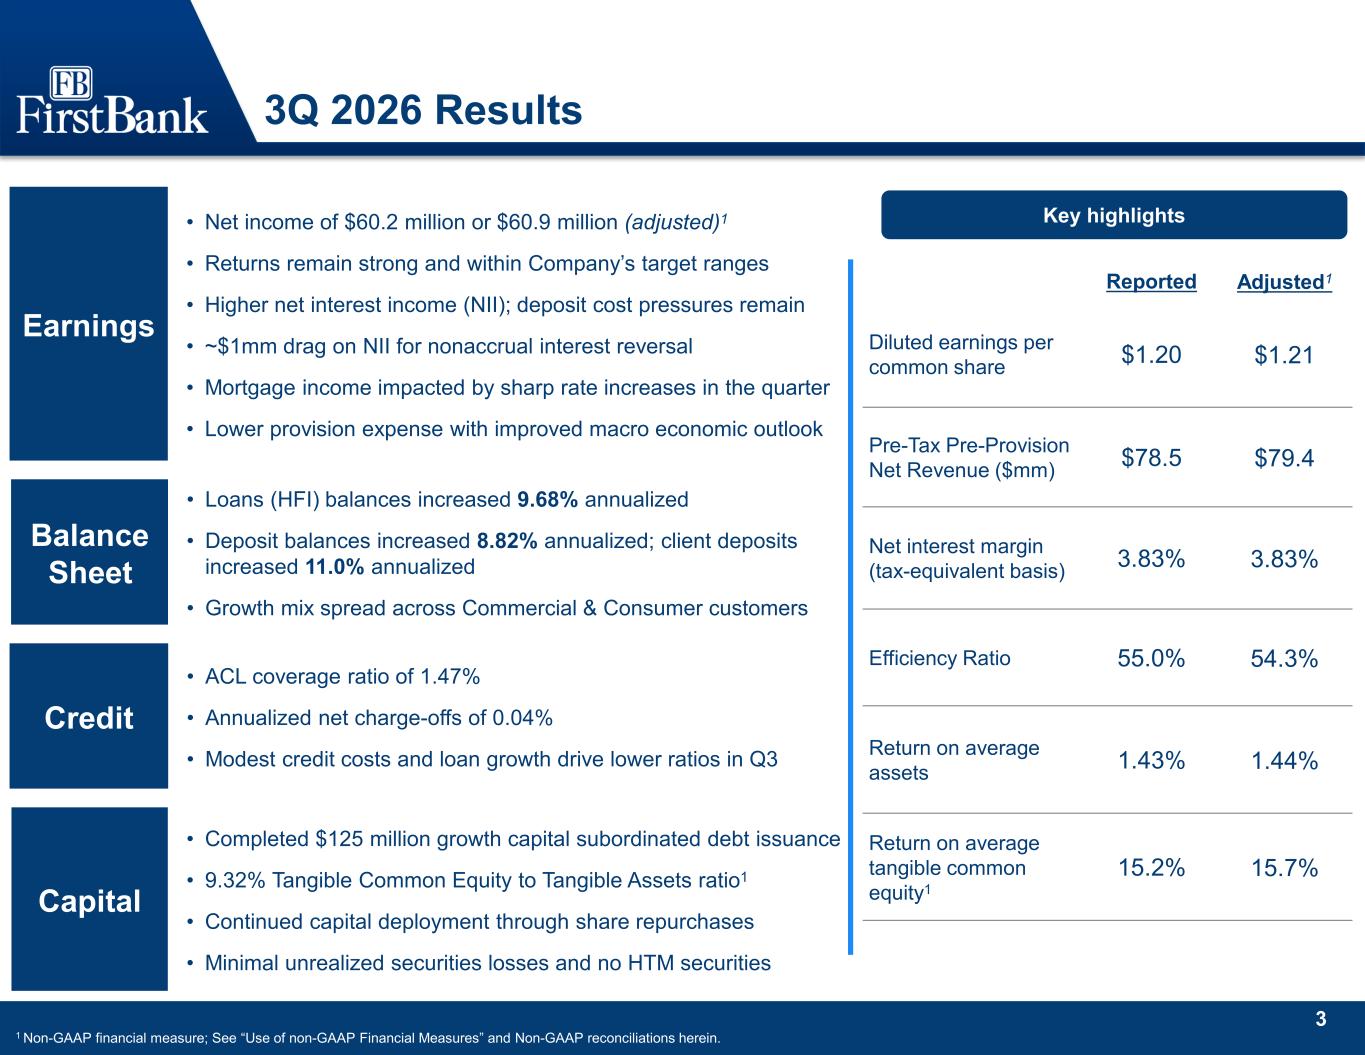
3 3Q 2026 Results 1 Non-GAAP financial measure; See “Use of non-GAAP Financial Measures” and Non-GAAP reconciliations herein. Key highlights Earnings • Net income of $60.2 million or $60.9 million (adjusted)1 • Returns remain strong and within Company’s target ranges • Higher net interest income (NII); deposit cost pressures remain • ~$1mm drag on NII for nonaccrual interest reversal • Mortgage income impacted by sharp rate increases in the quarter • Lower provision expense with improved macro economic outlook Balance Sheet • Loans (HFI) balances increased 9.68% annualized • Deposit balances increased 8.82% annualized; client deposits increased 11.0% annualized • Growth mix spread across Commercial & Consumer customers Credit • ACL coverage ratio of 1.47% • Annualized net charge-offs of 0.04% • Modest credit costs and loan growth drive lower ratios in Q3 Capital • Completed $125 million growth capital subordinated debt issuance • 9.32% Tangible Common Equity to Tangible Assets ratio1 • Continued capital deployment through share repurchases • Minimal unrealized securities losses and no HTM securities Reported Adjusted1 Diluted earnings per common share $1.20 $1.21 Pre-Tax Pre-Provision Net Revenue ($mm) $78.5 $79.4 Net interest margin (tax-equivalent basis) 3.83% 3.83% Efficiency Ratio 55.0% 54.3% Return on average assets 1.43% 1.44% Return on average tangible common equity1 15.2% 15.7%
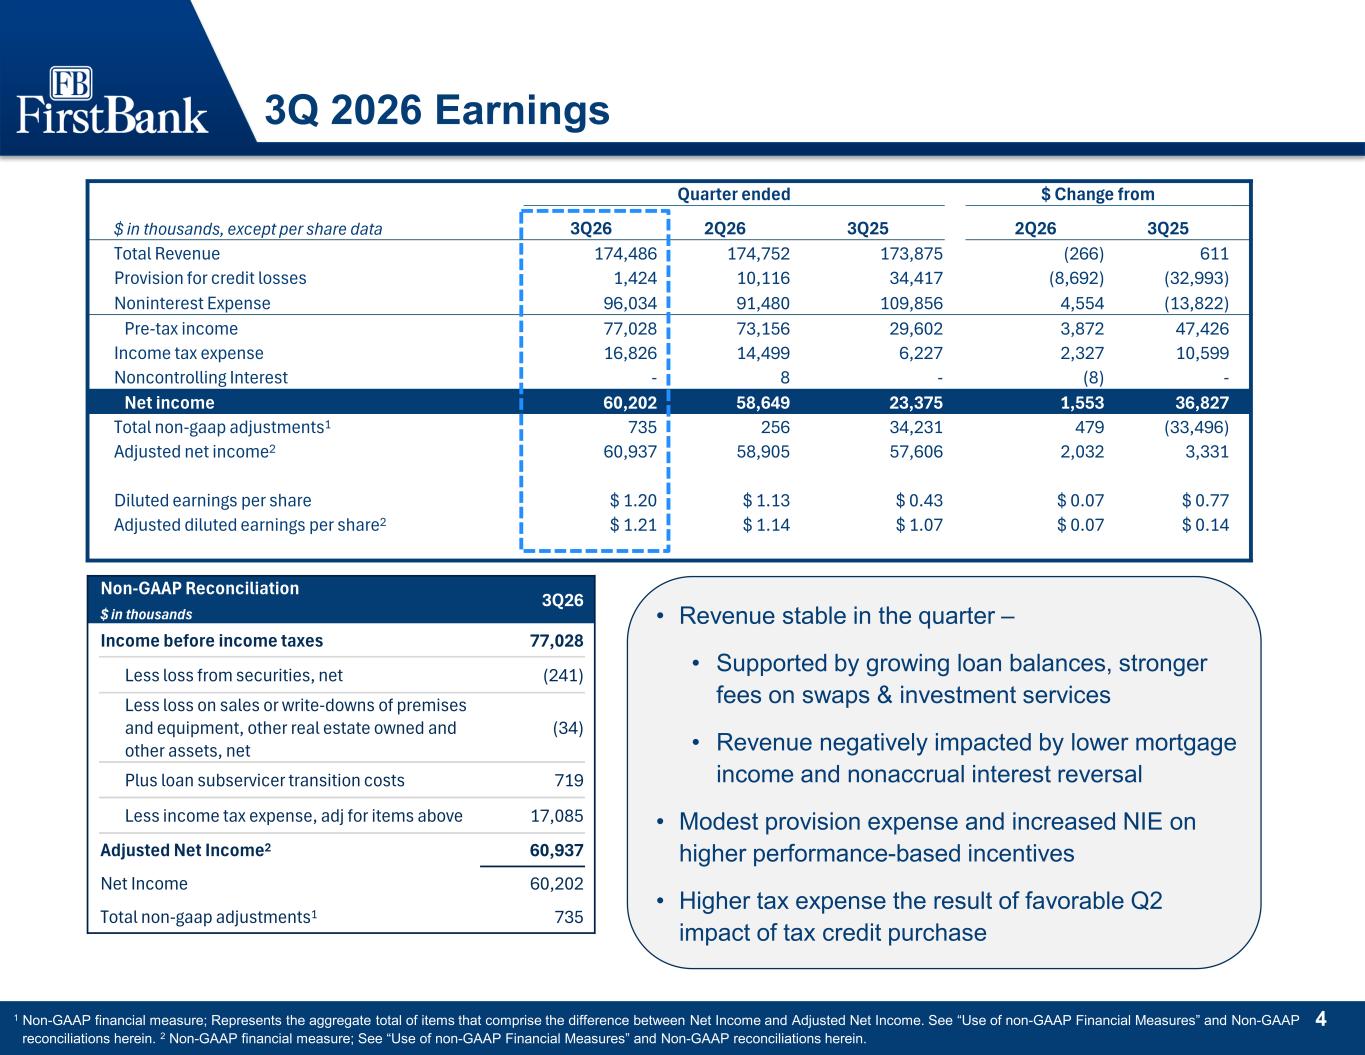
4 3Q 2026 Earnings Quarter ended $ Change from $ in thousands, except per share data 3Q26 2Q26 3Q25 2Q26 3Q25 Total Revenue 174,486 174,752 173,875 (266) 611 Provision for credit losses 1,424 10,116 34,417 (8,692) (32,993) Noninterest Expense 96,034 91,480 109,856 4,554 (13,822) Pre-tax income 77,028 73,156 29,602 3,872 47,426 Income tax expense 16,826 14,499 6,227 2,327 10,599 Noncontrolling Interest - 8 - (8) - Net income 60,202 58,649 23,375 1,553 36,827 Total non-gaap adjustments1 735 256 34,231 479 (33,496) Adjusted net income2 60,937 58,905 57,606 2,032 3,331 Diluted earnings per share $ 1.20 $ 1.13 $ 0.43 $ 0.07 $ 0.77 Adjusted diluted earnings per share2 $ 1.21 $ 1.14 $ 1.07 $ 0.07 $ 0.14 Non-GAAP Reconciliation $ in thousands 3Q26 Income before income taxes 77,028 Less loss from securities, net (241) Less loss on sales or write-downs of premises and equipment, other real estate owned and other assets, net (34) Plus loan subservicer transition costs 719 Less income tax expense, adj for items above 17,085 Adjusted Net Income2 60,937 Net Income 60,202 Total non-gaap adjustments1 735 1 Non-GAAP financial measure; Represents the aggregate total of items that comprise the difference between Net Income and Adjusted Net Income. See “Use of non-GAAP Financial Measures” and Non-GAAP reconciliations herein. 2 Non-GAAP financial measure; See “Use of non-GAAP Financial Measures” and Non-GAAP reconciliations herein. • Revenue stable in the quarter – • Supported by growing loan balances, stronger fees on swaps & investment services • Revenue negatively impacted by lower mortgage income and nonaccrual interest reversal • Modest provision expense and increased NIE on higher performance-based incentives • Higher tax expense the result of favorable Q2 impact of tax credit purchase
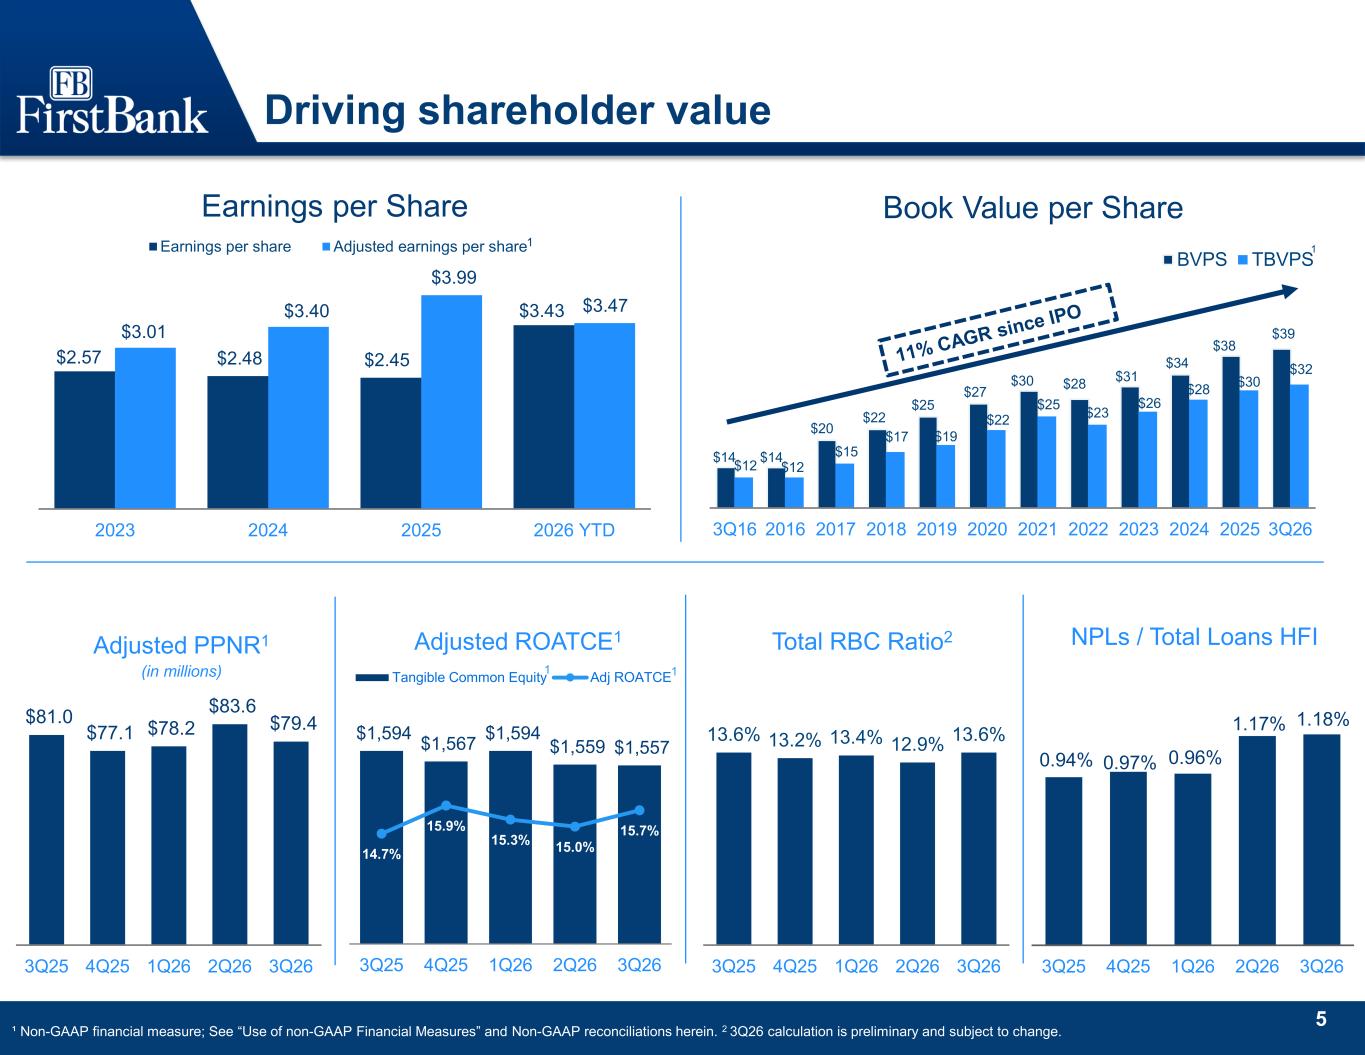
5 Driving shareholder value ¹ Non-GAAP financial measure; See “Use of non-GAAP Financial Measures” and Non-GAAP reconciliations herein. 2 3Q26 calculation is preliminary and subject to change. $2.57 $2.48 $2.45 $3.43 $3.01 $3.40 $3.99 $3.47 2023 2024 2025 2026 YTD Earnings per share Adjusted earnings per share Earnings per Share $14 $14 $20 $22 $25 $27 $30 $28 $31 $34 $38 $39 $12 $12 $15 $17 $19 $22 $25 $23 $26 $28 $30 $32 3Q16 2016 2017 2018 2019 2020 2021 2022 2023 2024 2025 3Q26 BVPS TBVPS 13.6% 13.2% 13.4% 12.9% 13.6% 3Q25 4Q25 1Q26 2Q26 3Q26 $81.0 $77.1 $78.2 $83.6 $79.4 3Q25 4Q25 1Q26 2Q26 3Q26 Book Value per Share Total RBC Ratio2 NPLs / Total Loans HFIAdjusted ROATCE1Adjusted PPNR1 (in millions) 1 1 $1,594 $1,567 $1,594 $1,559 $1,557 14.7% 15.9% 15.3% 15.0% 15.7% 3Q25 4Q25 1Q26 2Q26 3Q26 Tangible Common Equity Adj ROATCE11 0.94% 0.97% 0.96% 1.17% 1.18% 3Q25 4Q25 1Q26 2Q26 3Q26
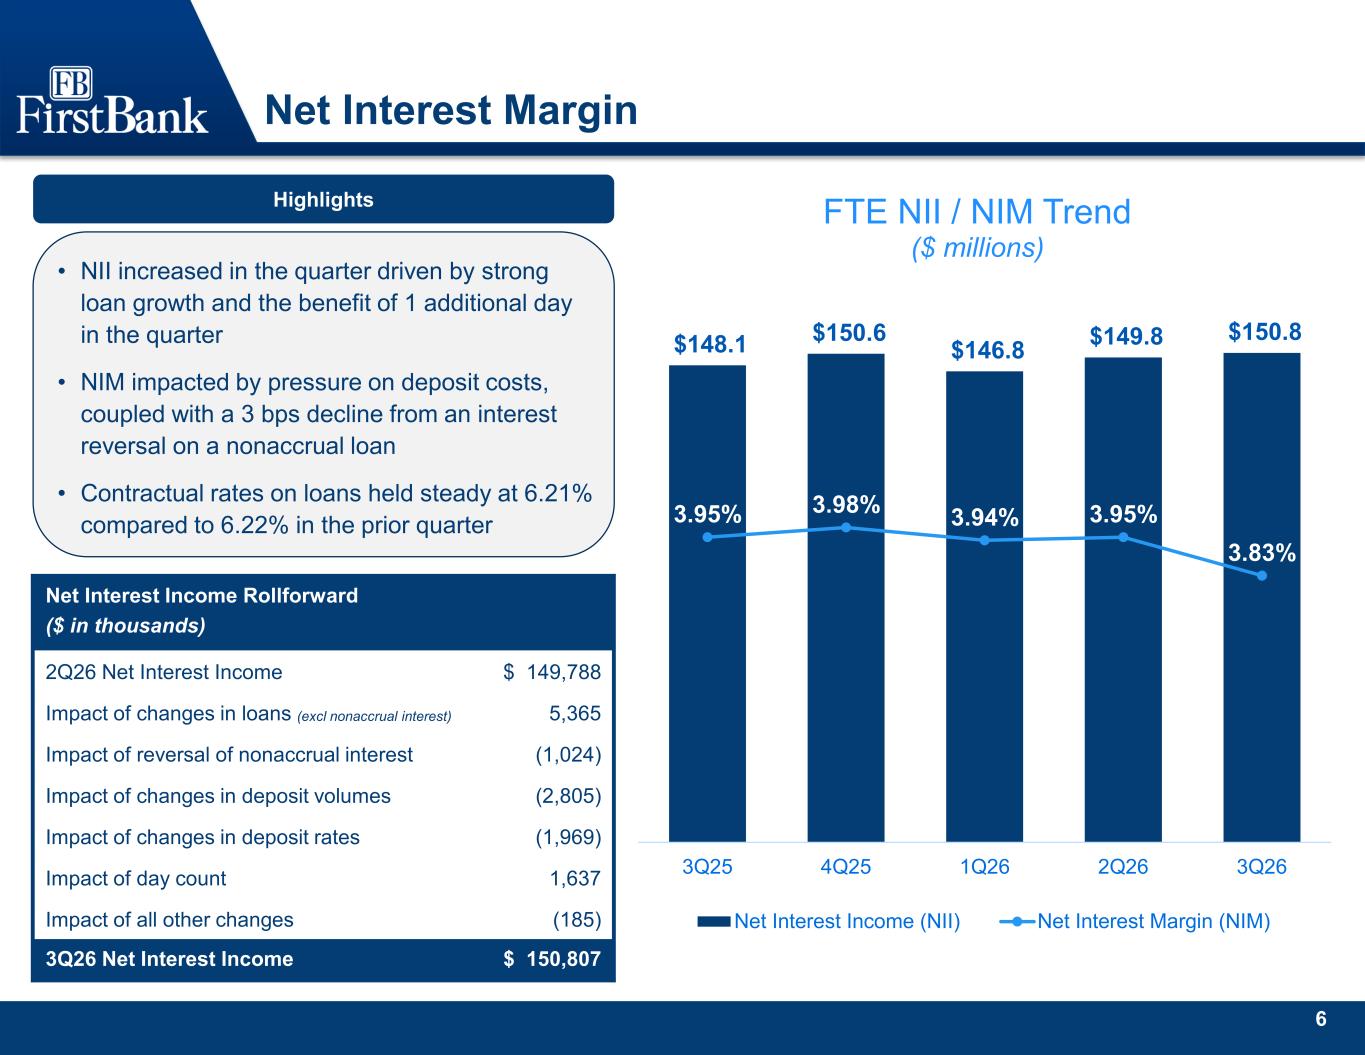
6 Net Interest Margin $148.1 $150.6 $146.8 $149.8 $150.8 3.95% 3.98% 3.94% 3.95% 3.83% 3Q25 4Q25 1Q26 2Q26 3Q26 FTE NII / NIM Trend ($ millions) Net Interest Income (NII) Net Interest Margin (NIM) Highlights Net Interest Income Rollforward ($ in thousands) 2Q26 Net Interest Income $ 149,788 Impact of changes in loans (excl nonaccrual interest) 5,365 Impact of reversal of nonaccrual interest (1,024) Impact of changes in deposit volumes (2,805) Impact of changes in deposit rates (1,969) Impact of day count 1,637 Impact of all other changes (185) 3Q26 Net Interest Income $ 150,807 • NII increased in the quarter driven by strong loan growth and the benefit of 1 additional day in the quarter • NIM impacted by pressure on deposit costs, coupled with a 3 bps decline from an interest reversal on a nonaccrual loan • Contractual rates on loans held steady at 6.21% compared to 6.22% in the prior quarter
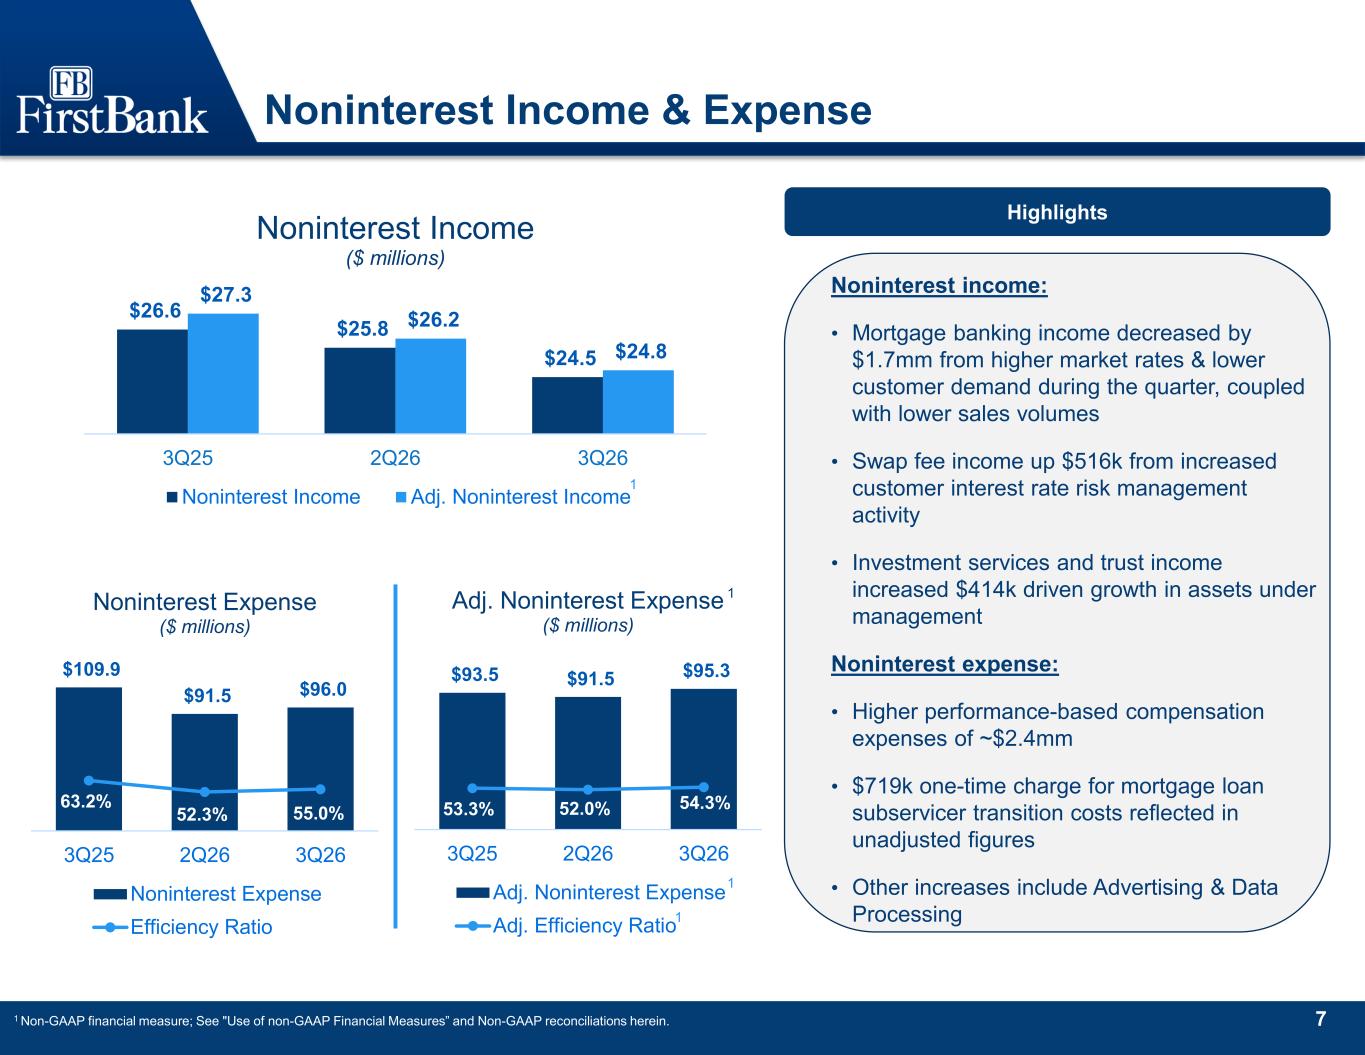
7 Noninterest Income & Expense $109.9 $91.5 $96.0 63.2% 52.3% 55.0% 3Q25 2Q26 3Q26 Noninterest Expense ($ millions) Noninterest Expense Efficiency Ratio $93.5 $91.5 $95.3 53.3% 52.0% 54.3% 3Q25 2Q26 3Q26 Adj. Noninterest Expense ($ millions) Adj. Noninterest Expense Adj. Efficiency Ratio $26.6 $25.8 $24.5 $27.3 $26.2 $24.8 3Q25 2Q26 3Q26 Noninterest Income ($ millions) Noninterest Income Adj. Noninterest Income Highlights 1 1 Non-GAAP financial measure; See "Use of non-GAAP Financial Measures” and Non-GAAP reconciliations herein. 1 1 1 Noninterest income: • Mortgage banking income decreased by $1.7mm from higher market rates & lower customer demand during the quarter, coupled with lower sales volumes • Swap fee income up $516k from increased customer interest rate risk management activity • Investment services and trust income increased $414k driven growth in assets under management Noninterest expense: • Higher performance-based compensation expenses of ~$2.4mm • $719k one-time charge for mortgage loan subservicer transition costs reflected in unadjusted figures • Other increases include Advertising & Data Processing
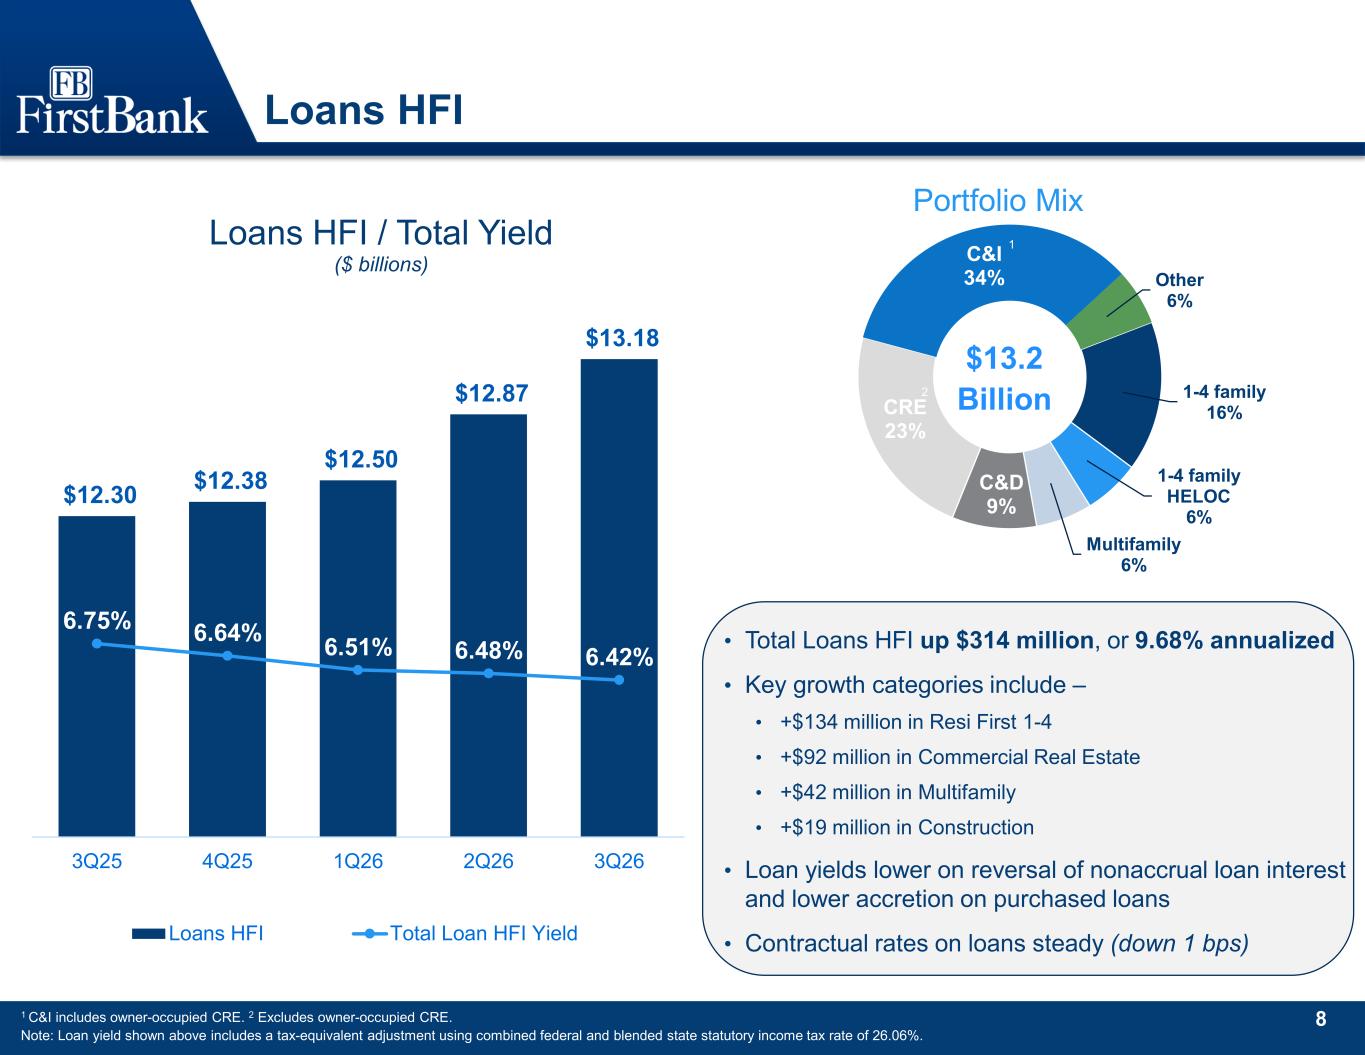
8 Loans HFI $12.30 $12.38 $12.50 $12.87 $13.18 6.75% 6.64% 6.51% 6.48% 6.42% 3Q25 4Q25 1Q26 2Q26 3Q26 Loans HFI / Total Yield ($ billions) Loans HFI Total Loan HFI Yield 1-4 family 16% 1-4 family HELOC 6% Multifamily 6% C&D 9% CRE 23% C&I 34% Other 6% Portfolio Mix $13.2 Billion 1 C&I includes owner-occupied CRE. 2 Excludes owner-occupied CRE. Note: Loan yield shown above includes a tax-equivalent adjustment using combined federal and blended state statutory income tax rate of 26.06%. 1 2 • Total Loans HFI up $314 million, or 9.68% annualized • Key growth categories include – • +$134 million in Resi First 1-4 • +$92 million in Commercial Real Estate • +$42 million in Multifamily • +$19 million in Construction • Loan yields lower on reversal of nonaccrual loan interest and lower accretion on purchased loans • Contractual rates on loans steady (down 1 bps)
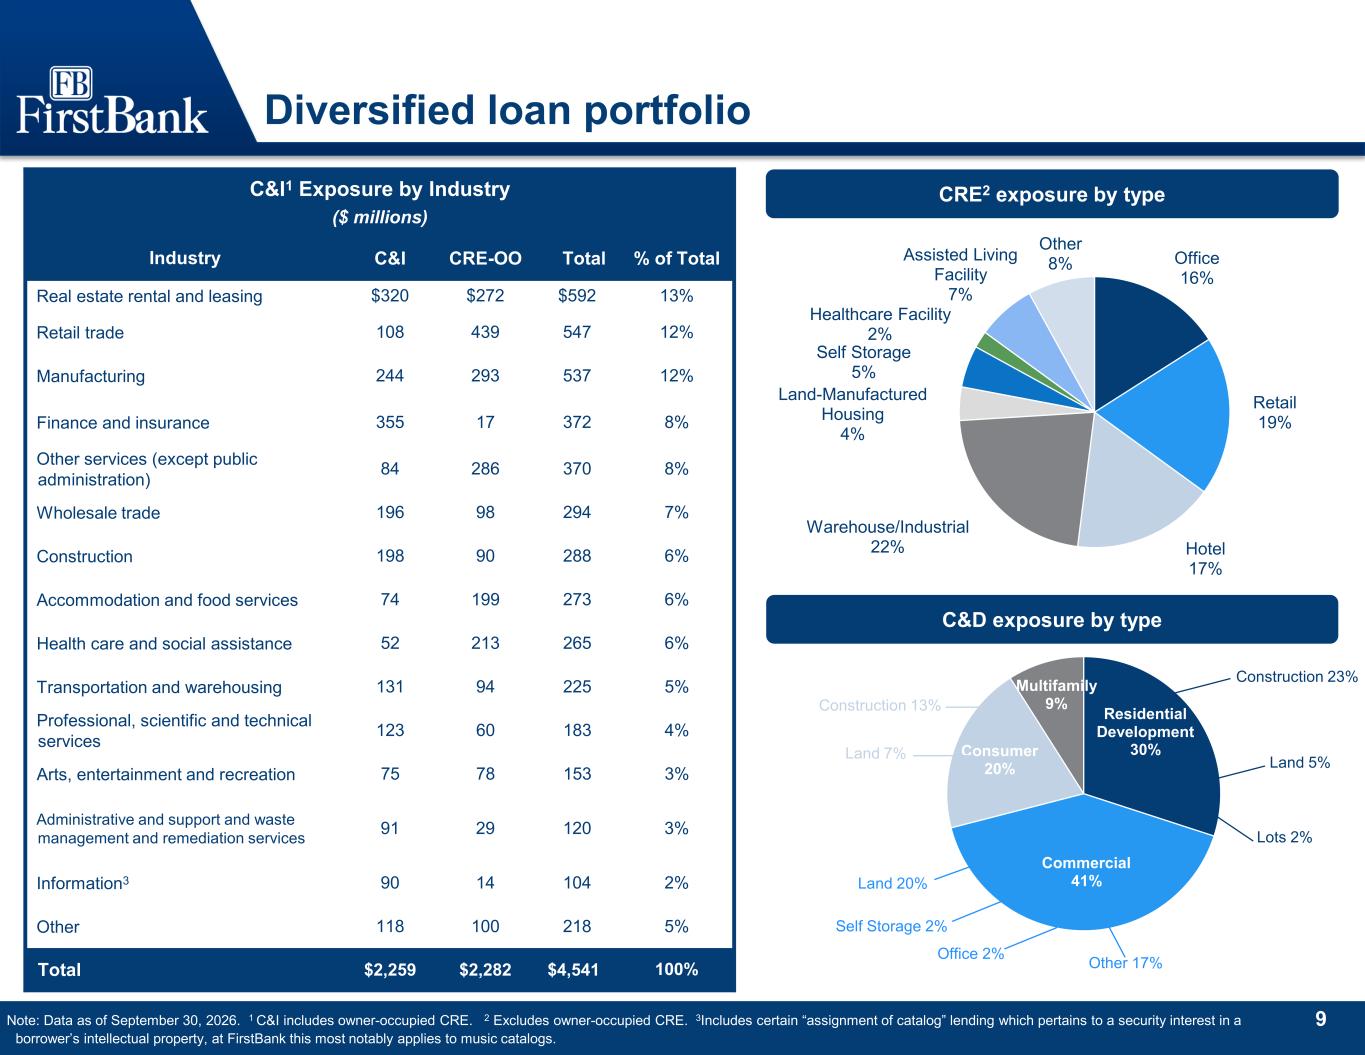
9 Office 16% Retail 19% Hotel 17% Warehouse/Industrial 22% Land-Manufactured Housing 4% Self Storage 5% Healthcare Facility 2% Assisted Living Facility 7% Other 8% Residential Development 30% Commercial 41% Consumer 20% Multifamily 9% Construction 23% Land 5% Lots 2% Diversified loan portfolio CRE2 exposure by type Note: Data as of September 30, 2026. 1 C&I includes owner-occupied CRE. 2 Excludes owner-occupied CRE. 3Includes certain “assignment of catalog” lending which pertains to a security interest in a borrower’s intellectual property, at FirstBank this most notably applies to music catalogs. C&D exposure by type C&I1 Exposure by Industry ($ millions) Industry C&I CRE-OO Total % of Total Real estate rental and leasing $320 $272 $592 13% Retail trade 108 439 547 12% Manufacturing 244 293 537 12% Finance and insurance 355 17 372 8% Other services (except public administration) 84 286 370 8% Wholesale trade 196 98 294 7% Construction 198 90 288 6% Accommodation and food services 74 199 273 6% Health care and social assistance 52 213 265 6% Transportation and warehousing 131 94 225 5% Professional, scientific and technical services 123 60 183 4% Arts, entertainment and recreation 75 78 153 3% Administrative and support and waste management and remediation services 91 29 120 3% Information3 90 14 104 2% Other 118 100 218 5% Total $2,259 $2,282 $4,541 100% Land 20% Self Storage 2% Other 17% Construction 13% Land 7% Office 2%
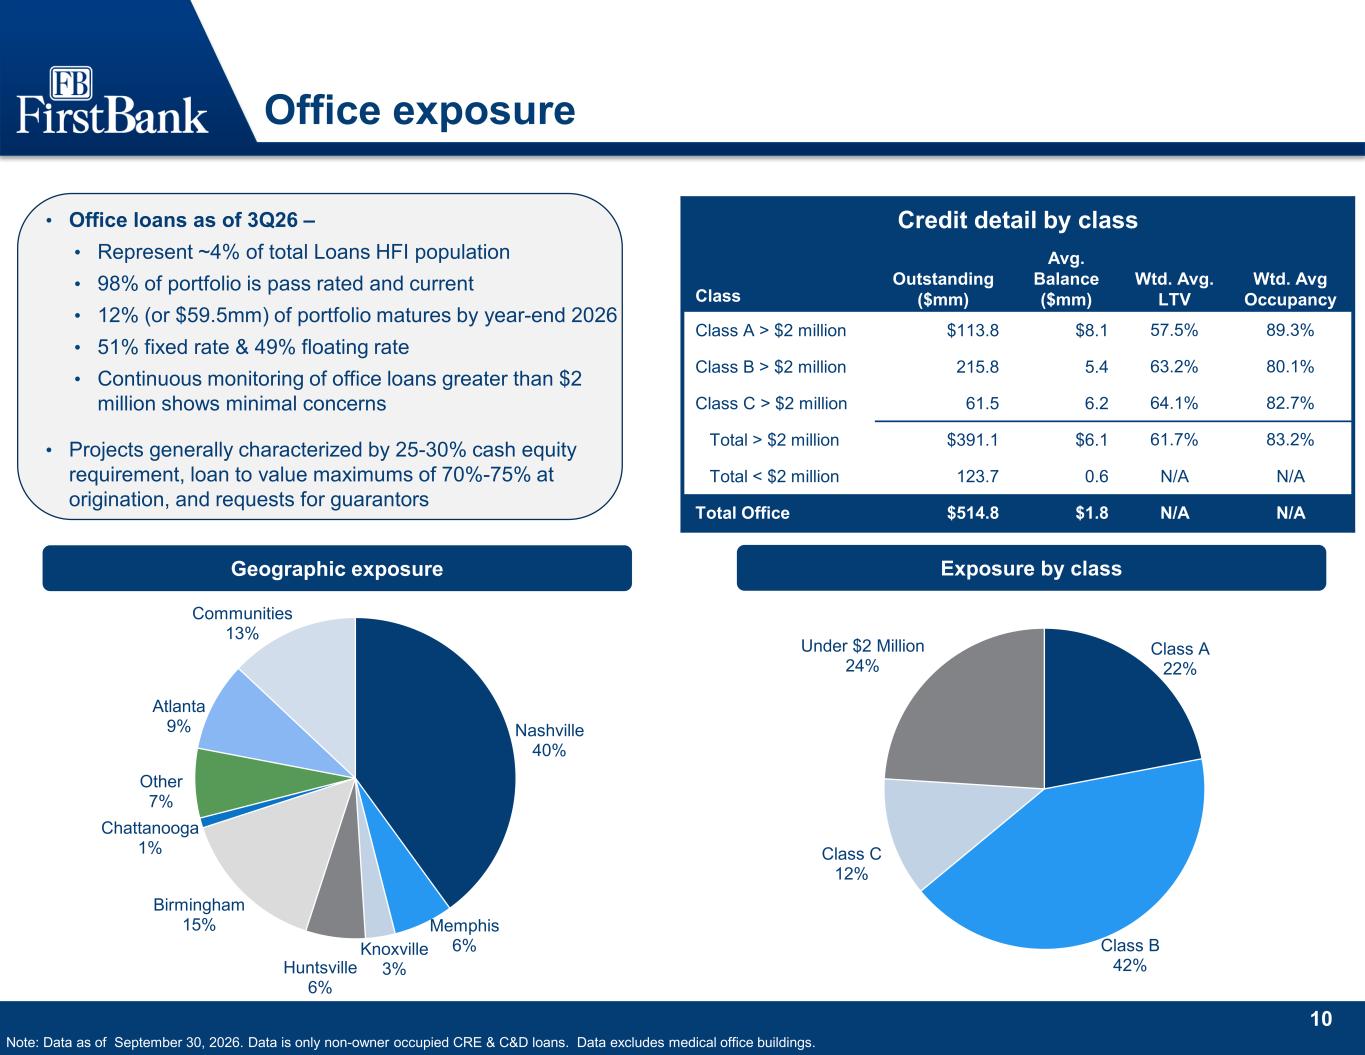
10 Nashville 40% Memphis 6%Knoxville 3%Huntsville 6% Birmingham 15% Chattanooga 1% Other 7% Atlanta 9% Communities 13% Class A 22% Class B 42% Class C 12% Under $2 Million 24% Office exposure Geographic exposure Note: Data as of September 30, 2026. Data is only non-owner occupied CRE & C&D loans. Data excludes medical office buildings. Credit detail by class Class Outstanding ($mm) Avg. Balance ($mm) Wtd. Avg. LTV Wtd. Avg Occupancy Class A > $2 million $113.8 $8.1 57.5% 89.3% Class B > $2 million 215.8 5.4 63.2% 80.1% Class C > $2 million 61.5 6.2 64.1% 82.7% Total > $2 million $391.1 $6.1 61.7% 83.2% Total < $2 million 123.7 0.6 N/A N/A Total Office $514.8 $1.8 N/A N/A Exposure by class • Office loans as of 3Q26 – • Represent ~4% of total Loans HFI population • 98% of portfolio is pass rated and current • 12% (or $59.5mm) of portfolio matures by year-end 2026 • 51% fixed rate & 49% floating rate • Continuous monitoring of office loans greater than $2 million shows minimal concerns • Projects generally characterized by 25-30% cash equity requirement, loan to value maximums of 70%-75% at origination, and requests for guarantors
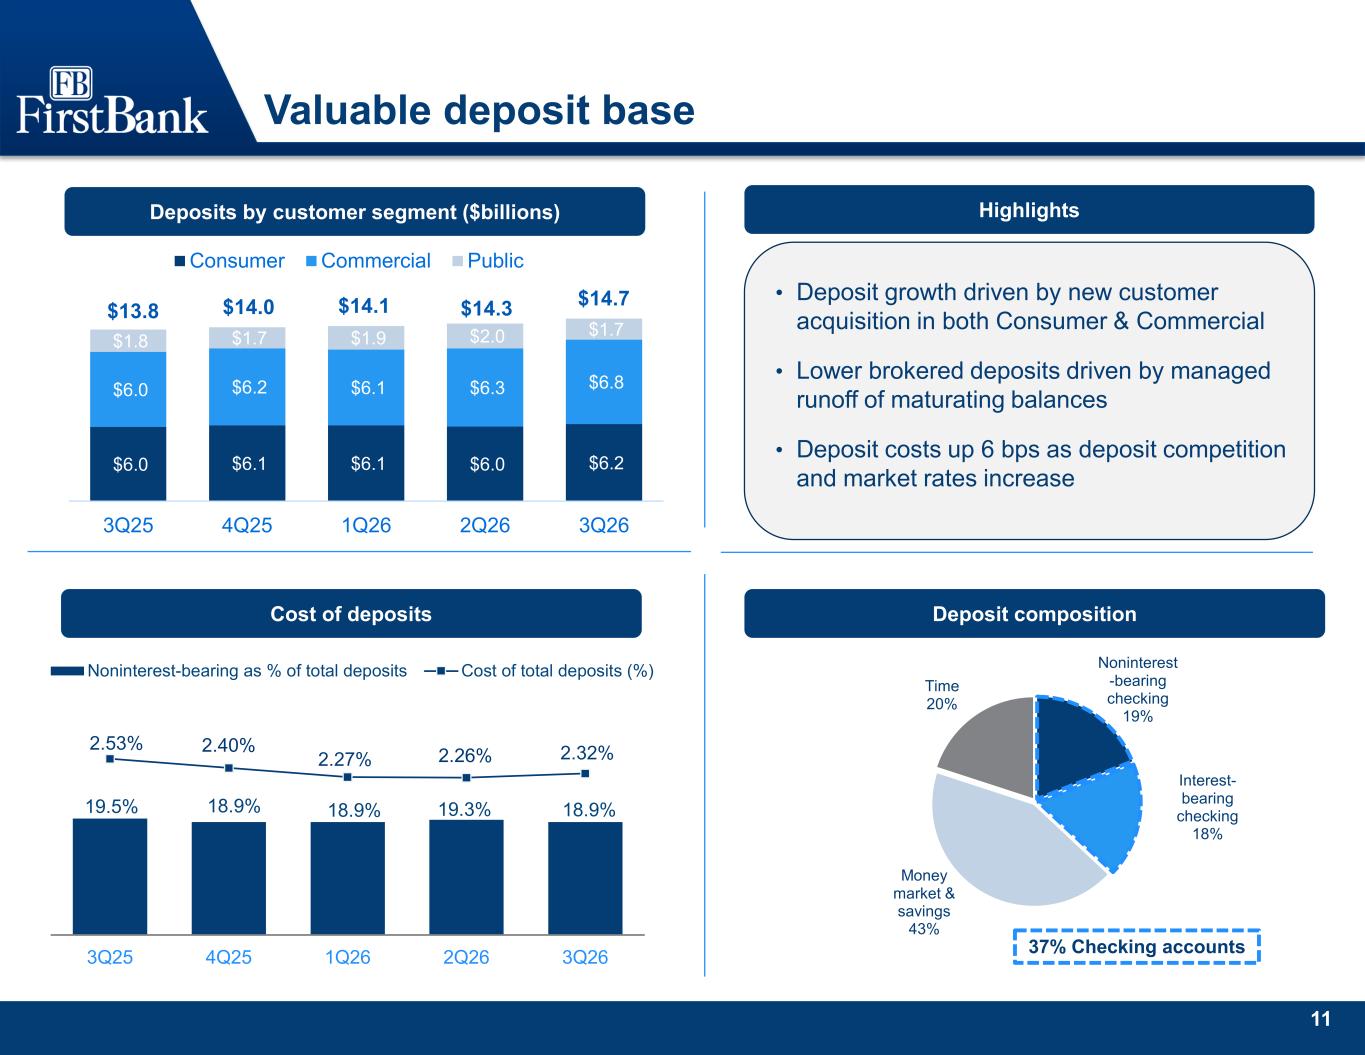
11 Valuable deposit base Cost of deposits 19.5% 18.9% 18.9% 19.3% 18.9% 2.53% 2.40% 2.27% 2.26% 2.32% 0.00% 0.50% 1.00% 1.50% 2.00% 2.50% 3.00% 0.0% 5.0% 10.0% 15.0% 20.0% 25.0% 30.0% 35.0% 3Q25 4Q25 1Q26 2Q26 3Q26 Noninterest-bearing as % of total deposits Cost of total deposits (%) Deposits by customer segment ($billions) • Deposit growth driven by new customer acquisition in both Consumer & Commercial • Lower brokered deposits driven by managed runoff of maturating balances • Deposit costs up 6 bps as deposit competition and market rates increase Highlights Noninterest -bearing checking 19% Interest- bearing checking 18% Money market & savings 43% Time 20% 37% Checking accounts Deposit composition $6.0 $6.1 $6.1 $6.0 $6.2 $6.0 $6.2 $6.1 $6.3 $6.8 $1.8 $1.7 $1.9 $2.0 $1.7 $13.8 $14.0 $14.1 $14.3 $14.7 3Q25 4Q25 1Q26 2Q26 3Q26 Consumer Commercial Public Total
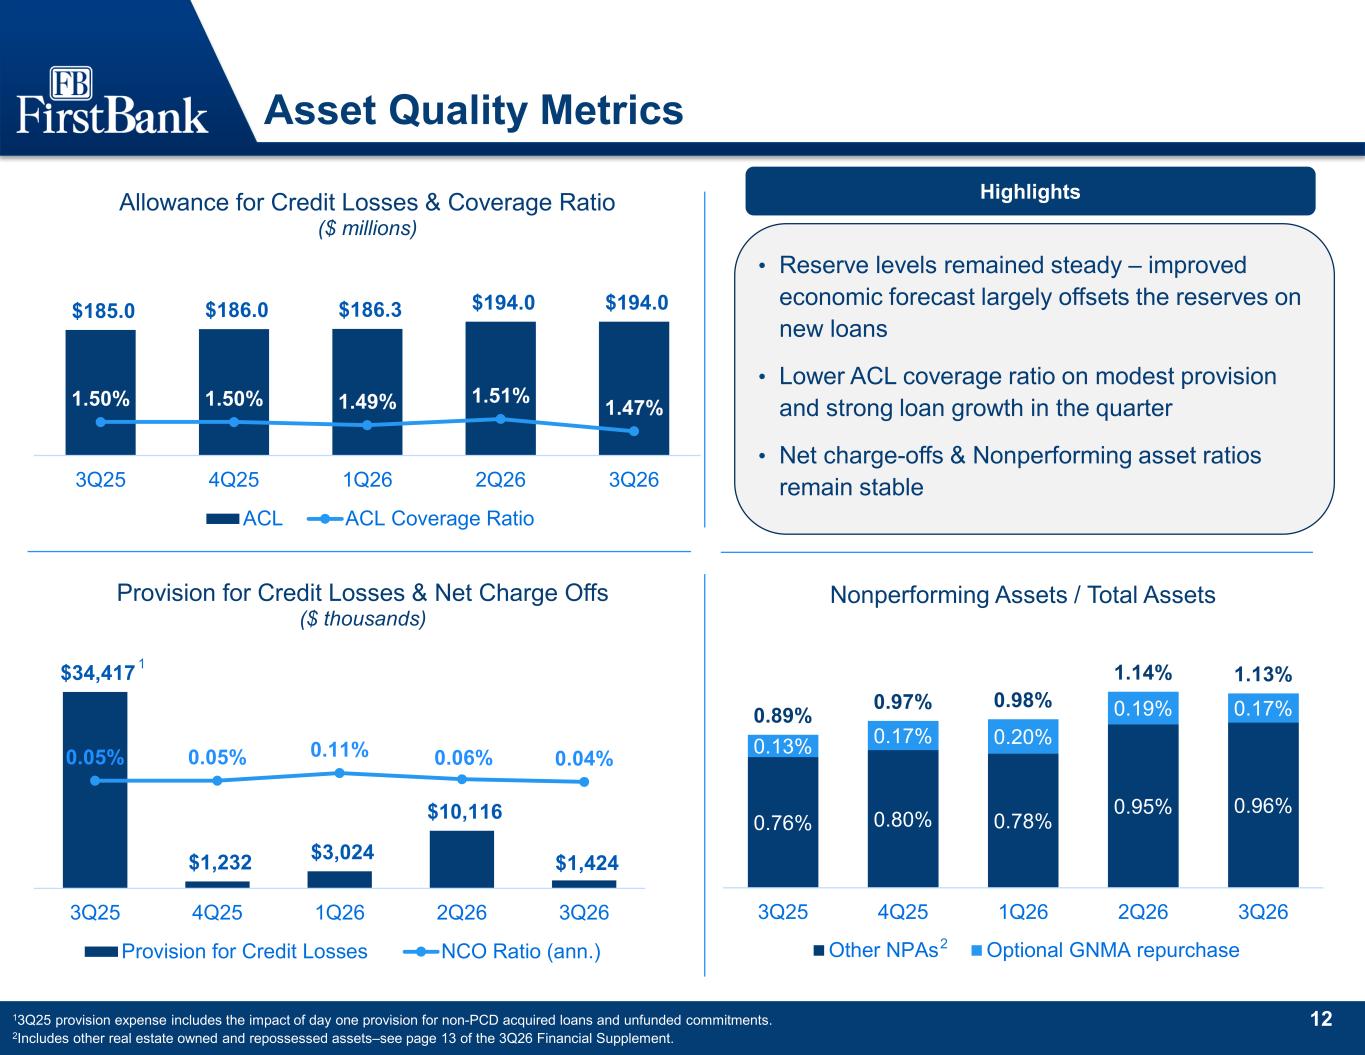
12 $34,417 $1,232 $3,024 $10,116 $1,424 0.05% 0.05% 0.11% 0.06% 0.04% 3Q25 4Q25 1Q26 2Q26 3Q26 Provision for Credit Losses & Net Charge Offs ($ thousands) Provision for Credit Losses NCO Ratio (ann.) Asset Quality Metrics • Reserve levels remained steady – improved economic forecast largely offsets the reserves on new loans • Lower ACL coverage ratio on modest provision and strong loan growth in the quarter • Net charge-offs & Nonperforming asset ratios remain stable $185.0 $186.0 $186.3 $194.0 $194.0 1.50% 1.50% 1.49% 1.51% 1.47% 3Q25 4Q25 1Q26 2Q26 3Q26 Allowance for Credit Losses & Coverage Ratio ($ millions) ACL ACL Coverage Ratio 13Q25 provision expense includes the impact of day one provision for non-PCD acquired loans and unfunded commitments. 2Includes other real estate owned and repossessed assets–see page 13 of the 3Q26 Financial Supplement. Highlights 2 1 0.76% 0.80% 0.78% 0.95% 0.96% 0.13% 0.17% 0.20% 0.19% 0.17%0.89% 0.97% 0.98% 1.14% 1.13% 3Q25 4Q25 1Q26 2Q26 3Q26 Nonperforming Assets / Total Assets Other NPAs Optional GNMA repurchase
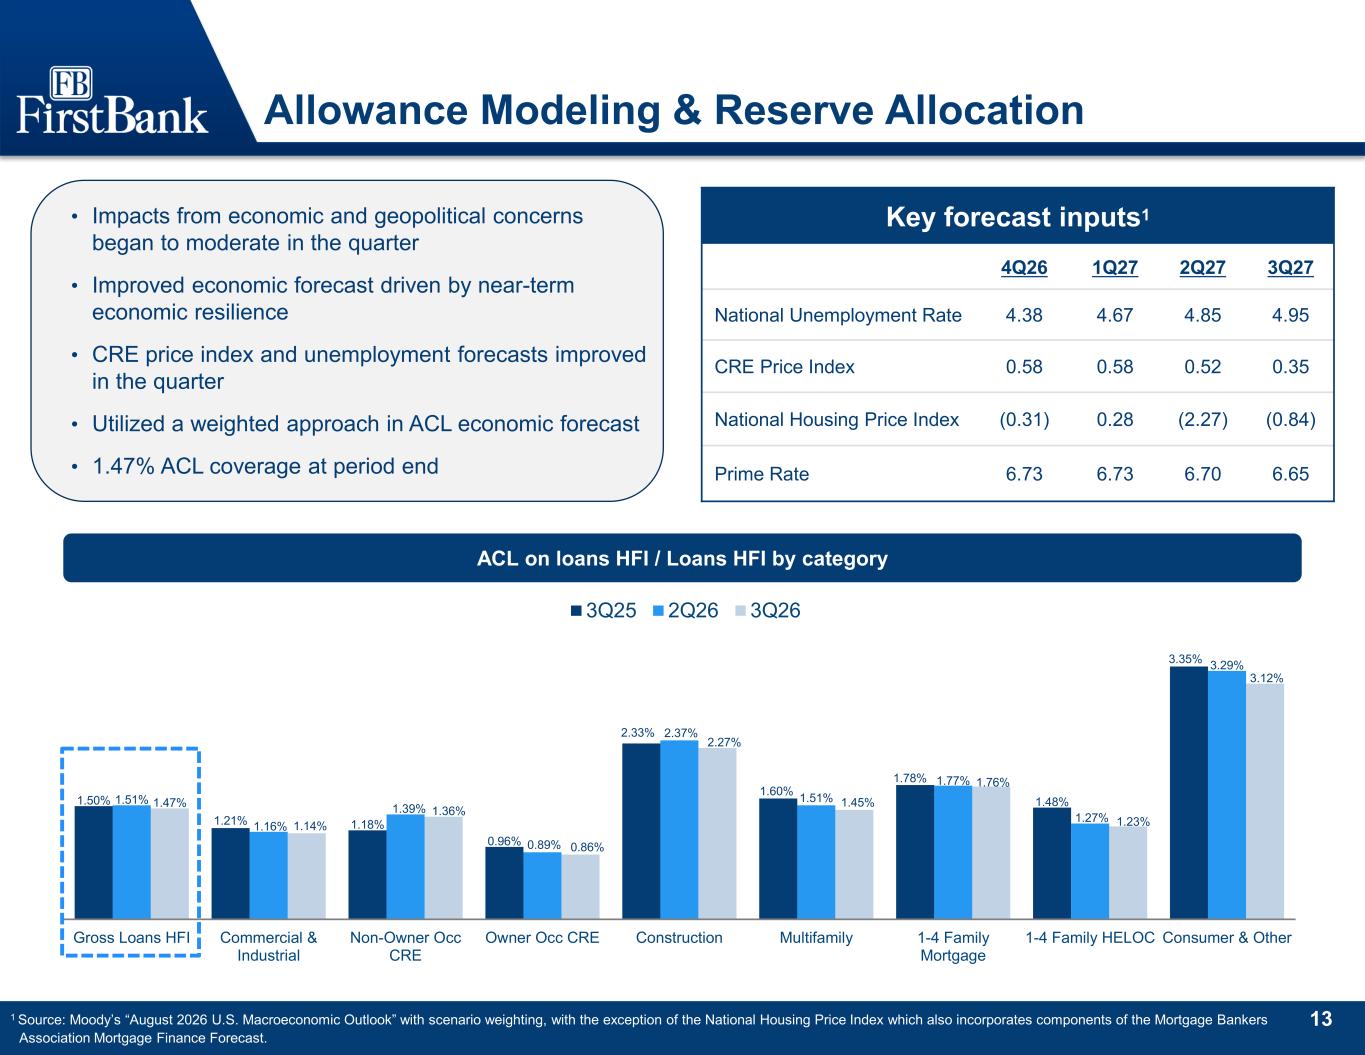
13 1.50% 1.21% 1.18% 0.96% 2.33% 1.60% 1.78% 1.48% 3.35% 1.51% 1.16% 1.39% 0.89% 2.37% 1.51% 1.77% 1.27% 3.29% 1.47% 1.14% 1.36% 0.86% 2.27% 1.45% 1.76% 1.23% 3.12% Gross Loans HFI Commercial & Industrial Non-Owner Occ CRE Owner Occ CRE Construction Multifamily 1-4 Family Mortgage 1-4 Family HELOC Consumer & Other 3Q25 2Q26 3Q26 Allowance Modeling & Reserve Allocation ACL on loans HFI / Loans HFI by category Key forecast inputs1 4Q26 1Q27 2Q27 3Q27 National Unemployment Rate 4.38 4.67 4.85 4.95 CRE Price Index 0.58 0.58 0.52 0.35 National Housing Price Index (0.31) 0.28 (2.27) (0.84) Prime Rate 6.73 6.73 6.70 6.65 1 Source: Moody’s “August 2026 U.S. Macroeconomic Outlook” with scenario weighting, with the exception of the National Housing Price Index which also incorporates components of the Mortgage Bankers Association Mortgage Finance Forecast. • Impacts from economic and geopolitical concerns began to moderate in the quarter • Improved economic forecast driven by near-term economic resilience • CRE price index and unemployment forecasts improved in the quarter • Utilized a weighted approach in ACL economic forecast • 1.47% ACL coverage at period end
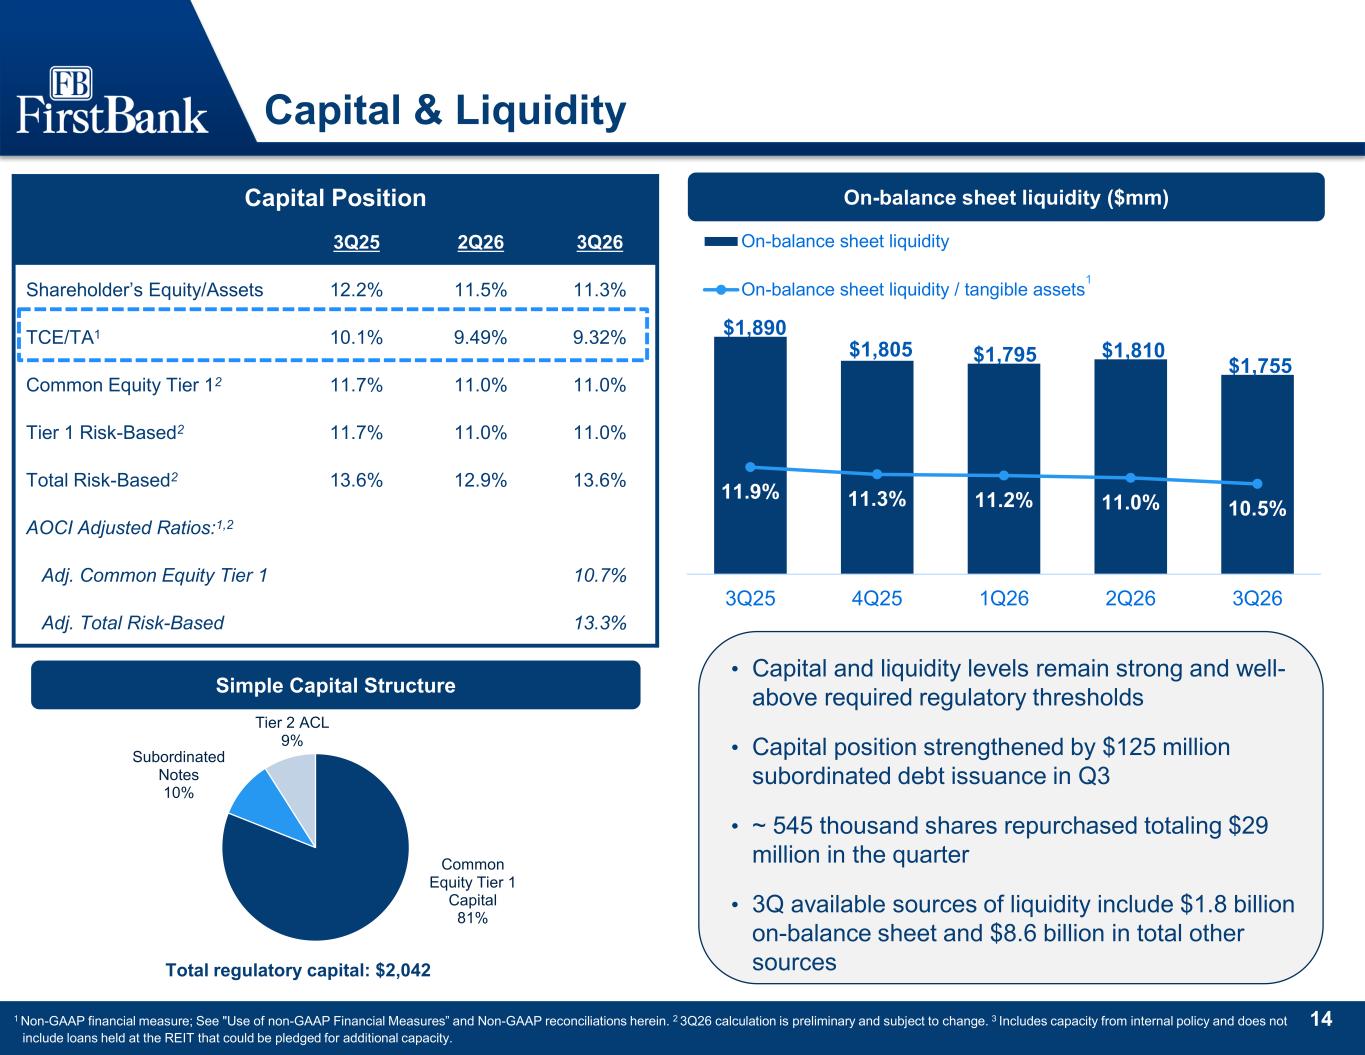
14 Capital & Liquidity Simple Capital Structure Common Equity Tier 1 Capital 81% Subordinated Notes 10% Tier 2 ACL 9% Total regulatory capital: $2,042 1 Non-GAAP financial measure; See "Use of non-GAAP Financial Measures” and Non-GAAP reconciliations herein. 2 3Q26 calculation is preliminary and subject to change. 3 Includes capacity from internal policy and does not include loans held at the REIT that could be pledged for additional capacity. On-balance sheet liquidity ($mm) $1,890 $1,805 $1,795 $1,810 $1,755 11.9% 11.3% 11.2% 11.0% 10.5% 3Q25 4Q25 1Q26 2Q26 3Q26 On-balance sheet liquidity On-balance sheet liquidity / tangible assets Capital Position 3Q25 2Q26 3Q26 Shareholder’s Equity/Assets 12.2% 11.5% 11.3% TCE/TA1 10.1% 9.49% 9.32% Common Equity Tier 12 11.7% 11.0% 11.0% Tier 1 Risk-Based2 11.7% 11.0% 11.0% Total Risk-Based2 13.6% 12.9% 13.6% AOCI Adjusted Ratios:1,2 Adj. Common Equity Tier 1 10.7% Adj. Total Risk-Based 13.3% 1 • Capital and liquidity levels remain strong and well- above required regulatory thresholds • Capital position strengthened by $125 million subordinated debt issuance in Q3 • ~ 545 thousand shares repurchased totaling $29 million in the quarter • 3Q available sources of liquidity include $1.8 billion on-balance sheet and $8.6 billion in total other sources
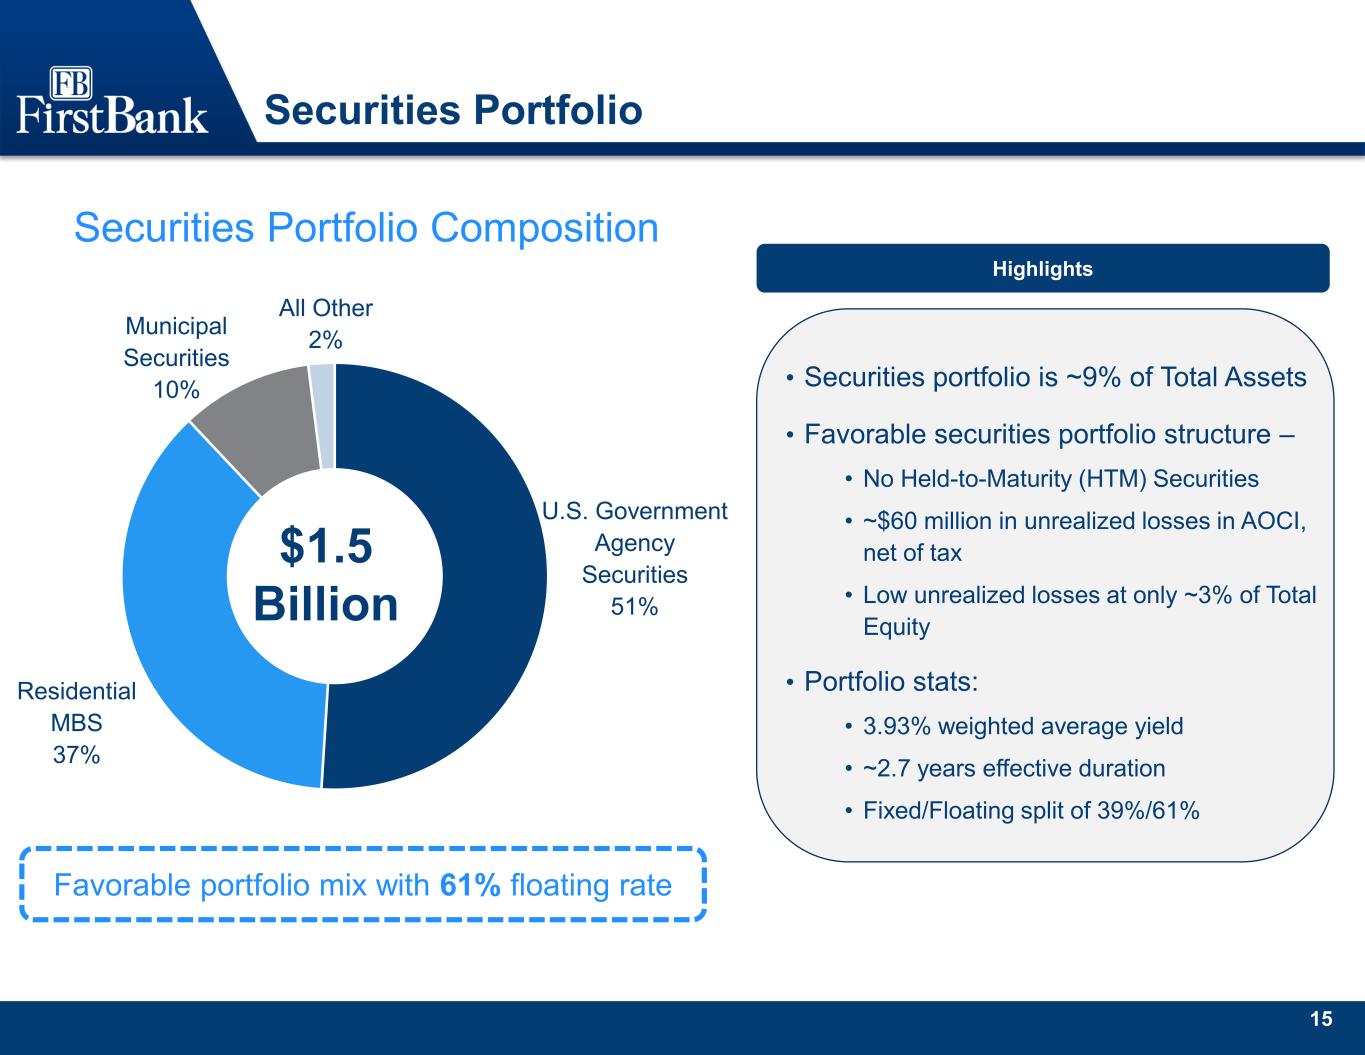
15 Securities Portfolio • Securities portfolio is ~9% of Total Assets • Favorable securities portfolio structure – • No Held-to-Maturity (HTM) Securities • ~$60 million in unrealized losses in AOCI, net of tax • Low unrealized losses at only ~3% of Total Equity • Portfolio stats: • 3.93% weighted average yield • ~2.7 years effective duration • Fixed/Floating split of 39%/61% $1.5 Billion U.S. Government Agency Securities 51% Residential MBS 37% Municipal Securities 10% All Other 2% Favorable portfolio mix with 61% floating rate Highlights Securities Portfolio Composition
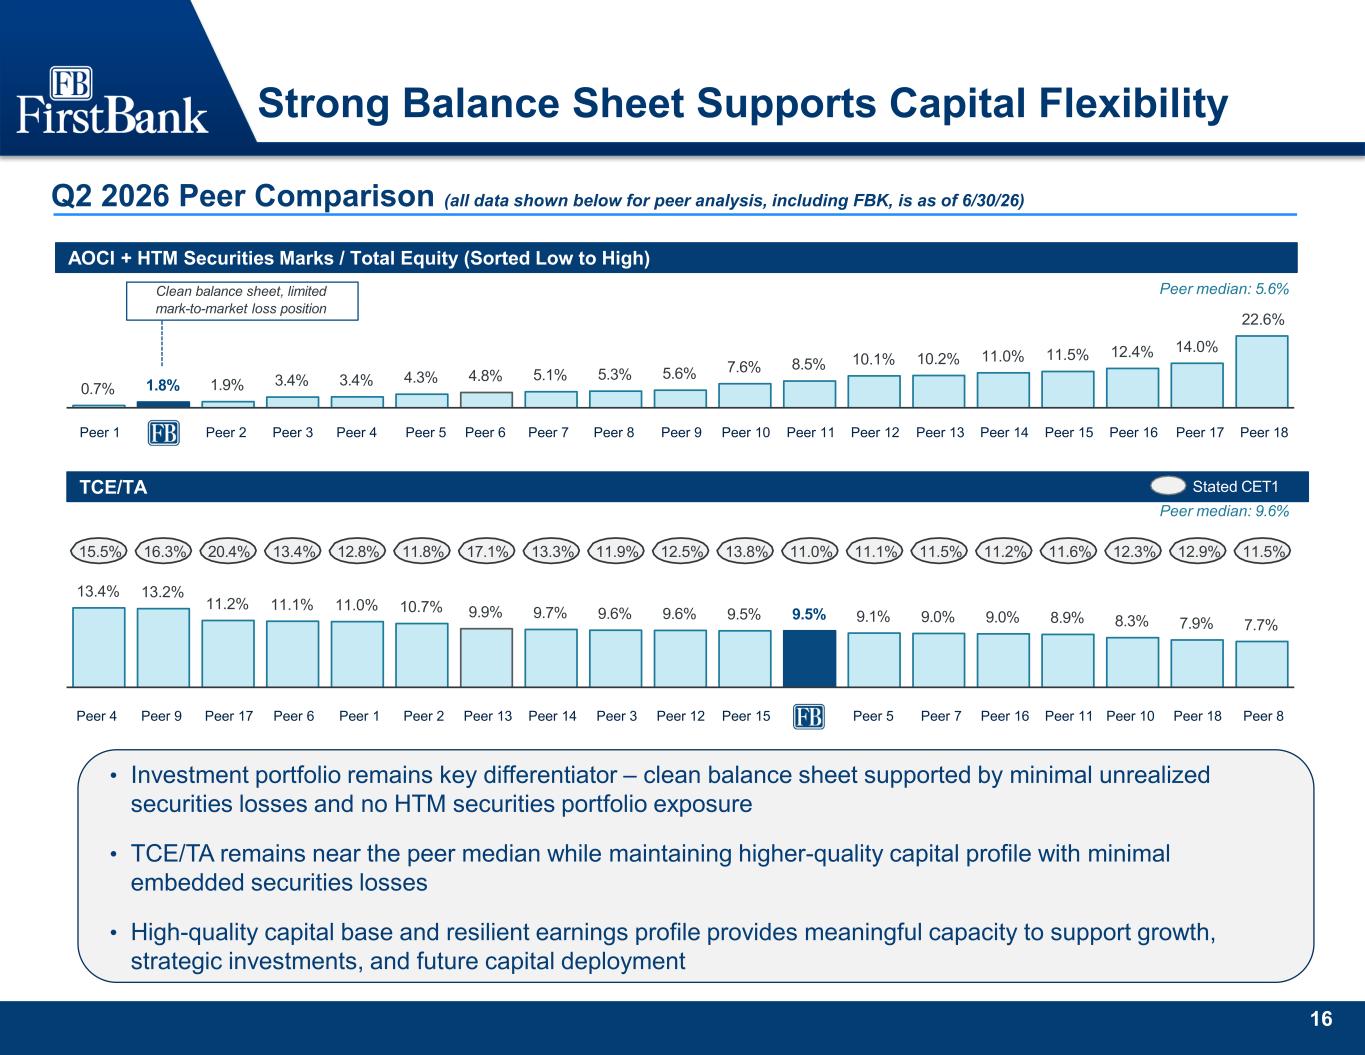
16 TCE/TA 13.4% 13.2% 11.2% 11.1% 11.0% 10.7% 9.9% 9.7% 9.6% 9.6% 9.5% 9.5% 9.1% 9.0% 9.0% 8.9% 8.3% 7.9% 7.7% Stated CET1 Peer median: 9.6% 15.5% 16.3% 20.4% 13.4% 12.8% 11.8% 17.1% 13.3% 11.9% 12.5% 13.8% 11.0% 11.1% 11.5% 11.2% 11.6% 12.3% 12.9% 11.5% AOCI + HTM SECURITIES MARKS / TOTAL EQUITY (SORTED LOW TO HIGH) 0.7% 1.8% 1.9% 3.4% 3.4% 4.3% 4.8% 5.1% 5.3% 5.6% 7.6% 8.5% 10.1% 10.2% 11.0% 11.5% 12.4% 14.0% Peer median: 5.6% 22.6% Clean balance sheet, limited mark-to-market loss position Peer 4 Peer 4Peer 1 Peer 1 Peer 2 Peer 2 Peer 3 Peer 3 Peer 5 Peer 5 Peer 6 Peer 6 Peer 7 Peer 7 Peer 8 Peer 8 Peer 9 Peer 9 Peer 10 Peer 10 Peer 11 Peer 11 Peer 12 Peer 12 Peer 13 Peer 13 Peer 14 Peer 14 Peer 15 Peer 15 Peer 16 Peer 16 Peer 17 Peer 17 Peer 18 Peer 18 Strong Balance Sheet Supports Capital Flexibility AOCI + HTM Securities Marks / Total Equity (Sorted Low to High) • Investment portfolio remains key differentiator – clean balance sheet supported by minimal unrealized securities losses and no HTM securities portfolio exposure • TCE/TA remains near the peer median while maintaining higher-quality capital profile with minimal embedded securities losses • High-quality capital base and resilient earnings profile provides meaningful capacity to support growth, strategic investments, and future capital deployment Q2 2026 Peer Comparison (all data shown below for peer analysis, including FBK, is as of 6/30/26)
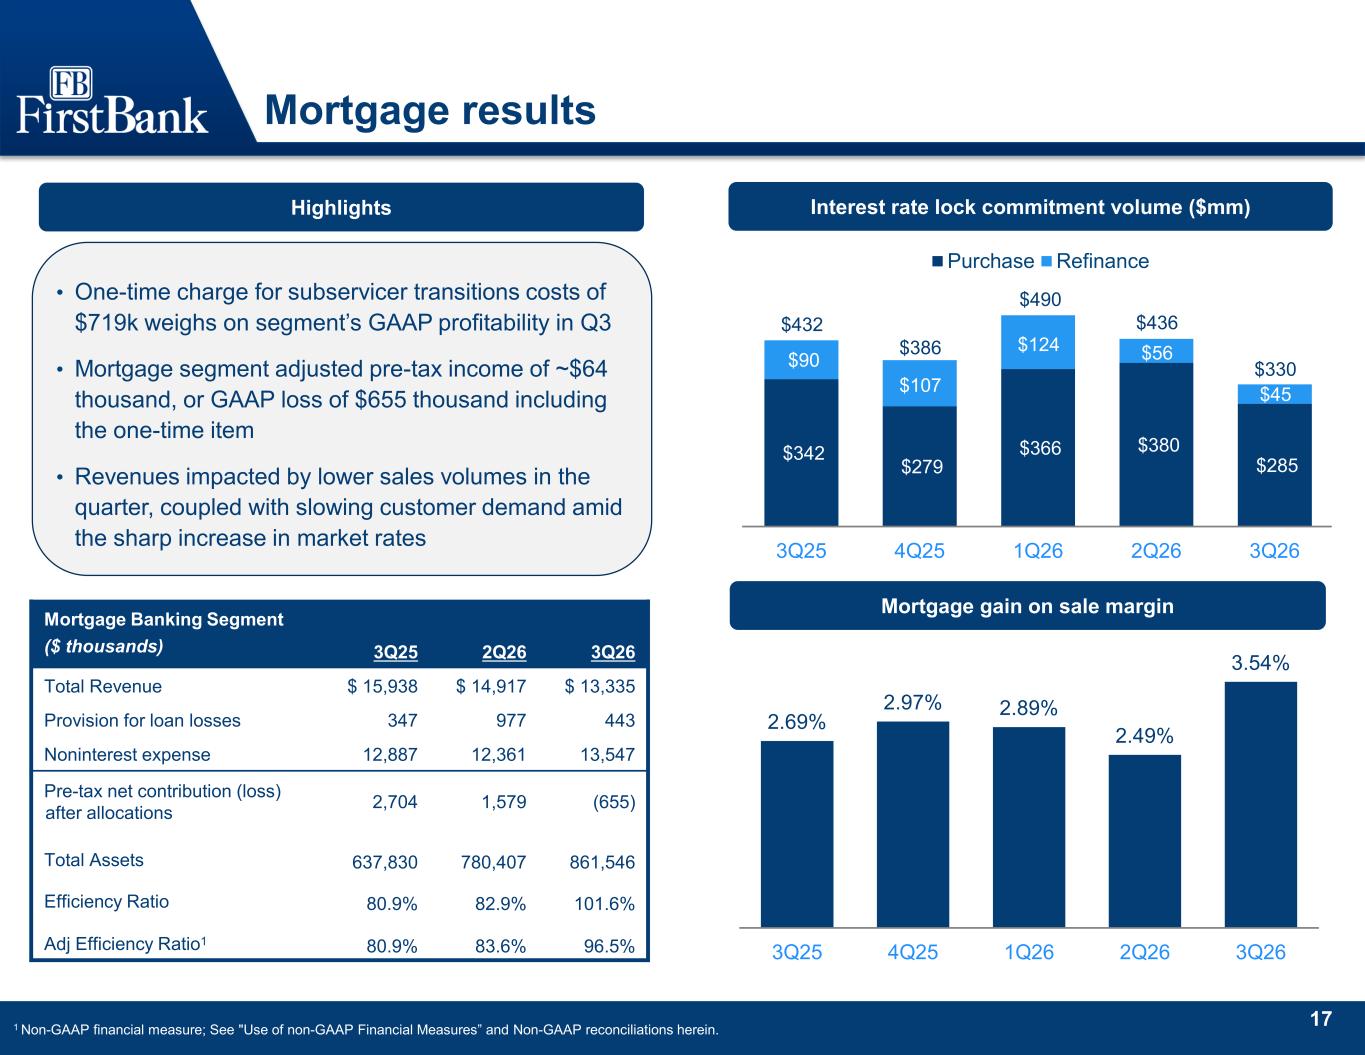
17 Mortgage results • One-time charge for subservicer transitions costs of $719k weighs on segment’s GAAP profitability in Q3 • Mortgage segment adjusted pre-tax income of ~$64 thousand, or GAAP loss of $655 thousand including the one-time item • Revenues impacted by lower sales volumes in the quarter, coupled with slowing customer demand amid the sharp increase in market rates 2.69% 2.97% 2.89% 2.49% 3.54% 3Q25 4Q25 1Q26 2Q26 3Q26 Interest rate lock commitment volume ($mm) Mortgage gain on sale margin $342 $279 $366 $380 $285 $90 $107 $124 $56 $45 $432 $386 $490 $436 $330 3Q25 4Q25 1Q26 2Q26 3Q26 Purchase Refinance Highlights Mortgage Banking Segment ($ thousands) 3Q25 2Q26 3Q26 Total Revenue $ 15,938 $ 14,917 $ 13,335 Provision for loan losses 347 977 443 Noninterest expense 12,887 12,361 13,547 Pre-tax net contribution (loss) after allocations 2,704 1,579 (655) Total Assets 637,830 780,407 861,546 Efficiency Ratio 80.9% 82.9% 101.6% Adj Efficiency Ratio1 80.9% 83.6% 96.5% 1 Non-GAAP financial measure; See "Use of non-GAAP Financial Measures” and Non-GAAP reconciliations herein.
18 Appendix
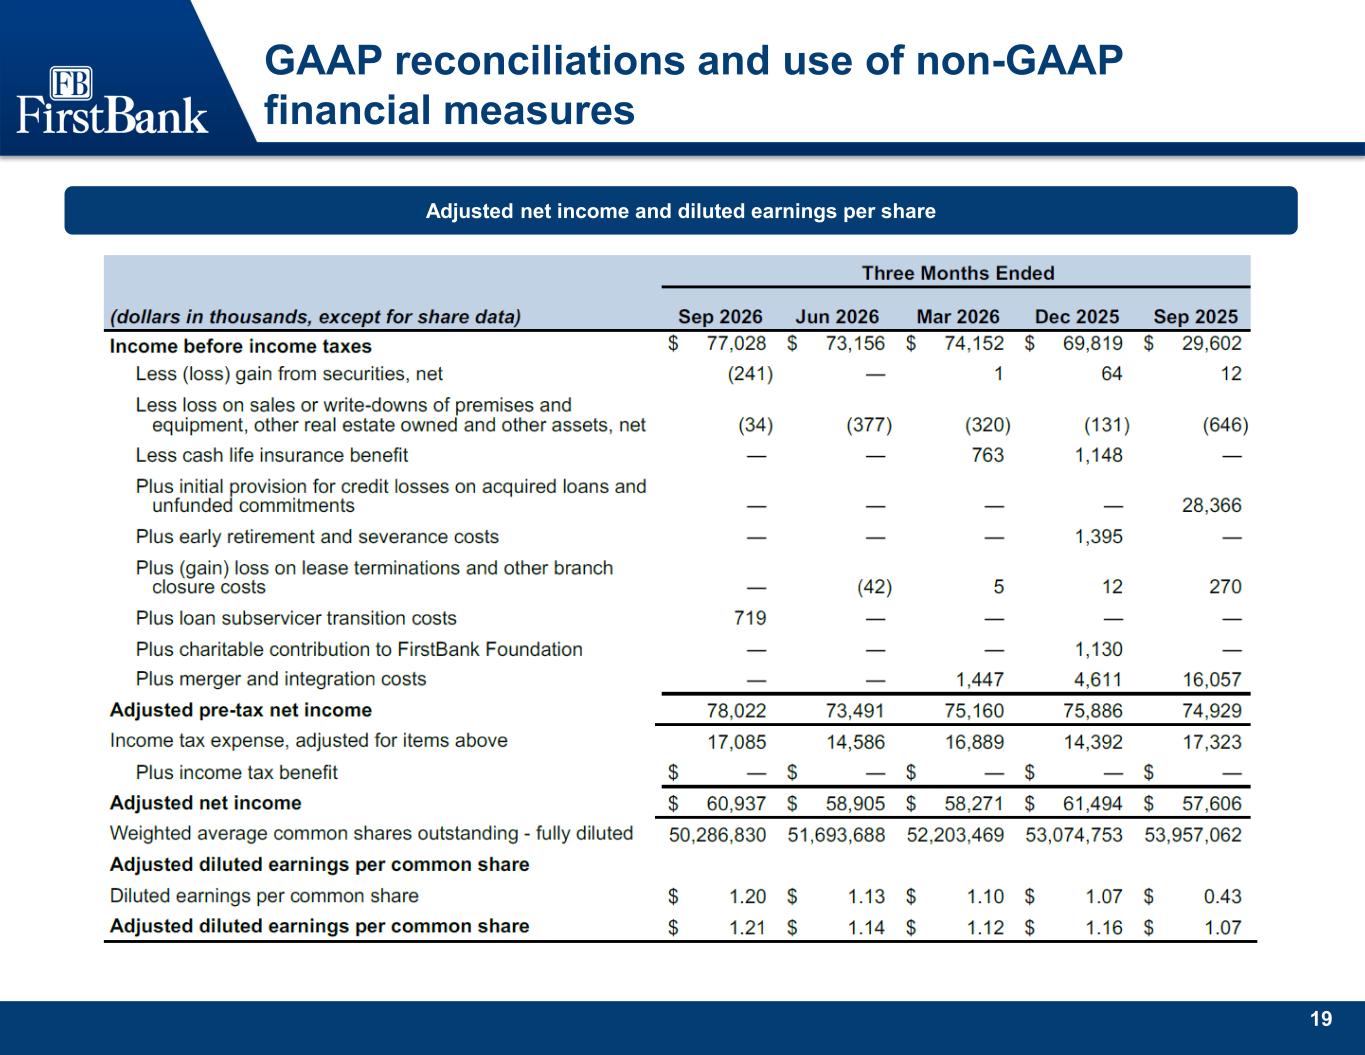
19 GAAP reconciliations and use of non-GAAP financial measures Adjusted net income and diluted earnings per share
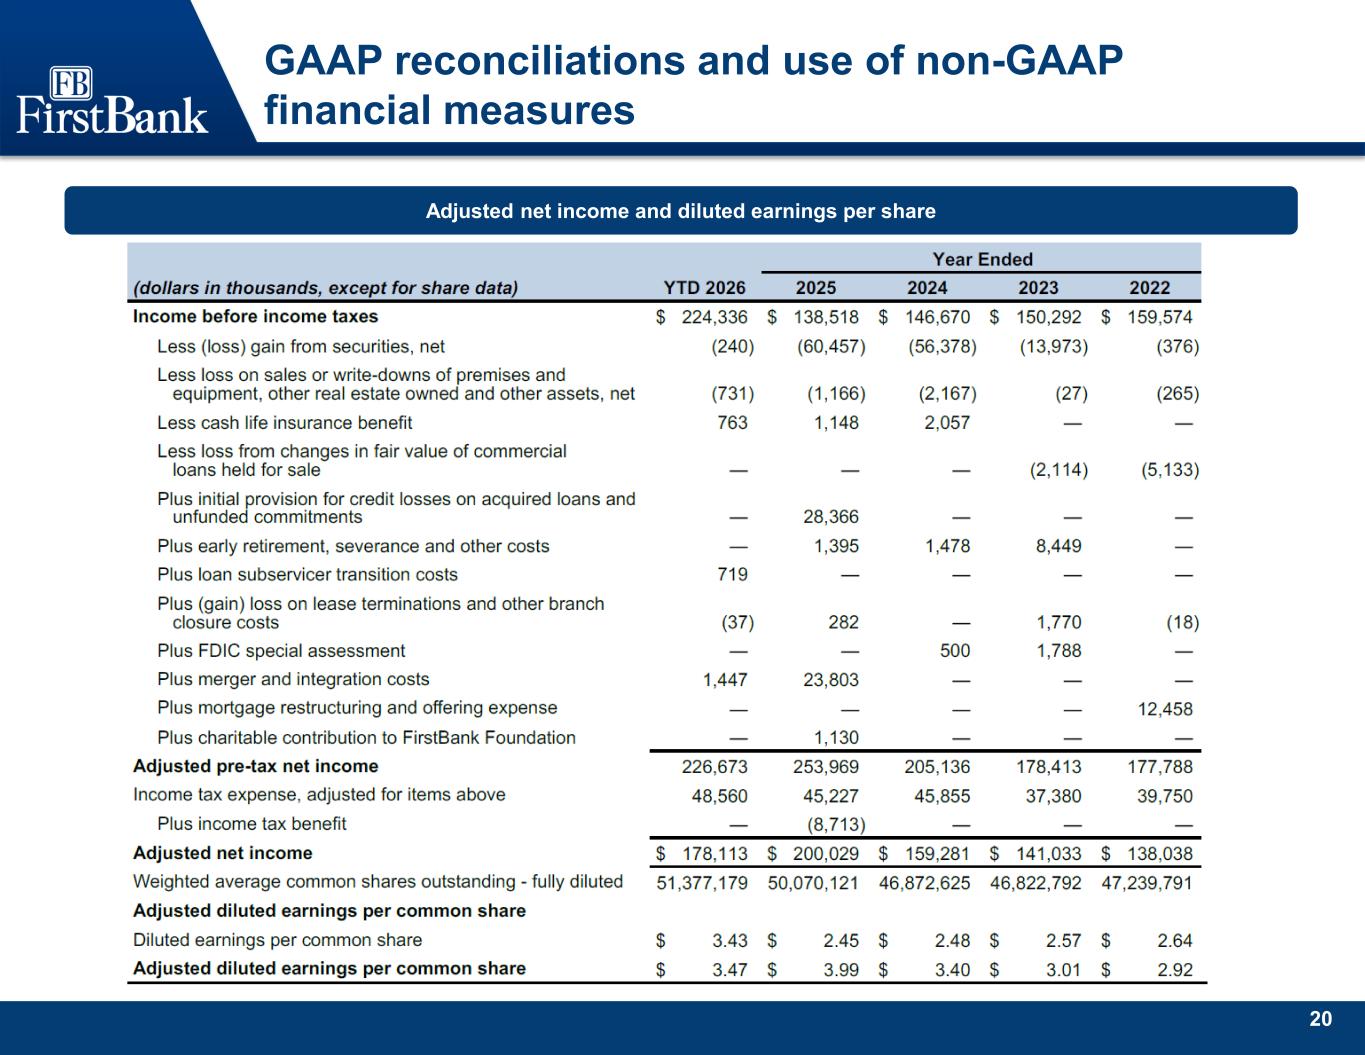
20 GAAP reconciliations and use of non-GAAP financial measures Adjusted net income and diluted earnings per share
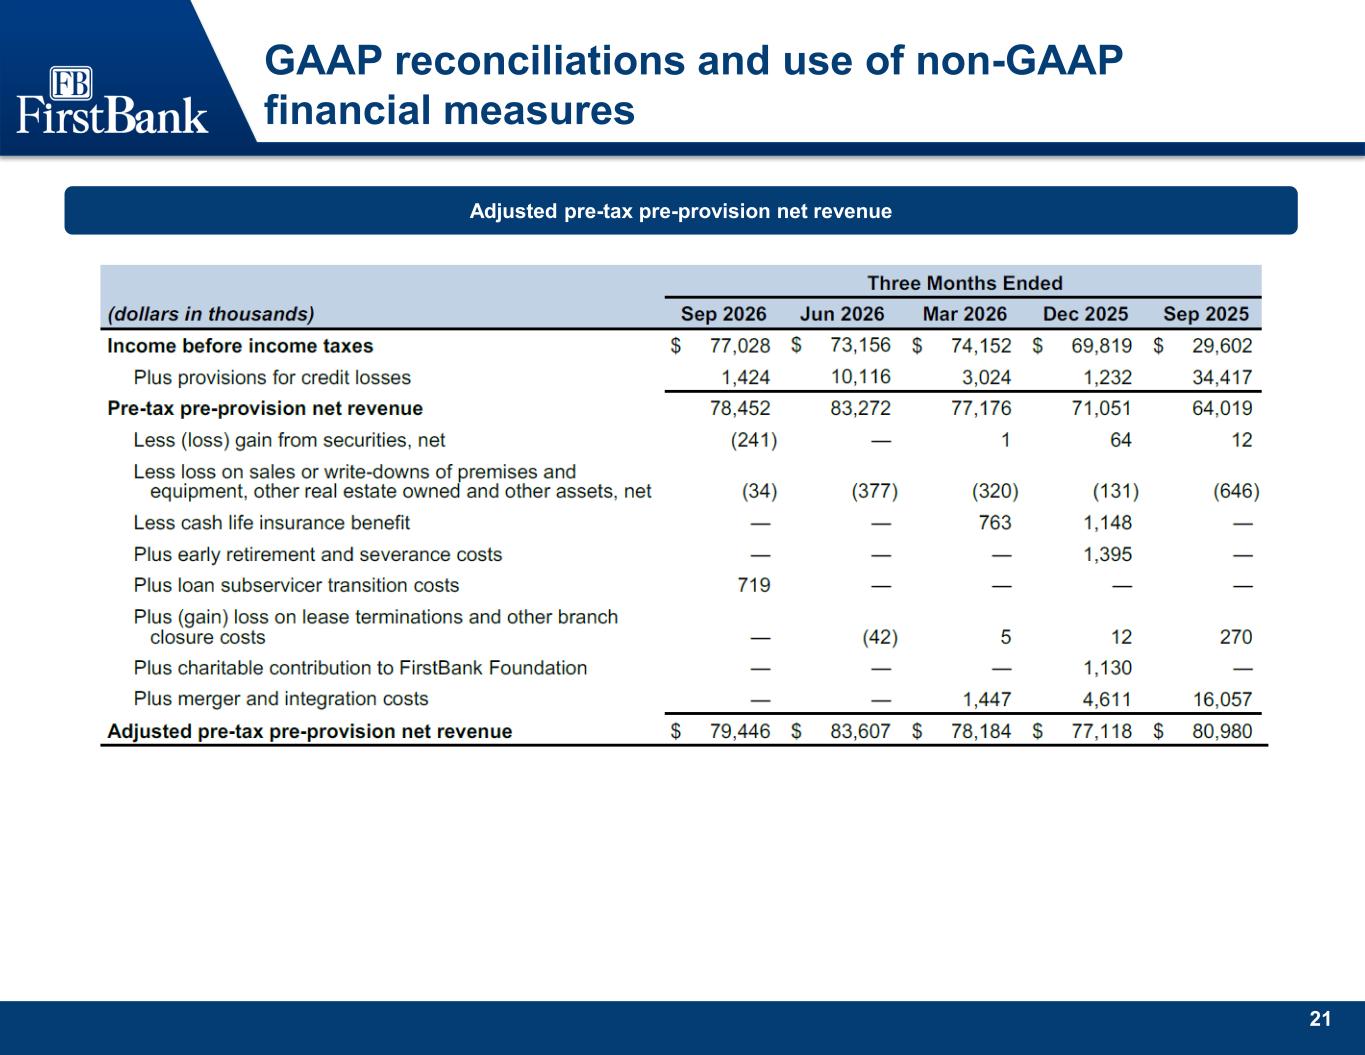
21 GAAP reconciliations and use of non-GAAP financial measures Adjusted pre-tax pre-provision net revenue
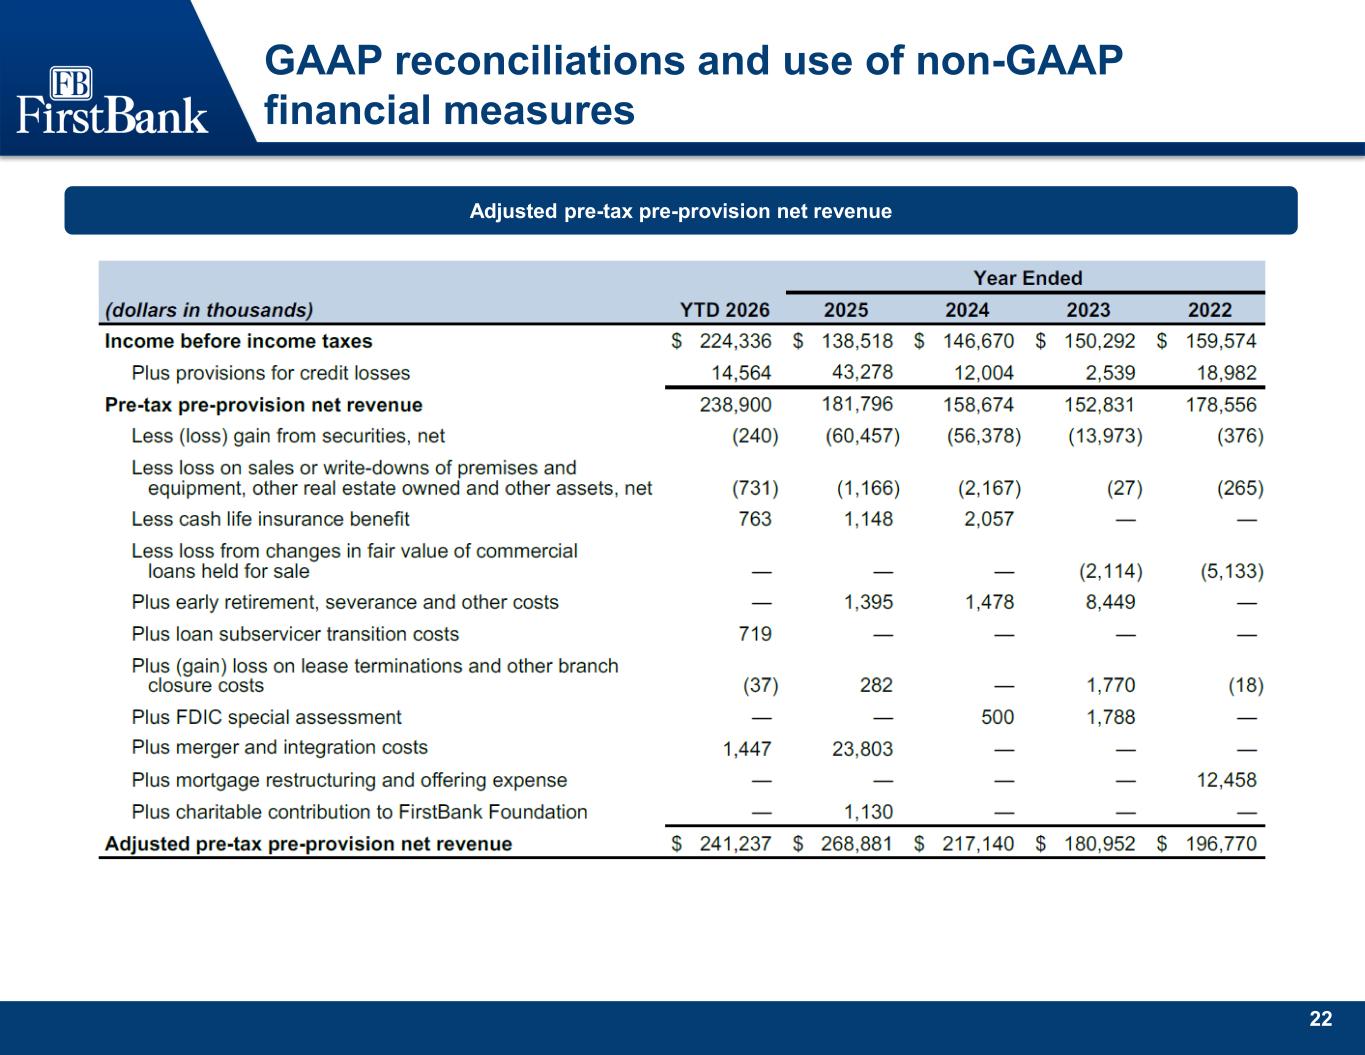
22 GAAP reconciliations and use of non-GAAP financial measures Adjusted pre-tax pre-provision net revenue
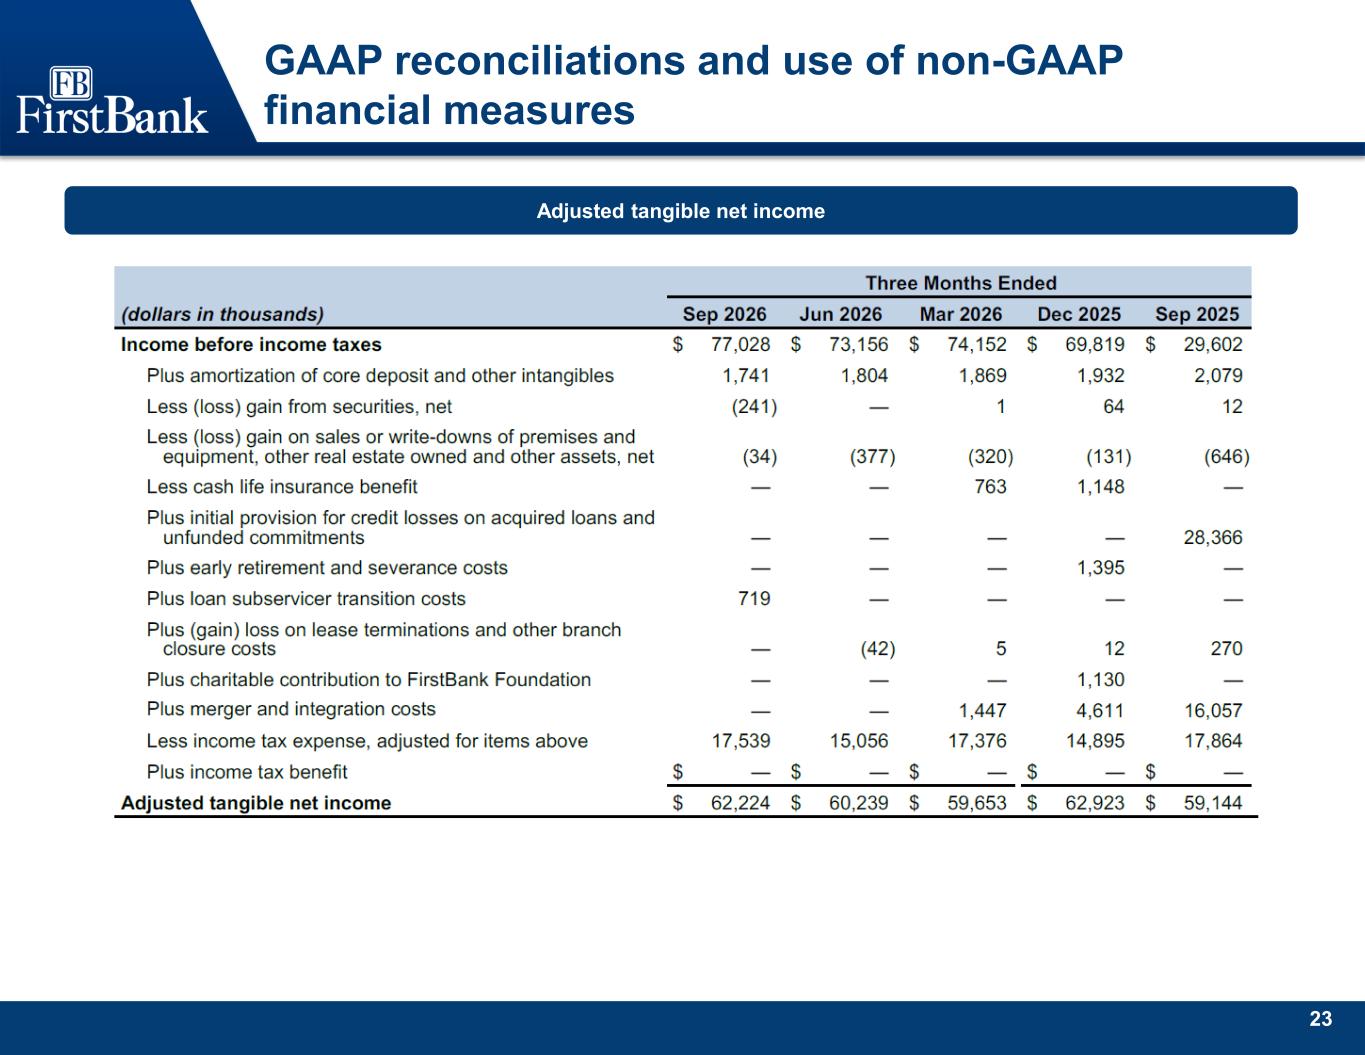
23 GAAP reconciliations and use of non-GAAP financial measures Adjusted tangible net income
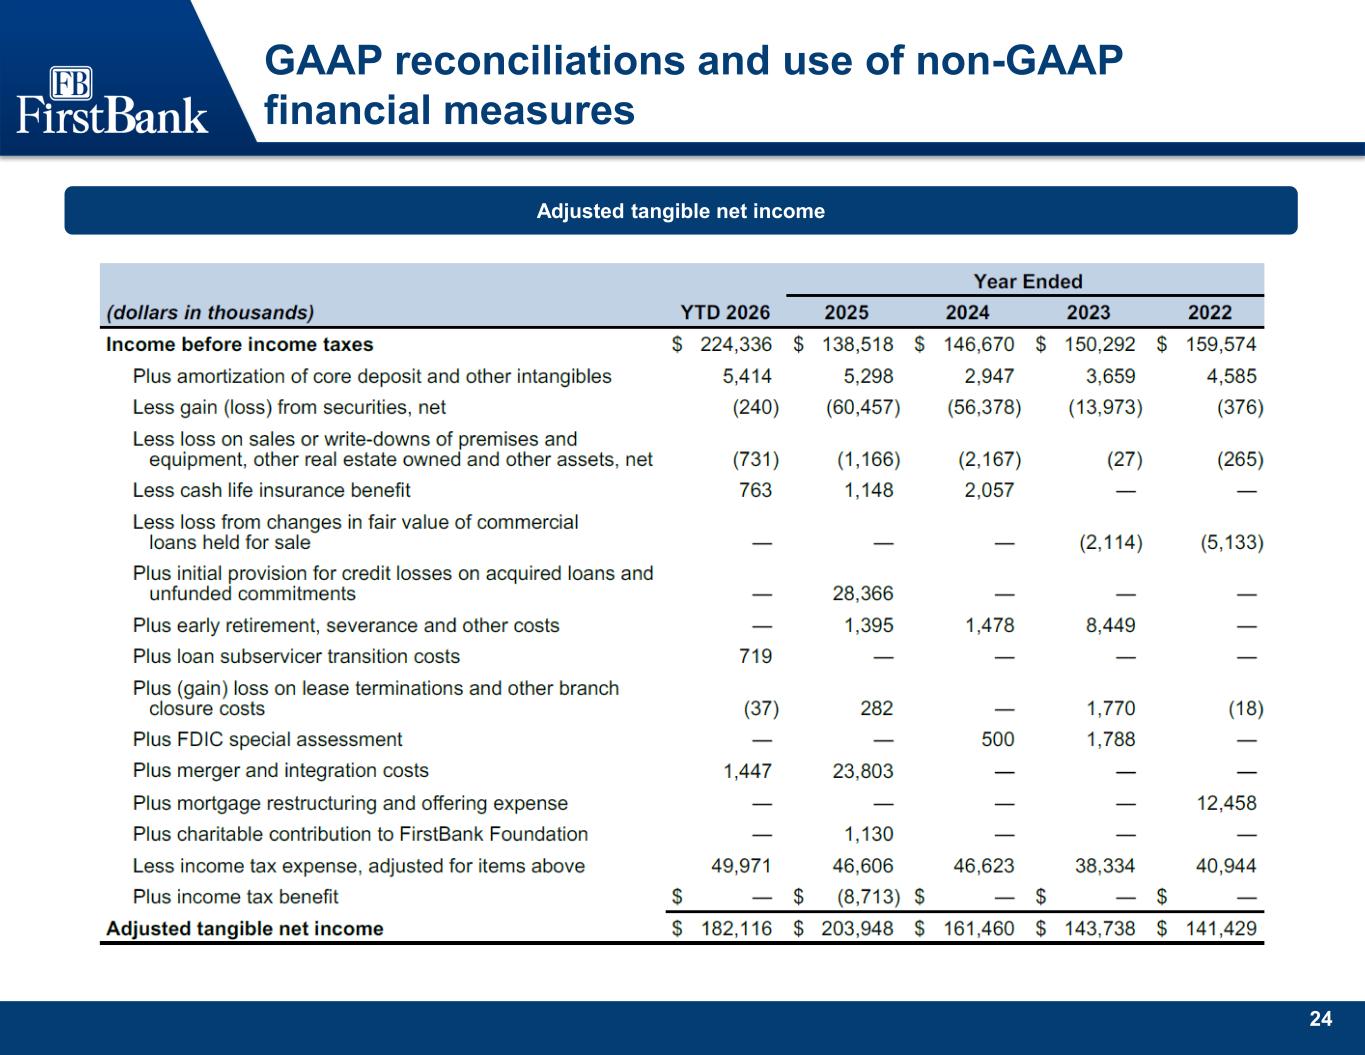
24 GAAP reconciliations and use of non-GAAP financial measures Adjusted tangible net income
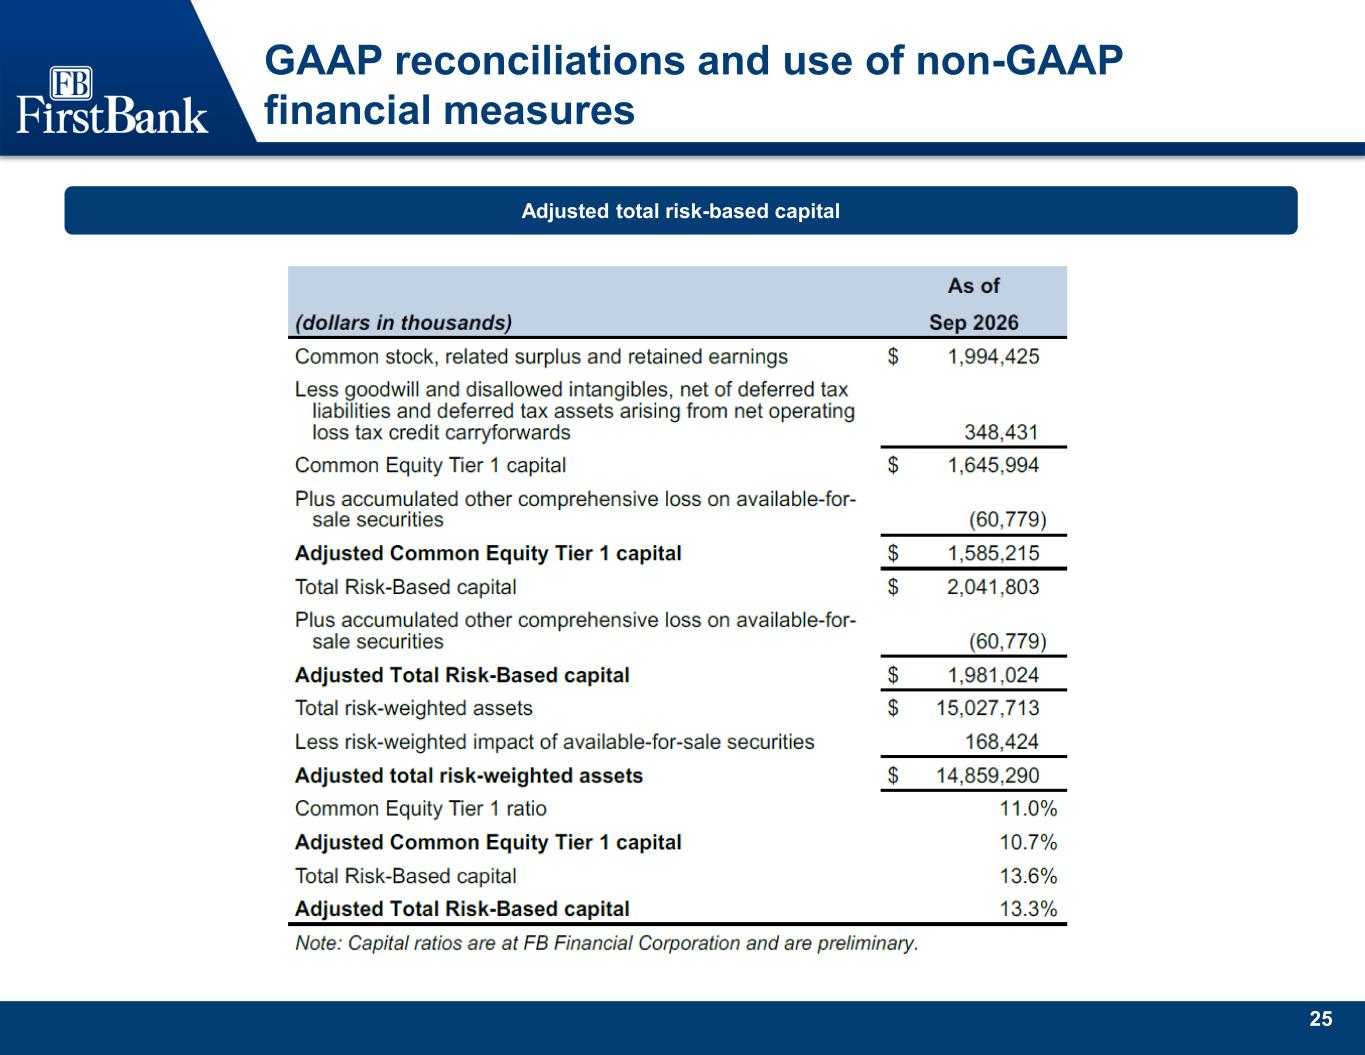
25 GAAP reconciliations and use of non-GAAP financial measures Adjusted total risk-based capital
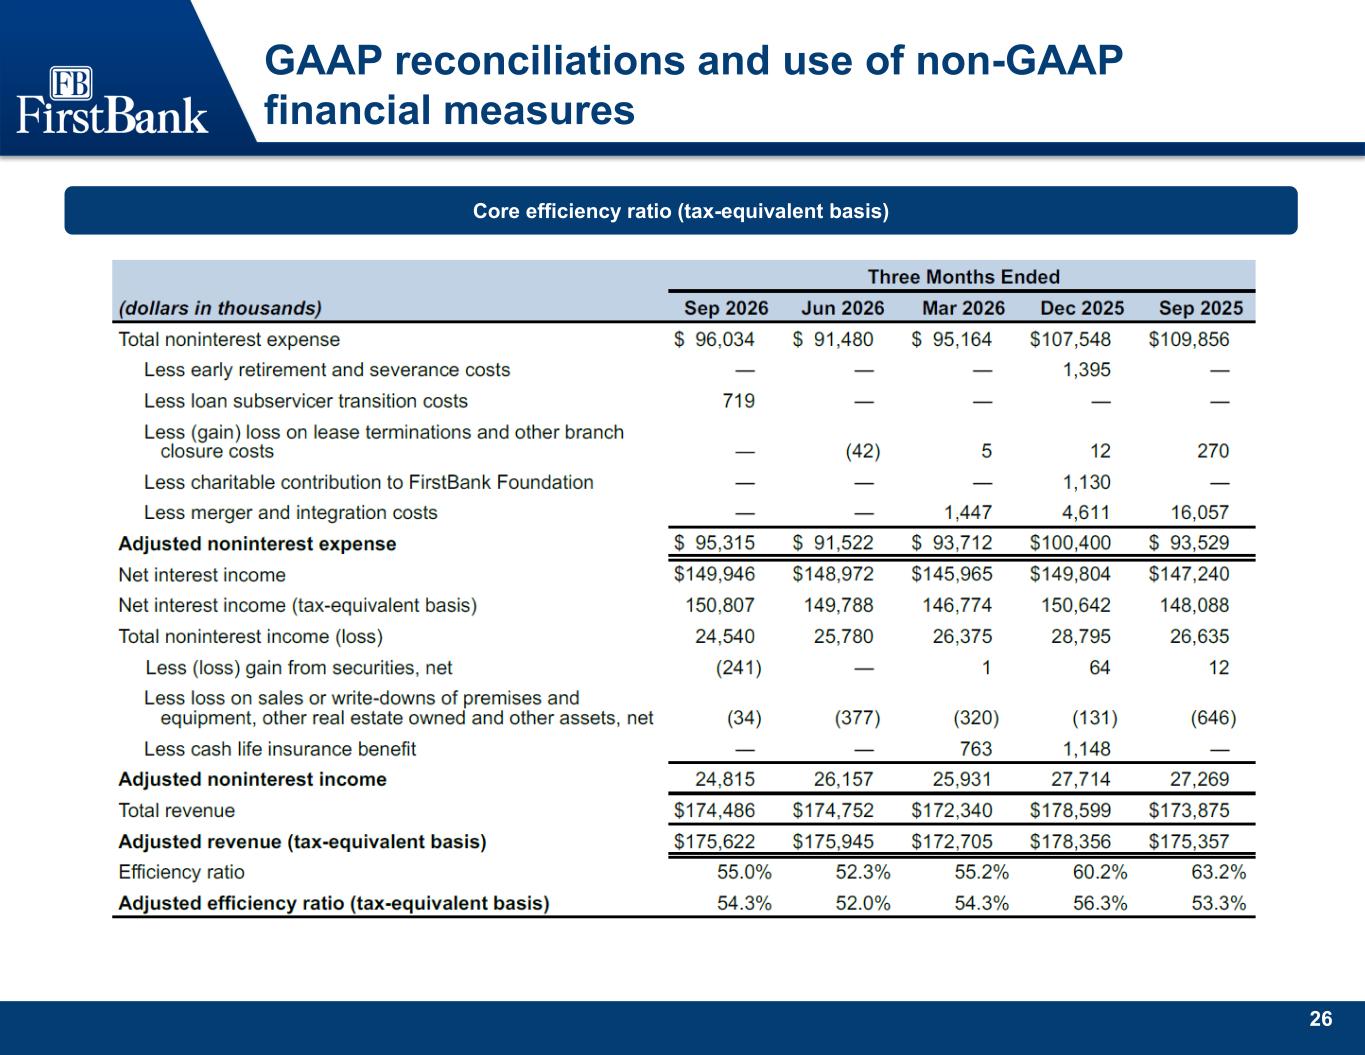
26 GAAP reconciliations and use of non-GAAP financial measures Core efficiency ratio (tax-equivalent basis)
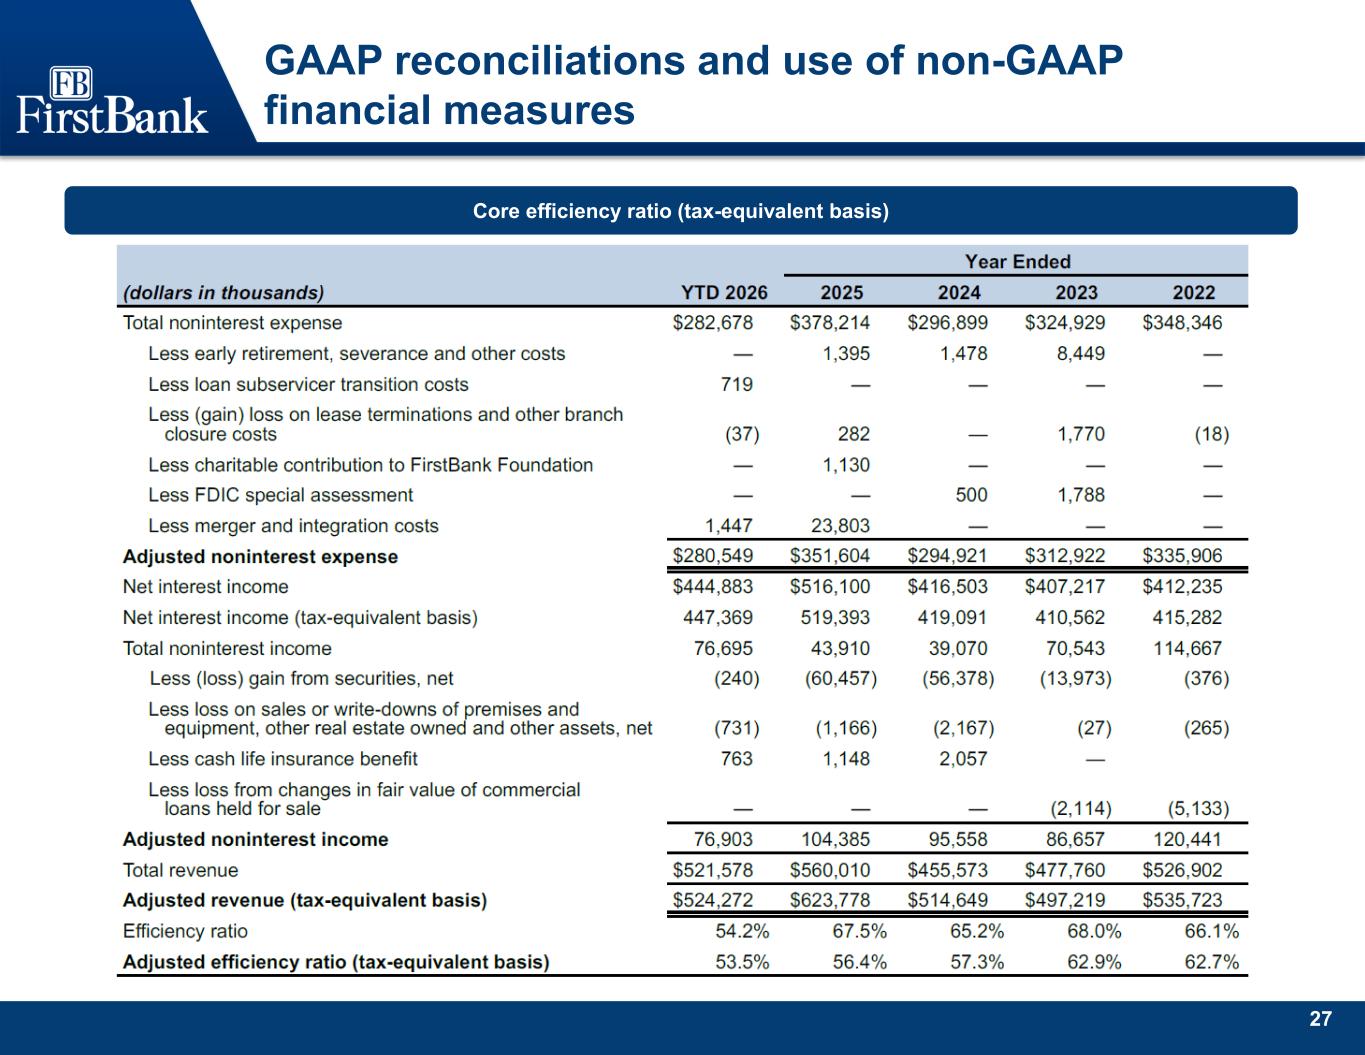
27 GAAP reconciliations and use of non-GAAP financial measures Core efficiency ratio (tax-equivalent basis)
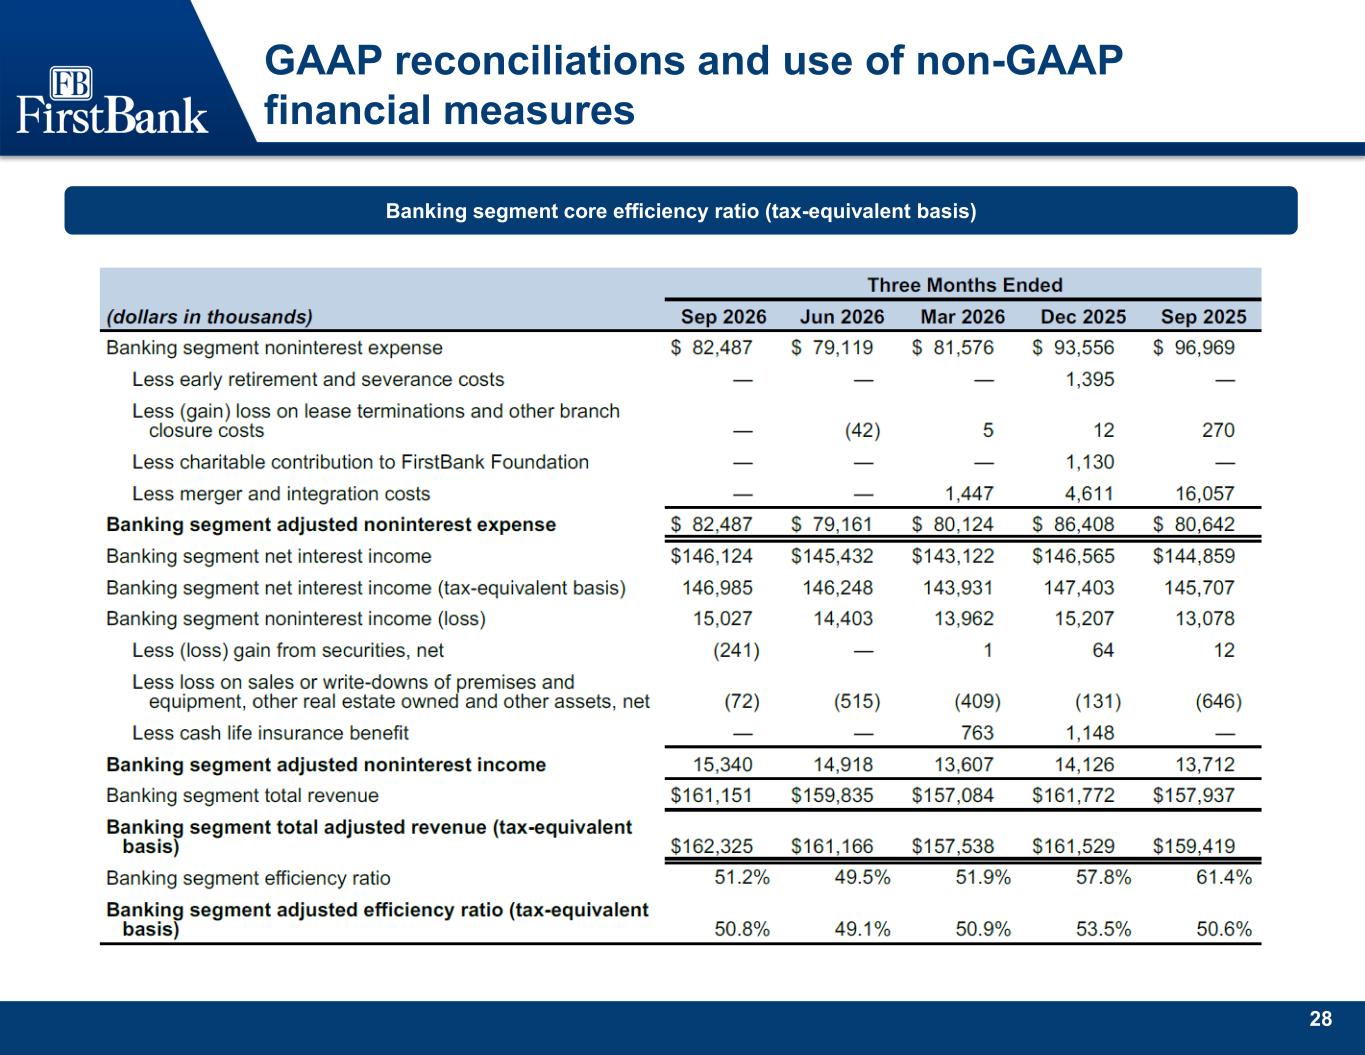
28 GAAP reconciliations and use of non-GAAP financial measures Banking segment core efficiency ratio (tax-equivalent basis)
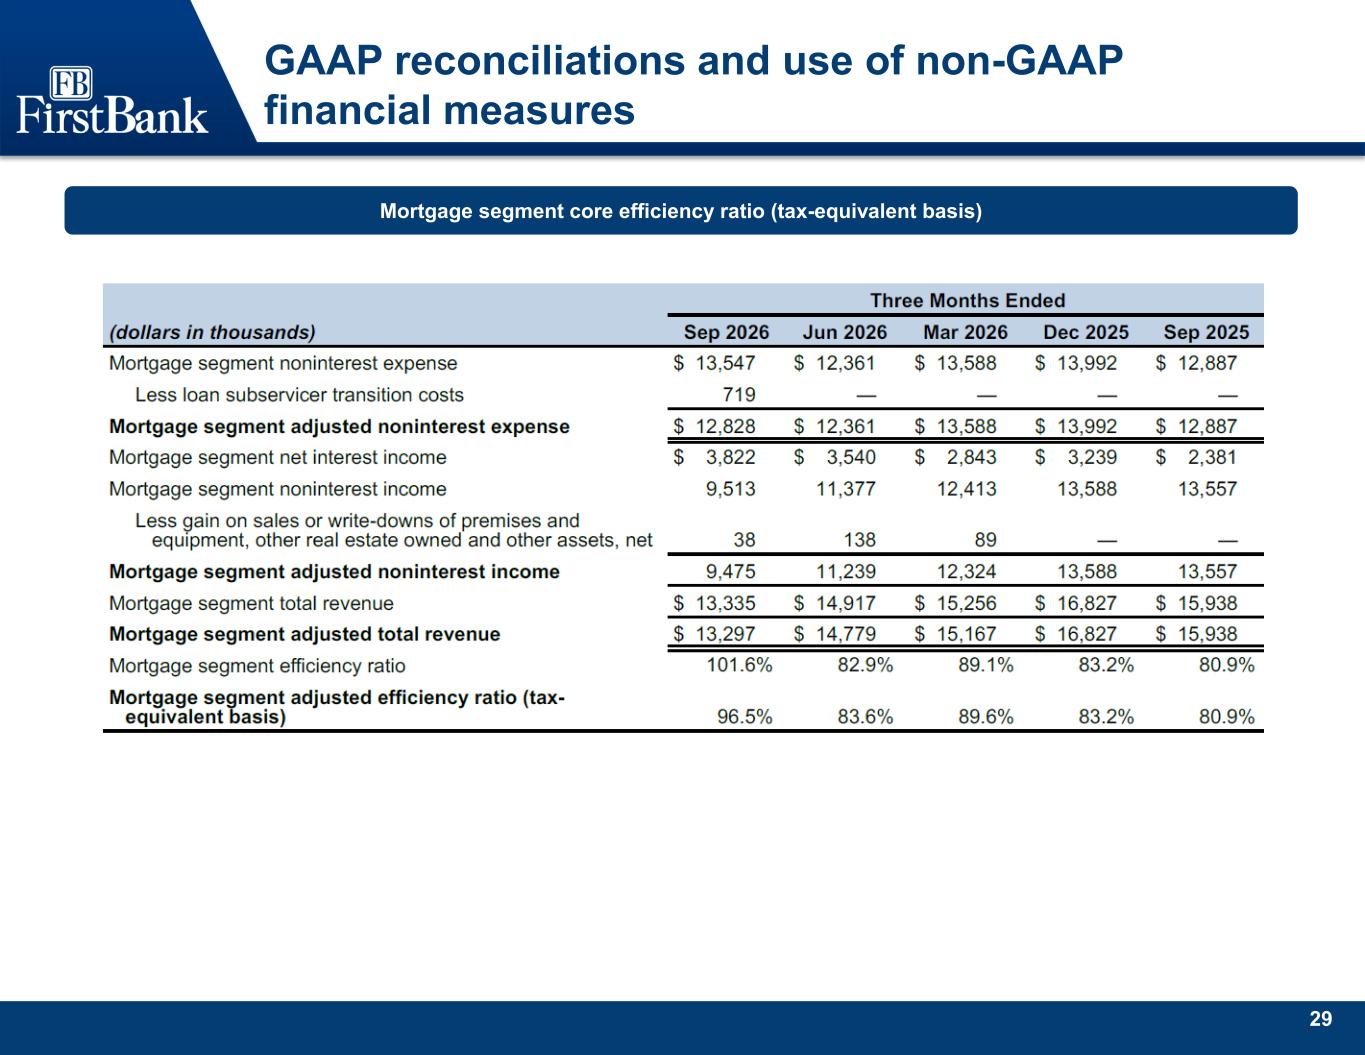
29 GAAP reconciliations and use of non-GAAP financial measures Mortgage segment core efficiency ratio (tax-equivalent basis)
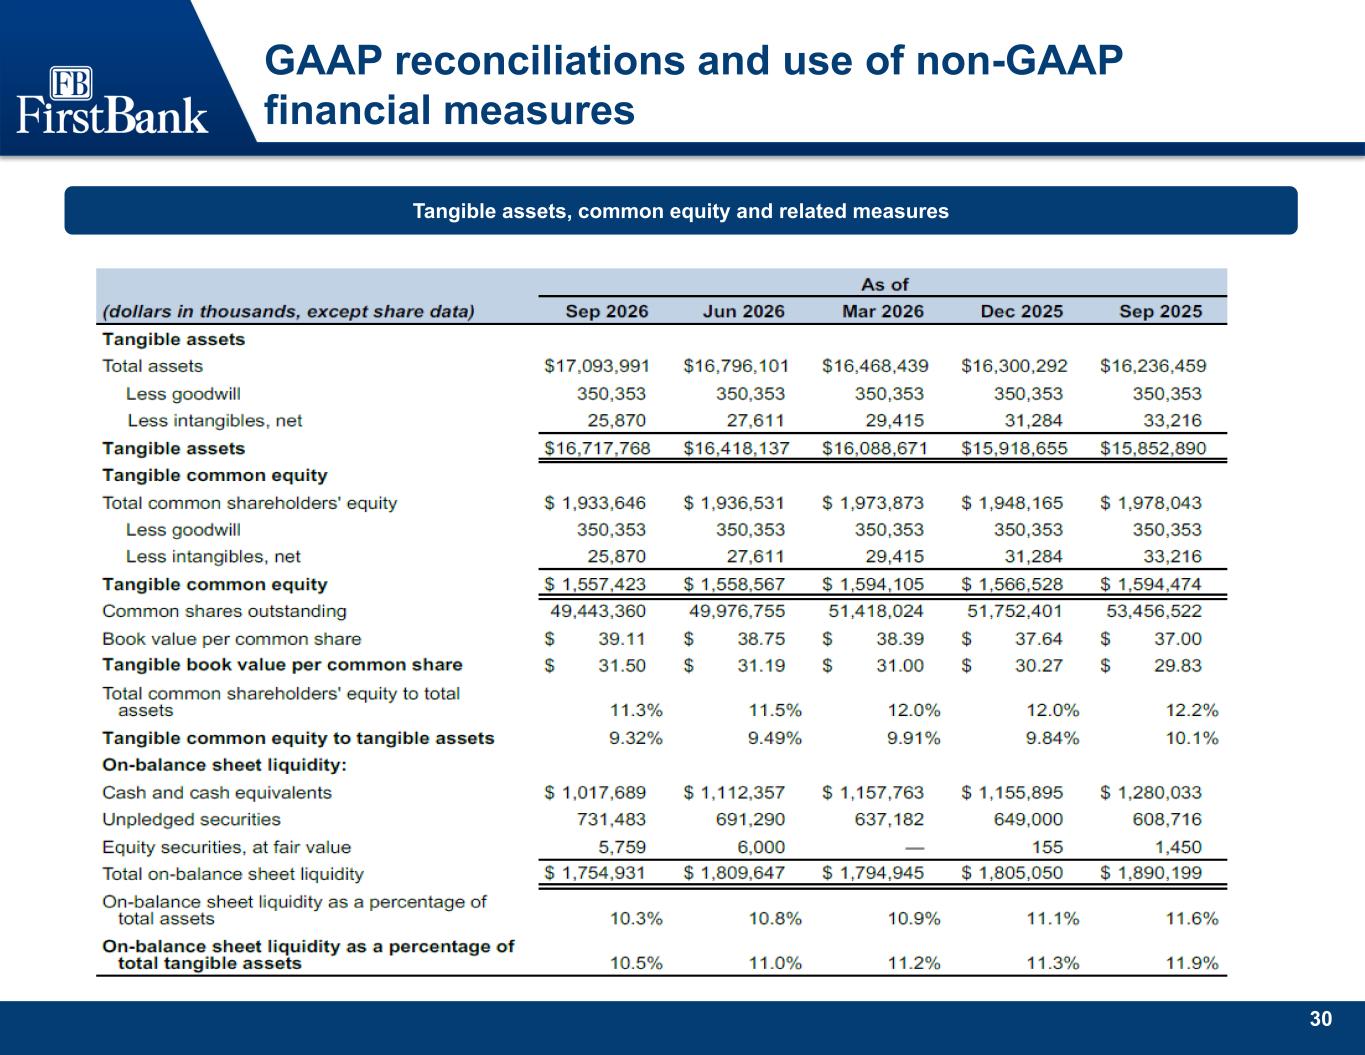
30 GAAP reconciliations and use of non-GAAP financial measures Tangible assets, common equity and related measures
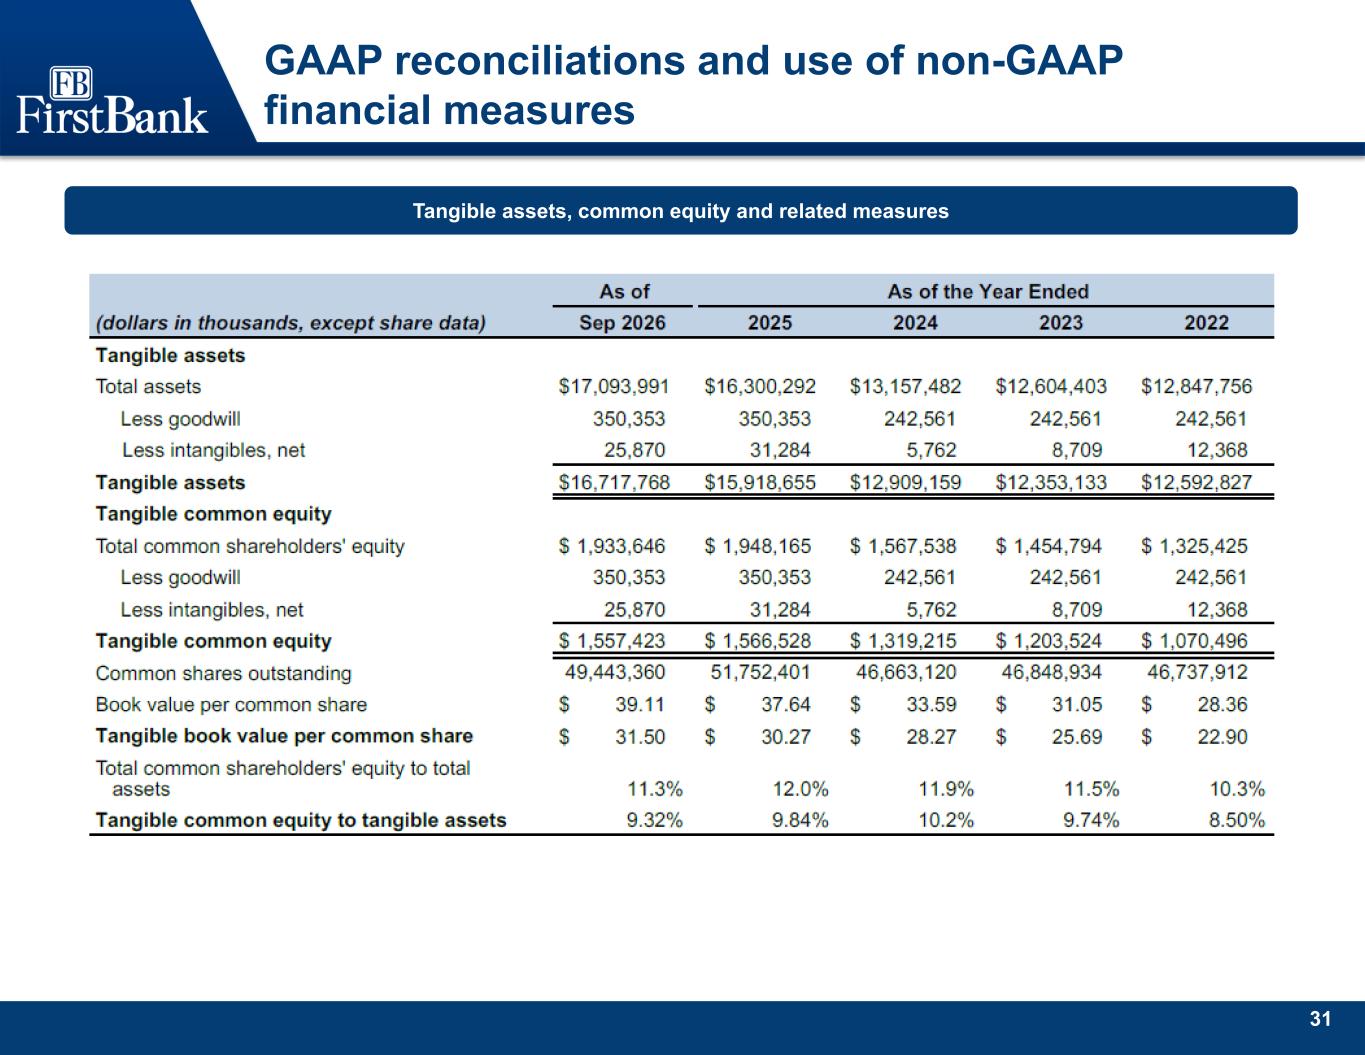
31 GAAP reconciliations and use of non-GAAP financial measures Tangible assets, common equity and related measures
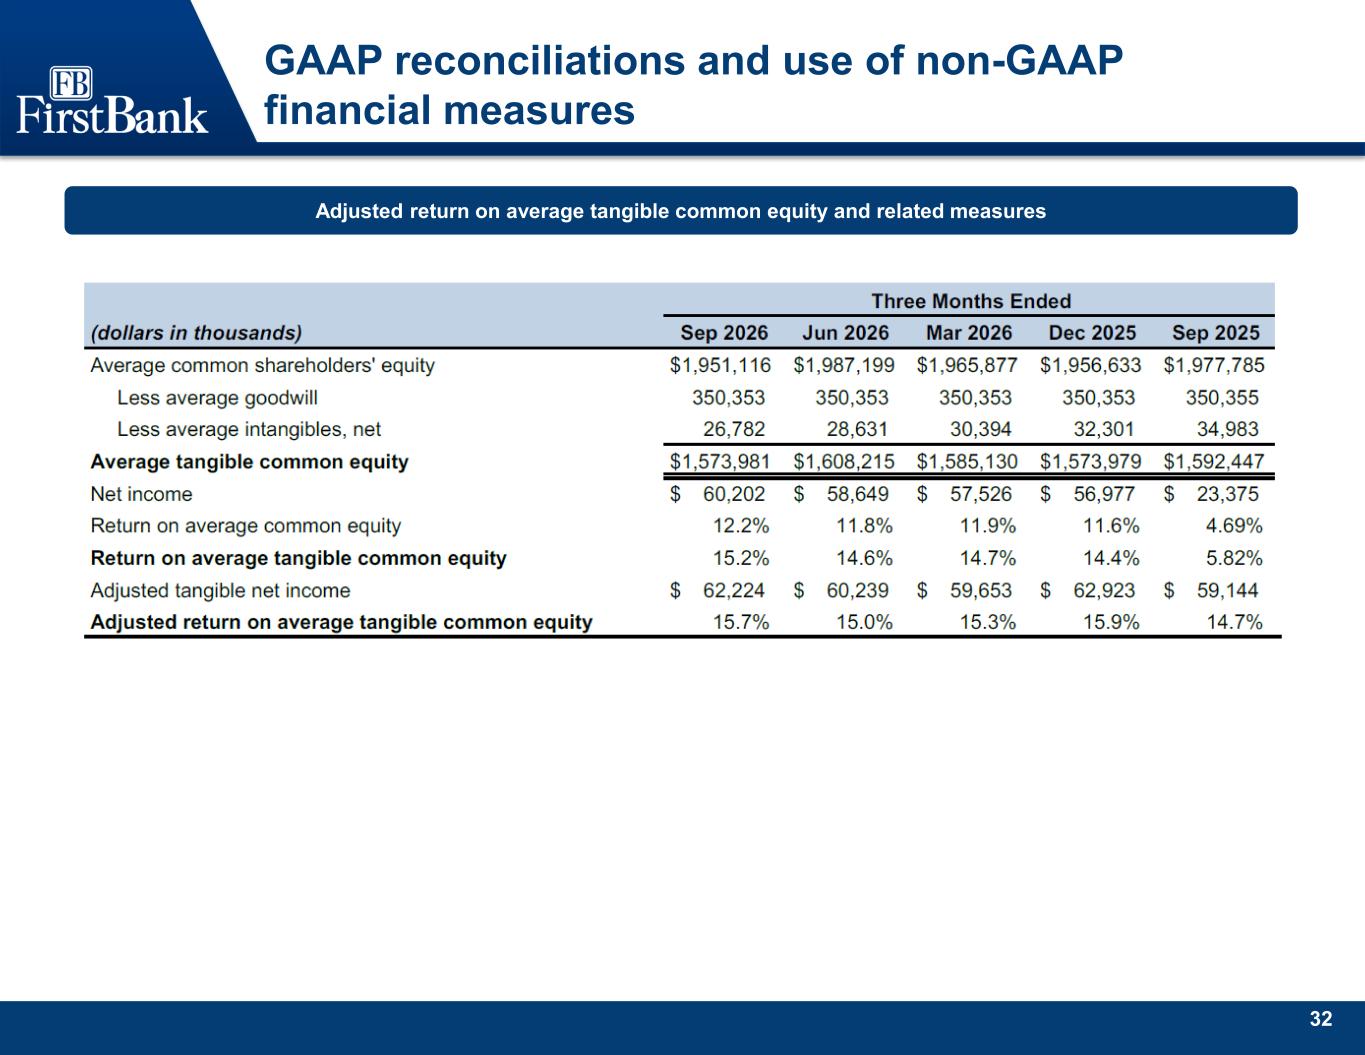
32 GAAP reconciliations and use of non-GAAP financial measures Adjusted return on average tangible common equity and related measures
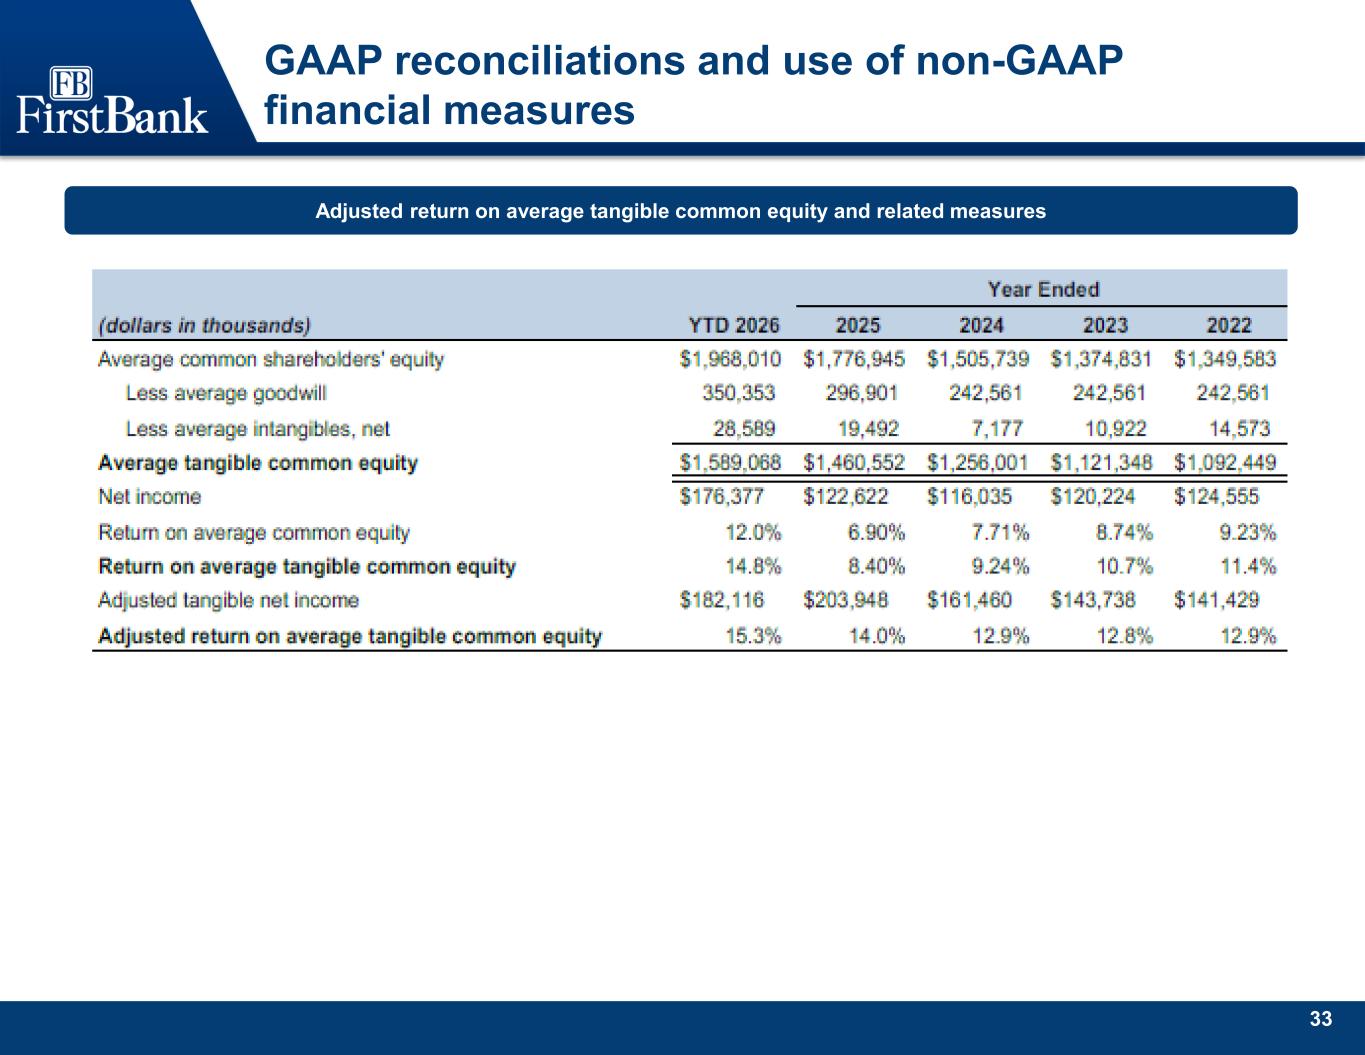
33 GAAP reconciliations and use of non-GAAP financial measures Adjusted return on average tangible common equity and related measures
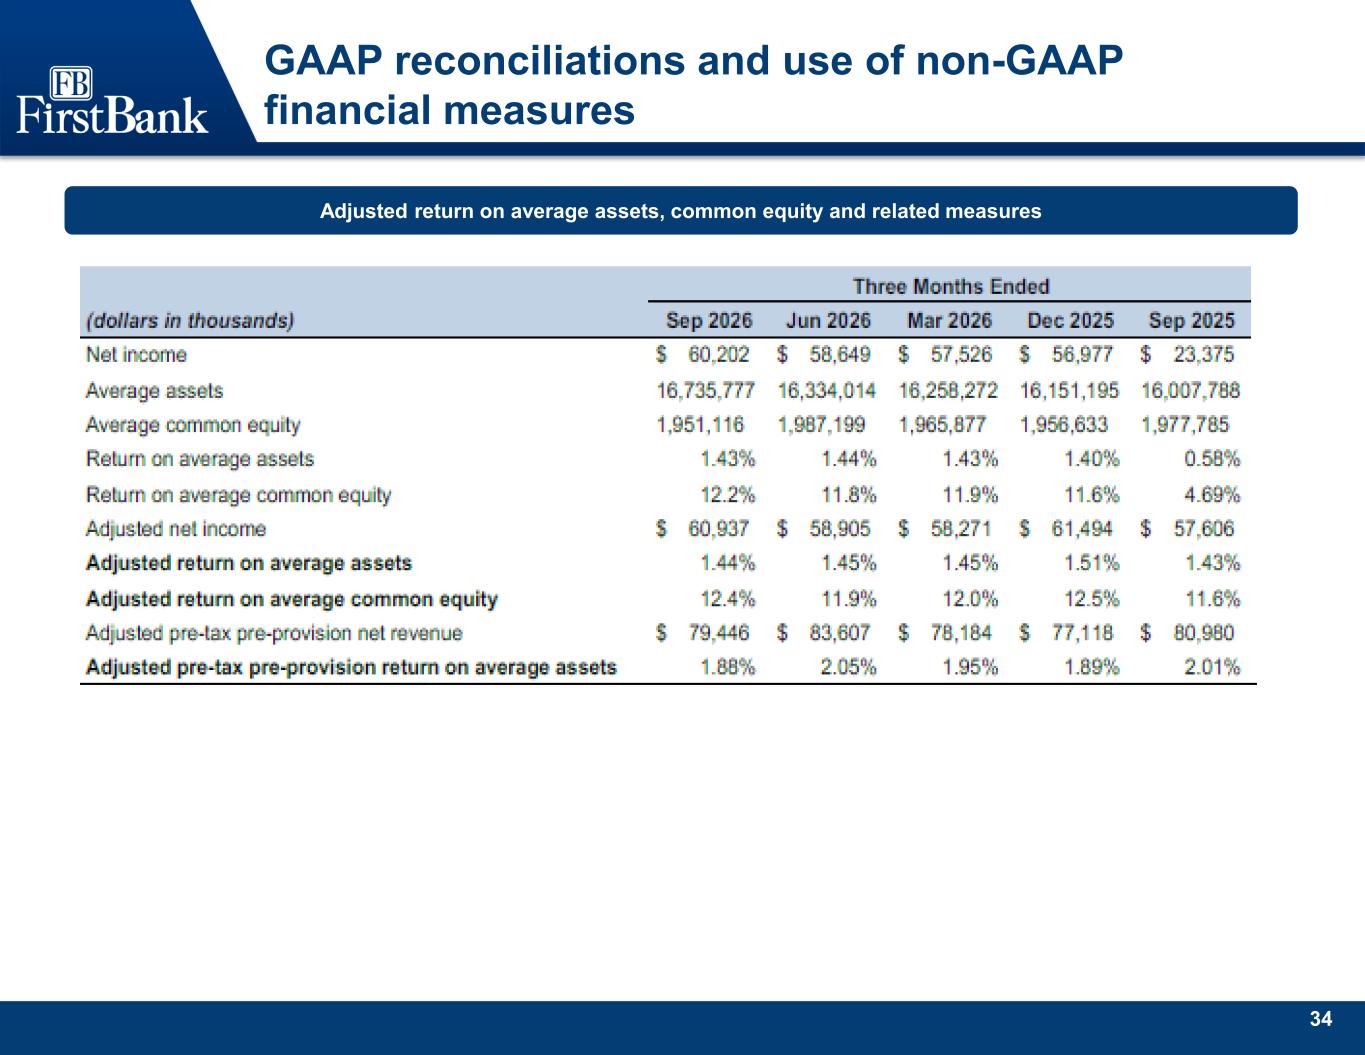
34 GAAP reconciliations and use of non-GAAP financial measures Adjusted return on average assets, common equity and related measures
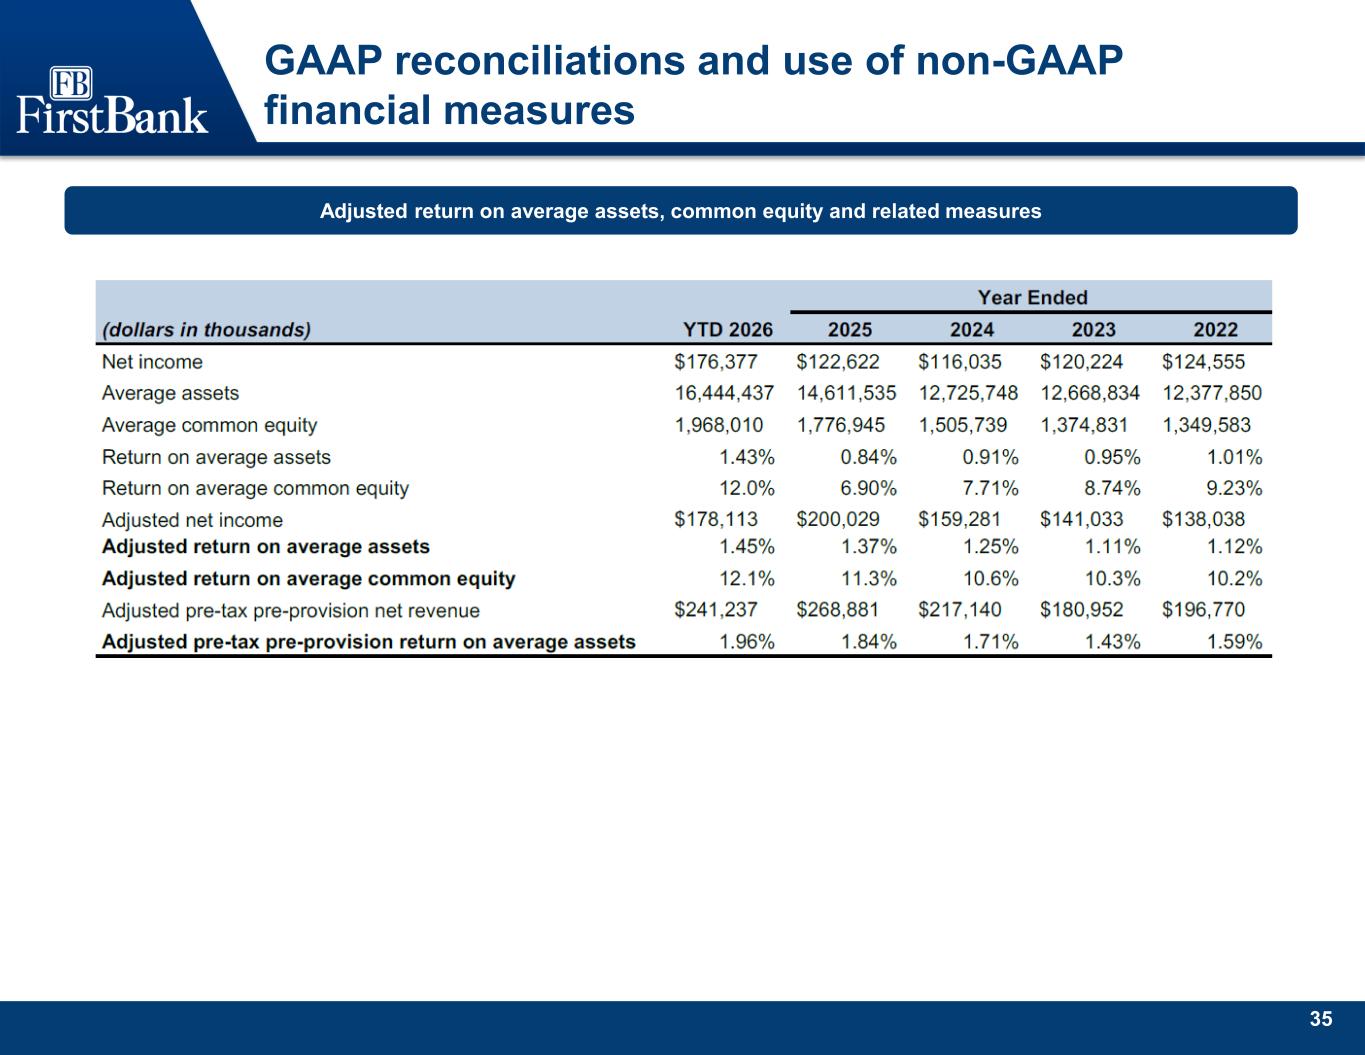
35 GAAP reconciliations and use of non-GAAP financial measures Adjusted return on average assets, common equity and related measures