Shareholder Letter Q3 2025
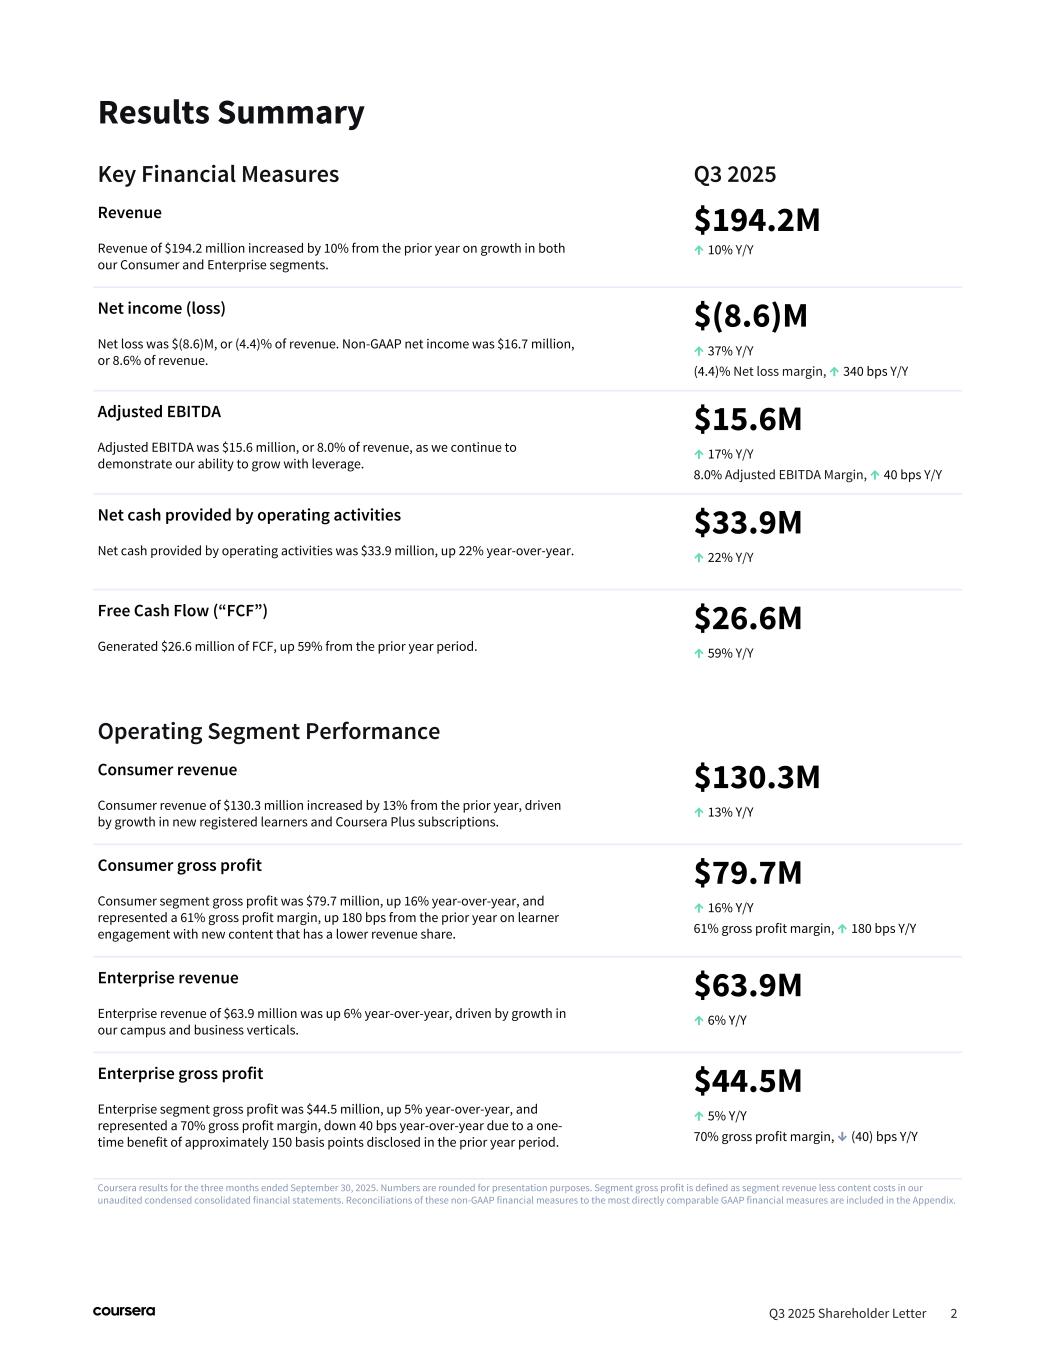
Results Summary Coursera results for the three months ended September 30, 2025. Numbers are rounded for presentation purposes. Segment gross profit is defined as segment revenue less content costs in our unaudited condensed consolidated financial statements. Reconciliations of these non-GAAP financial measures to the most directly comparable GAAP financial measures are included in the Appendix. Q3 2025 Shareholder Letter 2 Key Financial Measures Q3 2025 Revenue Revenue of $194.2 million increased by 10% from the prior year on growth in both our Consumer and Enterprise segments. $194.2M ↑ 10% Y/Y Net income (loss) Net loss was $(8.6)M, or (4.4)% of revenue. Non-GAAP net income was $16.7 million, or 8.6% of revenue. $(8.6)M ↑ 37% Y/Y (4.4)% Net loss margin, ↑ 340 bps Y/Y Adjusted EBITDA Adjusted EBITDA was $15.6 million, or 8.0% of revenue, as we continue to demonstrate our ability to grow with leverage. $15.6M ↑ 17% Y/Y 8.0% Adjusted EBITDA Margin, ↑ 40 bps Y/Y Net cash provided by operating activities Net cash provided by operating activities was $33.9 million, up 22% year-over-year. $33.9M ↑ 22% Y/Y Free Cash Flow (“FCF”) Generated $26.6 million of FCF, up 59% from the prior year period. $26.6M ↑ 59% Y/Y Operating Segment Performance Consumer revenue Consumer revenue of $130.3 million increased by 13% from the prior year, driven by growth in new registered learners and Coursera Plus subscriptions. $130.3M ↑ 13% Y/Y Consumer gross profit Consumer segment gross profit was $79.7 million, up 16% year-over-year, and represented a 61% gross profit margin, up 180 bps from the prior year on learner engagement with new content that has a lower revenue share. $79.7M ↑ 16% Y/Y 61% gross profit margin, ↑ 180 bps Y/Y Enterprise revenue Enterprise revenue of $63.9 million was up 6% year-over-year, driven by growth in our campus and business verticals. $63.9M ↑ 6% Y/Y Enterprise gross profit Enterprise segment gross profit was $44.5 million, up 5% year-over-year, and represented a 70% gross profit margin, down 40 bps year-over-year due to a one- time benefit of approximately 150 basis points disclosed in the prior year period. $44.5M ↑ 5% Y/Y 70% gross profit margin, ↓ (40) bps Y/Y
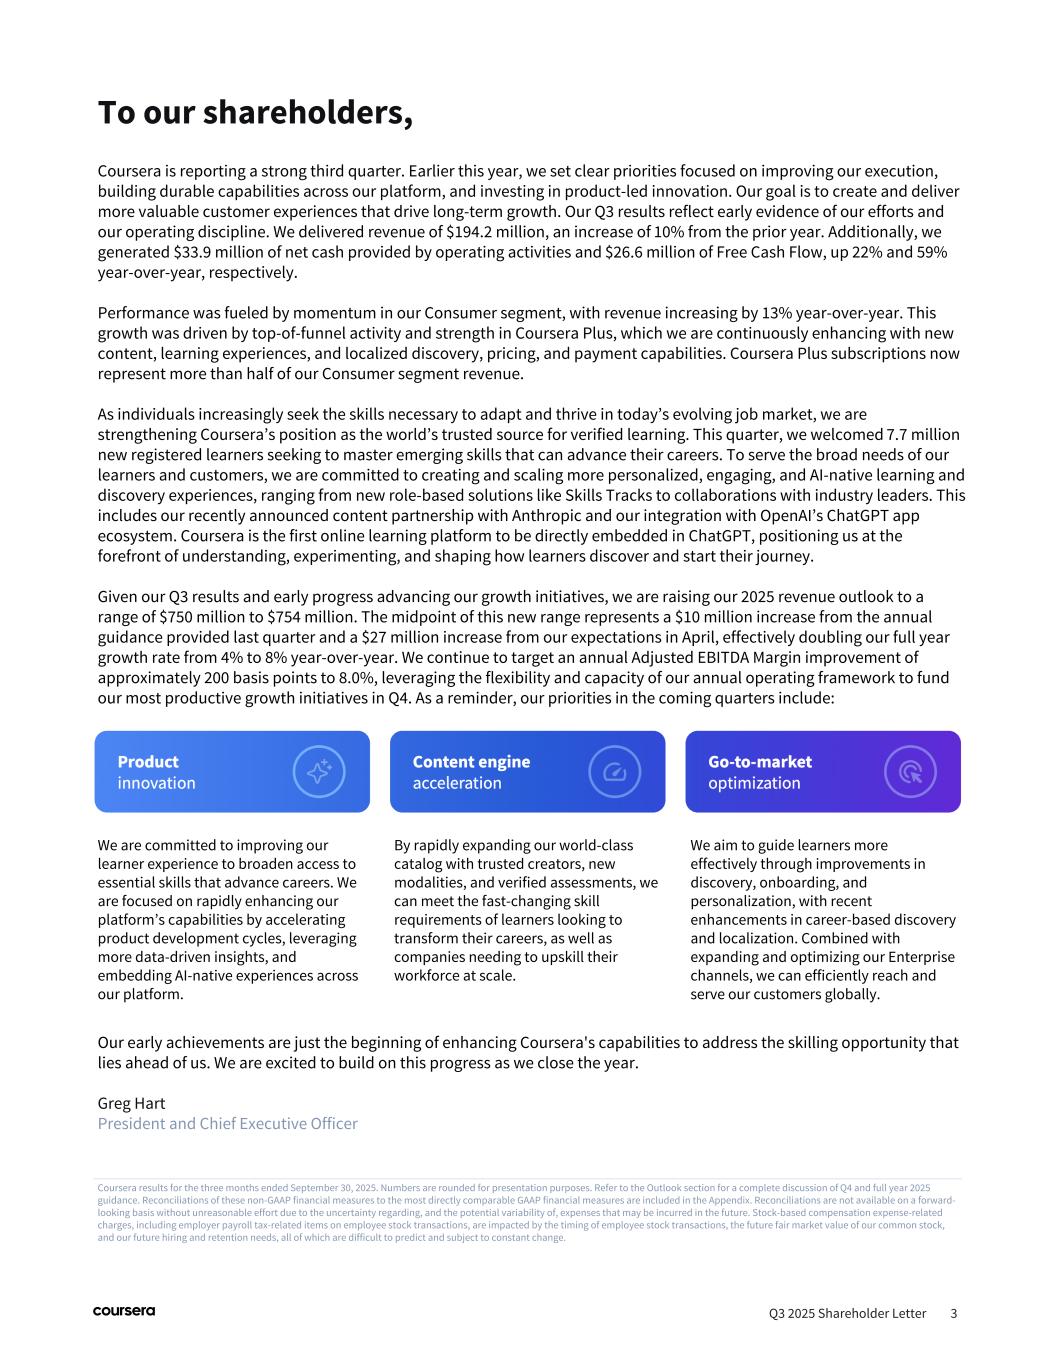
To our shareholders, Q3 2025 Shareholder Letter 3 Coursera is reporting a strong third quarter. Earlier this year, we set clear priorities focused on improving our execution, building durable capabilities across our platform, and investing in product-led innovation. Our goal is to create and deliver more valuable customer experiences that drive long-term growth. Our Q3 results reflect early evidence of our efforts and our operating discipline. We delivered revenue of $194.2 million, an increase of 10% from the prior year. Additionally, we generated $33.9 million of net cash provided by operating activities and $26.6 million of Free Cash Flow, up 22% and 59% year-over-year, respectively. Performance was fueled by momentum in our Consumer segment, with revenue increasing by 13% year-over-year. This growth was driven by top-of-funnel activity and strength in Coursera Plus, which we are continuously enhancing with new content, learning experiences, and localized discovery, pricing, and payment capabilities. Coursera Plus subscriptions now represent more than half of our Consumer segment revenue. As individuals increasingly seek the skills necessary to adapt and thrive in today’s evolving job market, we are strengthening Coursera’s position as the world’s trusted source for verified learning. This quarter, we welcomed 7.7 million new registered learners seeking to master emerging skills that can advance their careers. To serve the broad needs of our learners and customers, we are committed to creating and scaling more personalized, engaging, and AI-native learning and discovery experiences, ranging from new role-based solutions like Skills Tracks to collaborations with industry leaders. This includes our recently announced content partnership with Anthropic and our integration with OpenAI’s ChatGPT app ecosystem. Coursera is the first online learning platform to be directly embedded in ChatGPT, positioning us at the forefront of understanding, experimenting, and shaping how learners discover and start their journey. Given our Q3 results and early progress advancing our growth initiatives, we are raising our 2025 revenue outlook to a range of $750 million to $754 million. The midpoint of this new range represents a $10 million increase from the annual guidance provided last quarter and a $27 million increase from our expectations in April, effectively doubling our full year growth rate from 4% to 8% year-over-year. We continue to target an annual Adjusted EBITDA Margin improvement of approximately 200 basis points to 8.0%, leveraging the flexibility and capacity of our annual operating framework to fund our most productive growth initiatives in Q4. As a reminder, our priorities in the coming quarters include: Our early achievements are just the beginning of enhancing Coursera's capabilities to address the skilling opportunity that lies ahead of us. We are excited to build on this progress as we close the year. Greg Hart President and Chief Executive Officer Coursera results for the three months ended September 30, 2025. Numbers are rounded for presentation purposes. Refer to the Outlook section for a complete discussion of Q4 and full year 2025 guidance. Reconciliations of these non-GAAP financial measures to the most directly comparable GAAP financial measures are included in the Appendix. Reconciliations are not available on a forward- looking basis without unreasonable effort due to the uncertainty regarding, and the potential variability of, expenses that may be incurred in the future. Stock-based compensation expense-related charges, including employer payroll tax-related items on employee stock transactions, are impacted by the timing of employee stock transactions, the future fair market value of our common stock, and our future hiring and retention needs, all of which are difficult to predict and subject to constant change. We are committed to improving our learner experience to broaden access to essential skills that advance careers. We are focused on rapidly enhancing our platform’s capabilities by accelerating product development cycles, leveraging more data-driven insights, and embedding AI-native experiences across our platform. By rapidly expanding our world-class catalog with trusted creators, new modalities, and verified assessments, we can meet the fast-changing skill requirements of learners looking to transform their careers, as well as companies needing to upskill their workforce at scale. We aim to guide learners more effectively through improvements in discovery, onboarding, and personalization, with recent enhancements in career-based discovery and localization. Combined with expanding and optimizing our Enterprise channels, we can efficiently reach and serve our customers globally.
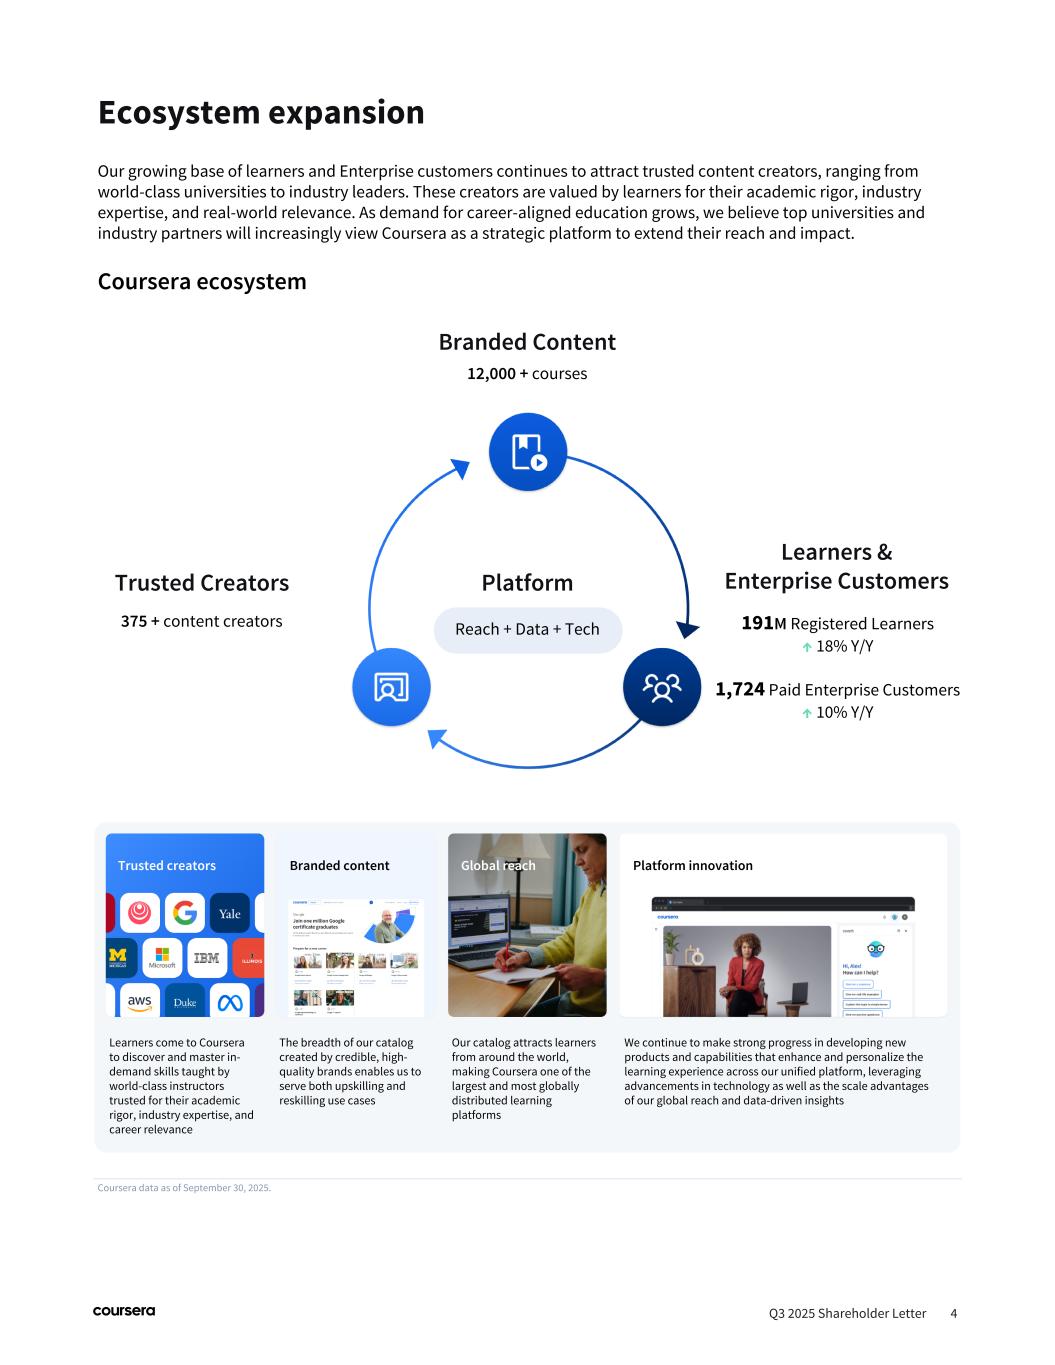
Ecosystem expansion Q3 2025 Shareholder Letter 4 Our growing base of learners and Enterprise customers continues to attract trusted content creators, ranging from world-class universities to industry leaders. These creators are valued by learners for their academic rigor, industry expertise, and real-world relevance. As demand for career-aligned education grows, we believe top universities and industry partners will increasingly view Coursera as a strategic platform to extend their reach and impact. Coursera ecosystem Coursera data as of September 30, 2025. Trusted creators Branded content Global reach Platform innovation Learners come to Coursera to discover and master in- demand skills taught by world-class instructors trusted for their academic rigor, industry expertise, and career relevance The breadth of our catalog created by credible, high- quality brands enables us to serve both upskilling and reskilling use cases Our catalog attracts learners from around the world, making Coursera one of the largest and most globally distributed learning platforms We continue to make strong progress in developing new products and capabilities that enhance and personalize the learning experience across our unified platform, leveraging advancements in technology as well as the scale advantages of our global reach and data-driven insights Trusted Creators Learners & Enterprise Customers 375 + content creators Platform Reach + Data + Tech Branded Content 12,000 + courses 191M Registered Learners ↑ 18% Y/Y 1,724 Paid Enterprise Customers ↑ 10% Y/Y
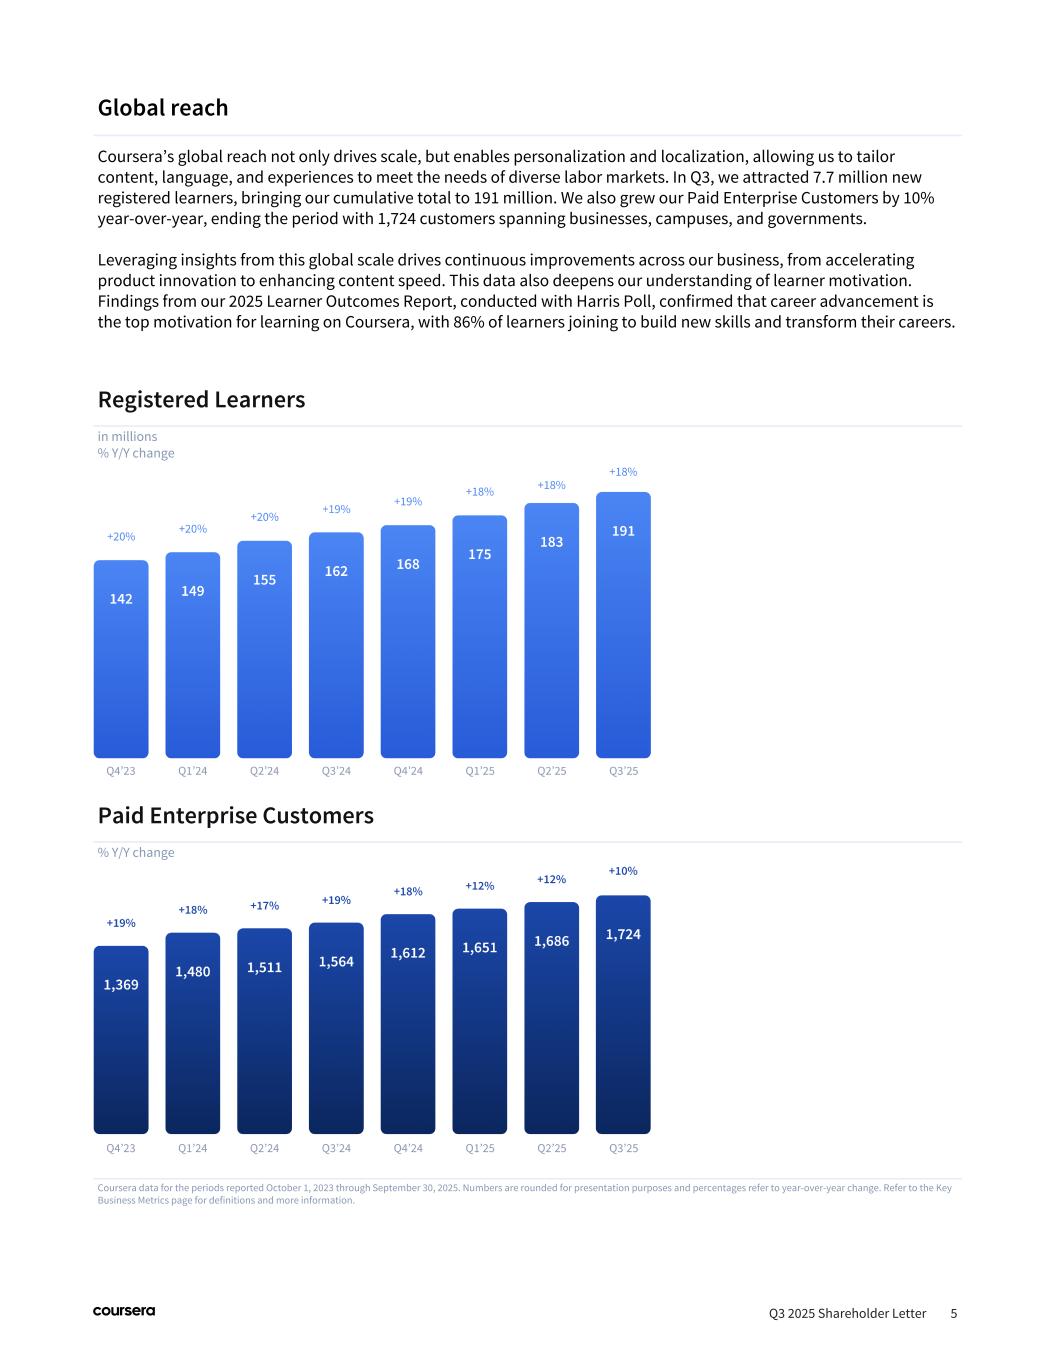
Q3 2025 Shareholder Letter 5 Paid Enterprise Customers % Y/Y change Registered Learners in millions % Y/Y change Coursera data for the periods reported October 1, 2023 through September 30, 2025. Numbers are rounded for presentation purposes and percentages refer to year-over-year change. Refer to the Key Business Metrics page for definitions and more information. Global reach Coursera’s global reach not only drives scale, but enables personalization and localization, allowing us to tailor content, language, and experiences to meet the needs of diverse labor markets. In Q3, we attracted 7.7 million new registered learners, bringing our cumulative total to 191 million. We also grew our Paid Enterprise Customers by 10% year-over-year, ending the period with 1,724 customers spanning businesses, campuses, and governments. Leveraging insights from this global scale drives continuous improvements across our business, from accelerating product innovation to enhancing content speed. This data also deepens our understanding of learner motivation. Findings from our 2025 Learner Outcomes Report, conducted with Harris Poll, confirmed that career advancement is the top motivation for learning on Coursera, with 86% of learners joining to build new skills and transform their careers.
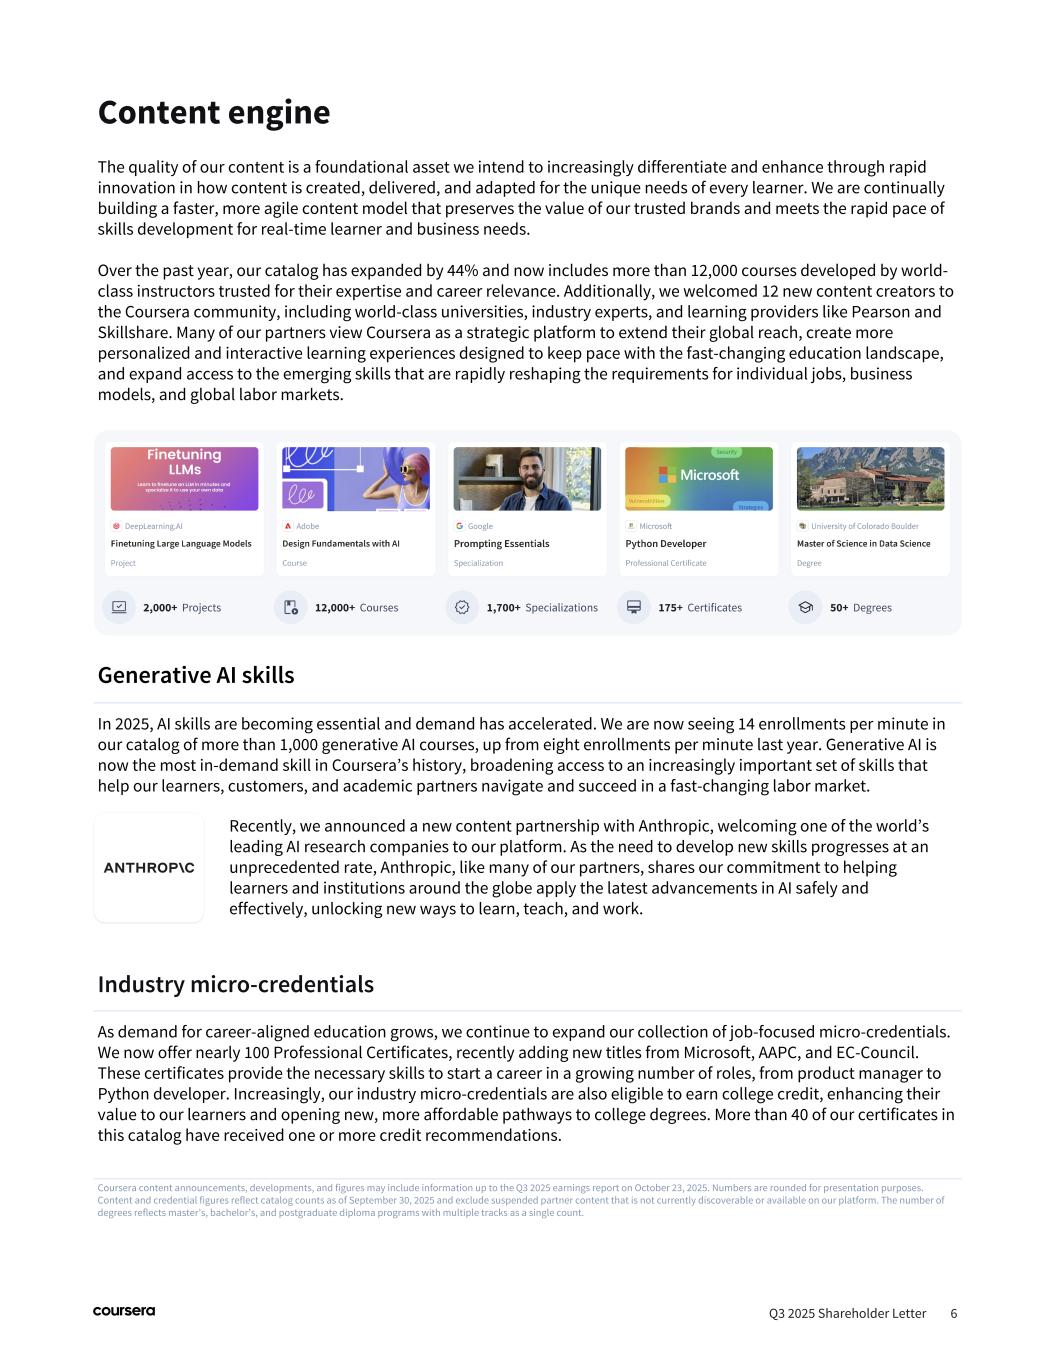
Content engine Coursera content announcements, developments, and figures may include information up to the Q3 2025 earnings report on October 23, 2025. Numbers are rounded for presentation purposes. Content and credential figures reflect catalog counts as of September 30, 2025 and exclude suspended partner content that is not currently discoverable or available on our platform. The number of degrees reflects master’s, bachelor’s, and postgraduate diploma programs with multiple tracks as a single count. Q3 2025 Shareholder Letter 6 The quality of our content is a foundational asset we intend to increasingly differentiate and enhance through rapid innovation in how content is created, delivered, and adapted for the unique needs of every learner. We are continually building a faster, more agile content model that preserves the value of our trusted brands and meets the rapid pace of skills development for real-time learner and business needs. Over the past year, our catalog has expanded by 44% and now includes more than 12,000 courses developed by world- class instructors trusted for their expertise and career relevance. Additionally, we welcomed 12 new content creators to the Coursera community, including world-class universities, industry experts, and learning providers like Pearson and Skillshare. Many of our partners view Coursera as a strategic platform to extend their global reach, create more personalized and interactive learning experiences designed to keep pace with the fast-changing education landscape, and expand access to the emerging skills that are rapidly reshaping the requirements for individual jobs, business models, and global labor markets. Recently, we announced a new content partnership with Anthropic, welcoming one of the world’s leading AI research companies to our platform. As the need to develop new skills progresses at an unprecedented rate, Anthropic, like many of our partners, shares our commitment to helping learners and institutions around the globe apply the latest advancements in AI safely and effectively, unlocking new ways to learn, teach, and work. Industry micro-credentials As demand for career-aligned education grows, we continue to expand our collection of job-focused micro-credentials. We now offer nearly 100 Professional Certificates, recently adding new titles from Microsoft, AAPC, and EC-Council. These certificates provide the necessary skills to start a career in a growing number of roles, from product manager to Python developer. Increasingly, our industry micro-credentials are also eligible to earn college credit, enhancing their value to our learners and opening new, more affordable pathways to college degrees. More than 40 of our certificates in this catalog have received one or more credit recommendations. Generative AI skills In 2025, AI skills are becoming essential and demand has accelerated. We are now seeing 14 enrollments per minute in our catalog of more than 1,000 generative AI courses, up from eight enrollments per minute last year. Generative AI is now the most in-demand skill in Coursera’s history, broadening access to an increasingly important set of skills that help our learners, customers, and academic partners navigate and succeed in a fast-changing labor market.
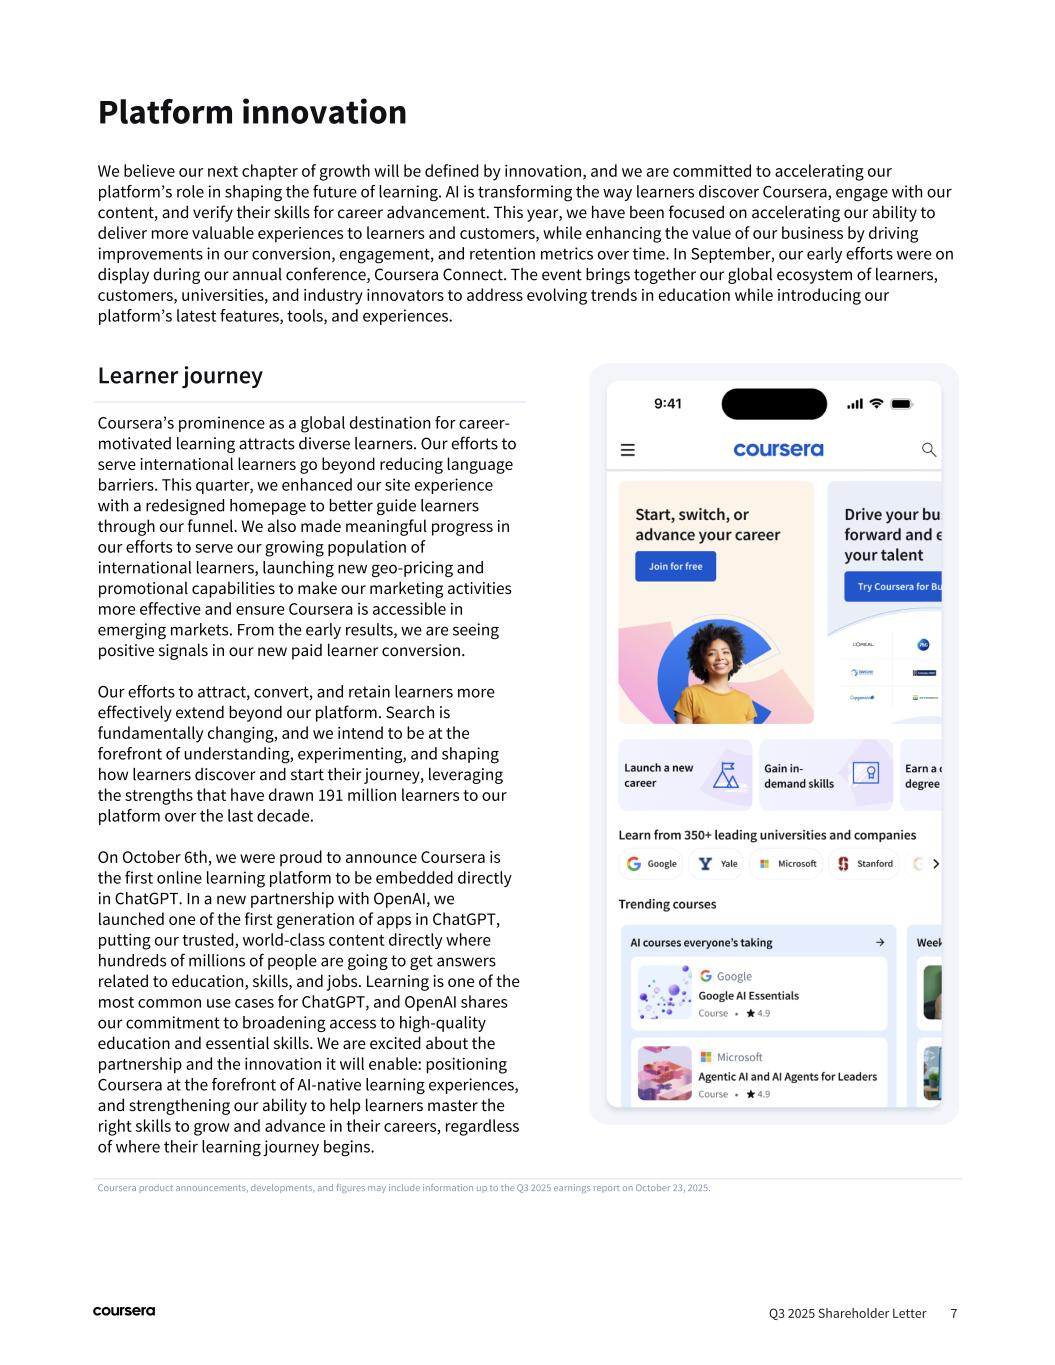
Platform innovation Coursera product announcements, developments, and figures may include information up to the Q3 2025 earnings report on October 23, 2025. Q3 2025 Shareholder Letter 7 We believe our next chapter of growth will be defined by innovation, and we are committed to accelerating our platform’s role in shaping the future of learning. AI is transforming the way learners discover Coursera, engage with our content, and verify their skills for career advancement. This year, we have been focused on accelerating our ability to deliver more valuable experiences to learners and customers, while enhancing the value of our business by driving improvements in our conversion, engagement, and retention metrics over time. In September, our early efforts were on display during our annual conference, Coursera Connect. The event brings together our global ecosystem of learners, customers, universities, and industry innovators to address evolving trends in education while introducing our platform’s latest features, tools, and experiences. Learner journey Coursera’s prominence as a global destination for career- motivated learning attracts diverse learners. Our efforts to serve international learners go beyond reducing language barriers. This quarter, we enhanced our site experience with a redesigned homepage to better guide learners through our funnel. We also made meaningful progress in our efforts to serve our growing population of international learners, launching new geo-pricing and promotional capabilities to make our marketing activities more effective and ensure Coursera is accessible in emerging markets. From the early results, we are seeing positive signals in our new paid learner conversion. Our efforts to attract, convert, and retain learners more effectively extend beyond our platform. Search is fundamentally changing, and we intend to be at the forefront of understanding, experimenting, and shaping how learners discover and start their journey, leveraging the strengths that have drawn 191 million learners to our platform over the last decade. On October 6th, we were proud to announce Coursera is the first online learning platform to be embedded directly in ChatGPT. In a new partnership with OpenAI, we launched one of the first generation of apps in ChatGPT, putting our trusted, world-class content directly where hundreds of millions of people are going to get answers related to education, skills, and jobs. Learning is one of the most common use cases for ChatGPT, and OpenAI shares our commitment to broadening access to high-quality education and essential skills. We are excited about the partnership and the innovation it will enable: positioning Coursera at the forefront of AI-native learning experiences, and strengthening our ability to help learners master the right skills to grow and advance in their careers, regardless of where their learning journey begins.
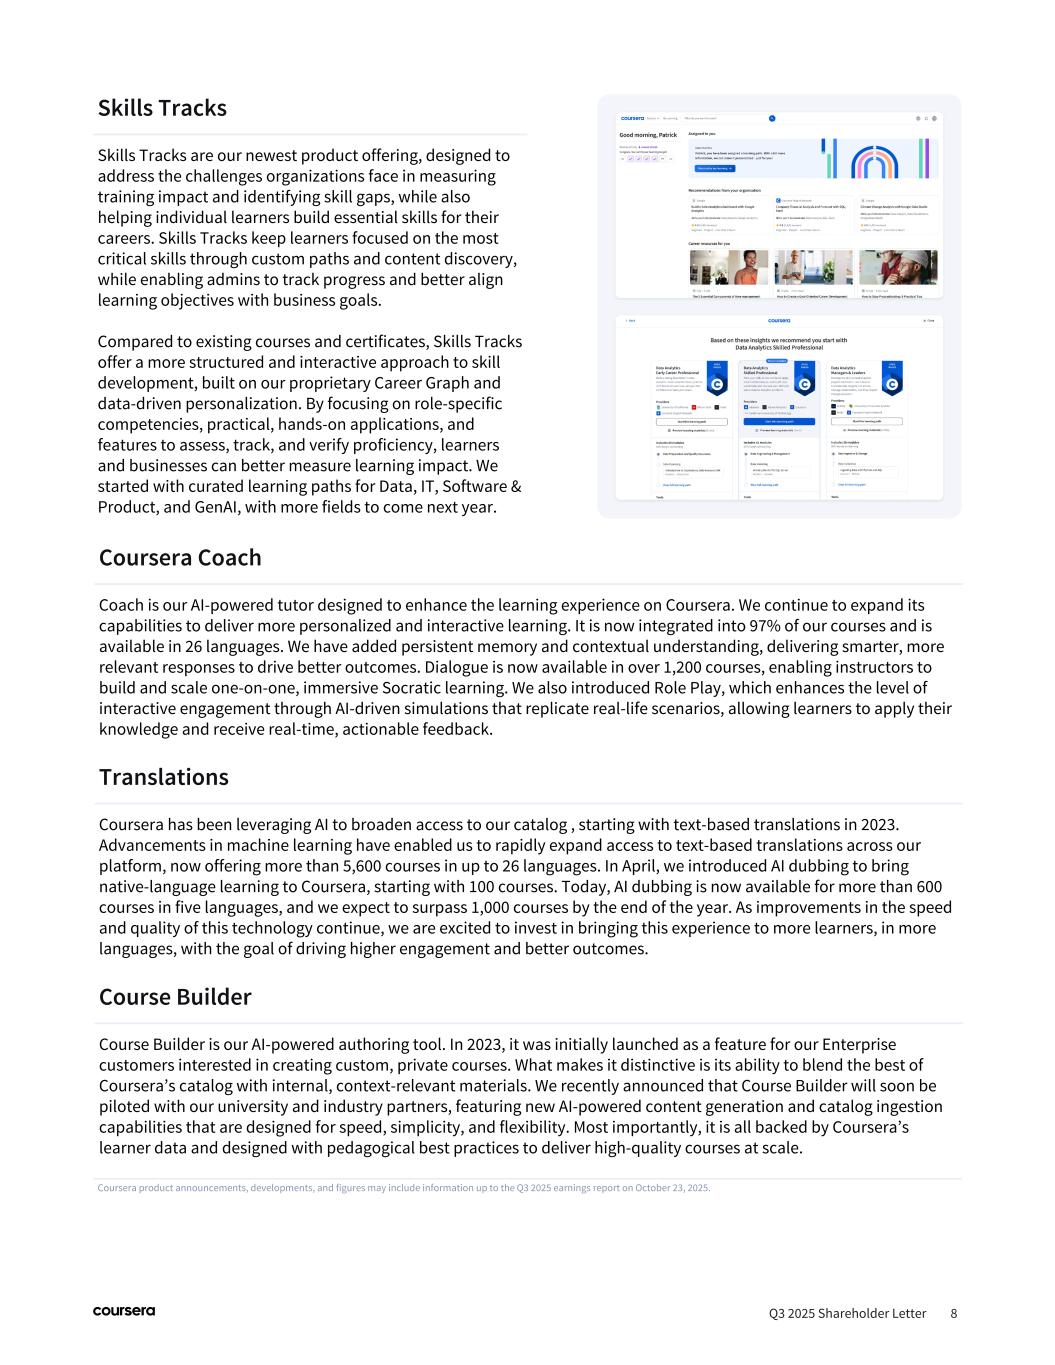
Coursera product announcements, developments, and figures may include information up to the Q3 2025 earnings report on October 23, 2025. Q3 2025 Shareholder Letter 8 Skills Tracks Skills Tracks are our newest product offering, designed to address the challenges organizations face in measuring training impact and identifying skill gaps, while also helping individual learners build essential skills for their careers. Skills Tracks keep learners focused on the most critical skills through custom paths and content discovery, while enabling admins to track progress and better align learning objectives with business goals. Compared to existing courses and certificates, Skills Tracks offer a more structured and interactive approach to skill development, built on our proprietary Career Graph and data-driven personalization. By focusing on role-specific competencies, practical, hands-on applications, and features to assess, track, and verify proficiency, learners and businesses can better measure learning impact. We started with curated learning paths for Data, IT, Software & Product, and GenAI, with more fields to come next year. Coursera Coach Coach is our AI-powered tutor designed to enhance the learning experience on Coursera. We continue to expand its capabilities to deliver more personalized and interactive learning. It is now integrated into 97% of our courses and is available in 26 languages. We have added persistent memory and contextual understanding, delivering smarter, more relevant responses to drive better outcomes. Dialogue is now available in over 1,200 courses, enabling instructors to build and scale one-on-one, immersive Socratic learning. We also introduced Role Play, which enhances the level of interactive engagement through AI-driven simulations that replicate real-life scenarios, allowing learners to apply their knowledge and receive real-time, actionable feedback. Translations Coursera has been leveraging AI to broaden access to our catalog , starting with text-based translations in 2023. Advancements in machine learning have enabled us to rapidly expand access to text-based translations across our platform, now offering more than 5,600 courses in up to 26 languages. In April, we introduced AI dubbing to bring native-language learning to Coursera, starting with 100 courses. Today, AI dubbing is now available for more than 600 courses in five languages, and we expect to surpass 1,000 courses by the end of the year. As improvements in the speed and quality of this technology continue, we are excited to invest in bringing this experience to more learners, in more languages, with the goal of driving higher engagement and better outcomes. Course Builder Course Builder is our AI-powered authoring tool. In 2023, it was initially launched as a feature for our Enterprise customers interested in creating custom, private courses. What makes it distinctive is its ability to blend the best of Coursera’s catalog with internal, context-relevant materials. We recently announced that Course Builder will soon be piloted with our university and industry partners, featuring new AI-powered content generation and catalog ingestion capabilities that are designed for speed, simplicity, and flexibility. Most importantly, it is all backed by Coursera’s learner data and designed with pedagogical best practices to deliver high-quality courses at scale.
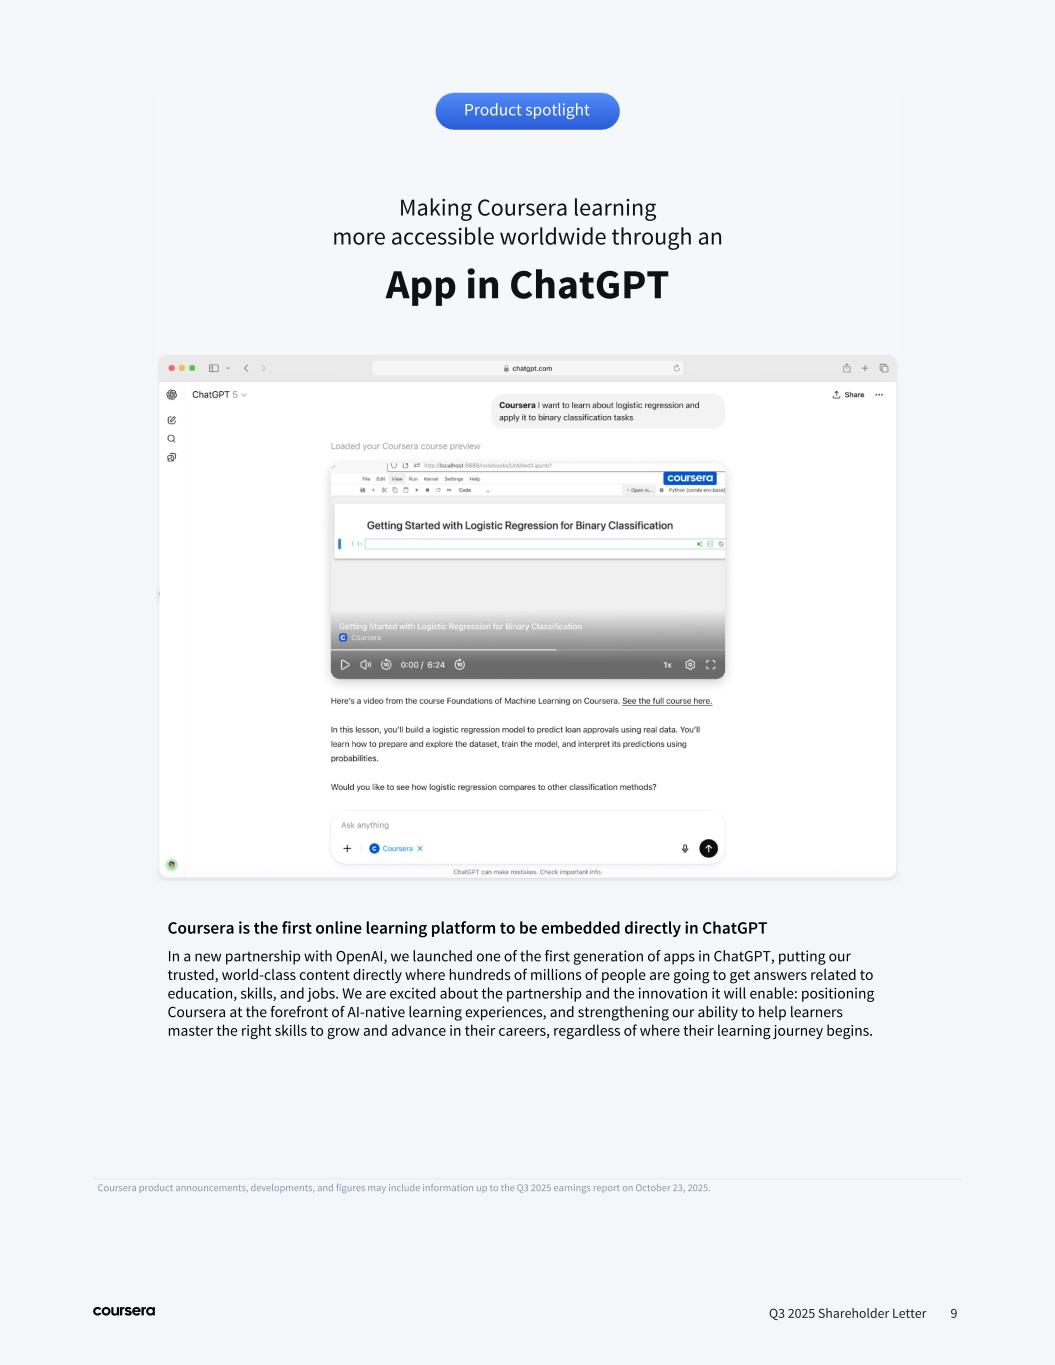
Making Coursera learning more accessible worldwide through an App in ChatGPT Q3 2025 Shareholder Letter 9 Coursera product announcements, developments, and figures may include information up to the Q3 2025 earnings report on October 23, 2025. Product spotlight Coursera is the first online learning platform to be embedded directly in ChatGPT In a new partnership with OpenAI, we launched one of the first generation of apps in ChatGPT, putting our trusted, world-class content directly where hundreds of millions of people are going to get answers related to education, skills, and jobs. We are excited about the partnership and the innovation it will enable: positioning Coursera at the forefront of AI-native learning experiences, and strengthening our ability to help learners master the right skills to grow and advance in their careers, regardless of where their learning journey begins.
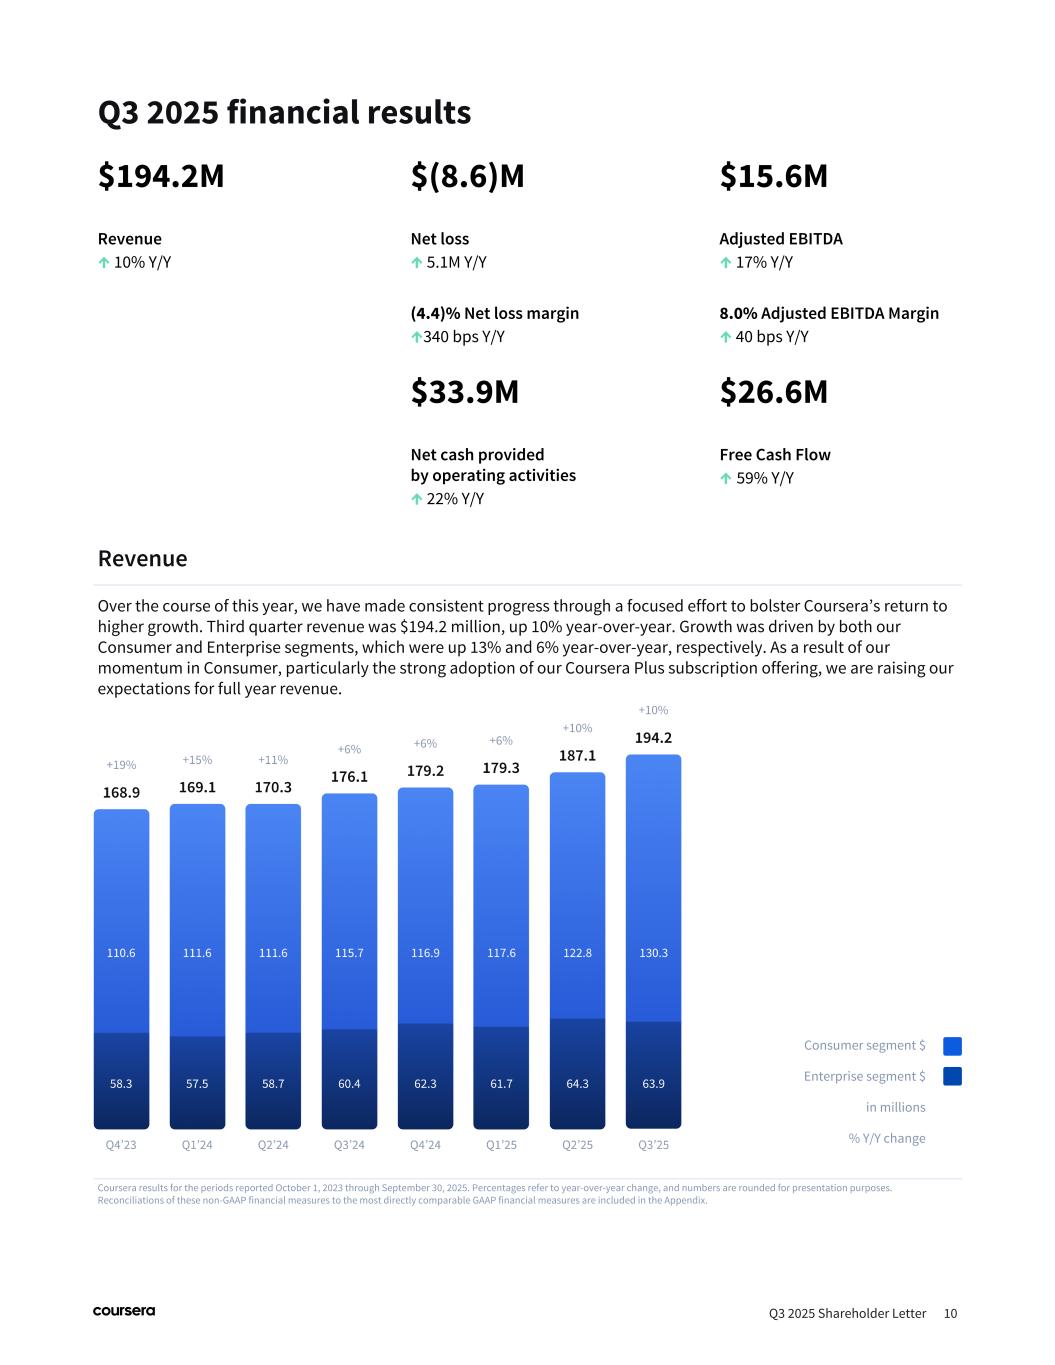
Q3 2025 financial results Q3 2025 Shareholder Letter 10 $194.2M Revenue ↑ 10% Y/Y $(8.6)M Net loss ↑ 5.1M Y/Y (4.4)% Net loss margin ↑340 bps Y/Y $15.6M Adjusted EBITDA ↑ 17% Y/Y 8.0% Adjusted EBITDA Margin ↑ 40 bps Y/Y $33.9M Net cash provided by operating activities ↑ 22% Y/Y $26.6M Free Cash Flow ↑ 59% Y/Y Coursera results for the periods reported October 1, 2023 through September 30, 2025. Percentages refer to year-over-year change, and numbers are rounded for presentation purposes. Reconciliations of these non-GAAP financial measures to the most directly comparable GAAP financial measures are included in the Appendix. Revenue Over the course of this year, we have made consistent progress through a focused effort to bolster Coursera’s return to higher growth. Third quarter revenue was $194.2 million, up 10% year-over-year. Growth was driven by both our Consumer and Enterprise segments, which were up 13% and 6% year-over-year, respectively. As a result of our momentum in Consumer, particularly the strong adoption of our Coursera Plus subscription offering, we are raising our expectations for full year revenue. Consumer segment $ Enterprise segment $ in millions % Y/Y change
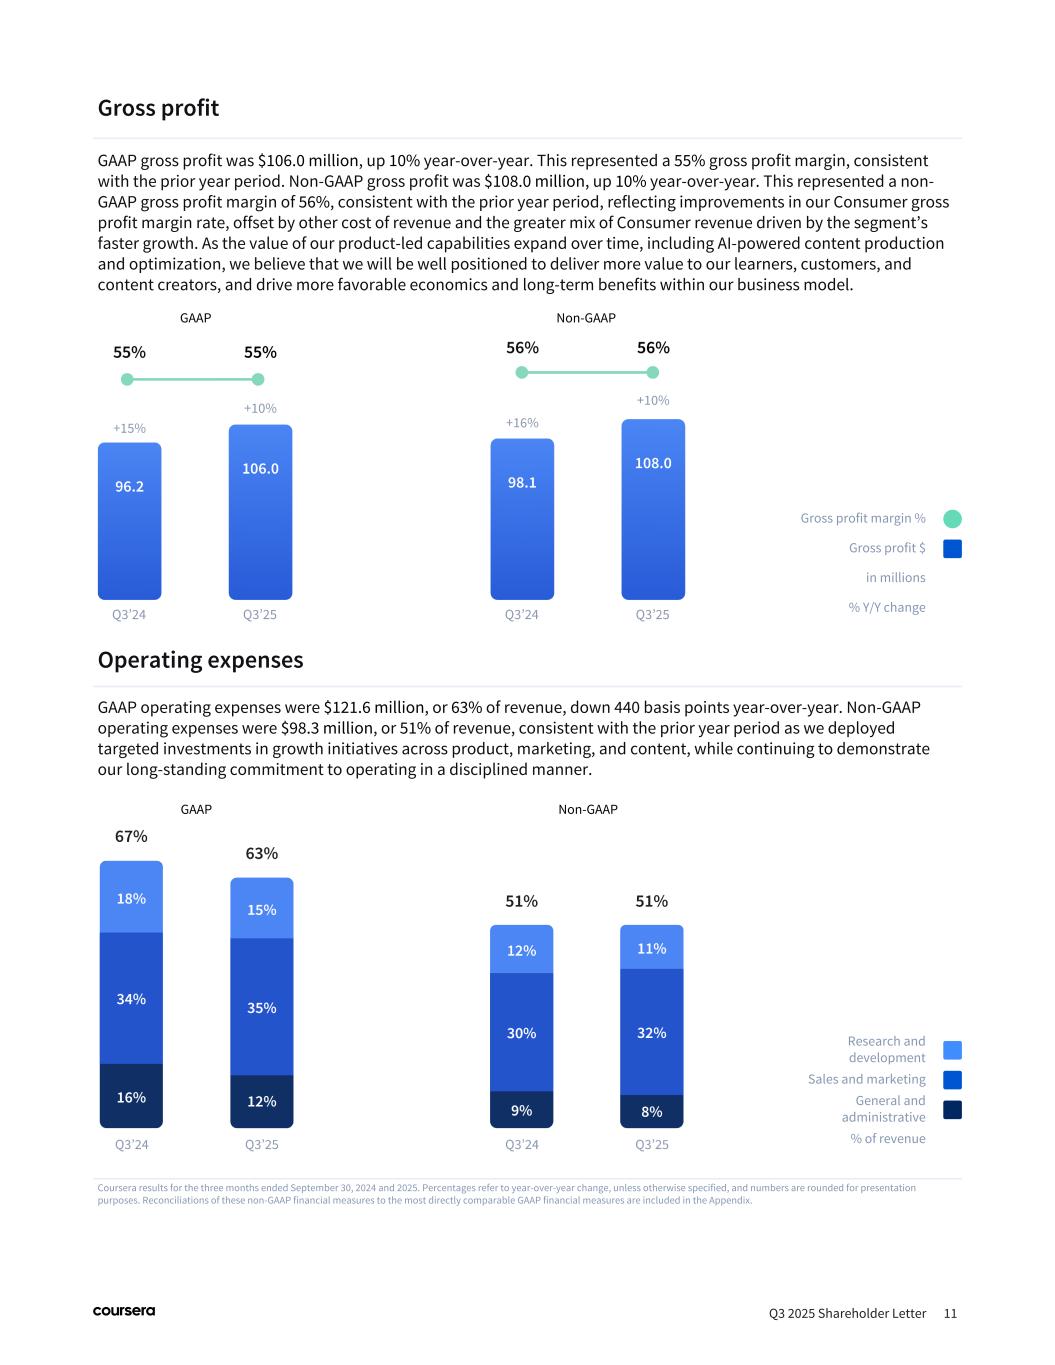
Q3 2025 Shareholder Letter 11 Gross profit GAAP gross profit was $106.0 million, up 10% year-over-year. This represented a 55% gross profit margin, consistent with the prior year period. Non-GAAP gross profit was $108.0 million, up 10% year-over-year. This represented a non- GAAP gross profit margin of 56%, consistent with the prior year period, reflecting improvements in our Consumer gross profit margin rate, offset by other cost of revenue and the greater mix of Consumer revenue driven by the segment’s faster growth. As the value of our product-led capabilities expand over time, including AI-powered content production and optimization, we believe that we will be well positioned to deliver more value to our learners, customers, and content creators, and drive more favorable economics and long-term benefits within our business model. Coursera results for the three months ended September 30, 2024 and 2025. Percentages refer to year-over-year change, unless otherwise specified, and numbers are rounded for presentation purposes. Reconciliations of these non-GAAP financial measures to the most directly comparable GAAP financial measures are included in the Appendix. Operating expenses GAAP operating expenses were $121.6 million, or 63% of revenue, down 440 basis points year-over-year. Non-GAAP operating expenses were $98.3 million, or 51% of revenue, consistent with the prior year period as we deployed targeted investments in growth initiatives across product, marketing, and content, while continuing to demonstrate our long-standing commitment to operating in a disciplined manner. Research and development Sales and marketing General and administrative % of revenue Gross profit margin % Gross profit $ in millions % Y/Y change GAAP Non-GAAP GAAP Non-GAAP
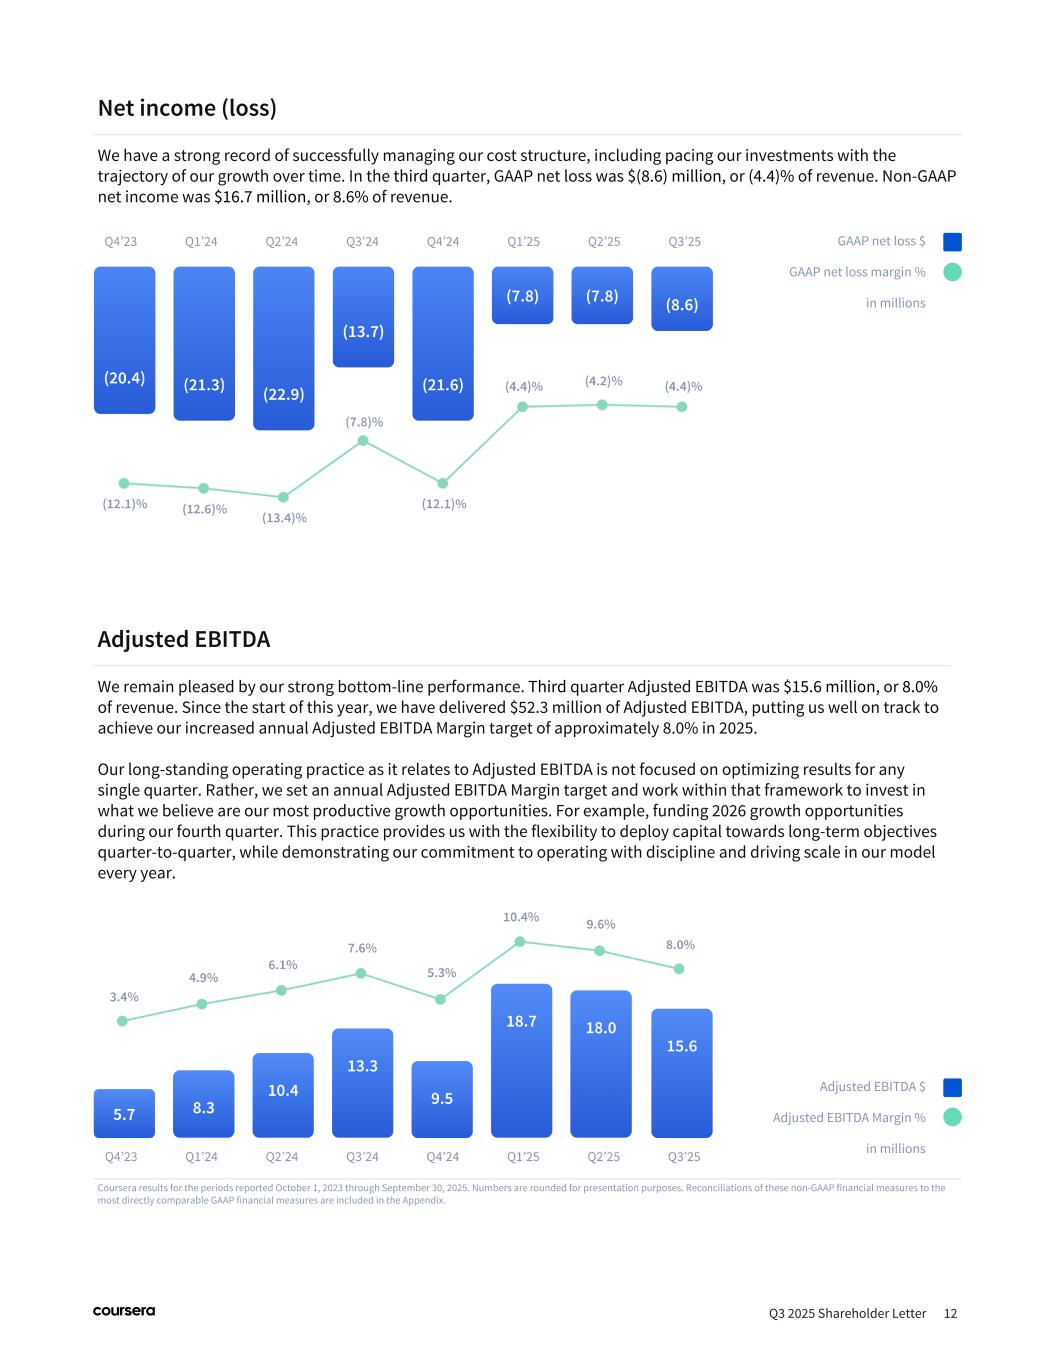
Net income (loss) We have a strong record of successfully managing our cost structure, including pacing our investments with the trajectory of our growth over time. In the third quarter, GAAP net loss was $(8.6) million, or (4.4)% of revenue. Non-GAAP net income was $16.7 million, or 8.6% of revenue. Q3 2025 Shareholder Letter 12 Coursera results for the periods reported October 1, 2023 through September 30, 2025. Numbers are rounded for presentation purposes. Reconciliations of these non-GAAP financial measures to the most directly comparable GAAP financial measures are included in the Appendix. Adjusted EBITDA We remain pleased by our strong bottom-line performance. Third quarter Adjusted EBITDA was $15.6 million, or 8.0% of revenue. Since the start of this year, we have delivered $52.3 million of Adjusted EBITDA, putting us well on track to achieve our increased annual Adjusted EBITDA Margin target of approximately 8.0% in 2025. Our long-standing operating practice as it relates to Adjusted EBITDA is not focused on optimizing results for any single quarter. Rather, we set an annual Adjusted EBITDA Margin target and work within that framework to invest in what we believe are our most productive growth opportunities. For example, funding 2026 growth opportunities during our fourth quarter. This practice provides us with the flexibility to deploy capital towards long-term objectives quarter-to-quarter, while demonstrating our commitment to operating with discipline and driving scale in our model every year. GAAP net loss $ GAAP net loss margin % in millions Adjusted EBITDA $ Adjusted EBITDA Margin % in millions
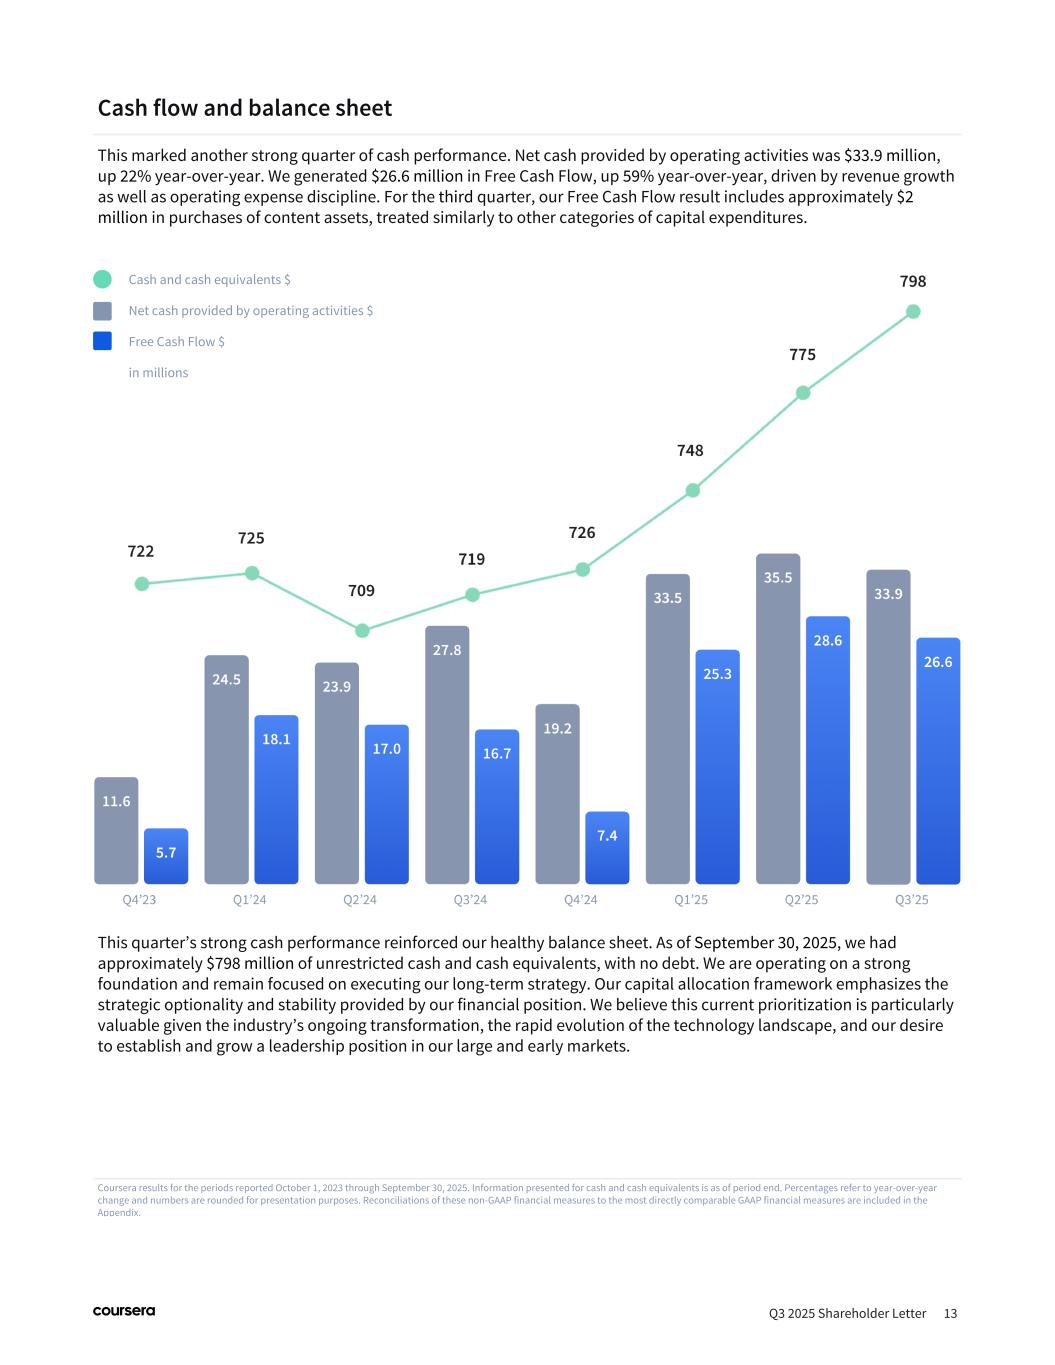
Cash flow and balance sheet This marked another strong quarter of cash performance. Net cash provided by operating activities was $33.9 million, up 22% year-over-year. We generated $26.6 million in Free Cash Flow, up 59% year-over-year, driven by revenue growth as well as operating expense discipline. For the third quarter, our Free Cash Flow result includes approximately $2 million in purchases of content assets, treated similarly to other categories of capital expenditures. Q3 2025 Shareholder Letter 13 Coursera results for the periods reported October 1, 2023 through September 30, 2025. Information presented for cash and cash equivalents is as of period end. Percentages refer to year-over-year change and numbers are rounded for presentation purposes. Reconciliations of these non-GAAP financial measures to the most directly comparable GAAP financial measures are included in the Appendix. This quarter’s strong cash performance reinforced our healthy balance sheet. As of September 30, 2025, we had approximately $798 million of unrestricted cash and cash equivalents, with no debt. We are operating on a strong foundation and remain focused on executing our long-term strategy. Our capital allocation framework emphasizes the strategic optionality and stability provided by our financial position. We believe this current prioritization is particularly valuable given the industry’s ongoing transformation, the rapid evolution of the technology landscape, and our desire to establish and grow a leadership position in our large and early markets. Cash and cash equivalents $ Net cash provided by operating activities $ Free Cash Flow $ in millions
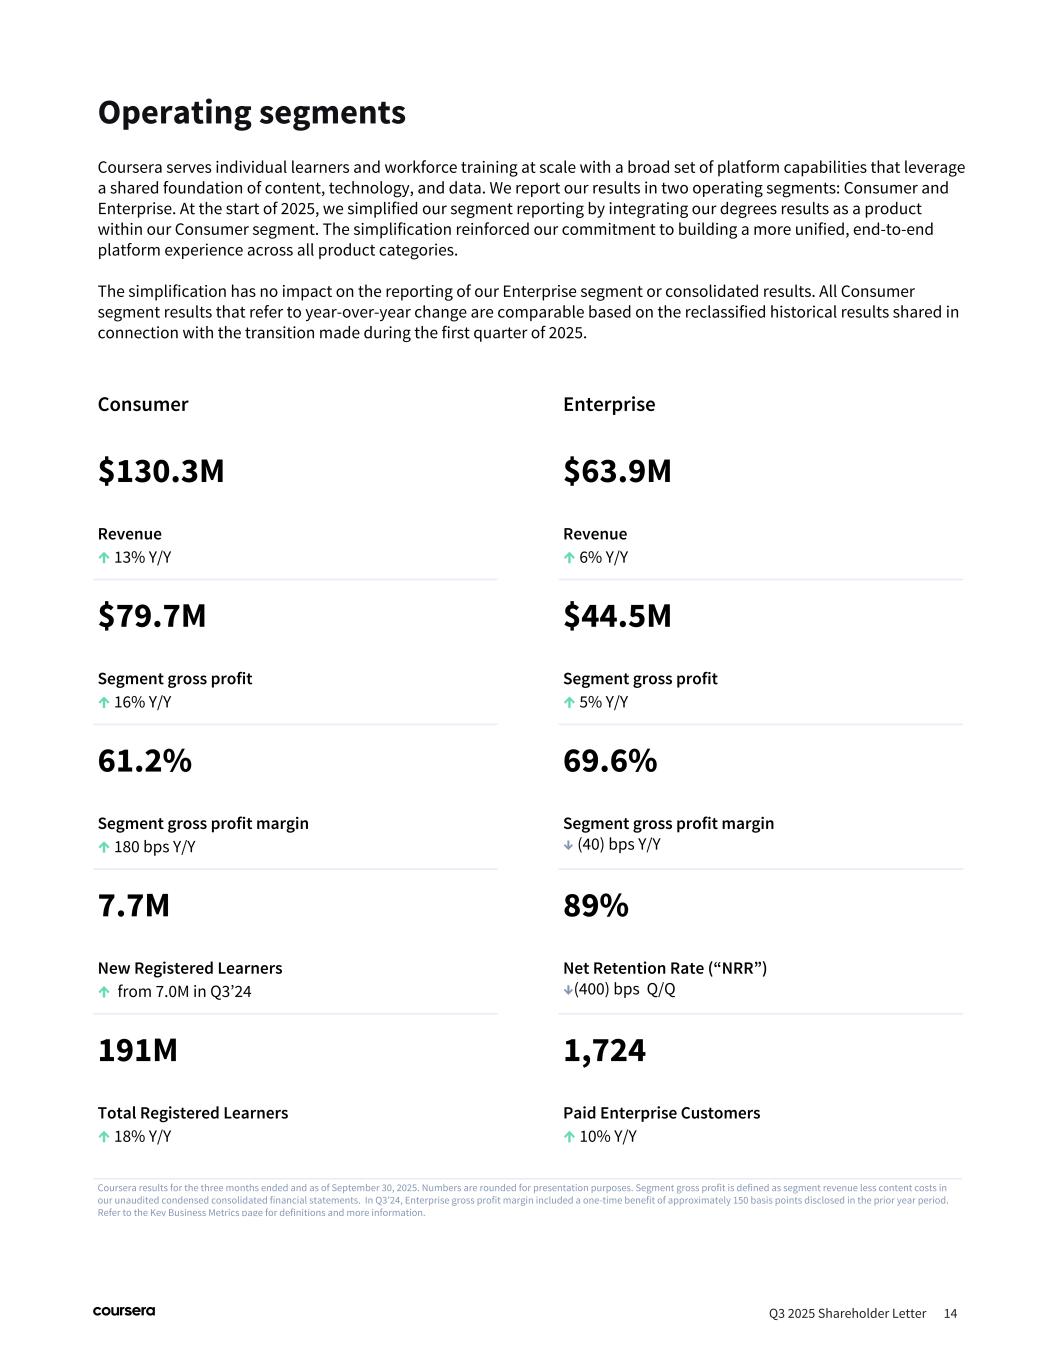
Operating segments Q3 2025 Shareholder Letter 14 Coursera serves individual learners and workforce training at scale with a broad set of platform capabilities that leverage a shared foundation of content, technology, and data. We report our results in two operating segments: Consumer and Enterprise. At the start of 2025, we simplified our segment reporting by integrating our degrees results as a product within our Consumer segment. The simplification reinforced our commitment to building a more unified, end-to-end platform experience across all product categories. The simplification has no impact on the reporting of our Enterprise segment or consolidated results. All Consumer segment results that refer to year-over-year change are comparable based on the reclassified historical results shared in connection with the transition made during the first quarter of 2025. Consumer Enterprise $130.3M Revenue ↑ 13% Y/Y $63.9M Revenue ↑ 6% Y/Y $79.7M Segment gross profit ↑ 16% Y/Y $44.5M Segment gross profit ↑ 5% Y/Y 61.2% Segment gross profit margin ↑ 180 bps Y/Y 69.6% Segment gross profit margin ↓ (40) bps Y/Y 7.7M New Registered Learners ↑ from 7.0M in Q3’24 89% Net Retention Rate (“NRR”) ↓(400) bps Q/Q 191M Total Registered Learners ↑ 18% Y/Y 1,724 Paid Enterprise Customers ↑ 10% Y/Y Coursera results for the three months ended and as of September 30, 2025. Numbers are rounded for presentation purposes. Segment gross profit is defined as segment revenue less content costs in our unaudited condensed consolidated financial statements. In Q3’24, Enterprise gross profit margin included a one-time benefit of approximately 150 basis points disclosed in the prior year period. Refer to the Key Business Metrics page for definitions and more information.
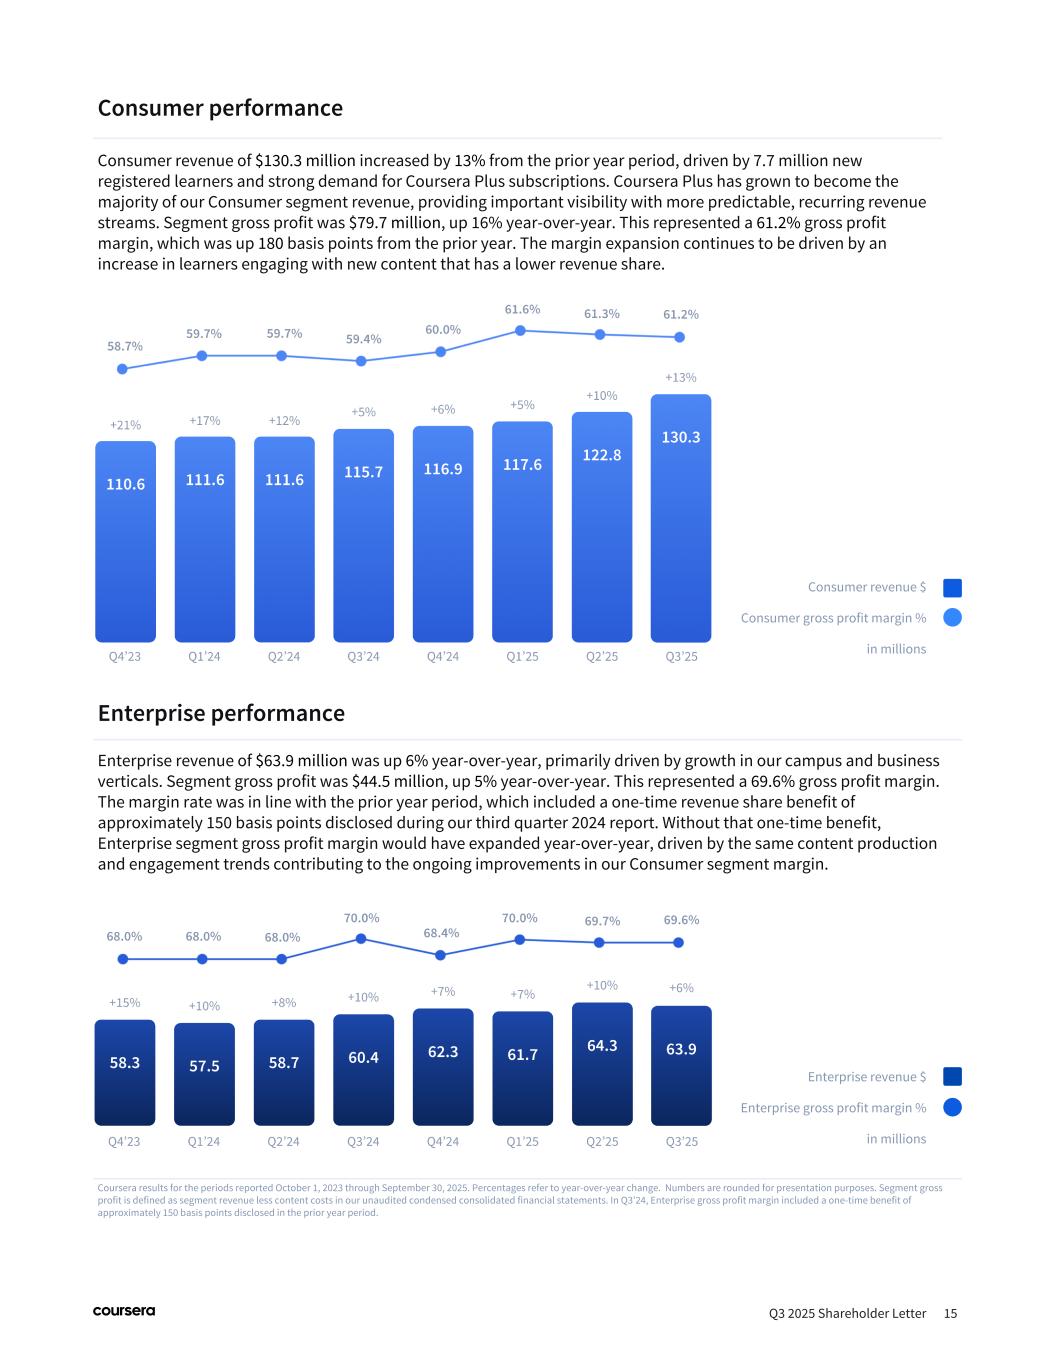
Q3 2025 Shareholder Letter 15 Enterprise performance Enterprise revenue of $63.9 million was up 6% year-over-year, primarily driven by growth in our campus and business verticals. Segment gross profit was $44.5 million, up 5% year-over-year. This represented a 69.6% gross profit margin. The margin rate was in line with the prior year period, which included a one-time revenue share benefit of approximately 150 basis points disclosed during our third quarter 2024 report. Without that one-time benefit, Enterprise segment gross profit margin would have expanded year-over-year, driven by the same content production and engagement trends contributing to the ongoing improvements in our Consumer segment margin. Consumer performance Consumer revenue of $130.3 million increased by 13% from the prior year period, driven by 7.7 million new registered learners and strong demand for Coursera Plus subscriptions. Coursera Plus has grown to become the majority of our Consumer segment revenue, providing important visibility with more predictable, recurring revenue streams. Segment gross profit was $79.7 million, up 16% year-over-year. This represented a 61.2% gross profit margin, which was up 180 basis points from the prior year. The margin expansion continues to be driven by an increase in learners engaging with new content that has a lower revenue share. Coursera results for the periods reported October 1, 2023 through September 30, 2025. Percentages refer to year-over-year change. Numbers are rounded for presentation purposes. Segment gross profit is defined as segment revenue less content costs in our unaudited condensed consolidated financial statements. In Q3’24, Enterprise gross profit margin included a one-time benefit of approximately 150 basis points disclosed in the prior year period. Enterprise revenue $ Enterprise gross profit margin % in millions Consumer revenue $ Consumer gross profit margin % in millions
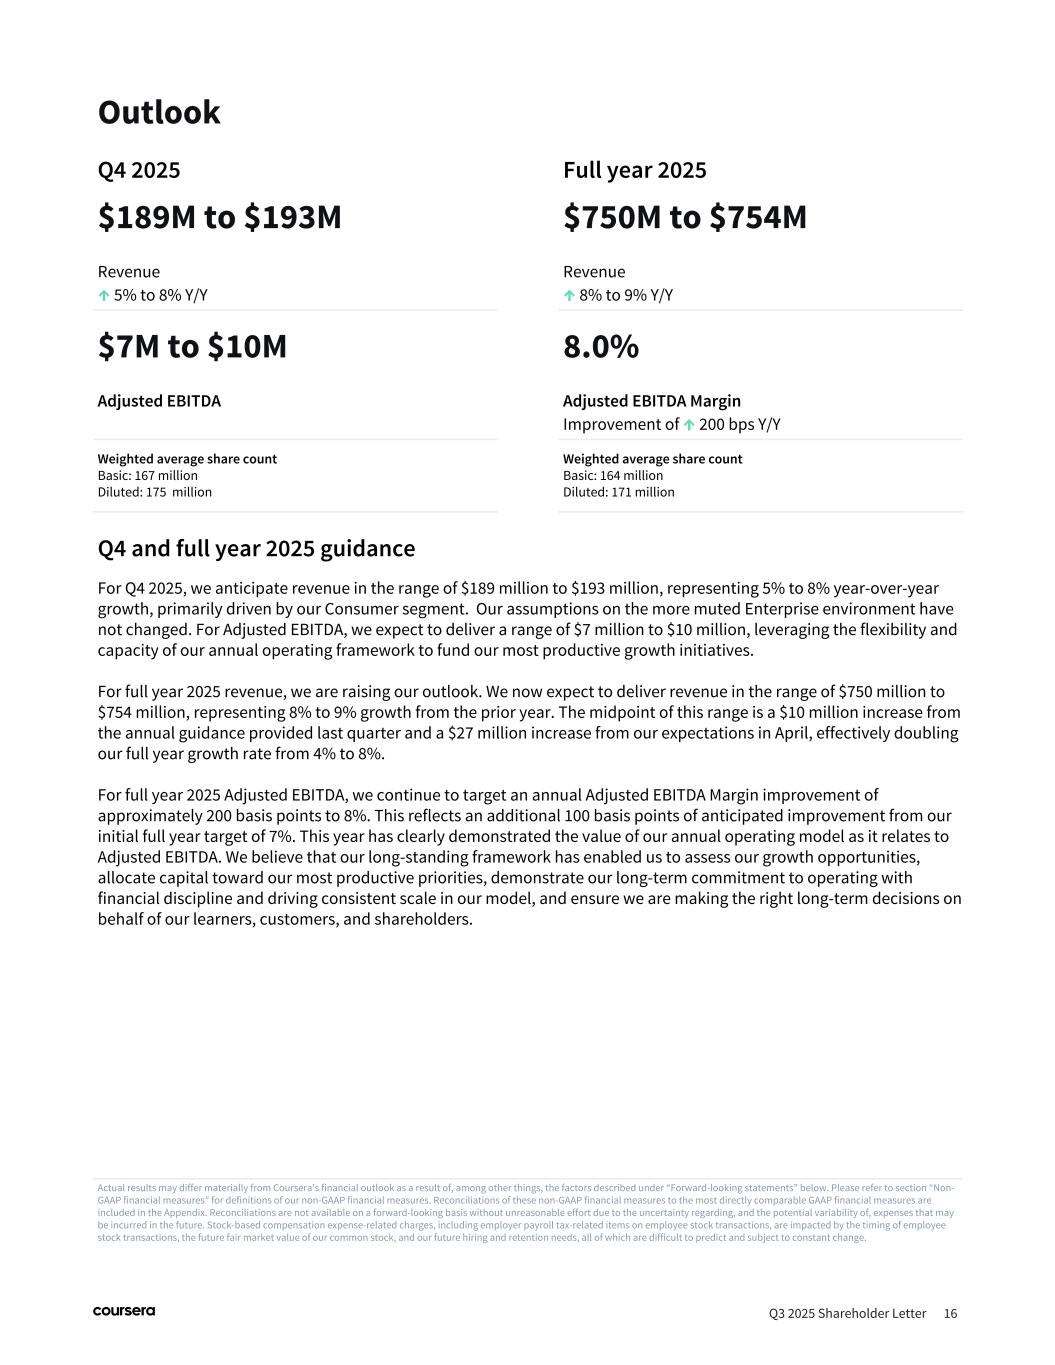
Q4 and full year 2025 guidance For Q4 2025, we anticipate revenue in the range of $189 million to $193 million, representing 5% to 8% year-over-year growth, primarily driven by our Consumer segment. Our assumptions on the more muted Enterprise environment have not changed. For Adjusted EBITDA, we expect to deliver a range of $7 million to $10 million, leveraging the flexibility and capacity of our annual operating framework to fund our most productive growth initiatives. For full year 2025 revenue, we are raising our outlook. We now expect to deliver revenue in the range of $750 million to $754 million, representing 8% to 9% growth from the prior year. The midpoint of this range is a $10 million increase from the annual guidance provided last quarter and a $27 million increase from our expectations in April, effectively doubling our full year growth rate from 4% to 8%. For full year 2025 Adjusted EBITDA, we continue to target an annual Adjusted EBITDA Margin improvement of approximately 200 basis points to 8%. This reflects an additional 100 basis points of anticipated improvement from our initial full year target of 7%. This year has clearly demonstrated the value of our annual operating model as it relates to Adjusted EBITDA. We believe that our long-standing framework has enabled us to assess our growth opportunities, allocate capital toward our most productive priorities, demonstrate our long-term commitment to operating with financial discipline and driving consistent scale in our model, and ensure we are making the right long-term decisions on behalf of our learners, customers, and shareholders. Outlook Actual results may differ materially from Coursera’s financial outlook as a result of, among other things, the factors described under “Forward-looking statements” below. Please refer to section “Non- GAAP financial measures” for definitions of our non-GAAP financial measures. Reconciliations of these non-GAAP financial measures to the most directly comparable GAAP financial measures are included in the Appendix. Reconciliations are not available on a forward-looking basis without unreasonable effort due to the uncertainty regarding, and the potential variability of, expenses that may be incurred in the future. Stock-based compensation expense-related charges, including employer payroll tax-related items on employee stock transactions, are impacted by the timing of employee stock transactions, the future fair market value of our common stock, and our future hiring and retention needs, all of which are difficult to predict and subject to constant change. Q3 2025 Shareholder Letter 16 Q4 2025 Full year 2025 $189M to $193M Revenue ↑ 5% to 8% Y/Y $750M to $754M Revenue ↑ 8% to 9% Y/Y $7M to $10M Adjusted EBITDA 8.0% Adjusted EBITDA Margin Improvement of ↑ 200 bps Y/Y Weighted average share count Basic: 167 million Diluted: 175 million Weighted average share count Basic: 164 million Diluted: 171 million
Conference call details Q3 2025 Shareholder Letter 17 As previously announced, Coursera will hold a conference call to discuss its third quarter 2025 performance today, October 23, 2025, at 2:00 p.m. Pacific Time (5:00 p.m. Eastern Time). A live, audio-only webcast of the conference call and earnings release materials will be available to the public on our investor relations page at investor.coursera.com. For those unable to listen to the broadcast live, an archived replay will be accessible in the same location for one year. Disclosure information In compliance with disclosure obligations under Regulation FD, Coursera announces material information to the public through a variety of means, including filings with the Securities and Exchange Commission (“SEC”), press releases, company blog posts, public conference calls, and webcasts, as well as Coursera’s investor relations website. About Coursera Coursera was launched in 2012 by Andrew Ng and Daphne Koller with a mission to provide universal access to world- class learning. Today, it is one of the largest online learning platforms in the world, with 191 million registered learners as of September 30, 2025. Coursera partners with over 375 leading university and industry partners to offer a broad catalog of content and credentials, including courses, Specializations, Professional Certificates, and degrees. Coursera’s platform innovations — including generative AI-powered features like Coach, Role Play, and Course Builder, and role-based solutions like Skills Tracks — enable instructors, partners, and companies to deliver scalable, personalized, and verified learning. Institutions worldwide rely on Coursera to upskill and reskill their employees, students, and citizens in high-demand fields such as GenAI, data science, technology, and business, while learners globally turn to Coursera to master the skills they need to advance their careers. Coursera is a Delaware public benefit corporation and a B Corp. Contacts Investor Relations Cam Carey, VP of Investor Relations ir@coursera.org Media Arunav Sinha, VP of Global Communications press@coursera.org
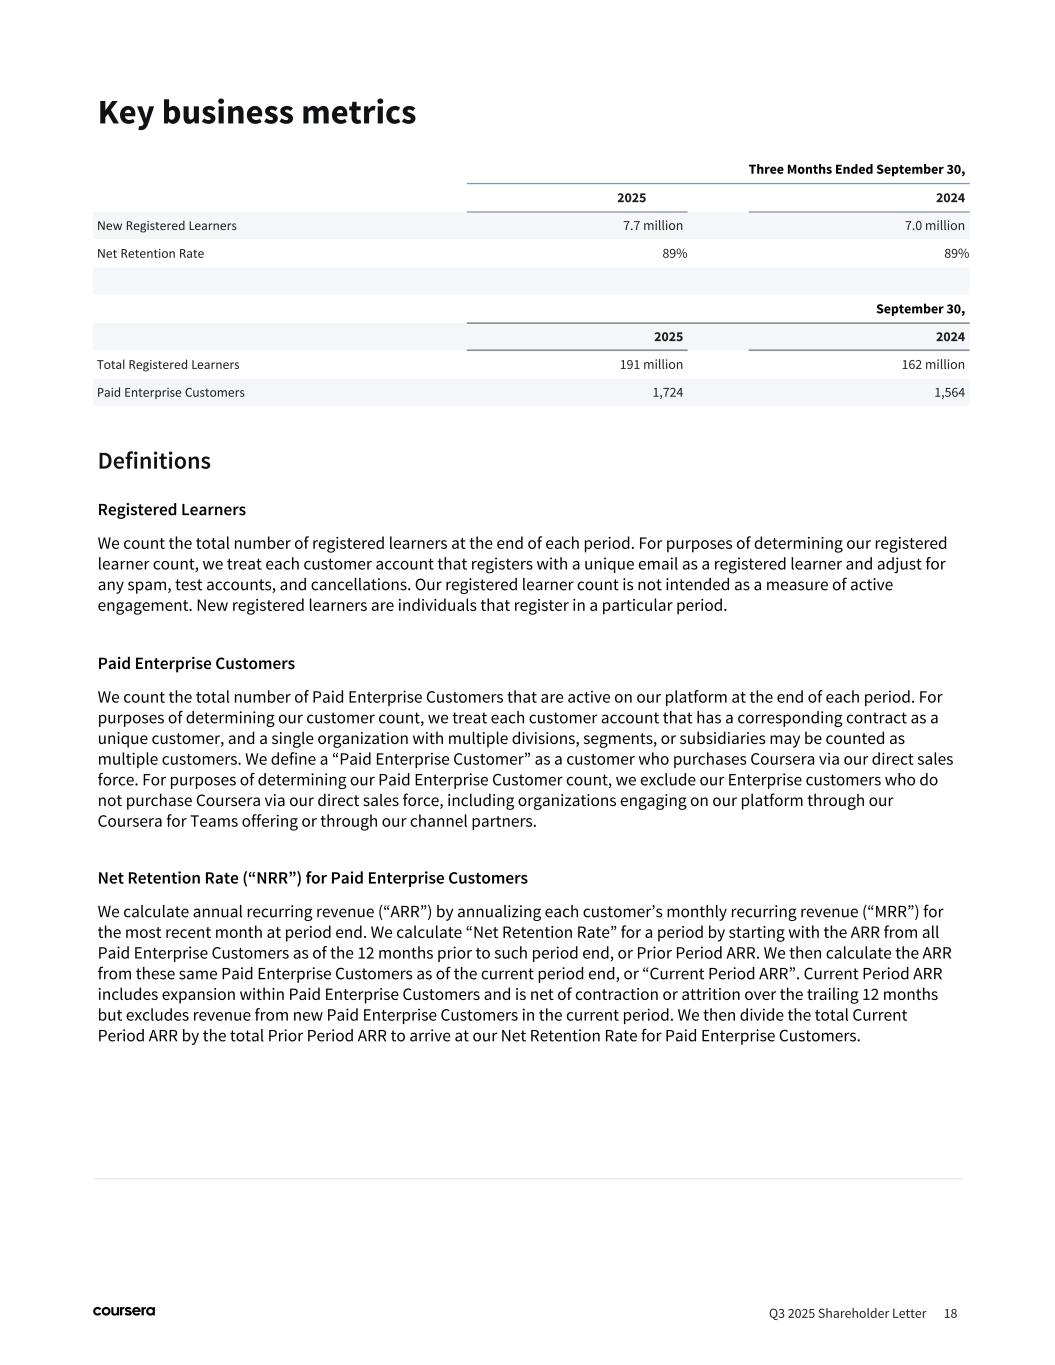
Key business metrics Q3 2025 Shareholder Letter 18 Definitions Registered Learners We count the total number of registered learners at the end of each period. For purposes of determining our registered learner count, we treat each customer account that registers with a unique email as a registered learner and adjust for any spam, test accounts, and cancellations. Our registered learner count is not intended as a measure of active engagement. New registered learners are individuals that register in a particular period. Paid Enterprise Customers We count the total number of Paid Enterprise Customers that are active on our platform at the end of each period. For purposes of determining our customer count, we treat each customer account that has a corresponding contract as a unique customer, and a single organization with multiple divisions, segments, or subsidiaries may be counted as multiple customers. We define a “Paid Enterprise Customer” as a customer who purchases Coursera via our direct sales force. For purposes of determining our Paid Enterprise Customer count, we exclude our Enterprise customers who do not purchase Coursera via our direct sales force, including organizations engaging on our platform through our Coursera for Teams offering or through our channel partners. Net Retention Rate (“NRR”) for Paid Enterprise Customers We calculate annual recurring revenue (“ARR”) by annualizing each customer’s monthly recurring revenue (“MRR”) for the most recent month at period end. We calculate “Net Retention Rate” for a period by starting with the ARR from all Paid Enterprise Customers as of the 12 months prior to such period end, or Prior Period ARR. We then calculate the ARR from these same Paid Enterprise Customers as of the current period end, or “Current Period ARR”. Current Period ARR includes expansion within Paid Enterprise Customers and is net of contraction or attrition over the trailing 12 months but excludes revenue from new Paid Enterprise Customers in the current period. We then divide the total Current Period ARR by the total Prior Period ARR to arrive at our Net Retention Rate for Paid Enterprise Customers. Three Months Ended September 30, 2025 2024 New Registered Learners 7.7 million 7.0 million Net Retention Rate 89 % 89 % September 30, 2025 2024 Total Registered Learners 191 million 162 million Paid Enterprise Customers 1,724 1,564
Non-GAAP financial measures Q3 2025 Shareholder Letter 19 We believe the presentation of these adjusted operating results provides useful supplemental information to investors and facilitates the analysis and comparison of our operating results across reporting periods. Reconciliations of these non-GAAP financial measures to the most directly comparable GAAP financial measures are included in the Appendix. In addition to financial information presented in accordance with GAAP, this shareholder letter includes non-GAAP gross profit, non-GAAP gross profit margin, non-GAAP net income, non-GAAP net income per share, non-GAAP operating expenses, Adjusted EBITDA, Adjusted EBITDA Margin, and Free Cash Flow, each of which is a non-GAAP financial measure. These are key measures used by our management to help us analyze our financial results, establish budgets and operational goals for managing our business, evaluate our performance, and make strategic decisions. Accordingly, we believe that these non-GAAP financial measures provide useful information to investors and others in understanding and evaluating our operating results in the same manner as our management and board of directors. In addition, we believe these measures are useful for period-to-period comparisons of our business. We also believe that the presentation of these non-GAAP financial measures provides an additional tool for investors to use in comparing our core business and results of operations over multiple periods with other companies in our industry, many of which present similar non-GAAP financial measures to investors, and to analyze our cash performance. However, the non- GAAP financial measures presented may not be comparable to similarly titled measures reported by other companies due to differences in the way that these measures are calculated. These non-GAAP financial measures are presented for supplemental informational purposes only and should not be considered as a substitute for or in isolation from financial information presented in accordance with GAAP. These non-GAAP financial measures have limitations as analytical tools. Definitions Non-GAAP Gross Profit, Non-GAAP Gross Profit Margin, Non-GAAP Net Income, and Non-GAAP Net Income Per Share We define non-GAAP gross profit and non-GAAP net income as GAAP gross profit and GAAP net loss excluding: (1) stock- based compensation expense; (2) amortization of stock-based compensation expense capitalized as internal-use software costs; (3) payroll tax expense related to stock-based compensation; (4) merger and acquisition (“M&A”) related transaction costs; (5) costs and settlement (gains) losses related to significant and non-recurring legal and regulatory matters, net of insurance recoveries; and (6) restructuring related charges. Non-GAAP gross profit margin reflects non-GAAP gross profit as a percentage of revenue. Non-GAAP net income per share is calculated by dividing non-GAAP net income by the diluted weighted average shares of common stock outstanding. Non-GAAP Operating Expenses We define non-GAAP operating expenses as GAAP operating expenses excluding: (1) stock-based compensation expense; (2) payroll tax expense related to stock-based compensation; (3) M&A related transaction costs; and (4) costs and settlement (gains) losses related to significant and non-recurring legal and regulatory matters, net of insurance recoveries. Adjusted EBITDA and Adjusted EBITDA Margin We define Adjusted EBITDA as our GAAP net loss excluding: (1) depreciation and amortization; (2) interest income, net; (3) income tax expense; (4) other (income) expense, net; (5) stock-based compensation expense; (6) payroll tax expense related to stock-based compensation; (7) M&A related transaction costs; (8) costs and settlement (gains) losses related to significant and non-recurring legal and regulatory matters, net of insurance recoveries; and (9) restructuring related charges. We define Adjusted EBITDA Margin as Adjusted EBITDA divided by revenue. Free Cash Flow We define Free Cash Flow as net cash provided by operating activities, less capitalized internal-use software costs, purchases of content assets, and purchases of property, equipment, and software as we consider these capital expenditures necessary to support our ongoing operations.
Forward-looking statements Q3 2025 Shareholder Letter 20 This shareholder letter contains forward-looking statements that involve substantial risks and uncertainties. Any statements contained in this press release that are not statements of historical facts may be deemed to be forward-looking statements. In some cases, you can identify forward-looking statements by terms such as: “accelerate,” “anticipate, “believe,” “can,” “continue,” “could,” “demand,” “design,” “estimate,” “expand,” “expect,” “intend,” “may,” “might,” “mission,” “need,” “objective,” “ongoing,” “outlook,” “plan,” “potential,” “predict,” “project,” “should,” “target,” “will,” “would,” or the negative of these terms, or other comparable terminology intended to identify statements about the future. These forward-looking statements include, but are not limited to, statements regarding our ability to grow with leverage and manage our cost structure; our market opportunity; the global demand to embrace new technology and skills; our next chapter of innovation and growth; our growth priorities; our initiative to strengthen our position as a trusted source for verified learning; our belief in our rapidly expanding capabilities; our progress in delivering new products, capabilities, and experiences across our platform; the use and continued development of our AI tools; our commitment to creating and scaling our AI experiences; the development of our AI tools in conjunction with industry partners; the value of our expanding industry micro-credential program and expanded offering of courses related to generative AI skills; our plan to continue expanding access for our AI-powered translations and Coursera Coach; our belief that top universities, industry partners, and other content creators will increasingly view Coursera as a strategic platform to extend their reach and impact; the currently available and continual development of the features and benefits of our platform and our content model; our expansion of our content catalog; our growing base of learning and Enterprise customers; our commitment to driving growth and operational improvements across all aspects of our business; our expansion of our career-based discovery experience; our planned investments in our content engine capabilities; the continued demonstration of the strength and scaling of our business model; our belief that our long-term prospects and value creation for shareholders will depend most heavily on us growing and succeeding in our large and attractive markets; our capacity to reinvest in reigniting durable, long-term growth; our mission to provide universal access to world-class learning; the demand for online learning; the anticipated utility of our non-GAAP financial measures; the strength of our customer and content creator relationships; our investment in new content production capabilities that can deliver more value for our learners, customers, and content creators, as well as drive favorable economics and long-term benefits to our business model; our belief that our long-term operating framework provides the flexibility to make the right long-term decisions; anticipated growth rates and features and benefits of our offerings; and our financial outlook, future financial and operational performance, and expectations; including our financial outlook for the fourth quarter of 2025 and full year 2025; among others. These forward-looking statements involve known and unknown risks, uncertainties, and other factors that may cause our actual results, levels of activity, performance, or achievements to be materially different from the information expressed or implied by these forward-looking statements. These risks and uncertainties include, but are not limited to, the following: our ability to attract, engage, and retain learners; our ability to increase sales of our offerings; our limited operating history; the relative nascency of online learning solutions and generative AI; risks related to market acceptance and demand for our offerings; our ability to maintain and expand our existing content creator relationships and to develop new partnerships with universities, industry leaders, and subject matter experts; our dependence on the supply of content created by our partners; risks related to our AI innovations and AI generally; our ability to compete effectively; adverse impacts on our business and financial condition due to macroeconomic or market conditions; our ability to manage our growth; regulatory and/or policy matters or changes impacting us or our content creators; risks related to intellectual property; cybersecurity and privacy risks and regulations; potential disruptions to our platform; risks related to operations, regulatory, economic, and geopolitical conditions; current and future legal and regulatory matters; the impact of actions to improve operational efficiencies and operating costs; our history of net losses and ability to achieve or sustain profitability; natural disasters, public health crises or other catastrophic events; and our status as a certified B Corp, as well as the risks and uncertainties discussed in our most recently filed annual and quarterly reports on Forms 10-K and 10-Q and subsequent filings and as detailed from time to time in our SEC filings. You should not rely upon forward-looking statements as predictions of future events. Although we believe that the expectations reflected in the forward-looking statements are reasonable, we cannot guarantee that the future results, levels of activity, performance, or events and circumstances reflected in the forward-looking statements will be achieved or occur. Moreover, neither we nor any other person assumes responsibility for the accuracy and completeness of the forward-looking statements. Such forward-looking statements relate only to events as of the date of this shareholder letter. We undertake no obligation to update any forward-looking statements except to the extent required by law.
Q3 2025 Shareholder Letter 21 Appendix
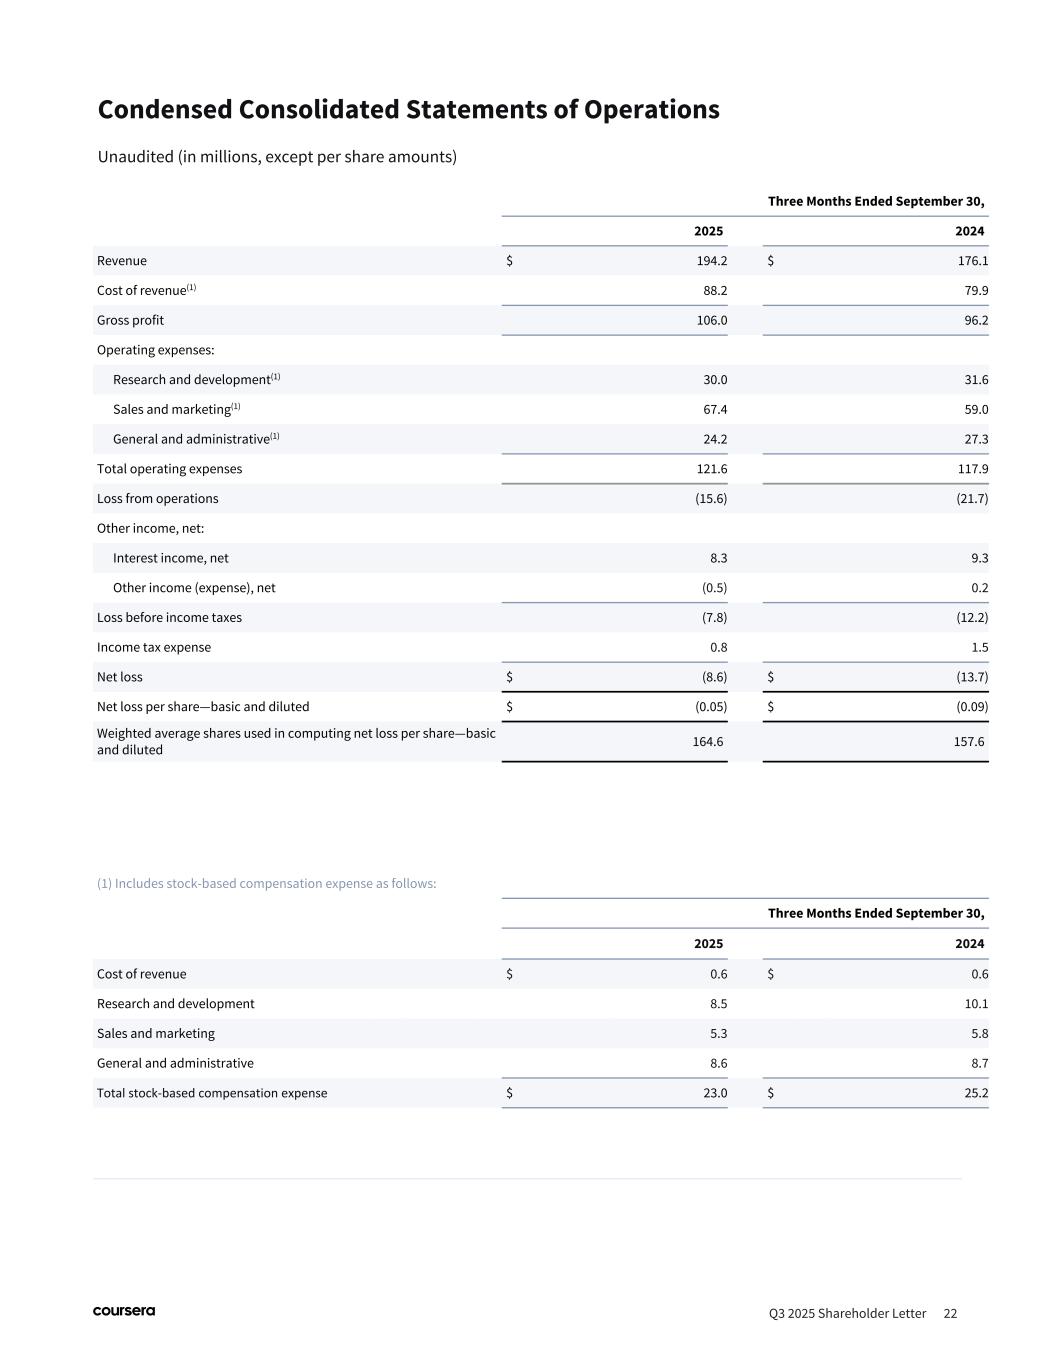
Condensed Consolidated Statements of Operations Unaudited (in millions, except per share amounts) Q3 2025 Shareholder Letter 22 Three Months Ended September 30, 2025 2024 Revenue $ 194.2 $ 176.1 Cost of revenue(1) 88.2 79.9 Gross profit 106.0 96.2 Operating expenses: Research and development(1) 30.0 31.6 Sales and marketing(1) 67.4 59.0 General and administrative(1) 24.2 27.3 Total operating expenses 121.6 117.9 Loss from operations (15.6) (21.7) Other income, net: Interest income, net 8.3 9.3 Other income (expense), net (0.5) 0.2 Loss before income taxes (7.8) (12.2) Income tax expense 0.8 1.5 Net loss $ (8.6) $ (13.7) Net loss per share—basic and diluted $ (0.05) $ (0.09) Weighted average shares used in computing net loss per share—basic and diluted 164.6 157.6 (1) Includes stock-based compensation expense as follows: Three Months Ended September 30, 2025 2024 Cost of revenue $ 0.6 $ 0.6 Research and development 8.5 10.1 Sales and marketing 5.3 5.8 General and administrative 8.6 8.7 Total stock-based compensation expense $ 23.0 $ 25.2
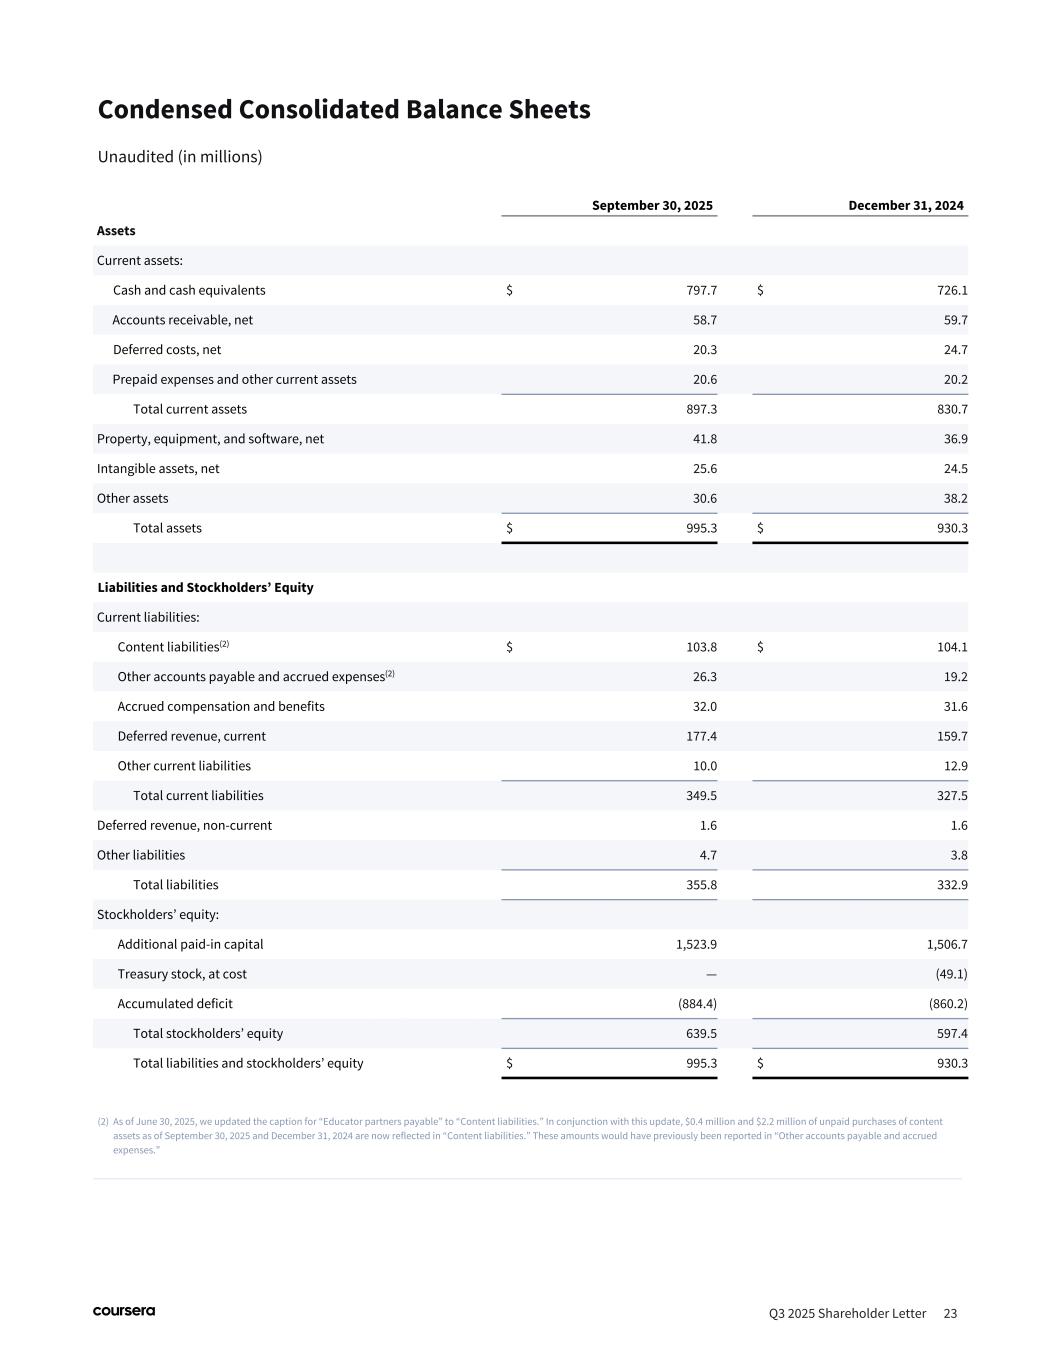
Condensed Consolidated Balance Sheets Unaudited (in millions) Q3 2025 Shareholder Letter 23 September 30, 2025 December 31, 2024 Assets Current assets: Cash and cash equivalents $ 797.7 $ 726.1 Accounts receivable, net 58.7 59.7 Deferred costs, net 20.3 24.7 Prepaid expenses and other current assets 20.6 20.2 Total current assets 897.3 830.7 Property, equipment, and software, net 41.8 36.9 Intangible assets, net 25.6 24.5 Other assets 30.6 38.2 Total assets $ 995.3 $ 930.3 Liabilities and Stockholders’ Equity Current liabilities: Content liabilities(2) $ 103.8 $ 104.1 Other accounts payable and accrued expenses(2) 26.3 19.2 Accrued compensation and benefits 32.0 31.6 Deferred revenue, current 177.4 159.7 Other current liabilities 10.0 12.9 Total current liabilities 349.5 327.5 Deferred revenue, non-current 1.6 1.6 Other liabilities 4.7 3.8 Total liabilities 355.8 332.9 Stockholders’ equity: Additional paid-in capital 1,523.9 1,506.7 Treasury stock, at cost — (49.1) Accumulated deficit (884.4) (860.2) Total stockholders’ equity 639.5 597.4 Total liabilities and stockholders’ equity $ 995.3 $ 930.3 (2) As of June 30, 2025, we updated the caption for “Educator partners payable” to “Content liabilities.” In conjunction with this update, $0.4 million and $2.2 million of unpaid purchases of content assets as of September 30, 2025 and December 31, 2024 are now reflected in “Content liabilities.” These amounts would have previously been reported in “Other accounts payable and accrued expenses.”
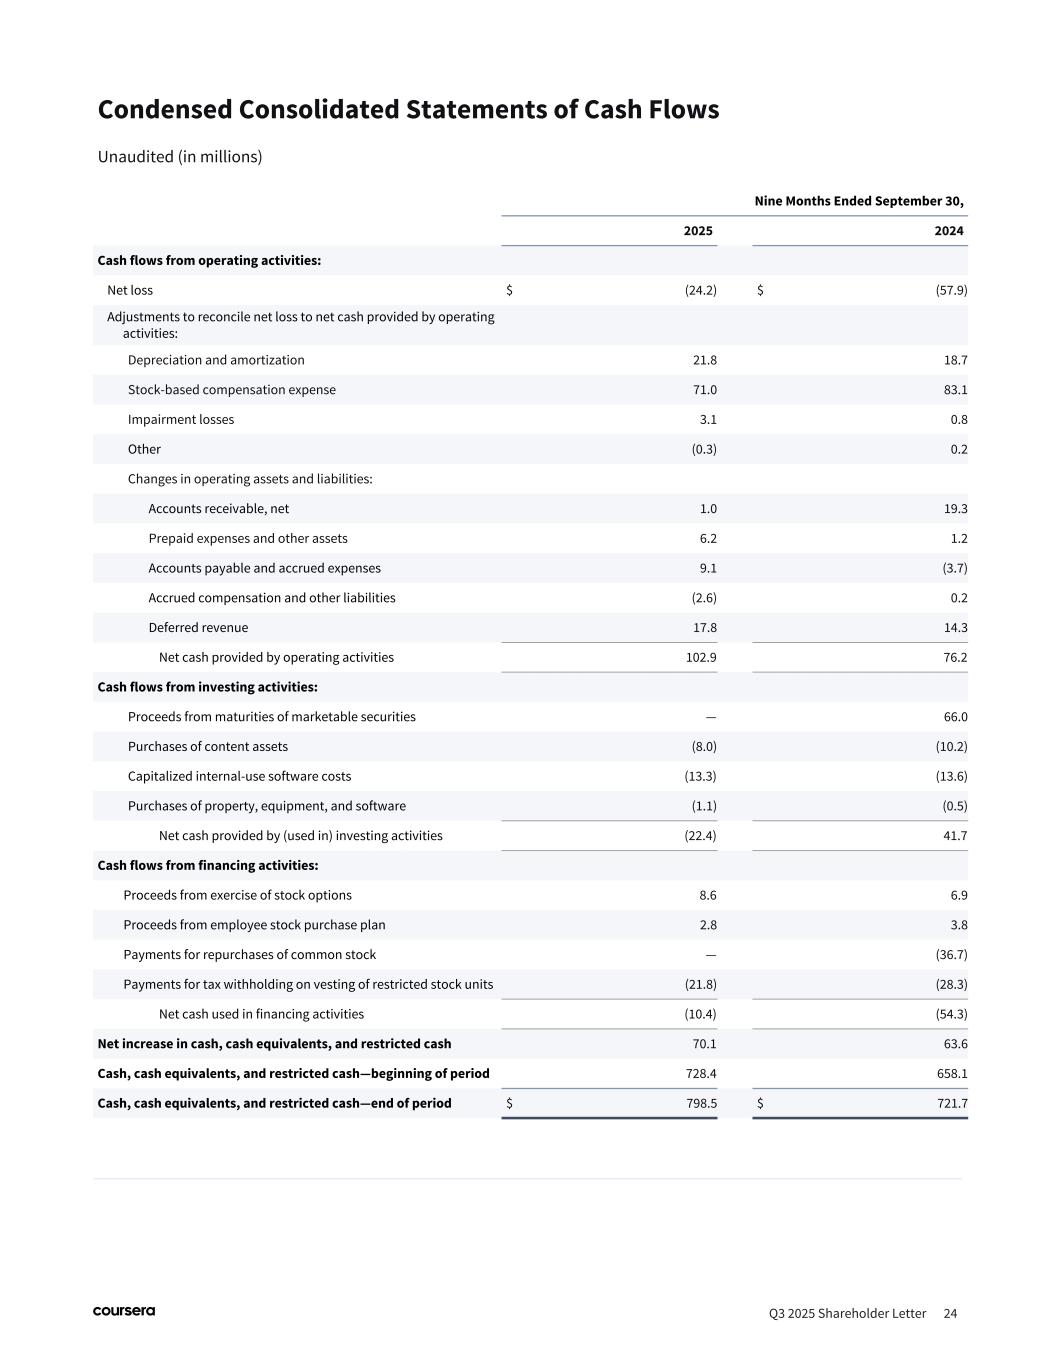
Condensed Consolidated Statements of Cash Flows Unaudited (in millions) Q3 2025 Shareholder Letter 24 Nine Months Ended September 30, 2025 2024 Cash flows from operating activities: Net loss $ (24.2) $ (57.9) Adjustments to reconcile net loss to net cash provided by operating activities: Depreciation and amortization 21.8 18.7 Stock-based compensation expense 71.0 83.1 Impairment losses 3.1 0.8 Other (0.3) 0.2 Changes in operating assets and liabilities: Accounts receivable, net 1.0 19.3 Prepaid expenses and other assets 6.2 1.2 Accounts payable and accrued expenses 9.1 (3.7) Accrued compensation and other liabilities (2.6) 0.2 Deferred revenue 17.8 14.3 Net cash provided by operating activities 102.9 76.2 Cash flows from investing activities: Proceeds from maturities of marketable securities — 66.0 Purchases of content assets (8.0) (10.2) Capitalized internal-use software costs (13.3) (13.6) Purchases of property, equipment, and software (1.1) (0.5) Net cash provided by (used in) investing activities (22.4) 41.7 Cash flows from financing activities: Proceeds from exercise of stock options 8.6 6.9 Proceeds from employee stock purchase plan 2.8 3.8 Payments for repurchases of common stock — (36.7) Payments for tax withholding on vesting of restricted stock units (21.8) (28.3) Net cash used in financing activities (10.4) (54.3) Net increase in cash, cash equivalents, and restricted cash 70.1 63.6 Cash, cash equivalents, and restricted cash—beginning of period 728.4 658.1 Cash, cash equivalents, and restricted cash—end of period $ 798.5 $ 721.7
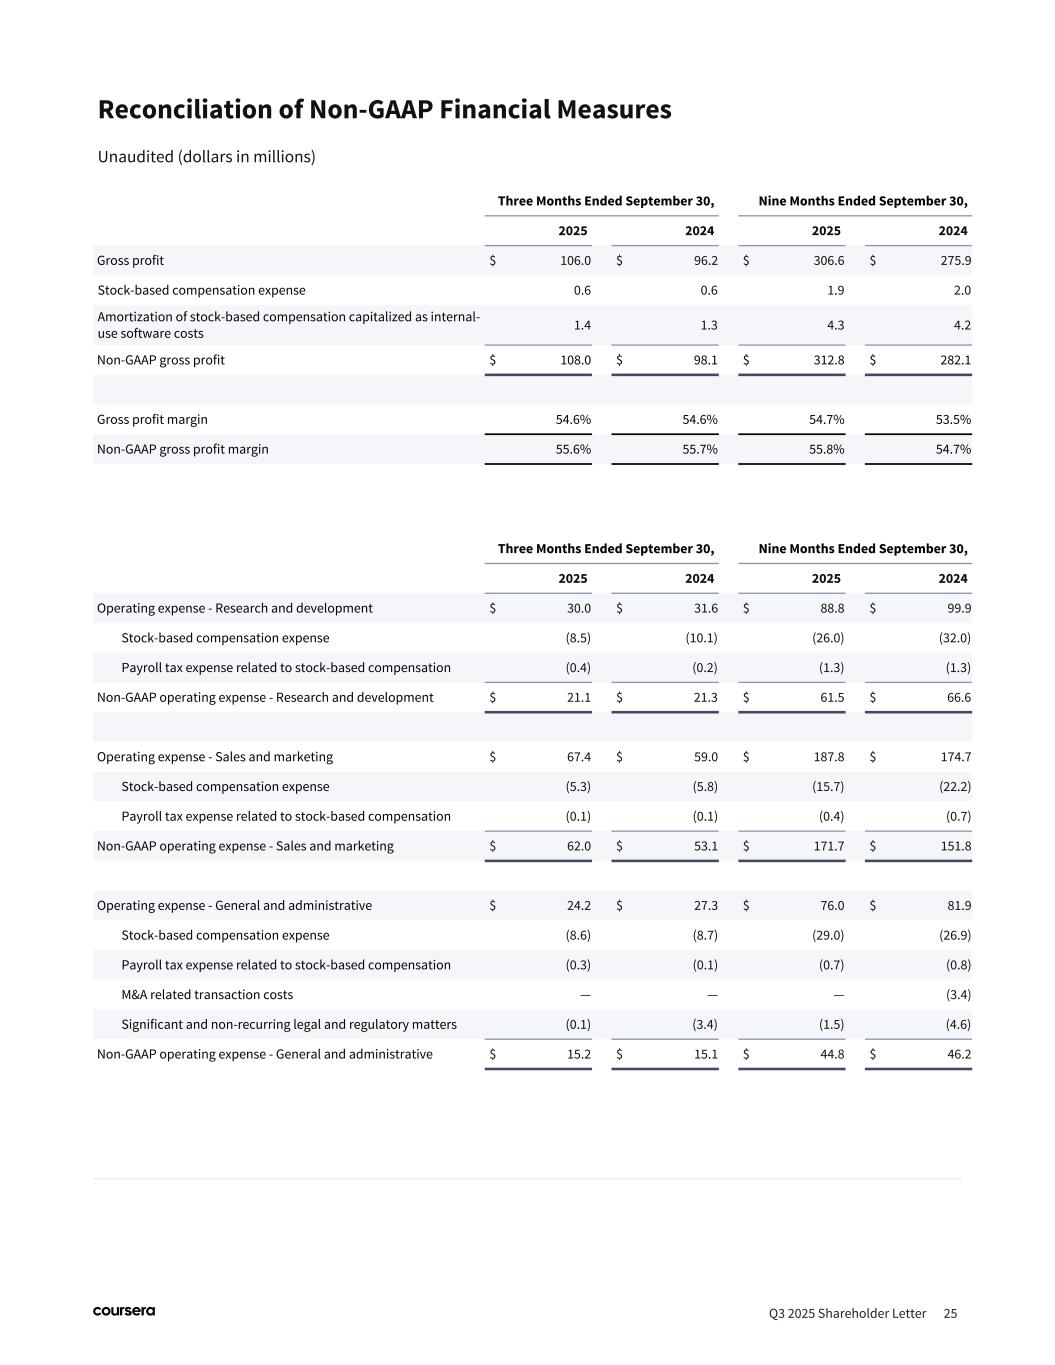
Three Months Ended September 30, Nine Months Ended September 30, 2025 2024 2025 2024 Operating expense - Research and development $ 30.0 $ 31.6 $ 88.8 $ 99.9 Stock-based compensation expense (8.5) (10.1) (26.0) (32.0) Payroll tax expense related to stock-based compensation (0.4) (0.2) (1.3) (1.3) Non-GAAP operating expense - Research and development $ 21.1 $ 21.3 $ 61.5 $ 66.6 Operating expense - Sales and marketing $ 67.4 $ 59.0 $ 187.8 $ 174.7 Stock-based compensation expense (5.3) (5.8) (15.7) (22.2) Payroll tax expense related to stock-based compensation (0.1) (0.1) (0.4) (0.7) Non-GAAP operating expense - Sales and marketing $ 62.0 $ 53.1 $ 171.7 $ 151.8 Operating expense - General and administrative $ 24.2 $ 27.3 $ 76.0 $ 81.9 Stock-based compensation expense (8.6) (8.7) (29.0) (26.9) Payroll tax expense related to stock-based compensation (0.3) (0.1) (0.7) (0.8) M&A related transaction costs — — — (3.4) Significant and non-recurring legal and regulatory matters (0.1) (3.4) (1.5) (4.6) Non-GAAP operating expense - General and administrative $ 15.2 $ 15.1 $ 44.8 $ 46.2 Reconciliation of Non-GAAP Financial Measures Unaudited (dollars in millions) Q3 2025 Shareholder Letter 25 Three Months Ended September 30, Nine Months Ended September 30, 2025 2024 2025 2024 Gross profit $ 106.0 $ 96.2 $ 306.6 $ 275.9 Stock-based compensation expense 0.6 0.6 1.9 2.0 Amortization of stock-based compensation capitalized as internal- use software costs 1.4 1.3 4.3 4.2 Non-GAAP gross profit $ 108.0 $ 98.1 $ 312.8 $ 282.1 Gross profit margin 54.6 % 54.6 % 54.7 % 53.5 % Non-GAAP gross profit margin 55.6 % 55.7 % 55.8 % 54.7 %
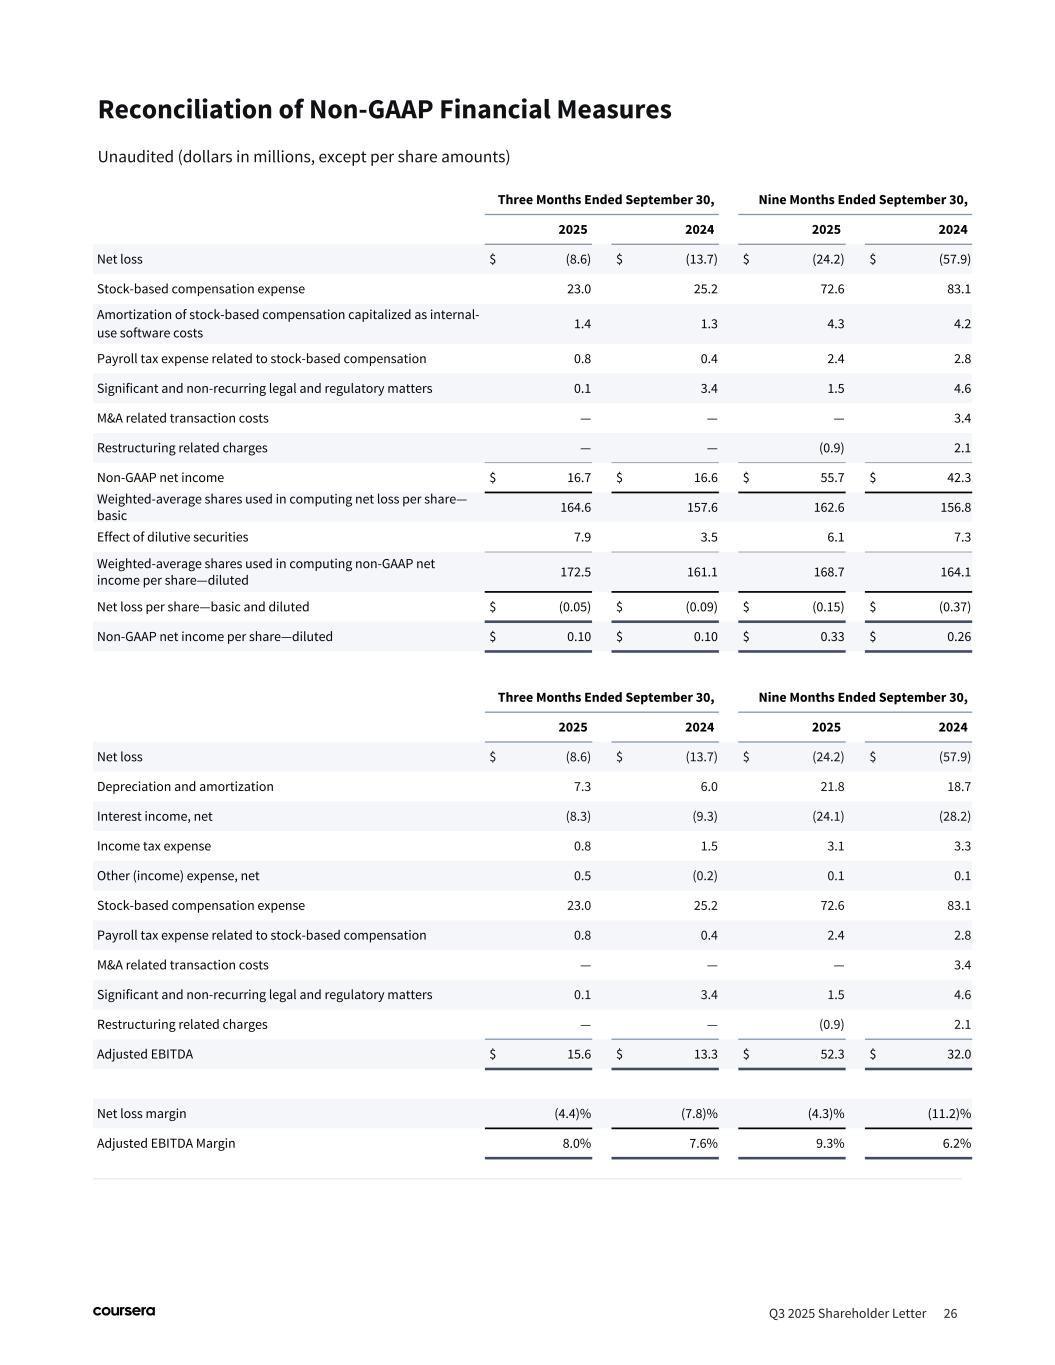
Three Months Ended September 30, Nine Months Ended September 30, 2025 2024 2025 2024 Net loss $ (8.6) $ (13.7) $ (24.2) $ (57.9) Stock-based compensation expense 23.0 25.2 72.6 83.1 Amortization of stock-based compensation capitalized as internal- use software costs 1.4 1.3 4.3 4.2 Payroll tax expense related to stock-based compensation 0.8 0.4 2.4 2.8 Significant and non-recurring legal and regulatory matters 0.1 3.4 1.5 4.6 M&A related transaction costs — — — 3.4 Restructuring related charges — — (0.9) 2.1 Non-GAAP net income $ 16.7 $ 16.6 $ 55.7 $ 42.3 Weighted-average shares used in computing net loss per share— basic 164.6 157.6 162.6 156.8 Effect of dilutive securities 7.9 3.5 6.1 7.3 Weighted-average shares used in computing non-GAAP net income per share—diluted 172.5 161.1 168.7 164.1 Net loss per share—basic and diluted $ (0.05) $ (0.09) $ (0.15) $ (0.37) Non-GAAP net income per share—diluted $ 0.10 $ 0.10 $ 0.33 $ 0.26 Reconciliation of Non-GAAP Financial Measures Unaudited (dollars in millions, except per share amounts) Q3 2025 Shareholder Letter 26 Three Months Ended September 30, Nine Months Ended September 30, 2025 2024 2025 2024 Net loss $ (8.6) $ (13.7) $ (24.2) $ (57.9) Depreciation and amortization 7.3 6.0 21.8 18.7 Interest income, net (8.3) (9.3) (24.1) (28.2) Income tax expense 0.8 1.5 3.1 3.3 Other (income) expense, net 0.5 (0.2) 0.1 0.1 Stock-based compensation expense 23.0 25.2 72.6 83.1 Payroll tax expense related to stock-based compensation 0.8 0.4 2.4 2.8 M&A related transaction costs — — — 3.4 Significant and non-recurring legal and regulatory matters 0.1 3.4 1.5 4.6 Restructuring related charges — — (0.9) 2.1 Adjusted EBITDA $ 15.6 $ 13.3 $ 52.3 $ 32.0 Net loss margin (4.4) % (7.8) % (4.3) % (11.2) % Adjusted EBITDA Margin 8.0 % 7.6 % 9.3 % 6.2 %
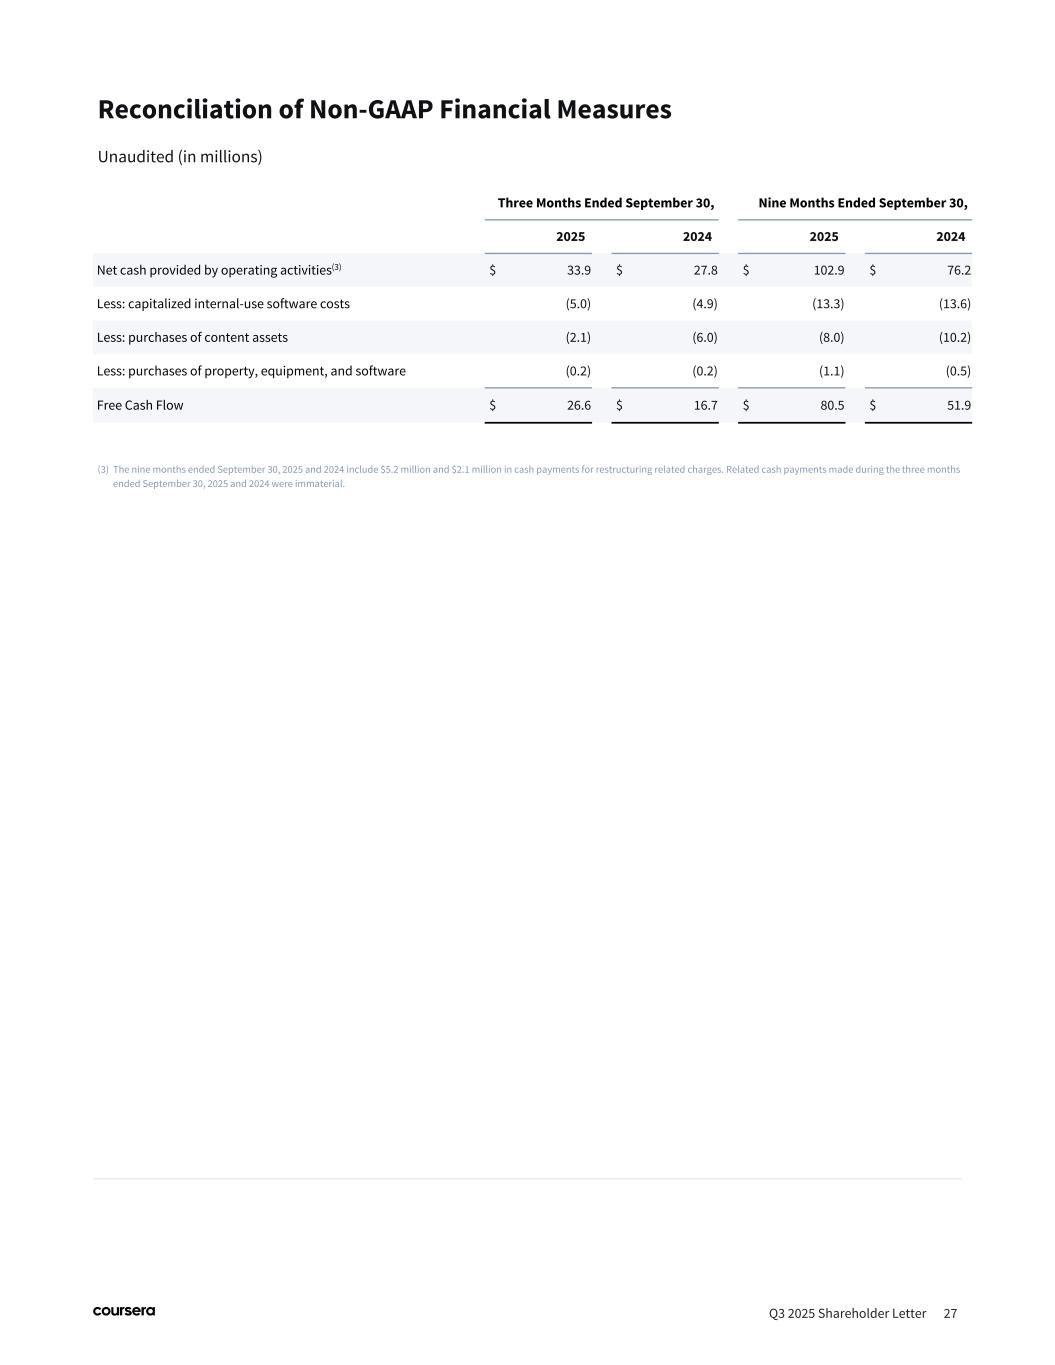
Reconciliation of Non-GAAP Financial Measures Unaudited (in millions) Q3 2025 Shareholder Letter 27 Three Months Ended September 30, Nine Months Ended September 30, 2025 2024 2025 2024 Net cash provided by operating activities(3) $ 33.9 $ 27.8 $ 102.9 $ 76.2 Less: capitalized internal-use software costs (5.0) (4.9) (13.3) (13.6) Less: purchases of content assets (2.1) (6.0) (8.0) (10.2) Less: purchases of property, equipment, and software (0.2) (0.2) (1.1) (0.5) Free Cash Flow $ 26.6 $ 16.7 $ 80.5 $ 51.9 (3) The nine months ended September 30, 2025 and 2024 include $5.2 million and $2.1 million in cash payments for restructuring related charges. Related cash payments made during the three months ended September 30, 2025 and 2024 were immaterial.
