1 May 28, 2026 Acquisition of CIBC Caribbean Bank Limited Creating a Leading Independent Banking Platform Investor Presentation May 28, 2026 (All values in US$ millions, unless otherwise stated)
2 May 28, 2026 Forward-Looking Statements: Certain of the statements made in this presentation are forward-looking statements within the meaning of, and subject to the protections of, Section 27A of the Securities Act, as amended, and Section 21E of the Securities Exchange Act of 1934, as amended, and the safe harbor provisions of the U.S. Private Securities Litigation Reform Act of 1995. Forward-looking statements are not historical facts and include statements with respect to, among other things, our beliefs, plans, objectives, goals, expectations, anticipations, assumptions, estimates, intentions, and future performance, including, without limitation statements regarding the proposed acquisition of CIBC Caribbean Bank Limited (“CIBC Caribbean”) by The Bank of N.T. Butterfield & Son Limited (“Butterfield”); the expected timing, structure, terms and completion of the proposed transaction; the expected form and mix of consideration, including the issuance of Butterfield ordinary shares; any acquisition of shares from minority shareholders of CIBC Caribbean or related compulsory acquisition, squeeze-out or similar process; the expected ownership, governance, management, capital, regulatory and operating profile of Butterfield following the proposed transaction; the expected financing of the proposed transaction, including the amount, terms and timing of the proposed subordinated debt financing; and the anticipated benefits of the proposed transaction, including expected scale, diversification, cost savings, synergies, earnings accretion, tangible book value per share accretion, capital generation, regulatory capital ratios, risk-weighted assets, liquidity, deposit mix, market position and other financial and operating impacts. Forward-looking statements involve known and unknown risks, uncertainties and other factors, many of which are beyond Butterfield’s control, which may cause the actual results, performance, capital, ownership, financial condition or achievements of Butterfield to be materially different from future results, performance, capital, ownership, financial condition or achievements expressed or implied by such forward-looking statements. These risks and uncertainties include, among others: Butterfield’s ability to successfully complete the proposed acquisition of CIBC Caribbean on the anticipated terms or timeline or at all; Butterfield’s ability to realize the anticipated benefits of the proposed transaction in the expected timeframes or at all, including cost savings, synergies, capital optimization initiatives, earnings accretion, tangible book value per share accretion; Butterfield’s ability to successfully integrate CIBC Caribbean’s businesses, operations, systems, controls, compliance programs, risk management framework, personnel and culture into those of Butterfield; the risk that such integration may be more difficult, time-consuming or costly than expected; the failure of any of the conditions to the proposed transaction to be satisfied or waived; the failure to obtain required shareholder, regulatory, governmental, securities exchange, exchange-control or other approvals, or delays in obtaining such approvals; the risk that such approvals may result in the imposition of conditions, restrictions or requirements that could adversely affect Butterfield, CIBC Caribbean or the expected benefits of the proposed transaction; the risk that any minority shareholder offer, compulsory acquisition, squeeze-out or similar process is delayed, not completed or completed on different terms than expected; revenues following the proposed transaction being lower than expected; operating costs, customer loss and business disruption, including difficulties in maintaining relationships with employees, customers, clients, depositors, vendors, suppliers, regulators and other business partners, being greater than expected; risks associated with the disruption of management’s attention from Butterfield’s ongoing business operations due to the proposed transaction; reputational risks and potential adverse reactions to the announcement, pendency or completion of the proposed transaction; the outcome of any legal, regulatory or shareholder proceedings, inquiries or investigations that may be instituted or arise in connection with the proposed transaction; the possibility that the proposed transaction may be more expensive to complete than anticipated, including as a result of unexpected transaction, integration, restructuring, financing, litigation, regulatory, tax, accounting or other costs; dilution caused by the issuance of additional Butterfield ordinary shares in connection with the proposed transaction; changes in Butterfield’s share price, interest rates, foreign exchange rates, capital markets or other market conditions that may affect the transaction financing or expected financial impacts of the proposed transaction; the risk that any subordinated debt or other transaction financing is not obtained on the expected terms, timing or at all; and the risk that assumptions underlying pro forma financial information, purchase accounting, credit marks, fair value marks, integration costs, cost savings, synergies, capital ratios, earnings accretion, tangible book value per share accretion, return metrics and other financial impacts prove to be inaccurate. Other factors that may impact Butterfield’s future results, performance, financial condition or achievements include worldwide and regional economic conditions, including economic growth and general business conditions in Bermuda, the Cayman Islands, Barbados, The Bahamas, Turks and Caicos, Trinidad and Tobago, the broader Atlantic, Caribbean and other markets in which Butterfield or CIBC Caribbean operates; fluctuations in interest rates, inflation, monetary policy, foreign exchange rates, capital markets, tourism, real estate markets and sovereign credit ratings, including a decline in Bermuda’s sovereign credit rating; any sudden liquidity crisis; changes in customer behavior, including customer borrowing, repayment, investment and deposit practices; unfavorable developments concerning asset quality, credit quality, loan losses, non-performing loans, collateral values, loan concentrations, sovereign exposures, residential mortgage risk weighting, reserves, funding costs, liquidity and deposit flows; competitive product and pricing pressures; security risks, including cybersecurity, data privacy, fraud, financial crime, anti-money laundering and sanctions risks; the impact, extent and timing of technological changes, systems conversions and operational resilience initiatives; risks relating to the success of Butterfield’s updated systems and platforms; capital management activities; changes in laws, regulations, accounting standards, tax laws, regulatory capital or liquidity requirements and supervisory expectations; potential impacts of climate change, hurricanes and other natural disasters; compliance with regulatory requirements; and other factors. Forward-looking statements can be identified by words such as "anticipate," "assume," "believe," "estimate," "expect," "indicate," "intend," "may," "plan," "point to," "predict," "project," "seek," "target," "potential," "will," "would," "could," "should," "continue," "contemplate" and other similar expressions, although not all forward-looking statements contain these identifying words. All statements other than statements of historical fact are statements that could be forward-looking statements. All forward-looking statements in this disclosure are expressly qualified in their entirety by this cautionary notice, including, without limitation, those risks and uncertainties described in our SEC reports and filings, including under the caption "Risk Factors" in our most recent Annual Report on Form 20-F and in any subsequent reports furnished or filed with the Securities and Exchange Commission ("SEC"). Such reports are available upon request from Butterfield, or from the SEC including through the SEC’s website at https://www.sec.gov. Any forward-looking statements made by Butterfield are current views as at the date they are made. Except as otherwise required by law, Butterfield assumes no obligation and does not undertake to review, update, revise or correct any of the forward-looking statements included in this disclosure, whether as a result of new information, future events or other developments. You are cautioned not to place undue reliance on the forward-looking statements made by Butterfield in this disclosure. Comparisons of results for current and any prior periods are not intended to express any future trends or indications of future performance, and should only be viewed as historical data. About Non-GAAP Financial Measures: This presentation contains non-GAAP financial measures including “core” net income and other financial measures presented on a “core” basis. We believe such measures provide useful information to investors that is supplementary to our financial condition, results of operations and cash flows computed in accordance with GAAP; however, our non-GAAP financial measures have a number of limitations. In addition, these non-GAAP financial measures have no standardized meanings and are not defined by GAAP. As such, investors should not view these disclosures as a substitute for results determined in accordance with GAAP, and they are not necessarily comparable to non-GAAP financial measures that other companies use. Reconciliations of these non-GAAP measures to corresponding GAAP financial measures are provided in the Appendix of this presentation. Presentation of Financial Information: Certain monetary amounts, percentages and other figures included in this report have been subject to rounding adjustments. Accordingly, figures shown as totals in certain tables may not be the arithmetic aggregation of the figures that precede them, and figures expressed as percentages in the text may not total 100% or, as applicable, when aggregated may not be the arithmetic aggregation of the percentages that precede them. Forward-Looking Statements
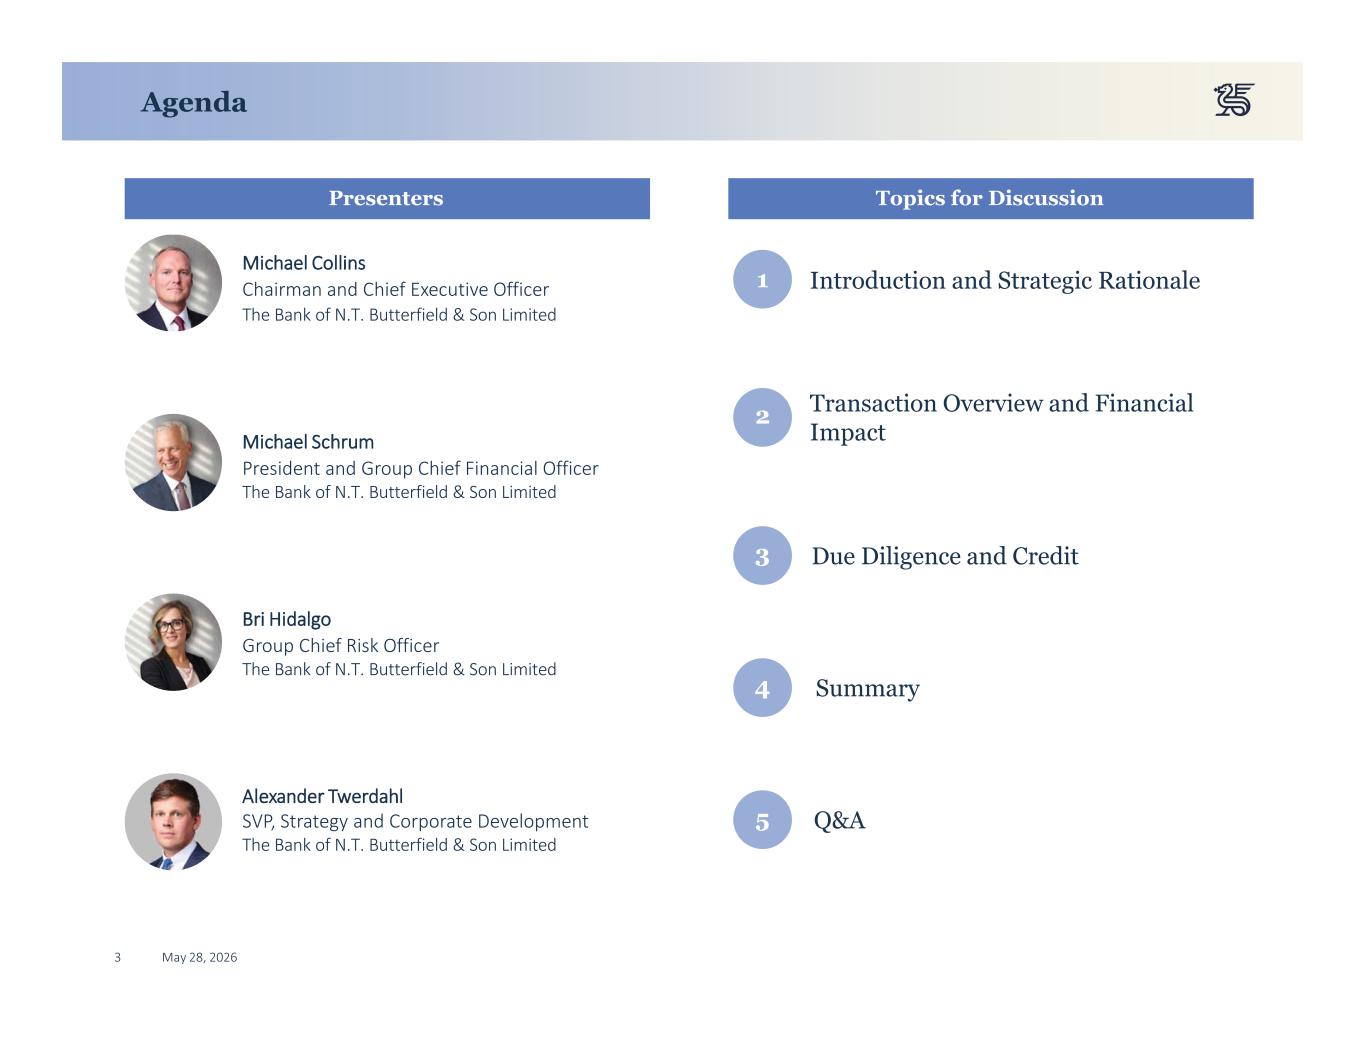
3 May 28, 2026 1 Introduction and Strategic Rationale 2 Transaction Overview and Financial Impact 3 Due Diligence and Credit 5 Q&A Michael Collins Chairman and Chief Executive Officer The Bank of N.T. Butterfield & Son Limited Michael Schrum President and Group Chief Financial Officer The Bank of N.T. Butterfield & Son Limited Bri Hidalgo Group Chief Risk Officer The Bank of N.T. Butterfield & Son Limited Agenda Alexander Twerdahl SVP, Strategy and Corporate Development The Bank of N.T. Butterfield & Son Limited Presenters Topics for Discussion 4 Summary
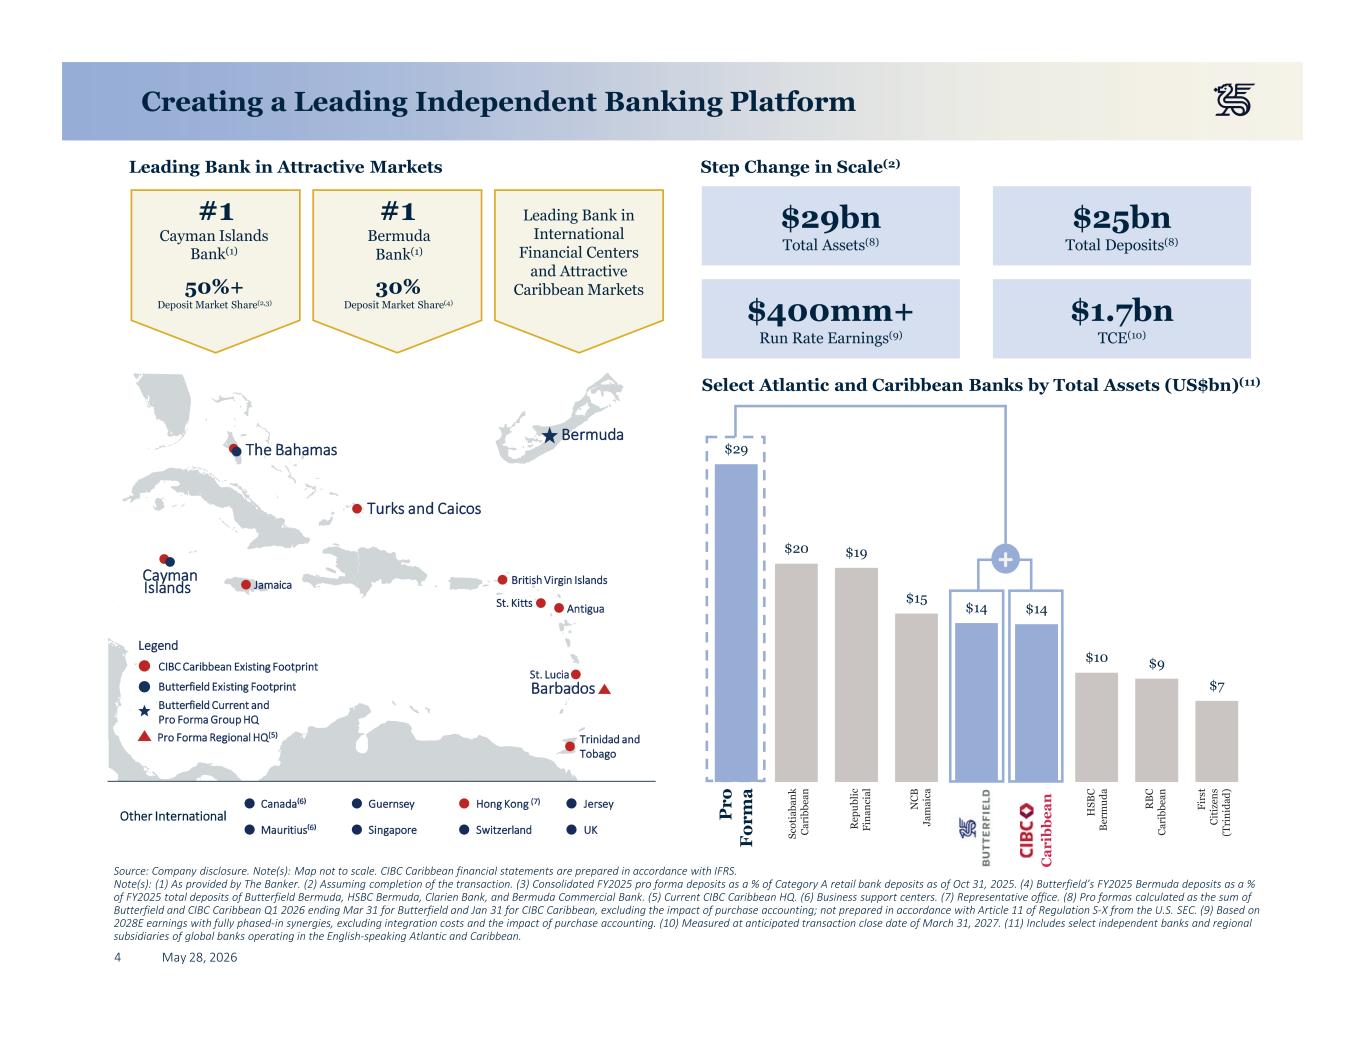
4 May 28, 2026 Creating a Leading Independent Banking Platform Step Change in Scale(2) Source: Company disclosure. Note(s): Map not to scale. CIBC Caribbean financial statements are prepared in accordance with IFRS. Note(s): (1) As provided by The Banker. (2) Assuming completion of the transaction. (3) Consolidated FY2025 pro forma deposits as a % of Category A retail bank deposits as of Oct 31, 2025. (4) Butterfield’s FY2025 Bermuda deposits as a % of FY2025 total deposits of Butterfield Bermuda, HSBC Bermuda, Clarien Bank, and Bermuda Commercial Bank. (5) Current CIBC Caribbean HQ. (6) Business support centers. (7) Representative office. (8) Pro formas calculated as the sum of Butterfield and CIBC Caribbean Q1 2026 ending Mar 31 for Butterfield and Jan 31 for CIBC Caribbean, excluding the impact of purchase accounting; not prepared in accordance with Article 11 of Regulation S-X from the U.S. SEC. (9) Based on 2028E earnings with fully phased-in synergies, excluding integration costs and the impact of purchase accounting. (10) Measured at anticipated transaction close date of March 31, 2027. (11) Includes select independent banks and regional subsidiaries of global banks operating in the English-speaking Atlantic and Caribbean. Leading Bank in Attractive Markets Select Atlantic and Caribbean Banks by Total Assets (US$bn)(11) $29bn Total Assets(8) $25bn Total Deposits(8) Leading Bank in International Financial Centers and Attractive Caribbean Markets #1 Bermuda Bank(1) #1 Cayman Islands Bank(1) 50%+ Deposit Market Share(2,3) 30% Deposit Market Share(4) $1.7bn TCE(10) $400mm+ Run Rate Earnings(9) $29 $20 $19 $15 $14 $14 $10 $9 $7 P ro F or m a + R ep ub lic Fi na nc ia l N C B Ja m ai ca Sc ot ia ba nk C ar ib be an H SB C B er m ud a R B C C ar ib be an Fi rs t C it iz en s (T ri ni da d) The Bahamas Turks and Caicos Cayman Islands Jamaica British Virgin Islands St. Kitts Antigua St. Lucia Barbados Trinidad and Tobago Bermuda Legend CIBC Caribbean Existing Footprint Butterfield Existing Footprint Butterfield Current and Pro Forma Group HQ Pro Forma Regional HQ(5) Other International 6 Guernsey Jersey 6 Singapore Switzerland UK C ar ib be anHong Kong (7)
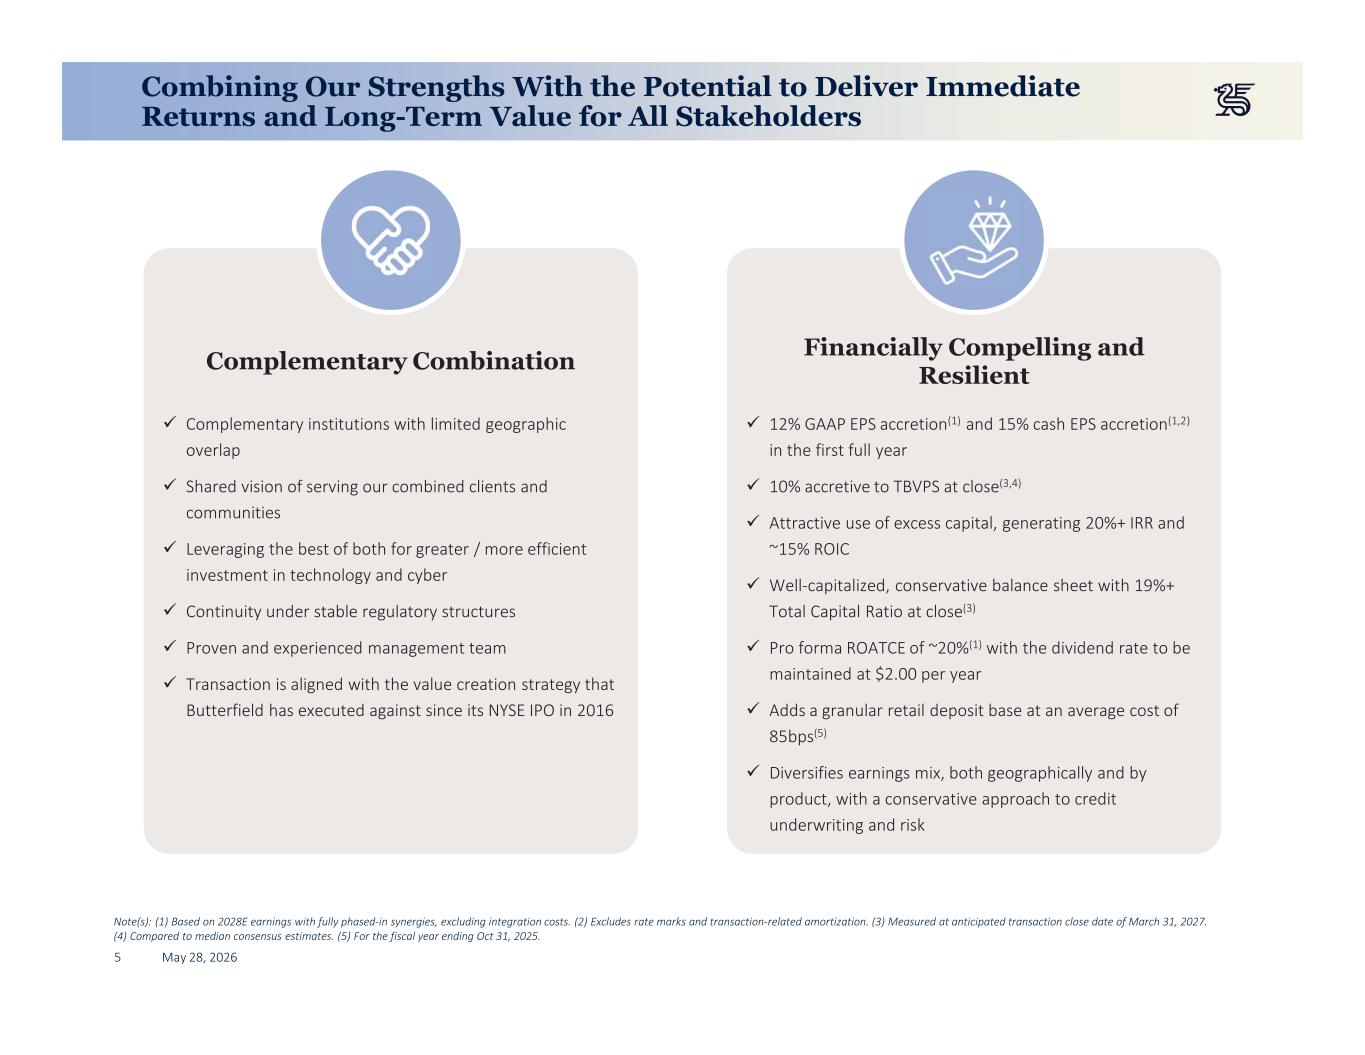
5 May 28, 2026 Complementary institutions with limited geographic overlap Shared vision of serving our combined clients and communities Leveraging the best of both for greater / more efficient investment in technology and cyber Continuity under stable regulatory structures Proven and experienced management team Transaction is aligned with the value creation strategy that Butterfield has executed against since its NYSE IPO in 2016 12% GAAP EPS accretion(1) and 15% cash EPS accretion(1,2) in the first full year 10% accretive to TBVPS at close(3,4) Attractive use of excess capital, generating 20%+ IRR and ~15% ROIC Well-capitalized, conservative balance sheet with 19%+ Total Capital Ratio at close(3) Pro forma ROATCE of ~20%(1) with the dividend rate to be maintained at $2.00 per year Adds a granular retail deposit base at an average cost of 85bps(5) Diversifies earnings mix, both geographically and by product, with a conservative approach to credit underwriting and risk Complementary Combination Financially Compelling and Resilient Combining Our Strengths With the Potential to Deliver Immediate Returns and Long-Term Value for All Stakeholders Note(s): (1) Based on 2028E earnings with fully phased-in synergies, excluding integration costs. (2) Excludes rate marks and transaction-related amortization. (3) Measured at anticipated transaction close date of March 31, 2027. (4) Compared to median consensus estimates. (5) For the fiscal year ending Oct 31, 2025.
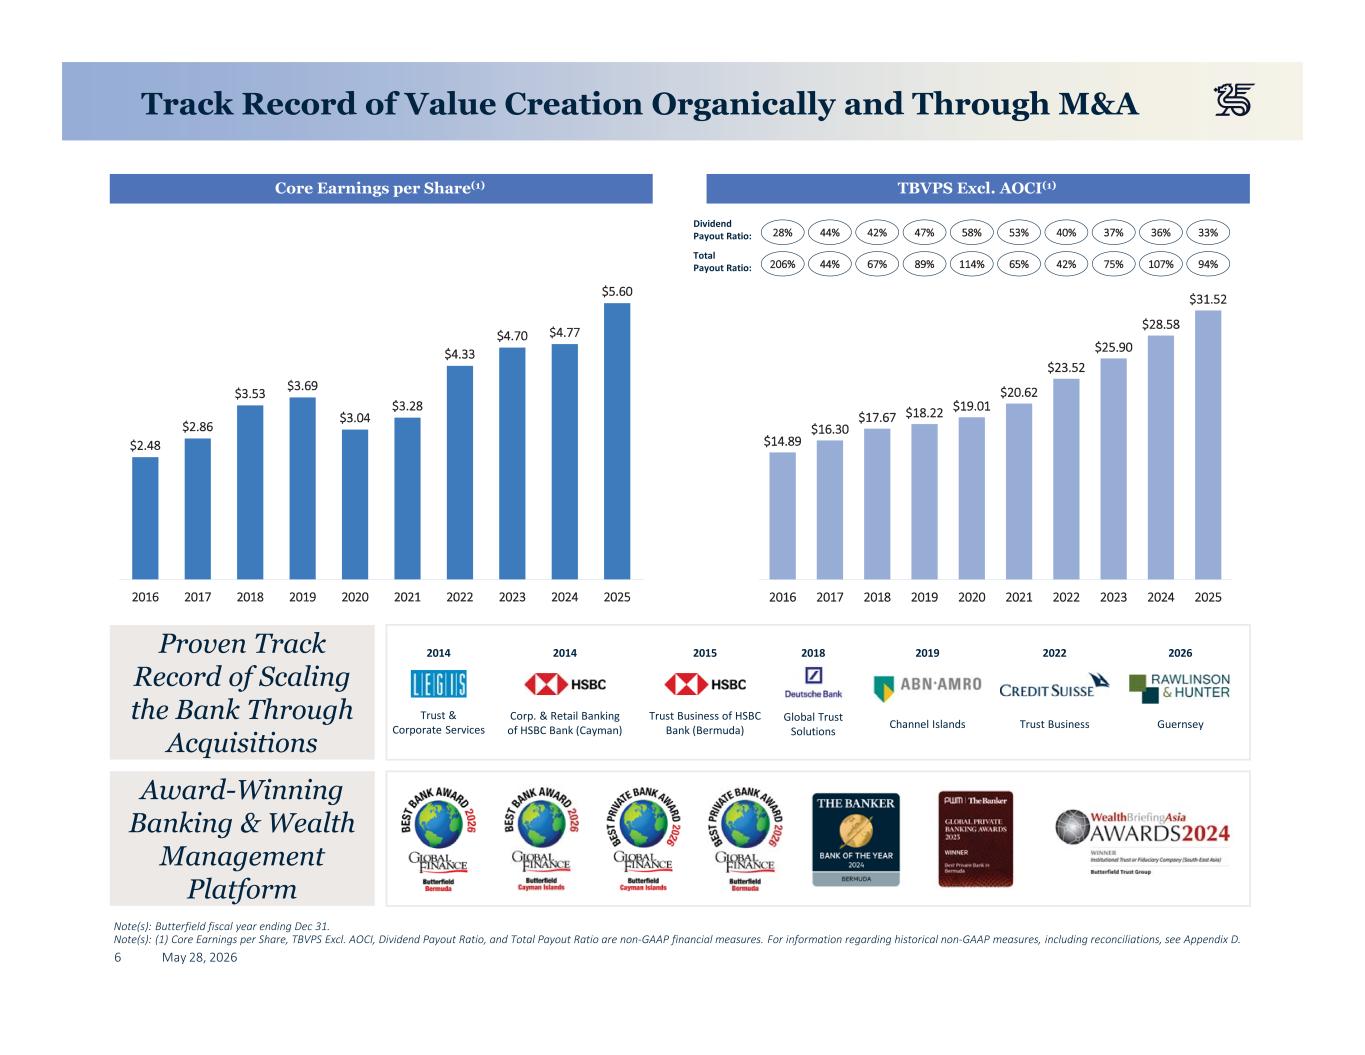
6 May 28, 2026 $31.52 $28.58 $25.90 $23.52 $20.62 $19.01$18.22$17.67 $16.30 $14.89 2025202420232022202120202019201820172016 $5.60 $4.77$4.70 $4.33 $3.28 $3.04 $3.69$3.53 $2.86 $2.48 2025202420232022202120202019201820172016 Track Record of Value Creation Organically and Through M&A Note(s): Butterfield fiscal year ending Dec 31. Note(s): (1) Core Earnings per Share, TBVPS Excl. AOCI, Dividend Payout Ratio, and Total Payout Ratio are non-GAAP financial measures. For information regarding historical non-GAAP measures, including reconciliations, see Appendix D. Award-Winning Banking & Wealth Management Platform Core Earnings per Share(1) TBVPS Excl. AOCI(1) Proven Track Record of Scaling the Bank Through Acquisitions Dividend Payout Ratio: Total Payout Ratio: 33%36%37%40%53%58%47%42%44%28% 94%107%75%42%65%114%89%67%44%206% Trust & Corporate Services 2014 Corp. & Retail Banking of HSBC Bank (Cayman) 2014 Global Trust Solutions 2018 Channel Islands 2019 Trust Business 2022 Guernsey 2026 Trust Business of HSBC Bank (Bermuda) 2015
7 May 28, 2026 Transaction Overview and Financial Impact
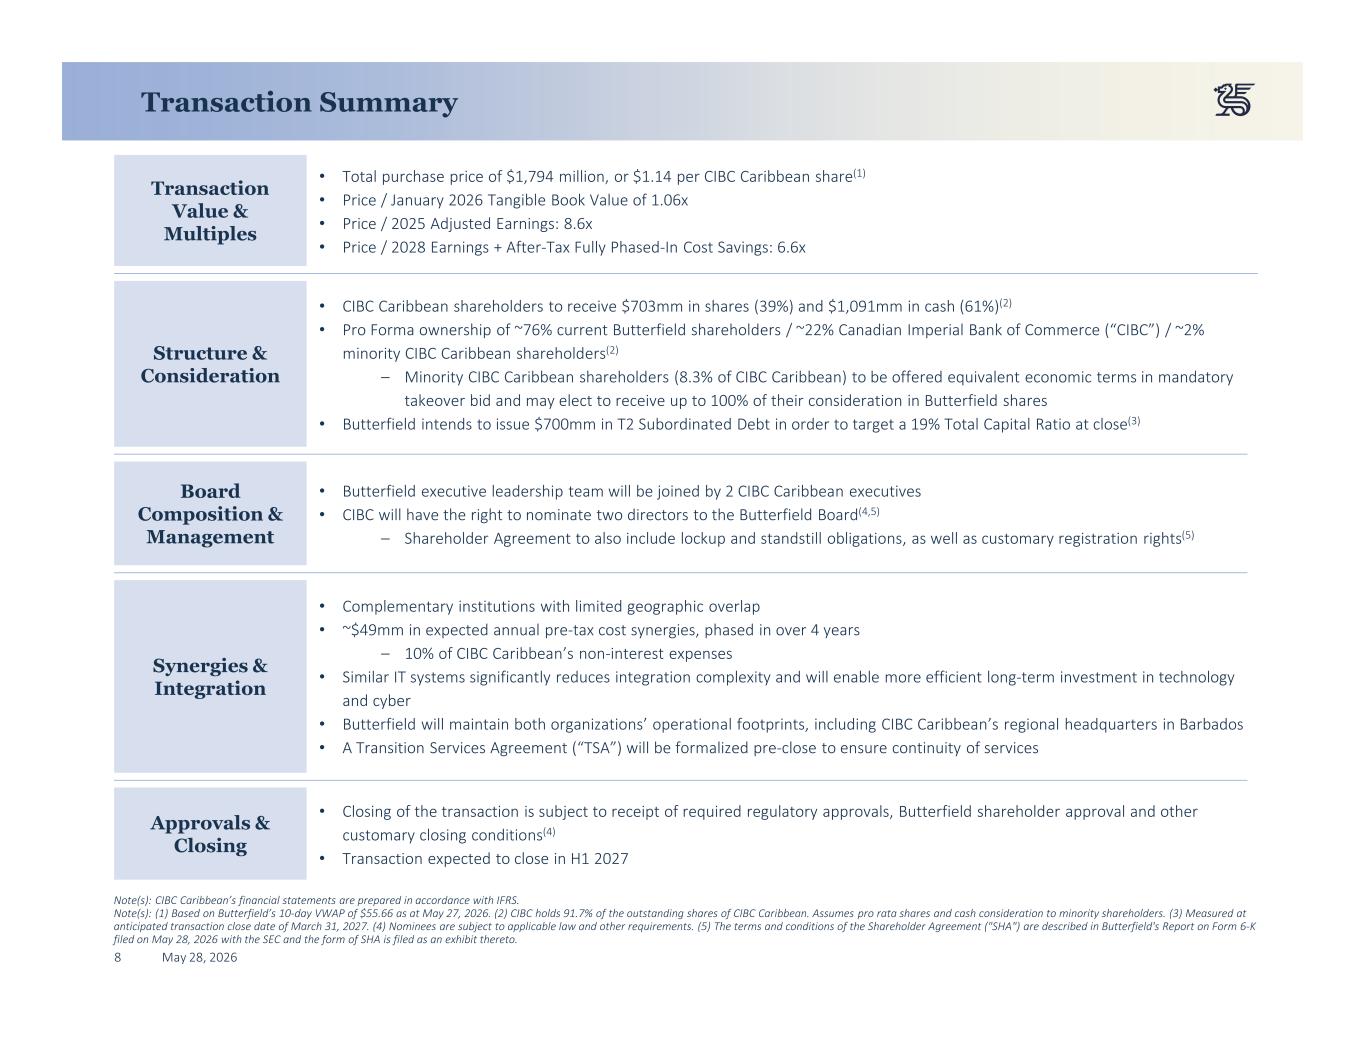
8 May 28, 2026 Transaction Summary Synergies & Integration Structure & Consideration • CIBC Caribbean shareholders to receive $703mm in shares (39%) and $1,091mm in cash (61%)(2) • Pro Forma ownership of ~76% current Butterfield shareholders / ~22% Canadian Imperial Bank of Commerce (“CIBC”) / ~2% minority CIBC Caribbean shareholders(2) – Minority CIBC Caribbean shareholders (8.3% of CIBC Caribbean) to be offered equivalent economic terms in mandatory takeover bid and may elect to receive up to 100% of their consideration in Butterfield shares • Butterfield intends to issue $700mm in T2 Subordinated Debt in order to target a 19% Total Capital Ratio at close(3) • Closing of the transaction is subject to receipt of required regulatory approvals, Butterfield shareholder approval and other customary closing conditions(4) • Transaction expected to close in H1 2027 Transaction Value & Multiples • Complementary institutions with limited geographic overlap • ~$49mm in expected annual pre-tax cost synergies, phased in over 4 years – 10% of CIBC Caribbean’s non-interest expenses • Similar IT systems significantly reduces integration complexity and will enable more efficient long-term investment in technology and cyber • Butterfield will maintain both organizations’ operational footprints, including CIBC Caribbean’s regional headquarters in Barbados • A Transition Services Agreement (“TSA”) will be formalized pre-close to ensure continuity of services Board Composition & Management Approvals & Closing • Butterfield executive leadership team will be joined by 2 CIBC Caribbean executives • CIBC will have the right to nominate two directors to the Butterfield Board(4,5) – Shareholder Agreement to also include lockup and standstill obligations, as well as customary registration rights(5) • Total purchase price of $1,794 million, or $1.14 per CIBC Caribbean share(1) • Price / January 2026 Tangible Book Value of 1.06x • Price / 2025 Adjusted Earnings: 8.6x • Price / 2028 Earnings + After-Tax Fully Phased-In Cost Savings: 6.6x Note(s): CIBC Caribbean’s financial statements are prepared in accordance with IFRS. Note(s): (1) Based on Butterfield’s 10-day VWAP of $55.66 as at May 27, 2026. (2) CIBC holds 91.7% of the outstanding shares of CIBC Caribbean. Assumes pro rata shares and cash consideration to minority shareholders. (3) Measured at anticipated transaction close date of March 31, 2027. (4) Nominees are subject to applicable law and other requirements. (5) The terms and conditions of the Shareholder Agreement ("SHA") are described in Butterfield's Report on Form 6-K filed on May 28, 2026 with the SEC and the form of SHA is filed as an exhibit thereto.
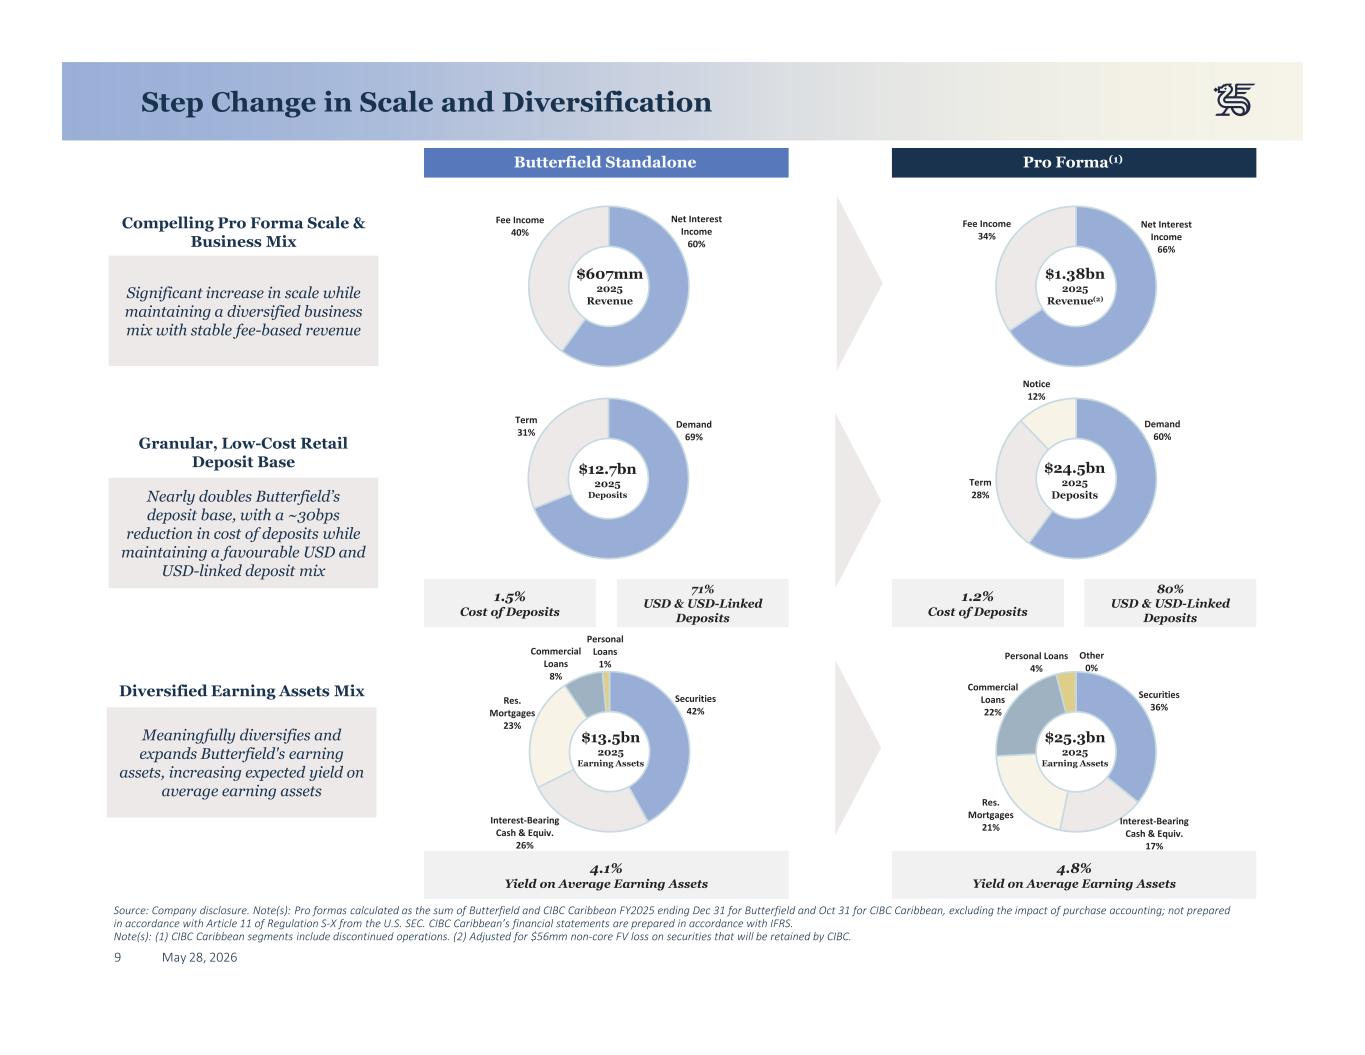
9 May 28, 2026 Securities 42% Interest-Bearing Cash & Equiv. 26% Res. Mortgages 23% Commercial Loans 8% Personal Loans 1% Step Change in Scale and Diversification Demand 69% Term 31% Pro Forma(1) Demand 60% Term 28% Notice 12% Butterfield Standalone Net Interest Income 60% Fee Income 40% Securities 36% Interest-Bearing Cash & Equiv. 17% Res. Mortgages 21% Commercial Loans 22% Personal Loans 4% Other 0% Source: Company disclosure. Note(s): Pro formas calculated as the sum of Butterfield and CIBC Caribbean FY2025 ending Dec 31 for Butterfield and Oct 31 for CIBC Caribbean, excluding the impact of purchase accounting; not prepared in accordance with Article 11 of Regulation S-X from the U.S. SEC. CIBC Caribbean’s financial statements are prepared in accordance with IFRS. Note(s): (1) CIBC Caribbean segments include discontinued operations. (2) Adjusted for $56mm non-core FV loss on securities that will be retained by CIBC. Compelling Pro Forma Scale & Business Mix Significant increase in scale while maintaining a diversified business mix with stable fee-based revenue Granular, Low-Cost Retail Deposit Base Nearly doubles Butterfield’s deposit base, with a ~30bps reduction in cost of deposits while maintaining a favourable USD and USD-linked deposit mix Diversified Earning Assets Mix Meaningfully diversifies and expands Butterfield's earning assets, increasing expected yield on average earning assets Net Interest Income 66% Fee Income 34% 1.5% Cost of Deposits 1.2% Cost of Deposits 4.1% Yield on Average Earning Assets 4.8% Yield on Average Earning Assets 71% USD & USD-Linked Deposits 80% USD & USD-Linked Deposits $607mm 2025 Revenue $1.38bn 2025 Revenue(2) $12.7bn 2025 Deposits $24.5bn 2025 Deposits $13.5bn 2025 Earning Assets $25.3bn 2025 Earning Assets
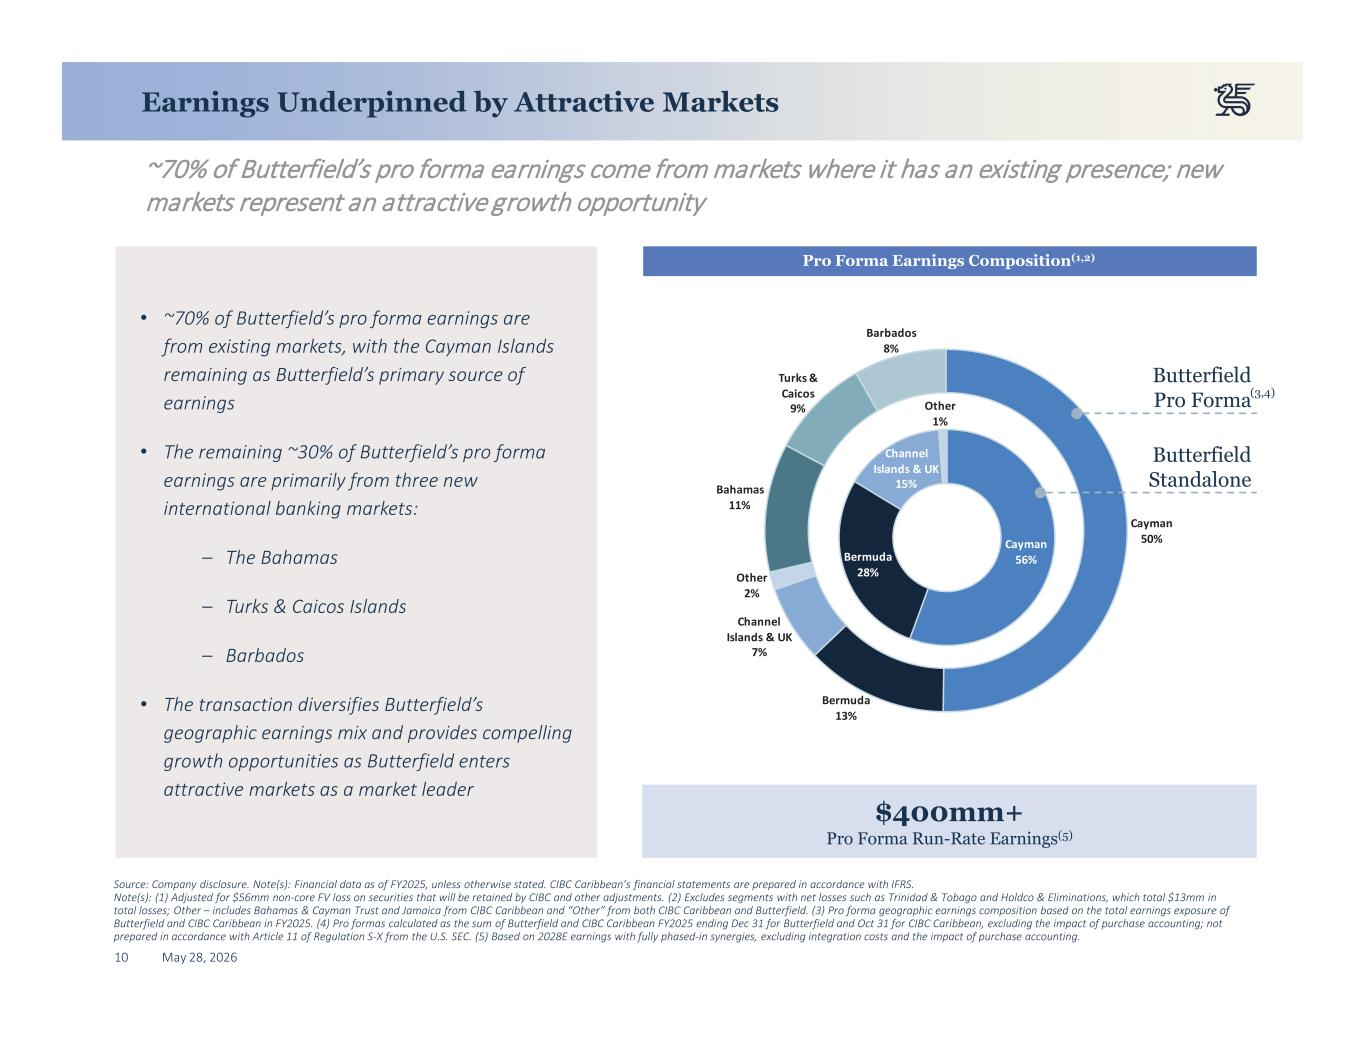
10 May 28, 2026 Cayman 50% Bermuda 13% Channel Islands & UK 7% Other 2% Bahamas 11% Turks & Caicos 9% Barbados 8% Cayman 56%Bermuda 28% Channel Islands & UK 15% Other 1% Earnings Underpinned by Attractive Markets Source: Company disclosure. Note(s): Financial data as of FY2025, unless otherwise stated. CIBC Caribbean’s financial statements are prepared in accordance with IFRS. Note(s): (1) Adjusted for $56mm non-core FV loss on securities that will be retained by CIBC and other adjustments. (2) Excludes segments with net losses such as Trinidad & Tobago and Holdco & Eliminations, which total $13mm in total losses; Other – includes Bahamas & Cayman Trust and Jamaica from CIBC Caribbean and “Other” from both CIBC Caribbean and Butterfield. (3) Pro forma geographic earnings composition based on the total earnings exposure of Butterfield and CIBC Caribbean in FY2025. (4) Pro formas calculated as the sum of Butterfield and CIBC Caribbean FY2025 ending Dec 31 for Butterfield and Oct 31 for CIBC Caribbean, excluding the impact of purchase accounting; not prepared in accordance with Article 11 of Regulation S-X from the U.S. SEC. (5) Based on 2028E earnings with fully phased-in synergies, excluding integration costs and the impact of purchase accounting. ~70% of Butterfield’s pro forma earnings come from markets where it has an existing presence; new markets represent an attractive growth opportunity • ~70% of Butterfield’s pro forma earnings are from existing markets, with the Cayman Islands remaining as Butterfield’s primary source of earnings • The remaining ~30% of Butterfield’s pro forma earnings are primarily from three new international banking markets: – The Bahamas – Turks & Caicos Islands – Barbados • The transaction diversifies Butterfield’s geographic earnings mix and provides compelling growth opportunities as Butterfield enters attractive markets as a market leader Pro Forma Earnings Composition(1,2) $400mm+ Pro Forma Run-Rate Earnings(5) Butterfield Pro Forma Butterfield Standalone (3,4)
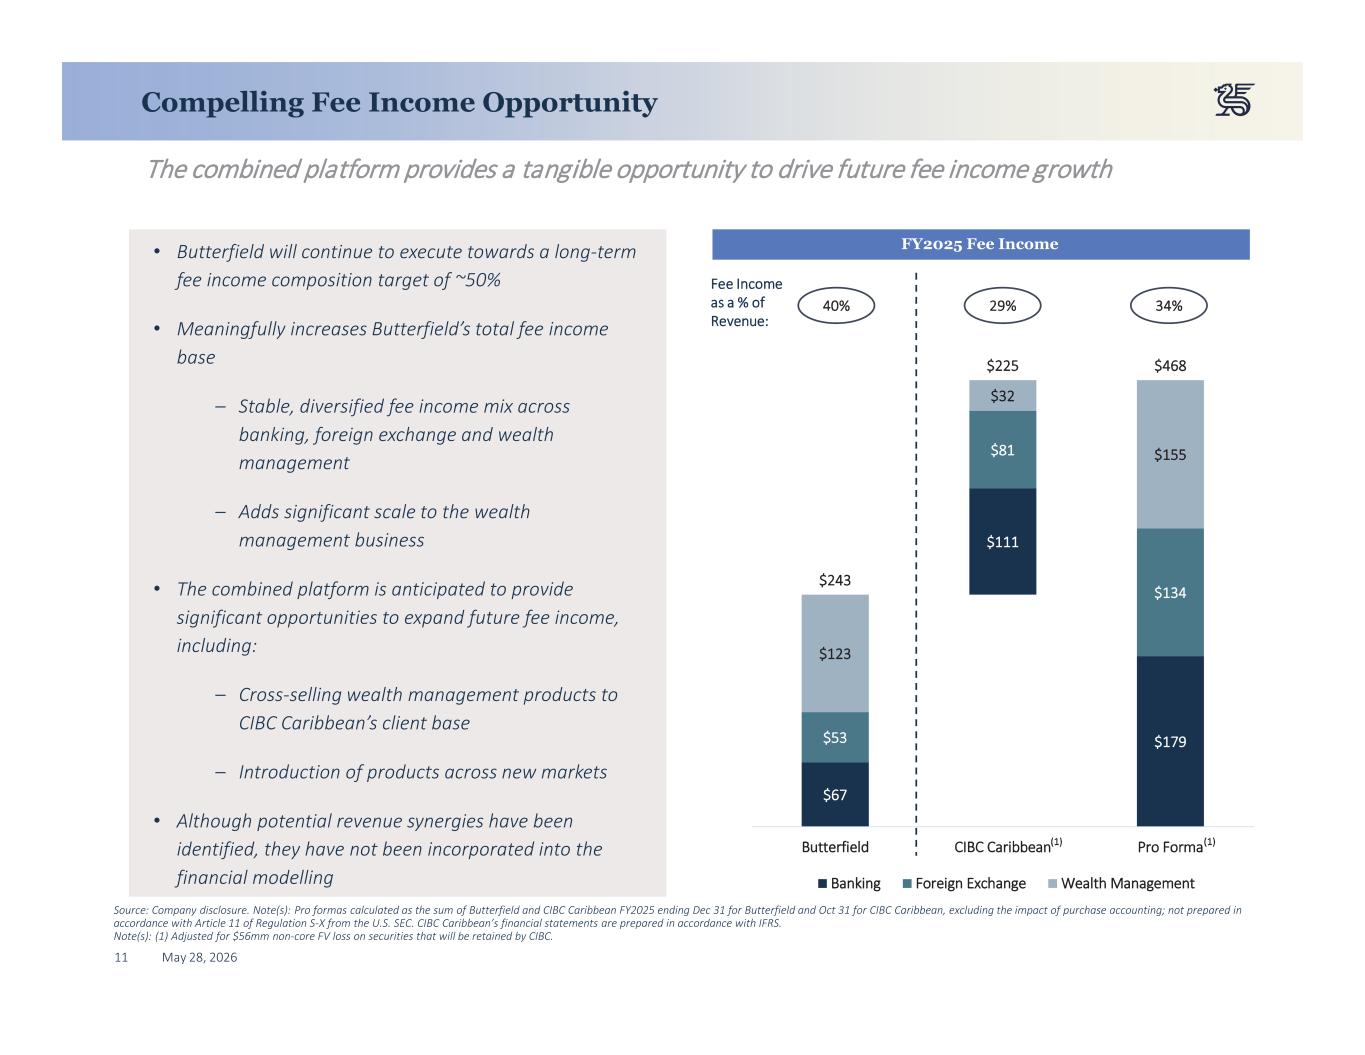
11 May 28, 2026 Compelling Fee Income Opportunity Source: Company disclosure. Note(s): Pro formas calculated as the sum of Butterfield and CIBC Caribbean FY2025 ending Dec 31 for Butterfield and Oct 31 for CIBC Caribbean, excluding the impact of purchase accounting; not prepared in accordance with Article 11 of Regulation S-X from the U.S. SEC. CIBC Caribbean’s financial statements are prepared in accordance with IFRS. Note(s): (1) Adjusted for $56mm non-core FV loss on securities that will be retained by CIBC. The combined platform provides a tangible opportunity to drive future fee income growth $67 $111 $179 $53 $81 $134 $123 $32 $155 $243 $225 $468 Butterfield CIBC Caribbean Pro Forma Banking Foreign Exchange Wealth Management FY2025 Fee Income• Butterfield will continue to execute towards a long-term fee income composition target of ~50% • Meaningfully increases Butterfield’s total fee income base – Stable, diversified fee income mix across banking, foreign exchange and wealth management – Adds significant scale to the wealth management business • The combined platform is anticipated to provide significant opportunities to expand future fee income, including: – Cross-selling wealth management products to CIBC Caribbean’s client base – Introduction of products across new markets • Although potential revenue synergies have been identified, they have not been incorporated into the financial modelling 40% 29% 34% Fee Income as a % of Revenue: (1)(1)
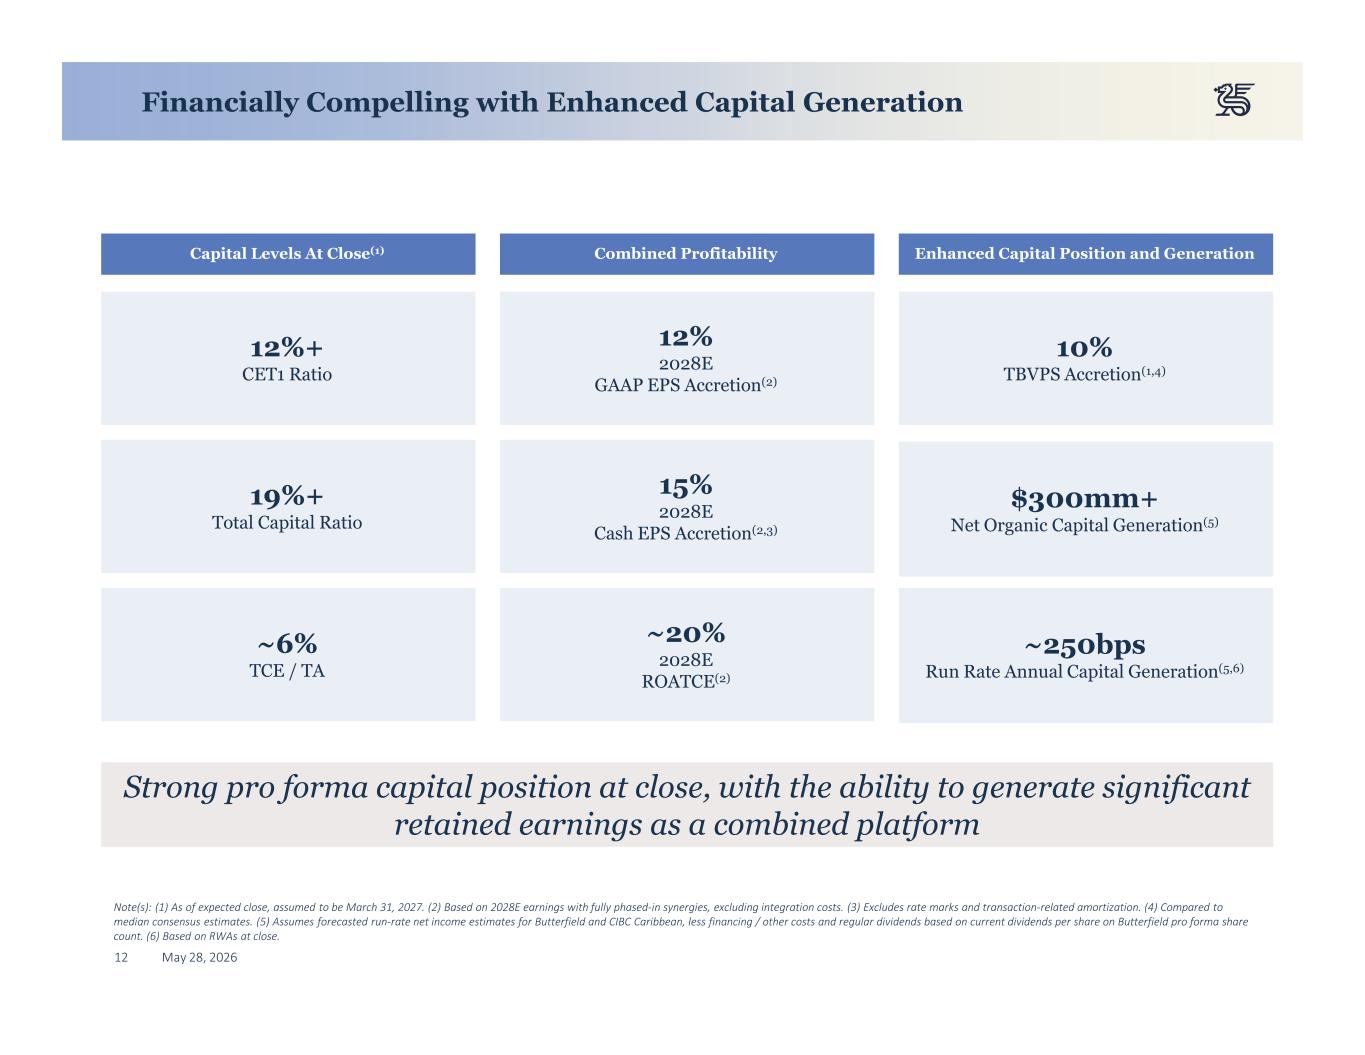
12 May 28, 2026 Financially Compelling with Enhanced Capital Generation Strong pro forma capital position at close, with the ability to generate significant retained earnings as a combined platform 12%+ CET1 Ratio Capital Levels At Close(1) 19%+ Total Capital Ratio Combined Profitability ~6% TCE / TA Note(s): (1) As of expected close, assumed to be March 31, 2027. (2) Based on 2028E earnings with fully phased-in synergies, excluding integration costs. (3) Excludes rate marks and transaction-related amortization. (4) Compared to median consensus estimates. (5) Assumes forecasted run-rate net income estimates for Butterfield and CIBC Caribbean, less financing / other costs and regular dividends based on current dividends per share on Butterfield pro forma share count. (6) Based on RWAs at close. Enhanced Capital Position and Generation 15% 2028E Cash EPS Accretion(2,3) ~20% 2028E ROATCE(2) 12% 2028E GAAP EPS Accretion(2) $300mm+ Net Organic Capital Generation(5) 10% TBVPS Accretion(1,4) ~250bps Run Rate Annual Capital Generation(5,6)
13 May 28, 2026 Due Diligence and Credit
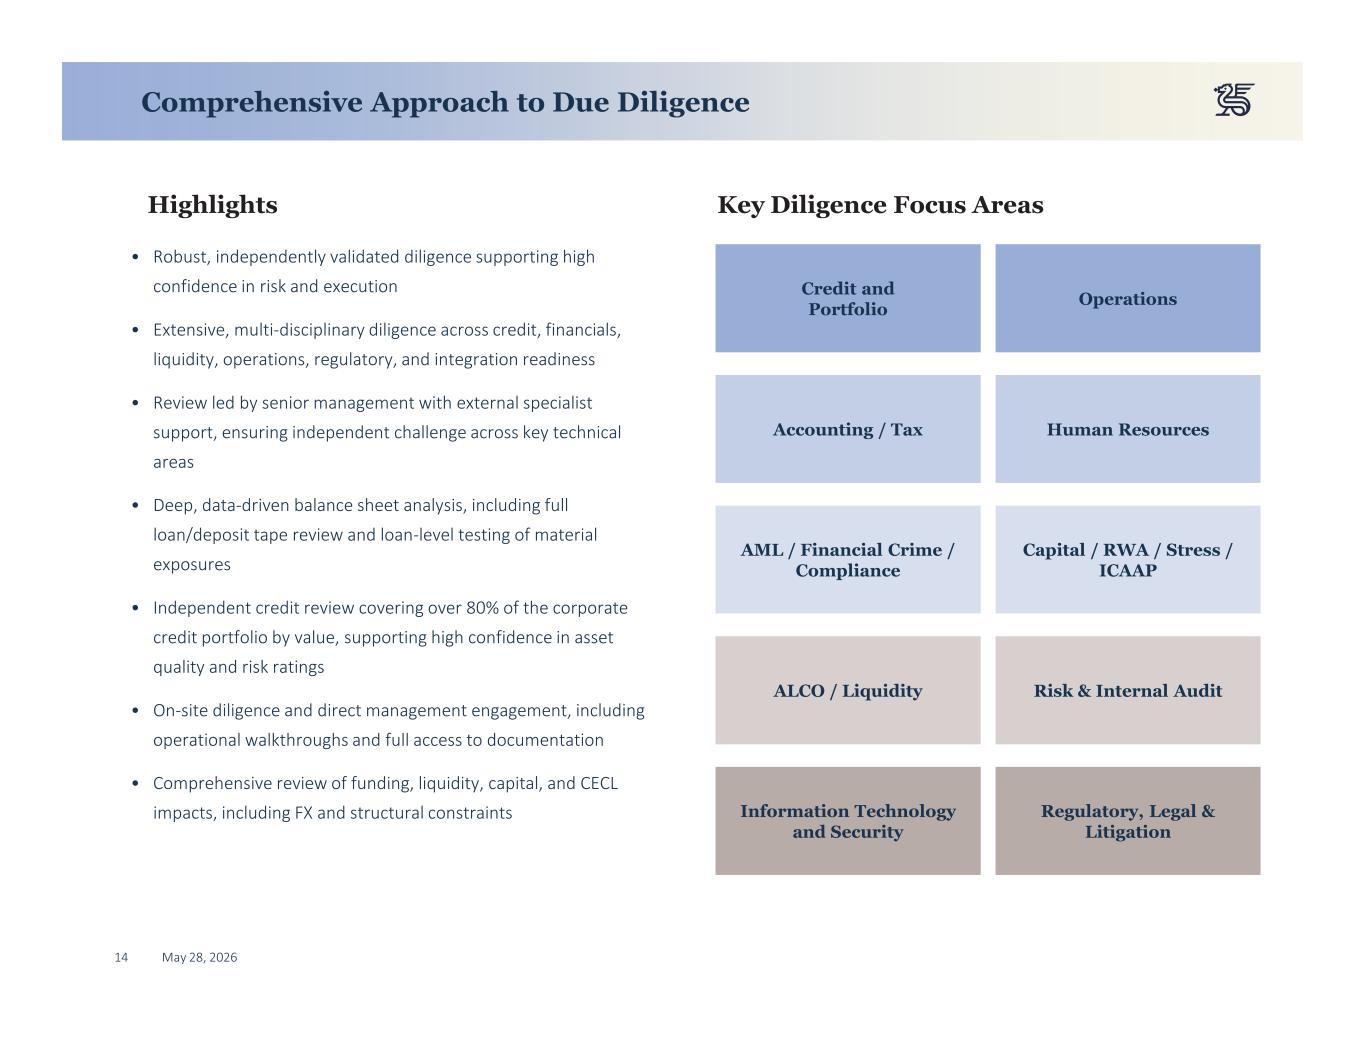
14 May 28, 2026 Comprehensive Approach to Due Diligence Highlights Key Diligence Focus Areas • Robust, independently validated diligence supporting high confidence in risk and execution • Extensive, multi-disciplinary diligence across credit, financials, liquidity, operations, regulatory, and integration readiness • Review led by senior management with external specialist support, ensuring independent challenge across key technical areas • Deep, data-driven balance sheet analysis, including full loan/deposit tape review and loan-level testing of material exposures • Independent credit review covering over 80% of the corporate credit portfolio by value, supporting high confidence in asset quality and risk ratings • On-site diligence and direct management engagement, including operational walkthroughs and full access to documentation • Comprehensive review of funding, liquidity, capital, and CECL impacts, including FX and structural constraints Credit and Portfolio Operations Accounting / Tax Human Resources AML / Financial Crime / Compliance Capital / RWA / Stress / ICAAP ALCO / Liquidity Risk & Internal Audit Information Technology and Security Regulatory, Legal & Litigation
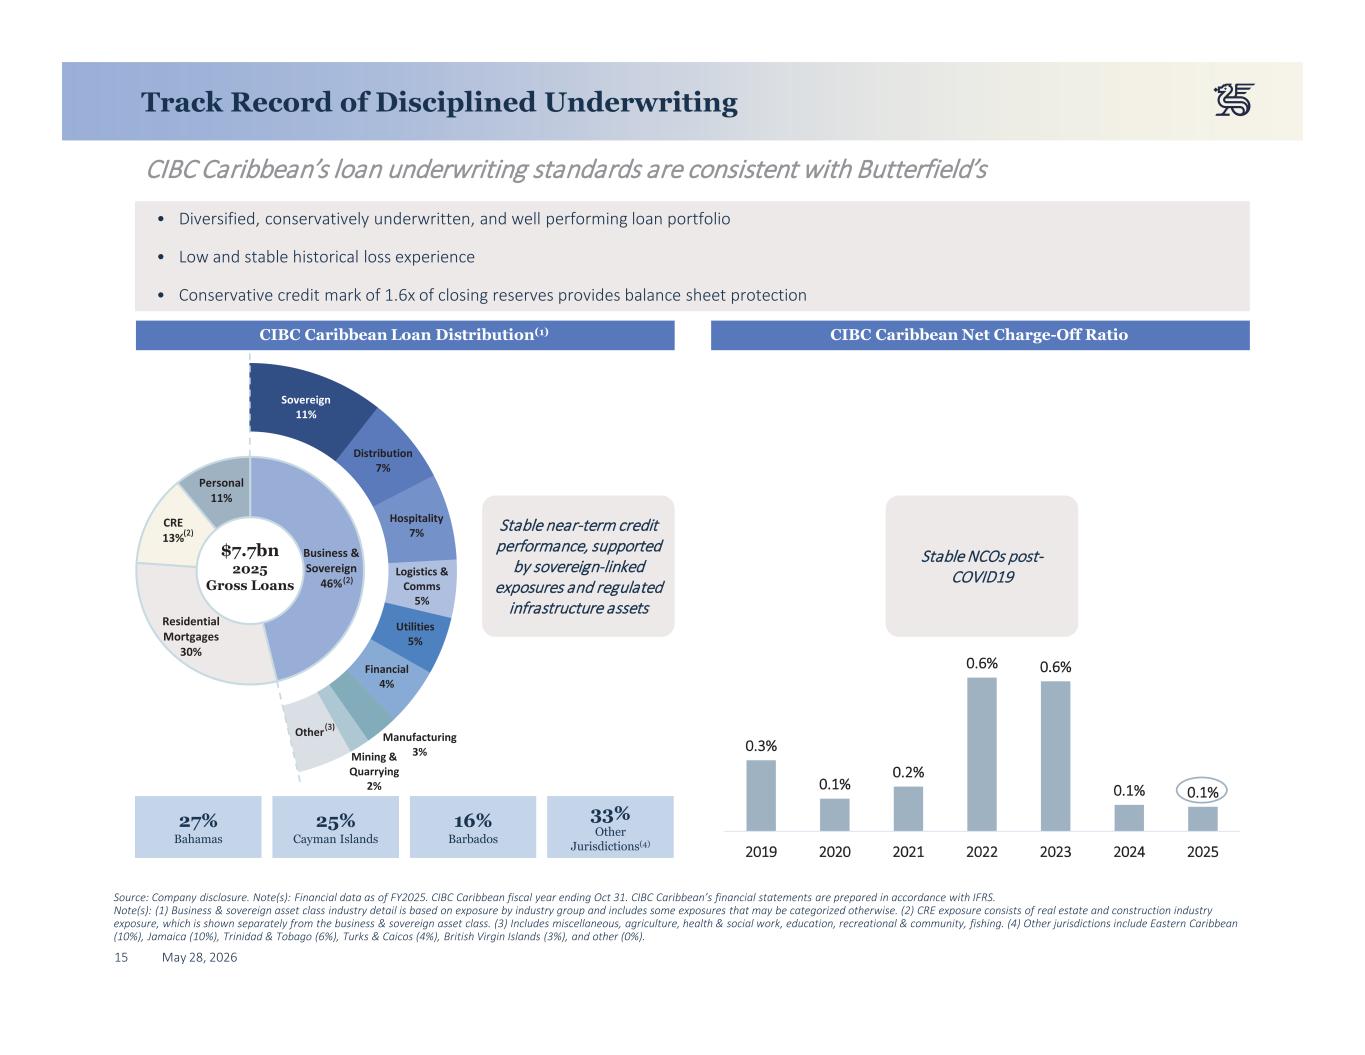
15 May 28, 2026 Track Record of Disciplined Underwriting Source: Company disclosure. Note(s): Financial data as of FY2025. CIBC Caribbean fiscal year ending Oct 31. CIBC Caribbean’s financial statements are prepared in accordance with IFRS. Note(s): (1) Business & sovereign asset class industry detail is based on exposure by industry group and includes some exposures that may be categorized otherwise. (2) CRE exposure consists of real estate and construction industry exposure, which is shown separately from the business & sovereign asset class. (3) Includes miscellaneous, agriculture, health & social work, education, recreational & community, fishing. (4) Other jurisdictions include Eastern Caribbean (10%), Jamaica (10%), Trinidad & Tobago (6%), Turks & Caicos (4%), British Virgin Islands (3%), and other (0%). CIBC Caribbean’s loan underwriting standards are consistent with Butterfield’s • Diversified, conservatively underwritten, and well performing loan portfolio • Low and stable historical loss experience • Conservative credit mark of 1.6x of closing reserves provides balance sheet protection CIBC Caribbean Loan Distribution(1) CIBC Caribbean Net Charge-Off Ratio 0.3% 0.1% 0.2% 0.6% 0.6% 0.1% 0.1% 2019 2020 2021 2022 2023 2024 2025 Sovereign 11% Distribution 7% Hospitality 7% Logistics & Comms 5% Utilities 5% Financial 4% Manufacturing 3%Mining & Quarrying 2% Other Business & Sovereign 46% Residential Mortgages 30% CRE 13% Personal 11% (2) 27% Bahamas 25% Cayman Islands 16% Barbados $7.7bn 2025 Gross Loans 33% Other Jurisdictions(4) (3) (2) Stable near-term credit performance, supported by sovereign-linked exposures and regulated infrastructure assets Stable NCOs post- COVID19

16 May 28, 2026 Summary
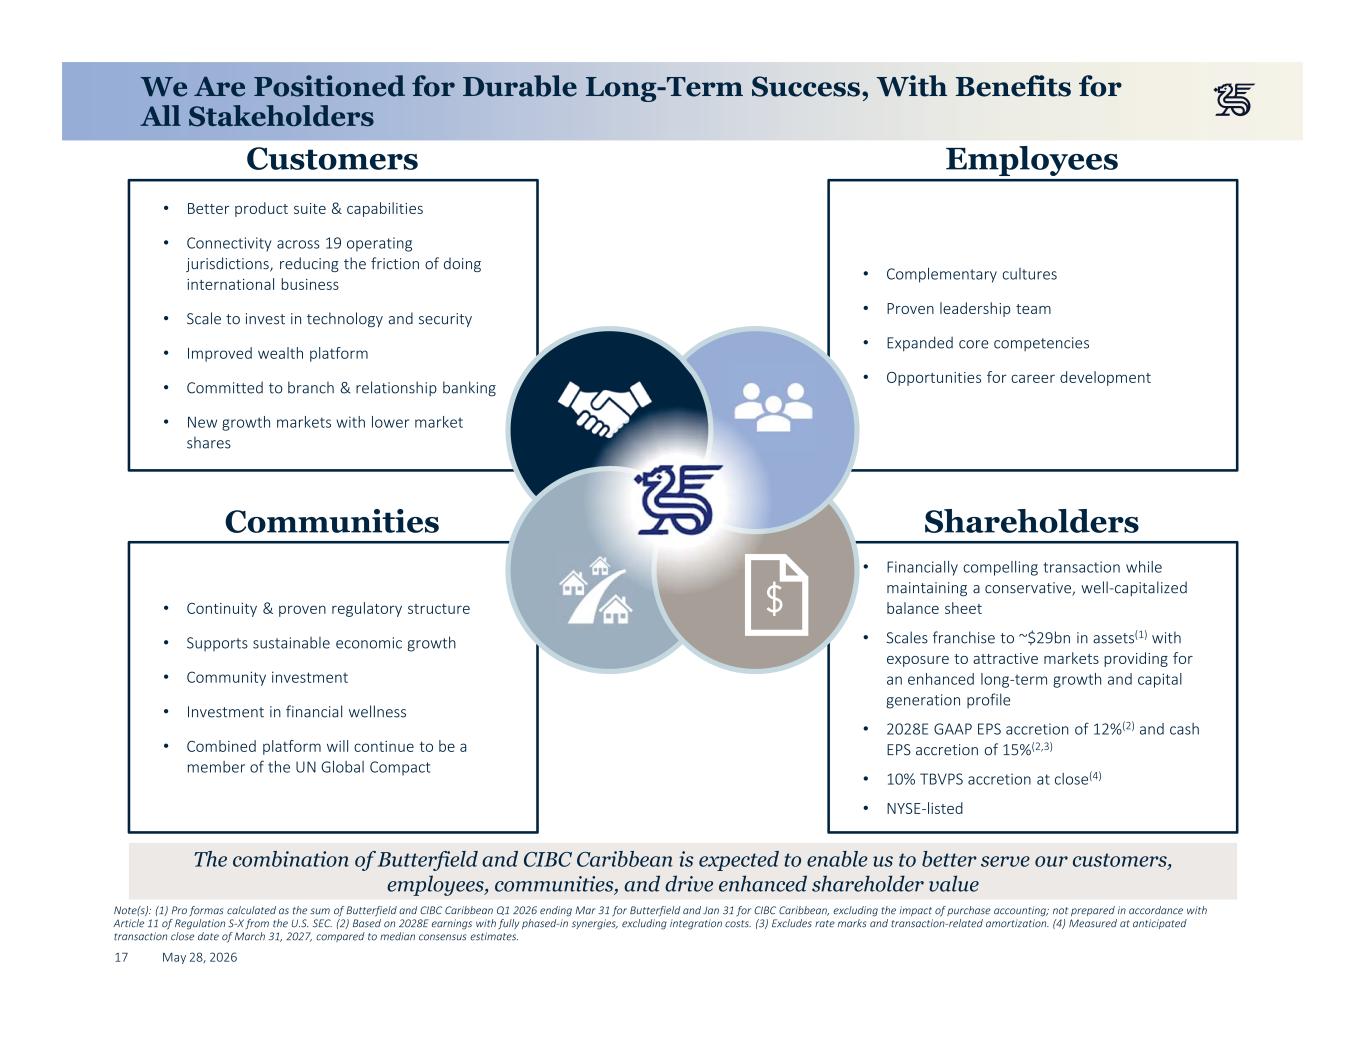
17 May 28, 2026 We Are Positioned for Durable Long-Term Success, With Benefits for All Stakeholders • Better product suite & capabilities • Connectivity across 19 operating jurisdictions, reducing the friction of doing international business • Scale to invest in technology and security • Improved wealth platform • Committed to branch & relationship banking • New growth markets with lower market shares • Continuity & proven regulatory structure • Supports sustainable economic growth • Community investment • Investment in financial wellness • Combined platform will continue to be a member of the UN Global Compact • Financially compelling transaction while maintaining a conservative, well-capitalized balance sheet • Scales franchise to ~$29bn in assets(1) with exposure to attractive markets providing for an enhanced long-term growth and capital generation profile • 2028E GAAP EPS accretion of 12%(2) and cash EPS accretion of 15%(2,3) • 10% TBVPS accretion at close(4) • NYSE-listed • Complementary cultures • Proven leadership team • Expanded core competencies • Opportunities for career development Customers Shareholders Employees Communities The combination of Butterfield and CIBC Caribbean is expected to enable us to better serve our customers, employees, communities, and drive enhanced shareholder value Note(s): (1) Pro formas calculated as the sum of Butterfield and CIBC Caribbean Q1 2026 ending Mar 31 for Butterfield and Jan 31 for CIBC Caribbean, excluding the impact of purchase accounting; not prepared in accordance with Article 11 of Regulation S-X from the U.S. SEC. (2) Based on 2028E earnings with fully phased-in synergies, excluding integration costs. (3) Excludes rate marks and transaction-related amortization. (4) Measured at anticipated transaction close date of March 31, 2027, compared to median consensus estimates.
18 May 28, 2026 Appendix A: Additional Financial Analysis
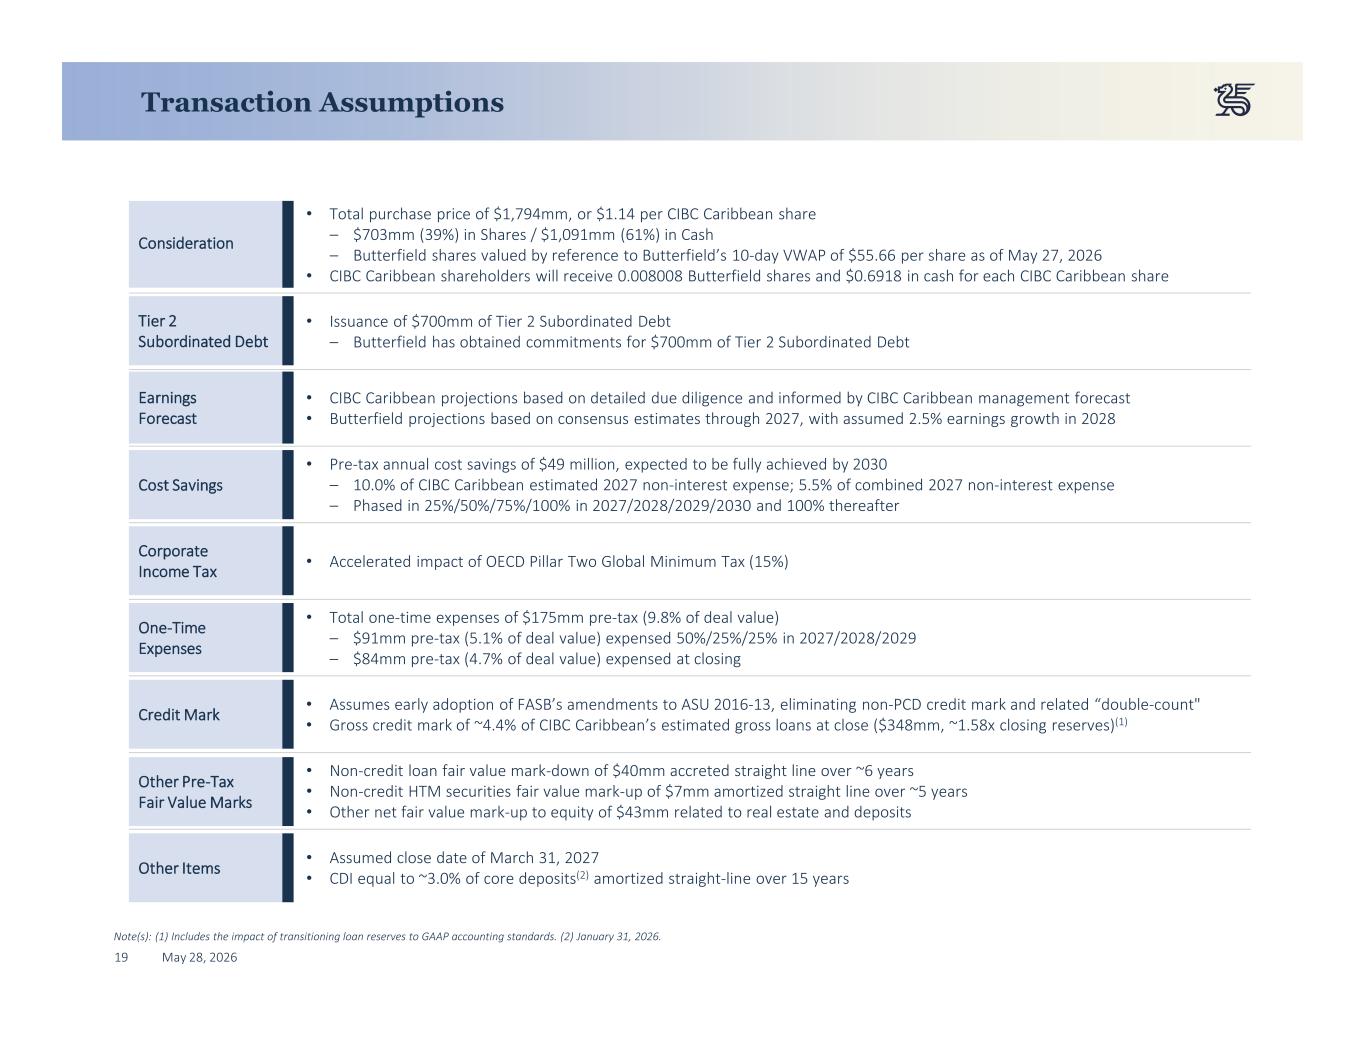
19 May 28, 2026 Transaction Assumptions • Total purchase price of $1,794mm, or $1.14 per CIBC Caribbean share – $703mm (39%) in Shares / $1,091mm (61%) in Cash – Butterfield shares valued by reference to Butterfield’s 10-day VWAP of $55.66 per share as of May 27, 2026 • CIBC Caribbean shareholders will receive 0.008008 Butterfield shares and $0.6918 in cash for each CIBC Caribbean share • Issuance of $700mm of Tier 2 Subordinated Debt – Butterfield has obtained commitments for $700mm of Tier 2 Subordinated Debt • CIBC Caribbean projections based on detailed due diligence and informed by CIBC Caribbean management forecast • Butterfield projections based on consensus estimates through 2027, with assumed 2.5% earnings growth in 2028 • Pre-tax annual cost savings of $49 million, expected to be fully achieved by 2030 – 10.0% of CIBC Caribbean estimated 2027 non-interest expense; 5.5% of combined 2027 non-interest expense – Phased in 25%/50%/75%/100% in 2027/2028/2029/2030 and 100% thereafter • Accelerated impact of OECD Pillar Two Global Minimum Tax (15%) • Total one-time expenses of $175mm pre-tax (9.8% of deal value) – $91mm pre-tax (5.1% of deal value) expensed 50%/25%/25% in 2027/2028/2029 – $84mm pre-tax (4.7% of deal value) expensed at closing • Assumes early adoption of FASB’s amendments to ASU 2016-13, eliminating non-PCD credit mark and related “double-count" • Gross credit mark of ~4.4% of CIBC Caribbean’s estimated gross loans at close ($348mm, ~1.58x closing reserves)(1) • Non-credit loan fair value mark-down of $40mm accreted straight line over ~6 years • Non-credit HTM securities fair value mark-up of $7mm amortized straight line over ~5 years • Other net fair value mark-up to equity of $43mm related to real estate and deposits • Assumed close date of March 31, 2027 • CDI equal to ~3.0% of core deposits(2) amortized straight-line over 15 years Consideration Tier 2 Subordinated Debt One-Time Expenses Credit Mark Earnings Forecast Other Items Corporate Income Tax Note(s): (1) Includes the impact of transitioning loan reserves to GAAP accounting standards. (2) January 31, 2026. Other Pre-Tax Fair Value Marks Cost Savings
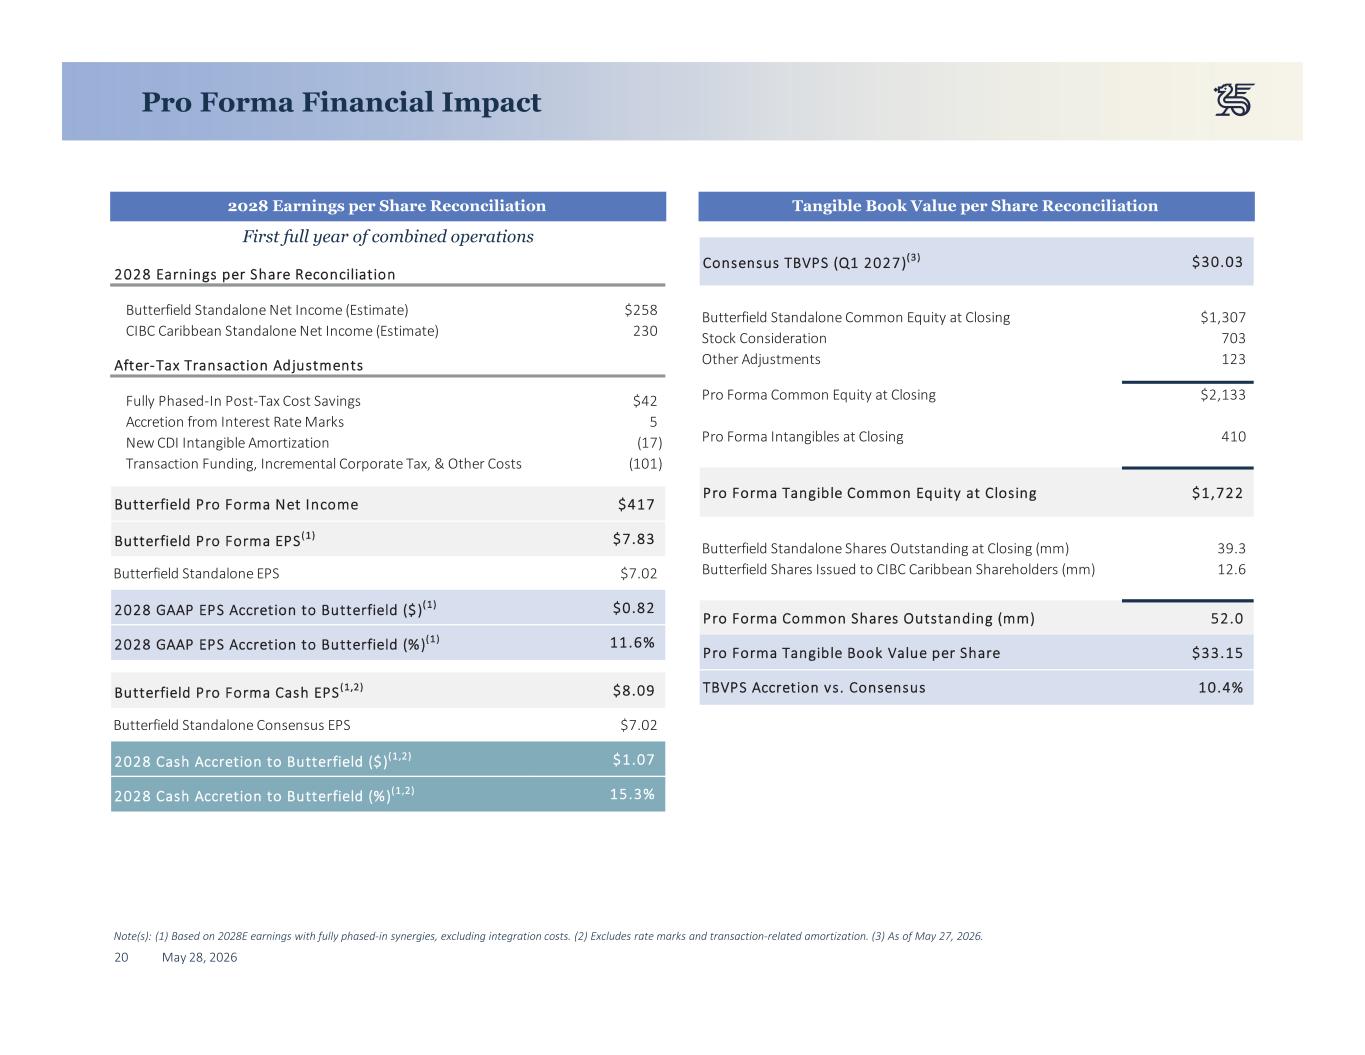
20 May 28, 2026 Pro Forma Financial Impact Note(s): (1) Based on 2028E earnings with fully phased-in synergies, excluding integration costs. (2) Excludes rate marks and transaction-related amortization. (3) As of May 27, 2026. 2028 Earnings per Share Reconciliation 2028 Earnings per Share Reconciliation Butterfield Standalone Net Income (Estimate) $258 CIBC Caribbean Standalone Net Income (Estimate) 230 After-Tax Transaction Adjustments Fully Phased-In Post-Tax Cost Savings $42 Accretion from Interest Rate Marks 5 New CDI Intangible Amortization (17) Transaction Funding, Incremental Corporate Tax, & Other Costs (101) Butterfield Pro Forma Net Income $417 Butterfield Pro Forma EPS(1) $7.83 Butterfield Standalone EPS $7.02 2028 GAAP EPS Accretion to Butterfield ($)(1) $0.82 2028 GAAP EPS Accretion to Butterfield (%)(1) 11.6% Butterfield Pro Forma Cash EPS(1,2) $8.09 Butterfield Standalone Consensus EPS $7.02 2028 Cash Accretion to Butterfield ($)(1,2) $1.07 2028 Cash Accretion to Butterfield (%)(1,2) 15.3% First full year of combined operations Tangible Book Value per Share Reconciliation Consensus TBVPS (Q1 2027)(3) $30.03 Butterfield Standalone Common Equity at Closing $1,307 Stock Consideration 703 Other Adjustments 123 Pro Forma Common Equity at Closing $2,133 Pro Forma Intangibles at Closing 410 Pro Forma Tangible Common Equity at Closing $1,722 Butterfield Standalone Shares Outstanding at Closing (mm) 39.3 Butterfield Shares Issued to CIBC Caribbean Shareholders (mm) 12.6 Pro Forma Common Shares Outstanding (mm) 52.0 Pro Forma Tangible Book Value per Share $33.15 TBVPS Accretion vs. Consensus 10.4%
21 May 28, 2026 Appendix B: CIBC Caribbean and Select Jurisdiction Overview
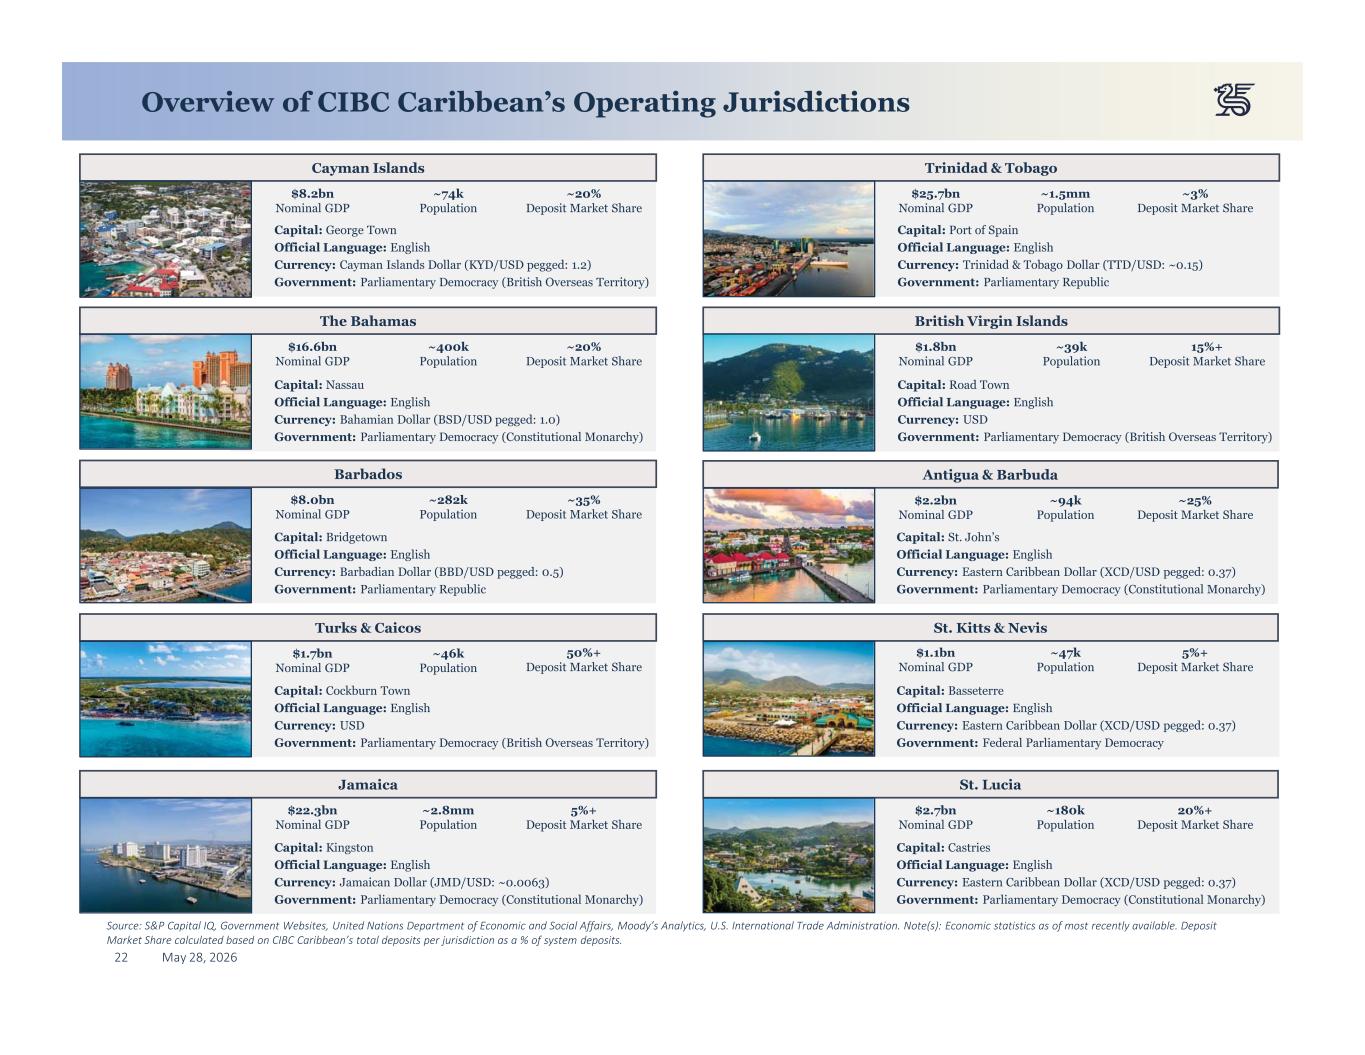
22 May 28, 2026 Overview of CIBC Caribbean’s Operating Jurisdictions Source: S&P Capital IQ, Government Websites, United Nations Department of Economic and Social Affairs, Moody’s Analytics, U.S. International Trade Administration. Note(s): Economic statistics as of most recently available. Deposit Market Share calculated based on CIBC Caribbean’s total deposits per jurisdiction as a % of system deposits. The Bahamas $16.6bn Nominal GDP ~400k Population ~20% Deposit Market Share Capital: Nassau Official Language: English Currency: Bahamian Dollar (BSD/USD pegged: 1.0) Government: Parliamentary Democracy (Constitutional Monarchy) Cayman Islands $8.2bn Nominal GDP ~74k Population ~20% Deposit Market Share Capital: George Town Official Language: English Currency: Cayman Islands Dollar (KYD/USD pegged: 1.2) Government: Parliamentary Democracy (British Overseas Territory) Barbados $8.0bn Nominal GDP ~282k Population ~35% Deposit Market Share Capital: Bridgetown Official Language: English Currency: Barbadian Dollar (BBD/USD pegged: 0.5) Government: Parliamentary Republic Turks & Caicos $1.7bn Nominal GDP ~46k Population 50%+ Deposit Market Share Capital: Cockburn Town Official Language: English Currency: USD Government: Parliamentary Democracy (British Overseas Territory) Jamaica $22.3bn Nominal GDP ~2.8mm Population 5%+ Deposit Market Share Capital: Kingston Official Language: English Currency: Jamaican Dollar (JMD/USD: ~0.0063) Government: Parliamentary Democracy (Constitutional Monarchy) Trinidad & Tobago $25.7bn Nominal GDP ~1.5mm Population ~3% Deposit Market Share Capital: Port of Spain Official Language: English Currency: Trinidad & Tobago Dollar (TTD/USD: ~0.15) Government: Parliamentary Republic Antigua & Barbuda $2.2bn Nominal GDP ~94k Population ~25% Deposit Market Share Capital: St. John’s Official Language: English Currency: Eastern Caribbean Dollar (XCD/USD pegged: 0.37) Government: Parliamentary Democracy (Constitutional Monarchy) St. Kitts & Nevis $1.1bn Nominal GDP ~47k Population 5%+ Deposit Market Share Capital: Basseterre Official Language: English Currency: Eastern Caribbean Dollar (XCD/USD pegged: 0.37) Government: Federal Parliamentary Democracy St. Lucia $2.7bn Nominal GDP ~180k Population 20%+ Deposit Market Share Capital: Castries Official Language: English Currency: Eastern Caribbean Dollar (XCD/USD pegged: 0.37) Government: Parliamentary Democracy (Constitutional Monarchy) British Virgin Islands $1.8bn Nominal GDP ~39k Population 15%+ Deposit Market Share Capital: Road Town Official Language: English Currency: USD Government: Parliamentary Democracy (British Overseas Territory)
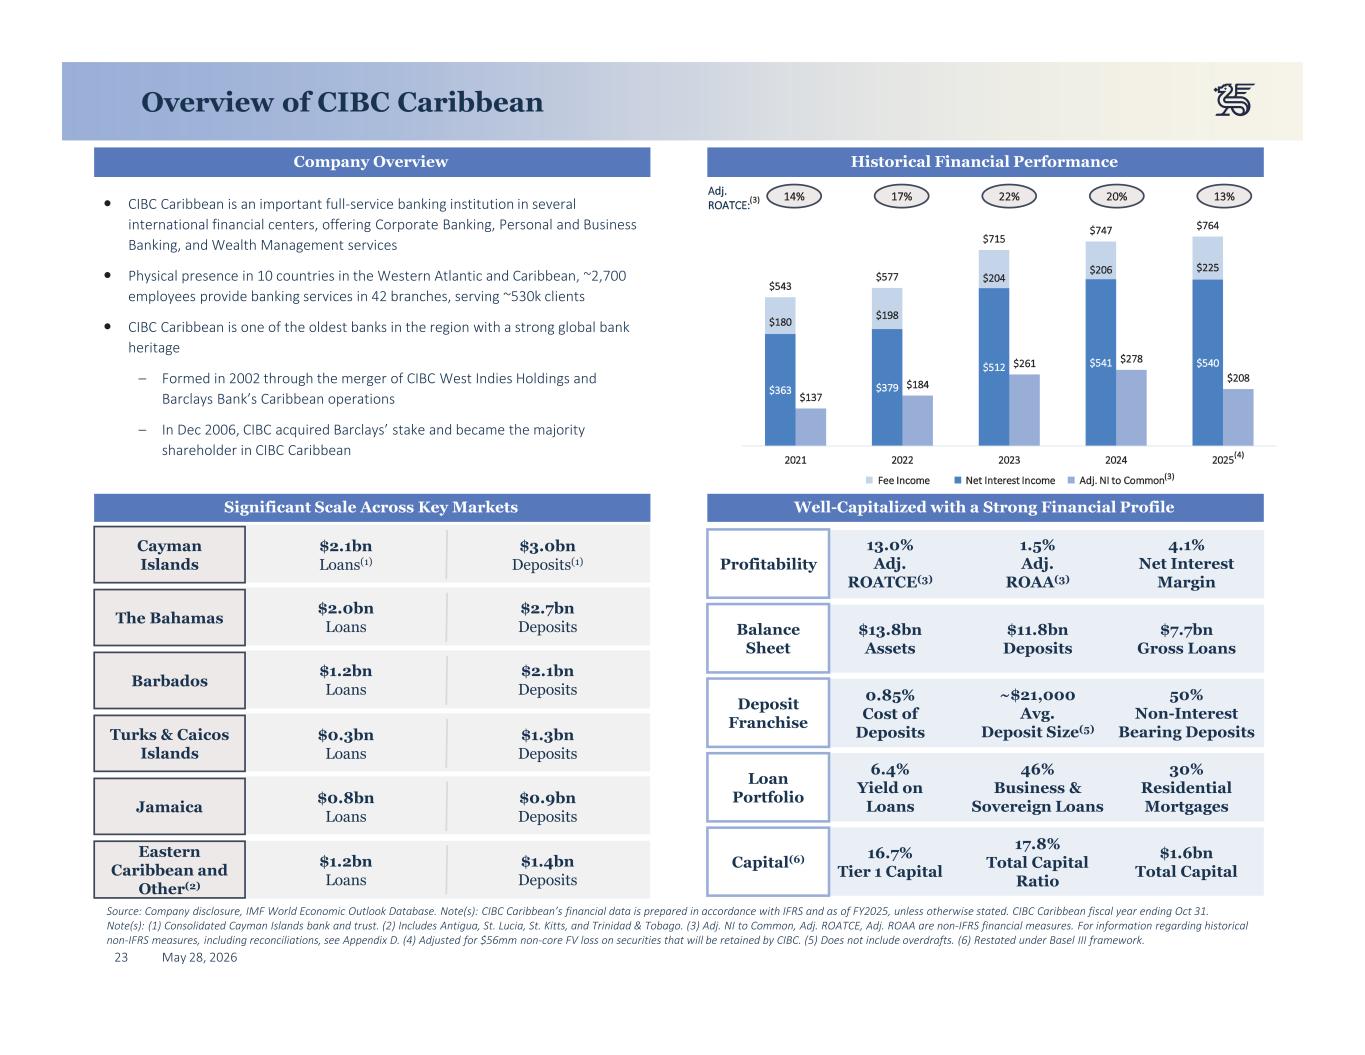
23 May 28, 2026 $543 $577 $715 $747 $764 $137 $184 $261 $278 $208 $363 $379 $512 $541 $540 $180 $198 $204 $206 $225 2021 2022 2023 2024 2025 Net Interest IncomeFee Income Adj. NI to Common Overview of CIBC Caribbean Historical Financial PerformanceCompany Overview CIBC Caribbean is an important full-service banking institution in several international financial centers, offering Corporate Banking, Personal and Business Banking, and Wealth Management services Physical presence in 10 countries in the Western Atlantic and Caribbean, ~2,700 employees provide banking services in 42 branches, serving ~530k clients CIBC Caribbean is one of the oldest banks in the region with a strong global bank heritage – Formed in 2002 through the merger of CIBC West Indies Holdings and Barclays Bank’s Caribbean operations – In Dec 2006, CIBC acquired Barclays’ stake and became the majority shareholder in CIBC Caribbean Source: Company disclosure, IMF World Economic Outlook Database. Note(s): CIBC Caribbean’s financial data is prepared in accordance with IFRS and as of FY2025, unless otherwise stated. CIBC Caribbean fiscal year ending Oct 31. Note(s): (1) Consolidated Cayman Islands bank and trust. (2) Includes Antigua, St. Lucia, St. Kitts, and Trinidad & Tobago. (3) Adj. NI to Common, Adj. ROATCE, Adj. ROAA are non-IFRS financial measures. For information regarding historical non-IFRS measures, including reconciliations, see Appendix D. (4) Adjusted for $56mm non-core FV loss on securities that will be retained by CIBC. (5) Does not include overdrafts. (6) Restated under Basel III framework. Significant Scale Across Key Markets Cayman Islands $2.1bn Loans(1) $3.0bn Deposits(1) The Bahamas $2.0bn Loans $2.7bn Deposits Barbados $1.2bn Loans $2.1bn Deposits Turks & Caicos Islands $0.3bn Loans $1.3bn Deposits Jamaica $0.8bn Loans $0.9bn Deposits Eastern Caribbean and Other(2) $1.2bn Loans $1.4bn Deposits Well-Capitalized with a Strong Financial Profile Deposit Franchise 50% Non-Interest Bearing Deposits ~$21,000 Avg. Deposit Size(5) 0.85% Cost of Deposits Loan Portfolio 6.4% Yield on Loans 46% Business & Sovereign Loans 30% Residential Mortgages Capital(6) 16.7% Tier 1 Capital 17.8% Total Capital Ratio $1.6bn Total Capital Balance Sheet $13.8bn Assets $11.8bn Deposits $7.7bn Gross Loans Profitability 13.0% Adj. ROATCE(3) 1.5% Adj. ROAA(3) 4.1% Net Interest Margin (4) Adj. ROATCE: 14% 17% 22% 20% 13%(3) (3)
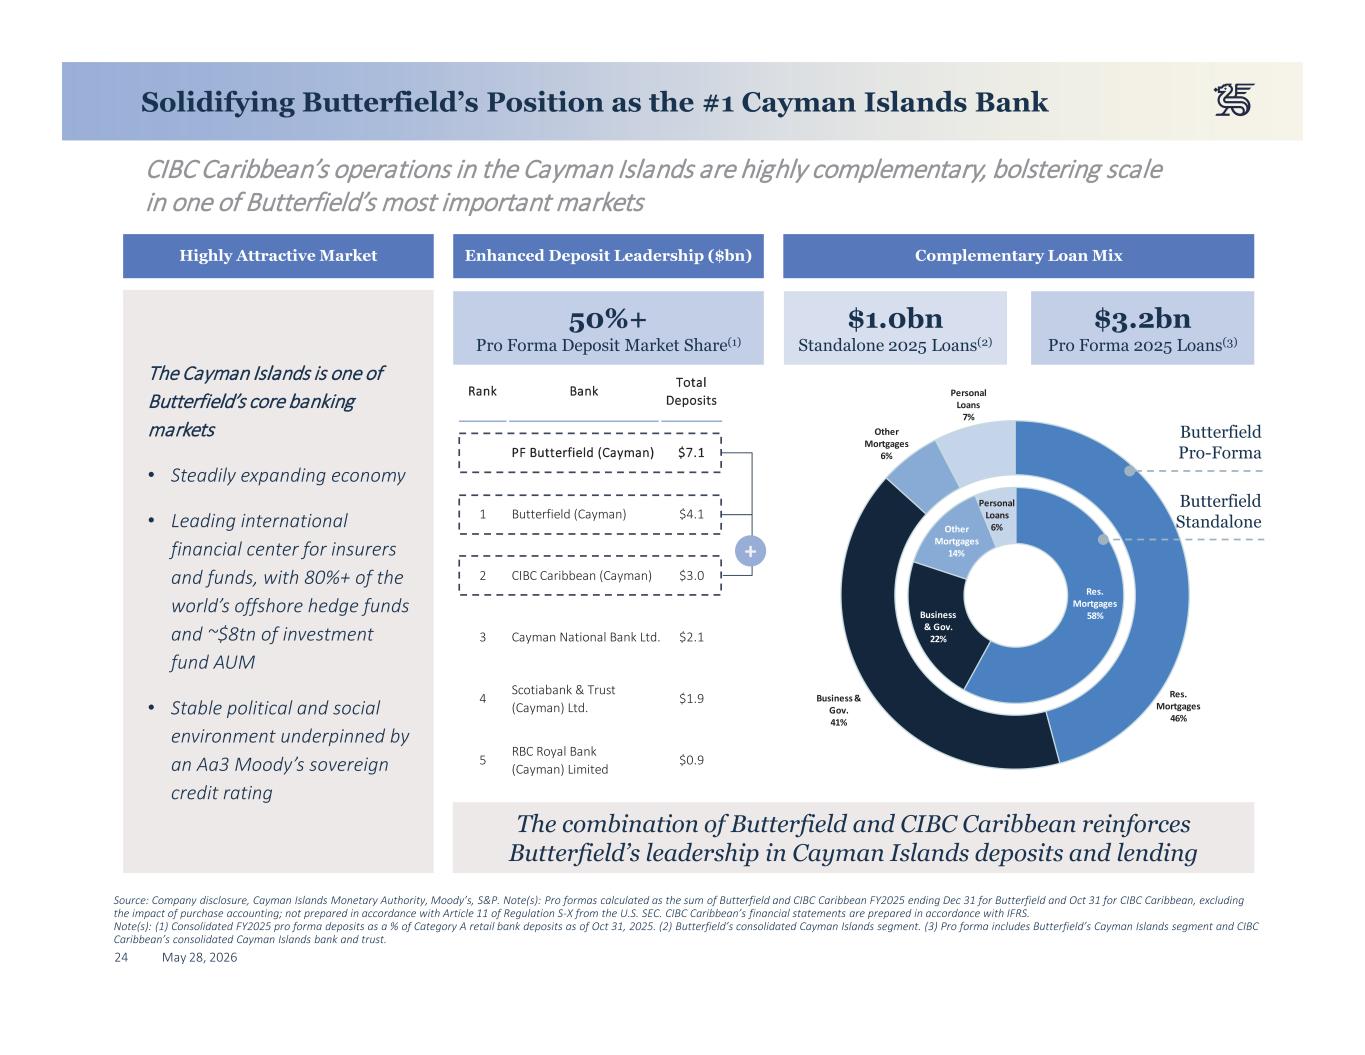
24 May 28, 2026 Solidifying Butterfield’s Position as the #1 Cayman Islands Bank Source: Company disclosure, Cayman Islands Monetary Authority, Moody’s, S&P. Note(s): Pro formas calculated as the sum of Butterfield and CIBC Caribbean FY2025 ending Dec 31 for Butterfield and Oct 31 for CIBC Caribbean, excluding the impact of purchase accounting; not prepared in accordance with Article 11 of Regulation S-X from the U.S. SEC. CIBC Caribbean’s financial statements are prepared in accordance with IFRS. Note(s): (1) Consolidated FY2025 pro forma deposits as a % of Category A retail bank deposits as of Oct 31, 2025. (2) Butterfield’s consolidated Cayman Islands segment. (3) Pro forma includes Butterfield’s Cayman Islands segment and CIBC Caribbean’s consolidated Cayman Islands bank and trust. Highly Attractive Market CIBC Caribbean’s operations in the Cayman Islands are highly complementary, bolstering scale in one of Butterfield’s most important markets Enhanced Deposit Leadership ($bn) Rank Bank Total Deposits PF Butterfield (Cayman) $7.1 1 Butterfield (Cayman) $4.1 2 CIBC Caribbean (Cayman) $3.0 3 Cayman National Bank Ltd. $2.1 4 Scotiabank & Trust (Cayman) Ltd. $1.9 5 RBC Royal Bank (Cayman) Limited $0.9 + The Cayman Islands is one of Butterfield’s core banking markets • Steadily expanding economy • Leading international financial center for insurers and funds, with 80%+ of the world’s offshore hedge funds and ~$8tn of investment fund AUM • Stable political and social environment underpinned by an Aa3 Moody’s sovereign credit rating Complementary Loan Mix Res. Mortgages 58%Business & Gov. 22% Other Mortgages 14% Personal Loans 6% Res. Mortgages 46% Business & Gov. 41% Other Mortgages 6% Personal Loans 7% Butterfield Pro-Forma Butterfield Standalone $3.2bn Pro Forma 2025 Loans(3) $1.0bn Standalone 2025 Loans(2) 50%+ Pro Forma Deposit Market Share(1) The combination of Butterfield and CIBC Caribbean reinforces Butterfield’s leadership in Cayman Islands deposits and lending
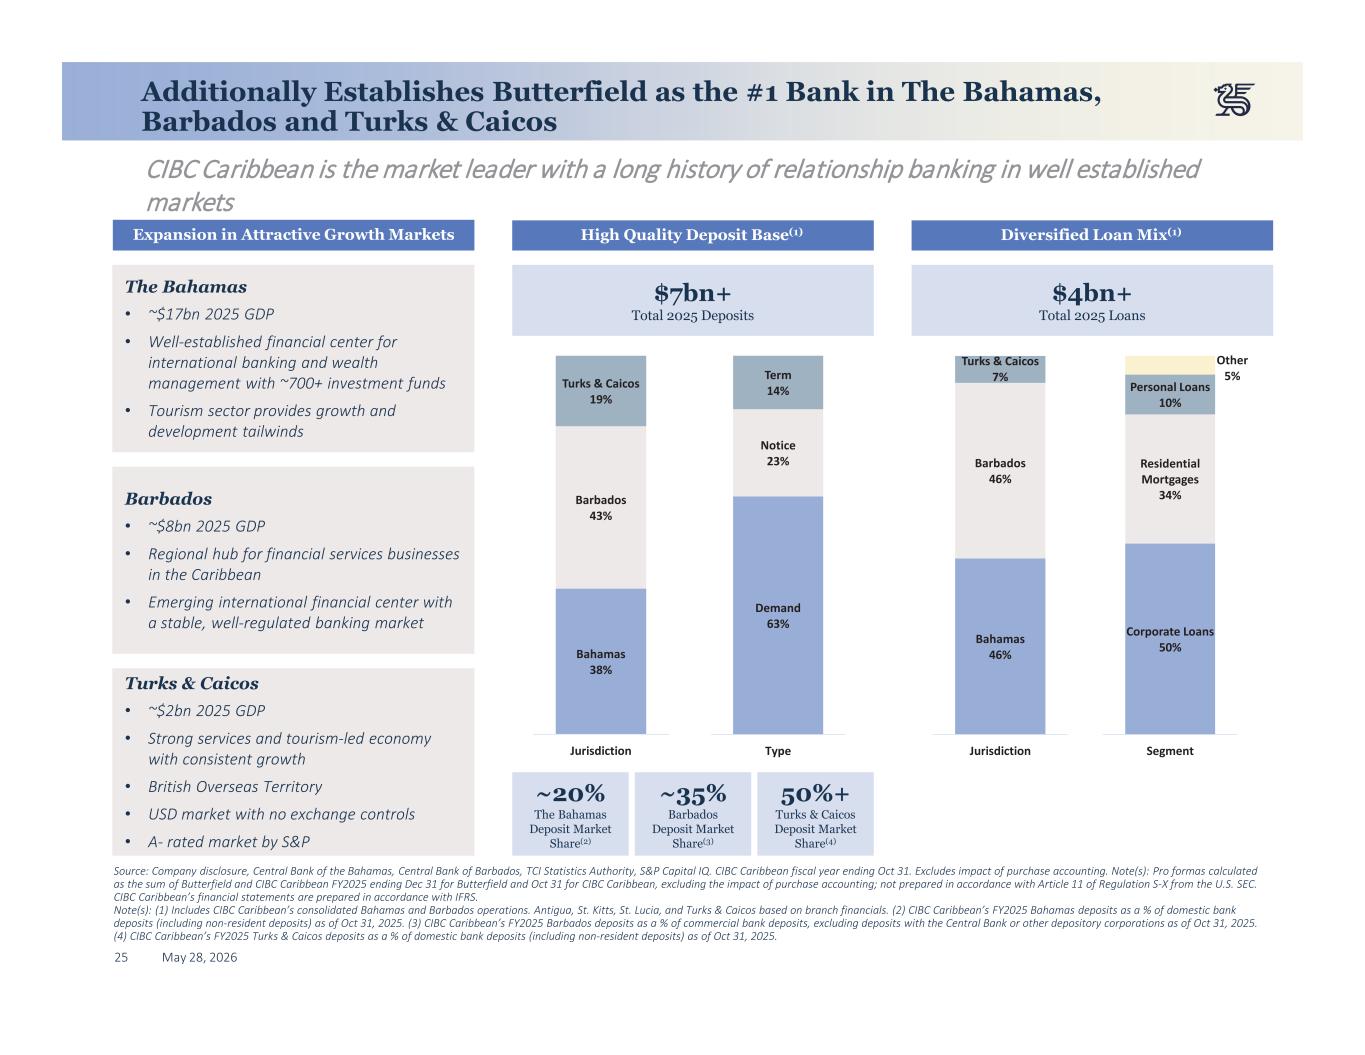
25 May 28, 2026 Additionally Establishes Butterfield as the #1 Bank in The Bahamas, Barbados and Turks & Caicos Source: Company disclosure, Central Bank of the Bahamas, Central Bank of Barbados, TCI Statistics Authority, S&P Capital IQ. CIBC Caribbean fiscal year ending Oct 31. Excludes impact of purchase accounting. Note(s): Pro formas calculated as the sum of Butterfield and CIBC Caribbean FY2025 ending Dec 31 for Butterfield and Oct 31 for CIBC Caribbean, excluding the impact of purchase accounting; not prepared in accordance with Article 11 of Regulation S-X from the U.S. SEC. CIBC Caribbean’s financial statements are prepared in accordance with IFRS. Note(s): (1) Includes CIBC Caribbean’s consolidated Bahamas and Barbados operations. Antigua, St. Kitts, St. Lucia, and Turks & Caicos based on branch financials. (2) CIBC Caribbean’s FY2025 Bahamas deposits as a % of domestic bank deposits (including non-resident deposits) as of Oct 31, 2025. (3) CIBC Caribbean’s FY2025 Barbados deposits as a % of commercial bank deposits, excluding deposits with the Central Bank or other depository corporations as of Oct 31, 2025. (4) CIBC Caribbean’s FY2025 Turks & Caicos deposits as a % of domestic bank deposits (including non-resident deposits) as of Oct 31, 2025. CIBC Caribbean is the market leader with a long history of relationship banking in well established markets ~20% The Bahamas Deposit Market Share(2) High Quality Deposit Base(1) Diversified Loan Mix(1) ~35% Barbados Deposit Market Share(3) $7bn+ Total 2025 Deposits $4bn+ Total 2025 Loans Expansion in Attractive Growth Markets The Bahamas • ~$17bn 2025 GDP • Well-established financial center for international banking and wealth management with ~700+ investment funds • Tourism sector provides growth and development tailwinds 50%+ Turks & Caicos Deposit Market Share(4) Barbados • ~$8bn 2025 GDP • Regional hub for financial services businesses in the Caribbean • Emerging international financial center with a stable, well-regulated banking market Turks & Caicos • ~$2bn 2025 GDP • Strong services and tourism-led economy with consistent growth • British Overseas Territory • USD market with no exchange controls • A- rated market by S&P Bahamas 38% Barbados 43% Turks & Caicos 19% Jurisdiction Demand 63% Notice 23% Term 14% Type Bahamas 46% Barbados 46% Turks & Caicos 7% Jurisdiction Corporate Loans 50% Residential Mortgages 34% Personal Loans 10% Other 5% Segment

26 May 28, 2026 Appendix C: Commitment to Communities
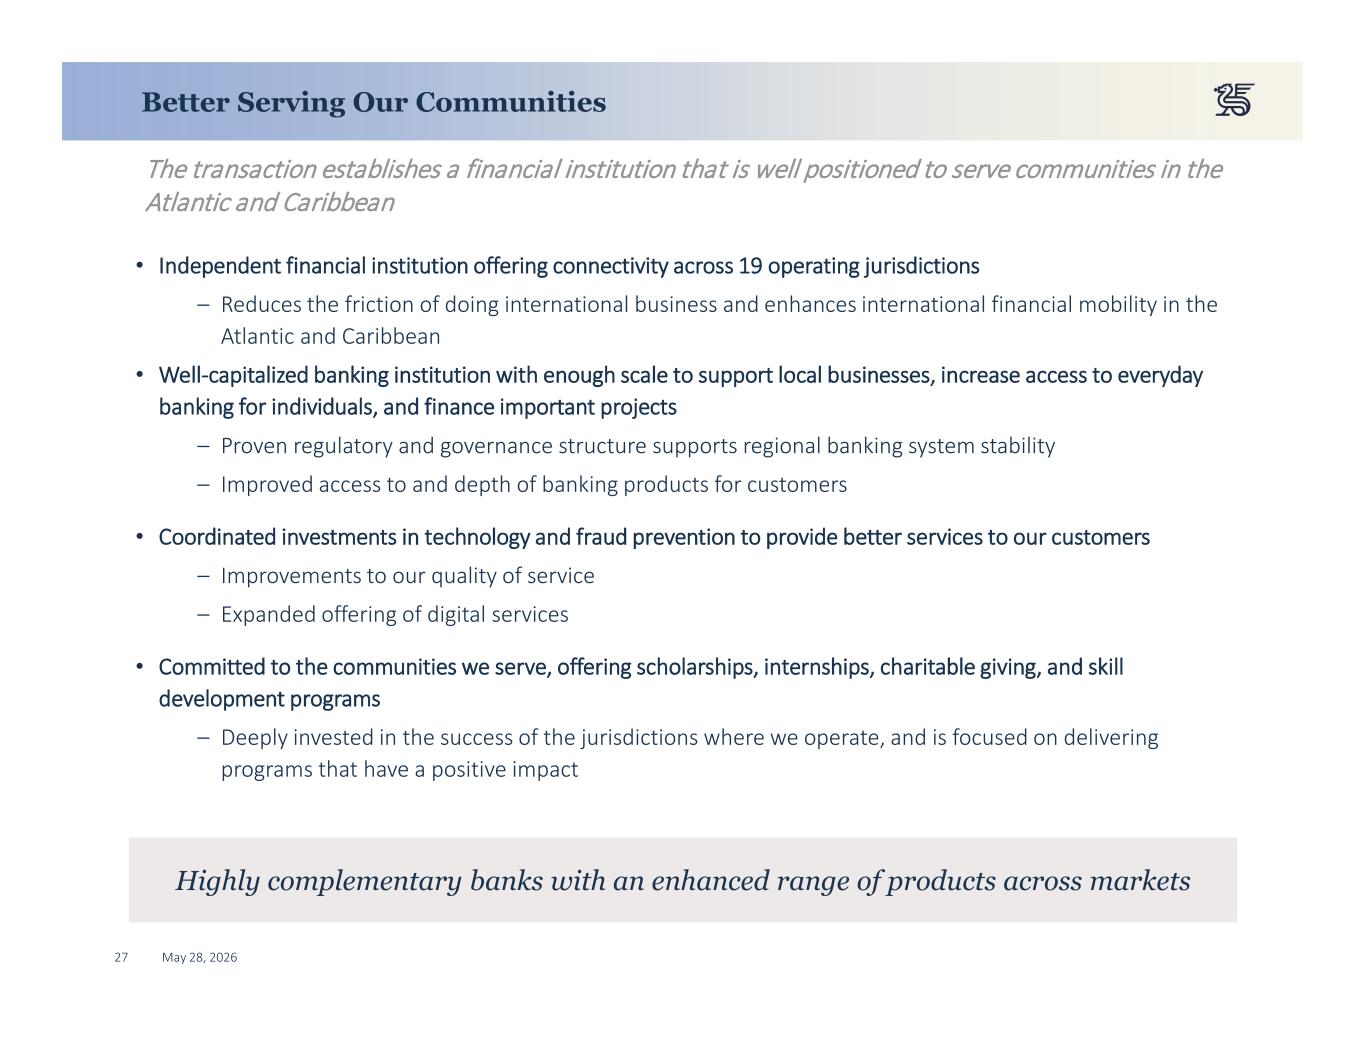
27 May 28, 2026 Better Serving Our Communities The transaction establishes a financial institution that is well positioned to serve communities in the Atlantic and Caribbean • Independent financial institution offering connectivity across 19 operating jurisdictions – Reduces the friction of doing international business and enhances international financial mobility in the Atlantic and Caribbean • Well-capitalized banking institution with enough scale to support local businesses, increase access to everyday banking for individuals, and finance important projects – Proven regulatory and governance structure supports regional banking system stability – Improved access to and depth of banking products for customers • Coordinated investments in technology and fraud prevention to provide better services to our customers – Improvements to our quality of service – Expanded offering of digital services • Committed to the communities we serve, offering scholarships, internships, charitable giving, and skill development programs – Deeply invested in the success of the jurisdictions where we operate, and is focused on delivering programs that have a positive impact Highly complementary banks with an enhanced range of products across markets
28 May 28, 2026 Appendix D: Reconciliations
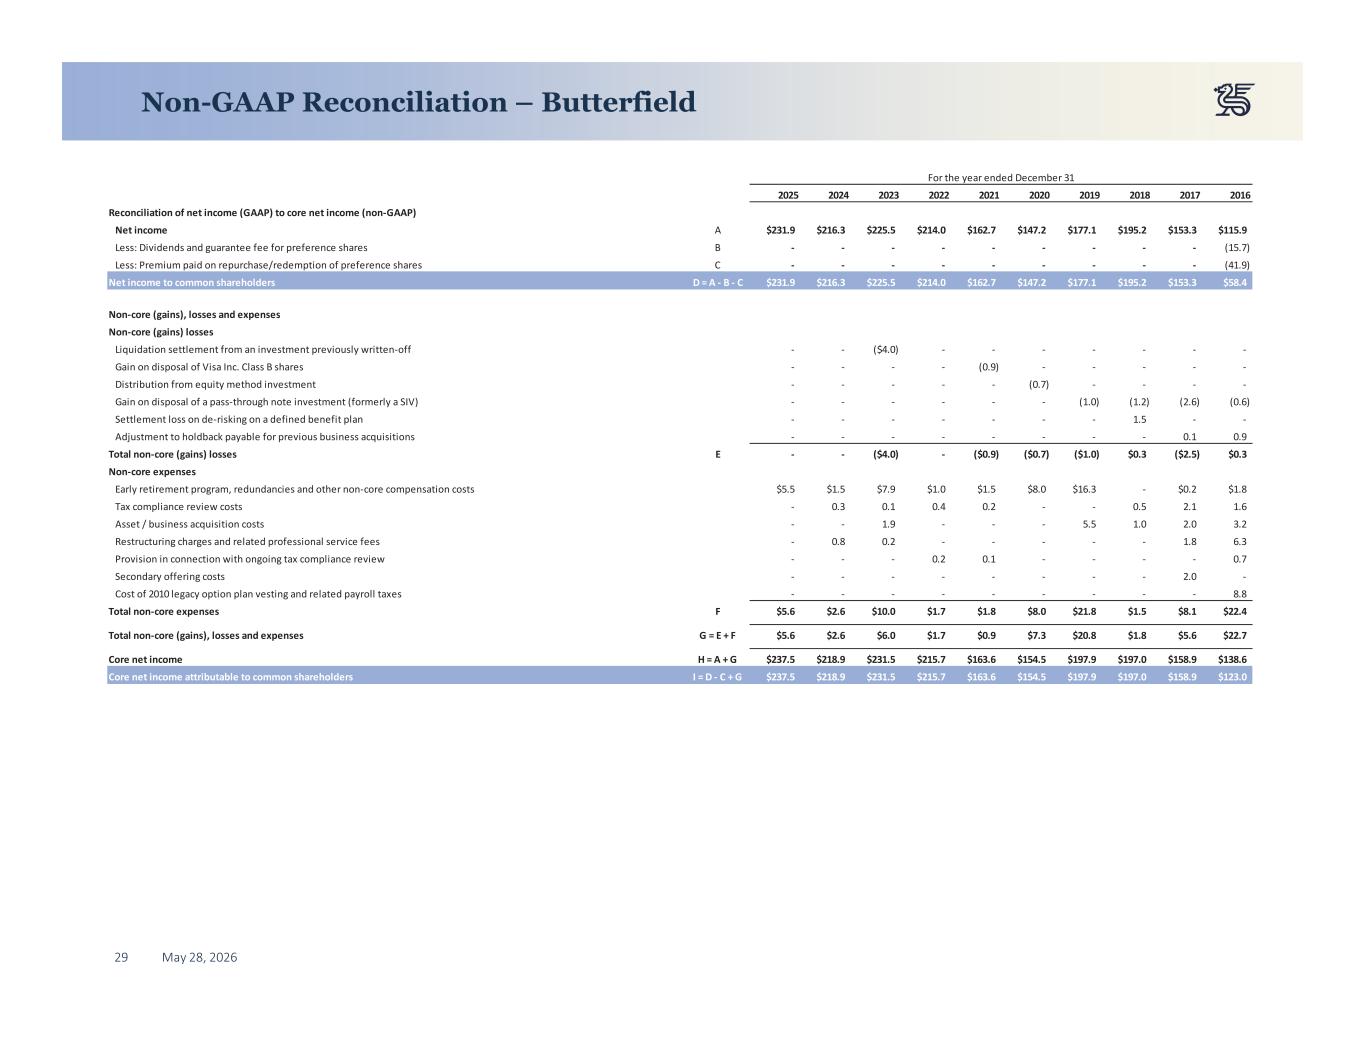
29 May 28, 2026 Non-GAAP Reconciliation – Butterfield For the year ended December 31 2025 2024 2023 2022 2021 2020 2019 2018 2017 2016 Reconciliation of net income (GAAP) to core net income (non-GAAP) Net income A $231.9 $216.3 $225.5 $214.0 $162.7 $147.2 $177.1 $195.2 $153.3 $115.9 Less: Dividends and guarantee fee for preference shares B - - - - - - - - - (15.7) Less: Premium paid on repurchase/redemption of preference shares C - - - - - - - - - (41.9) Net income to common shareholders D = A - B - C $231.9 $216.3 $225.5 $214.0 $162.7 $147.2 $177.1 $195.2 $153.3 $58.4 Non-core (gains), losses and expenses Non-core (gains) losses Liquidation settlement from an investment previously written-off - - ($4.0) - - - - - - - Gain on disposal of Visa Inc. Class B shares - - - - (0.9) - - - - - Distribution from equity method investment - - - - - (0.7) - - - - Gain on disposal of a pass-through note investment (formerly a SIV) - - - - - - (1.0) (1.2) (2.6) (0.6) Settlement loss on de-risking on a defined benefit plan - - - - - - - 1.5 - - Adjustment to holdback payable for previous business acquisitions - - - - - - - - 0.1 0.9 Total non-core (gains) losses E - - ($4.0) - ($0.9) ($0.7) ($1.0) $0.3 ($2.5) $0.3 Non-core expenses Early retirement program, redundancies and other non-core compensation costs $5.5 $1.5 $7.9 $1.0 $1.5 $8.0 $16.3 - $0.2 $1.8 Tax compliance review costs - 0.3 0.1 0.4 0.2 - - 0.5 2.1 1.6 Asset / business acquisition costs - - 1.9 - - - 5.5 1.0 2.0 3.2 Restructuring charges and related professional service fees - 0.8 0.2 - - - - - 1.8 6.3 Provision in connection with ongoing tax compliance review - - - 0.2 0.1 - - - - 0.7 Secondary offering costs - - - - - - - - 2.0 - Cost of 2010 legacy option plan vesting and related payroll taxes - - - - - - - - - 8.8 Total non-core expenses F $5.6 $2.6 $10.0 $1.7 $1.8 $8.0 $21.8 $1.5 $8.1 $22.4 Total non-core (gains), losses and expenses G = E + F $5.6 $2.6 $6.0 $1.7 $0.9 $7.3 $20.8 $1.8 $5.6 $22.7 Core net income H = A + G $237.5 $218.9 $231.5 $215.7 $163.6 $154.5 $197.9 $197.0 $158.9 $138.6 Core net income attributable to common shareholders I = D - C + G $237.5 $218.9 $231.5 $215.7 $163.6 $154.5 $197.9 $197.0 $158.9 $123.0
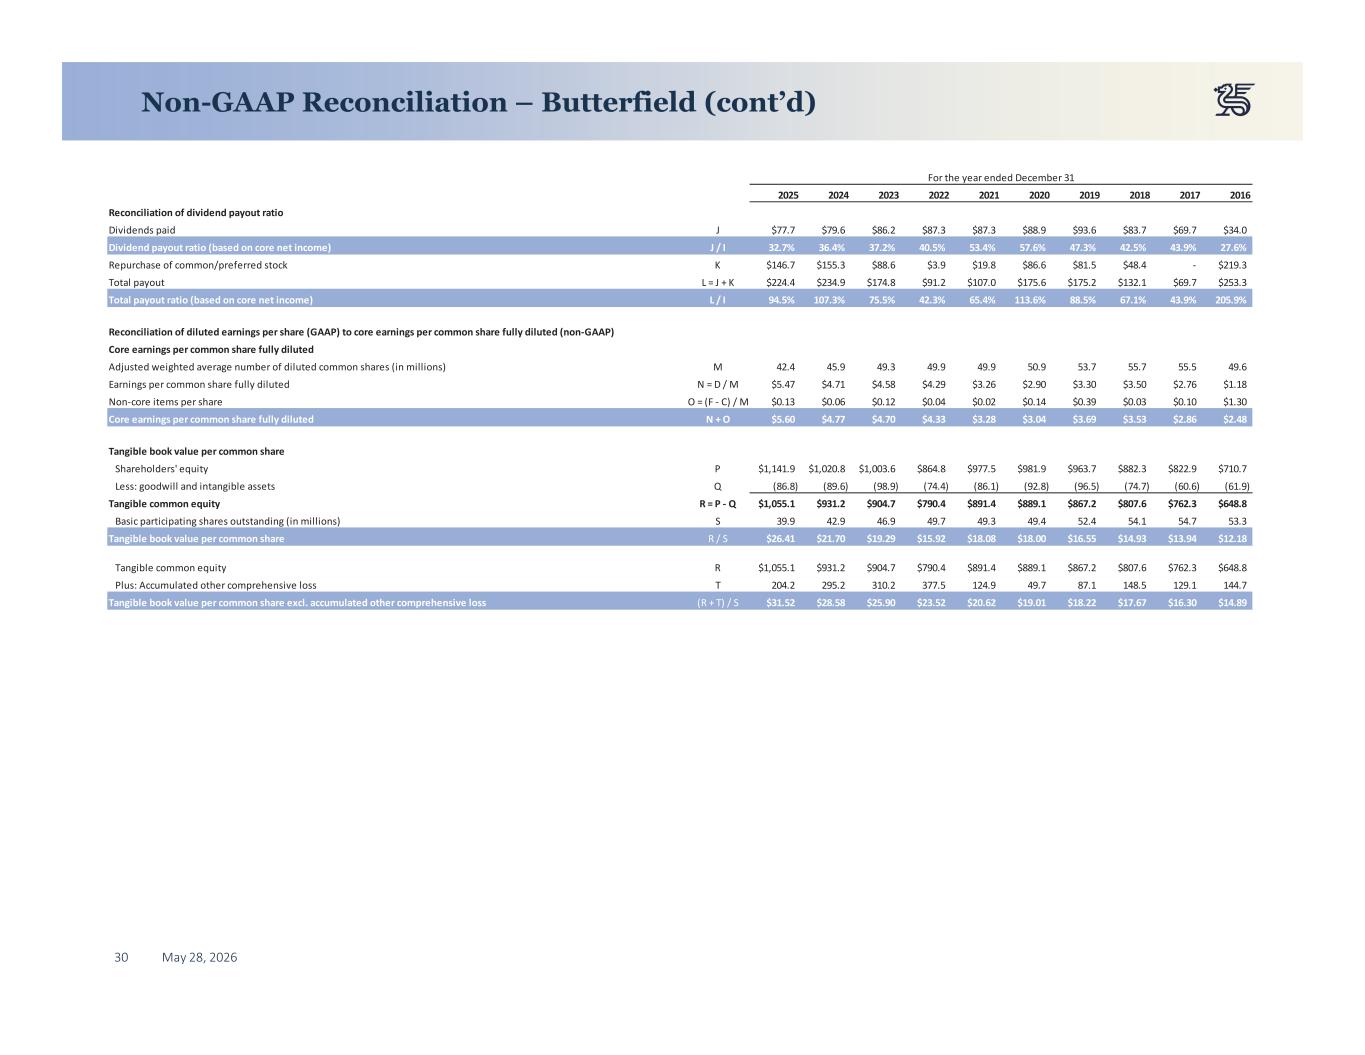
30 May 28, 2026 Non-GAAP Reconciliation – Butterfield (cont’d) For the year ended December 31 2025 2024 2023 2022 2021 2020 2019 2018 2017 2016 Reconciliation of dividend payout ratio Dividends paid J $77.7 $79.6 $86.2 $87.3 $87.3 $88.9 $93.6 $83.7 $69.7 $34.0 Dividend payout ratio (based on core net income) J / I 32.7% 36.4% 37.2% 40.5% 53.4% 57.6% 47.3% 42.5% 43.9% 27.6% Repurchase of common/preferred stock K $146.7 $155.3 $88.6 $3.9 $19.8 $86.6 $81.5 $48.4 - $219.3 Total payout L = J + K $224.4 $234.9 $174.8 $91.2 $107.0 $175.6 $175.2 $132.1 $69.7 $253.3 Total payout ratio (based on core net income) L / I 94.5% 107.3% 75.5% 42.3% 65.4% 113.6% 88.5% 67.1% 43.9% 205.9% Reconciliation of diluted earnings per share (GAAP) to core earnings per common share fully diluted (non-GAAP) Core earnings per common share fully diluted Adjusted weighted average number of diluted common shares (in millions) M 42.4 45.9 49.3 49.9 49.9 50.9 53.7 55.7 55.5 49.6 Earnings per common share fully diluted N = D / M $5.47 $4.71 $4.58 $4.29 $3.26 $2.90 $3.30 $3.50 $2.76 $1.18 Non-core items per share O = (F - C) / M $0.13 $0.06 $0.12 $0.04 $0.02 $0.14 $0.39 $0.03 $0.10 $1.30 Core earnings per common share fully diluted N + O $5.60 $4.77 $4.70 $4.33 $3.28 $3.04 $3.69 $3.53 $2.86 $2.48 Tangible book value per common share Shareholders' equity P $1,141.9 $1,020.8 $1,003.6 $864.8 $977.5 $981.9 $963.7 $882.3 $822.9 $710.7 Less: goodwill and intangible assets Q (86.8) (89.6) (98.9) (74.4) (86.1) (92.8) (96.5) (74.7) (60.6) (61.9) Tangible common equity R = P - Q $1,055.1 $931.2 $904.7 $790.4 $891.4 $889.1 $867.2 $807.6 $762.3 $648.8 Basic participating shares outstanding (in millions) S 39.9 42.9 46.9 49.7 49.3 49.4 52.4 54.1 54.7 53.3 Tangible book value per common share R / S $26.41 $21.70 $19.29 $15.92 $18.08 $18.00 $16.55 $14.93 $13.94 $12.18 Tangible common equity R $1,055.1 $931.2 $904.7 $790.4 $891.4 $889.1 $867.2 $807.6 $762.3 $648.8 Plus: Accumulated other comprehensive loss T 204.2 295.2 310.2 377.5 124.9 49.7 87.1 148.5 129.1 144.7 Tangible book value per common share excl. accumulated other comprehensive loss (R + T) / S $31.52 $28.58 $25.90 $23.52 $20.62 $19.01 $18.22 $17.67 $16.30 $14.89
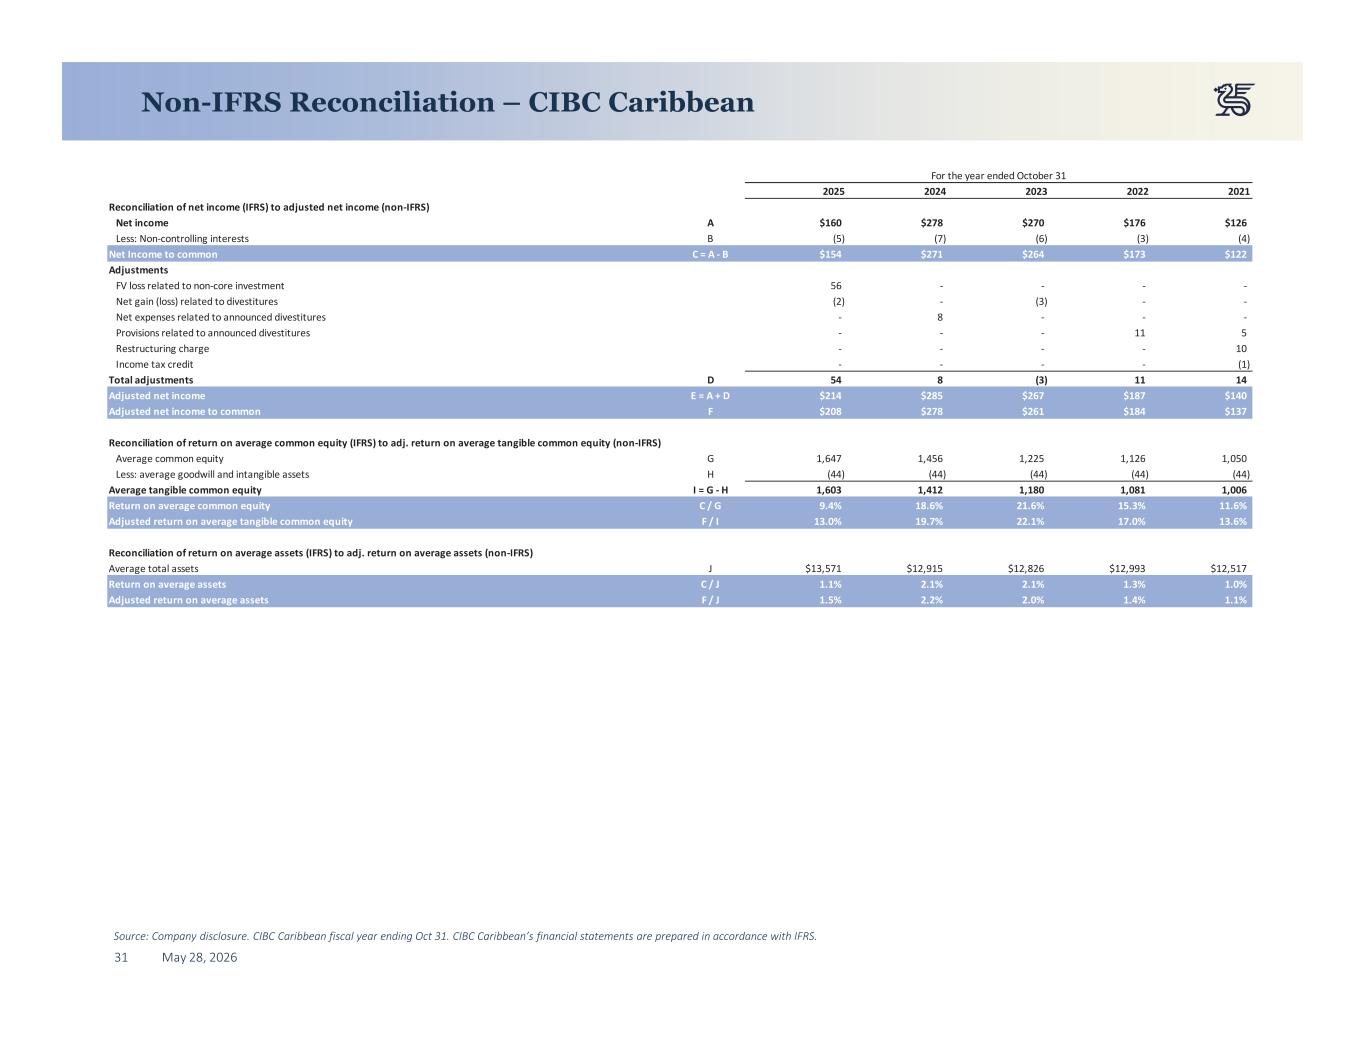
31 May 28, 2026 Non-IFRS Reconciliation – CIBC Caribbean Source: Company disclosure. CIBC Caribbean fiscal year ending Oct 31. CIBC Caribbean’s financial statements are prepared in accordance with IFRS. For the year ended October 31 2025 2024 2023 2022 2021 Reconciliation of net income (IFRS) to adjusted net income (non-IFRS) Net income A $160 $278 $270 $176 $126 Less: Non-controlling interests B (5) (7) (6) (3) (4) Net Income to common C = A - B $154 $271 $264 $173 $122 Adjustments FV loss related to non-core investment 56 - - - - Net gain (loss) related to divestitures (2) - (3) - - Net expenses related to announced divestitures - 8 - - - Provisions related to announced divestitures - - - 11 5 Restructuring charge - - - - 10 Income tax credit - - - - (1) Total adjustments D 54 8 (3) 11 14 Adjusted net income E = A + D $214 $285 $267 $187 $140 Adjusted net income to common F $208 $278 $261 $184 $137 Reconciliation of return on average common equity (IFRS) to adj. return on average tangible common equity (non-IFRS) Average common equity G 1,647 1,456 1,225 1,126 1,050 Less: average goodwill and intangible assets H (44) (44) (44) (44) (44) Average tangible common equity I = G - H 1,603 1,412 1,180 1,081 1,006 Return on average common equity C / G 9.4% 18.6% 21.6% 15.3% 11.6% Adjusted return on average tangible common equity F / I 13.0% 19.7% 22.1% 17.0% 13.6% Reconciliation of return on average assets (IFRS) to adj. return on average assets (non-IFRS) Average total assets J $13,571 $12,915 $12,826 $12,993 $12,517 Return on average assets C / J 1.1% 2.1% 2.1% 1.3% 1.0% Adjusted return on average assets F / J 1.5% 2.2% 2.0% 1.4% 1.1%
32 May 28, 2026 Appendix E: Glossary
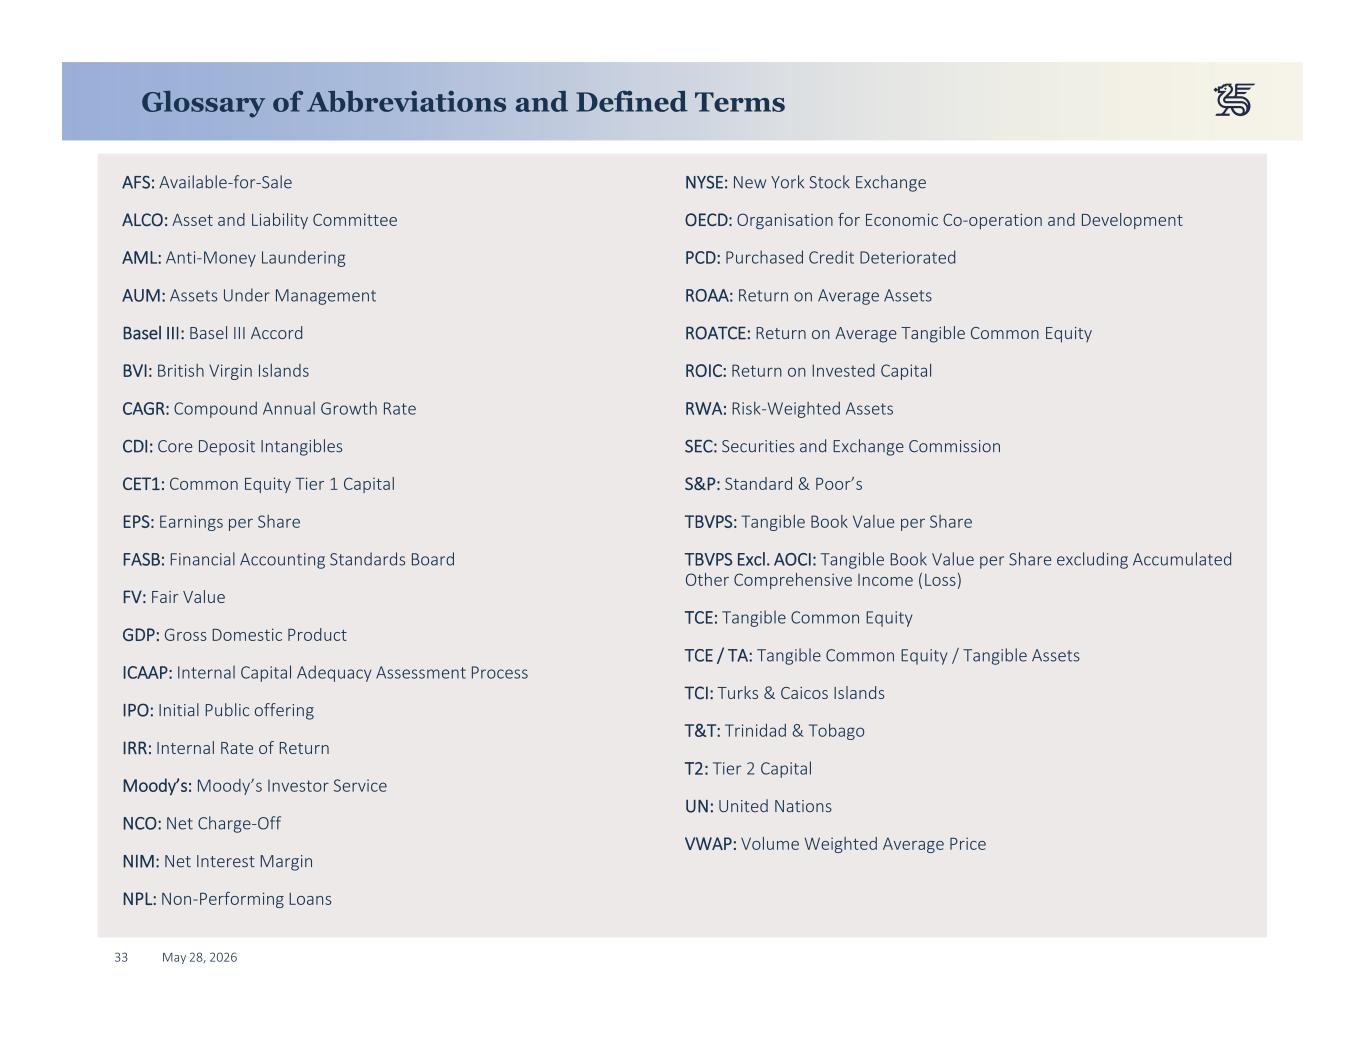
33 May 28, 2026 Glossary of Abbreviations and Defined Terms AFS: Available-for-Sale ALCO: Asset and Liability Committee AML: Anti-Money Laundering AUM: Assets Under Management Basel III: Basel III Accord BVI: British Virgin Islands CAGR: Compound Annual Growth Rate CDI: Core Deposit Intangibles CET1: Common Equity Tier 1 Capital EPS: Earnings per Share FASB: Financial Accounting Standards Board FV: Fair Value GDP: Gross Domestic Product ICAAP: Internal Capital Adequacy Assessment Process IPO: Initial Public offering IRR: Internal Rate of Return Moody’s: Moody’s Investor Service NCO: Net Charge-Off NIM: Net Interest Margin NPL: Non-Performing Loans NYSE: New York Stock Exchange OECD: Organisation for Economic Co-operation and Development PCD: Purchased Credit Deteriorated ROAA: Return on Average Assets ROATCE: Return on Average Tangible Common Equity ROIC: Return on Invested Capital RWA: Risk-Weighted Assets SEC: Securities and Exchange Commission S&P: Standard & Poor’s TBVPS: Tangible Book Value per Share TBVPS Excl. AOCI: Tangible Book Value per Share excluding Accumulated Other Comprehensive Income (Loss) TCE: Tangible Common Equity TCE / TA: Tangible Common Equity / Tangible Assets TCI: Turks & Caicos Islands T&T: Trinidad & Tobago T2: Tier 2 Capital UN: United Nations VWAP: Volume Weighted Average Price
34 May 28, 2026 Appendix E: Risk Factor Summary
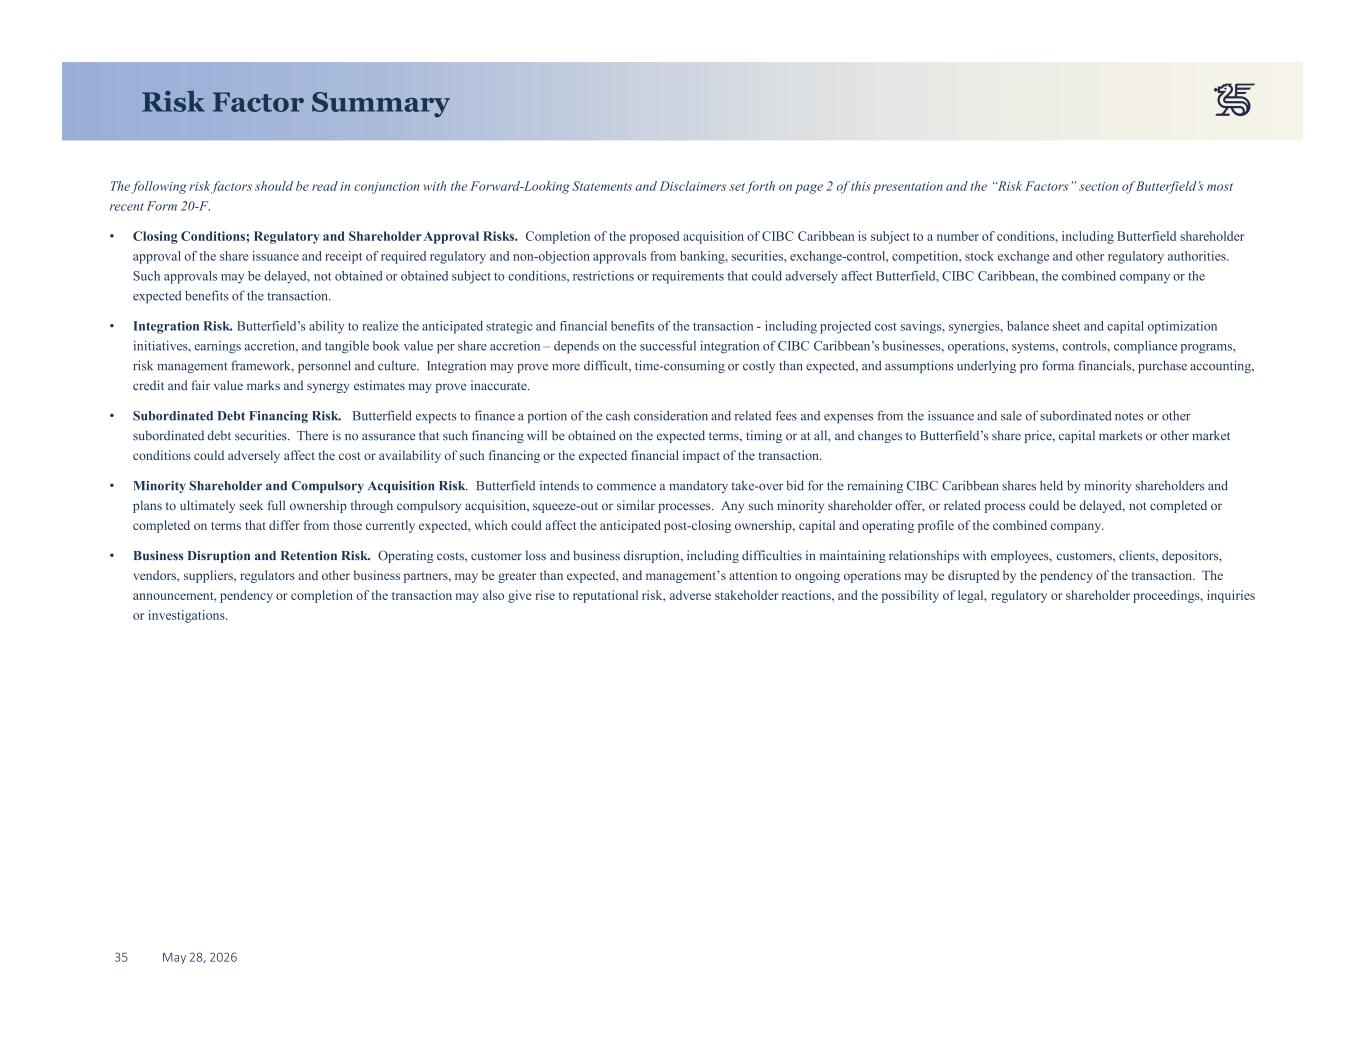
35 May 28, 2026 The following risk factors should be read in conjunction with the Forward-Looking Statements and Disclaimers set forth on page 2 of this presentation and the “Risk Factors” section of Butterfield’s most recent Form 20-F. • Closing Conditions; Regulatory and Shareholder Approval Risks. Completion of the proposed acquisition of CIBC Caribbean is subject to a number of conditions, including Butterfield shareholder approval of the share issuance and receipt of required regulatory and non-objection approvals from banking, securities, exchange-control, competition, stock exchange and other regulatory authorities. Such approvals may be delayed, not obtained or obtained subject to conditions, restrictions or requirements that could adversely affect Butterfield, CIBC Caribbean, the combined company or the expected benefits of the transaction. • Integration Risk. Butterfield’s ability to realize the anticipated strategic and financial benefits of the transaction - including projected cost savings, synergies, balance sheet and capital optimization initiatives, earnings accretion, and tangible book value per share accretion – depends on the successful integration of CIBC Caribbean’s businesses, operations, systems, controls, compliance programs, risk management framework, personnel and culture. Integration may prove more difficult, time-consuming or costly than expected, and assumptions underlying pro forma financials, purchase accounting, credit and fair value marks and synergy estimates may prove inaccurate. • Subordinated Debt Financing Risk. Butterfield expects to finance a portion of the cash consideration and related fees and expenses from the issuance and sale of subordinated notes or other subordinated debt securities. There is no assurance that such financing will be obtained on the expected terms, timing or at all, and changes to Butterfield’s share price, capital markets or other market conditions could adversely affect the cost or availability of such financing or the expected financial impact of the transaction. • Minority Shareholder and Compulsory Acquisition Risk. Butterfield intends to commence a mandatory take-over bid for the remaining CIBC Caribbean shares held by minority shareholders and plans to ultimately seek full ownership through compulsory acquisition, squeeze-out or similar processes. Any such minority shareholder offer, or related process could be delayed, not completed or completed on terms that differ from those currently expected, which could affect the anticipated post-closing ownership, capital and operating profile of the combined company. • Business Disruption and Retention Risk. Operating costs, customer loss and business disruption, including difficulties in maintaining relationships with employees, customers, clients, depositors, vendors, suppliers, regulators and other business partners, may be greater than expected, and management’s attention to ongoing operations may be disrupted by the pendency of the transaction. The announcement, pendency or completion of the transaction may also give rise to reputational risk, adverse stakeholder reactions, and the possibility of legal, regulatory or shareholder proceedings, inquiries or investigations. Risk Factor Summary