Please wait
Frontpage_Q1_repport_bleed.jpg
TORM PLC
120 CANNON STREET
LONDON, EC4N 6AS, UNITED KINGDOM
COMPANY: 09818726
Interim Results for the Second Quarter and
Six Months Ended 30 June 2026
TORM INTERIM RESULTS FOR THE SECOND QUARTER OF 2026
2
Highlights
“We delivered the strongest quarterly results in TORM’s history, turning exceptional market conditions into tangible value for our
shareholders,” said Jacob Meldgaard, CEO of TORM, adding: “Strong earnings and our confidence in continued market strength have led
us to raise our full-year guidance by USD 200m.”
In the second quarter of 2026, TORM generated time charter
equivalent earnings (TCE) of USD 512m (2025, same period:
USD 208m). EBITDA for the Group totaled USD 416m including
unrealized gains on financial instruments of USD 7m (2025,
same period: USD 127m including unrealized losses on
financial instruments of USD 2m), while net profit for the
period amounted to USD 338m (2025, same period: USD 59m),
thus marking a new all-time high for TORM’s quarterly results.
During the quarter, freight rates rose to unprecedented levels
as the conflict involving the US, Israel, and Iran, together with
the subsequent closure of the Strait of Hormuz, materially
disrupted global oil trade flows. The loss of Middle Eastern
exports triggered a shift toward replacement barrels from the
United States. While the ceasefire initially suggested a return
to more normal trading conditions, renewed attacks and
restrictions quickly reinstated uncertainty. Consequently, the
market continued to operate in a "no war, no peace"
environment, with fluctuating transit conditions through the
Strait of Hormuz creating additional inefficiencies in global
trade flows and underpinning freight rates.
In this market, TORM achieved fleet-wide TCE rates of USD/
day 59,301 on average (2025, same period: USD/day 26,672),
and available earning days increased to 8,519 (2025, same
period: 7,888). Our vessel class LR2 achieved TCE rates of
USD/day 66,993, the LR1 vessels achieved TCE rates of USD/
day 57,550, and the MR vessels achieved TCE rates of USD/
day 57,040.
For the second quarter of 2026, return on invested capital
amounted to 44.2% (2025, same period: 10.0%) reflecting the
exceptionally high freight rates and basic EPS amounted to
USD  3.31 (2025, same period: USD 0.60).
Consequently, TORM delivered a strong financial performance
in the first half of 2026, generating TCE earnings of USD 798m
(2025, same period: USD 422m), EBITDA of USD 617m (2025,
same period: USD 262m), and net profit of USD 461m (2025,
same period: USD 122m), supported by exceptionally favorable
freight market conditions during the period.
Business Highlights
In the second quarter of 2026, TORM took delivery of two
2015-built MR vessels, now renamed TORM Dehradun and
TORM Dapitan, increasing TORM’s fleet to 97 vessels.
Also during the second quarter, TORM acquired six MR resale
vessels, with deliveries scheduled from the first quarter of
2027 through 2028. Subsequent to quarter-end, TORM
entered into an agreement to acquire six MR newbuilding
vessels, with options for an additional two vessels. The six
vessels are scheduled for delivery in 2029, while the optional
vessels are expected to be delivered in 2030 if exercised.
Accordingly, TORM's fleet renewal and expansion program is
distributed over the coming years, with vessel deliveries
scheduled from 2027 through 2029 (and potentially 2030),
providing a phased increase in fleet capacity.
Based on broker valuations as of 30 June 2026, TORM’s fleet
had a market value of USD 4,056m (2025, same date: USD
2,888m) and TORM’s consolidated Net Asset Value (NAV) was
USD 3,737m (2025, same date: USD 2,300m) translating into
NAV per share of USD 36.50 (2025, same date: USD 23.50).
Coverage
As of 18 August 2026, TORM had covered 73% of the Q3 2026
earning days at an average rate of USD/day 38,606. By vessel
class, coverage stood at 83% for LR2s at USD/day 49,255,
61% for LR1s at USD/day 32,608 and 71% for MRs at USD/
day 35,247.
For the full year 2026, 70% of the earning days have been
fixed at an average rate of USD/day 45,391. The remaining
part of the earning days in 2026 - equivalent to 10,271 days -
remains open and thus subject to market fluctuations. A
change in freight rates of USD/day 1,000 will, all else equal,
impact EBITDA by approximately USD 10m.
TORM INTERIM RESULTS FOR THE SECOND QUARTER OF 2026
3
Key Figures
USDm
Q2 2026
Q2 2025
Q1-Q2
2026
Q1-Q2
2025
FY 2025
Income statement
Revenue
663
315
1,065
644
1,339
Time charter equivalent earnings (TCE) ¹⁾ ⁵⁾
512
208
798
422
910
EBITDA ¹⁾
416
127
617
262
571
Adjusted EBITDA ¹⁾
409
129
615
267
578
Operating profit (EBIT)
355
75
496
157
356
Financial items
-16
-14
-33
-28
-61
Net profit for the year/period
338
59
461
122
286
Net profit excl. non-recurring items ¹⁾
340
53
461
107
274
Balance sheet and cash flow
Non-current assets
2,977
2,714
2,977
2,714
2,835
Total assets
3,823
3,397
3,823
3,397
3,367
Equity
2,550
2,107
2,550
2,107
2,203
Total liabilities
1,273
1,289
1,273
1,289
1,164
Invested capital ¹⁾
3,254
2,859
3,254
2,859
3,038
Net interest-bearing debt ¹⁾
715
767
715
767
848
Net Asset Value (NAV) excl. NCI ²⁾
3,737
2,300
3,737
2,300
2,603
Cash and cash equivalents, incl. restricted cash
368
370
368
370
164
Investment in tangible fixed assets
79
30
259
60
321
Free cash flow ¹⁾
246
167
229
293
346
1) For definition of the calculated key figures, please refer to the glossary on pages 27 to 32.
²⁾ Based on broker valuations as of 30 June 2026, excluding charter commitments.
³⁾ End of period.
Q2 2026
Q2 2025
Q1-Q2
2026
Q1-Q2
2025
FY 2025
Key financial figures ¹⁾
Margins:
  EBITDA
62.7%
40.2%
57.9%
40.7%
42.6%
  Adjusted EBITDA
61.7%
40.9%
57.7%
41.4%
43.1%
  Operating profit (EBIT)
53.5%
23.7%
46.6%
24.4%
26.6%
Return on Equity (ROE)
28.1%
11.1%
38.8%
11.6%
13.4%
Return on Invested Capital (ROIC)
44.2%
10.0%
31.4%
10.2%
11.5%
Adjusted ROIC
43.9%
9.8%
31.1%
9.6%
10.8%
Equity ratio
66.7%
62.0%
66.7%
62.0%
65.4%
TCE per day (USD) ⁵⁾
59,301
26,672
47,259
26,740
28,783
OPEX per day (USD) ⁵⁾
8,315
7,853
8,171
7,872
7,638
Net Loan-to-value (LTV) ratio ⁵⁾
22.4%
26.8%
22.4%
26.8%
29.3%
Share-related key figures ¹⁾
Basic earnings per share (USD)
3.31
0.60
4.52
1.24
2.91
Diluted earnings per share (USD)
3.25
0.58
4.43
1.20
2.85
Dividend per share (USD) ⁶⁾
2.40
0.40
3.10
0.80
2.12
Net Asset Value per share (NAV/share) (USD) ²⁾
36.5
23.5
36.5
23.5
25.7
Share price in DKK ³⁾
168.6
106.8
168.6
106.8
126.9
Share price in USD ³⁾
26.1
16.7
26.1
16.7
19.6
Number of shares (m) ³⁾ ⁴⁾
102.4
98.0
102.4
98.0
101.3
Number of shares, weighted average (m) ⁴⁾
102.2
97.8
101.9
97.6
98.2
⁴⁾ Excluding treasury shares.
⁵⁾ For Tanker segment.
⁶⁾ Dividend per share includes declared and proposed dividends.
TORM INTERIM RESULTS FOR THE SECOND QUARTER OF 2026
4
Financial Review
TCE
The TCE rate/day increased by 77% from USD 26,740 to USD
47,259 in the first six months of 2026 compared to the same
period last year. This increase was primarily a result of an
increase in revenue due to changed market conditions.
Revenue for the first six months of 2026 increased by
USD 421m to USD 1,065m compared to the same period last
year (USD 644m). The primary driver behind this increase was
the US-Iran conflict and subsequent closure of the Strait of
Hormuz from late February 2026 through most of Q2 2026,
followed by an effective reduction in CPP-carrying capacity,
driven by an unprecedented shift of LR2 vessels into crude
trading ("dirty-ups"). These events triggered severe market
disruption, driving high volatility and freight rate escalation.
Revenue in Q2 2026 alone increased by 110% or USD 348m to
USD 663m compared to the same quarter last year. The
increase was driven by the same effects as described for the
first six months of 2026 above. For further elaboration of the
market developments, refer to the “The Product Tanker
Market” section on the following page.
Port expenses, bunkers, commissions, and other cost of goods
sold for the first six months of 2026 were USD 265m, an
increase of USD 50m compared to USD 215m in the same
period last year. The change can be attributed to USD 53m in
increased port expenses, bunker expenses, and increased
expenses related to emission allowances combined.
Port expenses, bunkers, commissions, and other cost of goods
sold in Q2 2026 were USD 150m, an increase of USD 45m
compared to USD 105m in the same period last year. The
change can be attributed to an increase in port expenses of
USD 28m due to changed sailing routes following the US-Iran
conflict, bunker expenses of USD 16m due to increased bunker
prices. Both are further supported by increased operating
days of 6%. The development is offset by an increase in
unrealized gains on derivative financial instruments regarding
freight and bunkers of USD 9m.
Assets
As of 30 June 2026, total assets were USD 3,823m (31
December 2025: USD 3,367m), an increase of USD 456m since
the end of 2025. The increase is mainly driven by an increase
in the carrying amount of vessels and capitalized dry docking
including prepayments on vessels of USD 142m, trade
receivables of USD 107m, and cash and cash equivalents incl.
restricted cash of USD 204m.
The carrying value of the fleet was USD 2,919m as of 30 June
2026 (31 December 2025: USD 2,792m). The increase was
driven by the delivery of three secondhand MR vessels and
two secondhand LR2 vessels, and by capitalized dry docking
and vessel modifications for a combined total of USD 244m.
The increase is offset by regular depreciation of USD 117m.
Based on broker valuations, TORM’s fleet on water had a
market value of USD 4,056m as of 30 June 2026, 39% above
carrying value (31 December 2025: USD 3,178m, 13% above
carrying value).
TORM´s liquidity position as of 30 June 2026 was USD 804m
including restricted cash of USD 3m and undrawn credit
facilities of USD 436m (31 December 2025: USD 562m
including restricted cash of USD 5m and undrawn credit
facilities of USD 399m).
Equity
As of 30 June 2026, TORM’s equity was USD 2,550m (31
December 2025: USD 2,203m), an increase of USD 347m. The
development was mainly driven by an increase in retained
profit from the net profit for the period of USD 461m, offset by
dividends paid of USD 143m.
Liabilities
As of 30 June 2026, total liabilities were USD 1,273m (31
December 2025: USD 1,164m). The increase was primarily
driven by increased borrowings of USD 73m, of which the
majority relate to the financing of newly acquired secondhand
vessels, offset by ordinary repayments.
Cash Flow Statement
Net cash flow from operating activities for the first six months
of 2026 was USD 455m (2025, same period: USD 244m). The
increase was primarily driven by an increase in the net profit
for the period offset by working capital movements.
Net cash flow from investing activities for the first six months
of 2026 was USD -226m (2025, same period: USD 49m). The
change in cash flow is largely driven by five new secondhand
vessel acquisitions, compared to no acquisitions and several
disposals in the same period last year.
Net cash flow from financing activities for the first six months
of 2026 was USD -22m (2025, same period: USD -205m). The
change in cash flow is mainly driven by the financing of the
five newly acquired secondhand vessels, offset by repayment
of lease debt related to the repurchase of eight vessels on
sale-and-leaseback agreements. No such repayments were
made in the same period last year.
Distribution
Today, TORM’s Board of Directors approved an interim
dividend for the second quarter of 2026 of USD 2.40 per share
corresponding to an expected total dividend payment of USD
246m. The distribution for the quarter is equivalent to 73% of
net profit and is consistent with the Distribution Policy. The
dividend will be paid on 24 September 2026 to shareholders of
record as of 10 September 2026. The ex-dividend date will be
09 September 2026 for shares listed on Nasdaq Copenhagen
and 10 September 2026 for shares listed on Nasdaq New York.
TORM INTERIM RESULTS FOR THE SECOND QUARTER OF 2026
5
The Product Tanker Market
Market Developments
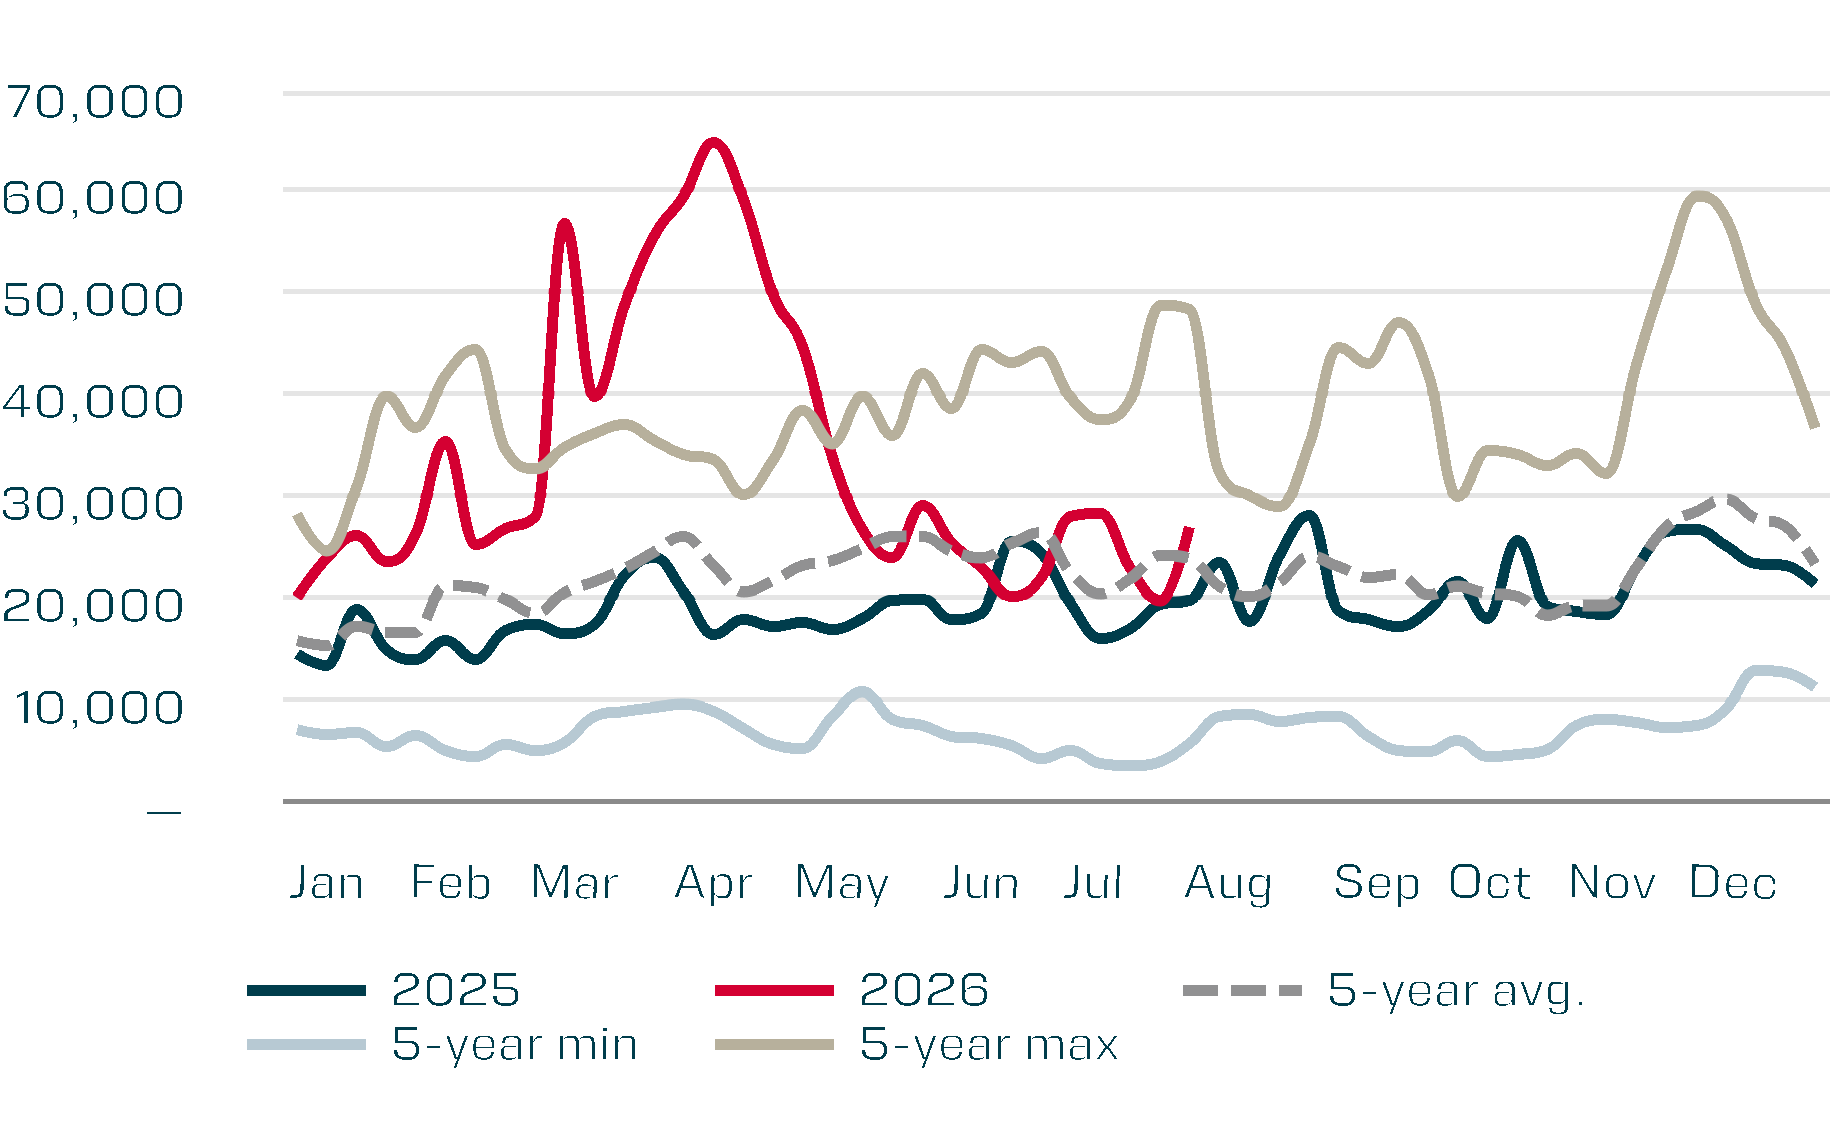
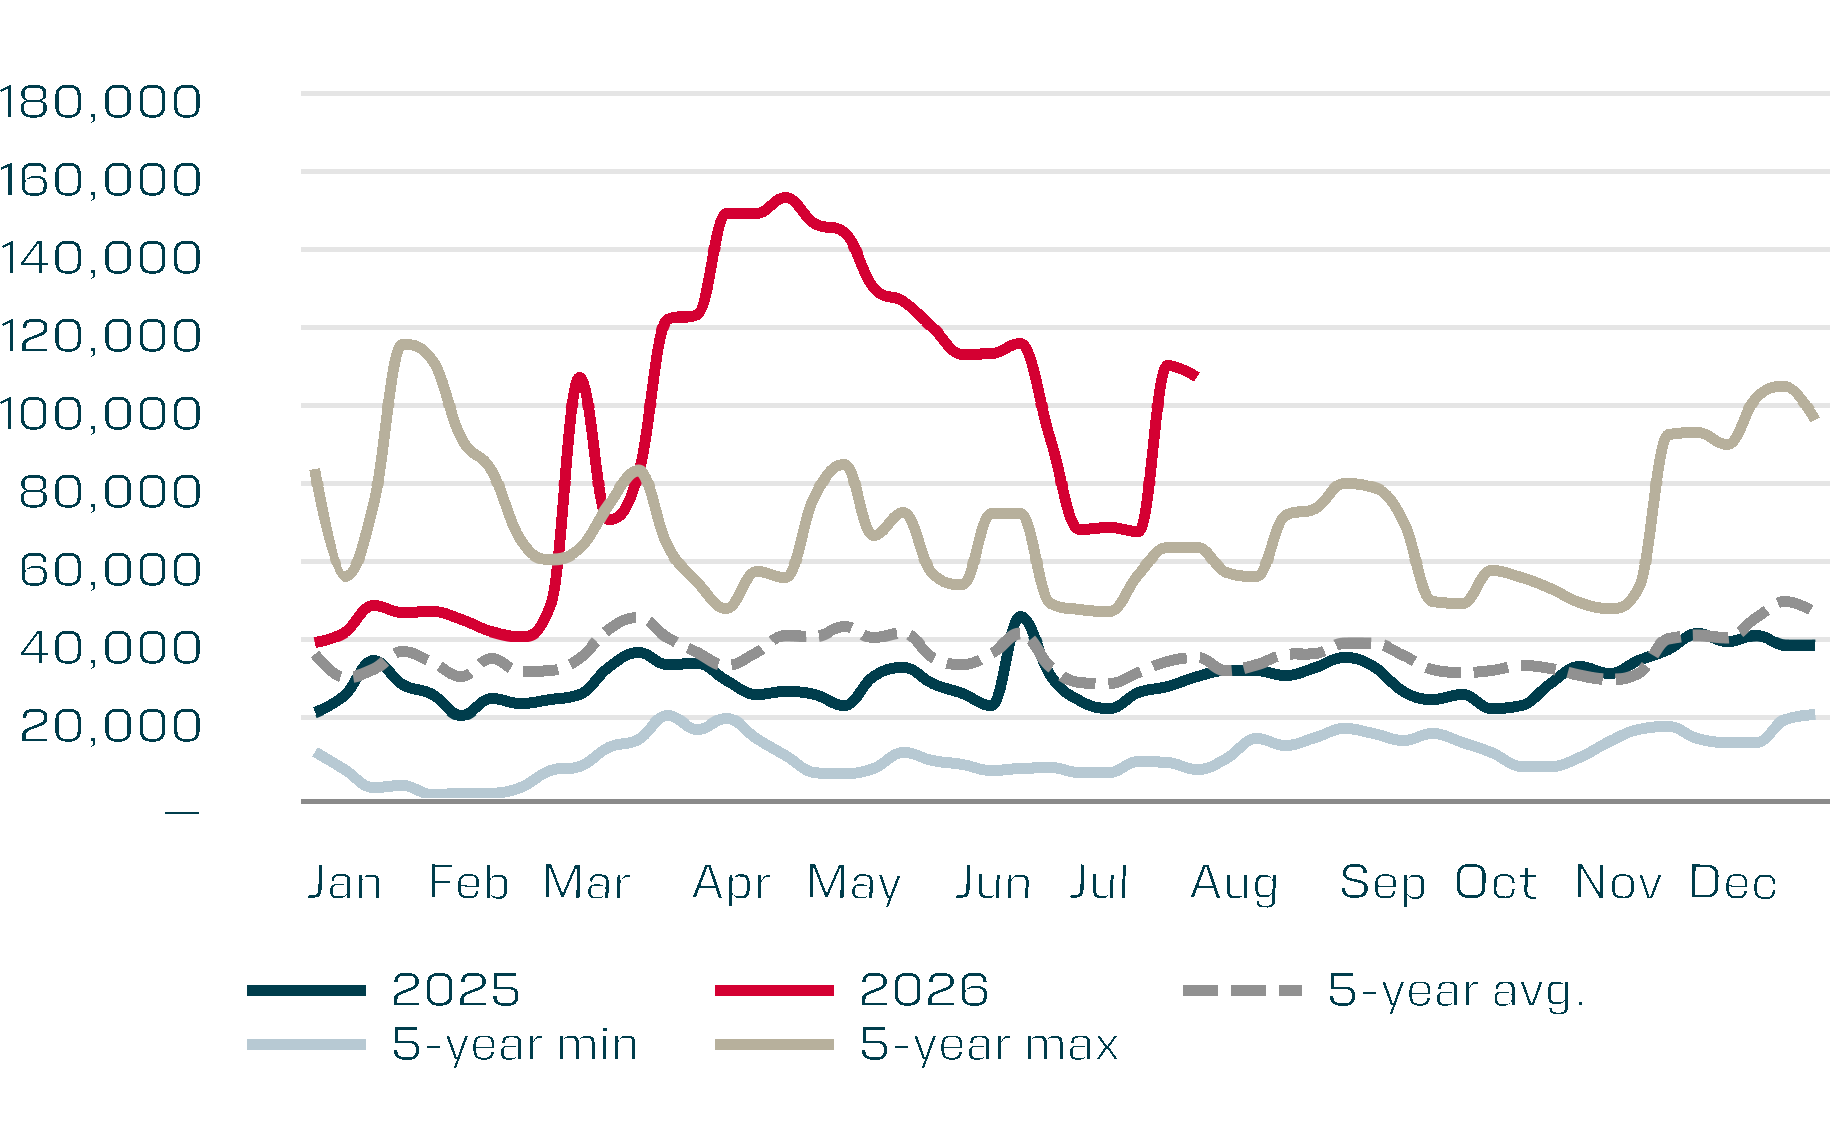
During the second quarter, freight rates rose to
unprecedented levels as the conflict involving the US, Israel,
and Iran, together with the subsequent closure of the Strait of
Hormuz, materially disrupted global oil trade flows. The loss of
Middle Eastern exports triggered a shift towards replacement
barrels from the Atlantic basin and increased market
inefficiencies.
Following the outbreak of the conflict in late February, the
Strait of Hormuz remained largely closed throughout most of
Q2. As a result, global clean petroleum product (CPP) flows
were constrained, averaging approximately 18% below pre-
closure levels in April and May. Despite reduced exports from
the Persian Gulf and Asia, Europe avoided a potential jet fuel
shortage through increased regional production and higher
imports from the US Gulf Coast and Nigeria's Dangote refinery.
Global crude oil flows averaged around only 17% of pre-
closure levels during the first two months of the quarter.
Increased pipeline exports from Saudi Arabia and the UAE,
bypassing the Persian Gulf, together with higher Atlantic Basin
crude exports, partly mitigated the loss of Gulf volumes, while
reduced Chinese crude imports absorbed much of the
remaining disruption. 
On 17 June, the United States and Iran signed a memorandum
of understanding (MoU), paving the way for a 60-day ceasefire.
Although violations of the agreement were reported, vessel
traffic through the Strait began to recover, reaching
approximately 25 tanker transits by end-June (yet less than
half the level of tanker transits before the closure of the Strait
of Hormuz). The rebound in Persian Gulf crude exports helped
narrow the global crude flow deficit to around 7% below pre-
closure levels, while CPP flows lagged at approximately 14%
below normal. This divergence between crude and product
markets was further exacerbated by strikes on Russian
refineries, which released additional crude supply while
simultaneously limiting refined product exports.
In the tanker market, the share of the LR2 fleet trading in the
“dirty” segment remained broadly stable at around two-thirds
by end June, resulting in an effective reduction of CPP-
carrying capacity by approximately 5% compared with the
start of the year. This continued to underpin LR2 earnings,
which remained significantly above historical norms
throughout the quarter. In contrast, MR tanker rates came
under pressure in the second half of the second quarter, as
the number of ballasting vessels heading toward the US Gulf
reached record highs in late April and early May.
Market Outlook
In early Q3, the ceasefire between the US and Iran collapsed,
leading to another effective closure of the Strait of Hormuz. At
the same time, the Houthis resumed attacks on commercial
vessels in the Bab el-Mandeb Strait, specifically targeting
tankers carrying Saudi crude from Red Sea ports. As a result,
disruptions affected two of the world's most critical oil
shipping routes.
LR2 rates (in USD/day)
SOURCE: CLARKSONS
With Saudi crude exports to Asia potentially being rerouted via
the Suez Canal and around the Cape of Good Hope, voyage
distances could increase significantly, potentially approaching
twice their normal length. This would materially boost ton-mile
demand and provide strong support for the VLCC market in
particular, but also to the general tanker complex.
Looking ahead, tanker demand is expected to remain
supported over the medium term by the need to rebuild both
strategic and commercial oil inventories that were drawn down
during the conflict. This restocking activity will add to baseline
trade flows driven by normal supply-demand dynamics, and
could be further amplified if inventories are rebuilt to levels
exceeding those seen prior to the Iran conflict. 
MR rates (in USD/day)
SOURCE: CLARKSON
36283883717777
36283883717751
TORM INTERIM RESULTS FOR THE SECOND QUARTER OF 2026
6
Outlook for 2026
Financial Outlook 2026
At TORM, we develop annual guidance by tracking key
performance metrics, including TCE, coverage levels, and
EBITDA sensitivity to freight rate movements. Freight rates in
the product tanker market - our primary earnings driver -
remain highly volatile, while we expect operating costs per
vessel day, and administrative expenses to stay broadly in line
with prior-year levels.
Our financial outlook is primarily based on the assumptions
described on the preceding pages. The most important factors
affecting our TCE earnings are expected to be:
Geopolitical conflicts including the war between Russia
and Ukraine, and the conflicts in the Middle East region.
Global economic growth or recession, consumption of
refined oil products, and inflationary pressure.
Location of closing and opening refineries and temporary
shutdowns due to maintenance.
Oil price development
Oil trading activity and developments in ton-mile
Bunker price developments
Global fleet growth and newbuilding ordering activity
Potential difficulties of major business partners
One-off market-shaping events such as strikes, conflicts,
embargoes, political instability, weather conditions, etc.
We have limited visibility on TCE rates that are not yet fixed
with our customers. Hence, these rates may be significantly
lower or significantly higher than our current expectations.
Disclaimer on Financial Outlook
The purpose of this Financial Outlook for 2026 is to comply
with reporting requirements for Companies listed in Denmark.
Actual results may vary, and this information may not be
accurate or appropriate for other purposes. Information about
our financial outlook for 2026, including the various
assumptions underlying it, is forward-looking and should be
read in conjunction with the Safe Harbor Statements on page
11, and the related disclosure and information about various
economic, competitive, and regulatory assumptions, factors,
and risks that may cause our actual future financial and
operating results to differ materially from what we currently
expect.
The information included in this Financial Outlook for 2026 is
preliminary, unaudited and based on estimates and
information available to us at this time. TORM has not finalized
its financial statements for the periods presented. During the
course of the financial statement closing process, TORM may
identify items that would require it to make adjustments, which
may be material to the information provided in this section. As
mentioned above, the provided information constitutes
forward-looking statements and is subject to risks and
uncertainties, including possible adjustments to the financial
outlook for 2026.
Based on the earnings realized this far as well as the outlook
for the remaining part of the year, TORM upgrades its full-year
guidance.
For the full year 2026, TCE earnings are now expected to
exceed the previous guidance and are now estimated to USD
1,400 - 1,600m (previous guidance USD 1,150 - 1,450m).
EBITDA for the full year 2026 is expected to be in the range of
USD 1,0001,200m (previous guidance USD 800 - 1,100m)
based on the current fleet size.
TORM INTERIM RESULTS FOR THE SECOND QUARTER OF 2026
7
Coverage 2026
Total earning and covered days in TORM as of 18 August 2026
The coverage tables below include both FFA contracts and the physical fleet.
Actual number of days can vary from projected number of days primarily due to vessel sales and
delays of vessel deliveries.Total earning days are defined as total calendar days less off-hire
days.
Q3 2026
FY 2026
Total earning days
LR2
1,980
7,672
LR1
915
3,598
MR
5,939
23,161
Total
8,834
34,431
Covered days
LR2
1,647
6,066
LR1
558
2,364
MR
4,226
15,773
Total
6,431
24,203
Q3 2026
FY 2026
Covered, %
LR2
83%
79%
LR1
61%
66%
MR
71%
68%
Total
73%
70%
Coverage rates, USD/day
LR2
49,255
52,231
LR1
32,608
44,080
MR
35,247
42,933
Total
38,606
45,391
TORM INTERIM RESULTS FOR THE SECOND QUARTER OF 2026
8
Earnings Data
USDm
Q2 2025
Q3 2025
Q4 2025
Q1 2026
Q2 2026
Change  Q2-25
- Q2-26
LR2 vessels
Available earning days 1)
1,866
1,781
1,872
1,826
1,889
1%
Spot rates 2)
33,351
35,996
38,109
50,811
71,289
114%
TCE per earning day 3)
35,459
38,685
35,567
41,062
66,993
89%
Operating days
1,871
1,840
1,892
1,902
2,002
7%
Operating expenses per operating day
7,695
7,497
7,709
8,321
8,942
16%
LR1 vessels
Available earning days 1)
905
911
919
897
906
%
Spot rates 2)
28,679
29,770
26,949
41,618
53,742
87%
TCE per earning day 3)
27,371
29,508
31,075
34,903
57,550
110%
Operating days
910
920
920
900
910
%
Operating expenses per operating day
7,282
7,836
7,087
7,743
8,382
15%
MR vessels
Available earning days 1)
5,117
5,167
5,241
5,602
5,724
12%
Spot rates 2)
23,950
28,310
29,515
36,253
57,088
138%
TCE per earning day 3)
23,345
28,632
28,832
32,946
57,040
144%
Operating days
5,460
5,419
5,463
5,644
5,862
7%
Operating expenses per operating day
8,002
7,093
7,547
7,964
8,091
1%
Tanker segment
Available earning days 1)
7,888
7,859
8,032
8,325
8,519
8%
Spot rates 2)
26,412
29,962
31,032
39,542
59,296
125%
TCE per earning day 3)
26,672
31,012
30,658
34,937
59,301
122%
Operating days
8,241
8,179
8,275
8,446
8,774
6%
Operating expenses per operating day
7,853
7,268
7,533
8,021
8,315
6%
1) Total available earning days = Total calendar days less off-hire days
2) Spot rates = Time Charter Equivalent Earnings for all charters with less than six months' duration.
3) TCE = Time Charter Equivalent Earnings. Please refer to the glossary on pages 27 to 32.
TORM INTERIM RESULTS FOR THE SECOND QUARTER OF 2026
9
TORM Fleet Development
The table shows recent developments in TORM’s operating
fleet. As of 30 June 2026, TORM’s fleet comprises 97 vessels.
At TORM, maintaining a high quality and competitive fleet is a
core priority. As part of our active fleet management strategy,
we regularly divest vessels as they reach a certain age to
ensure a stable and attractive average fleet age.
This approach not only supports operational efficiency and
environmental performance but also aligns with our broader
objective of maintaining high standards across our fleet.
Divestments are carefully timed and balanced with selective
acquisitions of high-quality secondhand vessels, which are
rapidly upgraded to match the TORM standard.
Through this disciplined process, we safeguard the long-term
competitiveness of our fleet and continue to meet the evolving
expectations of our customers, charterers, and stakeholders.
Image_12 orange line.jpg
TORM Fleet Development
Q2 2025
Changes
Q3 2025
Changes
Q4 2025
Changes
Q1 2026
Changes
Q2 2026
LR2
20
20
1
21
1
22
22
LR1
10
10
10
10
10
MR
60
-2
58
4
62
1
63
2
65
Total
90
-2
88
5
93
2
95
2
97
TORM INTERIM RESULTS FOR THE SECOND QUARTER OF 2026
10
Responsibility Statement
Disclaimer
The interim report has been prepared solely to provide
additional information to shareholders to assess the Group’s
strategies and the potential for those strategies to succeed.
The interim report should not be relied on by any other party
or for any other purpose.
The interim report contains certain forward-looking
statements. These statements are made by the Directors in
good faith based on the information available to them up to
the time of their approval of this report. Such statements
should be treated with caution due to the inherent
uncertainties, including both economic and business risk
factors, underlying any such forward-looking statements.
We Confirm to the Best of Our Knowledge
The condensed consolidated set of financial statements
has been prepared in accordance with IAS 34 Interim
Financial Reporting (“IAS 34”) as adopted in the UK and
also in accordance with IAS 34 as issued by the
International Accounting Standards Board (”IASB”) and IAS
34 as adopted by the EU, as applied to the financial
periods beginning on or after 01 January 2026 and
additional Danish disclosure requirements for interim
reports of listed companies.
The interim report gives a true and fair view of the Group’s
financial position as of 30 June 2026 as well as of the
Group’s financial performance and cash flow for the period
01 January30 June 2026.
The interim management report includes a fair review of
the development and performance of the Group’s business
and of the financial position as a whole and a description
of the principal risks and uncertainties for the remaining
six months of 2026.
The interim management report includes a fair review of
the material related party transactions which have taken
place in the period and material changes to those
described in the last annual report.
By order of the Board of Directors
Jacob Meldgaard
Executive Director
26 August 2026
TORM INTERIM RESULTS FOR THE SECOND QUARTER OF 2026
11
Safe Harbor Statement as to the Future
Matters discussed in this release may constitute forward-
looking statements. The Private Securities Litigation Reform
Act of 1995 provides safe harbor protections for forward-
looking statements in order to encourage companies to
provide prospective information about their business. Forward-
looking statements reflect our current views with respect to
future events and financial performance and may include
statements concerning plans, objectives, goals, strategies,
future events or performance, and underlying assumptions
and other statements, which are statements other than
statements of historical facts. The Company desires to take
advantage of the safe harbor provisions of the Private
Securities Litigation Reform Act of 1995 and is including this
cautionary statement in connection with this safe harbor
legislation. Words such as, but not limited to, “expects,”
“anticipates,” “intends,” “plans,” “believes,” “estimates,”
“targets,” “projects,” “forecasts,” “potential,” “continue,”
“possible,” “likely,” “may,” “could,” “should” and similar
expressions or phrases may identify forward-looking
statements.
The forward-looking statements in this annual report are
based upon various assumptions, many of which are, in turn,
based upon further assumptions, including without limitation,
management’s examination of historical operating trends, data
contained in our records and other data available from third
parties. Although the Company believes that these
assumptions were reasonable when made, because these
assumptions are inherently subject to significant uncertainties
and contingencies that are difficult or impossible to predict
and are beyond our control, the Company cannot guarantee
that it will achieve or accomplish these expectations, beliefs,
or projections.
Important factors that, in our view, could cause actual results
to differ materially from those discussed in the forward-
looking statements include, but are not limited to, our future
operating or financial results; changes in governmental rules
and regulations or actions taken by regulatory authorities;
inflationary pressure and central bank policies intended to
combat overall inflation and rising interest rates and foreign
exchange rates; general domestic and international political
conditions or events, including “trade wars” and the war
between Russia and Ukraine, the conflicts in the Middle East,
international sanctions against Russian oil and oil products;
changes in economic and competitive conditions affecting our
business, including market fluctuations in charter rates and
charterers’ abilities to perform under existing time charters;
changes in the supply and demand for vessels comparable to
ours and the number of newbuildings under construction; the
highly cyclical nature of the industry that we operate in; the
loss of a large customer or significant business relationship;
changes in worldwide oil production and consumption and
storage; risks associated with any future vessel construction;
our expectations regarding the availability of vessel
acquisitions and our ability to complete acquisition
transactions planned; availability of skilled crew members
other employees and the related labor costs; work stoppages
or other labor disruptions by our employees or the employees
of other companies in related industries;  effects of new
products and new technology in our industry;  new
environmental regulations and restrictions; the impact of an
interruption in or failure of our information technology and
communications systems, including the impact of cyber-
attacks, upon our ability to operate; potential conflicts of
interest involving members of our Board of Directors and
Senior Management; the failure of counterparties to fully
perform their contracts with us; changes in credit risk with
respect to our counterparties on contracts; adequacy of
insurance coverage; our ability to obtain indemnities from
customers; changes in laws, treaties or regulations; our
incorporation under the laws of England and Wales and the
different rights to relief that may be available compared to
other countries, including the United States; government
requisition of our vessels during a period of war or emergency;
the arrest of our vessels by maritime claimants; any further
changes in U.S. trade policy that could trigger retaliatory
actions by the affected countries; the impact of the U.S.
presidential and congressional election results affecting the
economy, future government laws and regulations and trade
policy matters, such as the imposition of tariffs and other
import restrictions; potential disruption of shipping routes due
to accidents, climate-related incidents, adverse weather and
natural disasters, environmental factors, political events,
public health threats, acts by terrorists or acts of piracy on
ocean-going vessels; damage to storage and receiving
facilities; potential liability from future litigation and potential
costs due to environmental damage and vessel collisions; and
the length and number of off-hire periods and dependence on
third-party managers.
In the light of these risks and uncertainties, undue reliance
should not be placed on forward-looking statements contained
in this release because they are statements about events that
are not certain to occur as described or at all. These forward-
looking statements are not guarantees of our future
performance, and actual results and future developments may
vary materially from those projected in the forward-looking
statements. Except to the extent required by applicable law or
regulation, the Company undertakes no obligation to release
publicly any revisions or updates to these forward-looking
statements to reflect events or circumstances after the date
of this release or to reflect the occurrence of unanticipated
events. Please see TORM’s filings with the U.S. Securities and
Exchange Commission for a more complete discussion of
certain of these and other risks and uncertainties. The
information set forth herein speaks only as of the date hereof,
and the Company disclaims any intention or obligation to
update any forward-looking statements as a result of
developments occurring after the date of this communication.
TORM INTERIM RESULTS FOR THE SECOND QUARTER OF 2026
12
Condensed Consolidated Income Statement
USDm
Note
Q2 2026
Q2 2025
Q1-Q2 2026
Q1-Q2 2025
FY 2025
Revenue
662.8
315.2
1,064.8
644.3
1,339.5
Port expenses, bunkers, commissions, and other cost of goods and services sold
-150.0
-104.9
-264.5
-215.3
-421.6
Operating expenses
2
-72.6
-64.3
-140.3
-130.7
-252.4
Profit from sale of vessels
3
5.4
4.0
14.9
19.0
Administrative expenses
2, 3
-24.2
-24.5
-47.2
-50.5
-113.8
Other operating income and expenses
-0.4
-0.1
-0.3
-0.3
0.1
Depreciation and amortization
3
-60.5
-52.2
-120.1
-105.4
-214.5
Operating profit (EBIT)
355.1
74.6
496.4
157.0
356.3
Financial income
2.3
3.6
3.9
7.5
13.3
Financial expenses
-18.3
-17.8
-37.2
-35.7
-74.4
Profit before tax
339.1
60.4
463.1
128.8
295.2
Tax
-0.8
-1.7
-2.4
-7.2
-9.2
Net profit for the period
338.3
58.7
460.7
121.6
286.0
Net profit for the period attributable to:
TORM plc shareholders
338.3
58.6
460.7
120.9
285.3
Non-controlling interest
0.1
0.7
0.7
Net profit for the period
338.3
58.7
460.7
121.6
286.0
Earnings per share
Basic earnings per share (USD)
7
3.31
0.60
4.52
1.24
2.91
Diluted earnings per share (USD)
7
3.25
0.58
4.43
1.20
2.85
Segment reporting, notes 1, 6 and 8-11 are on pages 18 to 26.
TORM INTERIM RESULTS FOR THE SECOND QUARTER OF 2026
13
Condensed Consolidated Statement of Comprehensive Income
USDm
Q2 2026
Q2 2025
Q1-Q2 2026
Q1-Q2 2025
FY 2025
Net profit for the period
338.3
58.7
460.7
121.6
286.0
Other comprehensive income:
Items that may be reclassified to profit or loss:
Exchange rate adjustment arising from translation of entities having a functional currency different from USD
0.1
0.7
-0.2
0.9
0.9
Fair value adjustment on hedging instruments
3.0
2.3
5.4
1.7
1.1
Fair value adjustment on hedging instruments transferred to income statement
-1.5
-3.8
-4.0
-7.1
-13.9
Tax on other comprehensive income
-0.6
1.1
-0.9
2.7
3.9
Other comprehensive income/(loss) after tax
1.0
0.3
0.3
-1.8
-8.0
Total comprehensive income for the period
339.3
59.0
461.0
119.8
278.0
Total comprehensive income for the period attributable to:
TORM plc shareholders
339.3
58.7
461.0
118.9
277.0
Non-controlling interest
0.3
0.9
1.0
Total comprehensive income for the period
339.3
59.0
461.0
119.8
278.0
TORM INTERIM RESULTS FOR THE SECOND QUARTER OF 2026
14
Condensed Consolidated Balance Sheet
30 June
30 June
31 December
USDm
Note
2026
2025
2025
ASSETS
Intangible assets
Goodwill
1.9
1.8
1.8
Other intangible assets
4.2
2.3
4.0
Total intangible assets
6.1
4.1
5.8
Tangible fixed assets
Land and buildings
8.3
8.3
9.7
Vessels and capitalized dry-docking
3
2,918.8
2,691.7
2,792.2
Prepayments on vessels
4
29.3
14.1
Other non-current assets under
construction
4.5
2.2
3.4
Other plant and operating equipment
1.9
2.6
2.5
Total tangible fixed assets
2,962.8
2,704.8
2,821.9
Financial assets
Investments in joint ventures
0.1
Loan receivables
4.4
4.5
4.4
Deferred tax asset
0.3
0.3
0.3
Other investments
3.0
0.1
2.7
Total financial assets
7.7
5.0
7.4
Total non-current assets
2,976.6
2,713.9
2,835.1
Inventories
111.8
69.5
66.5
Trade receivables
322.4
170.9
214.7
Other receivables
28.1
30.9
23.7
Prepayments
16.1
10.6
39.1
Cash and cash equivalents incl. restricted
cash
368.2
369.8
163.5
Current assets excl. assets held for sale
846.6
651.7
507.5
Assets held for sale
3
31.1
24.4
Total current assets
846.6
682.8
531.9
TOTAL ASSETS
3,823.2
3,396.7
3,367.0
30 June
30 June
31 December
USDm
Note
2026
2025
2025
EQUITY AND LIABILITIES
Equity
Common shares
1.0
1.0
1.0
Share premium
131.6
91.1
110.2
Hedging reserves
7.1
12.8
6.6
Translation reserves
-0.4
-0.1
-0.2
Other reserves
153.1
398.1
296.1
Retained profit
2,257.9
1,604.4
1,788.9
Total equity
2,550.3
2,107.3
2,202.6
Liabilities
Non-current tax liability related to held-
over gains
45.2
45.2
45.2
Deferred tax liability
2.0
0.3
0.2
Borrowings
5
839.2
969.8
714.3
Other non-current liabilities
13.8
8.0
3.3
Total non-current liabilities
900.2
1,023.3
763.0
Borrowings
5
237.0
156.2
288.8
Trade payables
81.8
45.2
41.0
Current tax liabilities
0.1
1.3
0.3
Other liabilities
46.8
57.1
68.3
Provisions
0.4
0.7
0.7
Prepayments from customers
6.6
5.6
2.3
Total current liabilities
372.7
266.1
401.4
Total liabilities
1,272.9
1,289.4
1,164.4
TOTAL EQUITY AND LIABILITIES
3,823.2
3,396.7
3,367.0
Segment reporting, notes 1, 6 and 8-11 are on pages 18 to 26.
TORM INTERIM RESULTS FOR THE SECOND QUARTER OF 2026
15
Condensed Consolidated Statement of Changes in Equity
01 January-30 June
USDm
Common
shares
Share
premium
Treasury
shares
Hedging
reserves
Translation
reserves
Other
reserves
Retained
profit
Equity
attributable to
shareholders
of TORM plc
Non-
controlling
interest
Total
Equity as of 01 January 2026
1.0
110.2
6.6
-0.2
296.1
1,788.9
2,202.6
2,202.6
Comprehensive income/loss for the period:
Net profit for the period
460.7
460.7
460.7
Other comprehensive income for the period
1.4
-0.2
1.2
1.2
Tax on other comprehensive income
-0.9
-0.9
-0.9
Total comprehensive income/(loss) for the period
0.5
-0.2
460.7
461.0
461.0
Capital increase
21.4
21.4
21.4
Share-based compensation
8.3
8.3
8.3
Dividend paid
-143.0
-143.0
-143.0
Total changes in equity for the period
21.4
0.5
-0.2
-143.0
469.0
347.7
347.7
Equity as of 30 June 2026
1.0
131.6
7.1
-0.4
153.1
2,257.9
2,550.3
2,550.3
TORM INTERIM RESULTS FOR THE SECOND QUARTER OF 2026
16
Condensed Consolidated Statement of Changes in Equity
USDm
Common
shares
Share
premium
Treasury
shares
Hedging
reserves
Translation
reserves
Other
reserves
Retained
profit
Equity
attributable to
shareholders
of TORM plc
Non-
controlling
interest
Total
Equity as of 01 January 2025
1.0
271.0
-4.2
15.5
-0.8
320.0
1,471.5
2,074.0
0.8
2,074.8
Comprehensive income/(loss) for the period:
Net profit/(loss) for the period
120.9
120.9
0.7
121.6
Other comprehensive income for the period
-5.4
0.7
-4.7
0.2
-4.5
Tax on other comprehensive income
2.7
2.7
2.7
Total comprehensive income/(loss) for the period
-2.7
0.7
120.9
118.9
0.9
119.8
Capital increase
0.2
0.2
0.2
Transaction costs of capital increase
-0.1
-0.1
-0.1
Capital reduction ²⁾
-180.0
180.0
Treasury share cancellation
4.2
-4.2
Share-based compensation
14.0
14.0
14.0
Dividend paid
-97.7
-97.7
-97.7
Total changes in equity for the period
-179.9
4.2
-2.7
0.7
78.1
134.9
35.3
0.9
36.2
Transactions with non-controlling interests
-2.0
-2.0
-1.7
-3.7
Equity as of 30 June 2025
1.0
91.1
12.8
-0.1
398.1
1,604.4
2,107.3
2,107.3
TORM INTERIM RESULTS FOR THE SECOND QUARTER OF 2026
17
Condensed Consolidated Cash Flow Statement
USDm
Q1-Q2
2026
Q1-Q2
2025
FY 2025
Cash flow from operating activities
Net profit for the period
460.7
121.6
286.0
Adjustments:
  Profit from sale of vessels
-4.0
-14.9
-19.0
  Depreciation and amortization
120.1
105.4
214.5
  Financial income
-3.9
-7.5
-13.3
  Financial expenses
37.2
35.7
74.4
  Tax
2.4
7.2
9.2
  Other non-cash movements
5.4
18.3
41.4
Interest received and realized exchange gains
3.4
7.7
11.9
Interest paid and realized exchange losses
-33.1
-34.1
-70.0
Income taxes paid
-1.7
-1.2
-2.7
Change in inventories, receivables and payables, etc.
-131.1
6.2
-33.5
Net cash flow from operating activities
455.4
244.4
498.9
USDm
Q1-Q2
2026
Q1-Q2
2025
FY 2025
Cash flow from investing activities
Investment in tangible fixed assets¹⁾
-256.9
-55.7
-308.5
Investment in intangible fixed assets
-1.5
-0.4
-1.8
Sale of tangible fixed assets
29.3
95.3
143.8
Change in restricted cash
2.9
9.3
13.9
Net cash flow from investing activities
-226.2
48.5
-152.6
Cash flow from financing activities
Proceeds, borrowings
294.5
0.1
338.0
Repayment, borrowings
-194.5
-103.8
-567.7
Vessel lease extinguishment prepayment
-29.1
Dividend paid
-143.0
-97.7
-199.7
Capital increase¹⁾
21.4
0.2
2.3
Transaction costs share issue
-0.1
-0.1
Transactions with non-controlling interests
-3.7
-3.8
Net cash flow from financing activities
-21.6
-205.0
-460.1
Net cash flow from operating, investing and financing
activities
207.6
87.9
-113.8
Cash and cash equivalents beginning balance
158.1
271.9
271.9
Cash and cash equivalents ending balance
365.7
359.8
158.1
Restricted cash equivalents ending balance
2.5
10.0
5.4
Cash and cash equivalents including restricted cash
ending balance
368.2
369.8
163.5
1) In 2025, share capital was increased by USD 19.3m, including an USD 17.0m non-cash share issue in relation to the
purchase of one vessel. No such non-cash transactions in the first six months of 2025 and first six months of 2026.
TORM INTERIM RESULTS FOR THE SECOND QUARTER OF 2026
18
Segment Reporting – Condensed Consolidated Income Statement
Q2 2026
Q2 2025
USDm
Tanker
segment
Marine
Engineering 
segment
Inter-
segment
elimination
Total
Tanker
segment
Marine
Engineering
segment
Inter-
segment
elimination
Total
Revenue
658.8
6.9
-2.9
662.8
311.2
8.9
-4.9
315.2
Port expenses, bunkers and commissions
-146.8
-146.8
-103.0
-103.0
Other cost of goods and services sold
-4.9
1.7
-3.2
-5.2
3.3
-1.9
Operating expenses
-72.9
0.3
-72.6
-64.7
0.4
-64.3
Profit from sale of vessels
4.9
0.5
5.4
Administrative expenses
-22.2
-2.0
-24.2
-22.3
-2.2
-24.5
Other operating income and expenses
-0.5
0.1
-0.4
-0.1
-0.1
Depreciation and amortization
-60.2
-0.3
-60.5
-51.9
-0.3
-52.2
Operating profit (EBIT)
356.2
-0.2
-0.9
355.1
74.1
1.2
-0.7
74.6
Financial income
2.3
2.3
3.6
3.6
Financial expenses
-18.2
-0.1
-18.3
-17.8
-17.8
Profit before tax
340.3
-0.3
-0.9
339.1
59.9
1.2
-0.7
60.4
Tax
-0.9
0.1
-0.8
-1.6
-0.1
-1.7
Net profit for the period
339.4
-0.2
-0.9
338.3
58.3
1.1
-0.7
58.7
TORM INTERIM RESULTS FOR THE SECOND QUARTER OF 2026
19
Segment Reporting – Condensed Consolidated Income Statement
Q1-Q2 2026
Q1-Q2 2025
FY 2025
USDm
Tanker
segment
Marine
Engineering 
segment
Inter-
segment
elimination
Total
Tanker
segment
Marine
Engineering
segment
Inter-
segment
elimination
Total
Tanker
segment
Marine
Engineering
segment
Inter-
segment
elimination
Total
Revenue
1,054.6
15.0
-4.8
1,064.8
624.5
28.5
-8.7
644.3
1,314.2
37.2
-11.9
1,339.5
Port expenses, bunkers and
commissions
-256.5
-256.5
-202.3
-202.3
-404.5
-404.5
Other cost of goods and services sold
-10.8
2.8
-8.0
-18.7
5.7
-13.0
-24.6
7.5
-17.1
Operating expenses
-140.7
0.4
-140.3
-131.2
0.5
-130.7
-253.1
0.7
-252.4
Profit from sale of vessels
4.0
4.0
14.0
0.9
14.9
17.8
1.2
19.0
Administrative expenses
-43.3
-3.9
-47.2
-46.4
-4.1
-50.5
-106.5
-7.3
-113.8
Other operating income and expenses
-0.5
0.2
-0.3
-0.3
-0.3
0.1
0.1
Depreciation and amortization
-119.2
-0.9
-120.1
-104.9
-0.5
-105.4
-213.5
-1.0
-214.5
Operating profit (EBIT)
498.4
-0.4
-1.6
496.4
153.4
5.2
-1.6
157.0
354.4
4.4
-2.5
356.3
Financial income
3.9
3.9
7.4
0.1
7.5
13.1
0.2
13.3
Financial expenses
-37.1
-0.1
-37.2
-35.6
-0.1
-35.7
-74.2
-0.2
-74.4
Profit before tax
465.2
-0.5
-1.6
463.1
125.2
5.2
-1.6
128.8
293.3
4.4
-2.5
295.2
Tax
-2.6
0.2
-2.4
-6.5
-0.7
-7.2
-8.5
-0.7
-9.2
Net profit for the period
462.6
-0.3
-1.6
460.7
118.7
4.5
-1.6
121.6
284.8
3.7
-2.5
286.0
TORM INTERIM RESULTS FOR THE SECOND QUARTER OF 2026
20
Segment Reporting – Condensed Consolidated Balance Sheet
30 June 2026
30 June 2025
31 December 2025
USDm
Tanker
segment
Marine
Engineering 
segment
Inter-
segment
elimination
Total
Tanker
segment
Marine
Engineering 
segment
Inter-
segment
elimination
Total
Tanker
segment
Marine
Engineering 
segment
Inter-
segment
elimination
Total
ASSETS
Intangible assets
Goodwill
1.9
1.9
1.8
1.8
1.8
1.8
Other intangible assets
1.8
2.4
4.2
1.4
0.9
2.3
1.6
2.4
4.0
Total intangible assets
1.8
4.3
6.1
1.4
2.7
4.1
1.6
4.2
5.8
Tangible fixed assets
Land and buildings
6.5
1.8
8.3
8.1
0.2
8.3
7.7
2.0
9.7
Vessels and capitalized dry-docking
2,934.6
-15.8
2,918.8
2,706.3
-14.6
2,691.7
2,806.8
-14.6
2,792.2
Prepayments on vessels
29.3
29.3
14.1
14.1
Other non-current assets under
construction
4.5
4.5
2.2
2.2
3.4
3.4
Other plant and operating equipment
1.1
0.8
1.9
1.4
1.2
2.6
1.4
1.1
2.5
Total tangible fixed assets
2,971.5
7.1
-15.8
2,962.8
2,715.8
3.6
-14.6
2,704.8
2,830.0
6.5
-14.6
2,821.9
Financial assets
Investments in joint ventures
0.1
0.1
Loan receivables
4.4
4.4
4.5
4.5
4.4
4.4
Deferred tax asset
0.3
0.3
0.3
0.3
0.3
0.3
Other investments
3.0
3.0
0.1
0.1
2.7
2.7
Total financial assets
7.7
7.7
5.0
5.0
7.4
7.4
Total non-current assets
2,981.0
11.4
-15.8
2,976.6
2,722.2
6.3
-14.6
2,713.9
2,839.0
10.7
-14.6
2,835.1
Inventories
108.6
3.2
111.8
66.9
2.6
69.5
63.8
2.7
66.5
Trade receivables
315.7
6.8
-0.1
322.4
166.6
4.6
-0.3
170.9
209.8
4.9
214.7
Other receivables
19.8
8.3
28.1
26.0
4.9
30.9
16.9
6.8
23.7
Prepayments
14.9
1.2
16.1
10.3
0.3
10.6
38.4
0.7
39.1
Cash and cash equivalents incl.
restricted cash
361.8
6.4
368.2
361.5
8.3
369.8
155.6
7.9
163.5
Current assets excl. assets held for sale
820.8
25.9
-0.1
846.6
631.3
20.7
-0.3
651.7
484.5
23.0
507.5
Assets held for sale
31.4
-0.3
31.1
24.4
24.4
Total current assets
820.8
25.9
-0.1
846.6
662.7
20.7
-0.6
682.8
508.9
23.0
531.9
TOTAL ASSETS
3,801.8
37.3
-15.9
3,823.2
3,384.9
27.0
-15.2
3,396.7
3,347.9
33.7
-14.6
3,367.0
TORM INTERIM RESULTS FOR THE SECOND QUARTER OF 2026
21
Segment Reporting – Condensed Consolidated Balance Sheet
30 June 2026
30 June 2025
31 December 2025
USDm
Tanker
segment
Marine
Engineering 
segment
Inter-
segment
elimination
Total
Tanker
segment
Marine
Engineering 
segment
Inter-
segment
elimination
Total
Tanker
segment
Marine
Engineering 
segment
Inter-
segment
elimination
Total
EQUITY AND LIABILITIES
Total equity
2,546.2
18.0
-13.9
2,550.3
2,102.9
15.8
-11.4
2,107.3
2,196.5
18.4
-12.3
2,202.6
Liabilities
Non-current tax liability related to held-
over gains
45.2
45.2
45.2
45.2
45.2
45.2
Deferred tax liability
1.8
0.2
2.0
0.3
0.3
0.2
0.2
Borrowings
837.7
1.5
839.2
969.1
0.7
969.8
712.8
1.5
714.3
Other non-current liabilities
13.3
0.5
13.8
7.4
0.6
8.0
2.7
0.6
3.3
Total non-current liabilities
898.0
2.2
900.2
1,021.7
1.6
1,023.3
760.7
2.3
763.0
Borrowings
233.1
3.9
237.0
154.3
1.9
156.2
285.2
3.6
288.8
Trade payables
78.2
3.6
81.8
43.4
1.8
45.2
38.8
2.2
41.0
Current tax liabilities
0.1
0.1
1.1
0.2
1.3
0.1
0.2
0.3
Other liabilities
46.2
0.7
-0.1
46.8
56.7
0.7
-0.3
57.1
66.6
1.7
68.3
Provisions
0.4
0.4
0.7
0.7
0.7
0.7
Prepayments from customers
8.5
-1.9
6.6
4.8
4.3
-3.5
5.6
4.6
-2.3
2.3
Total current liabilities
357.6
17.1
-2.0
372.7
260.3
9.6
-3.8
266.1
390.7
13.0
-2.3
401.4
Total liabilities
1,255.6
19.3
-2.0
1,272.9
1,282.0
11.2
-3.8
1,289.4
1,151.4
15.3
-2.3
1,164.4
TOTAL EQUITY AND LIABILITIES
3,801.8
37.3
-15.9
3,823.2
3,384.9
27.0
-15.2
3,396.7
3,347.9
33.7
-14.6
3,367.0
TORM INTERIM RESULTS FOR THE SECOND QUARTER OF 2026
22
Image_12 orange line.jpg
NOTE 1 - ACCOUNTING POLICIES AND GOING CONCERN
General Information
The information for the year ended 31 December 2025 does not constitute statutory accounts as
defined in section 434 of the Companies Act 2006. A copy of the statutory accounts for that year has
been delivered to the Registrar of Companies. The Auditor's Report on those accounts was not
qualified, did not include a reference to any matters to which the auditors drew attention by way of
emphasis without qualifying the report and did not contain statements under section 498(2) or (3) of
the Companies Act 2006.
The interim report for the second quarter and six months ended 30 June 2026 is unaudited.
Significant Accounting Policies
The interim report for the period 01 January-30 June 2026 is presented in accordance with IAS 34
"Interim Financial Reporting" (“IAS 34”) as adopted in the UK. The interim financial statements are also
prepared in accordance with IAS 34 as issued by the International Accounting Standards Board
(“IASB”) and IAS 34 as adopted by the EU, as applied to financial periods beginning on or after 01
January 2026 and the additional Danish disclosure requirements for interim reports of listed
companies.
TORM has implemented the following standards and amendments issued by the IASB and adopted by
the UK and the EU in the consolidated financial statements for 2026:
Annual Improvements to IFRS Accounting Standards - Volume 11 (January 2026)
Amendments to IFRS 9 and IFRS 7: Amendments to the Classification and Measurement of
Financial Instruments (January 2026)
Amendments to IFRS 9 and IFRS 7: Contracts Referencing Nature dependent Electricity (January
2026)
For the new standards and amendments, it is assessed that application of these effective on 01
January 2026 has not had any material impact on the consolidated financial statements in 2026. The
interim report has been prepared using the same accounting policies and methods of computation as in
the Annual Report 2025.
For critical estimates and judgements, please refer to the Annual Report 2025, page 162.
Image_12 orange line.jpg
NOTE 1 - continued
Going Concern
As of 30 June 2026, TORM’s available liquidity including undrawn and committed facilities was
USD 804.1m, including a total cash position of USD 368.2m (including restricted cash of USD 2.5m).
TORM’s net interest-bearing debt was USD 715.0m, and the net loan-to-value ratio was 22.4% (Tanker
segment only). Further information on TORM’s objectives and policies for managing our capital, our
financial risk management objectives, and our exposure to credit and liquidity risk can be found in Note
24 to the financial statements in the 2025 Annual Report.
TORM monitors our funding position throughout the year to ensure that we have access to sufficient
funds to meet the forecasted cash requirements and loan commitments, and to monitor compliance
with the financial covenants in our loan facilities, details of which are available in Note 2 to the financial
statements in the 2025 Annual Report.
A key element for TORM’s financial performance in the going concern period relates to the increased
geopolitical risks and trade disputes. TORM’s base case assumes that these dynamics will persist.
TORM monitors the general development in the geopolitical situation and potential effects on the
product tanker market. In the base case, TORM has sufficient liquidity and headroom for all the
covenant limits. The principal risks and uncertainties facing TORM are set out on pages 14 to 17 in the
2025 Annual Report. In addition to the base case, TORM has developed a reverse stress case. The
reverse stress case covers the lowest TCE rate that only just meet the minimum liquidity covenant and
the lowest vessel values that do not breach any of the facilities’ minimum-security values in the period.
In the reverse stress case, with TCE rates are significantly below the lowest rolling four-quarter average
observed since 2000 on each vessel class basis accompanied by a corresponding decline in vessel
values, TORM maintains sufficient headroom on liquidity and covenants throughout the going concern
period.
The Board of Directors has considered TORM’s cash flow forecasts and the expected compliance with
TORM’s financial covenants for the period until 30 September 2027. Based on this review, the Board of
Directors has a reasonable expectation that, taking reasonably possible changes in trading
performance and vessel valuations into account, TORM will be able to continue in operation and comply
with our financial covenants for the period until 30 September 2027. Accordingly, TORM continues to
adopt the going concern basis in preparing our financial statements.
TORM INTERIM RESULTS FOR THE SECOND QUARTER OF 2026
23
Image_12 orange line.jpg
NOTE 2 - STAFF COSTS
Staff costs included in operating expenses relate to the 106 seafarers employed under Danish
contracts (30 June 2025: 107, 31 December 2025: 105).
The average number of employees is calculated as a full-time equivalent (FTE).
USDm
Q2 2026
Q2 2025
Q1-Q2
2026
Q1-Q2
2025
FY 2025
Included in operating expenses
2.6
2.5
5.2
4.9
9.9
Included in administrative expenses
19.0
19.6
36.6
40.4
87.4
Total staff costs
21.6
22.1
41.8
45.3
97.3
As at 30 June 2026 TORM has a pool of 3,891 (30 June 2025: 3,798, 31 December 2025: 3,804)
seafarers.
The majority of seafarers on vessels are on short-term contracts. The average number of seafarers on
board vessels on short-term contracts for the first six months of 2026 were on average 1,802 (30 June
2025: 1,780, 31 December 2025:1,753).
Total seafarers costs for the first six months of 2026 were USD 80.8m (30 June 2025: USD 75.3m, 31
December 2025: USD 148.7m) which are included in "Operating expenses" of which USD 75.7m (30
June 2025 :USD 70.4m, 31 December 2025: USD 138.8m) pertains to cost for seafarers on board
vessels on short-term contracts and USD 5.2m (30 June 2025: USD 4.9m, 31 December 2025: USD
9.9m) pertains to cost for seafarers employed under the Danish contract as indicated in the staff costs
table above.
Total compensation to the Board of Directors and the Senior Management Team, including the CEO,
expensed during the period amounts to USD 7.7m (30 June 2025: USD 9.2m, 31 December 2025: USD
20.7m).
As announced on 26 February 2026, the Board of Directors agreed to grant a total of 1,356,087 (2025:
1,326,087) RSUs to certain employees. The vesting period of the program is three years. The exercise
price is set at DKK 167.1 (2025: DKK 162.4). The exercise price is adjusted in the future by dividend
payments. The exercise period is 360 days from each vesting date. The fair value of the RSUs granted
was determined using the Black-Scholes model and amounts to USD 9.0m (30 June 2025: 3.3m). The
average remaining contractual life for the restricted shares as of 30 June 2026 is 1.5 years (30 June
2025: 1.5 years, 31 December 2025: 1.5 years).
In addition to the RSUs granted to certain employees, the CEO was granted 255,200 (2025: 255,200)
restricted stock options on similar terms as outlined above. The fair value of the CEO's options was
determined using the Black-Scholes model and amounts to USD 1.9m (30 June 2025: USD 0.7m).
Image_12 orange line.jpg
NOTE 3 - VESSELS AND CAPITALIZED DRY-DOCKING
30 June
30 June
31 December
USDm
2026
2025
2025
Cost
Balance as of beginning of period
3,551.1
3,500.9
3,500.9
Additions
190.9
58.6
298.4
Disposals
-5.3
-22.1
-29.7
Transferred from prepayments
53.1
3.4
Transferred to assets held for sale
-160.4
-221.9
Balance
3,789.8
3,377.0
3,551.1
Depreciation
Balance as of beginning of period
748.3
660.6
660.6
Disposals
-5.3
-22.0
-29.7
Depreciation for the period
117.4
102.6
209.1
Transferred to assets held for sale
-67.3
-91.7
Balance
860.4
673.9
748.3
Impairment
Balance as of beginning of period
10.6
13.6
13.6
Transferred to assets held for sale
-2.2
-3.0
Balance
10.6
11.4
10.6
Carrying amount
2,918.8
2,691.7
2,792.2
Included in the carrying amount for "Vessels and capitalized dry-docking" are capitalized dry-docking
costs in the amount of USD 127.6m (30 June 2025: USD 121.9m, 31 December 2025: USD 132.8m).
Depreciation for the six months ended 30 June 2026 related to "Other plant and operating equipment"
amounts to USD 0.9m (30 June 2025: USD 0.5m, 31 December 2025: USD 1.1m) and related to “Land
and buildings” amounts to USD 1.4m (30 June 2025: USD 1.4m, 31 December 2025: USD 2.8m).
Impairment Assessment
For determination of the vessel values, TORM has carried out an impairment indicator assessment and
has found no indication of impairment, and therefore, TORM does not find any need to reassess the
recoverable amount as of 30 June 2026.
TORM INTERIM RESULTS FOR THE SECOND QUARTER OF 2026
24
Image_12 orange line.jpg
NOTE 3 - continued
Non-current Assets Sold During the Period
30 June
30 June
31 December
USDm
2026
2025
2025
Assets held for sale
Number of vessels held for sale end of period
2
1
Carrying amount
31.1
24.4
Sold and delivered during the year
Number of vessels
4
7
Vessel sales price (CF)
78.5
128.2
Carrying amount of vessels and capitalized dry-
docking
-59.8
-102.8
Bunker and lube oil cost
-2.2
-3.6
Transaction costs (CF)
-1.6
-2.8
Profit on sale
14.9
19.0
Sold last year and delivered during the year
Number of vessels
1
Vessel sales price (CF)
30.1
Carrying amount of assets held for sale
-24.4
Bunker and lube oil cost
-0.9
Transaction costs (CF)
-0.8
Profit on sale
4.0
CF: Included in Sale of tangible fixed assets in Consolidated Cash Flow Statement 
Image_12 orange line.jpg
NOTE 4 - PREPAYMENTS ON VESSELS
30 June
30 June
31 December
USDm
2026
2025
2025
Balance as of beginning of period
14.1
Additions
68.3
17.5
Transferred to vessels
-53.1
-3.4
Carrying amount
29.3
14.1
Image_12 orange line.jpg
NOTE 5 - BORROWINGS
30 June
30 June
31 December
USDm
2026
2025
2025
Falling due within one year
236.8
156.6
288.9
Falling due between one and two years
130.6
148.8
97.1
Falling due between two and three years
324.4
119.6
92.3
Falling due between three and four years
190.0
326.6
383.6
Falling due between four and five years
171.9
240.3
78.5
Falling due after five years
24.6
140.1
65.2
Total
1,078.3
1,132.0
1,005.6
Borrowing costs
-11.4
-15.3
-13.2
Right-of-use lease liabilities
9.3
9.3
10.7
Total borrowings
1,076.2
1,126.0
1,003.1
As of 30 June 2026, TORM was in compliance with financial covenants. TORM expects to remain in compliance with
financial covenants in the remaining period of 2026.
TORM INTERIM RESULTS FOR THE SECOND QUARTER OF 2026
25
Image_12 orange line.jpg
NOTE 6 - DERIVATIVE FINANCIAL INSTRUMENTS
30 June
30 June
31 December
USDm
2026
2025
2025
Fair value of derivative financial instruments
regarding freight and bunkers
Forward freight agreements - fair value through
profit and loss
4.6
3.9
2.0
Bunker swaps - fair value through profit and loss
-1.2
-0.1
-0.8
Fair value of derivative financial instruments
regarding interest and currency exchange rate
Forward exchange contracts - hedge accounting
-1.5
3.1
0.9
Interest rate swaps - hedge accounting
11.5
13.8
8.3
Fair value of derivatives
13.4
20.7
10.4
Derivative financial instruments are recognized in the following balance sheet items:
30 June
30 June
31 December
USDm
2026
2025
2025
Other receivables
16.1
21.1
10.9
Other liabilities
-2.7
-0.4
-0.5
Total
13.4
20.7
10.4
The fair value hierarchy for the above derivative financial instruments is Level 2.
There are no changes in the methods and assumptions used in determining the fair value of the
financial instruments. Please refer to the Annual Report 2025, page 194-195.
Image_12 orange line.jpg
NOTE 7 - EARNINGS PER SHARE AND DIVIDEND PER SHARE
Q2 2026
Q2 2025
Q1-Q2
2026
Q1-Q2
2025
FY 2025
Earnings per share
Net profit for the year attributable to TORM plc
shareholders (USDm)
338.3
58.6
460.7
120.9
285.3
Million shares 
Weighted average number of shares
102.2
98.1
101.9
98.0
98.4
Weighted average number of treasury shares
-0.3
-0.4
-0.2
Weighted average number of shares
outstanding
102.2
97.8
101.9
97.6
98.2
Dilutive effect of outstanding share options
2.0
3.0
2.0
3.0
1.9
Weighted average number of shares
outstanding incl. dilutive effect of share options
104.2
100.8
103.9
100.6
100.1
Basic earnings per share (USD)
3.31
0.60
4.52
1.24
2.91
Diluted earnings per share (USD)
3.25
0.58
4.43
1.20
2.85
Q2 2026
Q2 2025
Q1-Q2
2026
Q1-Q2
2025
FY 2025
Dividend per share
Declared dividend per share (USD)
2.40
0.40
3.10
0.80
2.12
Declared dividend during the period (USDm)
245.7
39.2
317.2
78.3
209.9
Dividend paid per share (USD)
0.70
1.00
1.40
1.00
2.02
Dividend paid during the period (USDm)
71.6
97.7
143.0
97.7
199.7
Number of shares
Number of shares, end of period (million)
102.4
98.0
102.4
98.0
101.3
TORM INTERIM RESULTS FOR THE SECOND QUARTER OF 2026
26
Image_12 orange line.jpg
NOTE 8 - CONTINGENT LIABILITIES
TORM is involved in certain legal proceedings and disputes. It is the Management’s opinion that the
outcome of these proceedings and disputes will not have any material impact on TORM’s financial
position, results of operations, and cash flows.
Image_12 orange line.jpg
NOTE 9 - RELATED PARTY TRANSACTIONS
During the first six months ended 30 June 2026, there have been no related party transactions other
than ordinary remuneration to the Board of Directors, the CEO and the Senior Management Team.
Please refer to Note 2.
Following the completion of Hafnia Limited’s purchase of approximately 14.2m TORM plc A-shares in
January 2026, TORM plc does not have an ultimate parent entity.
Image_12 orange line.jpg
NOTE 10 - CONTRACTUAL OBLIGATIONS AND RIGHTS
As of 30 June 2026, TORM had contractual obligations regarding scrubber installations and other minor
commitments.
30 June
30 June
31 December
USDm
2026
2025
2025
Second-hand vessels commitments:
Within one year
90.9
126.0
Between one and two years
129.6
Between two and three years
43.2
Total
263.7
126.0
Committed scrubber installations and other
minor investments
Within one year
6.0
8.5
6.4
Between one and two years
1.5
1.1
Between two and three years
2.0
0.9
Between three and four years
2.0
0.9
Total
7.5
12.5
9.3
Image_12 orange line.jpg
NOTE 10 - continued
As of 30 June 2026, TORM has contractual rights to receive future payments as lessor of vessels on
time charter.
30 June
30 June
31 December
USDm
2026
2025
2025
Charter hire income for vessels - as lessor
Received within one year
73.7
51.1
53.9
Received between one and two years
28.6
25.1
31.2
Received between two and three years
8.7
9.2
Total
111.0
76.2
94.3
The charter hire income for these vessels under time charter is recognized under "Revenue".
Image_12 orange line.jpg
NOTE 11 - SUBSEQUENT EVENTS
TORM’s Board of Directors has declared an interim dividend for the second quarter of 2026 of USD 2.40
per share to be paid to the shareholders corresponding to an expected total dividend payment of
USD 245.7m. The distribution for the quarter is equivalent to 73% of net profit and reflects the
Distribution Policy. The payment date is 24 September 2026 to all shareholders on record as of
10 September 2026, and the ex-dividend date is 09 September 2026 for the shares listed on Nasdaq
OMX Copenhagen and 10 September 2026 for the shares listed on Nasdaq New York. The dividends
have not been recognized as liabilities as at 30 June 2026 and there are no tax consequences.
After the end of the quarter, TORM entered into an agreement to acquire six MR newbuilding vessels,
with options for an additional two vessels. The six vessels are scheduled for delivery in 2029, while the
optional vessels are expected to be delivered in 2030 if exercised.
Also, after the end of the quarter, TORM secured financing for ten vessels for a total of USD 217m.
TORM INTERIM RESULTS FOR THE SECOND QUARTER OF 2026
27
Glossary
Key Financial Figures
TCE per day
=
TCE excluding unrealized gains/losses on derivatives
Available earning days
EBITDA %
=
EBITDA
Revenue
Operating profit %
=
Operating profit (EBIT)
Revenue
Return on Equity (RoE) %
=
Net profit for the year
Average equity
Return on Invested Capital
(RoIC) %
=
Operating profit less tax
Average invested capital
Equity ratio
=
Equity
Total assets
Earnings per share, EPS
=
Net profit for the year
Average number of shares
Diluted earnings per share, EPS (USD)
=
Net profit/(loss) for the year
Average number of shares less average number of treasury shares
TORM INTERIM RESULTS FOR THE SECOND QUARTER OF 2026
28
Glossary
Alternative Performance Measures Group
Throughout the interim report, several alternative performance measures (APMs) are used.
The APMs used are the same as in the Annual Report 2025 and therefore we refer to the principles for
these on pages 278-282 in the TORM plc Annual Report 2025. The following APMs relate to the Group.
Net profit excluding non-recurring items: Net profit excluding non-recurring items is net profit less
non-recurring items, e.g. impairment and reversals of impairment on vessels, profit from sale of vessels,
claims provisions, impacts from refinancing as well as termination of leaseback arrangements. TORM
reports net profit excluding non-recurring items because we believe it provides additional meaningful
information to investors regarding the operational performance excluding non-recurring fluctuations.
USDm
Q2 2026
Q2 2025
Q1-Q2
2026
Q1-Q2
2025
FY 2025
Reconciliation to net profit
Net profit for the period
338.3
58.7
460.7
121.6
286.0
Profit from sale of vessels
-5.4
-4.0
-14.9
-19.0
Expense of capitalized bank fees at refinancing
0.4
1.8
6.8
Termination of leaseback arrangement
0.9
2.2
0.2
Net profit excluding non-recurring items
339.6
53.3
460.7
106.7
274.0
Return on Invested Capital (ROIC): TORM defines ROIC as earnings before interest and tax (EBIT) less
tax, divided by the average invested capital for the period. Invested capital is defined on page 30.
ROIC expresses the returns generated on capital invested in TORM. The progression of ROIC is used by
TORM to measure progress against our longer-term value creation goals outlined to investors. ROIC is
calculated as follows:
USDm
Q2 2026
Q2 2025
Q1-Q2
2026
Q1-Q2
2025
FY 2025
Reconciliation to operating profit (EBIT)
Operating profit (EBIT)
355.1
74.6
496.4
157.0
356.3
Tax
-0.8
-1.7
-2.4
-7.2
-9.2
EBIT less Tax
354.3
72.9
494.0
149.8
347.1
EBIT less Tax - Full year equivalent
1,417.2
291.6
988.0
299.6
347.1
Invested capital, opening balance
3,154.0
2,957.7
3,037.8
3,005.4
3,005.4
Invested capital, ending balance
3,253.9
2,859.0
3,253.9
2,859.0
3,037.8
Average invested capital
3,204.0
2,908.4
3,145.9
2,932.2
3,021.6
Return on Invested Capital (ROIC)
44.2%
10.0%
31.4%
10.2%
11.5%
TORM INTERIM RESULTS FOR THE SECOND QUARTER OF 2026
29
Glossary
Alternative Performance Measures Group
Adjusted Return on Invested Capital (Adjusted ROIC): TORM defines adjusted ROIC as earnings before
interest and tax (EBIT) less tax and non-recurrent items, divided by the average invested capital less
average impairment for the period. Invested capital is defined on page 30.
The Adjusted ROIC expresses the returns generated on capital invested in TORM adjusted for impacts
related to non-recurring items. The progression of ROIC is used by TORM to measure progress against
our longer-term value creation goals outlined to investors. Adjusted ROIC is calculated as follows:
USDm
Q2 2026
Q2 2025
Q1-Q2
2026
Q1-Q2
2025
FY 2025
Reconciliation to operating profit (EBIT)
Operating profit (EBIT)
355.1
74.6
496.4
157.0
356.3
Tax
-0.8
-1.7
-2.4
-7.2
-9.2
EBIT less Tax
354.3
72.9
494.0
149.8
347.1
EBIT less Tax - Full year equivalent
1,417.2
291.6
988.0
299.6
347.1
Profit from sale of vessels
-5.4
-4.0
-14.9
-19.0
EBIT less tax adjusted
1,417.2
286.2
984.0
284.7
328.1
Average invested capital ¹⁾
3,204.0
2,908.4
3,145.9
2,932.2
3,021.6
Average impairment ²⁾
22.0
23.2
22.0
23.9
23.5
Average invested capital adjusted for
impairment
3,226.0
2,931.6
3,167.9
2,956.1
3,045.1
Adjusted ROIC
43.9%
9.8%
31.1%
9.6%
10.8%
¹⁾ Average invested capital is calculated as the average of the opening and closing balance of invested capital.
²⁾ Average impairment is calculated as the average of the opening and closing balances of impairment charges on
vessels and goodwill in the balance sheet.
EBITDA and Adjusted EBITDA: TORM defines EBITDA as earnings before financial income and
expenses, depreciation, impairment, amortization and taxes.
EBITDA is used as a supplemental financial measure by Management and external users of financial
statements, such as lenders, to assess TORM's operating performance as well as compliance with the
financial covenants and restrictions contained in TORM's financing agreements. TORM believes that
EBITDA assists Management and investors in evaluating TORM’s operating performance by increasing
comparability of TORM's performance from period to period. This increased comparability is achieved
by excluding the potentially disparate effects of interest, depreciation, impairment, amortization, and
taxes. These are items which could be affected by various changing financing methods and capital
structures, which may significantly affect profit/(loss) between periods. Including EBITDA as a measure
benefits investor in selection between investment alternatives.
EBITDA excludes some, but not all, items that affect profit/ (loss), and these items may vary among
other companies and may therefore not be directly comparable. The following table reconciles EBITDA
to net profit/ (loss), the most directly comparable IFRS financial measure, for the periods presented.
Due to the temporary fluctuations of the fair value of freight and bunker derivatives, Management
believes that an adjustment for unrealized gain/losses on freight and bunker derivatives help to
increase comparability in EBITDA developments. The adjusted EBITDA is calculated as follows:
USDm
Q2 2026
Q2 2025
Q1-Q2
2026
Q1-Q2
2025
FY 2025
Reconciliation to net profit
Net profit for the period
338.3
58.7
460.7
121.6
286.0
Tax
0.8
1.7
2.4
7.2
9.2
Financial expenses
18.3
17.8
37.2
35.7
74.4
Financial income
-2.3
-3.6
-3.9
-7.5
-13.3
Depreciation and amortization
60.5
52.2
120.1
105.4
214.5
EBITDA
415.6
126.8
616.5
262.4
570.8
Reconciliation to EBITDA
EBITDA
415.6
126.8
616.5
262.4
570.8
Fair value adjustments on freight and bunker
derivatives
-6.8
2.2
-2.0
4.3
6.7
Adjusted EBITDA
408.8
129.0
614.5
266.7
577.5
TORM INTERIM RESULTS FOR THE SECOND QUARTER OF 2026
30
Glossary
Alternative Performance Measures Group
Invested capital: TORM defines invested capital as the sum of intangible assets, tangible fixed assets,
investments in joint ventures, deferred tax assets, other investments, bunkers, accounts receivables,
assets held for sale (when applicable), non-current tax liability related to held over gains, deferred tax
liabilities, trade payables, current tax liabilities, dividend payable, provisions and deferred income.
Invested capital measures the net investment used to achieve our operating profit. TORM believes that
invested capital is a relevant measure which Management uses to measure the overall development of
the assets and liabilities generating our net profit. Such measure may not be comparable to similarly
titled measures of other companies. Invested capital is calculated as follows:
30 June
30 June
31 December
USDm
2026
2025
2025
Tangible and intangible fixed assets
2,968.9
2,708.9
2,827.7
Investments in joint ventures
0.1
Deferred tax asset
0.3
0.3
0.3
Other investments
3.0
0.1
2.7
Inventories
111.8
69.5
66.5
Accounts receivables ¹⁾
366.6
212.4
277.5
Assets held for sale
31.1
24.4
Non-current tax liability related to held over gains
-45.2
-45.2
-45.2
Deferred tax liability
-2.0
-0.3
-0.2
Trade payables ²⁾
-142.4
-110.3
-112.6
Current tax liabilities
-0.1
-1.3
-0.3
Provisions
-0.4
-0.7
-0.7
Prepayments from customers
-6.6
-5.6
-2.3
Invested capital
3,253.9
2,859.0
3,037.8
¹⁾ Accounts receivables includes Trade receivables, Other receivables and Prepayments.
²⁾ Trade payables includes Trade payables, Other non-current liabilities and Other liabilities.
Net interest-bearing debt: Net interest-bearing debt is defined as mortgage debt and bank loans
(current and non-current), lease liabilities less cash equivalents and interest-bearing loan receivables.
Net interest-bearing debt depicts the net capital resources, which cause net interest expenditure and
interest rate risk and which, together with equity, are used to finance our investments. As such, TORM
believes that net interest-bearing debt is a relevant measure, which Management uses to measure the
overall development of our use of financing, other than equity. Such measure may not be comparable
to similarly titled measures of other companies. Net interest-bearing debt is calculated as follows:
30 June
30 June
31 December
USDm
2026
2025
2025
Borrowings¹⁾
1,087.6
1,141.3
1,016.3
Loan receivables
-4.4
-4.5
-4.4
Cash and cash equivalents, including restricted
cash
-368.2
-369.8
-163.5
Net interest-bearing debt
715.0
767.0
848.4
¹⁾ Borrowings include long-term and short-term borrowings, excluding capitalized loan costs. Please refer to Note 5 for
information on capitalized loan costs.
TORM INTERIM RESULTS FOR THE SECOND QUARTER OF 2026
31
Glossary
Alternative Performance Measures Group
Liquidity: TORM defines liquidity as available cash, comprising cash and cash equivalents, including
restricted cash, as well as undrawn and committed credit facilities. TORM finds the APM important as
the liquidity expresses TORM’s financial position, ability to meet current liabilities and cash buffer.
Further, it expresses TORM’s ability to act and invest when new possibilities occur.
30 June
30 June
31 December
USDm
2026
2025
2025
Cash and cash equivalents, including restricted
cash
368.2
369.8
163.5
Undrawn credit facilities and committed facilities
435.9
294.3
398.8
Liquidity
804.1
664.1
562.3
Restricted cash 30 June 2026 amounts to USD 2.5m (30 June 2025: USD 10.0m, 31 December 2025:
USD 5.4m).
Free cash flow: TORM defines free cash flow as net cash flow from operating activities less the net
cash flow from investing activities. TORM finds the APM important as free cash flow reflects our ability
to generate cash, repay liabilities and pay dividends.
USDm
Q2 2026
Q2 2025
Q1-Q2
2026
Q1-Q2
2025
FY 2025
Net cash flow from operating activities
319.5
161.4
455.4
244.4
498.9
Net cash flow from investing activities
-73.6
5.1
-226.2
48.5
-152.6
Free cash flow
245.9
166.5
229.2
292.9
346.3
Net Asset Value per share (NAV/share): TORM believes that the NAV/share is a relevant measure
which Management uses to measure the overall development of the assets and liabilities per share.
Such measure may not be comparable to similarly titled measures of other companies. NAV/share is
calculated using broker values of vessels and excluding charter commitments. NAV/share is calculated
as follows:
30 June
30 June
31 December
USDm
2026
2025
2025
Total vessel values (broker values)
4,055.5
2,887.6
3,177.5
Vessel values of purchased secondhand vessels
not delivered (broker values)
313.5
150.6
Committed investment capital expenditure
7.5
12.5
9.3
Committed liability capital expenditure
-271.2
-12.5
-135.3
Goodwill
1.9
1.8
1.8
Other intangible assets
4.2
2.3
4.0
Land and buildings
8.3
8.3
9.7
Other plant and operating equipment
1.9
2.6
2.5
Investments in joint ventures
0.1
Loan receivables
4.4
4.5
4.4
Deferred tax asset
0.3
0.3
0.3
Other investments
3.0
0.1
2.7
Inventories
111.8
69.5
66.5
Accounts receivables ¹⁾
366.6
212.4
277.5
Cash and cash equivalents incl. restricted cash
368.2
369.8
163.5
Deferred tax liability
-2.0
-0.3
-0.2
Borrowings ²⁾
-1,087.6
-1,141.3
-1,016.3
Trade payables ³⁾
-142.4
-110.3
-112.6
Current tax liabilities
-0.1
-1.3
-0.3
Provisions
-0.4
-0.7
-0.7
Prepayments from customers
-6.6
-5.6
-2.3
Total Net Asset Value (NAV)
3,736.8
2,299.8
2,602.6
Total number of shares, end of period excluding
treasury shares (million)
102.4
98.0
101.3
Total Net Asset Value per share (NAV/share)
36.5
23.5
25.7
¹⁾ Accounts receivables includes Trade receivables, Other receivables and Prepayments.
²⁾ Borrowings include  long-term and short-term borrowings, excluding capitalized loan costs. Please refer to Note 5 for
information on capitalized loan costs.
³⁾ Trade payables includes Trade payables, Other non-current liabilities and Other liabilities.
TORM INTERIM RESULTS FOR THE SECOND QUARTER OF 2026
32
Glossary
Alternative Performance Measures Tanker segment
Throughout the interim report, several alternative performance measures (APMs) are used. The APMs
used are the same as in the Annual Report 2025 and therefore we refer to the principles for these on
pages 225-229 in the TORM plc Annual Report 2025. After the acquisition of Marine Exhaust
Technology A/S on 01 September 2022, the following APMs relate to the primary segment, the Tanker
segment.
Time Charter Equivalent (TCE) earnings: TORM defines TCE earnings, a performance measure, as
revenue less port expenses, bunkers and commissions incl. freight and bunker derivatives. TORM
reports TCE earnings because we believe it provides additional meaningful information to investors in
relation to revenue, the most directly comparable IFRS measure. TCE earnings is a standard shipping
industry performance measure used primarily to compare period-to-period changes in a shipping
company’s performance irrespective of changes in the mix of charter types (i.e., spot charters, time
charters and bareboat charters) under which the vessels may be employed between the periods.
Due to the temporary fluctuations of the fair value of freight and bunker derivatives, TORM believes
that an adjustment for unrealized gain/losses on freight and bunker derivatives helps to increase
comparability in TCE earning developments. Further, to be able to reconcile the TCE earnings to the
TCE/day measure, adjusted TCE earnings are presented net of the fair value adjustments on freight
and bunker derivatives. The TCE/day measure is calculated as the adjusted TCE earnings divided by
available earning days. TCE earnings and adjusted TCE earnings are presented below:
USDm
Q2 2026
Q2 2025
Q1-Q2
2026
Q1-Q2
2025
FY 2025
Reconciliation to revenue
Revenue
658.8
311.2
1,054.6
624.5
1,314.2
Port expenses, bunkers and commissions
-146.8
-103.0
-256.5
-202.3
-404.5
TCE earnings
512.0
208.2
798.1
422.2
909.7
Reconciliation to TCE earnings
TCE earnings
512.0
208.2
798.1
422.2
909.7
Fair value adjustments on freight and bunker
derivatives
-6.8
2.2
-2.0
4.3
6.7
Adjusted TCE earnings
505.2
210.4
796.1
426.5
916.4
Available earning days
8,519
7,888
16,844
15,949
31,840
TCE per earning day (USD)
59,301
26,672
47,259
26,740
28,783
Net Loan-to-value (LTV): TORM defines Loan-to-value (LTV) ratio as vessel values divided by net
borrowings of the vessels.
LTV describes the net debt ratio of the vessels and is used by TORM to describe the financial situation
and the liquidity risk as well as to express the future possibilities to raise new capital by new loan
facilities.
30 June
30 June
31 December
USDm
2026
2025
2025
Vessel values (broker values)
4,055.5
2,887.6
3,177.5
Vessel values of purchased secondhand vessel
not delivered (broker values)
313.5
150.6
Other committed investment CAPEX
7.5
12.5
9.3
Total vessel values
4,376.5
2,900.1
3,337.4
Borrowings ¹⁾
1,082.2
1,138.7
1,011.3
- Debt regarding Land and buildings & Other
plant and operating equipment
-7.3
-8.9
-8.8
Committed liability capital expenditure
271.2
12.5
135.3
Loan receivable
-4.4
-4.5
-4.4
Cash and cash equivalents, including restricted
cash
-361.8
-361.5
-155.6
Total (loan)
979.9
776.3
977.8
Net Loan-to-value (LTV) ratio
22.4%
26.8%
29.3%
¹⁾ Borrowings include long-term and short-term borrowings, excluding capitalized loan costs. Please refer to Note 5 for
information on capitalized loan costs.