
Q3’25 Earnings October 28, 2025
2 Forward-looking statements and non-GAAP financial measures This presentation contains certain forward-looking statements relating to future events and expectations, including our expectations regarding our estimates and projections for our business outlook for the 2025 fiscal year, each of which is based on current expectations, estimates, and projections about our industry, management’s beliefs, and certain assumptions made by management based on information currently available to management at the time they are made. The forward-looking statements are made pursuant to the safe harbor provisions of the U.S. Private Securities Litigation Reform Act of 1995 and relate to the Company’s performance on a going forward basis. Readers are cautioned that these forward-looking statements are only predictions and may differ materially from actual results, performance, and/or trends. In addition to general industry and global economic conditions, factors that could cause actual results, performance, and/or trends to differ materially from those discussed in the forward-looking statements made in this presentation include, but are not limited to: (1) the emerging nature distributed energy generation and hydrogen markets and rapidly evolving market trends; (2) the significant upfront costs of Bloom’s Energy Servers and Bloom’s ability to secure financing for its products; (3) Bloom’s ability to drive cost reductions and to successfully mitigate against potential price increases; (4) Bloom’s ability to service its existing debt obligations; (5) Bloom’s ability to be successful in new markets; (6) the ability of the Bloom Energy Server to operate on a fuel source customers want; (7) the success of the strategic partnership with SK ecoplant in the United States and international markets; (8) timing and development of an ecosystem for the hydrogen market, including in the South Korean market; (9) continued incentives in the South Korean market; (10) adapting to the new government bidding process in the South Korean market; (11) the timing and pace of adoption of hydrogen for stationary power; (12) the risk of manufacturing defects; (13) the accuracy of Bloom’s estimates regarding the useful life of its Energy Servers, includ ing inventories with distributors; (14) delays in the development and introduction of new products or updates to existing products; (15) Bloom’s ability to secure partners in order to commercialize its electrolyzer and carbon capture products; (16) supply constraints; (17) the availability of rebates, tax credits and other tax benefits; (18) the impact of the Inflation Reduction Act of 2022 and the One Big Beautiful Bill Act; (19) changes in the regulatory landscape; (20) Bloom’s reliance upon a limited number of customers; (21) Bloom’s lengthy sales and installation cycle, construction, utility interconnection and other delays related to the installation of its Energy Servers; (22) business and economic conditions and growth trends in commercial and industrial energy markets; (23) trade policies including tariffs; (24) the overall electricity generation market; (25) our ability to increase production capacity for our products in a timely and cost-effective manner; (26) any actual or perceived slowdown in the adoption of AI resulting in a slower expansion of AI data centers; (27) Bloom’s ability to protect its intellectual property; and/or (28) the risks relating to forward-looking statements and other “Risk Factors” identified from time to time in our filings with the Securities and Exchange Commission (“SEC”), including our Annual Report on Form 10-K for the fiscal year ended December 31, 2024, and subsequently filed reports, including on Form 10-Q, which filings are available from the SEC. Bloom assumes no obligation to, and does not currently intend to, update information contained in these forward-looking statements, whether as a result of new information, future events or developments, or otherwise. Unless otherwise indicated in this presentation, all information in this presentation is as of October 28, 2025. This presentation includes certain non-GAAP financial measures as defined by SEC rules. These non-GAAP financial measures are in addition to, and not a substitute for or superior to, measures of financial performance prepared in accordance with U.S. GAAP. Some numbers may not foot due to rounding. There are a number of limitations related to the use of these non-GAAP financial measures versus their nearest U.S. GAAP equivalents. For example, other companies may calculate non-GAAP financial measures differently or may use other measures to evaluate their performance, all of which could reduce the usefulness of our non-GAAP financial measures as tools for comparison. As required by Regulation G, we have provided reconciliations of our non-GAAP financial measures to the most directly comparable U.S. GAAP financial measures in the Appendix to this presentation. Bloom has not provided a quantitative reconciliation of forward-looking non-GAAP gross margin and non-GAAP operating income measures to the corresponding U.S. GAAP measures without unreasonable efforts due to the uncertainty regarding, and the potential variability of, reconciling items such as stock-based compensation expense. The variability of these items could significantly impact our future U.S. GAAP financial results and we believe that any reconciliation provided would imply a degree of precision that could be confusing or misleading to investors.
3 Bloom's Mission To Make Clean, Reliable Energy Affordable for Everyone in the World.”
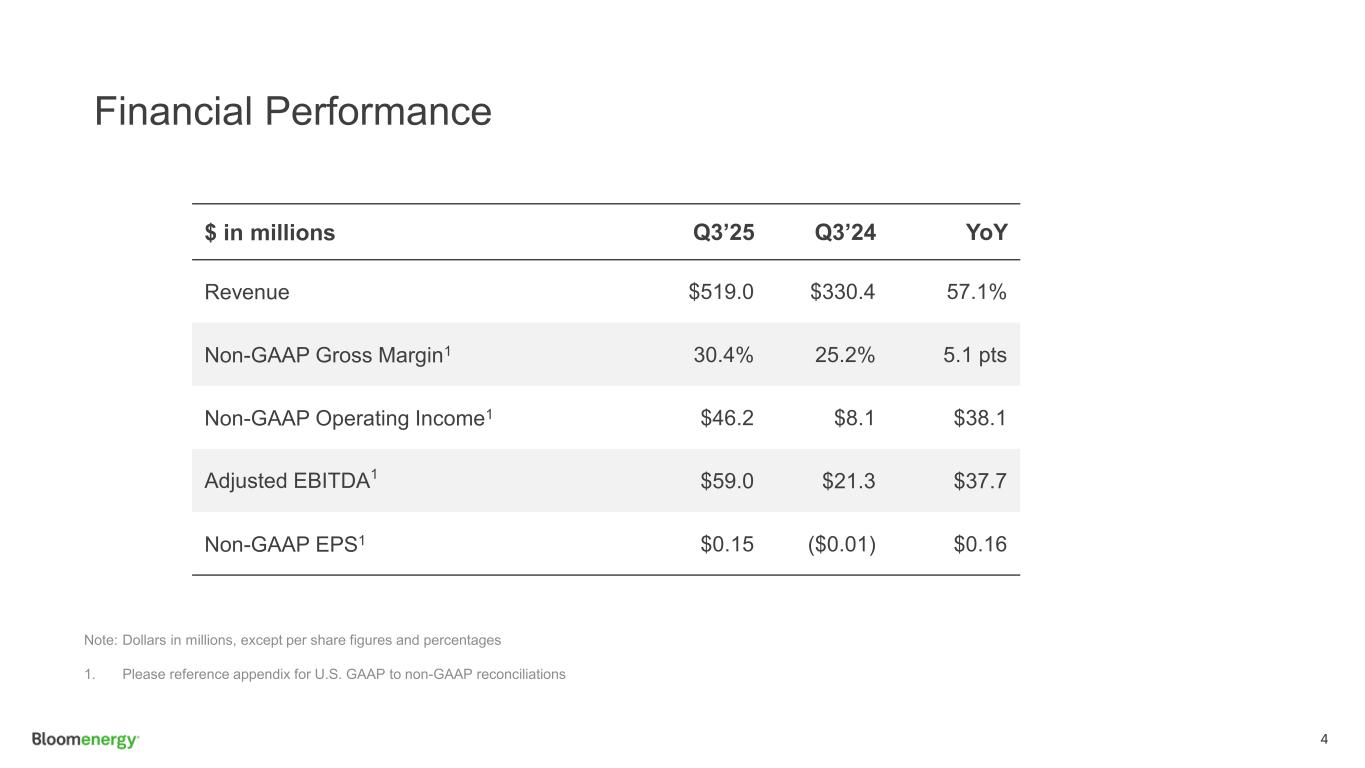
4 Financial Performance $ in millions Q3’25 Q3’24 YoY Revenue $519.0 $330.4 57.1% Non-GAAP Gross Margin1 30.4% 25.2% 5.1 pts Non-GAAP Operating Income1 $46.2 $8.1 $38.1 Adjusted EBITDA1 $59.0 $21.3 $37.7 Non-GAAP EPS1 $0.15 ($0.01) $0.16 Note: Dollars in millions, except per share figures and percentages 1. Please reference appendix for U.S. GAAP to non-GAAP reconciliations
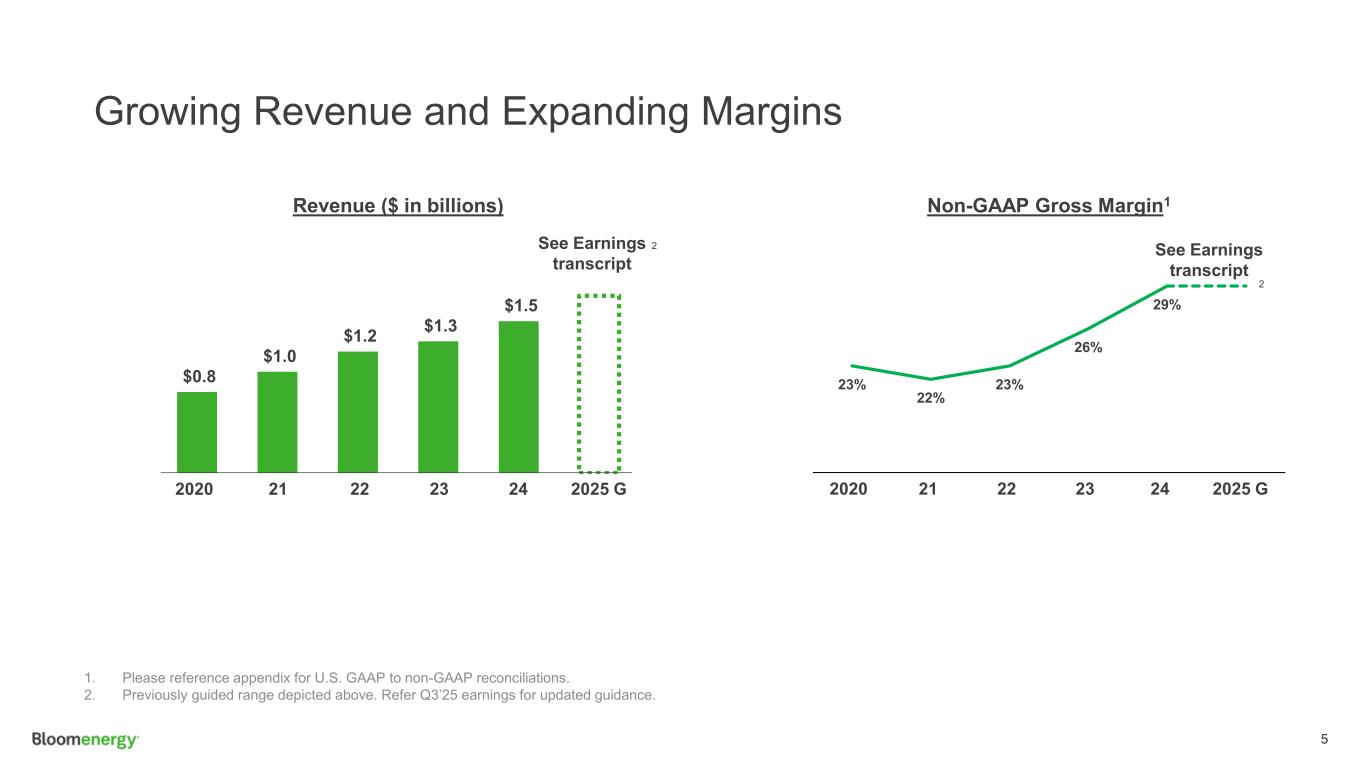
5 Growing Revenue and Expanding Margins 1. Please reference appendix for U.S. GAAP to non-GAAP reconciliations. 2. Previously guided range depicted above. Refer Q3’25 earnings for updated guidance. Revenue ($ in billions) Non-GAAP Gross Margin1 23% 22% 23% 26% 29% 232020 2025 G21 22 24 $0.8 $1.0 $1.2 $1.3 $1.5 232020 2025 G21 22 24 See Earnings transcript 2 2 See Earnings transcript

6 Driving Profitability and Generating Cash $(7) $(38) $(33) $19 $108 See Earnings transcript Non-GAAP Operating Income1 $(99) $(61) $(192) $(372) $92 Cash Flow from Operating Activities 232020 2025 G21 22 232020 2025 G21 2224 24 Similar to ‘24 2 2 1. Please reference appendix for U.S. GAAP to non-GAAP reconciliations. 2. Previously guided range depicted above. Refer Q3’25 earnings for updated guidance.

7 Q3 2025 Appendix
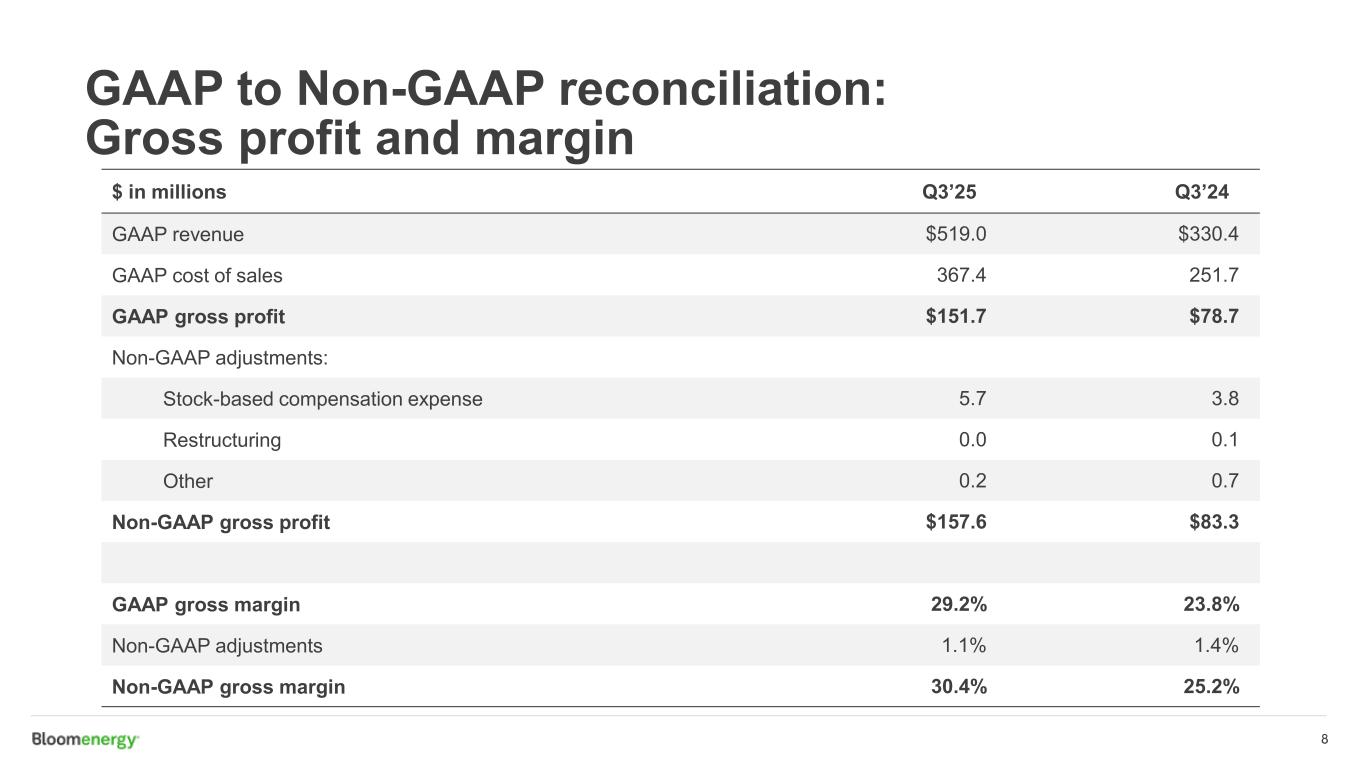
8 GAAP to Non-GAAP reconciliation: Gross profit and margin $ in millions Q3’25 Q3’24 GAAP revenue $519.0 $330.4 GAAP cost of sales 367.4 251.7 GAAP gross profit $151.7 $78.7 Non-GAAP adjustments: Stock-based compensation expense 5.7 3.8 Restructuring 0.0 0.1 Other 0.2 0.7 Non-GAAP gross profit $157.6 $83.3 GAAP gross margin 29.2% 23.8% Non-GAAP adjustments 1.1% 1.4% Non-GAAP gross margin 30.4% 25.2%
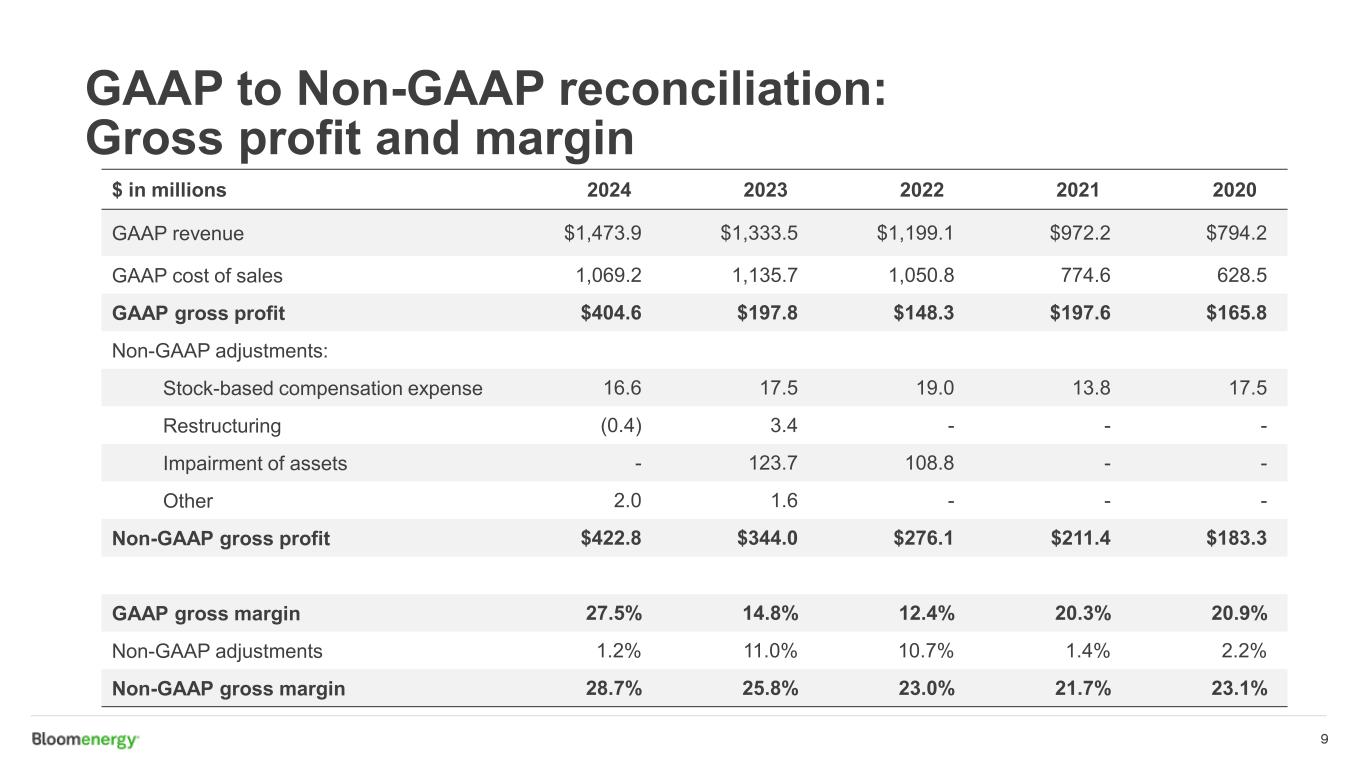
9 GAAP to Non-GAAP reconciliation: Gross profit and margin $ in millions 2024 2023 2022 2021 2020 GAAP revenue $1,473.9 $1,333.5 $1,199.1 $972.2 $794.2 GAAP cost of sales 1,069.2 1,135.7 1,050.8 774.6 628.5 GAAP gross profit $404.6 $197.8 $148.3 $197.6 $165.8 Non-GAAP adjustments: Stock-based compensation expense 16.6 17.5 19.0 13.8 17.5 Restructuring (0.4) 3.4 - - - Impairment of assets - 123.7 108.8 - - Other 2.0 1.6 - - - Non-GAAP gross profit $422.8 $344.0 $276.1 $211.4 $183.3 GAAP gross margin 27.5% 14.8% 12.4% 20.3% 20.9% Non-GAAP adjustments 1.2% 11.0% 10.7% 1.4% 2.2% Non-GAAP gross margin 28.7% 25.8% 23.0% 21.7% 23.1%
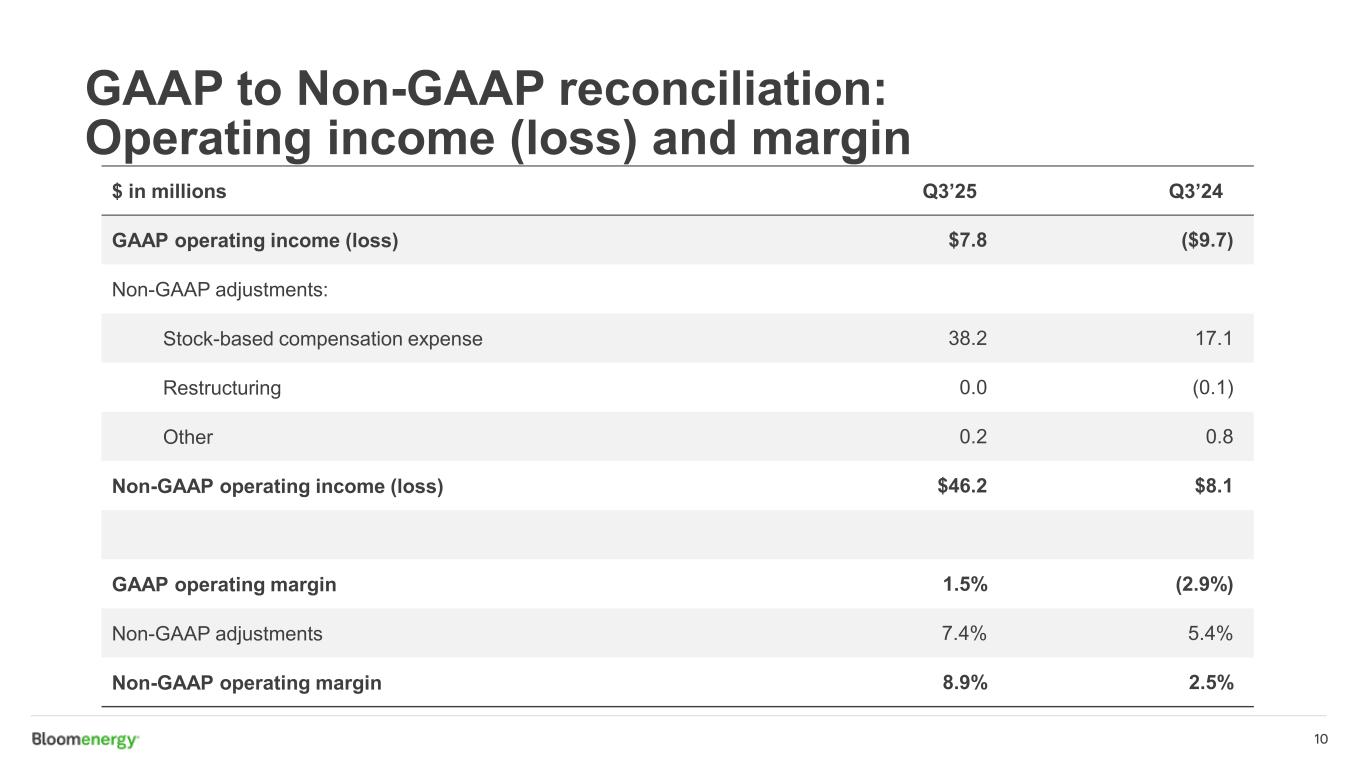
10 GAAP to Non-GAAP reconciliation: Operating income (loss) and margin $ in millions Q3’25 Q3’24 GAAP operating income (loss) $7.8 ($9.7) Non-GAAP adjustments: Stock-based compensation expense 38.2 17.1 Restructuring 0.0 (0.1) Other 0.2 0.8 Non-GAAP operating income (loss) $46.2 $8.1 GAAP operating margin 1.5% (2.9%) Non-GAAP adjustments 7.4% 5.4% Non-GAAP operating margin 8.9% 2.5%
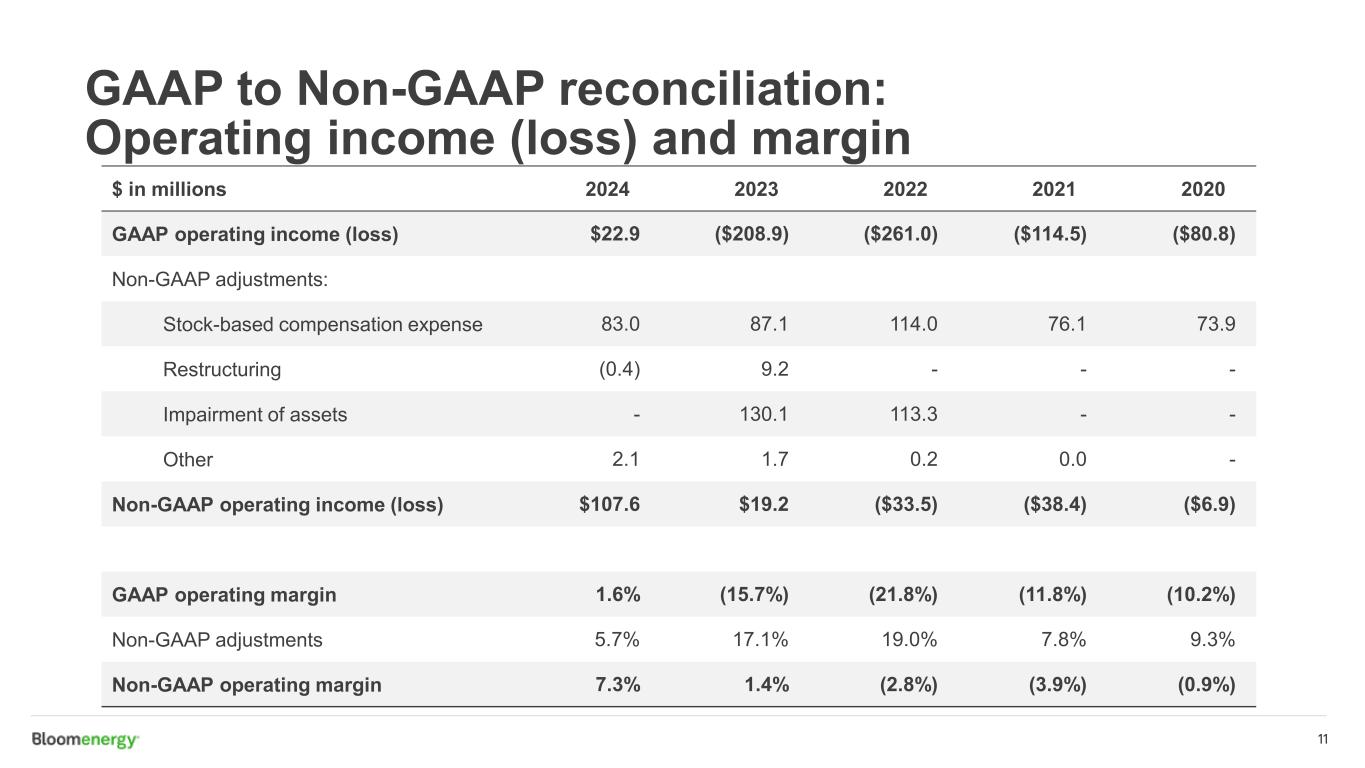
11 GAAP to Non-GAAP reconciliation: Operating income (loss) and margin $ in millions 2024 2023 2022 2021 2020 GAAP operating income (loss) $22.9 ($208.9) ($261.0) ($114.5) ($80.8) Non-GAAP adjustments: Stock-based compensation expense 83.0 87.1 114.0 76.1 73.9 Restructuring (0.4) 9.2 - - - Impairment of assets - 130.1 113.3 - - Other 2.1 1.7 0.2 0.0 - Non-GAAP operating income (loss) $107.6 $19.2 ($33.5) ($38.4) ($6.9) GAAP operating margin 1.6% (15.7%) (21.8%) (11.8%) (10.2%) Non-GAAP adjustments 5.7% 17.1% 19.0% 7.8% 9.3% Non-GAAP operating margin 7.3% 1.4% (2.8%) (3.9%) (0.9%)
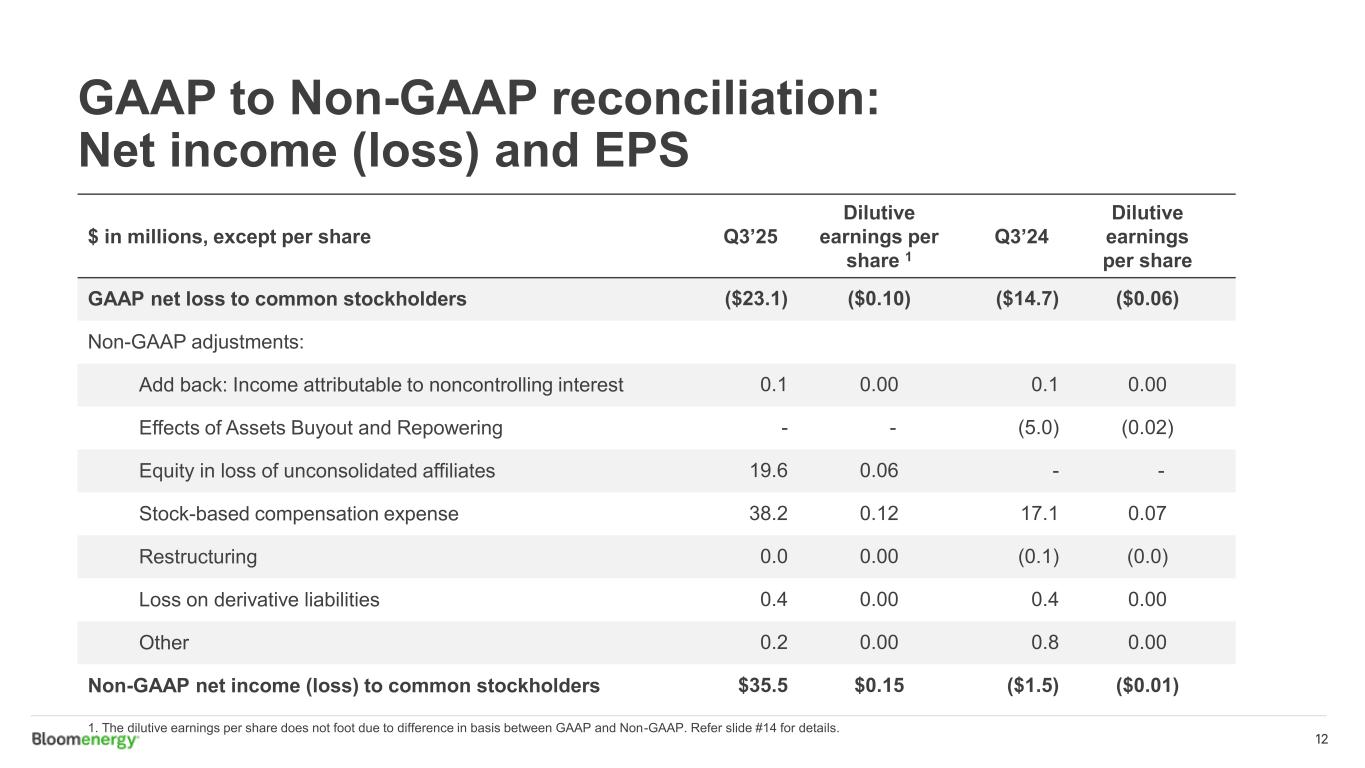
12 GAAP to Non-GAAP reconciliation: Net income (loss) and EPS $ in millions, except per share Q3’25 Dilutive earnings per share 1 Q3’24 Dilutive earnings per share GAAP net loss to common stockholders ($23.1) ($0.10) ($14.7) ($0.06) Non-GAAP adjustments: Add back: Income attributable to noncontrolling interest 0.1 0.00 0.1 0.00 Effects of Assets Buyout and Repowering - - (5.0) (0.02) Equity in loss of unconsolidated affiliates 19.6 0.06 - - Stock-based compensation expense 38.2 0.12 17.1 0.07 Restructuring 0.0 0.00 (0.1) (0.0) Loss on derivative liabilities 0.4 0.00 0.4 0.00 Other 0.2 0.00 0.8 0.00 Non-GAAP net income (loss) to common stockholders $35.5 $0.15 ($1.5) ($0.01) 1. The dilutive earnings per share does not foot due to difference in basis between GAAP and Non-GAAP. Refer slide #14 for details.

13 GAAP to Non-GAAP reconciliation: Adjusted EBITDA $ in millions Q3’25 Q3’24 GAAP net loss to common stockholders ($23.1) ($14.7) Non-GAAP adjustments: Add back: Income attributable to noncontrolling interest 0.1 0.1 Equity in loss of unconsolidated affiliates 19.6 - Stock-based compensation expense 38.2 17.1 Restructuring 0.0 (0.1) Loss on derivative liabilities 0.4 0.4 Interest expense / other misc. 10.5 9.5 Effects of Assets Buyout and Repowering - (5.0) Depreciation & amortization 12.8 13.2 Income tax provision 0.3 0.1 Other 0.2 0.8 Adjusted EBITDA $59.0 $21.3
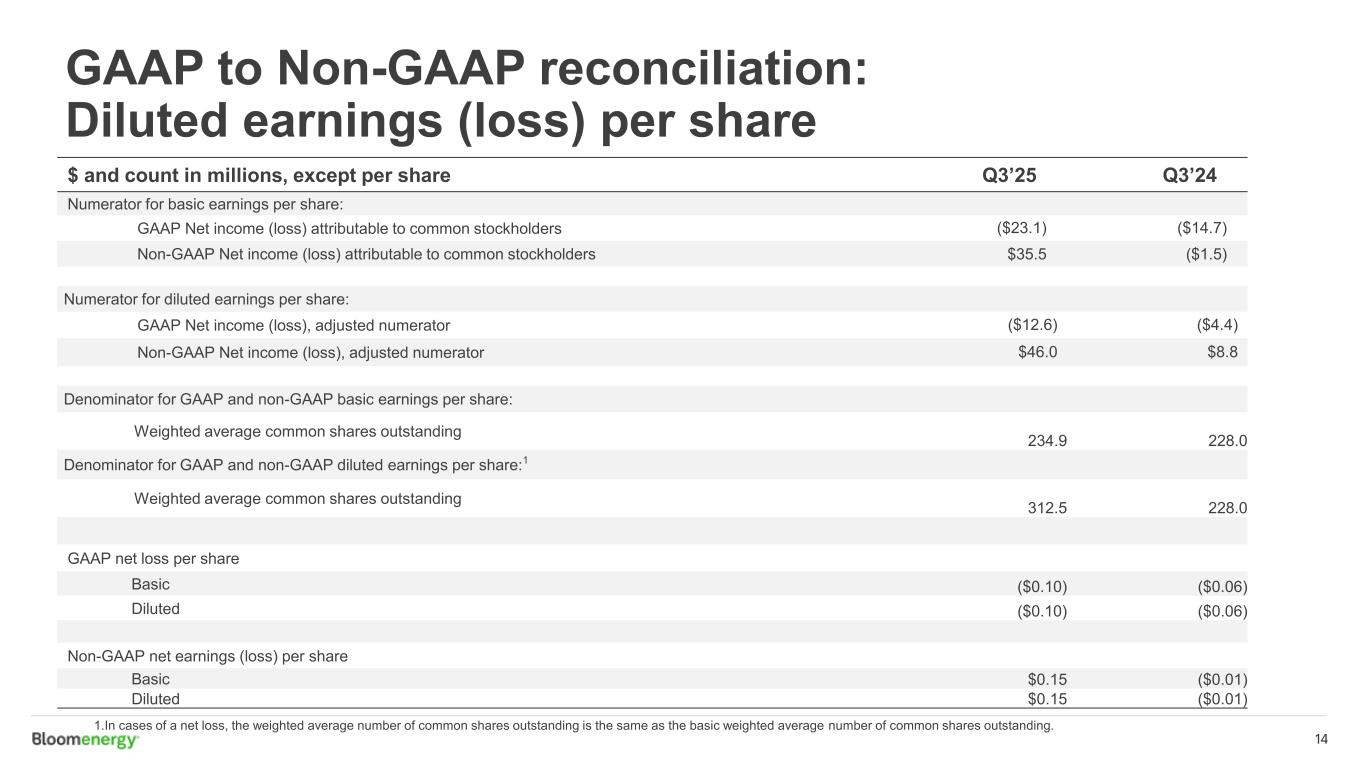
14 GAAP to Non-GAAP reconciliation: Diluted earnings (loss) per share $ and count in millions, except per share Q3’25 Q3’24 Numerator for basic earnings per share: GAAP Net income (loss) attributable to common stockholders ($23.1) ($14.7) Non-GAAP Net income (loss) attributable to common stockholders $35.5 ($1.5) Numerator for diluted earnings per share: GAAP Net income (loss), adjusted numerator ($12.6) ($4.4) Non-GAAP Net income (loss), adjusted numerator $46.0 $8.8 Denominator for GAAP and non-GAAP basic earnings per share: Weighted average common shares outstanding 234.9 228.0 Denominator for GAAP and non-GAAP diluted earnings per share:1 Weighted average common shares outstanding 312.5 228.0 GAAP net loss per share Basic ($0.10) ($0.06) Diluted ($0.10) ($0.06) Non-GAAP net earnings (loss) per share Basic $0.15 ($0.01) Diluted $0.15 ($0.01) 1.In cases of a net loss, the weighted average number of common shares outstanding is the same as the basic weighted average number of common shares outstanding.
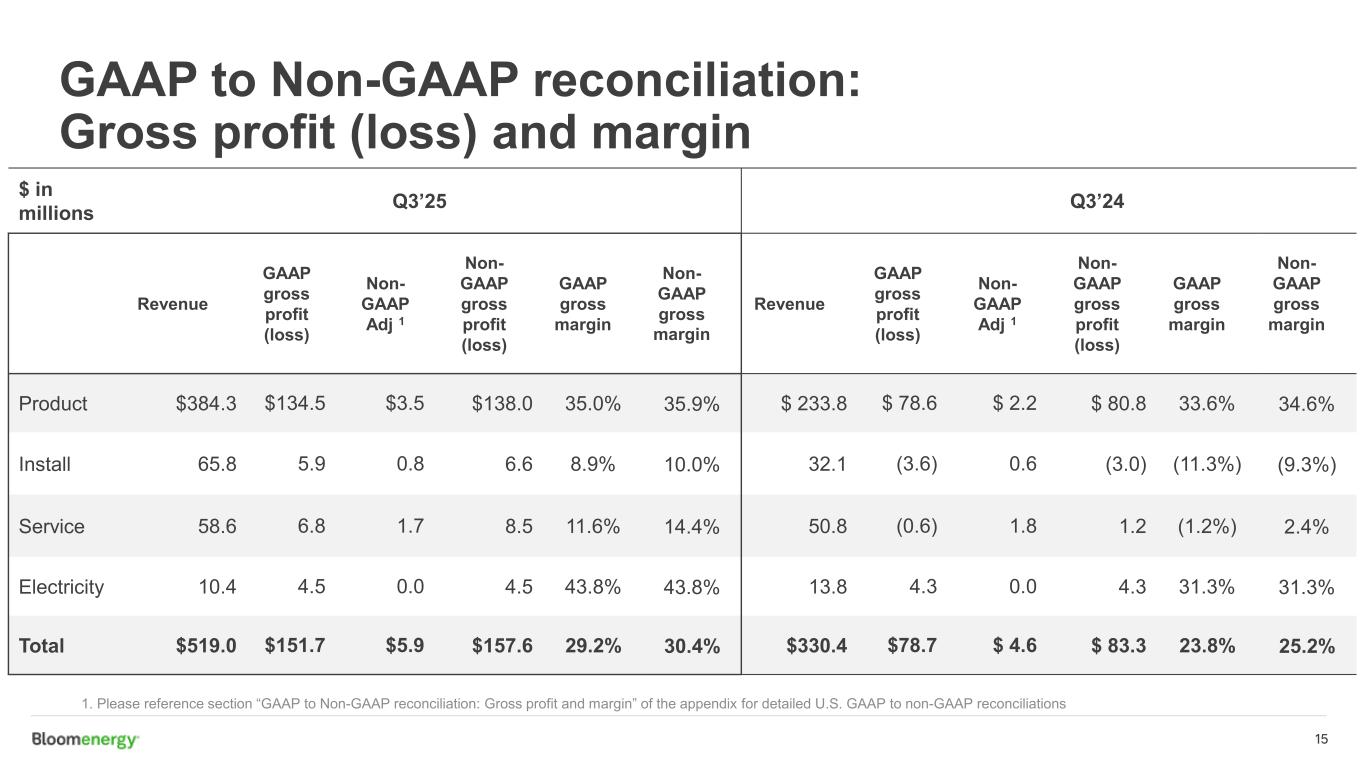
15 GAAP to Non-GAAP reconciliation: Gross profit (loss) and margin 1. Please reference section “GAAP to Non-GAAP reconciliation: Gross profit and margin” of the appendix for detailed U.S. GAAP to non-GAAP reconciliations $ in millions Q3’25 Q3’24 Revenue GAAP gross profit (loss) Non- GAAP Adj 1 Non- GAAP gross profit (loss) GAAP gross margin Non- GAAP gross margin Revenue GAAP gross profit (loss) Non- GAAP Adj 1 Non- GAAP gross profit (loss) GAAP gross margin Non- GAAP gross margin Product $384.3 $134.5 $3.5 $138.0 35.0% 35.9% $ 233.8 $ 78.6 $ 2.2 $ 80.8 33.6% 34.6% Install 65.8 5.9 0.8 6.6 8.9% 10.0% 32.1 (3.6) 0.6 (3.0) (11.3%) (9.3%) Service 58.6 6.8 1.7 8.5 11.6% 14.4% 50.8 (0.6) 1.8 1.2 (1.2%) 2.4% Electricity 10.4 4.5 0.0 4.5 43.8% 43.8% 13.8 4.3 0.0 4.3 31.3% 31.3% Total $519.0 $151.7 $5.9 $157.6 29.2% 30.4% $330.4 $78.7 $ 4.6 $ 83.3 23.8% 25.2%

What Powers You