Exhibit (c)(iii) Confidential Treatment Requested. Certain portions of this exhibit have been redacted and separately filed with the Securities and Exchange Commission pursuant to a request for confidential treatment. Special Committee Discussion Project Orange July 28, 2022 PRELIMINARY AND CONFIDENTIAL DRAFT
SECTION 1 Process Update & Considerations PRELIMINARY AND CONFIDENTIAL DRAFT 2

***
***
***
Potential Strategic Buyers *** Tier 1 – Suggested Outreach Tier 2 – Others Considered PROJECT ORANGE PRELIMINARY AND CONFIDENTIAL DRAFT PROCESS UPDATE & CONSIDERATIONS 6
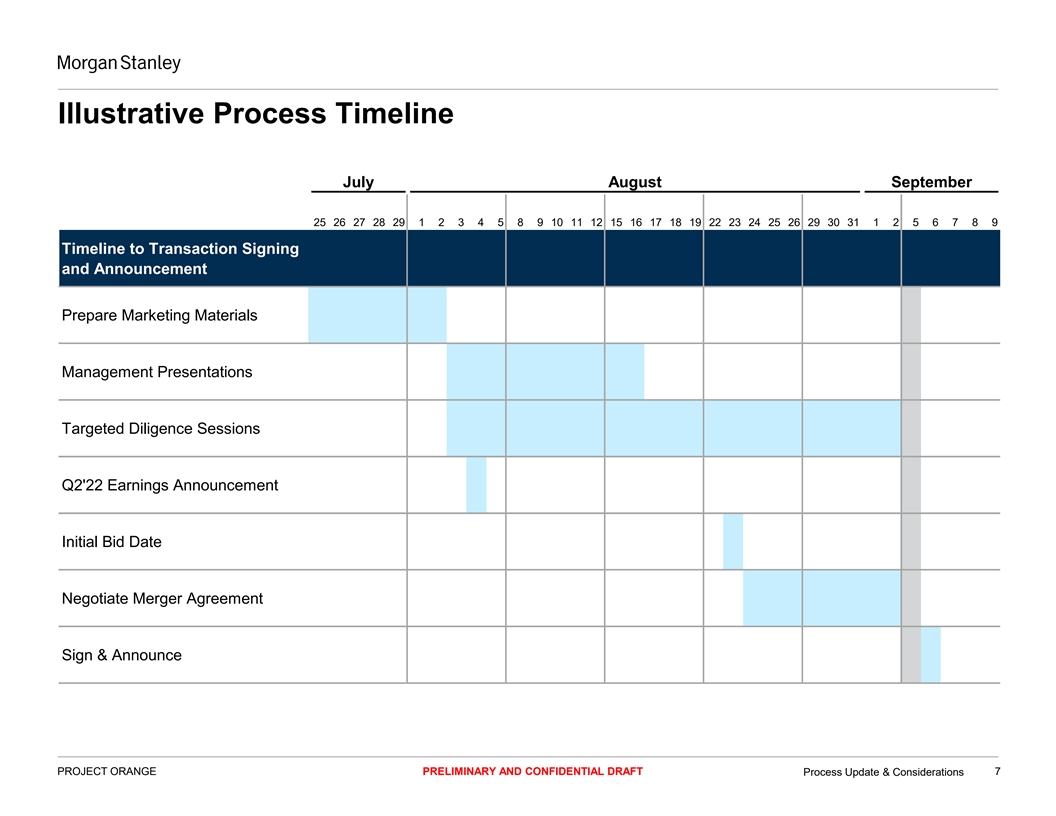
Illustrative Process Timeline July August September 25 26 27 28 29 1 2 3 4 5 8 9 10 11 12 15 16 17 18 19 22 23 24 25 26 29 30 31 1 2 5 6 7 8 9 Timeline to Transaction Signing and Announcement Prepare Marketing Materials Management Presentations Targeted Diligence Sessions Q2'22 Earnings Announcement Initial Bid Date Negotiate Merger Agreement Sign & Announce PROJECT ORANGE PRELIMINARY AND CONFIDENTIAL DRAFT Process Update & Considerations 7
Morgan Stanley *** PROJECT ORANGE PRELIMINARY AND CONFIDENTIAL DRAFT PROCESS UPDATE & CONSIDERATIONS 8
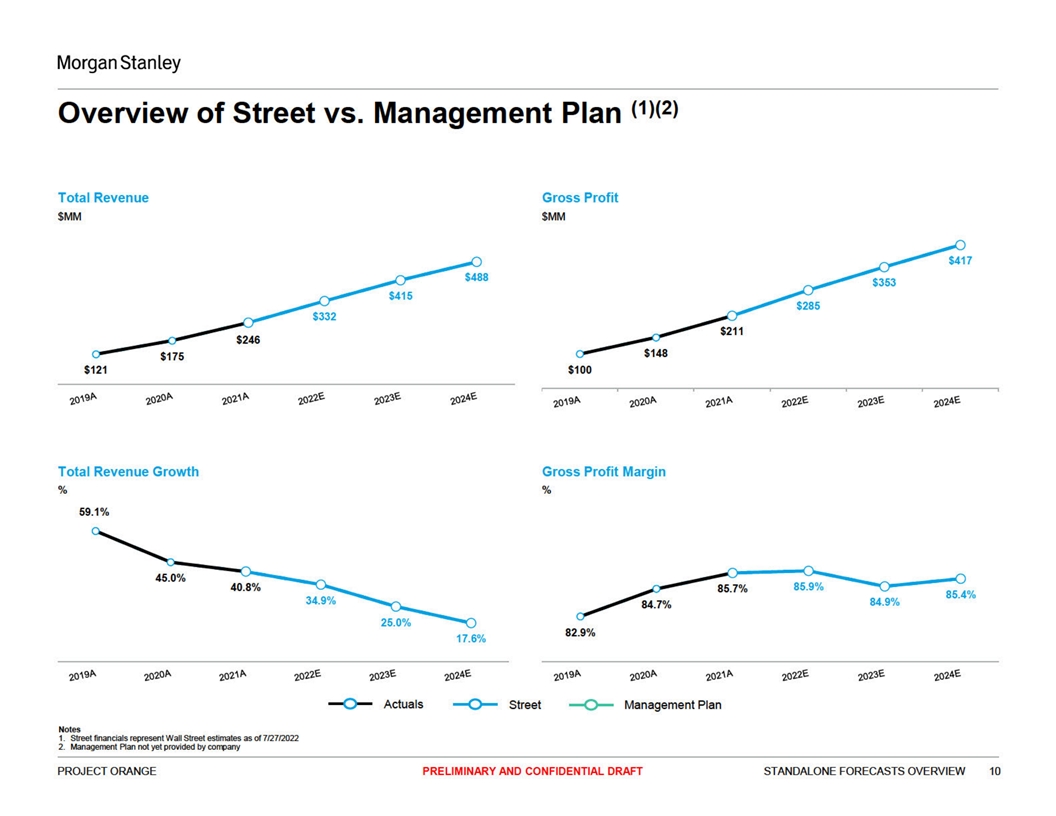
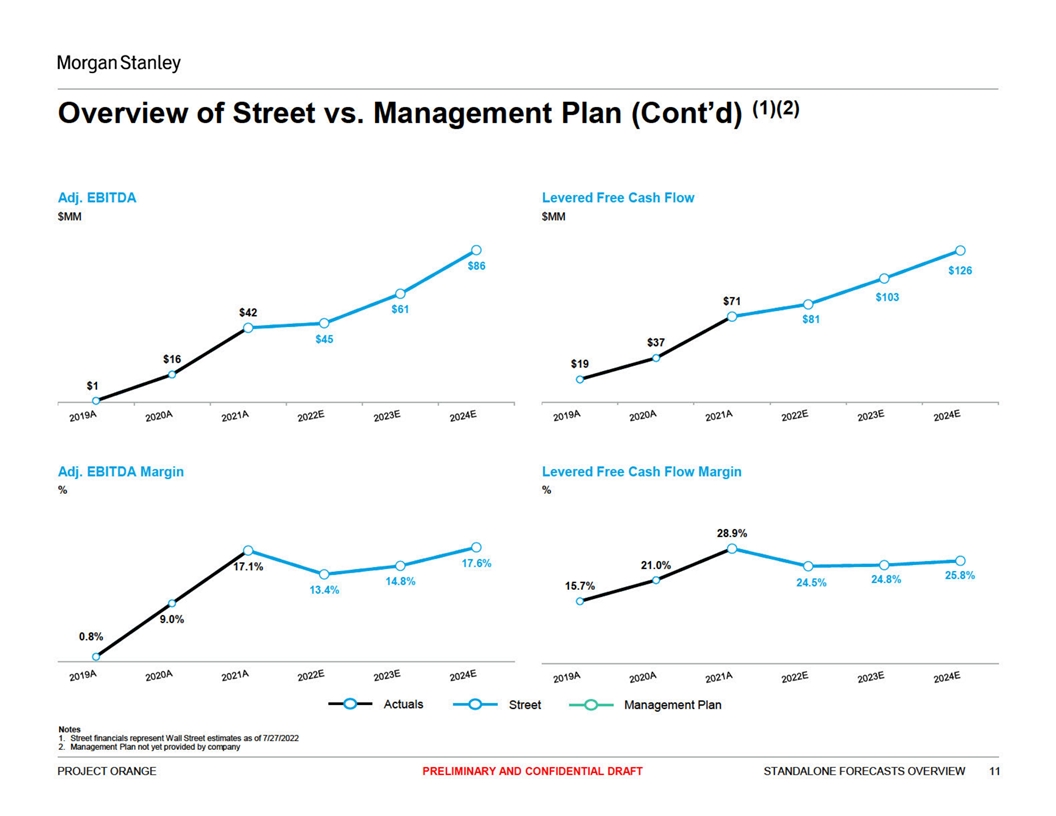
SECTION 2 Standalone Forecasts Overview PRELIMINARY AND CONFIDENTIAL DRAFT 9
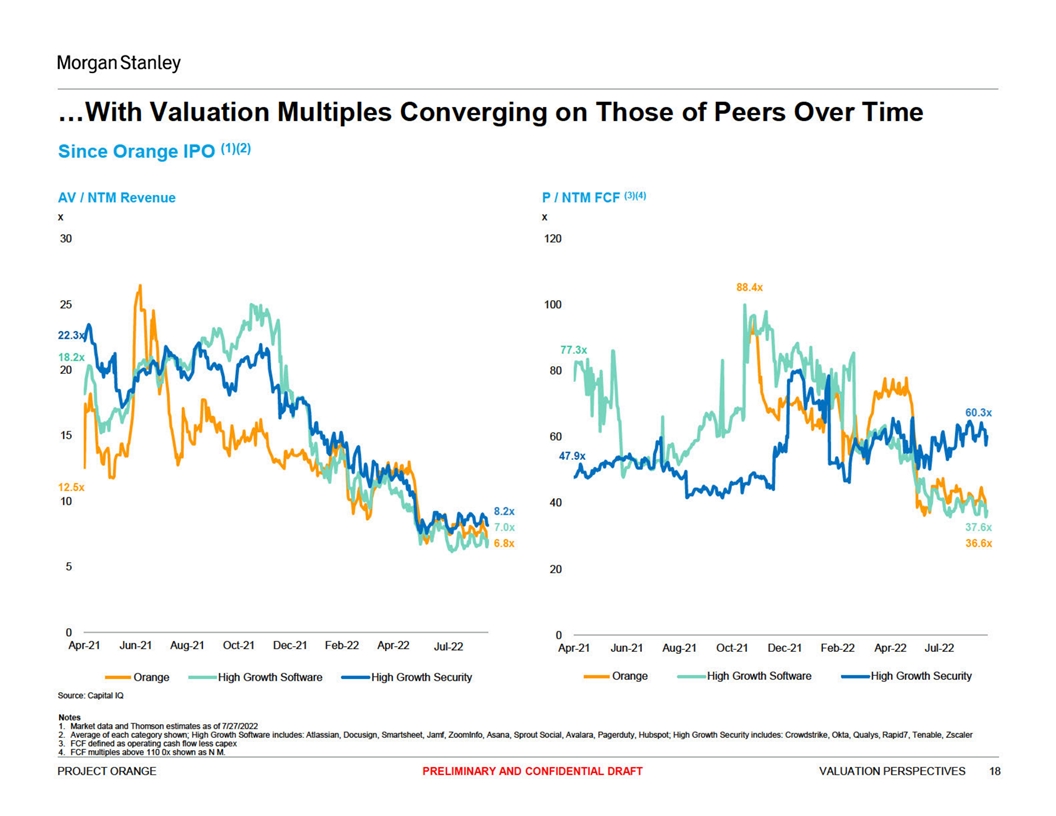
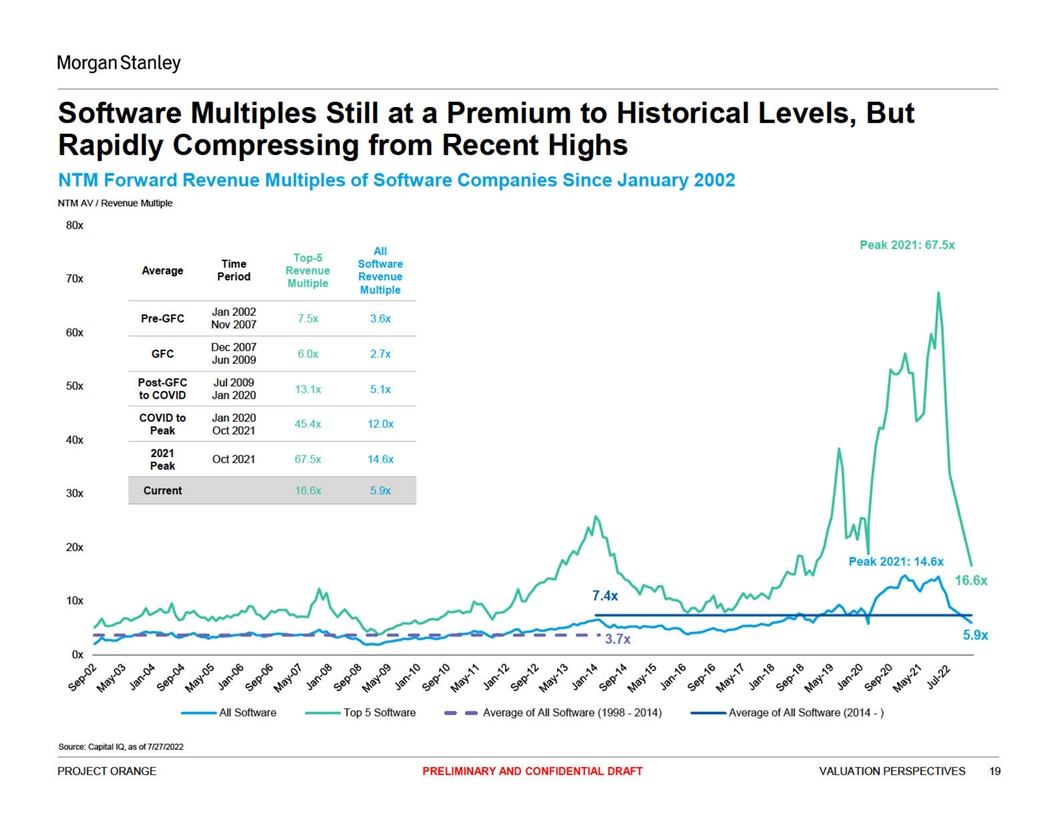
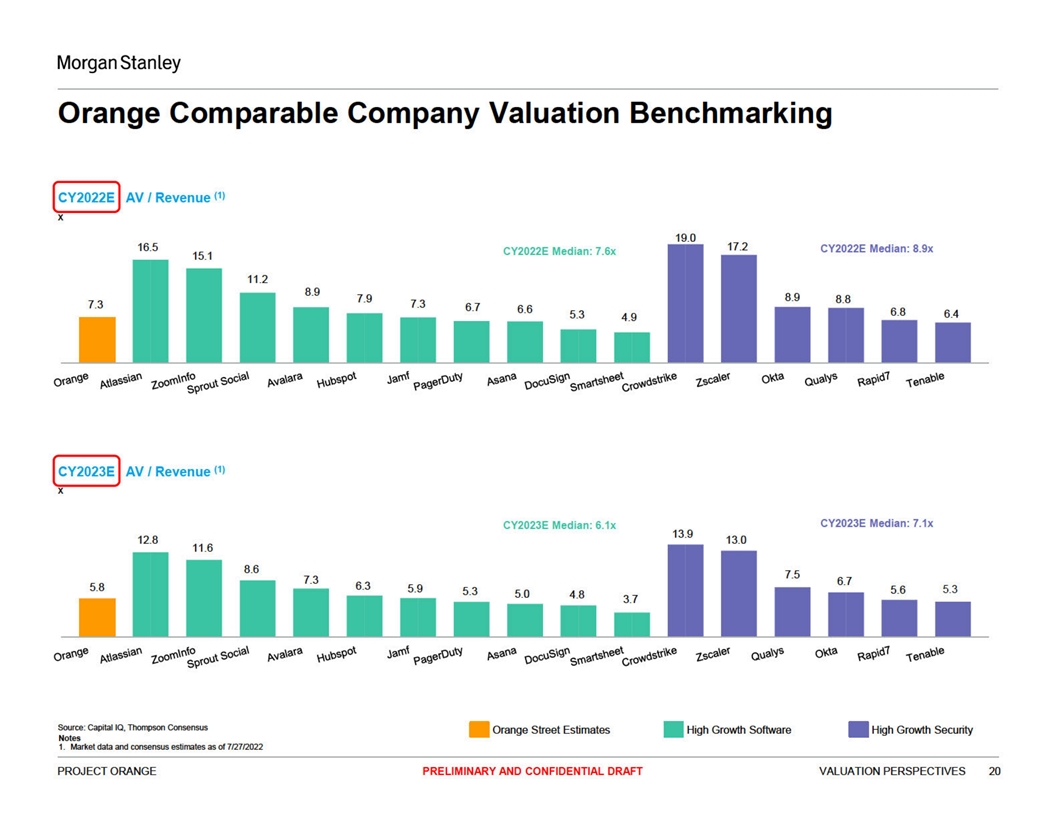
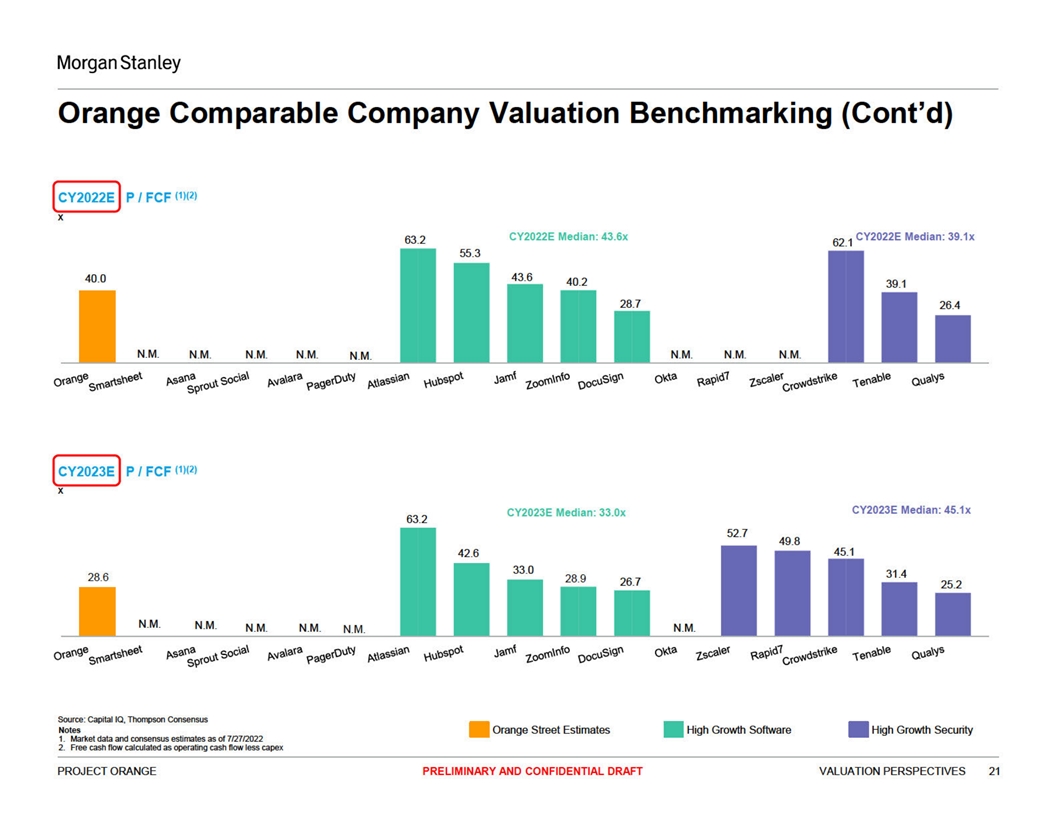
SECTION 3 Valuation Perspectives PRELIMINARY AND CONFIDENTIAL DRAFT 13
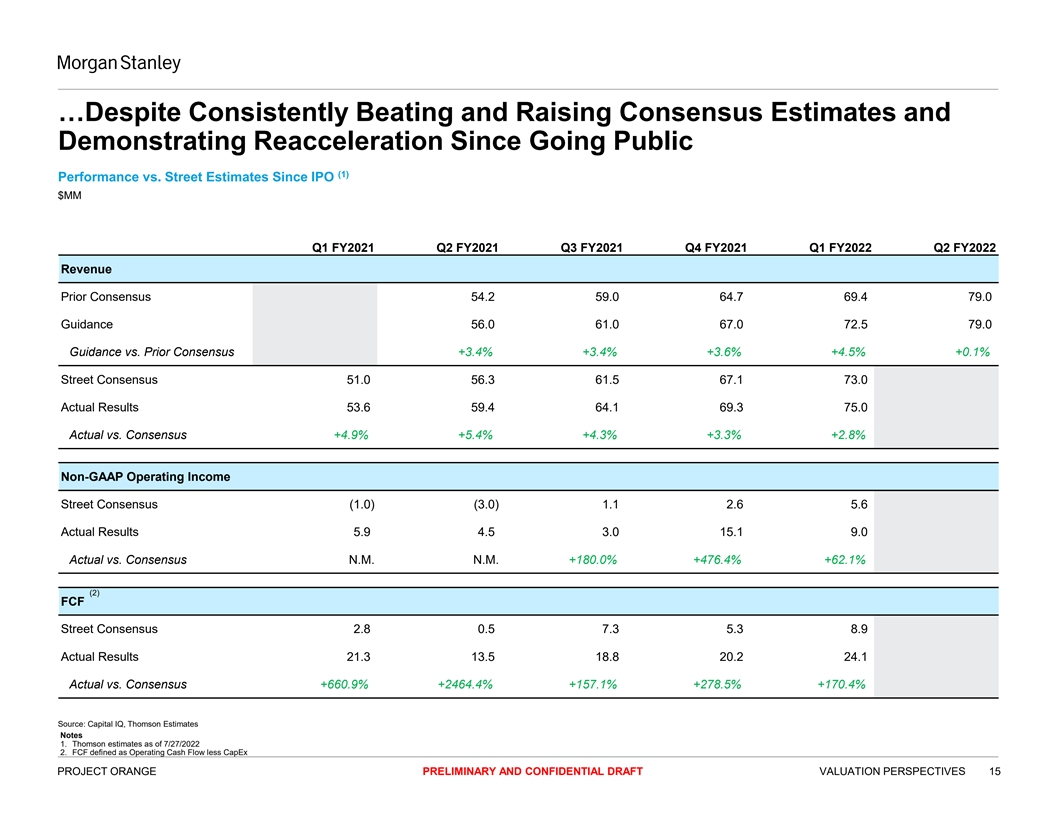
…Despite Consistently Beating and Raising Consensus Estimates and Demonstrating Reacceleration Since Going Public (1) Performance vs. Street Estimates Since IPO $MM Q1 FY2021 Q2 FY2021 Q3 FY2021 Q4 FY2021 Q1 FY2022 Q2 FY2022 Revenue Prior Consensus 54.2 59.0 64.7 69.4 79.0 Guidance 56.0 61.0 67.0 72.5 79.0 Guidance vs. Prior Consensus +3.4% +3.4% +3.6% +4.5% +0.1% Street Consensus 51.0 56.3 61.5 67.1 73.0 Actual Results 53.6 59.4 64.1 69.3 75.0 Actual vs. Consensus +4.9% +5.4% +4.3% +3.3% +2.8% Non-GAAP Operating Income Street Consensus (1.0) (3.0) 1.1 2.6 5.6 Actual Results 5.9 4.5 3.0 15.1 9.0 Actual vs. Consensus N.M. N.M. +180.0% +476.4% +62.1% (2) FCF Street Consensus 2.8 0.5 7.3 5.3 8.9 Actual Results 21.3 13.5 18.8 20.2 24.1 Actual vs. Consensus +660.9% +2464.4% +157.1% +278.5% +170.4% Source: Capital IQ, Thomson Estimates Notes 1. Thomson estimates as of 7/27/2022 2. FCF defined as Operating Cash Flow less CapEx PROJECT ORANGE PRELIMINARY AND CONFIDENTIAL DRAFT VALUATION PERSPECTIVES 15
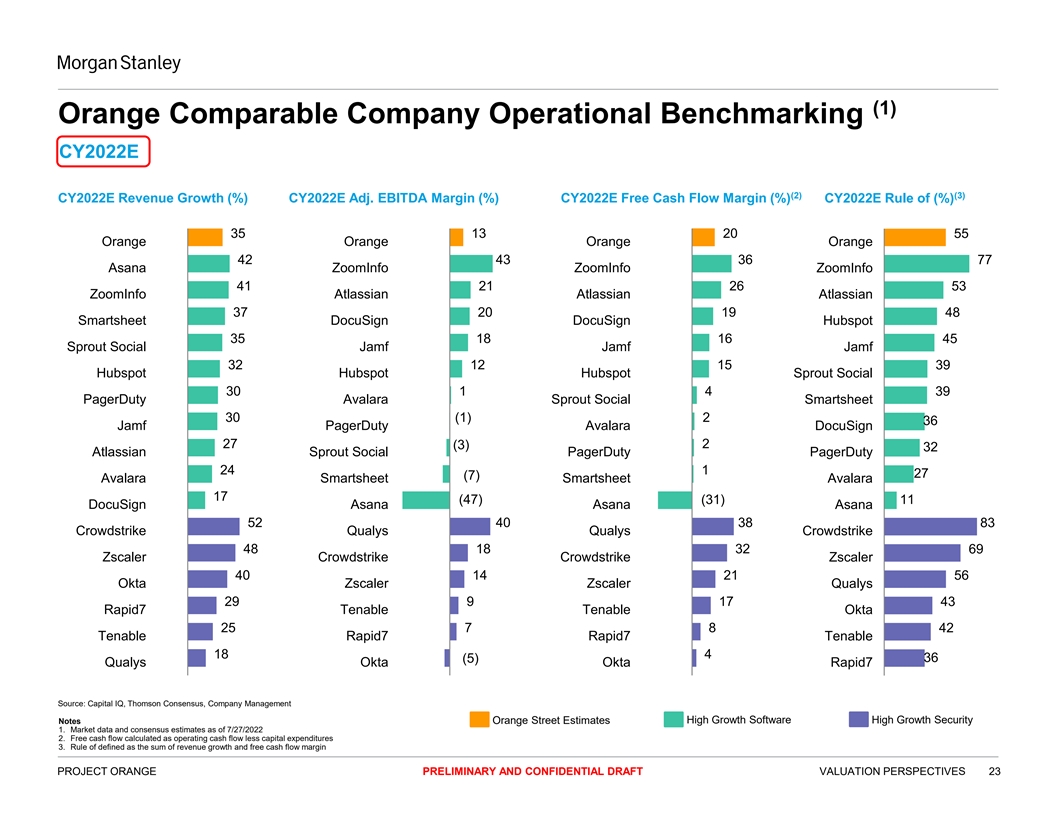
(1) Orange Comparable Company Operational Benchmarking CY2022E (2) (3) CY2022E Revenue Growth (%) CY2022E Adj. EBITDA Margin (%) CY2022E Free Cash Flow Margin (%) CY2022E Rule of (%) 35 13 20 55 Orange Orange Orange Orange 42 43 36 77 Asana ZoomInfo ZoomInfo ZoomInfo 41 21 26 53 ZoomInfo Atlassian Atlassian Atlassian 37 20 19 48 Smartsheet DocuSign DocuSign Hubspot 35 18 16 45 Sprout Social Jamf Jamf Jamf 32 12 15 39 Hubspot Hubspot Hubspot Sprout Social 30 1 4 39 PagerDuty Avalara Sprout Social Smartsheet 30 (1) 2 36 Jamf PagerDuty Avalara DocuSign 27 2 (3) 32 Atlassian Sprout Social PagerDuty PagerDuty 24 1 27 (7) Avalara Smartsheet Smartsheet Avalara 17 (47) (31) 11 DocuSign Asana Asana Asana 52 40 38 83 Crowdstrike Qualys Qualys Crowdstrike 48 18 32 69 Zscaler Crowdstrike Crowdstrike Zscaler 40 14 21 56 Okta Zscaler Zscaler Qualys 29 9 17 43 Rapid7 Tenable Tenable Okta 25 7 8 42 Tenable Rapid7 Rapid7 Tenable 18 4 (5) 36 Qualys Okta Okta Rapid7 Source: Capital IQ, Thomson Consensus, Company Management Notes Orange Street Estimates High Growth Software High Growth Security 1. Market data and consensus estimates as of 7/27/2022 2. Free cash flow calculated as operating cash flow less capital expenditures 3. Rule of defined as the sum of revenue growth and free cash flow margin PROJECT ORANGE PRELIMINARY AND CONFIDENTIAL DRAFT VALUATION PERSPECTIVES 23
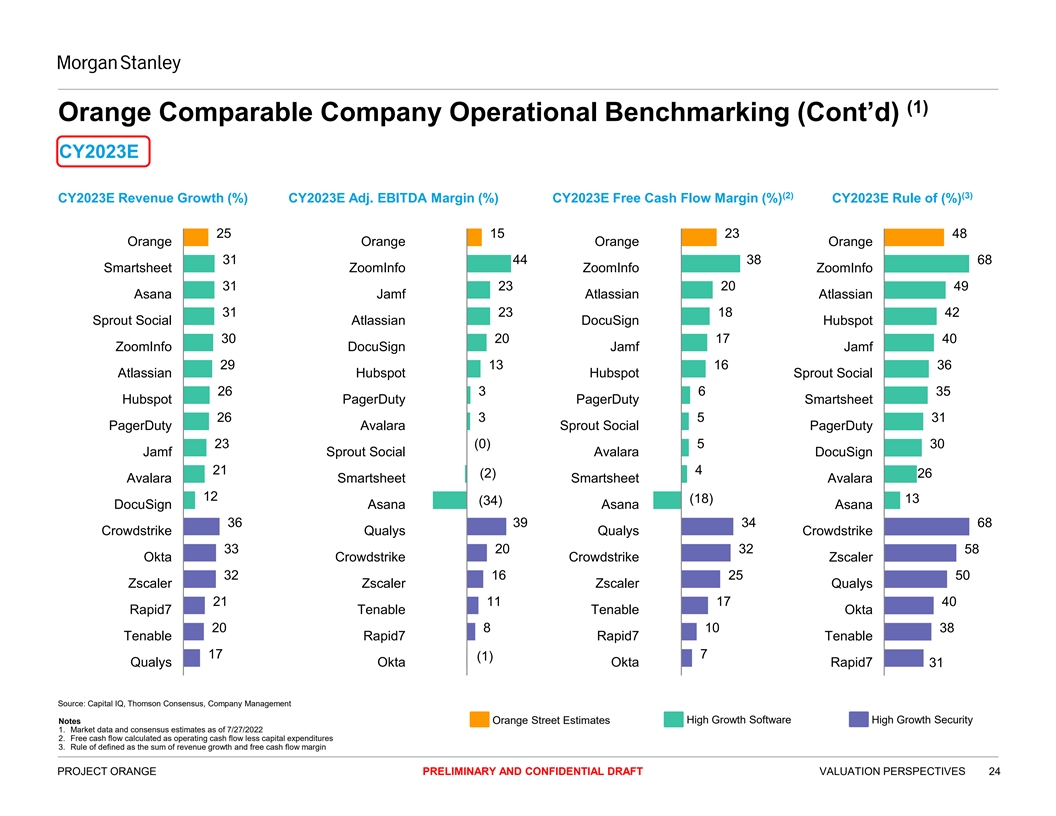
(1) Orange Comparable Company Operational Benchmarking (Cont’d) CY2023E (2) (3) CY2023E Revenue Growth (%) CY2023E Adj. EBITDA Margin (%) CY2023E Free Cash Flow Margin (%) CY2023E Rule of (%) 25 15 23 48 Orange Orange Orange Orange 31 44 38 68 Smartsheet ZoomInfo ZoomInfo ZoomInfo 31 23 20 49 Asana Jamf Atlassian Atlassian 31 23 18 42 Sprout Social Atlassian DocuSign Hubspot 30 20 17 40 ZoomInfo DocuSign Jamf Jamf 29 13 16 36 Atlassian Hubspot Hubspot Sprout Social 26 3 6 35 Hubspot PagerDuty PagerDuty Smartsheet 26 3 5 31 PagerDuty Avalara Sprout Social PagerDuty 23 (0) 5 30 Jamf Sprout Social Avalara DocuSign 21 4 (2) 26 Avalara Smartsheet Smartsheet Avalara 12 (18) 13 (34) DocuSign Asana Asana Asana 36 39 34 68 Crowdstrike Qualys Qualys Crowdstrike 33 20 32 58 Okta Crowdstrike Crowdstrike Zscaler 32 16 25 50 Zscaler Zscaler Zscaler Qualys 21 11 17 40 Rapid7 Tenable Tenable Okta 20 8 10 38 Tenable Rapid7 Rapid7 Tenable 17 7 (1) Qualys Okta Okta Rapid7 31 Source: Capital IQ, Thomson Consensus, Company Management Notes Orange Street Estimates High Growth Software High Growth Security 1. Market data and consensus estimates as of 7/27/2022 2. Free cash flow calculated as operating cash flow less capital expenditures 3. Rule of defined as the sum of revenue growth and free cash flow margin PROJECT ORANGE PRELIMINARY AND CONFIDENTIAL DRAFT VALUATION PERSPECTIVES 24
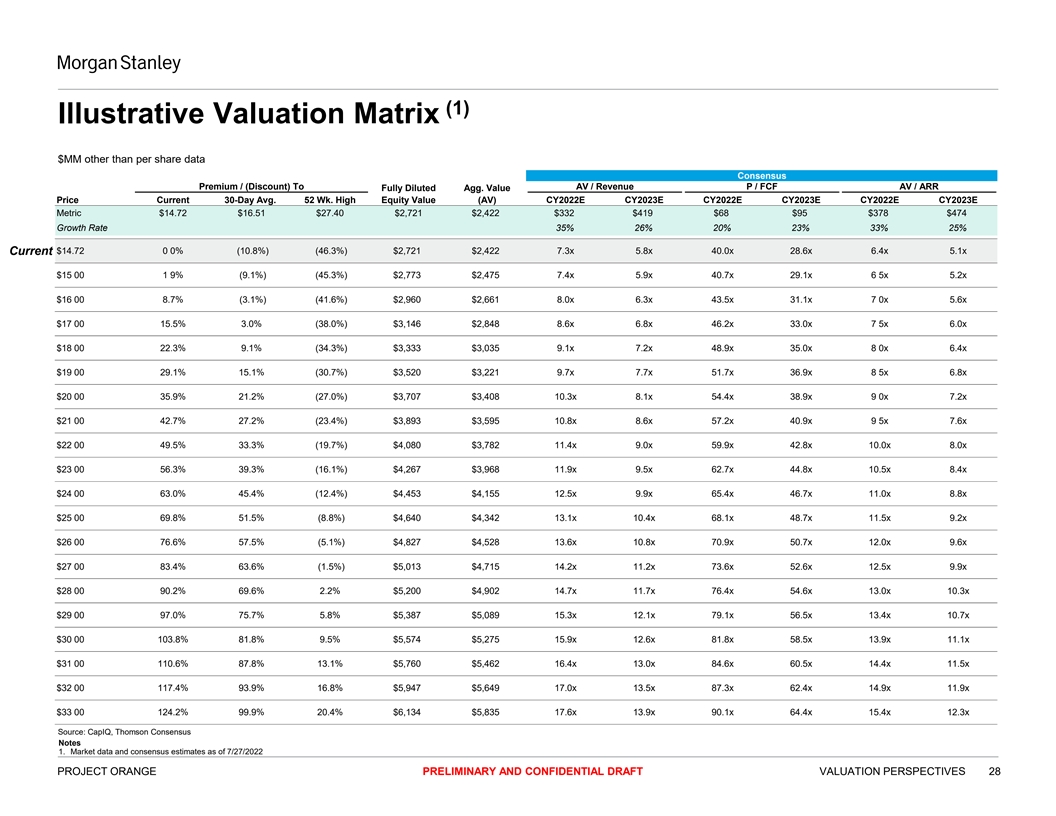
(1) Illustrative Valuation Matrix $MM other than per share data Consensus Premium / (Discount) To AV / Revenue P / FCF AV / ARR Fully Diluted Agg. Value Price Current 30-Day Avg. 52 Wk. High Equity Value (AV) CY2022E CY2023E CY2022E CY2023E CY2022E CY2023E Metric $14.72 $16.51 $27.40 $2,721 $2,422 $332 $419 $68 $95 $378 $474 Growth Rate 35% 26% 20% 23% 33% 25% Current $14.72 0 0% (10.8%) (46.3%) $2,721 $2,422 7.3x 5.8x 40.0x 28.6x 6.4x 5.1x $15 00 1 9% (9.1%) (45.3%) $2,773 $2,475 7.4x 5.9x 40.7x 29.1x 6 5x 5.2x $16 00 8.7% (3.1%) (41.6%) $2,960 $2,661 8.0x 6.3x 43.5x 31.1x 7 0x 5.6x $17 00 15.5% 3.0% (38.0%) $3,146 $2,848 8.6x 6.8x 46.2x 33.0x 7 5x 6.0x $18 00 22.3% 9.1% (34.3%) $3,333 $3,035 9.1x 7.2x 48.9x 35.0x 8 0x 6.4x $19 00 29.1% 15.1% (30.7%) $3,520 $3,221 9.7x 7.7x 51.7x 36.9x 8 5x 6.8x $20 00 35.9% 21.2% (27.0%) $3,707 $3,408 10.3x 8.1x 54.4x 38.9x 9 0x 7.2x $21 00 42.7% 27.2% (23.4%) $3,893 $3,595 10.8x 8.6x 57.2x 40.9x 9 5x 7.6x $22 00 49.5% 33.3% (19.7%) $4,080 $3,782 11.4x 9.0x 59.9x 42.8x 10.0x 8.0x $23 00 56.3% 39.3% (16.1%) $4,267 $3,968 11.9x 9.5x 62.7x 44.8x 10.5x 8.4x $24 00 63.0% 45.4% (12.4%) $4,453 $4,155 12.5x 9.9x 65.4x 46.7x 11.0x 8.8x $25 00 69.8% 51.5% (8.8%) $4,640 $4,342 13.1x 10.4x 68.1x 48.7x 11.5x 9.2x $26 00 76.6% 57.5% (5.1%) $4,827 $4,528 13.6x 10.8x 70.9x 50.7x 12.0x 9.6x $27 00 83.4% 63.6% (1.5%) $5,013 $4,715 14.2x 11.2x 73.6x 52.6x 12.5x 9.9x $28 00 90.2% 69.6% 2.2% $5,200 $4,902 14.7x 11.7x 76.4x 54.6x 13.0x 10.3x $29 00 97.0% 75.7% 5.8% $5,387 $5,089 15.3x 12.1x 79.1x 56.5x 13.4x 10.7x $30 00 103.8% 81.8% 9.5% $5,574 $5,275 15.9x 12.6x 81.8x 58.5x 13.9x 11.1x $31 00 110.6% 87.8% 13.1% $5,760 $5,462 16.4x 13.0x 84.6x 60.5x 14.4x 11.5x $32 00 117.4% 93.9% 16.8% $5,947 $5,649 17.0x 13.5x 87.3x 62.4x 14.9x 11.9x $33 00 124.2% 99.9% 20.4% $6,134 $5,835 17.6x 13.9x 90.1x 64.4x 15.4x 12.3x Source: CapIQ, Thomson Consensus Notes 1. Market data and consensus estimates as of 7/27/2022 PROJECT ORANGE PRELIMINARY AND CONFIDENTIAL DRAFT VALUATION PERSPECTIVES 28
APPENDIX A Valuation Reference Materials PRELIMINARY AND CONFIDENTIAL DRAFT 29
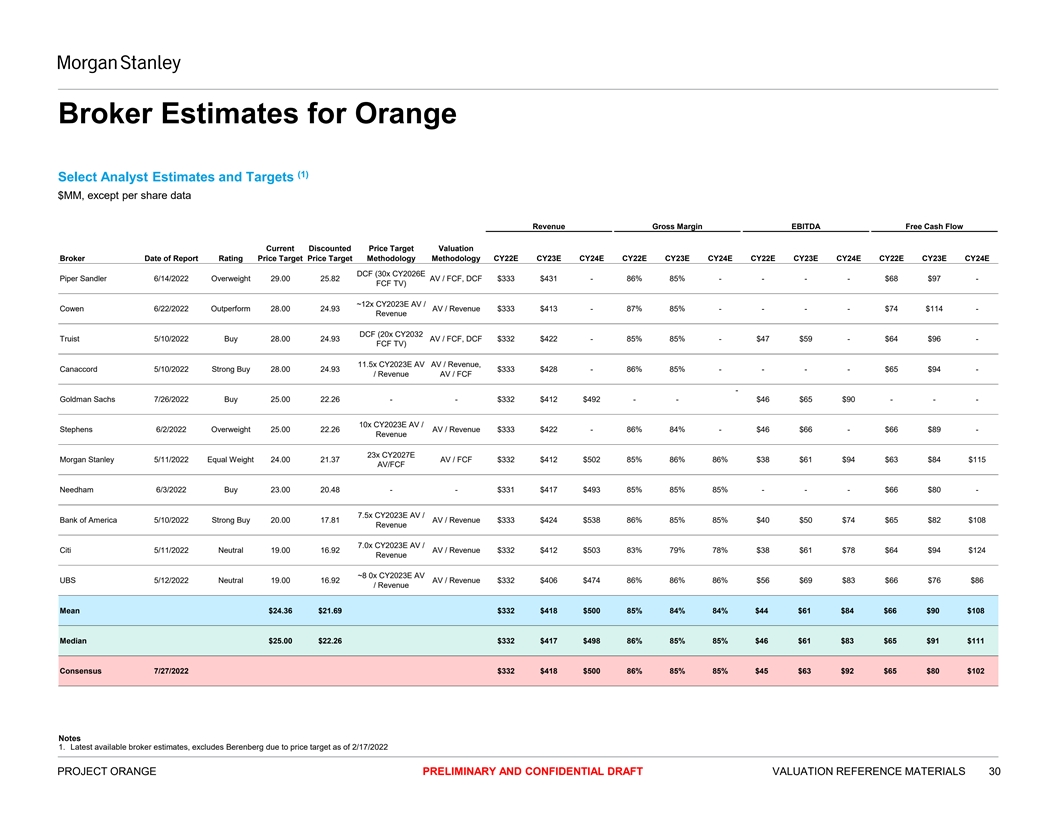
Broker Estimates for Orange (1) Select Analyst Estimates and Targets $MM, except per share data Revenue Gross Margin EBITDA Free Cash Flow Current Discounted Price Target Valuation Broker Date of Report Rating Price Target Price Target Methodology Methodology CY22E CY23E CY24E CY22E CY23E CY24E CY22E CY23E CY24E CY22E CY23E CY24E DCF (30x CY2026E Piper Sandler 6/14/2022 Overweight 29.00 25.82 AV / FCF, DCF $333 $431 - 86% 85% - - - - $68 $97 - FCF TV) ~12x CY2023E AV / Cowen 6/22/2022 Outperform 28.00 24.93 AV / Revenue $333 $413 - 87% 85% - - - - $74 $114 - Revenue DCF (20x CY2032 Truist 5/10/2022 Buy 28.00 24.93 AV / FCF, DCF $332 $422 - 85% 85% - $47 $59 - $64 $96 - FCF TV) 11.5x CY2023E AV AV / Revenue, Canaccord 5/10/2022 Strong Buy 28.00 24.93 $333 $428 - 86% 85% - - - - $65 $94 - / Revenue AV / FCF - Goldman Sachs 7/26/2022 Buy 25.00 22.26 - - $332 $412 $492 - - $46 $65 $90 - - - 10x CY2023E AV / Stephens 6/2/2022 Overweight 25.00 22.26 AV / Revenue $333 $422 - 86% 84% - $46 $66 - $66 $89 - Revenue 23x CY2027E Morgan Stanley 5/11/2022 Equal Weight 24.00 21.37 AV / FCF $332 $412 $502 85% 86% 86% $38 $61 $94 $63 $84 $115 AV/FCF Needham 6/3/2022 Buy 23.00 20.48 - - $331 $417 $493 85% 85% 85% - - - $66 $80 - 7.5x CY2023E AV / Bank of America 5/10/2022 Strong Buy 20.00 17.81 AV / Revenue $333 $424 $538 86% 85% 85% $40 $50 $74 $65 $82 $108 Revenue 7.0x CY2023E AV / Citi 5/11/2022 Neutral 19.00 16.92 AV / Revenue $332 $412 $503 83% 79% 78% $38 $61 $78 $64 $94 $124 Revenue ~8 0x CY2023E AV UBS 5/12/2022 Neutral 19.00 16.92 AV / Revenue $332 $406 $474 86% 86% 86% $56 $69 $83 $66 $76 $86 / Revenue Mean $24.36 $21.69 $332 $418 $500 85% 84% 84% $44 $61 $84 $66 $90 $108 Median $25.00 $22.26 $332 $417 $498 86% 85% 85% $46 $61 $83 $65 $91 $111 Consensus 7/27/2022 $332 $418 $500 86% 85% 85% $45 $63 $92 $65 $80 $102 Notes 1. Latest available broker estimates, excludes Berenberg due to price target as of 2/17/2022 PROJECT ORANGE PRELIMINARY AND CONFIDENTIAL DRAFT VALUATION REFERENCE MATERIALS 30
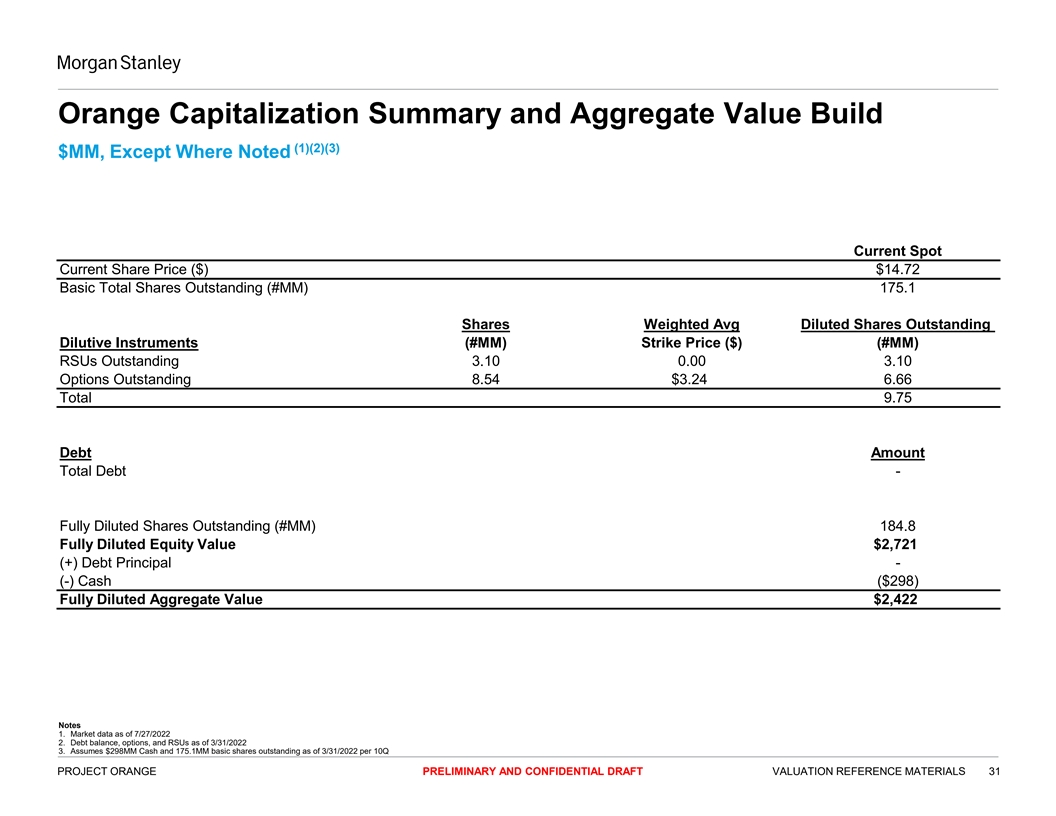
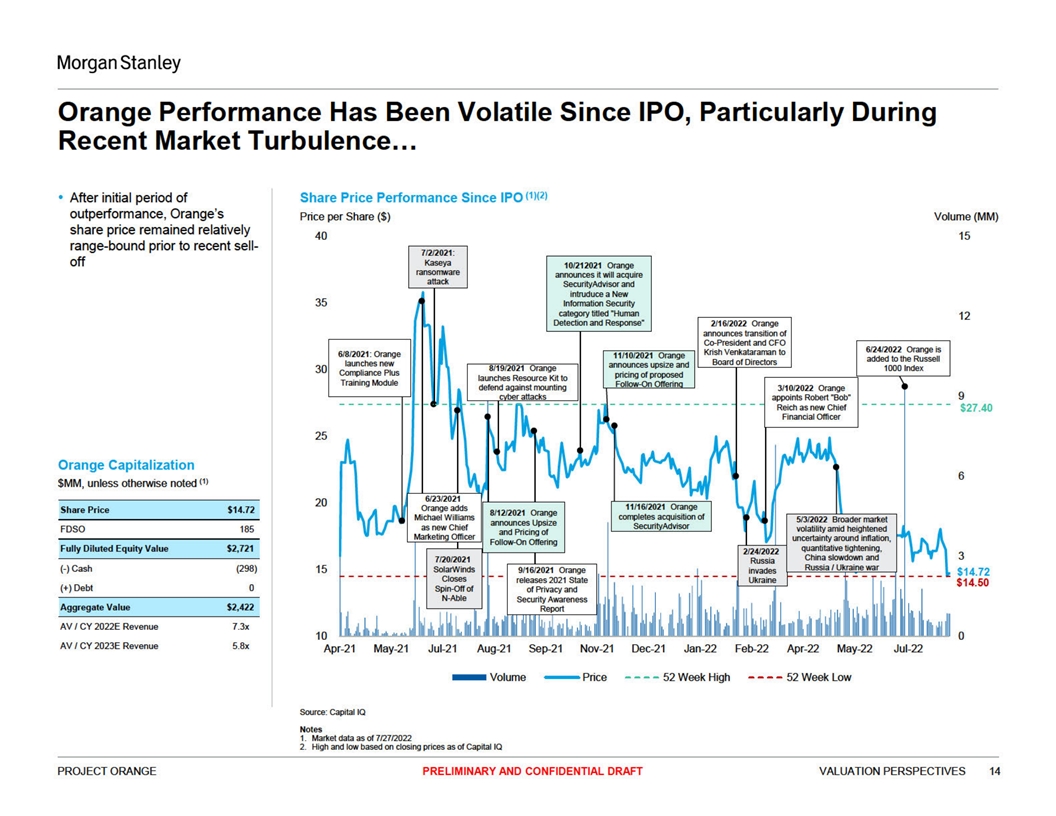
Orange Capitalization Summary and Aggregate Value Build (1)(2)(3) $MM, Except Where Noted Current Spot Current Share Price ($) $14.72 Basic Total Shares Outstanding (#MM) 175.1 Shares Weighted Avg Diluted Shares Outstanding Dilutive Instruments (#MM) Strike Price ($) (#MM) RSUs Outstanding 3.10 0.00 3.10 Options Outstanding 8.54 $3.24 6.66 Total 9.75 Debt Amount Total Debt - Fully Diluted Shares Outstanding (#MM) 184.8 Fully Diluted Equity Value $2,721 (+) Debt Principal - (-) Cash ($298) Fully Diluted Aggregate Value $2,422 Notes 1. Market data as of 7/27/2022 2. Debt balance, options, and RSUs as of 3/31/2022 3. Assumes $298MM Cash and 175.1MM basic shares outstanding as of 3/31/2022 per 10Q PROJECT ORANGE PRELIMINARY AND CONFIDENTIAL DRAFT VALUATION REFERENCE MATERIALS 31
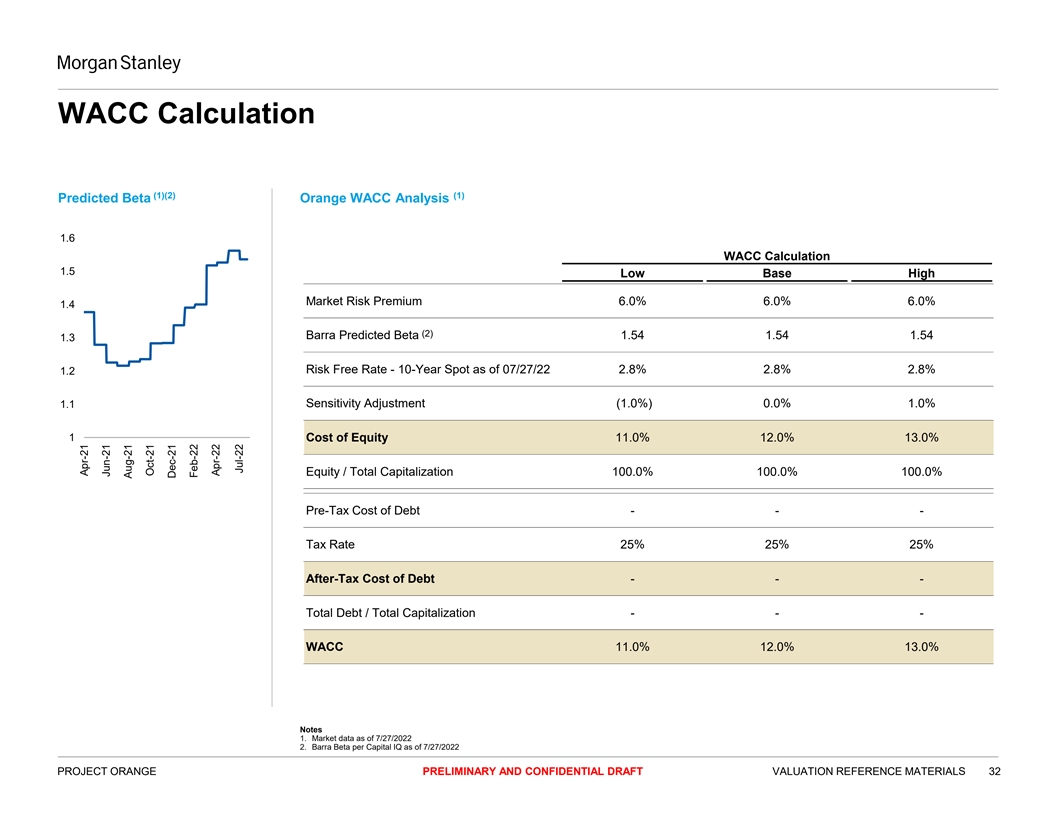
WACC Calculation (1)(2) (1) Predicted Beta Orange WACC Analysis 1.6 WACC Calculation 1.5 Low Base High Market Risk Premium 6.0% 6.0% 6.0% 1.4 (2) Barra Predicted Beta 1.54 1.54 1.54 1.3 Risk Free Rate - 10-Year Spot as of 07/27/22 2.8% 2.8% 2.8% 1.2 1.1 Sensitivity Adjustment (1.0%) 0.0% 1.0% 1 Cost of Equity 11.0% 12.0% 13.0% Equity / Total Capitalization 100.0% 100.0% 100.0% Pre-Tax Cost of Debt - - - Tax Rate 25% 25% 25% After-Tax Cost of Debt - - - Total Debt / Total Capitalization - - - WACC 11.0% 12.0% 13.0% Notes 1. Market data as of 7/27/2022 2. Barra Beta per Capital IQ as of 7/27/2022 PROJECT ORANGE PRELIMINARY AND CONFIDENTIAL DRAFT VALUATION REFERENCE MATERIALS 32 Apr-21 Jun-21 Aug-21 Oct-21 Dec-21 Feb-22 Apr-22 Jul-22
Legal Disclaimer We have prepared this document solely for informational purposes. You should not definitively rely upon it or use it to form the definitive basis for any decision, contract, commitment or action whatsoever, with respect to any proposed transaction or otherwise. You and your directors, officers, employees, agents and affiliates must hold this document and any oral information provided in connection with this document in strict confidence and may not communicate, reproduce, distr bute or disclose it to any other person, or refer to it publicly, in whole or in part at any time except with our prior written consent. If you are not the intended recipient of this document, please delete and destroy all copies immediately. We have prepared this document and the analyses contained in it based, in part, on certain assumptions and information obtained by us from the recipient, its directors, officers, employees, agents, affiliates and/or from other sources. Our use of such assumptions and information does not imply that we have independently verified or necessarily agree with any of such assumptions or information, and we have assumed and relied upon the accuracy and completeness of such assumptions and information for purposes of this document. Neither we nor any of our affiliates, or our or their respective officers, employees or agents, make any representation or warranty, express or implied, in relation to the accuracy or completeness of the information contained in this document or any oral information provided in connection herewith, or any data it generates and accept no responsibility, obligation or liability (whether direct or indirect, in contract, tort or otherwise) in relation to any of such information. We and our affiliates and our and their respective officers, employees and agents expressly disclaim any and all liability which may be based on this document and any errors therein or omissions therefrom. Neither we nor any of our affiliates, or our or their respective officers, employees or agents, make any representation or warranty, express or implied, that any transaction has been or may be effected on the terms or in the manner stated in this document, or as to the achievement or reasonableness of future projections, management targets, estimates, prospects or returns, if any. Any views or terms contained herein are preliminary only, and are based on financial, economic, market and other conditions prevailing as of the date of this document and are therefore subject to change. We undertake no obligation or responsibility to update any of the information contained in this document. Past performance does not guarantee or predict future performance. We have (i) assumed that any forecasted financial information contained herein reflects the best available estimates of future financial performance, and (ii) not made any independent valuation or appraisal of the assets or liabilities of any company involved in any proposed transaction, nor have we been furnished with any such valuations or appraisals. The purpose of this document is to provide the recipient with a preliminary valuation for discussion purposes in connection with a potential transaction. This document and the information contained herein do not constitute an offer to sell or the solicitation of an offer to buy any security, commodity or instrument or related derivative, nor do they constitute an offer or commitment to lend, syndicate or arrange a financing, underwrite or purchase or act as an agent or advisor or in any other capacity with respect to any transaction, or commit capital, or to participate in any trading strategies, and do not constitute legal, regulatory, accounting or tax advice to the recipient. We recommend that the recipient seek independent third party legal, regulatory, accounting and tax advice regarding the contents of this document. This document does not constitute and should not be considered as any form of financial opinion or recommendation by us or any of our affiliates. This document is not a research report and was not prepared by the research department of Morgan Stanley or any of its affiliates. Notwithstanding anything herein to the contrary, each recipient hereof (and their employees, representatives, and other agents) may disclose to any and all persons, without limitation of any kind from the commencement of discussions, the U.S. federal and state income tax treatment and tax structure of the proposed transaction and all materials of any kind (including opinions or other tax analyses) that are provided relating to the tax treatment and tax structure. For this purpose, tax structure is limited to facts relevant to the U.S. federal and state income tax treatment of the proposed transaction and does not include information relating to the identity of the parties, their affiliates, agents or advisors. This document is provided by Morgan Stanley & Co. LLC and/or certain of its affiliates or other applicable entities, which may include Morgan Stanley Realty Incorporated, Morgan Stanley Senior Funding, Inc., Morgan Stanley Bank, N.A., Morgan Stanley & Co. International plc, Morgan Stanley Securities Limited, Morgan Stanley Bank AG, Morgan Stanley MUFG Securities Co., Ltd., Mitsubishi UFJ Morgan Stanley Securities Co., Ltd., Morgan Stanley Asia Limited, Morgan Stanley Australia Securities Limited, Morgan Stanley Australia Limited, Morgan Stanley Asia (Singapore) Pte., Morgan Stanley Services Limited, Morgan Stanley & Co. International plc Seoul Branch and/or Morgan Stanley Canada Limited Unless governing law permits otherwise, you must contact an authorized Morgan Stanley entity in your jurisdiction regarding this document or any of the information contained herein. © Morgan Stanley and/or certain of its affiliates. All rights reserved. PROJECT ORANGE PRELIMINARY AND CONFIDENTIAL DRAFT 33