
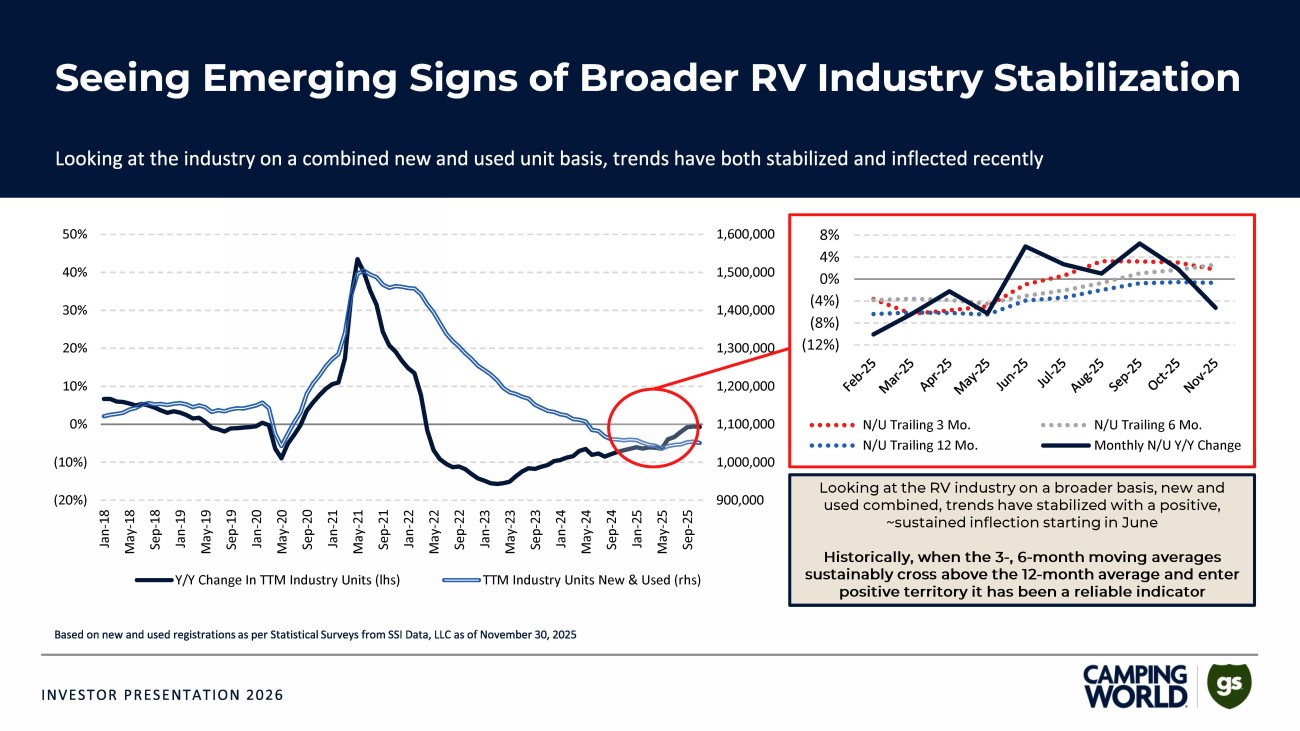
900,000 1,000,000 1,100,000 1,200,000 1,300,000 1,400,000 1,500,000 1,600,000 (20%) (10%) 0% 10% 20% 30% 40% 50% Jan-18 May-18 Sep-18 Jan-19 May-19 Sep-19 Jan-20 May-20 Sep-20 Jan-21 May-21 Sep-21 Jan-22 May-22 Sep-22 Jan-23 May-23 Sep-23 Jan-24 May-24 Sep-24 Jan-25 May-25 Sep-25 Y/Y Change In TTM Industry Units (lhs) TTM Industry Units New & Used (rhs) (12%) (8%) (4%) 0% 4% 8% N/U Trailing 3 Mo. N/U Trailing 6 Mo. N/U Trailing 12 Mo. Monthly N/U Y/Y Change Looking at the RV industry on a broader basis, new and used combined, trends have stabilized with a positive, ~sustained inflection starting in June Historically, when the 3 - , 6 - month moving averages sustainably cross above the 12 - month average and enter positive territory it has been a reliable indicator
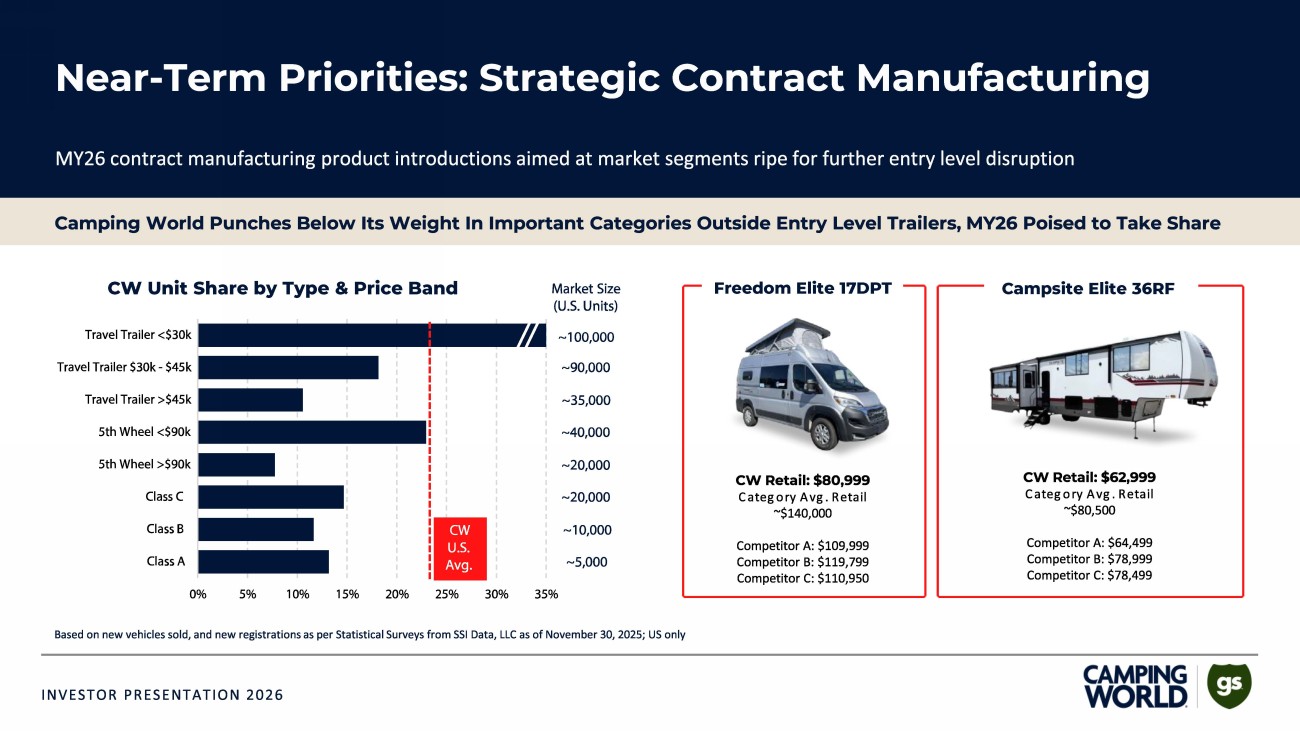
CW Unit Share by Type & Price Band Freedom Elite 17DPT Campsite Elite 36RF
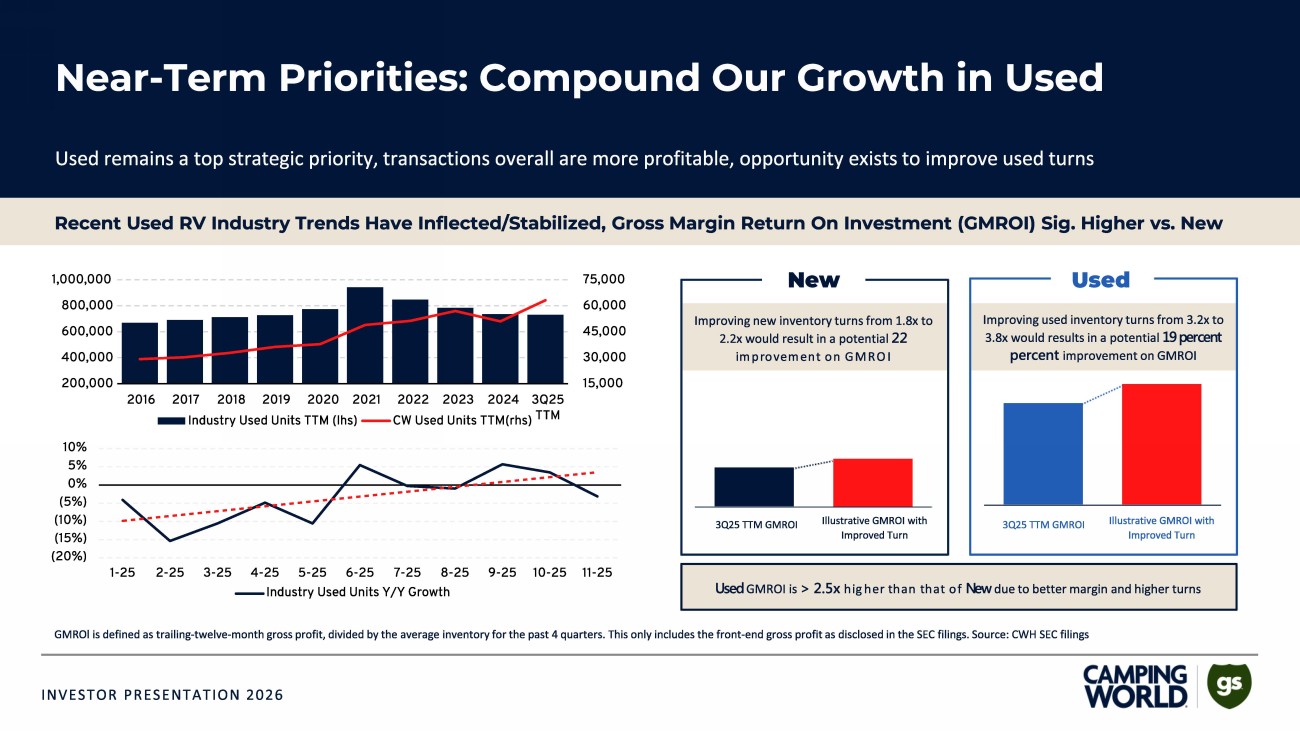
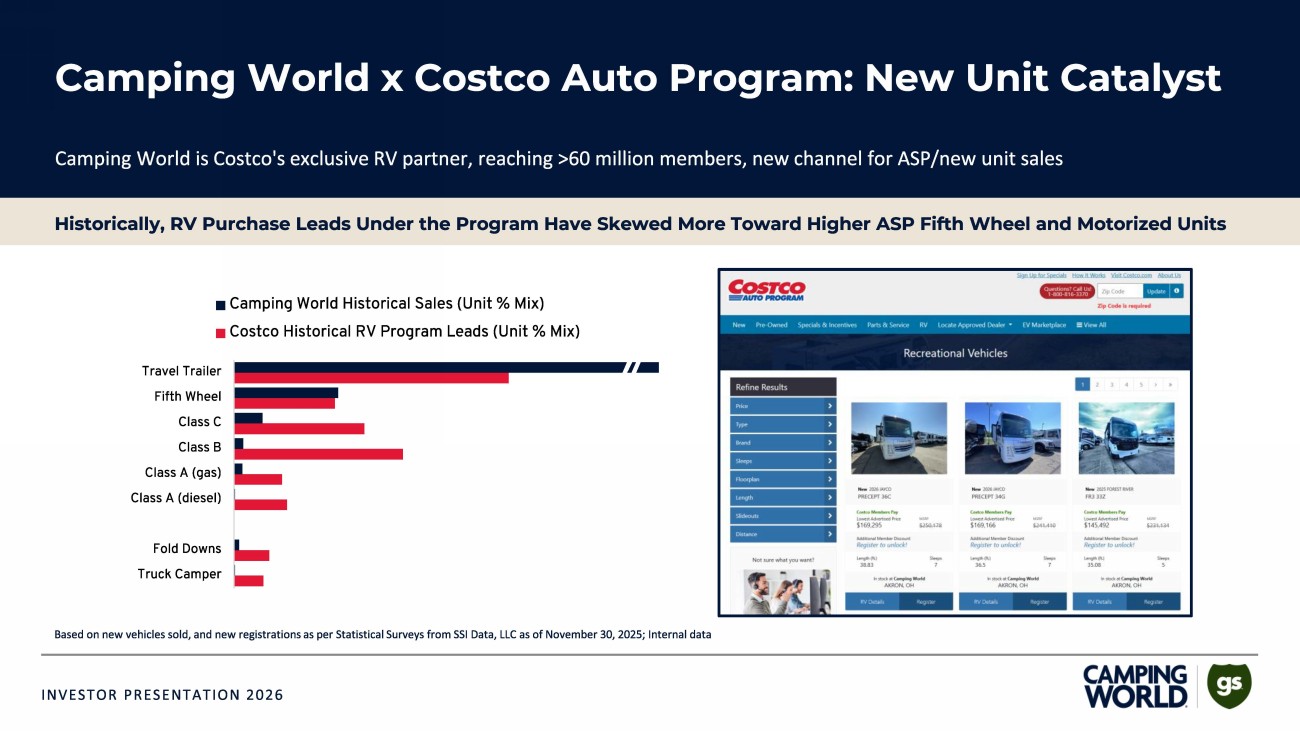
New Used
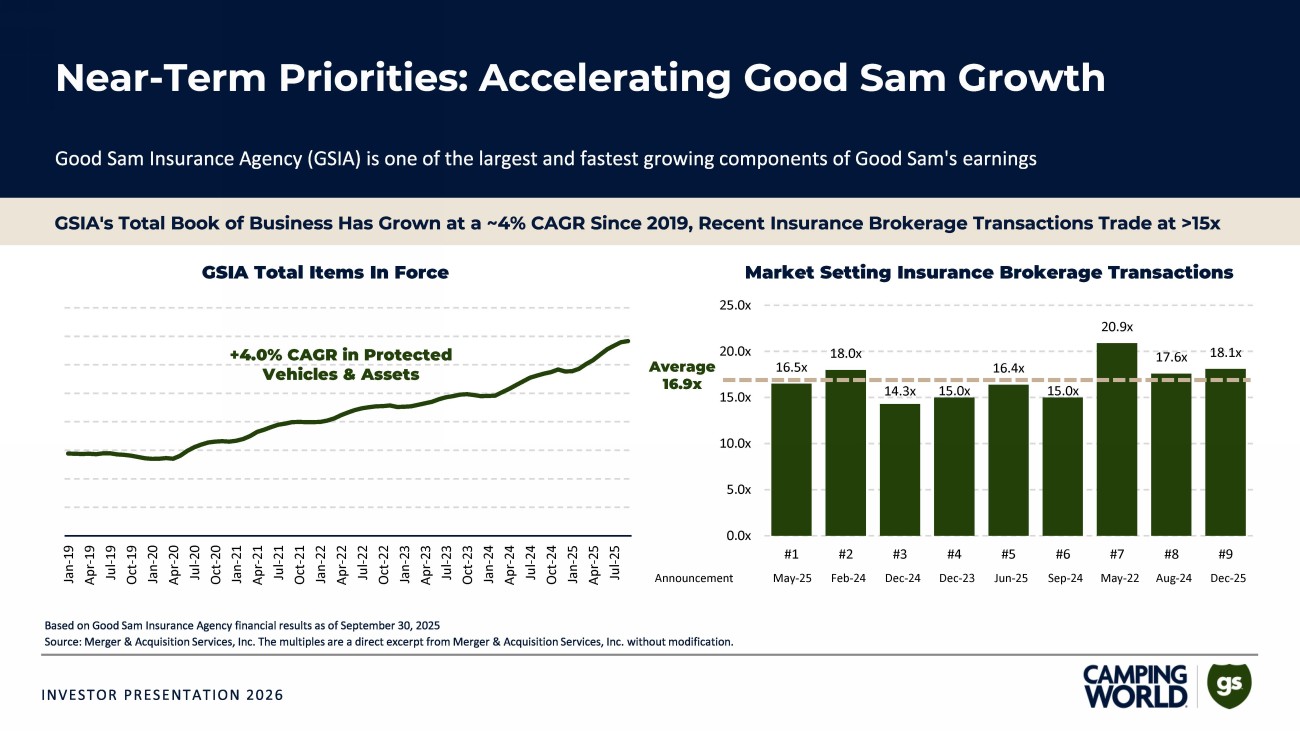
16.5x 18.0x 14.3x 15.0x 16.4x 15.0x 20.9x 17.6x 18.1x 0.0x 5.0x 10.0x 15.0x 20.0x 25.0x #1 #2 #3 #4 #5 #6 #7 #8 #9 Jan-19 Apr-19 Jul-19 Oct-19 Jan-20 Apr-20 Jul-20 Oct-20 Jan-21 Apr-21 Jul-21 Oct-21 Jan-22 Apr-22 Jul-22 Oct-22 Jan-23 Apr-23 Jul-23 Oct-23 Jan-24 Apr-24 Jul-24 Oct-24 Jan-25 Apr-25 Jul-25 Market Setting Insurance Brokerage Transactions GSIA Total Items In Force Dec - 25 Aug - 24 May - 22 Sep - 24 Jun - 25 Dec - 23 Dec - 24 Feb - 24 May - 25 Announcement Average 16.9x +4.0% CAGR in Protected Vehicles & Assets
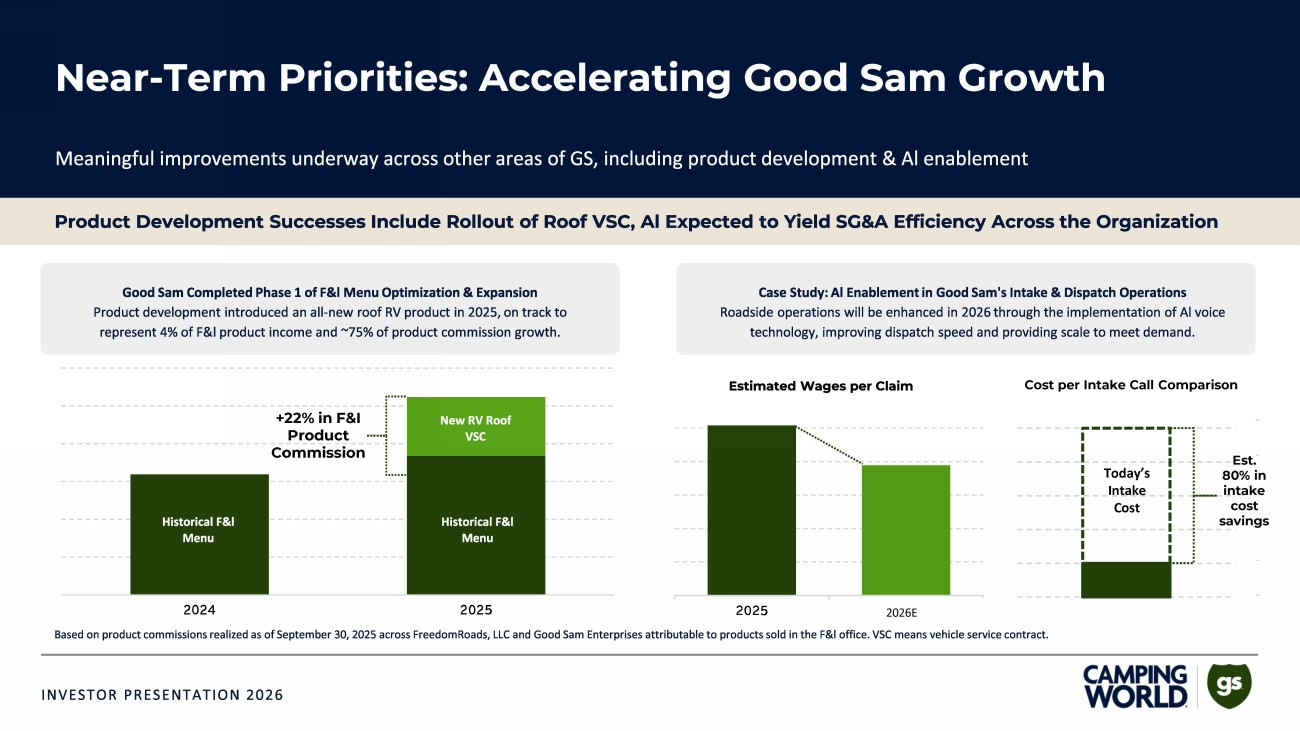
+22% in F&I Product Commission Est. 80% in intake cost savings Today’s Intake Cost Cost per Intake Call Comparison 2026E