August 10, 2026 Conduent Q2 2026 Financial Results
2 Forward-Looking Statements This presentation, any exhibits or attachments to this presentation, and other public statements we make may contain “forward-looking statements” as defined in the Private Securities Litigation Reform Act of 1995. The words “anticipate,” “believe,” “estimate,” “expect,” expectations," "in front of us," "plan," “intend,” “will,” “aim,” “should,” “could,” “forecast,” “target,” “may,” "continue to," "looking to continue," "endeavor," "if,” “growing,” “projected,” “potential,” “likely,” "see", "ahead", "further," "going forward," "on the horizon," "as we progress," "going to," "path from here forward," "think," "path to deliver," "from here," "on track," "remain" and similar expressions (including the negative and plural forms of such words and phrases), as they relate to us, are intended to identify forward-looking statements, but the absence of these words does not mean that a statement is not forward looking. All statements other than statements of historical fact included in this presentation or any attachment to this presentation are forward-looking statements, including, but not limited to, statements regarding our financial results, condition and outlook; changes in our operating results; general and market and economic conditions; and our projected financial performance, including all statements made under the section captioned “FY 2026 Outlook” within this presentation. These statements are based on our beliefs and reflect our current views with respect to future events using currently available information and are subject to certain risks, uncertainties and assumptions many of which are outside of our control, that could cause actual results to differ materially from those expected or implied by such forward-looking statements contained in this presentation, any exhibits to this presentation and other public statements we make. Important factors and uncertainties that could cause our actual results to differ materially from those in our forward-looking statements include, but are not limited to: risks related to recently announced divestitures including the sale of the Company’s (i) Public Transit business and (ii) Tolling business, including but not limited to our ability to realize the benefits anticipated from such transactions, as well as unexpected costs, liabilities or delays associated with such transactions; competitive restrictions applicable to the Company and its affiliates under the definitive transaction agreements; risks related to the equity interest in Quarterhill Inc. to be received as partial consideration in the Tolling transaction, including fluctuations in the value of such interest; government appropriations and termination rights contained in our government contracts; the impact of changes in government spending levels, budget priorities or efficiency initiatives, including federal cost- reduction programs, on demand for our government solutions and services; the competitiveness of the markets in which we operate and our ability to renew commercial and government contracts, including contracts awarded through competitive bidding processes; our ability to recover capital and other investments in connection with our contracts; the impact of geopolitical events and geopolitical tensions (such as the war in Ukraine and conflict in the Middle East), macroeconomic conditions, natural disasters and other factors in a particular country or region on our workforce, customers and vendors; the impact of changes in trade policies, tariffs or export controls on our cost structure, supply chain and business operations; our reliance on third-party providers; our ability to deliver on our contractual obligations properly and on time; changes in continued interest in outsourced business process services; the adverse effect of claims of infringement of third-party intellectual property rights; our ability to estimate the scope of work or the costs of performance in our contracts; the loss of key senior management and our ability to attract and retain necessary technical personnel and qualified subcontractors; our failure to develop new service offerings and protect our intellectual property rights; our ability to modernize our information technology infrastructure and consolidate data centers; expectations relating to environmental, social and governance considerations; utilization of our stock repurchase program; the effects related to our use of artificial intelligence on our business; the failure to comply with laws relating to individually identifiable information and personal health information; the failure to comply with laws relating to processing certain financial transactions, including payment card transactions and debit or credit card transactions; breaches of our information systems or security systems or any service interruptions; risks related to hacking or other cybersecurity threats to our data systems, information systems and network infrastructure and other service interruptions, including relating to the previously disclosed cyber event that took place in January 2025 (the “January 2025 Cyber Event”), including Conduent’s investigation of such incident and mitigation and remediation efforts, the nature and extent of such incident, the potential disruption to our business or operations, the potential impact on Conduent’s reputation, and Conduent’s assessments of the likely financial and operational impacts of such incident; our ability to comply with data security standards; developments in various contingent liabilities that are not reflected on our balance sheet, including those arising as a result of being involved in a variety of claims, lawsuits, investigations and proceedings; the impact of potential goodwill and other asset impairments on our results of operations; our significant indebtedness and the terms of such indebtedness; our failure to obtain or maintain a satisfactory credit rating and financial performance; our ability to obtain adequate pricing for our services and to improve our cost structure; our ability to collect our receivables, including those for unbilled services; a decline in revenues from, or a loss of, or a reduction in business from or failure of significant clients; fluctuations in our non-recurring revenue; increases in the cost of voice and data services or significant interruptions in such services; our ability to receive dividends or other payments from our subsidiaries; and other factors that are set forth in the “Risk Factors” section, the “Legal Proceedings” section, the “Management's Discussion and Analysis of Financial Condition and Results of Operations” section and other sections in our 2025 Annual Report on Form 10-K, as well as in our Quarterly Reports on Form 10-Q and Current Reports on Form 8-K filed with or furnished to the Securities and Exchange Commission. Any forward-looking statements made by us in this release speak only as of the date on which they are made. We are under no obligation to, and expressly disclaim any obligation to, update or alter our forward-looking statements, whether because of new information, subsequent events or otherwise, except as required by law. Cautionary Statements
3 Non-GAAP Financial Measures We have reported our financial results in accordance with accounting principles generally accepted in the U.S. (U.S. GAAP). In addition, we have discussed our financial results using non-GAAP measures for our Continuing Operations only, unless otherwise noted. We believe these non-GAAP measures allow investors to better understand the trends in our business and to better understand and compare our results. Accordingly, we believe it is necessary to adjust several reported amounts, determined in accordance with U.S. GAAP, to exclude the effects of certain items as well as their related tax effects. Management believes that these non-GAAP financial measures provide an additional means of analyzing the results of the current period against the corresponding prior period. However, these non-GAAP financial measures should be viewed in addition to, and not as a substitute for, our reported results prepared in accordance with U.S. GAAP. Our non-GAAP financial measures are not meant to be considered in isolation or as a substitute for comparable U.S. GAAP measures and should be read only in conjunction with our Consolidated Financial Statements prepared in accordance with U.S. GAAP. Our management regularly uses our non-GAAP financial measures internally to understand, manage and evaluate our business and make operating decisions. Providing such non-GAAP financial measures to investors allows for a further level of transparency as to how management reviews and evaluates our business results and trends. These non-GAAP measures are among the primary factors management uses in planning for and forecasting future periods. Compensation of our executives is based in part on the performance of our business based on certain of these non-GAAP measures. Refer to the "Non-GAAP Financial Measures" and "Non-GAAP Reconciliations" sections in this presentation for a discussion of these non-GAAP measures and their reconciliation to the reported U.S. GAAP measures. Discontinued Operations We have announced the pending sales of our Public Transit and Tolling businesses. These two pending transactions collectively represent an exit from the Transportation business, a strategic shift that will have a major effect on our operations and financial results. As such, these transactions qualify under applicable accounting guidance for reporting as discontinued operations and reclassified their results from our former Transportation segment to Discontinued Operations and no longer report results for a Transportation segment. Additionally, the related assets and liabilities associated with the discontinued operations are classified as held for sale in our condensed consolidated balance sheet for the periods presented. Unless otherwise noted, the discussion of our results is on a continuing operations basis and does not include discontinued operations. Cautionary Statements
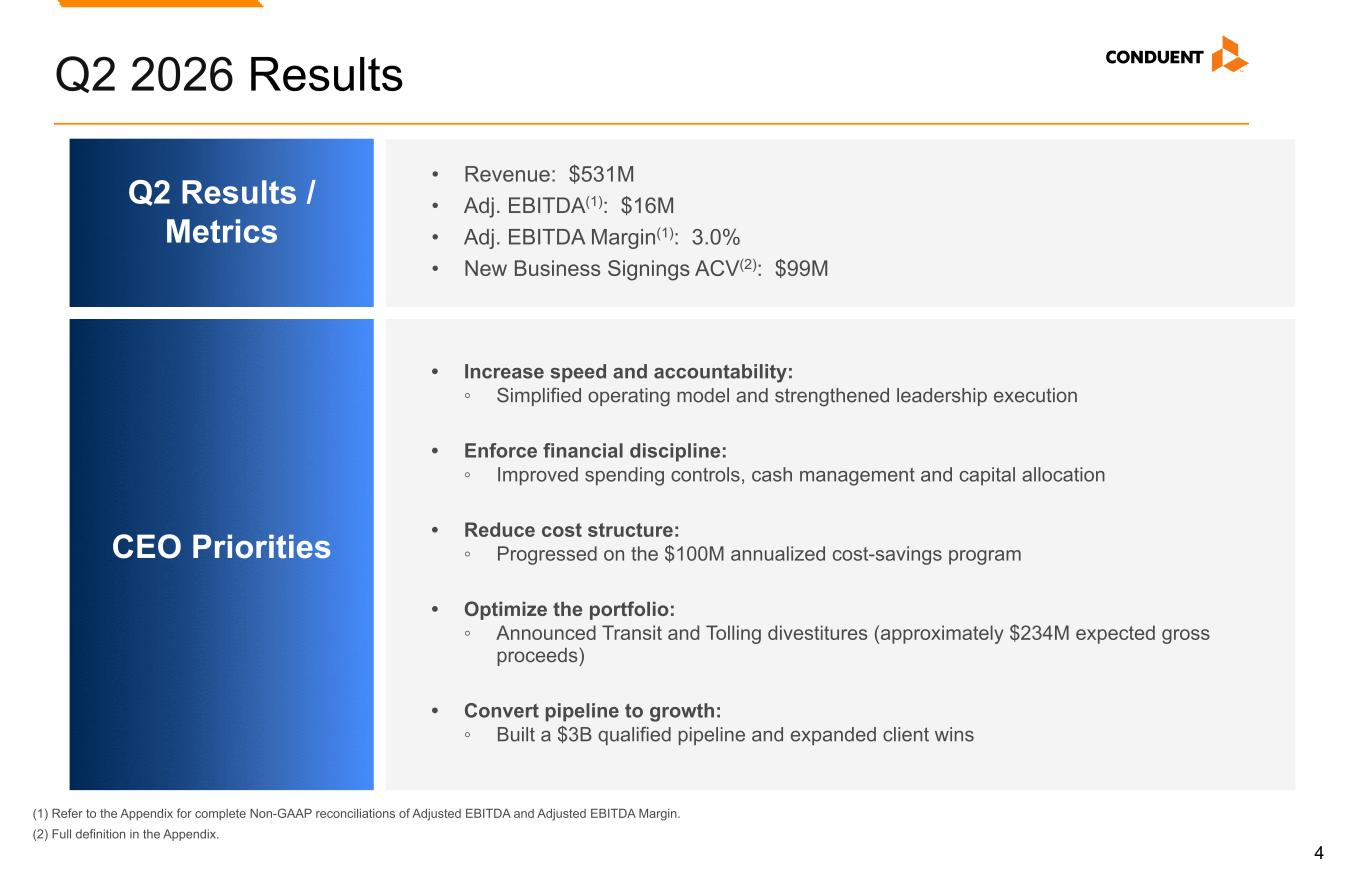
4 Q2 2026 Results (1) Refer to the Appendix for complete Non-GAAP reconciliations of Adjusted EBITDA and Adjusted EBITDA Margin. (2) Full definition in the Appendix. Q2 Results / Metrics CEO Priorities • Revenue: $531M • Adj. EBITDA(1): $16M • Adj. EBITDA Margin(1): 3.0% • New Business Signings ACV(2): $99M • Increase speed and accountability: ◦ Simplified operating model and strengthened leadership execution • Enforce financial discipline: ◦ Improved spending controls, cash management and capital allocation • Reduce cost structure: ◦ Progressed on the $100M annualized cost-savings program • Optimize the portfolio: ◦ Announced Transit and Tolling divestitures (approximately $234M expected gross proceeds) • Convert pipeline to growth: ◦ Built a $3B qualified pipeline and expanded client wins
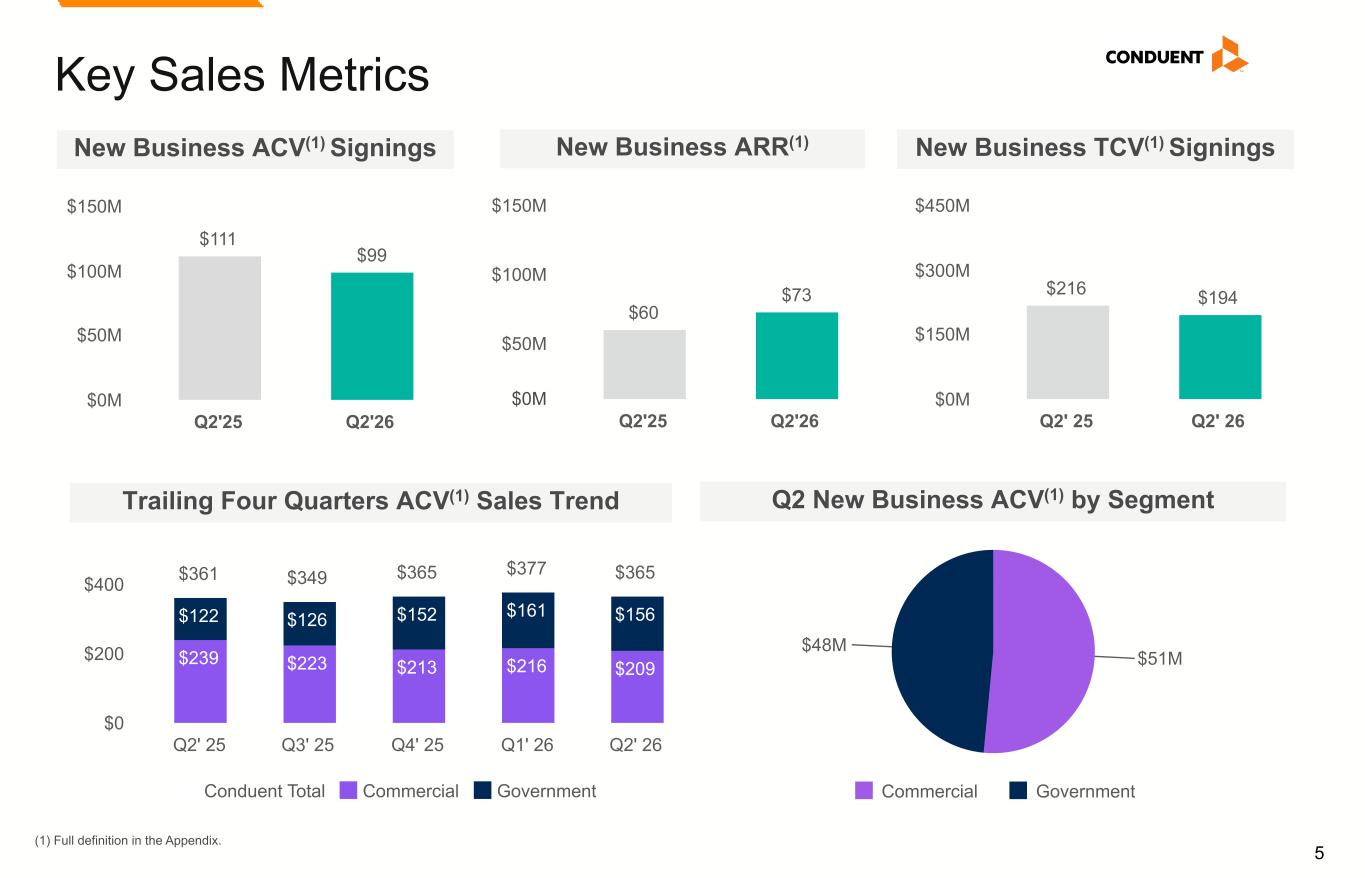
5 Key Sales Metrics New Business ACV(1) Signings Q2 New Business ACV(1) by Segment (1) Full definition in the Appendix. $216 $194 Q2' 25 Q2' 26 $0M $150M $300M $450M New Business TCV(1) Signings $60 $73 Q2'25 Q2'26 $50M $100M $150M $51M $48M Commercial Government $111 $99 Q2'25 Q2'26 $0M $50M $100M $150M New Business ARR(1) Trailing Four Quarters ACV(1) Sales Trend $361 $349 $365 $377 $365 $239 $223 $213 $216 $209 $122 $126 $152 $161 $156 Conduent Total Commercial Government Q2' 25 Q3' 25 Q4' 25 Q1' 26 Q2' 26 $0 $200 $400 $0M
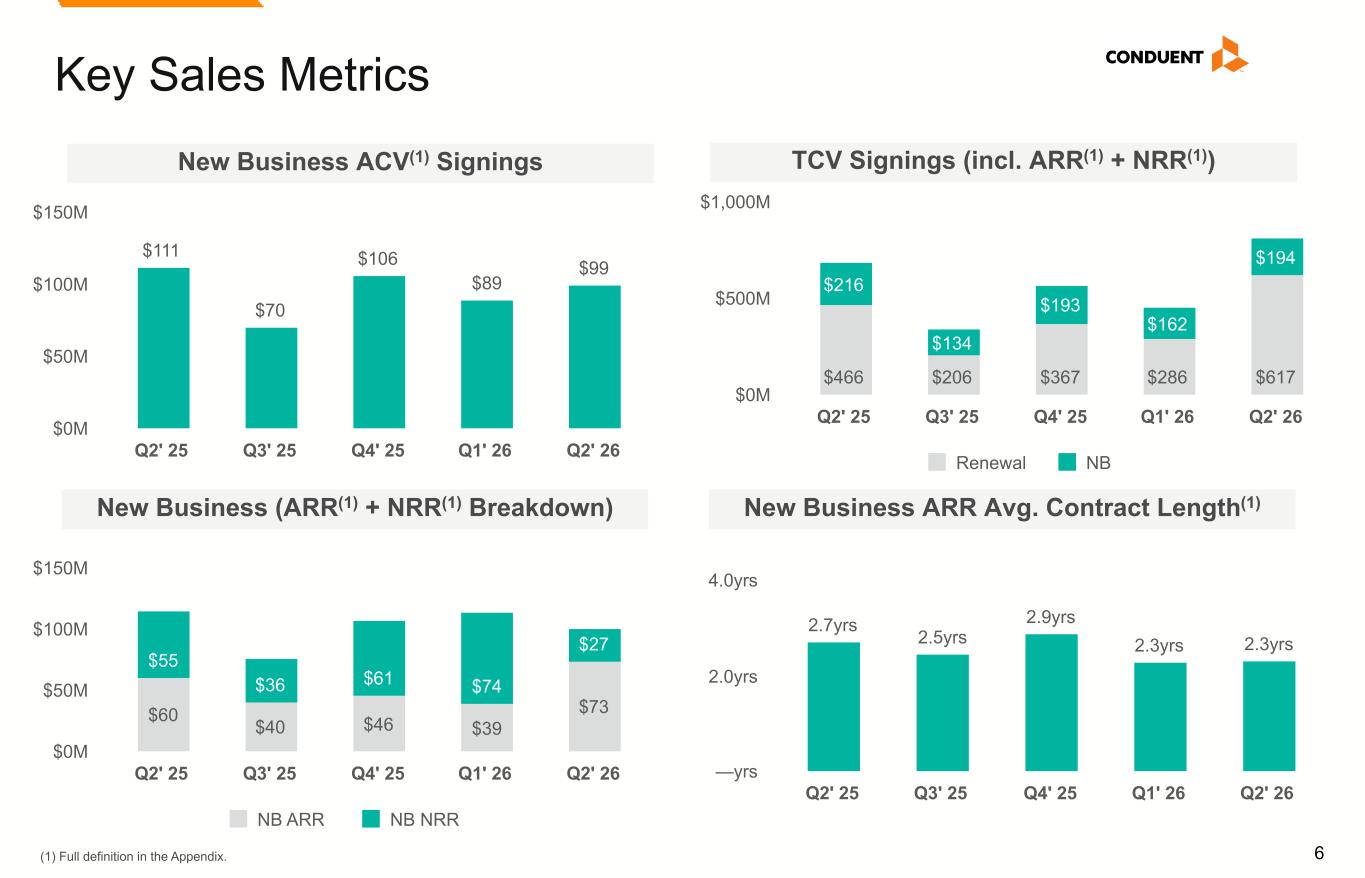
6 Key Sales Metrics TCV Signings (incl. ARR(1) + NRR(1)) $466 $206 $367 $286 $617 $216 $134 $193 $162 $194 Renewal NB Q2' 25 Q3' 25 Q4' 25 Q1' 26 Q2' 26 $0M $500M $1,000M New Business (ARR(1) + NRR(1) Breakdown) $60 $40 $46 $39 $73 $55 $36 $61 $74 $27 NB ARR NB NRR Q2' 25 Q3' 25 Q4' 25 Q1' 26 Q2' 26 $0M $50M $100M $150M New Business ARR Avg. Contract Length(1) $111 $70 $106 $89 $99 Q2' 25 Q3' 25 Q4' 25 Q1' 26 Q2' 26 $0M $50M $100M $150M New Business ACV(1) Signings 2.7yrs 2.5yrs 2.9yrs 2.3yrs 2.3yrs Q2' 25 Q3' 25 Q4' 25 Q1' 26 Q2' 26 —yrs 2.0yrs 4.0yrs (1) Full definition in the Appendix.
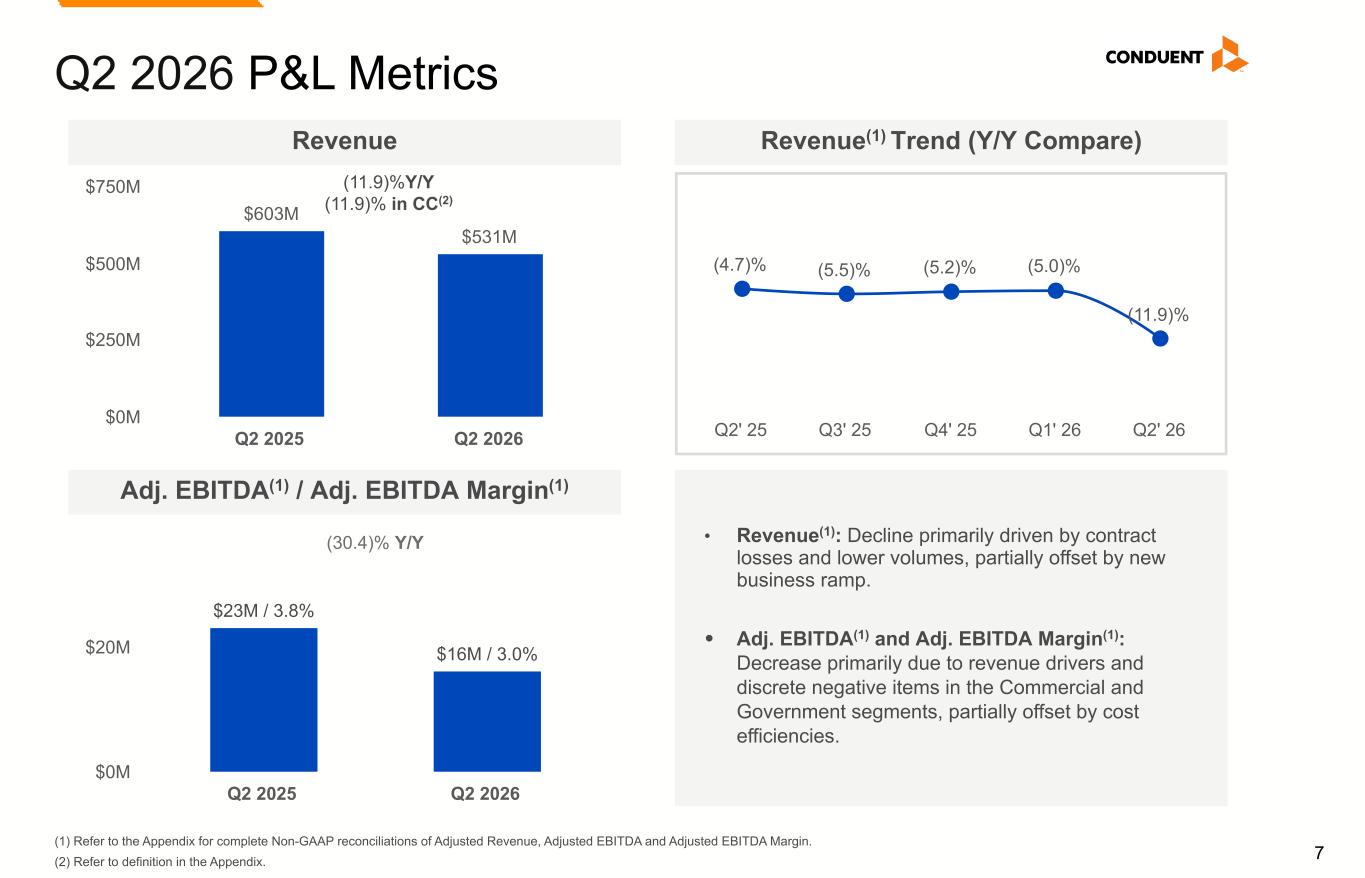
7 Q2 2026 P&L Metrics $603M $531M Q2 2025 Q2 2026 $0M $250M $500M $750M (11.9)%Y/Y (11.9)% in CC(2) Revenue $23M / 3.8% $16M / 3.0% Q2 2025 Q2 2026 $0M $20M Adj. EBITDA(1) / Adj. EBITDA Margin(1) (30.4)% Y/Y • Revenue(1): Decline primarily driven by contract losses and lower volumes, partially offset by new business ramp. • Adj. EBITDA(1) and Adj. EBITDA Margin(1): Decrease primarily due to revenue drivers and discrete negative items in the Commercial and Government segments, partially offset by cost efficiencies. (4.7)% (5.5)% (5.2)% (5.0)% (11.9)% Q2' 25 Q3' 25 Q4' 25 Q1' 26 Q2' 26 Revenue(1) Trend (Y/Y Compare) (1) Refer to the Appendix for complete Non-GAAP reconciliations of Adjusted Revenue, Adjusted EBITDA and Adjusted EBITDA Margin. (2) Refer to definition in the Appendix.
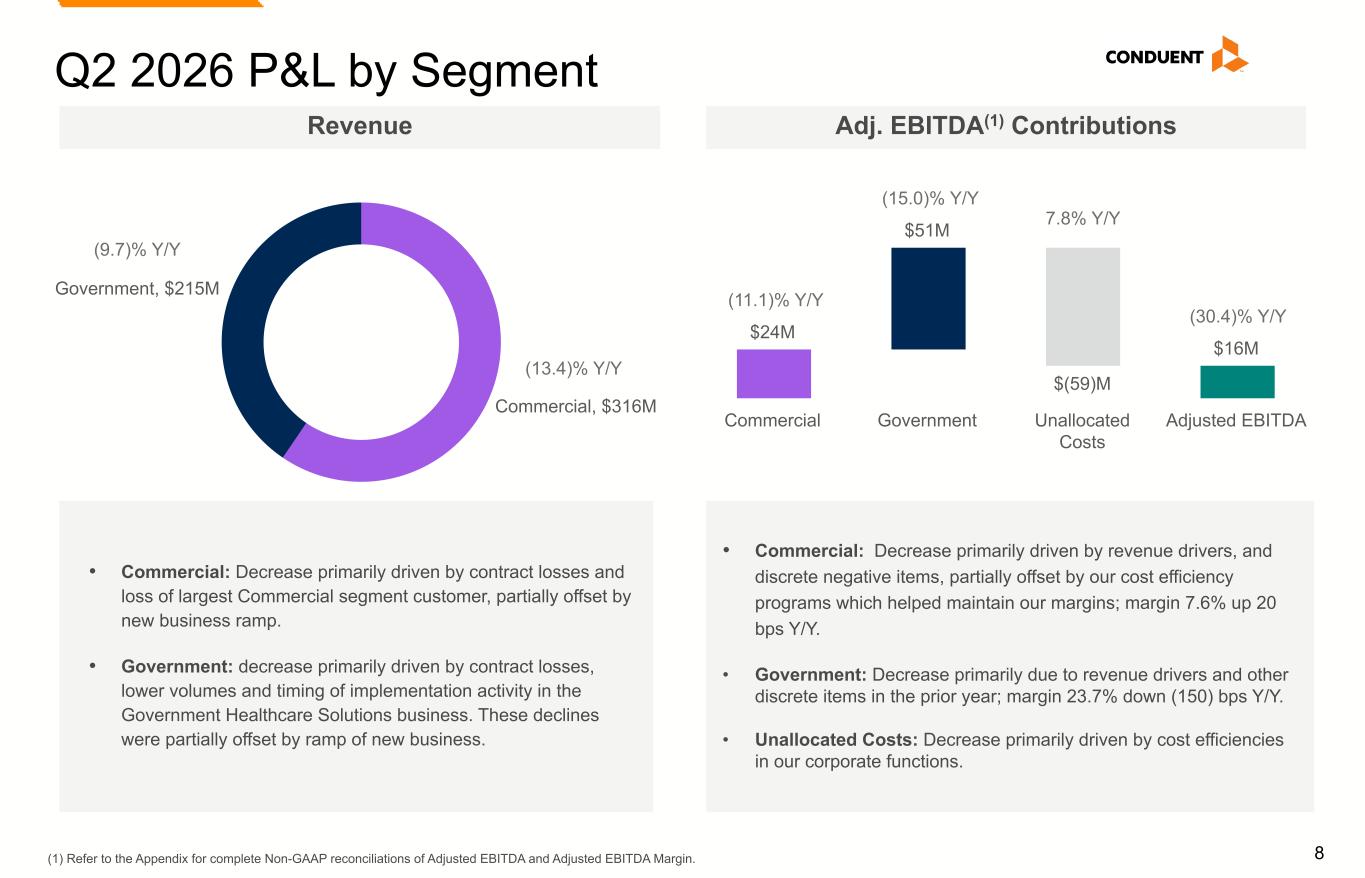
8 $24M $51M $(59)M $16M Commercial Government Unallocated Costs Adjusted EBITDA Commercial, $316M Government, $215M Q2 2026 P&L by Segment (1) Refer to the Appendix for complete Non-GAAP reconciliations of Adjusted EBITDA and Adjusted EBITDA Margin. (9.7)% Y/Y (13.4)% Y/Y (15.0)% Y/Y (11.1)% Y/Y Revenue Adj. EBITDA(1) Contributions (30.4)% Y/Y 7.8% Y/Y • Commercial: Decrease primarily driven by contract losses and loss of largest Commercial segment customer, partially offset by new business ramp. • Government: decrease primarily driven by contract losses, lower volumes and timing of implementation activity in the Government Healthcare Solutions business. These declines were partially offset by ramp of new business. • Commercial: Decrease primarily driven by revenue drivers, and discrete negative items, partially offset by our cost efficiency programs which helped maintain our margins; margin 7.6% up 20 bps Y/Y. • Government: Decrease primarily due to revenue drivers and other discrete items in the prior year; margin 23.7% down (150) bps Y/Y. • Unallocated Costs: Decrease primarily driven by cost efficiencies in our corporate functions.
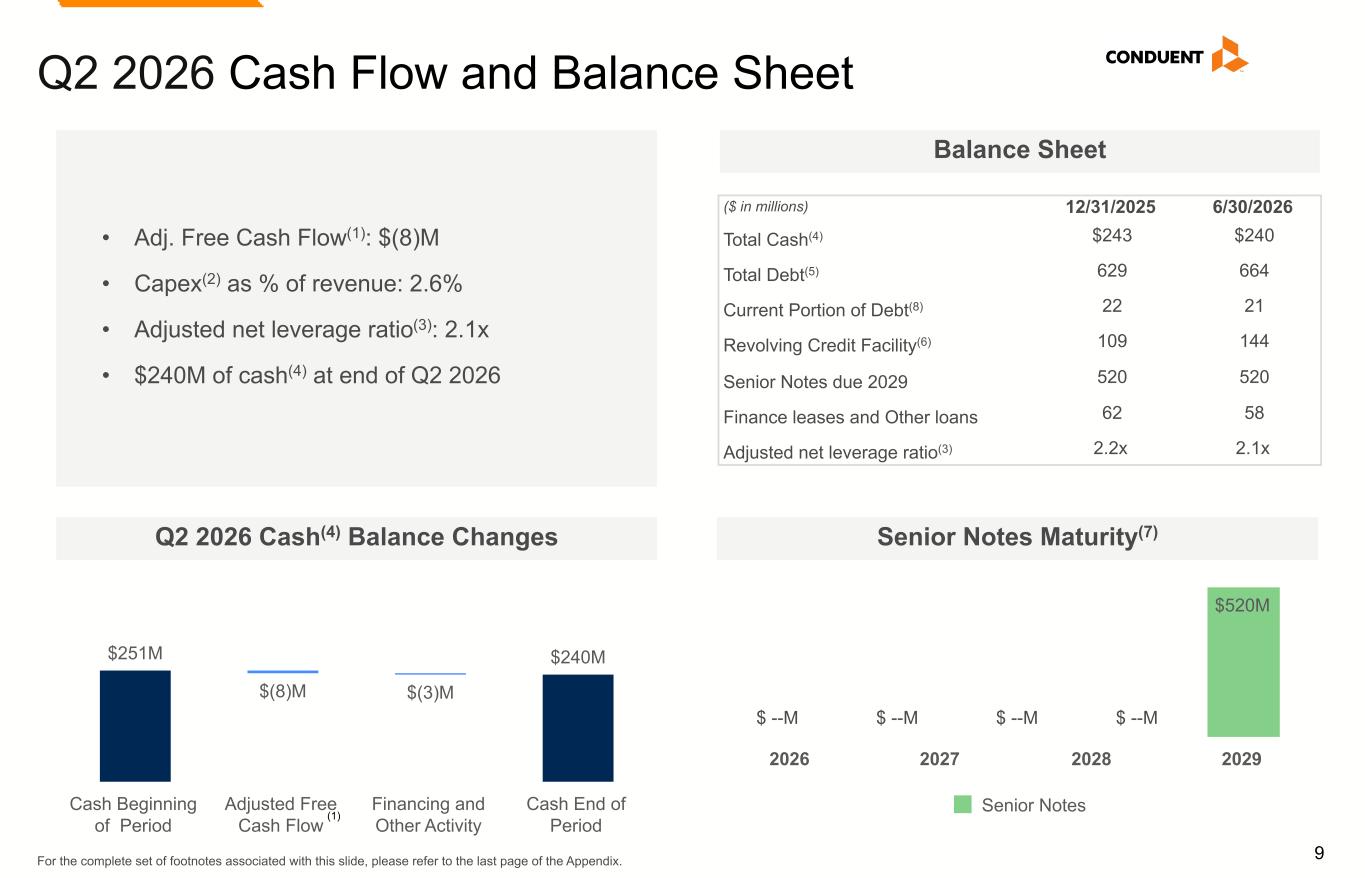
9 $520M Senior Notes 2026 2027 2028 2029 Q2 2026 Cash Flow and Balance Sheet Q2 2026 Cash(4) Balance Changes Balance Sheet For the complete set of footnotes associated with this slide, please refer to the last page of the Appendix. ($ in millions) 12/31/2025 6/30/2026 Total Cash(4) $243 $240 Total Debt(5) 629 664 Current Portion of Debt(8) 22 21 Revolving Credit Facility(6) 109 144 Senior Notes due 2029 520 520 Finance leases and Other loans 62 58 Adjusted net leverage ratio(3) 2.2x 2.1x Senior Notes Maturity(7) $251M $(8)M $(3)M $240M Cash Beginning of Period Adjusted Free Cash Flow Financing and Other Activity Cash End of Period • Adj. Free Cash Flow(1): $(8)M • Capex(2) as % of revenue: 2.6% • Adjusted net leverage ratio(3): 2.1x • $240M of cash(4) at end of Q2 2026 (1) $ --M $ --M$ --M $ --M
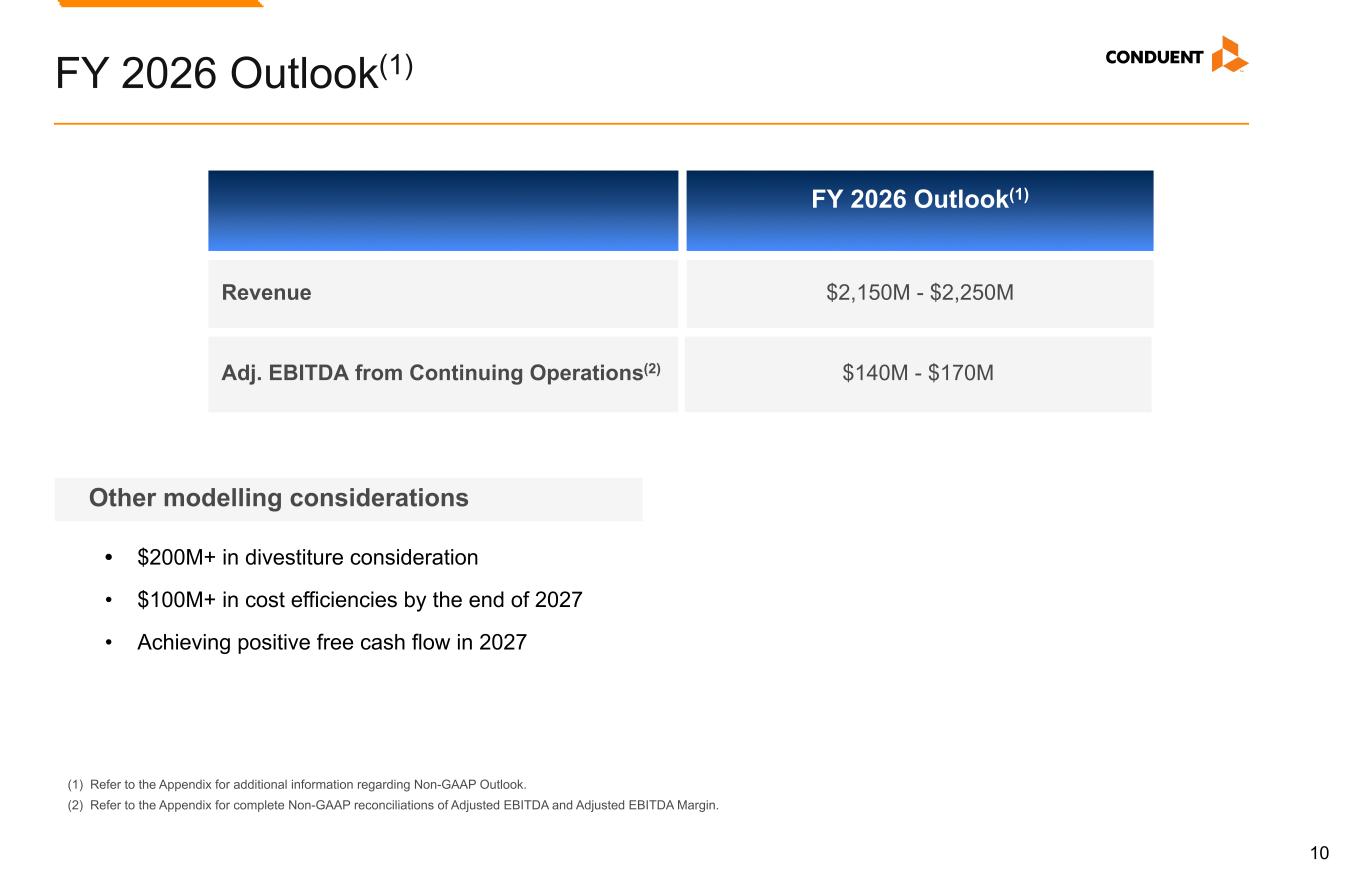
10 FY 2026 Outlook(1) (1) Refer to the Appendix for additional information regarding Non-GAAP Outlook. (2) Refer to the Appendix for complete Non-GAAP reconciliations of Adjusted EBITDA and Adjusted EBITDA Margin. $2,150M - $2,250MRevenue Adj. EBITDA from Continuing Operations(2) $140M - $170M FY 2026 Outlook(1) • $200M+ in divestiture consideration • $100M+ in cost efficiencies by the end of 2027 • Achieving positive free cash flow in 2027 Other modelling considerations
Appendix
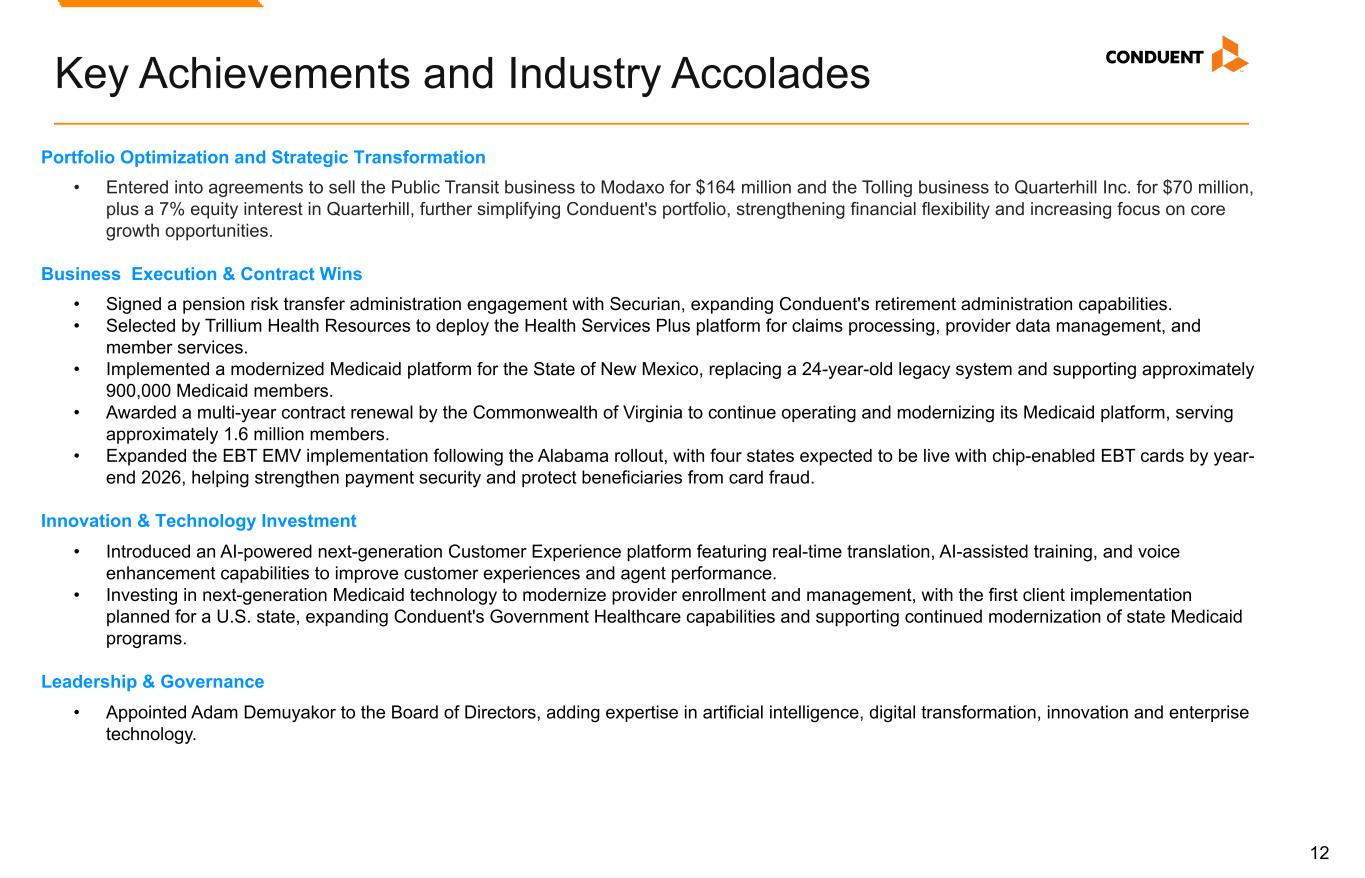
12 Key Achievements and Industry Accolades Portfolio Optimization and Strategic Transformation • Entered into agreements to sell the Public Transit business to Modaxo for $164 million and the Tolling business to Quarterhill Inc. for $70 million, plus a 7% equity interest in Quarterhill, further simplifying Conduent's portfolio, strengthening financial flexibility and increasing focus on core growth opportunities. Business Execution & Contract Wins • Signed a pension risk transfer administration engagement with Securian, expanding Conduent's retirement administration capabilities. • Selected by Trillium Health Resources to deploy the Health Services Plus platform for claims processing, provider data management, and member services. • Implemented a modernized Medicaid platform for the State of New Mexico, replacing a 24-year-old legacy system and supporting approximately 900,000 Medicaid members. • Awarded a multi-year contract renewal by the Commonwealth of Virginia to continue operating and modernizing its Medicaid platform, serving approximately 1.6 million members. • Expanded the EBT EMV implementation following the Alabama rollout, with four states expected to be live with chip-enabled EBT cards by year- end 2026, helping strengthen payment security and protect beneficiaries from card fraud. Innovation & Technology Investment • Introduced an AI-powered next-generation Customer Experience platform featuring real-time translation, AI-assisted training, and voice enhancement capabilities to improve customer experiences and agent performance. • Investing in next-generation Medicaid technology to modernize provider enrollment and management, with the first client implementation planned for a U.S. state, expanding Conduent's Government Healthcare capabilities and supporting continued modernization of state Medicaid programs. Leadership & Governance • Appointed Adam Demuyakor to the Board of Directors, adding expertise in artificial intelligence, digital transformation, innovation and enterprise technology.
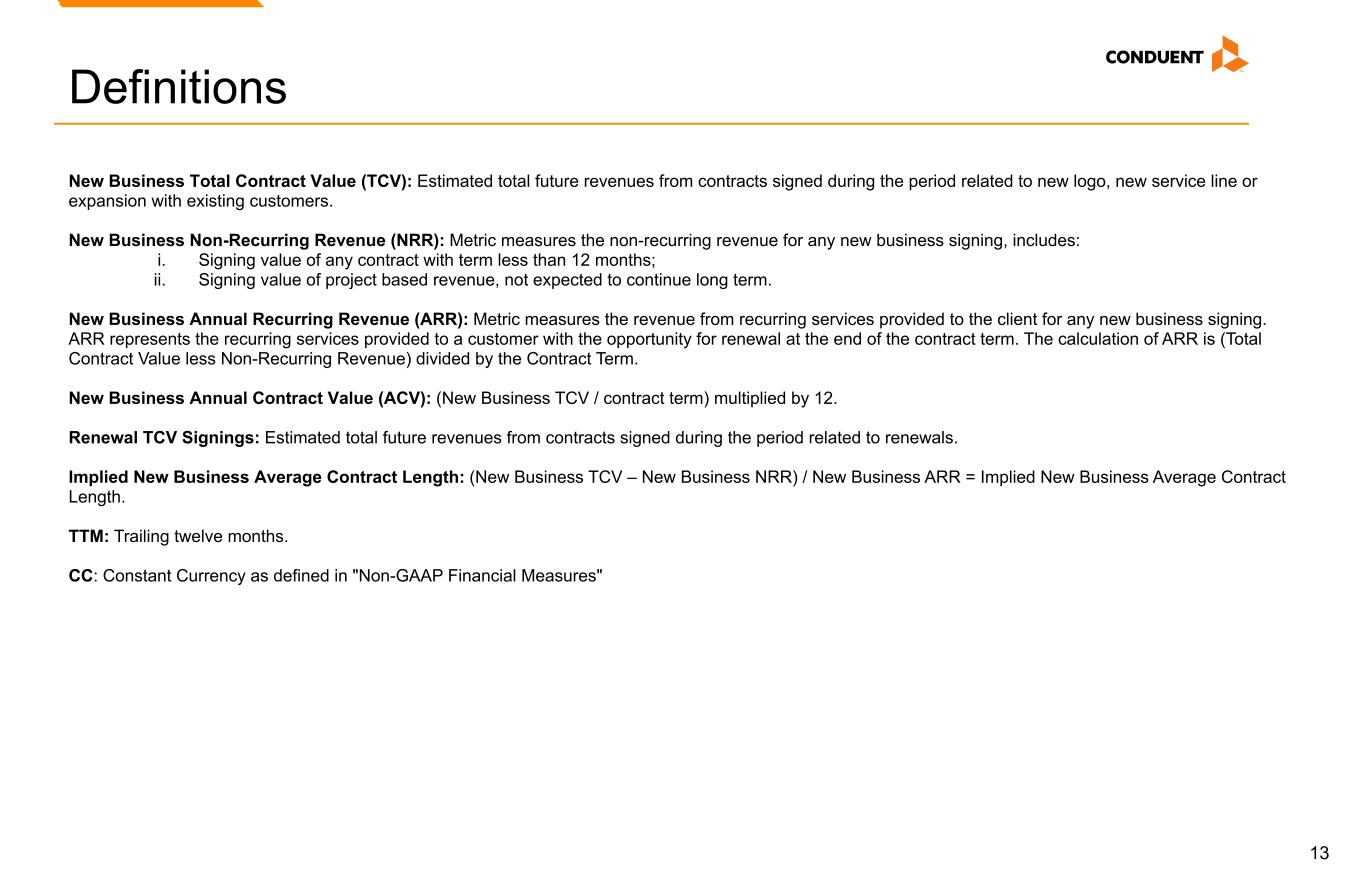
13 Definitions New Business Total Contract Value (TCV): Estimated total future revenues from contracts signed during the period related to new logo, new service line or expansion with existing customers. New Business Non-Recurring Revenue (NRR): Metric measures the non-recurring revenue for any new business signing, includes: i. Signing value of any contract with term less than 12 months; ii. Signing value of project based revenue, not expected to continue long term. New Business Annual Recurring Revenue (ARR): Metric measures the revenue from recurring services provided to the client for any new business signing. ARR represents the recurring services provided to a customer with the opportunity for renewal at the end of the contract term. The calculation of ARR is (Total Contract Value less Non-Recurring Revenue) divided by the Contract Term. New Business Annual Contract Value (ACV): (New Business TCV / contract term) multiplied by 12. Renewal TCV Signings: Estimated total future revenues from contracts signed during the period related to renewals. Implied New Business Average Contract Length: (New Business TCV – New Business NRR) / New Business ARR = Implied New Business Average Contract Length. TTM: Trailing twelve months. CC: Constant Currency as defined in "Non-GAAP Financial Measures"
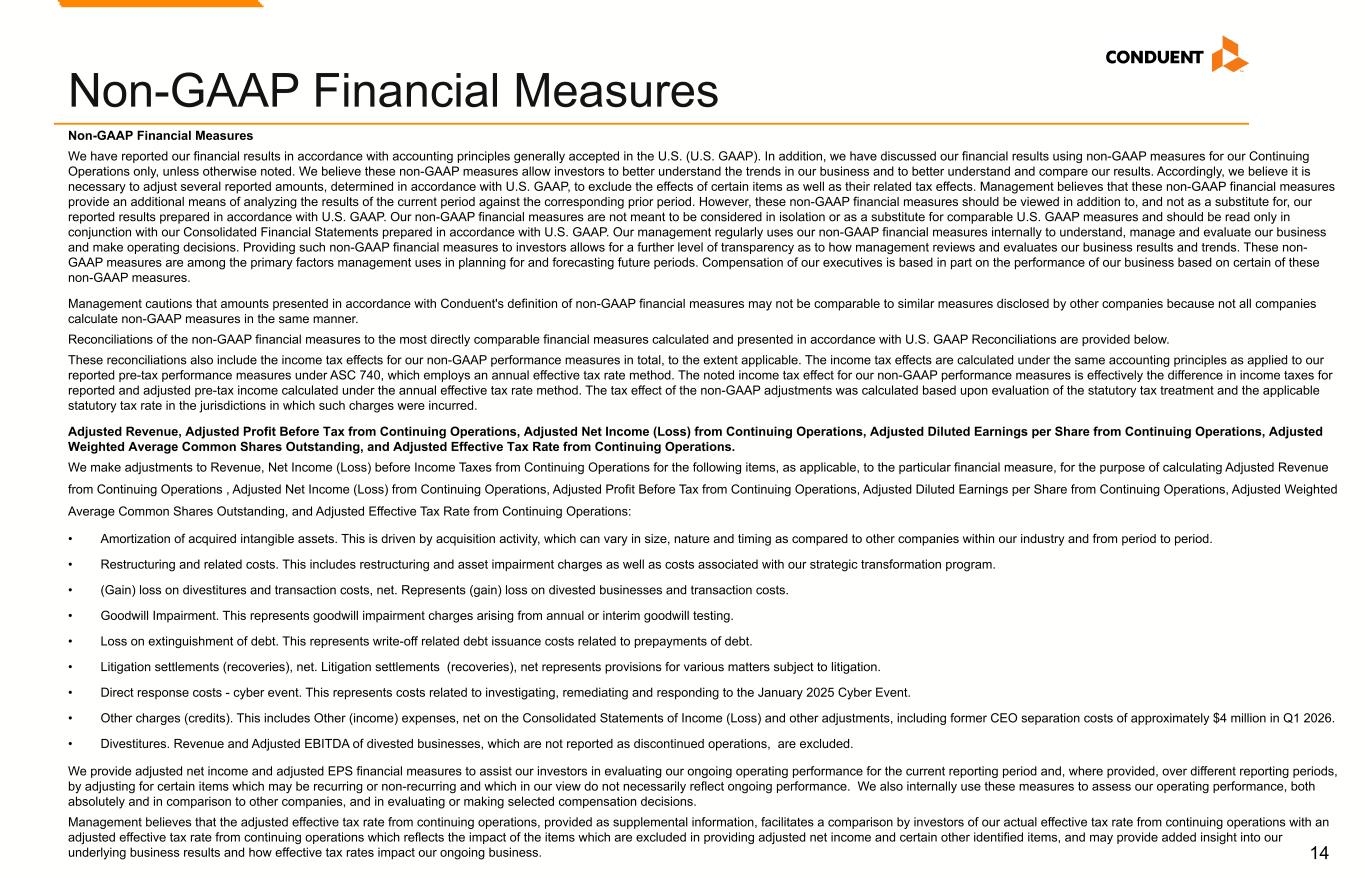
14 Non-GAAP Financial Measures We have reported our financial results in accordance with accounting principles generally accepted in the U.S. (U.S. GAAP). In addition, we have discussed our financial results using non-GAAP measures for our Continuing Operations only, unless otherwise noted. We believe these non-GAAP measures allow investors to better understand the trends in our business and to better understand and compare our results. Accordingly, we believe it is necessary to adjust several reported amounts, determined in accordance with U.S. GAAP, to exclude the effects of certain items as well as their related tax effects. Management believes that these non-GAAP financial measures provide an additional means of analyzing the results of the current period against the corresponding prior period. However, these non-GAAP financial measures should be viewed in addition to, and not as a substitute for, our reported results prepared in accordance with U.S. GAAP. Our non-GAAP financial measures are not meant to be considered in isolation or as a substitute for comparable U.S. GAAP measures and should be read only in conjunction with our Consolidated Financial Statements prepared in accordance with U.S. GAAP. Our management regularly uses our non-GAAP financial measures internally to understand, manage and evaluate our business and make operating decisions. Providing such non-GAAP financial measures to investors allows for a further level of transparency as to how management reviews and evaluates our business results and trends. These non- GAAP measures are among the primary factors management uses in planning for and forecasting future periods. Compensation of our executives is based in part on the performance of our business based on certain of these non-GAAP measures. Management cautions that amounts presented in accordance with Conduent's definition of non-GAAP financial measures may not be comparable to similar measures disclosed by other companies because not all companies calculate non-GAAP measures in the same manner. Reconciliations of the non-GAAP financial measures to the most directly comparable financial measures calculated and presented in accordance with U.S. GAAP Reconciliations are provided below. These reconciliations also include the income tax effects for our non-GAAP performance measures in total, to the extent applicable. The income tax effects are calculated under the same accounting principles as applied to our reported pre-tax performance measures under ASC 740, which employs an annual effective tax rate method. The noted income tax effect for our non-GAAP performance measures is effectively the difference in income taxes for reported and adjusted pre-tax income calculated under the annual effective tax rate method. The tax effect of the non-GAAP adjustments was calculated based upon evaluation of the statutory tax treatment and the applicable statutory tax rate in the jurisdictions in which such charges were incurred. Adjusted Revenue, Adjusted Profit Before Tax from Continuing Operations, Adjusted Net Income (Loss) from Continuing Operations, Adjusted Diluted Earnings per Share from Continuing Operations, Adjusted Weighted Average Common Shares Outstanding, and Adjusted Effective Tax Rate from Continuing Operations. We make adjustments to Revenue, Net Income (Loss) before Income Taxes from Continuing Operations for the following items, as applicable, to the particular financial measure, for the purpose of calculating Adjusted Revenue from Continuing Operations , Adjusted Net Income (Loss) from Continuing Operations, Adjusted Profit Before Tax from Continuing Operations, Adjusted Diluted Earnings per Share from Continuing Operations, Adjusted Weighted Average Common Shares Outstanding, and Adjusted Effective Tax Rate from Continuing Operations: • Amortization of acquired intangible assets. This is driven by acquisition activity, which can vary in size, nature and timing as compared to other companies within our industry and from period to period. • Restructuring and related costs. This includes restructuring and asset impairment charges as well as costs associated with our strategic transformation program. • (Gain) loss on divestitures and transaction costs, net. Represents (gain) loss on divested businesses and transaction costs. • Goodwill Impairment. This represents goodwill impairment charges arising from annual or interim goodwill testing. • Loss on extinguishment of debt. This represents write-off related debt issuance costs related to prepayments of debt. • Litigation settlements (recoveries), net. Litigation settlements (recoveries), net represents provisions for various matters subject to litigation. • Direct response costs - cyber event. This represents costs related to investigating, remediating and responding to the January 2025 Cyber Event. • Other charges (credits). This includes Other (income) expenses, net on the Consolidated Statements of Income (Loss) and other adjustments, including former CEO separation costs of approximately $4 million in Q1 2026. • Divestitures. Revenue and Adjusted EBITDA of divested businesses, which are not reported as discontinued operations, are excluded. We provide adjusted net income and adjusted EPS financial measures to assist our investors in evaluating our ongoing operating performance for the current reporting period and, where provided, over different reporting periods, by adjusting for certain items which may be recurring or non-recurring and which in our view do not necessarily reflect ongoing performance. We also internally use these measures to assess our operating performance, both absolutely and in comparison to other companies, and in evaluating or making selected compensation decisions. Management believes that the adjusted effective tax rate from continuing operations, provided as supplemental information, facilitates a comparison by investors of our actual effective tax rate from continuing operations with an adjusted effective tax rate from continuing operations which reflects the impact of the items which are excluded in providing adjusted net income and certain other identified items, and may provide added insight into our underlying business results and how effective tax rates impact our ongoing business. Non-GAAP Financial Measures
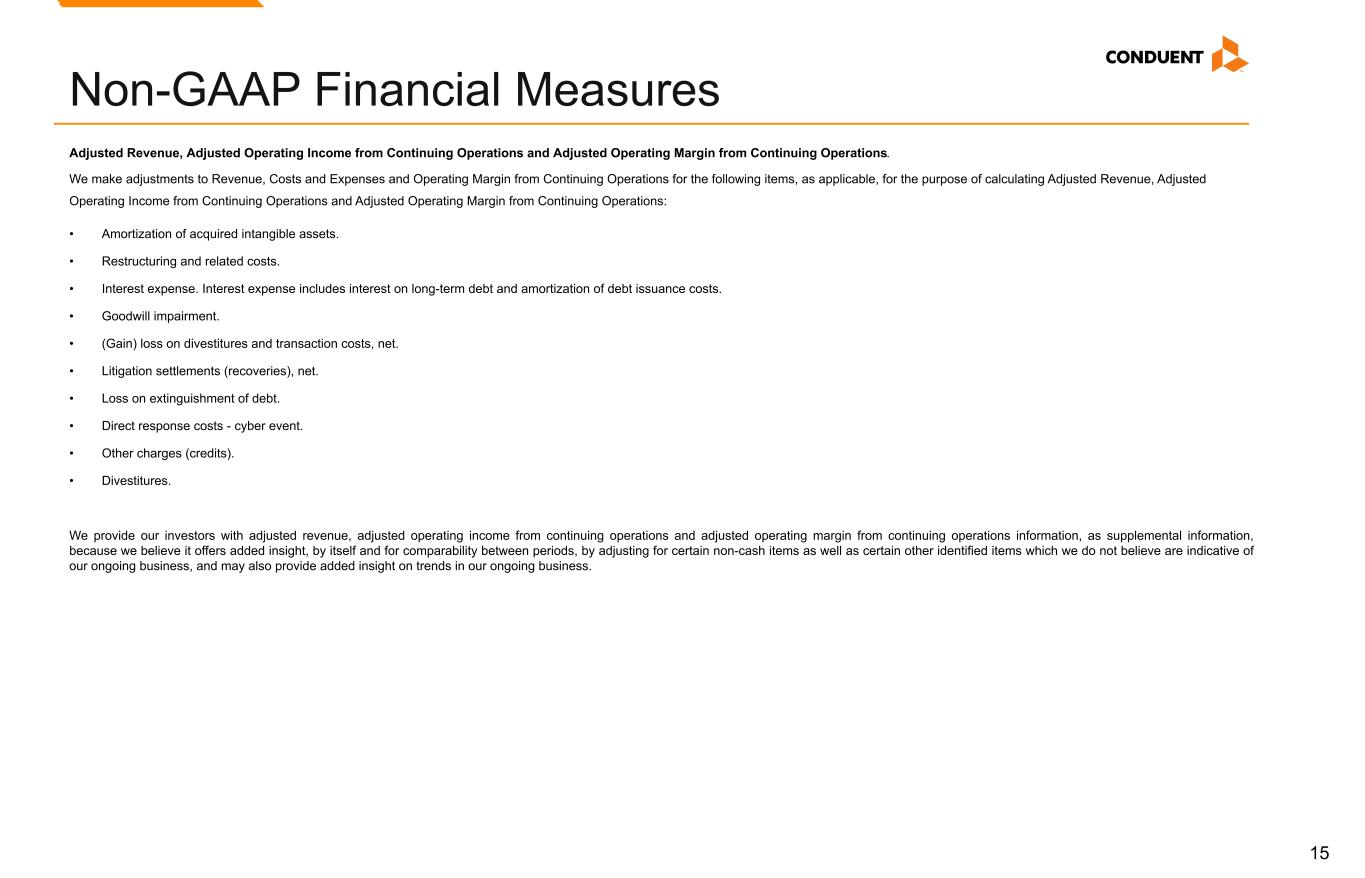
15 Adjusted Revenue, Adjusted Operating Income from Continuing Operations and Adjusted Operating Margin from Continuing Operations. We make adjustments to Revenue, Costs and Expenses and Operating Margin from Continuing Operations for the following items, as applicable, for the purpose of calculating Adjusted Revenue, Adjusted Operating Income from Continuing Operations and Adjusted Operating Margin from Continuing Operations: • Amortization of acquired intangible assets. • Restructuring and related costs. • Interest expense. Interest expense includes interest on long-term debt and amortization of debt issuance costs. • Goodwill impairment. • (Gain) loss on divestitures and transaction costs, net. • Litigation settlements (recoveries), net. • Loss on extinguishment of debt. • Direct response costs - cyber event. • Other charges (credits). • Divestitures. We provide our investors with adjusted revenue, adjusted operating income from continuing operations and adjusted operating margin from continuing operations information, as supplemental information, because we believe it offers added insight, by itself and for comparability between periods, by adjusting for certain non-cash items as well as certain other identified items which we do not believe are indicative of our ongoing business, and may also provide added insight on trends in our ongoing business. Non-GAAP Financial Measures
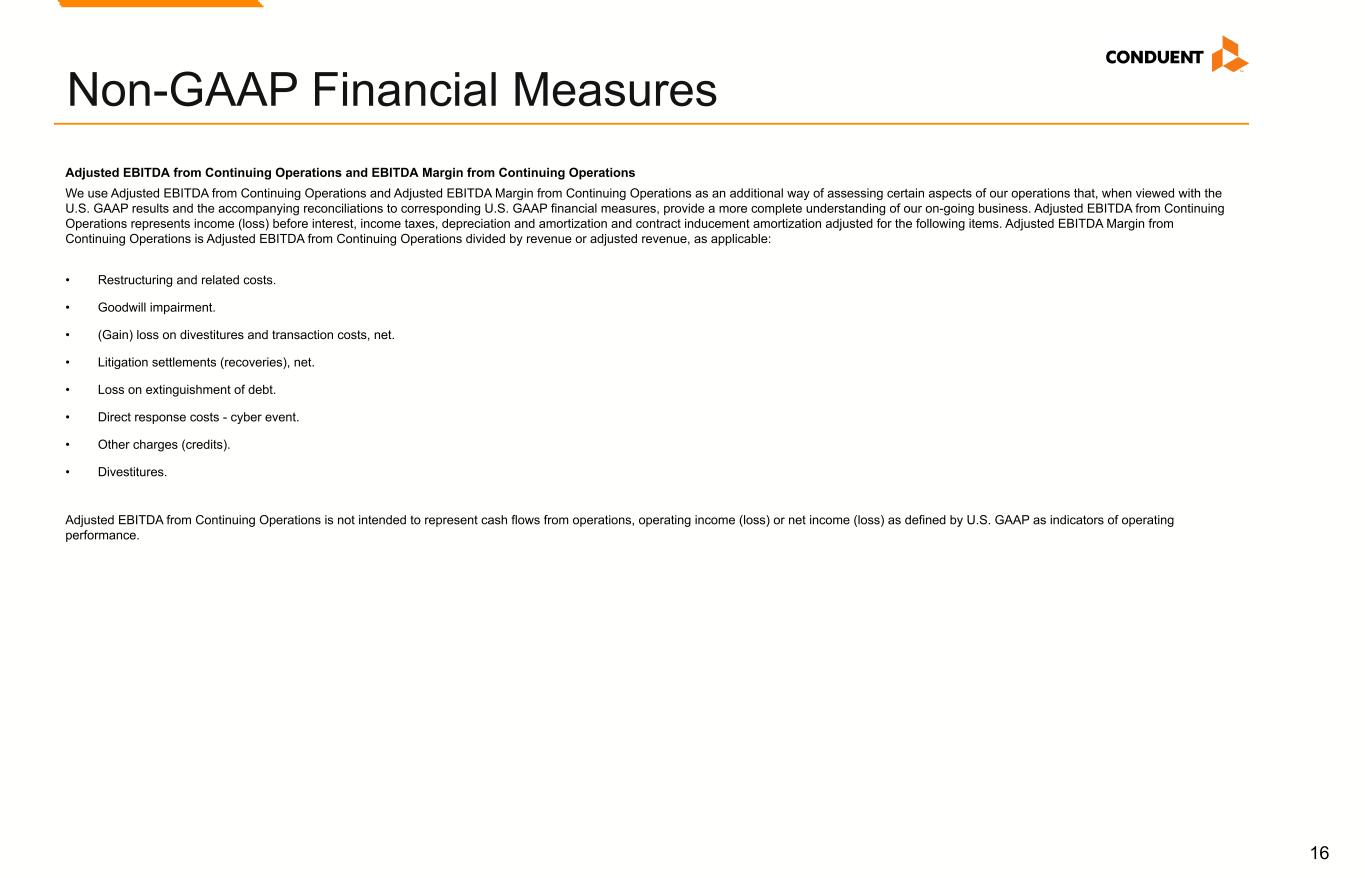
16 Adjusted EBITDA from Continuing Operations and EBITDA Margin from Continuing Operations We use Adjusted EBITDA from Continuing Operations and Adjusted EBITDA Margin from Continuing Operations as an additional way of assessing certain aspects of our operations that, when viewed with the U.S. GAAP results and the accompanying reconciliations to corresponding U.S. GAAP financial measures, provide a more complete understanding of our on-going business. Adjusted EBITDA from Continuing Operations represents income (loss) before interest, income taxes, depreciation and amortization and contract inducement amortization adjusted for the following items. Adjusted EBITDA Margin from Continuing Operations is Adjusted EBITDA from Continuing Operations divided by revenue or adjusted revenue, as applicable: • Restructuring and related costs. • Goodwill impairment. • (Gain) loss on divestitures and transaction costs, net. • Litigation settlements (recoveries), net. • Loss on extinguishment of debt. • Direct response costs - cyber event. • Other charges (credits). • Divestitures. Adjusted EBITDA from Continuing Operations is not intended to represent cash flows from operations, operating income (loss) or net income (loss) as defined by U.S. GAAP as indicators of operating performance. Non-GAAP Financial Measures
17 Free Cash Flow Free Cash Flow is defined as cash flows from operating activities as reported on the consolidated statement of cash flows, less cost of additions to land, buildings and equipment, cost of additions to internal use software, and proceeds from sales of land, buildings and equipment, as applicable. We use the non-GAAP measure of Free Cash Flow as a criterion of liquidity. We use Free Cash Flow as a measure of liquidity to determine amounts we can reinvest in our core businesses, such as amounts available to make acquisitions and invest in land, buildings and equipment and internal use software, after required payments on debt. In order to provide a meaningful basis for comparison, we are providing information with respect to our Free Cash Flow reconciled to cash flow provided by operating activities, which we believe to be the most directly comparable measure under U.S. GAAP. Adjusted Free Cash Flow Adjusted Free Cash Flow is defined as Free Cash Flow from above plus adjustments for litigation insurance recoveries, transaction costs, taxes paid on gains from divestitures and litigation recoveries, proceeds from failed sale-leaseback transactions and certain other identified adjustments, as applicable. We use Adjusted Free Cash Flow, in addition to Free Cash Flow, to provide supplemental information to our investors concerning our ability to generate cash from our ongoing operating activities; by excluding these items, we believe we provide useful additional information to our investors to help them further understand our ability to generate cash period-over-period as well as added information on comparability to our competitors. Such as with Free Cash Flow information, as so adjusted, it is specifically not intended to provide amounts available for discretionary spending. We have added certain adjustments to account for items which we do not believe reflect our core business or operating performance, and we computed all periods with such adjusted costs. Revenue at Constant Currency To better understand trends in our business, we believe that it is helpful to adjust revenue to exclude the impact of changes in the translation of foreign currencies into U.S. Dollars. We refer to this adjusted revenue as “constant currency.” Currency impact is determined as the difference between actual growth rates and constant currency growth rates. This currency impact is calculated by translating the current period activity in local currency using the comparable prior-year period's currency translation rate. Non-GAAP Outlook In providing the Full Year 2026 Outlook for Adjusted EBITDA from continuing operations, we exclude certain items which are otherwise included in determining the comparable U.S. GAAP financial measure. A description of the adjustments which historically have been applicable in determining Adjusted EBITDA is reflected in the table within this presentation. We are providing such outlooks only on a non-GAAP basis because we are unable without unreasonable efforts to predict with reasonable certainty the totality or ultimate outcome or occurrence of these adjustments for the forward-looking period, which can be dependent on future events that may not be reliably predicted. Based on past reported results, where one or more of these items have been applicable, such excluded items could be material, individually or in the aggregate, to reported results. We have provided outlooks for revenue only on a non-GAAP basis using foreign currency translation rates as of fiscal year end due to the inability to, without unreasonable efforts, accurately predict foreign currency impact on revenues. In addition, the Non-GAAP Outlook is provided on a continuing operations basis. Non-GAAP Financial Measures
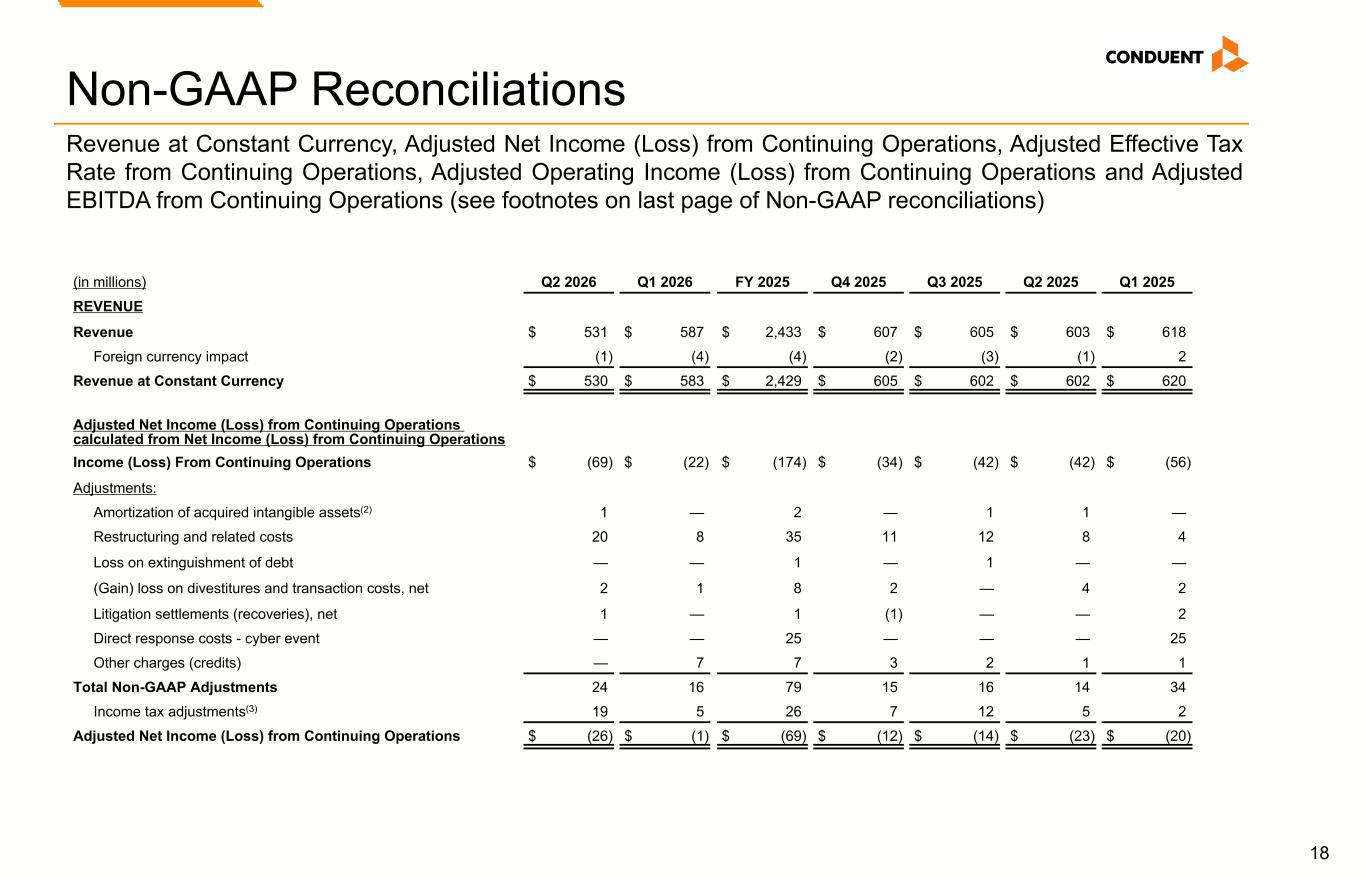
18 Non-GAAP Reconciliations (in millions) Q2 2026 Q1 2026 FY 2025 Q4 2025 Q3 2025 Q2 2025 Q1 2025 REVENUE Revenue $ 531 $ 587 $ 2,433 $ 607 $ 605 $ 603 $ 618 Foreign currency impact (1) (4) (4) (2) (3) (1) 2 Revenue at Constant Currency $ 530 $ 583 $ 2,429 $ 605 $ 602 $ 602 $ 620 Adjusted Net Income (Loss) from Continuing Operations calculated from Net Income (Loss) from Continuing Operations Income (Loss) From Continuing Operations $ (69) $ (22) $ (174) $ (34) $ (42) $ (42) $ (56) Adjustments: Amortization of acquired intangible assets(2) 1 — 2 — 1 1 — Restructuring and related costs 20 8 35 11 12 8 4 Loss on extinguishment of debt — — 1 — 1 — — (Gain) loss on divestitures and transaction costs, net 2 1 8 2 — 4 2 Litigation settlements (recoveries), net 1 — 1 (1) — — 2 Direct response costs - cyber event — — 25 — — — 25 Other charges (credits) — 7 7 3 2 1 1 Total Non-GAAP Adjustments 24 16 79 15 16 14 34 Income tax adjustments(3) 19 5 26 7 12 5 2 Adjusted Net Income (Loss) from Continuing Operations $ (26) $ (1) $ (69) $ (12) $ (14) $ (23) $ (20) Revenue at Constant Currency, Adjusted Net Income (Loss) from Continuing Operations, Adjusted Effective Tax Rate from Continuing Operations, Adjusted Operating Income (Loss) from Continuing Operations and Adjusted EBITDA from Continuing Operations (see footnotes on last page of Non-GAAP reconciliations)
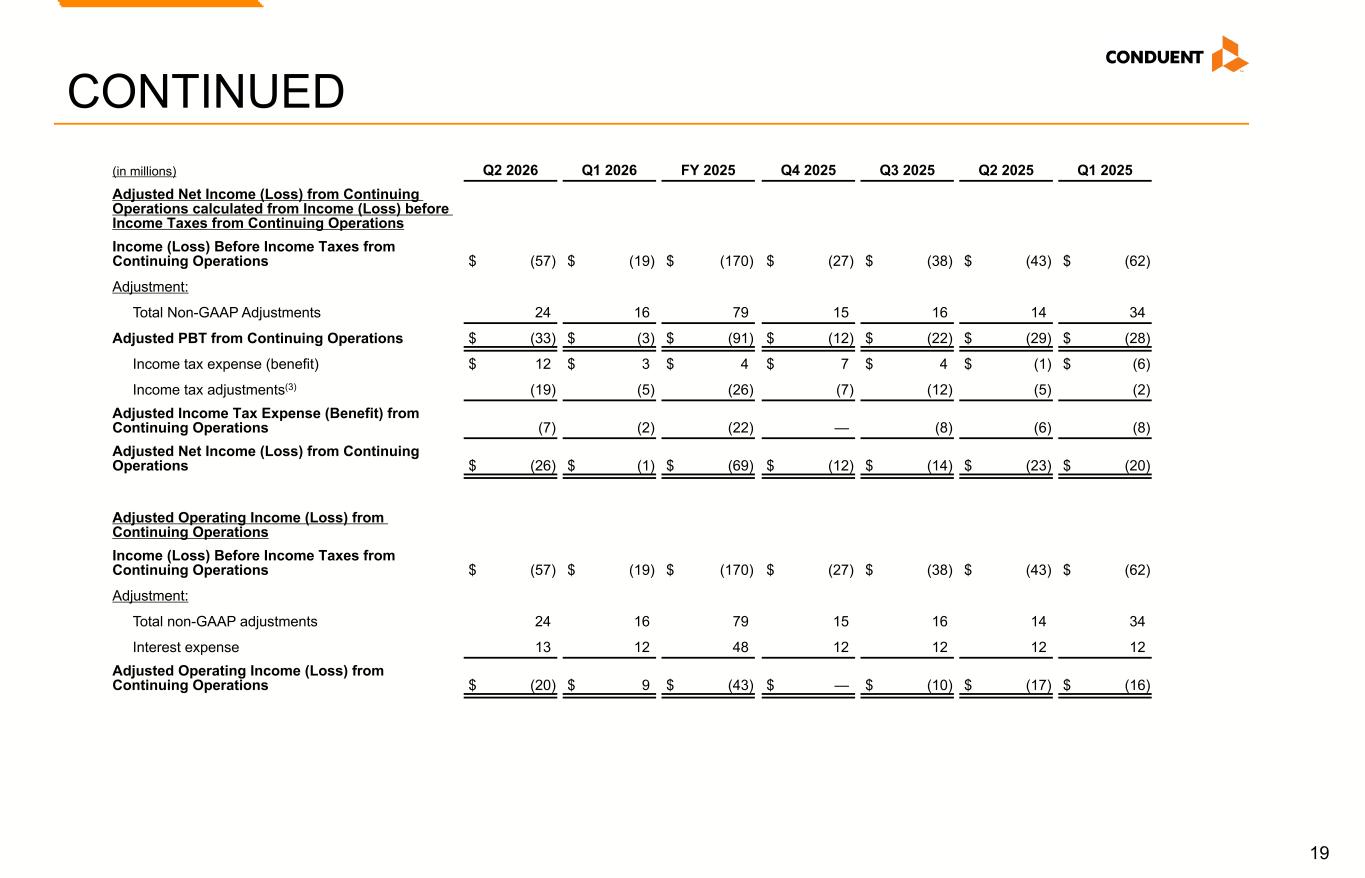
19 CONTINUED (in millions) Q2 2026 Q1 2026 FY 2025 Q4 2025 Q3 2025 Q2 2025 Q1 2025 Adjusted Net Income (Loss) from Continuing Operations calculated from Income (Loss) before Income Taxes from Continuing Operations Income (Loss) Before Income Taxes from Continuing Operations $ (57) $ (19) $ (170) $ (27) $ (38) $ (43) $ (62) Adjustment: Total Non-GAAP Adjustments 24 16 79 15 16 14 34 Adjusted PBT from Continuing Operations $ (33) $ (3) $ (91) $ (12) $ (22) $ (29) $ (28) Income tax expense (benefit) $ 12 $ 3 $ 4 $ 7 $ 4 $ (1) $ (6) Income tax adjustments(3) (19) (5) (26) (7) (12) (5) (2) Adjusted Income Tax Expense (Benefit) from Continuing Operations (7) (2) (22) — (8) (6) (8) Adjusted Net Income (Loss) from Continuing Operations $ (26) $ (1) $ (69) $ (12) $ (14) $ (23) $ (20) Adjusted Operating Income (Loss) from Continuing Operations Income (Loss) Before Income Taxes from Continuing Operations $ (57) $ (19) $ (170) $ (27) $ (38) $ (43) $ (62) Adjustment: Total non-GAAP adjustments 24 16 79 15 16 14 34 Interest expense 13 12 48 12 12 12 12 Adjusted Operating Income (Loss) from Continuing Operations $ (20) $ 9 $ (43) $ — $ (10) $ (17) $ (16)
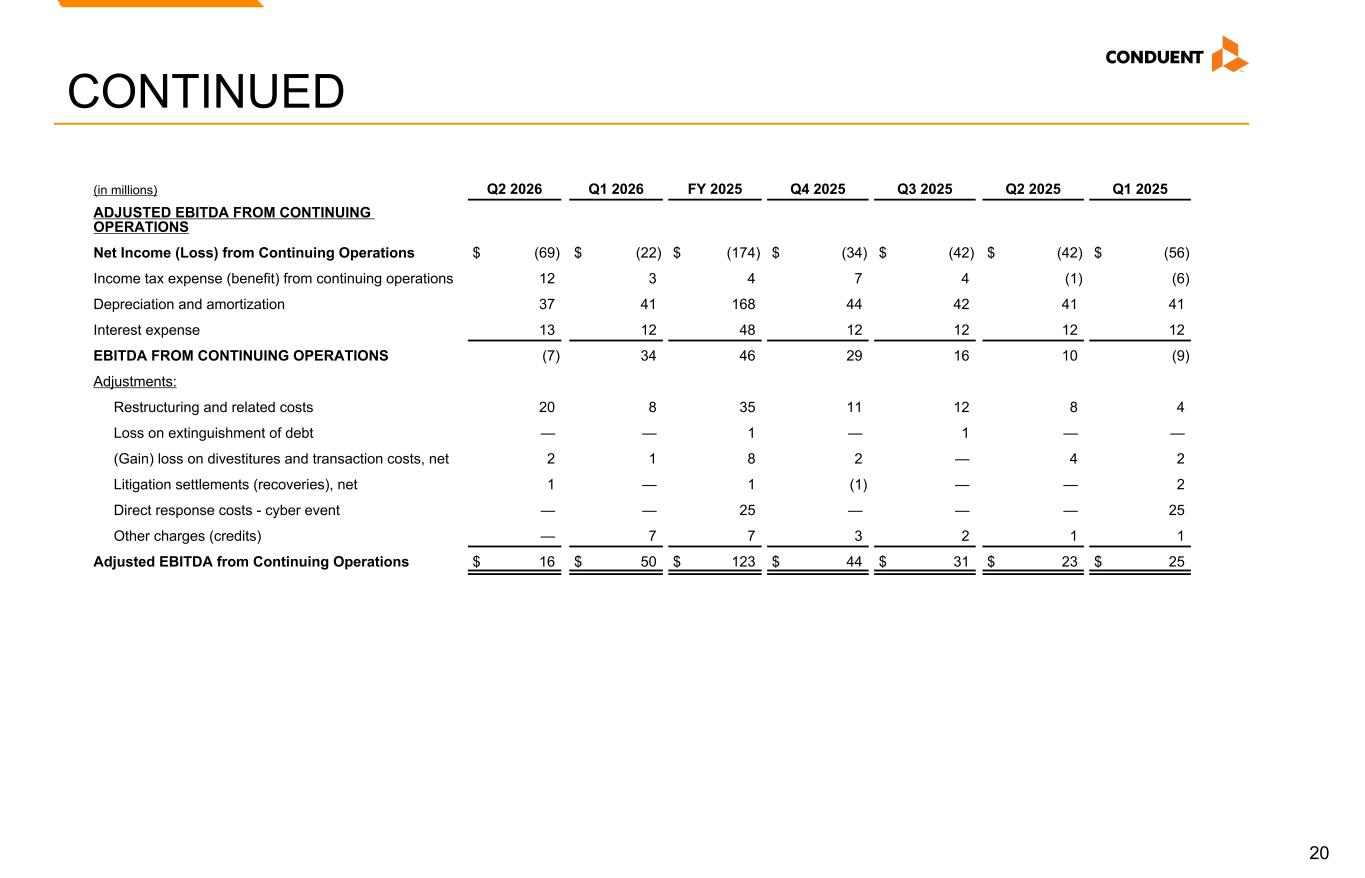
20 (in millions) Q2 2026 Q1 2026 FY 2025 Q4 2025 Q3 2025 Q2 2025 Q1 2025 ADJUSTED EBITDA FROM CONTINUING OPERATIONS Net Income (Loss) from Continuing Operations $ (69) $ (22) $ (174) $ (34) $ (42) $ (42) $ (56) Income tax expense (benefit) from continuing operations 12 3 4 7 4 (1) (6) Depreciation and amortization 37 41 168 44 42 41 41 Interest expense 13 12 48 12 12 12 12 EBITDA FROM CONTINUING OPERATIONS (7) 34 46 29 16 10 (9) Adjustments: Restructuring and related costs 20 8 35 11 12 8 4 Loss on extinguishment of debt — — 1 — 1 — — (Gain) loss on divestitures and transaction costs, net 2 1 8 2 — 4 2 Litigation settlements (recoveries), net 1 — 1 (1) — — 2 Direct response costs - cyber event — — 25 — — — 25 Other charges (credits) — 7 7 3 2 1 1 Adjusted EBITDA from Continuing Operations $ 16 $ 50 $ 123 $ 44 $ 31 $ 23 $ 25 CONTINUED
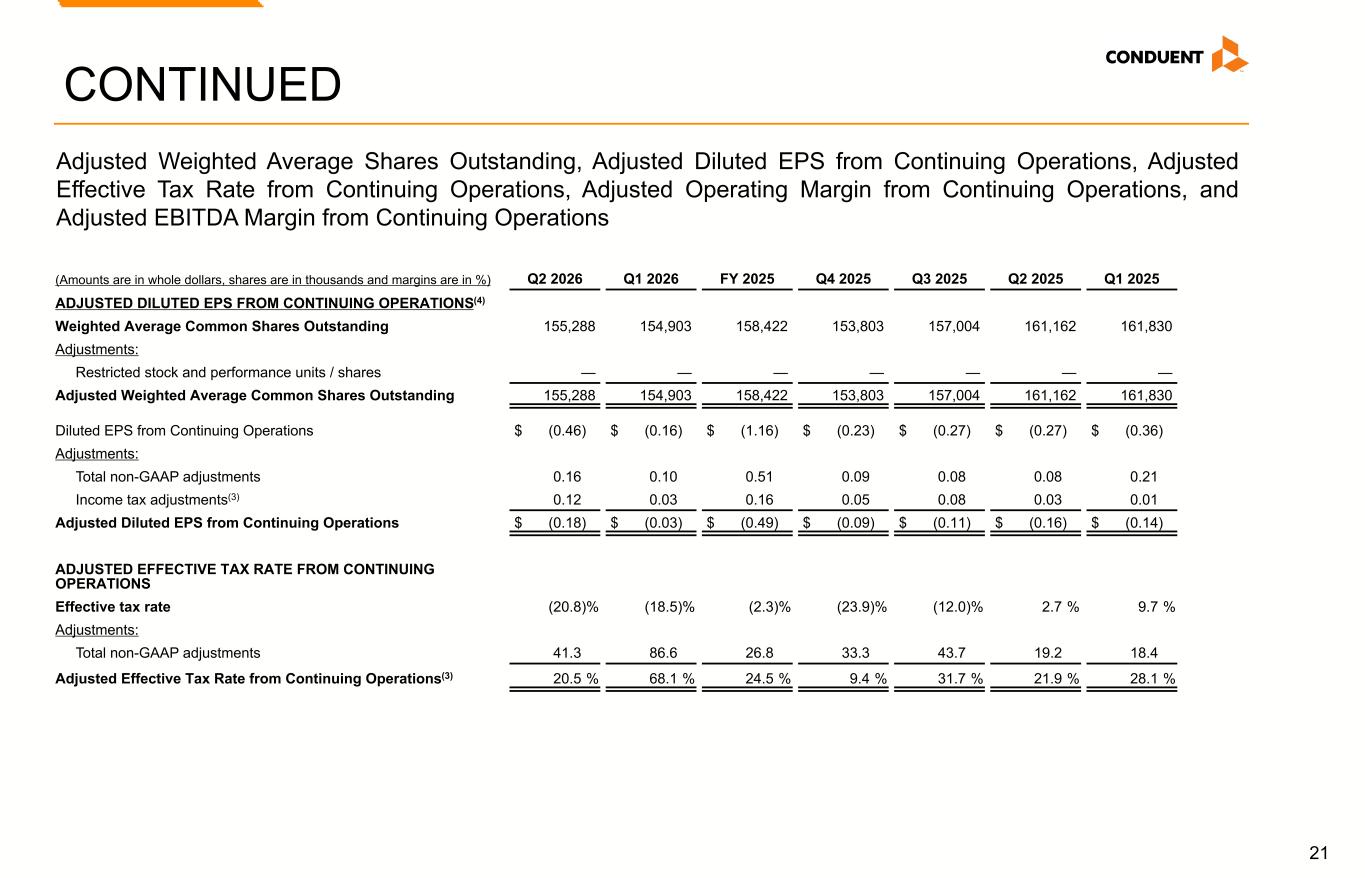
21 CONTINUED (Amounts are in whole dollars, shares are in thousands and margins are in %) Q2 2026 Q1 2026 FY 2025 Q4 2025 Q3 2025 Q2 2025 Q1 2025 ADJUSTED DILUTED EPS FROM CONTINUING OPERATIONS(4) Weighted Average Common Shares Outstanding 155,288 154,903 158,422 153,803 157,004 161,162 161,830 Adjustments: Restricted stock and performance units / shares — — — — — — — Adjusted Weighted Average Common Shares Outstanding 155,288 154,903 158,422 153,803 157,004 161,162 161,830 Diluted EPS from Continuing Operations $ (0.46) $ (0.16) $ (1.16) $ (0.23) $ (0.27) $ (0.27) $ (0.36) Adjustments: Total non-GAAP adjustments 0.16 0.10 0.51 0.09 0.08 0.08 0.21 Income tax adjustments(3) 0.12 0.03 0.16 0.05 0.08 0.03 0.01 Adjusted Diluted EPS from Continuing Operations $ (0.18) $ (0.03) $ (0.49) $ (0.09) $ (0.11) $ (0.16) $ (0.14) ADJUSTED EFFECTIVE TAX RATE FROM CONTINUING OPERATIONS Effective tax rate (20.8) % (18.5) % (2.3) % (23.9) % (12.0) % 2.7 % 9.7 % Adjustments: Total non-GAAP adjustments 41.3 86.6 26.8 33.3 43.7 19.2 18.4 Adjusted Effective Tax Rate from Continuing Operations(3) 20.5 % 68.1 % 24.5 % 9.4 % 31.7 % 21.9 % 28.1 % Adjusted Weighted Average Shares Outstanding, Adjusted Diluted EPS from Continuing Operations, Adjusted Effective Tax Rate from Continuing Operations, Adjusted Operating Margin from Continuing Operations, and Adjusted EBITDA Margin from Continuing Operations
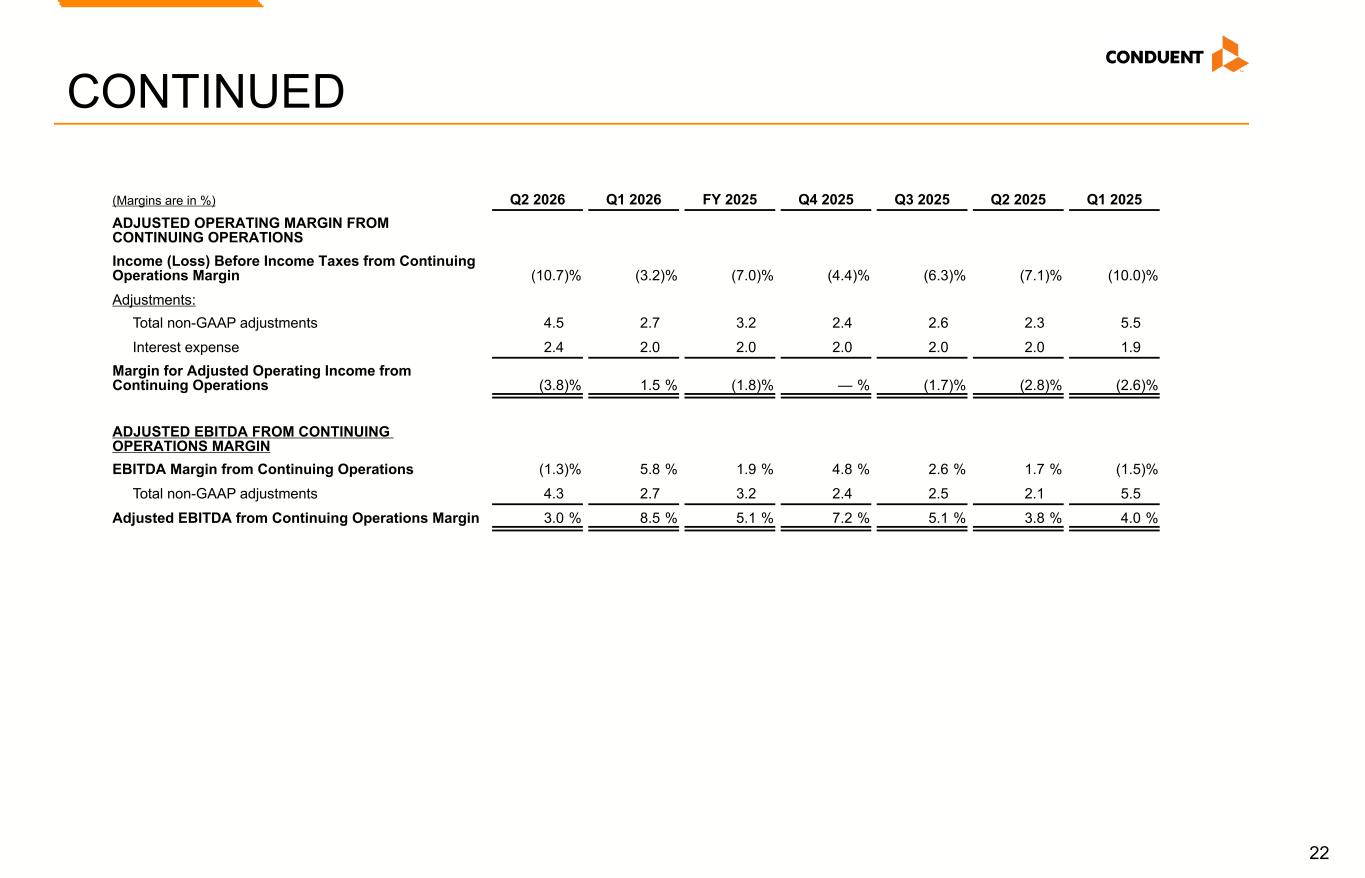
22 (Margins are in %) Q2 2026 Q1 2026 FY 2025 Q4 2025 Q3 2025 Q2 2025 Q1 2025 ADJUSTED OPERATING MARGIN FROM CONTINUING OPERATIONS Income (Loss) Before Income Taxes from Continuing Operations Margin (10.7) % (3.2) % (7.0) % (4.4) % (6.3) % (7.1) % (10.0) % Adjustments: Total non-GAAP adjustments 4.5 2.7 3.2 2.4 2.6 2.3 5.5 Interest expense 2.4 2.0 2.0 2.0 2.0 2.0 1.9 Margin for Adjusted Operating Income from Continuing Operations (3.8) % 1.5 % (1.8) % — % (1.7) % (2.8) % (2.6) % ADJUSTED EBITDA FROM CONTINUING OPERATIONS MARGIN EBITDA Margin from Continuing Operations (1.3) % 5.8 % 1.9 % 4.8 % 2.6 % 1.7 % (1.5) % Total non-GAAP adjustments 4.3 2.7 3.2 2.4 2.5 2.1 5.5 Adjusted EBITDA from Continuing Operations Margin 3.0 % 8.5 % 5.1 % 7.2 % 5.1 % 3.8 % 4.0 % CONTINUED
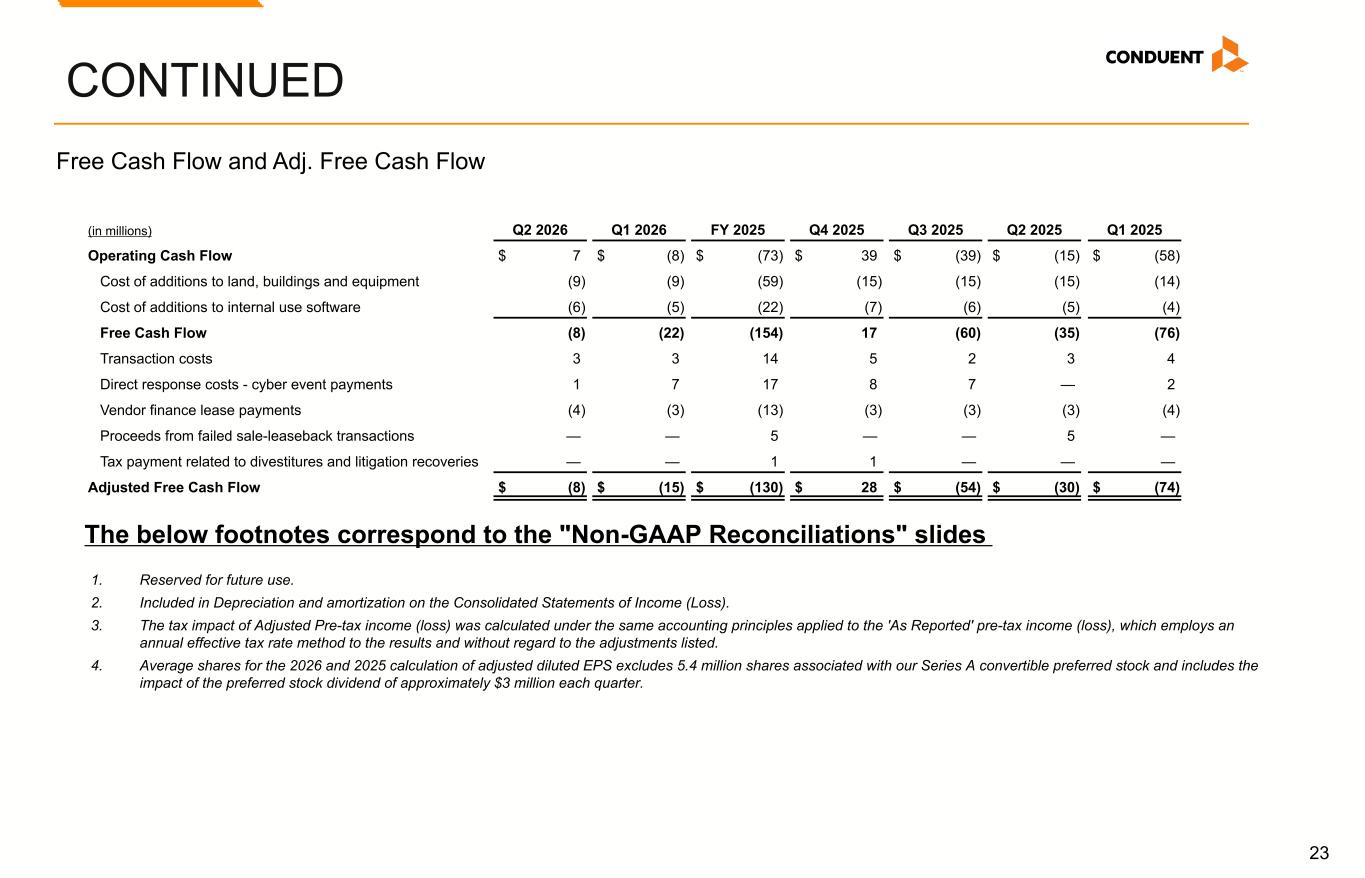
23 CONTINUED (in millions) Q2 2026 Q1 2026 FY 2025 Q4 2025 Q3 2025 Q2 2025 Q1 2025 Operating Cash Flow $ 7 $ (8) $ (73) $ 39 $ (39) $ (15) $ (58) Cost of additions to land, buildings and equipment (9) (9) (59) (15) (15) (15) (14) Cost of additions to internal use software (6) (5) (22) (7) (6) (5) (4) Free Cash Flow (8) (22) (154) 17 (60) (35) (76) Transaction costs 3 3 14 5 2 3 4 Direct response costs - cyber event payments 1 7 17 8 7 — 2 Vendor finance lease payments (4) (3) (13) (3) (3) (3) (4) Proceeds from failed sale-leaseback transactions — — 5 — — 5 — Tax payment related to divestitures and litigation recoveries — — 1 1 — — — Adjusted Free Cash Flow $ (8) $ (15) $ (130) $ 28 $ (54) $ (30) $ (74) Free Cash Flow and Adj. Free Cash Flow The below footnotes correspond to the "Non-GAAP Reconciliations" slides 1. Reserved for future use. 2. Included in Depreciation and amortization on the Consolidated Statements of Income (Loss). 3. The tax impact of Adjusted Pre-tax income (loss) was calculated under the same accounting principles applied to the 'As Reported' pre-tax income (loss), which employs an annual effective tax rate method to the results and without regard to the adjustments listed. 4. Average shares for the 2026 and 2025 calculation of adjusted diluted EPS excludes 5.4 million shares associated with our Series A convertible preferred stock and includes the impact of the preferred stock dividend of approximately $3 million each quarter.
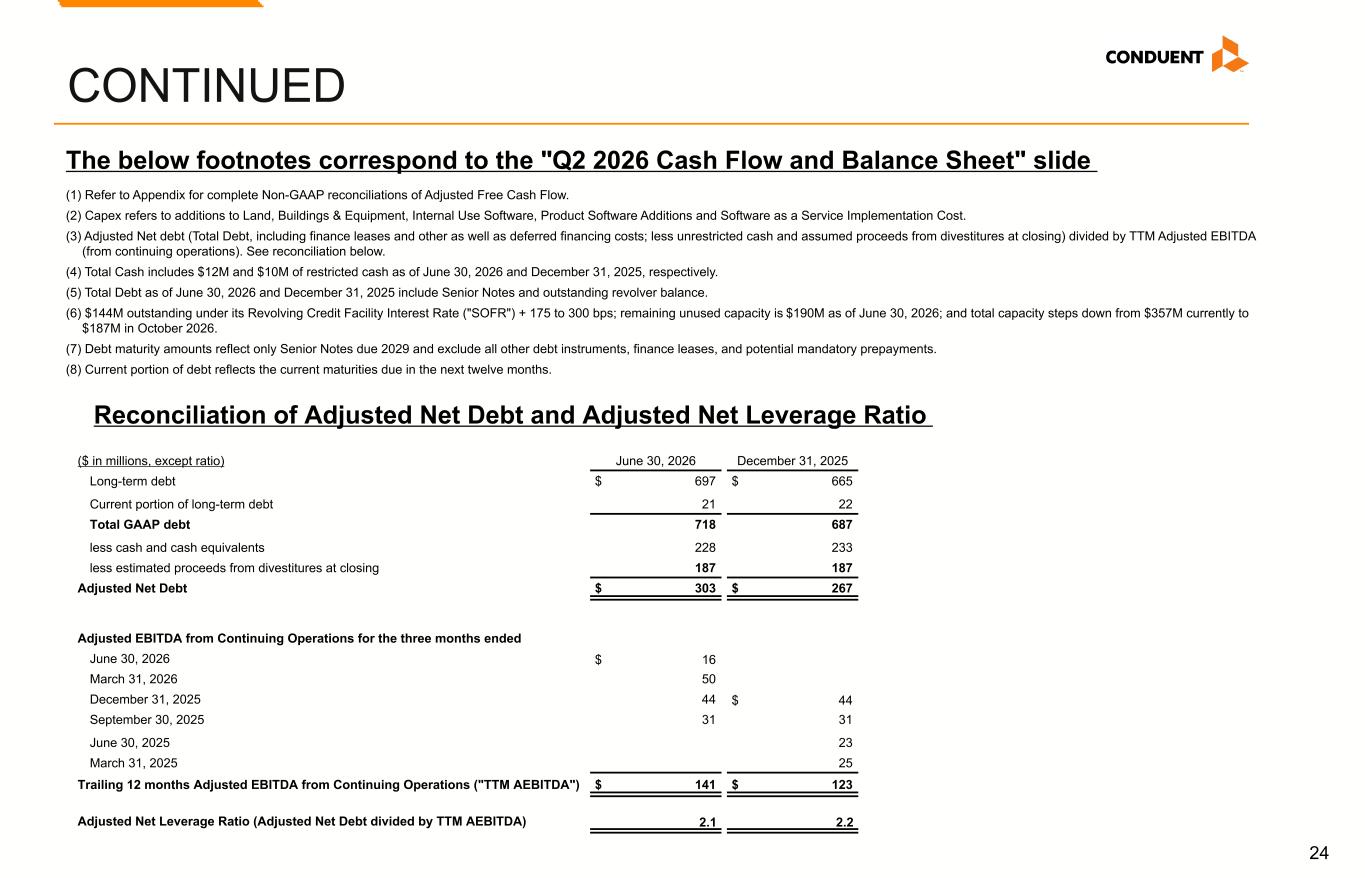
24 CONTINUED ($ in millions, except ratio) June 30, 2026 December 31, 2025 Long-term debt $ 697 $ 665 Current portion of long-term debt 21 22 Total GAAP debt 718 687 less cash and cash equivalents 228 233 less estimated proceeds from divestitures at closing 187 187 Adjusted Net Debt $ 303 $ 267 Adjusted EBITDA from Continuing Operations for the three months ended June 30, 2026 $ 16 March 31, 2026 50 December 31, 2025 44 $ 44 September 30, 2025 31 31 June 30, 2025 23 March 31, 2025 25 Trailing 12 months Adjusted EBITDA from Continuing Operations ("TTM AEBITDA") $ 141 $ 123 Adjusted Net Leverage Ratio (Adjusted Net Debt divided by TTM AEBITDA) 2.1 2.2 (1) Refer to Appendix for complete Non-GAAP reconciliations of Adjusted Free Cash Flow. (2) Capex refers to additions to Land, Buildings & Equipment, Internal Use Software, Product Software Additions and Software as a Service Implementation Cost. (3) Adjusted Net debt (Total Debt, including finance leases and other as well as deferred financing costs; less unrestricted cash and assumed proceeds from divestitures at closing) divided by TTM Adjusted EBITDA (from continuing operations). See reconciliation below. (4) Total Cash includes $12M and $10M of restricted cash as of June 30, 2026 and December 31, 2025, respectively. (5) Total Debt as of June 30, 2026 and December 31, 2025 include Senior Notes and outstanding revolver balance. (6) $144M outstanding under its Revolving Credit Facility Interest Rate ("SOFR") + 175 to 300 bps; remaining unused capacity is $190M as of June 30, 2026; and total capacity steps down from $357M currently to $187M in October 2026. (7) Debt maturity amounts reflect only Senior Notes due 2029 and exclude all other debt instruments, finance leases, and potential mandatory prepayments. (8) Current portion of debt reflects the current maturities due in the next twelve months. The below footnotes correspond to the "Q2 2026 Cash Flow and Balance Sheet" slide Reconciliation of Adjusted Net Debt and Adjusted Net Leverage Ratio

© 2025 Conduent, Inc. All rights reserved. Conduent and Conduent Agile Star are trademarks of Conduent, Inc. and/or its subsidiaries in the United States and/or other countries.© 2026 Conduent, Inc. All rights reserved. Conduent and Conduent Agile Star are trademarks of Conduent, Inc. and/or its subsidiaries in the United States and/or other countries.