UNITED STATES
SECURITIES AND EXCHANGE COMMISSION
Washington, D.C. 20549
FORM N-CSR
CERTIFIED SHAREHOLDER REPORT OF REGISTERED
MANAGEMENT INVESTMENT COMPANIES
Investment Company Act file number: 811-23165
CION ARES DIVERSIFIED CREDIT FUND
(Exact name of registrant as specified in charter)
100 PARK AVENUE
25TH FLOOR
NEW YORK, NEW YORK 10017
(Address of principal executive offices)(Zip code)
|
Eric A. Pinero 100 Park Avenue, 25th Floor New York, New York 10017 (Name and Address of Agent for Service) | ||
| Copy to: | ||
|
Michael A. Reisner Mark Gatto CION Ares Diversified Credit Fund 100 Park Avenue, 25th Floor New York, New York 10017
|
P. Jay Spinola, Esq. Michael A. DeNiro, Esq. Willkie Farr & Gallagher LLP 787 Seventh Avenue New York, New York 10019 | |
Registrant’s telephone number, including area code: (646) 845-2577
Date of fiscal year end: December 31
Date of reporting period: January 1, 2025 - June 30, 2025
Item 1. Report to Stockholders.
(a)
CION Ares Diversified Credit Fund
Contents
|
2 |
|||||||
|
5 |
|||||||
|
7 |
|||||||
|
132 |
|||||||
|
134 |
|||||||
|
135 |
|||||||
|
137 |
|||||||
|
138 |
|||||||
|
160 |
|||||||
|
191 |
|||||||
|
192 |
|||||||
|
194 |
|||||||
|
195 |
|||||||
|
196 |
|||||||
|
Approval of Investment Advisory Agreement and Investment |
201 |
||||||
Semi Annual Report 2025
CION Ares Diversified Credit Fund

Fellow Shareholders,
We are pleased to present the semi-annual report for the CION Ares Diversified Credit Fund (the "Fund" or "CADC"), for the period ending June 30, 2025. The Fund has continued to experience steady asset growth, with total managed assets reaching approximately $7.3 billion as of June 30, 2025. The Fund returned +4.05%1 over the year-to-date period, benefitting from firm credit fundamentals within the portfolio, stable base rates, and dynamic asset allocation. As of period-end, the Fund had exposure to over 850+ investments, diversified across 24 unique industries. Secured debt instruments accounted for 91%2 of the Fund and 78%3 of the portfolio was deployed in investments directly originated by investment groups within the Ares Management Corporation ("Ares") platform. The Fund's distribution rate was stable during the period, ending June 30 at 8.44%4. CADC's relative value approach across liquid and illiquid credit sectors enabled the portfolio to capitalize on market opportunities across global credit markets, while maintaining steady distributions of income and preserving shareholder capital.
Investment Philosophy and Process
The Fund employs a dynamic asset allocation framework that seeks to offer enhanced yield and downside risk mitigation, while enabling the Fund's investment advisor, CION Ares Management, LLC ("CION Ares Management," "CAM" or the "Advisor") and the Fund's investment sub-advisor, Ares Capital Management II LLC (the "Sub-Advisor"), an affiliate of Ares, to respond to changing market conditions. We believe the Fund's differentiated, diversified portfolio of both directly originated and liquid investments can provide superior risk-adjusted returns for our shareholders. Active management across a broad spectrum of credit asset classes, including direct lending in the United States and Europe, high yield bonds, leveraged loans, structured credit, real estate debt, and other credit instruments provides the opportunity to generate attractive risk-adjusted returns by capturing the best relative value.
The Fund's investment process is rigorous and incorporates both top-down and bottom-up factors. The Advisor leverages the resources of the Sub-Advisor to conduct ongoing proprietary analysis at the asset-class level, comparing current market conditions with historical and industry-level precedents to examine the rate environment, correlation to public markets, and local/regional risks. This information is brought before the Advisor's allocation committee, where senior members overseeing each of the underlying asset classes share their observations with the Fund's portfolio managers. This top-down framework is combined with the Sub-Advisor's robust origination and underwriting processes to drive a high degree of asset selectivity.
Investment Environment
Markets were met with a turbulent start to the year due to elevated geopolitical tensions and uncertainty around trade policy, culminating with the Trump administration's "Liberation Day" announcement in early April. Despite a drawdown heading into and immediately following the announcement, markets recovered swiftly due to positive trade developments and resilient hard economic data, both of which led to improved sentiment. While tariff arrangements as of June 30, 2025 have been better than initially feared, the Federal Reserve (the "Fed") has employed a "wait and see" approach with regard to future interest rate activity given the true impact of tariffs remains uncertain. Amid expectations of continued patience from the Fed, market forecasts currently reflect two rate cuts through year-end, which is fewer than was expected heading into 2025.
While price volatility was elevated, companies had a solid corporate earnings season and credit metrics remained stable. Despite the uncertain backdrop, equity and credit markets have experienced positive returns year-to-date following the risk rally toward the end of the first half of 2025. The S&P 500 returned +6.20%5 year-to-date through June 30, shrugging off a -4.28%5 return in the first quarter. Credit markets have underperformed equities, but have exhibited less volatility. Syndicated Loans returned +2.96%6 year-to-date, as a result of an attractive carry profile and stable technicals. High yield bonds returned +4.55%7 through June, benefitting from the risk-on environment more recently and expectations of future rate cuts by the Fed. Traditional fixed income returned +4.02%8, driven largely by the risk-off environment at the start of the year.
Semi Annual Report 2025
2
CION Ares Diversified Credit Fund
Letter to Shareholders (continued)
June 30, 2025
Several recurring trends have emerged within the leveraged credit markets year-to-date. Fundamentals have yet to deteriorate with defaults remaining manageable at 3.77% and 1.41%9 for syndicated loans and high yield bonds, respectively, while issuer leverage and interest coverage have remained sound. With respect to technicals, both the syndicated loan and high yield bond markets saw an expansion in market size of a combined $68 billion10 year-to-date. While capital markets activity took a pause in early April, bank lending has resumed with a continued focus on repricings and refinancings. Institution loan issuance reached $441 billion while $40 billion10 of high yield bonds have come to market year-to-date. Within private credit, deployment remained steady with lenders leaning more into their existing sponsor and management networks for new deals as M&A activity remains lower than initially expected at the onset of the year. As a result of challenged M&A volumes, competition for new issuance between the public and private loan markets has been elevated. Due to this competitive landscape, pricing for deals has grinded tighter, but all in yields remain above historical averages. Corporate fundamentals remain stable, with earnings growth moderating but still positive across most sectors and companies maintaining healthy balance sheets and liquidity.
Specific to CADC, the Fund has maintained a stable income profile with an attractive 9.45% current yield11 and 8.44% distribution rate4. We are excited about the opportunities that lie ahead in the global credit markets and continue to actively participate in corporate and asset-backed direct lending opportunities, while seeking to take advantage of pockets of volatility within the liquid credit markets. While the Fund continues to be anchored in a core allocation to directly originated assets, we continue to utilize the depth and breadth of the Ares credit platform to identify pockets of relative value and pricing mismatches across traded segments of the market, such as high yield bonds, syndicated loans and CLO securities. We continue to closely monitor macroeconomic developments, proactively manage exposures, and identify relative value opportunities created by shifts in sentiment on macro data releases, corporate fundamental trends and new policy implementations.
Summary
While market conditions remain firm, credit dispersion is increasing as management teams navigate the new trade landscape, and we expect periodic bouts of market volatility to surface as the market reacts to geopolitical headlines and central bank activity. We remain focused on downside protection and asset selectivity, with a bias towards direct lending in the U.S. and Europe while dynamically allocating across liquid and alternative credit markets as attractive relative value opportunities arise. We are pleased with the ongoing construction of the Fund's diversified portfolio, and we believe the Fund is well positioned to find compelling opportunities in an unpredictable market environment given our emphasis on senior secured, floating rate, directly originated assets in defensive, non-cyclical, service-based sectors. We believe Ares' scaled platform, tenured experience and cycle-tested investment process will allow the Fund to successfully navigate the evolving market environment.
We thank you for your investment in and continued support of the CION Ares Diversified Credit Fund.
Sincerely,
|
|
|
|
|||||||||
|
Mitch Goldstein Portfolio Manager CION Ares Diversified Credit Fund |
Greg Margolies Portfolio Manager CION Ares Diversified Credit Fund |
Michael Smith Portfolio Manager CION Ares Diversified Credit Fund |
|||||||||
Views expressed are those of CION Ares Management as of the date of this communication, are subject to change at any time, and may differ from the views of other portfolio managers or of Ares as a whole. Although these views are not intended to be a forecast of future events, a guarantee of future results, or investment advice, any forward-looking statements are not reliable indicators of future events and no guarantee is given that such activities will occur as expected or at all. Information contained herein has been obtained from sources believed to be reliable, but the accuracy and completeness of the information cannot be guaranteed. CION Ares Management does not undertake any obligation to publicly update or review any forward-looking information, whether as a result of new information, future developments or otherwise, except as required by law. All investments involve risk, including possible loss of principal. Past performance is not indicative of future results.
Semi Annual Report 2025
3
CION Ares Diversified Credit Fund
Letter to Shareholders (continued)
June 30, 2025
CION Securities, LLC ("CSL") is the wholesale marketing agent for the Fund, advised by CION Ares Management and distributed by ALPS Distributors, Inc ("ADI"). CSL, member FINRA, and CAM are not affiliated with ADI, member FINRA. Certain Ares fund securities may be offered through its affiliate, Ares Management Capital Markets LLC, a broker-dealer registered with the SEC, and a member of FINRA.
1 Past performance is not indicative of future results. Performance shown here is the I-Share Class. The I-Share was incepted on July 12, 2017. Returns include reinvestment of distributions and reflect fund expenses inclusive of recoupment of previously provided expense support. The expense ratio is 3.74% as of June 30, 2025 excluding interest expense. Expense ratios are annualized and calculated as a percentage of estimated average net assets. Share values will fluctuate, therefore if repurchased, they may be worth more or less than their original cost.
2 Secured Debt includes First and Second Lien assets, Structured Credit Debt, Structured Credit Equity. Excludes Cash.
3 Includes U.S. Direct Lending, European Direct Lending, Alternative Credit, Real Estate Debt and Opportunistic investments. Excludes cash.
4 The current distribution rate is expressed as a percentage equal to the projected annualized distribution amount (which is calculated by annualizing the current daily cash distribution per share without compounding), divided by the relevant net asset value per share. A portion of distributions may be a direct result of expense support payments provided by CION Ares Management, which are subject to repayment by CADC within three years. The purpose of this arrangement is to ensure that CADC bears an appropriate level of expenses. Any such distributions may not be entirely based on investment performance and can only be sustained if positive investment performance is achieved in future periods and/or CAM continues to make such expense support payments. Future repayments will reduce cash otherwise potentially available for distributions. There can be no assurance that such performance will be achieved in order to sustain these distributions. CAM has no obligation to provide expense support payments in future periods.
5 Proxy: S&P 500 Index. Please refer to Index Definitions for index definitions.
6 Proxy: S&P UBS Leveraged Loan Index. Please refer to Index Definitions for index definitions.
7 Proxy: ICE BofA US High Yield Index. Please refer to Index Definitions for index definitions.
8 Proxy: Bloomberg Aggregate Bond Index. Please refer to Index Definitions for index definitions.
9 Source: JP Morgan Default Monitor. As of June 30, 2025.
10 Source: JP Morgan Market Monitor. As of June 30, 2025.
11 CADC's current yield does not represent a return to investors.
Index Definitions
The Bloomberg Aggregate Bond Index measures the performance of the U.S. investment grade bond market. The index invests in a wide spectrum of public, investment-grade, taxable, fixed income securities in the United States — including government, corporate, and international dollar-denominated bonds, as well as mortgage-backed and asset-backed securities, all with maturities of more than 1 year. To be included in the index, bonds must be rated investment grade (at least Baa3/BBB) by Moody's and S&P. Inception date: January 1, 1976.
The Standard & Poor's 500 Index, often abbreviated as the S&P 500, or just "the S&P", is an American stock market index based on the market capitalizations of 500 large companies having common stock listed on the NYSE or NASDAQ. The index components and their weightings are determined by S&P Dow Jones Indices.
The S&P UBS Leveraged Loan Index is designed to mirror the investable universe of the US dollar-denominated leveraged loan market. The index inception is January 1992. The index frequency is daily, weekly and monthly. New loans are added to the index on their effective date if they qualify according to the following criteria: 1) Loan facilities must be rated "5B" or lower. That is, the highest Moody's/S&P ratings are Baa1/BB+ or Ba1/BBB+. For unrated loans, the initial spread must be 125 basis points or higher above the benchmark reference reset rate. 2) Only fully-funded term loan facilities are included. 3) The tenor must be at least one year. 4) Issuers must be domiciled in developed countries; issuers from developing countries are excluded.
The ICE BofA US High Yield Index tracks the performance of US dollar denominated below investment grade corporate debt publicly issued in the US domestic market. Qualifying securities must have a below investment grade rating (based on an average of Moody's, S&P and Fitch), at least 18 months to final maturity at the time of issuance, at least one year remaining term to final maturity as of the rebalancing date, a fixed coupon schedule and a minimum amount outstanding of $100 million. Index constituents are capitalization-weighted based on their current amount outstanding times the market price plus accrued interest. Accrued interest is calculated assuming next-day settlement. Cash flows from bond payments that are received during the month are retained in the index until the end of the month and then are removed as part of the rebalancing. Cash does not earn any reinvestment income while it is held in the index. The index is rebalanced on the last calendar day of the month, based on information available up to and including the third business day before the last business day of the month. No changes are made to constituent holdings other than on month end rebalancing dates. Inception date: August 31, 1986.
Semi Annual Report 2025
4
CION Ares Diversified Credit Fund
Fund Fact Sheet — As of June 30, 2025
CLASS A CADEX | CLASS C CADCX | CLASS I CADUX | CLASS L CADWX
CLASS U CADZX | CLASS U2 CADSX | CLASS W CADFX
FUND OVERVIEW
CION Ares Diversified Credit Fund (CADC) is a diversified, unlisted closed-end management investment company registered under the 1940 Act as an interval fund. The Fund will seek to capitalize on market inefficiencies and relative value opportunities by dynamically allocating a portfolio of directly originated loans, secured floating and fixed rate syndicated loans, corporate bonds, asset-backed securities, commercial real estate loans and other types of credit instruments which, under normal circumstances, will represent at least 80% of the Fund's assets.
Fixed Rate vs. Floating

Excludes cash, other net assets and equity instruments.
KEY FACTS
|
TOTAL MANAGED ASSETS* |
$7.3B |
||||||
|
TOTAL ISSUES |
898 |
||||||
|
DISTRIBUTIONS1 |
Monthly |
||||||
|
SHARE CLASS |
INCEPTION |
MONTH-END DISTRIBUTION RATE2 |
STANDARD DEVIATION3 |
SHARPE RATIO4 (ANNUALIZED) |
|||||||||||||||
|
CLASS A |
1/26/2017 |
8.10 |
% |
3.64 |
% |
1.05 |
|||||||||||||
|
CLASS C |
7/12/2017 |
7.28 |
% |
3.61 |
% |
0.98 |
|||||||||||||
|
CLASS I |
7/12/2017 |
8.40 |
% |
3.66 |
% |
1.11 |
|||||||||||||
|
CLASS L |
11/2/2017 |
7.95 |
% |
3.69 |
% |
1.00 |
|||||||||||||
|
CLASS U |
7/25/2019 |
7.65 |
% |
4.03 |
% |
0.85 |
|||||||||||||
|
CLASS U-2 |
4/30/2020 |
7.65 |
% |
2.91 |
% |
2.26 |
|||||||||||||
|
CLASS W |
12/4/2018 |
7.93 |
% |
3.91 |
% |
1.02 |
|||||||||||||
Portfolio Characteristics
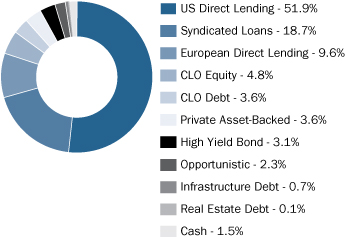
Allocation by Asset Type**
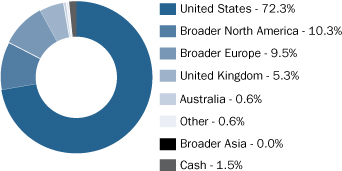
Allocation by Geography**
Allocation by Industry % of Portfolio
|
Software & Services |
21.8 |
% |
|||||
|
Health Care Equipment & Services |
10.0 |
% |
|||||
|
Structured Products |
9.9 |
% |
|||||
|
Financial Services |
8.6 |
% |
|||||
|
Commercial & Professional Services |
7.9 |
% |
|||||
|
Insurance |
7.1 |
% |
|||||
|
Consumer Services |
5.1 |
% |
|||||
|
Capital Goods |
4.2 |
% |
|||||
|
Other |
23.9 |
% |
|||||
|
Cash |
1.5 |
% |
|||||
Top Holdings % of Portfolio
|
Global Medical Response |
1.3 |
% |
|||||
|
Citrix |
1.0 |
% |
|||||
|
Global Music Rights |
0.9 |
% |
|||||
|
Enviva Partners |
0.9 |
% |
|||||
|
FinEquity Holdings |
0.8 |
% |
|||||
|
Spruce Bidco |
0.8 |
% |
|||||
|
eCapital |
0.8 |
% |
|||||
|
Kaseya |
0.8 |
% |
|||||
|
Banyan Software |
0.7 |
% |
|||||
|
High Street Insurance Partners |
0.7 |
% |
|||||
** Holdings and allocations, unless otherwise indicated, are based on the total managed assets and subject to change without notice. Total managed assets is defined as the total assets (including any assets attributable to financial leverage) minus accrued liabilities (other than debt representing financial leverage). Data shown is for informational purposes only and not a recommendation to buy or sell any security.
Semi Annual Report 2025
5
CION Ares Diversified Credit Fund
Fund Fact Sheet — As of June 30, 2025 (continued)
CLASS A CADEX | CLASS C CADCX | CLASS I CADUX | CLASS L CADWX
CLASS U CADZX | CLASS U2 CADSX | CLASS W CADFX
MANAGEMENT TEAM
• Mitch Goldstein, Co-Head of Ares Credit Group | 28 Years of Experience
• Greg Margolies, Partner, Ares Management | 35 Years of Experience
• Michael Smith, Co-Head of Ares Credit Group | 28 Years of Experience
• CADC's allocation committee consists of an additional 13 members, averaging nearly 25 years of experience.
ABOUT CION INVESTMENTS
CION Investments is a leading manager of investment solutions designed to redefine the way individual investors can build their portfolios and help meet their long-term investment goals. With more than 30 years of experience in the alternative asset management industry, CION strives to level the playing field. CION currently manages CION Investment Corporation, a leading BDC, and sponsors, through CION Ares Management, CION Ares Diversified Credit Fund, a globally diversified interval fund.
ABOUT ARES MANAGEMENT
Ares Management Corporation (NYSE: ARES) is a leading global alternative investment manager operating three integrated businesses across Credit, Private Equity and Real Estate. Ares Management's investment groups collaborate to deliver innovative investment solutions which seek to provide consistent and attractive investment returns throughout market cycles. Please visit www.aresmgmt.com for additional information.
Risks and limitations include, but are not limited to, the following: investment instruments may be susceptible to economic downturns; most of the underlying credit instruments are rated below investment grade and considered speculative; there is no guarantee all shares can be repurchased; the Fund's business and operations may be impacted by fluctuations in the capital markets; the Fund is a diversified, closed-end investment company with limited operating history; diversification does not eliminate the risk of investment losses.
1 Distribution Frequency — there is no assurance monthly distributions paid by the Fund will be maintained at the targeted level or paid at all.
2 Month-End Distribution Rate — Month-end distribution rate is expressed as a percentage equal to the projected annualized distribution amount (which is calculated by annualizing the current cash distribution per share without compounding), divided by the current net asset value. The month-end distribution rate shown may be rounded.
3 Standard Deviation — a widely used measure of an investment's performance volatility. Standard deviation shows how much variation from the mean exists with a larger number indicating the data points are more spread out over a larger range of values. Figures shown here are based on non-loaded daily NAV total returns utilizing data since inception.
4 Sharpe Ratio — a risk-adjusted measure that measures reward per unit of risk. The higher the Sharpe Ratio, the better. The numerator is the difference between a portfolio's return and the return of a risk-free instrument. The denominator is the portfolio's standard deviation. Figures shown here are based on non-loaded daily NAV total returns utilizing data since inception.
A portion of distributions may be a direct result of expense support payments provided by CION Ares Management, LLC (CAM), which are subject to repayment by CADC within three years. The purpose of this arrangement is to ensure that CADC bears an appropriate level of expenses. Any such distributions may not be entirely based on investment performance and can only be sustained if positive investment performance is achieved in future periods and/or CAM continues to make such expense support payments. Future repayments will reduce cash otherwise potentially available for distributions. There can be no assurance that such performance will be achieved in order to sustain these distributions. CAM has no obligation to provide expense support payments in future periods.
CADC may fund distributions from unlimited amounts of offering proceeds or borrowings, which may constitute a return of capital, as well as net income from operations, capital and non-capital gains from the sale of assets, dividends or distributions from equity investments and expense support payments from CAM, which are subject to repayment. For the year ending December 31, 2024 distributions were paid from taxable income and did not include a return of capital for tax purposes. It is not anticipated that the current distribution rate will contain a return of capital. If expense support payments from CAM were not provided, some or all of the distributions may have been a return of capital which would reduce the available capital for investment. The sources of distributions may vary periodically. Please refer to the semi-annual or annual reports filed with the SEC for the sources of distributions.
This is neither an offer to sell nor a solicitation to purchase the securities described herein. An offering is made only by the prospectus which must precede or accompany this piece. Please read the prospectus prior to making any investment decision and consider the risks, charges, expenses and other important information described therein. Additional copies of the prospectus may be obtained by contacting CION Securities at 800.435.5697 or by visiting cioninvestments.com.
Please be aware that the Fund, the Advisers, the Distributor or the Wholesale Marketing Agent and their respective officers, directors, employees and affiliates do not undertake to provide impartial investment advice or to give advice in a Fiduciary capacity in connection with the Fund's public offering of shares.
CION Securities, LLC (CSL) is the wholesale marketing agent for CION Ares Diversified Credit Fund, advised by CION Ares Management, LLC (CAM) with marketing services provided by ALPS Distributors, Inc (ADI). CSL, member FINRA, and CAM are not affiliated with ADI, member FINRA.
Semi Annual Report 2025
6
CION Ares Diversified Credit Fund
Consolidated Schedule of Investments
June 30, 2025 (Unaudited)
(in thousands, except shares, percentages and as otherwise noted)
Senior Loans(b)(c)(d)
|
Company |
Country(a) |
Investment |
Coupon |
Reference |
Spread |
Acquisition |
Maturity |
Shares |
Principal |
Fair Value(a) |
% of Net |
||||||||||||||||||||||||||||||||||||
|
Automobiles and Components |
|||||||||||||||||||||||||||||||||||||||||||||||
|
Automotive Keys |
1st Lien |
10.95% |
SOFR (Q) |
6.50 |
% |
08/2026 |
$ |
1,702 |
$ |
1,464 |
(e)(f) |
||||||||||||||||||||||||||||||||||||
|
Clarios Global LP |
1st Lien |
6.83% |
SOFR (M) |
2.50 |
% |
05/2030 |
7,778 |
7,749 |
(f) |
||||||||||||||||||||||||||||||||||||||
|
Collision SP |
1st Lien |
01/2030 |
— |
— |
(e)(g) |
||||||||||||||||||||||||||||||||||||||||||
|
Collision SP |
1st Lien |
9.03% |
SOFR (Q) |
4.75 |
% |
01/2030 |
892 |
892 |
(e)(f) |
||||||||||||||||||||||||||||||||||||||
|
Collision SP |
1st Lien |
9.03% |
SOFR (Q) |
4.75 |
% |
01/2030 |
28 |
29 |
(e)(f) |
||||||||||||||||||||||||||||||||||||||
|
Collision SP |
1st Lien |
9.03% |
SOFR (S) |
4.75 |
% |
01/2030 |
458 |
458 |
(e)(g) |
||||||||||||||||||||||||||||||||||||||
|
Collision SP |
1st Lien |
01/2030 |
— |
— |
(e)(g) |
||||||||||||||||||||||||||||||||||||||||||
|
Continental |
1st Lien |
8.17% |
SOFR (M) |
3.75 |
% |
01/2028 |
1 |
1 |
(e)(g) |
||||||||||||||||||||||||||||||||||||||
|
Continental |
1st Lien |
07/2028 |
6,479 |
3,758 |
(e)(i) |
||||||||||||||||||||||||||||||||||||||||||
|
Continental |
1st Lien |
07/2028 |
1,573 |
912 |
(e)(i) |
||||||||||||||||||||||||||||||||||||||||||
|
Highline |
1st Lien |
11/2028 |
— |
— |
(e)(g) |
||||||||||||||||||||||||||||||||||||||||||
|
Highline |
1st Lien |
7.83% |
SOFR (M) |
3.50 |
% |
02/2030 |
16,583 |
16,666 |
(e) |
||||||||||||||||||||||||||||||||||||||
|
New Churchill |
1st Lien |
11/2029 |
— |
— |
(e)(g) |
||||||||||||||||||||||||||||||||||||||||||
|
New Churchill |
1st Lien |
9.80% |
SOFR (Q) |
5.50 |
% |
11/2029 |
1,194 |
1,194 |
(e)(f) |
||||||||||||||||||||||||||||||||||||||
|
New Churchill |
1st Lien |
9.80% |
SOFR (Q) |
5.50 |
% |
11/2029 |
1,612 |
1,612 |
(e)(g) |
||||||||||||||||||||||||||||||||||||||
|
Sun Acquirer |
1st Lien |
09/2027 |
— |
— |
(e)(g) |
||||||||||||||||||||||||||||||||||||||||||
|
Sun Acquirer |
1st Lien |
9.33% |
SOFR (M) |
5.00 |
% |
09/2028 |
14,656 |
14,656 |
(e)(f) |
||||||||||||||||||||||||||||||||||||||
|
Sun Acquirer |
1st Lien |
9.33% |
SOFR (M) |
5.00 |
% |
09/2028 |
196 |
195 |
(e)(f) |
||||||||||||||||||||||||||||||||||||||
|
Sun Acquirer |
1st Lien |
9.33% |
SOFR (M) |
5.00 |
% |
09/2028 |
9,067 |
9,068 |
(e)(f) |
||||||||||||||||||||||||||||||||||||||
Semi Annual Report 2025
7
CION Ares Diversified Credit Fund
Consolidated Schedule of Investments (continued)
June 30, 2025 (Unaudited)
(in thousands, except shares, percentages and as otherwise noted)
Senior Loans(b)(c)(d) (continued)
|
Company |
Country(a) |
Investment |
Coupon |
Reference |
Spread |
Acquisition Date |
Maturity Date |
Shares |
Principal Amount(a) |
Fair Value(a) |
% of Net Assets |
||||||||||||||||||||||||||||||||||||
|
Sun Acquirer Corp. |
1st Lien Delay Draw Term Loan |
9.33% |
SOFR (M) |
5.00 |
% |
09/2028 |
$ |
402 |
$ |
402 |
(e)(g) |
||||||||||||||||||||||||||||||||||||
|
Telle Tire & Auto Service, LLC |
1st Lien Revolving Loan |
03/2031 |
— |
— |
(e)(g) |
||||||||||||||||||||||||||||||||||||||||||
|
Telle Tire & Auto Service, LLC |
1st Lien Term Loan |
9.00% |
SOFR (S) |
4.75 |
% |
03/2031 |
134 |
132 |
(e)(f) |
||||||||||||||||||||||||||||||||||||||
|
Telle Tire & Auto Service, LLC |
1st Lien Delay Draw Term Loan |
9.00% |
SOFR (S) |
4.75 |
% |
03/2031 |
147 |
146 |
(e)(g) |
||||||||||||||||||||||||||||||||||||||
|
Truck-Lite Co., LLC and Ecco Holdings Corp. |
1st Lien Revolving Loan |
02/2031 |
— |
— |
(e)(g) |
||||||||||||||||||||||||||||||||||||||||||
|
Truck-Lite Co., LLC and Ecco Holdings Corp. |
1st Lien Term Loan |
10.06% |
SOFR (M) |
5.75 |
% |
02/2032 |
13,520 |
13,521 |
(e)(f) |
||||||||||||||||||||||||||||||||||||||
|
Truck-Lite Co., LLC and Ecco Holdings Corp. |
1st Lien Delay Draw Term Loan |
02/2032 |
— |
— |
(e)(g) |
||||||||||||||||||||||||||||||||||||||||||
|
Wand Newco 3, Inc. |
1st Lien Term Loan |
6.83% |
SOFR (M) |
2.50 |
% |
01/2031 |
22,627 |
22,511 |
(f) |
||||||||||||||||||||||||||||||||||||||
|
95,366 |
1.96 |
% |
|||||||||||||||||||||||||||||||||||||||||||||
|
Capital Goods |
|||||||||||||||||||||||||||||||||||||||||||||||
|
AI Aqua Merger Sub, Inc. |
1st Lien Term Loan |
7.32% |
SOFR (M) |
3.00 |
% |
07/2028 |
31,490 |
31,425 |
(f) |
||||||||||||||||||||||||||||||||||||||
|
Airx Climate Solutions, Inc. |
1st Lien Revolving Loan |
11/2029 |
— |
— |
(e)(g) |
||||||||||||||||||||||||||||||||||||||||||
|
Airx Climate Solutions, Inc. |
1st Lien Term Loan |
10.08% |
SOFR (Q) |
5.75 |
% |
11/2029 |
1,494 |
1,494 |
(e)(f) |
||||||||||||||||||||||||||||||||||||||
|
Airx Climate Solutions, Inc. |
1st Lien Term Loan |
9.33% |
SOFR (Q) |
5.00 |
% |
11/2029 |
2,420 |
2,420 |
(e)(f) |
||||||||||||||||||||||||||||||||||||||
|
Airx Climate Solutions, Inc. |
1st Lien Delay Draw Term Loan |
9.33% |
SOFR (Q) |
5.00 |
% |
11/2029 |
494 |
494 |
(e)(f)(g) |
||||||||||||||||||||||||||||||||||||||
|
Align Precision Group, LLC |
1st Lien Term Loan |
06/2027 |
5,200 |
2,340 |
(e)(i) |
||||||||||||||||||||||||||||||||||||||||||
|
Align Precision Group, LLC |
1st Lien Delay Draw Term Loan |
10.69% |
SOFR (M) |
6.25 |
% |
06/2025 |
87 |
87 |
(e)(g) |
||||||||||||||||||||||||||||||||||||||
|
Align Precision Group, LLC |
1st Lien Delay Draw Term Loan |
06/2027 |
1,185 |
534 |
(e)(i) |
||||||||||||||||||||||||||||||||||||||||||
|
AllClear Military Inc. |
1st Lien Revolving Loan |
05/2030 |
— |
— |
(e)(g)(h) |
||||||||||||||||||||||||||||||||||||||||||
|
AllClear Military Inc. |
1st Lien Term Loan |
9.92% |
SOFR (M) |
5.50 |
% |
05/2030 |
807 |
807 |
(e) |
||||||||||||||||||||||||||||||||||||||
|
AllClear Military Inc. |
1st Lien Term Loan |
8.96% (2.00% PIK) |
SOFR (M) |
4.50 |
% |
05/2030 |
130 |
30 |
(e) |
||||||||||||||||||||||||||||||||||||||
Semi Annual Report 2025
8
CION Ares Diversified Credit Fund
Consolidated Schedule of Investments (continued)
June 30, 2025 (Unaudited)
(in thousands, except shares, percentages and as otherwise noted)
Senior Loans(b)(c)(d) (continued)
|
Company |
Country(a) |
Investment |
Coupon |
Reference |
Spread |
Acquisition Date |
Maturity Date |
Shares |
Principal Amount(a) |
Fair Value(a) |
% of Net Assets |
||||||||||||||||||||||||||||||||||||
|
AllClear Military Inc. |
1st Lien Term Loan |
5.46% (6.00% PIK) |
SOFR (M) |
1.00 |
% |
05/2030 |
$ |
458 |
$ |
106 |
(e) |
||||||||||||||||||||||||||||||||||||
|
AllClear Military Inc. |
1st Lien Delay Draw Term Loan |
05/2030 |
— |
— |
(e)(g)(h) |
||||||||||||||||||||||||||||||||||||||||||
|
Artera Services, LLC |
1st Lien Term Loan |
8.80% |
SOFR (Q) |
4.50 |
% |
02/2031 |
6,476 |
5,400 |
(f) |
||||||||||||||||||||||||||||||||||||||
|
BCPE Empire Holdings, Inc. |
1st Lien Term Loan |
7.58% |
SOFR (M) |
3.25 |
% |
12/2030 |
3,461 |
3,438 |
|||||||||||||||||||||||||||||||||||||||
|
BGIF IV Fearless Utility Services, Inc. |
1st Lien Revolving Loan |
06/2030 |
— |
— |
(e)(g) |
||||||||||||||||||||||||||||||||||||||||||
|
BGIF IV Fearless Utility Services, Inc. |
1st Lien Term Loan |
9.31% |
SOFR (M) |
5.00 |
% |
06/2031 |
2,221 |
2,221 |
(e)(f) |
||||||||||||||||||||||||||||||||||||||
|
BGIF IV Fearless Utility Services, Inc. |
1st Lien Delay Draw Term Loan |
06/2031 |
— |
— |
(e)(g) |
||||||||||||||||||||||||||||||||||||||||||
|
Box Bidco Limited |
United Kingdom |
1st Lien Term Loan |
9.23% | EURIBOR (S) |
7.17 |
% |
11/2028 |
€ |
878 |
1,035 |
(e)(f) |
||||||||||||||||||||||||||||||||||||
|
Box Bidco Limited |
United Kingdom |
1st Lien Term Loan |
10.19% |
SOFR (S) |
5.50 |
% |
11/2028 |
1,691 |
1,690 |
(e)(f) |
|||||||||||||||||||||||||||||||||||||
|
Box Bidco Limited |
United Kingdom |
1st Lien Term Loan |
11.86% |
SOFR (S) |
7.17 |
% |
11/2028 |
536 |
536 |
(e) |
|||||||||||||||||||||||||||||||||||||
|
Burgess Point Purchaser Corporation |
1st Lien Term Loan |
9.65% |
SOFR (Q) |
5.25 |
% |
07/2029 |
4,083 |
3,467 |
(f) |
||||||||||||||||||||||||||||||||||||||
|
Chillaton Bidco Limited |
United Kingdom |
1st Lien Term Loan |
10.73% |
SONIA (S) |
6.50 |
% |
05/2031 |
£ |
1,491 |
2,046 |
(e) |
||||||||||||||||||||||||||||||||||||
|
Chillaton Bidco Limited |
United Kingdom |
1st Lien Delay Draw Term Loan |
10.73% |
SONIA (S) |
6.50 |
% |
05/2031 |
£ |
544 |
746 |
(e)(g) |
||||||||||||||||||||||||||||||||||||
| CP Atlas Buyer Inc |
1st Lien Term Loan |
8.18% |
SOFR (M) |
3.75 |
% |
11/2027 |
4,069 |
4,051 |
(f) |
||||||||||||||||||||||||||||||||||||||
|
CPIG Holdco Inc. |
1st Lien Revolving Loan |
9.14% |
SOFR (Q) |
4.75 |
% |
04/2028 |
1 |
1 |
(e)(g) |
||||||||||||||||||||||||||||||||||||||
|
CPIG Holdco Inc. |
1st Lien Term Loan |
11.39% |
SOFR (Q) |
7.00 |
% |
04/2028 |
3,805 |
3,805 |
(e)(f) |
||||||||||||||||||||||||||||||||||||||
|
Dynamic NC Aerospace Holdings, LLC |
1st Lien Revolving Loan |
10.94% |
SOFR (Q) |
6.50 |
% |
12/2027 |
686 |
686 |
(e)(g) |
||||||||||||||||||||||||||||||||||||||
|
Dynamic NC Aerospace Holdings, LLC |
1st Lien Term Loan |
10.94% |
SOFR (Q) |
6.50 |
% |
12/2027 |
3,248 |
3,249 |
(e)(f) |
||||||||||||||||||||||||||||||||||||||
|
EC Partners Spanish Bidco, S.L.U. |
Spain |
1st Lien Term Loan |
8.34% | EURIBOR (S) |
5.75 |
% |
01/2032 |
€ |
444 |
524 |
(e) |
||||||||||||||||||||||||||||||||||||
|
EC Partners Spanish Bidco, S.L.U. |
Spain |
1st Lien Delay Draw Term Loan |
01/2032 |
€ |
— |
— |
(e)(g) |
||||||||||||||||||||||||||||||||||||||||
Semi Annual Report 2025
9
CION Ares Diversified Credit Fund
Consolidated Schedule of Investments (continued)
June 30, 2025 (Unaudited)
(in thousands, except shares, percentages and as otherwise noted)
Senior Loans(b)(c)(d) (continued)
|
Company |
Country(a) |
Investment |
Coupon |
Reference |
Spread |
Acquisition |
Maturity |
Shares |
Principal |
Fair Value(a) |
% of Net |
||||||||||||||||||||||||||||||||||||
|
Generator Buyer, |
Canada |
1st Lien |
7.93% |
CORRA (Q) |
5.25 |
% |
07/2030 |
CAD |
47 |
$ |
35 |
(e)(g) |
|||||||||||||||||||||||||||||||||||
|
Generator Buyer, |
Canada |
1st Lien |
7.93% |
CORRA (Q) |
5.25 |
% |
07/2030 |
CAD |
2,025 |
1,487 |
(e)(f) |
||||||||||||||||||||||||||||||||||||
|
Generator Buyer, |
Canada |
1st Lien |
7.93% |
CORRA (Q) |
5.25 |
% |
07/2030 |
CAD |
366 |
269 |
(e)(g) |
||||||||||||||||||||||||||||||||||||
|
GENERATOR US |
1st Lien |
9.55% |
SOFR (Q) |
5.25 |
% |
07/2030 |
408 |
408 |
(e)(f) |
||||||||||||||||||||||||||||||||||||||
|
GSV Purchaser, |
1st Lien |
08/2030 |
— |
— |
(e)(g) |
||||||||||||||||||||||||||||||||||||||||||
|
GSV Purchaser, |
1st Lien |
8.82% |
SOFR (M) |
4.50 |
% |
08/2031 |
3,680 |
3,680 |
(e)(f) |
||||||||||||||||||||||||||||||||||||||
|
GSV Purchaser, |
1st Lien |
8.82% |
SOFR (Q) |
4.50 |
% |
08/2031 |
300 |
300 |
(e)(g) |
||||||||||||||||||||||||||||||||||||||
|
Helix Acquisition |
1st Lien |
11.43% |
SOFR (M) |
7.00 |
% |
03/2030 |
473 |
473 |
(e) |
||||||||||||||||||||||||||||||||||||||
|
Horizon Avionics |
1st Lien |
8.80% |
SOFR (Q) |
4.50 |
% |
03/2032 |
111 |
110 |
(e)(g) |
||||||||||||||||||||||||||||||||||||||
|
Horizon Avionics |
1st Lien |
8.80% |
SOFR (Q) |
4.50 |
% |
03/2032 |
5,460 |
5,432 |
(e)(f) |
||||||||||||||||||||||||||||||||||||||
|
Horizon Avionics |
1st Lien |
03/2032 |
— |
— |
(e)(g) |
||||||||||||||||||||||||||||||||||||||||||
|
Kene Acquisition, |
1st Lien |
02/2031 |
— |
— |
(e)(g) |
||||||||||||||||||||||||||||||||||||||||||
|
Kene Acquisition, |
1st Lien |
9.53% |
SOFR (Q) |
5.25 |
% |
02/2031 |
1,779 |
1,779 |
(e)(f) |
||||||||||||||||||||||||||||||||||||||
|
Kene Acquisition, |
1st Lien |
9.53% |
SOFR (Q) |
5.25 |
% |
02/2031 |
82 |
82 |
(e)(g) |
||||||||||||||||||||||||||||||||||||||
|
LBM Acquisition |
1st Lien |
8.18% |
SOFR (M) |
3.75 |
% |
12/2027 |
3,697 |
3,640 |
|||||||||||||||||||||||||||||||||||||||
|
LBM Acquisition |
1st Lien |
8.16% |
SOFR (M) |
3.75 |
% |
06/2031 |
6,508 |
6,060 |
(f) |
||||||||||||||||||||||||||||||||||||||
|
Osmose Utilities |
1st Lien |
7.69% |
SOFR (M) |
3.25 |
% |
06/2028 |
1,141 |
1,068 |
|||||||||||||||||||||||||||||||||||||||
|
Osmose Utilities |
2nd Lien |
11.19% |
SOFR (M) |
6.75 |
% |
06/2029 |
8,237 |
7,743 |
(e) |
||||||||||||||||||||||||||||||||||||||
|
Paris US Holdco, |
1st Lien |
9.08% |
SOFR (M) |
4.75 |
% |
12/2031 |
43 |
43 |
(e)(g) |
||||||||||||||||||||||||||||||||||||||
Semi Annual Report 2025
10
CION Ares Diversified Credit Fund
Consolidated Schedule of Investments (continued)
June 30, 2025 (Unaudited)
(in thousands, except shares, percentages and as otherwise noted)
Senior Loans(b)(c)(d) (continued)
|
Company |
Country(a) |
Investment |
Coupon |
Reference |
Spread |
Acquisition Date |
Maturity Date |
Shares |
Principal Amount(a) |
Fair Value(a) |
% of Net Assets |
||||||||||||||||||||||||||||||||||||
|
Paris US Holdco, Inc. & 1001028292 Ontario Inc. |
1st Lien Term Loan |
9.08% |
SOFR (M) |
4.75 |
% |
12/2031 |
$ |
5,858 |
$ |
5,858 |
(e)(f) |
||||||||||||||||||||||||||||||||||||
|
Paris US Holdco, Inc. & 1001028292 Ontario Inc. |
1st Lien Delay Draw Term Loan |
12/2031 |
— |
— |
(e)(g) |
||||||||||||||||||||||||||||||||||||||||||
|
Patriot Container Corp. |
1st Lien Term Loan |
13.00% (7.00% PIK) |
09/2030 |
26,173 |
26,173 |
(e) |
|||||||||||||||||||||||||||||||||||||||||
|
Patriot Container Corp. |
1st Lien Delay Draw Term Loan |
13.00% (7.00% PIK) |
09/2030 |
370 |
370 |
(e)(g) |
|||||||||||||||||||||||||||||||||||||||||
|
PumpTech, LLC |
1st Lien Revolving Loan |
11.25% |
PRIME (Q) |
3.75 |
% |
01/2031 |
61 |
60 |
(e)(g) |
||||||||||||||||||||||||||||||||||||||
|
PumpTech, LLC |
1st Lien Term Loan |
9.08% |
SOFR (M) |
4.75 |
% |
01/2031 |
2,033 |
2,007 |
(e)(f) |
||||||||||||||||||||||||||||||||||||||
|
PumpTech, LLC |
1st Lien Delay Draw Term Loan |
01/2031 |
— |
— |
(e)(g) |
||||||||||||||||||||||||||||||||||||||||||
|
Radius Aerospace Europe Limited |
United Kingdom |
1st Lien Revolving Loan |
10.22% (0.25% PIK) |
SONIA (M) |
6.00 |
% |
03/2027 |
£ |
373 |
501 |
(e)(g) |
||||||||||||||||||||||||||||||||||||
|
Radius Aerospace Europe Limited |
United Kingdom |
1st Lien Term Loan |
10.51% (0.25% PIK) |
SOFR (Q) |
6.00 |
% |
03/2027 |
4,103 |
4,021 |
(e)(f) |
|||||||||||||||||||||||||||||||||||||
|
Radius Aerospace, Inc. |
1st Lien Revolving Loan |
10.48% (0.25% PIK) |
SOFR (Q) |
6.00 |
% |
03/2027 |
159 |
154 |
(e)(g) |
||||||||||||||||||||||||||||||||||||||
|
Radius Aerospace, Inc. |
1st Lien Term Loan |
10.51% (0.25% PIK) |
SOFR (Q) |
6.00 |
% |
03/2027 |
4,684 |
4,590 |
(e)(f) |
||||||||||||||||||||||||||||||||||||||
|
Radius Aerospace, Inc. |
1st Lien Term Loan |
10.45% (0.25% PIK) |
SOFR (Q) |
6.00 |
% |
03/2027 |
6 |
6 |
(e) |
||||||||||||||||||||||||||||||||||||||
|
Sigma Electric Manufacturing Corporation |
1st Lien Revolving Loan |
10.17% |
SOFR (M) |
5.75 |
% |
12/2027 |
28 |
28 |
(e)(g) |
||||||||||||||||||||||||||||||||||||||
|
Sigma Electric Manufacturing Corporation |
1st Lien Term Loan |
10.18% |
SOFR (M) |
5.75 |
% |
12/2027 |
439 |
439 |
(e)(f) |
||||||||||||||||||||||||||||||||||||||
|
Sigma Electric Manufacturing Corporation |
1st Lien Term Loan |
10.18% |
SOFR (S) |
5.75 |
% |
12/2027 |
2,298 |
2,298 |
(e)(f) |
||||||||||||||||||||||||||||||||||||||
|
Spirit AeroSystems, Inc. |
1st Lien Term Loan |
9.29% |
06/2025 |
10,349 |
10,349 |
(e) |
|||||||||||||||||||||||||||||||||||||||||
|
Sunk Rock Foundry Partners LP |
1st Lien Term Loan |
10.18% |
SOFR (S) |
5.75 |
% |
12/2027 |
217 |
217 |
(e)(f) |
||||||||||||||||||||||||||||||||||||||
|
Sunvair Aerospace Group, Inc. |
1st Lien Revolving Loan |
05/2031 |
— |
— |
(e)(g) |
||||||||||||||||||||||||||||||||||||||||||
Semi Annual Report 2025
11
CION Ares Diversified Credit Fund
Consolidated Schedule of Investments (continued)
June 30, 2025 (Unaudited)
(in thousands, except shares, percentages and as otherwise noted)
Senior Loans(b)(c)(d) (continued)
|
Company |
Country(a) |
Investment |
Coupon |
Reference |
Spread |
Acquisition Date |
Maturity Date |
Shares |
Principal Amount(a) |
Fair Value(a) |
% of Net Assets |
||||||||||||||||||||||||||||||||||||
|
Sunvair Aerospace Group, Inc. |
1st Lien Term Loan |
9.30% |
SOFR (Q) |
5.00 |
% |
05/2031 |
$ |
1,760 |
$ |
1,760 |
(e)(f) |
||||||||||||||||||||||||||||||||||||
|
Sunvair Aerospace Group, Inc. |
1st Lien Delay Draw Term Loan |
9.30% |
SOFR (Q) |
5.00 |
% |
05/2031 |
154 |
154 |
(e)(g) |
||||||||||||||||||||||||||||||||||||||
|
Two Six Labs, LLC |
1st Lien Revolving Loan |
9.57% |
SOFR (Q) |
5.25 |
% |
08/2027 |
1,229 |
1,229 |
(e)(g) |
||||||||||||||||||||||||||||||||||||||
|
Two Six Labs, LLC |
1st Lien Term Loan |
9.55% |
SOFR (Q) |
5.25 |
% |
08/2027 |
7,187 |
7,187 |
(e)(f) |
||||||||||||||||||||||||||||||||||||||
|
Two Six Labs, LLC |
1st Lien Term Loan |
10.30% |
SOFR (Q) |
6.00 |
% |
08/2027 |
1,318 |
1,318 |
(e)(f) |
||||||||||||||||||||||||||||||||||||||
|
Two Six Labs, LLC |
1st Lien Delay Draw Term Loan |
9.55% |
SOFR (Q) |
5.25 |
% |
08/2027 |
2,810 |
2,810 |
(e)(f) |
||||||||||||||||||||||||||||||||||||||
|
Two Six Labs, LLC |
1st Lien Delay Draw Term Loan |
08/2027 |
— |
— |
(e)(g) |
||||||||||||||||||||||||||||||||||||||||||
|
Victory Buyer LLC |
1st Lien Term Loan |
8.19% |
SOFR (M) |
3.75 |
% |
11/2028 |
8,486 |
8,365 |
|||||||||||||||||||||||||||||||||||||||
|
WEC US Holdings Ltd. |
1st Lien Term Loan |
6.57% |
SOFR (M) |
2.25 |
% |
01/2031 |
21,706 |
21,704 |
(f) |
||||||||||||||||||||||||||||||||||||||
|
Werner FinCo LP |
1st Lien Term Loan |
9.82% |
SOFR (Q) |
5.50 |
% |
06/2031 |
39,008 |
38,422 |
(e)(f) |
||||||||||||||||||||||||||||||||||||||
|
245,262 |
5.05 |
% |
|||||||||||||||||||||||||||||||||||||||||||||
|
Commercial and Professional Services |
|||||||||||||||||||||||||||||||||||||||||||||||
|
Accommodations Plus Technologies LLC |
1st Lien Revolving Loan |
05/2032 |
— |
— |
(e)(g) |
||||||||||||||||||||||||||||||||||||||||||
|
Accommodations Plus Technologies LLC |
1st Lien Term Loan |
8.83% |
SOFR (Q) |
4.50 |
% |
05/2032 |
410 |
405 |
(e)(f) |
||||||||||||||||||||||||||||||||||||||
|
Aero Operating LLC |
1st Lien Term Loan |
13.45% |
SOFR (Q) |
9.00 |
% |
02/2026 |
2,934 |
2,758 |
(e)(f) |
||||||||||||||||||||||||||||||||||||||
|
Aero Operating LLC |
1st Lien Delay Draw Term Loan |
13.45% (2.00% PIK) |
SOFR (Q) |
9.00 |
% |
02/2026 |
816 |
767 |
(e)(f) |
||||||||||||||||||||||||||||||||||||||
|
Aldinger Company |
1st Lien Revolving Loan |
9.56% |
SOFR (M) |
5.25 |
% |
07/2027 |
81 |
81 |
(e)(g) |
||||||||||||||||||||||||||||||||||||||
|
Aldinger Company |
1st Lien Term Loan |
9.55% |
SOFR (Q) |
5.25 |
% |
07/2027 |
1,245 |
1,245 |
(e)(f) |
||||||||||||||||||||||||||||||||||||||
|
Aldinger Company |
1st Lien Delay Draw Term Loan |
9.55% |
SOFR (Q) |
5.25 |
% |
07/2027 |
716 |
717 |
(e) |
||||||||||||||||||||||||||||||||||||||
|
Aldinger Company |
1st Lien Delay Draw Term Loan |
9.55% |
SOFR (Q) |
5.25 |
% |
07/2027 |
245 |
245 |
(e)(g) |
||||||||||||||||||||||||||||||||||||||
|
AMCP Clean Acquisition Company, LLC |
1st Lien Term Loan |
9.05% |
SOFR (Q) |
4.75 |
% |
06/2028 |
798 |
798 |
(e)(f) |
||||||||||||||||||||||||||||||||||||||
Semi Annual Report 2025
12
CION Ares Diversified Credit Fund
Consolidated Schedule of Investments (continued)
June 30, 2025 (Unaudited)
(in thousands, except shares, percentages and as otherwise noted)
Senior Loans(b)(c)(d) (continued)
|
Company |
Country(a) |
Investment |
Coupon |
Reference |
Spread |
Acquisition |
Maturity |
Shares |
Principal |
Fair Value(a) |
% of Net |
||||||||||||||||||||||||||||||||||||
|
AMCP Clean |
1st Lien |
9.05% |
SOFR (Q) |
4.75 |
% |
06/2028 |
$ |
640 |
$ |
640 |
(e)(g) |
||||||||||||||||||||||||||||||||||||
|
Andwis Group |
United |
1st Lien |
10.98% |
SONIA (S) |
6.75 |
% |
11/2031 |
£ |
2,074 |
2,847 |
(e) |
||||||||||||||||||||||||||||||||||||
|
Andwis Group |
United |
1st Lien |
10.96% |
SONIA (S) |
6.75 |
% |
11/2031 |
£ |
1,274 |
1,749 |
(e) |
||||||||||||||||||||||||||||||||||||
|
Andwis Group |
United |
1st Lien |
10.96% |
SONIA (S) |
6.75 |
% |
11/2031 |
£ |
1,650 |
2,265 |
(e)(g) |
||||||||||||||||||||||||||||||||||||
|
Antea Group |
Netherlands |
1st Lien |
8.26% |
EURIBOR (Q) |
6.25 |
% |
03/2030 |
€ |
1,250 |
1,472 |
(e)(g) |
||||||||||||||||||||||||||||||||||||
|
Armorica Lux |
Luxembourg |
1st Lien |
7.11% |
EURIBOR (Q) |
4.93 |
% |
07/2028 |
€ |
6,500 |
7,482 |
|||||||||||||||||||||||||||||||||||||
|
Auxadi Midco |
Spain |
1st Lien |
6.99% |
EURIBOR (Q) |
4.75 |
% |
07/2028 |
€ |
473 |
557 |
(e) |
||||||||||||||||||||||||||||||||||||
|
Bluejack Fire |
1st Lien |
01/2031 |
— |
— |
(e)(g) |
||||||||||||||||||||||||||||||||||||||||||
|
Bluejack Fire |
1st Lien |
9.07% |
SOFR (M) |
4.75 |
% |
01/2031 |
989 |
977 |
(e)(f) |
||||||||||||||||||||||||||||||||||||||
|
Bluejack Fire |
1st Lien |
01/2031 |
— |
— |
(e)(g) |
||||||||||||||||||||||||||||||||||||||||||
|
Capstone |
1st Lien |
05/2029 |
— |
— |
(e)(g) |
||||||||||||||||||||||||||||||||||||||||||
|
Capstone |
1st Lien |
8.93% |
SOFR (M) |
4.50 |
% |
11/2029 |
17,964 |
17,964 |
(e)(f) |
||||||||||||||||||||||||||||||||||||||
|
Capstone |
1st Lien |
11/2029 |
— |
— |
(e)(g) |
||||||||||||||||||||||||||||||||||||||||||
|
Capstone |
2nd Lien |
12.83% |
SOFR (M) |
8.50 |
% |
11/2030 |
9,247 |
9,247 |
(e)(f) |
||||||||||||||||||||||||||||||||||||||
|
Capstone |
2nd Lien |
11/2030 |
— |
— |
(e)(g) |
||||||||||||||||||||||||||||||||||||||||||
|
Celnor Group |
United |
1st Lien |
10.02% |
SONIA (Q) |
5.67 |
% |
08/2031 |
£ |
879 |
1,207 |
(e) |
||||||||||||||||||||||||||||||||||||
|
Celnor Group |
United |
1st Lien |
10.02% |
SONIA (Q) |
5.67 |
% |
08/2031 |
£ |
1,371 |
1,881 |
(e) |
||||||||||||||||||||||||||||||||||||
|
Celnor Group |
United |
1st Lien |
9.93% |
SOFR (Q) |
5.67 |
% |
08/2031 |
£ |
1,142 |
1,568 |
(e) |
||||||||||||||||||||||||||||||||||||
|
Celnor Group |
United |
1st Lien |
10.02% |
SONIA (Q) |
5.67 |
% |
08/2031 |
£ |
701 |
963 |
(e)(g) |
||||||||||||||||||||||||||||||||||||
|
Compass Bidco |
United |
1st Lien |
11.04% |
SONIA (S) |
6.75 |
% |
04/2031 |
£ |
12,356 |
16,961 |
(e) |
||||||||||||||||||||||||||||||||||||
Semi Annual Report 2025
13
CION Ares Diversified Credit Fund
Consolidated Schedule of Investments (continued)
June 30, 2025 (Unaudited)
(in thousands, except shares, percentages and as otherwise noted)
Senior Loans(b)(c)(d) (continued)
|
Company |
Country(a) |
Investment |
Coupon |
Reference |
Spread |
Acquisition Date |
Maturity Date |
Shares |
Principal Amount(a) |
Fair Value(a) |
% of Net Assets |
||||||||||||||||||||||||||||||||||||
|
Compass Bidco Limited. |
United Kingdom |
1st Lien Delay Draw Term Loan |
11.28% |
SONIA (S) |
6.75 |
% |
04/2031 |
£ |
5,747 |
$ |
7,889 |
(e) |
|||||||||||||||||||||||||||||||||||
|
Compex Legal Services, Inc. |
1st Lien Revolving Loan |
9.80% |
SOFR (S) |
5.45 |
% |
02/2026 |
540 |
540 |
(e)(g) |
||||||||||||||||||||||||||||||||||||||
|
Compex Legal Services, Inc. |
1st Lien Term Loan |
9.84% |
SOFR (Q) |
5.45 |
% |
02/2026 |
1,251 |
1,251 |
(e)(f) |
||||||||||||||||||||||||||||||||||||||
|
Divisions Holding Corporation |
1st Lien Revolving Loan |
04/2032 |
— |
— |
(e)(g) |
||||||||||||||||||||||||||||||||||||||||||
|
Divisions Holding Corporation |
1st Lien Term Loan |
8.80% |
SOFR (Q) |
4.50 |
% |
04/2032 |
1,395 |
1,381 |
(e)(f) |
||||||||||||||||||||||||||||||||||||||
|
Dorado Bidco, Inc. |
1st Lien Revolving Loan |
09/2031 |
— |
— |
(e)(g) |
||||||||||||||||||||||||||||||||||||||||||
|
Dorado Bidco, Inc. |
1st Lien Term Loan |
8.83% |
SOFR (M) |
4.50 |
% |
09/2031 |
3,077 |
3,076 |
(e)(f) |
||||||||||||||||||||||||||||||||||||||
|
Dorado Bidco, Inc. |
1st Lien Delay Draw Term Loan |
09/2031 |
— |
— |
(e)(g) |
||||||||||||||||||||||||||||||||||||||||||
|
DP Flores Holdings, LLC |
1st Lien Revolving Loan |
09/2030 |
— |
— |
(e)(g) |
||||||||||||||||||||||||||||||||||||||||||
|
DP Flores Holdings, LLC |
1st Lien Term Loan |
10.80% (3.25% PIK) |
SOFR (Q) |
6.50 |
% |
09/2030 |
3,936 |
3,936 |
(e)(f) |
||||||||||||||||||||||||||||||||||||||
|
DP Flores Holdings, LLC |
1st Lien Delay Draw Term Loan |
09/2030 |
— |
— |
(e)(g) |
||||||||||||||||||||||||||||||||||||||||||
|
Drogon Bidco Inc. |
1st Lien Revolving Loan |
08/2030 |
— |
— |
(e)(g) |
||||||||||||||||||||||||||||||||||||||||||
|
Drogon Bidco Inc. |
1st Lien Term Loan |
9.08% |
SOFR (M) |
4.75 |
% |
08/2031 |
1,365 |
1,365 |
(e)(f) |
||||||||||||||||||||||||||||||||||||||
|
Drogon Bidco Inc. |
1st Lien Delay Draw Term Loan |
9.08% |
SOFR (M) |
4.75 |
% |
08/2031 |
431 |
431 |
(e)(g) |
||||||||||||||||||||||||||||||||||||||
|
Dun & Bradstreet Corporation, The |
1st Lien Term Loan |
6.57% |
SOFR (M) |
2.25 |
% |
01/2029 |
17,889 |
17,874 |
(f) |
||||||||||||||||||||||||||||||||||||||
|
DuraServ LLC |
1st Lien Revolving Loan |
06/2030 |
— |
— |
(e)(g) |
||||||||||||||||||||||||||||||||||||||||||
|
DuraServ LLC |
1st Lien Term Loan |
9.06% |
SOFR (M) |
4.75 |
% |
06/2031 |
589 |
589 |
(e)(f) |
||||||||||||||||||||||||||||||||||||||
|
DuraServ LLC |
1st Lien Delay Draw Term Loan |
9.06% |
SOFR (M) |
4.75 |
% |
06/2031 |
227 |
228 |
(e)(g) |
||||||||||||||||||||||||||||||||||||||
|
Eagle Parent Corp. |
1st Lien Term Loan |
8.55% |
SOFR (Q) |
4.25 |
% |
04/2029 |
7,211 |
7,138 |
(f) |
||||||||||||||||||||||||||||||||||||||
|
Elevation Services Parent Holdings, LLC |
1st Lien Revolving Loan |
10.70% |
SOFR (Q) |
6.25 |
% |
12/2026 |
505 |
464 |
(e)(g) |
||||||||||||||||||||||||||||||||||||||
Semi Annual Report 2025
14
CION Ares Diversified Credit Fund
Consolidated Schedule of Investments (continued)
June 30, 2025 (Unaudited)
(in thousands, except shares, percentages and as otherwise noted)
Senior Loans(b)(c)(d) (continued)
|
Company |
Country(a) |
Investment |
Coupon |
Reference |
Spread |
Acquisition |
Maturity |
Shares |
Principal |
Fair Value(a) |
% of Net |
||||||||||||||||||||||||||||||||||||
|
Elevation Services |
1st Lien |
10.68% |
SOFR (Q) |
6.25 |
% |
12/2026 |
$ |
1,289 |
$ |
1,186 |
(e)(f) |
||||||||||||||||||||||||||||||||||||
|
Elevation Services |
1st Lien |
10.68% |
SOFR (Q) |
6.25 |
% |
12/2026 |
615 |
566 |
(e)(f) |
||||||||||||||||||||||||||||||||||||||
|
Elevation Services |
1st Lien |
10.68% |
SOFR (Q) |
6.25 |
% |
12/2026 |
1,724 |
1,586 |
(e)(f) |
||||||||||||||||||||||||||||||||||||||
|
Elevation Services |
1st Lien |
10.68% |
SOFR (Q) |
6.25 |
% |
12/2026 |
369 |
339 |
(e)(f) |
||||||||||||||||||||||||||||||||||||||
|
EMB Purchaser, |
1st Lien |
03/2032 |
— |
— |
(e)(g) |
||||||||||||||||||||||||||||||||||||||||||
|
EMB Purchaser, |
1st Lien |
8.82% |
SOFR (Q) |
4.50 |
% |
03/2032 |
42,749 |
42,535 |
(e)(f) |
||||||||||||||||||||||||||||||||||||||
|
EMB Purchaser, |
1st Lien |
8.82% |
SOFR (Q) |
4.50 |
% |
03/2032 |
9,938 |
9,869 |
(e)(g) |
||||||||||||||||||||||||||||||||||||||
|
Erasmus |
Netherlands |
1st Lien |
7.66% |
EURIBOR (S) |
5.63 |
% |
03/2030 |
€ |
3,323 |
3,915 |
(e) |
||||||||||||||||||||||||||||||||||||
|
Erasmus |
Netherlands |
1st Lien |
7.66% |
EURIBOR (S) |
5.63 |
% |
03/2030 |
€ |
1,187 |
1,399 |
(e) |
||||||||||||||||||||||||||||||||||||
|
Erasmus |
Netherlands |
1st Lien |
7.66% |
EURIBOR (Q) |
5.63 |
% |
03/2030 |
€ |
— |
— |
(e)(g) |
||||||||||||||||||||||||||||||||||||
|
Firebird |
1st Lien |
02/2032 |
— |
— |
(e)(g) |
||||||||||||||||||||||||||||||||||||||||||
|
Firebird |
1st Lien |
9.28% |
SOFR (Q) |
5.00 |
% |
02/2032 |
2,746 |
2,732 |
(e)(f) |
||||||||||||||||||||||||||||||||||||||
|
Firebird |
1st Lien |
8.81% |
SOFR (Q) |
4.50 |
% |
02/2032 |
89 |
88 |
(e)(g) |
||||||||||||||||||||||||||||||||||||||
|
Flywheel |
1st Lien |
10.83% |
SOFR (M) |
6.50 |
% |
05/2028 |
832 |
832 |
(e)(g) |
||||||||||||||||||||||||||||||||||||||
|
Flywheel |
1st Lien |
10.83% |
SOFR (M) |
6.50 |
% |
05/2030 |
13,576 |
13,576 |
(e)(f) |
||||||||||||||||||||||||||||||||||||||
|
Frontline Road |
1st Lien |
9.33% |
SOFR (M) |
5.00 |
% |
03/2032 |
1,206 |
1,194 |
(e)(g) |
||||||||||||||||||||||||||||||||||||||
|
Frontline Road |
1st Lien |
9.33% |
SOFR (M) |
5.00 |
% |
03/2032 |
23,255 |
23,139 |
(e)(f) |
||||||||||||||||||||||||||||||||||||||
|
Frontline Road |
1st Lien |
9.33% |
SOFR (M) |
5.00 |
% |
03/2032 |
6,925 |
6,870 |
(e)(g) |
||||||||||||||||||||||||||||||||||||||
Semi Annual Report 2025
15
CION Ares Diversified Credit Fund
Consolidated Schedule of Investments (continued)
June 30, 2025 (Unaudited)
(in thousands, except shares, percentages and as otherwise noted)
Senior Loans(b)(c)(d) (continued)
|
Company |
Country(a) |
Investment |
Coupon |
Reference |
Spread |
Acquisition Date |
Maturity Date |
Shares |
Principal Amount(a) |
Fair Value(a) |
% of Net Assets |
||||||||||||||||||||||||||||||||||||
|
HH-Stella, Inc. |
1st Lien Revolving Loan |
9.95% |
SOFR (Q) |
5.50 |
% |
04/2027 |
$ |
127 |
$ |
127 |
(e)(g) |
||||||||||||||||||||||||||||||||||||
|
HH-Stella, Inc. |
1st Lien Term Loan |
9.95% |
SOFR (Q) |
5.50 |
% |
04/2028 |
5,938 |
5,938 |
(e)(f) |
||||||||||||||||||||||||||||||||||||||
|
HH-Stella, Inc. |
1st Lien Delay Draw Term Loan |
9.95% |
SOFR (Q) |
5.50 |
% |
04/2028 |
1,062 |
1,062 |
(e)(f) |
||||||||||||||||||||||||||||||||||||||
|
HH-Stella, Inc. |
1st Lien Delay Draw Term Loan |
9.95% |
SOFR (Q) |
5.50 |
% |
04/2028 |
1,764 |
1,764 |
(e)(f) |
||||||||||||||||||||||||||||||||||||||
|
HH-Stella, Inc. |
1st Lien Delay Draw Term Loan |
9.95% |
SOFR (Q) |
5.50 |
% |
04/2028 |
922 |
922 |
(e)(g) |
||||||||||||||||||||||||||||||||||||||
|
The Hiller Companies, LLC |
1st Lien Revolving Loan |
06/2030 |
— |
— |
(e)(g) |
||||||||||||||||||||||||||||||||||||||||||
|
The Hiller Companies, LLC |
1st Lien Term Loan |
9.29% |
SOFR (Q) |
5.00 |
% |
06/2030 |
3,777 |
3,777 |
(e)(f) |
||||||||||||||||||||||||||||||||||||||
|
The Hiller Companies, LLC |
1st Lien Delay Draw Term Loan |
9.29% |
SOFR (Q) |
5.00 |
% |
06/2030 |
901 |
901 |
(e)(g) |
||||||||||||||||||||||||||||||||||||||
|
HP RSS Buyer, Inc. |
1st Lien Term Loan |
9.30% |
SOFR (Q) |
5.00 |
% |
12/2029 |
1,253 |
1,253 |
(e)(f) |
||||||||||||||||||||||||||||||||||||||
|
HP RSS Buyer, Inc. |
1st Lien Delay Draw Term Loan |
9.30% |
SOFR (Q) |
5.00 |
% |
12/2029 |
1,074 |
1,074 |
(e)(f) |
||||||||||||||||||||||||||||||||||||||
|
HP RSS Buyer, Inc. |
1st Lien Delay Draw Term Loan |
9.04% |
SOFR (Q) |
4.75 |
% |
12/2029 |
362 |
362 |
(e)(g) |
||||||||||||||||||||||||||||||||||||||
|
Indigo Acquisition B.V. |
Netherlands |
1st Lien Term Loan |
9.31% | EURIBOR (S) |
6.95 |
% |
09/2031 |
€ |
1,250 |
1,473 |
(e) |
||||||||||||||||||||||||||||||||||||
|
Indigo Acquisition B.V. |
Netherlands |
1st Lien Delay Draw Term Loan |
9.31% | EURIBOR (S) |
6.95 |
% |
09/2031 |
€ |
357 |
421 |
(e)(g) |
||||||||||||||||||||||||||||||||||||
|
Indigo Acquisition B.V. |
Netherlands |
1st Lien Delay Draw Term Loan |
11.25% |
SOFR (S) |
6.95 |
% |
09/2031 |
€ |
1,250 |
1,472 |
(e)(g) |
||||||||||||||||||||||||||||||||||||
|
IRI Group Holdings, Inc. |
1st Lien Revolving Loan |
12/2028 |
— |
— |
(e)(g) |
||||||||||||||||||||||||||||||||||||||||||
|
IRI Group Holdings, Inc. |
1st Lien Term Loan |
8.83% |
SOFR (Q) |
4.50 |
% |
12/2029 |
25,699 |
25,699 |
(e)(f) |
||||||||||||||||||||||||||||||||||||||
|
Kellermeyer Bergensons Services, LLC |
1st Lien Term Loan |
11/2028 |
3,286 |
1,807 |
(e)(i) |
||||||||||||||||||||||||||||||||||||||||||
|
Kellermeyer Bergensons Services, LLC |
1st Lien Term Loan |
9.68% PIK |
SOFR (Q) |
5.25 |
% |
11/2028 |
7,243 |
7,243 |
(e) |
||||||||||||||||||||||||||||||||||||||
|
Kings Buyer, LLC |
1st Lien Revolving Loan |
11.75% |
PRIME (Q) |
4.25 |
% |
10/2027 |
65 |
64 |
(e)(g) |
||||||||||||||||||||||||||||||||||||||
|
Kings Buyer, LLC |
1st Lien Term Loan |
9.65% |
SOFR (Q) |
5.25 |
% |
10/2027 |
3,385 |
3,283 |
(e)(f) |
||||||||||||||||||||||||||||||||||||||
Semi Annual Report 2025
16
CION Ares Diversified Credit Fund
Consolidated Schedule of Investments (continued)
June 30, 2025 (Unaudited)
(in thousands, except shares, percentages and as otherwise noted)
Senior Loans(b)(c)(d) (continued)
|
Company |
Country(a) |
Investment |
Coupon |
Reference |
Spread |
Acquisition |
Maturity |
Shares |
Principal |
Fair Value(a) |
% of Net |
||||||||||||||||||||||||||||||||||||
|
KPS Global LLC |
1st Lien |
09/2030 |
$ |
— |
$ |
— |
(e)(g) |
||||||||||||||||||||||||||||||||||||||||
|
KPS Global LLC |
1st Lien |
9.05% |
SOFR (Q) |
4.75 |
% |
09/2030 |
2,074 |
2,074 |
(e)(f) |
||||||||||||||||||||||||||||||||||||||
|
LABL, Inc. |
1st Lien |
9.43% |
SOFR (M) |
5.00 |
% |
10/2028 |
20,519 |
18,434 |
(f) |
||||||||||||||||||||||||||||||||||||||
|
Laboratories |
1st Lien |
6.20% |
SOFR (Q) |
1.75 |
% |
07/2029 |
1,376 |
1,073 |
(e)(g) |
||||||||||||||||||||||||||||||||||||||
|
Laboratories |
1st Lien |
4.65% |
CORRA (Q) |
1.75 |
% |
07/2029 |
CAD |
1,820 |
1,043 |
(e)(f) |
|||||||||||||||||||||||||||||||||||||
|
Laboratories |
1st Lien |
6.20% |
SOFR (Q) |
1.75 |
% |
07/2029 |
10,075 |
7,859 |
(e)(f) |
||||||||||||||||||||||||||||||||||||||
|
Laboratories |
1st Lien |
6.20% |
SOFR (Q) |
1.75 |
% |
07/2029 |
299 |
233 |
(e) |
||||||||||||||||||||||||||||||||||||||
|
LBC Woodlands |
1st Lien |
07/2030 |
— |
— |
(e)(g) |
||||||||||||||||||||||||||||||||||||||||||
|
LBC Woodlands |
1st Lien |
9.28% |
SOFR (Q) |
5.00 |
% |
07/2031 |
1,305 |
1,305 |
(e)(f) |
||||||||||||||||||||||||||||||||||||||
|
LBC Woodlands |
1st Lien |
9.28% |
SOFR (Q) |
5.00 |
% |
07/2031 |
93 |
93 |
(e)(g) |
||||||||||||||||||||||||||||||||||||||
|
Lightbeam Bidco, |
1st Lien |
9.33% |
SOFR (M) |
5.00 |
% |
05/2029 |
— |
— |
(e)(g) |
||||||||||||||||||||||||||||||||||||||
|
Lightbeam Bidco, |
1st Lien |
9.33% |
SOFR (M) |
5.00 |
% |
05/2030 |
1,115 |
1,115 |
(e)(f) |
||||||||||||||||||||||||||||||||||||||
|
Lightbeam Bidco, |
1st Lien |
9.32% |
SOFR (M) |
5.00 |
% |
05/2030 |
130 |
130 |
(e)(f) |
||||||||||||||||||||||||||||||||||||||
|
Lightbeam Bidco, |
1st Lien |
9.33% |
SOFR (M) |
5.00 |
% |
05/2030 |
169 |
169 |
(e)(f) |
||||||||||||||||||||||||||||||||||||||
|
Lightbeam Bidco, |
1st Lien |
9.32% |
SOFR (M) |
5.00 |
% |
05/2030 |
261 |
261 |
(e) |
||||||||||||||||||||||||||||||||||||||
|
Lowe P27 Bidco |
United |
1st Lien |
11.07% |
SONIA (S) |
6.50 |
% |
07/2026 |
£ |
1,400 |
1,922 |
(e) |
||||||||||||||||||||||||||||||||||||
|
Lowe P27 Bidco |
United |
1st Lien |
11.30% |
SOFR (S) |
6.50 |
% |
07/2026 |
610 |
609 |
(e) |
|||||||||||||||||||||||||||||||||||||
|
Lowe P27 Bidco |
United |
1st Lien |
11.07% |
SONIA (S) |
6.50 |
% |
07/2026 |
£ |
2,356 |
3,235 |
(e) |
||||||||||||||||||||||||||||||||||||
|
MPLC Debtco |
Jersey |
1st Lien |
10.50% |
SONIA (M) |
6.25 |
% |
01/2027 |
£ |
148 |
204 |
(e)(f) |
||||||||||||||||||||||||||||||||||||
|
MPLC Debtco |
Jersey |
1st Lien |
10.51% |
SOFR (S) |
6.25 |
% |
01/2027 |
1,808 |
1,808 |
(e)(f) |
|||||||||||||||||||||||||||||||||||||
Semi Annual Report 2025
17
CION Ares Diversified Credit Fund
Consolidated Schedule of Investments (continued)
June 30, 2025 (Unaudited)
(in thousands, except shares, percentages and as otherwise noted)
Senior Loans(b)(c)(d) (continued)
|
Company |
Country(a) |
Investment |
Coupon |
Reference |
Spread |
Acquisition |
Maturity |
Shares |
Principal |
Fair Value(a) |
% of Net |
||||||||||||||||||||||||||||||||||||
|
MPLC Debtco |
Jersey |
1st Lien |
10.74% |
SONIA (S) |
6.25 |
% |
01/2027 |
£ |
600 |
$ |
823 |
(e)(f) |
|||||||||||||||||||||||||||||||||||
|
Msis Holdings, |
1st Lien |
11.50% |
PRIME (Q) |
4.00 |
% |
03/2031 |
121 |
119 |
(e)(g) |
||||||||||||||||||||||||||||||||||||||
|
Msis Holdings, |
1st Lien |
9.31% |
SOFR (M) |
5.00 |
% |
03/2031 |
3,570 |
3,552 |
(e)(f) |
||||||||||||||||||||||||||||||||||||||
|
Msis Holdings, |
1st Lien |
03/2031 |
— |
— |
(e)(g) |
||||||||||||||||||||||||||||||||||||||||||
|
Neptune BidCo US |
1st Lien |
10/2027 |
— |
— |
(e)(g) |
||||||||||||||||||||||||||||||||||||||||||
|
Neptune BidCo US |
1st Lien |
9.08% |
SOFR (Q) |
4.75 |
% |
10/2028 |
13,301 |
12,498 |
(f) |
||||||||||||||||||||||||||||||||||||||
|
Neptune BidCo US |
1st Lien |
9.33% |
SOFR (Q) |
5.00 |
% |
04/2029 |
15,749 |
14,858 |
(f) |
||||||||||||||||||||||||||||||||||||||
|
Neptune BidCo US |
2nd Lien |
14.08% |
SOFR (Q) |
9.75 |
% |
10/2029 |
8,834 |
8,834 |
(e)(f) |
||||||||||||||||||||||||||||||||||||||
|
North Haven |
1st Lien |
9.07% |
SOFR (Q) |
4.75 |
% |
07/2027 |
232 |
232 |
(e)(g) |
||||||||||||||||||||||||||||||||||||||
|
North Haven |
1st Lien |
9.53% |
SOFR (Q) |
5.25 |
% |
07/2027 |
1,423 |
1,423 |
(e)(f) |
||||||||||||||||||||||||||||||||||||||
|
North Haven |
1st Lien |
9.07% |
SOFR (M) |
4.75 |
% |
07/2027 |
306 |
306 |
(e)(f) |
||||||||||||||||||||||||||||||||||||||
|
North Haven |
1st Lien |
9.30% |
SOFR (Q) |
5.00 |
% |
07/2027 |
258 |
258 |
(e) |
||||||||||||||||||||||||||||||||||||||
|
North Haven |
1st Lien |
9.07% |
SOFR (Q) |
4.75 |
% |
07/2027 |
742 |
742 |
(e)(f) |
||||||||||||||||||||||||||||||||||||||
|
North Haven |
1st Lien |
9.53% |
SOFR (Q) |
5.25 |
% |
07/2027 |
351 |
351 |
(e)(f)(g) |
||||||||||||||||||||||||||||||||||||||
|
North Haven |
1st Lien |
9.05% |
SOFR (Q) |
4.75 |
% |
07/2027 |
244 |
244 |
(e)(f) |
||||||||||||||||||||||||||||||||||||||
|
North Haven |
1st Lien |
9.55% |
SOFR (Q) |
5.25 |
% |
07/2027 |
190 |
190 |
(e)(f) |
||||||||||||||||||||||||||||||||||||||
|
North Haven |
1st Lien |
9.07% |
SOFR (Q) |
4.75 |
% |
07/2027 |
511 |
510 |
(e)(f) |
||||||||||||||||||||||||||||||||||||||
|
North Haven |
1st Lien |
9.57% |
SOFR (Q) |
5.25 |
% |
07/2027 |
201 |
201 |
(e)(f) |
||||||||||||||||||||||||||||||||||||||
|
North Haven |
1st Lien |
9.07% |
SOFR (S) |
4.75 |
% |
07/2027 |
30 |
30 |
(e) |
||||||||||||||||||||||||||||||||||||||
|
North Haven |
1st Lien |
9.07% |
SOFR (Q) |
4.75 |
% |
07/2027 |
15 |
15 |
(e)(g) |
||||||||||||||||||||||||||||||||||||||
Semi Annual Report 2025
18
CION Ares Diversified Credit Fund
Consolidated Schedule of Investments (continued)
June 30, 2025 (Unaudited)
(in thousands, except shares, percentages and as otherwise noted)
Senior Loans(b)(c)(d) (continued)
|
Company |
Country(a) |
Investment |
Coupon |
Reference |
Spread |
Acquisition Date |
Maturity Date |
Shares |
Principal Amount(a) |
Fair Value(a) |
% of Net Assets |
||||||||||||||||||||||||||||||||||||
|
Orbit Private Holdings I Ltd |
United Kingdom |
1st Lien Term Loan |
10.05% |
SONIA (S) |
5.75 |
% |
12/2028 |
£ |
4,915 |
$ |
6,678 |
(e) |
|||||||||||||||||||||||||||||||||||
|
PHM Group Holding Oyj |
Finland |
1st Lien Term Loan |
5.72% | EURIBOR (Q) |
3.50 |
% |
02/2032 |
€ |
6,217 |
7,262 |
|||||||||||||||||||||||||||||||||||||
|
Priority Waste Holdings LLC |
1st Lien Revolving Loan |
12.00% |
PRIME (Q) |
4.50 |
% |
08/2029 |
2 |
2 |
(e)(g) |
||||||||||||||||||||||||||||||||||||||
|
Priority Waste Holdings LLC |
1st Lien Term Loan |
12.30% (2.00% PIK) |
SOFR (Q) |
8.00 |
% |
08/2029 |
5,213 |
5,004 |
(e)(f) |
||||||||||||||||||||||||||||||||||||||
|
Priority Waste Holdings LLC |
1st Lien Delay Draw Term Loan |
12.30% (2.00% PIK) |
SOFR (Q) |
8.00 |
% |
08/2029 |
2,009 |
1,928 |
(e)(f) |
||||||||||||||||||||||||||||||||||||||
|
PSC Parent, Inc. |
1st Lien Revolving Loan |
9.57% |
SOFR (M) |
5.25 |
% |
04/2030 |
410 |
410 |
(e)(g) |
||||||||||||||||||||||||||||||||||||||
|
PSC Parent, Inc. |
1st Lien Term Loan |
9.57% |
SOFR (M) |
5.25 |
% |
04/2031 |
4,404 |
4,404 |
(e)(f) |
||||||||||||||||||||||||||||||||||||||
|
PSC Parent, Inc. |
1st Lien Delay Draw Term Loan |
9.57% |
SOFR (M) |
5.25 |
% |
04/2031 |
1,196 |
1,196 |
(e)(g) |
||||||||||||||||||||||||||||||||||||||
|
Pye-Barker Fire & Safety, LLC |
1st Lien Revolving Loan |
8.80% |
SOFR (Q) |
4.50 |
% |
05/2030 |
86 |
86 |
(e)(g) |
||||||||||||||||||||||||||||||||||||||
|
Pye-Barker Fire & Safety, LLC |
1st Lien Term Loan |
8.80% |
SOFR (Q) |
4.50 |
% |
05/2031 |
629 |
629 |
(e)(f) |
||||||||||||||||||||||||||||||||||||||
|
Pye-Barker Fire & Safety, LLC |
1st Lien Delay Draw Term Loan |
8.80% |
SOFR (Q) |
4.50 |
% |
05/2031 |
3,233 |
3,233 |
(e)(f)(g) |
||||||||||||||||||||||||||||||||||||||
|
Pye-Barker Fire & Safety, LLC |
1st Lien Delay Draw Term Loan |
05/2031 |
— |
— |
(e)(g) |
||||||||||||||||||||||||||||||||||||||||||
|
Registrar Intermediate, LLC |
1st Lien Revolving Loan |
9.32% |
SOFR (Q) |
5.00 |
% |
08/2029 |
430 |
430 |
(e)(g) |
||||||||||||||||||||||||||||||||||||||
|
Registrar Intermediate, LLC |
1st Lien Term Loan |
9.08% |
SOFR (Q) |
4.75 |
% |
08/2029 |
4,478 |
4,478 |
(e)(f) |
||||||||||||||||||||||||||||||||||||||
|
Registrar Intermediate, LLC |
1st Lien Delay Draw Term Loan |
08/2029 |
— |
— |
(e)(g) |
||||||||||||||||||||||||||||||||||||||||||
|
Rodeo AcquisitionCo LLC |
1st Lien Revolving Loan |
9.97% |
SOFR (Q) |
5.50 |
% |
07/2027 |
189 |
189 |
(e)(g) |
||||||||||||||||||||||||||||||||||||||
|
Rodeo AcquisitionCo LLC |
1st Lien Term Loan |
9.98% |
SOFR (Q) |
5.50 |
% |
07/2027 |
2,044 |
2,044 |
(e) |
||||||||||||||||||||||||||||||||||||||
|
RSK Group Limited |
United Kingdom |
1st Lien Term Loan |
7.70% | EURIBOR (Q) |
5.38 |
% |
09/2030 |
£ |
3,497 |
4,801 |
(e)(f) |
||||||||||||||||||||||||||||||||||||
|
RSK Group Limited |
United Kingdom |
1st Lien Delay Draw Term Loan |
9.74% |
SONIA (Q) |
5.38 |
% |
08/2028 |
£ |
1,272 |
1,747 |
(e)(f) |
||||||||||||||||||||||||||||||||||||
|
RSK Group Limited |
United Kingdom |
1st Lien Delay Draw Term Loan |
7.70% | EURIBOR (Q) |
5.38 |
% |
09/2030 |
€ |
1,061 |
1,250 |
(e)(f) |
||||||||||||||||||||||||||||||||||||
Semi Annual Report 2025
19
CION Ares Diversified Credit Fund
Consolidated Schedule of Investments (continued)
June 30, 2025 (Unaudited)
(in thousands, except shares, percentages and as otherwise noted)
Senior Loans(b)(c)(d) (continued)
|
Company |
Country(a) |
Investment |
Coupon |
Reference |
Spread |
Acquisition Date |
Maturity Date |
Shares |
Principal Amount(a) |
Fair Value(a) |
% of Net Assets |
||||||||||||||||||||||||||||||||||||
|
RSK Group Limited |
United Kingdom |
1st Lien Delay Draw Term Loan |
7.55% | EURIBOR (Q) |
5.38 |
% |
09/2030 |
£ |
13,676 |
$ |
18,772 |
(e) |
|||||||||||||||||||||||||||||||||||
|
RSK Group Limited |
United Kingdom |
1st Lien Delay Draw Term Loan |
7.39% | EURIBOR (Q) |
5.38 |
% |
09/2030 |
£ |
4,779 |
6,560 |
(e) |
||||||||||||||||||||||||||||||||||||
|
Saturn Purchaser Corp. |
1st Lien Revolving Loan |
07/2030 |
— |
— |
(e)(g) |
||||||||||||||||||||||||||||||||||||||||||
|
Saturn Purchaser Corp. |
1st Lien Term Loan |
9.13% |
SOFR (M) |
4.85 |
% |
07/2030 |
221 |
221 |
(e) |
||||||||||||||||||||||||||||||||||||||
|
Saturn Purchaser Corp. |
1st Lien Delay Draw Term Loan |
07/2030 |
— |
— |
(e)(g) |
||||||||||||||||||||||||||||||||||||||||||
|
Schill Landscaping and Lawn Care Services, LLC |
1st Lien Revolving Loan |
10.22% |
SOFR (M) |
5.75 |
% |
12/2027 |
180 |
180 |
(e)(g) |
||||||||||||||||||||||||||||||||||||||
|
Schill Landscaping and Lawn Care Services, LLC |
1st Lien Term Loan |
10.18% |
SOFR (M) |
5.75 |
% |
12/2027 |
2,136 |
2,136 |
(e)(f) |
||||||||||||||||||||||||||||||||||||||
|
Schill Landscaping and Lawn Care Services, LLC |
1st Lien Delay Draw Term Loan |
10.18% |
SOFR (M) |
5.75 |
% |
12/2027 |
1,561 |
1,561 |
(e)(f)(g) |
||||||||||||||||||||||||||||||||||||||
|
Shermco Intermediate Holdings, Inc. |
1st Lien Revolving Loan |
9.19% |
SOFR (S) |
5.00 |
% |
12/2026 |
1,379 |
1,379 |
(e)(g) |
||||||||||||||||||||||||||||||||||||||
|
Shermco Intermediate Holdings, Inc. |
1st Lien Term Loan |
9.22% |
SOFR (S) |
5.00 |
% |
12/2026 |
30,452 |
30,452 |
(e)(f) |
||||||||||||||||||||||||||||||||||||||
|
Shermco Intermediate Holdings, Inc. |
1st Lien Delay Draw Term Loan |
9.21% |
SOFR (S) |
5.00 |
% |
12/2026 |
187 |
187 |
(e) |
||||||||||||||||||||||||||||||||||||||
|
Shermco Intermediate Holdings, Inc. |
1st Lien Delay Draw Term Loan |
9.25% |
SOFR (S) |
5.00 |
% |
12/2026 |
4,601 |
4,601 |
(e) |
||||||||||||||||||||||||||||||||||||||
|
Shermco Intermediate Holdings, Inc. |
1st Lien Delay Draw Term Loan |
9.26% |
SOFR (S) |
5.00 |
% |
12/2026 |
2,478 |
2,478 |
(e) |
||||||||||||||||||||||||||||||||||||||
|
Shermco Intermediate Holdings, Inc. |
1st Lien Delay Draw Term Loan |
9.24% |
SOFR (S) |
5.00 |
% |
06/2027 |
124 |
125 |
(e)(g) |
||||||||||||||||||||||||||||||||||||||
|
Survitec Group Holdco Limited |
United Kingdom |
1st Lien Term Loan |
12.06% (2.50% PIK) |
SONIA (S) |
7.50 |
% |
04/2027 |
£ |
10,488 |
14,396 |
(e)(f) |
||||||||||||||||||||||||||||||||||||
|
Survitec Group Holdco Limited |
United Kingdom |
1st Lien Term Loan |
12.93% (2.50% PIK) |
SONIA (S) |
8.38 |
% |
04/2027 |
£ |
514 |
705 |
(e) |
||||||||||||||||||||||||||||||||||||
|
SV Newco 2, Inc. |
1st Lien Revolving Loan |
06/2031 |
— |
— |
(e)(g) |
||||||||||||||||||||||||||||||||||||||||||
|
SV Newco 2, Inc. |
1st Lien Term Loan |
9.05% |
SOFR (Q) |
4.75 |
% |
06/2031 |
933 |
933 |
(e)(f) |
||||||||||||||||||||||||||||||||||||||
Semi Annual Report 2025
20
CION Ares Diversified Credit Fund
Consolidated Schedule of Investments (continued)
June 30, 2025 (Unaudited)
(in thousands, except shares, percentages and as otherwise noted)
Senior Loans(b)(c)(d) (continued)
|
Company |
Country(a) |
Investment |
Coupon |
Reference |
Spread |
Acquisition |
Maturity |
Shares |
Principal |
Fair Value(a) |
% of Net |
||||||||||||||||||||||||||||||||||||
|
SV Newco 2, Inc. |
1st Lien |
11.25% |
PRIME (Q) |
3.75 |
% |
06/2031 |
$ |
230 |
$ |
230 |
(e)(g) |
||||||||||||||||||||||||||||||||||||
|
Systems Planning |
1st Lien |
9.05% |
SOFR (S) |
4.75 |
% |
08/2027 |
372 |
372 |
(e)(g) |
||||||||||||||||||||||||||||||||||||||
|
Systems Planning |
1st Lien |
8.92% |
SOFR (S) |
4.75 |
% |
08/2027 |
4,376 |
4,376 |
(e)(f) |
||||||||||||||||||||||||||||||||||||||
|
Thermostat |
1st Lien |
8.30% |
SOFR (Q) |
4.00 |
% |
08/2028 |
10 |
10 |
(e)(g) |
||||||||||||||||||||||||||||||||||||||
|
Thermostat |
2nd Lien |
11.73% |
SOFR (Q) |
7.25 |
% |
08/2029 |
3,575 |
3,575 |
(e) |
||||||||||||||||||||||||||||||||||||||
|
TSS Buyer, LLC |
1st Lien |
9.93% |
SOFR (Q) |
5.50 |
% |
06/2029 |
256 |
256 |
(e)(f) |
||||||||||||||||||||||||||||||||||||||
|
TSS Buyer, LLC |
1st Lien |
12.00% |
PRIME (Q) |
4.50 |
% |
06/2029 |
283 |
283 |
(e) |
||||||||||||||||||||||||||||||||||||||
|
Unifi Aviation |
1st Lien |
7.18% |
SOFR (Q) |
2.75 |
% |
09/2028 |
— |
— |
(e)(g) |
||||||||||||||||||||||||||||||||||||||
|
Unifi Aviation |
1st Lien |
9.69% |
SOFR (Q) |
5.25 |
% |
09/2028 |
2,006 |
2,006 |
(e) |
||||||||||||||||||||||||||||||||||||||
|
Unifi Aviation |
1st Lien |
9.69% |
SOFR (Q) |
5.25 |
% |
09/2028 |
565 |
565 |
(e) |
||||||||||||||||||||||||||||||||||||||
|
Unity Purchaser, |
1st Lien |
01/2031 |
— |
— |
(e)(g) |
||||||||||||||||||||||||||||||||||||||||||
|
Unity Purchaser, |
1st Lien |
9.24% |
SOFR (S) |
5.00 |
% |
01/2031 |
1,249 |
1,230 |
(e)(f) |
||||||||||||||||||||||||||||||||||||||
|
Unity Purchaser, |
1st Lien |
01/2031 |
— |
— |
(e)(g) |
||||||||||||||||||||||||||||||||||||||||||
|
Unity Purchaser, |
1st Lien |
9.24% |
SOFR (Q) |
5.00 |
% |
01/2031 |
581 |
572 |
(e) |
||||||||||||||||||||||||||||||||||||||
|
UP Intermediate II |
1st Lien |
9.56% |
SOFR (M) |
5.25 |
% |
03/2030 |
117 |
118 |
(e)(g) |
||||||||||||||||||||||||||||||||||||||
|
UP Intermediate II |
1st Lien |
9.55% |
SOFR (Q) |
5.25 |
% |
03/2031 |
369 |
369 |
(e)(f) |
||||||||||||||||||||||||||||||||||||||
|
Villa Dutch Bidco |
Netherlands |
1st Lien |
7.21% |
EURIBOR (M) |
5.25 |
% |
11/2029 |
€ |
6,000 |
6,704 |
|||||||||||||||||||||||||||||||||||||
|
Visual Edge |
1st Lien |
11.48% |
SOFR (Q) |
7.00 |
% |
12/2025 |
2,212 |
2,212 |
(e) |
||||||||||||||||||||||||||||||||||||||
|
Visual Edge |
1st Lien |
12/2025 |
— |
— |
(e)(g) |
||||||||||||||||||||||||||||||||||||||||||
|
VRC Companies, |
1st Lien |
06/2027 |
— |
— |
(e)(g) |
||||||||||||||||||||||||||||||||||||||||||
Semi Annual Report 2025
21
CION Ares Diversified Credit Fund
Consolidated Schedule of Investments (continued)
June 30, 2025 (Unaudited)
(in thousands, except shares, percentages and as otherwise noted)
Senior Loans(b)(c)(d) (continued)
|
Company |
Country(a) |
Investment |
Coupon |
Reference |
Spread |
Acquisition Date |
Maturity Date |
Shares |
Principal Amount(a) |
Fair Value(a) |
% of Net Assets |
||||||||||||||||||||||||||||||||||||
|
VRC Companies, LLC |
1st Lien Term Loan |
9.53% |
SOFR (Q) |
5.25 |
% |
06/2027 |
$ |
16,278 |
$ |
16,278 |
(e)(f) |
||||||||||||||||||||||||||||||||||||
|
W.S. Connelly & Co., LLC |
1st Lien Revolving Loan |
8.30% |
SOFR (Q) |
4.00 |
% |
05/2030 |
762 |
762 |
(e)(g) |
||||||||||||||||||||||||||||||||||||||
|
W.S. Connelly & Co., LLC |
1st Lien Revolving Loan |
05/2030 |
— |
— |
(e)(g) |
||||||||||||||||||||||||||||||||||||||||||
|
W.S. Connelly & Co., LLC |
1st Lien Term Loan |
9.30% |
SOFR (Q) |
5.00 |
% |
05/2030 |
595 |
595 |
(e)(f) |
||||||||||||||||||||||||||||||||||||||
|
W.S. Connelly & Co., LLC |
1st Lien Delay Draw Term Loan |
9.30% |
SOFR (Q) |
5.00 |
% |
05/2030 |
697 |
697 |
(e)(f)(g) |
||||||||||||||||||||||||||||||||||||||
|
Zinc Buyer Corporation |
1st Lien Revolving Loan |
11.25% |
PRIME (Q) |
3.75 |
% |
07/2031 |
81 |
81 |
(e)(g) |
||||||||||||||||||||||||||||||||||||||
|
Zinc Buyer Corporation |
1st Lien Term Loan |
9.05% |
SOFR (Q) |
4.75 |
% |
07/2031 |
1,855 |
1,855 |
(e)(f) |
||||||||||||||||||||||||||||||||||||||
|
Zinc Buyer Corporation |
1st Lien Delay Draw Term Loan |
07/2031 |
— |
— |
(e)(g) |
||||||||||||||||||||||||||||||||||||||||||
|
549,782 |
11.32 |
% |
|||||||||||||||||||||||||||||||||||||||||||||
|
Consumer Distribution and Retail |
|||||||||||||||||||||||||||||||||||||||||||||||
|
Bamboo Purchaser, Inc. |
1st Lien Revolving Loan |
7.36% |
SOFR (Q) |
2.75 |
% |
11/2026 |
1 |
1 |
(e)(g) |
||||||||||||||||||||||||||||||||||||||
|
Bamboo Purchaser, Inc. |
1st Lien Term Loan |
10.95% |
SOFR (Q) |
6.50 |
% |
11/2027 |
3,430 |
2,847 |
(e)(f) |
||||||||||||||||||||||||||||||||||||||
|
Bamboo Purchaser, Inc. |
1st Lien Delay Draw Term Loan |
10.95% |
SOFR (Q) |
6.50 |
% |
11/2027 |
809 |
671 |
(e) |
||||||||||||||||||||||||||||||||||||||
|
BGI Purchaser, Inc. |
1st Lien Revolving Loan |
8.33% |
SOFR (Q) |
4.00 |
% |
05/2030 |
3,167 |
3,168 |
(e)(g) |
||||||||||||||||||||||||||||||||||||||
|
BGI Purchaser, Inc. |
1st Lien Term Loan |
9.33% |
SOFR (Q) |
5.00 |
% |
05/2031 |
3,599 |
3,599 |
(e)(f) |
||||||||||||||||||||||||||||||||||||||
|
BGI Purchaser, Inc. |
1st Lien Delay Draw Term Loan |
05/2031 |
— |
— |
(e)(g) |
||||||||||||||||||||||||||||||||||||||||||
|
BR PJK Produce, LLC |
1st Lien Term Loan |
10.70% |
SOFR (Q) |
6.25 |
% |
11/2027 |
95 |
95 |
(e)(f) |
||||||||||||||||||||||||||||||||||||||
|
BR PJK Produce, LLC |
1st Lien Delay Draw Term Loan |
10.71% |
SOFR (Q) |
6.25 |
% |
11/2027 |
561 |
561 |
(e) |
||||||||||||||||||||||||||||||||||||||
|
BradyPlus Holdings, LLC |
1st Lien Term Loan |
9.28% |
SOFR (Q) |
5.00 |
% |
10/2029 |
19,390 |
19,390 |
(e)(f) |
||||||||||||||||||||||||||||||||||||||
|
BradyPlus Holdings, LLC |
1st Lien Delay Draw Term Loan |
9.28% |
SOFR (Q) |
5.00 |
% |
10/2029 |
188 |
188 |
(e)(g) |
||||||||||||||||||||||||||||||||||||||
|
City Line Distributors LLC |
1st Lien Revolving Loan |
08/2028 |
— |
— |
(e)(g) |
||||||||||||||||||||||||||||||||||||||||||
Semi Annual Report 2025
22
CION Ares Diversified Credit Fund
Consolidated Schedule of Investments (continued)
June 30, 2025 (Unaudited)
(in thousands, except shares, percentages and as otherwise noted)
Senior Loans(b)(c)(d) (continued)
|
Company |
Country(a) |
Investment |
Coupon |
Reference |
Spread |
Acquisition |
Maturity |
Shares |
Principal |
Fair Value(a) |
% of Net |
||||||||||||||||||||||||||||||||||||
|
City Line |
1st Lien |
10.55% |
SOFR (Q) |
6.00 |
% |
08/2028 |
$ |
309 |
$ |
309 |
(e)(f) |
||||||||||||||||||||||||||||||||||||
|
City Line |
1st Lien |
10.55% |
SOFR (Q) |
6.00 |
% |
08/2028 |
124 |
124 |
(e)(f) |
||||||||||||||||||||||||||||||||||||||
|
DecoPac, Inc. |
1st Lien |
9.55% |
SOFR (Q) |
5.25 |
% |
05/2030 |
1,038 |
1,038 |
(e)(g) |
||||||||||||||||||||||||||||||||||||||
|
DecoPac, Inc. |
1st Lien |
9.55% |
SOFR (Q) |
5.25 |
% |
05/2030 |
27,930 |
27,930 |
(e)(f) |
||||||||||||||||||||||||||||||||||||||
|
Hills Distribution, |
1st Lien |
8.82% |
SOFR (M) |
4.50 |
% |
11/2029 |
1 |
1 |
(e)(g) |
||||||||||||||||||||||||||||||||||||||
|
Hills Distribution, |
1st Lien |
10.32% |
SOFR (M) |
6.00 |
% |
11/2029 |
526 |
526 |
(e)(f) |
||||||||||||||||||||||||||||||||||||||
|
Hills Distribution, |
1st Lien |
10.32% |
SOFR (M) |
6.00 |
% |
11/2029 |
268 |
268 |
(e)(g) |
||||||||||||||||||||||||||||||||||||||
|
LJ Perimeter |
1st Lien |
10.93% |
SOFR (Q) |
6.50 |
% |
10/2028 |
3,200 |
2,944 |
(e)(f) |
||||||||||||||||||||||||||||||||||||||
|
LJ Perimeter |
1st Lien |
10.93% |
SOFR (Q) |
6.50 |
% |
10/2028 |
411 |
379 |
(e)(f) |
||||||||||||||||||||||||||||||||||||||
|
Marcone |
1st Lien |
11.44% |
SOFR (Q) |
7.00 |
% |
06/2028 |
10,773 |
9,373 |
(e)(f) |
||||||||||||||||||||||||||||||||||||||
|
Marcone |
1st Lien |
11.44% |
SOFR (Q) |
7.00 |
% |
06/2028 |
3,554 |
3,092 |
(e) |
||||||||||||||||||||||||||||||||||||||
|
Mavis Tire |
1st Lien |
7.33% |
SOFR (Q) |
3.00 |
% |
05/2028 |
7,898 |
7,889 |
|||||||||||||||||||||||||||||||||||||||
|
Mountaineer |
1st Lien |
9.28% |
SOFR (Q) |
5.00 |
% |
10/2027 |
2,217 |
2,106 |
(e)(g) |
||||||||||||||||||||||||||||||||||||||
|
Mr. Greens |
1st Lien |
10.16% |
SOFR (M) |
5.75 |
% |
05/2031 |
34 |
34 |
(e)(g) |
||||||||||||||||||||||||||||||||||||||
|
Mr. Greens |
1st Lien |
10.67% |
SOFR (M) |
6.25 |
% |
05/2029 |
2,270 |
2,270 |
(e)(f) |
||||||||||||||||||||||||||||||||||||||
|
Mr. Greens |
1st Lien |
10.07% |
SOFR (M) |
5.75 |
% |
05/2031 |
577 |
577 |
(e)(f) |
||||||||||||||||||||||||||||||||||||||
|
Mr. Greens |
1st Lien |
10.16% |
SOFR (M) |
5.75 |
% |
05/2031 |
104 |
104 |
(e)(g) |
||||||||||||||||||||||||||||||||||||||
|
Phoenix YW |
1st Lien |
05/2030 |
— |
— |
(e)(g) |
||||||||||||||||||||||||||||||||||||||||||
|
Phoenix YW |
1st Lien |
9.33% |
SOFR (M) |
5.00 |
% |
05/2030 |
5,242 |
5,242 |
(e)(f) |
||||||||||||||||||||||||||||||||||||||
Semi Annual Report 2025
23
CION Ares Diversified Credit Fund
Consolidated Schedule of Investments (continued)
June 30, 2025 (Unaudited)
(in thousands, except shares, percentages and as otherwise noted)
Senior Loans(b)(c)(d) (continued)
|
Company |
Country(a) |
Investment |
Coupon |
Reference |
Spread |
Acquisition |
Maturity |
Shares |
Principal |
Fair Value(a) |
% of Net |
||||||||||||||||||||||||||||||||||||
|
Reddy Ice LLC |
1st Lien |
11.25% |
PRIME (Q) |
3.75 |
% |
04/2029 |
$ |
2,471 |
$ |
2,471 |
(e)(g) |
||||||||||||||||||||||||||||||||||||
|
Reddy Ice LLC |
1st Lien |
9.03% |
SOFR (Q) |
4.75 |
% |
04/2029 |
33,238 |
33,238 |
(e)(f) |
||||||||||||||||||||||||||||||||||||||
|
Reddy Ice LLC |
1st Lien |
9.03% |
SOFR (Q) |
4.75 |
% |
04/2029 |
7,865 |
7,865 |
(e)(f) |
||||||||||||||||||||||||||||||||||||||
|
Royal Borrower, |
1st Lien |
07/2030 |
— |
— |
(e)(g) |
||||||||||||||||||||||||||||||||||||||||||
|
Royal Borrower, |
1st Lien |
9.56% |
SOFR (M) |
5.25 |
% |
07/2030 |
2,410 |
2,410 |
(e)(f) |
||||||||||||||||||||||||||||||||||||||
|
Royal Borrower, |
1st Lien |
07/2030 |
— |
— |
(e)(g) |
||||||||||||||||||||||||||||||||||||||||||
|
Saldon Holdings, |
1st Lien |
10.43% |
SOFR (M) |
6.00 |
% |
03/2026 |
117 |
117 |
(e)(g) |
||||||||||||||||||||||||||||||||||||||
|
Saldon Holdings, |
1st Lien |
10.43% |
SOFR (M) |
6.00 |
% |
03/2026 |
7,943 |
7,944 |
(e)(f) |
||||||||||||||||||||||||||||||||||||||
|
Saldon Holdings, |
1st Lien |
03/2026 |
— |
— |
(e)(g) |
||||||||||||||||||||||||||||||||||||||||||
|
SCIH Salt |
1st Lien |
7.29% |
SOFR (M) |
3.00 |
% |
01/2029 |
49,172 |
49,151 |
(f) |
||||||||||||||||||||||||||||||||||||||
|
SFE Intermediate |
1st Lien |
10.20% |
SOFR (Q) |
5.75 |
% |
07/2026 |
2,031 |
2,031 |
(e)(f) |
||||||||||||||||||||||||||||||||||||||
|
Shur-Co |
1st Lien |
9.83% |
SOFR (Q) |
5.50 |
% |
07/2030 |
5,818 |
5,818 |
(e)(f) |
||||||||||||||||||||||||||||||||||||||
|
US Salt Investors, |
1st Lien |
07/2026 |
— |
— |
(e)(g) |
||||||||||||||||||||||||||||||||||||||||||
|
US Salt Investors, |
1st Lien |
9.70% |
SOFR (Q) |
5.25 |
% |
07/2028 |
5,609 |
5,609 |
(e)(f) |
||||||||||||||||||||||||||||||||||||||
|
Worldwide |
1st Lien |
01/2029 |
— |
— |
(e)(g) |
||||||||||||||||||||||||||||||||||||||||||
|
Worldwide |
1st Lien |
11.97% |
SOFR (S) |
7.75 |
% |
01/2029 |
143 |
136 |
(e)(f) |
||||||||||||||||||||||||||||||||||||||
|
Worldwide |
1st Lien |
11.97% |
SOFR (S) |
7.75 |
% |
01/2029 |
51 |
48 |
(e)(f) |
||||||||||||||||||||||||||||||||||||||
|
ZB Holdco LLC |
1st Lien |
10.23% |
SOFR (Q) |
5.75 |
% |
02/2028 |
494 |
494 |
(e)(g) |
||||||||||||||||||||||||||||||||||||||
|
ZB Holdco LLC |
1st Lien |
10.20% |
SOFR (Q) |
5.75 |
% |
02/2028 |
1,927 |
1,927 |
(e)(f) |
||||||||||||||||||||||||||||||||||||||
|
ZB Holdco LLC |
1st Lien |
10.23% |
SOFR (Q) |
5.75 |
% |
02/2028 |
354 |
353 |
(e)(f) |
||||||||||||||||||||||||||||||||||||||
Semi Annual Report 2025
24
CION Ares Diversified Credit Fund
Consolidated Schedule of Investments (continued)
June 30, 2025 (Unaudited)
(in thousands, except shares, percentages and as otherwise noted)
Senior Loans(b)(c)(d) (continued)
|
Company |
Country(a) |
Investment |
Coupon |
Reference |
Spread |
Acquisition Date |
Maturity Date |
Shares |
Principal Amount(a) |
Fair Value(a) |
% of Net Assets |
||||||||||||||||||||||||||||||||||||
|
ZB Holdco LLC |
1st Lien Delay Draw Term Loan |
10.20% |
SOFR (Q) |
5.75 |
% |
02/2028 |
$ |
1,257 |
$ |
1,258 |
(e)(f) |
||||||||||||||||||||||||||||||||||||
|
ZB Holdco LLC |
1st Lien Delay Draw Term Loan |
10.21% |
SOFR (Q) |
5.75 |
% |
02/2028 |
337 |
337 |
(e)(g) |
||||||||||||||||||||||||||||||||||||||
|
ZB Holdco LLC |
1st Lien Delay Draw Term Loan |
02/2028 |
— |
— |
(e)(g) |
||||||||||||||||||||||||||||||||||||||||||
|
215,933 |
4.45 |
% |
|||||||||||||||||||||||||||||||||||||||||||||
|
Consumer Durables and Apparel |
|||||||||||||||||||||||||||||||||||||||||||||||
|
760203 N.B. LTD. |
Canada |
1st Lien Revolving Loan |
9.57% |
SOFR (M) |
5.25 |
% |
12/2030 |
CAD |
1,650 |
1,199 |
(e)(g) |
||||||||||||||||||||||||||||||||||||
|
760203 N.B. LTD. |
Canada |
1st Lien Term Loan |
8.25% |
CDOR (M) |
5.50 |
% |
12/2030 |
CAD |
9,539 |
6,935 |
(e)(f) |
||||||||||||||||||||||||||||||||||||
|
Centric Brands LLC |
1st Lien Term Loan |
9.76% |
SOFR (Q) |
5.50 |
% |
08/2029 |
964 |
964 |
(e) |
||||||||||||||||||||||||||||||||||||||
|
DRS Holdings III, Inc. |
1st Lien Revolving Loan |
11/2028 |
— |
— |
(e)(g) |
||||||||||||||||||||||||||||||||||||||||||
|
DRS Holdings III, Inc. |
1st Lien Term Loan |
9.58% |
SOFR (Q) |
5.25 |
% |
11/2028 |
15,025 |
15,026 |
(e)(f) |
||||||||||||||||||||||||||||||||||||||
|
Rawlings Sporting Goods Company, Inc. |
1st Lien Revolving Loan |
8.17% |
SOFR (M) |
3.75 |
% |
11/2029 |
447 |
447 |
(e)(g) |
||||||||||||||||||||||||||||||||||||||
|
Rawlings Sporting Goods Company, Inc. |
1st Lien Term Loan |
9.20% |
SOFR (Q) |
4.75 |
% |
11/2030 |
7,614 |
7,614 |
(e)(f) |
||||||||||||||||||||||||||||||||||||||
|
ST Athena Global LLC |
1st Lien Revolving Loan |
9.54% |
SOFR (Q) |
5.25 |
% |
06/2029 |
238 |
233 |
(e)(g) |
||||||||||||||||||||||||||||||||||||||
|
ST Athena Global LLC |
1st Lien Term Loan |
9.56% |
SOFR (Q) |
5.25 |
% |
06/2030 |
4,154 |
4,071 |
(e)(f) |
||||||||||||||||||||||||||||||||||||||
|
ST Athena Global LLC |
1st Lien Term Loan |
9.47% |
SONIA (M) |
5.25 |
% |
06/2030 |
£ |
1,875 |
2,522 |
(e)(f) |
|||||||||||||||||||||||||||||||||||||
|
ST Athena Global LLC |
1st Lien Delay Draw Term Loan |
06/2030 |
— |
— |
(e)(g) |
||||||||||||||||||||||||||||||||||||||||||
|
Varsity Brands, Inc. |
1st Lien Term Loan |
7.83% |
SOFR (Q) |
3.50 |
% |
08/2031 |
5,925 |
5,919 |
|||||||||||||||||||||||||||||||||||||||
|
44,930 |
0.93 |
% |
|||||||||||||||||||||||||||||||||||||||||||||
|
Consumer Services |
|||||||||||||||||||||||||||||||||||||||||||||||
|
Apex Service Partners, LLC |
1st Lien Revolving Loan |
10/2029 |
— |
— |
(e)(g) |
||||||||||||||||||||||||||||||||||||||||||
|
Apex Service Partners, LLC |
1st Lien Term Loan |
9.32% |
SOFR (Q) |
5.00 |
% |
10/2030 |
23,981 |
23,981 |
(e)(f) |
||||||||||||||||||||||||||||||||||||||
Semi Annual Report 2025
25
CION Ares Diversified Credit Fund
Consolidated Schedule of Investments (continued)
June 30, 2025 (Unaudited)
(in thousands, except shares, percentages and as otherwise noted)
Senior Loans(b)(c)(d) (continued)
|
Company |
Country(a) |
Investment |
Coupon |
Reference |
Spread |
Acquisition |
Maturity |
Shares |
Principal |
Fair Value(a) |
% of Net |
||||||||||||||||||||||||||||||||||||
|
Apex Service |
1st Lien |
9.32% |
SOFR (Q) |
5.00 |
% |
10/2030 |
$ |
11,882 |
$ |
11,882 |
(e)(f) |
||||||||||||||||||||||||||||||||||||
|
ASP Dream |
1st Lien |
8.68% |
SOFR (M) |
4.25 |
% |
12/2028 |
5,949 |
5,741 |
(e)(f) |
||||||||||||||||||||||||||||||||||||||
|
Aspris Bidco |
United |
1st Lien |
11.02% |
SONIA (S) |
6.50 |
% |
08/2028 |
£ |
3,234 |
4,440 |
(e)(f) |
||||||||||||||||||||||||||||||||||||
|
Aspris Bidco |
United |
1st Lien |
11.01% |
SONIA (S) |
6.50 |
% |
08/2028 |
£ |
1,406 |
1,930 |
(e) |
||||||||||||||||||||||||||||||||||||
|
Aspris Bidco |
United |
1st Lien |
11.58% |
SONIA (Q) |
7.00 |
% |
02/2030 |
£ |
571 |
784 |
(e)(g) |
||||||||||||||||||||||||||||||||||||
|
Astra Service |
1st Lien |
9.59% |
SOFR (Q) |
5.00 |
% |
03/2027 |
1 |
1 |
(e)(g) |
||||||||||||||||||||||||||||||||||||||
|
Astra Service |
1st Lien |
9.58% |
SOFR (Q) |
5.00 |
% |
03/2027 |
490 |
490 |
(e)(f) |
||||||||||||||||||||||||||||||||||||||
|
Astra Service |
1st Lien |
9.58% |
SOFR (Q) |
5.00 |
% |
03/2027 |
927 |
927 |
(e) |
||||||||||||||||||||||||||||||||||||||
|
Astra Service |
1st Lien |
10.32% |
SOFR (Q) |
6.00 |
% |
03/2027 |
51 |
51 |
(e)(g) |
||||||||||||||||||||||||||||||||||||||
|
Astra Service |
1st Lien |
03/2027 |
— |
— |
(e)(g) |
||||||||||||||||||||||||||||||||||||||||||
|
Bumble Bidco |
United |
1st Lien |
11.00% |
SONIA (Q) |
6.75 |
% |
10/2030 |
£ |
3,542 |
4,861 |
(e) |
||||||||||||||||||||||||||||||||||||
|
Bumble Bidco |
United |
1st Lien |
10/2030 |
£ |
— |
— |
(e)(g) |
||||||||||||||||||||||||||||||||||||||||
|
CC Fly Holding II |
Denmark |
1st Lien |
12.11% |
NIBOR (Q) |
7.75 |
% |
05/2026 |
DKK |
804 |
118 |
(e)(f) |
||||||||||||||||||||||||||||||||||||
|
CC Fly Holding II |
Denmark |
1st Lien |
12.11% |
NIBOR (Q) |
7.75 |
% |
05/2026 |
DKK |
3,813 |
560 |
(e)(f) |
||||||||||||||||||||||||||||||||||||
|
CC Fly Holding II |
Denmark |
1st Lien |
9.70% |
CIBOR (Q) |
7.75 |
% |
05/2026 |
DKK |
6,065 |
890 |
(e)(f) |
||||||||||||||||||||||||||||||||||||
|
Clarion Home |
1st Lien |
10.38% |
SOFR (Q) |
6.00 |
% |
12/2027 |
260 |
247 |
(e)(g) |
||||||||||||||||||||||||||||||||||||||
|
Clarion Home |
1st Lien |
12.38% |
SOFR (Q) |
8.00 |
% |
12/2027 |
2,528 |
2,427 |
(e) |
||||||||||||||||||||||||||||||||||||||
|
Clarion Home |
1st Lien |
12.38% |
SOFR (Q) |
8.00 |
% |
12/2027 |
1,435 |
1,378 |
(e) |
||||||||||||||||||||||||||||||||||||||
|
Clarion Home |
1st Lien |
12.66% |
SOFR (Q) |
8.25 |
% |
12/2027 |
262 |
251 |
(e)(g) |
||||||||||||||||||||||||||||||||||||||
|
ClubCorp |
1st Lien |
9.56% |
SOFR (Q) |
5.00 |
% |
09/2026 |
9,154 |
9,150 |
(f) |
||||||||||||||||||||||||||||||||||||||
Semi Annual Report 2025
26
CION Ares Diversified Credit Fund
Consolidated Schedule of Investments (continued)
June 30, 2025 (Unaudited)
(in thousands, except shares, percentages and as otherwise noted)
Senior Loans(b)(c)(d) (continued)
|
Company |
Country(a) |
Investment |
Coupon |
Reference |
Spread |
Acquisition Date |
Maturity Date |
Shares |
Principal Amount(a) |
Fair Value(a) |
% of Net Assets |
||||||||||||||||||||||||||||||||||||
|
CMG HoldCo, LLC |
1st Lien Revolving Loan |
8.96% |
SOFR (S) |
4.75 |
% |
05/2028 |
$ |
431 |
$ |
431 |
(e)(g) |
||||||||||||||||||||||||||||||||||||
|
CMG HoldCo, LLC |
1st Lien Term Loan |
8.88% |
SOFR (S) |
4.75 |
% |
05/2028 |
704 |
704 |
(e)(f) |
||||||||||||||||||||||||||||||||||||||
|
CMG HoldCo, LLC |
1st Lien Delay Draw Term Loan |
8.88% |
SOFR (S) |
4.75 |
% |
05/2028 |
1,459 |
1,459 |
(e)(f) |
||||||||||||||||||||||||||||||||||||||
|
CMG HoldCo, LLC |
1st Lien Delay Draw Term Loan |
8.94% |
SOFR (S) |
4.75 |
% |
05/2028 |
1,910 |
1,910 |
(e)(g) |
||||||||||||||||||||||||||||||||||||||
|
CMG HoldCo, LLC |
1st Lien Delay Draw Term Loan |
05/2028 |
— |
— |
(e)(g) |
||||||||||||||||||||||||||||||||||||||||||
|
CST Holding Company |
1st Lien Revolving Loan |
11/2028 |
— |
— |
(e)(g) |
||||||||||||||||||||||||||||||||||||||||||
|
CST Holding Company |
1st Lien Term Loan |
9.43% |
SOFR (S) |
5.00 |
% |
11/2028 |
1,065 |
1,065 |
(e)(f) |
||||||||||||||||||||||||||||||||||||||
|
Davidson Hotel Company LLC |
1st Lien Revolving Loan |
10/2031 |
— |
— |
(e)(g) |
||||||||||||||||||||||||||||||||||||||||||
|
Davidson Hotel Company LLC |
1st Lien Term Loan |
9.33% |
SOFR (M) |
5.00 |
% |
10/2031 |
3,306 |
3,306 |
(e)(f) |
||||||||||||||||||||||||||||||||||||||
|
Davidson Hotel Company LLC |
1st Lien Delay Draw Term Loan |
9.33% |
SOFR (M) |
5.00 |
% |
10/2031 |
43 |
43 |
(e)(g) |
||||||||||||||||||||||||||||||||||||||
|
ECG Bidco S.A.S. |
France |
1st Lien Term Loan |
8.98% | EURIBOR (Q) |
7.00 |
% |
10/2028 |
€ |
6,010 |
7,079 |
(e)(f) |
||||||||||||||||||||||||||||||||||||
|
ECG Bidco S.A.S. |
France |
1st Lien Term Loan |
10.24% |
SONIA (Q) |
5.75 |
% |
05/2029 |
£ |
9,567 |
13,132 |
(e)(f) |
||||||||||||||||||||||||||||||||||||
|
ECG Bidco S.A.S. |
France |
1st Lien Delay Draw Term Loan |
8.73% | EURIBOR (Q) |
6.75 |
% |
05/2029 |
€ |
1,227 |
1,445 |
(e)(f)(g) |
||||||||||||||||||||||||||||||||||||
|
ECG Bidco S.A.S. |
France |
1st Lien Delay Draw Term Loan |
05/2029 |
€ |
— |
— |
(e)(f)(g) |
||||||||||||||||||||||||||||||||||||||||
|
ECG Bidco S.A.S. |
France |
1st Lien Delay Draw Term Loan |
7.73% | EURIBOR (Q) |
5.75 |
% |
05/2029 |
€ |
17,736 |
20,892 |
(e) |
||||||||||||||||||||||||||||||||||||
|
Equinox Holdings, Inc. |
1st Lien Term Loan |
12.55% (4.13% PIK) |
SOFR (Q) |
8.25 |
% |
03/2029 |
43,990 |
43,990 |
(e)(f) |
||||||||||||||||||||||||||||||||||||||
|
Equinox Holdings, Inc. |
2nd Lien Term Loan |
16.00% PIK |
06/2027 |
4,111 |
4,111 |
(e) |
|||||||||||||||||||||||||||||||||||||||||
|
Essential Services Holding Corporation |
1st Lien Revolving Loan |
9.33% |
SOFR (Q) |
5.00 |
% |
06/2030 |
313 |
307 |
(e)(g) |
||||||||||||||||||||||||||||||||||||||
|
Essential Services Holding Corporation |
1st Lien Term Loan |
9.28% |
SOFR (Q) |
5.00 |
% |
06/2031 |
21,311 |
20,885 |
(e)(f) |
||||||||||||||||||||||||||||||||||||||
|
Essential Services Holding Corporation |
1st Lien Delay Draw Term Loan |
06/2031 |
— |
— |
(e)(g) |
||||||||||||||||||||||||||||||||||||||||||
Semi Annual Report 2025
27
CION Ares Diversified Credit Fund
Consolidated Schedule of Investments (continued)
June 30, 2025 (Unaudited)
(in thousands, except shares, percentages and as otherwise noted)
Senior Loans(b)(c)(d) (continued)
|
Company |
Country(a) |
Investment |
Coupon |
Reference |
Spread |
Acquisition Date |
Maturity Date |
Shares |
Principal Amount(a) |
Fair Value(a) |
% of Net Assets |
||||||||||||||||||||||||||||||||||||
|
Eternal Aus Bidco Pty Ltd |
Australia |
1st Lien Term Loan |
10.00% |
BBSY (Q) |
6.25 |
% |
11/2029 |
AUD |
1,834 |
$ |
1,208 |
(e) |
|||||||||||||||||||||||||||||||||||
|
Eternal Aus Bidco Pty Ltd |
Australia |
1st Lien Delay Draw Term Loan |
10.00% |
BBSY (Q) |
6.25 |
% |
11/2029 |
AUD |
76 |
50 |
(e)(g) |
||||||||||||||||||||||||||||||||||||
|
EuroParcs Topholding B.V. |
Netherlands |
1st Lien Delay Draw Term Loan |
10.20% PIK |
EURIBOR (Q) |
8.25 |
% |
07/2029 |
€ |
300 |
354 |
(e)(g) |
||||||||||||||||||||||||||||||||||||
|
Excel Fitness Holdings, Inc. |
1st Lien Term Loan |
9.80% |
SOFR (Q) |
5.50 |
% |
04/2029 |
752 |
752 |
(e)(f) |
||||||||||||||||||||||||||||||||||||||
|
Excel Fitness Holdings, Inc. |
1st Lien Delay Draw Term Loan |
9.80% |
SOFR (Q) |
5.50 |
% |
04/2029 |
379 |
379 |
(e)(f) |
||||||||||||||||||||||||||||||||||||||
|
Excel Fitness Holdings, Inc. |
1st Lien Delay Draw Term Loan |
9.80% |
SOFR (Q) |
5.50 |
% |
04/2029 |
30 |
30 |
(e)(g) |
||||||||||||||||||||||||||||||||||||||
|
Family First Bidco Limited |
United Kingdom |
1st Lien Term Loan |
12.50% |
12/2029 |
£ |
28 |
38 |
(e) |
|||||||||||||||||||||||||||||||||||||||
|
Family First Bidco Limited |
United Kingdom |
1st Lien Term Loan |
12.50% |
12/2029 |
£ |
2 |
3 |
(e) |
|||||||||||||||||||||||||||||||||||||||
|
Fertitta Entertainment, LLC |
1st Lien Term Loan |
7.83% |
SOFR (M) |
3.50 |
% |
01/2029 |
5,753 |
5,743 |
(f) |
||||||||||||||||||||||||||||||||||||||
|
Fitness Ventures Holdings, Inc. |
1st Lien Revolving Loan |
8.33% |
SOFR (M) |
4.00 |
% |
08/2030 |
128 |
128 |
(e)(g) |
||||||||||||||||||||||||||||||||||||||
|
Fitness Ventures Holdings, Inc. |
1st Lien Term Loan |
9.83% |
SOFR (M) |
5.50 |
% |
08/2031 |
2,010 |
2,010 |
(e)(f) |
||||||||||||||||||||||||||||||||||||||
|
Fitness Ventures Holdings, Inc. |
1st Lien Delay Draw Term Loan |
9.83% |
SOFR (M) |
5.50 |
% |
08/2031 |
323 |
323 |
(e)(g) |
||||||||||||||||||||||||||||||||||||||
|
Flint Opco, LLC |
1st Lien Revolving Loan |
08/2029 |
— |
— |
(e)(g) |
||||||||||||||||||||||||||||||||||||||||||
|
Flint Opco, LLC |
1st Lien Term Loan |
9.03% |
SOFR (Q) |
4.75 |
% |
08/2030 |
1,016 |
1,015 |
(e)(f) |
||||||||||||||||||||||||||||||||||||||
|
Flint Opco, LLC |
1st Lien Delay Draw Term Loan |
9.03% |
SOFR (Q) |
4.75 |
% |
08/2030 |
429 |
429 |
(e)(f) |
||||||||||||||||||||||||||||||||||||||
|
Flint Opco, LLC |
1st Lien Delay Draw Term Loan |
9.05% |
SOFR (Q) |
4.75 |
% |
08/2030 |
435 |
435 |
(e)(g) |
||||||||||||||||||||||||||||||||||||||
|
Flint Opco, LLC |
1st Lien Delay Draw Term Loan |
08/2030 |
— |
— |
(e)(g) |
||||||||||||||||||||||||||||||||||||||||||
|
GS SEER Group Borrower LLC |
1st Lien Revolving Loan |
04/2029 |
— |
— |
(e)(g) |
||||||||||||||||||||||||||||||||||||||||||
|
GS SEER Group Borrower LLC |
1st Lien Term Loan |
11.05% |
SOFR (Q) |
6.75 |
% |
04/2030 |
319 |
319 |
(e) |
||||||||||||||||||||||||||||||||||||||
|
GS SEER Group Borrower LLC |
1st Lien Delay Draw Term Loan |
11.05% |
SOFR (Q) |
6.75 |
% |
04/2030 |
112 |
112 |
(e)(g) |
||||||||||||||||||||||||||||||||||||||
Semi Annual Report 2025
28
CION Ares Diversified Credit Fund
Consolidated Schedule of Investments (continued)
June 30, 2025 (Unaudited)
(in thousands, except shares, percentages and as otherwise noted)
Senior Loans(b)(c)(d) (continued)
|
Company |
Country(a) |
Investment |
Coupon |
Reference |
Spread |
Acquisition |
Maturity |
Shares |
Principal |
Fair Value(a) |
% of Net |
||||||||||||||||||||||||||||||||||||
|
HGC Holdings, |
1st Lien |
06/2029 |
$ |
— |
$ |
— |
(e)(g) |
||||||||||||||||||||||||||||||||||||||||
|
HGC Holdings, |
1st Lien |
9.32% |
SOFR (Q) |
5.00 |
% |
06/2029 |
23,342 |
23,167 |
(e)(f) |
||||||||||||||||||||||||||||||||||||||
|
HGC Holdings, |
1st Lien |
8.80% |
SOFR (Q) |
4.50 |
% |
06/2029 |
671 |
669 |
(e)(g) |
||||||||||||||||||||||||||||||||||||||
|
IFH Franchisee |
1st Lien |
8.32% |
SOFR (Q) |
4.00 |
% |
12/2029 |
1,158 |
1,157 |
(e)(g) |
||||||||||||||||||||||||||||||||||||||
|
IFH Franchisee |
1st Lien |
10.07% |
SOFR (Q) |
5.75 |
% |
12/2029 |
3,879 |
3,879 |
(e)(f) |
||||||||||||||||||||||||||||||||||||||
|
IFH Franchisee |
1st Lien |
12/2029 |
— |
— |
(e)(g) |
||||||||||||||||||||||||||||||||||||||||||
|
Infinity Home |
1st Lien |
12.50% |
PRIME (Q) |
5.00 |
% |
12/2028 |
114 |
114 |
(e)(g) |
||||||||||||||||||||||||||||||||||||||
|
Infinity Home |
1st Lien |
12/2028 |
CAD |
— |
— |
(e)(g) |
|||||||||||||||||||||||||||||||||||||||||
|
Infinity Home |
1st Lien |
10.30% |
SOFR (Q) |
6.00 |
% |
12/2028 |
3,324 |
3,324 |
(e)(f) |
||||||||||||||||||||||||||||||||||||||
|
Infinity Home |
1st Lien |
10.30% |
SOFR (Q) |
6.00 |
% |
12/2028 |
2,195 |
2,195 |
(e)(f)(g) |
||||||||||||||||||||||||||||||||||||||
|
Infinity Home |
1st Lien |
9.80% |
SOFR (Q) |
5.50 |
% |
12/2028 |
1,727 |
1,727 |
(e)(g) |
||||||||||||||||||||||||||||||||||||||
|
Infinity Home |
1st Lien |
12/2028 |
— |
— |
(e)(g) |
||||||||||||||||||||||||||||||||||||||||||
|
IRB Holding Corp. |
1st Lien |
6.83% |
SOFR (M) |
2.50 |
% |
12/2027 |
12,515 |
12,511 |
(f) |
||||||||||||||||||||||||||||||||||||||
|
Leviathan |
1st Lien |
10.31% |
SOFR (M) |
6.00 |
% |
12/2027 |
6 |
6 |
(e)(g) |
||||||||||||||||||||||||||||||||||||||
|
Leviathan |
1st Lien |
10.30% |
SOFR (Q) |
6.00 |
% |
12/2027 |
1,360 |
1,360 |
(e)(f) |
||||||||||||||||||||||||||||||||||||||
|
LGDN Bidco |
United |
1st Lien |
12.19% |
SONIA (Q) |
7.59 |
% |
12/2027 |
£ |
2,195 |
3,014 |
(e)(f) |
||||||||||||||||||||||||||||||||||||
|
LGDN Bidco |
United |
1st Lien |
12/2027 |
£ |
— |
— |
(e)(f)(g) |
||||||||||||||||||||||||||||||||||||||||
|
Mister Car Wash |
1st Lien |
6.83% |
SOFR (M) |
2.50 |
% |
03/2031 |
7,655 |
7,663 |
(f) |
||||||||||||||||||||||||||||||||||||||
|
Mustang |
1st Lien |
9.30% |
SOFR (Q) |
5.00 |
% |
06/2031 |
17 |
17 |
(e)(g) |
||||||||||||||||||||||||||||||||||||||
Semi Annual Report 2025
29
CION Ares Diversified Credit Fund
Consolidated Schedule of Investments (continued)
June 30, 2025 (Unaudited)
(in thousands, except shares, percentages and as otherwise noted)
Senior Loans(b)(c)(d) (continued)
|
Company |
Country(a) |
Investment |
Coupon |
Reference |
Spread |
Acquisition |
Maturity |
Shares |
Principal |
Fair Value(a) |
% of Net |
||||||||||||||||||||||||||||||||||||
|
Mustang |
1st Lien |
9.30% |
SOFR (Q) |
5.00 |
% |
06/2031 |
$ |
1,505 |
$ |
1,506 |
(e)(f) |
||||||||||||||||||||||||||||||||||||
|
Mustang |
1st Lien |
9.30% |
SOFR (Q) |
5.00 |
% |
06/2031 |
392 |
392 |
(e)(g) |
||||||||||||||||||||||||||||||||||||||
|
North Haven |
1st Lien |
9.30% |
SOFR (Q) |
5.00 |
% |
05/2028 |
7 |
7 |
(e)(g) |
||||||||||||||||||||||||||||||||||||||
|
North Haven |
1st Lien |
9.28% |
SOFR (Q) |
5.00 |
% |
05/2028 |
44 |
44 |
(e)(f) |
||||||||||||||||||||||||||||||||||||||
|
North Haven |
1st Lien |
9.26% |
SOFR (Q) |
5.00 |
% |
05/2028 |
644 |
644 |
(e)(f) |
||||||||||||||||||||||||||||||||||||||
|
North Haven |
1st Lien |
9.28% |
SOFR (Q) |
5.00 |
% |
05/2028 |
195 |
196 |
(e)(f) |
||||||||||||||||||||||||||||||||||||||
|
North Haven |
1st Lien |
9.30% |
SOFR (Q) |
5.00 |
% |
05/2028 |
924 |
924 |
(e)(g) |
||||||||||||||||||||||||||||||||||||||
|
Northwinds |
1st Lien |
05/2029 |
— |
— |
(e)(g) |
||||||||||||||||||||||||||||||||||||||||||
|
Northwinds |
1st Lien |
9.42% |
SOFR (Q) |
5.00 |
% |
05/2029 |
4,221 |
4,221 |
(e)(f) |
||||||||||||||||||||||||||||||||||||||
|
Northwinds |
1st Lien |
9.42% |
SOFR (Q) |
5.00 |
% |
05/2029 |
2,852 |
2,852 |
(e)(f) |
||||||||||||||||||||||||||||||||||||||
|
Northwinds |
1st Lien |
9.46% |
SOFR (Q) |
5.00 |
% |
05/2029 |
1,872 |
1,872 |
(e) |
||||||||||||||||||||||||||||||||||||||
|
Northwinds |
1st Lien |
9.47% |
SOFR (Q) |
5.00 |
% |
05/2029 |
15 |
15 |
(e)(g) |
||||||||||||||||||||||||||||||||||||||
|
PestCo, LLC |
1st Lien |
02/2028 |
— |
— |
(e)(g) |
||||||||||||||||||||||||||||||||||||||||||
|
PestCo, LLC |
1st Lien |
10.68% |
SOFR (Q) |
6.25 |
% |
02/2028 |
391 |
391 |
(e)(f) |
||||||||||||||||||||||||||||||||||||||
|
PestCo, LLC |
1st Lien |
9.53% |
SOFR (Q) |
5.25 |
% |
02/2028 |
154 |
155 |
(e)(f) |
||||||||||||||||||||||||||||||||||||||
|
PestCo, LLC |
1st Lien |
10.68% |
SOFR (Q) |
6.25 |
% |
02/2028 |
99 |
99 |
(e)(f) |
||||||||||||||||||||||||||||||||||||||
|
PestCo, LLC |
1st Lien |
02/2028 |
— |
— |
(e)(g) |
||||||||||||||||||||||||||||||||||||||||||
|
Pinnacle MEP |
1st Lien |
9.04% |
SOFR (Q) |
4.75 |
% |
10/2030 |
311 |
307 |
(e)(g) |
||||||||||||||||||||||||||||||||||||||
|
Pinnacle MEP |
1st Lien |
9.04% |
SOFR (Q) |
4.75 |
% |
10/2030 |
1,385 |
1,371 |
(e)(f) |
||||||||||||||||||||||||||||||||||||||
Semi Annual Report 2025
30
CION Ares Diversified Credit Fund
Consolidated Schedule of Investments (continued)
June 30, 2025 (Unaudited)
(in thousands, except shares, percentages and as otherwise noted)
Senior Loans(b)(c)(d) (continued)
|
Company |
Country(a) |
Investment |
Coupon |
Reference |
Spread |
Acquisition Date |
Maturity Date |
Shares |
Principal Amount(a) |
Fair Value(a) |
% of Net Assets |
||||||||||||||||||||||||||||||||||||
|
Pinnacle MEP Intermediate Holdco LLC |
1st Lien Delay Draw Term Loan |
9.04% |
SOFR (Q) |
4.75 |
% |
10/2030 |
$ |
487 |
$ |
482 |
(e)(g) |
||||||||||||||||||||||||||||||||||||
|
Premiere Buyer, LLC |
1st Lien Revolving Loan |
05/2030 |
— |
— |
(e)(g) |
||||||||||||||||||||||||||||||||||||||||||
|
Premiere Buyer, LLC |
1st Lien Term Loan |
9.03% |
SOFR (Q) |
4.75 |
% |
05/2031 |
3,543 |
3,544 |
(e)(f) |
||||||||||||||||||||||||||||||||||||||
|
Premiere Buyer, LLC |
1st Lien Delay Draw Term Loan |
9.05% |
SOFR (Q) |
4.75 |
% |
05/2031 |
511 |
511 |
(e) |
||||||||||||||||||||||||||||||||||||||
|
Premiere Buyer, LLC |
1st Lien Delay Draw Term Loan |
9.02% |
SOFR (Q) |
4.75 |
% |
05/2031 |
150 |
150 |
(e) |
||||||||||||||||||||||||||||||||||||||
|
Premiere Buyer, LLC |
1st Lien Delay Draw Term Loan |
05/2031 |
— |
— |
(e)(g) |
||||||||||||||||||||||||||||||||||||||||||
|
Quick Quack Car Wash Holdings, LLC |
1st Lien Revolving Loan |
06/2031 |
— |
— |
(e)(g) |
||||||||||||||||||||||||||||||||||||||||||
|
Quick Quack Car Wash Holdings, LLC |
1st Lien Term Loan |
9.07% |
SOFR (M) |
4.75 |
% |
06/2031 |
2,125 |
2,125 |
(e)(f) |
||||||||||||||||||||||||||||||||||||||
|
Quick Quack Car Wash Holdings, LLC |
1st Lien Delay Draw Term Loan |
9.07% |
SOFR (M) |
4.75 |
% |
06/2031 |
166 |
165 |
(e)(g) |
||||||||||||||||||||||||||||||||||||||
|
Quick Quack Car Wash Holdings, LLC |
1st Lien Delay Draw Term Loan |
06/2031 |
— |
— |
(e)(g) |
||||||||||||||||||||||||||||||||||||||||||
|
Radiant Intermediate Holding, LLC |
1st Lien Term Loan |
10.35% (3.00% PIK) |
SOFR (S) |
6.00 |
% |
11/2026 |
504 |
453 |
(e) |
||||||||||||||||||||||||||||||||||||||
|
Redwood Services, LP |
1st Lien Revolving Loan |
06/2032 |
— |
— |
(e)(g) |
||||||||||||||||||||||||||||||||||||||||||
|
Redwood Services, LP |
1st Lien Term Loan |
9.05% |
SOFR (Q) |
4.75 |
% |
06/2032 |
2,341 |
2,318 |
(e)(f) |
||||||||||||||||||||||||||||||||||||||
|
Redwood Services, LP |
1st Lien Delay Draw Term Loan |
06/2032 |
— |
— |
(e)(g) |
||||||||||||||||||||||||||||||||||||||||||
|
Rust Investment Sarl |
Luxembourg |
1st Lien Term Loan |
11/2034 |
€ |
5,607 |
3,892 |
(e)(i) |
||||||||||||||||||||||||||||||||||||||||
|
Safe Home Security, Inc. |
1st Lien Term Loan |
11.69% |
SOFR (Q) |
7.25 |
% |
05/2025 |
644 |
644 |
(e)(f) |
||||||||||||||||||||||||||||||||||||||
|
Safe Home Security, Inc. |
1st Lien Delay Draw Term Loan |
11.69% |
SOFR (M) |
7.25 |
% |
05/2025 |
51 |
51 |
(e)(f) |
||||||||||||||||||||||||||||||||||||||
|
Service Logic Acquisition, Inc. |
1st Lien Revolving Loan |
10/2025 |
— |
— |
(e)(g) |
||||||||||||||||||||||||||||||||||||||||||
|
Service Logic Acquisition, Inc. |
1st Lien Term Loan |
7.28% |
SOFR (Q) |
3.00 |
% |
10/2027 |
19,835 |
19,835 |
(e) |
||||||||||||||||||||||||||||||||||||||
Semi Annual Report 2025
31
CION Ares Diversified Credit Fund
Consolidated Schedule of Investments (continued)
June 30, 2025 (Unaudited)
(in thousands, except shares, percentages and as otherwise noted)
Senior Loans(b)(c)(d) (continued)
|
Company |
Country(a) |
Investment |
Coupon |
Reference |
Spread |
Acquisition Date |
Maturity Date |
Shares |
Principal Amount(a) |
Fair Value(a) |
% of Net Assets |
||||||||||||||||||||||||||||||||||||
|
Vertex Service Partners, LLC |
1st Lien Revolving Loan |
10.30% |
SOFR (Q) |
6.00 |
% |
11/2030 |
$ |
168 |
$ |
163 |
(e)(g) |
||||||||||||||||||||||||||||||||||||
|
Vertex Service Partners, LLC |
1st Lien Term Loan |
10.30% |
SOFR (Q) |
6.00 |
% |
11/2030 |
1,031 |
1,000 |
(e)(f) |
||||||||||||||||||||||||||||||||||||||
|
Vertex Service Partners, LLC |
1st Lien Delay Draw Term Loan |
10.30% |
SOFR (Q) |
6.00 |
% |
11/2030 |
1,967 |
1,908 |
(e)(f) |
||||||||||||||||||||||||||||||||||||||
|
Vertex Service Partners, LLC |
1st Lien Delay Draw Term Loan |
9.55% |
SOFR (Q) |
5.25 |
% |
11/2030 |
1,181 |
1,122 |
(e)(g) |
||||||||||||||||||||||||||||||||||||||
|
Vulcan UK Bidco Limited |
United Kingdom |
1st Lien Term Loan |
9.64% |
SOFR (S) |
5.25 |
% |
05/2032 |
700 |
700 |
(e) |
|||||||||||||||||||||||||||||||||||||
|
Witherslack Bidco Limited |
United Kingdom |
1st Lien Term Loan |
11.00% |
SONIA (Q) |
6.67 |
% |
08/2028 |
£ |
5,702 |
7,826 |
(e)(f) |
||||||||||||||||||||||||||||||||||||
|
Witherslack Bidco Limited |
United Kingdom |
1st Lien Delay Draw Term Loan |
08/2028 |
£ |
— |
— |
(e)(g) |
||||||||||||||||||||||||||||||||||||||||
|
Witherslack Bidco Limited |
United Kingdom |
1st Lien Delay Draw Term Loan |
10.86% |
SONIA (Q) |
6.40 |
% |
08/2028 |
£ |
6,164 |
8,461 |
(e) |
||||||||||||||||||||||||||||||||||||
|
Witherslack Bidco Limited |
United Kingdom |
1st Lien Delay Draw Term Loan |
10.73% |
SONIA (Q) |
6.40 |
% |
08/2028 |
£ |
704 |
967 |
(e)(g) |
||||||||||||||||||||||||||||||||||||
|
Wrench Group LLC |
1st Lien Term Loan |
8.56% |
SOFR (Q) |
4.00 |
% |
10/2028 |
22,937 |
22,829 |
(f) |
||||||||||||||||||||||||||||||||||||||
|
YE Brands Holdings, LLC |
1st Lien Revolving Loan |
10/2027 |
— |
— |
(e)(g) |
||||||||||||||||||||||||||||||||||||||||||
|
YE Brands Holdings, LLC |
1st Lien Term Loan |
9.05% |
SOFR (Q) |
4.75 |
% |
10/2027 |
2,167 |
2,167 |
(e)(f) |
||||||||||||||||||||||||||||||||||||||
|
YE Brands Holdings, LLC |
1st Lien Delay Draw Term Loan |
9.05% |
SOFR (Q) |
4.75 |
% |
10/2027 |
297 |
297 |
(e)(g) |
||||||||||||||||||||||||||||||||||||||
|
361,605 |
7.45 |
% |
|||||||||||||||||||||||||||||||||||||||||||||
|
Energy |
|||||||||||||||||||||||||||||||||||||||||||||||
|
Enviva Inc. |
1st Lien Term Loan |
12.80% PIK |
SOFR (Q) |
8.50 |
% |
08/2029 |
37,956 |
38,074 |
|||||||||||||||||||||||||||||||||||||||
|
GNZ Energy Bidco Limited |
New Zealand |
1st Lien Delay Draw Term Loan |
9.50% |
BKBM (Q) |
6.00 |
% |
07/2027 |
NZD |
19,293 |
11,760 |
(e)(f) |
||||||||||||||||||||||||||||||||||||
|
GNZ Energy Bidco Limited |
New Zealand |
1st Lien Delay Draw Term Loan |
07/2027 |
NZD |
— |
— |
(e)(g) |
||||||||||||||||||||||||||||||||||||||||
|
HighPeak Energy, Inc. |
1st Lien Term Loan |
11.95% |
SOFR (Q) |
7.50 |
% |
09/2026 |
14,599 |
14,599 |
(e) |
||||||||||||||||||||||||||||||||||||||
|
Offen, Inc. |
1st Lien Term Loan |
9.35% |
SOFR (M) |
5.00 |
% |
06/2026 |
2,643 |
2,643 |
(e)(f) |
||||||||||||||||||||||||||||||||||||||
|
Offen, Inc. |
1st Lien Delay Draw Term Loan |
9.35% |
SOFR (M) |
5.00 |
% |
06/2026 |
13,565 |
13,565 |
(e)(f) |
||||||||||||||||||||||||||||||||||||||
|
Prairie ECI Acquiror LP |
1st Lien Term Loan |
8.58% |
SOFR (M) |
4.25 |
% |
08/2029 |
7,215 |
7,253 |
(f) |
||||||||||||||||||||||||||||||||||||||
Semi Annual Report 2025
32
CION Ares Diversified Credit Fund
Consolidated Schedule of Investments (continued)
June 30, 2025 (Unaudited)
(in thousands, except shares, percentages and as otherwise noted)
Senior Loans(b)(c)(d) (continued)
|
Company |
Country(a) |
Investment |
Coupon |
Reference |
Spread |
Acquisition Date |
Maturity Date |
Shares |
Principal Amount(a) |
Fair Value(a) |
% of Net Assets |
||||||||||||||||||||||||||||||||||||
|
PX HoldCo3 Limited |
United Kingdom |
1st Lien Delay Draw Term Loan |
10.58% |
SONIA (Q) |
6.25 |
% |
04/2027 |
£ |
2,947 |
$ |
4,046 |
(e)(f) |
|||||||||||||||||||||||||||||||||||
|
PX HoldCo3 Limited |
United Kingdom |
1st Lien Delay Draw Term Loan |
10.59% |
SONIA (Q) |
6.25 |
% |
04/2027 |
£ |
221 |
303 |
(e) |
||||||||||||||||||||||||||||||||||||
|
TransMontaigne Operating Company L.P. |
1st Lien Term Loan |
7.58% |
SOFR (M) |
3.25 |
% |
11/2028 |
6,910 |
6,933 |
(f) |
||||||||||||||||||||||||||||||||||||||
|
99,176 |
2.04 |
% |
|||||||||||||||||||||||||||||||||||||||||||||
|
Financial Services |
|||||||||||||||||||||||||||||||||||||||||||||||
|
Aduro Advisors, LLC |
1st Lien Revolving Loan |
07/2030 |
— |
— |
(e)(g) |
||||||||||||||||||||||||||||||||||||||||||
|
Aduro Advisors, LLC |
1st Lien Term Loan |
9.08% |
SOFR (M) |
4.75 |
% |
07/2030 |
2,491 |
2,490 |
(e)(f) |
||||||||||||||||||||||||||||||||||||||
|
Aduro Advisors, LLC |
1st Lien Delay Draw Term Loan |
07/2030 |
— |
— |
(e)(g) |
||||||||||||||||||||||||||||||||||||||||||
|
Alpha Luxco 2 Sarl |
Luxembourg |
1st Lien Delay Draw Term Loan |
9.91% (1.55% PIK) |
EURIBOR (S) |
7.31 |
% |
01/2027 |
€ |
1,030 |
1,214 |
(e)(f) |
||||||||||||||||||||||||||||||||||||
|
Antenore Bidco SpA |
Italy |
1st Lien Delay Draw Term Loan |
11/2031 |
€ |
— |
— |
(e)(g) |
||||||||||||||||||||||||||||||||||||||||
|
AQ Sage Buyer, LLC |
1st Lien Revolving Loan |
10.43% |
SOFR (M) |
6.00 |
% |
01/2027 |
22 |
21 |
(e)(g) |
||||||||||||||||||||||||||||||||||||||
|
AQ Sage Buyer, LLC |
1st Lien Delay Draw Term Loan |
10.47% |
SOFR (S) |
6.00 |
% |
01/2027 |
252 |
244 |
(e) |
||||||||||||||||||||||||||||||||||||||
|
Arete Bidco Limited |
Jersey |
1st Lien Term Loan |
11.39% (2.00% PIK) |
SONIA (Y) |
6.93 |
% |
05/2031 |
£ |
2,590 |
3,555 |
(e) |
||||||||||||||||||||||||||||||||||||
|
Arete Bidco Limited |
Jersey |
1st Lien Delay Draw Term Loan |
11.39% |
SONIA (Q) |
6.93 |
% |
05/2031 |
£ |
1,400 |
1,922 |
(e)(g) |
||||||||||||||||||||||||||||||||||||
|
Arete Bidco Limited |
Jersey |
1st Lien Delay Draw Term Loan |
05/2031 |
£ |
— |
— |
(e)(g)(h) |
||||||||||||||||||||||||||||||||||||||||
|
BCC Blueprint Holdings I, LLC |
1st Lien Term Loan |
11.21% |
SOFR (Q) |
6.75 |
% |
09/2027 |
7,377 |
7,377 |
(e) |
||||||||||||||||||||||||||||||||||||||
|
Beacon Pointe Harmony, LLC |
1st Lien Revolving Loan |
12/2027 |
— |
— |
(e)(g) |
||||||||||||||||||||||||||||||||||||||||||
|
Beacon Pointe Harmony, LLC |
1st Lien Term Loan |
9.08% |
SOFR (M) |
4.75 |
% |
12/2028 |
5,939 |
5,939 |
(e)(f) |
||||||||||||||||||||||||||||||||||||||
|
Beacon Pointe Harmony, LLC |
1st Lien Delay Draw Term Loan |
9.07% |
SOFR (Q) |
4.75 |
% |
12/2028 |
2,336 |
2,336 |
(e)(f) |
||||||||||||||||||||||||||||||||||||||
|
Beacon Pointe Harmony, LLC |
1st Lien Delay Draw Term Loan |
9.08% |
SOFR (M) |
4.75 |
% |
12/2028 |
1,956 |
1,956 |
(e)(f) |
||||||||||||||||||||||||||||||||||||||
Semi Annual Report 2025
33
CION Ares Diversified Credit Fund
Consolidated Schedule of Investments (continued)
June 30, 2025 (Unaudited)
(in thousands, except shares, percentages and as otherwise noted)
Senior Loans(b)(c)(d) (continued)
|
Company |
Country(a) |
Investment |
Coupon |
Reference |
Spread |
Acquisition |
Maturity |
Shares |
Principal |
Fair Value(a) |
% of Net |
||||||||||||||||||||||||||||||||||||
|
Beacon Pointe |
1st Lien |
9.05% |
SOFR (M) |
4.75 |
% |
12/2028 |
$ |
1,684 |
$ |
1,684 |
(e)(g) |
||||||||||||||||||||||||||||||||||||
|
BlauwTrust |
Netherlands |
1st Lien |
9.60% |
EURIBOR (S) |
7.25 |
% |
01/2029 |
€ |
5,045 |
5,943 |
(e)(f) |
||||||||||||||||||||||||||||||||||||
|
Brokers Alliance |
Spain |
1st Lien |
8.16% |
EURIBOR (Q) |
6.18 |
% |
04/2029 |
€ |
2,777 |
3,271 |
(e)(f) |
||||||||||||||||||||||||||||||||||||
|
Brokers Alliance |
Spain |
1st Lien |
8.16% |
EURIBOR (Q) |
6.18 |
% |
04/2029 |
€ |
4,730 |
5,573 |
(e) |
||||||||||||||||||||||||||||||||||||
|
Cezanne Bidco |
France |
1st Lien |
8.48% |
EURIBOR (Q) |
6.50 |
% |
10/2031 |
€ |
5,762 |
6,787 |
(e) |
||||||||||||||||||||||||||||||||||||
|
Cezanne Bidco |
France |
1st Lien |
8.48% |
EURIBOR (Q) |
6.50 |
% |
10/2031 |
€ |
(1,216 |
) |
(1,433 |
)(e)(g) |
|||||||||||||||||||||||||||||||||||
|
Cezanne Bidco |
1st Lien |
10/2031 |
€ |
2,466 |
2,905 |
(e)(g)(h) |
|||||||||||||||||||||||||||||||||||||||||
|
Clearstead |
1st Lien |
8.83% |
SOFR (M) |
4.50 |
% |
02/2028 |
15 |
15 |
(e)(g) |
||||||||||||||||||||||||||||||||||||||
|
Clearstead |
1st Lien |
8.79% |
SOFR (S) |
4.50 |
% |
02/2028 |
433 |
431 |
(e)(f) |
||||||||||||||||||||||||||||||||||||||
|
Convera |
Luxembourg |
1st Lien |
10.45% |
SOFR (Q) |
6.00 |
% |
03/2028 |
20,625 |
20,625 |
(e)(f) |
|||||||||||||||||||||||||||||||||||||
|
Convera |
Jersey |
1st Lien |
03/2027 |
— |
— |
(e)(g) |
|||||||||||||||||||||||||||||||||||||||||
|
Convera |
Jersey |
1st Lien |
10.45% |
SOFR (Q) |
6.00 |
% |
03/2028 |
7,153 |
7,153 |
(e)(f) |
|||||||||||||||||||||||||||||||||||||
|
De Hypothekers |
Netherlands |
1st Lien |
9.60% |
EURIBOR (S) |
7.25 |
% |
01/2029 |
€ |
1,069 |
1,259 |
(e)(f) |
||||||||||||||||||||||||||||||||||||
|
Edelman Financial |
1st Lien |
7.33% |
SOFR (M) |
3.00 |
% |
04/2028 |
12,855 |
12,861 |
(f) |
||||||||||||||||||||||||||||||||||||||
|
Edelman Financial |
2nd Lien |
9.58% |
SOFR (M) |
5.25 |
% |
10/2028 |
17,500 |
17,522 |
|||||||||||||||||||||||||||||||||||||||
|
Endeavor Bidco |
1st Lien |
8.55% |
SOFR (Q) |
4.25 |
% |
08/2029 |
1,067 |
1,067 |
(e)(f) |
||||||||||||||||||||||||||||||||||||||
|
GC Waves |
1st Lien |
10/2030 |
— |
— |
(e)(g) |
||||||||||||||||||||||||||||||||||||||||||
|
GC Waves |
1st Lien |
9.18% |
SOFR (M) |
4.75 |
% |
10/2030 |
1,868 |
1,868 |
(e)(f) |
||||||||||||||||||||||||||||||||||||||
|
GC Waves |
1st Lien |
9.18% |
SOFR (M) |
4.75 |
% |
10/2030 |
4,957 |
4,957 |
(e)(g) |
||||||||||||||||||||||||||||||||||||||
|
GTCR Everest |
1st Lien |
09/2029 |
— |
— |
(e)(g) |
||||||||||||||||||||||||||||||||||||||||||
Semi Annual Report 2025
34
CION Ares Diversified Credit Fund
Consolidated Schedule of Investments (continued)
June 30, 2025 (Unaudited)
(in thousands, except shares, percentages and as otherwise noted)
Senior Loans(b)(c)(d) (continued)
|
Company |
Country(a) |
Investment |
Coupon |
Reference |
Spread |
Acquisition |
Maturity |
Shares |
Principal |
Fair Value(a) |
% of Net |
||||||||||||||||||||||||||||||||||||
|
GTCR F Buyer |
1st Lien |
09/2029 |
$ |
— |
$ |
— |
(e)(g) |
||||||||||||||||||||||||||||||||||||||||
|
GTCR F Buyer |
1st Lien |
9.30% |
SOFR (Q) |
5.00 |
% |
09/2030 |
886 |
885 |
(e)(f) |
||||||||||||||||||||||||||||||||||||||
|
GTCR F Buyer |
1st Lien |
9.30% |
SOFR (Q) |
5.00 |
% |
09/2030 |
407 |
407 |
(e)(g) |
||||||||||||||||||||||||||||||||||||||
|
HighTower |
1st Lien |
7.26% |
SOFR (Q) |
3.00 |
% |
02/2032 |
6,678 |
6,656 |
(f) |
||||||||||||||||||||||||||||||||||||||
|
IVC Acquisition Ltd |
Canada |
1st Lien |
6.01% |
EURIBOR (Q) |
4.00 |
% |
12/2028 |
€ |
6,022 |
7,120 |
|||||||||||||||||||||||||||||||||||||
|
Jewel Bidco |
United |
1st Lien |
07/2028 |
£ |
6,864 |
8,367 |
(e)(f)(i) |
||||||||||||||||||||||||||||||||||||||||
|
Jewel Bidco |
United |
1st Lien |
07/2028 |
£ |
68 |
94 |
(e)(i) |
||||||||||||||||||||||||||||||||||||||||
|
Jewel Bidco |
United |
1st Lien |
07/2028 |
£ |
4,012 |
4,890 |
(e)(i) |
||||||||||||||||||||||||||||||||||||||||
|
The Mather |
1st Lien |
12.25% |
PRIME (Q) |
4.75 |
% |
03/2028 |
285 |
285 |
(e)(g) |
||||||||||||||||||||||||||||||||||||||
|
The Mather |
1st Lien |
10.20% |
SOFR (Q) |
5.75 |
% |
03/2028 |
4,850 |
4,850 |
(e)(f) |
||||||||||||||||||||||||||||||||||||||
|
The Mather |
1st Lien |
10.27% |
SOFR (Q) |
5.75 |
% |
03/2028 |
801 |
801 |
(e)(f) |
||||||||||||||||||||||||||||||||||||||
|
The Mather |
1st Lien |
10.20% |
SOFR (Q) |
5.75 |
% |
03/2028 |
1,951 |
1,951 |
(e)(f) |
||||||||||||||||||||||||||||||||||||||
|
Medlar Bidco |
Jersey |
1st Lien |
9.46% |
SONIA (S) |
5.00 |
% |
05/2032 |
£ |
3,785 |
5,117 |
(e)(f) |
||||||||||||||||||||||||||||||||||||
|
Medlar Bidco |
Jersey |
1st Lien |
7.15% |
EURIBOR (S) |
5.00 |
% |
05/2032 |
€ |
5,395 |
6,259 |
(e)(f) |
||||||||||||||||||||||||||||||||||||
|
Medlar Bidco |
Jersey |
1st Lien |
05/2032 |
£ |
— |
— |
(e)(g) |
||||||||||||||||||||||||||||||||||||||||
|
Mercury Borrower, |
1st Lien |
7.33% |
SOFR (M) |
3.00 |
% |
08/2028 |
2,992 |
2,995 |
|||||||||||||||||||||||||||||||||||||||
|
Monica Holdco |
1st Lien |
01/2026 |
— |
— |
(e)(g) |
||||||||||||||||||||||||||||||||||||||||||
|
Monica Holdco |
1st Lien |
10.20% |
SOFR (Q) |
5.75 |
% |
01/2028 |
7,891 |
7,891 |
(e)(f) |
||||||||||||||||||||||||||||||||||||||
|
Monica Holdco |
1st Lien |
10.05% |
SOFR (Q) |
5.75 |
% |
01/2028 |
2,846 |
2,846 |
(e)(f) |
||||||||||||||||||||||||||||||||||||||
|
OLIFAN GROUP |
France |
1st Lien |
8.29% |
EURIBOR (S) |
6.25 |
% |
03/2032 |
€ |
1,089 |
1,283 |
(e) |
||||||||||||||||||||||||||||||||||||
|
OLIFAN GROUP |
France |
1st Lien |
8.29% |
EURIBOR (Q) |
6.25 |
% |
03/2032 |
€ |
146 |
173 |
(e)(g) |
||||||||||||||||||||||||||||||||||||
|
Pathstone Family |
1st Lien |
05/2028 |
— |
— |
(e)(g) |
||||||||||||||||||||||||||||||||||||||||||
Semi Annual Report 2025
35
CION Ares Diversified Credit Fund
Consolidated Schedule of Investments (continued)
June 30, 2025 (Unaudited)
(in thousands, except shares, percentages and as otherwise noted)
Senior Loans(b)(c)(d) (continued)
|
Company |
Country(a) |
Investment |
Coupon |
Reference |
Spread |
Acquisition |
Maturity |
Shares |
Principal |
Fair Value(a) |
% of Net |
||||||||||||||||||||||||||||||||||||
|
Pathstone Family |
1st Lien |
9.43% |
SOFR (M) |
5.00 |
% |
05/2029 |
$ |
7,618 |
$ |
7,618 |
(e)(f) |
||||||||||||||||||||||||||||||||||||
|
Pathstone Family |
1st Lien |
9.43% |
SOFR (M) |
5.00 |
% |
05/2029 |
255 |
255 |
(e)(f) |
||||||||||||||||||||||||||||||||||||||
|
Pathstone Family |
1st Lien |
05/2029 |
— |
— |
(e)(g) |
||||||||||||||||||||||||||||||||||||||||||
|
PCIA SPV-3, LLC |
1st Lien |
08/2029 |
— |
— |
(e)(g) |
||||||||||||||||||||||||||||||||||||||||||
|
PCIA SPV-3, LLC |
1st Lien |
9.55% |
SOFR (Q) |
5.25 |
% |
08/2029 |
1,493 |
1,494 |
(e)(f) |
||||||||||||||||||||||||||||||||||||||
|
PCIA SPV-3, LLC |
1st Lien |
9.55% |
SOFR (Q) |
5.25 |
% |
08/2029 |
651 |
651 |
(e)(g) |
||||||||||||||||||||||||||||||||||||||
|
PCS Midco, Inc. |
1st Lien |
10.05% |
SOFR (Q) |
5.75 |
% |
03/2030 |
6 |
6 |
(e)(g) |
||||||||||||||||||||||||||||||||||||||
|
PCS Midco, Inc. |
1st Lien |
10.05% |
SOFR (Q) |
5.75 |
% |
03/2030 |
1,015 |
1,015 |
(e)(f) |
||||||||||||||||||||||||||||||||||||||
|
PCS Midco, Inc. |
1st Lien |
10.05% |
SOFR (Q) |
5.75 |
% |
03/2030 |
168 |
168 |
(e)(g) |
||||||||||||||||||||||||||||||||||||||
|
Pegasus (Bidco) |
Jersey |
1st Lien |
11.27% |
SONIA (S) |
6.75 |
% |
04/2029 |
£ |
4,125 |
5,662 |
(e)(f) |
||||||||||||||||||||||||||||||||||||
|
Pegasus (Bidco) |
Jersey |
1st Lien |
11.27% |
SONIA (S) |
6.75 |
% |
04/2029 |
£ |
822 |
1,128 |
(e) |
||||||||||||||||||||||||||||||||||||
|
Perigon Wealth |
1st Lien |
03/2031 |
— |
— |
(e)(g) |
||||||||||||||||||||||||||||||||||||||||||
|
Perigon Wealth |
1st Lien |
9.83% |
SOFR (M) |
5.50 |
% |
03/2031 |
2,006 |
2,006 |
(e)(f) |
||||||||||||||||||||||||||||||||||||||
|
Perigon Wealth |
1st Lien |
9.83% |
SOFR (M) |
5.50 |
% |
03/2031 |
871 |
871 |
(e)(g) |
||||||||||||||||||||||||||||||||||||||
|
Plutus Bidco |
Jersey |
1st Lien |
10.22% |
SONIA (S) |
6.00 |
% |
09/2028 |
£ |
5,250 |
7,207 |
(e) |
||||||||||||||||||||||||||||||||||||
|
Plutus Bidco |
Jersey |
1st Lien |
10.22% |
SONIA (S) |
6.00 |
% |
09/2028 |
£ |
1,750 |
2,402 |
(e) |
||||||||||||||||||||||||||||||||||||
|
ProFund S.a r.l. |
Poland |
1st Lien |
8.04% |
EURIBOR (S) |
6.00 |
% |
12/2027 |
€ |
2,164 |
2,549 |
(e)(f) |
||||||||||||||||||||||||||||||||||||
|
ProFund S.a r.l. |
Poland |
1st Lien |
8.04% |
EURIBOR (S) |
6.00 |
% |
12/2027 |
€ |
90 |
106 |
(e) |
||||||||||||||||||||||||||||||||||||
|
ProFund S.a r.l. |
Poland |
1st Lien |
10.95% |
WIBOR (S) |
6.00 |
% |
12/2027 |
PLN |
15,023 |
4,168 |
(e) |
||||||||||||||||||||||||||||||||||||
|
Project Optimus |
Jersey |
1st Lien |
9.71% |
SONIA (Q) |
5.50 |
% |
05/2031 |
£ |
309 |
424 |
(e) |
||||||||||||||||||||||||||||||||||||
Semi Annual Report 2025
36
CION Ares Diversified Credit Fund
Consolidated Schedule of Investments (continued)
June 30, 2025 (Unaudited)
(in thousands, except shares, percentages and as otherwise noted)
Senior Loans(b)(c)(d) (continued)
|
Company |
Country(a) |
Investment |
Coupon |
Reference |
Spread |
Acquisition |
Maturity |
Shares |
Principal |
Fair Value(a) |
% of Net |
||||||||||||||||||||||||||||||||||||
|
Project Optimus |
Jersey |
1st Lien |
05/2031 |
£ |
— |
$ |
— |
(e)(g) |
|||||||||||||||||||||||||||||||||||||||
|
RFS Opco LLC |
1st Lien |
9.05% |
SOFR (Q) |
4.75 |
% |
04/2031 |
6,184 |
6,184 |
(e)(f) |
||||||||||||||||||||||||||||||||||||||
|
RFS Opco LLC |
1st Lien |
9.04% |
SOFR (Q) |
4.75 |
% |
04/2031 |
1,300 |
1,300 |
(e) |
||||||||||||||||||||||||||||||||||||||
|
RFS Opco LLC |
1st Lien |
04/2031 |
— |
— |
(e)(g) |
||||||||||||||||||||||||||||||||||||||||||
|
RWA Wealth |
1st Lien |
9.06% |
SOFR (Q) |
4.75 |
% |
11/2030 |
117 |
117 |
(e)(g) |
||||||||||||||||||||||||||||||||||||||
|
RWA Wealth |
1st Lien |
9.07% |
SOFR (Q) |
4.75 |
% |
11/2030 |
3,121 |
3,121 |
(e)(f) |
||||||||||||||||||||||||||||||||||||||
|
RWA Wealth |
1st Lien |
9.07% |
SOFR (Q) |
4.75 |
% |
11/2030 |
157 |
157 |
(e)(g) |
||||||||||||||||||||||||||||||||||||||
|
Sabseg Group, |
Spain |
1st Lien |
8.16% |
EURIBOR (Q) |
6.18 |
% |
04/2029 |
€ |
3,737 |
4,402 |
(e)(g) |
||||||||||||||||||||||||||||||||||||
|
Skyliner S.a r.l. |
Luxembourg |
1st Lien |
06/2031 |
€ |
— |
— |
(e)(g)(h) |
||||||||||||||||||||||||||||||||||||||||
|
Stepstone Group |
1st Lien |
12/2031 |
€ |
6,000 |
6,906 |
(h) |
|||||||||||||||||||||||||||||||||||||||||
|
Steward Partners |
1st Lien |
10/2028 |
— |
— |
(e)(g) |
||||||||||||||||||||||||||||||||||||||||||
|
Steward Partners |
1st Lien |
9.05% |
SOFR (Q) |
4.75 |
% |
10/2028 |
383 |
383 |
(e)(f) |
||||||||||||||||||||||||||||||||||||||
|
Steward Partners |
1st Lien |
9.05% |
SOFR (Q) |
4.75 |
% |
10/2028 |
582 |
582 |
(e) |
||||||||||||||||||||||||||||||||||||||
|
Steward Partners |
1st Lien |
9.05% |
SOFR (Q) |
4.75 |
% |
10/2028 |
3 |
3 |
(e)(g) |
||||||||||||||||||||||||||||||||||||||
|
TK Elevator Midco |
Germany |
1st Lien |
5.85% |
EURIBOR (S) |
3.25 |
% |
04/2030 |
€ |
7,125 |
8,354 |
|||||||||||||||||||||||||||||||||||||
|
Toscafund Limited |
United |
1st Lien |
12.52% |
SONIA (S) |
8.00 |
% |
04/2026 |
£ |
700 |
961 |
(e)(f) |
||||||||||||||||||||||||||||||||||||
|
TPG IX Cardiff |
1st Lien |
10.28% |
SOFR (Q) |
6.00 |
% |
01/2033 |
4,579 |
4,579 |
(e) |
||||||||||||||||||||||||||||||||||||||
|
Trustly AB |
Sweden |
1st Lien |
8.91% |
STIBOR (Q) |
6.75 |
% |
06/2025 |
SEK |
5,500 |
581 |
(e) |
||||||||||||||||||||||||||||||||||||
|
Trustly AB |
Sweden |
1st Lien |
9.10% |
STIBOR (Q) |
6.75 |
% |
06/2025 |
SEK |
2,700 |
286 |
(e) |
||||||||||||||||||||||||||||||||||||
Semi Annual Report 2025
37
CION Ares Diversified Credit Fund
Consolidated Schedule of Investments (continued)
June 30, 2025 (Unaudited)
(in thousands, except shares, percentages and as otherwise noted)
Senior Loans(b)(c)(d) (continued)
|
Company |
Country(a) |
Investment |
Coupon |
Reference |
Spread |
Acquisition |
Maturity |
Shares |
Principal |
Fair Value(a) |
% of Net |
||||||||||||||||||||||||||||||||||||
|
The Ultimus |
1st Lien |
03/2030 |
$ |
— |
$ |
— |
(e)(g) |
||||||||||||||||||||||||||||||||||||||||
|
The Ultimus |
1st Lien |
9.68% |
SOFR (M) |
5.25 |
% |
03/2031 |
2,972 |
2,942 |
(e)(f) |
||||||||||||||||||||||||||||||||||||||
|
The Ultimus |
1st Lien |
03/2031 |
— |
— |
(e)(g) |
||||||||||||||||||||||||||||||||||||||||||
|
Waverly Advisors, |
1st Lien |
10.20% |
SOFR (Q) |
5.75 |
% |
03/2028 |
189 |
189 |
(e)(g) |
||||||||||||||||||||||||||||||||||||||
|
Waverly Advisors, |
1st Lien |
10.20% |
SOFR (Q) |
5.75 |
% |
03/2028 |
2,000 |
2,000 |
(e)(f) |
||||||||||||||||||||||||||||||||||||||
|
Waverly Advisors, |
1st Lien |
10.20% |
SOFR (Q) |
5.75 |
% |
03/2028 |
1,462 |
1,462 |
(e)(f) |
||||||||||||||||||||||||||||||||||||||
|
Waverly Advisors, |
1st Lien |
9.95% |
SOFR (Q) |
5.50 |
% |
03/2028 |
3,202 |
3,202 |
(e) |
||||||||||||||||||||||||||||||||||||||
|
Waverly Advisors, |
1st Lien |
9.45% |
SOFR (Q) |
5.00 |
% |
03/2028 |
911 |
911 |
(e)(g) |
||||||||||||||||||||||||||||||||||||||
|
Wealth |
1st Lien |
10/2028 |
— |
— |
(e)(g) |
||||||||||||||||||||||||||||||||||||||||||
|
Wealth |
1st Lien |
9.28% |
SOFR (Q) |
5.00 |
% |
10/2028 |
3,512 |
3,512 |
(e)(f) |
||||||||||||||||||||||||||||||||||||||
|
Wealth |
1st Lien |
9.30% |
SOFR (Q) |
5.00 |
% |
10/2028 |
687 |
687 |
(e) |
||||||||||||||||||||||||||||||||||||||
|
Wealth |
1st Lien |
9.31% |
SOFR (Q) |
5.00 |
% |
10/2028 |
641 |
641 |
(e)(g) |
||||||||||||||||||||||||||||||||||||||
|
Wealth |
1st Lien |
9.28% |
SOFR (Q) |
5.00 |
% |
10/2028 |
2,341 |
2,341 |
(e)(f) |
||||||||||||||||||||||||||||||||||||||
|
Wealth |
1st Lien |
9.32% |
SOFR (M) |
5.00 |
% |
10/2028 |
2,410 |
2,410 |
(e)(f) |
||||||||||||||||||||||||||||||||||||||
|
Wealth |
1st Lien |
9.29% |
SOFR (M) |
5.00 |
% |
10/2028 |
8,089 |
8,089 |
(e)(f)(g) |
||||||||||||||||||||||||||||||||||||||
|
Wealth |
1st Lien |
9.29% |
SOFR (Q) |
5.00 |
% |
10/2028 |
2,480 |
2,480 |
(e)(f) |
||||||||||||||||||||||||||||||||||||||
|
Wellington-Altus |
Canada |
1st Lien |
08/2030 |
CAD |
— |
— |
(e)(g) |
||||||||||||||||||||||||||||||||||||||||
|
Wellington-Altus |
Canada |
1st Lien |
7.99% |
CORRA (Q) |
5.00 |
% |
08/2030 |
CAD |
1,137 |
835 |
(e)(f) |
||||||||||||||||||||||||||||||||||||
|
Wellington-Altus |
Canada |
1st Lien |
08/2030 |
CAD |
— |
— |
(e)(g) |
||||||||||||||||||||||||||||||||||||||||
Semi Annual Report 2025
38
CION Ares Diversified Credit Fund
Consolidated Schedule of Investments (continued)
June 30, 2025 (Unaudited)
(in thousands, except shares, percentages and as otherwise noted)
Senior Loans(b)(c)(d) (continued)
|
Company |
Country(a) |
Investment |
Coupon |
Reference |
Spread |
Acquisition Date |
Maturity Date |
Shares |
Principal Amount(a) |
Fair Value(a) |
% of Net Assets |
||||||||||||||||||||||||||||||||||||
|
Wilbur-Ellis Holdings II LLC |
1st Lien Revolving Loan |
8.30% |
SOFR (Q) |
4.00 |
% |
06/2030 |
$ |
471 |
$ |
464 |
(e)(g) |
||||||||||||||||||||||||||||||||||||
|
Zelis Cost Management Buyer, Inc. |
1st Lien Term Loan |
7.08% |
SOFR (M) |
2.75 |
% |
09/2029 |
1,955 |
1,940 |
(f) |
||||||||||||||||||||||||||||||||||||||
|
292,163 |
6.02 |
% |
|||||||||||||||||||||||||||||||||||||||||||||
|
Food, Beverage and Tobacco |
|||||||||||||||||||||||||||||||||||||||||||||||
|
Badia Spices, LLC |
1st Lien Revolving Loan |
11/2030 |
— |
— |
(e)(g) |
||||||||||||||||||||||||||||||||||||||||||
|
Badia Spices, LLC |
1st Lien Term Loan |
8.63% |
SOFR (S) |
4.50 |
% |
11/2030 |
8,830 |
8,675 |
(e)(f) |
||||||||||||||||||||||||||||||||||||||
|
Berner Food & Beverage, LLC |
1st Lien Revolving Loan |
13.00% |
PRIME (Q) |
5.50 |
% |
07/2026 |
73 |
73 |
(e)(g) |
||||||||||||||||||||||||||||||||||||||
|
Berner Food & Beverage, LLC |
1st Lien Term Loan |
10.93% |
SOFR (Q) |
6.50 |
% |
07/2027 |
2,757 |
2,757 |
(e)(f) |
||||||||||||||||||||||||||||||||||||||
|
Chobani, LLC |
1st Lien Term Loan |
6.83% |
SOFR (M) |
2.50 |
% |
10/2027 |
8,929 |
8,950 |
(f) |
||||||||||||||||||||||||||||||||||||||
|
Demakes Borrower, LLC |
1st Lien Term Loan |
10.30% |
SOFR (Q) |
6.00 |
% |
12/2029 |
944 |
944 |
(e)(f) |
||||||||||||||||||||||||||||||||||||||
|
Florida Food Products, LLC |
1st Lien Term Loan |
9.56% |
SOFR (Q) |
5.00 |
% |
10/2028 |
36 |
24 |
(e) |
||||||||||||||||||||||||||||||||||||||
|
Florida Food Products, LLC |
2nd Lien Term Loan |
10/2029 |
7,299 |
4,817 |
(e)(i) |
||||||||||||||||||||||||||||||||||||||||||
|
Gotham Greens Holdings, PBC |
1st Lien Term Loan |
13.59% (2.00% PIK) |
SOFR (S) |
9.13 |
% |
12/2026 |
6,492 |
6,297 |
(e) |
||||||||||||||||||||||||||||||||||||||
|
Gotham Greens Holdings, PBC |
1st Lien Delay Draw Term Loan |
13.59% (2.00% PIK) |
SOFR (S) |
9.13 |
% |
12/2026 |
8,322 |
8,073 |
(e) |
||||||||||||||||||||||||||||||||||||||
|
KNPC Holdco, LLC |
1st Lien Term Loan |
10.11% |
SOFR (S) |
5.75 |
% |
10/2029 |
9,345 |
9,345 |
(e)(f) |
||||||||||||||||||||||||||||||||||||||
|
KNPC Holdco, LLC |
1st Lien Term Loan |
11.36% |
SOFR (S) |
7.00 |
% |
10/2029 |
483 |
483 |
(e)(f) |
||||||||||||||||||||||||||||||||||||||
|
KNPC Holdco, LLC |
1st Lien Term Loan |
10.61% |
SOFR (S) |
6.25 |
% |
10/2029 |
470 |
470 |
(e)(f) |
||||||||||||||||||||||||||||||||||||||
|
Quirch Foods Holdings, LLC |
1st Lien Term Loan |
9.57% |
SOFR (Q) |
5.00 |
% |
10/2027 |
4,874 |
4,544 |
|||||||||||||||||||||||||||||||||||||||
|
RB Holdings Interco, LLC |
1st Lien Revolving Loan |
9.42% |
SOFR (Q) |
5.00 |
% |
05/2028 |
198 |
194 |
(e)(g) |
||||||||||||||||||||||||||||||||||||||
|
RB Holdings Interco, LLC |
1st Lien Term Loan |
9.41% |
SOFR (Q) |
5.00 |
% |
05/2028 |
3,666 |
3,592 |
(e)(f) |
||||||||||||||||||||||||||||||||||||||
|
Spindrift Beverage Co., Inc. |
1st Lien Revolving Loan |
9.53% |
SOFR (Q) |
5.25 |
% |
02/2032 |
25 |
25 |
(e)(g) |
||||||||||||||||||||||||||||||||||||||
|
Spindrift Beverage Co., Inc. |
1st Lien Term Loan |
9.53% |
SOFR (Q) |
5.25 |
% |
02/2032 |
1,737 |
1,728 |
(e)(f) |
||||||||||||||||||||||||||||||||||||||
Semi Annual Report 2025
39
CION Ares Diversified Credit Fund
Consolidated Schedule of Investments (continued)
June 30, 2025 (Unaudited)
(in thousands, except shares, percentages and as otherwise noted)
Senior Loans(b)(c)(d) (continued)
|
Company |
Country(a) |
Investment |
Coupon |
Reference |
Spread |
Acquisition Date |
Maturity Date |
Shares |
Principal Amount(a) |
Fair Value(a) |
% of Net Assets |
||||||||||||||||||||||||||||||||||||
|
Spindrift Beverage Co., Inc. |
1st Lien Delay Draw Term Loan |
02/2032 |
$ |
— |
$ |
— |
(e)(g) |
||||||||||||||||||||||||||||||||||||||||
|
Sugar PPC Buyer LLC |
1st Lien Term Loan |
9.51% |
SOFR (S) |
5.25 |
% |
10/2030 |
2,122 |
2,122 |
(e)(f) |
||||||||||||||||||||||||||||||||||||||
|
Sugar PPC Buyer LLC |
1st Lien Delay Draw Term Loan |
9.51% |
SOFR (S) |
5.25 |
% |
10/2030 |
589 |
589 |
(e)(f) |
||||||||||||||||||||||||||||||||||||||
|
Sugar PPC Buyer LLC |
1st Lien Delay Draw Term Loan |
9.57% |
SOFR (M) |
5.25 |
% |
10/2030 |
352 |
352 |
(e)(g) |
||||||||||||||||||||||||||||||||||||||
|
Supplying Demand, Inc. |
1st Lien Revolving Loan |
8.32% |
SOFR (Q) |
4.00 |
% |
11/2027 |
1,216 |
1,216 |
(e)(g) |
||||||||||||||||||||||||||||||||||||||
|
Watermill Express, LLC |
1st Lien Revolving Loan |
8.82% |
SOFR (Q) |
4.50 |
% |
04/2031 |
58 |
58 |
(e)(g) |
||||||||||||||||||||||||||||||||||||||
|
Watermill Express, LLC |
1st Lien Term Loan |
8.80% |
SOFR (Q) |
4.50 |
% |
04/2031 |
2,779 |
2,779 |
(e)(f) |
||||||||||||||||||||||||||||||||||||||
|
Watermill Express, LLC |
1st Lien Term Loan |
8.80% |
SOFR (Q) |
4.50 |
% |
04/2031 |
567 |
567 |
(e)(f) |
||||||||||||||||||||||||||||||||||||||
|
Watermill Express, LLC |
1st Lien Delay Draw Term Loan |
8.80% |
SOFR (Q) |
4.50 |
% |
04/2031 |
213 |
213 |
(e)(f) |
||||||||||||||||||||||||||||||||||||||
|
Watermill Express, LLC |
1st Lien Delay Draw Term Loan |
8.80% |
SOFR (Q) |
4.50 |
% |
04/2031 |
208 |
209 |
(e)(f) |
||||||||||||||||||||||||||||||||||||||
|
Watermill Express, LLC |
1st Lien Delay Draw Term Loan |
8.87% |
SOFR (Q) |
4.50 |
% |
04/2031 |
469 |
469 |
(e) |
||||||||||||||||||||||||||||||||||||||
|
Watermill Express, LLC |
1st Lien Delay Draw Term Loan |
04/2031 |
— |
— |
(e)(g) |
||||||||||||||||||||||||||||||||||||||||||
|
69,565 |
1.43 |
% |
|||||||||||||||||||||||||||||||||||||||||||||
|
Health Care Equipment and Services |
|||||||||||||||||||||||||||||||||||||||||||||||
|
Aerin Medical Inc. |
1st Lien Term Loan |
11.55% (3.88% PIK) |
SOFR (Q) |
7.25 |
% |
12/2030 |
2,310 |
2,310 |
(e) |
||||||||||||||||||||||||||||||||||||||
|
Aerin Medical Inc. |
1st Lien Delay Draw Term Loan |
12/2030 |
— |
— |
(e)(g) |
||||||||||||||||||||||||||||||||||||||||||
|
Agiliti Health, Inc. |
1st Lien Term Loan |
7.24% |
SOFR (Q) |
3.00 |
% |
05/2030 |
9,389 |
9,072 |
|||||||||||||||||||||||||||||||||||||||
|
Amethyst Radiotherapy Group B.V. |
Netherlands |
1st Lien Term Loan |
7.42% | EURIBOR (Q) |
5.25 |
% |
04/2031 |
€ |
2,000 |
2,356 |
(e) |
||||||||||||||||||||||||||||||||||||
|
Artivion, Inc. |
1st Lien Revolving Loan |
8.30% |
SOFR (Q) |
4.00 |
% |
01/2030 |
168 |
167 |
(e)(g) |
||||||||||||||||||||||||||||||||||||||
|
Artivion, Inc. |
1st Lien Term Loan |
10.55% |
SOFR (Q) |
6.25 |
% |
01/2030 |
2,278 |
2,278 |
(e)(f) |
||||||||||||||||||||||||||||||||||||||
Semi Annual Report 2025
40
CION Ares Diversified Credit Fund
Consolidated Schedule of Investments (continued)
June 30, 2025 (Unaudited)
(in thousands, except shares, percentages and as otherwise noted)
Senior Loans(b)(c)(d) (continued)
|
Company |
Country(a) |
Investment |
Coupon |
Reference |
Spread |
Acquisition Date |
Maturity Date |
Shares |
Principal Amount(a) |
Fair Value(a) |
% of Net Assets |
||||||||||||||||||||||||||||||||||||
|
Artivion, Inc. |
1st Lien Delay Draw Term Loan |
01/2030 |
$ |
— |
$ |
— |
(e)(g) |
||||||||||||||||||||||||||||||||||||||||
|
athenahealth Group Inc. |
1st Lien Revolving Loan |
02/2027 |
— |
— |
(e)(g) |
||||||||||||||||||||||||||||||||||||||||||
|
athenahealth Group Inc. |
1st Lien Term Loan |
7.08% |
SOFR (M) |
2.75 |
% |
02/2029 |
14,334 |
14,312 |
|||||||||||||||||||||||||||||||||||||||
|
Avalign Technologies, Inc. |
1st Lien Revolving Loan |
10.83% |
SOFR (M) |
6.50 |
% |
12/2028 |
75 |
67 |
(e)(g) |
||||||||||||||||||||||||||||||||||||||
|
Avalign Technologies, Inc. |
1st Lien Term Loan |
11.58% (3.63% PIK) |
SOFR (Q) |
7.25 |
% |
12/2028 |
1,709 |
1,538 |
(e)(f) |
||||||||||||||||||||||||||||||||||||||
|
AX VI INV3 Holding AB |
Sweden |
1st Lien Term Loan |
8.37% (1.67% PIK) |
EURIBOR (Q) |
6.25 |
% |
08/2031 |
SEK |
33,882 |
3,581 |
(e) |
||||||||||||||||||||||||||||||||||||
|
AX VI INV3 Holding AB |
Sweden |
1st Lien Delay Draw Term Loan |
8.37% (1.67% PIK) |
EURIBOR (Q) |
6.25 |
% |
08/2031 |
SEK |
12,696 |
1,342 |
(e)(g) |
||||||||||||||||||||||||||||||||||||
|
AX VI INV3 Holding AB |
Sweden |
1st Lien Delay Draw Term Loan |
08/2031 |
€ |
— |
— |
(e)(g)(h) |
||||||||||||||||||||||||||||||||||||||||
|
Bausch + Lomb Corporation |
Canada |
1st Lien Term Loan |
8.57% |
SOFR (M) |
4.25 |
% |
05/2027 |
11,937 |
11,911 |
(f) |
|||||||||||||||||||||||||||||||||||||
|
Bracket Intermediate Holding Corp. |
1st Lien Term Loan |
8.55% |
SOFR (Q) |
4.25 |
% |
05/2028 |
14,188 |
14,221 |
(f) |
||||||||||||||||||||||||||||||||||||||
|
BrightStar Group Holdings, Inc. |
1st Lien Revolving Loan |
9.30% |
SOFR (Q) |
5.00 |
% |
03/2032 |
25 |
25 |
(e)(g) |
||||||||||||||||||||||||||||||||||||||
|
BrightStar Group Holdings, Inc. |
1st Lien Term Loan |
9.25% |
SOFR (S) |
5.00 |
% |
03/2032 |
3,836 |
3,817 |
(e)(f) |
||||||||||||||||||||||||||||||||||||||
|
BVI Medical, Inc. |
1st Lien Revolving Loan |
03/2032 |
— |
— |
(e)(g) |
||||||||||||||||||||||||||||||||||||||||||
|
BVI Medical, Inc. |
1st Lien Term Loan |
10.58% (5.00% PIK) |
SOFR (M) |
6.25 |
% |
03/2032 |
19,637 |
19,342 |
(e) |
||||||||||||||||||||||||||||||||||||||
|
BVI Medical, Inc. |
1st Lien Delay Draw Term Loan |
03/2032 |
— |
— |
(e)(g) |
||||||||||||||||||||||||||||||||||||||||||
|
CHPPR Midco Inc. |
1st Lien Term Loan |
13.05% |
SOFR (Q) |
8.75 |
% |
12/2029 |
4,010 |
4,045 |
|||||||||||||||||||||||||||||||||||||||
|
CNT Holdings I Corp |
1st Lien Term Loan |
6.78% |
SOFR (Q) |
2.50 |
% |
11/2032 |
6,137 |
6,150 |
(f) |
||||||||||||||||||||||||||||||||||||||
|
Color Intermediate, LLC |
1st Lien Term Loan |
9.15% |
SOFR (Q) |
4.75 |
% |
10/2029 |
1,822 |
1,822 |
(e)(f) |
||||||||||||||||||||||||||||||||||||||
|
Colosseum Dental Finance BV |
Netherlands |
1st Lien Term Loan |
5.76% | EURIBOR (Q) |
3.75 |
% |
03/2032 |
€ |
5,995 |
7,054 |
|||||||||||||||||||||||||||||||||||||
|
Comprehensive EyeCare Partners, LLC |
1st Lien Revolving Loan |
10.95% (2.50% PIK) |
SOFR (M) |
6.50 |
% |
07/2025 |
1 |
1 |
(e)(g) |
||||||||||||||||||||||||||||||||||||||
Semi Annual Report 2025
41
CION Ares Diversified Credit Fund
Consolidated Schedule of Investments (continued)
June 30, 2025 (Unaudited)
(in thousands, except shares, percentages and as otherwise noted)
Senior Loans(b)(c)(d) (continued)
|
Company |
Country(a) |
Investment |
Coupon |
Reference |
Spread |
Acquisition Date |
Maturity Date |
Shares |
Principal Amount(a) |
Fair Value(a) |
% of Net Assets |
||||||||||||||||||||||||||||||||||||
|
Comprehensive EyeCare Partners, LLC |
1st Lien Revolving Loan |
13.00% (2.50% PIK) |
PRIME (Q) |
5.50 |
% |
07/2025 |
$ |
— |
$ |
— |
(e)(g) |
||||||||||||||||||||||||||||||||||||
|
Comprehensive EyeCare Partners, LLC |
1st Lien Term Loan |
11.02% (2.50% PIK) |
SOFR (M) |
6.50 |
% |
07/2025 |
1,001 |
951 |
(e)(f) |
||||||||||||||||||||||||||||||||||||||
|
Comprehensive EyeCare Partners, LLC |
1st Lien Delay Draw Term Loan |
11.02% (2.50% PIK) |
SOFR (M) |
6.50 |
% |
07/2025 |
671 |
638 |
(e)(f) |
||||||||||||||||||||||||||||||||||||||
|
Comprehensive EyeCare Partners, LLC |
1st Lien Delay Draw Term Loan |
11.02% (2.50% PIK) |
SOFR (Q) |
6.50 |
% |
07/2025 |
36 |
35 |
(e) |
||||||||||||||||||||||||||||||||||||||
|
Convey Health Solutions, Inc. |
1st Lien Term Loan |
9.65% (4.25% PIK) |
SOFR (Q) |
5.25 |
% |
07/2029 |
1,868 |
1,513 |
(e) |
||||||||||||||||||||||||||||||||||||||
|
Cradle Lux Bidco S.a r.l |
Luxembourg |
1st Lien Term Loan |
7.60% | EURIBOR (S) |
5.50 |
% |
11/2031 |
€ |
1,959 |
2,307 |
(e)(f) |
||||||||||||||||||||||||||||||||||||
|
Cradle Lux Bidco S.a r.l |
Luxembourg |
1st Lien Term Loan |
9.77% |
SOFR (S) |
5.50 |
% |
11/2031 |
721 |
721 |
(e)(f) |
|||||||||||||||||||||||||||||||||||||
|
Cradle Lux Bidco S.a r.l |
Luxembourg |
1st Lien Delay Draw Term Loan |
7.60% | EURIBOR (S) |
5.50 |
% |
11/2031 |
728 |
728 |
(e)(g) |
|||||||||||||||||||||||||||||||||||||
|
Cradle Lux Bidco S.a r.l |
Luxembourg |
1st Lien Delay Draw Term Loan |
11/2031 |
— |
— |
(e)(g) |
|||||||||||||||||||||||||||||||||||||||||
|
Crown CT Parent Inc. |
1st Lien Revolving Loan |
9.94% |
SOFR (Q) |
5.50 |
% |
03/2028 |
572 |
572 |
(e)(g) |
||||||||||||||||||||||||||||||||||||||
|
Crown CT Parent Inc. |
1st Lien Term Loan |
9.95% |
SOFR (Q) |
5.50 |
% |
03/2029 |
8,048 |
8,048 |
(e)(f) |
||||||||||||||||||||||||||||||||||||||
|
CVP Holdco, Inc. |
1st Lien Revolving Loan |
06/2030 |
— |
— |
(e)(g) |
||||||||||||||||||||||||||||||||||||||||||
|
CVP Holdco, Inc. |
1st Lien Term Loan |
9.07% |
SOFR (M) |
4.75 |
% |
06/2031 |
19,710 |
19,710 |
(e)(f) |
||||||||||||||||||||||||||||||||||||||
|
CVP Holdco, Inc. |
1st Lien Delay Draw Term Loan |
9.07% |
SOFR (M) |
4.75 |
% |
06/2031 |
1,073 |
1,073 |
(e)(g) |
||||||||||||||||||||||||||||||||||||||
|
Electron Bidco Inc. |
1st Lien Term Loan |
7.08% |
SOFR (M) |
2.75 |
% |
11/2028 |
13,864 |
13,895 |
(f) |
||||||||||||||||||||||||||||||||||||||
|
Empower Payments Investor, LLC |
1st Lien Revolving Loan |
03/2030 |
— |
— |
(e)(g) |
||||||||||||||||||||||||||||||||||||||||||
|
Empower Payments Investor, LLC |
1st Lien Term Loan |
8.83% |
SOFR (M) |
4.50 |
% |
03/2031 |
472 |
472 |
(e)(f) |
||||||||||||||||||||||||||||||||||||||
|
Empower Payments Investor, LLC |
1st Lien Term Loan |
8.80% |
SOFR (Q) |
4.50 |
% |
03/2031 |
117 |
117 |
(e)(f) |
||||||||||||||||||||||||||||||||||||||
|
Empower Payments Investor, LLC |
1st Lien Delay Draw Term Loan |
8.83% |
SOFR (Q) |
4.50 |
% |
03/2031 |
68 |
68 |
(e) |
||||||||||||||||||||||||||||||||||||||
Semi Annual Report 2025
42
CION Ares Diversified Credit Fund
Consolidated Schedule of Investments (continued)
June 30, 2025 (Unaudited)
(in thousands, except shares, percentages and as otherwise noted)
Senior Loans(b)(c)(d) (continued)
|
Company |
Country(a) |
Investment |
Coupon |
Reference |
Spread |
Acquisition Date |
Maturity Date |
Shares |
Principal Amount(a) |
Fair Value(a) |
% of Net Assets |
||||||||||||||||||||||||||||||||||||
|
Empower Payments Investor, LLC |
1st Lien Delay Draw Term Loan |
03/2031 |
$ |
— |
$ |
— |
(e)(g) |
||||||||||||||||||||||||||||||||||||||||
|
Envisage Dental UK Limited |
United Kingdom |
1st Lien Term Loan |
11.75% (2.50% PIK) |
SONIA (Q) |
7.50 |
% |
04/2031 |
£ |
2,547 |
3,497 |
(e) |
||||||||||||||||||||||||||||||||||||
|
Envisage Dental UK Limited |
United Kingdom |
1st Lien Delay Draw Term Loan |
11.25% (2.50% PIK) |
SONIA (Q) |
7.00 |
% |
04/2031 |
£ |
1,827 |
2,507 |
(e) |
||||||||||||||||||||||||||||||||||||
|
Envisage Dental UK Limited |
United Kingdom |
1st Lien Delay Draw Term Loan |
04/2031 |
£ |
— |
— |
(e)(g)(h) |
||||||||||||||||||||||||||||||||||||||||
|
Evolent Health LLC |
1st Lien Revolving Loan |
8.45% |
SOFR (Q) |
4.00 |
% |
12/2029 |
2 |
2 |
(e)(g) |
||||||||||||||||||||||||||||||||||||||
|
Evolent Health LLC |
1st Lien Delay Draw Term Loan |
9.68% |
SOFR (Q) |
5.25 |
% |
12/2029 |
8,373 |
8,373 |
(e) |
||||||||||||||||||||||||||||||||||||||
|
Floss Bidco Limited |
United Kingdom |
1st Lien Term Loan |
10.77% |
SONIA (S) |
6.25 |
% |
09/2026 |
£ |
451 |
595 |
(e)(f) |
||||||||||||||||||||||||||||||||||||
|
Floss Bidco Limited |
United Kingdom |
1st Lien Term Loan |
10.02% |
SONIA (S) |
5.50 |
% |
09/2026 |
£ |
361 |
475 |
(e)(f) |
||||||||||||||||||||||||||||||||||||
|
Gainwell Acquisition Corp. |
1st Lien Term Loan |
8.40% |
SOFR (Q) |
4.00 |
% |
10/2027 |
15,983 |
15,372 |
(f) |
||||||||||||||||||||||||||||||||||||||
|
Global Medical Response, Inc. |
1st Lien Term Loan |
9.83% (0.75% PIK) |
SOFR (Q) |
5.50 |
% |
10/2028 |
35,467 |
35,487 |
|||||||||||||||||||||||||||||||||||||||
|
Hanger, Inc. |
1st Lien Term Loan |
7.83% |
SOFR (M) |
3.50 |
% |
10/2031 |
530 |
531 |
|||||||||||||||||||||||||||||||||||||||
|
Hanger, Inc. |
1st Lien Delay Draw Term Loan |
7.83% |
SOFR (M) |
3.50 |
% |
10/2031 |
10 |
10 |
(g) |
||||||||||||||||||||||||||||||||||||||
|
Himalaya TopCo LLC |
1st Lien Revolving Loan |
06/2032 |
— |
— |
(e)(g) |
||||||||||||||||||||||||||||||||||||||||||
|
Himalaya TopCo LLC |
1st Lien Term Loan |
9.33% |
SOFR (M) |
5.00 |
% |
06/2032 |
53,161 |
52,629 |
(e)(f) |
||||||||||||||||||||||||||||||||||||||
|
Himalaya TopCo LLC |
1st Lien Delay Draw Term Loan |
06/2032 |
— |
— |
(e)(g) |
||||||||||||||||||||||||||||||||||||||||||
|
HuFriedy Group Acquisition LLC |
1st Lien Revolving Loan |
9.81% |
SOFR (Q) |
5.50 |
% |
05/2030 |
126 |
126 |
(e)(g) |
||||||||||||||||||||||||||||||||||||||
|
HuFriedy Group Acquisition LLC |
1st Lien Term Loan |
9.83% |
SOFR (Q) |
5.50 |
% |
05/2031 |
19,148 |
19,148 |
(e)(f) |
||||||||||||||||||||||||||||||||||||||
|
HuFriedy Group Acquisition LLC |
1st Lien Delay Draw Term Loan |
9.83% |
SOFR (Q) |
5.50 |
% |
05/2031 |
3,705 |
3,705 |
(e)(g) |
||||||||||||||||||||||||||||||||||||||
|
LifeScan Global Corporation |
1st Lien Term Loan |
12/2026 |
1,913 |
1,243 |
(i) |
||||||||||||||||||||||||||||||||||||||||||
|
LifeScan Global Corporation |
2nd Lien Term Loan |
03/2027 |
5,692 |
— |
(e)(i) |
||||||||||||||||||||||||||||||||||||||||||
Semi Annual Report 2025
43
CION Ares Diversified Credit Fund
Consolidated Schedule of Investments (continued)
June 30, 2025 (Unaudited)
(in thousands, except shares, percentages and as otherwise noted)
Senior Loans(b)(c)(d) (continued)
|
Company |
Country(a) |
Investment |
Coupon |
Reference |
Spread |
Acquisition Date |
Maturity Date |
Shares |
Principal Amount(a) |
Fair Value(a) |
% of Net Assets |
||||||||||||||||||||||||||||||||||||
|
LivTech Purchaser, Inc. |
1st Lien Revolving Loan |
11/2031 |
$ |
— |
$ |
— |
(e)(g) |
||||||||||||||||||||||||||||||||||||||||
|
LivTech Purchaser, Inc. |
1st Lien Term Loan |
8.81% |
SOFR (Q) |
4.50% |
11/2031 |
1,290 |
1,290 |
(e)(f) |
|||||||||||||||||||||||||||||||||||||||
|
LivTech Purchaser, Inc. |
1st Lien Delay Draw Term Loan |
8.81% |
SOFR (Q) |
4.50% |
11/2031 |
1,185 |
1,185 |
(e)(g) |
|||||||||||||||||||||||||||||||||||||||
|
MAK-System Group Limited |
United Kingdom |
1st Lien Delay Draw Term Loan |
11.31% PIK |
SOFR (S) |
7.00% |
02/2027 |
27,131 |
25,232 |
(e)(f) |
||||||||||||||||||||||||||||||||||||||
|
Mamba Purchaser, Inc. |
1st Lien Term Loan |
7.08% |
SOFR (M) |
2.75% |
10/2028 |
13,752 |
13,739 |
(f) |
|||||||||||||||||||||||||||||||||||||||
|
Medline Borrower, LP |
1st Lien Term Loan |
6.58% |
SOFR (M) |
2.25% |
10/2028 |
12,144 |
12,150 |
(f) |
|||||||||||||||||||||||||||||||||||||||
|
Medmark Services Inc |
1st Lien Term Loan |
9.56% |
SOFR (Q) |
5.00% |
06/2027 |
1,754 |
1,526 |
(e)(f) |
|||||||||||||||||||||||||||||||||||||||
|
Medmark Services Inc |
1st Lien Delay Draw Term Loan |
9.56% |
SOFR (Q) |
5.00% |
06/2027 |
1,501 |
1,306 |
(e)(f) |
|||||||||||||||||||||||||||||||||||||||
|
Medmark Services Inc |
2nd Lien Term Loan |
06/2028 |
9,139 |
5,209 |
(e)(i) |
||||||||||||||||||||||||||||||||||||||||||
|
Medmark Services Inc |
2nd Lien Delay Draw Term Loan |
06/2028 |
4,897 |
2,791 |
(e)(i) |
||||||||||||||||||||||||||||||||||||||||||
|
Network Bidco B.V. |
Netherlands |
1st Lien Term Loan |
6.98% | EURIBOR (Q) |
5.00% |
05/2031 |
€ |
5,778 |
6,806 |
(e)(f) |
|||||||||||||||||||||||||||||||||||||
|
Network Bidco B.V. |
Netherlands |
1st Lien Delay Draw Term Loan |
7.13% | EURIBOR (Q) |
5.00% |
05/2031 |
€ |
2,222 |
2,618 |
(e) |
|||||||||||||||||||||||||||||||||||||
|
Network Bidco B.V. |
Netherlands |
1st Lien Delay Draw Term Loan |
05/2031 |
€ |
— |
— |
(e)(g)(h) |
||||||||||||||||||||||||||||||||||||||||
|
Next Holdco, LLC |
1st Lien Revolving Loan |
11/2029 |
— |
— |
(e)(g) |
||||||||||||||||||||||||||||||||||||||||||
|
Next Holdco, LLC |
1st Lien Term Loan |
9.55% |
SOFR (Q) |
5.25% |
11/2030 |
984 |
984 |
(e)(f) |
|||||||||||||||||||||||||||||||||||||||
|
Next Holdco, LLC |
1st Lien Delay Draw Term Loan |
11/2030 |
— |
— |
(e)(g) |
||||||||||||||||||||||||||||||||||||||||||
|
NextCare, Inc. |
2nd Lien Term Loan |
11.95% PIK |
SOFR (Q) |
7.50% |
12/2025 |
7,890 |
7,890 |
(e) |
|||||||||||||||||||||||||||||||||||||||
|
Nomi Health, Inc. |
1st Lien Term Loan |
12.55% |
SOFR (Q) |
8.25% |
07/2028 |
3,989 |
3,590 |
(e) |
|||||||||||||||||||||||||||||||||||||||
|
Olympia Acquisition, Inc. |
1st Lien Delay Draw Term Loan |
13.95% PIK |
SOFR (Q) |
9.50% |
02/2027 |
235 |
235 |
(e)(g) |
|||||||||||||||||||||||||||||||||||||||
|
Olympia Acquisition, Inc. |
1st Lien Term Loan |
02/2027 |
177 |
64 |
(e)(i) |
||||||||||||||||||||||||||||||||||||||||||
|
Olympia Acquisition, Inc. |
1st Lien Term Loan |
02/2027 |
4,106 |
1,478 |
(e)(i) |
||||||||||||||||||||||||||||||||||||||||||
Semi Annual Report 2025
44
CION Ares Diversified Credit Fund
Consolidated Schedule of Investments (continued)
June 30, 2025 (Unaudited)
(in thousands, except shares, percentages and as otherwise noted)
Senior Loans(b)(c)(d) (continued)
|
Company |
Country(a) |
Investment |
Coupon |
Reference |
Spread |
Acquisition |
Maturity |
Shares |
Principal |
Fair Value(a) |
% of Net |
||||||||||||||||||||||||||||||||||||
|
Olympia |
1st Lien |
02/2027 |
$ |
658 |
$ |
237 |
(e)(i) |
||||||||||||||||||||||||||||||||||||||||
|
Pluto Acquisition I, |
1st Lien |
8.30% |
SOFR (Q) |
4.00 |
% |
09/2028 |
21,094 |
18,352 |
(f) |
||||||||||||||||||||||||||||||||||||||
|
PointClickCare |
Canada |
1st Lien |
7.42% |
SOFR (Q) |
3.25 |
% |
11/2031 |
2,488 |
2,495 |
||||||||||||||||||||||||||||||||||||||
|
Premise Health |
1st Lien |
9.57% |
SOFR (M) |
5.25 |
% |
03/2030 |
26 |
26 |
(e)(g) |
||||||||||||||||||||||||||||||||||||||
|
Premise Health |
1st Lien |
9.55% |
SOFR (Q) |
5.25 |
% |
03/2031 |
2,648 |
2,648 |
(e)(f) |
||||||||||||||||||||||||||||||||||||||
|
Prime Dental |
Netherlands |
1st Lien |
9.48% |
EURIBOR (Q) |
7.50 |
% |
06/2027 |
€ |
2,200 |
2,592 |
(e)(f) |
||||||||||||||||||||||||||||||||||||
|
Prime Dental |
Netherlands |
1st Lien |
9.73% |
EURIBOR (Q) |
7.75 |
% |
06/2027 |
€ |
953 |
1,123 |
(e) |
||||||||||||||||||||||||||||||||||||
|
Prime Dental |
Netherlands |
1st Lien |
9.48% |
EURIBOR (Q) |
7.50 |
% |
06/2027 |
€ |
1,654 |
1,949 |
(e) |
||||||||||||||||||||||||||||||||||||
|
Prime Dental |
Netherlands |
1st Lien |
9.73% |
EURIBOR (Q) |
7.75 |
% |
06/2027 |
€ |
3,183 |
3,749 |
(e)(g) |
||||||||||||||||||||||||||||||||||||
|
Project Ruby |
1st Lien |
7.44% |
SOFR (M) |
3.00 |
% |
03/2028 |
7,067 |
7,073 |
|||||||||||||||||||||||||||||||||||||||
|
Radnet |
1st Lien |
6.58% |
SOFR (Q) |
2.25 |
% |
04/2031 |
8,926 |
8,931 |
(f) |
||||||||||||||||||||||||||||||||||||||
|
Raven Acquisition |
1st Lien |
11/2029 |
— |
— |
(e)(g) |
||||||||||||||||||||||||||||||||||||||||||
|
Raven Acquisition |
1st Lien |
7.58% |
SOFR (M) |
3.25 |
% |
11/2031 |
8,988 |
8,977 |
|||||||||||||||||||||||||||||||||||||||
|
Raven Acquisition |
1st Lien |
11/2031 |
— |
— |
(g) |
||||||||||||||||||||||||||||||||||||||||||
|
Resonetics, LLC |
1st Lien |
7.57% |
SOFR (Q) |
3.25 |
% |
06/2031 |
4,944 |
4,943 |
(f) |
||||||||||||||||||||||||||||||||||||||
|
Revival Animal |
1st Lien |
10.30% |
SOFR (Q) |
6.00 |
% |
01/2028 |
77 |
76 |
(e)(g) |
||||||||||||||||||||||||||||||||||||||
|
Revival Animal |
1st Lien |
10.30% |
SOFR (Q) |
6.00 |
% |
01/2028 |
3,193 |
3,161 |
(e)(f) |
||||||||||||||||||||||||||||||||||||||
|
Revival Animal |
1st Lien |
10.29% |
SOFR (Q) |
6.00 |
% |
01/2028 |
354 |
350 |
(e)(f) |
||||||||||||||||||||||||||||||||||||||
|
Revival Animal |
1st Lien |
10.30% |
SOFR (Q) |
6.00 |
% |
01/2028 |
1,471 |
1,457 |
(e) |
||||||||||||||||||||||||||||||||||||||
|
Revival Animal |
1st Lien |
01/2028 |
— |
— |
(e)(g) |
||||||||||||||||||||||||||||||||||||||||||
|
Rubicone Bidco |
United |
1st Lien |
11.10% |
SONIA (Q) |
6.75 |
% |
12/2028 |
£ |
2,942 |
4,039 |
(e)(f) |
||||||||||||||||||||||||||||||||||||
Semi Annual Report 2025
45
CION Ares Diversified Credit Fund
Consolidated Schedule of Investments (continued)
June 30, 2025 (Unaudited)
(in thousands, except shares, percentages and as otherwise noted)
Senior Loans(b)(c)(d) (continued)
|
Company |
Country(a) |
Investment |
Coupon |
Reference |
Spread |
Acquisition Date |
Maturity Date |
Shares |
Principal Amount(a) |
Fair Value(a) |
% of Net Assets |
||||||||||||||||||||||||||||||||||||
|
Rubicone Bidco Limited |
United Kingdom |
1st Lien Delay Draw Term Loan |
11.10% |
SONIA (Q) |
6.75% |
12/2028 |
£ |
1,698 |
$ |
2,331 |
(e) |
||||||||||||||||||||||||||||||||||||
|
Rubicone Bidco Limited |
United Kingdom |
1st Lien Delay Draw Term Loan |
13.09% PIK |
SONIA (Q) |
8.25% |
12/2028 |
£ |
195 |
267 |
(e)(g) |
|||||||||||||||||||||||||||||||||||||
|
Spruce Bidco II Inc. |
1st Lien Revolving Loan |
01/2032 |
— |
— |
(e)(g) |
||||||||||||||||||||||||||||||||||||||||||
|
Spruce Bidco II Inc. |
1st Lien Term Loan |
9.13% |
SOFR (S) |
5.00% |
01/2032 |
46,224 |
45,531 |
(e)(f) |
|||||||||||||||||||||||||||||||||||||||
|
Spruce Bidco II Inc. |
1st Lien Term Loan |
7.68% |
CDOR (S) |
5.00% |
01/2032 |
CAD |
9,365 |
6,774 |
(e)(f) |
||||||||||||||||||||||||||||||||||||||
|
Spruce Bidco II Inc. |
1st Lien Term Loan |
5.73% |
TONA (S) |
5.25% |
01/2032 |
¥ |
1,001,315 |
6,849 |
(e) |
||||||||||||||||||||||||||||||||||||||
|
Symplr Software Inc. |
1st Lien Revolving Loan |
8.04% |
SOFR (Q) |
3.75% |
12/2027 |
— |
— |
(e)(g) |
|||||||||||||||||||||||||||||||||||||||
|
Symplr Software Inc. |
1st Lien Term Loan |
8.88% |
SOFR (Q) |
4.50% |
12/2027 |
3,416 |
3,107 |
(f) |
|||||||||||||||||||||||||||||||||||||||
|
Symplr Software Inc. |
1st Lien Term Loan |
9.63% |
SOFR (Q) |
5.25% |
12/2027 |
1,828 |
1,700 |
(e)(f) |
|||||||||||||||||||||||||||||||||||||||
|
Symplr Software Inc. |
2nd Lien Term Loan |
12.25% |
SOFR (Q) |
7.88% |
12/2028 |
12,343 |
11,479 |
(e)(f) |
|||||||||||||||||||||||||||||||||||||||
|
Symplr Software Inc. |
2nd Lien Term Loan |
14.38% (4.00% PIK) |
SOFR (Q) |
10.00% |
12/2028 |
5,734 |
5,620 |
(e)(f) |
|||||||||||||||||||||||||||||||||||||||
|
Tandarts Today Holding B.V. |
Netherlands |
1st Lien Term Loan |
8.98% | EURIBOR (Q) |
7.00% |
02/2028 |
€ |
643 |
758 |
(e)(f) |
|||||||||||||||||||||||||||||||||||||
|
Tandarts Today Holding B.V. |
Netherlands |
1st Lien Delay Draw Term Loan |
9.00% | EURIBOR (Q) |
7.00% |
02/2028 |
€ |
2,474 |
2,914 |
(e)(g) |
|||||||||||||||||||||||||||||||||||||
|
Therapy Brands Holdings LLC |
2nd Lien Term Loan |
11.19% |
SOFR (M) |
6.75% |
05/2029 |
4,334 |
3,684 |
(e)(f) |
|||||||||||||||||||||||||||||||||||||||
|
U.S. Urology Partners, LLC |
1st Lien Revolving Loan |
04/2032 |
— |
— |
(e)(g) |
||||||||||||||||||||||||||||||||||||||||||
|
U.S. Urology Partners, LLC |
1st Lien Term Loan |
9.05% |
SOFR (Q) |
4.75% |
04/2032 |
1,505 |
1,486 |
(e)(f) |
|||||||||||||||||||||||||||||||||||||||
|
U.S. Urology Partners, LLC |
1st Lien Delay Draw Term Loan |
04/2032 |
— |
— |
(e)(g) |
||||||||||||||||||||||||||||||||||||||||||
|
United Digestive MSO Parent, LLC |
1st Lien Revolving Loan |
10.07% |
SOFR (Q) |
5.75% |
03/2029 |
34 |
33 |
(e)(g) |
|||||||||||||||||||||||||||||||||||||||
|
United Digestive MSO Parent, LLC |
1st Lien Term Loan |
10.05% |
SOFR (Q) |
5.75% |
03/2029 |
3,098 |
3,098 |
(e)(f) |
|||||||||||||||||||||||||||||||||||||||
|
United Digestive MSO Parent, LLC |
1st Lien Delay Draw Term Loan |
10.05% |
SOFR (Q) |
5.75% |
03/2029 |
63 |
63 |
(e)(g) |
|||||||||||||||||||||||||||||||||||||||
|
United Digestive MSO Parent, LLC |
1st Lien Delay Draw Term Loan |
03/2029 |
— |
— |
(e)(g) |
||||||||||||||||||||||||||||||||||||||||||
Semi Annual Report 2025
46
CION Ares Diversified Credit Fund
Consolidated Schedule of Investments (continued)
June 30, 2025 (Unaudited)
(in thousands, except shares, percentages and as otherwise noted)
Senior Loans(b)(c)(d) (continued)
|
Company |
Country(a) |
Investment |
Coupon |
Reference |
Spread |
Acquisition Date |
Maturity Date |
Shares |
Principal Amount(a) |
Fair Value(a) |
% of Net Assets |
||||||||||||||||||||||||||||||||||||
|
Veonet Lense GmbH |
Germany |
1st Lien Term Loan |
5.88% | EURIBOR (S) |
3.50 |
% |
03/2029 |
€ |
6,111 |
$ |
7,066 |
||||||||||||||||||||||||||||||||||||
|
Viant Medical Holdings, Inc. (f/k/a MedPlast Holdings Inc.) |
1st Lien Term Loan |
8.33% |
SOFR (M) |
4.00 |
% |
10/2031 |
8,581 |
8,497 |
(f) |
||||||||||||||||||||||||||||||||||||||
|
VPP Intermediate Holdings, LLC |
1st Lien Revolving Loan |
12/2027 |
— |
— |
(e)(g) |
||||||||||||||||||||||||||||||||||||||||||
|
VPP Intermediate Holdings, LLC |
1st Lien Term Loan |
10.18% |
SOFR (M) |
5.75 |
% |
12/2027 |
1,526 |
1,526 |
(e)(f) |
||||||||||||||||||||||||||||||||||||||
|
VPP Intermediate Holdings, LLC |
1st Lien Delay Draw Term Loan |
10.18% |
SOFR (M) |
5.75 |
% |
12/2027 |
459 |
459 |
(e)(f) |
||||||||||||||||||||||||||||||||||||||
|
VPP Intermediate Holdings, LLC |
1st Lien Delay Draw Term Loan |
10.07% |
SOFR (M) |
5.75 |
% |
12/2027 |
2,564 |
2,564 |
(e)(f) |
||||||||||||||||||||||||||||||||||||||
|
VPP Intermediate Holdings, LLC |
1st Lien Delay Draw Term Loan |
10.17% |
SOFR (M) |
5.75 |
% |
12/2027 |
335 |
335 |
(e) |
||||||||||||||||||||||||||||||||||||||
|
VPP Intermediate Holdings, LLC |
1st Lien Delay Draw Term Loan |
9.67% |
SOFR (M) |
5.25 |
% |
12/2027 |
253 |
253 |
(e)(g) |
||||||||||||||||||||||||||||||||||||||
|
Waystar Technologies, Inc. |
1st Lien Term Loan |
6.58% |
SOFR (M) |
2.25 |
% |
10/2029 |
4,216 |
4,224 |
(f) |
||||||||||||||||||||||||||||||||||||||
|
WSHP FC Acquisition LLC |
1st Lien Revolving Loan |
12.41% |
SOFR (Q) |
8.00 |
% |
03/2028 |
2,757 |
2,343 |
(e)(g) |
||||||||||||||||||||||||||||||||||||||
|
WSHP FC Acquisition LLC |
1st Lien Term Loan |
11.95% (4.00% PIK) |
SOFR (Q) |
7.50 |
% |
03/2028 |
17,970 |
15,274 |
(e)(f) |
||||||||||||||||||||||||||||||||||||||
|
WSHP FC Acquisition LLC |
1st Lien Term Loan |
11.95% (4.00% PIK) |
SOFR (Q) |
7.50 |
% |
03/2028 |
873 |
742 |
(e)(f) |
||||||||||||||||||||||||||||||||||||||
|
WSHP FC Acquisition LLC |
1st Lien Term Loan |
12.43% (4.50% PIK) |
SOFR (Q) |
8.00 |
% |
03/2028 |
550 |
468 |
(e)(f) |
||||||||||||||||||||||||||||||||||||||
|
WSHP FC Acquisition LLC |
1st Lien Term Loan |
11.95% (4.00% PIK) |
SOFR (Q) |
7.50 |
% |
03/2028 |
564 |
479 |
(e)(f) |
||||||||||||||||||||||||||||||||||||||
|
WSHP FC Acquisition LLC |
1st Lien Delay Draw Term Loan |
11.95% (4.00% PIK) |
SOFR (Q) |
7.50 |
% |
03/2028 |
6,814 |
5,792 |
(e)(f) |
||||||||||||||||||||||||||||||||||||||
|
WSHP FC Acquisition LLC |
1st Lien Delay Draw Term Loan |
11.94% (4.00% PIK) |
SOFR (Q) |
7.50 |
% |
03/2028 |
356 |
303 |
(e) |
||||||||||||||||||||||||||||||||||||||
|
606,249 |
12.49 |
% |
|||||||||||||||||||||||||||||||||||||||||||||
|
Household and Personal Products |
|||||||||||||||||||||||||||||||||||||||||||||||
|
Beacon Wellness Brands, Inc. |
1st Lien Revolving Loan |
12/2027 |
— |
— |
(e)(g) |
||||||||||||||||||||||||||||||||||||||||||
|
Beacon Wellness Brands, Inc. |
1st Lien Term Loan |
10.18% |
SOFR (M) |
5.75 |
% |
12/2027 |
1,635 |
1,537 |
(e)(f) |
||||||||||||||||||||||||||||||||||||||
Semi Annual Report 2025
47
CION Ares Diversified Credit Fund
Consolidated Schedule of Investments (continued)
June 30, 2025 (Unaudited)
(in thousands, except shares, percentages and as otherwise noted)
Senior Loans(b)(c)(d) (continued)
|
Company |
Country(a) |
Investment |
Coupon |
Reference |
Spread |
Acquisition Date |
Maturity Date |
Shares |
Principal Amount(a) |
Fair Value(a) |
% of Net Assets |
||||||||||||||||||||||||||||||||||||
|
Foundation Consumer Brands, LLC |
1st Lien Revolving Loan |
02/2029 |
$ |
— |
$ |
— |
(e)(g) |
||||||||||||||||||||||||||||||||||||||||
|
Foundation Consumer Brands, LLC |
1st Lien Term Loan |
9.36% |
SOFR (Q) |
5.00% |
02/2029 |
14,463 |
14,463 |
(e)(f) |
|||||||||||||||||||||||||||||||||||||||
|
pH Beauty Holdings III, Inc. |
1st Lien Term Loan |
9.27% |
SOFR (S) |
5.00% |
09/2027 |
3,626 |
3,608 |
(e)(f) |
|||||||||||||||||||||||||||||||||||||||
|
Premier Specialties, Inc. |
1st Lien Revolving Loan |
11.34% |
SOFR (M) |
7.00% |
08/2027 |
281 |
259 |
(e)(g) |
|||||||||||||||||||||||||||||||||||||||
|
Premier Specialties, Inc. |
1st Lien Term Loan |
11.43% |
SOFR (M) |
7.00% |
08/2027 |
3,106 |
2,857 |
(e)(f) |
|||||||||||||||||||||||||||||||||||||||
|
Silk Holdings III Corp. |
1st Lien Revolving Loan |
8.33% |
SOFR (Q) |
4.00% |
05/2029 |
9,322 |
9,321 |
(e)(g) |
|||||||||||||||||||||||||||||||||||||||
|
Silk Holdings III Corp. |
1st Lien Term Loan |
9.83% |
SOFR (Q) |
5.50% |
05/2029 |
4,751 |
4,751 |
(e)(f) |
|||||||||||||||||||||||||||||||||||||||
|
TCI Buyer LLC |
1st Lien Revolving Loan |
11/2030 |
— |
— |
(e)(g) |
||||||||||||||||||||||||||||||||||||||||||
|
TCI Buyer LLC |
1st Lien Term Loan |
8.83% |
SOFR (M) |
4.50% |
11/2030 |
12,351 |
12,351 |
(e)(f) |
|||||||||||||||||||||||||||||||||||||||
|
TCI Buyer LLC |
1st Lien Delay Draw Term Loan |
11/2030 |
— |
— |
(e)(g) |
||||||||||||||||||||||||||||||||||||||||||
|
WU Holdco, Inc. |
1st Lien Revolving Loan |
04/2032 |
— |
— |
(e)(g) |
||||||||||||||||||||||||||||||||||||||||||
|
WU Holdco, Inc. |
1st Lien Term Loan |
9.05% |
SOFR (Q) |
4.75% |
04/2032 |
1,467 |
1,460 |
(e)(f) |
|||||||||||||||||||||||||||||||||||||||
|
WU Holdco, Inc. |
1st Lien Delay Draw Term Loan |
04/2032 |
— |
— |
(e)(g) |
||||||||||||||||||||||||||||||||||||||||||
|
50,607 |
1.04 |
% |
|||||||||||||||||||||||||||||||||||||||||||||
|
Insurance |
|||||||||||||||||||||||||||||||||||||||||||||||
|
15484880 Canada Inc. |
Canada |
1st Lien Revolving Loan |
8.38% |
CORRA (Q) |
5.50% |
04/2031 |
CAD |
41 |
30 |
(e)(g) |
|||||||||||||||||||||||||||||||||||||
|
15484880 Canada Inc. |
Canada |
1st Lien Term Loan |
8.55% |
CORRA (M) |
5.50% |
04/2031 |
CAD |
4,343 |
3,142 |
(e)(f) |
|||||||||||||||||||||||||||||||||||||
|
15484880 Canada Inc. |
Canada |
1st Lien Delay Draw Term Loan |
04/2031 |
CAD |
— |
— |
(e)(g) |
||||||||||||||||||||||||||||||||||||||||
|
Accession Risk Management Group, Inc. |
1st Lien Revolving Loan |
11/2029 |
— |
— |
(e)(g) |
||||||||||||||||||||||||||||||||||||||||||
|
Accession Risk Management Group, Inc. |
1st Lien Term Loan |
9.03% |
SOFR (Q) |
4.75% |
11/2029 |
3,809 |
3,809 |
(e)(f) |
|||||||||||||||||||||||||||||||||||||||
Semi Annual Report 2025
48
CION Ares Diversified Credit Fund
Consolidated Schedule of Investments (continued)
June 30, 2025 (Unaudited)
(in thousands, except shares, percentages and as otherwise noted)
Senior Loans(b)(c)(d) (continued)
|
Company |
Country(a) |
Investment |
Coupon |
Reference |
Spread |
Acquisition |
Maturity |
Shares |
Principal |
Fair Value(a) |
% of Net |
||||||||||||||||||||||||||||||||||||
|
Accession Risk |
1st Lien |
9.04% |
SOFR (Q) |
4.75 |
% |
11/2029 |
$ |
44 |
$ |
44 |
(e)(f) |
||||||||||||||||||||||||||||||||||||
|
Accession Risk |
1st Lien |
9.06% |
SOFR (Q) |
4.75 |
% |
11/2029 |
977 |
976 |
(e)(f) |
||||||||||||||||||||||||||||||||||||||
|
Accession Risk |
1st Lien |
9.05% |
SOFR (Q) |
4.75 |
% |
11/2029 |
303 |
303 |
(e)(g) |
||||||||||||||||||||||||||||||||||||||
|
Acrisure, LLC |
1st Lien |
7.33% |
SOFR (M) |
3.00 |
% |
11/2030 |
9,679 |
9,644 |
(f) |
||||||||||||||||||||||||||||||||||||||
|
Acrisure, LLC |
1st Lien |
06/2032 |
9,540 |
9,528 |
(h) |
||||||||||||||||||||||||||||||||||||||||||
|
Alfred AcquiCo |
Netherlands |
1st Lien |
8.48% |
EURIBOR (M) |
6.50 |
% |
09/2029 |
€ |
1,953 |
2,301 |
(e)(f) |
||||||||||||||||||||||||||||||||||||
|
AQ Sunshine, Inc. |
1st Lien |
9.55% |
SOFR (Q) |
5.25 |
% |
07/2030 |
529 |
529 |
(e)(g) |
||||||||||||||||||||||||||||||||||||||
|
AQ Sunshine, Inc. |
1st Lien |
9.55% |
SOFR (Q) |
5.25 |
% |
07/2031 |
14,677 |
14,677 |
(e)(f) |
||||||||||||||||||||||||||||||||||||||
|
AQ Sunshine, Inc. |
1st Lien |
9.55% |
SOFR (Q) |
5.25 |
% |
07/2031 |
2,287 |
2,287 |
(e)(g) |
||||||||||||||||||||||||||||||||||||||
|
Ardonagh Midco 3 |
Australia |
1st Lien |
7.03% |
SOFR (M) |
2.75 |
% |
02/2031 |
34,913 |
34,607 |
||||||||||||||||||||||||||||||||||||||
|
AssuredPartners, |
1st Lien |
7.83% |
SOFR (M) |
3.50 |
% |
02/2031 |
28,259 |
28,324 |
(f) |
||||||||||||||||||||||||||||||||||||||
|
Bellwether Buyer, |
1st Lien |
04/2032 |
— |
— |
(e)(g) |
||||||||||||||||||||||||||||||||||||||||||
|
Bellwether Buyer, |
1st Lien |
8.81% |
SOFR (M) |
4.50 |
% |
04/2032 |
2,097 |
2,087 |
(e)(f) |
||||||||||||||||||||||||||||||||||||||
|
Bellwether Buyer, |
1st Lien |
04/2032 |
— |
— |
(e)(g) |
||||||||||||||||||||||||||||||||||||||||||
|
Broadstreet |
1st Lien |
7.33% |
SOFR (M) |
3.00 |
% |
06/2031 |
9,807 |
9,817 |
(f) |
||||||||||||||||||||||||||||||||||||||
|
Captive |
1st Lien |
07/2028 |
— |
— |
(e)(g) |
||||||||||||||||||||||||||||||||||||||||||
|
Captive |
1st Lien |
8.83% |
SOFR (M) |
4.50 |
% |
07/2029 |
2,373 |
2,373 |
(e)(f) |
||||||||||||||||||||||||||||||||||||||
|
CFCo, LLC |
1st Lien |
09/2038 |
3,231 |
— |
(e)(i) |
||||||||||||||||||||||||||||||||||||||||||
|
Daylight Beta |
1st Lien |
09/2033 |
2,161 |
192 |
(e)(i) |
||||||||||||||||||||||||||||||||||||||||||
|
Diamond |
1st Lien |
10/2030 |
— |
— |
(e)(g) |
||||||||||||||||||||||||||||||||||||||||||
|
Diamond |
1st Lien |
9.30% |
SOFR (Q) |
5.00 |
% |
10/2030 |
5,886 |
5,886 |
(e)(f) |
||||||||||||||||||||||||||||||||||||||
Semi Annual Report 2025
49
CION Ares Diversified Credit Fund
Consolidated Schedule of Investments (continued)
June 30, 2025 (Unaudited)
(in thousands, except shares, percentages and as otherwise noted)
Senior Loans(b)(c)(d) (continued)
|
Company |
Country(a) |
Investment |
Coupon |
Reference |
Spread |
Acquisition |
Maturity |
Shares |
Principal |
Fair Value(a) |
% of Net |
||||||||||||||||||||||||||||||||||||
|
Diamond |
1st Lien |
10/2030 |
$ |
— |
$ |
— |
(e)(g) |
||||||||||||||||||||||||||||||||||||||||
|
DOXA Insurance |
1st Lien |
9.55% |
SOFR (Q) |
5.25 |
% |
12/2029 |
24 |
24 |
(e)(g) |
||||||||||||||||||||||||||||||||||||||
|
DOXA Insurance |
1st Lien |
9.55% |
SOFR (Q) |
5.25 |
% |
12/2030 |
1,240 |
1,240 |
(e) |
||||||||||||||||||||||||||||||||||||||
|
DOXA Insurance |
1st Lien |
9.55% |
SOFR (Q) |
5.25 |
% |
12/2030 |
1,168 |
1,168 |
(e)(g) |
||||||||||||||||||||||||||||||||||||||
|
DOXA Insurance |
1st Lien |
12/2030 |
— |
— |
(e)(g) |
||||||||||||||||||||||||||||||||||||||||||
|
Forza Insurance |
1st Lien |
9.80% |
SOFR (Q) |
5.50 |
% |
02/2030 |
5,558 |
5,502 |
(e)(f) |
||||||||||||||||||||||||||||||||||||||
|
Foundation Risk |
1st Lien |
10/2029 |
— |
— |
(e)(g) |
||||||||||||||||||||||||||||||||||||||||||
|
Foundation Risk |
1st Lien |
9.05% |
SOFR (Q) |
4.75 |
% |
10/2030 |
18,810 |
18,809 |
(e)(f) |
||||||||||||||||||||||||||||||||||||||
|
Foundation Risk |
1st Lien |
9.05% |
SOFR (Q) |
4.75 |
% |
10/2030 |
21,607 |
21,608 |
(e)(f)(g) |
||||||||||||||||||||||||||||||||||||||
|
Galway Borrower |
1st Lien |
8.80% |
SOFR (Q) |
4.50 |
% |
09/2028 |
359 |
359 |
(e)(g) |
||||||||||||||||||||||||||||||||||||||
|
Galway Borrower |
1st Lien |
8.79% |
SOFR (Q) |
4.50 |
% |
09/2028 |
10,595 |
10,595 |
(e)(f) |
||||||||||||||||||||||||||||||||||||||
|
Galway Borrower |
1st Lien |
8.79% |
SOFR (Q) |
4.50 |
% |
09/2028 |
219 |
219 |
(e)(g) |
||||||||||||||||||||||||||||||||||||||
|
Gestion ABS Bidco |
Canada |
1st Lien |
03/2031 |
CAD |
— |
— |
(e)(g) |
||||||||||||||||||||||||||||||||||||||||
|
Gestion ABS Bidco |
Canada |
1st Lien |
7.75% |
CORRA (M) |
5.00 |
% |
03/2031 |
CAD |
646 |
474 |
(e) |
||||||||||||||||||||||||||||||||||||
|
Gestion ABS Bidco |
Canada |
1st Lien |
03/2031 |
CAD |
— |
— |
(e)(g) |
||||||||||||||||||||||||||||||||||||||||
|
Higginbotham |
1st Lien |
8.83% |
SOFR (M) |
4.50 |
% |
11/2028 |
589 |
589 |
(e)(f) |
||||||||||||||||||||||||||||||||||||||
|
Higginbotham |
1st Lien |
9.08% |
SOFR (M) |
4.75 |
% |
11/2028 |
320 |
320 |
(e)(g) |
||||||||||||||||||||||||||||||||||||||
|
High Street Buyer, |
1st Lien |
04/2027 |
— |
— |
(e)(g) |
||||||||||||||||||||||||||||||||||||||||||
|
High Street Buyer, |
1st Lien |
9.55% |
SOFR (Q) |
5.25 |
% |
04/2028 |
4,615 |
4,614 |
(e)(f) |
||||||||||||||||||||||||||||||||||||||
Semi Annual Report 2025
50
CION Ares Diversified Credit Fund
Consolidated Schedule of Investments (continued)
June 30, 2025 (Unaudited)
(in thousands, except shares, percentages and as otherwise noted)
Senior Loans(b)(c)(d) (continued)
|
Company |
Country(a) |
Investment |
Coupon |
Reference |
Spread |
Acquisition Date |
Maturity Date |
Shares |
Principal Amount(a) |
Fair Value(a) |
% of Net Assets |
||||||||||||||||||||||||||||||||||||
|
High Street Buyer, Inc. |
1st Lien Delay Draw Term Loan |
9.55% |
SOFR (Q) |
5.25 |
% |
04/2028 |
$ |
28,812 |
$ |
28,813 |
(e)(f) |
||||||||||||||||||||||||||||||||||||
|
High Street Buyer, Inc. |
1st Lien Delay Draw Term Loan |
9.55% |
SOFR (Q) |
5.25 |
% |
04/2028 |
1,239 |
1,239 |
(e)(g) |
||||||||||||||||||||||||||||||||||||||
|
Hub International Limited |
1st Lien Term Loan |
6.77% |
SOFR (Q) |
2.50 |
% |
06/2030 |
8,514 |
8,538 |
(f) |
||||||||||||||||||||||||||||||||||||||
|
Hyperion Refinance S.a r.l. |
Luxembourg |
1st Lien Term Loan |
7.33% |
SOFR (M) |
3.00 |
% |
02/2031 |
9,925 |
9,951 |
||||||||||||||||||||||||||||||||||||||
|
Inszone Mid, LLC |
1st Lien Revolving Loan |
11/2029 |
— |
— |
(e)(g) |
||||||||||||||||||||||||||||||||||||||||||
|
Inszone Mid, LLC |
1st Lien Term Loan |
9.55% |
SOFR (Q) |
5.25 |
% |
11/2029 |
2,037 |
2,037 |
(e) |
||||||||||||||||||||||||||||||||||||||
|
Inszone Mid, LLC |
1st Lien Delay Draw Term Loan |
9.55% |
SOFR (Q) |
5.25 |
% |
11/2029 |
2,868 |
2,868 |
(e)(g) |
||||||||||||||||||||||||||||||||||||||
|
JMG Group Investments Limited |
United Kingdom |
1st Lien Term Loan |
11.62% (3.75% PIK) |
SONIA (Q) |
7.25 |
% |
12/2028 |
£ |
324 |
445 |
(e)(f) |
||||||||||||||||||||||||||||||||||||
|
JMG Group Investments Limited |
United Kingdom |
1st Lien Delay Draw Term Loan |
11.62% (3.75% PIK) |
SONIA (Q) |
7.25 |
% |
12/2028 |
£ |
2,806 |
3,852 |
(e) |
||||||||||||||||||||||||||||||||||||
|
JMG Group Investments Limited |
United Kingdom |
1st Lien Delay Draw Term Loan |
11.83% (3.75% PIK) |
SONIA (Q) |
7.50 |
% |
12/2028 |
£ |
3,542 |
4,863 |
(e) |
||||||||||||||||||||||||||||||||||||
|
JMG Group Investments Limited |
United Kingdom |
1st Lien Delay Draw Term Loan |
11.22% |
SONIA (Q) |
6.89 |
% |
12/2028 |
£ |
5,062 |
6,948 |
(e) |
||||||||||||||||||||||||||||||||||||
|
JMG Group Investments Limited |
United Kingdom |
1st Lien Delay Draw Term Loan |
10.96% |
SONIA (Q) |
6.63 |
% |
12/2028 |
£ |
237 |
325 |
(e)(g) |
||||||||||||||||||||||||||||||||||||
|
Keystone Agency Partners LLC |
1st Lien Revolving Loan |
05/2027 |
— |
— |
(e)(g) |
||||||||||||||||||||||||||||||||||||||||||
|
Keystone Agency Partners LLC |
1st Lien Term Loan |
9.05% |
SOFR (Q) |
4.75 |
% |
05/2027 |
702 |
702 |
(e)(f) |
||||||||||||||||||||||||||||||||||||||
|
Keystone Agency Partners LLC |
1st Lien Term Loan |
9.05% |
SOFR (Q) |
4.75 |
% |
05/2027 |
887 |
888 |
(e)(f) |
||||||||||||||||||||||||||||||||||||||
|
Keystone Agency Partners LLC |
1st Lien Delay Draw Term Loan |
9.05% |
SOFR (Q) |
4.75 |
% |
05/2027 |
876 |
875 |
(e)(f) |
||||||||||||||||||||||||||||||||||||||
|
Keystone Agency Partners LLC |
1st Lien Delay Draw Term Loan |
9.05% |
SOFR (Q) |
4.75 |
% |
05/2027 |
1,420 |
1,420 |
(e) |
||||||||||||||||||||||||||||||||||||||
|
Keystone Agency Partners LLC |
1st Lien Delay Draw Term Loan |
9.06% |
SOFR (M) |
4.75 |
% |
05/2027 |
426 |
426 |
(e)(g) |
||||||||||||||||||||||||||||||||||||||
|
King Risk Partners, LLC |
1st Lien Revolving Loan |
04/2031 |
— |
— |
(e)(g) |
||||||||||||||||||||||||||||||||||||||||||
|
King Risk Partners, LLC |
1st Lien Term Loan |
8.83% |
SOFR (M) |
4.50 |
% |
04/2031 |
1,203 |
1,191 |
(e)(f) |
||||||||||||||||||||||||||||||||||||||
Semi Annual Report 2025
51
CION Ares Diversified Credit Fund
Consolidated Schedule of Investments (continued)
June 30, 2025 (Unaudited)
(in thousands, except shares, percentages and as otherwise noted)
Senior Loans(b)(c)(d) (continued)
|
Company |
Country(a) |
Investment |
Coupon |
Reference |
Spread |
Acquisition Date |
Maturity Date |
Shares |
Principal Amount(a) |
Fair Value(a) |
% of Net Assets |
||||||||||||||||||||||||||||||||||||
|
King Risk Partners, LLC |
1st Lien Delay Draw Term Loan |
8.82% |
SOFR (M) |
4.50 |
% |
04/2031 |
$ |
184 |
$ |
183 |
(e)(g) |
||||||||||||||||||||||||||||||||||||
|
Lucida Broking Holdings Limited |
United Kingdom |
1st Lien Term Loan |
13.79% PIK |
SONIA (S) |
9.25 |
% |
06/2026 |
£ |
1,132 |
1,523 |
(e)(f) |
||||||||||||||||||||||||||||||||||||
|
Lucida Broking Holdings Limited |
United Kingdom |
1st Lien Delay Draw Term Loan |
14.01% PIK |
SONIA (S) |
9.25 |
% |
06/2026 |
£ |
727 |
978 |
(e)(f) |
||||||||||||||||||||||||||||||||||||
|
Maximus BidCo AB |
Sweden |
1st Lien Term Loan |
7.70% |
STIBOR (S) |
5.37 |
% |
04/2032 |
SEK |
154,830 |
16,365 |
(e) |
||||||||||||||||||||||||||||||||||||
|
Maximus BidCo AB |
Sweden |
1st Lien Delay Draw Term Loan |
04/2032 |
SEK |
— |
— |
(e)(g) |
||||||||||||||||||||||||||||||||||||||||
|
Oakbridge Insurance Agency LLC |
1st Lien Revolving Loan |
10.06% |
SOFR (M) |
5.75 |
% |
11/2029 |
8 |
8 |
(e)(g) |
||||||||||||||||||||||||||||||||||||||
|
Oakbridge Insurance Agency LLC |
1st Lien Term Loan |
10.06% |
SOFR (M) |
5.75 |
% |
11/2029 |
1,274 |
1,274 |
(e)(f) |
||||||||||||||||||||||||||||||||||||||
|
Oakbridge Insurance Agency LLC |
1st Lien Delay Draw Term Loan |
10.06% |
SOFR (M) |
5.75 |
% |
11/2029 |
530 |
530 |
(e)(g) |
||||||||||||||||||||||||||||||||||||||
|
Oakbridge Insurance Agency LLC |
1st Lien Delay Draw Term Loan |
11/2029 |
— |
— |
(e)(g) |
||||||||||||||||||||||||||||||||||||||||||
|
OneDigital Borrower LLC |
1st Lien Term Loan |
7.33% |
SOFR (M) |
3.00 |
% |
07/2031 |
12,422 |
12,387 |
|||||||||||||||||||||||||||||||||||||||
|
Optio Group Limited |
United Kingdom |
1st Lien Delay Draw Term Loan |
11.04% |
SONIA (S) |
6.50 |
% |
03/2026 |
£ |
360 |
495 |
(e)(f) |
||||||||||||||||||||||||||||||||||||
|
Optio Group Limited |
United Kingdom |
1st Lien Delay Draw Term Loan |
8.84% | EURIBOR (S) |
6.25 |
% |
03/2026 |
£ |
280 |
384 |
(e) |
||||||||||||||||||||||||||||||||||||
|
Optio Group Limited |
United Kingdom |
1st Lien Delay Draw Term Loan |
11.05% |
SONIA (S) |
6.50 |
% |
03/2026 |
£ |
252 |
345 |
(e)(g) |
||||||||||||||||||||||||||||||||||||
|
Patriot Growth Insurance Services, LLC |
1st Lien Revolving Loan |
10/2028 |
— |
— |
(e)(g) |
||||||||||||||||||||||||||||||||||||||||||
|
Patriot Growth Insurance Services, LLC |
1st Lien Term Loan |
9.45% |
SOFR (Q) |
5.00 |
% |
10/2028 |
1,747 |
1,747 |
(e)(f) |
||||||||||||||||||||||||||||||||||||||
|
People Corporation |
Canada |
1st Lien Revolving Loan |
8.22% |
CORRA (Q) |
5.25 |
% |
02/2027 |
CAD |
561 |
412 |
(e)(g) |
||||||||||||||||||||||||||||||||||||
|
People Corporation |
Canada |
1st Lien Term Loan |
8.19% |
CORRA (Q) |
5.25 |
% |
02/2028 |
CAD |
7,244 |
5,320 |
(e)(f) |
||||||||||||||||||||||||||||||||||||
|
People Corporation |
Canada |
1st Lien Delay Draw Term Loan |
8.19% |
CORRA (Q) |
5.25 |
% |
02/2028 |
CAD |
6,660 |
4,890 |
(e) |
||||||||||||||||||||||||||||||||||||
|
People Corporation |
Canada |
1st Lien Delay Draw Term Loan |
8.20% |
CORRA (Q) |
5.25 |
% |
02/2028 |
CAD |
2,178 |
1,599 |
(e) |
||||||||||||||||||||||||||||||||||||
Semi Annual Report 2025
52
CION Ares Diversified Credit Fund
Consolidated Schedule of Investments (continued)
June 30, 2025 (Unaudited)
(in thousands, except shares, percentages and as otherwise noted)
Senior Loans(b)(c)(d) (continued)
|
Company |
Country(a) |
Investment |
Coupon |
Reference |
Spread |
Acquisition |
Maturity |
Shares |
Principal |
Fair Value(a) |
% of Net |
||||||||||||||||||||||||||||||||||||
|
People |
Canada |
1st Lien |
8.03% |
CORRA (Q) |
5.00 |
% |
02/2028 |
CAD |
894 |
$ |
657 |
(e)(g) |
|||||||||||||||||||||||||||||||||||
|
Platinum Credit |
Jersey |
1st Lien |
10.78% |
SONIA (S) |
6.50 |
% |
11/2029 |
£ |
27,960 |
38,380 |
(e)(f) |
||||||||||||||||||||||||||||||||||||
|
Platinum Credit |
Jersey |
1st Lien |
10.95% |
SONIA (S) |
6.50 |
% |
11/2029 |
£ |
8,917 |
12,240 |
(e) |
||||||||||||||||||||||||||||||||||||
|
Roman New Bidco |
United |
1st Lien |
10.38% |
SONIA (Q) |
5.92 |
% |
12/2028 |
£ |
994 |
1,365 |
(e) |
||||||||||||||||||||||||||||||||||||
|
Roman New Bidco |
United |
1st Lien |
12/2028 |
£ |
— |
— |
(e)(g)(h) |
||||||||||||||||||||||||||||||||||||||||
|
SageSure |
1st Lien |
9.19% |
SOFR (M) |
4.75 |
% |
01/2030 |
19,860 |
19,860 |
(e)(f) |
||||||||||||||||||||||||||||||||||||||
|
SageSure |
1st Lien |
9.19% |
SOFR (M) |
4.75 |
% |
01/2030 |
7,723 |
7,723 |
(e)(f) |
||||||||||||||||||||||||||||||||||||||
|
SageSure |
1st Lien |
9.19% |
SOFR (M) |
4.75 |
% |
01/2030 |
8,679 |
8,679 |
(e)(f) |
||||||||||||||||||||||||||||||||||||||
|
SageSure |
1st Lien |
01/2030 |
— |
— |
(e)(g) |
||||||||||||||||||||||||||||||||||||||||||
|
SCM Insurance |
Canada |
1st Lien |
08/2026 |
CAD |
— |
— |
(e)(g) |
||||||||||||||||||||||||||||||||||||||||
|
SCM Insurance |
Canada |
1st Lien |
9.10% |
CORRA (M) |
6.25 |
% |
08/2026 |
CAD |
179 |
131 |
(e)(f) |
||||||||||||||||||||||||||||||||||||
|
SelectQuote, Inc. |
1st Lien |
10.93% |
SOFR (M) |
6.50 |
% |
09/2027 |
2,992 |
2,992 |
(e)(f) |
||||||||||||||||||||||||||||||||||||||
|
SG Acquisition, |
1st Lien |
04/2030 |
— |
— |
(e)(g) |
||||||||||||||||||||||||||||||||||||||||||
|
SG Acquisition, |
1st Lien |
9.03% |
SOFR (Q) |
4.75 |
% |
04/2030 |
5,571 |
5,571 |
(e)(f) |
||||||||||||||||||||||||||||||||||||||
|
SIG Parent |
1st Lien |
08/2031 |
— |
— |
(e)(g) |
||||||||||||||||||||||||||||||||||||||||||
|
SIG Parent |
1st Lien |
9.33% |
SOFR (M) |
5.00 |
% |
08/2031 |
3,762 |
3,762 |
(e)(f) |
||||||||||||||||||||||||||||||||||||||
|
SIG Parent |
1st Lien |
9.33% |
SOFR (M) |
5.00 |
% |
08/2031 |
113 |
113 |
(e)(g) |
||||||||||||||||||||||||||||||||||||||
|
Spitfire Bidco |
United |
1st Lien |
10.88% |
SOFR (S) |
6.25 |
% |
09/2029 |
18,200 |
19,372 |
(e)(f) |
|||||||||||||||||||||||||||||||||||||
|
Spitfire Bidco |
United |
1st Lien |
10.47% |
SONIA (Q) |
6.25 |
% |
09/2029 |
£ |
3,484 |
4,782 |
(e)(g) |
||||||||||||||||||||||||||||||||||||
|
Truist Insurance |
1st Lien |
05/2029 |
— |
— |
(e)(g) |
||||||||||||||||||||||||||||||||||||||||||
|
Truist Insurance |
1st Lien |
7.05% |
SOFR (Q) |
2.75 |
% |
05/2031 |
138 |
138 |
|||||||||||||||||||||||||||||||||||||||
Semi Annual Report 2025
53
CION Ares Diversified Credit Fund
Consolidated Schedule of Investments (continued)
June 30, 2025 (Unaudited)
(in thousands, except shares, percentages and as otherwise noted)
Senior Loans(b)(c)(d) (continued)
|
Company |
Country(a) |
Investment |
Coupon |
Reference |
Spread |
Acquisition Date |
Maturity Date |
Shares |
Principal Amount(a) |
Fair Value(a) |
% of Net Assets |
||||||||||||||||||||||||||||||||||||
|
USI, Inc. |
1st Lien Term Loan |
6.55% |
SOFR (Q) |
2.25 |
% |
11/2029 |
$ |
7,007 |
$ |
6,993 |
(f) |
||||||||||||||||||||||||||||||||||||
|
USI, Inc. |
1st Lien Term Loan |
6.55% |
SOFR (Q) |
2.25 |
% |
09/2030 |
15,339 |
15,286 |
(f) |
||||||||||||||||||||||||||||||||||||||
|
World Insurance Associates, LLC |
1st Lien Revolving Loan |
04/2030 |
— |
— |
(e)(g) |
||||||||||||||||||||||||||||||||||||||||||
|
World Insurance Associates, LLC |
1st Lien Term Loan |
9.30% |
SOFR (Q) |
5.00 |
% |
04/2030 |
1,851 |
1,851 |
(e) |
||||||||||||||||||||||||||||||||||||||
|
World Insurance Associates, LLC |
1st Lien Delay Draw Term Loan |
04/2030 |
— |
— |
(e)(g) |
||||||||||||||||||||||||||||||||||||||||||
|
469,793 |
9.68 |
% |
|||||||||||||||||||||||||||||||||||||||||||||
|
Materials |
|||||||||||||||||||||||||||||||||||||||||||||||
|
Adonis Acquisition Holdings LLC |
1st Lien Revolving Loan |
9.41% |
SOFR (Q) |
5.00 |
% |
08/2028 |
1 |
1 |
(e)(g) |
||||||||||||||||||||||||||||||||||||||
|
Adonis Acquisition Holdings LLC |
1st Lien Term Loan |
9.90% PIK |
SOFR (Q) |
5.50 |
% |
02/2030 |
2,748 |
2,749 |
(e) |
||||||||||||||||||||||||||||||||||||||
|
Adonis Acquisition Holdings LLC |
1st Lien Delay Draw Term Loan |
12.00% PIK |
PRIME (Q) |
4.50 |
% |
02/2030 |
472 |
472 |
(e)(g) |
||||||||||||||||||||||||||||||||||||||
|
AP Adhesives Holdings, LLC |
1st Lien Revolving Loan |
9.07% |
SOFR (M) |
4.75 |
% |
04/2031 |
26 |
26 |
(e)(g) |
||||||||||||||||||||||||||||||||||||||
|
AP Adhesives Holdings, LLC |
1st Lien Term Loan |
8.80% |
SOFR (S) |
4.75 |
% |
04/2032 |
3,704 |
3,667 |
(e)(f) |
||||||||||||||||||||||||||||||||||||||
|
AP Adhesives Holdings, LLC |
1st Lien Delay Draw Term Loan |
04/2032 |
— |
— |
(e)(g) |
||||||||||||||||||||||||||||||||||||||||||
|
Aruba Investments, Inc. |
2nd Lien Term Loan |
12.18% |
SOFR (M) |
7.75 |
% |
11/2028 |
4,038 |
3,775 |
|||||||||||||||||||||||||||||||||||||||
|
ASP-r-pac Acquisition Co LLC |
1st Lien Revolving Loan |
10.44% |
SOFR (M) |
6.00 |
% |
12/2027 |
478 |
479 |
(e)(g) |
||||||||||||||||||||||||||||||||||||||
|
ASP-r-pac Acquisition Co LLC |
1st Lien Term Loan |
10.54% |
SOFR (Q) |
6.00 |
% |
12/2027 |
6,041 |
6,041 |
(e)(f) |
||||||||||||||||||||||||||||||||||||||
|
ASP-r-pac Acquisition Co LLC |
1st Lien Term Loan |
10.28% |
SOFR (Q) |
6.00 |
% |
12/2027 |
471 |
471 |
(e)(f) |
||||||||||||||||||||||||||||||||||||||
|
Bulab Holdings, Inc. |
1st Lien Revolving Loan |
07/2032 |
— |
— |
(e)(g)(h) |
||||||||||||||||||||||||||||||||||||||||||
|
Bulab Holdings, Inc. |
1st Lien Term Loan |
07/2032 |
25,215 |
25,730 |
(e)(g)(h) |
||||||||||||||||||||||||||||||||||||||||||
|
BW Holding, Inc. |
1st Lien Term Loan |
8.48% |
SOFR (Q) |
4.00 |
% |
12/2028 |
6,887 |
4,900 |
|||||||||||||||||||||||||||||||||||||||
|
Flexsys Cayman Holdings, LP |
1st Lien Term Loan |
10.58% |
SOFR (Q) |
6.25 |
% |
08/2029 |
6,329 |
5,949 |
|||||||||||||||||||||||||||||||||||||||
|
Flexsys Cayman Holdings, LP |
1st Lien Term Loan |
9.69% |
SOFR (M) |
5.25 |
% |
08/2029 |
8,703 |
4,406 |
|||||||||||||||||||||||||||||||||||||||
Semi Annual Report 2025
54
CION Ares Diversified Credit Fund
Consolidated Schedule of Investments (continued)
June 30, 2025 (Unaudited)
(in thousands, except shares, percentages and as otherwise noted)
Senior Loans(b)(c)(d) (continued)
|
Company |
Country(a) |
Investment |
Coupon |
Reference |
Spread |
Acquisition Date |
Maturity Date |
Shares |
Principal Amount(a) |
Fair Value(a) |
% of Net Assets |
||||||||||||||||||||||||||||||||||||
|
Meyer Laboratory, LLC |
1st Lien Revolving Loan |
12.25% |
PRIME (Q) |
4.75 |
% |
02/2030 |
$ |
133 |
$ |
131 |
(e)(g) |
||||||||||||||||||||||||||||||||||||
|
Meyer Laboratory, LLC |
1st Lien Term Loan |
10.08% |
SOFR (M) |
5.75 |
% |
02/2030 |
657 |
643 |
(e)(f) |
||||||||||||||||||||||||||||||||||||||
|
Meyer Laboratory, LLC |
1st Lien Delay Draw Term Loan |
10.08% |
SOFR (M) |
5.75 |
% |
02/2030 |
117 |
115 |
(e)(g) |
||||||||||||||||||||||||||||||||||||||
|
NCP-MSI Buyer, Inc. |
1st Lien Revolving Loan |
8.05% |
SOFR (Q) |
3.75 |
% |
03/2031 |
266 |
263 |
(e)(g) |
||||||||||||||||||||||||||||||||||||||
|
NCP-MSI Buyer, Inc. |
1st Lien Revolving Loan |
03/2031 |
— |
— |
(e)(g) |
||||||||||||||||||||||||||||||||||||||||||
|
NCP-MSI Buyer, Inc. |
1st Lien Term Loan |
9.05% |
SOFR (Q) |
4.75 |
% |
03/2031 |
3,882 |
3,862 |
(e)(f) |
||||||||||||||||||||||||||||||||||||||
|
NCP-MSI Buyer, Inc. |
1st Lien Delay Draw Term Loan |
03/2031 |
— |
— |
(e)(g) |
||||||||||||||||||||||||||||||||||||||||||
|
Nelipak Holding Company |
1st Lien Revolving Loan |
9.83% |
SOFR (M) |
5.50 |
% |
03/2031 |
191 |
187 |
(e)(g) |
||||||||||||||||||||||||||||||||||||||
|
Nelipak Holding Company |
1st Lien Revolving Loan |
7.37% | EURIBOR (M) |
5.50 |
% |
03/2031 |
€ |
13 |
15 |
(e)(g) |
|||||||||||||||||||||||||||||||||||||
|
Nelipak Holding Company |
1st Lien Term Loan |
9.80% |
SOFR (Q) |
5.50 |
% |
03/2031 |
977 |
957 |
(e)(f) |
||||||||||||||||||||||||||||||||||||||
|
Nelipak Holding Company |
1st Lien Term Loan |
7.86% | EURIBOR (Q) |
5.50 |
% |
03/2031 |
€ |
1,876 |
2,166 |
(e)(f) |
|||||||||||||||||||||||||||||||||||||
|
Nelipak Holding Company |
1st Lien Delay Draw Term Loan |
03/2031 |
— |
— |
(e)(g) |
||||||||||||||||||||||||||||||||||||||||||
|
Nelipak Holding Company |
1st Lien Delay Draw Term Loan |
03/2031 |
€ |
— |
— |
(e)(g) |
|||||||||||||||||||||||||||||||||||||||||
|
Novipax Buyer, L.L.C. |
1st Lien Term Loan |
12.63% (1.00% PIK) |
SOFR (S) |
8.25 |
% |
12/2026 |
4,283 |
4,197 |
(e)(f) |
||||||||||||||||||||||||||||||||||||||
|
Plaskolite PPC Intermediate II LLC |
1st Lien Revolving Loan |
11.31% |
SOFR (M) |
7.00 |
% |
02/2030 |
152 |
149 |
(e)(g) |
||||||||||||||||||||||||||||||||||||||
|
Plaskolite PPC Intermediate II LLC |
1st Lien Term Loan |
11.31% (3.00% PIK) |
SOFR (M) |
7.00 |
% |
05/2030 |
34,367 |
33,679 |
(e)(f) |
||||||||||||||||||||||||||||||||||||||
|
Polymer Solutions Group, LLC |
1st Lien Term Loan |
8.63% |
SOFR (Q) |
4.50 |
% |
11/2026 |
635 |
635 |
(e)(f) |
||||||||||||||||||||||||||||||||||||||
|
Precision Concepts Canada Corporation |
Canada |
1st Lien Term Loan |
9.90% |
SOFR (Q) |
5.50 |
% |
04/2026 |
613 |
613 |
(e)(f) |
|||||||||||||||||||||||||||||||||||||
|
Precision Concepts International LLC |
1st Lien Revolving Loan |
9.90% |
SOFR (Q) |
5.50 |
% |
04/2026 |
91 |
91 |
(e)(g) |
||||||||||||||||||||||||||||||||||||||
Semi Annual Report 2025
55
CION Ares Diversified Credit Fund
Consolidated Schedule of Investments (continued)
June 30, 2025 (Unaudited)
(in thousands, except shares, percentages and as otherwise noted)
Senior Loans(b)(c)(d) (continued)
|
Company |
Country(a) |
Investment |
Coupon |
Reference |
Spread |
Acquisition Date |
Maturity Date |
Shares |
Principal Amount(a) |
Fair Value(a) |
% of Net Assets |
||||||||||||||||||||||||||||||||||||
|
Precision Concepts International LLC |
1st Lien Term Loan |
9.90% |
SOFR (Q) |
5.50 |
% |
04/2026 |
$ |
4,758 |
$ |
4,758 |
(e)(f) |
||||||||||||||||||||||||||||||||||||
|
Precision Concepts International LLC |
1st Lien Term Loan |
9.90% |
SOFR (S) |
5.50 |
% |
04/2026 |
626 |
626 |
(e)(f) |
||||||||||||||||||||||||||||||||||||||
|
Pregis TopCo LLC |
1st Lien Term Loan |
8.33% |
SOFR (M) |
4.00 |
% |
02/2029 |
14,519 |
14,548 |
(f) |
||||||||||||||||||||||||||||||||||||||
|
Pretium PKG Holdings, Inc. |
1st Lien Term Loan |
8.16% |
SOFR (Q) |
3.90 |
% |
10/2028 |
6,170 |
2,928 |
|||||||||||||||||||||||||||||||||||||||
|
Reagent Chemical & Research, LLC |
1st Lien Revolving Loan |
04/2030 |
— |
— |
(e)(g) |
||||||||||||||||||||||||||||||||||||||||||
|
Reagent Chemical & Research, LLC |
1st Lien Term Loan |
9.58% |
SOFR (M) |
5.25 |
% |
04/2031 |
2,338 |
2,338 |
(e)(f) |
||||||||||||||||||||||||||||||||||||||
|
Trident TPI Holdings, Inc. |
1st Lien Term Loan |
8.05% |
SOFR (Q) |
3.75 |
% |
09/2028 |
18,237 |
17,893 |
(f) |
||||||||||||||||||||||||||||||||||||||
|
149,460 |
3.08 |
% |
|||||||||||||||||||||||||||||||||||||||||||||
|
Sports, Media and Entertainment |
|||||||||||||||||||||||||||||||||||||||||||||||
| 3 Step Sports LLC |
1st Lien Revolving Loan |
12.32% |
SOFR (M) |
8.00 |
% |
10/2028 |
93 |
88 |
(e)(g) |
||||||||||||||||||||||||||||||||||||||
| 3 Step Sports LLC |
1st Lien Term Loan |
12.30% (1.50% PIK) |
SOFR (Q) |
8.00 |
% |
10/2029 |
1,946 |
1,848 |
(e) |
||||||||||||||||||||||||||||||||||||||
| 3 Step Sports LLC |
1st Lien Delay Draw Term Loan |
12.30% (1.50% PIK) |
SOFR (Q) |
8.00 |
% |
10/2029 |
221 |
210 |
(e)(g) |
||||||||||||||||||||||||||||||||||||||
|
Aventine Intermediate LLC |
1st Lien Term Loan |
10.40% (3.00% PIK) |
SOFR (Q) |
6.00 |
% |
06/2027 |
2,326 |
2,279 |
(e)(f) |
||||||||||||||||||||||||||||||||||||||
|
Aventine Intermediate LLC |
1st Lien Delay Draw Term Loan |
10.40% (3.00% PIK) |
SOFR (Q) |
6.00 |
% |
06/2027 |
921 |
903 |
(e) |
||||||||||||||||||||||||||||||||||||||
|
Bad Vibes Forever, LLC and Bad Vibes Forever Publishing, LLC |
1st Lien Term Loan |
9.68% |
SOFR (S) |
5.50 |
% |
06/2032 |
537 |
529 |
(e) |
||||||||||||||||||||||||||||||||||||||
|
Creative Artists Agency, LLC |
1st Lien Term Loan |
7.08% |
SOFR (M) |
2.75 |
% |
10/2031 |
8,240 |
8,260 |
(f) |
||||||||||||||||||||||||||||||||||||||
|
Fever Labs, Inc. |
1st Lien Revolving Loan |
11/2028 |
— |
— |
(e)(g) |
||||||||||||||||||||||||||||||||||||||||||
|
Fever Labs, Inc. |
1st Lien Revolving Loan |
11.00% |
11/2028 |
2,308 |
2,308 |
(e)(g) |
|||||||||||||||||||||||||||||||||||||||||
|
Fever Labs, Inc. |
1st Lien Term Loan |
11.00% |
11/2028 |
3,815 |
3,815 |
(e) |
|||||||||||||||||||||||||||||||||||||||||
|
Fever Labs, Inc. |
1st Lien Delay Draw Term Loan |
11.00% |
11/2028 |
818 |
818 |
(e)(g) |
|||||||||||||||||||||||||||||||||||||||||
Semi Annual Report 2025
56
CION Ares Diversified Credit Fund
Consolidated Schedule of Investments (continued)
June 30, 2025 (Unaudited)
(in thousands, except shares, percentages and as otherwise noted)
Senior Loans(b)(c)(d) (continued)
|
Company |
Country(a) |
Investment |
Coupon |
Reference |
Spread |
Acquisition |
Maturity |
Shares |
Principal |
Fair Value(a) |
% of Net |
||||||||||||||||||||||||||||||||||||
|
Global Music |
1st Lien |
12/2031 |
$ |
— |
$ |
— |
(e)(g) |
||||||||||||||||||||||||||||||||||||||||
|
Global Music |
1st Lien |
9.05% |
SOFR (Q) |
4.75 |
% |
12/2031 |
64,370 |
64,370 |
(e)(f) |
||||||||||||||||||||||||||||||||||||||
|
Gray Television, |
1st Lien |
7.44% |
SOFR (M) |
3.00 |
% |
12/2028 |
3,958 |
3,823 |
(f) |
||||||||||||||||||||||||||||||||||||||
|
League One |
1st Lien |
10.83% |
SOFR (Q) |
6.50 |
% |
01/2030 |
1 |
1 |
(e)(g) |
||||||||||||||||||||||||||||||||||||||
|
Legends |
1st Lien |
9.32% |
SOFR (M) |
5.00 |
% |
08/2030 |
240 |
240 |
(e)(g) |
||||||||||||||||||||||||||||||||||||||
|
Legends |
1st Lien |
9.82% |
SOFR (Q) |
5.50 |
% |
08/2031 |
6,123 |
6,123 |
(e)(f) |
||||||||||||||||||||||||||||||||||||||
|
Legends |
1st Lien |
08/2031 |
— |
— |
(e)(g) |
||||||||||||||||||||||||||||||||||||||||||
|
NEP Group, Inc. |
1st Lien |
9.34% |
SOFR (Q) |
4.75 |
% |
08/2026 |
18,201 |
16,734 |
|||||||||||||||||||||||||||||||||||||||
|
NEP Group, Inc. |
1st Lien |
10.07% |
SOFR (Q) |
5.50 |
% |
08/2026 |
7,303 |
6,609 |
|||||||||||||||||||||||||||||||||||||||
|
Production |
1st Lien |
12.57% |
SOFR (Q) |
8.13 |
% |
08/2029 |
335 |
335 |
(e) |
||||||||||||||||||||||||||||||||||||||
|
Production |
1st Lien |
11.95% |
SOFR (Q) |
7.50 |
% |
08/2029 |
755 |
755 |
(e) |
||||||||||||||||||||||||||||||||||||||
|
Production |
1st Lien |
12.57% |
SOFR (Q) |
8.13 |
% |
08/2029 |
52 |
52 |
(e) |
||||||||||||||||||||||||||||||||||||||
|
Production |
1st Lien |
12.43% |
SOFR (Q) |
8.00 |
% |
08/2029 |
51 |
51 |
(e) |
||||||||||||||||||||||||||||||||||||||
|
Production |
1st Lien |
08/2029 |
1,068 |
726 |
(e)(i) |
||||||||||||||||||||||||||||||||||||||||||
|
Professional |
1st Lien |
14.00% |
01/2026 |
848 |
849 |
(e) |
|||||||||||||||||||||||||||||||||||||||||
|
Professional |
2nd Lien |
16.00% |
01/2026 |
8 |
8 |
(e) |
|||||||||||||||||||||||||||||||||||||||||
|
Storm Investment |
Luxembourg |
1st Lien |
3.75% |
06/2029 |
€ |
9,193 |
10,829 |
(e) |
|||||||||||||||||||||||||||||||||||||||
Semi Annual Report 2025
57
CION Ares Diversified Credit Fund
Consolidated Schedule of Investments (continued)
June 30, 2025 (Unaudited)
(in thousands, except shares, percentages and as otherwise noted)
Senior Loans(b)(c)(d) (continued)
|
Company |
Country(a) |
Investment |
Coupon |
Reference |
Spread |
Acquisition Date |
Maturity Date |
Shares |
Principal Amount(a) |
Fair Value(a) |
% of Net Assets |
||||||||||||||||||||||||||||||||||||
|
Voldex Entertainment Limited |
United Kingdom |
1st Lien Term Loan |
11.55% |
SOFR (Q) |
7.25 |
% |
01/2029 |
$ |
23 |
$ |
23 |
(e) |
|||||||||||||||||||||||||||||||||||
|
WideOpenWest Finance, LLC |
1st Lien Term Loan |
11.50% |
SOFR (Q) |
7.00 |
% |
12/2028 |
2,187 |
2,236 |
(f) |
||||||||||||||||||||||||||||||||||||||
|
WRE Sports Investments LLC |
1st Lien Term Loan |
11.00% (5.50% PIK) |
07/2031 |
7,251 |
7,251 |
(e) |
|||||||||||||||||||||||||||||||||||||||||
|
WRE Sports Investments LLC |
1st Lien Delay Draw Term Loan |
11.00% (5.50% PIK) |
07/2031 |
302 |
302 |
(e)(g) |
|||||||||||||||||||||||||||||||||||||||||
|
142,375 |
2.93 |
% |
|||||||||||||||||||||||||||||||||||||||||||||
|
Pharmaceuticals, Biotechnology and Life Sciences |
|||||||||||||||||||||||||||||||||||||||||||||||
|
1261229 B.C. Ltd. |
Canada |
1st Lien Term Loan |
10.56% |
SOFR (M) |
6.25 |
% |
10/2030 |
26,000 |
25,021 |
||||||||||||||||||||||||||||||||||||||
|
ADMA Biologics, Inc. |
1st Lien Revolving Loan |
8.05% |
SOFR (Q) |
3.75 |
% |
12/2027 |
1 |
1 |
(e)(g) |
||||||||||||||||||||||||||||||||||||||
|
ADMA Biologics, Inc. |
1st Lien Term Loan |
10.81% |
SOFR (Q) |
6.50 |
% |
12/2027 |
36 |
36 |
(e)(f) |
||||||||||||||||||||||||||||||||||||||
|
Alcami Corporation |
1st Lien Revolving Loan |
12/2028 |
— |
— |
(e)(g) |
||||||||||||||||||||||||||||||||||||||||||
|
Alcami Corporation |
1st Lien Term Loan |
11.48% |
SOFR (Q) |
7.00 |
% |
12/2028 |
200 |
200 |
(e) |
||||||||||||||||||||||||||||||||||||||
|
Alcami Corporation |
1st Lien Delay Draw Term Loan |
11.48% |
SOFR (M) |
7.00 |
% |
12/2028 |
15 |
15 |
(e) |
||||||||||||||||||||||||||||||||||||||
|
ASPIRE BIDCO LIMITED |
Jersey |
1st Lien Term Loan |
10.43% |
SONIA (Q) |
6.09 |
% |
09/2028 |
£ |
7,777 |
10,675 |
(e)(f) |
||||||||||||||||||||||||||||||||||||
|
ASPIRE BIDCO LIMITED |
Jersey |
1st Lien Delay Draw Term Loan |
10.43% |
SONIA (Q) |
6.09 |
% |
09/2028 |
£ |
647 |
888 |
(e)(g) |
||||||||||||||||||||||||||||||||||||
|
Bamboo US BidCo LLC |
1st Lien Revolving Loan |
10/2029 |
— |
— |
(e)(g) |
||||||||||||||||||||||||||||||||||||||||||
|
Bamboo US BidCo LLC |
1st Lien Term Loan |
9.53% |
SOFR (Q) |
5.25 |
% |
09/2030 |
2,655 |
2,655 |
(e) |
||||||||||||||||||||||||||||||||||||||
|
Bamboo US BidCo LLC |
1st Lien Term Loan |
7.44% | EURIBOR (Q) |
5.25 |
% |
09/2030 |
€ |
2,126 |
2,504 |
(e) |
|||||||||||||||||||||||||||||||||||||
|
Bamboo US BidCo LLC |
1st Lien Delay Draw Term Loan |
9.58% |
SOFR (Q) |
5.25 |
% |
09/2030 |
92 |
92 |
(e)(g) |
||||||||||||||||||||||||||||||||||||||
|
Bamboo US BidCo LLC |
1st Lien Delay Draw Term Loan |
09/2030 |
— |
— |
(e)(g) |
||||||||||||||||||||||||||||||||||||||||||
|
Bamboo US BidCo LLC |
1st Lien Delay Draw Term Loan |
9.53% |
SOFR (Q) |
5.25 |
% |
09/2030 |
406 |
406 |
(e) |
||||||||||||||||||||||||||||||||||||||
|
Cambrex Corporation |
1st Lien Revolving Loan |
03/2032 |
— |
— |
(e)(g) |
||||||||||||||||||||||||||||||||||||||||||
Semi Annual Report 2025
58
CION Ares Diversified Credit Fund
Consolidated Schedule of Investments (continued)
June 30, 2025 (Unaudited)
(in thousands, except shares, percentages and as otherwise noted)
Senior Loans(b)(c)(d) (continued)
|
Company |
Country(a) |
Investment |
Coupon |
Reference |
Spread |
Acquisition Date |
Maturity Date |
Shares |
Principal Amount(a) |
Fair Value(a) |
% of Net Assets |
||||||||||||||||||||||||||||||||||||
|
Cambrex Corporation |
1st Lien Term Loan |
9.08% |
SOFR (M) |
4.75 |
% |
03/2032 |
$ |
36,544 |
$ |
36,362 |
(e)(f) |
||||||||||||||||||||||||||||||||||||
|
Cambrex Corporation |
1st Lien Delay Draw Term Loan |
03/2032 |
— |
— |
(e)(g) |
||||||||||||||||||||||||||||||||||||||||||
|
Cobalt Buyer Sub, Inc. |
1st Lien Revolving Loan |
9.83% |
SOFR (Q) |
5.50 |
% |
10/2027 |
358 |
358 |
(e)(g) |
||||||||||||||||||||||||||||||||||||||
|
Cobalt Buyer Sub, Inc. |
1st Lien Term Loan |
9.83% |
SOFR (Q) |
5.50 |
% |
10/2028 |
10,719 |
10,720 |
(e)(f) |
||||||||||||||||||||||||||||||||||||||
|
Cobalt Buyer Sub, Inc. |
1st Lien Delay Draw Term Loan |
9.83% |
SOFR (Q) |
5.50 |
% |
10/2028 |
2,403 |
2,403 |
(e)(f) |
||||||||||||||||||||||||||||||||||||||
|
Cobalt Buyer Sub, Inc. |
1st Lien Delay Draw Term Loan |
10/2028 |
— |
— |
(e)(g) |
||||||||||||||||||||||||||||||||||||||||||
|
Creek Parent, Inc. |
1st Lien Revolving Loan |
12/2031 |
— |
— |
(e)(g) |
||||||||||||||||||||||||||||||||||||||||||
|
Creek Parent, Inc. |
1st Lien Term Loan |
9.57% |
SOFR (M) |
5.25 |
% |
12/2031 |
42,024 |
42,024 |
(e)(f) |
||||||||||||||||||||||||||||||||||||||
|
Crossco (1469) Limited |
United Kingdom |
1st Lien Term Loan |
10.47% |
SONIA (Q) |
6.25 |
% |
12/2030 |
£ |
1,935 |
2,657 |
(e) |
||||||||||||||||||||||||||||||||||||
|
Crossco (1469) Limited |
United Kingdom |
1st Lien Delay Draw Term Loan |
12/2030 |
£ |
— |
— |
(e)(g) |
||||||||||||||||||||||||||||||||||||||||
|
Gula Buyer Inc. |
1st Lien Term Loan |
9.32% |
SOFR (M) |
5.00 |
% |
10/2031 |
7,984 |
7,984 |
(e)(f) |
||||||||||||||||||||||||||||||||||||||
|
IGEA BIDCO S.P.A |
Italy |
1st Lien Delay Draw Term Loan |
09/2030 |
€ |
— |
— |
(e)(g) |
||||||||||||||||||||||||||||||||||||||||
|
NMC Skincare Intermediate Holdings II, LLC |
1st Lien Revolving Loan |
10.92% |
SOFR (M) |
6.50 |
% |
10/2028 |
56 |
52 |
(e)(g) |
||||||||||||||||||||||||||||||||||||||
|
NMC Skincare Intermediate Holdings II, LLC |
1st Lien Revolving Loan |
10.98% |
SOFR (Q) |
6.50 |
% |
10/2028 |
8 |
7 |
(e)(g) |
||||||||||||||||||||||||||||||||||||||
|
NMC Skincare Intermediate Holdings II, LLC |
1st Lien Term Loan |
10.93% (1.50% PIK) |
SOFR (Q) |
6.50 |
% |
10/2028 |
1,703 |
1,584 |
(e)(f) |
||||||||||||||||||||||||||||||||||||||
|
NMC Skincare Intermediate Holdings II, LLC |
1st Lien Term Loan |
10.95% (1.50% PIK) |
SOFR (Q) |
6.50 |
% |
10/2028 |
335 |
312 |
(e)(f) |
||||||||||||||||||||||||||||||||||||||
|
NMC Skincare Intermediate Holdings II, LLC |
1st Lien Delay Draw Term Loan |
10.93% (1.50% PIK) |
SOFR (Q) |
6.50 |
% |
10/2028 |
574 |
534 |
(e)(f) |
||||||||||||||||||||||||||||||||||||||
|
North American Science Associates, LLC |
1st Lien Revolving Loan |
8.97% |
SOFR (Q) |
4.50 |
% |
03/2027 |
2,499 |
2,424 |
(e)(g) |
||||||||||||||||||||||||||||||||||||||
|
North American Science Associates, LLC |
1st Lien Term Loan |
10.46% |
SOFR (Q) |
6.00 |
% |
09/2027 |
11,456 |
11,112 |
(e)(f) |
||||||||||||||||||||||||||||||||||||||
|
North American Science Associates, LLC |
1st Lien Delay Draw Term Loan |
10.46% |
SOFR (Q) |
6.00 |
% |
09/2027 |
1,858 |
1,802 |
(e)(f) |
||||||||||||||||||||||||||||||||||||||
Semi Annual Report 2025
59
CION Ares Diversified Credit Fund
Consolidated Schedule of Investments (continued)
June 30, 2025 (Unaudited)
(in thousands, except shares, percentages and as otherwise noted)
Senior Loans(b)(c)(d) (continued)
|
Company |
Country(a) |
Investment |
Coupon |
Reference |
Spread |
Acquisition Date |
Maturity Date |
Shares |
Principal Amount(a) |
Fair Value(a) |
% of Net Assets |
||||||||||||||||||||||||||||||||||||
|
Solar Bidco Limited |
United Kingdom |
1st Lien Delay Draw Term Loan |
7.98% | EURIBOR (Q) |
6.00% |
11/2029 |
£ |
2,226 |
$ |
3,056 |
(e)(g) |
||||||||||||||||||||||||||||||||||||
|
Verista, Inc. |
1st Lien Revolving Loan |
10.57% |
SOFR (Q) |
6.00% |
02/2027 |
167 |
153 |
(e)(g) |
|||||||||||||||||||||||||||||||||||||||
|
Verista, Inc. |
1st Lien Term Loan |
11.08% (0.50% PIK) |
SOFR (Q) |
6.50% |
02/2027 |
8,800 |
8,096 |
(e)(f) |
|||||||||||||||||||||||||||||||||||||||
|
Verista, Inc. |
1st Lien Delay Draw Term Loan |
11.06% (0.50% PIK) |
SOFR (Q) |
6.50% |
02/2027 |
1,814 |
1,669 |
(e)(f) |
|||||||||||||||||||||||||||||||||||||||
|
WCI-BXC Purchaser, LLC |
1st Lien Revolving Loan |
11/2029 |
— |
— |
(e)(g) |
||||||||||||||||||||||||||||||||||||||||||
|
WCI-BXC Purchaser, LLC |
1st Lien Term Loan |
10.51% |
SOFR (Q) |
6.25% |
11/2030 |
756 |
756 |
(e) |
|||||||||||||||||||||||||||||||||||||||
|
176,558 |
3.64 |
% |
|||||||||||||||||||||||||||||||||||||||||||||
|
Real Estate Management and Development |
|||||||||||||||||||||||||||||||||||||||||||||||
| 285 Mezz LLC |
1st Lien Delay Draw Term Loan |
12/2025 |
4,972 |
3,023 |
(e)(i) |
||||||||||||||||||||||||||||||||||||||||||
|
285 Schermerhorn LLC |
1st Lien Delay Draw Term Loan |
12/2025 |
8,352 |
5,079 |
(e)(g)(i) |
||||||||||||||||||||||||||||||||||||||||||
|
Odevo AB |
Sweden |
1st Lien Term Loan |
7.45% | EURIBOR (Q) |
5.50% |
12/2030 |
€ |
2,829 |
3,332 |
(e) |
|||||||||||||||||||||||||||||||||||||
|
Odevo AB |
Sweden |
1st Lien Term Loan |
9.71% |
SONIA (Q) |
5.50% |
12/2030 |
£ |
9,498 |
13,037 |
(e) |
|||||||||||||||||||||||||||||||||||||
|
Odevo AB |
Sweden |
1st Lien Term Loan |
7.74% |
STIBOR (Q) |
5.50% |
12/2030 |
SEK |
78,160 |
8,262 |
(e)(f) |
|||||||||||||||||||||||||||||||||||||
|
Odevo AB |
Sweden |
1st Lien Term Loan |
9.82% |
SOFR (Q) |
5.50% |
12/2030 |
8,732 |
8,732 |
(e) |
||||||||||||||||||||||||||||||||||||||
|
Odevo AB |
Sweden |
1st Lien Delay Draw Term Loan |
7.64% | EURIBOR (Q) |
5.50% |
12/2030 |
€ |
40 |
47 |
(e)(g) |
|||||||||||||||||||||||||||||||||||||
|
41,512 |
0.86 |
% |
|||||||||||||||||||||||||||||||||||||||||||||
|
Software and Services |
|||||||||||||||||||||||||||||||||||||||||||||||
|
Access CIG, LLC |
1st Lien Term Loan |
8.38% |
SOFR (Q) |
4.25% |
08/2028 |
17,974 |
18,038 |
(f) |
|||||||||||||||||||||||||||||||||||||||
|
ACP Avenu Buyer, LLC |
1st Lien Revolving Loan |
10/2029 |
— |
— |
(e)(g) |
||||||||||||||||||||||||||||||||||||||||||
|
ACP Avenu Buyer, LLC |
1st Lien Term Loan |
9.02% |
SOFR (S) |
4.75% |
10/2029 |
3,515 |
3,479 |
(e)(f) |
|||||||||||||||||||||||||||||||||||||||
|
ACP Avenu Buyer, LLC |
1st Lien Delay Draw Term Loan |
10/2029 |
— |
— |
(e)(g) |
||||||||||||||||||||||||||||||||||||||||||
|
ACTFY Buyer, Inc. |
1st Lien Revolving Loan |
05/2030 |
— |
— |
(e)(g) |
||||||||||||||||||||||||||||||||||||||||||
Semi Annual Report 2025
60
CION Ares Diversified Credit Fund
Consolidated Schedule of Investments (continued)
June 30, 2025 (Unaudited)
(in thousands, except shares, percentages and as otherwise noted)
Senior Loans(b)(c)(d) (continued)
|
Company |
Country(a) |
Investment |
Coupon |
Reference |
Spread |
Acquisition Date |
Maturity Date |
Shares |
Principal Amount(a) |
Fair Value(a) |
% of Net Assets |
||||||||||||||||||||||||||||||||||||
|
ACTFY Buyer, Inc. |
1st Lien Term Loan |
9.33% |
SOFR (M) |
5.00 |
% |
05/2031 |
$ |
1,499 |
$ |
1,499 |
(e)(f) |
||||||||||||||||||||||||||||||||||||
|
ACTFY Buyer, Inc. |
1st Lien Delay Draw Term Loan |
9.33% |
SOFR (M) |
5.00 |
% |
05/2031 |
164 |
163 |
(e)(g) |
||||||||||||||||||||||||||||||||||||||
|
Activate holdings (US) Corp. |
1st Lien Revolving Loan |
07/2029 |
— |
— |
(e)(g) |
||||||||||||||||||||||||||||||||||||||||||
|
Activate holdings (US) Corp. |
1st Lien Term Loan |
9.80% |
SOFR (Q) |
5.50 |
% |
07/2030 |
13,239 |
13,239 |
(e)(f) |
||||||||||||||||||||||||||||||||||||||
|
Adonis Bidco, Inc. |
1st Lien Revolving Loan |
11/2031 |
— |
— |
(e)(g) |
||||||||||||||||||||||||||||||||||||||||||
|
Adonis Bidco, Inc. |
1st Lien Term Loan |
10.05% (3.00% PIK) |
SOFR (Q) |
5.75 |
% |
02/2032 |
50,641 |
50,135 |
(e)(f) |
||||||||||||||||||||||||||||||||||||||
|
Adonis Bidco, Inc. |
1st Lien Delay Draw Term Loan |
9.80% |
SOFR (Q) |
5.50 |
% |
02/2032 |
2,413 |
2,385 |
(e)(g) |
||||||||||||||||||||||||||||||||||||||
|
AI Titan Parent, Inc. |
1st Lien Revolving Loan |
08/2031 |
— |
— |
(e)(g) |
||||||||||||||||||||||||||||||||||||||||||
|
AI Titan Parent, Inc. |
1st Lien Term Loan |
8.83% |
SOFR (M) |
4.50 |
% |
08/2031 |
8,946 |
8,946 |
(e)(f) |
||||||||||||||||||||||||||||||||||||||
|
AI Titan Parent, Inc. |
1st Lien Delay Draw Term Loan |
08/2031 |
— |
— |
(e)(g) |
||||||||||||||||||||||||||||||||||||||||||
|
Anaplan, Inc. |
1st Lien Revolving Loan |
06/2028 |
— |
— |
(e)(g) |
||||||||||||||||||||||||||||||||||||||||||
|
Anaplan, Inc. |
1st Lien Term Loan |
8.82% |
SOFR (Q) |
4.50 |
% |
06/2029 |
7,092 |
7,092 |
(e)(f) |
||||||||||||||||||||||||||||||||||||||
|
Applied Systems, Inc. |
1st Lien Term Loan |
6.80% |
SOFR (Q) |
2.50 |
% |
02/2031 |
997 |
1,001 |
|||||||||||||||||||||||||||||||||||||||
|
Aptean Acquiror Inc. |
1st Lien Revolving Loan |
01/2031 |
— |
— |
(e)(g) |
||||||||||||||||||||||||||||||||||||||||||
|
Aptean Acquiror Inc. |
1st Lien Term Loan |
9.07% |
SOFR (Q) |
4.75 |
% |
01/2031 |
4,300 |
4,300 |
(e)(f) |
||||||||||||||||||||||||||||||||||||||
|
Aptean Acquiror Inc. |
1st Lien Delay Draw Term Loan |
9.06% |
SOFR (Q) |
4.75 |
% |
01/2031 |
6 |
6 |
(e)(g) |
||||||||||||||||||||||||||||||||||||||
|
Artifact Bidco, Inc. |
1st Lien Revolving Loan |
07/2030 |
— |
— |
(e)(g) |
||||||||||||||||||||||||||||||||||||||||||
|
Artifact Bidco, Inc. |
1st Lien Term Loan |
8.55% |
SOFR (Q) |
4.25 |
% |
07/2031 |
1,154 |
1,154 |
(e)(f) |
||||||||||||||||||||||||||||||||||||||
|
Artifact Bidco, Inc. |
1st Lien Delay Draw Term Loan |
07/2031 |
— |
— |
(e)(g) |
||||||||||||||||||||||||||||||||||||||||||
|
Asurion, LLC |
1st Lien Term Loan |
7.69% |
SOFR (M) |
3.25 |
% |
07/2027 |
1,470 |
1,468 |
(f) |
||||||||||||||||||||||||||||||||||||||
|
Asurion, LLC |
1st Lien Term Loan |
8.58% |
SOFR (M) |
4.25 |
% |
09/2030 |
4,000 |
3,882 |
|||||||||||||||||||||||||||||||||||||||
Semi Annual Report 2025
61
CION Ares Diversified Credit Fund
Consolidated Schedule of Investments (continued)
June 30, 2025 (Unaudited)
(in thousands, except shares, percentages and as otherwise noted)
Senior Loans(b)(c)(d) (continued)
|
Company |
Country(a) |
Investment |
Coupon |
Reference |
Spread |
Acquisition |
Maturity |
Shares |
Principal |
Fair Value(a) |
% of Net |
||||||||||||||||||||||||||||||||||||
|
Avaya Inc. |
1st Lien |
11.83% |
SOFR (M) |
7.50 |
% |
08/2028 |
$ |
7,806 |
$ |
6,077 |
|||||||||||||||||||||||||||||||||||||
|
Bamboo Health |
1st Lien |
05/2027 |
— |
— |
(e)(g) |
||||||||||||||||||||||||||||||||||||||||||
|
Bamboo Health |
1st Lien |
9.22% |
SOFR (M) |
4.75 |
% |
05/2027 |
1,419 |
1,419 |
(e) |
||||||||||||||||||||||||||||||||||||||
|
Banyan Software |
1st Lien |
9.82% |
SOFR (M) |
5.50 |
% |
01/2031 |
75 |
75 |
(e)(g) |
||||||||||||||||||||||||||||||||||||||
|
Banyan Software |
1st Lien |
9.83% |
SOFR (M) |
5.50 |
% |
01/2031 |
4,755 |
4,755 |
(e)(f) |
||||||||||||||||||||||||||||||||||||||
|
Banyan Software |
1st Lien |
9.83% |
SOFR (M) |
5.50 |
% |
01/2031 |
1,543 |
1,543 |
(e)(g) |
||||||||||||||||||||||||||||||||||||||
|
Banyan Software |
1st Lien |
01/2031 |
— |
— |
(e)(g) |
||||||||||||||||||||||||||||||||||||||||||
|
BCPE Pequod |
1st Lien |
11/2029 |
— |
— |
(e)(g) |
||||||||||||||||||||||||||||||||||||||||||
|
BCPE Pequod |
1st Lien |
7.58% |
SOFR (M) |
3.25 |
% |
11/2031 |
6,436 |
6,442 |
|||||||||||||||||||||||||||||||||||||||
|
BigHand UK Bidco |
United |
1st Lien |
10.48% |
SOFR (S) |
6.31 |
% |
06/2030 |
1,048 |
1,048 |
(e) |
|||||||||||||||||||||||||||||||||||||
|
BigHand UK Bidco |
United |
1st Lien |
10.53% |
SONIA (S) |
6.31 |
% |
06/2030 |
£ |
781 |
1,072 |
(e) |
||||||||||||||||||||||||||||||||||||
|
BigHand UK Bidco |
United |
1st Lien |
10.10% |
SOFR (B) |
5.75 |
% |
06/2030 |
£ |
242 |
332 |
(e) |
||||||||||||||||||||||||||||||||||||
|
Bizzdesign |
Netherlands |
1st Lien |
8.48% |
EURIBOR (Q) |
6.50 |
% |
10/2031 |
€ |
1,000 |
1,178 |
(e) |
||||||||||||||||||||||||||||||||||||
|
Bizzdesign |
Netherlands |
1st Lien |
8.48% |
EURIBOR (Q) |
6.50 |
% |
10/2031 |
€ |
1,750 |
2,061 |
(e) |
||||||||||||||||||||||||||||||||||||
|
Bobcat Purchaser, |
1st Lien |
06/2030 |
— |
— |
(e)(g) |
||||||||||||||||||||||||||||||||||||||||||
|
Bobcat Purchaser, |
1st Lien |
9.05% |
SOFR (Q) |
4.75 |
% |
06/2030 |
2,910 |
2,910 |
(e)(f) |
||||||||||||||||||||||||||||||||||||||
|
Bobcat Purchaser, |
1st Lien |
9.05% |
SOFR (Q) |
4.75 |
% |
06/2030 |
986 |
986 |
(e)(f) |
||||||||||||||||||||||||||||||||||||||
|
Boost Newco |
1st Lien |
6.30% |
SOFR (Q) |
2.00 |
% |
01/2031 |
16,420 |
16,454 |
(f) |
||||||||||||||||||||||||||||||||||||||
|
Bottomline |
1st Lien |
05/2028 |
— |
— |
(e)(g) |
||||||||||||||||||||||||||||||||||||||||||
|
Bottomline |
1st Lien |
8.80% |
SOFR (Q) |
4.50 |
% |
05/2029 |
19,792 |
19,792 |
(e)(f) |
||||||||||||||||||||||||||||||||||||||
|
Businessolver.com, |
1st Lien |
9.87% |
SOFR (Q) |
5.50 |
% |
12/2027 |
4,163 |
4,163 |
(e)(f) |
||||||||||||||||||||||||||||||||||||||
Semi Annual Report 2025
62
CION Ares Diversified Credit Fund
Consolidated Schedule of Investments (continued)
June 30, 2025 (Unaudited)
(in thousands, except shares, percentages and as otherwise noted)
Senior Loans(b)(c)(d) (continued)
|
Company |
Country(a) |
Investment |
Coupon |
Reference |
Spread |
Acquisition |
Maturity |
Shares |
Principal |
Fair Value(a) |
% of Net |
||||||||||||||||||||||||||||||||||||
|
Businessolver.com, |
1st Lien |
9.87% |
SOFR (Q) |
5.50 |
% |
12/2027 |
$ |
505 |
$ |
505 |
(e)(g) |
||||||||||||||||||||||||||||||||||||
|
Calculus Acquico |
Luxembourg |
1st Lien |
10.77% |
SOFR (Q) |
6.50 |
% |
05/2032 |
600 |
600 |
(e) |
|||||||||||||||||||||||||||||||||||||
|
Calculus Acquico |
Luxembourg |
1st Lien |
8.60% |
EURIBOR (Q) |
6.50 |
% |
05/2032 |
€ |
1,234 |
1,454 |
(e) |
||||||||||||||||||||||||||||||||||||
|
Calculus Acquico |
Luxembourg |
1st Lien |
05/2032 |
— |
— |
(e)(g) |
|||||||||||||||||||||||||||||||||||||||||
|
Capnor Connery |
Denmark |
1st Lien |
9.10% |
STIBOR (M) |
6.75 |
% |
10/2030 |
DKK |
74,317 |
11,734 |
(e) |
||||||||||||||||||||||||||||||||||||
|
Capnor Connery |
Denmark |
1st Lien |
11.06% |
NIBOR (M) |
6.75 |
% |
10/2030 |
DKK |
74,170 |
11,710 |
(e)(g) |
||||||||||||||||||||||||||||||||||||
|
Cardinal Parent, |
1st Lien |
08/2027 |
— |
— |
(e)(g) |
||||||||||||||||||||||||||||||||||||||||||
|
Cardinal Parent, |
1st Lien |
8.95% |
SOFR (Q) |
4.50 |
% |
11/2027 |
4,299 |
4,170 |
(f) |
||||||||||||||||||||||||||||||||||||||
|
Cardinal Parent, |
2nd Lien |
12.19% |
SOFR (Q) |
7.75 |
% |
11/2028 |
10,547 |
10,336 |
(e)(f) |
||||||||||||||||||||||||||||||||||||||
|
CBTS BORROWER, |
1st Lien |
14.50% |
SOFR (Q) |
10.00 |
% |
12/2030 |
8,063 |
8,063 |
(e) |
||||||||||||||||||||||||||||||||||||||
|
CBTS BORROWER, |
1st Lien |
12/2030 |
— |
— |
(e)(g) |
||||||||||||||||||||||||||||||||||||||||||
|
CC Globe |
Denmark |
1st Lien |
03/2028 |
DKK |
22,527 |
2,499 |
(e)(f)(i) |
||||||||||||||||||||||||||||||||||||||||
|
CC Globe |
Denmark |
1st Lien |
03/2028 |
DKK |
20,339 |
2,256 |
(e)(i) |
||||||||||||||||||||||||||||||||||||||||
|
CC Globe |
Denmark |
1st Lien |
03/2028 |
DKK |
12,687 |
1,407 |
(e)(i) |
||||||||||||||||||||||||||||||||||||||||
|
Central Parent |
1st Lien |
7.55% |
SOFR (Q) |
3.25 |
% |
07/2029 |
12,777 |
10,638 |
|||||||||||||||||||||||||||||||||||||||
|
CentralSquare |
1st Lien |
04/2030 |
— |
— |
(e)(g) |
||||||||||||||||||||||||||||||||||||||||||
|
CentralSquare |
1st Lien |
10.32% |
SOFR (M) |
6.00 |
% |
04/2030 |
30,984 |
30,984 |
(e)(f) |
||||||||||||||||||||||||||||||||||||||
|
Cloud Software |
1st Lien |
09/2029 |
— |
— |
(e)(g) |
||||||||||||||||||||||||||||||||||||||||||
|
Cloud Software |
1st Lien |
7.80% |
SOFR (Q) |
3.50 |
% |
03/2029 |
43,497 |
43,526 |
(f) |
||||||||||||||||||||||||||||||||||||||
|
Cloud Software |
1st Lien |
8.05% |
SOFR (Q) |
3.75 |
% |
03/2031 |
25,468 |
25,505 |
(f) |
||||||||||||||||||||||||||||||||||||||
|
Cloud Software |
1st Lien |
9.00% |
09/2029 |
100 |
104 |
||||||||||||||||||||||||||||||||||||||||||
Semi Annual Report 2025
63
CION Ares Diversified Credit Fund
Consolidated Schedule of Investments (continued)
June 30, 2025 (Unaudited)
(in thousands, except shares, percentages and as otherwise noted)
Senior Loans(b)(c)(d) (continued)
|
Company |
Country(a) |
Investment |
Coupon |
Reference |
Spread |
Acquisition |
Maturity |
Shares |
Principal |
Fair Value(a) |
% of Net |
||||||||||||||||||||||||||||||||||||
|
Confirmasoft AB |
Sweden |
1st Lien |
9.09% |
CIBOR (Q) |
6.75 |
% |
06/2027 |
€ |
1,505 |
$ |
1,773 |
(e)(g) |
|||||||||||||||||||||||||||||||||||
|
Confirmasoft AB |
Sweden |
1st Lien |
8.71% |
EURIBOR (Q) |
6.75 |
% |
06/2027 |
€ |
1,995 |
2,350 |
(e)(f) |
||||||||||||||||||||||||||||||||||||
|
Confirmasoft AB |
Sweden |
1st Lien |
8.99% |
EURIBOR (Q) |
7.00 |
% |
06/2027 |
€ |
1,635 |
1,926 |
(e)(g) |
||||||||||||||||||||||||||||||||||||
|
Confirmasoft AB |
Sweden |
1st Lien |
06/2027 |
€ |
— |
— |
(e)(g)(h) |
||||||||||||||||||||||||||||||||||||||||
|
Conservice Midco, |
1st Lien |
7.33% |
SOFR (M) |
3.00 |
% |
05/2030 |
5,528 |
5,531 |
(f) |
||||||||||||||||||||||||||||||||||||||
|
Cority Software |
1st Lien |
9.05% |
SOFR (Q) |
4.75 |
% |
07/2026 |
2,599 |
2,599 |
(e)(f) |
||||||||||||||||||||||||||||||||||||||
|
Cority Software |
1st Lien |
07/2026 |
— |
— |
(e)(g) |
||||||||||||||||||||||||||||||||||||||||||
|
Cority Software |
1st Lien |
9.05% |
SOFR (Q) |
4.75 |
% |
07/2026 |
3,074 |
3,074 |
(e)(f) |
||||||||||||||||||||||||||||||||||||||
|
Cornerstone |
1st Lien |
7.44% |
SOFR (M) |
3.00 |
% |
10/2026 |
22 |
20 |
(e)(g) |
||||||||||||||||||||||||||||||||||||||
|
Cornerstone |
1st Lien |
8.19% |
SOFR (M) |
3.75 |
% |
10/2028 |
2,992 |
2,801 |
|||||||||||||||||||||||||||||||||||||||
|
Cornerstone |
2nd Lien |
10.94% |
SOFR (M) |
6.50 |
% |
10/2029 |
19,364 |
17,718 |
(e)(f) |
||||||||||||||||||||||||||||||||||||||
|
Coupa Holdings, |
1st Lien |
02/2029 |
— |
— |
(e)(g) |
||||||||||||||||||||||||||||||||||||||||||
|
Coupa Holdings, |
1st Lien |
9.53% |
SOFR (Q) |
5.25 |
% |
02/2030 |
226 |
226 |
(e) |
||||||||||||||||||||||||||||||||||||||
|
Coupa Holdings, |
1st Lien |
02/2030 |
— |
— |
(e)(g) |
||||||||||||||||||||||||||||||||||||||||||
|
Databricks, Inc. |
1st Lien |
8.83% |
SOFR (M) |
4.50 |
% |
01/2031 |
83 |
84 |
(e) |
||||||||||||||||||||||||||||||||||||||
|
Databricks, Inc. |
1st Lien |
01/2031 |
— |
— |
(e)(g) |
||||||||||||||||||||||||||||||||||||||||||
|
Datix Bidco |
United |
1st Lien |
9.56% |
SOFR (Q) |
5.25 |
% |
10/2030 |
313 |
313 |
(e)(g) |
|||||||||||||||||||||||||||||||||||||
|
Datix Bidco |
United |
1st Lien |
9.54% |
SOFR (S) |
5.25 |
% |
04/2031 |
5,965 |
5,965 |
(e) |
|||||||||||||||||||||||||||||||||||||
|
Datix Bidco |
United |
1st Lien |
9.48% |
SONIA (S) |
5.25 |
% |
04/2031 |
£ |
3,289 |
4,515 |
(e) |
||||||||||||||||||||||||||||||||||||
|
Datix Bidco |
United |
1st Lien |
04/2031 |
— |
— |
(e)(g) |
|||||||||||||||||||||||||||||||||||||||||
|
DCert Buyer, Inc. |
1st Lien |
8.33% |
SOFR (M) |
4.00 |
% |
10/2026 |
17,318 |
17,137 |
(f) |
||||||||||||||||||||||||||||||||||||||
Semi Annual Report 2025
64
CION Ares Diversified Credit Fund
Consolidated Schedule of Investments (continued)
June 30, 2025 (Unaudited)
(in thousands, except shares, percentages and as otherwise noted)
Senior Loans(b)(c)(d) (continued)
|
Company |
Country(a) |
Investment |
Coupon |
Reference |
Spread |
Acquisition |
Maturity |
Shares |
Principal |
Fair Value(a) |
% of Net |
||||||||||||||||||||||||||||||||||||
|
DCert Buyer, Inc. |
2nd Lien |
11.33% |
SOFR (M) |
7.00 |
% |
02/2029 |
$ |
7,288 |
$ |
6,305 |
(f) |
||||||||||||||||||||||||||||||||||||
|
DEDOMENA |
United |
1st Lien |
9.90% |
SONIA (M) |
5.50 |
% |
06/2032 |
£ |
706 |
969 |
(e) |
||||||||||||||||||||||||||||||||||||
|
DEDOMENA |
United |
1st Lien |
06/2032 |
£ |
— |
— |
(e)(g) |
||||||||||||||||||||||||||||||||||||||||
|
Denali Holdco LLC |
1st Lien |
09/2028 |
— |
— |
(e)(g) |
||||||||||||||||||||||||||||||||||||||||||
|
Denali Holdco LLC |
1st Lien |
9.07% |
SOFR (M) |
4.75 |
% |
09/2028 |
6,800 |
6,800 |
(e)(f) |
||||||||||||||||||||||||||||||||||||||
|
Denali Holdco LLC |
1st Lien |
09/2028 |
— |
— |
(e)(g) |
||||||||||||||||||||||||||||||||||||||||||
|
Diligent |
1st Lien |
9.33% |
SOFR (Q) |
5.00 |
% |
08/2030 |
50 |
50 |
(e)(g) |
||||||||||||||||||||||||||||||||||||||
|
Diligent |
1st Lien |
9.33% |
SOFR (Q) |
5.00 |
% |
08/2030 |
8,174 |
8,175 |
(e)(f) |
||||||||||||||||||||||||||||||||||||||
|
Diligent |
1st Lien |
08/2030 |
— |
— |
(e)(g) |
||||||||||||||||||||||||||||||||||||||||||
|
Doxim Inc. |
1st Lien |
12.43% |
SOFR (M) |
8.00 |
% |
05/2026 |
5,601 |
5,601 |
(e)(f) |
||||||||||||||||||||||||||||||||||||||
|
Doxim Inc. |
1st Lien |
11.43% |
SOFR (M) |
7.00 |
% |
05/2026 |
1,271 |
1,271 |
(e)(f) |
||||||||||||||||||||||||||||||||||||||
|
Doxim Inc. |
1st Lien |
11.18% |
SOFR (M) |
6.75 |
% |
05/2026 |
3,302 |
3,302 |
(e)(f) |
||||||||||||||||||||||||||||||||||||||
|
Doxim Inc. |
First Lien |
10.83% |
SOFR (M) |
6.40 |
% |
05/2026 |
707 |
707 |
(e)(f) |
||||||||||||||||||||||||||||||||||||||
|
Doxim Inc. |
First Lien |
10.83% |
SOFR (M) |
6.40 |
% |
05/2026 |
325 |
326 |
(e) |
||||||||||||||||||||||||||||||||||||||
|
Drivecentric |
1st Lien |
08/2031 |
— |
— |
(e)(g) |
||||||||||||||||||||||||||||||||||||||||||
|
Drivecentric |
1st Lien |
8.82% |
SOFR (Q) |
4.50 |
% |
08/2031 |
3,672 |
3,672 |
(e)(f) |
||||||||||||||||||||||||||||||||||||||
|
E2Open, LLC |
1st Lien |
7.94% |
SOFR (M) |
3.50 |
% |
02/2028 |
1,382 |
1,386 |
|||||||||||||||||||||||||||||||||||||||
|
Echo Purchaser, |
1st Lien |
11/2029 |
— |
— |
(e)(g) |
||||||||||||||||||||||||||||||||||||||||||
|
Echo Purchaser, |
1st Lien |
9.83% |
SOFR (M) |
5.50 |
% |
11/2029 |
1,817 |
1,817 |
(e)(f) |
||||||||||||||||||||||||||||||||||||||
|
Echo Purchaser, |
1st Lien |
9.83% |
SOFR (M) |
5.50 |
% |
11/2029 |
156 |
156 |
(e)(g) |
||||||||||||||||||||||||||||||||||||||
|
Eclipse Buyer, Inc. |
1st Lien |
09/2031 |
— |
— |
(e)(g) |
||||||||||||||||||||||||||||||||||||||||||
Semi Annual Report 2025
65
CION Ares Diversified Credit Fund
Consolidated Schedule of Investments (continued)
June 30, 2025 (Unaudited)
(in thousands, except shares, percentages and as otherwise noted)
Senior Loans(b)(c)(d) (continued)
|
Company |
Country(a) |
Investment |
Coupon |
Reference |
Spread |
Acquisition Date |
Maturity Date |
Shares |
Principal Amount(a) |
Fair Value(a) |
% of Net Assets |
||||||||||||||||||||||||||||||||||||
|
Eclipse Buyer, Inc. |
1st Lien Term Loan |
9.06% |
SOFR (M) |
4.75 |
% |
09/2031 |
$ |
45,019 |
$ |
45,019 |
(e)(f) |
||||||||||||||||||||||||||||||||||||
|
Eclipse Buyer, Inc. |
1st Lien Delay Draw Term Loan |
09/2031 |
— |
— |
(e)(g) |
||||||||||||||||||||||||||||||||||||||||||
|
Edmunds GovTech, Inc. |
1st Lien Revolving Loan |
8.05% |
SOFR (Q) |
3.75 |
% |
02/2030 |
32 |
32 |
(e)(g) |
||||||||||||||||||||||||||||||||||||||
|
Edmunds GovTech, Inc. |
1st Lien Revolving Loan |
02/2030 |
— |
— |
(e)(g) |
||||||||||||||||||||||||||||||||||||||||||
|
Edmunds GovTech, Inc. |
1st Lien Term Loan |
9.05% |
SOFR (Q) |
4.75 |
% |
02/2031 |
331 |
331 |
(e)(f) |
||||||||||||||||||||||||||||||||||||||
|
Edmunds GovTech, Inc. |
1st Lien Delay Draw Term Loan |
9.05% |
SOFR (Q) |
4.75 |
% |
02/2031 |
59 |
59 |
(e)(g) |
||||||||||||||||||||||||||||||||||||||
|
Einstein Parent, Inc. |
1st Lien Revolving Loan |
01/2031 |
— |
— |
(e)(g) |
||||||||||||||||||||||||||||||||||||||||||
|
Einstein Parent, Inc. |
1st Lien Term Loan |
10.77% |
SOFR (Q) |
6.50 |
% |
01/2031 |
5,031 |
4,931 |
(e)(f) |
||||||||||||||||||||||||||||||||||||||
|
Elemica Parent, Inc. |
1st Lien Revolving Loan |
9.96% |
SOFR (Q) |
5.50 |
% |
09/2026 |
1,267 |
1,255 |
(e)(g) |
||||||||||||||||||||||||||||||||||||||
|
Elemica Parent, Inc. |
1st Lien Term Loan |
9.92% |
SOFR (Q) |
5.50 |
% |
09/2026 |
2,727 |
2,699 |
(e)(f) |
||||||||||||||||||||||||||||||||||||||
|
Elemica Parent, Inc. |
1st Lien Term Loan |
9.91% |
SOFR (Q) |
5.50 |
% |
09/2026 |
841 |
833 |
(e)(f) |
||||||||||||||||||||||||||||||||||||||
|
Elemica Parent, Inc. |
1st Lien Term Loan |
9.97% |
SOFR (Q) |
5.50 |
% |
09/2026 |
1,331 |
1,318 |
(e)(f) |
||||||||||||||||||||||||||||||||||||||
|
Elemica Parent, Inc. |
1st Lien Delay Draw Term Loan |
9.92% |
SOFR (Q) |
5.50 |
% |
09/2026 |
535 |
529 |
(e)(f) |
||||||||||||||||||||||||||||||||||||||
|
Elemica Parent, Inc. |
1st Lien Delay Draw Term Loan |
9.91% |
SOFR (Q) |
5.50 |
% |
09/2026 |
2,180 |
2,158 |
(e)(f) |
||||||||||||||||||||||||||||||||||||||
|
Ellucian Holdings Inc. |
1st Lien Term Loan |
7.33% |
SOFR (M) |
3.00 |
% |
10/2029 |
9,827 |
9,846 |
(f) |
||||||||||||||||||||||||||||||||||||||
|
Enigma Acquisition B.V. |
Netherlands |
1st Lien Delay Draw Term Loan |
9.57% (2.19% PIK) |
EURIBOR (S) |
7.19 |
% |
01/2028 |
€ |
4,451 |
5,244 |
(e)(f) |
||||||||||||||||||||||||||||||||||||
|
Ensono, Inc. |
1st Lien Term Loan |
8.44% |
SOFR (M) |
4.00 |
% |
05/2028 |
23,218 |
23,195 |
(f) |
||||||||||||||||||||||||||||||||||||||
|
Ensono, Inc. |
1st Lien Term Loan |
05/2028 |
835 |
834 |
(e)(h) |
||||||||||||||||||||||||||||||||||||||||||
|
Enverus Holdings, Inc. |
1st Lien Revolving Loan |
9.82% |
SOFR (M) |
5.50 |
% |
12/2029 |
54 |
54 |
(e)(g) |
||||||||||||||||||||||||||||||||||||||
|
Enverus Holdings, Inc. |
1st Lien Revolving Loan |
9.82% |
SOFR (M) |
5.50 |
% |
12/2029 |
22 |
22 |
(e)(g) |
||||||||||||||||||||||||||||||||||||||
|
Enverus Holdings, Inc. |
1st Lien Term Loan |
9.83% |
SOFR (M) |
5.50 |
% |
12/2029 |
8,923 |
8,923 |
(e)(f) |
||||||||||||||||||||||||||||||||||||||
Semi Annual Report 2025
66
CION Ares Diversified Credit Fund
Consolidated Schedule of Investments (continued)
June 30, 2025 (Unaudited)
(in thousands, except shares, percentages and as otherwise noted)
Senior Loans(b)(c)(d) (continued)
|
Company |
Country(a) |
Investment |
Coupon |
Reference |
Spread |
Acquisition |
Maturity |
Shares |
Principal |
Fair Value(a) |
% of Net |
||||||||||||||||||||||||||||||||||||
|
Enverus Holdings, |
1st Lien |
12/2029 |
$ |
— |
$ |
— |
(e)(g) |
||||||||||||||||||||||||||||||||||||||||
|
Epicor Software |
1st Lien |
7.08% |
SOFR (M) |
2.75 |
% |
05/2031 |
15,996 |
16,028 |
(f) |
||||||||||||||||||||||||||||||||||||||
|
eResearchTechno |
1st Lien |
10/2031 |
— |
— |
(e)(g) |
||||||||||||||||||||||||||||||||||||||||||
|
eResearchTechno |
1st Lien |
9.08% |
SOFR (M) |
4.75 |
% |
01/2032 |
24,124 |
23,883 |
(e)(f) |
||||||||||||||||||||||||||||||||||||||
|
eResearchTechno |
1st Lien |
9.08% |
SOFR (M) |
4.75 |
% |
01/2032 |
4,643 |
4,599 |
(e)(g) |
||||||||||||||||||||||||||||||||||||||
|
ESHA Research, |
1st Lien |
9.71% |
SOFR (S) |
5.50 |
% |
06/2028 |
50 |
50 |
(e)(g) |
||||||||||||||||||||||||||||||||||||||
|
ESHA Research, |
1st Lien |
9.65% |
SOFR (S) |
5.50 |
% |
06/2028 |
473 |
472 |
(e)(f) |
||||||||||||||||||||||||||||||||||||||
|
ExtraHop |
1st Lien |
07/2027 |
— |
— |
(e)(g) |
||||||||||||||||||||||||||||||||||||||||||
|
ExtraHop |
1st Lien |
10.93% |
SOFR (M) |
6.50 |
% |
07/2027 |
2,647 |
2,647 |
(e) |
||||||||||||||||||||||||||||||||||||||
|
ExtraHop |
1st Lien |
10.93% |
SOFR (M) |
6.50 |
% |
07/2027 |
993 |
993 |
(e) |
||||||||||||||||||||||||||||||||||||||
|
Finastra USA, Inc. |
1st Lien |
09/2029 |
— |
— |
(e)(g) |
||||||||||||||||||||||||||||||||||||||||||
|
Finastra USA, Inc. |
1st Lien |
11.57% |
SOFR (Q) |
7.25 |
% |
09/2029 |
18,671 |
18,671 |
(e)(f) |
||||||||||||||||||||||||||||||||||||||
|
Flash Charm, Inc. |
1st Lien |
7.78% |
SOFR (Q) |
3.50 |
% |
03/2028 |
7,824 |
7,315 |
(f) |
||||||||||||||||||||||||||||||||||||||
|
Flexential Topco |
1st Lien |
12.00% |
08/2027 |
3,000 |
3,000 |
(e)(g) |
|||||||||||||||||||||||||||||||||||||||||
|
GHP-VGS |
1st Lien |
04/2032 |
— |
— |
(e)(g) |
||||||||||||||||||||||||||||||||||||||||||
|
GHP-VGS |
1st Lien |
9.43% |
SOFR (S) |
4.75 |
% |
04/2032 |
1,981 |
1,961 |
(e)(f) |
||||||||||||||||||||||||||||||||||||||
|
GHP-VGS |
1st Lien |
04/2032 |
— |
— |
(e)(g) |
||||||||||||||||||||||||||||||||||||||||||
|
Gilfoyle Bidco AB |
Sweden |
1st Lien |
09/2028 |
SEK |
73,292 |
6,228 |
(e)(i) |
||||||||||||||||||||||||||||||||||||||||
|
Gilfoyle Bidco AB |
Sweden |
1st Lien |
09/2028 |
SEK |
12,446 |
1,058 |
(e)(i) |
||||||||||||||||||||||||||||||||||||||||
|
Goldeneye Parent, |
1st Lien |
03/2032 |
— |
— |
(e)(g) |
||||||||||||||||||||||||||||||||||||||||||
|
Goldeneye Parent, |
1st Lien |
9.30% |
SOFR (Q) |
5.00 |
% |
03/2032 |
2,473 |
2,461 |
(e)(f) |
||||||||||||||||||||||||||||||||||||||
Semi Annual Report 2025
67
CION Ares Diversified Credit Fund
Consolidated Schedule of Investments (continued)
June 30, 2025 (Unaudited)
(in thousands, except shares, percentages and as otherwise noted)
Senior Loans(b)(c)(d) (continued)
|
Company |
Country(a) |
Investment |
Coupon |
Reference |
Spread |
Acquisition Date |
Maturity Date |
Shares |
Principal Amount(a) |
Fair Value(a) |
% of Net Assets |
||||||||||||||||||||||||||||||||||||
|
Granite France Bidco SAS |
France |
1st Lien Term Loan |
7.01% | EURIBOR (Q) |
4.98 |
% |
10/2028 |
€ |
4,637 |
$ |
5,312 |
||||||||||||||||||||||||||||||||||||
|
GraphPAD Software, LLC |
1st Lien Revolving Loan |
06/2031 |
— |
— |
(e)(g) |
||||||||||||||||||||||||||||||||||||||||||
|
GraphPAD Software, LLC |
1st Lien Term Loan |
9.08% |
SOFR (M) |
4.75 |
% |
06/2031 |
17,414 |
17,415 |
(e)(f) |
||||||||||||||||||||||||||||||||||||||
|
GraphPAD Software, LLC |
1st Lien Delay Draw Term Loan |
11.25% |
PRIME (Q) |
3.75 |
% |
06/2031 |
435 |
435 |
(e)(g) |
||||||||||||||||||||||||||||||||||||||
|
Guidepoint Security Holdings, LLC |
1st Lien Revolving Loan |
10/2029 |
— |
— |
(e)(g) |
||||||||||||||||||||||||||||||||||||||||||
|
Guidepoint Security Holdings, LLC |
1st Lien Term Loan |
9.58% |
SOFR (M) |
5.25 |
% |
10/2029 |
1,527 |
1,527 |
(e)(f) |
||||||||||||||||||||||||||||||||||||||
|
Guidepoint Security Holdings, LLC |
1st Lien Delay Draw Term Loan |
10/2029 |
— |
— |
(e)(g) |
||||||||||||||||||||||||||||||||||||||||||
|
Hakken Bidco B.V. |
Netherlands |
1st Lien Term Loan |
9.76% | EURIBOR (S) |
7.25 |
% |
07/2030 |
€ |
3,060 |
3,533 |
(e) |
||||||||||||||||||||||||||||||||||||
|
Hakken Bidco B.V. |
Netherlands |
1st Lien Delay Draw Term Loan |
9.76% | EURIBOR (Q) |
7.25 |
% |
07/2030 |
€ |
596 |
688 |
(e)(g) |
||||||||||||||||||||||||||||||||||||
|
Heavy Construction Systems Specialists, LLC |
1st Lien Revolving Loan |
11/2027 |
— |
— |
(e)(g) |
||||||||||||||||||||||||||||||||||||||||||
|
Heavy Construction Systems Specialists, LLC |
1st Lien Term Loan |
9.05% |
SOFR (Q) |
4.75 |
% |
11/2028 |
4,053 |
4,053 |
(e)(f) |
||||||||||||||||||||||||||||||||||||||
|
Heavy Construction Systems Specialists, LLC |
1st Lien Term Loan |
9.55% |
SOFR (Q) |
5.25 |
% |
11/2028 |
2,909 |
2,910 |
(e)(f) |
||||||||||||||||||||||||||||||||||||||
|
Help/Systems Holdings, Inc. |
1st Lien Term Loan |
8.38% |
SOFR (Q) |
4.00 |
% |
11/2026 |
15,484 |
14,710 |
(f) |
||||||||||||||||||||||||||||||||||||||
|
Hyland Software, Inc. |
1st Lien Revolving Loan |
09/2029 |
— |
— |
(e)(g) |
||||||||||||||||||||||||||||||||||||||||||
|
Hyland Software, Inc. |
1st Lien Term Loan |
9.33% |
SOFR (M) |
5.00 |
% |
09/2030 |
9,537 |
9,537 |
(e)(f) |
||||||||||||||||||||||||||||||||||||||
|
Icefall Parent, Inc. |
1st Lien Revolving Loan |
01/2030 |
— |
— |
(e)(g) |
||||||||||||||||||||||||||||||||||||||||||
|
Icefall Parent, Inc. |
1st Lien Term Loan |
10.03% |
SOFR (Q) |
5.75 |
% |
01/2030 |
2,328 |
2,328 |
(e)(f) |
||||||||||||||||||||||||||||||||||||||
|
ID.me, LLC |
1st Lien Revolving Loan |
10.00% |
01/2031 |
2,309 |
2,262 |
(e)(g) |
|||||||||||||||||||||||||||||||||||||||||
|
ID.me, LLC |
1st Lien Term Loan |
10.25% (5.25% PIK) |
01/2031 |
18,655 |
16,603 |
(e) |
|||||||||||||||||||||||||||||||||||||||||
Semi Annual Report 2025
68
CION Ares Diversified Credit Fund
Consolidated Schedule of Investments (continued)
June 30, 2025 (Unaudited)
(in thousands, except shares, percentages and as otherwise noted)
Senior Loans(b)(c)(d) (continued)
|
Company |
Country(a) |
Investment |
Coupon |
Reference |
Spread |
Acquisition |
Maturity |
Shares |
Principal |
Fair Value(a) |
% of Net |
||||||||||||||||||||||||||||||||||||
|
ID.me, LLC |
1st Lien |
01/2031 |
$ |
— |
$ |
— |
(e)(g) |
||||||||||||||||||||||||||||||||||||||||
|
Idemia Group |
France |
1st Lien |
5.98% |
EURIBOR (Q) |
4.00 |
% |
09/2028 |
€ |
7,000 |
8,227 |
|||||||||||||||||||||||||||||||||||||
|
Internet Truckstop |
1st Lien |
04/2027 |
— |
— |
(e)(g) |
||||||||||||||||||||||||||||||||||||||||||
|
Internet Truckstop |
1st Lien |
9.70% |
SOFR (Q) |
5.25 |
% |
04/2027 |
2,328 |
2,328 |
(e)(f) |
||||||||||||||||||||||||||||||||||||||
|
IQN Holding Corp. |
1st Lien |
9.58% |
SOFR (Q) |
5.25 |
% |
05/2028 |
461 |
461 |
(e)(g) |
||||||||||||||||||||||||||||||||||||||
|
IQN Holding Corp. |
1st Lien |
10.08% |
SOFR (Q) |
5.75 |
% |
05/2029 |
6,686 |
6,686 |
(e)(f) |
||||||||||||||||||||||||||||||||||||||
|
Ivanti Software, |
1st Lien |
12/2025 |
— |
— |
(g) |
||||||||||||||||||||||||||||||||||||||||||
|
JAMS Buyer LLC |
1st Lien |
06/2031 |
— |
— |
(e)(g) |
||||||||||||||||||||||||||||||||||||||||||
|
JAMS Buyer LLC |
1st Lien |
9.83% |
SOFR (Q) |
5.50 |
% |
06/2032 |
2,001 |
1,971 |
(e)(f) |
||||||||||||||||||||||||||||||||||||||
|
JAMS Buyer LLC |
1st Lien |
06/2032 |
— |
— |
(e)(g) |
||||||||||||||||||||||||||||||||||||||||||
|
Kaseya Inc. |
1st Lien |
7.58% |
SOFR (M) |
3.25 |
% |
03/2032 |
3,017 |
3,028 |
|||||||||||||||||||||||||||||||||||||||
|
Kaseya Inc. |
2nd Lien |
9.33% |
SOFR (M) |
5.00 |
% |
03/2033 |
44,975 |
44,989 |
|||||||||||||||||||||||||||||||||||||||
|
LeanTaaS |
1st Lien |
11.80% |
SOFR (Q) |
7.50 |
% |
07/2028 |
2,635 |
2,634 |
(e)(f) |
||||||||||||||||||||||||||||||||||||||
|
LeanTaaS |
1st Lien |
11.80% |
SOFR (Q) |
7.50 |
% |
07/2028 |
3,505 |
3,505 |
(e)(f)(g) |
||||||||||||||||||||||||||||||||||||||
|
LeanTaaS |
1st Lien |
07/2028 |
— |
— |
(e)(g) |
||||||||||||||||||||||||||||||||||||||||||
|
Leia Finco US LLC |
2nd Lien |
9.46% |
SOFR (Q) |
5.25 |
% |
10/2032 |
7,508 |
7,439 |
|||||||||||||||||||||||||||||||||||||||
|
Magellan Bidco |
France |
1st Lien |
8.37% |
EURIBOR (S) |
6.25 |
% |
10/2031 |
€ |
833 |
982 |
(e) |
||||||||||||||||||||||||||||||||||||
|
Magellan Bidco |
France |
1st Lien |
10/2031 |
€ |
— |
— |
(e)(g)(h) |
||||||||||||||||||||||||||||||||||||||||
|
Majesco |
1st Lien |
09/2027 |
— |
— |
(e)(g) |
||||||||||||||||||||||||||||||||||||||||||
|
Majesco |
1st Lien |
9.05% |
SOFR (Q) |
4.75 |
% |
09/2028 |
9,525 |
9,525 |
(e)(f) |
||||||||||||||||||||||||||||||||||||||
|
Maltese Bidco 1 |
United |
1st Lien |
8.91% |
EURIBOR (S) |
6.75 |
% |
02/2029 |
€ |
3,600 |
4,240 |
(e)(f) |
||||||||||||||||||||||||||||||||||||
Semi Annual Report 2025
69
CION Ares Diversified Credit Fund
Consolidated Schedule of Investments (continued)
June 30, 2025 (Unaudited)
(in thousands, except shares, percentages and as otherwise noted)
Senior Loans(b)(c)(d) (continued)
|
Company |
Country(a) |
Investment |
Coupon |
Reference |
Spread |
Acquisition Date |
Maturity Date |
Shares |
Principal Amount(a) |
Fair Value(a) |
% of Net Assets |
||||||||||||||||||||||||||||||||||||
|
Maltese Bidco 1 Limited |
United Kingdom |
1st Lien Term Loan |
8.91% | EURIBOR (S) |
6.75% |
02/2029 |
£ |
1,543 |
$ |
2,118 |
(e) |
||||||||||||||||||||||||||||||||||||
|
Metatiedot Bidco Oy |
Luxembourg |
1st Lien Revolving Loan |
11/2030 |
€ |
— |
— |
(e)(g) |
||||||||||||||||||||||||||||||||||||||||
|
Metatiedot Bidco Oy |
Luxembourg |
1st Lien Term Loan |
7.26% | EURIBOR (Q) |
5.25% |
11/2031 |
€ |
2,757 |
3,248 |
(e)(f) |
|||||||||||||||||||||||||||||||||||||
|
Metatiedot Bidco Oy |
Luxembourg |
1st Lien Term Loan |
9.58% |
SOFR (Q) |
5.25% |
11/2031 |
2,065 |
2,066 |
(e)(f) |
||||||||||||||||||||||||||||||||||||||
|
Metatiedot Bidco Oy |
Luxembourg |
1st Lien Delay Draw Term Loan |
7.26% | EURIBOR (Q) |
5.25% |
11/2031 |
€ |
22 |
26 |
(e)(g) |
|||||||||||||||||||||||||||||||||||||
|
Mimecast Borrowerco, Inc. |
1st Lien Term Loan |
8.83% |
SOFR (M) |
4.50% |
05/2029 |
37,508 |
37,508 |
(e)(f) |
|||||||||||||||||||||||||||||||||||||||
|
Mimecast Borrowerco, Inc. |
1st Lien Term Loan |
8.72% |
SONIA (Q) |
4.50% |
05/2029 |
£ |
6,859 |
9,415 |
(e)(f) |
||||||||||||||||||||||||||||||||||||||
|
Mimecast Borrowerco, Inc. |
1st Lien Delay Draw Term Loan |
8.83% |
SOFR (M) |
4.50% |
05/2029 |
4,206 |
4,206 |
(e)(f) |
|||||||||||||||||||||||||||||||||||||||
|
Mitchell International, Inc. |
1st Lien Term Loan |
7.58% |
SOFR (M) |
3.25% |
06/2031 |
2,072 |
2,069 |
(f) |
|||||||||||||||||||||||||||||||||||||||
|
Mitchell International, Inc. |
2nd Lien Term Loan |
9.58% |
SOFR (M) |
5.25% |
06/2032 |
18,270 |
17,899 |
||||||||||||||||||||||||||||||||||||||||
|
Modernizing Medicine, Inc. |
1st Lien Revolving Loan |
04/2032 |
— |
— |
(e)(g) |
||||||||||||||||||||||||||||||||||||||||||
|
Modernizing Medicine, Inc. |
1st Lien Term Loan |
9.55% (2.75% PIK) |
SOFR (Q) |
5.25% |
04/2032 |
22,505 |
22,280 |
(e)(f) |
|||||||||||||||||||||||||||||||||||||||
|
MRI Software LLC |
1st Lien Revolving Loan |
9.05% |
SOFR (Q) |
4.75% |
02/2027 |
30 |
30 |
(e)(g) |
|||||||||||||||||||||||||||||||||||||||
|
MRI Software LLC |
1st Lien Term Loan |
9.05% |
SOFR (Q) |
4.75% |
02/2027 |
10,038 |
10,038 |
(e)(f) |
|||||||||||||||||||||||||||||||||||||||
|
Netsmart Technologies, Inc. |
1st Lien Revolving Loan |
08/2031 |
— |
— |
(e)(g) |
||||||||||||||||||||||||||||||||||||||||||
|
Netsmart Technologies, Inc. |
1st Lien Term Loan |
9.28% (2.45% PIK) |
SOFR (M) |
4.95% |
08/2031 |
34,218 |
34,218 |
(e)(f) |
|||||||||||||||||||||||||||||||||||||||
|
Netsmart Technologies, Inc. |
1st Lien Delay Draw Term Loan |
08/2031 |
— |
— |
(e)(g) |
||||||||||||||||||||||||||||||||||||||||||
|
North Star Acquisitionco, LLC |
1st Lien Revolving Loan |
05/2029 |
— |
— |
(e)(g) |
||||||||||||||||||||||||||||||||||||||||||
|
North Star Acquisitionco, LLC |
1st Lien Term Loan |
8.80% |
SOFR (Q) |
4.50% |
05/2029 |
2,121 |
2,121 |
(e) |
|||||||||||||||||||||||||||||||||||||||
|
North Star Acquisitionco, LLC |
1st Lien Term Loan |
8.72% |
SONIA (Q) |
4.50% |
05/2029 |
£ |
239 |
329 |
(e) |
||||||||||||||||||||||||||||||||||||||
|
North Star Acquisitionco, LLC |
1st Lien Term Loan |
8.86% |
NIBOR (Q) |
4.50% |
05/2029 |
NOK |
5,242 |
520 |
(e) |
||||||||||||||||||||||||||||||||||||||
Semi Annual Report 2025
70
CION Ares Diversified Credit Fund
Consolidated Schedule of Investments (continued)
June 30, 2025 (Unaudited)
(in thousands, except shares, percentages and as otherwise noted)
Senior Loans(b)(c)(d) (continued)
|
Company |
Country(a) |
Investment |
Coupon |
Reference |
Spread |
Acquisition Date |
Maturity Date |
Shares |
Principal Amount(a) |
Fair Value(a) |
% of Net Assets |
||||||||||||||||||||||||||||||||||||
|
North Star Acquisitionco, LLC |
1st Lien Delay Draw Term Loan |
8.91% |
SONIA (Q) |
4.75 |
% |
05/2029 |
$ |
468 |
$ |
468 |
(e)(g) |
||||||||||||||||||||||||||||||||||||
|
OID-OL Intermediate I, LLC |
1st Lien Term Loan |
10.33% |
SOFR (S) |
6.00 |
% |
02/2029 |
1,626 |
1,671 |
|||||||||||||||||||||||||||||||||||||||
|
OID-OL Intermediate I, LLC |
1st Lien Term Loan |
8.73% |
SOFR (S) |
4.25 |
% |
02/2029 |
7,782 |
6,488 |
|||||||||||||||||||||||||||||||||||||||
|
ParentPay Group Limited |
United Kingdom |
1st Lien Term Loan |
11.33% |
SONIA (Q) |
6.72 |
% |
06/2028 |
£ |
5,529 |
7,589 |
(e)(f) |
||||||||||||||||||||||||||||||||||||
|
ParentPay Group Limited |
United Kingdom |
1st Lien Delay Draw Term Loan |
11.05% |
SONIA (Q) |
6.72 |
% |
06/2028 |
£ |
1,464 |
2,009 |
(e) |
||||||||||||||||||||||||||||||||||||
|
PCMI Parent, LLC |
1st Lien Revolving Loan |
03/2032 |
— |
— |
(e)(g) |
||||||||||||||||||||||||||||||||||||||||||
|
PCMI Parent, LLC |
1st Lien Term Loan |
9.82% |
SOFR (Q) |
5.50 |
% |
03/2032 |
3,025 |
3,010 |
(e)(f) |
||||||||||||||||||||||||||||||||||||||
|
PDDS Holdco, Inc. |
1st Lien Revolving Loan |
11.95% |
SOFR (Q) |
7.50 |
% |
07/2028 |
17 |
18 |
(e)(g) |
||||||||||||||||||||||||||||||||||||||
|
PDDS Holdco, Inc. |
1st Lien Term Loan |
11.95% |
SOFR (Q) |
7.50 |
% |
07/2028 |
733 |
733 |
(e) |
||||||||||||||||||||||||||||||||||||||
|
PDDS Holdco, Inc. |
1st Lien Delay Draw Term Loan |
11.95% |
SOFR (Q) |
7.50 |
% |
07/2028 |
459 |
458 |
(e)(g) |
||||||||||||||||||||||||||||||||||||||
|
PDI TA Holdings, Inc. |
1st Lien Revolving Loan |
9.78% |
SOFR (Q) |
5.50 |
% |
02/2031 |
74 |
74 |
(e)(g) |
||||||||||||||||||||||||||||||||||||||
|
PDI TA Holdings, Inc. |
1st Lien Term Loan |
9.78% |
SOFR (Q) |
5.50 |
% |
02/2031 |
2,350 |
2,350 |
(e)(f) |
||||||||||||||||||||||||||||||||||||||
|
PDI TA Holdings, Inc. |
1st Lien Delay Draw Term Loan |
9.78% |
SOFR (Q) |
5.50 |
% |
02/2031 |
210 |
210 |
(e) |
||||||||||||||||||||||||||||||||||||||
|
Pluralsight, LLC |
1st Lien Revolving Loan |
08/2029 |
— |
— |
(e)(g) |
||||||||||||||||||||||||||||||||||||||||||
|
Pluralsight, LLC |
1st Lien Term Loan |
8.83% (1.50% PIK) |
SOFR (Q) |
4.50 |
% |
08/2029 |
3,209 |
3,209 |
(e) |
||||||||||||||||||||||||||||||||||||||
|
Pluralsight, LLC |
1st Lien Term Loan |
11.83% PIK |
SOFR (Q) |
7.50 |
% |
08/2029 |
3,479 |
3,479 |
(e) |
||||||||||||||||||||||||||||||||||||||
|
Pluralsight, LLC |
1st Lien Delay Draw Term Loan |
08/2029 |
— |
— |
(e)(g) |
||||||||||||||||||||||||||||||||||||||||||
|
Polaris Newco, LLC |
1st Lien Term Loan |
8.29% |
SOFR (Q) |
3.75 |
% |
06/2028 |
10,206 |
9,936 |
(f) |
||||||||||||||||||||||||||||||||||||||
|
Poseidon Intermediateco, Inc. |
1st Lien Revolving Loan |
06/2031 |
— |
— |
(e)(g) |
||||||||||||||||||||||||||||||||||||||||||
|
Poseidon Intermediateco, Inc. |
1st Lien Term Loan |
8.81% |
SOFR (M) |
4.50 |
% |
06/2032 |
1,032 |
1,026 |
(e)(f) |
||||||||||||||||||||||||||||||||||||||
Semi Annual Report 2025
71
CION Ares Diversified Credit Fund
Consolidated Schedule of Investments (continued)
June 30, 2025 (Unaudited)
(in thousands, except shares, percentages and as otherwise noted)
Senior Loans(b)(c)(d) (continued)
|
Company |
Country(a) |
Investment |
Coupon |
Reference |
Spread |
Acquisition |
Maturity |
Shares |
Principal |
Fair Value(a) |
% of Net |
||||||||||||||||||||||||||||||||||||
|
Poseidon |
1st Lien |
06/2032 |
$ |
— |
$ |
— |
(e)(g) |
||||||||||||||||||||||||||||||||||||||||
|
PracticeTek |
1st Lien |
8.78% |
SOFR (Q) |
4.50 |
% |
08/2029 |
1 |
— |
(e)(g) |
||||||||||||||||||||||||||||||||||||||
|
PracticeTek |
1st Lien |
10.03% |
SOFR (Q) |
5.75 |
% |
08/2029 |
7,483 |
7,483 |
(e)(f) |
||||||||||||||||||||||||||||||||||||||
|
PracticeTek |
1st Lien |
10.03% |
SOFR (Q) |
5.75 |
% |
08/2029 |
108 |
108 |
(e)(g) |
||||||||||||||||||||||||||||||||||||||
|
Precisely Software |
1st Lien |
8.54% |
SOFR (Q) |
4.00 |
% |
04/2028 |
13,061 |
12,359 |
(f) |
||||||||||||||||||||||||||||||||||||||
|
Project Boost |
1st Lien |
7.30% |
SOFR (Q) |
3.00 |
% |
07/2031 |
27,931 |
27,966 |
(f) |
||||||||||||||||||||||||||||||||||||||
|
Project Boost |
2nd Lien |
9.55% |
SOFR (Q) |
5.25 |
% |
07/2032 |
676 |
680 |
|||||||||||||||||||||||||||||||||||||||
|
Proofpoint, Inc. |
1st Lien |
08/2026 |
— |
— |
(e)(g) |
||||||||||||||||||||||||||||||||||||||||||
|
Proofpoint, Inc. |
1st Lien |
7.33% |
SOFR (M) |
3.00 |
% |
08/2028 |
35,473 |
35,477 |
(f) |
||||||||||||||||||||||||||||||||||||||
|
Proofpoint, Inc. |
1st Lien |
08/2028 |
2,742 |
2,743 |
(f)(h) |
||||||||||||||||||||||||||||||||||||||||||
|
QBS Parent, Inc. |
1st Lien |
06/2032 |
— |
— |
(e)(g) |
||||||||||||||||||||||||||||||||||||||||||
|
QBS Parent, Inc. |
1st Lien |
8.80% |
SOFR (Q) |
4.50 |
% |
06/2032 |
4,800 |
4,776 |
(e)(f) |
||||||||||||||||||||||||||||||||||||||
|
QF Holdings, Inc. |
1st Lien |
9.08% |
SOFR (Q) |
4.75 |
% |
12/2027 |
21 |
21 |
(e)(g) |
||||||||||||||||||||||||||||||||||||||
|
QF Holdings, Inc. |
1st Lien |
9.03% |
SOFR (Q) |
4.75 |
% |
12/2027 |
3,793 |
3,793 |
(e)(f) |
||||||||||||||||||||||||||||||||||||||
|
QF Holdings, Inc. |
1st Lien |
9.08% |
SOFR (Q) |
4.75 |
% |
12/2027 |
391 |
391 |
(e)(f) |
||||||||||||||||||||||||||||||||||||||
|
QF Holdings, Inc. |
1st Lien |
9.13% |
SOFR (Q) |
4.75 |
% |
12/2027 |
371 |
371 |
(e)(f) |
||||||||||||||||||||||||||||||||||||||
|
QF Holdings, Inc. |
1st Lien |
9.03% |
SOFR (Q) |
4.75 |
% |
12/2027 |
261 |
262 |
(e)(f) |
||||||||||||||||||||||||||||||||||||||
|
QF Holdings, Inc. |
1st Lien |
9.04% |
SOFR (Q) |
4.75 |
% |
12/2027 |
261 |
261 |
(e)(f) |
||||||||||||||||||||||||||||||||||||||
|
Raptor |
1st Lien |
9.02% |
SOFR (Q) |
4.75 |
% |
10/2027 |
720 |
720 |
(e)(g) |
||||||||||||||||||||||||||||||||||||||
|
Raptor |
1st Lien |
9.05% |
SOFR (Q) |
4.75 |
% |
10/2028 |
14,841 |
14,841 |
(e)(f) |
||||||||||||||||||||||||||||||||||||||
Semi Annual Report 2025
72
CION Ares Diversified Credit Fund
Consolidated Schedule of Investments (continued)
June 30, 2025 (Unaudited)
(in thousands, except shares, percentages and as otherwise noted)
Senior Loans(b)(c)(d) (continued)
|
Company |
Country(a) |
Investment |
Coupon |
Reference |
Spread |
Acquisition Date |
Maturity Date |
Shares |
Principal Amount(a) |
Fair Value(a) |
% of Net Assets |
||||||||||||||||||||||||||||||||||||
|
Relativity ODA LLC |
1st Lien Revolving Loan |
05/2029 |
$ |
— |
$ |
— |
(e)(g) |
||||||||||||||||||||||||||||||||||||||||
|
Relativity ODA LLC |
1st Lien Term Loan |
8.83% |
SOFR (M) |
4.50 |
% |
05/2029 |
9,193 |
9,193 |
(e)(f) |
||||||||||||||||||||||||||||||||||||||
|
Revalize, Inc. |
1st Lien Revolving Loan |
10.20% |
SOFR (Q) |
5.75 |
% |
04/2027 |
182 |
154 |
(e)(g) |
||||||||||||||||||||||||||||||||||||||
|
Revalize, Inc. |
1st Lien Delay Draw Term Loan |
10.19% |
SOFR (Q) |
5.75 |
% |
04/2027 |
2,670 |
2,269 |
(e) |
||||||||||||||||||||||||||||||||||||||
|
Revalize, Inc. |
1st Lien Delay Draw Term Loan |
10.19% |
SOFR (M) |
5.75 |
% |
04/2027 |
202 |
172 |
(e) |
||||||||||||||||||||||||||||||||||||||
|
RMS Holdco II, LLC |
1st Lien Revolving Loan |
12/2028 |
— |
— |
(e)(g) |
||||||||||||||||||||||||||||||||||||||||||
|
RMS Holdco II, LLC |
1st Lien Term Loan |
9.28% |
SOFR (Q) |
5.00 |
% |
12/2028 |
5,782 |
5,435 |
(e)(f) |
||||||||||||||||||||||||||||||||||||||
|
Runway Bidco, LLC |
1st Lien Revolving Loan |
12/2031 |
— |
— |
(e)(g) |
||||||||||||||||||||||||||||||||||||||||||
|
Runway Bidco, LLC |
1st Lien Term Loan |
9.30% |
SOFR (Q) |
5.00 |
% |
12/2031 |
1,037 |
1,027 |
(e)(f) |
||||||||||||||||||||||||||||||||||||||
|
Runway Bidco, LLC |
1st Lien Delay Draw Term Loan |
12/2031 |
— |
— |
(e)(g) |
||||||||||||||||||||||||||||||||||||||||||
|
Sapphire Software Buyer, Inc. |
1st Lien Revolving Loan |
09/2031 |
— |
— |
(e)(g) |
||||||||||||||||||||||||||||||||||||||||||
|
Sapphire Software Buyer, Inc. |
1st Lien Term Loan |
9.22% |
SOFR (S) |
5.00 |
% |
09/2031 |
10,402 |
10,402 |
(e)(f) |
||||||||||||||||||||||||||||||||||||||
|
Sedgwick Claims Management Services, Inc. (Lightning Cayman Merger Sub, Ltd.) |
1st Lien Term Loan |
7.33% |
SOFR (M) |
3.00 |
% |
07/2031 |
23,487 |
23,560 |
(f) |
||||||||||||||||||||||||||||||||||||||
|
Severin Acquisition, LLC |
1st Lien Revolving Loan |
9.08% |
SOFR (M) |
4.75 |
% |
10/2031 |
2,499 |
2,474 |
(e)(g) |
||||||||||||||||||||||||||||||||||||||
|
Severin Acquisition, LLC |
1st Lien Term Loan |
9.33% (2.25% PIK) |
SOFR (M) |
5.00 |
% |
10/2031 |
44,011 |
43,571 |
(e)(f) |
||||||||||||||||||||||||||||||||||||||
|
Severin Acquisition, LLC |
1st Lien Delay Draw Term Loan |
9.33% (2.25% PIK) |
SOFR (M) |
5.00 |
% |
10/2031 |
1,208 |
1,195 |
(e)(g) |
||||||||||||||||||||||||||||||||||||||
|
Smarsh Inc. |
1st Lien Revolving Loan |
9.05% |
SOFR (Q) |
4.75 |
% |
02/2029 |
290 |
290 |
(e)(g) |
||||||||||||||||||||||||||||||||||||||
|
Smarsh Inc. |
1st Lien Term Loan |
9.05% |
SOFR (Q) |
4.75 |
% |
02/2029 |
4,682 |
4,682 |
(e)(f) |
||||||||||||||||||||||||||||||||||||||
|
Smarsh Inc. |
1st Lien Delay Draw Term Loan |
02/2029 |
— |
— |
(e)(g) |
||||||||||||||||||||||||||||||||||||||||||
Semi Annual Report 2025
73
CION Ares Diversified Credit Fund
Consolidated Schedule of Investments (continued)
June 30, 2025 (Unaudited)
(in thousands, except shares, percentages and as otherwise noted)
Senior Loans(b)(c)(d) (continued)
|
Company |
Country(a) |
Investment |
Coupon |
Reference |
Spread |
Acquisition |
Maturity |
Shares |
Principal |
Fair Value(a) |
% of Net |
||||||||||||||||||||||||||||||||||||
|
Smarsh Inc. |
1st Lien |
02/2029 |
$ |
— |
$ |
— |
(e)(g) |
||||||||||||||||||||||||||||||||||||||||
|
Spaceship |
1st Lien |
10/2031 |
— |
— |
(e)(g) |
||||||||||||||||||||||||||||||||||||||||||
|
Spaceship |
1st Lien |
9.30% |
SOFR (Q) |
5.00 |
% |
10/2031 |
21,671 |
21,671 |
(e)(f) |
||||||||||||||||||||||||||||||||||||||
|
Spaceship |
1st Lien |
10/2031 |
— |
— |
(e)(g) |
||||||||||||||||||||||||||||||||||||||||||
|
Spaceship |
1st Lien |
10/2031 |
— |
— |
(e)(g) |
||||||||||||||||||||||||||||||||||||||||||
|
Spark Purchaser, |
1st Lien |
04/2030 |
— |
— |
(e)(g) |
||||||||||||||||||||||||||||||||||||||||||
|
Spark Purchaser, |
1st Lien |
9.80% |
SOFR (Q) |
5.50 |
% |
04/2031 |
1,293 |
1,293 |
(e) |
||||||||||||||||||||||||||||||||||||||
|
Sundance Group |
1st Lien |
8.80% |
SOFR (Q) |
4.50 |
% |
07/2029 |
— |
1 |
(e)(g) |
||||||||||||||||||||||||||||||||||||||
|
Sundance Group |
1st Lien |
8.80% |
SOFR (Q) |
4.50 |
% |
07/2029 |
2,566 |
2,566 |
(e)(f) |
||||||||||||||||||||||||||||||||||||||
|
Superman |
1st Lien |
08/2031 |
— |
— |
(e)(g) |
||||||||||||||||||||||||||||||||||||||||||
|
Superman |
1st Lien |
8.80% |
SOFR (Q) |
4.50 |
% |
08/2031 |
8,691 |
8,691 |
(e)(f) |
||||||||||||||||||||||||||||||||||||||
|
Superman |
1st Lien |
8.80% |
SOFR (Q) |
4.50 |
% |
08/2031 |
1,811 |
1,811 |
(e)(g) |
||||||||||||||||||||||||||||||||||||||
|
TCP Hawker |
1st Lien |
8.05% |
SOFR (Q) |
3.75 |
% |
08/2029 |
3,384 |
3,384 |
(e)(g) |
||||||||||||||||||||||||||||||||||||||
|
TCP Hawker |
1st Lien |
8.05% |
SOFR (M) |
3.75 |
% |
08/2029 |
242 |
242 |
(e)(g) |
||||||||||||||||||||||||||||||||||||||
|
TCP Hawker |
1st Lien |
9.30% |
SOFR (Q) |
5.00 |
% |
08/2029 |
6,820 |
6,819 |
(e)(f) |
||||||||||||||||||||||||||||||||||||||
|
TCP Hawker |
1st Lien |
08/2029 |
— |
— |
(e)(g) |
||||||||||||||||||||||||||||||||||||||||||
|
TCP Hawker |
1st Lien |
08/2029 |
— |
— |
(e)(g) |
||||||||||||||||||||||||||||||||||||||||||
|
Total Webhosting |
Netherlands |
1st Lien |
6.43% |
EURIBOR (M) |
4.50 |
% |
11/2031 |
€ |
6,000 |
7,066 |
|||||||||||||||||||||||||||||||||||||
|
Transit |
1st Lien |
08/2030 |
— |
— |
(e)(g) |
||||||||||||||||||||||||||||||||||||||||||
|
Transit |
1st Lien |
8.89% |
SOFR (S) |
4.75 |
% |
08/2031 |
3,790 |
3,790 |
(e)(f) |
||||||||||||||||||||||||||||||||||||||
Semi Annual Report 2025
74
CION Ares Diversified Credit Fund
Consolidated Schedule of Investments (continued)
June 30, 2025 (Unaudited)
(in thousands, except shares, percentages and as otherwise noted)
Senior Loans(b)(c)(d) (continued)
|
Company |
Country(a) |
Investment |
Coupon |
Reference |
Spread |
Acquisition |
Maturity |
Shares |
Principal |
Fair Value(a) |
% of Net |
||||||||||||||||||||||||||||||||||||
|
Transit |
1st Lien |
8.89% |
SOFR (S) |
4.75 |
% |
08/2031 |
$ |
423 |
$ |
423 |
(e)(g) |
||||||||||||||||||||||||||||||||||||
|
UserZoom |
1st Lien |
11.78% |
SOFR (Q) |
7.50 |
% |
04/2029 |
250 |
250 |
(e)(f) |
||||||||||||||||||||||||||||||||||||||
|
Vamos Bidco, Inc. |
1st Lien |
01/2032 |
— |
— |
(e)(g) |
||||||||||||||||||||||||||||||||||||||||||
|
Vamos Bidco, Inc. |
1st Lien |
9.05% |
SOFR (Q) |
4.75 |
% |
01/2032 |
2,599 |
2,573 |
(e)(f) |
||||||||||||||||||||||||||||||||||||||
|
Vamos Bidco, Inc. |
1st Lien |
01/2032 |
— |
— |
(e)(g) |
||||||||||||||||||||||||||||||||||||||||||
|
Victors Purchaser, |
1st Lien |
08/2031 |
— |
— |
(e)(g) |
||||||||||||||||||||||||||||||||||||||||||
|
Victors Purchaser, |
1st Lien |
9.05% |
SOFR (Q) |
4.75 |
% |
08/2031 |
12,232 |
12,232 |
(e)(f) |
||||||||||||||||||||||||||||||||||||||
|
Victors Purchaser, |
1st Lien |
9.05% |
SOFR (Q) |
4.75 |
% |
08/2031 |
634 |
634 |
(e)(g) |
||||||||||||||||||||||||||||||||||||||
|
Viper Bidco, Inc. |
1st Lien |
11/2031 |
— |
— |
(e)(g) |
||||||||||||||||||||||||||||||||||||||||||
|
Viper Bidco, Inc. |
1st Lien |
9.30% |
SOFR (Q) |
5.00 |
% |
11/2031 |
4,765 |
4,718 |
(e)(f) |
||||||||||||||||||||||||||||||||||||||
|
Viper Bidco, Inc. |
1st Lien |
9.22% |
SONIA (Q) |
5.00 |
% |
11/2031 |
£ |
2,203 |
2,994 |
(e)(f) |
|||||||||||||||||||||||||||||||||||||
|
Viper Bidco, Inc. |
1st Lien |
11/2031 |
— |
— |
(e)(g) |
||||||||||||||||||||||||||||||||||||||||||
|
VS Buyer, LLC |
1st Lien |
7.02% |
SOFR (Q) |
2.75 |
% |
04/2031 |
7,524 |
7,552 |
|||||||||||||||||||||||||||||||||||||||
|
WebPT, Inc. |
1st Lien |
10.68% |
SOFR (Q) |
6.25 |
% |
01/2028 |
188 |
187 |
(e)(g) |
||||||||||||||||||||||||||||||||||||||
|
WebPT, Inc. |
1st Lien |
10.68% |
SOFR (Q) |
6.25 |
% |
01/2028 |
2,037 |
2,016 |
(e)(f)(g) |
||||||||||||||||||||||||||||||||||||||
|
Wellington Bidco |
1st Lien |
9.05% |
SOFR (Q) |
4.75 |
% |
06/2030 |
110 |
110 |
(e)(g) |
||||||||||||||||||||||||||||||||||||||
|
Wellington Bidco |
1st Lien |
9.05% |
SOFR (Q) |
4.75 |
% |
06/2030 |
3,297 |
3,297 |
(e)(f) |
||||||||||||||||||||||||||||||||||||||
|
Wellington Bidco |
1st Lien |
06/2030 |
— |
— |
(e)(g) |
||||||||||||||||||||||||||||||||||||||||||
|
Wellness |
1st Lien |
01/2029 |
— |
— |
(e)(g) |
||||||||||||||||||||||||||||||||||||||||||
|
Wellness |
1st Lien |
9.05% |
SOFR (Q) |
4.75 |
% |
01/2029 |
5,334 |
5,334 |
(e)(f) |
||||||||||||||||||||||||||||||||||||||
Semi Annual Report 2025
75
CION Ares Diversified Credit Fund
Consolidated Schedule of Investments (continued)
June 30, 2025 (Unaudited)
(in thousands, except shares, percentages and as otherwise noted)
Senior Loans(b)(c)(d) (continued)
|
Company |
Country(a) |
Investment |
Coupon |
Reference |
Spread |
Acquisition Date |
Maturity Date |
Shares |
Principal Amount(a) |
Fair Value(a) |
% of Net Assets |
||||||||||||||||||||||||||||||||||||
|
Wellness AcquisitionCo, Inc. |
1st Lien Delay Draw Term Loan |
9.05% |
SOFR (Q) |
4.75 |
% |
01/2029 |
$ |
1,373 |
$ |
1,373 |
(e) |
||||||||||||||||||||||||||||||||||||
|
WorkWave Intermediate II, LLC |
1st Lien Revolving Loan |
10.40% |
SOFR (Q) |
6.00 |
% |
06/2027 |
101 |
101 |
(e)(g) |
||||||||||||||||||||||||||||||||||||||
|
WorkWave Intermediate II, LLC |
1st Lien Term Loan |
10.90% (3.25% PIK) |
SOFR (Q) |
6.50 |
% |
06/2027 |
4,962 |
4,962 |
(e) |
||||||||||||||||||||||||||||||||||||||
|
WorkWave Intermediate II, LLC |
1st Lien Delay Draw Term Loan |
10.90% (3.25% PIK) |
SOFR (Q) |
6.50 |
% |
06/2027 |
3,819 |
3,819 |
(e) |
||||||||||||||||||||||||||||||||||||||
|
WSBidCo Limited |
Jersey |
1st Lien Term Loan |
10.58% |
SONIA (Q) |
6.25 |
% |
06/2028 |
£ |
2,679 |
3,677 |
(e)(f) |
||||||||||||||||||||||||||||||||||||
|
WSBidCo Limited |
Jersey |
1st Lien Delay Draw Term Loan |
10.85% |
SONIA (Q) |
6.25 |
% |
06/2028 |
£ |
2,679 |
3,677 |
(e) |
||||||||||||||||||||||||||||||||||||
|
WSBidCo Limited |
Jersey |
1st Lien Delay Draw Term Loan |
10.60% |
SONIA (Q) |
6.25 |
% |
06/2028 |
£ |
2,885 |
3,959 |
(e) |
||||||||||||||||||||||||||||||||||||
|
WSBidCo Limited |
Jersey |
1st Lien Delay Draw Term Loan |
10.58% |
SONIA (Q) |
6.25 |
% |
06/2028 |
£ |
1,292 |
1,774 |
(e)(g) |
||||||||||||||||||||||||||||||||||||
|
ZocDoc, Inc. |
1st Lien Term Loan |
10.82% |
SOFR (Q) |
6.50 |
% |
05/2029 |
2,730 |
2,730 |
(e)(f) |
||||||||||||||||||||||||||||||||||||||
|
1,366,351 |
28.14 |
% |
|||||||||||||||||||||||||||||||||||||||||||||
|
Technology Hardware and Equipment |
|||||||||||||||||||||||||||||||||||||||||||||||
|
Chariot Buyer LLC |
1st Lien Revolving Loan |
01/2029 |
— |
— |
(e)(g) |
||||||||||||||||||||||||||||||||||||||||||
|
Chariot Buyer LLC |
1st Lien Term Loan |
7.68% |
SOFR (M) |
3.25 |
% |
11/2028 |
6,931 |
6,938 |
(f) |
||||||||||||||||||||||||||||||||||||||
|
ConnectWise, LLC |
1st Lien Term Loan |
8.06% |
SOFR (Q) |
3.50 |
% |
09/2028 |
5,557 |
5,580 |
(f) |
||||||||||||||||||||||||||||||||||||||
|
Cotiviti Holdings, Inc. |
1st Lien Term Loan |
7.07% |
SOFR (M) |
2.75 |
% |
03/2032 |
5,500 |
5,468 |
|||||||||||||||||||||||||||||||||||||||
|
Emerald Debt Merger Sub LLC |
1st Lien Term Loan |
6.83% |
SOFR (Q) |
2.50 |
% |
05/2030 |
6,431 |
6,422 |
(f) |
||||||||||||||||||||||||||||||||||||||
|
Excelitas Technologies Corp. |
1st Lien Term Loan |
9.58% |
SOFR (M) |
5.25 |
% |
08/2029 |
2,092 |
2,092 |
(e)(f) |
||||||||||||||||||||||||||||||||||||||
|
Excelitas Technologies Corp. |
1st Lien Delay Draw Term Loan |
08/2029 |
— |
— |
(e)(g) |
||||||||||||||||||||||||||||||||||||||||||
|
FL Hawk Intermediate Holdings, Inc. |
1st Lien Revolving Loan |
02/2029 |
— |
— |
(e)(g) |
||||||||||||||||||||||||||||||||||||||||||
|
FL Hawk Intermediate Holdings, Inc. |
1st Lien Term Loan |
8.80% |
SOFR (Q) |
4.50 |
% |
02/2030 |
10,873 |
10,873 |
(e)(f) |
||||||||||||||||||||||||||||||||||||||
|
MWG BidCo ApS |
Denmark |
1st Lien Delay Draw Term Loan |
9.47% |
CIBOR (S) |
7.00 |
% |
02/2028 |
DKK |
20,066 |
3,168 |
(e)(g) |
||||||||||||||||||||||||||||||||||||
Semi Annual Report 2025
76
CION Ares Diversified Credit Fund
Consolidated Schedule of Investments (continued)
June 30, 2025 (Unaudited)
(in thousands, except shares, percentages and as otherwise noted)
Senior Loans(b)(c)(d) (continued)
|
Company |
Country(a) |
Investment |
Coupon |
Reference |
Spread |
Acquisition Date |
Maturity Date |
Shares |
Principal Amount(a) |
Fair Value(a) |
% of Net Assets |
||||||||||||||||||||||||||||||||||||
|
MWG BidCo ApS |
Denmark |
1st Lien Delay Draw Term Loan |
9.38% | EURIBOR (S) |
7.00 |
% |
02/2028 |
DKK |
4,934 |
$ |
779 |
(e) |
|||||||||||||||||||||||||||||||||||
|
MWG BidCo ApS |
Denmark |
1st Lien Delay Draw Term Loan |
9.45% | EURIBOR (S) |
7.00 |
% |
02/2028 |
DKK |
1,712 |
270 |
(e) |
||||||||||||||||||||||||||||||||||||
|
Repairify, Inc. |
1st Lien Revolving Loan |
9.68% |
SOFR (S) |
5.25 |
% |
06/2027 |
540 |
540 |
(e)(g) |
||||||||||||||||||||||||||||||||||||||
|
Repairify, Inc. |
1st Lien Term Loan |
9.67% |
SOFR (S) |
5.25 |
% |
06/2027 |
3,436 |
3,436 |
(e)(f) |
||||||||||||||||||||||||||||||||||||||
|
Repairify, Inc. |
1st Lien Term Loan |
9.72% |
SOFR (Q) |
5.25 |
% |
06/2027 |
555 |
556 |
(e)(f) |
||||||||||||||||||||||||||||||||||||||
|
Stellant Midco, LLC |
1st Lien Term Loan |
9.93% |
SOFR (M) |
5.50 |
% |
10/2028 |
1,566 |
1,565 |
(e)(f) |
||||||||||||||||||||||||||||||||||||||
|
47,687 |
0.98 |
% |
|||||||||||||||||||||||||||||||||||||||||||||
|
Telecommunication Services |
|||||||||||||||||||||||||||||||||||||||||||||||
|
CB-SDG Limited |
United Kingdom |
1st Lien Term Loan |
04/2028 |
£ |
1,899 |
1,123 |
(e)(i) |
||||||||||||||||||||||||||||||||||||||||
|
Delta Topco, Inc. |
1st Lien Term Loan |
7.07% |
SOFR (Q) |
2.75 |
% |
11/2029 |
5,438 |
5,396 |
(f) |
||||||||||||||||||||||||||||||||||||||
|
Hamsard 3713 Limited |
United Kingdom |
1st Lien Term Loan |
8.84% | EURIBOR (Q) |
6.86 |
% |
11/2030 |
€ |
8,541 |
10,061 |
(e) |
||||||||||||||||||||||||||||||||||||
|
Hamsard 3713 Limited |
United Kingdom |
1st Lien Delay Draw Term Loan |
11.41% |
SOFR (Q) |
6.86 |
% |
11/2030 |
€ |
3,968 |
4,674 |
(e) |
||||||||||||||||||||||||||||||||||||
|
Lumen Technologies Inc |
1st Lien Term Loan |
6.79% |
SOFR (M) |
2.35 |
% |
04/2029 |
6,982 |
6,889 |
|||||||||||||||||||||||||||||||||||||||
|
Panther NewCo |
France |
1st Lien Term Loan |
9.16% | EURIBOR (Q) |
7.18 |
% |
05/2029 |
€ |
8,250 |
9,718 |
(e) |
||||||||||||||||||||||||||||||||||||
|
Panther NewCo |
France |
1st Lien Delay Draw Term Loan |
7.16% | EURIBOR (Q) |
5.18 |
% |
05/2029 |
€ |
2,798 |
3,296 |
(e) |
||||||||||||||||||||||||||||||||||||
|
Panther NewCo |
France |
1st Lien Delay Draw Term Loan |
7.73% | EURIBOR (Q) |
5.75 |
% |
05/2029 |
€ |
939 |
1,107 |
(e)(g) |
||||||||||||||||||||||||||||||||||||
|
Panther NewCo |
France |
1st Lien Delay Draw Term Loan |
05/2029 |
€ |
— |
— |
(e)(g)(h) |
||||||||||||||||||||||||||||||||||||||||
|
Ristretto Bidco B.V. |
1st Lien Revolving Loan |
12/2030 |
— |
— |
(e)(g) |
||||||||||||||||||||||||||||||||||||||||||
|
Ristretto Bidco B.V. |
1st Lien Term Loan |
10.82% (3.50% PIK) |
SOFR (Q) |
6.50 |
% |
12/2030 |
26,377 |
26,377 |
(e)(f) |
||||||||||||||||||||||||||||||||||||||
|
Ristretto Bidco B.V. |
1st Lien Delay Draw Term Loan |
10.82% (3.50% PIK) |
SOFR (Q) |
6.50 |
% |
12/2030 |
1,954 |
1,954 |
(e)(g) |
||||||||||||||||||||||||||||||||||||||
|
Zayo Group Holdings, Inc. |
1st Lien Term Loan |
7.44% |
SOFR (M) |
3.00 |
% |
03/2027 |
14,016 |
13,304 |
(f) |
||||||||||||||||||||||||||||||||||||||
Semi Annual Report 2025
77
CION Ares Diversified Credit Fund
Consolidated Schedule of Investments (continued)
June 30, 2025 (Unaudited)
(in thousands, except shares, percentages and as otherwise noted)
Senior Loans(b)(c)(d) (continued)
|
Company |
Country(a) |
Investment |
Coupon |
Reference |
Spread |
Acquisition Date |
Maturity Date |
Shares |
Principal Amount(a) |
Fair Value(a) |
% of Net Assets |
||||||||||||||||||||||||||||||||||||
|
Zayo Group Holdings, Inc. |
1st Lien Term Loan |
8.58% |
SOFR (M) |
4.25 |
% |
03/2027 |
$ |
997 |
$ |
956 |
|||||||||||||||||||||||||||||||||||||
|
84,855 |
1.75 |
% |
|||||||||||||||||||||||||||||||||||||||||||||
|
Transportation |
|||||||||||||||||||||||||||||||||||||||||||||||
|
Draken Bidco Limited |
United Kingdom |
1st Lien Term Loan |
11.58% |
SOFR (Q) |
7.00 |
% |
07/2029 |
10,560 |
10,560 |
(e)(f) |
|||||||||||||||||||||||||||||||||||||
|
Draken Bidco Limited |
United Kingdom |
1st Lien Delay Draw Term Loan |
07/2029 |
— |
— |
(e)(g) |
|||||||||||||||||||||||||||||||||||||||||
|
First Student Bidco Inc. |
1st Lien Term Loan |
6.80% |
SOFR (Q) |
2.50 |
% |
07/2028 |
6,506 |
6,505 |
|||||||||||||||||||||||||||||||||||||||
|
Neovia Logistics, LP |
1st Lien Term Loan |
13.08% (8.50% PIK) |
SOFR (Q) |
9.00 |
% |
11/2027 |
475 |
475 |
(e) |
||||||||||||||||||||||||||||||||||||||
|
17,540 |
0.36 |
% |
|||||||||||||||||||||||||||||||||||||||||||||
|
Utilities |
|||||||||||||||||||||||||||||||||||||||||||||||
|
Lackawanna Energy Center LLC |
1st Lien Term Loan |
8.58% |
SOFR (M) |
4.25 |
% |
08/2029 |
4,965 |
4,969 |
|||||||||||||||||||||||||||||||||||||||
|
Semper Holding BV |
Netherlands |
1st Lien Term Loan |
8.08% | EURIBOR (S) |
5.70 |
% |
02/2031 |
€ |
7,500 |
8,834 |
(e)(f) |
||||||||||||||||||||||||||||||||||||
|
Semper Holding BV |
Netherlands |
1st Lien Term Loan |
8.12% | EURIBOR (S) |
5.70 |
% |
02/2031 |
€ |
22,353 |
26,331 |
(e) |
||||||||||||||||||||||||||||||||||||
|
Watt Holdco Limited |
Ireland |
1st Lien Term Loan |
9.46% |
SONIA (Q) |
5.25 |
% |
09/2031 |
€ |
3,000 |
3,534 |
(e) |
||||||||||||||||||||||||||||||||||||
|
Watt Holdco Limited |
Ireland |
1st Lien Delay Draw Term Loan |
09/2031 |
€ |
— |
— |
(e)(g) |
||||||||||||||||||||||||||||||||||||||||
|
43,668 |
0.90 |
% |
|||||||||||||||||||||||||||||||||||||||||||||
|
Total Senior Loans (Cost $5,147,421) |
5,170,437 |
106.49 |
% |
||||||||||||||||||||||||||||||||||||||||||||
|
Subordinated Loans(b)(c)(d) |
|||||||||||||||||||||||||||||||||||||||||||||||
|
Capital Goods |
|||||||||||||||||||||||||||||||||||||||||||||||
|
OPH NEP Investment, LLC |
Subordinated Term Loan |
10.00% (7.00% PIK) |
05/2032 |
9,257 |
9,072 |
(e) |
|||||||||||||||||||||||||||||||||||||||||
|
OPH NEP Investment, LLC |
Subordinated Term Loan |
10.00% (7.00% PIK) |
05/2032 |
1,247 |
1,222 |
(e) |
|||||||||||||||||||||||||||||||||||||||||
|
10,294 |
0.21 |
% |
|||||||||||||||||||||||||||||||||||||||||||||
|
Commercial and Professional Services |
|||||||||||||||||||||||||||||||||||||||||||||||
|
Argenbright Holdings V, LLC |
Subordinated Term Loan |
13.71% (6.94% PIK) |
SOFR (Q) |
9.25 |
% |
11/2028 |
3,021 |
3,021 |
(e) |
||||||||||||||||||||||||||||||||||||||
|
Argenbright Holdings V, LLC |
Subordinated Delay Draw Term Loan |
13.71% (6.94% PIK) |
SOFR (Q) |
9.25 |
% |
11/2028 |
188 |
188 |
(e) |
||||||||||||||||||||||||||||||||||||||
Semi Annual Report 2025
78
CION Ares Diversified Credit Fund
Consolidated Schedule of Investments (continued)
June 30, 2025 (Unaudited)
(in thousands, except shares, percentages and as otherwise noted)
Subordinated Loans(b)(c)(d) (continued)
|
Company |
Country(a) |
Investment |
Coupon |
Reference |
Spread |
Acquisition Date |
Maturity Date |
Shares |
Principal Amount(a) |
Fair Value(a) |
% of Net Assets |
||||||||||||||||||||||||||||||||||||
|
Argenbright Holdings V, LLC |
Subordinated Delay Draw Term Loan |
13.72% (6.94% PIK) |
SOFR (Q) |
9.25 |
% |
11/2028 |
$ |
52 |
$ |
51 |
(e)(g) |
||||||||||||||||||||||||||||||||||||
|
VRC Companies, LLC |
Senior Subordinated Loan |
12.00% (2.00% PIK) |
06/2028 |
27 |
27 |
(e) |
|||||||||||||||||||||||||||||||||||||||||
|
3,287 |
0.07 |
% |
|||||||||||||||||||||||||||||||||||||||||||||
|
Consumer Durables and Apparel |
|||||||||||||||||||||||||||||||||||||||||||||||
|
Centric Brands TopCo, LLC |
Subordinated Term Loan |
10.76% |
SOFR (Q) |
6.50 |
% |
02/2031 |
814 |
814 |
(e) |
||||||||||||||||||||||||||||||||||||||
|
Centric Brands TopCo, LLC |
Subordinated Term Loan |
12.26% PIK |
SOFR (Q) |
8.00 |
% |
02/2031 |
962 |
962 |
(e) |
||||||||||||||||||||||||||||||||||||||
|
1,776 |
0.04 |
% |
|||||||||||||||||||||||||||||||||||||||||||||
|
Financial Services |
|||||||||||||||||||||||||||||||||||||||||||||||
|
BCC Blueprint Investments, LLC |
Senior Subordinated Loan |
9.30% PIK |
09/2026 |
853 |
853 |
(e) |
|||||||||||||||||||||||||||||||||||||||||
|
eCapital Finance Corp. |
Canada |
Subordinated Term Loan |
12.17% |
SOFR (M) |
7.75 |
% |
12/2028 |
31,851 |
31,851 |
(e) |
|||||||||||||||||||||||||||||||||||||
|
eCapital Finance Corp. |
Canada |
Subordinated Delay Draw Term Loan |
12.17% |
SOFR (M) |
7.75 |
% |
12/2028 |
2,803 |
2,803 |
(e) |
|||||||||||||||||||||||||||||||||||||
|
eCapital Finance Corp. |
Canada |
Subordinated Term Loan |
12.17% |
SOFR (M) |
7.75 |
% |
12/2028 |
3,642 |
3,642 |
(e) |
|||||||||||||||||||||||||||||||||||||
|
eCapital Finance Corp. |
Canada |
Subordinated Term Loan |
12.17% |
SOFR (M) |
7.75 |
% |
12/2028 |
15,869 |
15,868 |
(e) |
|||||||||||||||||||||||||||||||||||||
|
eCapital Finance Corp. |
Canada |
Subordinated Term Loan |
12.92% |
SOFR (M) |
8.50 |
% |
12/2028 |
3,793 |
3,793 |
(e) |
|||||||||||||||||||||||||||||||||||||
|
Gapco Aiv Interholdco (CP), L.P. |
Subordinated Term Loan |
11.05% PIK |
SOFR (Q) |
6.75 |
% |
03/2033 |
2,540 |
2,540 |
(e) |
||||||||||||||||||||||||||||||||||||||
|
Gapco Aiv Interholdco (CP), L.P. |
Subordinated Delay Draw Term Loan |
03/2033 |
— |
— |
(e)(g) |
||||||||||||||||||||||||||||||||||||||||||
|
HighTower Holding, LLC |
Senior Subordinated Loan |
6.75% |
04/2029 |
3,280 |
3,269 |
||||||||||||||||||||||||||||||||||||||||||
|
Midcap Financial Issuer Trust |
Senior Subordinated Loan |
6.50% |
05/2028 |
11,483 |
11,354 |
||||||||||||||||||||||||||||||||||||||||||
|
TriplePoint Venture Growth BDC Corp |
8.11% |
02/2028 |
17,100 |
17,259 |
(e) |
||||||||||||||||||||||||||||||||||||||||||
|
TVG-TMG Topco, Inc. |
Subordinated Term Loan |
12.00% PIK |
03/2029 |
4,061 |
4,020 |
(e) |
|||||||||||||||||||||||||||||||||||||||||
|
97,252 |
2.00 |
% |
|||||||||||||||||||||||||||||||||||||||||||||
Semi Annual Report 2025
79
CION Ares Diversified Credit Fund
Consolidated Schedule of Investments (continued)
June 30, 2025 (Unaudited)
(in thousands, except shares, percentages and as otherwise noted)
Subordinated Loans(b)(c)(d) (continued)
|
Company |
Country(a) |
Investment |
Coupon |
Reference |
Spread |
Acquisition Date |
Maturity Date |
Shares |
Principal Amount(a) |
Fair Value(a) |
% of Net Assets |
||||||||||||||||||||||||||||||||||||
|
Food, Beverage and Tobacco |
|||||||||||||||||||||||||||||||||||||||||||||||
|
Forward Keystone Holdings, LP |
Subordinated Term Loan |
15.00% (8.00% PIK) |
03/2029 |
$ |
3,602 |
$ |
3,511 |
(e) |
|||||||||||||||||||||||||||||||||||||||
|
Forward Keystone Holdings, LP |
Subordinated Delay Draw Term Loan |
15.00% (8.00% PIK) |
03/2029 |
73 |
71 |
(e)(g) |
|||||||||||||||||||||||||||||||||||||||||
|
Primo Water Holdings Inc / Triton Water Holdings Inc |
Senior Unsecured |
6.25% |
04/2029 |
100 |
101 |
||||||||||||||||||||||||||||||||||||||||||
|
3,683 |
0.08 |
% |
|||||||||||||||||||||||||||||||||||||||||||||
|
Health Care Equipment and Services |
|||||||||||||||||||||||||||||||||||||||||||||||
|
AmeriVet Partners Management, Inc. |
Subordinated Unsecured Term Loan |
16.50% PIK |
12/2030 |
8,511 |
7,405 |
(e) |
|||||||||||||||||||||||||||||||||||||||||
|
AmeriVet Partners Management, Inc. |
Subordinated Unsecured Delay Draw Term Loan |
16.50% PIK |
12/2030 |
1,365 |
1,188 |
(e) |
|||||||||||||||||||||||||||||||||||||||||
|
8,593 |
0.18 |
% |
|||||||||||||||||||||||||||||||||||||||||||||
|
Insurance |
|||||||||||||||||||||||||||||||||||||||||||||||
|
15484910 Canada Inc. |
Canada |
Subordinated Term Loan |
14.00% PIK |
04/2035 |
CAD |
2,117 |
1,516 |
(e) |
|||||||||||||||||||||||||||||||||||||||
|
15484910 Canada Inc. |
Canada |
Subordinated Delay Draw Term Loan |
04/2035 |
CAD |
— |
— |
(e)(g) |
||||||||||||||||||||||||||||||||||||||||
|
Slaine Holdings LLC |
Subordinated Term Loan |
11.07% |
SOFR (M) |
6.75 |
% |
05/2030 |
6,056 |
5,934 |
(e) |
||||||||||||||||||||||||||||||||||||||
|
Slaine Holdings LLC |
Senior Subordinated Revolving Loan |
05/2030 |
— |
— |
(e)(g) |
||||||||||||||||||||||||||||||||||||||||||
|
Slaine Holdings LLC |
Subordinated Delay Draw Term Loan |
05/2030 |
— |
— |
(e)(g) |
||||||||||||||||||||||||||||||||||||||||||
|
7,450 |
0.15 |
% |
|||||||||||||||||||||||||||||||||||||||||||||
|
Sports, Media and Entertainment |
|||||||||||||||||||||||||||||||||||||||||||||||
|
22 HoldCo Limited |
United Kingdom |
Subordinated Delay Draw Term Loan |
12.23% PIK |
SONIA (S) |
7.50 |
% |
08/2033 |
£ |
2,045 |
2,807 |
(e) |
||||||||||||||||||||||||||||||||||||
|
22 HoldCo Limited |
United Kingdom |
Subordinated Term Loan |
12.23% PIK |
SONIA (S) |
7.50 |
% |
08/2033 |
£ |
3,334 |
4,576 |
(e) |
||||||||||||||||||||||||||||||||||||
|
Aventine Holdings II LLC |
Subordinated Term Loan |
10.25% PIK |
12/2030 |
15,562 |
12,605 |
(e) |
|||||||||||||||||||||||||||||||||||||||||
Semi Annual Report 2025
80
CION Ares Diversified Credit Fund
Consolidated Schedule of Investments (continued)
June 30, 2025 (Unaudited)
(in thousands, except shares, percentages and as otherwise noted)
Subordinated Loans(b)(c)(d) (continued)
|
Company |
Country(a) |
Investment |
Coupon |
Reference |
Spread |
Acquisition Date |
Maturity Date |
Shares |
Principal Amount(a) |
Fair Value(a) |
% of Net Assets |
||||||||||||||||||||||||||||||||||||
|
Eagle Football Holdings BidCo Limited |
United Kingdom |
Senior Subordinated Loan |
12.29% PIK |
SOFR (S) |
8.15 |
% |
12/2028 |
$ |
1,688 |
$ |
1,621 |
(e) |
|||||||||||||||||||||||||||||||||||
|
Eagle Football Holdings BidCo Limited |
United Kingdom |
Senior Subordinated Loan |
19.00% PIK |
12/2028 |
825 |
825 |
(e) |
||||||||||||||||||||||||||||||||||||||||
|
Eagle Football Holdings BidCo Limited |
United Kingdom |
Senior Subordinated Loan |
19.00% PIK |
12/2028 |
19 |
19 |
(e) |
||||||||||||||||||||||||||||||||||||||||
|
22,453 |
0.46 |
% |
|||||||||||||||||||||||||||||||||||||||||||||
|
Pharmaceuticals, Biotechnology and Life Sciences |
|||||||||||||||||||||||||||||||||||||||||||||||
|
Cardinal Topco Holdings, LP |
Subordinated Term Loan |
11.00% PIK |
03/2027 |
11 |
11 |
(e) |
|||||||||||||||||||||||||||||||||||||||||
|
11 |
— |
% |
|||||||||||||||||||||||||||||||||||||||||||||
|
Software and Services |
|||||||||||||||||||||||||||||||||||||||||||||||
|
BCTO Ignition Purchaser, Inc. |
Subordinated Term Loan |
11.77% PIK |
SOFR (Q) |
7.50 |
% |
10/2030 |
1,622 |
1,622 |
(e) |
||||||||||||||||||||||||||||||||||||||
|
Insightful Science Intermediate I, LLC |
Senior Subordinated Loan |
10.50% PIK |
04/2032 |
1,923 |
1,923 |
(e) |
|||||||||||||||||||||||||||||||||||||||||
|
Practicetek Midco, LLC |
Senior Subordinated Loan |
14.00% PIK |
08/2030 |
10,435 |
10,435 |
(e) |
|||||||||||||||||||||||||||||||||||||||||
|
WPT Intermediate Holdco, Inc. |
Subordinated Term Loan |
13.25% PIK |
05/2029 |
21,007 |
20,587 |
(e) |
|||||||||||||||||||||||||||||||||||||||||
|
34,567 |
0.71 |
% |
|||||||||||||||||||||||||||||||||||||||||||||
|
Transportation |
|||||||||||||||||||||||||||||||||||||||||||||||
|
Nordic Ferry Infrastructure AS |
Norway |
Subordinated Term Loan |
9.64% |
NIBOR (Q) |
5.00 |
% |
11/2031 |
NOK |
207,385 |
20,575 |
(e) |
||||||||||||||||||||||||||||||||||||
|
Nordic Ferry Infrastructure AS |
Norway |
Subordinated Term Loan |
7.01% | EURIBOR (Q) |
5.00 |
% |
11/2031 |
€ |
17,459 |
20,566 |
(e) |
||||||||||||||||||||||||||||||||||||
|
41,141 |
0.85 |
% |
|||||||||||||||||||||||||||||||||||||||||||||
|
Utilities |
|||||||||||||||||||||||||||||||||||||||||||||||
|
BNZ TopCo B.V. |
Netherlands |
Subordinated Delay Draw Term Loan |
8.25% | EURIBOR (Q) |
6.25 |
% |
10/2030 |
€ |
3,980 |
4,594 |
(e)(g) |
||||||||||||||||||||||||||||||||||||
|
4,594 |
0.09 |
% |
|||||||||||||||||||||||||||||||||||||||||||||
|
Total Subordinated Loans (Cost $230,327) |
235,101 |
4.84 |
% |
||||||||||||||||||||||||||||||||||||||||||||
Semi Annual Report 2025
81
CION Ares Diversified Credit Fund
Consolidated Schedule of Investments (continued)
June 30, 2025 (Unaudited)
(in thousands, except shares, percentages and as otherwise noted)
Corporate Bonds(b)(c)
|
Company |
Country(a) |
Investment |
Coupon |
Reference |
Spread |
Acquisition Date |
Maturity Date |
Shares |
Principal Amount(a) |
Fair Value(a) |
% of Net Assets |
||||||||||||||||||||||||||||||||||||
|
Capital Goods |
|||||||||||||||||||||||||||||||||||||||||||||||
| CP Atlas Buyer Inc | 7.00% |
12/2028 |
$ |
12,163 |
$ |
11,260 |
(d) |
||||||||||||||||||||||||||||||||||||||||
|
LBM Acquisition LLC |
6.25% |
01/2029 |
8,436 |
7,318 |
(d) |
||||||||||||||||||||||||||||||||||||||||||
|
VistaJet Malta Finance PLC / Vista Management Holding Inc |
Malta |
9.50% |
06/2028 |
6,105 |
6,275 |
(d) |
|||||||||||||||||||||||||||||||||||||||||
|
VistaJet Malta Finance PLC / Vista Management Holding Inc |
Malta |
6.38% |
02/2030 |
13,163 |
12,373 |
(d) |
|||||||||||||||||||||||||||||||||||||||||
|
Wilsonart LLC |
11.00% |
08/2032 |
8,582 |
7,796 |
(d) |
||||||||||||||||||||||||||||||||||||||||||
|
45,022 |
0.93 |
% |
|||||||||||||||||||||||||||||||||||||||||||||
|
Commercial and Professional Services |
|||||||||||||||||||||||||||||||||||||||||||||||
|
NBLY 2021-1 |
3.58% |
04/2051 |
24 |
23 |
(d)(e) |
||||||||||||||||||||||||||||||||||||||||||
|
Neptune BidCo US Inc. |
9.29% |
04/2029 |
8,991 |
8,702 |
(d) |
||||||||||||||||||||||||||||||||||||||||||
|
8,725 |
0.18 |
% |
|||||||||||||||||||||||||||||||||||||||||||||
|
Consumer Distribution and Retail |
|||||||||||||||||||||||||||||||||||||||||||||||
|
BUNDT 2021-1 |
2.99% |
07/2051 |
25 |
24 |
(d)(e) |
||||||||||||||||||||||||||||||||||||||||||
|
24 |
— |
% |
|||||||||||||||||||||||||||||||||||||||||||||
|
Consumer Services |
|||||||||||||||||||||||||||||||||||||||||||||||
|
AUTHB 2021-1 |
3.73% |
07/2051 |
24 |
22 |
(d)(e) |
||||||||||||||||||||||||||||||||||||||||||
|
SERV 2020-1 |
3.34% |
01/2051 |
24 |
21 |
(d)(e) |
||||||||||||||||||||||||||||||||||||||||||
|
43 |
— |
% |
|||||||||||||||||||||||||||||||||||||||||||||
|
Energy |
|||||||||||||||||||||||||||||||||||||||||||||||
|
Enviva Partners LP / Enviva Partners Finance Corp |
01/2026 |
17,217 |
— |
(d)(e)(i) |
|||||||||||||||||||||||||||||||||||||||||||
|
ITT Holdings LLC |
6.50% |
08/2029 |
14,264 |
13,565 |
(d) |
||||||||||||||||||||||||||||||||||||||||||
|
Tallgrass Energy Partners LP / Tallgrass Energy Finance Corp |
6.00% |
12/2030 |
10,093 |
9,904 |
(d) |
||||||||||||||||||||||||||||||||||||||||||
|
Transocean Inc. |
Cayman Islands |
6.80% |
03/2038 |
8,968 |
6,304 |
||||||||||||||||||||||||||||||||||||||||||
|
29,773 |
0.61 |
% |
|||||||||||||||||||||||||||||||||||||||||||||
Semi Annual Report 2025
82
CION Ares Diversified Credit Fund
Consolidated Schedule of Investments (continued)
June 30, 2025 (Unaudited)
(in thousands, except shares, percentages and as otherwise noted)
Corporate Bonds(b)(c) (continued)
|
Company |
Country(a) |
Investment |
Coupon |
Reference |
Spread |
Acquisition Date |
Maturity Date |
Shares |
Principal Amount(a) |
Fair Value(a) |
% of Net Assets |
||||||||||||||||||||||||||||||||||||
|
Equity Real Estate Investment Trusts (REITs) |
|||||||||||||||||||||||||||||||||||||||||||||||
|
Brookfield Property REIT Inc / BPR Cumulus LLC / BPR Nimbus LLC / GGSI Sellco LL |
4.50% |
04/2027 |
$ |
8,321 |
$ |
8,087 |
(d) |
||||||||||||||||||||||||||||||||||||||||
|
Iron Mountain Inc |
5.25% |
07/2030 |
4,089 |
4,033 |
(d) |
||||||||||||||||||||||||||||||||||||||||||
|
12,120 |
0.25 |
% |
|||||||||||||||||||||||||||||||||||||||||||||
|
Financial Services |
|||||||||||||||||||||||||||||||||||||||||||||||
|
Antenore Bidco SpA |
Italy |
9.11% |
10/2030 |
€ |
3,000 |
3,534 |
(e) |
||||||||||||||||||||||||||||||||||||||||
|
Trinity Capital Inc |
7.54% |
10/2027 |
20,300 |
20,372 |
(e) |
||||||||||||||||||||||||||||||||||||||||||
|
WAX 2022-1 |
5.50% |
03/2052 |
18,430 |
18,156 |
(d)(e) |
||||||||||||||||||||||||||||||||||||||||||
|
42,062 |
0.87 |
% |
|||||||||||||||||||||||||||||||||||||||||||||
|
Insurance |
|||||||||||||||||||||||||||||||||||||||||||||||
|
SQ ABS Issuer, LLC |
7.80% |
10/2039 |
776 |
776 |
(e) |
||||||||||||||||||||||||||||||||||||||||||
|
SQ ABS Issuer, LLC |
9.65% |
10/2039 |
517 |
517 |
(e) |
||||||||||||||||||||||||||||||||||||||||||
|
1,293 |
0.03 |
% |
|||||||||||||||||||||||||||||||||||||||||||||
|
Materials |
|||||||||||||||||||||||||||||||||||||||||||||||
|
Ardagh Packaging Finance PLC / Ardagh Holdings USA Inc |
Ireland |
4.13% |
08/2026 |
8,000 |
7,511 |
(d) |
|||||||||||||||||||||||||||||||||||||||||
|
Ardagh Packaging Finance PLC / Ardagh Holdings USA Inc |
Ireland |
5.25% |
08/2027 |
27,645 |
12,328 |
(d) |
|||||||||||||||||||||||||||||||||||||||||
|
Chemours Company, The |
5.75% |
11/2028 |
2,864 |
2,678 |
(d) |
||||||||||||||||||||||||||||||||||||||||||
|
OI European Group BV |
Netherlands |
4.75% |
02/2030 |
3,603 |
3,459 |
(d) |
|||||||||||||||||||||||||||||||||||||||||
|
Trident TPI Holdings, Inc. |
12.75% |
12/2028 |
6,102 |
6,473 |
(d) |
||||||||||||||||||||||||||||||||||||||||||
|
32,449 |
0.67 |
% |
|||||||||||||||||||||||||||||||||||||||||||||
|
Sports, Media and Entertainment |
|||||||||||||||||||||||||||||||||||||||||||||||
|
ANGI Group LLC |
3.88% |
08/2028 |
4,959 |
4,623 |
(d) |
||||||||||||||||||||||||||||||||||||||||||
|
Scripps Escrow II Inc |
3.88% |
01/2029 |
15,813 |
13,766 |
(d) |
||||||||||||||||||||||||||||||||||||||||||
|
18,389 |
0.38 |
% |
|||||||||||||||||||||||||||||||||||||||||||||
Semi Annual Report 2025
83
CION Ares Diversified Credit Fund
Consolidated Schedule of Investments (continued)
June 30, 2025 (Unaudited)
(in thousands, except shares, percentages and as otherwise noted)
Corporate Bonds(b)(c) (continued)
|
Company |
Country(a) |
Investment |
Coupon |
Reference |
Spread |
Acquisition Date |
Maturity Date |
Shares |
Principal Amount(a) |
Fair Value(a) |
% of Net Assets |
||||||||||||||||||||||||||||||||||||
|
Pharmaceuticals, Biotechnology and Life Sciences |
|||||||||||||||||||||||||||||||||||||||||||||||
|
1261229 B.C. Ltd. |
Canada |
10.00 |
% |
04/2032 |
$ |
7,500 |
$ |
7,568 |
(d) |
||||||||||||||||||||||||||||||||||||||
|
Grifols SA |
Spain |
3.88 |
% |
10/2028 |
€ |
1,925 |
2,166 |
||||||||||||||||||||||||||||||||||||||||
|
IGEA BIDCO S.P.A |
Italy |
9.69 |
% |
09/2031 |
€ |
3,651 |
4,300 |
(e) |
|||||||||||||||||||||||||||||||||||||||
|
14,034 |
0.29 |
% |
|||||||||||||||||||||||||||||||||||||||||||||
|
Software and Services |
|||||||||||||||||||||||||||||||||||||||||||||||
|
Cloud Software Group, Inc. |
8.25 |
% |
06/2032 |
3,400 |
3,617 |
(d) |
|||||||||||||||||||||||||||||||||||||||||
|
3,617 |
0.07 |
% |
|||||||||||||||||||||||||||||||||||||||||||||
|
Telecommunication Services |
|||||||||||||||||||||||||||||||||||||||||||||||
|
Level 3 Financing Inc. |
11.00 |
% |
11/2029 |
8,048 |
9,233 |
(d) |
|||||||||||||||||||||||||||||||||||||||||
|
Zayo Group Holdings, Inc. |
4.00 |
% |
03/2027 |
15,719 |
14,741 |
(d) |
|||||||||||||||||||||||||||||||||||||||||
|
23,974 |
0.49 |
% |
|||||||||||||||||||||||||||||||||||||||||||||
|
Total Corporate Bonds (Cost $234,017) |
231,525 |
4.77 |
% |
||||||||||||||||||||||||||||||||||||||||||||
| Collateralized Loan Obligations — Debt(b)(c)(d)(e) | |||||||||||||||||||||||||||||||||||||||||||||||
|
ABPCI 2022-11A ER |
Cayman Islands |
11.42 |
% |
SOFR (Q) |
7.00 |
% |
01/2038 |
7,000 |
6,927 |
||||||||||||||||||||||||||||||||||||||
|
ABPCI 2023-12A ER |
Jersey |
12.54 |
% |
SOFR (Q) |
8.25 |
% |
07/2037 |
2,850 |
2,874 |
||||||||||||||||||||||||||||||||||||||
|
ABPCI 2025-20A E |
10.52 |
% |
SOFR (Q) |
6.25 |
% |
04/2037 |
1,450 |
1,451 |
|||||||||||||||||||||||||||||||||||||||
|
AIMCO 2024-22A E |
Jersey |
10.77 |
% |
SOFR (Q) |
6.50 |
% |
04/2037 |
3,000 |
3,047 |
||||||||||||||||||||||||||||||||||||||
|
ANCHC 2019-13A ERR |
Cayman Islands |
10.83 |
% |
SOFR (Q) |
6.50 |
% |
04/2038 |
5,000 |
5,034 |
||||||||||||||||||||||||||||||||||||||
|
ANCHF 2020-12A E |
Cayman Islands |
6.91 |
% |
10/2038 |
1,000 |
903 |
|||||||||||||||||||||||||||||||||||||||||
|
ATRM 14A ER |
Cayman Islands |
10.76 |
% |
SOFR (Q) |
6.50 |
% |
10/2037 |
5,600 |
5,620 |
||||||||||||||||||||||||||||||||||||||
|
ATRM 15A ER |
Cayman Islands |
10.76 |
% |
SOFR (Q) |
6.50 |
% |
07/2037 |
3,350 |
3,348 |
||||||||||||||||||||||||||||||||||||||
|
BABSN 2023-1A ER |
Cayman Islands |
11.03 |
% |
SOFR (Q) |
6.70 |
% |
04/2038 |
900 |
915 |
||||||||||||||||||||||||||||||||||||||
|
BABSN 2023-3A E |
Cayman Islands |
11.59 |
% |
SOFR (Q) |
7.33 |
% |
10/2036 |
563 |
570 |
||||||||||||||||||||||||||||||||||||||
|
BALLY 2023-24A C |
Jersey |
9.31 |
% |
SOFR (Q) |
5.05 |
% |
07/2036 |
2,000 |
2,000 |
||||||||||||||||||||||||||||||||||||||
|
BALLY 2024-26A D |
Cayman Islands |
10.38 |
% |
SOFR (Q) |
6.10 |
% |
07/2037 |
1,800 |
1,824 |
||||||||||||||||||||||||||||||||||||||
|
BCC 2020-1A ER |
Cayman Islands |
11.42 |
% |
SOFR (Q) |
7.15 |
% |
04/2033 |
2,500 |
2,508 |
||||||||||||||||||||||||||||||||||||||
|
BCC 2023-3A D |
Jersey |
9.53 |
% |
SOFR (Q) |
5.25 |
% |
07/2036 |
3,000 |
3,013 |
||||||||||||||||||||||||||||||||||||||
Semi Annual Report 2025
84
CION Ares Diversified Credit Fund
Consolidated Schedule of Investments (continued)
June 30, 2025 (Unaudited)
(in thousands, except shares, percentages and as otherwise noted)
Collateralized Loan Obligations — Debt(b)(c)(d)(e) (continued)
|
Company |
Country(a) |
Investment |
Coupon |
Reference |
Spread |
Acquisition |
Maturity |
Shares |
Principal |
Fair Value(a) |
% of Net |
||||||||||||||||||||||||||||||||||||
|
BSP 2016-9A ER2 |
Cayman |
10.17% |
SOFR (Q) |
5.90 |
% |
10/2037 |
$ |
3,125 |
$ |
3,149 |
|||||||||||||||||||||||||||||||||||||
|
BSP 2018-14A ER |
Cayman |
10.42% |
SOFR (Q) |
6.15 |
% |
10/2037 |
5,500 |
5,544 |
|||||||||||||||||||||||||||||||||||||||
|
BSP 2022-28A ER |
Cayman |
9.67% |
SOFR (Q) |
5.40 |
% |
10/2037 |
500 |
503 |
|||||||||||||||||||||||||||||||||||||||
|
BSP 2023-30A ER |
Jersey |
9.73% |
SOFR (Q) |
5.45 |
% |
04/2038 |
2,000 |
2,011 |
|||||||||||||||||||||||||||||||||||||||
|
BSP 2023-31A ER |
Jersey |
11.45% |
SOFR (Q) |
7.17 |
% |
04/2038 |
375 |
385 |
|||||||||||||||||||||||||||||||||||||||
|
BSP 2024-38A E |
Cayman |
9.31% |
SOFR (Q) |
5.00 |
% |
01/2038 |
3,750 |
3,755 |
|||||||||||||||||||||||||||||||||||||||
|
BSP 2025-39A E |
Cayman |
8.76% |
SOFR (Q) |
4.50 |
% |
04/2038 |
1,825 |
1,833 |
|||||||||||||||||||||||||||||||||||||||
|
CAVU 2021-1A ER |
Cayman |
11.28% |
SOFR (Q) |
7.00 |
% |
07/2037 |
1,250 |
1,254 |
|||||||||||||||||||||||||||||||||||||||
|
CAVU 2022-2A |
Cayman |
8.34% |
03/2038 |
2,575 |
2,599 |
||||||||||||||||||||||||||||||||||||||||||
|
CAVU 2022-2A ER |
Cayman |
8.56% |
SOFR (Q) |
6.45 |
% |
03/2038 |
2,950 |
2,996 |
|||||||||||||||||||||||||||||||||||||||
|
CEDF 2018-9A ER |
Cayman |
11.80% |
SOFR (Q) |
7.53 |
% |
07/2037 |
500 |
504 |
|||||||||||||||||||||||||||||||||||||||
|
CEDF 2019-10A |
Cayman |
11.02% |
SOFR (Q) |
6.75 |
% |
10/2037 |
1,000 |
1,008 |
|||||||||||||||||||||||||||||||||||||||
|
CGMS 2019-2A |
Cayman |
11.26% |
SOFR (Q) |
7.00 |
% |
10/2037 |
4,388 |
4,507 |
|||||||||||||||||||||||||||||||||||||||
|
CGMS 2020-1A |
Cayman |
9.22% |
SOFR (Q) |
4.95 |
% |
01/2038 |
3,750 |
3,708 |
|||||||||||||||||||||||||||||||||||||||
|
CGMS 2022-2A |
Cayman |
11.22% |
SOFR (Q) |
6.95 |
% |
01/2038 |
2,850 |
2,900 |
|||||||||||||||||||||||||||||||||||||||
|
CGMS 2022-5A |
Cayman |
11.36% |
SOFR (Q) |
7.10 |
% |
10/2037 |
4,190 |
4,249 |
|||||||||||||||||||||||||||||||||||||||
|
CGMS 2023-1A E |
Cayman |
12.73% |
SOFR (Q) |
8.46 |
% |
07/2035 |
500 |
500 |
|||||||||||||||||||||||||||||||||||||||
|
CGMS 2023-2A |
Cayman |
9.27% |
SOFR (Q) |
5.00 |
% |
07/2036 |
5,000 |
5,019 |
|||||||||||||||||||||||||||||||||||||||
|
CGMS 2024-1A E |
Cayman |
11.18% |
SOFR (Q) |
6.92 |
% |
04/2037 |
1,096 |
1,115 |
|||||||||||||||||||||||||||||||||||||||
|
CGMS 2024-3A E |
Cayman |
10.68% |
SOFR (Q) |
6.40 |
% |
07/2036 |
3,250 |
3,305 |
|||||||||||||||||||||||||||||||||||||||
|
CGMS 2024-5A E |
Cayman |
9.93% |
SOFR (Q) |
5.65 |
% |
10/2036 |
1,500 |
1,515 |
|||||||||||||||||||||||||||||||||||||||
|
CIFC 2018-1A ER |
Cayman |
9.52% |
SOFR (Q) |
5.25 |
% |
01/2038 |
830 |
821 |
|||||||||||||||||||||||||||||||||||||||
|
CIFC 2018-4A ER |
Cayman |
9.12% |
SOFR (Q) |
4.85 |
% |
01/2038 |
1,625 |
1,616 |
|||||||||||||||||||||||||||||||||||||||
|
CIFC 2018-5A ER |
Cayman |
10.86% |
SOFR (Q) |
6.60 |
% |
07/2038 |
650 |
652 |
|||||||||||||||||||||||||||||||||||||||
|
CIFC 2020-4A ER |
Cayman |
9.16% |
SOFR (Q) |
4.90 |
% |
01/2040 |
5,500 |
5,505 |
|||||||||||||||||||||||||||||||||||||||
|
CIFC 2021-4A ER |
Cayman |
10.48% |
SOFR (Q) |
6.20 |
% |
07/2037 |
1,000 |
1,017 |
|||||||||||||||||||||||||||||||||||||||
Semi Annual Report 2025
85
CION Ares Diversified Credit Fund
Consolidated Schedule of Investments (continued)
June 30, 2025 (Unaudited)
(in thousands, except shares, percentages and as otherwise noted)
Collateralized Loan Obligations — Debt(b)(c)(d)(e) (continued)
|
Company |
Country(a) |
Investment |
Coupon |
Reference |
Spread |
Acquisition |
Maturity |
Shares |
Principal |
Fair Value(a) |
% of Net |
||||||||||||||||||||||||||||||||||||
|
CIFC 2021-5A ER |
Cayman |
9.36% |
SOFR (Q) |
5.10 |
% |
01/2038 |
$ |
3,883 |
$ |
3,847 |
|||||||||||||||||||||||||||||||||||||
|
CIFC 2022-6A ER |
Cayman |
10.01% |
SOFR (Q) |
5.75 |
% |
10/2038 |
438 |
442 |
|||||||||||||||||||||||||||||||||||||||
|
CIFC 2022-7A ER |
Cayman |
9.62% |
SOFR (Q) |
5.35 |
% |
01/2038 |
688 |
689 |
|||||||||||||||||||||||||||||||||||||||
|
CIFC 2024-1A E |
Cayman |
10.87% |
SOFR (Q) |
6.60 |
% |
04/2037 |
375 |
381 |
|||||||||||||||||||||||||||||||||||||||
|
CIFC 2024-5A E |
Cayman |
9.48% |
SOFR (Q) |
5.15 |
% |
01/2038 |
4,000 |
4,056 |
|||||||||||||||||||||||||||||||||||||||
|
CIFC 2025-1A E |
Cayman |
8.75% |
SOFR (Q) |
4.50 |
% |
04/2038 |
1,375 |
1,382 |
|||||||||||||||||||||||||||||||||||||||
|
CPTPK 2024-1A E |
Jersey |
10.27% |
SOFR (Q) |
6.00 |
% |
07/2037 |
1,750 |
1,771 |
|||||||||||||||||||||||||||||||||||||||
|
DRSLF 2022-104A |
Cayman |
11.72% |
SOFR (Q) |
7.40 |
% |
08/2034 |
5,756 |
5,799 |
|||||||||||||||||||||||||||||||||||||||
|
ELM12 2021-5A |
Cayman |
10.16% |
SOFR (Q) |
5.90 |
% |
10/2037 |
1,475 |
1,479 |
|||||||||||||||||||||||||||||||||||||||
|
ELM24 2023-3A |
Cayman |
9.38% |
SOFR (Q) |
5.10 |
% |
01/2038 |
2,000 |
1,979 |
|||||||||||||||||||||||||||||||||||||||
|
ELM30 2024-6A E |
Cayman |
9.53% |
SOFR (Q) |
5.25 |
% |
07/2037 |
1,250 |
1,256 |
|||||||||||||||||||||||||||||||||||||||
|
ELM37 2024-13A |
Cayman |
9.04% |
SOFR (Q) |
4.75 |
% |
01/2038 |
3,000 |
3,036 |
|||||||||||||||||||||||||||||||||||||||
|
ELM38 2025-1A E |
Cayman |
8.78% |
SOFR (Q) |
4.50 |
% |
04/2038 |
1,500 |
1,488 |
|||||||||||||||||||||||||||||||||||||||
|
ELM40 2025-3A E |
Cayman |
9.53% |
SOFR (Q) |
5.25 |
% |
03/2038 |
1,750 |
1,772 |
|||||||||||||||||||||||||||||||||||||||
|
ELM42 2025-5A E |
Cayman |
10.78% |
SOFR (Q) |
6.50 |
% |
03/2038 |
1,200 |
1,235 |
|||||||||||||||||||||||||||||||||||||||
|
ELMW2 2019-2A |
Cayman |
10.02% |
SOFR (Q) |
5.75 |
% |
10/2037 |
1,400 |
1,406 |
|||||||||||||||||||||||||||||||||||||||
|
ELMW4 2020-1A |
Cayman |
10.42% |
SOFR (Q) |
6.15 |
% |
04/2037 |
2,738 |
2,749 |
|||||||||||||||||||||||||||||||||||||||
|
ELMW8 2021-1A |
Cayman |
10.52% |
SOFR (Q) |
6.25 |
% |
04/2037 |
5,028 |
5,013 |
|||||||||||||||||||||||||||||||||||||||
|
EMPWR 2023-3A E |
Jersey |
12.09% |
SOFR (Q) |
7.82 |
% |
01/2037 |
500 |
504 |
|||||||||||||||||||||||||||||||||||||||
|
FLAT 2023-2A E |
Jersey |
12.09% |
SOFR (Q) |
7.83 |
% |
01/2037 |
750 |
766 |
|||||||||||||||||||||||||||||||||||||||
|
GLM 2022-12A |
Jersey |
9.97% |
SOFR (Q) |
5.70 |
% |
07/2037 |
2,100 |
2,115 |
|||||||||||||||||||||||||||||||||||||||
|
GNRT 2022-10A |
Cayman |
9.22% |
SOFR (Q) |
4.90 |
% |
01/2038 |
2,750 |
2,758 |
|||||||||||||||||||||||||||||||||||||||
|
GNRT 2024-15A E |
Cayman |
10.97% |
SOFR (Q) |
6.70 |
% |
07/2037 |
1,075 |
1,088 |
|||||||||||||||||||||||||||||||||||||||
|
GNRT 2A ER2 |
Cayman |
11.62% |
SOFR (Q) |
7.35 |
% |
10/2037 |
250 |
247 |
|||||||||||||||||||||||||||||||||||||||
|
GNRT 6A ER2 |
Cayman |
11.52% |
SOFR (Q) |
7.25 |
% |
10/2037 |
1,820 |
1,829 |
|||||||||||||||||||||||||||||||||||||||
|
GNRT 9A ER |
Cayman |
10.62% |
SOFR (Q) |
6.35 |
% |
01/2038 |
4,015 |
4,075 |
|||||||||||||||||||||||||||||||||||||||
|
HAMLN 2024-1A E |
Jersey |
9.67% |
SOFR (Q) |
5.40 |
% |
10/2037 |
2,018 |
2,038 |
|||||||||||||||||||||||||||||||||||||||
Semi Annual Report 2025
86
CION Ares Diversified Credit Fund
Consolidated Schedule of Investments (continued)
June 30, 2025 (Unaudited)
(in thousands, except shares, percentages and as otherwise noted)
Collateralized Loan Obligations — Debt(b)(c)(d)(e) (continued)
|
Company |
Country(a) |
Investment |
Coupon |
Reference |
Spread |
Acquisition |
Maturity |
Shares |
Principal |
Fair Value(a) |
% of Net |
||||||||||||||||||||||||||||||||||||
|
INVCO 2023-2A |
Jersey |
12.20% |
SOFR (Q) |
7.88 |
% |
04/2038 |
$ |
1,600 |
$ |
1,682 |
|||||||||||||||||||||||||||||||||||||
|
KKR 2024-53A E |
Cayman |
10.76% |
SOFR (Q) |
6.50 |
% |
01/2038 |
2,235 |
2,290 |
|||||||||||||||||||||||||||||||||||||||
|
KKR 44A D |
Cayman |
9.27% |
SOFR (Q) |
5.00 |
% |
01/2036 |
3,800 |
3,856 |
|||||||||||||||||||||||||||||||||||||||
|
MAGNE 2022-33A |
Cayman |
9.82% |
SOFR (Q) |
5.55 |
% |
10/2037 |
5,875 |
5,915 |
|||||||||||||||||||||||||||||||||||||||
|
MAGNE 2024-41A E |
Cayman |
9.21% |
SOFR (Q) |
4.90 |
% |
01/2038 |
2,313 |
2,320 |
|||||||||||||||||||||||||||||||||||||||
|
MAGNE 2024-42A E |
Cayman |
9.31% |
SOFR (Q) |
5.00 |
% |
01/2038 |
2,125 |
2,131 |
|||||||||||||||||||||||||||||||||||||||
|
MAGNE 2025-43A E |
Cayman |
10.80% |
SOFR (Q) |
6.50 |
% |
07/2038 |
1,380 |
1,385 |
|||||||||||||||||||||||||||||||||||||||
|
MDPK 2014-14A |
Cayman |
12.30% |
SOFR (Q) |
8.03 |
% |
10/2030 |
1,000 |
866 |
|||||||||||||||||||||||||||||||||||||||
|
MDPK 2016-20A |
Cayman |
10.68% |
SOFR (Q) |
6.40 |
% |
10/2037 |
2,728 |
2,689 |
|||||||||||||||||||||||||||||||||||||||
|
MDPK 2018-30A |
Cayman |
8.50% |
07/2037 |
750 |
756 |
||||||||||||||||||||||||||||||||||||||||||
|
MDPK 2018-31A |
Cayman |
10.68% |
SOFR (Q) |
6.40 |
% |
07/2037 |
650 |
650 |
|||||||||||||||||||||||||||||||||||||||
|
MDPK 2018-32A |
Cayman |
10.67% |
SOFR (Q) |
6.40 |
% |
07/2037 |
6,050 |
6,039 |
|||||||||||||||||||||||||||||||||||||||
|
MDPK 2019-34A |
Cayman |
10.76% |
SOFR (Q) |
6.50 |
% |
10/2037 |
1,700 |
1,698 |
|||||||||||||||||||||||||||||||||||||||
|
MDPK 2021-59A |
Cayman |
10.67% |
SOFR (Q) |
6.40 |
% |
04/2037 |
2,860 |
2,860 |
|||||||||||||||||||||||||||||||||||||||
|
MDPK 2022-55A |
Cayman |
10.27% |
SOFR (Q) |
6.00 |
% |
07/2037 |
2,100 |
2,083 |
|||||||||||||||||||||||||||||||||||||||
|
MDPK 2022-60A |
Cayman |
10.78% |
SOFR (Q) |
6.50 |
% |
10/2037 |
5,625 |
5,679 |
|||||||||||||||||||||||||||||||||||||||
|
MDPK 2023-61A E |
Jersey |
11.95% |
SOFR (Q) |
7.68 |
% |
01/2037 |
500 |
510 |
|||||||||||||||||||||||||||||||||||||||
|
MDPK 2023-63A |
Cayman |
10.32% |
SOFR (Q) |
6.00 |
% |
07/2038 |
1,500 |
1,507 |
|||||||||||||||||||||||||||||||||||||||
|
MDPK 2024-66A E |
Cayman |
9.85% |
SOFR (Q) |
5.50 |
% |
10/2037 |
2,500 |
2,518 |
|||||||||||||||||||||||||||||||||||||||
|
MDPK 2024-68A E |
Cayman |
9.40% |
SOFR (Q) |
5.10 |
% |
01/2038 |
2,375 |
2,382 |
|||||||||||||||||||||||||||||||||||||||
|
NEUB 2025-60A E |
Cayman |
10.80% |
SOFR (Q) |
6.48 |
% |
04/2039 |
2,100 |
2,163 |
|||||||||||||||||||||||||||||||||||||||
|
NMC CLO-2A ER |
Cayman |
9.96% |
SOFR (Q) |
5.70 |
% |
01/2038 |
938 |
941 |
|||||||||||||||||||||||||||||||||||||||
|
OAKC 2016-13A |
Cayman |
10.02% |
SOFR (Q) |
5.75 |
% |
10/2037 |
1,220 |
1,231 |
|||||||||||||||||||||||||||||||||||||||
|
OAKC 2019-3A |
Cayman |
9.27% |
SOFR (Q) |
5.00 |
% |
01/2038 |
783 |
779 |
|||||||||||||||||||||||||||||||||||||||
|
OAKC 2020-6A |
Cayman |
9.52% |
SOFR (Q) |
5.25 |
% |
10/2037 |
1,100 |
1,103 |
|||||||||||||||||||||||||||||||||||||||
|
OAKC 2021-9A ER |
Cayman |
9.77% |
SOFR (Q) |
5.50 |
% |
10/2037 |
2,050 |
2,070 |
|||||||||||||||||||||||||||||||||||||||
Semi Annual Report 2025
87
CION Ares Diversified Credit Fund
Consolidated Schedule of Investments (continued)
June 30, 2025 (Unaudited)
(in thousands, except shares, percentages and as otherwise noted)
Collateralized Loan Obligations — Debt(b)(c)(d)(e) (continued)
|
Company |
Country(a) |
Investment |
Coupon |
Reference |
Spread |
Acquisition Date |
Maturity Date |
Shares |
Principal Amount(a) |
Fair Value(a) |
% of Net Assets |
||||||||||||||||||||||||||||||||||||
|
OAKC 2022-12A DR |
Bermuda |
9.27% |
SOFR (Q) |
5.00 |
% |
07/2036 |
$ |
5,000 |
$ |
5,019 |
|||||||||||||||||||||||||||||||||||||
|
OCP 2015-10A ER3 |
Cayman Islands |
9.63% |
SOFR (Q) |
5.35 |
% |
01/2038 |
1,000 |
1,003 |
|||||||||||||||||||||||||||||||||||||||
|
OCP 2025-43A E |
Cayman Islands |
10.78% |
SOFR (Q) |
6.50 |
% |
07/2038 |
600 |
613 |
|||||||||||||||||||||||||||||||||||||||
|
OCPA 2023-29A ER |
Jersey |
9.27% |
SOFR (Q) |
5.00 |
% |
01/2036 |
1,000 |
986 |
|||||||||||||||||||||||||||||||||||||||
|
OCPA 2025-41A D2 |
Cayman Islands |
8.00% |
04/2037 |
1,500 |
1,500 |
||||||||||||||||||||||||||||||||||||||||||
|
OCT61 2023-2A ER |
Cayman Islands |
12.17% |
SOFR (Q) |
7.89 |
% |
04/2038 |
850 |
892 |
|||||||||||||||||||||||||||||||||||||||
|
OCT63 2024-2A E |
Cayman Islands |
10.77% |
SOFR (Q) |
6.50 |
% |
07/2037 |
1,167 |
1,187 |
|||||||||||||||||||||||||||||||||||||||
|
OHACP 2024-17A E |
Cayman Islands |
9.40% |
SOFR (Q) |
5.00 |
% |
01/2038 |
3,000 |
3,012 |
|||||||||||||||||||||||||||||||||||||||
|
PIPK 2025-18A E |
Cayman Islands |
10.04% |
SOFR (Q) |
5.75 |
% |
04/2038 |
1,250 |
1,271 |
|||||||||||||||||||||||||||||||||||||||
|
PXLY 2024-1A E |
Cayman Islands |
9.30% |
SOFR (Q) |
5.00 |
% |
01/2037 |
6,550 |
6,620 |
|||||||||||||||||||||||||||||||||||||||
| RRAM 2025-37A D |
Cayman Islands |
8.96% |
SOFR (Q) |
4.65 |
% |
04/2038 |
1,063 |
1,064 |
|||||||||||||||||||||||||||||||||||||||
|
SIXST 2022-21A ER |
Cayman Islands |
10.02% |
SOFR (Q) |
5.75 |
% |
10/2037 |
2,025 |
2,050 |
|||||||||||||||||||||||||||||||||||||||
|
SIXST 2024-27A E |
Cayman Islands |
9.61% |
SOFR (Q) |
5.25 |
% |
01/2038 |
1,750 |
1,770 |
|||||||||||||||||||||||||||||||||||||||
|
SIXST 2025-28A E |
Cayman Islands |
9.78% |
SOFR (Q) |
5.45 |
% |
04/2038 |
425 |
432 |
|||||||||||||||||||||||||||||||||||||||
|
STKPK 2022-1A ER |
Jersey |
10.41% |
SOFR (Q) |
6.15 |
% |
10/2037 |
3,375 |
3,389 |
|||||||||||||||||||||||||||||||||||||||
|
SYMP 2022-33A E1R |
Jersey |
9.63% |
SOFR (Q) |
5.35 |
% |
01/2038 |
2,500 |
2,452 |
|||||||||||||||||||||||||||||||||||||||
|
SYMP 2023-40A ER |
Bermuda |
9.49% |
SOFR (Q) |
5.25 |
% |
01/2038 |
1,500 |
1,504 |
|||||||||||||||||||||||||||||||||||||||
|
TCIFC 2024-2A E |
Cayman Islands |
9.53% |
SOFR (Q) |
5.25 |
% |
01/2037 |
4,100 |
4,157 |
|||||||||||||||||||||||||||||||||||||||
|
VOYA 2021-3A D2R |
Cayman Islands |
8.15% |
04/2038 |
1,875 |
1,892 |
||||||||||||||||||||||||||||||||||||||||||
|
VOYA 2021-3A ER |
Cayman Islands |
10.16% |
SOFR (Q) |
5.90 |
% |
04/2038 |
2,500 |
2,535 |
|||||||||||||||||||||||||||||||||||||||
|
VOYA 2024-1A E |
Cayman Islands |
10.91% |
SOFR (Q) |
6.65 |
% |
04/2037 |
1,682 |
1,713 |
|||||||||||||||||||||||||||||||||||||||
|
VOYA 2025-2A E |
Cayman Islands |
10.55% |
SOFR (Q) |
6.25 |
% |
07/2038 |
2,775 |
2,810 |
|||||||||||||||||||||||||||||||||||||||
|
WILDPK 2024-1A E |
Jersey |
10.02% |
SOFR (Q) |
5.75 |
% |
10/2037 |
1,118 |
1,131 |
|||||||||||||||||||||||||||||||||||||||
|
264,309 |
5.44 |
% |
|||||||||||||||||||||||||||||||||||||||||||||
|
Total Collateralized Loan Obligations — Debt (Cost $262,597) |
264,309 |
5.44 |
% |
||||||||||||||||||||||||||||||||||||||||||||
Semi Annual Report 2025
88
CION Ares Diversified Credit Fund
Consolidated Schedule of Investments (continued)
June 30, 2025 (Unaudited)
(in thousands, except shares, percentages and as otherwise noted)
Collateralized Loan Obligations — Equity(d)(e)
|
Company |
Country(a) |
Investment |
Coupon |
Reference |
Spread |
Acquisition |
Maturity |
Shares |
Principal |
Fair Value(a) |
% of Net |
||||||||||||||||||||||||||||||||||||
|
AIMCO 2020-11A |
Cayman |
19.91 |
% |
10/2034 |
$ |
7,971 |
$ |
6,617 |
|||||||||||||||||||||||||||||||||||||||
|
AIMCO 2021-16A |
Cayman |
14.70 |
% |
07/2037 |
5,882 |
4,255 |
|||||||||||||||||||||||||||||||||||||||||
|
AIMCO 2023-20A |
Cayman |
12.55 |
% |
10/2036 |
1,500 |
1,173 |
|||||||||||||||||||||||||||||||||||||||||
|
AIMCO 2024-22A |
Jersey |
13.86 |
% |
04/2037 |
700 |
568 |
|||||||||||||||||||||||||||||||||||||||||
|
AIMCO 2025-23A |
Cayman |
04/2038 |
8,870 |
8,362 |
|||||||||||||||||||||||||||||||||||||||||||
|
ANCHC 2021-20A |
Cayman |
6.81 |
% |
01/2035 |
3,500 |
1,515 |
|||||||||||||||||||||||||||||||||||||||||
|
ANCHC 2021-20X |
Cayman |
6.81 |
% |
01/2035 |
1,150 |
498 |
|||||||||||||||||||||||||||||||||||||||||
|
ANCHF 2015-1A |
Cayman |
07/2037 |
4,860 |
3,576 |
|||||||||||||||||||||||||||||||||||||||||||
|
ANCHF 2015-2A |
Cayman |
04/2038 |
4,550 |
3,183 |
|||||||||||||||||||||||||||||||||||||||||||
|
ANCHF 2016-3A |
Cayman |
01/2039 |
3,360 |
2,124 |
|||||||||||||||||||||||||||||||||||||||||||
|
ANCHF 2016-4A |
Cayman |
04/2039 |
4,830 |
2,793 |
|||||||||||||||||||||||||||||||||||||||||||
|
ANCHF 2018-5A |
Cayman |
04/2036 |
4,682 |
2,783 |
|||||||||||||||||||||||||||||||||||||||||||
|
ANCHF 2018-6A |
Cayman |
07/2036 |
1,800 |
729 |
|||||||||||||||||||||||||||||||||||||||||||
|
ANCHF 2019-7A |
Cayman |
04/2037 |
1,420 |
733 |
|||||||||||||||||||||||||||||||||||||||||||
|
ANCHF 2019-8A |
Cayman |
07/2037 |
404 |
202 |
|||||||||||||||||||||||||||||||||||||||||||
|
ANCHF 2019-9A |
Cayman |
10/2037 |
930 |
563 |
|||||||||||||||||||||||||||||||||||||||||||
|
ANCHF 2020-10A |
Cayman |
04/2038 |
1,731 |
991 |
|||||||||||||||||||||||||||||||||||||||||||
|
ATRM 14A SUB |
Cayman |
15.19 |
% |
10/2037 |
17,839 |
9,902 |
|||||||||||||||||||||||||||||||||||||||||
|
ATRM 14X SUB |
Cayman |
11.93 |
% |
10/2037 |
510 |
283 |
|||||||||||||||||||||||||||||||||||||||||
|
ATRM 15A SUB |
Cayman |
9.23 |
% |
01/2031 |
4,080 |
1,807 |
|||||||||||||||||||||||||||||||||||||||||
|
Ballyrock CLO 21, |
Jersey |
13.29 |
% |
10/2037 |
2,730 |
2,217 |
|||||||||||||||||||||||||||||||||||||||||
|
BCC 2017-2A SUB |
Cayman |
8.45 |
% |
07/2037 |
5,051 |
2,543 |
|||||||||||||||||||||||||||||||||||||||||
|
BCC 2018-1A SUB |
Cayman |
04/2031 |
1,420 |
25 |
|||||||||||||||||||||||||||||||||||||||||||
|
BCC 2019-2A SUB |
Cayman |
10/2032 |
810 |
253 |
|||||||||||||||||||||||||||||||||||||||||||
|
BCC 2020-2A SUB |
Cayman |
27.54 |
% |
07/2034 |
800 |
337 |
|||||||||||||||||||||||||||||||||||||||||
Semi Annual Report 2025
89
CION Ares Diversified Credit Fund
Consolidated Schedule of Investments (continued)
June 30, 2025 (Unaudited)
(in thousands, except shares, percentages and as otherwise noted)
Collateralized Loan Obligations — Equity(d)(e) (continued)
|
Company |
Country(a) |
Investment |
Coupon |
Reference |
Spread |
Acquisition |
Maturity |
Shares |
Principal |
Fair Value(a) |
% of Net |
||||||||||||||||||||||||||||||||||||
|
BCC 2021-2A SUB |
Cayman |
12.83% |
07/2034 |
$ |
1,000 |
$ |
395 |
||||||||||||||||||||||||||||||||||||||||
|
BCC 2022-1A SUB |
Cayman |
10.38% |
04/2035 |
10,016 |
4,220 |
||||||||||||||||||||||||||||||||||||||||||
|
BCC 2024-2A SUB |
Jersey |
14.20% |
07/2037 |
1,620 |
1,249 |
||||||||||||||||||||||||||||||||||||||||||
|
BERRY 2024-1A M |
Jersey |
10/2037 |
3,580 |
212 |
|||||||||||||||||||||||||||||||||||||||||||
|
BERRY 2024-1A |
Jersey |
13.84% |
10/2037 |
3,580 |
2,746 |
||||||||||||||||||||||||||||||||||||||||||
|
BSP 2024-37A |
Cayman |
15.46% |
01/2038 |
6,670 |
7,150 |
||||||||||||||||||||||||||||||||||||||||||
|
CEDF 2021-14A |
Cayman |
18.71% |
07/2033 |
1,450 |
718 |
||||||||||||||||||||||||||||||||||||||||||
|
CGMS 2018-3A |
Cayman |
10/2030 |
750 |
232 |
|||||||||||||||||||||||||||||||||||||||||||
|
CGMS 2018-4A |
Cayman |
11.95% |
01/2031 |
3,487 |
1,546 |
||||||||||||||||||||||||||||||||||||||||||
|
CGMS 2019-3A |
Cayman |
10.95% |
04/2037 |
4,600 |
2,489 |
||||||||||||||||||||||||||||||||||||||||||
|
CGMS 2021-2A |
Cayman |
17.40% |
04/2038 |
6,457 |
4,462 |
||||||||||||||||||||||||||||||||||||||||||
|
CGMS 2021-4A |
Cayman |
12.05% |
04/2034 |
3,060 |
1,749 |
||||||||||||||||||||||||||||||||||||||||||
|
CGMS 2021-5A |
Cayman |
16.70% |
07/2034 |
500 |
233 |
||||||||||||||||||||||||||||||||||||||||||
|
CGMS 2021-8A |
Cayman |
12.36% |
10/2034 |
1,000 |
473 |
||||||||||||||||||||||||||||||||||||||||||
|
CGMS 2023-5A |
Cayman |
8.56% |
01/2036 |
3,080 |
2,550 |
||||||||||||||||||||||||||||||||||||||||||
|
CGMS 2024-3A |
Cayman |
13.30% |
07/2036 |
3,750 |
2,653 |
||||||||||||||||||||||||||||||||||||||||||
|
CGMS 2024-5A |
Cayman |
13.37% |
10/2036 |
2,580 |
2,166 |
||||||||||||||||||||||||||||||||||||||||||
|
CIFC 2015-4A |
Cayman |
7.46% |
04/2034 |
2,252 |
637 |
||||||||||||||||||||||||||||||||||||||||||
|
CIFC 2018-1A |
Cayman |
15.29% |
01/2038 |
3,982 |
1,675 |
||||||||||||||||||||||||||||||||||||||||||
|
CIFC 2019-1A |
Cayman |
16.92% |
10/2037 |
3,065 |
1,880 |
||||||||||||||||||||||||||||||||||||||||||
|
CIFC 2019-FAL |
Cayman |
9.73% |
01/2033 |
3,050 |
1,160 |
||||||||||||||||||||||||||||||||||||||||||
|
CIFC 2020-3A |
Cayman |
13.84% |
10/2034 |
1,141 |
725 |
||||||||||||||||||||||||||||||||||||||||||
|
CIFC 2021-2A |
Cayman |
13.33% |
04/2034 |
3,080 |
1,731 |
||||||||||||||||||||||||||||||||||||||||||
|
CIFC 2021-5A |
Cayman |
15.31% |
01/2038 |
6,901 |
4,551 |
||||||||||||||||||||||||||||||||||||||||||
|
CIFC 2021-7A |
Cayman |
19.79% |
01/2035 |
250 |
149 |
||||||||||||||||||||||||||||||||||||||||||
|
CIFC 2022-2A |
Cayman |
20.70% |
04/2035 |
1,900 |
1,446 |
||||||||||||||||||||||||||||||||||||||||||
Semi Annual Report 2025
90
CION Ares Diversified Credit Fund
Consolidated Schedule of Investments (continued)
June 30, 2025 (Unaudited)
(in thousands, except shares, percentages and as otherwise noted)
Collateralized Loan Obligations — Equity(d)(e) (continued)
|
Company |
Country(a) |
Investment |
Coupon |
Reference |
Spread |
Acquisition |
Maturity |
Shares |
Principal |
Fair Value(a) |
% of Net |
||||||||||||||||||||||||||||||||||||
|
CIFC 2024-3A |
Cayman |
12.83% |
07/2037 |
$ |
680 |
$ |
570 |
||||||||||||||||||||||||||||||||||||||||
|
CIFC 2024-4A |
Cayman |
13.69% |
10/2037 |
3,570 |
3,216 |
||||||||||||||||||||||||||||||||||||||||||
|
CIFC 2025-3A |
Cayman |
07/2038 |
7,712 |
6,711 |
|||||||||||||||||||||||||||||||||||||||||||
|
CLRMPK 2025-1A M |
Cayman |
04/2038 |
12,479 |
455 |
|||||||||||||||||||||||||||||||||||||||||||
|
CLRMPK 2025-1A |
Cayman |
04/2038 |
12,479 |
10,980 |
|||||||||||||||||||||||||||||||||||||||||||
|
DAVIS 2022-1A |
04/2035 |
7,250 |
56 |
||||||||||||||||||||||||||||||||||||||||||||
|
DAVIS 2022-1A |
04/2035 |
7,250 |
136 |
||||||||||||||||||||||||||||||||||||||||||||
|
DAVIS 2022-1A |
16.14% |
04/2035 |
7,250 |
4,857 |
|||||||||||||||||||||||||||||||||||||||||||
|
DCLO 2021-1A |
Cayman |
14.18% |
10/2037 |
1,445 |
1,218 |
||||||||||||||||||||||||||||||||||||||||||
|
DRSLF 2021-95A |
Cayman |
17.10% |
08/2034 |
1,500 |
642 |
||||||||||||||||||||||||||||||||||||||||||
|
DRSLF 2022-98A |
Cayman |
10.51% |
04/2035 |
4,000 |
1,835 |
||||||||||||||||||||||||||||||||||||||||||
|
DRSLF 2022-98X |
Cayman |
10.52% |
04/2035 |
1,000 |
459 |
||||||||||||||||||||||||||||||||||||||||||
|
ELM11 2021-4A |
Cayman |
17.95% |
10/2034 |
4,320 |
3,800 |
||||||||||||||||||||||||||||||||||||||||||
|
ELM15 2022-2A |
10.86% |
04/2035 |
3,050 |
1,676 |
|||||||||||||||||||||||||||||||||||||||||||
|
ELM17 2022-4A |
Cayman |
16.44% |
07/2037 |
2,880 |
2,039 |
||||||||||||||||||||||||||||||||||||||||||
|
ELM24 2023-3A |
Cayman |
12.49% |
12/2033 |
1,555 |
1,074 |
||||||||||||||||||||||||||||||||||||||||||
|
ELM26 2024-1A |
Cayman |
10.21% |
04/2037 |
800 |
561 |
||||||||||||||||||||||||||||||||||||||||||
|
ELM32 2024-8A |
Cayman |
13.47% |
10/2037 |
3,450 |
2,830 |
||||||||||||||||||||||||||||||||||||||||||
|
ELM35 2024-11A |
Cayman |
12.55% |
10/2037 |
1,990 |
1,622 |
||||||||||||||||||||||||||||||||||||||||||
|
ELMW5 2020-2A |
Cayman |
18.75% |
10/2037 |
2,500 |
1,575 |
||||||||||||||||||||||||||||||||||||||||||
|
ELMW8 2021-1A |
Cayman |
14.93% |
01/2034 |
2,003 |
774 |
||||||||||||||||||||||||||||||||||||||||||
|
ELMW8 2021-1X |
Cayman |
14.91% |
01/2034 |
385 |
149 |
||||||||||||||||||||||||||||||||||||||||||
|
ELMWOOD |
08/2099 |
1,260 |
1,260 |
||||||||||||||||||||||||||||||||||||||||||||
|
GNRT 2022-10A |
Cayman |
24.80% |
01/2038 |
6,500 |
5,331 |
||||||||||||||||||||||||||||||||||||||||||
|
GNRT 2024-18A |
Cayman |
16.79% |
01/2038 |
8,160 |
7,810 |
||||||||||||||||||||||||||||||||||||||||||
Semi Annual Report 2025
91
CION Ares Diversified Credit Fund
Consolidated Schedule of Investments (continued)
June 30, 2025 (Unaudited)
(in thousands, except shares, percentages and as otherwise noted)
Collateralized Loan Obligations — Equity(d)(e) (continued)
|
Company |
Country(a) |
Investment |
Coupon |
Reference |
Spread |
Acquisition |
Maturity |
Shares |
Principal |
Fair Value(a) |
% of Net |
||||||||||||||||||||||||||||||||||||
|
GNRT 2024-20A |
Cayman |
15.77% |
01/2038 |
$ |
11,050 |
$ |
9,608 |
||||||||||||||||||||||||||||||||||||||||
|
GNRT 7A SUB |
Cayman |
14.07% |
04/2037 |
4,000 |
2,055 |
||||||||||||||||||||||||||||||||||||||||||
|
GNRT 9A SUB |
Cayman |
16.94% |
10/2034 |
1,000 |
666 |
||||||||||||||||||||||||||||||||||||||||||
|
HPPK 2024-1A |
Jersey |
14.48% |
10/2037 |
2,900 |
2,329 |
||||||||||||||||||||||||||||||||||||||||||
|
HRPK 2020-1A |
Cayman |
13.94% |
04/2034 |
3,985 |
2,593 |
||||||||||||||||||||||||||||||||||||||||||
|
INVCO 2021-2A |
Cayman |
16.90% |
07/2034 |
440 |
138 |
||||||||||||||||||||||||||||||||||||||||||
|
INVCO 2021-2A Y |
Cayman |
07/2034 |
44 |
12 |
|||||||||||||||||||||||||||||||||||||||||||
|
INVCO 2021-3A |
Cayman |
21.75% |
10/2034 |
2,700 |
957 |
||||||||||||||||||||||||||||||||||||||||||
|
INVCO 2021-3A Y |
Cayman |
10/2034 |
270 |
77 |
|||||||||||||||||||||||||||||||||||||||||||
|
INVCO 2021-3X |
Cayman |
21.75% |
10/2034 |
957 |
339 |
||||||||||||||||||||||||||||||||||||||||||
|
INVCO 2021-3X Y |
Cayman |
10/2034 |
96 |
27 |
|||||||||||||||||||||||||||||||||||||||||||
|
INVCO 2023-1A |
Jersey |
10.88% |
04/2037 |
2,695 |
1,694 |
||||||||||||||||||||||||||||||||||||||||||
|
INVCO 2023-1A Y |
Jersey |
04/2037 |
270 |
101 |
|||||||||||||||||||||||||||||||||||||||||||
|
KKR 2024-50A |
Cayman |
7.61% |
04/2037 |
1,948 |
1,268 |
||||||||||||||||||||||||||||||||||||||||||
|
KKR 2024-53A |
Cayman |
12.16% |
01/2038 |
7,000 |
5,935 |
||||||||||||||||||||||||||||||||||||||||||
|
KKR 2024-56A |
Cayman |
14.78% |
10/2037 |
4,240 |
3,235 |
||||||||||||||||||||||||||||||||||||||||||
|
MAGNE 2020-28A |
Cayman |
19.86% |
01/2035 |
5,886 |
4,723 |
||||||||||||||||||||||||||||||||||||||||||
|
MAGNE 2024-38A |
8.67% |
04/2037 |
362 |
277 |
|||||||||||||||||||||||||||||||||||||||||||
|
MAGNE 2024-44A |
11.92% |
10/2037 |
4,670 |
3,858 |
|||||||||||||||||||||||||||||||||||||||||||
|
Magnetite XLVIII, |
06/2099 |
1,518 |
1,518 |
||||||||||||||||||||||||||||||||||||||||||||
|
MDPK 2015-17A |
Cayman |
15.25% |
07/2045 |
35,192 |
5,433 |
||||||||||||||||||||||||||||||||||||||||||
|
MDPK 2015-17X |
Cayman |
15.25% |
07/2030 |
3,660 |
565 |
||||||||||||||||||||||||||||||||||||||||||
|
MDPK 2016-22A |
Cayman |
13.13% |
01/2033 |
10,434 |
5,546 |
||||||||||||||||||||||||||||||||||||||||||
|
MDPK 2018-28A |
Cayman |
11.94% |
07/2030 |
1,750 |
806 |
||||||||||||||||||||||||||||||||||||||||||
|
MDPK 2018-30A |
Cayman |
13.45% |
07/2027 |
12,921 |
6,622 |
||||||||||||||||||||||||||||||||||||||||||
|
MDPK 2018-31A |
Cayman |
9.42% |
07/2037 |
6,206 |
3,051 |
||||||||||||||||||||||||||||||||||||||||||
Semi Annual Report 2025
92
CION Ares Diversified Credit Fund
Consolidated Schedule of Investments (continued)
June 30, 2025 (Unaudited)
(in thousands, except shares, percentages and as otherwise noted)
Collateralized Loan Obligations — Equity(d)(e) (continued)
|
Company |
Country(a) |
Investment |
Coupon |
Reference |
Spread |
Acquisition |
Maturity |
Shares |
Principal |
Fair Value(a) |
% of Net |
||||||||||||||||||||||||||||||||||||
|
MDPK 2018-32A |
Cayman |
10.65% |
01/2048 |
$ |
3,535 |
$ |
1,702 |
||||||||||||||||||||||||||||||||||||||||
|
MDPK 2018-32X |
Cayman |
9.74% |
01/2048 |
710 |
342 |
||||||||||||||||||||||||||||||||||||||||||
|
MDPK 2019-34A |
Cayman |
13.10% |
04/2048 |
870 |
472 |
||||||||||||||||||||||||||||||||||||||||||
|
MDPK 2019-37A |
Cayman |
14.58% |
04/2037 |
8,889 |
4,857 |
||||||||||||||||||||||||||||||||||||||||||
|
MDPK 2021-38A |
Cayman |
6.79% |
07/2034 |
1,290 |
727 |
||||||||||||||||||||||||||||||||||||||||||
|
MDPK 2021-50A |
Cayman |
5.00% |
04/2034 |
2,500 |
1,374 |
||||||||||||||||||||||||||||||||||||||||||
|
MDPK 2021-59A |
Cayman |
5.89% |
04/2037 |
5,865 |
3,753 |
||||||||||||||||||||||||||||||||||||||||||
|
MDPK 2021-59X |
Cayman |
4.66% |
04/2037 |
1,500 |
960 |
||||||||||||||||||||||||||||||||||||||||||
|
MDPK 2022-53A |
Cayman |
7.15% |
04/2035 |
6,000 |
3,074 |
||||||||||||||||||||||||||||||||||||||||||
|
MDPK 2022-55A |
Cayman |
24.79% |
07/2037 |
3,025 |
2,441 |
||||||||||||||||||||||||||||||||||||||||||
|
MDPK 2022-60A |
Cayman |
12.58% |
10/2037 |
691 |
536 |
||||||||||||||||||||||||||||||||||||||||||
|
MDPK 2023-63A |
Cayman |
15.40% |
07/2038 |
6,408 |
4,288 |
||||||||||||||||||||||||||||||||||||||||||
|
MDPK 2024-66A |
Cayman |
13.53% |
10/2037 |
1,910 |
1,869 |
||||||||||||||||||||||||||||||||||||||||||
|
MDPK 2024-67A |
Cayman |
10.69% |
04/2037 |
265 |
221 |
||||||||||||||||||||||||||||||||||||||||||
|
MDPK 2025-71A |
Cayman |
04/2038 |
3,000 |
3,022 |
|||||||||||||||||||||||||||||||||||||||||||
|
MDPK 2025-72A |
Cayman |
07/2038 |
8,300 |
8,300 |
(k) |
||||||||||||||||||||||||||||||||||||||||||
|
OAKC 2012-7A |
Cayman |
21.51% |
02/2038 |
500 |
307 |
||||||||||||||||||||||||||||||||||||||||||
|
OAKC 2014-10RA |
Cayman |
16.58% |
04/2038 |
4,658 |
2,244 |
||||||||||||||||||||||||||||||||||||||||||
|
OAKC 2014-10RX |
Cayman |
17.82% |
04/2038 |
1,000 |
482 |
||||||||||||||||||||||||||||||||||||||||||
|
OAKC 2015-11A |
Cayman |
9.84% |
04/2037 |
500 |
282 |
||||||||||||||||||||||||||||||||||||||||||
|
OAKC 2015-12A |
Cayman |
8.26% |
04/2037 |
12,070 |
6,739 |
||||||||||||||||||||||||||||||||||||||||||
|
OAKC 2016-13A |
Cayman |
10.07% |
10/2037 |
2,320 |
1,609 |
||||||||||||||||||||||||||||||||||||||||||
|
OAKC 2016-13X |
Cayman |
10.07% |
01/2030 |
1,100 |
763 |
||||||||||||||||||||||||||||||||||||||||||
|
OAKC 2017-14A |
Cayman |
11.65% |
07/2037 |
3,043 |
2,316 |
||||||||||||||||||||||||||||||||||||||||||
|
OAKC 2017-15A |
Cayman |
9.93% |
01/2030 |
10,142 |
4,946 |
||||||||||||||||||||||||||||||||||||||||||
|
OAKC 2018-1A |
Cayman |
10.44% |
04/2037 |
1,913 |
1,467 |
||||||||||||||||||||||||||||||||||||||||||
Semi Annual Report 2025
93
CION Ares Diversified Credit Fund
Consolidated Schedule of Investments (continued)
June 30, 2025 (Unaudited)
(in thousands, except shares, percentages and as otherwise noted)
Collateralized Loan Obligations — Equity(d)(e) (continued)
|
Company |
Country(a) |
Investment |
Coupon |
Reference |
Spread |
Acquisition |
Maturity |
Shares |
Principal |
Fair Value(a) |
% of Net |
||||||||||||||||||||||||||||||||||||
|
OAKC 2019-2A |
Cayman |
13.20% |
01/2038 |
$ |
670 |
$ |
624 |
||||||||||||||||||||||||||||||||||||||||
|
OAKC 2019-3A |
Cayman |
11.58% |
07/2032 |
3,110 |
2,541 |
||||||||||||||||||||||||||||||||||||||||||
|
OAKC 2020-5A |
Cayman |
10.88% |
10/2037 |
3,370 |
3,078 |
||||||||||||||||||||||||||||||||||||||||||
|
OAKC 2020-6A |
Cayman |
10.79% |
10/2037 |
3,209 |
3,297 |
||||||||||||||||||||||||||||||||||||||||||
|
OAKC 2021-16A |
Cayman |
15.32% |
10/2034 |
5,988 |
4,543 |
||||||||||||||||||||||||||||||||||||||||||
|
OAKC 2021-8A |
Cayman |
13.17% |
01/2038 |
640 |
577 |
||||||||||||||||||||||||||||||||||||||||||
|
OAKC 2021-9A |
Cayman |
11.77% |
10/2037 |
1,190 |
1,108 |
||||||||||||||||||||||||||||||||||||||||||
|
OCP 2023-30A |
Jersey |
12.48% |
01/2037 |
3,850 |
2,734 |
||||||||||||||||||||||||||||||||||||||||||
|
OCP 2024-34A |
14.62% |
10/2037 |
750 |
595 |
|||||||||||||||||||||||||||||||||||||||||||
|
OCP Preferred |
Cayman |
4.85% |
07/2031 |
11 |
5,500 |
||||||||||||||||||||||||||||||||||||||||||
|
OHACP 2024-17A |
Cayman |
11.82% |
01/2038 |
2,070 |
1,924 |
||||||||||||||||||||||||||||||||||||||||||
|
OHALF 2013-1A |
Cayman |
12.66% |
04/2037 |
1,935 |
729 |
||||||||||||||||||||||||||||||||||||||||||
|
OHALF 2016-1A |
Cayman |
18.46% |
07/2037 |
9,782 |
5,906 |
||||||||||||||||||||||||||||||||||||||||||
|
RESPK 2020-1A |
Cayman |
01/2038 |
4,261 |
198 |
|||||||||||||||||||||||||||||||||||||||||||
|
RESPK 2020-1A |
Cayman |
17.45% |
01/2038 |
3,278 |
1,960 |
||||||||||||||||||||||||||||||||||||||||||
|
Riviera Loan |
03/2035 |
900 |
900 |
||||||||||||||||||||||||||||||||||||||||||||
|
ROCKP 2021-1A |
Cayman |
04/2034 |
1,000 |
16 |
|||||||||||||||||||||||||||||||||||||||||||
|
ROCKP 2021-1A |
Cayman |
04/2034 |
1,000 |
24 |
|||||||||||||||||||||||||||||||||||||||||||
|
ROCKP 2021-1A |
Cayman |
10.59% |
04/2034 |
1,000 |
510 |
||||||||||||||||||||||||||||||||||||||||||
|
ROCKP 2021-1X |
Cayman |
04/2034 |
1,100 |
18 |
|||||||||||||||||||||||||||||||||||||||||||
|
ROCKP 2021-1X |
Cayman |
04/2034 |
1,100 |
27 |
|||||||||||||||||||||||||||||||||||||||||||
|
ROCKP 2021-1X |
Cayman |
10.59% |
04/2034 |
1,100 |
561 |
||||||||||||||||||||||||||||||||||||||||||
|
RRAM 2021-17A |
Cayman |
29.38% |
07/2034 |
1,000 |
365 |
||||||||||||||||||||||||||||||||||||||||||
|
RRAM 2021-19A |
Cayman |
18.34% |
10/2121 |
1,226 |
1,001 |
||||||||||||||||||||||||||||||||||||||||||
|
RRAM 2022-21A |
Bermuda |
8.41% |
01/2123 |
13,070 |
7,663 |
||||||||||||||||||||||||||||||||||||||||||
Semi Annual Report 2025
94
CION Ares Diversified Credit Fund
Consolidated Schedule of Investments (continued)
June 30, 2025 (Unaudited)
(in thousands, except shares, percentages and as otherwise noted)
Collateralized Loan Obligations — Equity(d)(e) (continued)
|
Company |
Country(a) |
Investment |
Coupon |
Reference |
Spread |
Acquisition Date |
Maturity Date |
Shares |
Principal Amount(a) |
Fair Value(a) |
% of Net Assets |
||||||||||||||||||||||||||||||||||||
|
RRAM 2023-26A SUB |
Cayman Islands |
21.43% |
04/2123 |
$ |
14,483 |
$ |
11,432 |
||||||||||||||||||||||||||||||||||||||||
|
RRAM 2024-29RA SUB |
Cayman Islands |
15.44% |
07/2039 |
515 |
307 |
||||||||||||||||||||||||||||||||||||||||||
|
RRAM 2024-30A SUB |
Cayman Islands |
12.54% |
07/2036 |
6,000 |
5,059 |
||||||||||||||||||||||||||||||||||||||||||
|
RRAM 2024-33A SUB |
Bermuda |
11.01% |
10/2039 |
3,850 |
3,179 |
||||||||||||||||||||||||||||||||||||||||||
|
RRAM 2025-38A SUB |
Cayman Islands |
13.14% |
04/2040 |
2,240 |
1,963 |
||||||||||||||||||||||||||||||||||||||||||
|
RRAMX 2022-7A SUB |
Cayman Islands |
7.94% |
07/2122 |
2,175 |
1,012 |
||||||||||||||||||||||||||||||||||||||||||
|
SIXST 2021-17A SUB |
Cayman Islands |
18.72% |
04/2125 |
6,000 |
4,487 |
||||||||||||||||||||||||||||||||||||||||||
|
SIXST 2022-21A SUB |
Cayman Islands |
15.97% |
10/2037 |
4,161 |
2,807 |
||||||||||||||||||||||||||||||||||||||||||
|
SIXST 2025-28A SUB |
Cayman Islands |
04/2125 |
1,703 |
1,431 |
|||||||||||||||||||||||||||||||||||||||||||
|
SIXST 2025-29A SUB |
07/2038 |
267 |
267 |
||||||||||||||||||||||||||||||||||||||||||||
|
SIXST 2025-29A SUB |
Cayman Islands |
07/2038 |
480 |
433 |
(k) |
||||||||||||||||||||||||||||||||||||||||||
|
SPEAK 2024-11A SUB |
Cayman Islands |
18.91% |
07/2037 |
3,300 |
2,962 |
||||||||||||||||||||||||||||||||||||||||||
|
STKPK 2022-1A M |
Jersey |
10/2037 |
17,520 |
522 |
|||||||||||||||||||||||||||||||||||||||||||
|
STKPK 2022-1A SUB |
Jersey |
14.37% |
10/2037 |
17,520 |
13,617 |
||||||||||||||||||||||||||||||||||||||||||
|
VOYA 2024-1A SUB |
Cayman Islands |
13.88% |
04/2037 |
3,104 |
2,467 |
||||||||||||||||||||||||||||||||||||||||||
|
VOYA 2025-2A SUB |
Cayman Islands |
07/2038 |
9,503 |
8,622 |
|||||||||||||||||||||||||||||||||||||||||||
|
WLLMN 2021-1A M1 |
Cayman Islands |
07/2034 |
2,550 |
60 |
|||||||||||||||||||||||||||||||||||||||||||
|
WLLMN 2021-1A M2 |
Cayman Islands |
07/2034 |
3,640 |
114 |
|||||||||||||||||||||||||||||||||||||||||||
|
WLLMN 2021-1A SUB |
Cayman Islands |
14.02% |
07/2037 |
2,550 |
1,652 |
||||||||||||||||||||||||||||||||||||||||||
|
400,183 |
8.24 |
% |
|||||||||||||||||||||||||||||||||||||||||||||
|
Total Collateralized Loan Obligations — Equity (Cost $412,961) |
400,183 |
8.24 |
% |
||||||||||||||||||||||||||||||||||||||||||||
|
Mortgage-Backed Security(d)(e) |
|||||||||||||||||||||||||||||||||||||||||||||||
|
Financial Services |
|||||||||||||||||||||||||||||||||||||||||||||||
| CPFTR 2025-1 | 8.38% |
07/2026 |
23,108 |
23,279 |
|||||||||||||||||||||||||||||||||||||||||||
|
23,279 |
0.48 |
% |
|||||||||||||||||||||||||||||||||||||||||||||
|
Total Mortgage-Backed Security (Cost $23,108) |
23,279 |
0.48 |
% |
||||||||||||||||||||||||||||||||||||||||||||
Semi Annual Report 2025
95
CION Ares Diversified Credit Fund
Consolidated Schedule of Investments (continued)
June 30, 2025 (Unaudited)
(in thousands, except shares, percentages and as otherwise noted)
Private Asset-Backed Investment(b)(c)(d)(e)
|
Company |
Country(a) |
Investment |
Coupon |
Reference |
Spread |
Acquisition Date |
Maturity Date |
Shares |
Principal Amount(a) |
Fair Value(a) |
% of Net Assets |
||||||||||||||||||||||||||||||||||||
|
Commercial and Professional Services |
|||||||||||||||||||||||||||||||||||||||||||||||
|
GCM HVAC HOLDCO, LLC |
14.00% PIK |
09/2031 |
$ |
1,508 |
$ |
1,508 |
|||||||||||||||||||||||||||||||||||||||||
|
1,508 |
0.03 |
% |
|||||||||||||||||||||||||||||||||||||||||||||
|
Consumer Services |
|||||||||||||||||||||||||||||||||||||||||||||||
|
CFG Investments WH Limited |
10.44% |
SOFR (M) |
6.00 |
% |
03/2031 |
1,643 |
1,643 |
(g) |
|||||||||||||||||||||||||||||||||||||||
|
1,643 |
0.03 |
% |
|||||||||||||||||||||||||||||||||||||||||||||
|
Equity Real Estate Investment Trusts (REITs) |
|||||||||||||||||||||||||||||||||||||||||||||||
|
Vantage Data Centers Europe S.a r.l. |
Luxembourg |
8.87% | EURIBOR (M) |
6.85 |
% |
05/2029 |
€ |
3,974 |
4,681 |
(g) |
|||||||||||||||||||||||||||||||||||||
|
4,681 |
0.10 |
% |
|||||||||||||||||||||||||||||||||||||||||||||
|
Financial Services |
|||||||||||||||||||||||||||||||||||||||||||||||
|
Adonis Financial Funding, LLC |
12/2026 |
417 |
189 |
(g)(i) |
|||||||||||||||||||||||||||||||||||||||||||
|
ASF COPPER, L.P., |
7.92% | EURIBOR (Q) |
6.00 |
% |
08/2028 |
€ |
137 |
162 |
|||||||||||||||||||||||||||||||||||||||
|
ASF POLLOCK, L.P., |
10.30% |
SOFR (Q) |
6.00 |
% |
08/2028 |
272 |
272 |
||||||||||||||||||||||||||||||||||||||||
|
ASF POLLOCK, L.P., |
7.92% | EURIBOR (Q) |
6.00 |
% |
08/2028 |
€ |
72 |
85 |
|||||||||||||||||||||||||||||||||||||||
|
ASF VII WAGNER B L.P., |
United Kingdom |
10.30% |
SOFR (Q) |
6.00 |
% |
08/2028 |
217 |
217 |
|||||||||||||||||||||||||||||||||||||||
|
ASF VII WAGNER B L.P., |
United Kingdom |
7.92% | EURIBOR (Q) |
6.00 |
% |
08/2028 |
€ |
140 |
165 |
||||||||||||||||||||||||||||||||||||||
|
ASF VII WAGNER L.P., |
United Kingdom |
10.30% |
SOFR (Q) |
6.00 |
% |
08/2028 |
462 |
462 |
|||||||||||||||||||||||||||||||||||||||
|
ASF VII WAGNER L.P., |
United Kingdom |
7.92% | EURIBOR (Q) |
6.00 |
% |
08/2028 |
€ |
299 |
352 |
||||||||||||||||||||||||||||||||||||||
|
BTCP 2023-1 |
10.84% |
SOFR (M) |
6.50 |
% |
09/2030 |
6,412 |
6,412 |
||||||||||||||||||||||||||||||||||||||||
|
Cannon Bridge Designated Activity Company |
Ireland |
11.86% PIK |
SOFR (S) |
7.50 |
% |
10/2033 |
€ |
1,214 |
1,431 |
(g) |
|||||||||||||||||||||||||||||||||||||
|
Cannon Bridge Designated Activity Company |
Ireland |
7.07% PIK |
SOFR (S) |
2.65 |
% |
10/2033 |
€ |
1,488 |
1,753 |
(g) |
|||||||||||||||||||||||||||||||||||||
|
DFC Global Facility Borrower III LLC |
13.07% |
SOFR (M) |
8.75 |
% |
01/2028 |
CAD |
2,646 |
1,940 |
(g)(l) |
||||||||||||||||||||||||||||||||||||||
|
DFC Global Facility Borrower III LLC |
6.82% |
CORRA (B) |
4.07 |
% |
01/2028 |
CAD |
28,389 |
20,813 |
(g)(l) |
||||||||||||||||||||||||||||||||||||||
|
Harbourvest Global Private Equity Limited |
Guernsey |
7.82% |
SOFR (Q) |
3.50 |
% |
06/2029 |
11,420 |
11,420 |
(g) |
||||||||||||||||||||||||||||||||||||||
|
Hg Saturn 2 SumoCo Limited |
Guernsey |
10.52% PIK |
SOFR (Q) |
6.25 |
% |
01/2029 |
19,010 |
19,010 |
|||||||||||||||||||||||||||||||||||||||
|
Isthmus Capital LLC |
9.50% |
06/2030 |
3,562 |
3,562 |
|||||||||||||||||||||||||||||||||||||||||||
Semi Annual Report 2025
96
CION Ares Diversified Credit Fund
Consolidated Schedule of Investments (continued)
June 30, 2025 (Unaudited)
(in thousands, except shares, percentages and as otherwise noted)
Private Asset-Backed Investment(b)(c)(d)(e) (continued)
|
Company |
Country(a) |
Investment |
Coupon |
Reference |
Spread |
Acquisition Date |
Maturity Date |
Shares |
Principal Amount(a) |
Fair Value(a) |
% of Net Assets |
||||||||||||||||||||||||||||||||||||
|
Isthmus Capital LLC |
12/2049 |
$ |
— |
$ |
59 |
||||||||||||||||||||||||||||||||||||||||||
|
Mars Downstop Loan Purchaser Trust |
11.00% |
9,697 |
5,069 |
||||||||||||||||||||||||||||||||||||||||||||
|
MCF CLO 12 LLC |
8.38% |
SOFR (Q) |
4.05 |
% |
02/2034 |
10,400 |
10,400 |
||||||||||||||||||||||||||||||||||||||||
|
MidOcean CLO Equity Fund I, LP |
9.00% |
4,339 |
4,335 |
||||||||||||||||||||||||||||||||||||||||||||
|
OKANAGAN 2024-1 |
12.13% |
SOFR (M) |
8.25 |
% |
12/2032 |
16,274 |
16,274 |
||||||||||||||||||||||||||||||||||||||||
|
Oncourse Warehouse Borrower, LLC |
04/2027 |
— |
— |
(g) |
|||||||||||||||||||||||||||||||||||||||||||
|
Oncourse Warehouse Borrower, LLC |
04/2027 |
— |
— |
(g) |
|||||||||||||||||||||||||||||||||||||||||||
|
PROSE 2024-3 |
8.85% |
10/2054 |
25,000 |
25,414 |
|||||||||||||||||||||||||||||||||||||||||||
|
Sera 2021 LLC |
10.03% |
SOFR (Q) |
5.75 |
% |
03/2026 |
95 |
94 |
||||||||||||||||||||||||||||||||||||||||
|
Sunbit Receivables Trust IV |
11.33% |
SOFR (M) |
7.00 |
% |
04/2029 |
3,036 |
3,013 |
(g) |
|||||||||||||||||||||||||||||||||||||||
|
TI VI Holdings 1, L.P. |
United Kingdom |
9.31% PIK |
1 |
1,285 |
|||||||||||||||||||||||||||||||||||||||||||
|
Tikehau Green Diamond II CFO Equity LP |
European Union |
7.75% | EURIBOR (Q) |
7.75 |
% |
€ |
2,127 |
2,465 |
|||||||||||||||||||||||||||||||||||||||
|
Tikehau Ruby CLO Equity LP |
12.16% | EURIBOR (Q) |
10.00 |
% |
€ |
2,715 |
1,356 |
||||||||||||||||||||||||||||||||||||||||
|
Tikehau Topaz LP |
13.27% |
SOFR (Q) |
9.00 |
% |
2,473 |
1,993 |
|||||||||||||||||||||||||||||||||||||||||
|
140,002 |
2.88 |
% |
|||||||||||||||||||||||||||||||||||||||||||||
|
Sports, Media and Entertainment |
|||||||||||||||||||||||||||||||||||||||||||||||
|
Orange Barrel Media, LLC |
10.08% |
SOFR (M) |
5.75 |
% |
03/2027 |
4,784 |
4,784 |
||||||||||||||||||||||||||||||||||||||||
|
Orange Barrel Media, LLC |
03/2027 |
— |
— |
(g) |
|||||||||||||||||||||||||||||||||||||||||||
|
Orange Barrel Media, LLC |
10.08% |
SOFR (M) |
5.75 |
% |
10/2027 |
4,352 |
4,352 |
(g) |
|||||||||||||||||||||||||||||||||||||||
|
9,136 |
0.19 |
% |
|||||||||||||||||||||||||||||||||||||||||||||
|
Real Estate Management and Development |
|||||||||||||||||||||||||||||||||||||||||||||||
|
Illinois Investment S.a.r.l. |
Luxembourg |
5.17% |
12/2026 |
SEK |
31,362 |
2,686 |
|||||||||||||||||||||||||||||||||||||||||
|
Illinois Investment S.a.r.l. |
Luxembourg |
25.00% |
04/2029 |
SEK |
10,050 |
1,062 |
|||||||||||||||||||||||||||||||||||||||||
|
Invesco Vaf V Investments, LLC |
11.50% |
07/2028 |
3,333 |
3,333 |
|||||||||||||||||||||||||||||||||||||||||||
|
Invesco Vaf V Investments, LLC |
11.50% |
07/2028 |
1,667 |
1,667 |
|||||||||||||||||||||||||||||||||||||||||||
|
Pallas Funding Trust No.2 |
Australia |
11.62% |
BBSY (M) |
7.85 |
% |
02/2027 |
AUD |
3,586 |
2,360 |
||||||||||||||||||||||||||||||||||||||
Semi Annual Report 2025
97
CION Ares Diversified Credit Fund
Consolidated Schedule of Investments (continued)
June 30, 2025 (Unaudited)
(in thousands, except shares, percentages and as otherwise noted)
Private Asset-Backed Investment(b)(c)(d)(e) (continued)
|
Company |
Country(a) |
Investment |
Coupon |
Reference |
Spread |
Acquisition Date |
Maturity Date |
Shares |
Principal Amount(a) |
Fair Value(a) |
% of Net Assets |
||||||||||||||||||||||||||||||||||||
|
Pallas Funding Trust No.2 |
Australia |
6.92% |
BBSY (M) |
3.15 |
% |
10/2027 |
AUD |
2,049 |
$ |
1,349 |
|||||||||||||||||||||||||||||||||||||
|
Pallas NZ Funding Trust No.1 |
New Zealand |
9.90% |
BBSY (M) |
6.15 |
% |
07/2026 |
NZD |
6,265 |
3,819 |
(g) |
|||||||||||||||||||||||||||||||||||||
|
16,276 |
0.34 |
% |
|||||||||||||||||||||||||||||||||||||||||||||
|
Software and Services |
|||||||||||||||||||||||||||||||||||||||||||||||
|
Switch BBF, LLC |
11.42% |
SOFR (S) |
7.17 |
% |
08/2027 |
1,342 |
1,342 |
||||||||||||||||||||||||||||||||||||||||
|
1,342 |
0.03 |
% |
|||||||||||||||||||||||||||||||||||||||||||||
|
Total Private Asset-Backed Investment (Cost $171,562) |
174,588 |
3.60 |
% |
||||||||||||||||||||||||||||||||||||||||||||
|
Preferred Stock(b)(c)(d)(e) |
|||||||||||||||||||||||||||||||||||||||||||||||
|
Automobiles and Components |
|||||||||||||||||||||||||||||||||||||||||||||||
|
Automotive Keys Investor, LLC |
9.00% PIK |
12/2020 |
37,749 |
4 |
|||||||||||||||||||||||||||||||||||||||||||
|
Automotive Keys Investor, LLC |
15.00% PIK |
01/2023 |
25,000 |
2 |
|||||||||||||||||||||||||||||||||||||||||||
|
6 |
— |
% |
|||||||||||||||||||||||||||||||||||||||||||||
|
Commercial and Professional Services |
|||||||||||||||||||||||||||||||||||||||||||||||
|
KBS Topco, LLC |
03/2024 |
901,730 |
— |
(f)(j) |
|||||||||||||||||||||||||||||||||||||||||||
|
Visual Edge Technology, Inc. |
10.00% PIK |
07/2023 |
13 |
89 |
|||||||||||||||||||||||||||||||||||||||||||
|
Visual Edge Technology, Inc. |
07/2023 |
17 |
— |
(j) |
|||||||||||||||||||||||||||||||||||||||||||
|
WSC Ultimate Holdings, LLC |
Class A |
10.00% PIK |
05/2024 |
1,020 |
114 |
||||||||||||||||||||||||||||||||||||||||||
|
203 |
— |
% |
|||||||||||||||||||||||||||||||||||||||||||||
|
Consumer Distribution and Retail |
|||||||||||||||||||||||||||||||||||||||||||||||
|
City Line Investments LLC |
Class A |
8.00% PIK |
08/2023 |
30,038 |
34 |
||||||||||||||||||||||||||||||||||||||||||
|
GMP Hills, LP |
11/2023 |
611,000 |
662 |
(j) |
|||||||||||||||||||||||||||||||||||||||||||
|
Metis Holdco, Inc. |
Class A |
7.00% PIK |
05/2021 |
7,959 |
10,620 |
||||||||||||||||||||||||||||||||||||||||||
|
Monolith Brands Group, Inc. |
Series A |
04/2022 |
192,811 |
— |
(j) |
||||||||||||||||||||||||||||||||||||||||||
|
Phoenix YW Parent, Inc. |
Class B |
8.00% PIK |
05/2024 |
248 |
516 |
||||||||||||||||||||||||||||||||||||||||||
|
Royal Parent, LP |
Class A |
10.00% PIK |
07/2024 |
293,000 |
300 |
||||||||||||||||||||||||||||||||||||||||||
|
12,132 |
— |
% |
|||||||||||||||||||||||||||||||||||||||||||||
|
Consumer Services |
|||||||||||||||||||||||||||||||||||||||||||||||
|
Aragorn Parent Holdings LP |
Series A |
10.00% PIK |
10/2020 |
50,000 |
137 |
||||||||||||||||||||||||||||||||||||||||||
|
Family First Bidco Limited |
United Kingdom |
12/2022 |
20,838 |
11 |
(j) |
||||||||||||||||||||||||||||||||||||||||||
|
Mustang Prospects Holdco, LLC |
Class A |
09/2024 |
48 |
45 |
(j) |
||||||||||||||||||||||||||||||||||||||||||
Semi Annual Report 2025
98
CION Ares Diversified Credit Fund
Consolidated Schedule of Investments (continued)
June 30, 2025 (Unaudited)
(in thousands, except shares, percentages and as otherwise noted)
Preferred Stock(b)(c)(d)(e) (continued)
|
Company |
Country(a) |
Investment |
Coupon |
Reference |
Spread |
Acquisition Date |
Maturity Date |
Shares |
Principal Amount(a) |
Fair Value(a) |
% of Net Assets |
||||||||||||||||||||||||||||||||||||
|
OMERS Mahomes Investment Holdings LLC |
15.00% PIK |
07/2023 |
2 |
$ |
22 |
||||||||||||||||||||||||||||||||||||||||||
|
215 |
— |
% |
|||||||||||||||||||||||||||||||||||||||||||||
|
Financial Services |
|||||||||||||||||||||||||||||||||||||||||||||||
|
Aquarian Peninsula Holdings LLC |
13.06% PIK |
SOFR (Q) |
10.50 |
% |
12/2022 |
35,481,024 |
42,013 |
||||||||||||||||||||||||||||||||||||||||
|
ASE Royal Aggregator, LLC |
Class A |
07/2023 |
1,646,000 |
2,036 |
(j) |
||||||||||||||||||||||||||||||||||||||||||
|
Corient Holdings, Inc. |
Series A |
15.00% PIK |
05/2023 |
9,627 |
15,774 |
||||||||||||||||||||||||||||||||||||||||||
|
TVG-TMG Holdings, LLC |
Series A |
03/2022 |
50 |
40 |
(j) |
||||||||||||||||||||||||||||||||||||||||||
|
The Ultimus Group, LLC |
Class A |
8.00% PIK |
02/2019 |
1 |
1 |
||||||||||||||||||||||||||||||||||||||||||
|
59,864 |
1.23 |
% |
|||||||||||||||||||||||||||||||||||||||||||||
|
Food, Beverage and Tobacco |
|||||||||||||||||||||||||||||||||||||||||||||||
|
Gotham Greens Holdings, PBC |
Series E-1 |
6.00% PIK |
06/2022 |
76,779 |
— |
(f) |
|||||||||||||||||||||||||||||||||||||||||
|
Watermill Express Holdings, LLC |
Class A |
04/2021 |
5,000 |
125 |
(j) |
||||||||||||||||||||||||||||||||||||||||||
|
125 |
— |
% |
|||||||||||||||||||||||||||||||||||||||||||||
|
Health Care Equipment and Services |
|||||||||||||||||||||||||||||||||||||||||||||||
|
Aerin Medical Inc. |
12/2024 |
152,624 |
178 |
(j) |
|||||||||||||||||||||||||||||||||||||||||||
|
Evolent Health, Inc. |
Series A |
10.29% |
SOFR (Q) |
6.00 |
% |
01/2023 |
64 |
64 |
|||||||||||||||||||||||||||||||||||||||
|
GMR Buyer Corp. |
15.00% PIK |
05/2024 |
38,889 |
45,920 |
|||||||||||||||||||||||||||||||||||||||||||
|
Minerva Holdco, Inc. |
Series A |
10.75% PIK |
02/2022 |
21,262 |
30,560 |
||||||||||||||||||||||||||||||||||||||||||
|
Olympia Acquisition, Inc. |
15.59% PIK |
SOFR (Q) |
11.00 |
% |
02/2022 |
472 |
— |
||||||||||||||||||||||||||||||||||||||||
|
Olympia TopCo, L.P. |
15.00% PIK |
07/2021 |
2,184 |
— |
|||||||||||||||||||||||||||||||||||||||||||
|
OMERS Wildcats Investment Holdings LLC |
Class A |
08/2023 |
19 |
10 |
(j) |
||||||||||||||||||||||||||||||||||||||||||
|
Symplr Software Intermediate Holdings, Inc. |
Series C-1 |
11.00% PIK |
12/2020 |
50 |
71 |
||||||||||||||||||||||||||||||||||||||||||
|
Symplr Software Intermediate Holdings, Inc. |
Series C-2 |
11.00% PIK |
06/2021 |
5,980 |
8,017 |
||||||||||||||||||||||||||||||||||||||||||
|
Symplr Software Intermediate Holdings, Inc. |
Series C-3 |
11.00% PIK |
10/2021 |
789 |
1,021 |
||||||||||||||||||||||||||||||||||||||||||
|
WSHP FC Holdings LLC |
11/2024 |
5 |
— |
(j) |
|||||||||||||||||||||||||||||||||||||||||||
|
85,841 |
1.77 |
% |
|||||||||||||||||||||||||||||||||||||||||||||
Semi Annual Report 2025
99
CION Ares Diversified Credit Fund
Consolidated Schedule of Investments (continued)
June 30, 2025 (Unaudited)
(in thousands, except shares, percentages and as otherwise noted)
Preferred Stock(b)(c)(d)(e) (continued)
|
Company |
Country(a) |
Investment |
Coupon |
Reference |
Spread |
Acquisition Date |
Maturity Date |
Shares |
Principal Amount(a) |
Fair Value(a) |
% of Net Assets |
||||||||||||||||||||||||||||||||||||
|
Insurance |
|||||||||||||||||||||||||||||||||||||||||||||||
|
HIG Intermediate, Inc. |
10.50% PIK |
12/2024 |
5,290 |
$ |
5,211 |
||||||||||||||||||||||||||||||||||||||||||
|
High Street HoldCo LLC |
Series A-1 |
10.00% PIK |
01/2022 |
3,898,354 |
5,906 |
||||||||||||||||||||||||||||||||||||||||||
|
High Street HoldCo LLC |
Series A-2 |
10.00% PIK |
01/2022 |
789,494 |
1,180 |
||||||||||||||||||||||||||||||||||||||||||
|
High Street HoldCo LLC |
Series A-3 |
10.00% PIK |
01/2022 |
389,813 |
579 |
||||||||||||||||||||||||||||||||||||||||||
|
High Street HoldCo LLC |
Series A-4 |
10.00% PIK |
01/2022 |
1,480,301 |
2,178 |
||||||||||||||||||||||||||||||||||||||||||
|
High Street HoldCo LLC |
Series A-5 |
10.00% PIK |
01/2022 |
347,693 |
508 |
||||||||||||||||||||||||||||||||||||||||||
|
High Street HoldCo LLC |
Series A-6 |
10.00% PIK |
01/2022 |
660,617 |
956 |
||||||||||||||||||||||||||||||||||||||||||
|
High Street HoldCo LLC |
Series A-7 |
10.00% PIK |
01/2022 |
938,771 |
1,337 |
||||||||||||||||||||||||||||||||||||||||||
|
High Street HoldCo LLC |
Series A-8 |
10.00% PIK |
11/2022 |
409,637 |
533 |
||||||||||||||||||||||||||||||||||||||||||
|
High Street HoldCo LLC |
Series A-9 |
10.00% PIK |
11/2022 |
97,533 |
127 |
||||||||||||||||||||||||||||||||||||||||||
|
High Street HoldCo LLC |
Series A-10 |
10.00% PIK |
12/2022 |
253,585 |
326 |
||||||||||||||||||||||||||||||||||||||||||
|
High Street HoldCo LLC |
Series A-11 |
10.00% PIK |
12/2022 |
331,611 |
424 |
||||||||||||||||||||||||||||||||||||||||||
|
High Street HoldCo LLC |
Series A-12 |
10.00% PIK |
02/2023 |
702,235 |
891 |
||||||||||||||||||||||||||||||||||||||||||
|
High Street HoldCo LLC |
Series A-13 |
10.00% PIK |
04/2023 |
214,572 |
267 |
||||||||||||||||||||||||||||||||||||||||||
|
High Street HoldCo LLC |
Series A-14 |
10.00% PIK |
07/2023 |
136,546 |
166 |
||||||||||||||||||||||||||||||||||||||||||
|
High Street HoldCo LLC |
Series A-15 |
10.00% PIK |
07/2023 |
711,315 |
862 |
||||||||||||||||||||||||||||||||||||||||||
|
21,451 |
0.44 |
% |
|||||||||||||||||||||||||||||||||||||||||||||
|
Materials |
|||||||||||||||||||||||||||||||||||||||||||||||
|
Novipax Parent Holding Company, L.L.C. |
Class A |
10.00% PIK |
12/2020 |
50 |
38 |
||||||||||||||||||||||||||||||||||||||||||
|
Plaskolite PPC Blocker LLC |
10/2023 |
1 |
— |
(j) |
|||||||||||||||||||||||||||||||||||||||||||
|
Plaskolite PPC Blocker LLC |
05/2025 |
3,271 |
51 |
(j) |
|||||||||||||||||||||||||||||||||||||||||||
|
89 |
— |
% |
|||||||||||||||||||||||||||||||||||||||||||||
|
Sports, Media and Entertainment |
|||||||||||||||||||||||||||||||||||||||||||||||
| CFC Funding LLC |
9.75% PIK |
07/2023 |
4,270 |
4,928 |
|||||||||||||||||||||||||||||||||||||||||||
|
Fever Labs, Inc. |
08/2024 |
59,428 |
323 |
(j) |
|||||||||||||||||||||||||||||||||||||||||||
|
Fever Labs, Inc. |
13.50% PIK |
06/2025 |
776 |
759 |
|||||||||||||||||||||||||||||||||||||||||||
Semi Annual Report 2025
100
CION Ares Diversified Credit Fund
Consolidated Schedule of Investments (continued)
June 30, 2025 (Unaudited)
(in thousands, except shares, percentages and as otherwise noted)
Preferred Stock(b)(c)(d)(e) (continued)
|
Company |
Country(a) |
Investment |
Coupon |
Reference |
Spread |
Acquisition Date |
Maturity Date |
Shares |
Principal Amount(a) |
Fair Value(a) |
% of Net Assets |
||||||||||||||||||||||||||||||||||||
|
League One Volleyball, Inc. |
Series B |
07/2023 |
194 |
$ |
2 |
(j) |
|||||||||||||||||||||||||||||||||||||||||
|
League One Volleyball, Inc. |
09/2024 |
67 |
1 |
(j) |
|||||||||||||||||||||||||||||||||||||||||||
|
LiveBarn Inc. |
Canada |
08/2023 |
648,925 |
3,429 |
(j) |
||||||||||||||||||||||||||||||||||||||||||
|
PFL MMA, Inc. |
Series E |
04/2022 |
7,823 |
25 |
(j) |
||||||||||||||||||||||||||||||||||||||||||
|
PRG III, LLC |
Class A |
10.24% PIK |
SOFR (Y) |
5.50 |
% |
10/2020 |
2,250 |
— |
|||||||||||||||||||||||||||||||||||||||
|
9,467 |
0.19 |
% |
|||||||||||||||||||||||||||||||||||||||||||||
|
Pharmaceuticals, Biotechnology and Life Sciences |
|||||||||||||||||||||||||||||||||||||||||||||||
|
Cardinal Topco Holdings, LP |
Class A |
8.00% PIK |
09/2020 |
83 |
121 |
||||||||||||||||||||||||||||||||||||||||||
|
Cobalt Holdings I, LP |
8.00% PIK |
10/2021 |
50 |
5 |
|||||||||||||||||||||||||||||||||||||||||||
|
Cobalt Intermediate I, Inc. |
Series A |
13.75% PIK |
10/2021 |
8,582 |
14,344 |
||||||||||||||||||||||||||||||||||||||||||
|
14,470 |
0.30 |
% |
|||||||||||||||||||||||||||||||||||||||||||||
|
Real Estate Management and Development |
|||||||||||||||||||||||||||||||||||||||||||||||
|
QUINTAIN INVESTMENTS HOLDINGS LIMITED |
Jersey |
11.00 |
% |
08/2024 |
24,530,221 |
36,592 |
|||||||||||||||||||||||||||||||||||||||||
|
36,592 |
0.75 |
% |
|||||||||||||||||||||||||||||||||||||||||||||
|
Software and Services |
|||||||||||||||||||||||||||||||||||||||||||||||
|
Activate holdings (US) Corp. |
10/2023 |
50,000 |
66 |
(j) |
|||||||||||||||||||||||||||||||||||||||||||
|
Banyan Software Intermediate, Inc. |
14.00% PIK |
01/2025 |
44,662 |
46,730 |
|||||||||||||||||||||||||||||||||||||||||||
|
CBTS TopCo, L.P. |
8.00% PIK |
12/2024 |
1,100,000 |
1,078 |
|||||||||||||||||||||||||||||||||||||||||||
|
Cority Parent, Inc. |
Canada |
Class A-1 |
9.00% PIK |
07/2019 |
50 |
276 |
|||||||||||||||||||||||||||||||||||||||||
|
DCert Preferred Holdings, Inc. |
Series A |
10.50% PIK |
05/2021 |
22,284 |
27,801 |
||||||||||||||||||||||||||||||||||||||||||
|
Diligent Preferred Issuer, Inc. |
10.50% PIK |
04/2021 |
1,476 |
2,165 |
|||||||||||||||||||||||||||||||||||||||||||
|
Eclipse Topco, Inc. |
12.50% PIK |
09/2024 |
118 |
1,304 |
|||||||||||||||||||||||||||||||||||||||||||
|
EZ Elemica Holdings, Inc. |
09/2019 |
50 |
59 |
(j) |
|||||||||||||||||||||||||||||||||||||||||||
|
GSV PracticeTek Holdings, LLC |
Class A |
8.00% PIK |
03/2021 |
269,272 |
298 |
||||||||||||||||||||||||||||||||||||||||||
|
Insightful Science Holdings, LLC |
14.00% PIK |
04/2021 |
62,340 |
2,906 |
|||||||||||||||||||||||||||||||||||||||||||
|
Jams Holdings LP |
8.00% PIK |
06/2025 |
139,000 |
139 |
|||||||||||||||||||||||||||||||||||||||||||
|
Knockout Intermediate Holdings I Inc. |
15.03% PIK |
SOFR (S) |
10.75 |
% |
06/2022 |
4,598 |
6,858 |
||||||||||||||||||||||||||||||||||||||||
Semi Annual Report 2025
101
CION Ares Diversified Credit Fund
Consolidated Schedule of Investments (continued)
June 30, 2025 (Unaudited)
(in thousands, except shares, percentages and as otherwise noted)
Preferred Stock(b)(c)(d)(e) (continued)
|
Company |
Country(a) |
Investment |
Coupon |
Reference |
Spread |
Acquisition Date |
Maturity Date |
Shares |
Principal Amount(a) |
Fair Value(a) |
% of Net Assets |
||||||||||||||||||||||||||||||||||||
|
Magic Topco, L.P. |
Class A |
9.00% PIK |
09/2020 |
58 |
$ |
150 |
|||||||||||||||||||||||||||||||||||||||||
|
ModMed Software Midco Holdings, Inc. |
13.00% PIK |
04/2025 |
13,000 |
12,950 |
|||||||||||||||||||||||||||||||||||||||||||
|
Packers Software Intermediate Holdings, Inc. |
Series A |
11.00% PIK |
11/2020 |
50 |
76 |
||||||||||||||||||||||||||||||||||||||||||
|
Packers Software Intermediate Holdings, Inc. |
Series A-2 |
11.00% PIK |
12/2020 |
18 |
27 |
||||||||||||||||||||||||||||||||||||||||||
|
Packers Software Intermediate Holdings, Inc. |
Series A-3 |
11.00% PIK |
11/2021 |
24 |
32 |
||||||||||||||||||||||||||||||||||||||||||
|
PCMI Ultimate Holdings, LP |
9.00% PIK |
03/2025 |
145 |
144 |
|||||||||||||||||||||||||||||||||||||||||||
|
Peachtree Parent, Inc. |
Series A |
13.25% PIK |
03/2019 |
25 |
57 |
||||||||||||||||||||||||||||||||||||||||||
|
Sunshine Software Holdings, Inc. |
Series A |
10.50% PIK |
10/2021 |
15,929 |
19,792 |
||||||||||||||||||||||||||||||||||||||||||
|
SuperMoose NewCo, Inc. |
15.00% PIK |
04/2024 |
17,961 |
21,470 |
|||||||||||||||||||||||||||||||||||||||||||
|
Titan DI Preferred Holdings, Inc. |
13.50% PIK |
02/2020 |
0 |
102 |
|||||||||||||||||||||||||||||||||||||||||||
|
Wellington TopCo LP |
Class A-2 |
06/2024 |
143,000 |
154 |
(j) |
||||||||||||||||||||||||||||||||||||||||||
|
144,634 |
2.98 |
% |
|||||||||||||||||||||||||||||||||||||||||||||
|
Telecommunication Services |
|||||||||||||||||||||||||||||||||||||||||||||||
|
6DG TOPCO LIMITED |
United Kingdom |
|
|
|
|
02/2024 |
1,371,829,990 |
— |
(j) |
||||||||||||||||||||||||||||||||||||||
|
— |
— |
% |
|||||||||||||||||||||||||||||||||||||||||||||
|
Transportation |
|||||||||||||||||||||||||||||||||||||||||||||||
|
Neovia Acquisition, LLC |
Class B |
18.42% PIK |
SOFR (Q) |
12.50 |
% |
11/2022 |
718 |
1,077 |
|||||||||||||||||||||||||||||||||||||||
|
1,077 |
0.02 |
% |
|||||||||||||||||||||||||||||||||||||||||||||
|
Utilities |
|||||||||||||||||||||||||||||||||||||||||||||||
|
Ferrellgas, L.P. |
8.96% |
03/2021 |
8,898 |
9,607 |
|||||||||||||||||||||||||||||||||||||||||||
|
9,607 |
0.20 |
% |
|||||||||||||||||||||||||||||||||||||||||||||
|
Total Preferred Stock (Cost $400,181) |
395,773 |
8.15 |
% |
||||||||||||||||||||||||||||||||||||||||||||
|
Common Stock |
|||||||||||||||||||||||||||||||||||||||||||||||
|
Automobiles and Components |
|||||||||||||||||||||||||||||||||||||||||||||||
|
Automotive Keys Investor, LLC |
Class A |
11/2020 |
62,749 |
— |
(d)(e)(j) |
||||||||||||||||||||||||||||||||||||||||||
|
Clarience Technologies, LLC |
Class A |
02/2024 |
349 |
987 |
(d)(e)(j) |
||||||||||||||||||||||||||||||||||||||||||
|
Highline PPC Blocker LLC |
11/2020 |
500 |
99 |
(d)(e)(j) |
|||||||||||||||||||||||||||||||||||||||||||
Semi Annual Report 2025
102
CION Ares Diversified Credit Fund
Consolidated Schedule of Investments (continued)
June 30, 2025 (Unaudited)
(in thousands, except shares, percentages and as otherwise noted)
Common Stock (continued)
|
Company |
Country(a) |
Investment |
Coupon |
Reference |
Spread |
Acquisition Date |
Maturity Date |
Shares |
Principal Amount(a) |
Fair Value(a) |
% of Net Assets |
||||||||||||||||||||||||||||||||||||
|
Next Horizon Capital TireCo SPV, LP |
03/2025 |
48,000 |
$ |
48 |
(d)(e)(j) |
||||||||||||||||||||||||||||||||||||||||||
|
Sun TopCo, LP |
Class A |
09/2021 |
1,000 |
143 |
(d)(e)(j) |
||||||||||||||||||||||||||||||||||||||||||
|
Victory Topco, LP |
Class A-2 |
11/2023 |
2,510 |
545 |
(d)(e)(j) |
||||||||||||||||||||||||||||||||||||||||||
|
1,822 |
0.04 |
% |
|||||||||||||||||||||||||||||||||||||||||||||
|
Capital Goods |
|||||||||||||||||||||||||||||||||||||||||||||||
|
Allclear Group LLC |
05/2025 |
1,146 |
— |
(d)(e)(j) |
|||||||||||||||||||||||||||||||||||||||||||
|
Dynamic NC Investment Holdings, LP |
12/2020 |
50,000 |
76 |
(d)(e)(j) |
|||||||||||||||||||||||||||||||||||||||||||
|
GB Helios Holdings, L.P. |
Series A |
05/2024 |
59 |
95 |
(d)(e)(j) |
||||||||||||||||||||||||||||||||||||||||||
|
HPCC Parent, Inc. |
09/2024 |
148,775 |
1,410 |
(d)(e)(j) |
|||||||||||||||||||||||||||||||||||||||||||
|
IMPEL CV-B, LP |
03/2025 |
130,381 |
169 |
(d)(e)(j) |
|||||||||||||||||||||||||||||||||||||||||||
|
Kene Holdings, L.P. |
Class A |
08/2019 |
50,000 |
99 |
(d)(e)(j) |
||||||||||||||||||||||||||||||||||||||||||
|
OPH NEP Investment, LLC |
Class B |
05/2024 |
2 |
697 |
(d)(e)(j) |
||||||||||||||||||||||||||||||||||||||||||
|
2,546 |
0.05 |
% |
|||||||||||||||||||||||||||||||||||||||||||||
|
Commercial and Professional Services |
|||||||||||||||||||||||||||||||||||||||||||||||
|
Bedrock Parent Holdings, LP |
Class A |
04/2021 |
644 |
78 |
(d)(e)(j) |
||||||||||||||||||||||||||||||||||||||||||
|
Bluejack Fire Holdings, LLC |
01/2025 |
195 |
196 |
(d)(e)(j) |
|||||||||||||||||||||||||||||||||||||||||||
|
Capstone Parent Holdings, LP |
Class A |
11/2020 |
50 |
75 |
(d)(e)(j) |
||||||||||||||||||||||||||||||||||||||||||
|
Drogon Aggregator LP |
Class A-2 |
08/2024 |
186,000 |
200 |
(d)(e)(j) |
||||||||||||||||||||||||||||||||||||||||||
|
Elliott Metron Co-Investor Aggregator L.P. |
10/2022 |
1,000,000 |
1,581 |
(d)(e)(j) |
|||||||||||||||||||||||||||||||||||||||||||
|
GCM HVAC TOPCO, LLC |
Class A |
09/2024 |
756,697 |
1,130 |
(e)(j) |
||||||||||||||||||||||||||||||||||||||||||
|
KBS Topco, LLC |
Class A |
03/2024 |
901,730 |
— |
(d)(e)(f)(j) |
||||||||||||||||||||||||||||||||||||||||||
|
KKR Nest Co-Invest L.P. |
09/2021 |
50,000 |
68 |
(d)(e)(j) |
|||||||||||||||||||||||||||||||||||||||||||
|
Laboratories Topco LLC |
Class A |
07/2021 |
33,333 |
— |
(d)(e)(j) |
||||||||||||||||||||||||||||||||||||||||||
|
Landscape Parallel Partners, L.P. |
Class A |
12/2021 |
162 |
806 |
(d)(e)(j) |
||||||||||||||||||||||||||||||||||||||||||
|
LBC Woodlands Holdings LP |
Class A-1 |
07/2024 |
108,000 |
92 |
(d)(e)(j) |
||||||||||||||||||||||||||||||||||||||||||
|
MS Precision Parent, LP |
03/2025 |
179,000 |
182 |
(d)(e)(j) |
|||||||||||||||||||||||||||||||||||||||||||
|
New Insight Holdings, Inc. |
07/2024 |
1,788 |
36 |
(d)(e)(f)(j) |
|||||||||||||||||||||||||||||||||||||||||||
Semi Annual Report 2025
103
CION Ares Diversified Credit Fund
Consolidated Schedule of Investments (continued)
June 30, 2025 (Unaudited)
(in thousands, except shares, percentages and as otherwise noted)
Common Stock (continued)
|
Company |
Country(a) |
Investment |
Coupon |
Reference |
Spread |
Acquisition Date |
Maturity Date |
Shares |
Principal Amount(a) |
Fair Value(a) |
% of Net Assets |
||||||||||||||||||||||||||||||||||||
|
PSP Registrar Co-Investment Fund, L.P. |
Class A |
08/2021 |
50 |
$ |
42 |
(d)(e)(j) |
|||||||||||||||||||||||||||||||||||||||||
|
RC V Tecmo Investor LLC |
08/2020 |
50,000 |
88 |
(d)(e)(j) |
|||||||||||||||||||||||||||||||||||||||||||
|
SSE Parent, LP |
Class A-1 |
06/2020 |
25 |
— |
(d)(e)(j) |
||||||||||||||||||||||||||||||||||||||||||
|
SSE Parent, LP |
Class A-2 |
06/2020 |
25 |
— |
(d)(e)(j) |
||||||||||||||||||||||||||||||||||||||||||
|
Unity Purchaser, LLC |
01/2025 |
358,000 |
358 |
(d)(e)(j) |
|||||||||||||||||||||||||||||||||||||||||||
|
UPBW Blocker, LLC |
03/2024 |
4,700 |
547 |
(d)(e)(j) |
|||||||||||||||||||||||||||||||||||||||||||
|
UPBW Blocker, LLC |
Class Ares |
09/2024 |
304 |
35 |
(e)(j) |
||||||||||||||||||||||||||||||||||||||||||
|
WSC Ultimate Holdings, LLC |
Class A |
05/2024 |
95 |
46 |
(d)(e)(j) |
||||||||||||||||||||||||||||||||||||||||||
|
5,560 |
0.11 |
% |
|||||||||||||||||||||||||||||||||||||||||||||
|
Consumer Distribution and Retail |
|||||||||||||||||||||||||||||||||||||||||||||||
|
Arko Corp |
12/2020 |
106 |
1 |
(d)(j) |
|||||||||||||||||||||||||||||||||||||||||||
|
Emerald Lake Pearl Acquisition-A, L.P. |
07/2021 |
43,500 |
73 |
(d)(e)(j) |
|||||||||||||||||||||||||||||||||||||||||||
|
Fastsigns Holdings Inc. |
03/2019 |
50 |
87 |
(d)(e)(j) |
|||||||||||||||||||||||||||||||||||||||||||
|
KCAKE Holdings Inc. |
05/2021 |
50 |
68 |
(d)(e)(j) |
|||||||||||||||||||||||||||||||||||||||||||
|
LJ Perimeter Co-Invest, L.P. |
Class A |
10/2022 |
50,052 |
13 |
(d)(e)(j) |
||||||||||||||||||||||||||||||||||||||||||
|
Marcone Yellowstone Holdings, LLC |
Class A |
06/2021 |
96 |
1 |
(d)(e)(j) |
||||||||||||||||||||||||||||||||||||||||||
|
Metis Topco, LP |
05/2021 |
50 |
68 |
(d)(e)(j) |
|||||||||||||||||||||||||||||||||||||||||||
|
REP WWP Coinvest IV, L.P. |
01/2023 |
25,000 |
— |
(d)(e)(j) |
|||||||||||||||||||||||||||||||||||||||||||
|
Restaurant Produce and Services Blocker, LLC |
Tranche B |
05/2023 |
50,000 |
46 |
(d)(e)(j) |
||||||||||||||||||||||||||||||||||||||||||
|
Shur-Co HoldCo, Inc. |
06/2021 |
500 |
105 |
(d)(e)(j) |
|||||||||||||||||||||||||||||||||||||||||||
|
Stonecourt IV Partners LP |
10/2021 |
2,423,676 |
1,720 |
(d)(e)(j) |
|||||||||||||||||||||||||||||||||||||||||||
|
ZB TopCo LLC |
02/2022 |
50 |
74 |
(d)(e)(j) |
|||||||||||||||||||||||||||||||||||||||||||
|
2,256 |
0.05 |
% |
|||||||||||||||||||||||||||||||||||||||||||||
|
Consumer Durables and Apparel |
|||||||||||||||||||||||||||||||||||||||||||||||
|
Centric Brands L.P. |
Class A |
10/2020 |
21,364 |
291 |
(d)(e)(j) |
||||||||||||||||||||||||||||||||||||||||||
|
DRS Holdings I, Inc. |
11/2019 |
50 |
48 |
(d)(e)(j) |
|||||||||||||||||||||||||||||||||||||||||||
|
SEP Diamond Fund, L.P. |
06/2024 |
2,314,010 |
3,572 |
(d)(e)(j) |
|||||||||||||||||||||||||||||||||||||||||||
|
3,911 |
0.08 |
% |
|||||||||||||||||||||||||||||||||||||||||||||
Semi Annual Report 2025
104
CION Ares Diversified Credit Fund
Consolidated Schedule of Investments (continued)
June 30, 2025 (Unaudited)
(in thousands, except shares, percentages and as otherwise noted)
Common Stock (continued)
|
Company |
Country(a) |
Investment |
Coupon |
Reference |
Spread |
Acquisition |
Maturity |
Shares |
Principal |
Fair Value(a) |
% of Net |
||||||||||||||||||||||||||||||||||||
|
Consumer Services |
|||||||||||||||||||||||||||||||||||||||||||||||
|
Aimbridge Topco, |
03/2025 |
11,970 |
$ |
701 |
(d)(e)(j) |
||||||||||||||||||||||||||||||||||||||||||
|
Apex Service |
Series B |
10/2023 |
44,263 |
1,945 |
(d)(e)(j) |
||||||||||||||||||||||||||||||||||||||||||
|
BPCP Pinnacle |
10/2024 |
189 |
159 |
(d)(e)(j) |
|||||||||||||||||||||||||||||||||||||||||||
|
CMG Buyer |
05/2022 |
5 |
184 |
(d)(e)(j) |
|||||||||||||||||||||||||||||||||||||||||||
|
Family First Bidco |
United |
12/2022 |
176 |
— |
(d)(e)(j) |
||||||||||||||||||||||||||||||||||||||||||
|
GS SEER Group |
Class A |
04/2023 |
25 |
20 |
(d)(e)(j) |
||||||||||||||||||||||||||||||||||||||||||
|
IHS Parent |
Class A |
12/2022 |
25,000 |
30 |
(d)(e)(j) |
||||||||||||||||||||||||||||||||||||||||||
|
KKR Game |
06/2024 |
467,000 |
535 |
(d)(e)(j) |
|||||||||||||||||||||||||||||||||||||||||||
|
LBC Breeze |
Class A |
12/2021 |
50 |
31 |
(d)(e)(j) |
||||||||||||||||||||||||||||||||||||||||||
|
Leviathan |
12/2022 |
38,000 |
50 |
(d)(e)(j) |
|||||||||||||||||||||||||||||||||||||||||||
|
Meaningful |
07/2024 |
686,000 |
829 |
(d)(e)(j) |
|||||||||||||||||||||||||||||||||||||||||||
|
Mustang |
Class B |
09/2024 |
48,120 |
19 |
(d)(e)(j) |
||||||||||||||||||||||||||||||||||||||||||
|
Northwinds |
05/2023 |
60,684 |
105 |
(d)(e)(j) |
|||||||||||||||||||||||||||||||||||||||||||
|
OMERS Mahomes |
Class A |
11/2020 |
16 |
79 |
(d)(e)(j) |
||||||||||||||||||||||||||||||||||||||||||
|
PestCo Holdings, |
Class A |
01/2023 |
2 |
40 |
(d)(e)(j) |
||||||||||||||||||||||||||||||||||||||||||
|
Rust Investment |
Luxembourg |
11/2024 |
3,354,688 |
— |
(d)(e)(j) |
||||||||||||||||||||||||||||||||||||||||||
|
Rust Investment |
Luxembourg |
11/2024 |
3,354,688 |
— |
(d)(e)(j) |
||||||||||||||||||||||||||||||||||||||||||
|
Rust Investment |
Luxembourg |
11/2024 |
3,354,688 |
— |
(d)(e)(j) |
||||||||||||||||||||||||||||||||||||||||||
|
Rust Investment |
Luxembourg |
11/2024 |
3,354,688 |
— |
(d)(e)(j) |
||||||||||||||||||||||||||||||||||||||||||
|
Rust Investment |
Luxembourg |
11/2024 |
3,354,688 |
— |
(d)(e)(j) |
||||||||||||||||||||||||||||||||||||||||||
|
Rust Investment |
Luxembourg |
11/2024 |
3,354,688 |
— |
(d)(e)(j) |
||||||||||||||||||||||||||||||||||||||||||
|
Rust Investment |
Luxembourg |
11/2024 |
3,354,688 |
— |
(d)(e)(j) |
||||||||||||||||||||||||||||||||||||||||||
Semi Annual Report 2025
105
CION Ares Diversified Credit Fund
Consolidated Schedule of Investments (continued)
June 30, 2025 (Unaudited)
(in thousands, except shares, percentages and as otherwise noted)
Common Stock (continued)
|
Company |
Country(a) |
Investment |
Coupon |
Reference |
Spread |
Acquisition Date |
Maturity Date |
Shares |
Principal Amount(a) |
Fair Value(a) |
% of Net Assets |
||||||||||||||||||||||||||||||||||||
|
Rust Investment Sarl |
Luxembourg |
11/2024 |
170,559 |
$ |
— |
(d)(e)(j) |
|||||||||||||||||||||||||||||||||||||||||
|
Rust Investment Sarl |
Luxembourg |
11/2024 |
3,354,688 |
— |
(d)(e)(j) |
||||||||||||||||||||||||||||||||||||||||||
|
Rust Investment Sarl |
Luxembourg |
11/2024 |
3,354,688 |
— |
(d)(e)(j) |
||||||||||||||||||||||||||||||||||||||||||
|
Vertex Service Partners Holdings, LLC |
Class B |
11/2023 |
33 |
47 |
(d)(e)(j) |
||||||||||||||||||||||||||||||||||||||||||
|
ZBS Mechanical Group Co-Invest Fund 2, LLC |
10/2021 |
50,000 |
145 |
(d)(e)(j) |
|||||||||||||||||||||||||||||||||||||||||||
|
ZBS Mechanical Group Co-Invest II Fund 2, LLC |
02/2025 |
4,767 |
14 |
(d)(e)(j) |
|||||||||||||||||||||||||||||||||||||||||||
|
4,933 |
0.10 |
% |
|||||||||||||||||||||||||||||||||||||||||||||
|
Energy |
|||||||||||||||||||||||||||||||||||||||||||||||
|
Enviva Inc. |
12/2024 |
1,273,882 |
25,000 |
(j) |
|||||||||||||||||||||||||||||||||||||||||||
|
Galileo Co-Investment Trust I |
New Zealand |
07/2022 |
50,000 |
27 |
(d)(e)(j) |
||||||||||||||||||||||||||||||||||||||||||
|
25,027 |
0.52 |
% |
|||||||||||||||||||||||||||||||||||||||||||||
|
Financial Services |
|||||||||||||||||||||||||||||||||||||||||||||||
|
BCC Blueprint Investments, LLC |
09/2021 |
874,540 |
1,591 |
(d)(e)(j) |
|||||||||||||||||||||||||||||||||||||||||||
|
Constellation Wealth Capital Fund, L.P. |
01/2024 |
560,406 |
551 |
(d)(e)(j) |
|||||||||||||||||||||||||||||||||||||||||||
|
CWC Fund I Co-Invest (AlTi) LP |
03/2024 |
3,276,000 |
3,706 |
(d)(e)(j) |
|||||||||||||||||||||||||||||||||||||||||||
|
CWC Fund I Co-Invest (Prism) LP |
03/2024 |
2,374,000 |
2,571 |
(d)(e)(j) |
|||||||||||||||||||||||||||||||||||||||||||
|
Endeavor TopCo, Inc. |
Class A |
08/2024 |
323 |
437 |
(d)(e)(j) |
||||||||||||||||||||||||||||||||||||||||||
|
GTCR (D) Investors LP |
09/2023 |
39,339 |
72 |
(d)(e)(j) |
|||||||||||||||||||||||||||||||||||||||||||
|
Kelso XI Tailwind Co-Investment, L.P. |
09/2023 |
48,023 |
65 |
(d)(e)(j) |
|||||||||||||||||||||||||||||||||||||||||||
|
Linden Structured Capital Fund II-A LP |
07/2024 |
324,828 |
250 |
(d)(e)(j) |
|||||||||||||||||||||||||||||||||||||||||||
|
PCS Parent, L.P. |
Class A |
03/2024 |
80,000 |
78 |
(d)(e)(j) |
||||||||||||||||||||||||||||||||||||||||||
|
Sera 2021 LLC |
Class A |
03/2021 |
4 |
290 |
(d)(e)(j) |
||||||||||||||||||||||||||||||||||||||||||
|
TPG IX Cardiff CI II, L.P. |
12/2024 |
2,299,421 |
2,529 |
(d)(e)(j) |
|||||||||||||||||||||||||||||||||||||||||||
|
TVG-TMG Holdings, LLC |
03/2022 |
50 |
— |
(d)(e)(j) |
|||||||||||||||||||||||||||||||||||||||||||
|
The Ultimus Group Aggregator, LP |
Class A |
02/2019 |
0 |
— |
(d)(e)(j) |
||||||||||||||||||||||||||||||||||||||||||
Semi Annual Report 2025
106
CION Ares Diversified Credit Fund
Consolidated Schedule of Investments (continued)
June 30, 2025 (Unaudited)
(in thousands, except shares, percentages and as otherwise noted)
Common Stock (continued)
|
Company |
Country(a) |
Investment |
Coupon |
Reference |
Spread |
Acquisition Date |
Maturity Date |
Shares |
Principal Amount(a) |
Fair Value(a) |
% of Net Assets |
||||||||||||||||||||||||||||||||||||
|
The Ultimus Group Aggregator, LP |
Class B |
02/2019 |
182 |
$ |
— |
(d)(e)(j) |
|||||||||||||||||||||||||||||||||||||||||
|
The Ultimus Group, LLC |
Class B |
02/2019 |
1,609 |
3 |
(d)(e)(j) |
||||||||||||||||||||||||||||||||||||||||||
|
WAAM Topco, LLC |
Class A |
06/2023 |
41,556 |
105 |
(e)(j) |
||||||||||||||||||||||||||||||||||||||||||
|
Wellington-Altus Financial Inc. |
Canada |
08/2024 |
49,525 |
2,206 |
(d)(e)(j) |
||||||||||||||||||||||||||||||||||||||||||
|
14,454 |
0.30 |
% |
|||||||||||||||||||||||||||||||||||||||||||||
|
Food, Beverage and Tobacco |
|||||||||||||||||||||||||||||||||||||||||||||||
|
Forward Keystone Holdings, LP |
03/2025 |
588,000 |
588 |
(d)(e)(j) |
|||||||||||||||||||||||||||||||||||||||||||
|
PPC CHG Blocker LLC |
12/2021 |
1 |
85 |
(d)(e)(j) |
|||||||||||||||||||||||||||||||||||||||||||
|
SBC Aggregator LP |
02/2025 |
1,247 |
1,389 |
(d)(e)(j) |
|||||||||||||||||||||||||||||||||||||||||||
|
2,062 |
0.04 |
% |
|||||||||||||||||||||||||||||||||||||||||||||
|
Health Care Equipment and Services |
|||||||||||||||||||||||||||||||||||||||||||||||
|
Asclepius Holdings LLC |
02/2022 |
448 |
— |
(d)(e)(j) |
|||||||||||||||||||||||||||||||||||||||||||
|
AVE Holdings LP |
Class A |
03/2024 |
402 |
— |
(d)(e)(j) |
||||||||||||||||||||||||||||||||||||||||||
|
AVE Holdings LP |
Class C |
11/2023 |
983 |
— |
(d)(e)(j) |
||||||||||||||||||||||||||||||||||||||||||
|
BCPE Co-Invest (A), LP |
Class A |
02/2022 |
45,000 |
62 |
(d)(e)(j) |
||||||||||||||||||||||||||||||||||||||||||
|
BVI Group Limited |
03/2025 |
532 |
632 |
(d)(e)(j) |
|||||||||||||||||||||||||||||||||||||||||||
|
CHPPR Holdings Inc. |
12/2023 |
4,700 |
748 |
(e)(j) |
|||||||||||||||||||||||||||||||||||||||||||
|
Crown CT HoldCo Inc. |
Class A |
03/2022 |
5 |
63 |
(d)(e)(j) |
||||||||||||||||||||||||||||||||||||||||||
|
Crown CT Management LLC |
03/2022 |
1 |
10 |
(d)(e)(j) |
|||||||||||||||||||||||||||||||||||||||||||
|
General Atlantic (USU) Blocker Collection Holdco, L.P. |
04/2025 |
305,000 |
305 |
(d)(e)(j) |
|||||||||||||||||||||||||||||||||||||||||||
|
KOLN Co-Invest Unblocked, LP |
Class A |
03/2023 |
50 |
70 |
(d)(e)(j) |
||||||||||||||||||||||||||||||||||||||||||
|
Network Investco BV |
Netherlands |
07/2022 |
1,073,830 |
3,036 |
(d)(e)(j) |
||||||||||||||||||||||||||||||||||||||||||
|
Olympia TopCo, L.P. |
Class A |
09/2019 |
50,000 |
— |
(d)(e)(j) |
||||||||||||||||||||||||||||||||||||||||||
|
OMERS Bluejay Investment Holdings LP |
Class A |
07/2018 |
25 |
50 |
(d)(e)(j) |
||||||||||||||||||||||||||||||||||||||||||
|
OMERS Wildcats Investment Holdings LLC |
Class A |
10/2019 |
216 |
111 |
(d)(e)(j) |
||||||||||||||||||||||||||||||||||||||||||
|
SiroMed Equity Holdings, LLC |
03/2018 |
3,703 |
12 |
(d)(e)(j) |
|||||||||||||||||||||||||||||||||||||||||||
Semi Annual Report 2025
107
CION Ares Diversified Credit Fund
Consolidated Schedule of Investments (continued)
June 30, 2025 (Unaudited)
(in thousands, except shares, percentages and as otherwise noted)
Common Stock (continued)
|
Company |
Country(a) |
Investment |
Coupon |
Reference |
Spread |
Acquisition Date |
Maturity Date |
Shares |
Principal Amount(a) |
Fair Value(a) |
% of Net Assets |
||||||||||||||||||||||||||||||||||||
|
VPP Group Holdings, L.P. |
12/2021 |
50 |
$ |
84 |
(d)(e)(j) |
||||||||||||||||||||||||||||||||||||||||||
|
VPP Group Holdings, L.P. |
Class A2 |
03/2023 |
0 |
1 |
(d)(e)(j) |
||||||||||||||||||||||||||||||||||||||||||
|
WSHP FC Holdings LLC |
07/2022 |
374 |
6 |
(d)(e)(j) |
|||||||||||||||||||||||||||||||||||||||||||
|
5,190 |
0.11 |
% |
|||||||||||||||||||||||||||||||||||||||||||||
|
Household and Personal Products |
|||||||||||||||||||||||||||||||||||||||||||||||
|
CDI Holdings I Corp. |
12/2021 |
50 |
29 |
(d)(e)(j) |
|||||||||||||||||||||||||||||||||||||||||||
|
RMCF V CIV XLIV, L.P. |
08/2021 |
54 |
16 |
(d)(e)(j) |
|||||||||||||||||||||||||||||||||||||||||||
|
Silk Holdings I Corp. |
05/2023 |
50 |
104 |
(d)(e)(j) |
|||||||||||||||||||||||||||||||||||||||||||
|
TCI Holdings, LP |
11/2024 |
9,050 |
1,093 |
(d)(e)(j) |
|||||||||||||||||||||||||||||||||||||||||||
|
1,242 |
0.03 |
% |
|||||||||||||||||||||||||||||||||||||||||||||
|
Insurance |
|||||||||||||||||||||||||||||||||||||||||||||||
|
15484910 Canada Inc. |
Canada |
04/2025 |
2,225,693 |
1,634 |
(d)(e)(j) |
||||||||||||||||||||||||||||||||||||||||||
| CFCo, LLC |
Class B |
09/2023 |
5,035,395 |
— |
(d)(e)(j) |
||||||||||||||||||||||||||||||||||||||||||
|
High Street HoldCo LLC |
Series A |
10.00% PIK |
04/2021 |
88,605 |
273 |
(d)(e) |
|||||||||||||||||||||||||||||||||||||||||
|
High Street HoldCo LLC |
Series C |
10.00% PIK |
04/2021 |
563,740 |
1,736 |
(d)(e) |
|||||||||||||||||||||||||||||||||||||||||
|
INSZ Holdings, LLC |
11/2022 |
31,139 |
48 |
(d)(e)(j) |
|||||||||||||||||||||||||||||||||||||||||||
|
INSZ Holdings, LLC |
11/2023 |
1,073,000 |
1,651 |
(d)(e)(j) |
|||||||||||||||||||||||||||||||||||||||||||
|
Maple Acquisition Holdings, LP |
Class A2 |
11/2023 |
13,871 |
309 |
(d)(e)(j) |
||||||||||||||||||||||||||||||||||||||||||
|
MDCP Co-Investors (Jade I), L.P. |
06/2025 |
2,490,000 |
3,418 |
(d)(e)(j) |
|||||||||||||||||||||||||||||||||||||||||||
|
Rocket Co-Invest, SLP |
Luxembourg |
03/2024 |
188,027 |
268 |
(d)(e)(j) |
||||||||||||||||||||||||||||||||||||||||||
|
9,337 |
0.19 |
% |
|||||||||||||||||||||||||||||||||||||||||||||
|
Materials |
|||||||||||||||||||||||||||||||||||||||||||||||
|
Adonis Acquisition Holdings Parent LLC |
02/2025 |
66,089 |
2,737 |
(d)(e)(j) |
|||||||||||||||||||||||||||||||||||||||||||
|
ASP-r-pac Holdings LP |
Class A |
12/2021 |
514 |
52 |
(d)(e)(j) |
||||||||||||||||||||||||||||||||||||||||||
|
Buckman PPC Co-Invest LP |
06/2025 |
906,000 |
906 |
(d)(e)(j) |
|||||||||||||||||||||||||||||||||||||||||||
|
KNPAK Holdings, LP |
Class A |
07/2019 |
100,000 |
101 |
(d)(e)(j) |
||||||||||||||||||||||||||||||||||||||||||
|
Meyer Parent, LLC |
02/2024 |
12,000 |
8 |
(d)(e)(j) |
|||||||||||||||||||||||||||||||||||||||||||
|
NCP MSI Co-Invest, LP |
03/2025 |
130,000 |
141 |
(d)(e)(j) |
|||||||||||||||||||||||||||||||||||||||||||
Semi Annual Report 2025
108
CION Ares Diversified Credit Fund
Consolidated Schedule of Investments (continued)
June 30, 2025 (Unaudited)
(in thousands, except shares, percentages and as otherwise noted)
Common Stock (continued)
|
Company |
Country(a) |
Investment |
Coupon |
Reference |
Spread |
Acquisition Date |
Maturity Date |
Shares |
Principal Amount(a) |
Fair Value(a) |
% of Net Assets |
||||||||||||||||||||||||||||||||||||
|
Novipax Parent Holding Company, L.L.C. |
Class C |
12/2020 |
50 |
$ |
— |
(d)(e)(j) |
|||||||||||||||||||||||||||||||||||||||||
|
Plaskolite PPC Blocker LLC |
12/2018 |
10 |
— |
(d)(e)(j) |
|||||||||||||||||||||||||||||||||||||||||||
|
3,945 |
0.08 |
% |
|||||||||||||||||||||||||||||||||||||||||||||
|
Sports, Media and Entertainment |
|||||||||||||||||||||||||||||||||||||||||||||||
|
County Line South Properties, LLC |
12/2024 |
8 |
1,689 |
(d)(e)(j) |
|||||||||||||||||||||||||||||||||||||||||||
|
Dolphin Center Properties, LLC |
12/2024 |
8 |
417 |
(d)(e)(j) |
|||||||||||||||||||||||||||||||||||||||||||
|
Dundee Eros, LP |
11/2024 |
1,682,452 |
1,768 |
(d)(e)(j) |
|||||||||||||||||||||||||||||||||||||||||||
|
Eagle Football Holdings Limited |
United Kingdom |
09/2023 |
14 |
17 |
(d)(e)(j) |
||||||||||||||||||||||||||||||||||||||||||
|
FinEquity Holdings, LLC |
12/2024 |
8 |
57,923 |
(d)(e)(j) |
|||||||||||||||||||||||||||||||||||||||||||
|
GSM Rights Fund II LP |
03/2025 |
251,849 |
252 |
(d)(e)(j) |
|||||||||||||||||||||||||||||||||||||||||||
|
Sandlot Action Sports, LLC |
05/2024 |
3,384 |
11 |
(d)(e)(j) |
|||||||||||||||||||||||||||||||||||||||||||
|
South Florida Motorsports, LLC |
12/2024 |
8 |
1,729 |
(d)(e)(j) |
|||||||||||||||||||||||||||||||||||||||||||
|
Stadium Coinvest (B)-III, L.P. |
02/2025 |
650,000 |
762 |
(d)(e)(j) |
|||||||||||||||||||||||||||||||||||||||||||
|
Storm Investment S.a.r.l. |
Luxembourg |
Class A |
06/2021 |
491,621 |
683 |
(d)(e)(j) |
|||||||||||||||||||||||||||||||||||||||||
|
Storm Investment S.a.r.l. |
Luxembourg |
Class B |
06/2021 |
491,621 |
683 |
(d)(e)(j) |
|||||||||||||||||||||||||||||||||||||||||
|
Storm Investment S.a.r.l. |
Luxembourg |
Class C |
06/2021 |
491,621 |
682 |
(d)(e)(j) |
|||||||||||||||||||||||||||||||||||||||||
|
Storm Investment S.a.r.l. |
Luxembourg |
Class D |
06/2021 |
491,621 |
682 |
(d)(e)(j) |
|||||||||||||||||||||||||||||||||||||||||
|
Storm Investment S.a.r.l. |
Luxembourg |
Class E |
06/2021 |
491,621 |
682 |
(d)(e)(j) |
|||||||||||||||||||||||||||||||||||||||||
|
Storm Investment S.a.r.l. |
Luxembourg |
Class F |
06/2021 |
491,621 |
682 |
(d)(e)(j) |
|||||||||||||||||||||||||||||||||||||||||
|
Storm Investment S.a.r.l. |
Luxembourg |
Class G |
06/2021 |
491,621 |
682 |
(d)(e)(j) |
|||||||||||||||||||||||||||||||||||||||||
|
Storm Investment S.a.r.l. |
Luxembourg |
Class H |
06/2021 |
491,621 |
682 |
(d)(e)(j) |
|||||||||||||||||||||||||||||||||||||||||
|
Storm Investment S.a.r.l. |
Luxembourg |
Class I |
06/2021 |
491,621 |
682 |
(d)(e)(j) |
|||||||||||||||||||||||||||||||||||||||||
|
Storm Investment S.a.r.l. |
Luxembourg |
06/2021 |
590 |
41 |
(d)(e)(j) |
||||||||||||||||||||||||||||||||||||||||||
|
Storm Investment S.a.r.l. |
Luxembourg |
04/2022 |
25,565 |
— |
(d)(e)(j) |
||||||||||||||||||||||||||||||||||||||||||
|
70,749 |
1.46 |
% |
|||||||||||||||||||||||||||||||||||||||||||||
|
Pharmaceuticals, Biotechnology and Life Sciences |
|||||||||||||||||||||||||||||||||||||||||||||||
|
Cobalt Holdings I, LP |
Class A |
10/2021 |
500 |
45 |
(d)(e)(j) |
||||||||||||||||||||||||||||||||||||||||||
|
Creek Feeder, L.P. |
12/2024 |
1,447,000 |
1,880 |
(d)(e)(j) |
|||||||||||||||||||||||||||||||||||||||||||
Semi Annual Report 2025
109
CION Ares Diversified Credit Fund
Consolidated Schedule of Investments (continued)
June 30, 2025 (Unaudited)
(in thousands, except shares, percentages and as otherwise noted)
Common Stock (continued)
|
Company |
Country(a) |
Investment |
Coupon |
Reference |
Spread |
Acquisition Date |
Maturity Date |
Shares |
Principal Amount(a) |
Fair Value(a) |
% of Net Assets |
||||||||||||||||||||||||||||||||||||
|
Gula Co-Invest II, L.P. |
04/2025 |
28 |
$ |
28 |
(d)(e)(j) |
||||||||||||||||||||||||||||||||||||||||||
|
WCI-BXC Investment Holdings, L.P. |
11/2023 |
126,000 |
126 |
(d)(e)(j) |
|||||||||||||||||||||||||||||||||||||||||||
|
2,079 |
0.04 |
% |
|||||||||||||||||||||||||||||||||||||||||||||
|
Real Estate Management and Development |
|||||||||||||||||||||||||||||||||||||||||||||||
|
Illinois Investment S.a.r.l. |
Luxembourg |
Class A |
09/2021 |
3,400,700 |
— |
(d)(e)(j) |
|||||||||||||||||||||||||||||||||||||||||
|
Illinois Investment S.a.r.l. |
Luxembourg |
Class B |
09/2021 |
3,400,700 |
— |
(d)(e)(j) |
|||||||||||||||||||||||||||||||||||||||||
|
Illinois Investment S.a.r.l. |
Luxembourg |
Class C |
09/2021 |
3,400,700 |
— |
(d)(e)(j) |
|||||||||||||||||||||||||||||||||||||||||
|
Illinois Investment S.a.r.l. |
Luxembourg |
Class D |
09/2021 |
3,400,700 |
— |
(d)(e)(j) |
|||||||||||||||||||||||||||||||||||||||||
|
Illinois Investment S.a.r.l. |
Luxembourg |
Class E |
09/2021 |
3,400,700 |
— |
(d)(e)(j) |
|||||||||||||||||||||||||||||||||||||||||
|
Illinois Investment S.a.r.l. |
Luxembourg |
Class F |
09/2021 |
3,400,700 |
— |
(d)(e)(j) |
|||||||||||||||||||||||||||||||||||||||||
|
Illinois Investment S.a.r.l. |
Luxembourg |
Class G |
09/2021 |
3,400,700 |
— |
(d)(e)(j) |
|||||||||||||||||||||||||||||||||||||||||
|
Illinois Investment S.a.r.l. |
Luxembourg |
Class H |
09/2021 |
3,400,700 |
— |
(d)(e)(j) |
|||||||||||||||||||||||||||||||||||||||||
|
Illinois Investment S.a.r.l. |
Luxembourg |
Class I |
09/2021 |
3,400,700 |
— |
(d)(e)(j) |
|||||||||||||||||||||||||||||||||||||||||
|
Illinois Investment S.a.r.l. |
Luxembourg |
09/2021 |
4,081 |
— |
(d)(e)(j) |
||||||||||||||||||||||||||||||||||||||||||
|
Illinois Investment S.a.r.l. |
Luxembourg |
05/2022 |
106,292 |
— |
(d)(e)(j) |
||||||||||||||||||||||||||||||||||||||||||
|
— |
— |
% |
|||||||||||||||||||||||||||||||||||||||||||||
|
Software and Services |
|||||||||||||||||||||||||||||||||||||||||||||||
|
APG Holdings, LLC |
Class A |
01/2020 |
50,000 |
33 |
(d)(e)(j) |
||||||||||||||||||||||||||||||||||||||||||
|
Astorg VII Co-Invest ERT |
Luxembourg |
01/2020 |
1,208,500 |
2,714 |
(d)(e)(j) |
||||||||||||||||||||||||||||||||||||||||||
|
Avaya Holdings Corp. |
05/2023 |
78,991 |
610 |
(j) |
|||||||||||||||||||||||||||||||||||||||||||
|
Bobcat Topco, L.P. |
Class A-1 |
06/2023 |
56,770 |
54 |
(d)(e)(j) |
||||||||||||||||||||||||||||||||||||||||||
|
Consilio Investment Holdings, L.P. |
Series A |
09/2022 |
243 |
5 |
(d)(e)(j) |
||||||||||||||||||||||||||||||||||||||||||
|
Consilio Investment Holdings, L.P. |
05/2021 |
5,038 |
96 |
(d)(e)(j) |
|||||||||||||||||||||||||||||||||||||||||||
|
Cority Parent, Inc. |
Canada |
Class B-1 |
07/2019 |
47,536 |
3 |
(d)(e)(j) |
|||||||||||||||||||||||||||||||||||||||||
|
Denali Apexco LP |
Class A |
09/2021 |
50,000 |
96 |
(d)(e)(j) |
||||||||||||||||||||||||||||||||||||||||||
|
Destiny Digital Holdings, L.P. |
05/2021 |
3,076 |
55 |
(d)(e)(j) |
|||||||||||||||||||||||||||||||||||||||||||
|
Eclipse Investor Parent, L.P. |
Class A |
09/2024 |
102 |
109 |
(d)(e)(j) |
||||||||||||||||||||||||||||||||||||||||||
Semi Annual Report 2025
110
CION Ares Diversified Credit Fund
Consolidated Schedule of Investments (continued)
June 30, 2025 (Unaudited)
(in thousands, except shares, percentages and as otherwise noted)
Common Stock (continued)
|
Company |
Country(a) |
Investment |
Coupon |
Reference |
Spread |
Acquisition Date |
Maturity Date |
Shares |
Principal Amount(a) |
Fair Value(a) |
% of Net Assets |
||||||||||||||||||||||||||||||||||||
|
Elliott Alto Co-Investor Aggregator L.P. |
09/2022 |
500,000 |
$ |
1,480 |
(d)(e)(j) |
||||||||||||||||||||||||||||||||||||||||||
|
EQT IX Co-Investment (E) SCSP |
04/2021 |
5,000 |
99 |
(d)(e)(j) |
|||||||||||||||||||||||||||||||||||||||||||
|
H&F Unite Partners, L.P. |
05/2019 |
50,032 |
122 |
(d)(e)(j) |
|||||||||||||||||||||||||||||||||||||||||||
|
iCapital, Inc. |
04/2025 |
295,434 |
4,136 |
(d)(e)(j) |
|||||||||||||||||||||||||||||||||||||||||||
|
Insight PDI Holdings, LLC |
Class A |
03/2019 |
26,548 |
60 |
(d)(e)(j) |
||||||||||||||||||||||||||||||||||||||||||
|
Magic Topco, L.P. |
Class B |
09/2020 |
12,975 |
— |
(d)(e)(j) |
||||||||||||||||||||||||||||||||||||||||||
|
Magnesium Co-Invest SCSp |
Luxembourg |
05/2022 |
5 |
58 |
(d)(e)(j) |
||||||||||||||||||||||||||||||||||||||||||
|
Paradigmatic Holdco LLC |
08/2024 |
1,057,325 |
1,585 |
(d)(e)(j) |
|||||||||||||||||||||||||||||||||||||||||||
|
PCMI Ultimate Holdings, LP |
03/2025 |
34,526 |
— |
(d)(e)(j) |
|||||||||||||||||||||||||||||||||||||||||||
|
RMCF VI CIV XLVIII, L.P. |
06/2022 |
64,827 |
98 |
(d)(e)(j) |
|||||||||||||||||||||||||||||||||||||||||||
|
RMS Group Holdings, Inc. |
12/2021 |
6 |
30 |
(d)(e)(j) |
|||||||||||||||||||||||||||||||||||||||||||
|
Rocket Parent, LLC |
Class A |
10/2021 |
74,502 |
227 |
(d)(e)(j) |
||||||||||||||||||||||||||||||||||||||||||
|
Skywalker TopCo, LLC |
11/2020 |
25,407 |
141 |
(d)(e)(j) |
|||||||||||||||||||||||||||||||||||||||||||
|
Sunshine Software Holdings, Inc. |
Class A-1 |
10/2021 |
5,000 |
79 |
(d)(e)(j) |
||||||||||||||||||||||||||||||||||||||||||
|
WP Victors Co-Investment, L.P. |
08/2024 |
461,000 |
519 |
(d)(e)(j) |
|||||||||||||||||||||||||||||||||||||||||||
|
12,409 |
0.26 |
% |
|||||||||||||||||||||||||||||||||||||||||||||
|
Technology Hardware and Equipment |
|||||||||||||||||||||||||||||||||||||||||||||||
|
PerkinElmer Topco GP, L.L.C. |
Class A-2 |
01/2022 |
365 |
53 |
(d)(e)(j) |
||||||||||||||||||||||||||||||||||||||||||
|
Repairify Holdings, LLC |
Class A |
06/2021 |
1,655 |
22 |
(d)(e)(j) |
||||||||||||||||||||||||||||||||||||||||||
|
75 |
— |
% |
|||||||||||||||||||||||||||||||||||||||||||||
|
Transportation |
|||||||||||||||||||||||||||||||||||||||||||||||
|
Neovia Acquisition, LLC |
11/2022 |
6 |
— |
(e)(j) |
|||||||||||||||||||||||||||||||||||||||||||
|
— |
— |
% |
|||||||||||||||||||||||||||||||||||||||||||||
|
Utilities |
|||||||||||||||||||||||||||||||||||||||||||||||
|
Apex Clean Energy TopCo, LLC |
Class A |
11/2021 |
149,776 |
25,212 |
(d)(e)(j) |
||||||||||||||||||||||||||||||||||||||||||
|
25,212 |
0.52 |
% |
|||||||||||||||||||||||||||||||||||||||||||||
|
Total Common Stock (Cost $150,854) |
192,809 |
3.97 |
% |
||||||||||||||||||||||||||||||||||||||||||||
Semi Annual Report 2025
111
CION Ares Diversified Credit Fund
Consolidated Schedule of Investments (continued)
June 30, 2025 (Unaudited)
(in thousands, except shares, percentages and as otherwise noted)
Warrants(d)(j)
|
Company |
Country(a) |
Investment |
Coupon |
Reference |
Spread |
Acquisition Date |
Maturity Date |
Shares |
Principal Amount(a) |
Fair Value(a) |
% of Net Assets |
||||||||||||||||||||||||||||||||||||
|
Commercial and Professional Services |
|||||||||||||||||||||||||||||||||||||||||||||||
|
New Insight Holdings, Inc. |
07/2024 |
5,104 |
$ |
— |
(e)(f) |
||||||||||||||||||||||||||||||||||||||||||
|
Priority Waste Super Holdings, LLC |
08/2023 |
4,247 |
483 |
(e) |
|||||||||||||||||||||||||||||||||||||||||||
|
Priority Waste Super Holdings, LLC |
06/2024 |
1,937 |
220 |
(e)(f) |
|||||||||||||||||||||||||||||||||||||||||||
|
Visual Edge Technology, Inc. |
03/2018 |
27,334 |
— |
(e) |
|||||||||||||||||||||||||||||||||||||||||||
|
703 |
0.01 |
% |
|||||||||||||||||||||||||||||||||||||||||||||
|
Consumer Distribution and Retail |
|||||||||||||||||||||||||||||||||||||||||||||||
|
Arko Corp |
12/2020 |
55 |
— |
||||||||||||||||||||||||||||||||||||||||||||
|
— |
— |
% |
|||||||||||||||||||||||||||||||||||||||||||||
|
Food, Beverage and Tobacco |
|||||||||||||||||||||||||||||||||||||||||||||||
|
Gotham Greens Holdings, PBC |
06/2022 |
31,842 |
— |
(e)(f) |
|||||||||||||||||||||||||||||||||||||||||||
|
— |
— |
% |
|||||||||||||||||||||||||||||||||||||||||||||
|
Health Care Equipment and Services |
|||||||||||||||||||||||||||||||||||||||||||||||
|
Air Medical Buyer Corp |
03/2018 |
122 |
1 |
(e) |
|||||||||||||||||||||||||||||||||||||||||||
|
CHPPR Holdings Inc. |
12/2023 |
13,942 |
964 |
(e) |
|||||||||||||||||||||||||||||||||||||||||||
|
CHPPR Holdings Inc. |
12/2023 |
6,604 |
336 |
(e) |
|||||||||||||||||||||||||||||||||||||||||||
|
CHPPR Holdings Inc. |
12/2023 |
7,625 |
1,214 |
(e) |
|||||||||||||||||||||||||||||||||||||||||||
|
CHPPR Holdings Inc. |
12/2023 |
3,054 |
486 |
(e) |
|||||||||||||||||||||||||||||||||||||||||||
|
GMR Buyer Corp. |
12/2021 |
1,927 |
17 |
(e) |
|||||||||||||||||||||||||||||||||||||||||||
|
GMR Buyer Corp. |
05/2024 |
959,055 |
8,469 |
(e) |
|||||||||||||||||||||||||||||||||||||||||||
|
Nomi Health, Inc. |
07/2023 |
2,174 |
— |
(e) |
|||||||||||||||||||||||||||||||||||||||||||
|
Nomi Health, Inc. |
06/2024 |
4,857 |
— |
(e) |
|||||||||||||||||||||||||||||||||||||||||||
|
11,487 |
0.24 |
% |
|||||||||||||||||||||||||||||||||||||||||||||
|
Insurance |
|||||||||||||||||||||||||||||||||||||||||||||||
|
SelectQuote, Inc. |
10/2024 |
57,965 |
— |
(e) |
|||||||||||||||||||||||||||||||||||||||||||
|
— |
— |
% |
|||||||||||||||||||||||||||||||||||||||||||||
|
Sports, Media and Entertainment |
|||||||||||||||||||||||||||||||||||||||||||||||
|
Eagle Football Holdings Limited |
12/2022 |
5 |
22 |
(e) |
|||||||||||||||||||||||||||||||||||||||||||
|
Eagle Football Holdings Limited |
12/2022 |
5 |
7 |
(e) |
|||||||||||||||||||||||||||||||||||||||||||
Semi Annual Report 2025
112
CION Ares Diversified Credit Fund
Consolidated Schedule of Investments (continued)
June 30, 2025 (Unaudited)
(in thousands, except shares, percentages and as otherwise noted)
Warrants(d)(j) (continued)
|
Company |
Country(a) |
Investment |
Coupon |
Reference |
Spread |
Acquisition Date |
Maturity Date |
Shares |
Principal Amount(a) |
Fair Value(a) |
% of Net Assets |
||||||||||||||||||||||||||||||||||||
|
League One Volleyball, Inc. |
01/2025 |
8 |
$ |
— |
(e) |
||||||||||||||||||||||||||||||||||||||||||
|
PFL MMA, Inc. |
01/2021 |
115,111 |
— |
(e) |
|||||||||||||||||||||||||||||||||||||||||||
|
PFL MMA, Inc. |
11/2022 |
2,457 |
— |
(e) |
|||||||||||||||||||||||||||||||||||||||||||
|
29 |
— |
% |
|||||||||||||||||||||||||||||||||||||||||||||
|
Software and Services |
|||||||||||||||||||||||||||||||||||||||||||||||
|
ID.me, LLC |
01/2025 |
1,198,188 |
1,697 |
(e) |
|||||||||||||||||||||||||||||||||||||||||||
|
1,697 |
0.03 |
% |
|||||||||||||||||||||||||||||||||||||||||||||
|
Total Warrants (Cost $2,641) |
13,916 |
0.29 |
% |
||||||||||||||||||||||||||||||||||||||||||||
|
Total Investments — (Cost $7,035,669) |
7,101,920 |
146.28 |
% |
||||||||||||||||||||||||||||||||||||||||||||
|
Other Assets In Excess of Liabilities |
(2,246,786 |
) |
(46.28 |
)% |
|||||||||||||||||||||||||||||||||||||||||||
|
Net Assets |
$ |
4,855,134 |
100.00 |
% |
|||||||||||||||||||||||||||||||||||||||||||
(a) Investment holdings in foreign currencies are converted to U.S. dollars using period end spot rates. Investments are in United States enterprises and all principal balances shown are in U.S. dollars unless otherwise noted.
(b) Variable rate loans to the Fund's portfolio companies bear interest at a rate that may be determined by reference to the Secured Overnight Financing Rate ("SOFR"), or an alternate base rate such as the Bank Bill Swap Bid Rate ("BBSY"), Bank Bill Benchmark Rate ("BKBM"), Canadian Dollar Offered Rate ("CDOR"), Copenhagen Interbank Offered Rate ("CIBOR"), Euro Interbank Offered Rate ("EURIBOR"), Norwegian Interbank Offered Rate ("NIBOR"), Prime Rate ("PRIME"), Sterling Overnight Index Average ("SONIA"), Stockholm Interbank Offered Rate ("STIBOR") or Warsaw Interbank Offered Rate ("WIBOR"), at the borrower's option, which reset semi-annually (S), quarterly (Q), bi-monthly (B), or monthly (M). SOFR based contracts may include a credit spread adjustment that is charged in addition to the base rate and the stated spread. Stated interest rates in this schedule represents the "all-in" rate as of June 30, 2025.
(c) Variable rate coupon rate shown as of June 30, 2025.
(d) These investments, which as of June 30, 2025 represented 145% of the Fund's net assets or 99% of the Fund's total assets, may be subject to legal restrictions on sales. Acquisition dates are included above for equity securities that may be subject to legal restrictions on sales.
(e) Investments whose values were determined using significant unobservable inputs (Level 3) (See Note 4 to the consolidated financial statements).
(f) These assets are pledged as collateral under the Fund or the Fund's consolidated subsidiaries' various revolving credit facilities.
(g) As of June 30, 2025, the Fund had the following commitments to fund various revolving and delayed draw senior secured and subordinated loans. Such commitments are subject to the satisfaction of certain conditions set forth in the documents governing these loans and there can be no assurance that such conditions will be satisfied.
|
Company |
Investment Type |
Total revolving and delayed draw loan commitments |
Less: funded commitments |
Total unfunded commitments |
|||||||||||||||
|
15484880 Canada Inc. |
1st Lien Delay Draw Term Loan |
$ |
757 |
$ |
— |
$ |
757 |
||||||||||||
|
15484880 Canada Inc. |
1st Lien Revolving Loan |
304 |
(30 |
) |
274 |
||||||||||||||
|
15484910 Canada Inc. |
1st Lien Delay Draw Term Loan |
455 |
— |
455 |
|||||||||||||||
| 3 Step Sports LLC |
1st Lien Delay Draw Term Loan |
1,498 |
— |
1,498 |
|||||||||||||||
| 3 Step Sports LLC |
1st Lien Revolving Loan |
124 |
(93 |
) |
31 |
||||||||||||||
|
760203 N.B. LTD. |
1st Lien Revolving Loan |
1,471 |
(1,211 |
) |
260 |
||||||||||||||
|
Accession Risk Management Group, Inc. |
1st Lien Delay Draw Term Loan |
332 |
— |
332 |
|||||||||||||||
|
Accession Risk Management Group, Inc. |
1st Lien Revolving Loan |
136 |
— |
136 |
|||||||||||||||
|
Accommodations Plus Technologies LLC |
1st Lien Revolving Loan |
63 |
— |
63 |
|||||||||||||||
|
ACP Avenu Buyer, LLC |
1st Lien Delay Draw Term Loan |
2,973 |
— |
2,973 |
|||||||||||||||
Semi Annual Report 2025
113
CION Ares Diversified Credit Fund
Consolidated Schedule of Investments (continued)
June 30, 2025 (Unaudited)
(in thousands, except shares, percentages and as otherwise noted)
|
Company |
Investment Type |
Total revolving and delayed draw loan commitments |
Less: funded commitments |
Total unfunded commitments |
|||||||||||||||
|
ACP Avenu Buyer, LLC |
1st Lien Revolving Loan |
$ |
1,057 |
$ |
— |
$ |
1,057 |
||||||||||||
|
ACTFY Buyer, Inc. |
1st Lien Delay Draw Term Loan |
328 |
— |
328 |
|||||||||||||||
|
ACTFY Buyer, Inc. |
1st Lien Revolving Loan |
476 |
— |
476 |
|||||||||||||||
|
Activate holdings (US) Corp. |
1st Lien Revolving Loan |
579 |
— |
579 |
|||||||||||||||
|
ADMA BIOLOGICS, INC. |
1st Lien Revolving Loan |
1 |
(1 |
) |
— |
||||||||||||||
|
Adonis Acquisition Holdings LLC |
1st Lien Delay Draw Term Loan |
529 |
— |
529 |
|||||||||||||||
|
Adonis Acquisition Holdings LLC |
1st Lien Revolving Loan |
1 |
(1 |
) |
— |
||||||||||||||
|
Adonis Bidco, Inc. |
1st Lien Delay Draw Term Loan |
12,593 |
— |
12,593 |
|||||||||||||||
|
Adonis Bidco, Inc. |
1st Lien Revolving Loan |
5,688 |
— |
5,688 |
|||||||||||||||
|
Adonis Financial Funding, LLC |
1st Lien Revolving Loan |
417 |
(417 |
) |
— |
||||||||||||||
|
Aduro Advisors, LLC |
1st Lien Delay Draw Term Loan |
1,006 |
— |
1,006 |
|||||||||||||||
|
Aduro Advisors, LLC |
1st Lien Revolving Loan |
597 |
— |
597 |
|||||||||||||||
|
Aerin Medical Inc. |
1st Lien Delay Draw Term Loan |
1,131 |
— |
1,131 |
|||||||||||||||
|
AI Titan Parent, Inc. |
1st Lien Delay Draw Term Loan |
1,789 |
— |
1,789 |
|||||||||||||||
|
AI Titan Parent, Inc. |
1st Lien Revolving Loan |
1,546 |
— |
1,546 |
|||||||||||||||
|
Airx Climate Solutions, Inc. |
1st Lien Delay Draw Term Loan |
2,160 |
— |
2,160 |
|||||||||||||||
|
Airx Climate Solutions, Inc. |
1st Lien Revolving Loan |
463 |
— |
463 |
|||||||||||||||
|
Alcami Corporation |
1st Lien Revolving Loan |
27 |
— |
27 |
|||||||||||||||
|
Aldinger Company |
1st Lien Delay Draw Term Loan |
343 |
— |
343 |
|||||||||||||||
|
Aldinger Company |
1st Lien Revolving Loan |
304 |
(81 |
) |
223 |
||||||||||||||
|
Align Precision Group, LLC |
1st Lien Delay Draw Term Loan |
30 |
— |
30 |
|||||||||||||||
|
AllClear Military Inc. |
1st Lien Delay Draw Term Loan |
243 |
— |
243 |
|||||||||||||||
|
AllClear Military Inc. |
1st Lien Revolving Loan |
162 |
— |
162 |
|||||||||||||||
|
AMCP Clean Acquisition Company, LLC |
1st Lien Delay Draw Term Loan |
537 |
— |
537 |
|||||||||||||||
|
Anaplan, Inc. |
1st Lien Revolving Loan |
381 |
— |
381 |
|||||||||||||||
|
Andwis Group Limited |
1st Lien Delay Draw Term Loan |
1,801 |
— |
1,801 |
|||||||||||||||
|
Antea Group Holding B.V. |
1st Lien Delay Draw Term Loan |
1,472 |
— |
1,472 |
|||||||||||||||
|
Antenore Bidco SpA |
1st Lien Delay Draw Term Loan |
1,178 |
— |
1,178 |
|||||||||||||||
|
AP Adhesives Holdings, LLC |
1st Lien Delay Draw Term Loan |
1,235 |
— |
1,235 |
|||||||||||||||
|
AP Adhesives Holdings, LLC |
1st Lien Revolving Loan |
642 |
(26 |
) |
616 |
||||||||||||||
|
Apex Service Partners, LLC |
1st Lien Revolving Loan |
2,131 |
— |
2,131 |
|||||||||||||||
|
Aptean Acquiror Inc. |
1st Lien Delay Draw Term Loan |
654 |
— |
654 |
|||||||||||||||
|
Aptean Acquiror Inc. |
1st Lien Revolving Loan |
373 |
— |
373 |
|||||||||||||||
|
AQ Sage Buyer, LLC |
1st Lien Revolving Loan |
50 |
(22 |
) |
28 |
||||||||||||||
|
AQ Sunshine, Inc. |
1st Lien Delay Draw Term Loan |
3,910 |
— |
3,910 |
|||||||||||||||
|
AQ Sunshine, Inc. |
1st Lien Revolving Loan |
1,653 |
(529 |
) |
1,124 |
||||||||||||||
|
Arete Bidco Limited |
1st Lien Delay Draw Term Loan |
6,874 |
— |
6,874 |
|||||||||||||||
|
Artifact Bidco, Inc. |
1st Lien Delay Draw Term Loan |
282 |
— |
282 |
|||||||||||||||
|
Artifact Bidco, Inc. |
1st Lien Revolving Loan |
252 |
— |
252 |
|||||||||||||||
Semi Annual Report 2025
114
CION Ares Diversified Credit Fund
Consolidated Schedule of Investments (continued)
June 30, 2025 (Unaudited)
(in thousands, except shares, percentages and as otherwise noted)
|
Company |
Investment Type |
Total revolving and delayed draw loan commitments |
Less: funded commitments |
Total unfunded commitments |
|||||||||||||||
|
Artivion, Inc. |
1st Lien Delay Draw Term Loan |
$ |
1,199 |
$ |
— |
$ |
1,199 |
||||||||||||
|
Artivion, Inc. |
1st Lien Revolving Loan |
336 |
(168 |
) |
168 |
||||||||||||||
|
ASPIRE BIDCO LIMITED |
1st Lien Delay Draw Term Loan |
1,775 |
— |
1,775 |
|||||||||||||||
|
Aspris Bidco Limited |
1st Lien Delay Draw Term Loan |
284 |
— |
284 |
|||||||||||||||
|
ASP-r-pac Acquisition Co LLC |
1st Lien Revolving Loan |
839 |
(478 |
) |
361 |
||||||||||||||
|
Astra Service Partners, LLC |
1st Lien Delay Draw Term Loan |
632 |
— |
632 |
|||||||||||||||
|
Astra Service Partners, LLC |
1st Lien Revolving Loan |
2 |
1 |
2 |
|||||||||||||||
|
athenahealth Group Inc. |
1st Lien Revolving Loan |
2,100 |
— |
2,100 |
|||||||||||||||
|
Avalign Technologies, Inc. |
1st Lien Revolving Loan |
250 |
(75 |
) |
175 |
||||||||||||||
|
AX VI INV3 Holding AB |
1st Lien Delay Draw Term Loan |
4,079 |
— |
4,079 |
|||||||||||||||
|
Badia Spices, LLC |
1st Lien Revolving Loan |
526 |
— |
526 |
|||||||||||||||
|
Bamboo Health Holdings, LLC |
1st Lien Revolving Loan |
212 |
— |
212 |
|||||||||||||||
|
Bamboo Purchaser, Inc. |
1st Lien Revolving Loan |
1 |
(1 |
) |
— |
||||||||||||||
|
Bamboo US BidCo LLC |
1st Lien Delay Draw Term Loan |
1,872 |
— |
1,872 |
|||||||||||||||
|
Bamboo US BidCo LLC |
1st Lien Revolving Loan |
1,413 |
— |
1,413 |
|||||||||||||||
|
Banyan Software Holdings, LLC |
1st Lien Delay Draw Term Loan |
3,423 |
— |
3,423 |
|||||||||||||||
|
Banyan Software Holdings, LLC |
1st Lien Revolving Loan |
510 |
(75 |
) |
435 |
||||||||||||||
|
BCPE Pequod Buyer, Inc. |
1st Lien Revolving Loan |
3,003 |
— |
3,003 |
|||||||||||||||
|
Beacon Pointe Harmony, LLC |
1st Lien Delay Draw Term Loan |
6,106 |
— |
6,106 |
|||||||||||||||
|
Beacon Pointe Harmony, LLC |
1st Lien Revolving Loan |
909 |
— |
909 |
|||||||||||||||
|
Beacon Wellness Brands, Inc. |
1st Lien Revolving Loan |
205 |
— |
205 |
|||||||||||||||
|
Bellwether Buyer, L.L.C. |
1st Lien Delay Draw Term Loan |
1,092 |
— |
1,092 |
|||||||||||||||
|
Bellwether Buyer, L.L.C. |
1st Lien Revolving Loan |
454 |
— |
454 |
|||||||||||||||
|
Berner Food & Beverage, LLC |
1st Lien Revolving Loan |
262 |
(73 |
) |
189 |
||||||||||||||
|
BGI Purchaser, Inc. |
1st Lien Delay Draw Term Loan |
1,595 |
— |
1,595 |
|||||||||||||||
|
BGI Purchaser, Inc. |
1st Lien Revolving Loan |
4,674 |
(3,168 |
) |
1,506 |
||||||||||||||
|
BGIF IV Fearless Utility Services, Inc. |
1st Lien Delay Draw Term Loan |
811 |
— |
811 |
|||||||||||||||
|
BGIF IV Fearless Utility Services, Inc. |
1st Lien Revolving Loan |
709 |
— |
709 |
|||||||||||||||
|
Bluejack Fire Acquisition, Inc. |
1st Lien Delay Draw Term Loan |
1,416 |
— |
1,416 |
|||||||||||||||
|
Bluejack Fire Acquisition, Inc. |
1st Lien Revolving Loan |
294 |
— |
294 |
|||||||||||||||
|
BNZ TopCo B.V. |
Subordinated Delay Draw Term Loan |
7,930 |
— |
7,930 |
|||||||||||||||
|
Bobcat Purchaser, LLC |
1st Lien Revolving Loan |
306 |
— |
306 |
|||||||||||||||
|
Bottomline Technologies, Inc. and Legal Spend Holdings, LLC |
1st Lien Revolving Loan |
1,912 |
— |
1,912 |
|||||||||||||||
|
BRADYPLUS HOLDINGS, LLC |
1st Lien Delay Draw Term Loan |
384 |
— |
384 |
|||||||||||||||
|
BrightStar Group Holdings, Inc. |
1st Lien Revolving Loan |
505 |
(25 |
) |
480 |
||||||||||||||
|
Bulab Holdings, Inc. |
1st Lien Delay Draw Term Loan |
4,996 |
— |
4,996 |
|||||||||||||||
|
Bulab Holdings, Inc. |
1st Lien Revolving Loan |
6,101 |
— |
6,101 |
|||||||||||||||
|
Bumble Bidco Limited |
1st Lien Delay Draw Term Loan |
2,286 |
— |
2,286 |
|||||||||||||||
|
Businessolver.com, Inc. |
1st Lien Delay Draw Term Loan |
111 |
— |
111 |
|||||||||||||||
Semi Annual Report 2025
115
CION Ares Diversified Credit Fund
Consolidated Schedule of Investments (continued)
June 30, 2025 (Unaudited)
(in thousands, except shares, percentages and as otherwise noted)
|
Company |
Investment Type |
Total revolving and delayed draw loan commitments |
Less: funded commitments |
Total unfunded commitments |
|||||||||||||||
|
BVI Medical, Inc. |
1st Lien Delay Draw Term Loan |
$ |
850 |
$ |
— |
$ |
850 |
||||||||||||
|
BVI Medical, Inc. |
1st Lien Revolving Loan |
1,586 |
— |
1,586 |
|||||||||||||||
|
Calculus Acquico Sarl |
1st Lien Delay Draw Term Loan |
1,000 |
— |
1,000 |
|||||||||||||||
|
Cambrex Corporation |
1st Lien Delay Draw Term Loan |
5,454 |
— |
5,454 |
|||||||||||||||
|
Cambrex Corporation |
1st Lien Revolving Loan |
5,889 |
— |
5,889 |
|||||||||||||||
|
Cannon Bridge Designated Activity Company |
1st Lien Revolving Loan |
9,259 |
(3,182 |
) |
6,077 |
||||||||||||||
|
Capnor Connery Bidco A/S |
1st Lien Delay Draw Term Loan |
219 |
— |
219 |
|||||||||||||||
|
Capstone Acquisition Holdings, Inc. |
1st Lien Delay Draw Term Loan |
518 |
— |
518 |
|||||||||||||||
|
Capstone Acquisition Holdings, Inc. |
1st Lien Revolving Loan |
3,135 |
— |
3,135 |
|||||||||||||||
|
Capstone Acquisition Holdings, Inc. |
2nd Lien Delay Draw Term Loan |
1,668 |
— |
1,668 |
|||||||||||||||
|
Captive Resources Midco, LLC |
1st Lien Revolving Loan |
185 |
— |
185 |
|||||||||||||||
|
Cardinal Parent, Inc. |
1st Lien Revolving Loan |
1 |
— |
1 |
|||||||||||||||
|
CBTS BORROWER, LLC |
1st Lien Delay Draw Term Loan |
1,900 |
— |
1,900 |
|||||||||||||||
|
Celnor Group Limited |
1st Lien Delay Draw Term Loan |
621 |
— |
621 |
|||||||||||||||
|
CentralSquare Technologies, LLC |
1st Lien Revolving Loan |
3,402 |
— |
3,402 |
|||||||||||||||
|
Cezanne Bidco |
1st Lien Delay Draw Term Loan |
4,325 |
— |
4,325 |
|||||||||||||||
|
CFG Investments WH Limited |
1st Lien Revolving Loan |
5,100 |
(1,643 |
) |
3,457 |
||||||||||||||
|
Chariot Buyer LLC |
1st Lien Revolving Loan |
100 |
— |
100 |
|||||||||||||||
|
Chillaton Bidco Limited |
1st Lien Delay Draw Term Loan |
1,397 |
— |
1,397 |
|||||||||||||||
|
City Line Distributors LLC |
1st Lien Revolving Loan |
2 |
— |
2 |
|||||||||||||||
|
Clarion Home Services Group, LLC |
1st Lien Revolving Loan |
416 |
(260 |
) |
156 |
||||||||||||||
|
Clearstead Advisors, LLC |
1st Lien Revolving Loan |
34 |
(15 |
) |
19 |
||||||||||||||
|
Cloud Software Group, Inc. |
1st Lien Revolving Loan |
2,574 |
— |
2,574 |
|||||||||||||||
|
CMG HoldCo, LLC |
1st Lien Delay Draw Term Loan |
1,240 |
— |
1,240 |
|||||||||||||||
|
CMG HoldCo, LLC |
1st Lien Revolving Loan |
1,397 |
(431 |
) |
966 |
||||||||||||||
|
Cobalt Buyer Sub, Inc. |
1st Lien Delay Draw Term Loan |
2,156 |
— |
2,156 |
|||||||||||||||
|
Cobalt Buyer Sub, Inc. |
1st Lien Revolving Loan |
1,194 |
(358 |
) |
836 |
||||||||||||||
|
Collision SP Subco, LLC |
1st Lien Delay Draw Term Loan |
773 |
— |
773 |
|||||||||||||||
|
Collision SP Subco, LLC |
1st Lien Revolving Loan |
88 |
— |
88 |
|||||||||||||||
|
Compex Legal Services, Inc. |
1st Lien Revolving Loan |
900 |
(540 |
) |
360 |
||||||||||||||
|
Comprehensive EyeCare Partners, LLC |
1st Lien Revolving Loan |
1 |
(1 |
) |
— |
||||||||||||||
|
Confirmasoft AB |
1st Lien Delay Draw Term Loan |
1,698 |
— |
1,698 |
|||||||||||||||
|
Continental Acquisition Holdings, Inc. |
1st Lien Revolving Loan |
1 |
(1 |
) |
— |
||||||||||||||
|
Convera International Holdings Limited |
1st Lien Revolving Loan |
1,777 |
— |
1,777 |
|||||||||||||||
|
Cority Software Inc. |
1st Lien Revolving Loan |
1,504 |
— |
1,504 |
|||||||||||||||
|
Cornerstone OnDemand, Inc. |
1st Lien Revolving Loan |
100 |
(22 |
) |
78 |
||||||||||||||
|
Coupa Holdings, LLC |
1st Lien Delay Draw Term Loan |
20 |
— |
20 |
|||||||||||||||
|
Coupa Holdings, LLC |
1st Lien Revolving Loan |
1 |
— |
1 |
|||||||||||||||
|
CPIG Holdco Inc. |
1st Lien Revolving Loan |
2 |
(1 |
) |
1 |
||||||||||||||
Semi Annual Report 2025
116
CION Ares Diversified Credit Fund
Consolidated Schedule of Investments (continued)
June 30, 2025 (Unaudited)
(in thousands, except shares, percentages and as otherwise noted)
|
Company |
Investment Type |
Total revolving and delayed draw loan commitments |
Less: funded commitments |
Total unfunded commitments |
|||||||||||||||
|
Cradle Lux Bidco S.a r.l |
1st Lien Delay Draw Term Loan |
$ |
985 |
$ |
— |
$ |
985 |
||||||||||||
|
Creek Parent, Inc. |
1st Lien Revolving Loan |
7,992 |
— |
7,992 |
|||||||||||||||
|
Crossco (1469) Limited |
1st Lien Delay Draw Term Loan |
1,062 |
— |
1,062 |
|||||||||||||||
|
Crown CT Parent Inc. |
1st Lien Revolving Loan |
903 |
(572 |
) |
331 |
||||||||||||||
|
CST Holding Company |
1st Lien Revolving Loan |
79 |
— |
79 |
|||||||||||||||
|
CVP Holdco, Inc. |
1st Lien Delay Draw Term Loan |
4,160 |
— |
4,160 |
|||||||||||||||
|
CVP Holdco, Inc. |
1st Lien Revolving Loan |
3,539 |
— |
3,539 |
|||||||||||||||
|
Databricks, Inc. |
1st Lien Delay Draw Term Loan |
17 |
— |
17 |
|||||||||||||||
|
Datix Bidco Limited |
1st Lien Delay Draw Term Loan |
891 |
— |
891 |
|||||||||||||||
|
Datix Bidco Limited |
1st Lien Revolving Loan |
1,424 |
(313 |
) |
1,111 |
||||||||||||||
|
Davidson Hotel Company LLC |
1st Lien Delay Draw Term Loan |
1,041 |
— |
1,041 |
|||||||||||||||
|
Davidson Hotel Company LLC |
1st Lien Revolving Loan |
567 |
— |
567 |
|||||||||||||||
|
DecoPac, Inc. |
1st Lien Revolving Loan |
3,737 |
(1,038 |
) |
2,699 |
||||||||||||||
|
DEDOMENA BIDCO LIMITED |
1st Lien Delay Draw Term Loan |
403 |
— |
403 |
|||||||||||||||
|
Denali Holdco LLC |
1st Lien Delay Draw Term Loan |
1,394 |
— |
1,394 |
|||||||||||||||
|
Denali Holdco LLC |
1st Lien Revolving Loan |
1,108 |
— |
1,108 |
|||||||||||||||
|
DFC Global Facility Borrower III LLC |
1st Lien Revolving Loan |
29,386 |
(22,780 |
) |
6,606 |
||||||||||||||
|
Diamond Mezzanine 24 LLC |
1st Lien Delay Draw Term Loan |
198 |
— |
198 |
|||||||||||||||
|
Diamond Mezzanine 24 LLC |
1st Lien Revolving Loan |
321 |
— |
321 |
|||||||||||||||
|
Diligent Corporation |
1st Lien Delay Draw Term Loan |
926 |
— |
926 |
|||||||||||||||
|
Diligent Corporation |
1st Lien Revolving Loan |
669 |
(50 |
) |
619 |
||||||||||||||
|
Divisions Holding Corporation |
1st Lien Revolving Loan |
99 |
— |
99 |
|||||||||||||||
|
Dorado Bidco, Inc. |
1st Lien Delay Draw Term Loan |
2,232 |
— |
2,232 |
|||||||||||||||
|
Dorado Bidco, Inc. |
1st Lien Revolving Loan |
698 |
— |
698 |
|||||||||||||||
|
DOXA Insurance Holdings LLC |
1st Lien Delay Draw Term Loan |
2,329 |
— |
2,329 |
|||||||||||||||
|
DOXA Insurance Holdings LLC |
1st Lien Revolving Loan |
200 |
(24 |
) |
176 |
||||||||||||||
|
DP Flores Holdings, LLC |
1st Lien Delay Draw Term Loan |
1,115 |
— |
1,115 |
|||||||||||||||
|
DP Flores Holdings, LLC |
1st Lien Revolving Loan |
513 |
— |
513 |
|||||||||||||||
|
Draken Bidco Limited |
1st Lien Delay Draw Term Loan |
1,440 |
— |
1,440 |
|||||||||||||||
|
Drivecentric Holdings, LLC |
1st Lien Revolving Loan |
518 |
— |
518 |
|||||||||||||||
|
Drogon Bidco Inc. |
1st Lien Delay Draw Term Loan |
722 |
— |
722 |
|||||||||||||||
|
Drogon Bidco Inc. |
1st Lien Revolving Loan |
445 |
— |
445 |
|||||||||||||||
|
DRS Holdings III, Inc. |
1st Lien Revolving Loan |
183 |
— |
183 |
|||||||||||||||
|
DuraServ LLC |
1st Lien Delay Draw Term Loan |
220 |
— |
220 |
|||||||||||||||
|
DuraServ LLC |
1st Lien Revolving Loan |
227 |
— |
227 |
|||||||||||||||
|
Dynamic NC Aerospace Holdings, LLC |
1st Lien Revolving Loan |
1,608 |
(686 |
) |
922 |
||||||||||||||
|
EC Partners Spanish Bidco, S.L.U. |
1st Lien Delay Draw Term Loan |
654 |
— |
654 |
|||||||||||||||
|
ECG Bidco S.A.S. |
1st Lien Delay Draw Term Loan |
4,851 |
— |
4,851 |
|||||||||||||||
|
Echo Purchaser, Inc. |
1st Lien Delay Draw Term Loan |
179 |
— |
179 |
|||||||||||||||
Semi Annual Report 2025
117
CION Ares Diversified Credit Fund
Consolidated Schedule of Investments (continued)
June 30, 2025 (Unaudited)
(in thousands, except shares, percentages and as otherwise noted)
|
Company |
Investment Type |
Total revolving and delayed draw loan commitments |
Less: funded commitments |
Total unfunded commitments |
|||||||||||||||
|
Echo Purchaser, Inc. |
1st Lien Revolving Loan |
$ |
213 |
$ |
— |
$ |
213 |
||||||||||||
|
Eclipse Buyer, Inc. |
1st Lien Delay Draw Term Loan |
7,630 |
— |
7,630 |
|||||||||||||||
|
Eclipse Buyer, Inc. |
1st Lien Revolving Loan |
4,351 |
— |
4,351 |
|||||||||||||||
|
Edmunds GovTech, Inc. |
1st Lien Delay Draw Term Loan |
327 |
— |
327 |
|||||||||||||||
|
Edmunds GovTech, Inc. |
1st Lien Revolving Loan |
64 |
(32 |
) |
32 |
||||||||||||||
|
Einstein Parent, Inc. |
1st Lien Revolving Loan |
537 |
— |
537 |
|||||||||||||||
|
Elemica Parent, Inc. |
1st Lien Revolving Loan |
1,358 |
(1,267 |
) |
91 |
||||||||||||||
|
Elevation Services Parent Holdings, LLC |
1st Lien Revolving Loan |
631 |
(505 |
) |
126 |
||||||||||||||
|
EMB Purchaser, Inc. |
1st Lien Delay Draw Term Loan |
15,711 |
— |
15,711 |
|||||||||||||||
|
EMB Purchaser, Inc. |
1st Lien Revolving Loan |
6,840 |
— |
6,840 |
|||||||||||||||
|
Empower Payments Investor, LLC |
1st Lien Delay Draw Term Loan |
66 |
— |
66 |
|||||||||||||||
|
Empower Payments Investor, LLC |
1st Lien Revolving Loan |
60 |
— |
60 |
|||||||||||||||
|
Enverus Holdings, Inc. |
1st Lien Delay Draw Term Loan |
166 |
— |
166 |
|||||||||||||||
|
Enverus Holdings, Inc. |
1st Lien Revolving Loan |
1,053 |
(76 |
) |
977 |
||||||||||||||
|
Envisage Dental UK Limited |
1st Lien Delay Draw Term Loan |
3,811 |
— |
3,811 |
|||||||||||||||
|
Erasmus Acquisition Holding B.V. |
1st Lien Delay Draw Term Loan |
742 |
— |
742 |
|||||||||||||||
|
eResearchTechnology, Inc. |
1st Lien Delay Draw Term Loan |
3,915 |
— |
3,915 |
|||||||||||||||
|
eResearchTechnology, Inc. |
1st Lien Revolving Loan |
2,724 |
— |
2,724 |
|||||||||||||||
|
ESHA Research, LLC |
1st Lien Revolving Loan |
76 |
(50 |
) |
26 |
||||||||||||||
|
Essential Services Holding Corporation |
1st Lien Delay Draw Term Loan |
4,179 |
— |
4,179 |
|||||||||||||||
|
Essential Services Holding Corporation |
1st Lien Revolving Loan |
2,611 |
(313 |
) |
2,298 |
||||||||||||||
|
Eternal Aus Bidco Pty Ltd |
1st Lien Delay Draw Term Loan |
182 |
— |
182 |
|||||||||||||||
|
EuroParcs Topholding B.V. |
1st Lien Delay Draw Term Loan |
332 |
— |
332 |
|||||||||||||||
|
Evolent Health LLC |
1st Lien Revolving Loan |
4 |
(2 |
) |
2 |
||||||||||||||
|
Excel Fitness Holdings, Inc. |
1st Lien Delay Draw Term Loan |
122 |
— |
122 |
|||||||||||||||
|
Excelitas Technologies Corp. |
1st Lien Delay Draw Term Loan |
2,092 |
— |
2,092 |
|||||||||||||||
|
ExtraHop Networks, Inc. |
1st Lien Revolving Loan |
420 |
— |
420 |
|||||||||||||||
|
Fever Labs, Inc. |
1st Lien Delay Draw Term Loan |
818 |
— |
818 |
|||||||||||||||
|
Fever Labs, Inc. |
1st Lien Revolving Loan |
3,645 |
(2,308 |
) |
1,337 |
||||||||||||||
|
Finastra USA, Inc. |
1st Lien Revolving Loan |
2,178 |
— |
2,178 |
|||||||||||||||
|
Firebird Acquisition Corp, Inc. |
1st Lien Delay Draw Term Loan |
1,422 |
— |
1,422 |
|||||||||||||||
|
Firebird Acquisition Corp, Inc. |
1st Lien Revolving Loan |
473 |
— |
473 |
|||||||||||||||
|
Fitness Ventures Holdings, Inc. |
1st Lien Delay Draw Term Loan |
942 |
— |
942 |
|||||||||||||||
|
Fitness Ventures Holdings, Inc. |
1st Lien Revolving Loan |
141 |
(128 |
) |
13 |
||||||||||||||
|
FL Hawk Intermediate Holdings, Inc. |
1st Lien Revolving Loan |
1,658 |
— |
1,658 |
|||||||||||||||
|
Flexential Topco Corporation |
1st Lien Revolving Loan |
3,000 |
(3,000 |
) |
— |
||||||||||||||
|
Flint Opco, LLC |
1st Lien Delay Draw Term Loan |
1,589 |
— |
1,589 |
|||||||||||||||
|
Flint Opco, LLC |
1st Lien Revolving Loan |
1 |
— |
1 |
|||||||||||||||
|
Flywheel Acquireco, Inc. |
1st Lien Revolving Loan |
1,664 |
(832 |
) |
832 |
||||||||||||||
Semi Annual Report 2025
118
CION Ares Diversified Credit Fund
Consolidated Schedule of Investments (continued)
June 30, 2025 (Unaudited)
(in thousands, except shares, percentages and as otherwise noted)
|
Company |
Investment Type |
Total revolving and delayed draw loan commitments |
Less: funded commitments |
Total unfunded commitments |
|||||||||||||||
|
Forward Keystone Holdings, LP |
1st Lien Delay Draw Term Loan |
$ |
1,302 |
$ |
— |
$ |
1,302 |
||||||||||||
|
Foundation Consumer Brands, LLC |
1st Lien Revolving Loan |
788 |
— |
788 |
|||||||||||||||
|
Foundation Risk Partners, Corp. |
1st Lien Delay Draw Term Loan |
157 |
— |
157 |
|||||||||||||||
|
Foundation Risk Partners, Corp. |
1st Lien Revolving Loan |
3,847 |
— |
3,847 |
|||||||||||||||
|
Frontline Road Safety Operations, LLC |
1st Lien Delay Draw Term Loan |
494 |
— |
494 |
|||||||||||||||
|
Frontline Road Safety Operations, LLC |
1st Lien Revolving Loan |
5,513 |
(1,206 |
) |
4,307 |
||||||||||||||
|
Galway Borrower LLC |
1st Lien Delay Draw Term Loan |
1,128 |
— |
1,128 |
|||||||||||||||
|
Galway Borrower LLC |
1st Lien Revolving Loan |
1,144 |
(359 |
) |
785 |
||||||||||||||
|
Gapco Aiv Interholdco (CP), L.P. |
1st Lien Delay Draw Term Loan |
4,200 |
— |
4,200 |
|||||||||||||||
|
GC Waves Holdings, Inc. |
1st Lien Delay Draw Term Loan |
3,944 |
— |
3,944 |
|||||||||||||||
|
GC Waves Holdings, Inc. |
1st Lien Revolving Loan |
173 |
— |
173 |
|||||||||||||||
|
Generator Buyer, Inc. |
1st Lien Delay Draw Term Loan |
159 |
— |
159 |
|||||||||||||||
|
Generator Buyer, Inc. |
1st Lien Revolving Loan |
218 |
(35 |
) |
183 |
||||||||||||||
|
Gestion ABS Bidco Inc./ABS Bidco Holdings Inc. |
1st Lien Delay Draw Term Loan |
237 |
— |
237 |
|||||||||||||||
|
Gestion ABS Bidco Inc./ABS Bidco Holdings Inc. |
1st Lien Revolving Loan |
73 |
— |
73 |
|||||||||||||||
|
GHP-VGS Purchaser LLC |
1st Lien Delay Draw Term Loan |
926 |
— |
926 |
|||||||||||||||
|
GHP-VGS Purchaser LLC |
1st Lien Revolving Loan |
285 |
— |
285 |
|||||||||||||||
|
Global Music Rights, LLC |
1st Lien Revolving Loan |
6,442 |
— |
6,442 |
|||||||||||||||
|
GNZ Energy Bidco Limited |
1st Lien Delay Draw Term Loan |
1,196 |
— |
1,196 |
|||||||||||||||
|
Goldeneye Parent, LLC |
1st Lien Revolving Loan |
373 |
— |
373 |
|||||||||||||||
|
GraphPAD Software, LLC |
1st Lien Delay Draw Term Loan |
3,948 |
— |
3,948 |
|||||||||||||||
|
GraphPAD Software, LLC |
1st Lien Revolving Loan |
1,836 |
— |
1,836 |
|||||||||||||||
|
GS SEER Group Borrower LLC |
1st Lien Delay Draw Term Loan |
25 |
— |
25 |
|||||||||||||||
|
GS SEER Group Borrower LLC |
1st Lien Revolving Loan |
37 |
— |
37 |
|||||||||||||||
|
GSV Purchaser, Inc. |
1st Lien Delay Draw Term Loan |
2,017 |
— |
2,017 |
|||||||||||||||
|
GSV Purchaser, Inc. |
1st Lien Revolving Loan |
1,202 |
— |
1,202 |
|||||||||||||||
|
GTCR Everest Borrower, LLC |
1st Lien Revolving Loan |
211 |
— |
211 |
|||||||||||||||
|
GTCR F Buyer Corp. |
1st Lien Delay Draw Term Loan |
139 |
— |
139 |
|||||||||||||||
|
GTCR F Buyer Corp. |
1st Lien Revolving Loan |
45 |
— |
45 |
|||||||||||||||
|
Guidepoint Security Holdings, LLC |
1st Lien Delay Draw Term Loan |
295 |
— |
295 |
|||||||||||||||
|
Guidepoint Security Holdings, LLC |
1st Lien Revolving Loan |
200 |
— |
200 |
|||||||||||||||
|
Hakken Bidco B.V. |
1st Lien Delay Draw Term Loan |
739 |
— |
739 |
|||||||||||||||
|
Hanger, Inc. |
1st Lien Delay Draw Term Loan |
58 |
— |
58 |
|||||||||||||||
|
Harbourvest Global Private Equity Limited |
1st Lien Revolving Loan |
24,000 |
(11,420 |
) |
12,580 |
||||||||||||||
|
Heavy Construction Systems Specialists, LLC |
1st Lien Revolving Loan |
410 |
— |
410 |
|||||||||||||||
|
HGC Holdings, LLC |
1st Lien Delay Draw Term Loan |
11,000 |
— |
11,000 |
|||||||||||||||
|
HGC Holdings, LLC |
1st Lien Revolving Loan |
2,606 |
— |
2,606 |
|||||||||||||||
Semi Annual Report 2025
119
CION Ares Diversified Credit Fund
Consolidated Schedule of Investments (continued)
June 30, 2025 (Unaudited)
(in thousands, except shares, percentages and as otherwise noted)
|
Company |
Investment Type |
Total revolving and delayed draw loan commitments |
Less: funded commitments |
Total unfunded commitments |
|||||||||||||||
|
HH-Stella, Inc. |
1st Lien Delay Draw Term Loan |
$ |
776 |
$ |
— |
$ |
776 |
||||||||||||
|
HH-Stella, Inc. |
1st Lien Revolving Loan |
444 |
(127 |
) |
317 |
||||||||||||||
|
Higginbotham Insurance Agency, Inc. |
1st Lien Delay Draw Term Loan |
308 |
— |
308 |
|||||||||||||||
|
High Street Buyer, Inc. |
1st Lien Delay Draw Term Loan |
747 |
— |
747 |
|||||||||||||||
|
High Street Buyer, Inc. |
1st Lien Revolving Loan |
688 |
— |
688 |
|||||||||||||||
|
Highline Aftermarket Acquisition, LLC |
1st Lien Revolving Loan |
2 |
— |
2 |
|||||||||||||||
|
Hills Distribution, Inc. |
1st Lien Delay Draw Term Loan |
44 |
— |
44 |
|||||||||||||||
|
Hills Distribution, Inc. |
1st Lien Revolving Loan |
1 |
(1 |
) |
— |
||||||||||||||
|
Himalaya TopCo LLC |
1st Lien Delay Draw Term Loan |
12,221 |
— |
12,221 |
|||||||||||||||
|
Himalaya TopCo LLC |
1st Lien Revolving Loan |
9,857 |
— |
9,857 |
|||||||||||||||
|
Horizon Avionics Buyer, LLC (Horizon CTS Buyer, LLC) |
1st Lien Delay Draw Term Loan |
1,030 |
— |
1,030 |
|||||||||||||||
|
Horizon Avionics Buyer, LLC (Horizon CTS Buyer, LLC) |
1st Lien Revolving Loan |
1,385 |
(111 |
) |
1,274 |
||||||||||||||
|
HP RSS Buyer, Inc. |
1st Lien Delay Draw Term Loan |
443 |
— |
443 |
|||||||||||||||
|
HuFriedy Group Acquisition LLC |
1st Lien Delay Draw Term Loan |
484 |
— |
484 |
|||||||||||||||
|
HuFriedy Group Acquisition LLC |
1st Lien Revolving Loan |
2,102 |
(126 |
) |
1,976 |
||||||||||||||
|
Hyland Software, Inc. |
1st Lien Revolving Loan |
594 |
— |
594 |
|||||||||||||||
|
Icefall Parent, Inc. |
1st Lien Revolving Loan |
154 |
— |
154 |
|||||||||||||||
|
ID.me, LLC |
1st Lien Delay Draw Term Loan |
4,617 |
— |
4,617 |
|||||||||||||||
|
ID.me, LLC |
1st Lien Revolving Loan |
2,309 |
(2,309 |
) |
— |
||||||||||||||
|
IFH Franchisee Holdings, LLC |
1st Lien Delay Draw Term Loan |
880 |
— |
880 |
|||||||||||||||
|
IFH Franchisee Holdings, LLC |
1st Lien Revolving Loan |
1,737 |
(1,158 |
) |
579 |
||||||||||||||
|
IGEA BIDCO S.P.A |
1st Lien Delay Draw Term Loan |
1,028 |
— |
1,028 |
|||||||||||||||
|
Indigo Acquisition B.V. |
1st Lien Delay Draw Term Loan |
383 |
— |
383 |
|||||||||||||||
|
Infinity Home Services HoldCo, Inc. |
1st Lien Delay Draw Term Loan |
3,981 |
— |
3,981 |
|||||||||||||||
|
Infinity Home Services HoldCo, Inc. |
1st Lien Revolving Loan |
456 |
(114 |
) |
342 |
||||||||||||||
|
Inszone Mid, LLC |
1st Lien Delay Draw Term Loan |
8,602 |
— |
8,602 |
|||||||||||||||
|
Inszone Mid, LLC |
1st Lien Revolving Loan |
1,215 |
— |
1,215 |
|||||||||||||||
|
Internet Truckstop Group LLC |
1st Lien Revolving Loan |
302 |
— |
302 |
|||||||||||||||
|
IQN Holding Corp. |
1st Lien Revolving Loan |
629 |
(461 |
) |
168 |
||||||||||||||
|
IRI Group Holdings, Inc. |
1st Lien Revolving Loan |
1,885 |
— |
1,885 |
|||||||||||||||
|
Ivanti Security Holdings LLC |
1st Lien Revolving Loan |
460 |
— |
460 |
|||||||||||||||
|
JAMS Buyer LLC |
1st Lien Delay Draw Term Loan |
625 |
— |
625 |
|||||||||||||||
|
JAMS Buyer LLC |
1st Lien Revolving Loan |
349 |
— |
349 |
|||||||||||||||
|
JMG Group Investments Limited |
1st Lien Delay Draw Term Loan |
2,922 |
— |
2,922 |
|||||||||||||||
|
Kene Acquisition, Inc. |
1st Lien Delay Draw Term Loan |
713 |
— |
713 |
|||||||||||||||
|
Kene Acquisition, Inc. |
1st Lien Revolving Loan |
265 |
— |
265 |
|||||||||||||||
|
Keystone Agency Partners LLC |
1st Lien Delay Draw Term Loan |
523 |
— |
523 |
|||||||||||||||
|
Keystone Agency Partners LLC |
1st Lien Revolving Loan |
20 |
— |
20 |
|||||||||||||||
Semi Annual Report 2025
120
CION Ares Diversified Credit Fund
Consolidated Schedule of Investments (continued)
June 30, 2025 (Unaudited)
(in thousands, except shares, percentages and as otherwise noted)
|
Company |
Investment Type |
Total revolving and delayed draw loan commitments |
Less: funded commitments |
Total unfunded commitments |
|||||||||||||||
|
King Risk Partners, LLC |
1st Lien Delay Draw Term Loan |
$ |
1,018 |
$ |
— |
$ |
1,018 |
||||||||||||
|
King Risk Partners, LLC |
1st Lien Revolving Loan |
261 |
— |
261 |
|||||||||||||||
|
Kings Buyer, LLC |
1st Lien Revolving Loan |
186 |
(65 |
) |
121 |
||||||||||||||
|
KPS Global LLC |
1st Lien Revolving Loan |
1,359 |
— |
1,359 |
|||||||||||||||
|
Laboratories Bidco LLC |
1st Lien Revolving Loan |
1,597 |
(1,376 |
) |
221 |
||||||||||||||
|
LBC Woodlands Purchaser LLC |
1st Lien Delay Draw Term Loan |
564 |
— |
564 |
|||||||||||||||
|
LBC Woodlands Purchaser LLC |
1st Lien Revolving Loan |
611 |
— |
611 |
|||||||||||||||
|
League One Volleyball Clubs, LLC |
1st Lien Delay Draw Term Loan |
2 |
— |
2 |
|||||||||||||||
|
LeanTaaS Holdings, Inc. |
1st Lien Delay Draw Term Loan |
2,809 |
— |
2,809 |
|||||||||||||||
|
Legends Hospitality Holding Company, LLC |
1st Lien Delay Draw Term Loan |
354 |
— |
354 |
|||||||||||||||
|
Legends Hospitality Holding Company, LLC |
1st Lien Revolving Loan |
600 |
(240 |
) |
360 |
||||||||||||||
|
Leviathan Intermediate Holdco, LLC |
1st Lien Revolving Loan |
13 |
(6 |
) |
7 |
||||||||||||||
|
LGDN Bidco Limited |
1st Lien Delay Draw Term Loan |
296 |
— |
296 |
|||||||||||||||
|
Lightbeam Bidco, Inc. |
1st Lien Revolving Loan |
1 |
— |
1 |
|||||||||||||||
|
LivTech Purchaser, Inc. |
1st Lien Delay Draw Term Loan |
289 |
— |
289 |
|||||||||||||||
|
LivTech Purchaser, Inc. |
1st Lien Revolving Loan |
384 |
— |
384 |
|||||||||||||||
|
Magellan Bidco |
1st Lien Delay Draw Term Loan |
196 |
— |
196 |
|||||||||||||||
|
Majesco |
1st Lien Revolving Loan |
624 |
— |
624 |
|||||||||||||||
|
Maximus BidCo AB |
1st Lien Delay Draw Term Loan |
7,259 |
— |
7,259 |
|||||||||||||||
|
Medlar Bidco Limited |
1st Lien Delay Draw Term Loan |
1,660 |
— |
1,660 |
|||||||||||||||
|
Metatiedot Bidco Oy |
1st Lien Delay Draw Term Loan |
999 |
— |
999 |
|||||||||||||||
|
Metatiedot Bidco Oy |
1st Lien Revolving Loan |
662 |
— |
662 |
|||||||||||||||
|
Meyer Laboratory, LLC |
1st Lien Delay Draw Term Loan |
107 |
— |
107 |
|||||||||||||||
|
Meyer Laboratory, LLC |
1st Lien Revolving Loan |
190 |
(133 |
) |
57 |
||||||||||||||
|
Modernizing Medicine, Inc. |
1st Lien Revolving Loan |
2,111 |
— |
2,111 |
|||||||||||||||
|
Monica Holdco (US), Inc. |
1st Lien Revolving Loan |
1,009 |
— |
1,009 |
|||||||||||||||
|
Mountaineer Merger Corporation |
1st Lien Revolving Loan |
5,375 |
(2,217 |
) |
3,158 |
||||||||||||||
|
Mr. Greens Intermediate, LLC |
1st Lien Delay Draw Term Loan |
865 |
— |
865 |
|||||||||||||||
|
Mr. Greens Intermediate, LLC |
1st Lien Revolving Loan |
146 |
(34 |
) |
112 |
||||||||||||||
|
MRI Software LLC |
1st Lien Revolving Loan |
541 |
(30 |
) |
511 |
||||||||||||||
|
Msis Holdings, Inc. |
1st Lien Delay Draw Term Loan |
1,164 |
— |
1,164 |
|||||||||||||||
|
Msis Holdings, Inc. |
1st Lien Revolving Loan |
831 |
(121 |
) |
710 |
||||||||||||||
|
Mustang Prospects Purchaser, LLC |
1st Lien Delay Draw Term Loan |
328 |
— |
328 |
|||||||||||||||
|
Mustang Prospects Purchaser, LLC |
1st Lien Revolving Loan |
284 |
(17 |
) |
267 |
||||||||||||||
|
NCP-MSI Buyer, Inc. |
1st Lien Delay Draw Term Loan |
998 |
— |
998 |
|||||||||||||||
|
NCP-MSI Buyer, Inc. |
1st Lien Revolving Loan |
1,031 |
(266 |
) |
765 |
||||||||||||||
|
Nelipak Holding Company |
1st Lien Delay Draw Term Loan |
1,243 |
— |
1,243 |
|||||||||||||||
|
Nelipak Holding Company |
1st Lien Revolving Loan |
554 |
(206 |
) |
348 |
||||||||||||||
|
Neptune BidCo US Inc. |
1st Lien Revolving Loan |
2,988 |
— |
2,988 |
|||||||||||||||
Semi Annual Report 2025
121
CION Ares Diversified Credit Fund
Consolidated Schedule of Investments (continued)
June 30, 2025 (Unaudited)
(in thousands, except shares, percentages and as otherwise noted)
|
Company |
Investment Type |
Total revolving and delayed draw loan commitments |
Less: funded commitments |
Total unfunded commitments |
|||||||||||||||
|
Netsmart Technologies, Inc. |
1st Lien Delay Draw Term Loan |
$ |
4,473 |
$ |
— |
$ |
4,473 |
||||||||||||
|
Netsmart Technologies, Inc. |
1st Lien Revolving Loan |
5,311 |
— |
5,311 |
|||||||||||||||
|
Network Bidco B.V. |
1st Lien Delay Draw Term Loan |
2,075 |
— |
2,075 |
|||||||||||||||
|
New Churchill Holdco LLC |
1st Lien Delay Draw Term Loan |
542 |
— |
542 |
|||||||||||||||
|
New Churchill Holdco LLC |
1st Lien Revolving Loan |
151 |
— |
151 |
|||||||||||||||
|
Next Holdco, LLC |
1st Lien Delay Draw Term Loan |
255 |
— |
255 |
|||||||||||||||
|
Next Holdco, LLC |
1st Lien Revolving Loan |
37 |
— |
37 |
|||||||||||||||
|
NMC Skincare Intermediate Holdings II, LLC |
1st Lien Revolving Loan |
340 |
(64 |
) |
276 |
||||||||||||||
|
North American Science Associates, LLC |
1st Lien Revolving Loan |
2,499 |
(2,499 |
) |
— |
||||||||||||||
|
North Haven Fairway Buyer, LLC |
1st Lien Delay Draw Term Loan |
886 |
— |
886 |
|||||||||||||||
|
North Haven Fairway Buyer, LLC |
1st Lien Revolving Loan |
13 |
(7 |
) |
6 |
||||||||||||||
|
North Haven Stack Buyer, LLC |
1st Lien Delay Draw Term Loan |
89 |
— |
89 |
|||||||||||||||
|
North Haven Stack Buyer, LLC |
1st Lien Revolving Loan |
545 |
(232 |
) |
313 |
||||||||||||||
|
North Star Acquisitionco, LLC |
1st Lien Delay Draw Term Loan |
28 |
— |
28 |
|||||||||||||||
|
North Star Acquisitionco, LLC |
1st Lien Revolving Loan |
621 |
— |
621 |
|||||||||||||||
|
Northwinds Holding, Inc. |
1st Lien Delay Draw Term Loan |
631 |
— |
631 |
|||||||||||||||
|
Northwinds Holding, Inc. |
1st Lien Revolving Loan |
965 |
— |
965 |
|||||||||||||||
|
Oakbridge Insurance Agency LLC |
1st Lien Delay Draw Term Loan |
721 |
— |
721 |
|||||||||||||||
|
Oakbridge Insurance Agency LLC |
1st Lien Revolving Loan |
113 |
(8 |
) |
105 |
||||||||||||||
|
Odevo AB |
1st Lien Delay Draw Term Loan |
540 |
— |
540 |
|||||||||||||||
|
OLIFAN GROUP PARTNERS |
1st Lien Delay Draw Term Loan |
248 |
— |
248 |
|||||||||||||||
|
Olympia Acquisition, Inc. |
1st Lien Delay Draw Term Loan |
54 |
— |
54 |
|||||||||||||||
|
Oncourse Warehouse Borrower, LLC |
1st Lien Delay Draw Term Loan |
21,990 |
— |
21,990 |
|||||||||||||||
|
Oncourse Warehouse Borrower, LLC |
1st Lien Revolving Loan |
2,000 |
— |
2,000 |
|||||||||||||||
|
Optio Group Limited |
1st Lien Delay Draw Term Loan |
1,574 |
— |
1,574 |
|||||||||||||||
|
Orange Barrel Media, LLC |
1st Lien Delay Draw Term Loan |
2,184 |
— |
2,184 |
|||||||||||||||
|
Orange Barrel Media, LLC |
1st Lien Revolving Loan |
2,080 |
— |
2,080 |
|||||||||||||||
|
Pallas NZ Funding Trust No. 1 |
1st Lien Revolving Loan |
3,818 |
(3,818 |
) |
— |
||||||||||||||
|
Panther NewCo |
1st Lien Delay Draw Term Loan |
6,313 |
— |
6,313 |
|||||||||||||||
|
Paris US Holdco, Inc. & 1001028292 Ontario Inc. |
1st Lien Delay Draw Term Loan |
1,516 |
— |
1,516 |
|||||||||||||||
|
Paris US Holdco, Inc. & 1001028292 Ontario Inc. |
1st Lien Revolving Loan |
1,074 |
(43 |
) |
1,031 |
||||||||||||||
|
Pathstone Family Office LLC |
1st Lien Delay Draw Term Loan |
722 |
— |
722 |
|||||||||||||||
|
Pathstone Family Office LLC |
1st Lien Revolving Loan |
629 |
— |
629 |
|||||||||||||||
|
Patriot Container Corp. |
1st Lien Delay Draw Term Loan |
1,882 |
— |
1,882 |
|||||||||||||||
|
Patriot Growth Insurance Services, LLC |
1st Lien Revolving Loan |
250 |
— |
250 |
|||||||||||||||
|
PCIA SPV-3, LLC |
1st Lien Delay Draw Term Loan |
227 |
— |
227 |
|||||||||||||||
|
PCIA SPV-3, LLC |
1st Lien Revolving Loan |
321 |
— |
321 |
|||||||||||||||
|
PCMI Parent, LLC |
1st Lien Revolving Loan |
600 |
— |
600 |
|||||||||||||||
Semi Annual Report 2025
122
CION Ares Diversified Credit Fund
Consolidated Schedule of Investments (continued)
June 30, 2025 (Unaudited)
(in thousands, except shares, percentages and as otherwise noted)
|
Company |
Investment Type |
Total revolving and delayed draw loan commitments |
Less: funded commitments |
Total unfunded commitments |
|||||||||||||||
|
PCS Midco, Inc. |
1st Lien Delay Draw Term Loan |
$ |
173 |
$ |
— |
$ |
173 |
||||||||||||
|
PCS Midco, Inc. |
1st Lien Revolving Loan |
75 |
(6 |
) |
69 |
||||||||||||||
|
PDDS Holdco, Inc. |
1st Lien Delay Draw Term Loan |
38 |
— |
38 |
|||||||||||||||
|
PDDS Holdco, Inc. |
1st Lien Revolving Loan |
58 |
(17 |
) |
41 |
||||||||||||||
|
PDI TA Holdings, Inc. |
1st Lien Revolving Loan |
185 |
(74 |
) |
111 |
||||||||||||||
|
People Corporation |
1st Lien Delay Draw Term Loan |
4,368 |
— |
4,368 |
|||||||||||||||
|
People Corporation |
1st Lien Revolving Loan |
659 |
(412 |
) |
247 |
||||||||||||||
|
Perigon Wealth Management, LLC |
1st Lien Delay Draw Term Loan |
874 |
— |
874 |
|||||||||||||||
|
Perigon Wealth Management, LLC |
1st Lien Revolving Loan |
250 |
— |
250 |
|||||||||||||||
|
PestCo, LLC |
1st Lien Delay Draw Term Loan |
99 |
— |
99 |
|||||||||||||||
|
PestCo, LLC |
1st Lien Revolving Loan |
2 |
— |
2 |
|||||||||||||||
|
Phoenix YW Buyer, Inc. |
1st Lien Revolving Loan |
979 |
— |
979 |
|||||||||||||||
|
Pinnacle MEP Intermediate Holdco LLC |
1st Lien Delay Draw Term Loan |
1,173 |
— |
1,173 |
|||||||||||||||
|
Pinnacle MEP Intermediate Holdco LLC |
1st Lien Revolving Loan |
518 |
(311 |
) |
207 |
||||||||||||||
|
Plaskolite PPC Intermediate II LLC |
1st Lien Revolving Loan |
2,713 |
(152 |
) |
2,561 |
||||||||||||||
|
Pluralsight, LLC |
1st Lien Delay Draw Term Loan |
1,322 |
— |
1,322 |
|||||||||||||||
|
Pluralsight, LLC |
1st Lien Revolving Loan |
529 |
— |
529 |
|||||||||||||||
|
Poseidon Intermediateco, Inc. |
1st Lien Delay Draw Term Loan |
229 |
— |
229 |
|||||||||||||||
|
Poseidon Intermediateco, Inc. |
1st Lien Revolving Loan |
118 |
— |
118 |
|||||||||||||||
|
PracticeTek Purchaser, LLC |
1st Lien Delay Draw Term Loan |
2,254 |
— |
2,254 |
|||||||||||||||
|
PracticeTek Purchaser, LLC |
1st Lien Revolving Loan |
2 |
(1 |
) |
1 |
||||||||||||||
|
Precision Concepts International LLC |
1st Lien Revolving Loan |
312 |
(91 |
) |
221 |
||||||||||||||
|
Premier Specialties, Inc. |
1st Lien Revolving Loan |
385 |
(281 |
) |
104 |
||||||||||||||
|
Premiere Buyer, LLC |
1st Lien Delay Draw Term Loan |
321 |
— |
321 |
|||||||||||||||
|
Premiere Buyer, LLC |
1st Lien Revolving Loan |
1,062 |
— |
1,062 |
|||||||||||||||
|
Premise Health Holding Corp. |
1st Lien Revolving Loan |
387 |
(26 |
) |
361 |
||||||||||||||
|
Prime Dental Alliance B.V. |
1st Lien Delay Draw Term Loan |
480 |
— |
480 |
|||||||||||||||
|
Priority Waste Holdings LLC |
1st Lien Revolving Loan |
2 |
(2 |
) |
— |
||||||||||||||
|
Project Optimus Bidco Limited |
1st Lien Delay Draw Term Loan |
699 |
— |
699 |
|||||||||||||||
|
Proofpoint, Inc. |
1st Lien Revolving Loan |
240 |
— |
240 |
|||||||||||||||
|
PSC Parent, Inc. |
1st Lien Delay Draw Term Loan |
593 |
— |
593 |
|||||||||||||||
|
PSC Parent, Inc. |
1st Lien Revolving Loan |
992 |
(410 |
) |
582 |
||||||||||||||
|
PumpTech, LLC |
1st Lien Delay Draw Term Loan |
1,456 |
— |
1,456 |
|||||||||||||||
|
PumpTech, LLC |
1st Lien Revolving Loan |
455 |
(61 |
) |
394 |
||||||||||||||
|
Pye-Barker Fire & Safety, LLC |
1st Lien Delay Draw Term Loan |
1,627 |
— |
1,627 |
|||||||||||||||
|
Pye-Barker Fire & Safety, LLC |
1st Lien Revolving Loan |
689 |
(86 |
) |
603 |
||||||||||||||
|
QBS Parent, Inc. |
1st Lien Revolving Loan |
488 |
— |
488 |
|||||||||||||||
|
QF Holdings, Inc. |
1st Lien Revolving Loan |
317 |
(21 |
) |
296 |
||||||||||||||
|
Quick Quack Car Wash Holdings, LLC |
1st Lien Delay Draw Term Loan |
731 |
— |
731 |
|||||||||||||||
Semi Annual Report 2025
123
CION Ares Diversified Credit Fund
Consolidated Schedule of Investments (continued)
June 30, 2025 (Unaudited)
(in thousands, except shares, percentages and as otherwise noted)
|
Company |
Investment Type |
Total revolving and delayed draw loan commitments |
Less: funded commitments |
Total unfunded commitments |
|||||||||||||||
|
Quick Quack Car Wash Holdings, LLC |
1st Lien Revolving Loan |
$ |
366 |
$ |
— |
$ |
366 |
||||||||||||
|
Radius Aerospace Europe Limited |
1st Lien Revolving Loan |
511 |
(511 |
) |
— |
||||||||||||||
|
Radius Aerospace, Inc. |
1st Lien Revolving Loan |
861 |
(159 |
) |
702 |
||||||||||||||
|
Raptor Technologies, LLC (Sycamore Bidco Ltd) |
1st Lien Revolving Loan |
1,679 |
(720 |
) |
959 |
||||||||||||||
|
Raven Acquisition Holdings, LLC |
1st Lien Delay Draw Term Loan |
644 |
— |
644 |
|||||||||||||||
|
Raven Acquisition Holdings, LLC |
1st Lien Revolving Loan |
1,424 |
— |
1,424 |
|||||||||||||||
|
Rawlings Sporting Goods Company, Inc. |
1st Lien Revolving Loan |
3,148 |
(447 |
) |
2,701 |
||||||||||||||
|
RB Holdings Interco, LLC |
1st Lien Revolving Loan |
698 |
(198 |
) |
500 |
||||||||||||||
|
Reagent Chemical & Research, LLC |
1st Lien Revolving Loan |
564 |
— |
564 |
|||||||||||||||
|
Reddy Ice LLC |
1st Lien Revolving Loan |
6,036 |
(2,471 |
) |
3,565 |
||||||||||||||
|
Redwood Services, LP |
1st Lien Delay Draw Term Loan |
739 |
— |
739 |
|||||||||||||||
|
Redwood Services, LP |
1st Lien Revolving Loan |
318 |
— |
318 |
|||||||||||||||
|
Registrar Intermediate, LLC |
1st Lien Delay Draw Term Loan |
558 |
— |
558 |
|||||||||||||||
|
Registrar Intermediate, LLC |
1st Lien Revolving Loan |
782 |
(430 |
) |
352 |
||||||||||||||
|
Relativity ODA LLC |
1st Lien Revolving Loan |
2 |
— |
2 |
|||||||||||||||
|
Repairify, Inc. |
1st Lien Revolving Loan |
766 |
(540 |
) |
226 |
||||||||||||||
|
Revalize, Inc. |
1st Lien Revolving Loan |
227 |
(182 |
) |
45 |
||||||||||||||
|
Revival Animal Health, LLC |
1st Lien Delay Draw Term Loan |
266 |
— |
266 |
|||||||||||||||
|
Revival Animal Health, LLC |
1st Lien Revolving Loan |
307 |
(77 |
) |
230 |
||||||||||||||
|
RFS Opco LLC |
1st Lien Delay Draw Term Loan |
307 |
— |
307 |
|||||||||||||||
|
Ristretto Bidco B.V. |
1st Lien Delay Draw Term Loan |
3,887 |
— |
3,887 |
|||||||||||||||
|
Ristretto Bidco B.V. |
1st Lien Revolving Loan |
3,531 |
— |
3,531 |
|||||||||||||||
|
RMS Holdco II, LLC |
1st Lien Revolving Loan |
883 |
— |
883 |
|||||||||||||||
|
Rodeo AcquisitionCo LLC |
1st Lien Revolving Loan |
312 |
(189 |
) |
123 |
||||||||||||||
|
Roman New Bidco Limited |
1st Lien Delay Draw Term Loan |
1,419 |
— |
1,419 |
|||||||||||||||
|
Royal Borrower, LLC |
1st Lien Delay Draw Term Loan |
1,345 |
— |
1,345 |
|||||||||||||||
|
Royal Borrower, LLC |
1st Lien Revolving Loan |
805 |
— |
805 |
|||||||||||||||
|
Rubicone Bidco Limited |
1st Lien Delay Draw Term Loan |
511 |
— |
511 |
|||||||||||||||
|
Runway Bidco, LLC |
1st Lien Delay Draw Term Loan |
258 |
— |
258 |
|||||||||||||||
|
Runway Bidco, LLC |
1st Lien Revolving Loan |
116 |
— |
116 |
|||||||||||||||
|
RWA Wealth Partners, LLC |
1st Lien Delay Draw Term Loan |
2,366 |
— |
2,366 |
|||||||||||||||
|
RWA Wealth Partners, LLC |
1st Lien Revolving Loan |
744 |
(117 |
) |
627 |
||||||||||||||
|
Sabseg Group, S.L. |
1st Lien Delay Draw Term Loan |
10,268 |
— |
10,268 |
|||||||||||||||
|
SageSure Holdings, LLC |
1st Lien Delay Draw Term Loan |
7,492 |
— |
7,492 |
|||||||||||||||
|
Saldon Holdings, Inc. |
1st Lien Delay Draw Term Loan |
235 |
— |
235 |
|||||||||||||||
|
Saldon Holdings, Inc. |
1st Lien Revolving Loan |
469 |
(117 |
) |
352 |
||||||||||||||
|
Sapphire Software Buyer, Inc. |
1st Lien Revolving Loan |
1,491 |
— |
1,491 |
|||||||||||||||
|
Saturn Purchaser Corp. |
1st Lien Delay Draw Term Loan |
52 |
— |
52 |
|||||||||||||||
|
Saturn Purchaser Corp. |
1st Lien Revolving Loan |
14 |
— |
14 |
|||||||||||||||
Semi Annual Report 2025
124
CION Ares Diversified Credit Fund
Consolidated Schedule of Investments (continued)
June 30, 2025 (Unaudited)
(in thousands, except shares, percentages and as otherwise noted)
|
Company |
Investment Type |
Total revolving and delayed draw loan commitments |
Less: funded commitments |
Total unfunded commitments |
|||||||||||||||
|
Schill Landscaping and Lawn Care Services, LLC |
1st Lien Delay Draw Term Loan |
$ |
662 |
$ |
— |
$ |
662 |
||||||||||||
|
Schill Landscaping and Lawn Care Services, LLC |
1st Lien Revolving Loan |
720 |
(180 |
) |
540 |
||||||||||||||
|
SCM Insurance Services Inc. |
1st Lien Revolving Loan |
1 |
— |
1 |
|||||||||||||||
|
Service Logic Acquisition, Inc. |
1st Lien Revolving Loan |
1,007 |
— |
1,007 |
|||||||||||||||
|
Severin Acquisition, LLC |
1st Lien Delay Draw Term Loan |
7,950 |
— |
7,950 |
|||||||||||||||
|
Severin Acquisition, LLC |
1st Lien Revolving Loan |
5,767 |
(2,499 |
) |
3,268 |
||||||||||||||
|
SG Acquisition, Inc. |
1st Lien Revolving Loan |
418 |
— |
418 |
|||||||||||||||
|
Shermco Intermediate Holdings, Inc. |
1st Lien Delay Draw Term Loan |
167 |
— |
167 |
|||||||||||||||
|
Shermco Intermediate Holdings, Inc. |
1st Lien Revolving Loan |
2,507 |
(1,379 |
) |
1,128 |
||||||||||||||
|
SIG Parent Holdings, LLC |
1st Lien Delay Draw Term Loan |
2,068 |
— |
2,068 |
|||||||||||||||
|
SIG Parent Holdings, LLC |
1st Lien Revolving Loan |
667 |
— |
667 |
|||||||||||||||
|
Sigma Electric Manufacturing Corporation |
1st Lien Revolving Loan |
82 |
(28 |
) |
54 |
||||||||||||||
|
Silk Holdings III Corp. |
1st Lien Revolving Loan |
12,037 |
(9,322 |
) |
2,715 |
||||||||||||||
|
Skyliner S.a r.l. |
1st Lien Delay Draw Term Loan |
2,150 |
— |
2,150 |
|||||||||||||||
|
Slaine Holdings LLC |
1st Lien Delay Draw Term Loan |
2,422 |
— |
2,422 |
|||||||||||||||
|
Slaine Holdings LLC |
1st Lien Revolving Loan |
438 |
— |
438 |
|||||||||||||||
|
Smarsh Inc. |
1st Lien Delay Draw Term Loan |
896 |
— |
896 |
|||||||||||||||
|
Smarsh Inc. |
1st Lien Revolving Loan |
680 |
(290 |
) |
390 |
||||||||||||||
|
Solar Bidco Limited |
1st Lien Delay Draw Term Loan |
856 |
— |
856 |
|||||||||||||||
|
Spaceship Purchaser, Inc. |
1st Lien Delay Draw Term Loan |
4,397 |
— |
4,397 |
|||||||||||||||
|
Spaceship Purchaser, Inc. |
1st Lien Revolving Loan |
1,411 |
— |
1,411 |
|||||||||||||||
|
Spark Purchaser, Inc. |
1st Lien Revolving Loan |
281 |
— |
281 |
|||||||||||||||
|
Spindrift Beverage Co., Inc. |
1st Lien Delay Draw Term Loan |
195 |
— |
195 |
|||||||||||||||
|
Spindrift Beverage Co., Inc. |
1st Lien Revolving Loan |
351 |
(25 |
) |
326 |
||||||||||||||
|
Spitfire Bidco Limited |
1st Lien Delay Draw Term Loan |
5,228 |
— |
5,228 |
|||||||||||||||
|
Spruce Bidco II Inc. |
1st Lien Revolving Loan |
11,657 |
— |
11,657 |
|||||||||||||||
|
ST Athena Global LLC |
1st Lien Delay Draw Term Loan |
174 |
— |
174 |
|||||||||||||||
|
ST Athena Global LLC |
1st Lien Revolving Loan |
696 |
(238 |
) |
458 |
||||||||||||||
|
Steward Partners Global Advisory, LLC |
1st Lien Delay Draw Term Loan |
644 |
— |
644 |
|||||||||||||||
|
Steward Partners Global Advisory, LLC |
1st Lien Revolving Loan |
86 |
— |
86 |
|||||||||||||||
|
Sugar PPC Buyer LLC |
1st Lien Delay Draw Term Loan |
821 |
— |
821 |
|||||||||||||||
|
Sun Acquirer Corp. |
1st Lien Delay Draw Term Loan |
12,286 |
— |
12,286 |
|||||||||||||||
|
Sun Acquirer Corp. |
1st Lien Revolving Loan |
1,638 |
— |
1,638 |
|||||||||||||||
|
Sunbit Receivables Trust IV |
1st Lien Revolving Loan |
5,060 |
(3,036 |
) |
2,024 |
||||||||||||||
|
Sundance Group Holdings, Inc. |
1st Lien Revolving Loan |
1 |
— |
1 |
|||||||||||||||
|
Sunvair Aerospace Group, Inc. |
1st Lien Delay Draw Term Loan |
1,528 |
— |
1,528 |
|||||||||||||||
|
Sunvair Aerospace Group, Inc. |
1st Lien Revolving Loan |
653 |
— |
653 |
|||||||||||||||
|
Superman Holdings, LLC |
1st Lien Delay Draw Term Loan |
1,024 |
— |
1,024 |
|||||||||||||||
Semi Annual Report 2025
125
CION Ares Diversified Credit Fund
Consolidated Schedule of Investments (continued)
June 30, 2025 (Unaudited)
(in thousands, except shares, percentages and as otherwise noted)
|
Company |
Investment Type |
Total revolving and delayed draw loan commitments |
Less: funded commitments |
Total unfunded commitments |
|||||||||||||||
|
Superman Holdings, LLC |
1st Lien Revolving Loan |
$ |
1,259 |
$ |
— |
$ |
1,259 |
||||||||||||
|
Supplying Demand, Inc. |
1st Lien Revolving Loan |
6,257 |
(1,216 |
) |
5,041 |
||||||||||||||
|
SV Newco 2, Inc. |
1st Lien Delay Draw Term Loan |
357 |
— |
357 |
|||||||||||||||
|
SV Newco 2, Inc. |
1st Lien Revolving Loan |
588 |
— |
588 |
|||||||||||||||
|
Symplr Software Inc. |
1st Lien Revolving Loan |
1 |
— |
1 |
|||||||||||||||
|
Systems Planning and Analysis, Inc. |
1st Lien Revolving Loan |
1,004 |
(372 |
) |
632 |
||||||||||||||
|
Tandarts Today Holding B.V. |
1st Lien Delay Draw Term Loan |
1,067 |
— |
1,067 |
|||||||||||||||
|
TCI Buyer LLC |
1st Lien Delay Draw Term Loan |
6,705 |
— |
6,705 |
|||||||||||||||
|
TCI Buyer LLC |
1st Lien Revolving Loan |
3,017 |
— |
3,017 |
|||||||||||||||
|
TCP Hawker Intermediate LLC |
1st Lien Delay Draw Term Loan |
2,683 |
— |
2,683 |
|||||||||||||||
|
TCP Hawker Intermediate LLC |
1st Lien Revolving Loan |
5,995 |
(3,626 |
) |
2,369 |
||||||||||||||
|
Telle Tire & Auto Service, LLC |
1st Lien Delay Draw Term Loan |
255 |
— |
255 |
|||||||||||||||
|
Telle Tire & Auto Service, LLC |
1st Lien Revolving Loan |
70 |
— |
70 |
|||||||||||||||
|
The Hiller Companies, LLC |
1st Lien Delay Draw Term Loan |
143 |
— |
143 |
|||||||||||||||
|
The Hiller Companies, LLC |
1st Lien Revolving Loan |
965 |
— |
965 |
|||||||||||||||
|
The Mather Group, LLC |
1st Lien Revolving Loan |
750 |
(285 |
) |
465 |
||||||||||||||
|
The Ultimus Group Midco, LLC |
1st Lien Delay Draw Term Loan |
448 |
— |
448 |
|||||||||||||||
|
The Ultimus Group Midco, LLC |
1st Lien Revolving Loan |
537 |
— |
537 |
|||||||||||||||
|
Thermostat Purchaser III, Inc. |
1st Lien Revolving Loan |
100 |
(10 |
) |
90 |
||||||||||||||
|
Transit Technologies LLC |
1st Lien Delay Draw Term Loan |
929 |
— |
929 |
|||||||||||||||
|
Transit Technologies LLC |
1st Lien Revolving Loan |
839 |
— |
839 |
|||||||||||||||
|
Truck-Lite Co., LLC and Ecco Holdings Corp. |
1st Lien Delay Draw Term Loan |
3,329 |
— |
3,329 |
|||||||||||||||
|
Truck-Lite Co., LLC and Ecco Holdings Corp. |
1st Lien Revolving Loan |
1,474 |
— |
1,474 |
|||||||||||||||
|
Truist Insurance Holdings, LLC |
1st Lien Revolving Loan |
654 |
— |
654 |
|||||||||||||||
|
Two Six Labs, LLC |
1st Lien Delay Draw Term Loan |
3,768 |
— |
3,768 |
|||||||||||||||
|
Two Six Labs, LLC |
1st Lien Revolving Loan |
2,561 |
(1,229 |
) |
1,332 |
||||||||||||||
|
U.S. Urology Partners, LLC |
1st Lien Delay Draw Term Loan |
361 |
— |
361 |
|||||||||||||||
|
U.S. Urology Partners, LLC |
1st Lien Revolving Loan |
186 |
— |
186 |
|||||||||||||||
|
Unifi Aviation North America, LLC |
1st Lien Revolving Loan |
1 |
— |
1 |
|||||||||||||||
|
United Digestive MSO Parent, LLC |
1st Lien Delay Draw Term Loan |
1,384 |
— |
1,384 |
|||||||||||||||
|
United Digestive MSO Parent, LLC |
1st Lien Revolving Loan |
169 |
(34 |
) |
135 |
||||||||||||||
|
Unity Purchaser, LLC |
1st Lien Delay Draw Term Loan |
1,455 |
— |
1,455 |
|||||||||||||||
|
Unity Purchaser, LLC |
1st Lien Revolving Loan |
424 |
— |
424 |
|||||||||||||||
|
UP Intermediate II LLC |
1st Lien Revolving Loan |
326 |
(117 |
) |
209 |
||||||||||||||
|
US Salt Investors, LLC |
1st Lien Revolving Loan |
679 |
— |
679 |
|||||||||||||||
|
Vamos Bidco, Inc. |
1st Lien Delay Draw Term Loan |
1,083 |
— |
1,083 |
|||||||||||||||
|
Vamos Bidco, Inc. |
1st Lien Revolving Loan |
334 |
— |
334 |
|||||||||||||||
|
Vantage Data Centers Europe S.a r.l. |
1st Lien Delay Draw Term Loan |
3,010 |
— |
3,010 |
|||||||||||||||
Semi Annual Report 2025
126
CION Ares Diversified Credit Fund
Consolidated Schedule of Investments (continued)
June 30, 2025 (Unaudited)
(in thousands, except shares, percentages and as otherwise noted)
|
Company |
Investment Type |
Total revolving and delayed draw loan commitments |
Less: funded commitments |
Total unfunded commitments |
|||||||||||||||
|
Verista, Inc. |
1st Lien Revolving Loan |
$ |
2,000 |
$ |
(167 |
) |
$ |
1,833 |
|||||||||||
|
Vertex Service Partners, LLC |
1st Lien Delay Draw Term Loan |
4,842 |
— |
4,842 |
|||||||||||||||
|
Vertex Service Partners, LLC |
1st Lien Revolving Loan |
210 |
(168 |
) |
42 |
||||||||||||||
|
Victors Purchaser, LLC |
1st Lien Delay Draw Term Loan |
2,291 |
— |
2,291 |
|||||||||||||||
|
Victors Purchaser, LLC |
1st Lien Revolving Loan |
2,223 |
— |
2,223 |
|||||||||||||||
|
Viper Bidco, Inc. |
1st Lien Delay Draw Term Loan |
748 |
— |
748 |
|||||||||||||||
|
Viper Bidco, Inc. |
1st Lien Revolving Loan |
618 |
— |
618 |
|||||||||||||||
|
Visual Edge Technology, Inc. |
1st Lien Delay Draw Term Loan |
50 |
— |
50 |
|||||||||||||||
|
VPP Intermediate Holdings, LLC |
1st Lien Delay Draw Term Loan |
1,738 |
— |
1,738 |
|||||||||||||||
|
VPP Intermediate Holdings, LLC |
1st Lien Revolving Loan |
315 |
— |
315 |
|||||||||||||||
|
VRC Companies, LLC |
1st Lien Revolving Loan |
1,342 |
— |
1,342 |
|||||||||||||||
|
W.S. Connelly & Co., LLC |
1st Lien Delay Draw Term Loan |
907 |
— |
907 |
|||||||||||||||
|
W.S. Connelly & Co., LLC |
1st Lien Revolving Loan |
1,778 |
(762 |
) |
1,016 |
||||||||||||||
|
Watermill Express, LLC |
1st Lien Delay Draw Term Loan |
381 |
— |
381 |
|||||||||||||||
|
Watermill Express, LLC |
1st Lien Revolving Loan |
561 |
(58 |
) |
503 |
||||||||||||||
|
Watt Holdco Limited |
1st Lien Delay Draw Term Loan |
518 |
— |
518 |
|||||||||||||||
|
Waverly Advisors, LLC |
1st Lien Delay Draw Term Loan |
4,938 |
— |
4,938 |
|||||||||||||||
|
Waverly Advisors, LLC |
1st Lien Revolving Loan |
945 |
(189 |
) |
756 |
||||||||||||||
|
WCI-BXC Purchaser, LLC |
1st Lien Revolving Loan |
34 |
— |
34 |
|||||||||||||||
|
Wealth Enhancement Group, LLC |
1st Lien Delay Draw Term Loan |
5,249 |
— |
5,249 |
|||||||||||||||
|
Wealth Enhancement Group, LLC |
1st Lien Revolving Loan |
1,378 |
— |
1,378 |
|||||||||||||||
|
WebPT, Inc. |
1st Lien Revolving Loan |
216 |
(188 |
) |
28 |
||||||||||||||
|
Wellington Bidco Inc. |
1st Lien Delay Draw Term Loan |
653 |
— |
653 |
|||||||||||||||
|
Wellington Bidco Inc. |
1st Lien Revolving Loan |
804 |
(110 |
) |
694 |
||||||||||||||
|
Wellington-Altus Financial Inc. |
1st Lien Delay Draw Term Loan |
841 |
— |
841 |
|||||||||||||||
|
Wellington-Altus Financial Inc. |
1st Lien Revolving Loan |
336 |
— |
336 |
|||||||||||||||
|
Wellness AcquisitionCo, Inc. |
1st Lien Revolving Loan |
1,500 |
— |
1,500 |
|||||||||||||||
|
Wilbur-Ellis Holdings II LLC |
1st Lien Revolving Loan |
726 |
(471 |
) |
255 |
||||||||||||||
|
Witherslack Bidco Limited |
1st Lien Delay Draw Term Loan |
3,222 |
— |
3,222 |
|||||||||||||||
|
WorkWave Intermediate II, LLC |
1st Lien Revolving Loan |
460 |
(101 |
) |
359 |
||||||||||||||
|
World Insurance Associates, LLC |
1st Lien Delay Draw Term Loan |
716 |
— |
716 |
|||||||||||||||
|
World Insurance Associates, LLC |
1st Lien Revolving Loan |
60 |
— |
60 |
|||||||||||||||
|
Worldwide Produce Acquisition, LLC |
1st Lien Revolving Loan |
21 |
— |
21 |
|||||||||||||||
|
WRE Sports Investments LLC |
1st Lien Delay Draw Term Loan |
1,644 |
— |
1,644 |
|||||||||||||||
|
WSBidCo Limited |
1st Lien Delay Draw Term Loan |
2,918 |
— |
2,918 |
|||||||||||||||
|
WSHP FC Acquisition LLC |
1st Lien Revolving Loan |
2,945 |
(2,757 |
) |
188 |
||||||||||||||
|
WU Holdco, Inc. |
1st Lien Delay Draw Term Loan |
357 |
— |
357 |
|||||||||||||||
|
WU Holdco, Inc. |
1st Lien Revolving Loan |
132 |
— |
132 |
|||||||||||||||
|
YE Brands Holdings, LLC |
1st Lien Delay Draw Term Loan |
104 |
— |
104 |
|||||||||||||||
Semi Annual Report 2025
127
CION Ares Diversified Credit Fund
Consolidated Schedule of Investments (continued)
June 30, 2025 (Unaudited)
(in thousands, except shares, percentages and as otherwise noted)
|
Company |
Investment Type |
Total revolving and delayed draw loan commitments |
Less: funded commitments |
Total unfunded commitments |
|||||||||||||||
|
YE Brands Holdings, LLC |
1st Lien Revolving Loan |
$ |
297 |
$ |
— |
$ |
297 |
||||||||||||
|
ZB Holdco LLC |
1st Lien Delay Draw Term Loan |
1,728 |
— |
1,728 |
|||||||||||||||
|
ZB Holdco LLC |
1st Lien Revolving Loan |
1,074 |
(494 |
) |
580 |
||||||||||||||
|
Zinc Buyer Corporation |
1st Lien Delay Draw Term Loan |
215 |
— |
215 |
|||||||||||||||
|
Zinc Buyer Corporation |
1st Lien Revolving Loan |
407 |
(81 |
) |
326 |
||||||||||||||
|
$ |
887,656 |
$ |
(113,253 |
) |
$ |
774,402 |
|||||||||||||
(h) This loan or a portion of this loan represents an unsettled loan purchase. The interest rate will be determined at the time of settlement and will be based upon a spread plus the applicable reference rate determined at the time of purchase.
(i) Loan or bond was on non-accrual status as of June 30, 2025.
(j) Non-income producing security as of June 30, 2025.
(k) When-Issued or delayed delivery security based on typical market settlement convention for such security.
(l) The Fund sold a participating interest of CAD $17,093 in aggregate principal amount outstanding of the portfolio company's first lien senior secured revolver. As the transaction did not qualify as a "true sale" in accordance with U.S. generally accepted accounting principles ("GAAP"), the Fund recorded a corresponding secured borrowing of $16,996 at fair value, included in "accrued expenses and other payables" in the consolidated statement of assets and liabilities. As of June 30, 2025, the interest rate in effect for the secured borrowing was 13.07%.
As of June 30, 2025, the aggregate cost of securities for federal income tax purposes was $7,050,850. Unrealized appreciation and depreciation on investments for federal income tax purposes are as follows:
|
Gross unrealized appreciation |
$ |
231,133 |
|||||
|
Gross unrealized depreciation |
(193,783 |
) |
|||||
|
Net unrealized depreciation |
$ |
37,350 |
|||||
Forward currency contracts as of June 30, 2025 were as follows:
|
Description |
Notional Amount to be Purchased |
Notional Amount to be Sold |
Counterparty |
Settlement Date |
Unrealized Appreciation/ (Depreciation) |
||||||||||||||||||
|
Foreign currency forward contract |
$ |
224,715 |
€ |
190,452 |
Morgan Stanley Capital Services LLC |
July 25, 2025 |
$ |
(6,920 |
) |
||||||||||||||
|
Foreign currency forward contract |
$ |
148,913 |
£ |
108,475 |
Goldman Sachs International |
July 25, 2025 |
(4,640 |
) |
|||||||||||||||
|
Foreign currency forward contract |
$ |
142,171 |
£ |
103,563 |
Morgan Stanley Capital Services LLC |
July 25, 2025 |
(4,228 |
) |
|||||||||||||||
|
Foreign currency forward contract |
$ |
132,502 |
€ |
112,299 |
Goldman Sachs International |
July 25, 2025 |
(4,482 |
) |
|||||||||||||||
|
Foreign currency forward contract |
€ |
40,331 |
SEK |
380,950 |
Goldman Sachs International |
July 25, 2025 |
(575 |
) |
|||||||||||||||
|
Foreign currency forward contract |
$ |
24,223 |
CAD |
32,956 |
Goldman Sachs International |
July 18, 2025 |
8 |
||||||||||||||||
|
Foreign currency forward contract |
$ |
24,135 |
NOK |
243,235 |
Morgan Stanley Capital Services LLC |
July 25, 2025 |
(786 |
) |
|||||||||||||||
|
Foreign currency forward contract |
$ |
23,280 |
CAD |
31,660 |
Morgan Stanley Capital Services LLC |
July 25, 2025 |
(371 |
) |
|||||||||||||||
|
Foreign currency forward contract |
$ |
15,921 |
CAD |
21,651 |
Goldman Sachs International |
July 25, 2025 |
(502 |
) |
|||||||||||||||
|
Foreign currency forward contract |
$ |
12,498 |
DKK |
79,010 |
Morgan Stanley Capital Services LLC |
July 25, 2025 |
(396 |
) |
|||||||||||||||
|
Foreign currency forward contract |
$ |
11,784 |
NZD |
19,317 |
Goldman Sachs International |
July 25, 2025 |
(200 |
) |
|||||||||||||||
Semi Annual Report 2025
128
CION Ares Diversified Credit Fund
Consolidated Schedule of Investments (continued)
June 30, 2025 (Unaudited)
(in thousands, except shares, percentages and as otherwise noted)
|
Description |
Notional Amount to be Purchased |
Notional Amount to be Sold |
Counterparty |
Settlement Date |
Unrealized Appreciation/ (Depreciation) |
||||||||||||||||||
|
Foreign currency forward contract |
$ |
6,973 |
¥ |
1,001,315 |
Morgan Stanley Capital Services LLC |
July 25, 2025 |
$ |
119 |
|||||||||||||||
|
Foreign currency forward contract |
$ |
6,327 |
DKK |
40,000 |
Goldman Sachs International |
July 25, 2025 |
(206 |
) |
|||||||||||||||
|
Foreign currency forward contract |
$ |
4,764 |
SEK |
45,000 |
Morgan Stanley Capital Services LLC |
July 25, 2025 |
(55 |
) |
|||||||||||||||
|
Foreign currency forward contract |
$ |
4,629 |
£ |
3,371 |
Goldman Sachs International |
August 21, 2026 |
(458 |
) |
|||||||||||||||
|
Foreign currency forward contract |
$ |
4,273 |
NZD |
7,008 |
Morgan Stanley Capital Services LLC |
July 17, 2025 |
(114 |
) |
|||||||||||||||
|
Foreign currency forward contract |
$ |
4,259 |
AUD |
6,469 |
Morgan Stanley Capital Services LLC |
July 17, 2025 |
(122 |
) |
|||||||||||||||
|
Foreign currency forward contract |
$ |
4,166 |
PLN |
15,023 |
Goldman Sachs International |
July 25, 2025 |
(176 |
) |
|||||||||||||||
|
Foreign currency forward contract |
£ |
3,785 |
$ |
5,196 |
Goldman Sachs International |
July 25, 2025 |
133 |
||||||||||||||||
|
Foreign currency forward contract |
$ |
1,966 |
€ |
2,320 |
Morgan Stanley Capital Services LLC |
July 25, 2025 |
92 |
||||||||||||||||
|
Foreign currency forward contract |
$ |
1,258 |
AUD |
1,911 |
Morgan Stanley Capital Services LLC |
July 25, 2025 |
(35 |
) |
|||||||||||||||
|
Foreign currency forward contract |
$ |
1,247 |
$ |
1,712 |
Morgan Stanley Capital Services LLC |
July 25, 2025 |
42 |
||||||||||||||||
|
Foreign currency forward contract |
$ |
972 |
€ |
824 |
Morgan Stanley Capital Services LLC |
July 17, 2025 |
(34 |
) |
|||||||||||||||
|
Foreign currency forward contract |
€ |
824 |
$ |
972 |
Morgan Stanley Capital Services LLC |
July 17, 2025 |
39 |
||||||||||||||||
|
Foreign currency forward contract |
$ |
635 |
NOK |
6,400 |
Goldman Sachs International |
July 25, 2025 |
(22 |
) |
|||||||||||||||
|
Foreign currency forward contract |
$ |
14 |
€ |
13 |
Goldman Sachs International |
July 7, 2025 |
(1 |
) |
|||||||||||||||
|
Total |
$ |
(23,890 |
) |
||||||||||||||||||||
Interest rate swaps as of June 30, 2025 were as follows:
|
Description |
MRPS |
Fund Receives |
Fund Pays |
Counterparty |
Maturity Date |
Notional Amount |
Fair Value |
Upfront Payments/ Receipts |
Change in Unrealized Appreciation/ (Depreciation) |
||||||||||||||||||||||||||||||
|
Interest rate swap |
Series H MRPS |
6.250 |
% |
SOFR +1.7420% |
Goldman Sachs International |
06/07/2027 |
$ |
100,000 |
$ |
1,770 |
$ |
— |
$ |
205 |
|||||||||||||||||||||||||
|
Interest rate swap |
Series I MRPS |
6.350 |
% |
SOFR +2.0865% |
Goldman Sachs International |
06/07/2029 |
50,000 |
1,441 |
— |
413 |
|||||||||||||||||||||||||||||
|
Interest rate swap |
Series J MRPS |
6.350 |
% |
SOFR +2.0895% |
Goldman Sachs International |
07/03/2029 |
50,000 |
1,462 |
— |
420 |
|||||||||||||||||||||||||||||
|
Interest rate swap |
Series K MRPS |
5.940 |
% |
SOFR +1.9950% |
Goldman Sachs International |
01/15/2030 |
150,000 |
2,769 |
— |
1,477 |
|||||||||||||||||||||||||||||
|
Interest rate swap |
Series L MRPS |
6.070 |
% |
SOFR +2.1530% |
Goldman Sachs International |
04/14/2032 |
150,000 |
2,781 |
— |
1,467 |
|||||||||||||||||||||||||||||
|
Total |
$ |
500,000 |
$ |
10,223 |
$ |
— |
$ |
3,982 |
|||||||||||||||||||||||||||||||
Semi Annual Report 2025
129
CION Ares Diversified Credit Fund
Consolidated Schedule of Investments (continued)
June 30, 2025 (Unaudited)
(in thousands, except shares, percentages and as otherwise noted)
Purchased options outstanding as of June 30, 2025 were as follows:
Options on Equity Indices — Buy Protection
|
Description |
Exercise Price |
Expiration Date |
Counterparty |
Notional Amount |
Premium |
Fair Value |
|||||||||||||||||||||
|
Call-Chicago Board Options Exchange-VIX US |
$ |
30 |
08/20/2025 |
Goldman Sachs International |
$ |
962 |
$ |
82 |
$ |
57 |
|||||||||||||||||
|
Total Purchased Options on Equity Indices |
$ |
82 |
$ |
57 |
|||||||||||||||||||||||
Written options outstanding as of June 30, 2025 were as follows:
Options on Equity Indices — Sell Protection
|
Description |
Exercise Price |
Expiration Date |
Counterparty |
Notional Amount |
Premium |
Fair Value |
|||||||||||||||||||||
|
Call-Chicago Board Options Exchange-VIX US |
$ |
40 |
08/20/2025 |
Goldman Sachs International |
$ |
(962 |
) |
$ |
(47 |
) |
$ |
(32 |
) |
||||||||||||||
|
Total Written Options |
$ |
(47 |
) |
$ |
(32 |
) |
|||||||||||||||||||||
Swaps outstanding as of June 30, 2025 were as follows:
Swaps: Centrally Cleared or Exchange Traded
Credit Default Swaps on Credit Indices — Buy Protection (1)
|
Description |
Payment |
Fixed |
Expiration Date |
Exchange |
Notional |
Value (3) |
Upfront |
Unrealized |
|||||||||||||||||||||||||||
|
CDX HY S41 5Y |
Q |
5.00 |
% |
12/20/2028 |
ICE |
$ |
10,395 |
$ |
(781 |
) |
$ |
(618 |
) |
$ |
(163 |
) |
|||||||||||||||||||
|
CDX HY S44 |
— |
% |
09/17/2025 |
ICE |
$ |
3,250 |
9 |
28 |
(19 |
) |
|||||||||||||||||||||||||
|
Total Swaps — Buy Protection: Centrally Cleared or Exchange Traded |
$ |
(772 |
) |
$ |
(590 |
) |
$ |
(182 |
) |
||||||||||||||||||||||||||
Credit Default Swaps on Credit Indices — Sell Protection (1)
|
Description |
Payment |
Fixed |
Expiration Date |
Exchange |
Notional |
Value (3) |
Upfront |
Unrealized |
|||||||||||||||||||||||||||
|
CDX HY S44 |
— |
% |
09/17/2025 |
ICE |
$ |
(3,250 |
) |
$ |
(4 |
) |
$ |
(10 |
) |
$ |
6 |
||||||||||||||||||||
|
Total Swaps — Buy Protection: Centrally Cleared or Exchange Traded |
$ |
(4 |
) |
$ |
(10 |
) |
$ |
6 |
|||||||||||||||||||||||||||
Swaps: Over the Counter
Credit Default Swaps on Credit Indices — Buy Protection (1)
|
Description |
Payment |
Fixed |
Expiration Date |
Counterparty |
Notional |
Value (3) |
Upfront |
Unrealized |
|||||||||||||||||||||||||||
|
CDX HY S39 |
Q |
5.00 |
% |
12/20/2027 |
Goldman Sachs |
$ |
4,945 |
$ |
(436 |
) |
$ |
(308 |
) |
$ |
(128 |
) |
|||||||||||||||||||
|
CMBX.NA.BBB—S9 |
M |
3.00 |
% |
09/17/2058 |
Goldman Sachs |
1,030 |
177 |
246 |
(69 |
) |
|||||||||||||||||||||||||
|
Total Swaps — Buy Protection: Over the Counter |
$ |
(259 |
) |
$ |
(62 |
) |
$ |
(197 |
) |
||||||||||||||||||||||||||
Semi Annual Report 2025
130
CION Ares Diversified Credit Fund
Consolidated Schedule of Investments (continued)
June 30, 2025 (Unaudited)
(in thousands, except shares, percentages and as otherwise noted)
Credit Default Swaps on Credit Indices — Sell Protection (4)
|
Description |
Payment |
Fixed |
Expiration Date |
Counterparty |
Notional |
Value (3) |
Upfront |
Unrealized |
|||||||||||||||||||||||||||
|
SRT CDS Tranche |
M |
5.25 |
% |
09/30/2031 |
Goldman Sachs |
$ |
— |
$ |
1 |
$ |
— |
$ |
1 |
||||||||||||||||||||||
|
Total Swaps — Sell Protection: Over the Counter |
$ |
1 |
$ |
— |
$ |
1 |
|||||||||||||||||||||||||||||
(1) If the Fund is a buyer of protection and a credit event occurs, as defined under the terms of that particular swap, the Fund will either (i) receive from the seller of protection an amount equal to the notional amount of the swap and deliver the referenced obligation or underlying investments comprising the referenced index or (ii) receive a net settlement amount in the form of cash or investments equal to the notional amount of the swap less the recovery value of the referenced obligation or underlying investments comprising the referenced index.
(2) The maximum potential amount the Fund could be required to pay as a seller of credit protection or receive as a buyer of credit protection if a credit event occurs as defined under the terms of that particular swap.
(3) The quoted market prices and resulting values for credit default swaps on credit indices serve as an indicator of the current status of the payment/performance risk and represent the expected amount paid or received for the credit derivative had the notional amount of the swap been closed/sold as of year-end. Increasing values (buy protection) or decreasing values (sell protection), when compared to the notional amount of the swap, represent a deterioration of the referenced entity's credit soundness and a greater likelihood of risk of default or other credit event occurring as defined under the terms of the agreement.
(4) If the Fund is a seller of protection and a credit event occurs, as defined under the terms of that particular swap, the Fund will either (i) pay to the buyer of protection an amount equal to the notional amount of the swap and take delivery of the referenced obligation or underlying securities comprising the referenced index or (ii) pay a net settlement amount in the form of cash or securities equal to the notional amount of the swap less the recovery value of the referenced obligation or underlying securities comprising the referenced index.
Abbreviations:
144A Certain conditions for public sale may exist. Unless otherwise noted, these securities are deemed to be liquid.
CLO Collateralized Loan Obligation
Currencies:
€ Euro Currency
£ British Pounds
$ U.S. Dollars
AUD Australian Dollars
CAD Canadian Dollars
DKK Danish Krone
GBP British Pounds
NOK Norwegian Krone
NZD New Zealand Dollars
PLN Polish Zloty
SEK Swedish Krone
USD U.S. Dollars
Semi Annual Report 2025
131
CION Ares Diversified Credit Fund
|
Assets: |
|||||||
|
Investments in unaffiliated issuers, at fair value (cost $7,035,669) |
$ |
7,101,920 |
|||||
|
Derivatives |
10,891 |
||||||
|
Cash |
120,314 |
||||||
|
Cash denominated in foreign currency, at value (cost $14,990) |
15,040 |
||||||
|
Due from brokers |
82,057 |
||||||
|
Receivable for common shares issued by the Fund |
46,331 |
||||||
|
Receivable for securities sold |
80,262 |
||||||
|
Interest and dividend receivable |
54,165 |
||||||
|
Other assets |
16,244 |
||||||
|
Total assets |
$ |
7,527,224 |
|||||
|
Liabilities: |
|||||||
|
Debt |
$ |
1,390,689 |
|||||
|
Mandatory redeemable preferred shares (liquidation preference $1,070,000, net of unamortized deferred issuance costs of $6,889) |
1,063,111 |
||||||
|
Derivatives |
24,791 |
||||||
|
Payable for securities purchased |
88,543 |
||||||
|
Interest and facility fees payable |
20,579 |
||||||
|
Accrued expenses and other payables |
84,377 |
||||||
|
Total liabilities |
2,672,090 |
||||||
|
Commitments and contingencies (See Note 2) |
|||||||
|
Net assets |
$ |
4,855,134 |
|||||
|
Net assets consist of: |
|||||||
|
Paid-in capital |
$ |
4,842,599 |
|||||
|
Accumulated undistributed earnings |
12,535 |
||||||
|
Net assets |
$ |
4,855,134 |
|||||
Semi Annual Report 2025
132
CION Ares Diversified Credit Fund
Consolidated Statement of Assets and Liabilities (continued)
June 30, 2025 (Unaudited)
(in thousands, except per share data)
|
Common shares: |
|||||||
|
Class A: |
|||||||
|
Net Assets |
$ |
82,548 |
|||||
|
Shares Outstanding ($.001 par value; unlimited shares authorized) |
3,294 |
||||||
|
Net Asset Value Per Share |
$ |
25.06 |
|||||
|
Maximum Offering Price Per Share |
$ |
26.59 |
|||||
|
Class C: |
|||||||
|
Net Assets |
$ |
69,103 |
|||||
|
Shares Outstanding ($.001 par value; unlimited shares authorized) |
2,774 |
||||||
|
Net Asset Value Per Share |
$ |
24.91 |
|||||
|
Class I: |
|||||||
|
Net Assets |
$ |
3,845,246 |
|||||
|
Shares Outstanding ($.001 par value; unlimited shares authorized) |
151,930 |
||||||
|
Net Asset Value Per Share |
$ |
25.31 |
|||||
|
Class L: |
|||||||
|
Net Assets |
$ |
13,006 |
|||||
|
Shares Outstanding ($.001 par value; unlimited shares authorized) |
517 |
||||||
|
Net Asset Value Per Share |
$ |
25.14 |
|||||
|
Maximum Offering Price Per Share |
$ |
26.25 |
|||||
|
Class U: |
|||||||
|
Net Assets |
$ |
665,542 |
|||||
|
Shares Outstanding ($.001 par value; unlimited shares authorized) |
26,413 |
||||||
|
Net Asset Value Per Share |
$ |
25.20 |
|||||
|
Class U-2: |
|||||||
|
Net Assets |
$ |
144,522 |
|||||
|
Shares Outstanding ($.001 par value; unlimited shares authorized) |
5,742 |
||||||
|
Net Asset Value Per Share |
$ |
25.17 |
|||||
|
Maximum Offering Price Per Share |
$ |
25.81 |
|||||
|
Class W: |
|||||||
|
Net Assets |
$ |
35,167 |
|||||
|
Shares Outstanding ($.001 par value; unlimited shares authorized) |
1,388 |
||||||
|
Net Asset Value Per Share |
$ |
25.33 |
|||||
|
Maximum Offering Price Per Share |
$ |
26.11 |
|||||
See accompanying notes to consolidated financial statements.
Semi Annual Report 2025
133
CION Ares Diversified Credit Fund
Consolidated Statement of Operations
For the six months ended June 30, 2025 (Unaudited)
(in thousands)
|
Investment income: |
|||||||
|
Interest income (excluding payment-in-kind ("PIK") interest income) |
$ |
292,686 |
|||||
|
PIK interest income |
21,699 |
||||||
|
Dividend income (excluding PIK dividend income) |
2,363 |
||||||
|
PIK dividend income |
20,098 |
||||||
|
Total investment income |
336,846 |
||||||
|
Expenses: |
|||||||
|
Management fee (Note 3) |
42,384 |
||||||
|
Incentive fee (Note 3) |
31,765 |
||||||
|
Interest and credit facility fees (Note 6 and 7) |
70,818 |
||||||
|
Shareholder service expense and distribution fees (Note 3) |
3,417 |
||||||
|
Other expenses |
8,326 |
||||||
|
Total operating expenses |
156,710 |
||||||
|
Tax expenses (Note 10) |
564 |
||||||
|
Total expenses |
157,274 |
||||||
|
Net investment income |
179,572 |
||||||
|
Realized and unrealized gains (losses) on investments, foreign currency and derivative contracts |
|||||||
|
Net realized losses on investments |
(23,526 |
) |
|||||
|
Net realized losses on securities sold short |
(16 |
) |
|||||
|
Net realized losses on derivative contracts |
(35,607 |
) |
|||||
|
Net realized gains on foreign currency |
5,792 |
||||||
|
Net unrealized gains on investments |
115,529 |
||||||
|
Net unrealized gains on securities sold short |
34 |
||||||
|
Net unrealized losses on derivative contracts |
(34,744 |
) |
|||||
|
Net unrealized losses on foreign currency |
(28,380 |
) |
|||||
|
Net realized and unrealized losses on investments, foreign currency and other transactions |
(918 |
) |
|||||
|
Net increase in net assets resulting from operations |
$ |
178,654 |
|||||
See accompanying notes to consolidated financial statements.
Semi Annual Report 2025
134
CION Ares Diversified Credit Fund
|
For the Six Months Ended June 30, 2025 (unaudited) |
For the Year Ended December 31, 2024 |
||||||||||
|
Increase (decrease) in net assets from operations: |
|||||||||||
|
Net investment income |
$ |
179,572 |
$ |
343,398 |
|||||||
|
Net realized losses on investments, foreign currency and other transactions |
(53,357 |
) |
(28,430 |
) |
|||||||
|
Net unrealized gains on investments, foreign currency and other transactions |
52,439 |
44,746 |
|||||||||
|
Net increase from operations |
178,654 |
359,714 |
|||||||||
|
Distributions to shareholders from (Note 2): |
|||||||||||
|
Distributed earnings — Class A |
(3,409 |
) |
(7,211 |
) |
|||||||
|
Distributed earnings — Class C |
(2,568 |
) |
(6,150 |
) |
|||||||
|
Distributed earnings — Class I |
(148,086 |
) |
(267,847 |
) |
|||||||
|
Distributed earnings — Class L |
(500 |
) |
(1,052 |
) |
|||||||
|
Distributed earnings — Class U |
(23,909 |
) |
(45,625 |
) |
|||||||
|
Distributed earnings — Class U-2 |
(5,277 |
) |
(9,994 |
) |
|||||||
|
Distributed earnings — Class W |
(1,373 |
) |
(3,023 |
) |
|||||||
|
Total distributions |
(185,122 |
) |
(340,902 |
) |
|||||||
|
Increase (decrease) in net assets from operations and distributions |
(6,468 |
) |
18,812 |
||||||||
|
Share transactions: |
|||||||||||
|
Class A: |
|||||||||||
|
Proceeds of shares issued |
12,744 |
31,431 |
|||||||||
|
Share transfers between classes |
(13,872 |
) |
(575 |
) |
|||||||
|
Value of distributions reinvested |
545 |
1,169 |
|||||||||
|
Cost of shares repurchased |
(6,704 |
) |
(10,562 |
) |
|||||||
|
Net increase (decrease) from share operations |
(7,287 |
) |
21,463 |
||||||||
|
Class C: |
|||||||||||
|
Proceeds of shares issued |
2,221 |
8,677 |
|||||||||
|
Share transfers between classes |
(3,756 |
) |
(8,251 |
) |
|||||||
|
Value of distributions reinvested |
1,149 |
2,739 |
|||||||||
|
Cost of shares repurchased |
(3,694 |
) |
(9,629 |
) |
|||||||
|
Net decrease from share operations |
(4,080 |
) |
(6,464 |
) |
|||||||
|
Class I: |
|||||||||||
|
Proceeds of shares issued |
601,774 |
1,191,935 |
|||||||||
|
Share transfers between classes |
22,683 |
9,428 |
|||||||||
|
Value of distributions reinvested |
27,957 |
51,863 |
|||||||||
|
Cost of shares repurchased |
(180,887 |
) |
(320,783 |
) |
|||||||
|
Net increase from share operations |
471,527 |
932,443 |
|||||||||
|
Class L: |
|||||||||||
|
Proceeds of shares issued |
838 |
1,196 |
|||||||||
|
Share transfers between classes |
— |
(287 |
) |
||||||||
|
Value of distributions reinvested |
349 |
737 |
|||||||||
|
Cost of shares repurchased |
(709 |
) |
(448 |
) |
|||||||
|
Net increase from share operations |
478 |
1,198 |
|||||||||
Semi Annual Report 2025
135
CION Ares Diversified Credit Fund
Consolidated Statements of Changes in Net Assets (continued)
(in thousands)
|
For the Six Months Ended June 30, 2025 (unaudited) |
For the Year Ended December 31, 2024 |
||||||||||
|
Class U: |
|||||||||||
|
Proceeds of shares issued |
52,832 |
127,230 |
|||||||||
|
Share transfers between classes |
(4,992 |
) |
1,645 |
||||||||
|
Value of distributions reinvested |
17,293 |
33,706 |
|||||||||
|
Cost of shares repurchased |
(13,531 |
) |
(28,072 |
) |
|||||||
|
Net increase from share operations |
51,602 |
134,509 |
|||||||||
|
Class U-2: |
|||||||||||
|
Proceeds of shares issued |
17,276 |
35,734 |
|||||||||
|
Share transfers between classes |
(63 |
) |
(1,960 |
) |
|||||||
|
Value of distributions reinvested |
3,750 |
7,464 |
|||||||||
|
Cost of shares repurchased |
(9,869 |
) |
(14,969 |
) |
|||||||
|
Net increase from share operations |
11,094 |
26,269 |
|||||||||
|
Class W: |
|||||||||||
|
Value of distributions reinvested |
918 |
2,042 |
|||||||||
|
Cost of shares repurchased |
(956 |
) |
(1,186 |
) |
|||||||
|
Net increase (decrease) from share operations |
(38 |
) |
856 |
||||||||
|
Total increase in net assets |
516,828 |
1,129,086 |
|||||||||
|
Net Assets, beginning of period |
4,338,306 |
3,209,220 |
|||||||||
|
Net Assets, end of period |
$ |
4,855,134 |
$ |
4,338,306 |
|||||||
See accompanying notes to consolidated financial statements.
Semi Annual Report 2025
136
CION Ares Diversified Credit Fund
Consolidated Statement of Cash Flows
For the six months ended June 30, 2025 (Unaudited)
(in thousands)
|
Operating activities: |
|||||||
|
Net increase in net assets resulting from operations |
$ |
178,654 |
|||||
|
Adjustments to reconcile net increase in net assets resulting from operations to net cash used in operating activities: |
|||||||
|
Purchases of investments |
(1,793,395 |
) |
|||||
|
Proceeds from the sale of investments |
1,095,736 |
||||||
|
Purchases to cover securities sold short |
(1,695 |
) |
|||||
|
Purchases of derivative contracts |
(35,755 |
) |
|||||
|
Proceeds from the sale of derivative contracts |
90 |
||||||
|
Amortization and accretion of discounts and premiums, net |
(10,803 |
) |
|||||
|
Net realized and unrealized gains on investments |
(92,003 |
) |
|||||
|
Net realized and unrealized gains on securities sold short |
(18 |
) |
|||||
|
Net realized and unrealized losses on derivative contracts |
70,351 |
||||||
|
Net realized and unrealized losses on foreign currency |
22,588 |
||||||
|
Amortization of debt issuance cost |
3,106 |
||||||
|
PIK interest |
(21,699 |
) |
|||||
|
PIK dividends |
(20,098 |
) |
|||||
|
Collections of PIK interest |
1,766 |
||||||
|
Collections of PIK dividends |
2,957 |
||||||
|
Changes in operating assets and liabilities: |
|||||||
|
Due from brokers |
(34,482 |
) |
|||||
|
Interest and dividend receivable |
(6,598 |
) |
|||||
|
Other assets |
(331 |
) |
|||||
|
Interest and facility fees payable |
1,692 |
||||||
|
Accrued expenses and other payables |
9,915 |
||||||
|
Net cash used in operating activities |
(630,022 |
) |
|||||
|
Financing activities: |
|||||||
|
Borrowings on debt |
1,031,000 |
||||||
|
Repayments of debt |
(1,062,468 |
) |
|||||
|
Proceeds from issuance of mandatory redeemable preferred shares |
300,000 |
||||||
|
Deferred debt and mandatory redeemable preferred shares issuance costs |
(5,341 |
) |
|||||
|
Proceeds of common shares issued |
677,549 |
||||||
|
Cost of common shares repurchased |
(216,350 |
) |
|||||
|
Distributions to shareholders |
(185,122 |
) |
|||||
|
Value of distributions reinvested |
51,961 |
||||||
|
Net cash provided by financing activities |
591,229 |
||||||
|
Change in Cash |
(38,793 |
) |
|||||
|
Cash, Beginning of Period |
174,147 |
||||||
|
Cash, End of Period |
$ |
135,354 |
|||||
|
Supplemental disclosure of cash flow information: |
|||||||
|
Cash paid for interest on mandatory redeemable preferred shares and credit facilities during the period |
$ |
65,394 |
|||||
|
Cash paid for taxes during the period |
$ |
3,501 |
|||||
See accompanying notes to consolidated financial statements.
Semi Annual Report 2025
137
CION Ares Diversified Credit Fund
|
For the Six Months Ended June 30, 2025 (unaudited) |
For the Year Ended December 31, 2024 |
For the Year Ended December 31, 2023 |
For the Year Ended December 31, 2022 |
For the Year Ended December 31, 2021 |
|||||||||||||||||||
|
Class A |
|||||||||||||||||||||||
|
Per share data: |
|||||||||||||||||||||||
|
Net asset value, beginning of period |
$ |
25.09 |
$ |
24.96 |
$ |
23.86 |
$ |
25.75 |
$ |
25.13 |
|||||||||||||
|
Income from investment operations: |
|||||||||||||||||||||||
|
Net investment income(a) |
0.99 |
2.27 |
2.50 |
1.62 |
1.46 |
||||||||||||||||||
|
Net realized and unrealized gains (losses) |
(0.01 |
) |
0.11 |
0.61 |
(2.09 |
) |
0.55 |
||||||||||||||||
|
Total income (loss) from investment operations |
0.98 |
2.38 |
3.11 |
(0.47 |
) |
2.01 |
|||||||||||||||||
|
Less distributions declared to shareholders: |
|||||||||||||||||||||||
|
From net investment income |
(1.01 |
) |
(2.25 |
) |
(2.01 |
) |
(1.42 |
) |
(1.39 |
) |
|||||||||||||
|
Total distributions |
(1.01 |
) |
(2.25 |
) |
(2.01 |
) |
(1.42 |
) |
(1.39 |
) |
|||||||||||||
|
Net asset value, end of period |
$ |
25.06 |
$ |
25.09 |
$ |
24.96 |
$ |
23.86 |
$ |
25.75 |
|||||||||||||
|
Total return, excluding expense support(b) |
3.98 |
% |
9.91 |
% |
13.53 |
% |
(1.70 |
)% |
8.93 |
% |
|||||||||||||
|
Total return, including expense support(b) |
3.98 |
% |
9.91 |
% |
13.53 |
% |
(1.84 |
)% |
8.21 |
% |
|||||||||||||
|
Ratios to average net assets/supplemental data: |
|||||||||||||||||||||||
|
Net assets, end of period |
$ |
82,548 |
$ |
90,043 |
$ |
68,153 |
$ |
58,829 |
$ |
62,031 |
|||||||||||||
|
Including interest expense: |
|||||||||||||||||||||||
|
Expenses, excluding expense support(d)(g) |
7.11 |
%(h) |
7.13 |
%(h) |
6.97 |
%(h) |
4.92 |
%(h) |
3.11 |
%(h) |
|||||||||||||
|
Expenses, including expense support(d)(f)(g) |
7.11 |
%(h) |
7.13 |
%(h) |
6.97 |
%(h) |
5.06 |
%(h) |
3.83 |
%(h) |
|||||||||||||
|
Excluding interest expense: |
|||||||||||||||||||||||
|
Expenses, excluding expense support(d)(g) |
3.95 |
% |
4.25 |
% |
4.40 |
% |
3.40 |
% |
2.46 |
% |
|||||||||||||
|
Expenses, including expense support(d)(f)(g) |
3.95 |
% |
4.25 |
% |
4.40 |
% |
3.54 |
% |
3.18 |
% |
|||||||||||||
|
Net investment income(d) |
7.94 |
% |
9.05 |
% |
10.25 |
% |
6.53 |
% |
5.72 |
% |
|||||||||||||
|
Portfolio turnover rate |
14.71 |
%(c) |
46.16 |
% |
30.64 |
% |
38.16 |
% |
43.72 |
% |
|||||||||||||
Semi Annual Report 2025
138
CION Ares Diversified Credit Fund
Financial Highlights (continued)
(in thousands, except per share data, percentages and as otherwise noted)
|
For the Year Ended December 31, 2020 |
For the Period Ended December 31, 2019* |
For the Year Ended October 31, 2019 |
For the Year Ended October 31, 2018 |
For the Period from January 26, 2017 to October 31, 2017 |
|||||||||||||||||||
|
Class A |
|||||||||||||||||||||||
|
Per share data: |
|||||||||||||||||||||||
|
Net asset value, beginning of period |
$ |
25.93 |
$ |
25.44 |
$ |
25.80 |
$ |
25.25 |
$ |
25.00 |
|||||||||||||
|
Income from investment operations: |
|||||||||||||||||||||||
|
Net investment income(a) |
1.40 |
0.23 |
1.39 |
1.52 |
0.86 |
||||||||||||||||||
|
Net realized and unrealized gains (losses) |
(0.80 |
) |
0.49 |
(0.36 |
) |
0.42 |
0.44 |
||||||||||||||||
|
Total income from investment operations |
0.60 |
0.72 |
1.03 |
1.94 |
1.30 |
||||||||||||||||||
|
Less distributions declared to shareholders: |
|||||||||||||||||||||||
|
From net investment income |
(1.40 |
) |
(0.23 |
) |
(1.39 |
) |
(1.39 |
) |
(0.86 |
) |
|||||||||||||
|
From net realized gains on investments |
— |
— |
— |
— |
(0.12 |
) |
|||||||||||||||||
|
From net unrealized gains on investments and foreign currency |
— |
— |
— |
— |
(0.07 |
) |
|||||||||||||||||
|
Total distributions |
(1.40 |
) |
(0.23 |
) |
(1.39 |
) |
(1.39 |
) |
(1.05 |
) |
|||||||||||||
|
Net asset value, end of period |
$ |
25.13 |
$ |
25.93 |
$ |
25.44 |
$ |
25.80 |
$ |
25.25 |
|||||||||||||
|
Total return, excluding expense support(b) |
3.61 |
% |
2.86 |
%(c) |
4.37 |
% |
(2.44 |
)% |
(37.12 |
)%(c) |
|||||||||||||
|
Total return, including expense support(d) |
2.77 |
% |
2.86 |
%(c) |
4.10 |
% |
7.91 |
% |
5.32 |
%(c) |
|||||||||||||
|
Ratios to average net assets/supplemental data: |
|||||||||||||||||||||||
|
Net assets, end of period |
$ |
58,881 |
$ |
60,203 |
$ |
54,386 |
$ |
37,915 |
$ |
12,865 |
|||||||||||||
|
Including interest expense: |
|||||||||||||||||||||||
|
Expenses, excluding expense support(e)(h) |
3.44 |
% |
4.01 |
%(f) |
4.03 |
% |
5.98 |
% |
58.85 |
%(f) |
|||||||||||||
|
Expenses, including expense support(e)(g)(h) |
4.28 |
% |
4.01 |
%(f) |
4.30 |
% |
0.34 |
% |
0.00 |
%(f) |
|||||||||||||
|
Excluding interest expense: |
|||||||||||||||||||||||
|
Expenses, excluding expense support(h) |
2.90 |
% |
3.33 |
%(f) |
3.38 |
% |
5.97 |
% |
58.85 |
%(f) |
|||||||||||||
|
Expenses, including expense support(g)(h) |
3.73 |
% |
3.33 |
%(f) |
3.65 |
% |
0.33 |
% |
0.00 |
%(f) |
|||||||||||||
|
Net investment income(e) |
5.86 |
% |
5.27 |
%(f) |
5.56 |
% |
5.91 |
% |
4.48 |
%(f) |
|||||||||||||
|
Portfolio turnover rate |
59.77 |
% |
5.42 |
%(c) |
63.58 |
% |
28.36 |
% |
164.09 |
%(c) |
|||||||||||||
* For the two month period ended December 31, 2019. See Note 1 to the consolidated financial statements for the six months ended June 30, 2025.
(a) Per share net investment income has been calculated using the average shares outstanding during the period.
(b) Based on net asset value per share. Distributions, if any, are assumed for purposes of this calculation to be reinvested at prices obtained under the Fund's dividend reinvestment plan, (the "DRIP"). Total return is not annualized for periods less than one year. Total return excludes or includes, as noted, expense support provided or (recouped) by CION Ares Management, LLC (the "Adviser").
(c) Not annualized.
(d) Includes organizational and offering costs, where applicable.
(e) Annualized, except for certain non-recurring costs.
(f) Includes expense support provided or (recouped) by the Adviser.
Semi Annual Report 2025
139
CION Ares Diversified Credit Fund
Financial Highlights (continued)
(in thousands, except per share data, percentages and as otherwise noted)
(g) For the periods presented below, the ratio of operating expenses to average net assets consisted of the following:
|
For the Six Months Ended June 30, 2025 (unaudited) |
For the Year Ended December 31, 2024 |
For the Year Ended December 31, 2023 |
For the Year Ended December 31, 2022 |
For the Year Ended December 31, 2021 |
|||||||||||||||||||
|
Base management fee |
1.89 |
% |
1.81 |
% |
1.82 |
% |
1.77 |
% |
1.58 |
% |
|||||||||||||
|
Income based incentive fee |
1.41 |
% |
1.59 |
% |
1.77 |
% |
0.79 |
% |
— |
% |
|||||||||||||
|
Cost of borrowing |
3.17 |
% |
2.88 |
% |
2.57 |
% |
1.52 |
% |
0.65 |
% |
|||||||||||||
|
Net expense support |
— |
% |
— |
% |
— |
% |
0.14 |
% |
0.72 |
% |
|||||||||||||
|
Other operating expenses |
0.64 |
% |
0.85 |
% |
0.81 |
% |
0.84 |
% |
0.88 |
% |
|||||||||||||
|
Total operating expenses |
7.11 |
% |
7.13 |
% |
6.97 |
% |
5.06 |
% |
3.83 |
% |
|||||||||||||
|
For the Year Ended December 31, 2020 |
For the Period Ended December 31, 2019* |
For the Year Ended October 31, 2019 |
For the Year Ended October 31, 2018 |
For the Period from January 26, 2017 to October 31, 2017 |
|||||||||||||||||||
|
Base management fee |
1.56 |
% |
1.56 |
% |
1.47 |
% |
1.49 |
% |
1.49 |
% |
|||||||||||||
|
Income based incentive fee |
— |
% |
— |
% |
— |
% |
— |
% |
— |
% |
|||||||||||||
|
Cost of borrowing |
0.54 |
% |
0.68 |
% |
0.65 |
% |
— |
% |
— |
% |
|||||||||||||
|
Net expense support |
0.84 |
% |
— |
% |
0.27 |
% |
(5.91 |
)% |
(56.68 |
)% |
|||||||||||||
|
Other operating expenses |
1.35 |
% |
1.77 |
% |
1.91 |
% |
4.76 |
% |
55.19 |
% |
|||||||||||||
|
Total operating expenses |
4.28 |
% |
4.01 |
% |
4.30 |
% |
0.34 |
% |
— |
% |
|||||||||||||
(h) Includes stated dividends and amortization of deferred issuance costs on the mandatory redeemable preferred shares ("MRPS"). See Note 7 to the consolidated financial statements for the six months ended June 30, 2025.
Semi Annual Report 2025
140
CION Ares Diversified Credit Fund
Financial Highlights (continued)
(in thousands, except per share data, percentages and as otherwise noted)
|
For the Six Months Ended June 30, 2025 (unaudited) |
For the Year Ended December 31, 2024 |
For the Year Ended December 31, 2023 |
For the Year Ended December 31, 2022 |
For the Year Ended December 31, 2021 |
|||||||||||||||||||
|
Class C |
|||||||||||||||||||||||
|
Per share data: |
|||||||||||||||||||||||
|
Net asset value, beginning of period |
$ |
24.93 |
$ |
24.77 |
$ |
23.66 |
$ |
25.65 |
$ |
25.05 |
|||||||||||||
|
Income from investment operations: |
|||||||||||||||||||||||
|
Net investment income(a) |
0.89 |
2.11 |
2.32 |
1.48 |
1.43 |
||||||||||||||||||
|
Net realized and unrealized gains (losses) |
(0.01 |
) |
0.10 |
0.60 |
(2.08 |
) |
0.56 |
||||||||||||||||
|
Total income (loss) from investment operations |
0.88 |
2.21 |
2.92 |
(0.60 |
) |
1.99 |
|||||||||||||||||
|
Less distributions declared to shareholders: |
|||||||||||||||||||||||
|
From net investment income |
(0.90 |
) |
(2.05 |
) |
(1.81 |
) |
(1.39 |
) |
(1.39 |
) |
|||||||||||||
|
Total distributions |
(0.90 |
) |
(2.05 |
) |
(1.81 |
) |
(1.39 |
) |
(1.39 |
) |
|||||||||||||
|
Net asset value, end of period |
$ |
24.91 |
$ |
24.93 |
$ |
24.77 |
$ |
23.66 |
$ |
25.65 |
|||||||||||||
|
Total return, excluding expense support(b) |
3.64 |
% |
9.24 |
% |
12.80 |
% |
(2.31 |
)% |
8.20 |
% |
|||||||||||||
|
Total return, including expense support(b) |
3.64 |
% |
9.24 |
% |
12.80 |
% |
(2.42 |
)% |
8.16 |
% |
|||||||||||||
|
Ratios to average net assets/supplemental data: |
|||||||||||||||||||||||
|
Net assets, end of period |
$ |
69,103 |
$ |
73,279 |
$ |
79,242 |
$ |
73,573 |
$ |
77,361 |
|||||||||||||
|
Including interest expense: |
|||||||||||||||||||||||
|
Expenses, excluding expense support(d)(g) |
7.76 |
%(h) |
7.75 |
%(h) |
7.62 |
%(h) |
5.50 |
%(h) |
3.87 |
%(h) |
|||||||||||||
|
Expenses, including expense support(d)(f)(g) |
7.76 |
%(h) |
7.75 |
%(h) |
7.62 |
%(h) |
5.61 |
%(h) |
3.91 |
%(h) |
|||||||||||||
|
Excluding interest expense: |
|||||||||||||||||||||||
|
Expenses, excluding expense support(d)(g) |
4.59 |
% |
4.90 |
% |
5.05 |
% |
3.98 |
% |
3.22 |
% |
|||||||||||||
|
Expenses, including expense support(d)(f)(g) |
4.59 |
% |
4.90 |
% |
5.05 |
% |
4.09 |
% |
3.26 |
% |
|||||||||||||
|
Net investment income(d) |
7.31 |
% |
8.47 |
% |
9.59 |
% |
5.99 |
% |
5.65 |
% |
|||||||||||||
|
Portfolio turnover rate |
14.71 |
%(c) |
46.16 |
% |
30.64 |
% |
38.16 |
% |
43.72 |
% |
|||||||||||||
Semi Annual Report 2025
141
CION Ares Diversified Credit Fund
Financial Highlights (continued)
(in thousands, except per share data, percentages and as otherwise noted)
|
For the Year Ended December 31, 2020 |
For the Period Ended December 31, 2019* |
For the Year Ended October 31, 2019 |
For the Year Ended October 31, 2018 |
For the Period from July 12, 2017 (commencement of operations) to October 31, 2017 |
|||||||||||||||||||
|
Class C |
|||||||||||||||||||||||
|
Per share data: |
|||||||||||||||||||||||
|
Net asset value, beginning of period |
$ |
25.90 |
$ |
25.44 |
$ |
25.80 |
$ |
25.25 |
$ |
24.95 |
|||||||||||||
|
Income from investment operations: |
|||||||||||||||||||||||
|
Net investment income(a) |
1.35 |
0.19 |
1.39 |
1.52 |
0.39 |
||||||||||||||||||
|
Net realized and unrealized gains (losses) |
(0.80 |
) |
0.50 |
(0.36 |
) |
0.42 |
0.33 |
||||||||||||||||
|
Total income from investment operations |
0.55 |
0.69 |
1.03 |
1.94 |
0.72 |
||||||||||||||||||
|
Less distributions declared to shareholders: |
|||||||||||||||||||||||
|
From net investment income |
(1.40 |
) |
(0.23 |
) |
(1.39 |
) |
(1.39 |
) |
(0.39 |
) |
|||||||||||||
|
From net realized gains on investments |
— |
— |
— |
— |
(0.02 |
) |
|||||||||||||||||
|
From net unrealized gains on investments and foreign currency |
— |
— |
— |
— |
(0.01 |
) |
|||||||||||||||||
|
Total distributions |
(1.40 |
) |
(0.23 |
) |
(1.39 |
) |
(1.39 |
) |
(0.42 |
) |
|||||||||||||
|
Net asset value, end of period |
$ |
25.05 |
$ |
25.90 |
$ |
25.44 |
$ |
25.80 |
$ |
25.25 |
|||||||||||||
|
Total return, excluding expense support(b) |
2.81 |
% |
2.74 |
%(c) |
3.70 |
% |
(3.19 |
)% |
(3.56 |
)%(c) |
|||||||||||||
|
Total return, including expense support(d) |
2.57 |
% |
2.74 |
%(c) |
4.10 |
% |
7.91 |
% |
2.95 |
%(c) |
|||||||||||||
|
Ratios to average net assets/supplemental data: |
|||||||||||||||||||||||
|
Net assets, end of period |
$ |
68,039 |
$ |
65,779 |
$ |
59,912 |
$ |
29,868 |
$ |
3,898 |
|||||||||||||
|
Including interest expense: |
|||||||||||||||||||||||
|
Expenses, excluding expense support(e) |
4.18 |
% |
4.76 |
%(f) |
4.82 |
% |
6.73 |
% |
25.59 |
%(f) |
|||||||||||||
|
Expenses, including expense support(e)(g) |
4.41 |
% |
4.76 |
%(f) |
4.42 |
% |
0.34 |
% |
0.00 |
%(f) |
|||||||||||||
|
Excluding interest expense: |
|||||||||||||||||||||||
|
Expenses, excluding expense support |
3.64 |
% |
4.07 |
%(f) |
4.15 |
% |
6.72 |
% |
22.59 |
%(f) |
|||||||||||||
|
Expenses, including expense support(g) |
3.88 |
% |
4.07 |
%(f) |
3.75 |
% |
0.33 |
% |
0.00 |
%(f) |
|||||||||||||
|
Net investment income(e) |
5.66 |
% |
4.52 |
%(f) |
5.48 |
% |
5.91 |
% |
5.17 |
%(f) |
|||||||||||||
|
Portfolio turnover rate |
59.77 |
% |
5.42 |
%(c) |
63.58 |
% |
28.36 |
% |
164.09 |
%(c) |
|||||||||||||
* For the two month period ended December 31, 2019. See Note 1 to the consolidated financial statements for the six months ended June 30, 2025.
(a) Per share net investment income has been calculated using the average shares outstanding during the period.
(b) Based on net asset value per share. Distributions, if any, are assumed for purposes of this calculation to be reinvested at prices obtained under the Fund's DRIP. Total return is not annualized for periods less than one year. Total return excludes or includes, as noted, expense support provided or (recouped) by the Adviser.
(c) Not annualized.
(d) Includes organizational and offering costs, where applicable.
(e) Annualized, except for certain non-recurring costs.
(f) Includes expense support provided or (recouped) by the Adviser.
Semi Annual Report 2025
142
CION Ares Diversified Credit Fund
Financial Highlights (continued)
(in thousands, except per share data, percentages and as otherwise noted)
(g) For the periods presented below, the ratio of operating expenses to average net assets consisted of the following:
|
For the Six Months Ended June 30, 2025 (unaudited) |
For the Year Ended December 31, 2024 |
For the Year Ended December 31, 2023 |
For the Year Ended December 31, 2022 |
For the Year Ended December 31, 2021 |
|||||||||||||||||||
|
Base management fee |
1.90 |
% |
1.80 |
% |
1.82 |
% |
1.77 |
% |
1.58 |
% |
|||||||||||||
|
Income based incentive fee |
1.30 |
% |
1.49 |
% |
1.66 |
% |
0.61 |
% |
— |
% |
|||||||||||||
|
Cost of borrowing |
3.17 |
% |
2.85 |
% |
2.57 |
% |
1.52 |
% |
0.65 |
% |
|||||||||||||
|
Net expense support |
— |
% |
— |
% |
— |
% |
0.11 |
% |
0.04 |
% |
|||||||||||||
|
Other operating expenses |
1.39 |
% |
1.61 |
% |
1.57 |
% |
1.60 |
% |
1.64 |
% |
|||||||||||||
|
Total operating expenses |
7.76 |
% |
7.75 |
% |
7.62 |
% |
5.61 |
% |
3.91 |
% |
|||||||||||||
|
For the Year Ended December 31, 2020 |
For the Period Ended December 31, 2019* |
For the Year Ended October 31, 2019 |
For the Year Ended October 31, 2018 |
For the Period from July 12, 2017 (commencement of operations) to October 31, 2017 |
|||||||||||||||||||
|
Base management fee |
1.56 |
% |
1.56 |
% |
1.47 |
% |
1.49 |
% |
1.49 |
% |
|||||||||||||
|
Income based incentive fee |
— |
% |
— |
% |
— |
% |
— |
% |
— |
% |
|||||||||||||
|
Cost of borrowing |
0.52 |
% |
0.68 |
% |
0.67 |
% |
— |
% |
— |
% |
|||||||||||||
|
Net expense support |
0.24 |
% |
— |
% |
(0.40 |
)% |
(6.20 |
)% |
(33.93 |
)% |
|||||||||||||
|
Other operating expenses |
2.09 |
% |
2.52 |
% |
2.67 |
% |
5.05 |
% |
32.44 |
% |
|||||||||||||
|
Total operating expenses |
4.41 |
% |
4.76 |
% |
4.42 |
% |
0.34 |
% |
— |
% |
|||||||||||||
(h) Includes stated dividends and amortization of deferred issuance costs on the MRPS. See Note 7 to the consolidated financial statements for the six months ended June 30, 2025.
Semi Annual Report 2025
143
CION Ares Diversified Credit Fund
Financial Highlights (continued)
(in thousands, except per share data, percentages and as otherwise noted)
|
For the Six Months Ended June 30, 2025 (unaudited) |
For the Year Ended December 31, 2024 |
For the Year Ended December 31, 2023 |
For the Year Ended December 31, 2022 |
For the Year Ended December 31, 2021 |
|||||||||||||||||||
|
Class I |
|||||||||||||||||||||||
|
Per share data: |
|||||||||||||||||||||||
|
Net asset value, beginning of period |
$ |
25.36 |
$ |
25.23 |
$ |
24.12 |
$ |
26.01 |
$ |
25.22 |
|||||||||||||
|
Income from investment operations: |
|||||||||||||||||||||||
|
Net investment income(a) |
1.01 |
2.35 |
2.58 |
1.73 |
1.62 |
||||||||||||||||||
|
Net realized and unrealized gains (losses) |
(0.01 |
) |
0.11 |
0.62 |
(2.14 |
) |
0.56 |
||||||||||||||||
|
Total income (loss) from investment operations |
1.00 |
2.46 |
3.20 |
(0.41 |
) |
2.18 |
|||||||||||||||||
|
Less distributions declared to shareholders: |
|||||||||||||||||||||||
|
From net investment income |
(1.05 |
) |
(2.33 |
) |
(2.09 |
) |
(1.48 |
) |
(1.39 |
) |
|||||||||||||
|
Total distributions |
(1.05 |
) |
(2.33 |
) |
(2.09 |
) |
(1.48 |
) |
(1.39 |
) |
|||||||||||||
|
Net asset value, end of period |
$ |
25.31 |
$ |
25.36 |
$ |
25.23 |
$ |
24.12 |
$ |
26.01 |
|||||||||||||
|
Total return, excluding expense support(b) |
4.05 |
% |
10.17 |
% |
13.79 |
% |
(1.62 |
)% |
8.90 |
% |
|||||||||||||
|
Total return, including expense support(b) |
4.05 |
% |
10.17 |
% |
13.79 |
% |
(1.62 |
)% |
8.87 |
% |
|||||||||||||
|
Ratios to average net assets/supplemental data: |
|||||||||||||||||||||||
|
Net assets, end of period |
$ |
3,845,246 |
$ |
3,378,787 |
$ |
2,432,547 |
$ |
1,819,625 |
$ |
1,339,092 |
|||||||||||||
|
Including interest expense: |
|||||||||||||||||||||||
|
Expenses, excluding expense support(d)(g) |
6.92 |
%(h) |
6.92 |
%(h) |
6.75 |
%(h) |
4.87 |
%(h) |
3.25 |
%(h) |
|||||||||||||
|
Expenses, including expense support(d)(f)(g) |
6.92 |
%(h) |
6.92 |
%(h) |
6.75 |
%(h) |
4.87 |
%(h) |
3.28 |
%(h) |
|||||||||||||
|
Excluding interest expense: |
|||||||||||||||||||||||
|
Expenses, excluding expense support(d)(g) |
3.74 |
% |
4.03 |
% |
4.18 |
% |
3.32 |
% |
2.56 |
% |
|||||||||||||
|
Expenses, including expense support(d)(f)(g) |
3.74 |
% |
4.03 |
% |
4.18 |
% |
3.32 |
% |
2.59 |
% |
|||||||||||||
|
Net investment income(d) |
8.18 |
% |
9.26 |
% |
10.50 |
% |
6.92 |
% |
6.34 |
% |
|||||||||||||
|
Portfolio turnover rate |
14.71 |
%(c) |
46.16 |
% |
30.64 |
% |
38.16 |
% |
43.72 |
% |
|||||||||||||
Semi Annual Report 2025
144
CION Ares Diversified Credit Fund
Financial Highlights (continued)
(in thousands, except per share data, percentages and as otherwise noted)
|
For the Year Ended December 31, 2020 |
For the Period Ended December 31, 2019* |
For the Year Ended October 31, 2019 |
For the Year Ended October 31, 2018 |
For the Period from July 12, 2017 (commencement of operations) to October 31, 2017 |
|||||||||||||||||||
|
Class I |
|||||||||||||||||||||||
|
Per share data: |
|||||||||||||||||||||||
|
Net asset value, beginning of period |
$ |
25.93 |
$ |
25.44 |
$ |
25.80 |
$ |
25.25 |
$ |
24.95 |
|||||||||||||
|
Income from investment operations: |
|||||||||||||||||||||||
|
Net investment income(a) |
1.49 |
0.23 |
1.39 |
1.52 |
0.40 |
||||||||||||||||||
|
Net realized and unrealized gains (losses) |
(0.80 |
) |
0.49 |
(0.36 |
) |
0.42 |
0.32 |
||||||||||||||||
|
Total income from investment operations |
0.69 |
0.72 |
1.03 |
1.94 |
0.72 |
||||||||||||||||||
|
Less distributions declared to shareholders: |
|||||||||||||||||||||||
|
From net investment income |
(1.40 |
) |
(0.23 |
) |
(1.39 |
) |
(1.39 |
) |
(0.40 |
) |
|||||||||||||
|
From net realized gains on investments |
— |
— |
— |
— |
(0.01 |
) |
|||||||||||||||||
|
From net unrealized gains on investments and foreign currency |
— |
— |
— |
— |
(0.01 |
) |
|||||||||||||||||
|
Total distributions |
(1.40 |
) |
(0.23 |
) |
(1.39 |
) |
(1.39 |
) |
(0.42 |
) |
|||||||||||||
|
Net asset value, end of period |
$ |
25.22 |
$ |
25.93 |
$ |
25.44 |
$ |
25.80 |
$ |
25.25 |
|||||||||||||
|
Total return, excluding expense support(b) |
3.55 |
% |
2.88 |
%(c) |
4.78 |
% |
(2.19 |
)% |
(2.49 |
)%(c) |
|||||||||||||
|
Total return, including expense support(d) |
3.12 |
% |
2.86 |
%(c) |
4.10 |
% |
7.91 |
% |
2.95 |
%(c) |
|||||||||||||
|
Ratios to average net assets/supplemental data: |
|||||||||||||||||||||||
|
Net assets, end of period |
$ |
603,536 |
$ |
354,144 |
$ |
298,481 |
$ |
111,705 |
$ |
6,048 |
|||||||||||||
|
Including interest expense: |
|||||||||||||||||||||||
|
Expenses, excluding expense support(e)(h) |
3.50 |
% |
3.74 |
%(f) |
3.87 |
% |
5.73 |
% |
18.62 |
%(f) |
|||||||||||||
|
Expenses, including expense support(e)(g)(h) |
3.93 |
% |
3.87 |
%(f) |
4.55 |
% |
0.34 |
% |
0.00 |
%(f) |
|||||||||||||
|
Excluding interest expense: |
|||||||||||||||||||||||
|
Expenses, excluding expense support(h) |
2.97 |
% |
3.06 |
%(f) |
3.17 |
% |
5.71 |
% |
18.62 |
%(f) |
|||||||||||||
|
Expenses, including expense support(g)(h) |
3.39 |
% |
3.19 |
%(f) |
3.85 |
% |
0.32 |
% |
0.00 |
%(f) |
|||||||||||||
|
Net investment income(e) |
6.24 |
% |
5.44 |
%(f) |
5.38 |
% |
5.91 |
% |
5.19 |
%(f) |
|||||||||||||
|
Portfolio turnover rate |
59.77 |
% |
5.42 |
%(c) |
63.58 |
% |
28.36 |
% |
164.09 |
%(c) |
|||||||||||||
* For the two month period ended December 31, 2019. See Note 1 to the consolidated financial statements for the six months ended June 30, 2025.
(a) Per share net investment income has been calculated using the average shares outstanding during the period.
(b) Based on net asset value per share. Distributions, if any, are assumed for purposes of this calculation to be reinvested at prices obtained under the Fund's DRIP. Total return is not annualized for periods less than one year. Total return excludes or includes, as noted, expense support provided or (recouped) by the Adviser.
(c) Not annualized.
(d) Includes organizational and offering costs, where applicable.
(e) Annualized, except for certain non-recurring costs.
(f) Includes expense support provided or (recouped) by the Adviser.
Semi Annual Report 2025
145
CION Ares Diversified Credit Fund
Financial Highlights (continued)
(in thousands, except per share data, percentages and as otherwise noted)
(g) For the periods presented below, the ratio of operating expenses to average net assets consisted of the following:
|
For the Six Months Ended June 30, 2025 (unaudited) |
For the Year Ended December 31, 2024 |
For the Year Ended December 31, 2023 |
For the Year Ended December 31, 2022 |
For the Year Ended December 31, 2021 |
|||||||||||||||||||
|
Base management fee |
1.90 |
% |
1.81 |
% |
1.82 |
% |
1.78 |
% |
1.60 |
% |
|||||||||||||
|
Income based incentive fee |
1.45 |
% |
1.62 |
% |
1.81 |
% |
0.95 |
% |
0.33 |
% |
|||||||||||||
|
Cost of borrowing |
3.18 |
% |
2.89 |
% |
2.56 |
% |
1.55 |
% |
0.69 |
% |
|||||||||||||
|
Net expense support |
— |
% |
— |
% |
— |
% |
— |
% |
0.03 |
% |
|||||||||||||
|
Other operating expenses |
0.39 |
% |
0.60 |
% |
0.56 |
% |
0.59 |
% |
0.63 |
% |
|||||||||||||
|
Total operating expenses |
6.92 |
% |
6.92 |
% |
6.75 |
% |
4.87 |
% |
3.28 |
% |
|||||||||||||
|
For the Year Ended December 31, 2020 |
For the Period Ended December 31, 2019* |
For the Year Ended October 31, 2019 |
For the Year Ended October 31, 2018 |
For the Period from July 12, 2017 (commencement of operations) to October 31, 2017 |
|||||||||||||||||||
|
Base management fee |
1.59 |
% |
1.56 |
% |
1.48 |
% |
1.49 |
% |
1.49 |
% |
|||||||||||||
|
Income based incentive fee |
0.25 |
% |
— |
% |
— |
% |
— |
% |
— |
% |
|||||||||||||
|
Cost of borrowing |
0.53 |
% |
0.68 |
% |
0.71 |
% |
— |
% |
— |
% |
|||||||||||||
|
Net expense support |
0.43 |
% |
0.13 |
% |
0.68 |
% |
(4.79 |
)% |
(29.81 |
)% |
|||||||||||||
|
Other operating expenses |
1.14 |
% |
1.51 |
% |
1.68 |
% |
3.64 |
% |
28.33 |
% |
|||||||||||||
|
Total operating expenses |
3.93 |
% |
3.87 |
% |
4.55 |
% |
0.34 |
% |
— |
% |
|||||||||||||
(h) Includes stated dividends and amortization of deferred issuance costs on the MRPS. See Note 7 to the consolidated financial statements for the six months ended June 30, 2025.
Semi Annual Report 2025
146
CION Ares Diversified Credit Fund
Financial Highlights (continued)
(in thousands, except per share data, percentages and as otherwise noted)
|
For the Six Months Ended June 30, 2025 (unaudited) |
For the Year Ended December 31, 2024 |
For the Year Ended December 31, 2023 |
For the Year Ended December 31, 2022 |
For the Year Ended December 31, 2021 |
|||||||||||||||||||
|
Class L |
|||||||||||||||||||||||
|
Per share data: |
|||||||||||||||||||||||
|
Net asset value, beginning of period |
$ |
25.18 |
$ |
25.04 |
$ |
23.93 |
$ |
25.85 |
$ |
25.14 |
|||||||||||||
|
Income from investment operations: |
|||||||||||||||||||||||
|
Net investment income(a) |
0.96 |
2.23 |
2.45 |
1.63 |
1.54 |
||||||||||||||||||
|
Net realized and unrealized gains (losses) |
(0.01 |
) |
0.10 |
0.61 |
(2.11 |
) |
0.56 |
||||||||||||||||
|
Total income (loss) from investment operations |
0.95 |
2.33 |
3.06 |
(0.48 |
) |
2.10 |
|||||||||||||||||
|
Less distributions declared to shareholders: |
|||||||||||||||||||||||
|
From net investment income |
(0.99 |
) |
(2.19 |
) |
(1.95 |
) |
(1.44 |
) |
(1.39 |
) |
|||||||||||||
|
Total distributions |
(0.99 |
) |
(2.19 |
) |
(1.95 |
) |
(1.44 |
) |
(1.39 |
) |
|||||||||||||
|
Net asset value, end of period |
$ |
25.14 |
$ |
25.18 |
$ |
25.04 |
$ |
23.93 |
$ |
25.85 |
|||||||||||||
|
Total return, excluding expense support(b) |
3.86 |
% |
9.68 |
% |
13.28 |
% |
(1.92 |
)% |
8.69 |
% |
|||||||||||||
|
Total return, including expense support(b) |
3.86 |
% |
9.68 |
% |
13.28 |
% |
(1.92 |
)% |
8.58 |
% |
|||||||||||||
|
Ratios to average net assets/supplemental data: |
|||||||||||||||||||||||
|
Net assets, end of period |
$ |
13,006 |
$ |
12,552 |
$ |
11,283 |
$ |
10,537 |
$ |
9,845 |
|||||||||||||
|
Including interest expense: |
|||||||||||||||||||||||
|
Expenses, excluding expense support(d)(g) |
7.34 |
%(h) |
7.34 |
%(h) |
7.19 |
%(h) |
5.12 |
%(h) |
3.40 |
%(h) |
|||||||||||||
|
Expenses, including expense support(d)(f)(g) |
7.34 |
%(h) |
7.34 |
%(h) |
7.19 |
%(h) |
5.12 |
%(h) |
3.51 |
%(h) |
|||||||||||||
|
Excluding interest expense: |
|||||||||||||||||||||||
|
Expenses, excluding expense support(d)(g) |
4.06 |
% |
4.47 |
% |
4.62 |
% |
3.59 |
% |
2.75 |
% |
|||||||||||||
|
Expenses, including expense support(d)(f)(g) |
4.06 |
% |
4.47 |
% |
4.62 |
% |
3.59 |
% |
2.86 |
% |
|||||||||||||
|
Net investment income(d) |
7.74 |
% |
8.87 |
% |
10.03 |
% |
6.56 |
% |
6.05 |
% |
|||||||||||||
|
Portfolio turnover rate |
14.71 |
%(c) |
46.16 |
% |
30.64 |
% |
38.16 |
% |
43.72 |
% |
|||||||||||||
Semi Annual Report 2025
147
CION Ares Diversified Credit Fund
Financial Highlights (continued)
(in thousands, except per share data, percentages and as otherwise noted)
|
For the Year Ended December 31, 2020 |
For the Period Ended December 31, 2019* |
For the Year Ended October 31, 2019 |
For the Period from November 2, 2017 (commencement of operations) to October 31, 2018 |
||||||||||||||||
|
Class L |
|||||||||||||||||||
|
Per share data: |
|||||||||||||||||||
|
Net asset value, beginning of period |
$ |
25.92 |
$ |
25.44 |
$ |
25.80 |
$ |
25.23 |
|||||||||||
|
Income from investment operations: |
|||||||||||||||||||
|
Net investment income(a) |
1.44 |
0.19 |
1.39 |
1.52 |
|||||||||||||||
|
Net realized and unrealized gains (losses) |
(0.82 |
) |
0.52 |
(0.36 |
) |
0.43 |
|||||||||||||
|
Total income from investment operations |
0.62 |
0.71 |
1.03 |
1.95 |
|||||||||||||||
|
Less distributions declared to shareholders: |
|||||||||||||||||||
|
From net investment income |
(1.40 |
) |
(0.23 |
) |
(1.39 |
) |
(1.38 |
) |
|||||||||||
|
Total distributions |
(1.40 |
) |
(0.23 |
) |
(1.39 |
) |
(1.38 |
) |
|||||||||||
|
Net asset value, end of period |
$ |
25.14 |
$ |
25.92 |
$ |
25.44 |
$ |
25.80 |
|||||||||||
|
Total return, excluding expense support(b) |
3.27 |
% |
2.82 |
%(c) |
4.32 |
% |
(2.69 |
)%(c) |
|||||||||||
|
Total return, including expense support(d) |
2.85 |
% |
2.82 |
%(c) |
4.10 |
% |
7.96 |
%(c) |
|||||||||||
|
Ratios to average net assets/supplemental data: |
|||||||||||||||||||
|
Net assets, end of period |
$ |
7,364 |
$ |
6,325 |
$ |
5,536 |
$ |
1,933 |
|||||||||||
|
Including interest expense: |
|||||||||||||||||||
|
Expenses, excluding expense support(e)(h) |
3.82 |
% |
4.24 |
%(f) |
4.38 |
% |
6.23 |
%(f) |
|||||||||||
|
Expenses, including expense support(e)(g)(h) |
4.24 |
% |
4.24 |
%(f) |
4.60 |
% |
0.34 |
%(f) |
|||||||||||
|
Excluding interest expense: |
|||||||||||||||||||
|
Expenses, excluding expense support(h) |
3.27 |
% |
3.56 |
%(f) |
3.67 |
% |
6.21 |
%(f) |
|||||||||||
|
Expenses, including expense support(g)(h) |
3.69 |
% |
3.56 |
%(f) |
3.89 |
% |
0.32 |
%(f) |
|||||||||||
|
Net investment income(e) |
6.04 |
% |
4.47 |
%(f) |
5.35 |
% |
5.19 |
%(f) |
|||||||||||
|
Portfolio turnover rate |
59.77 |
% |
5.42 |
%(c) |
63.58 |
% |
28.36 |
%(c) |
|||||||||||
* For the two month period ended December 31, 2019. See Note 1 to the consolidated financial statements for the six months ended June 30, 2025.
(a) Per share net investment income has been calculated using the average shares outstanding during the period.
(b) Based on net asset value per share. Distributions, if any, are assumed for purposes of this calculation to be reinvested at prices obtained under the Fund's DRIP. Total return is not annualized for periods less than one year. Total return excludes or includes, as noted, expense support provided or (recouped) by the Adviser.
(c) Not annualized.
(d) Includes organizational and offering costs, where applicable.
(e) Annualized, except for certain non-recurring costs.
(f) Includes expense support provided or (recouped) by the Adviser.
Semi Annual Report 2025
148
CION Ares Diversified Credit Fund
Financial Highlights (continued)
(in thousands, except per share data, percentages and as otherwise noted)
(g) For the periods presented below, the ratio of operating expenses to average net assets consisted of the following:
|
For the Six Months Ended June 30, 2025 (unaudited) |
For the Year Ended December 31, 2024 |
For the Year Ended December 31, 2023 |
For the Year Ended December 31, 2022 |
For the Year Ended December 31, 2021 |
|||||||||||||||||||
|
Base management fee |
1.90 |
% |
1.80 |
% |
1.82 |
% |
1.78 |
% |
1.58 |
% |
|||||||||||||
|
Income based incentive fee |
1.37 |
% |
1.56 |
% |
1.73 |
% |
0.75 |
% |
0.05 |
% |
|||||||||||||
|
Cost of borrowing |
3.28 |
% |
2.87 |
% |
2.57 |
% |
1.53 |
% |
0.65 |
% |
|||||||||||||
|
Net expense support |
— |
% |
— |
% |
— |
% |
— |
% |
0.11 |
% |
|||||||||||||
|
Other operating expenses |
0.79 |
% |
1.11 |
% |
1.07 |
% |
1.06 |
% |
1.12 |
% |
|||||||||||||
|
Total operating expenses |
7.34 |
% |
7.34 |
% |
7.19 |
% |
5.12 |
% |
3.51 |
% |
|||||||||||||
|
For the Year Ended December 31, 2020 |
For the Period Ended December 31, 2019* |
For the Year Ended October 31, 2019 |
For the Period from November 2, 2017 (commencement of operations) to October 31, 2018 |
||||||||||||||||
|
Base management fee |
1.58 |
% |
1.56 |
% |
1.49 |
% |
1.48 |
% |
|||||||||||
|
Income based incentive fee |
0.02 |
% |
— |
% |
— |
% |
— |
% |
|||||||||||
|
Cost of borrowing |
0.55 |
% |
0.68 |
% |
0.72 |
% |
— |
% |
|||||||||||
|
Net expense support |
0.42 |
% |
— |
% |
0.21 |
% |
(4.71 |
)% |
|||||||||||
|
Other operating expenses |
1.68 |
% |
2.01 |
% |
2.18 |
% |
3.57 |
% |
|||||||||||
|
Total operating expenses |
4.24 |
% |
4.24 |
% |
4.60 |
% |
0.34 |
% |
|||||||||||
(h) Includes stated dividends and amortization of deferred issuance costs on the MRPS. See Note 7 to the consolidated financial statements for the six months ended June 30, 2025.
Semi Annual Report 2025
149
CION Ares Diversified Credit Fund
Financial Highlights (continued)
(in thousands, except per share data, percentages and as otherwise noted)
|
For the Six Months Ended June 30, 2025 (unaudited) |
For the Year Ended December 31, 2024 |
For the Year Ended December 31, 2023 |
For the Year Ended December 31, 2022 |
For the Year Ended December 31, 2021 |
|||||||||||||||||||
|
Class U |
|||||||||||||||||||||||
|
Per share data: |
|||||||||||||||||||||||
|
Net asset value, beginning of period |
$ |
25.23 |
$ |
25.08 |
$ |
23.95 |
$ |
25.87 |
$ |
25.18 |
|||||||||||||
|
Income from investment operations: |
|||||||||||||||||||||||
|
Net investment income(a) |
0.94 |
2.17 |
2.41 |
1.59 |
1.52 |
||||||||||||||||||
|
Net realized and unrealized gains (losses) |
(0.01 |
) |
0.11 |
0.61 |
(2.11 |
) |
0.56 |
||||||||||||||||
|
Total income (loss) from investment operations |
0.93 |
2.28 |
3.02 |
(0.52 |
) |
2.08 |
|||||||||||||||||
|
Less distributions declared to shareholders: |
|||||||||||||||||||||||
|
From net investment income |
(0.96 |
) |
(2.13 |
) |
(1.89 |
) |
(1.40 |
) |
(1.39 |
) |
|||||||||||||
|
Total distributions |
(0.96 |
) |
(2.13 |
) |
(1.89 |
) |
(1.40 |
) |
(1.39 |
) |
|||||||||||||
|
Net asset value, end of period |
$ |
25.20 |
$ |
25.23 |
$ |
25.08 |
$ |
23.95 |
$ |
25.87 |
|||||||||||||
|
Total return, excluding expense support(b) |
3.75 |
% |
9.45 |
% |
13.07 |
% |
(2.07 |
)% |
8.48 |
% |
|||||||||||||
|
Total return, including expense support(b) |
3.75 |
% |
9.45 |
% |
13.07 |
% |
(2.07 |
)% |
8.48 |
% |
|||||||||||||
|
Ratios to average net assets/supplemental data: |
|||||||||||||||||||||||
|
Net assets, end of period |
$ |
665,542 |
$ |
614,678 |
$ |
477,044 |
$ |
388,866 |
$ |
345,691 |
|||||||||||||
|
Including interest expense: |
|||||||||||||||||||||||
|
Expenses, excluding expense support(d)(g) |
7.56 |
%(h) |
7.56 |
%(h) |
7.39 |
%(h) |
5.33 |
%(h) |
3.64 |
%(h) |
|||||||||||||
|
Expenses, including expense support(d)(f)(g) |
7.56 |
%(h) |
7.56 |
%(h) |
7.39 |
%(h) |
5.33 |
%(h) |
3.64 |
%(h) |
|||||||||||||
|
Excluding interest expense: |
|||||||||||||||||||||||
|
Expenses, excluding expense support(d)(g) |
4.38 |
% |
4.68 |
% |
4.82 |
% |
3.80 |
% |
2.97 |
% |
|||||||||||||
|
Expenses, including expense support(d)(f)(g) |
4.38 |
% |
4.68 |
% |
4.82 |
% |
3.80 |
% |
2.97 |
% |
|||||||||||||
|
Net investment income(d) |
7.53 |
% |
8.62 |
% |
9.85 |
% |
6.39 |
% |
5.96 |
% |
|||||||||||||
|
Portfolio turnover rate |
14.71 |
%(c) |
46.16 |
% |
30.64 |
% |
38.16 |
% |
43.72 |
% |
|||||||||||||
Semi Annual Report 2025
150
CION Ares Diversified Credit Fund
Financial Highlights (continued)
(in thousands, except per share data, percentages and as otherwise noted)
|
For the Year Ended December 31, 2020 |
For the Period Ended December 31, 2019* |
For the Period from July 26, 2019 (commencement of operations) to October 31, 2019 |
|||||||||||||
|
Class U |
|||||||||||||||
|
Per share data: |
|||||||||||||||
|
Net asset value, beginning of period |
$ |
25.92 |
$ |
25.44 |
$ |
25.86 |
|||||||||
|
Income from investment operations: |
|||||||||||||||
|
Net investment income(a) |
1.42 |
0.20 |
0.40 |
||||||||||||
|
Net realized and unrealized gains (losses) |
(0.76 |
) |
0.51 |
(0.45 |
) |
||||||||||
|
Total income (loss) from investment operations |
0.66 |
0.71 |
(0.05 |
) |
|||||||||||
|
Less distributions declared to shareholders: |
|||||||||||||||
|
From net investment income |
(1.40 |
) |
(0.23 |
) |
(0.37 |
) |
|||||||||
|
Total distributions |
(1.40 |
) |
(0.23 |
) |
(0.37 |
) |
|||||||||
|
Net asset value, end of period |
$ |
25.18 |
$ |
25.92 |
$ |
25.44 |
|||||||||
|
Total return, excluding expense support(b) |
3.01 |
% |
2.74 |
% |
1.60 |
% |
|||||||||
|
Total return, including expense support(b) |
2.99 |
% |
2.82 |
% |
(0.14 |
)% |
|||||||||
|
Ratios to average net assets/supplemental data: |
|||||||||||||||
|
Net assets, end of period |
$ |
199,175 |
$ |
42,902 |
$ |
10,434 |
|||||||||
|
Including interest expense: |
|||||||||||||||
|
Expenses, excluding expense support(d)(g) |
4.00 |
% |
4.31 |
%(e) |
4.85 |
%(e) |
|||||||||
|
Expenses, including expense support(d)(f)(g) |
4.02 |
% |
3.83 |
%(e) |
6.59 |
%(e) |
|||||||||
|
Excluding interest expense: |
|||||||||||||||
|
Expenses, excluding expense support(d)(g) |
3.51 |
% |
3.66 |
%(e) |
3.88 |
%(e) |
|||||||||
|
Expenses, including expense support(d)(f)(g) |
3.54 |
% |
4.48 |
%(e) |
5.62 |
%(e) |
|||||||||
|
Net investment income(d) |
5.98 |
% |
5.39 |
%(e) |
12.08 |
%(e) |
|||||||||
|
Portfolio turnover rate |
59.77 |
% |
5.42 |
%(c) |
63.58 |
%(c) |
|||||||||
* For the two month period ended December 31, 2019. See Note 1 to the consolidated financial statements for the six months ended June 30, 2025.
(a) Per share net investment income has been calculated using the average shares outstanding during the period.
(b) Based on net asset value per share. Distributions, if any, are assumed for purposes of this calculation to be reinvested at prices obtained under the Fund's DRIP. Total return is not annualized for periods less than one year. Total return excludes or includes, as noted, expense support provided or (recouped) by the Adviser.
(c) Not annualized.
(d) Includes organizational and offering costs, where applicable.
(e) Annualized, except for certain non-recurring costs.
(f) Includes expense support provided or (recouped) by the Adviser.
Semi Annual Report 2025
151
CION Ares Diversified Credit Fund
Financial Highlights (continued)
(in thousands, except per share data, percentages and as otherwise noted)
(g) For the periods presented below, the ratio of operating expenses to average net assets consisted of the following:
|
For the Six Months Ended June 30, 2025 (unaudited) |
For the Year Ended December 31, 2024 |
For the Year Ended December 31, 2023 |
For the Year Ended December 31, 2022 |
For the Year Ended December 31, 2021 |
|||||||||||||||||||
|
Base management fee |
1.90 |
% |
1.81 |
% |
1.82 |
% |
1.78 |
% |
1.59 |
% |
|||||||||||||
|
Income based incentive fee |
1.34 |
% |
1.52 |
% |
1.70 |
% |
0.67 |
% |
— |
% |
|||||||||||||
|
Cost of borrowing |
3.18 |
% |
2.88 |
% |
2.57 |
% |
1.53 |
% |
0.67 |
% |
|||||||||||||
|
Net expense support |
— |
% |
— |
% |
— |
% |
— |
% |
— |
% |
|||||||||||||
|
Other operating expenses |
1.14 |
% |
1.35 |
% |
1.30 |
% |
1.35 |
% |
1.38 |
% |
|||||||||||||
|
Total operating expenses |
7.56 |
% |
7.56 |
% |
7.39 |
% |
5.33 |
% |
3.64 |
% |
|||||||||||||
|
For the Year Ended December 31, 2020 |
For the Period Ended December 31, 2019* |
For the Period from July 26, 2019 (commencement of operations) to October 31, 2019 |
|||||||||||||
|
Base management fee |
1.60 |
% |
1.56 |
% |
1.61 |
% |
|||||||||
|
Income based incentive fee |
— |
% |
— |
% |
— |
% |
|||||||||
|
Cost of borrowing |
0.48 |
% |
0.65 |
% |
0.89 |
% |
|||||||||
|
Net expense support |
0.02 |
% |
(0.47 |
)% |
1.74 |
% |
|||||||||
|
Other operating expenses |
1.92 |
% |
2.10 |
% |
2.35 |
% |
|||||||||
|
Total operating expenses |
4.02 |
% |
3.83 |
% |
6.59 |
% |
|||||||||
(h) Includes stated dividends and amortization of deferred issuance costs on the MRPS. See Note 7 to the consolidated financial statements for the six months ended June 30, 2025.
Semi Annual Report 2025
152
CION Ares Diversified Credit Fund
Financial Highlights (continued)
(in thousands, except per share data, percentages and as otherwise noted)
|
For the Six Months Ended June 30, 2025 (unaudited) |
For the Year Ended December 31, 2024 |
For the Year Ended December 31, 2023 |
For the Year Ended December 31, 2022 |
For the Year Ended December 31, 2021 |
For the Period from April 13, 2020 (commencement of operations) to December 31, 2020 |
||||||||||||||||||||||
|
Class U-2 |
|||||||||||||||||||||||||||
|
Per share data: |
|||||||||||||||||||||||||||
|
Net asset value, beginning of period |
$ |
25.20 |
$ |
25.05 |
$ |
23.92 |
$ |
25.85 |
$ |
25.17 |
$ |
21.79 |
|||||||||||||||
|
Income from investment operations: |
|||||||||||||||||||||||||||
|
Net investment income(a) |
0.93 |
2.17 |
2.40 |
1.60 |
1.52 |
0.76 |
|||||||||||||||||||||
|
Net realized and unrealized gains (losses) |
(0.01 |
) |
0.11 |
0.62 |
(2.13 |
) |
0.55 |
3.62 |
|||||||||||||||||||
|
Total income (loss) from investment operations |
0.92 |
2.28 |
3.02 |
(0.53 |
) |
2.07 |
4.38 |
||||||||||||||||||||
|
Less distributions declared to shareholders: |
|||||||||||||||||||||||||||
|
From net investment income |
(0.95 |
) |
(2.13 |
) |
(1.89 |
) |
(1.40 |
) |
(1.39 |
) |
(1.00 |
) |
|||||||||||||||
|
Total distributions |
(0.95 |
) |
(2.13 |
) |
(1.89 |
) |
(1.40 |
) |
(1.39 |
) |
(1.00 |
) |
|||||||||||||||
|
Net asset value, end of period |
$ |
25.17 |
$ |
25.20 |
$ |
25.05 |
$ |
23.92 |
$ |
25.85 |
$ |
25.17 |
|||||||||||||||
|
Total return, excluding expense support(b) |
3.75 |
% |
9.45 |
% |
13.08 |
% |
(2.11 |
)% |
8.44 |
% |
19.71 |
% |
|||||||||||||||
|
Total return, including expense support(b) |
3.75 |
% |
9.45 |
% |
13.08 |
% |
(2.11 |
)% |
8.44 |
% |
19.71 |
% |
|||||||||||||||
|
Ratios to average net assets/ supplemental data: |
|||||||||||||||||||||||||||
|
Net assets, end of period |
$ |
144,522 |
$ |
133,700 |
$ |
106,738 |
$ |
84,792 |
$ |
56,851 |
$ |
12,018 |
|||||||||||||||
|
Including interest expense: |
|||||||||||||||||||||||||||
|
Expenses, excluding expense support(d)(g) |
7.55 |
%(h) |
7.56 |
%(h) |
7.40 |
%(h) |
5.39 |
%(h) |
3.74 |
%(h) |
4.10 |
%(e) |
|||||||||||||||
|
Expenses, including expense support(d)(f)(g) |
7.55 |
%(h) |
7.56 |
%(h) |
7.40 |
%(h) |
5.39 |
%(h) |
3.74 |
%(h) |
4.10 |
%(e) |
|||||||||||||||
|
Excluding interest expense: |
|||||||||||||||||||||||||||
|
Expenses, excluding expense support(d)(g) |
4.38 |
% |
4.68 |
% |
4.84 |
% |
3.83 |
% |
3.00 |
% |
3.69 |
%(e) |
|||||||||||||||
|
Expenses, including expense support(d)(f)(g) |
4.38 |
% |
4.68 |
% |
4.84 |
% |
3.83 |
% |
3.00 |
% |
3.69 |
%(e) |
|||||||||||||||
|
Net investment income(d) |
7.52 |
% |
8.63 |
% |
9.84 |
% |
6.48 |
% |
5.98 |
% |
4.48 |
%(e) |
|||||||||||||||
|
Portfolio turnover rate |
14.71 |
%(c) |
46.16 |
% |
30.64 |
% |
38.16 |
% |
43.72 |
% |
59.77 |
%(c) |
|||||||||||||||
(a) Per share net investment income has been calculated using the average shares outstanding during the period.
(b) Based on net asset value per share. Distributions, if any, are assumed for purposes of this calculation to be reinvested at prices obtained under the Fund's DRIP. Total return is not annualized for periods less than one year. Total return excludes or includes, as noted, expense support provided or (recouped) by the Adviser.
(c) Not annualized.
(d) Includes organizational and offering costs, where applicable.
(e) Annualized.
(f) Includes expense support provided or (recouped) by the Adviser.
Semi Annual Report 2025
153
CION Ares Diversified Credit Fund
Financial Highlights (continued)
(in thousands, except per share data, percentages and as otherwise noted)
(g) For the periods presented below, the ratio of operating expenses to average net assets consisted of the following:
|
For the Six Months Ended June 30, 2025 (unaudited) |
For the Year Ended December 31, 2024 |
For the Year Ended December 31, 2023 |
For the Year Ended December 31, 2022 |
For the Year Ended December 31, 2021 |
For the Period from April 13, 2020 (commencement of operations) to December 31, 2020 |
||||||||||||||||||||||
|
Base management fee |
1.90 |
% |
1.81 |
% |
1.82 |
% |
1.78 |
% |
1.62 |
% |
1.54 |
% |
|||||||||||||||
|
Income based incentive fee |
1.33 |
% |
1.52 |
% |
1.70 |
% |
0.71 |
% |
— |
% |
— |
% |
|||||||||||||||
|
Cost of borrowing |
3.17 |
% |
2.88 |
% |
2.56 |
% |
1.56 |
% |
0.74 |
% |
0.39 |
% |
|||||||||||||||
|
Other operating expenses |
1.15 |
% |
1.35 |
% |
1.32 |
% |
1.34 |
% |
1.38 |
% |
2.17 |
% |
|||||||||||||||
|
Total operating expenses |
7.55 |
% |
7.56 |
% |
7.40 |
% |
5.39 |
% |
3.74 |
% |
4.10 |
% |
|||||||||||||||
(h) Includes stated dividends and amortization of deferred issuance costs on the MRPS. See Note 7 to the consolidated financial statements for the six months ended June 30, 2025.
Semi Annual Report 2025
154
CION Ares Diversified Credit Fund
Financial Highlights (continued)
(in thousands, except per share data, percentages and as otherwise noted)
|
For the Six Months Ended June 30, 2025 (unaudited) |
For the Year Ended December 31, 2024 |
For the Year Ended December 31, 2023 |
For the Year Ended December 31, 2022 |
For the Year Ended December 31, 2021 |
|||||||||||||||||||
|
Class W |
|||||||||||||||||||||||
|
Per share data: |
|||||||||||||||||||||||
|
Net asset value, beginning of period |
$ |
25.37 |
$ |
25.23 |
$ |
24.11 |
$ |
26.03 |
$ |
25.27 |
|||||||||||||
|
Income from investment operations: |
|||||||||||||||||||||||
|
Net investment income(a) |
0.97 |
2.25 |
2.47 |
1.62 |
1.58 |
||||||||||||||||||
|
Net realized and unrealized gains (losses) |
(0.01 |
) |
0.10 |
0.61 |
(2.10 |
) |
0.57 |
||||||||||||||||
|
Total income (loss) from investment operations |
0.96 |
2.35 |
3.08 |
(0.48 |
) |
2.15 |
|||||||||||||||||
|
Less distributions declared to shareholders: |
|||||||||||||||||||||||
|
From net investment income |
(1.00 |
) |
(2.21 |
) |
(1.96 |
) |
(1.44 |
) |
(1.39 |
) |
|||||||||||||
|
Total distributions |
(1.00 |
) |
(2.21 |
) |
(1.96 |
) |
(1.44 |
) |
(1.39 |
) |
|||||||||||||
|
Net asset value, end of period |
$ |
25.33 |
$ |
25.37 |
$ |
25.23 |
$ |
24.11 |
$ |
26.03 |
|||||||||||||
|
Total return, excluding expense support(b) |
3.85 |
% |
9.68 |
% |
13.28 |
% |
(1.91 |
)% |
8.73 |
% |
|||||||||||||
|
Total return, including expense support(b) |
3.85 |
% |
9.68 |
% |
13.28 |
% |
(1.91 |
)% |
8.73 |
% |
|||||||||||||
|
Ratios to average net assets/supplemental data: |
|||||||||||||||||||||||
|
Net assets, end of period |
$ |
35,167 |
$ |
35,267 |
$ |
34,213 |
$ |
32,160 |
$ |
38,688 |
|||||||||||||
|
Including interest expense: |
|||||||||||||||||||||||
|
Expenses, excluding expense support(d)(g) |
7.34 |
%(h) |
7.33 |
%(h) |
7.19 |
%(h) |
5.03 |
%(h) |
3.39 |
%(h) |
|||||||||||||
|
Expenses, including expense support(d)(f)(g) |
7.34 |
%(h) |
7.33 |
%(h) |
7.19 |
%(h) |
5.03 |
%(h) |
3.39 |
%(h) |
|||||||||||||
|
Excluding interest expense: |
|||||||||||||||||||||||
|
Expenses, excluding expense support(d)(g) |
4.17 |
% |
4.47 |
% |
4.62 |
% |
3.53 |
% |
2.75 |
% |
|||||||||||||
|
Expenses, including expense support(d)(f)(g) |
4.17 |
% |
4.47 |
% |
4.62 |
% |
3.53 |
% |
2.75 |
% |
|||||||||||||
|
Net investment income(d) |
7.74 |
% |
8.88 |
% |
10.03 |
% |
6.45 |
% |
6.17 |
% |
|||||||||||||
|
Portfolio turnover rate |
14.71 |
%(c) |
46.16 |
% |
30.64 |
% |
38.16 |
% |
43.72 |
% |
|||||||||||||
Semi Annual Report 2025
155
CION Ares Diversified Credit Fund
Financial Highlights (continued)
(in thousands, except per share data, percentages and as otherwise noted)
|
For the Year Ended December 31, 2020 |
For the Period Ended December 31, 2019* |
For the Period from December 21, 2018 (commencement of operations) to October 31, 2019 |
|||||||||||||
|
Class W |
|||||||||||||||
|
Per share data: |
|||||||||||||||
|
Net asset value, beginning of period |
$ |
25.92 |
$ |
25.44 |
$ |
25.03 |
|||||||||
|
Income from investment operations: |
|||||||||||||||
|
Net investment income(a) |
1.50 |
0.25 |
1.23 |
||||||||||||
|
Net realized and unrealized gains (losses) |
(0.75 |
) |
0.46 |
0.38 |
|||||||||||
|
Total income (loss) from investment operations |
0.75 |
0.71 |
1.61 |
||||||||||||
|
Less distributions declared to shareholders: |
|||||||||||||||
|
From net investment income |
(1.40 |
) |
(0.23 |
) |
(1.20 |
) |
|||||||||
|
Total distributions |
(1.40 |
) |
(0.23 |
) |
(1.20 |
) |
|||||||||
|
Net asset value, end of period |
$ |
25.27 |
$ |
25.92 |
$ |
25.44 |
|||||||||
|
Total return, excluding expense support(b) |
3.35 |
% |
2.82 |
% |
7.00 |
% |
|||||||||
|
Total return, including expense support(b) |
3.35 |
% |
2.82 |
% |
6.25 |
% |
|||||||||
|
Ratios to average net assets/supplemental data: |
|||||||||||||||
|
Net assets, end of period |
$ |
39,831 |
$ |
39,449 |
$ |
38,423 |
|||||||||
|
Including interest expense: |
|||||||||||||||
|
Expenses, excluding expense support(d)(g) |
3.65 |
% |
4.28 |
%(e) |
4.73 |
%(e) |
|||||||||
|
Expenses, including expense support(d)(f)(g) |
3.65 |
% |
4.28 |
%(e) |
5.47 |
%(e) |
|||||||||
|
Excluding interest expense: |
|||||||||||||||
|
Expenses, excluding expense support(d)(g) |
3.14 |
% |
3.59 |
%(e) |
3.65 |
%(e) |
|||||||||
|
Expenses, including expense support(d)(f)(g) |
3.14 |
% |
3.59 |
%(e) |
4.39 |
%(e) |
|||||||||
|
Net investment income(d) |
6.23 |
% |
4.97 |
%(e) |
5.14 |
%(e) |
|||||||||
|
Portfolio turnover rate |
59.77 |
% |
5.42 |
%(c) |
63.58 |
%(c) |
|||||||||
* For the two month period ended December 31, 2019. See Note 1 to the consolidated financial statements for the six months ended June 30, 2025.
(a) Per share net investment income has been calculated using the average shares outstanding during the period.
(b) Based on net asset value per share. Distributions, if any, are assumed for purposes of this calculation to be reinvested at prices obtained under the Fund's DRIP. Total return is not annualized for periods less than one year. Total return excludes or includes, as noted, expense support provided or (recouped) by the Adviser.
(c) Not annualized.
(d) Includes organizational and offering costs, where applicable.
(e) Annualized, except for certain non-recurring costs.
(f) Includes expense support provided or (recouped) by the Adviser.
Semi Annual Report 2025
156
CION Ares Diversified Credit Fund
Financial Highlights (continued)
(in thousands, except per share data, percentages and as otherwise noted)
(g) For the periods presented below, the ratio of operating expenses to average net assets consisted of the following:
|
For the Six Months Ended June 30, 2025 (unaudited) |
For the Year Ended December 31, 2024 |
For the Year Ended December 31, 2023 |
For the Year Ended December 31, 2022 |
For the Year Ended December 31, 2021 |
|||||||||||||||||||
|
Base management fee |
1.90 |
% |
1.80 |
% |
1.82 |
% |
1.77 |
% |
1.58 |
% |
|||||||||||||
|
Income based incentive fee |
1.38 |
% |
1.56 |
% |
1.74 |
% |
0.70 |
% |
0.06 |
% |
|||||||||||||
|
Cost of borrowing |
3.17 |
% |
2.86 |
% |
2.57 |
% |
1.50 |
% |
0.64 |
% |
|||||||||||||
|
Net expense support |
— |
% |
— |
% |
— |
% |
— |
% |
— |
% |
|||||||||||||
|
Other operating expenses |
0.89 |
% |
1.11 |
% |
1.06 |
% |
1.06 |
% |
1.11 |
% |
|||||||||||||
|
Total operating expenses |
7.34 |
% |
7.33 |
% |
7.19 |
% |
5.03 |
% |
3.39 |
% |
|||||||||||||
|
For the Year Ended December 31, 2020 |
For the Period Ended December 31, 2019* |
For the Period from December 21, 2018 (commencement of operations) to October 31, 2019 |
|||||||||||||
|
Base management fee |
1.54 |
% |
1.56 |
% |
1.57 |
% |
|||||||||
|
Income based incentive fee |
0.03 |
% |
— |
% |
— |
% |
|||||||||
|
Cost of borrowing |
0.50 |
% |
0.68 |
% |
0.91 |
% |
|||||||||
|
Net expense support |
— |
% |
— |
% |
0.74 |
% |
|||||||||
|
Other operating expenses |
1.58 |
% |
2.03 |
% |
2.24 |
% |
|||||||||
|
Total operating expenses |
3.65 |
% |
4.28 |
% |
5.47 |
% |
|||||||||
(h) Includes stated dividends and amortization of deferred issuance costs on the MRPS. See Note 7 to the consolidated financial statements for the six months ended June 30, 2025.
Semi Annual Report 2025
157
CION Ares Diversified Credit Fund
Financial Highlights (continued)
(in thousands, except per share data, percentages and as otherwise noted)
Information about the Fund's senior securities as of June 30, 2025, December 31, 2024, December 31, 2023, December 31, 2022, December 31, 2021, December 31, 2020, December 31, 2019 and October 31, 2019 is shown in the following table. There were no senior securities outstanding as of October 31, 2018 and October 31, 2017.
|
Total Amount Outstanding Exclusive of Treasury Securities(a) |
Asset Coverage Per Unit(b) |
Involuntary Liquidating Preference Per Unit(c) |
Average Market Value Per Unit(d) |
||||||||||||||||
|
Class and Period Ended |
|||||||||||||||||||
|
State Street Credit Facility |
|||||||||||||||||||
|
June 30, 2025 (unaudited) |
$ |
284,793 |
$ |
5,256 |
— |
N/A |
|||||||||||||
|
December 31, 2024 |
277,014 |
4,579 |
— |
N/A |
|||||||||||||||
|
December 31, 2023 |
246,939 |
6,200 |
— |
N/A |
|||||||||||||||
|
December 31, 2022 |
317,201 |
5,299 |
— |
N/A |
|||||||||||||||
|
December 31, 2021 |
176,803 |
6,461 |
— |
N/A |
|||||||||||||||
|
December 31, 2020 |
111,283 |
6,233 |
— |
N/A |
|||||||||||||||
|
December 31, 2019 |
110,387 |
5,383 |
— |
N/A |
|||||||||||||||
|
October 31, 2019 |
142,357 |
3,847 |
— |
N/A |
|||||||||||||||
|
Wells Credit Facility |
|||||||||||||||||||
|
June 30, 2025 (unaudited) |
$ |
915,896 |
$ |
5,256 |
— |
N/A |
|||||||||||||
|
December 31, 2024 |
845,143 |
4,579 |
— |
N/A |
|||||||||||||||
|
December 31, 2023 |
426,117 |
6,200 |
— |
N/A |
|||||||||||||||
|
December 31, 2022 |
348,844 |
5,299 |
— |
N/A |
|||||||||||||||
|
December 31, 2021 |
225,664 |
6,461 |
— |
N/A |
|||||||||||||||
|
December 31, 2020 |
77,025 |
6,233 |
— |
N/A |
|||||||||||||||
|
December 31, 2019 |
19,054 |
5,383 |
— |
N/A |
|||||||||||||||
|
October 31, 2019 |
19,397 |
3,847 |
— |
N/A |
|||||||||||||||
|
BNP Credit Facility |
|||||||||||||||||||
|
June 30, 2025 (unaudited) |
$ |
190,000 |
$ |
5,256 |
— |
N/A |
|||||||||||||
|
December 31, 2024 |
300,000 |
4,579 |
— |
N/A |
|||||||||||||||
|
Mandatory Redeemable Preferred Shares* |
|||||||||||||||||||
|
June 30, 2025 (unaudited) |
$ |
1,070,000 |
$ |
74.46 |
$ |
25.00 |
N/A |
||||||||||||
|
December 31, 2024 |
770,000 |
74.36 |
25.00 |
N/A |
|||||||||||||||
|
December 31, 2023 |
570,000 |
86.35 |
25.00 |
N/A |
|||||||||||||||
|
December 31, 2022 |
420,000 |
81.52 |
25.00 |
N/A |
|||||||||||||||
|
December 31, 2021 |
300,000 |
93.11 |
25.00 |
N/A |
|||||||||||||||
|
Secured Borrowings |
|||||||||||||||||||
|
June 30, 2025 (unaudited) |
$ |
16,996 |
$ |
5,256 |
— |
N/A |
|||||||||||||
|
December 31, 2024 |
5,315 |
4,579 |
— |
N/A |
|||||||||||||||
|
December 31, 2023 |
6,548 |
6,200 |
— |
N/A |
|||||||||||||||
|
December 31, 2022 |
5,776 |
5,299 |
— |
N/A |
|||||||||||||||
|
December 31, 2021 |
5,776 |
6,461 |
— |
N/A |
|||||||||||||||
|
December 31, 2020 |
650 |
6,233 |
— |
N/A |
|||||||||||||||
|
December 31, 2019 |
314 |
5,383 |
— |
N/A |
|||||||||||||||
|
October 31, 2019 |
349 |
3,847 |
— |
N/A |
|||||||||||||||
Semi Annual Report 2025
158
CION Ares Diversified Credit Fund
Financial Highlights (continued)
(in thousands, except per share data, percentages and as otherwise noted)
* There were no mandatory redeemable preferred shares outstanding as of December 31, 2020, December 31, 2019 and October 31, 2019.
(a) Total amount of each class of senior securities outstanding at principal value at the end of the period presented.
(b) The asset coverage ratio for a class of senior securities representing indebtedness is calculated as the Fund's consolidated total assets, less all liabilities and indebtedness not represented by senior securities, divided by total senior securities representing indebtedness as calculated separately for each of the mandatory redeemable preferred shares and the credit facilities in accordance with Section 18(h) of the Investment Company Act of 1940, as amended. With respect to the mandatory redeemable preferred shares, the asset coverage per unit figure is expressed in terms of dollar amounts per share of outstanding mandatory redeemable preferred shares (based on a per share liquidation preference of $25). With respect to the credit facilities, the asset coverage ratio is multiplied by $1,000 to determine the "Asset Coverage Per Unit".
(c) The amount to which such class of senior security would be entitled upon the Fund's involuntary liquidation in preference to any security junior to it. The "—" in this column indicates that the U.S. Securities and Exchange Commission expressly does not require this information to be disclosed for certain types of senior securities.
(d) Not applicable to senior securities outstanding as of period end.
Semi Annual Report 2025
159
CION Ares Diversified Credit Fund
Notes to Consolidated Financial Statements
June 30, 2025 (Unaudited)
(in thousands, except per share data, percentages and as otherwise noted)
(1) Organization
CION Ares Diversified Credit Fund (the "Fund") is a closed-end, diversified management investment company that is registered under the Investment Company Act of 1940, as amended (together with the rules and regulations promulgated thereunder, the "Investment Company Act"). The Fund operates as an interval fund and continuously offers its shares. The Fund was organized as a Delaware statutory trust on June 21, 2016.
The Fund's investment objective is to provide superior risk-adjusted returns across various market cycles by investing in a diversified portfolio of liquid and illiquid asset classes. The Fund seeks to capitalize on market inefficiencies and relative value opportunities throughout the entire global credit spectrum.
The Fund is externally managed by CION Ares Management, LLC (the "Adviser") pursuant to an investment advisory and management agreement. The Adviser was registered as an investment adviser with the U.S. Securities and Exchange Commission (the "SEC") under the Investment Advisers Act of 1940, as amended (the "Advisers Act"), on January 4, 2017. The Adviser is a joint venture between affiliates of Ares Management Corporation ("Ares Management"), a publicly traded, leading global alternative investment manager, and CION Investment Group, LLC and is controlled by Ares Management. The Adviser oversees the management of the Fund's activities and is responsible for making investment decisions for the Fund's portfolio. Ares Operations LLC, a subsidiary of Ares Management, provides certain administrative and other services necessary for the Fund to operate.
Fiscal Year End Change
On September 25, 2019, the board of trustees (the "Board") approved a change to the fiscal year end of the Fund from October 31 to December 31. Accordingly, the Fund's financial highlights include information as of and for the year ended December 31, 2020, the two month period ended December 31, 2019 and the year ended October 31, 2019.
(2) Significant Accounting Policies
Basis of Presentation
The accompanying consolidated financial statements have been prepared on the accrual basis of accounting in conformity with U.S. generally accepted accounting principles ("GAAP"), and include the accounts of the Fund and its consolidated subsidiaries. The Fund is an investment company following accounting and reporting guidance in Accounting Standards Codification ("ASC") Topic 946, Financial Services — Investment Companies. The consolidated
financial statements reflect all adjustments and reclassifications, that, in the opinion of management, are necessary for the fair presentation of the results of operations and financial condition as of and for the periods presented. All significant intercompany balances and transactions have been eliminated.
Cash and Cash Equivalents
Cash and cash equivalents include funds from time to time deposited with financial institutions and short-term, liquid investments in a money market account. Cash and cash equivalents are carried at cost, which approximates fair value.
Concentration of Credit Risk
The Fund places its cash and cash equivalents with financial institutions and, at times, cash held in depository or money market accounts may exceed the Federal Deposit Insurance Corporation insured limit.
Investment Transactions
Investment transactions are recorded on the trade date. Realized gains or losses are measured by the difference between the net proceeds from the repayment or sale and the amortized cost basis of the investment using the specific identification method without regard to unrealized gains or losses previously recognized, and include investments charged off during the period, net of recoveries. Unrealized gains or losses primarily reflect the change in investment values, including the reversal of previously recorded unrealized gains or losses when gains or losses are realized.
Pursuant to Rule 2a-5 under the Investment Company Act, the Board has designated the Adviser as the Fund's "valuation designee" (the "Valuation Designee") to perform fair value determinations for investments held by the Fund without readily available market quotations subject to the oversight of the Board. All investments are recorded at their fair value.
Investments for which market quotations are readily available are typically valued at such market quotations. In order to validate market quotations, the Valuation Designee looks at a number of factors to determine if the quotations are representative of fair value, including the source and nature of the quotations. Debt and equity securities that are not publicly traded or whose market prices are not readily available are valued at fair value as determined in good faith by the Valuation Designee, subject to the oversight of the Board, in accordance with the Valuation Designee's valuation policy. The Valuation Designee may utilize independent third-party pricing and valuation services to assist in the valuation of each portfolio investment without a readily available market quotation in accordance with the valuation policy and a consistently applied valuation process.
Semi Annual Report 2025
160
CION Ares Diversified Credit Fund
Notes to Consolidated Financial Statements (continued)
June 30, 2025 (Unaudited)
(in thousands, except per share data, percentages and as otherwise noted)
Investments in the Fund's portfolio that do not have a readily available market are valued at fair value as determined in good faith by the Valuation Designee as described herein. As part of the valuation process for investments that do not have readily available market prices, the Valuation Designee may take into account the following types of factors, if relevant, in determining the fair value of the Fund's investments: the enterprise value of a portfolio company (the entire value of the portfolio company to a market participant, including the sum of the values of debt and equity securities used to capitalize the enterprise at a point in time), the nature and realizable value of any collateral, the portfolio company's ability to make payments and its earnings and discounted cash flow, the markets in which the portfolio company does business, a comparison of the portfolio company's securities to any similar publicly traded securities, changes in the interest rate environment and the credit markets, which may affect the price at which similar investments would trade in their principal markets and other relevant factors. When an external event such as a purchase transaction, public offering or subsequent sale occurs, the Valuation Designee considers the pricing indicated by the external event to corroborate its valuation.
Due to the inherent uncertainty of determining the fair value of investments that do not have a readily available market value, the fair value of the Fund's investments may fluctuate from period to period. Additionally, the fair value of the Fund's investments may differ significantly from the values that would have been used had a ready market existed for such investments and may differ materially from the values that the Fund may ultimately realize. Further, such investments are generally subject to legal and other restrictions on resale or otherwise are less liquid than publicly traded securities. If the Fund was required to liquidate a portfolio investment in a forced or liquidation sale, the Fund could realize significantly less than the value at which the Fund has recorded it. In addition, changes in the market environment and other events that may occur over the life of the investments may cause the gains or losses ultimately realized on these investments to be different than the unrealized gains or losses reflected in the valuations currently assigned. See Note 4 for more information on the Fund's valuation process.
Interest Income Recognition
Interest income is recorded on an accrual basis and includes the accretion of discounts, amortization of premiums and payment-in-kind ("PIK") interest. Discounts from and premiums to par value on investments purchased are accreted/amortized into interest income over the life of the respective security using the effective yield method. To the
extent loans contain PIK provisions, PIK interest, computed at the contractual rate specified in each applicable agreement, is accrued and recorded as interest income and added to the principal balance of the loan. PIK interest income added to the principal balance is generally collected upon repayment of the outstanding principal. To maintain the Fund's tax treatment as a regulated investment company ("RIC") under the Internal Revenue Code of 1986, as amended, (the "Code"), this non-cash source of income must be paid out to shareholders in the form of dividends for the year the income was earned, even though the Fund has not yet collected the cash. The amortized cost of investments represents the original cost adjusted for any accretion of discounts, amortization of premiums and PIK interest.
Loans are generally placed on non-accrual status when principal or interest payments are past due 30 days or more or when there is reasonable doubt that principal or interest will be collected in full. Accrued and unpaid interest is generally reversed when a loan is placed on non-accrual status. Interest payments received on non-accrual loans may be recognized as income or applied to principal depending upon the Fund's judgment regarding collectability. Non-accrual loans are restored to accrual status when past due principal and interest are paid or there is no longer any reasonable doubt that such principal or interest will be collected in full and, in the Fund's judgment, are likely to remain current. The Fund may make exceptions to this policy if the loan has sufficient collateral value (i.e., typically measured as enterprise value of the portfolio company) or is in the process of collection.
Equity investments in a collateralized loan obligation ("CLO") recognize investment income by utilizing an effective interest methodology based upon an effective yield to maturity utilizing projected cash flows, as required by ASC 325-40, Beneficial Interest in Securitized Financial Assets.
Dividend Income Recognition
Dividend income on preferred equity is recorded on an accrual basis to the extent that such amounts are payable by the portfolio company and are expected to be collected. Dividend income on common equity securities is recorded on the record date for private portfolio companies or on the ex-dividend date for publicly traded portfolio companies. To the extent preferred equity contains PIK provisions, PIK dividends, computed at the contractual rate specified in each applicable agreement, are accrued and recorded as dividend income and added to the principal balance of the preferred equity. PIK dividends added to the principal balance are generally collected upon redemption of the equity.
Semi Annual Report 2025
161
CION Ares Diversified Credit Fund
Notes to Consolidated Financial Statements (continued)
June 30, 2025 (Unaudited)
(in thousands, except per share data, percentages and as otherwise noted)
Foreign Currency Transactions and Foreign Currency Forward Contracts
The Fund's books and records are maintained in U.S. dollars. Any foreign currency amounts are translated into U.S. dollars on the following basis: (i) fair value of investment securities, other assets and liabilities at the exchange rates prevailing at the end of the period; and (ii) purchases and sales of investment securities, income and expense at the exchange rates prevailing on the respective dates of such transactions, income or expenses.
The Fund does not isolate that portion of the results of operations resulting from the changes in foreign exchange rates on investments from fluctuations arising from changes in market prices of securities held. Such fluctuations are included in "net realized and unrealized gains or losses on investments" in the consolidated statement of operations.
Reported net realized foreign exchange gains or losses arise from sales of foreign currencies, currency gains or losses realized between the trade and settlement dates of securities transactions, and the difference between the amounts of income and expense items recorded on the Fund's books and the U.S. dollar equivalent of the amounts actually received or paid. Net unrealized foreign currency gains and losses arise from the changes in fair values of assets and liabilities, other than investments in securities at period end, resulting from changes in exchange rates.
Investments in foreign companies and securities of foreign governments may involve special risks and considerations not typically associated with investing in U.S. companies and securities of the U.S. government. These risks include, among other things, revaluation of currencies, less reliable information about issuers, different transaction clearance and settlement practices, and potential future adverse political and economic developments. Moreover, investments in foreign companies and securities of foreign governments and their markets may be less liquid and their prices more volatile than those of comparable U.S. companies and the U.S. government.
The Fund may enter into foreign currency forward contracts for operational purposes and to protect against adverse exchange rate fluctuations. A foreign currency forward contract is an agreement between the Fund and a counterparty to buy or sell a foreign currency at a specific exchange rate on a future date. The Fund may also enter into these contracts for purposes of increasing exposure to a foreign currency or to shift exposure to foreign currency fluctuations from one currency to another. The net U.S. dollar value of foreign currency underlying all contractual commitments held by the Fund and the resulting unrealized appreciation or depreciation are determined using foreign currency exchange rates from an independent pricing service. The Fund is subject to the credit
risk that the other party will not complete the obligations of the contract. The fair values of the foreign currency forward contracts are obtained from an independent pricing source.
Derivative Instruments
The Fund values its derivatives at fair value with the unrealized gains or losses recorded in "net realized and unrealized gains or losses on derivative contracts" in the Fund's consolidated statement of operations.
Mandatory Redeemable Preferred Shares
The Fund carries its mandatory redeemable preferred shares ("MRPS") at amortized cost and such shares are included as a liability on the consolidated statement of assets and liabilities. See Note 7 for more information.
Debt and Mandatory Redeemable Preferred Shares Issuance Costs
Debt and MRPS issuance costs are amortized over the life of the relevant senior secured revolving credit facilities and MRPS, using the straight line method.
Secured Borrowings
The Fund follows the guidance in ASC Topic 860, Transfers and Servicing ("ASC 860"), when accounting for participations and other partial loan sales. Certain loan sales do not qualify for sale accounting under ASC 860 because these sales do not meet the definition of a "participating interest," as defined in the guidance, in order for sale treatment to be allowed. Participations or other partial loan sales which do not meet the definition of a participating interest or which are not eligible for sale accounting remain as an investment on the consolidated statement of assets and liabilities as required under GAAP and the proceeds are recorded as a secured borrowing. Secured borrowings are carried at fair value and included in "accrued expenses and other payables" in the accompanying consolidated statement of assets and liabilities.
Income Taxes
The Fund has elected to be treated as a RIC under the Code, and operates in a manner so as to qualify for the tax treatment applicable to RICs. To qualify for tax treatment as a RIC, the Fund must, among other requirements, meet certain source-of-income and asset diversification requirements and timely distribute to its shareholders all or substantially all of its investment company taxable income, as defined by the Code, for each year. The Fund has made and intends to continue to make the requisite distributions to its shareholders, which will generally relieve the Fund from U.S. federal corporate-level income taxes.
Semi Annual Report 2025
162
CION Ares Diversified Credit Fund
Notes to Consolidated Financial Statements (continued)
June 30, 2025 (Unaudited)
(in thousands, except per share data, percentages and as otherwise noted)
Depending on the level of taxable income earned in a tax year, the Fund may choose to carry forward taxable income in excess of current year dividend distributions from such current year taxable income into the next tax year and pay a 4% excise tax on such income, as required. To the extent that the Fund determines that its estimated current year taxable income will be in excess of estimated dividend distributions for the current year from such income, the Fund accrues excise tax, if any, on estimated excess taxable income as such taxable income is earned.
For tax purposes, the distributions to holders of MRPS as described in Note 7 are treated as dividends.
Commitments and Contingencies
In the normal course of business, the Fund's investment activities involve executions, settlement and financing of various transactions resulting in receivables from, and payables to, brokers, dealers and the Fund's custodian. These activities may expose the Fund to risk in the event that such parties are unable to fulfill contractual obligations. Management does not anticipate any material losses from counterparties with whom it conducts business. Consistent with standard business practice, the Fund enters into contracts that contain a variety of indemnifications, and is engaged from time to time in various legal actions. The maximum exposure of the Fund under these arrangements and activities is unknown. However, the Fund expects the risk of material loss to be remote.
Commitments to extend credit include loan proceeds the Fund is obligated to advance, such as delayed draws or revolving credit arrangements. Commitments generally have fixed expiration dates or other termination clauses. Unrealized gains or losses associated with unfunded commitments are recorded in the consolidated financial statements and reflected as an adjustment to the fair value of the related security in the consolidated schedule of investments. The par amount of the unfunded commitments is not recognized by the Fund until it becomes funded.
Distributions to Shareholders
The Fund records distributions from net investment income daily. These distributions may be reinvested or paid monthly to shareholders. The Fund intends to pay common shareholders at least annually all or substantially all of its taxable income. The Fund intends to pay any capital gains distributions at least annually.
The Fund may make distributions, without limitation, from offering proceeds or borrowings, which may constitute a return of capital, as well as net investment income from operations, capital and non-capital gains from the sale of assets, and dividends or distributions from equity investments.
Furthermore, a portion of the Fund's distributions may be derived from expense support payments made by the Adviser, which are subject to repayment by the Fund within three years pursuant to the Expense Support and Conditional Reimbursement Agreement (the "Expense Support Agreement"). The purpose of such expense support payments is to ensure that the Fund bears an appropriate level of expenses. As such, the Fund's distributions may not be entirely based on investment performance and can only be sustained if positive investment performance is achieved in future periods and/or the Adviser continues to make such expense support payments. Any future repayments of expenses by the Fund will reduce cash otherwise potentially available for distributions. There can be no assurance that sufficient performance will be achieved in order to sustain the current level of the Fund's distributions. After the expiration of the current term of the Expense Support Agreement on July 31, 2026, the Adviser has no obligation to make expense support payments in future periods. If the Adviser did not make any expense support payments during such period, all or a portion of the Fund's distributions would have been a return of capital which would reduce the available capital for investment. The sources of the Fund's distributions may vary periodically. Please refer to the Financial Highlights table for the sources of distributions.
Shareholders' Allocations
The Fund currently offers Class A, Class C, Class I, Class L, Class U, Class U-2 and Class W common shares (See Note 5). Realized and unrealized gains and losses and net investment income, excluding class specific expenses, if any, are allocated daily to each class of common shares based upon the relative proportion of net assets of each class. Differences in per share distributions by class are generally due to differences in class specific expenses.
Segment Reporting
In accordance with ASC Topic 280, Segment Reporting ("ASC 280"), the Fund has determined that it has a single operating and reporting segment. As a result, the Fund's segment accounting policies are the same as described herein and the Fund does not have any intra-segment sales and transfers of assets.
Use of Estimates in the Preparation of the Consolidated Financial Statements
The preparation of the consolidated financial statements in conformity with GAAP requires the Adviser to make estimates and assumptions that affect the reported amounts of actual and contingent assets and liabilities at the date of the consolidated financial statements and the reported amounts of income or loss and expenses during the reporting period. Actual results
Semi Annual Report 2025
163
CION Ares Diversified Credit Fund
Notes to Consolidated Financial Statements (continued)
June 30, 2025 (Unaudited)
(in thousands, except per share data, percentages and as otherwise noted)
could differ from those estimates and such differences may be actual and contingent. Significant estimates include the valuation of investments.
Recent Accounting Pronouncements
The Fund considers the applicability and impact of all accounting standard updates ("ASUs") issued by the Financial Accounting Standards Board (the "FASB"). ASUs not listed were assessed by the Fund and either determined to be not applicable or expected to have minimal impact on its consolidated financial statements.
In December 2023, the FASB issued ASU 2023-09, Income Taxes (Topic 740): Improvements to Income Tax Disclosures ("ASU 2023-09"), which intends to improve the transparency of income tax disclosures. ASU 2023-09 is effective for fiscal years beginning after December 15, 2024 and is to be adopted on a prospective basis with the option to apply retrospectively. The Fund is currently assessing the impact of this guidance, however, the Fund does not expect a material impact on its consolidated financial statements.
In November 2024, the FASB issued ASU 2024-03, Income Statement — Reporting Comprehensive Income — Expense Disaggregation Disclosures ("ASU 2024-03"), which requires disaggregated disclosure of certain costs and expenses, including purchases of inventory, employee compensation, depreciation, amortization and depletion, within relevant income statement captions. ASU 2024-03 is effective for fiscal years beginning after December 15, 2026, and interim periods beginning with the first quarter ended March 31, 2028. Early adoption and retrospective application is permitted. The Fund is currently assessing the impact of this guidance, however, the Fund does not expect a material impact on its consolidated financial statements.
(3) Investment Advisory and Other Agreements
The Adviser is registered as an investment adviser under the Advisers Act. The Adviser is an affiliate of Ares Management and leverages Ares Management's entire investment platform and benefits from the significant capital markets, trading and research expertise of all of Ares Management's investment professionals.
Pursuant to the third amended and restated investment advisory agreement, dated as of May 22, 2020 (the "Investment Advisory Agreement"), by and between the Fund and the Adviser, the Adviser provides certain investment advisory and administrative services to the Fund. In consideration of the advisory services provided, the Adviser is entitled to a fee consisting of two components — a base management fee (the "Management Fee") and an incentive fee
(the "Incentive Fee"). Pursuant to the investment sub-advisory agreement, dated as of December 6, 2016 (the "Investment Sub-Advisory Agreement"), by and among the Adviser, Ares Capital Management II LLC (the "Sub-Adviser") and the Fund, the Adviser pays the Sub-Adviser 40% of the Management Fee and Incentive Fee actually received and retained and not otherwise used to support expenses.
Pursuant to the Investment Advisory Agreement, the Fund has agreed to pay the Adviser the Management Fee at an annual rate of 1.25% of the average daily value of the Fund's total assets (including any assets attributable to any preferred shares issued or to indebtedness) minus the Fund's liabilities other than liabilities relating to indebtedness. The Management Fee incurred by the Fund for the six months ended June 30, 2025 was $42,384.
The Incentive Fee is calculated and payable quarterly in arrears based upon each share class's "pre-incentive fee net investment income" for the immediately preceding fiscal quarter, and is subject to a hurdle rate, expressed as a rate of return on each share class's "average daily net asset value," equal to 1.50% per quarter (or an annualized hurdle rate of 6.00%), subject to a "catch-up" feature. For this purpose, "pre-incentive fee net investment income" means interest income, dividend income and any other income accrued during the fiscal quarter, minus each share class's operating expenses for the quarter and the distribution and/or shareholder servicing fees (if any) applicable to each class accrued during the fiscal quarter. For such purposes, each share class's operating expenses will include the Management Fee, expenses reimbursed to the Adviser under the administration agreement, dated as of December 6, 2016 (the "Adviser Administration Agreement"), by and between the Fund and the Adviser, and any interest expense and distributions paid on any issued and outstanding preferred shares, but will exclude the Incentive Fee.
The "catch-up" provision is intended to provide the Adviser with an Incentive Fee of 15% on each share class's pre- incentive fee net investment income when the share class's pre-incentive fee net investment income reaches 1.765% of average daily net asset value in any fiscal quarter. The Incentive Fee incurred by the Fund for all share classes for the six months ended June 30, 2025 was $31,765.
Prior to May 22, 2020, the Incentive Fee was calculated and payable quarterly in arrears based upon the Fund's (rather than each class's) "pre-incentive fee net investment income" for the immediately preceding quarter, and was subject to a hurdle rate, expressed as a rate of return on the Fund's "adjusted capital," equal to 1.50% per quarter (or an annualized hurdle rate of 6.00%), subject to a "catch-up" feature. "Adjusted Capital" previously was defined as the cumulative gross
Semi Annual Report 2025
164
CION Ares Diversified Credit Fund
Notes to Consolidated Financial Statements (continued)
June 30, 2025 (Unaudited)
(in thousands, except per share data, percentages and as otherwise noted)
proceeds received by the Fund from the sale of the Fund's shares (including pursuant to the Fund's DRIP (as defined below)), reduced by amounts paid in connection with purchases of the Fund's shares pursuant to the Fund's share repurchase program and further reduced by distribution representing a return of capital. In calculating any Incentive Fee, "pre-incentive fee net investment income" was previously defined to mean interest income, dividend income and any other income accrued during the calendar quarter, minus the Fund's operating expenses for the quarter.
The Adviser and the Sub-Adviser are obligated to pay expenses associated with providing the investment services stated in the Investment Advisory Agreement and Investment Sub-Advisory Agreement, respectively, including compensation of and office space for their officers and employees connected with investment and economic research, trading and investment management of the Fund.
Under the Expense Support Agreement, the Adviser may at its discretion, through the period ending July 31, 2025, reimburse the Fund's or any class's operating expenses to the extent that it deems appropriate in order to ensure that the Fund or a class bears an appropriate level of expenses (the "Expense Payment"). Prior to July 31, 2019, the Adviser had agreed contractually to reimburse the Fund's initial organizational and offering costs, as well as the Fund's operating expenses, to the extent that aggregate distributions made to the Fund's shareholders during the applicable quarter exceeded the sum of (i) the Fund's net investment Fund taxable income (including net short-term capital gains reduced by net long-term capital losses); (ii) the Fund's net capital gains (including the excess of net long-term capital gains over net short-term capital losses); and (iii) dividends and other distributions paid to or otherwise earned by the Fund on account of investments in portfolio companies (to the extent such amounts listed in clause (iii) are not included under clauses (i) and (ii) above).
In consideration of the Adviser's agreement to reimburse the Fund's operating expenses, the Fund has agreed to repay the Adviser in the amount of any Fund expenses reimbursed subject to the limitation that a reimbursement (an "Adviser Reimbursement") will be made only if and to the extent that (i) it is payable not more than three years from the last business day of the calendar quarter in which the applicable Expense Payment was made by the Adviser; (ii) the Adviser Reimbursement does not cause other fund operating expenses attributable to the applicable class (on an annualized basis and net of any reimbursements received by the Fund with respect to such class during such fiscal year) during the applicable quarter to exceed the percentage of the Fund's average net assets attributable to common shares represented by other
fund operating expenses allocable to the applicable class (as defined below) (on an annualized basis) during the quarter in which the applicable Expense Payment from the Adviser was made; and (iii) the distributions per share declared by the Fund for the applicable class at the time of the applicable Expense Payment are less than the effective rate of distributions per share for the applicable class at the time the Adviser Reimbursement would be paid. Other fund operating expenses is defined as the Fund's total Operating Expenses (as defined below), excluding the Management Fee, the Incentive Fee, offering expenses, financing fees and costs, interest expense and extraordinary expenses. "Operating Expenses" means all operating costs and expenses incurred by the Fund, as determined in accordance with GAAP for investment companies. The Expense Support Agreement was renewed for another year in May 2025 and is set to expire on July 31, 2026, unless renewed by the mutual agreement of the Adviser and the Board. The Expense Support Agreement may be terminated only by the Board on notice to the Adviser. For the six months ended June 30, 2025, the Adviser did not provide any expense support and the Fund did not incur any Adviser Reimbursement.
Pursuant to the Adviser Administration Agreement, the Adviser furnishes the Fund with office equipment and clerical, bookkeeping and record keeping services at the Adviser's office facilities. Under the Adviser Administration Agreement, the Fund is obligated to reimburse the Adviser, at cost, based upon the Fund's allocable portion of the Adviser's overhead and other expenses (including travel expenses) incurred by the Adviser in performing its obligations under the Adviser Administration Agreement, including the Fund's allocable portion of the compensation, rent and other expenses of certain of its officers (including but not limited to the chief compliance officer, chief financial officer, chief accounting officer, general counsel, treasurer and assistant treasurer) and their respective staffs. The Adviser Administration Agreement may be terminated by either party without penalty upon 60 days' written notice to the other party. The total of such expenses incurred for the six months ended June 30, 2025 was $1,797. These expenses were included in "other expenses" in the consolidated statement of operations.
Pursuant to an administration agreement between ALPS Fund Services, Inc. ("ALPS") and the Fund, ALPS performs, or administers the performance of, certain of the Fund's required administrative services, which include, among other things, providing assistance in accounting, legal, tax, compliance and operations, preparing the financial records that the Fund is required to maintain and preparing reports to the Fund's shareholders and reports filed with the SEC. In addition, ALPS coordinates the preparation and filing of the Fund's tax
Semi Annual Report 2025
165
CION Ares Diversified Credit Fund
Notes to Consolidated Financial Statements (continued)
June 30, 2025 (Unaudited)
(in thousands, except per share data, percentages and as otherwise noted)
returns and generally coordinates the payment of the Fund's expenses and the performance of administrative and professional services rendered to the Fund by others. The Fund pays ALPS for these services. The total of such expenses incurred by the Fund for the six months ended June 30, 2025 was $1,860. These expenses were included in "other expenses" in the consolidated statement of operations.
Pursuant to a transfer agent agreement between SS&C GIDS, Inc. ("SS&C GIDS") and the Fund, SS&C GIDS performs transfer agency services for the Fund. SS&C GIDS maintains the shareholder accounting records for the Fund. The Fund pays SS&C GIDS for these services. The total of such expenses incurred for the six months ended June 30, 2025 was $585. These expenses were included in "other expenses" in the consolidated statement of operations.
Shareholder Service Expenses
The Fund has adopted a "Shareholder Services Plan" with respect to its Class A, Class C, Class L and Class U-2 Shares under which the Fund may compensate financial industry professionals for providing ongoing services in respect of clients with whom they have distributed shares of the Fund. Such services may include electronic processing of client orders, electronic fund transfers between clients and the Fund, account reconciliations with the Fund's transfer agent, facilitation of electronic delivery to clients of Fund documentation, monitoring client accounts for back-up withholding and any other special tax reporting obligations, maintenance of books and records with respect to the foregoing, and such other information and liaison services as the Fund or the Adviser may reasonably request. Under the Shareholder Services Plan, the Fund, with respect to Class A, Class C, Class L and Class U-2 Shares, may incur expenses on an annual basis equal to 0.25% of its average net assets attributable to Class A, Class C, Class L and Class U-2 Shares, respectively.
Distribution Plan
The Fund, with respect to its Class C, Class L, Class U, Class W and Class U-2 Shares, is authorized under a "Distribution Plan" to pay to ALPS Distributors, Inc. (the "Distributor") a distribution fee for certain activities relating to the distribution of shares to investors. These activities include marketing and other activities to support the distribution of Class C, Class L, Class U, Class W and Class U-2 shares. The Distribution Plan operates in a manner consistent with Rule 12b-1 under the Investment Company Act, which regulates the manner in which an open-end investment company may directly or indirectly bear the expenses of distributing its shares. Although the Fund is not an
open-end investment company, it has undertaken to comply with the terms of Rule 12b-1 as a condition of an exemptive order under the Investment Company Act which permits it to offer multiple classes of shares. Under the Distribution Plan, the Fund pays the Distributor a distribution fee at an annual rate of 0.75% of average daily net assets attributable to Class C Shares, 0.25% of the average daily net assets attributable to Class L Shares, 0.50% of the average daily net assets attributable to Class W Shares and Class U-2 Shares, and 0.75% of the average daily net assets attributable to Class U Shares. Some or all of such distribution fee may be paid by the Distributor to certain financial intermediaries.
(4) Fair Value of Financial Instruments
The Fund follows ASC 825-10, Recognition and Measurement of Financial Assets and Financial Liabilities ("ASC 825-10"), which provides companies the option to report selected financial assets and liabilities at fair value. ASC 825-10 also establishes presentation and disclosure requirements designed to facilitate comparisons between companies that choose different measurement attributes for similar types of assets and liabilities and to more easily understand the effect of the company's choice to use fair value on its earnings. ASC 825-10 also requires entities to display the fair value of the selected assets and liabilities on the face of the balance sheet. The Fund has not elected the ASC 825-10 option to report selected financial assets and liabilities at fair value. With the exception of the line items entitled "other assets", "mandatory redeemable preferred shares" and "debt," which are reported at amortized cost, the carrying value of all other assets and liabilities approximate fair value.
The Fund also follows ASC 820-10, Fair Value Measurements and Disclosures ("ASC 820-10"), which among other matters, requires enhanced disclosures about investments that are measured and reported at fair value. ASC 820-10 defines fair value, establishes a framework for measuring fair value in accordance with GAAP and expands disclosure of fair value measurements. ASC 820-10 determines fair value to be the price that would be received for an investment in a current sale, which assumes an orderly transaction between market participants on the measurement date. ASC 820-10 requires the Fund to assume that the portfolio investment is sold in its principal market to market participants or, in the absence of a principal market, the most advantageous market, which may be a hypothetical market. Market participants are defined as buyers and sellers in the principal or most advantageous market that are independent, knowledgeable, and willing and able to transact. In accordance with ASC 820-10, the Fund has considered its principal market as the market in which the Fund exits its portfolio investments with the greatest volume
Semi Annual Report 2025
166
CION Ares Diversified Credit Fund
Notes to Consolidated Financial Statements (continued)
June 30, 2025 (Unaudited)
(in thousands, except per share data, percentages and as otherwise noted)
and level of activity. ASC 820-10 specifies a hierarchy of valuation techniques based on whether the inputs to those valuation techniques are observable or unobservable. In accordance with ASC 820-10, these inputs are summarized in the three broad levels listed below:
• Level 1 — Valuations based on quoted prices in active markets for identical assets or liabilities that the Fund has the ability to access.
• Level 2 — Valuations based on quoted prices in markets that are not active or for which all significant inputs are observable, either directly or indirectly.
• Level 3 — Valuations based on inputs that are unobservable and significant to the overall fair value measurement.
In addition to using the above inputs in investment valuations, the Valuation Designee continues to employ its net asset valuation policy and procedures that have been reviewed by the Fund's Board in connection with their designation of the Adviser as the Fund's valuation designee and are consistent with the provisions of Rule 2a-5 under the Investment Company Act and ASC 820-10 (see Note 2 for more information). Consistent with its valuation policy and procedures, the Valuation Designee evaluates the source of inputs, including any markets in which the Fund's investments are trading (or any markets in which securities with similar attributes are trading), in determining fair value. Because there is not a readily available market value for most of the investments in the Fund's portfolio, the fair value of the investments must typically be determined using unobservable inputs.
The assets and liabilities classified as Level 1 or Level 2 are typically valued based on quoted market prices, forward foreign exchange rates, dealer quotations or alternative pricing sources supported by observable inputs. The Valuation Designee obtains prices from independent pricing services which generally utilize broker quotes and may use various other pricing techniques which take into account appropriate factors such as yield, quality, coupon rate, maturity, type of issue, trading characteristics and other data. The Valuation Designee is responsible for all inputs and assumptions related to the pricing of securities. The Valuation Designee has internal controls in place that support its reliance on information received from third-party pricing sources. As part of its internal controls, the Valuation Designee obtains, reviews, and tests information to corroborate prices received from third-party pricing sources. For any security, if market or dealer quotations are not readily available, or if the Valuation Designee determines that a quotation of a security does not represent a fair value, then the security is valued at a fair value
as determined in good faith by the Valuation Designee, subject to the oversight of the Board and will be classified as Level 3. In such instances, the Valuation Designee will use valuation techniques consistent with the market or income approach to measure fair value and will give consideration to all factors which might reasonably affect the fair value.
The Fund's portfolio investments classified as Level 3 (other than as described below in the following paragraph) are typically valued using two different valuation techniques. The first valuation technique is an analysis of the enterprise value ("EV") of the portfolio company. EV means the entire value of the portfolio company to a market participant, including the sum of the values of debt and equity securities used to capitalize the enterprise at a point in time. The primary method for determining EV uses a multiple analysis whereby appropriate multiples are applied to the portfolio company's EBITDA (generally defined as net income before net interest expense, income tax expense, depreciation and amortization). EBITDA multiples are typically determined based upon review of market comparable transactions and publicly traded comparable companies, if any. The Valuation Designee may also employ other valuation multiples to determine EV, such as revenues. The Valuation Designee may also use industry specific valuation analyses to determine EV, such as capitalization rate analysis used in the real estate industry. The second method for determining EV uses a discounted cash flow analysis whereby future expected cash flows of the portfolio company are discounted to determine a present value using estimated discount rates (typically a weighted average cost of capital based on costs of debt and equity consistent with current market conditions). The EV analysis is performed to determine the value of equity investments, the value of debt investments in portfolio companies where the Fund has control or could gain control through an option or warrant security, and to determine if there is credit impairment for debt investments. If debt investments are credit impaired, an EV analysis may be used to value such debt investments; however, in addition to the methods outlined above, other methods such as a liquidation or wind down analysis may be utilized to estimate EV. The second valuation technique is a yield analysis, which is typically performed for non-credit impaired debt investments in portfolio companies where the Fund does not own a controlling equity position. To determine fair value using a yield analysis, a current price is imputed for the investment based upon an assessment of the expected market yield for a similarly structured investment with a similar level of risk. In the yield analysis, the Valuation Designee considers the current contractual interest rate, the maturity and other terms of the investment relative to risk of the company and the specific investment. A key determinant of risk, among other things, is the leverage through the
Semi Annual Report 2025
167
CION Ares Diversified Credit Fund
Notes to Consolidated Financial Statements (continued)
June 30, 2025 (Unaudited)
(in thousands, except per share data, percentages and as otherwise noted)
investment relative to the EV of the portfolio company. As debt investments held by the Fund are substantially illiquid with no active transaction market, the Valuation Designee depends on primary market data, including newly funded transactions, as well as secondary market data with respect to high yield debt instruments and syndicated loans, as inputs in determining the appropriate market yield, as applicable.
The fair value of CLOs is estimated based on various valuation models from third-party pricing services. The provided prices are checked using internally developed models. The valuation models generally utilize discounted cash flows and take into consideration prepayment and loss assumptions, based on historical experience and projected performance, economic factors, the characteristics and condition of the underlying collateral, comparable yields for similar securities and recent trading activity. These securities are classified as Level 3.
Private asset-backed securities classified as Level 3 are typically valued using two different valuation techniques. The first valuation technique is an analysis of the forecasted cash flows of the security. The forecasted cash flows take into consideration prepayment and loss assumptions, based on historical experience and projected performance, economic factors, and the characteristics and condition of the underlying collateral. For equity securities, the projected cash flows are present valued using a market discount rate to determine the fair value. For debt securities, the analysis is used to determine if the borrower has the ability to repay its obligations. If it is determined that the borrower does have the ability to repay its obligations, the second valuation technique that is utilized is a yield analysis. To determine fair value using a yield analysis, a current price is imputed for the investment based upon an assessment of the expected market yield for a similarly structured investment with a similar level of risk. In the yield analysis, the Valuation Designee considers the current contractual interest rate, the maturity and other terms of the investment relative to risk of the borrower and the specific investment. As the debt investments are substantially illiquid with no active transaction market, the Valuation Designee depends on primary market data, including newly funded transactions, as inputs in determining the appropriate market yield, as applicable.
The following table is a summary of the inputs used as of June 30, 2025, in valuing the Fund's investments carried at fair value, derivative assets and derivative liabilities:
|
Level 1 — Quoted Prices ($) |
Level 2 — Other Significant Observable Inputs ($) |
Level 3 — Significant Unobservable Inputs ($) |
Total ($) |
||||||||||||||||
|
Senior loans |
— |
1,485,690 |
3,684,747 |
5,170,437 |
|||||||||||||||
|
Subordinated loans |
— |
14,724 |
220,377 |
235,101 |
|||||||||||||||
|
Corporate bonds |
— |
183,780 |
47,745 |
231,525 |
|||||||||||||||
|
Collateralized loan obligations |
— |
— |
664,492 |
664,492 |
|||||||||||||||
|
Mortgage- backed security |
— |
— |
23,279 |
23,279 |
|||||||||||||||
|
Private asset-backed investments |
— |
— |
174,588 |
174,588 |
|||||||||||||||
|
Preferred stock |
— |
— |
395,773 |
395,773 |
|||||||||||||||
|
Common stock |
— |
25,611 |
167,198 |
192,809 |
|||||||||||||||
|
Warrants |
— |
— |
13,916 |
13,916 |
|||||||||||||||
|
Total investments |
— |
1,709,805 |
5,392,115 |
7,101,920 |
|||||||||||||||
|
Derivative assets: |
|||||||||||||||||||
|
Foreign currency forward contracts |
— |
433 |
— |
433 |
|||||||||||||||
|
Purchased equity options |
57 |
— |
— |
57 |
|||||||||||||||
|
Credit default swaps |
— |
178 |
— |
178 |
|||||||||||||||
|
Interest rate swaps |
— |
10,223 |
— |
10,223 |
|||||||||||||||
|
Derivative liabilities: |
|||||||||||||||||||
|
Foreign currency forward contracts |
— |
(24,323 |
) |
— |
(24,323 |
) |
|||||||||||||
|
Written equity options |
(32 |
) |
— |
— |
(32 |
) |
|||||||||||||
|
Credit default swaps |
— |
(436 |
) |
— |
(436 |
) |
|||||||||||||
Semi Annual Report 2025
168
CION Ares Diversified Credit Fund
Notes to Consolidated Financial Statements (continued)
June 30, 2025 (Unaudited)
(in thousands, except per share data, percentages and as otherwise noted)
The following table summarizes the significant unobservable inputs the Valuation Designee used to value the majority of the Fund's investments categorized within Level 3 as of June 30, 2025. The table is not intended to be all-inclusive, but instead to capture the significant unobservable inputs relevant to the determination of fair values.
|
Asset |
Fair Value |
Primary |
Inputs |
Estimated |
Weighted |
||||||||||||||||||
|
Senior loans |
3,519,033 |
Yield |
Market |
5.4% - |
10.1% |
||||||||||||||||||
|
Senior loans |
111,035 |
EV coverage |
Valuation |
1.0x - |
12.0% |
||||||||||||||||||
|
Senior loans |
54,679 |
Broker |
N/A |
N/A |
N/A |
||||||||||||||||||
|
Subordinated |
220,377 |
Yield |
Market |
6.9% - |
12.5% |
||||||||||||||||||
|
Corporate bonds |
39,910 |
Broker |
N/A |
N/A |
N/A |
||||||||||||||||||
|
Corporate bonds |
7,835 |
Yield |
Market |
— |
8.7% |
||||||||||||||||||
|
Collateralized |
664,492 |
Broker |
N/A |
N/A |
N/A |
||||||||||||||||||
|
Mortgage-backed |
23,279 |
Broker |
N/A |
N/A |
N/A |
||||||||||||||||||
|
Private |
174,588 |
Income |
Market |
6.8% - |
7.9% |
||||||||||||||||||
|
Preferred stock |
336,010 |
Yield |
Market |
7.0% - |
14.2% |
||||||||||||||||||
|
Preferred stock |
59,763 |
EV market |
Valuation |
1.0x - |
15.9x |
||||||||||||||||||
|
Asset |
Fair Value |
Primary |
Inputs |
Estimated |
Weighted |
||||||||||||||||||
|
Common stock |
157,636 |
EV market |
Valuation |
1.0x - |
15.7x |
||||||||||||||||||
|
Common stock |
5,055 |
DCF |
Discount |
14.5% - |
14.8% |
||||||||||||||||||
|
Common stock |
4,507 |
Yield |
Market |
9.8% |
9.8% |
||||||||||||||||||
|
Warrants |
13,916 |
EV market |
Valuation |
2.4x - |
7.8x |
||||||||||||||||||
|
Total Level 3 |
5,392,115 |
||||||||||||||||||||||
(a) Unobservable inputs were weighted by the relative fair value of investments.
Changes in market yields, discount rates or EBITDA multiples, each in isolation, may change the fair value of certain of the Fund's investments. Generally, an increase in market yields or discount rates or decrease in EBITDA multiples may result in a decrease in the fair value of certain of the Fund's investments.
Due to the inherent uncertainty of determining the fair value of investments that do not have a readily available market value, the fair value of the Fund's investments may fluctuate from period to period. Additionally, the fair value of the Fund's investments may differ significantly from the values that would have been used had a ready market existed for such investments and may differ materially from the values that the Fund may ultimately realize. Further, such investments are generally subject to legal and other restrictions on resale or otherwise are less liquid than publicly traded securities. If the Fund was required to liquidate a portfolio investment in a forced or liquidation sale, it could realize significantly less than the value at which the Fund has recorded it.
In addition, changes in the market environment and other events that may occur over the life of the investments may cause the gains or losses ultimately realized on these investments to be different than the unrealized gains or losses reflected in the valuations currently assigned.
The following table is a reconciliation of the Fund's investments in which significant unobservable inputs (Level 3) were used in determining fair value for the six months ended June 30, 2025:
|
Senior Loans ($) |
Subordinated Loans ($) |
Corporate Bonds ($) |
Collateralized Loan Obligations ($) |
Mortgage- Backed Security ($) |
Private Asset- Backed Investments ($) |
Preferred Stock ($) |
Common Stock ($) |
Warrants ($) |
Total ($) |
||||||||||||||||||||||||||||||||||
|
Balance as of December 31, 2024 |
3,093,042 |
178,228 |
55,816 |
564,213 |
— |
181,652 |
328,779 |
147,541 |
6,366 |
4,555,637 |
|||||||||||||||||||||||||||||||||
|
Purchases |
1,006,788 |
39,147 |
426 |
173,409 |
23,821 |
80,288 |
63,817 |
20,204 |
1,662 |
1,409,562 |
|||||||||||||||||||||||||||||||||
Semi Annual Report 2025
169
CION Ares Diversified Credit Fund
Notes to Consolidated Financial Statements (continued)
June 30, 2025 (Unaudited)
(in thousands, except per share data, percentages and as otherwise noted)
|
Senior Loans ($) |
Subordinated Loans ($) |
Corporate Bonds ($) |
Collateralized Loan Obligations ($) |
Mortgage- Backed Security ($) |
Private Asset- Backed Investments ($) |
Preferred Stock ($) |
Common Stock ($) |
Warrants ($) |
Total ($) |
||||||||||||||||||||||||||||||||||
|
Sales and principal redemptions |
(444,544 |
) |
(3,965 |
) |
(9,858 |
) |
(64,991 |
) |
(713 |
) |
(91,325 |
) |
(300 |
) |
(3,619 |
) |
— |
(619,315 |
) |
||||||||||||||||||||||||
|
Net realized and unrealized gains (losses) |
76,065 |
6,340 |
1,341 |
(8,117 |
) |
171 |
3,816 |
3,477 |
3,682 |
5,888 |
92,663 |
||||||||||||||||||||||||||||||||
|
Accrued discounts (premiums) |
4,812 |
627 |
20 |
(22 |
) |
— |
157 |
— |
— |
— |
5,594 |
||||||||||||||||||||||||||||||||
|
Transfers in to Level 3 |
— |
— |
— |
— |
— |
— |
— |
— |
— |
— |
|||||||||||||||||||||||||||||||||
|
Transfers out of Level 3(a) |
(51,416 |
) |
— |
— |
— |
— |
— |
— |
(610 |
) |
— |
(52,026 |
) |
||||||||||||||||||||||||||||||
|
Balance as of June 30, 2025 |
3,684,747 |
220,377 |
47,745 |
664,492 |
23,279 |
174,588 |
395,773 |
167,198 |
13,916 |
5,392,115 |
|||||||||||||||||||||||||||||||||
|
Net change in unrealized gains (losses) from investments held at June 30, 2025 |
78,847 |
6,321 |
1,399 |
(6,557 |
) |
171 |
5,380 |
3,538 |
3,444 |
5,888 |
98,431 |
||||||||||||||||||||||||||||||||
(a) Investments were transferred out of Level 3 during the six months ended June 30, 2025. Transfers out of Level 3 were generally as a result of changes in the observability of significant inputs or available market data for certain portfolio companies.
The following are the carrying values and fair values of the Fund's senior secured revolving credit facilities and MRPS as of June 30, 2025.
|
Carrying Value ($) |
Fair Value(b) ($) |
||||||||||
|
State Street Credit Facility(a) |
284,793 |
284,793 |
|||||||||
|
Wells Credit Facility(a) |
915,896 |
915,896 |
|||||||||
|
BNP Credit Facility(a) |
190,000 |
190,000 |
|||||||||
|
Series A MRPS |
59,857 |
60,000 |
|||||||||
|
Series B MRPS |
89,752 |
90,000 |
|||||||||
|
Series C MRPS |
149,233 |
150,000 |
|||||||||
|
Series D MRPS |
54,772 |
55,000 |
|||||||||
|
Series E MRPS |
64,423 |
65,000 |
|||||||||
|
Series F MRPS |
84,715 |
85,000 |
|||||||||
|
Series G MRPS |
64,584 |
65,000 |
|||||||||
|
Series H MRPS |
99,247 |
100,000 |
|||||||||
|
Series I MRPS |
49,538 |
50,000 |
|||||||||
|
Series J MRPS |
49,536 |
50,000 |
|||||||||
|
Series K MRPS |
148,768 |
150,000 |
|||||||||
|
Series L MRPS |
148,686 |
150,000 |
|||||||||
|
2,453,800 |
2,460,689 |
||||||||||
(a) The State Street Credit Facility, the Wells Credit Facility and the BNP Credit Facility (each as defined below) carrying values are the same as the principal amounts outstanding.
(b) The fair value of these debt obligations would be categorized as level 2 under ASC 820-10.
(5) Common Stock
The Fund began continuously offering its shares on January 3, 2017. The Fund, pursuant to an exemptive order granted by the SEC on July 11, 2017, offers multiple classes of shares. As of July 11, 2017, the Fund simultaneously redesignated its issued and outstanding shares as Class A shares and created its Class C, Class I and Class L shares. As of December 4, 2018, the Fund created its Class U and Class W shares. As of March 31, 2020, the Fund created its Class U-2 shares. The maximum sales load imposed on purchases, maximum contingent deferred sales charges, shareholder servicing and/or distribution fees charged will vary depending on each share class.
Common share transactions were as follows:
|
Class A |
For the Six Months Ended June 30, 2025 |
||||||||||
|
Shares |
Amount ($) |
||||||||||
|
Common shares outstanding — beginning of period |
3,588 |
90,451 |
|||||||||
|
Common shares issued |
509 |
12,744 |
|||||||||
|
Share transfers between classes |
(554 |
) |
(13,872 |
) |
|||||||
|
Reinvestment of distributions |
22 |
545 |
|||||||||
|
Common shares repurchased |
(271 |
) |
(6,704 |
) |
|||||||
|
Common shares outstanding — end of period |
3,294 |
83,164 |
|||||||||
Semi Annual Report 2025
170
CION Ares Diversified Credit Fund
Notes to Consolidated Financial Statements (continued)
June 30, 2025 (Unaudited)
(in thousands, except per share data, percentages and as otherwise noted)
|
Class C |
For the Six Months Ended June 30, 2025 |
||||||||||
|
Shares |
Amount ($) |
||||||||||
|
Common shares outstanding — beginning of period |
2,939 |
75,107 |
|||||||||
|
Common shares issued |
90 |
2,221 |
|||||||||
|
Share transfers between classes |
(151 |
) |
(3,756 |
) |
|||||||
|
Reinvestment of distributions |
46 |
1,149 |
|||||||||
|
Common shares repurchased |
(150 |
) |
(3,694 |
) |
|||||||
|
Common shares outstanding — end of period |
2,774 |
71,027 |
|||||||||
|
Class I |
For the Six Months Ended June 30, 2025 |
||||||||||
|
Shares |
Amount ($) |
||||||||||
|
Common shares outstanding — beginning of period |
133,237 |
3,373,969 |
|||||||||
|
Common shares issued |
23,917 |
601,774 |
|||||||||
|
Share transfers between classes |
898 |
22,683 |
|||||||||
|
Reinvestment of distributions |
1,109 |
27,957 |
|||||||||
|
Common shares repurchased |
(7,231 |
) |
(180,887 |
) |
|||||||
|
Common shares outstanding — end of period |
151,930 |
3,845,496 |
|||||||||
|
Class L |
For the Six Months Ended June 30, 2025 |
||||||||||
|
Shares |
Amount ($) |
||||||||||
|
Common shares outstanding — beginning of period |
498 |
12,639 |
|||||||||
|
Common shares issued |
33 |
838 |
|||||||||
|
Reinvestment of distributions |
14 |
349 |
|||||||||
|
Common shares repurchased |
(28 |
) |
(709 |
) |
|||||||
|
Common shares outstanding — end of period |
517 |
13,117 |
|||||||||
|
Class U |
For the Six Months Ended June 30, 2025 |
||||||||||
|
Shares |
Amount ($) |
||||||||||
|
Common shares outstanding — beginning of period |
24,360 |
610,369 |
|||||||||
|
Common shares issued |
2,106 |
52,832 |
|||||||||
|
Share transfers between classes |
(199 |
) |
(4,992 |
) |
|||||||
|
Reinvestment of distributions |
689 |
17,293 |
|||||||||
|
Common shares repurchased |
(543 |
) |
(13,531 |
) |
|||||||
|
Common shares outstanding — end of period |
26,413 |
661,971 |
|||||||||
|
Class U-2 |
For the Six Months Ended June 30, 2025 |
||||||||||
|
Shares |
Amount ($) |
||||||||||
|
Common shares outstanding — beginning of period |
5,305 |
133,468 |
|||||||||
|
Common shares issued |
689 |
17,276 |
|||||||||
|
Share transfers between classes |
(3 |
) |
(63 |
) |
|||||||
|
Reinvestment of distributions |
150 |
3,750 |
|||||||||
|
Common shares repurchased |
(399 |
) |
(9,869 |
) |
|||||||
|
Common shares outstanding — end of period |
5,742 |
144,562 |
|||||||||
|
Class W |
For the Six Months Ended June 30, 2025 |
||||||||||
|
Shares |
Amount ($) |
||||||||||
|
Common shares outstanding — beginning of period |
1,390 |
35,699 |
|||||||||
|
Reinvestment of distributions |
36 |
918 |
|||||||||
|
Common shares repurchased |
(38 |
) |
(956 |
) |
|||||||
|
Common shares outstanding — end of period |
1,388 |
35,661 |
|||||||||
Repurchase Program
Beginning in the second quarter of 2017, the Fund began offering, and currently intends to continue offering, the quarterly repurchase of shares in such amount as may be determined by the Board in accordance with the Fund's fundamental policy to conduct repurchase offers for between 5%-25% of its outstanding shares each quarter.
The following table summarizes the share repurchases completed during the six months ended June 30, 2025:
|
Three Months Ended |
Repurchase Date |
Shares Repurchased |
Purchase Price Per Share |
Aggregate Consideration for Repurchased Shares |
Size of Repurchase Offer |
% of Outstanding Shares Offered to be Repurchased |
% of Outstanding Shares Repurchased |
||||||||||||||||||||||||
|
December 31, 2024 |
January 11, 2025 |
3,596 |
$ |
25.31 |
$ |
91,021 |
8,595 |
5.00 |
% |
2.09 |
% |
||||||||||||||||||||
|
March 31, 2025 |
April 10, 2025 |
5,064 |
24.75 |
125,329 |
9,208 |
5.00 |
% |
2.75 |
% |
||||||||||||||||||||||
|
Total |
8,660 |
$ |
216,350 |
||||||||||||||||||||||||||||
Semi Annual Report 2025
171
CION Ares Diversified Credit Fund
Notes to Consolidated Financial Statements (continued)
June 30, 2025 (Unaudited)
(in thousands, except per share data, percentages and as otherwise noted)
(6) Debt
In accordance with the Investment Company Act, the Fund is allowed to borrow amounts with respect to senior securities representing indebtedness (such as the senior secured revolving credit facilities), such that its asset coverage, calculated pursuant to the Investment Company Act, is at least 300% after such borrowing.
State Street Credit Facility
The Fund is a party to a senior secured revolving credit facility (as amended, the "State Street Credit Facility"), that allows the Fund to borrow up to $300,000 at any one time outstanding. The State Street Credit Facility's stated maturity date is July 31, 2026. Under the State Street Credit Facility, the Fund is required to comply with various covenants, reporting requirements and other customary requirements for similar revolving credit facilities (which are subject to certain limitations and exceptions), including, without limitation, covenants related to: (a) limitations on the incurrence of additional indebtedness, including additional MRPS, and liens, (b) limitations on certain restricted payments, (c) maintaining a ratio of total assets (less total liabilities other than senior securities representing indebtedness) to senior securities representing indebtedness plus the involuntary liquidation preference of the MRPS of the Fund and its consolidated subsidiaries (subject to certain exceptions) of not less than 2:1 and (d) maintaining a ratio of total assets (less total liabilities other than senior securities representing indebtedness) of the Fund to outstanding and requested loans of not less than 3:1. As of June 30, 2025, the Fund was in compliance with the terms of the State Street Credit Facility.
As of June 30, 2025, there was $284,793 outstanding under the State Street Credit Facility. Since July 31, 2024, the interest rate charged on the State Street Credit Facility is based on an applicable Secured Overnight Financing Rate ("SOFR") plus an applicable spread of 1.25%. Prior to July 31, 2024, the interest rate charged on the State Street Credit Facility was based on an applicable SOFR plus a credit spread adjustment of 0.10% and an applicable spread of 1.00%. In addition to the stated interest expense on the State Street Credit Facility, the Fund is required to pay a commitment fee of 0.25% per annum on any unused portion of the State Street Credit Facility.
For the six months ended June 30, 2025, the components of interest and unused commitment fee expense, average stated interest rates (i.e., rate in effect plus the spread) and average
outstanding balances for the State Street Credit Facility were as follows:
|
For the Six Months Ended June 30, 2025 ($) |
|||||||
|
Stated interest expense |
7,116 |
||||||
|
Unused commitment fee |
49 |
||||||
|
Amortization of debt issuance costs |
205 |
||||||
|
Total interest and credit facility fees expense |
7,370 |
||||||
|
Cash paid for interest expense |
7,257 |
||||||
|
Average stated interest rate |
5.37 |
% |
|||||
|
Average outstanding balance |
267,319 |
||||||
Wells Credit Facility
The Fund and one of the Fund's consolidated subsidiaries, CADEX Credit Financing, LLC (the "Financing Sub 1"), are party to a revolving funding facility (as amended, the "Wells Credit Facility"), that allows the Financing Sub 1 to borrow up to $1,400,000 at any one time outstanding. The Wells Credit Facility is secured by all of the assets held by, and the membership interest in, the Financing Sub 1. The end of the reinvestment period and the stated maturity date for the Wells Credit Facility are May 30, 2028 and May 30, 2030, respectively.
Amounts available to borrow under the Wells Credit Facility are subject to a borrowing base that applies different advance rates to different types of assets held by the Financing Sub 1. The Financing Sub 1 is also subject to limitations with respect to the loans securing the Wells Credit Facility, including restrictions on loan size, borrower domicile, payment frequency and status, collateral interests, and loans with fixed rates, as well as restrictions on portfolio company leverage, which may also affect the borrowing base and therefore amounts available to borrow. The Fund and the Financing Sub 1 are also required to comply with various covenants, reporting requirements and other customary requirements for similar facilities. These covenants are subject to important limitations and exceptions that are described in the documents governing the Wells Credit Facility. As of June 30, 2025, the Fund and the Financing Sub 1 were in compliance with the terms of the Wells Credit Facility.
As of June 30, 2025, there was $915,896 outstanding under the Wells Credit Facility. Since May 30, 2025, the interest rate charged on the Wells Credit Facility is based on an applicable SOFR plus an applicable spread of 1.90%. Prior to May 30, 2025, the interest rate charged on the Wells Credit Facility was based on an applicable SOFR plus an applicable spread of
Semi Annual Report 2025
172
CION Ares Diversified Credit Fund
Notes to Consolidated Financial Statements (continued)
June 30, 2025 (Unaudited)
(in thousands, except per share data, percentages and as otherwise noted)
2.15%. In addition to the stated interest expense on the Wells Credit Facility, the Financing Sub 1 is also required to pay a commitment fee of between 0.50% and 1.80% per annum depending on the size of the unused portion of the Wells Credit Facility.
For the six months ended June 30, 2025, the components of interest and unused commitment fee expense, average stated interest rates (i.e., rate in effect plus the spread) and average outstanding balances for the Wells Credit Facility were as follows:
|
For the Six Months Ended June 30, 2025 ($) |
|||||||
|
Stated interest expense |
27,600 |
||||||
|
Unused commitment fee |
1,316 |
||||||
|
Amortization of debt issuance costs |
1,366 |
||||||
|
Total interest and credit facility fees expense |
30,282 |
||||||
|
Cash paid for interest expense |
29,510 |
||||||
|
Average stated interest rate |
6.57 |
% |
|||||
|
Average outstanding balance |
847,561 |
||||||
BNP Credit Facility
The Fund and one of the Fund's consolidated subsidiaries, CADEX Liquid Financing LLC (the "Financing Sub 2"), are party to a revolving credit facility (the "BNP Credit Facility"), that allows the Financing Sub 2 to borrow up to $400,000 at any one time outstanding. The obligations of Financing Sub 2 under the BNP Credit Facility are secured by all of the assets held by Financing Sub 2, including certain loans to be contributed by the Fund to Financing Sub 2 from time to time. The end of the reinvestment period and the stated maturity date for the BNP Credit Facility are July 31, 2027 and July 31, 2028, respectively. Subject to certain conditions, during the reinvestment period, Financing Sub 2 may propose one or more increases in the maximum facility amount in increments of $50,000. Under the terms of the BNP Credit Facility, the
Fund and Financing Sub 2, as applicable, have made certain representations and warranties regarding the loans, as well as their businesses, and are required to comply with various covenants, servicing procedures, limitations on the disposition of loans, reporting requirements and other customary requirements for similar revolving funding facilities. The BNP Credit Facility includes usual and customary events of default for revolving funding facilities of this nature. As of June 30, 2025, the Fund and the Financing Sub 2 were in compliance with the terms of the BNP Credit Facility.
As of June 30, 2025, there was $190,000 outstanding under the BNP Credit Facility. The interest rate charged on the BNP Credit Facility is based on an applicable SOFR (as defined in the documents governing the BNP Credit Facility) plus a margin of (i) 1.60% during the reinvestment period and (ii) 2.60% following the reinvestment period. In addition to the stated interest expense on the BNP Credit Facility, the Financing Sub 2 is also required to pay a commitment fee of between 0.35% and 0.70% per annum depending on the size of the unused portion of the BNP Credit Facility.
For the six months ended June 30, 2025, the components of interest and unused commitment fee expense, average stated interest rates (i.e., rate in effect plus the spread) and average outstanding balances for the BNP Credit Facility were as follows:
|
For the Six Months Ended June 30, 2025 ($) |
|||||||
|
Stated interest expense |
7,557 |
||||||
|
Unused commitment fee |
112 |
||||||
|
Amortization of debt issuance costs |
439 |
||||||
|
Total interest and credit facility fees expense |
8,108 |
||||||
|
Cash paid for interest expense |
8,671 |
||||||
|
Average stated interest rate |
6.01 |
% |
|||||
|
Average outstanding balance |
253,481 |
||||||
(7) Mandatory Redeemable Preferred Shares
The Fund has authorized and issued certain MRPS (each issuance of which is referred to herein using the defined term set forth under the "MRPS" column of the table below and collectively referred to as the MRPS. Certain key terms related to the features for the MRPS as of June 30, 2025 are listed below.
|
MRPS |
Shares Authorized and Issued |
Gross Proceeds |
Redemption Date |
Liquidation Preference |
Dividend Rate per annum(1) |
||||||||||||||||||
|
Series A MRPS |
2,400 |
$ |
60,000 |
July 30, 2026 |
$ |
25.00 |
2.68 |
% |
|||||||||||||||
|
Series B MRPS |
3,600 |
90,000 |
September 30, 2026 |
25.00 |
2.68 |
% |
|||||||||||||||||
|
Series C MRPS |
6,000 |
150,000 |
September 30, 2028 |
25.00 |
3.07 |
% |
|||||||||||||||||
|
Series D MRPS |
2,200 |
55,000 |
January 6, 2027 |
25.00 |
2.96 |
% |
|||||||||||||||||
Semi Annual Report 2025
173
CION Ares Diversified Credit Fund
Notes to Consolidated Financial Statements (continued)
June 30, 2025 (Unaudited)
(in thousands, except per share data, percentages and as otherwise noted)
|
MRPS |
Shares Authorized and Issued |
Gross Proceeds |
Redemption Date |
Liquidation Preference |
Dividend Rate per annum(1) |
||||||||||||||||||
|
Series E MRPS |
2,600 |
$ |
65,000 |
January 6, 2032 |
$ |
25.00 |
3.48 |
% |
|||||||||||||||
|
Series F MRPS |
3,400 |
85,000 |
June 1, 2026 |
25.00 |
7.16 |
% |
|||||||||||||||||
|
Series G MRPS |
2,600 |
65,000 |
June 1, 2028 |
25.00 |
7.23 |
% |
|||||||||||||||||
|
Series H MRPS(2) |
4,000 |
100,000 |
June 7, 2027 |
25.00 |
6.25 |
% |
|||||||||||||||||
|
Series I MRPS(2) |
2,000 |
50,000 |
June 7, 2029 |
25.00 |
6.35 |
% |
|||||||||||||||||
|
Series J MRPS(2) |
2,000 |
50,000 |
July 3, 2029 |
25.00 |
6.35 |
% |
|||||||||||||||||
|
Series K MRPS(2) |
6,000 |
150,000 |
January 15, 2030 |
25.00 |
5.94 |
% |
|||||||||||||||||
|
Series L MRPS(2) |
6,000 |
150,000 |
April 14, 2032 |
25.00 |
6.07 |
% |
|||||||||||||||||
|
Total redeemable amount |
$ |
1,070,000 |
|||||||||||||||||||||
(1) Payable quarterly. The weighted average dividend rate for the MRPS is 5.04% per annum.
(2) In connection with the issuance of the Series H MRPS, the Series I MRPS, the Series J MRPS, the Series K MRPS and the Series L MRPS, the Fund entered into interest rate swaps to more closely align the interest rate of such liabilities with the Fund's investment portfolio, which consists primarily of floating rate loans. See Note 9 for more information on the Fund's interest rate swaps.
The MRPS are subject to optional and mandatory redemption in certain circumstances. The MRPS will be subject to redemption, at the option of the Fund, in whole or in part at any time only for the purposes of decreasing leverage of the Fund. The Fund may be obligated to redeem certain of the MRPS if the Fund fails to maintain an asset coverage ratio, calculated in accordance with the Investment Company Act, greater than or equal to 225%. Holders of the MRPS are entitled to receive quarterly cumulative cash dividend payments on the first business day following each quarterly dividend date.
The redemption price per share is equal to the sum of the liquidation preference per share plus any accumulated but
unpaid dividends plus, in some cases, an early redemption premium, which may vary based on the date of redemption. The Fund is subject to certain restrictions relating to the MRPS such as maintaining certain asset coverage ratio requirements. Failure to comply with these restrictions could preclude the Fund from declaring any dividends to common shareholders and could trigger the mandatory redemption of the MRPS. Additionally, in accordance with the Investment Company Act, the Fund may not issue additional MRPS if immediately after such issuance the Fund will not have an asset coverage of at least 200%. As of June 30, 2025, the Fund was in compliance with the terms applicable to the MRPS.
The Fund's MRPS activity for the six months ended June 30, 2025 was as follows:
|
|
Series A MRPS |
Series B MRPS |
Series C MRPS |
Series D MRPS |
Series E MRPS |
Series F MRPS |
Series G MRPS |
Series H MRPS |
Series I MRPS |
Series J MRPS |
Series K MRPS |
Series L MRPS |
|||||||||||||||||||||||||||||||||||||||
|
Shares outstanding — beginning of period |
2,400 |
3,600 |
6,000 |
2,200 |
2,600 |
3,400 |
2,600 |
4,000 |
2,000 |
2,000 |
— |
— |
|||||||||||||||||||||||||||||||||||||||
|
Shares issued |
— |
— |
— |
— |
— |
— |
— |
— |
— |
— |
6,000 |
6,000 |
|||||||||||||||||||||||||||||||||||||||
|
Shares outstanding — end of period |
2,400 |
3,600 |
6,000 |
2,200 |
2,600 |
3,400 |
2,600 |
4,000 |
2,000 |
2,000 |
6,000 |
6,000 |
|||||||||||||||||||||||||||||||||||||||
The Fund's MRPS balance as of June 30, 2025 were as follows:
|
|
Series A MRPS ($) |
Series B MRPS ($) |
Series C MRPS ($) |
Series D MRPS ($) |
Series E MRPS ($) |
Series F MRPS ($) |
Series G MRPS ($) |
Series H MRPS ($) |
Series I MRPS ($) |
Series J MRPS ($) |
Series K MRPS ($) |
Series L MRPS ($) |
Total ($) |
||||||||||||||||||||||||||||||||||||||||||
|
Principal amount |
60,000 |
90,000 |
150,000 |
55,000 |
65,000 |
85,000 |
65,000 |
100,000 |
50,000 |
50,000 |
150,000 |
150,000 |
1,070,000 |
||||||||||||||||||||||||||||||||||||||||||
|
Unamortized issuance cost |
(143 |
) |
(248 |
) |
(767 |
) |
(228 |
) |
(577 |
) |
(285 |
) |
(416 |
) |
(753 |
) |
(462 |
) |
(464 |
) |
(1,232 |
) |
(1,314 |
) |
(6,889 |
) |
|||||||||||||||||||||||||||||
|
Carrying value |
59,857 |
89,752 |
149,233 |
54,772 |
64,423 |
84,715 |
64,584 |
99,247 |
49,538 |
49,536 |
148,768 |
148,686 |
1,063,111 |
||||||||||||||||||||||||||||||||||||||||||
Semi Annual Report 2025
174
CION Ares Diversified Credit Fund
Notes to Consolidated Financial Statements (continued)
June 30, 2025 (Unaudited)
(in thousands, except per share data, percentages and as otherwise noted)
Dividends on the MRPS are accrued on a daily basis and included in interest and credit facility fee expense on the consolidated statement of operations and in interest and facility fees payable on the consolidated statement of assets and liabilities. The table below summarizes the components of interest expense, the effective dividend rates and cash paid for dividends on the Fund's MRPS for the six months ended June 30, 2025:
|
|
Series A MRPS ($) |
Series B MRPS ($) |
Series C MRPS ($) |
Series D MRPS ($) |
Series E MRPS ($) |
Series F MRPS ($) |
Series G MRPS ($) |
Series H MRPS ($) |
Series I MRPS ($) |
Series J MRPS ($) |
Series K MRPS ($) |
Series L MRPS ($) |
Total ($) |
||||||||||||||||||||||||||||||||||||||||||
|
Stated dividends |
802 |
1,204 |
2,299 |
812 |
1,129 |
3,037 |
2,346 |
3,119 |
1,585 |
1,585 |
4,101 |
1,943 |
23,962 |
||||||||||||||||||||||||||||||||||||||||||
|
Amortization of deferred issuance costs |
65 |
98 |
117 |
74 |
44 |
154 |
71 |
193 |
58 |
57 |
124 |
41 |
1,096 |
||||||||||||||||||||||||||||||||||||||||||
|
Total interest expense |
867 |
1,302 |
2,416 |
886 |
1,173 |
3,191 |
2,417 |
3,312 |
1,643 |
1,642 |
4,225 |
1,984 |
25,058 |
||||||||||||||||||||||||||||||||||||||||||
|
Weighted average stated dividend rate |
2.68 |
% |
2.68 |
% |
3.07 |
% |
2.96 |
% |
3.48 |
% |
7.16 |
% |
7.23 |
% |
6.25 |
% |
6.35 |
% |
6.35 |
% |
5.94 |
% |
6.07 |
% |
5.04 |
% |
|||||||||||||||||||||||||||||
|
Cash paid for dividends |
804 |
1,206 |
2,302 |
814 |
1,132 |
3,043 |
2,350 |
3,125 |
1,588 |
1,587 |
2,005 |
— |
19,956 |
||||||||||||||||||||||||||||||||||||||||||
(8) Investment Transactions
For the six months ended June 30, 2025, the cost of investments purchased and proceeds from the sale of investments, excluding short obligations and derivatives, were as follows:
|
For the Six Months Ended June 30, 2025 ($) |
|||||||
|
Cost of investments purchased |
(1,793,395 |
) |
|||||
|
Proceeds from the sale of investments |
1,095,736 |
||||||
(9) Derivative Instruments
The Fund recognizes all of its derivative instruments at fair value as either assets or liabilities in the consolidated statement of assets and liabilities. The changes in the fair value are included in the consolidated statement of operations during the current year. Purchases of derivative contracts and proceeds from the sale of derivative contracts, as disclosed in the consolidated statement of cash flows, are indicative of the volume of derivative activity during the six months ended June 30, 2025. The Fund is exposed to certain risks relating to its ongoing operations; the primary risks managed by using derivative instruments are market risk, credit risk, and foreign exchange risk. Additionally, the Fund holds certain derivative instruments for investment purposes. As of or during the six months ended June 30, 2025, the Fund held the following instruments meeting the definition of a derivative instrument: foreign currency forward contracts, interest rate swaps, equity options and credit default swaps.
The Fund operates as a "limited derivatives user" for purposes of the derivatives transactions exemption in Rule 18f-4. To qualify as a limited derivatives user, the Fund's "derivatives exposure" is limited to 10% of its net assets subject to exclusions for certain currency or interest rate hedging transactions (as calculated in accordance with Rule 18f-4). If the Fund ceases to qualify as a "limited derivatives user" as defined in Rule 18f-4, the rule would, among other things, require the Fund to establish a comprehensive derivatives risk management program, to comply with certain value-at-risk based leverage limits, to appoint a derivatives risk manager and to provide additional disclosure both publicly and to the SEC regarding its derivatives positions.
Qualitative Disclosures of Derivative Financial Instruments
The following is a description of the derivatives utilized by the Fund during the reporting period, including the primary underlying risk exposure related to each instrument type.
Foreign Currency Forward Contracts
The Fund enters into foreign currency forward contracts from time to time to help mitigate its foreign currency risk exposure. As of June 30, 2025, the counterparties to each of the Fund's foreign currency forward contracts were Goldman Sachs International and Morgan Stanley Capital Services LLC.
Interest Rate Swaps
In connection with the issuances of the Series H MRPS, the Series I MRPS, the Series J MRPS, the Series K MRPS and
Semi Annual Report 2025
175
CION Ares Diversified Credit Fund
Notes to Consolidated Financial Statements (continued)
June 30, 2025 (Unaudited)
(in thousands, except per share data, percentages and as otherwise noted)
the Series L MRPS, the Fund entered into interest rate swaps to more closely align the interest rates of such liabilities with its investment portfolio, which consists primarily of floating rate loans. Under the interest rate swaps, the Fund receives a fixed interest rate and pays a floating interest rate of one-month SOFR plus an applicable spread, as disclosed below. As of June 30, 2025, the counterparty to all of the Fund's interest rate swaps was Goldman Sachs International. See Note 7 for more information on the Series H MRPS, the Series I MRPS, the Series J MRPS, the Series K MRPS and the Series L MRPS.
Equity Options
The Fund is subject to equity price risk in the normal course of pursuing its investment objective. The Fund may enter into options contracts based on an equity index or specific security in order to manage its exposure to changes in market conditions. The risks of entering into equity price risk derivative instruments include the possible lack of liquidity, failure of the counterparty to meet its obligations, and that there may be unfavorable changes in the underlying investments or instruments. The Fund may purchase or write an option contract to protect against declines in market value on the underlying index or security. A purchased option contract provides the Fund a right, but not an obligation, to buy (call) or sell (put) an equity-related asset at a specified exercise price within a certain period or on a specific date. A written option contract holds the corresponding obligation to sell (call writing) or buy (put writing) the underlying equity-related asset if the purchaser exercises the option contract. The buyer pays the seller an initial purchase price (premium) for this right. Option contracts purchased by the Fund are accounted for in the same manner as marketable portfolio securities. The premium received by the Fund for option contracts written is recorded as a liability. The proceeds from securities sold through the exercise of option contracts are decreased by the premium paid to purchase the option contracts. The Fund may recognize a realized gain or loss when the option contract is closed, exercised or expires. Net realized gains or losses occurring during the holding period of purchased options and written options contracts are included in the "net realized gains or losses on derivative contracts" in the accompanying consolidated statement of operations. Net unrealized gains or losses occurring during the holding period of purchased options and written options contracts are included in the "net unrealized gains or losses on derivative contracts" in the accompanying consolidated statement of operations.
Credit Default Swaps
The Fund enters into credit default swap contracts for investment purposes and to manage its credit risk. Credit default swap agreements involve one party making a stream of payments (referred to as the buyer of protection) to another party (the seller of protection) in exchange for the right to receive a specified return in the event of a default or other credit event for the referenced entity, obligation or index. The Fund may purchase or sell protection. A seller of protection generally receives an upfront payment or periodic payments throughout the term of the swap provided there is no credit event. Such periodic payments received are accrued daily and accounted for as realized gains. If a credit event occurs, as defined under the terms of the swap agreement, the Fund will either (i) pay to the buyer of protection an amount equal to the notional amount of the swap and take delivery of the referenced obligation or underlying securities comprising the referenced index or (ii) pay a net settlement amount in the form of cash or securities equal to the notional amount of the swap less the recovery value of the referenced obligation or underlying securities comprising the referenced index. The buyer of protection generally pays an upfront premium or periodic payments throughout the term of the swap provided there is no credit event. Such periodic payments paid are accrued daily and accounted for as realized losses.
Entering into credit default swaps involves, to varying degrees, elements of credit, market and documentation risk in excess of the related amounts recognized in the consolidated statement of assets and liabilities. Such risks involve the possibility that there will be no liquid market for these agreements, that the counterparty to the agreements may default on its obligations to perform or disagree as to the meaning of the contractual terms in the agreements, and that there will be unfavorable changes in net interest rates.
The Fund's derivative contracts are subject to either International Swaps and Derivatives Association Master Agreements, or futures contracts/OTC addenda which contain certain covenants and other provisions that, if violated, may require the Fund to post collateral on derivatives if the Fund is in a net liability position with its counterparties exceeding certain amounts. As of June 30, 2025, there were no derivative instruments with credit-risk-related contingent features that are in a net liability position after taking into effect permissible offsetting. Additionally, OTC derivative counterparties may immediately terminate these agreements and the related derivative contracts if the Fund fails to maintain sufficient asset coverage for its contracts or its net assets decline by stated percentages or amounts. As of June 30, 2025, the termination values of these derivative contracts were approximately equal to their fair values.
Semi Annual Report 2025
176
CION Ares Diversified Credit Fund
Notes to Consolidated Financial Statements (continued)
June 30, 2025 (Unaudited)
(in thousands, except per share data, percentages and as otherwise noted)
Certain information related to the Fund's derivative instruments as of June 30, 2025 is presented below.
|
Derivative Instrument |
Notional Amount |
Gross Amount of Recognized Assets |
Gross Amount of Recognized Liabilities |
Balance Sheet Location of Net Amounts |
|||||||||||||||
|
Foreign currency forward contract |
¥ |
1,001,315 |
$ |
6,973 |
$ |
(6,854 |
) |
Derivative assets |
|||||||||||
|
Foreign currency forward contract |
SEK |
380,950 |
40,331 |
(40,906 |
) |
Derivative liabilities |
|||||||||||||
|
Foreign currency forward contract |
NOK |
243,235 |
24,135 |
(24,921 |
) |
Derivative liabilities |
|||||||||||||
|
Foreign currency forward contract |
€ |
191,276 |
225,687 |
(232,641 |
) |
Derivative liabilities |
|||||||||||||
|
Foreign currency forward contract |
€ |
112,312 |
132,516 |
(136,999 |
) |
Derivative liabilities |
|||||||||||||
|
Foreign currency forward contract |
£ |
111,846 |
153,542 |
(158,640 |
) |
Derivative liabilities |
|||||||||||||
|
Foreign currency forward contract |
£ |
103,563 |
142,171 |
(146,399 |
) |
Derivative liabilities |
|||||||||||||
|
Foreign currency forward contract |
DKK |
79,010 |
12,498 |
(12,894 |
) |
Derivative liabilities |
|||||||||||||
|
Foreign currency forward contract |
CAD |
54,607 |
40,144 |
(40,638 |
) |
Derivative liabilities |
|||||||||||||
|
Foreign currency forward contract |
SEK |
45,000 |
4,764 |
(4,819 |
) |
Derivative liabilities |
|||||||||||||
|
Foreign currency forward contract |
DKK |
40,000 |
6,327 |
(6,533 |
) |
Derivative liabilities |
|||||||||||||
|
Foreign currency forward contract |
CAD |
31,660 |
23,280 |
(23,651 |
) |
Derivative liabilities |
|||||||||||||
|
Foreign currency forward contract |
NZD |
19,317 |
11,784 |
(11,984 |
) |
Derivative liabilities |
|||||||||||||
|
Foreign currency forward contract |
PLN |
15,023 |
4,166 |
(4,342 |
) |
Derivative liabilities |
|||||||||||||
|
Foreign currency forward contract |
AUD |
8,380 |
5,517 |
(5,674 |
) |
Derivative liabilities |
|||||||||||||
|
Foreign currency forward contract |
NZD |
7,008 |
4,273 |
(4,387 |
) |
Derivative liabilities |
|||||||||||||
|
Foreign currency forward contract |
NOK |
6,400 |
635 |
(657 |
) |
Derivative liabilities |
|||||||||||||
|
Foreign currency forward contract |
$ |
5,196 |
3,785 |
(3,652 |
) |
Derivative assets |
|||||||||||||
|
Foreign currency forward contract |
$ |
5,004 |
4,037 |
(3,864 |
) |
Derivative assets |
|||||||||||||
|
Call-Chicago Board Options Exchange-VIX US |
$ |
962 |
57 |
— |
Derivative assets |
||||||||||||||
|
Call-Chicago Board Options Exchange-VIX US |
$ |
(962 |
) |
— |
(32 |
) |
Derivative liabilities |
||||||||||||
|
CDX HY S39 Tranche 15-25 |
$ |
4,945 |
— |
(436 |
) |
Derivative liabilities |
|||||||||||||
|
CMBX.NA.BBB- S9 |
$ |
1,030 |
177 |
— |
Derivative assets |
||||||||||||||
|
SRT CDS Tranche 95.12-99.23 |
$ |
— |
1 |
— |
Derivative assets |
||||||||||||||
|
Interest rate swap — Series H MRPS |
$ |
100,000 |
1,770 |
— |
Derivative assets |
||||||||||||||
|
Interest rate swap — Series I MRPS |
$ |
50,000 |
1,441 |
— |
Derivative assets |
||||||||||||||
|
Interest rate swap — Series J MRPS |
$ |
50,000 |
1,462 |
— |
Derivative assets |
||||||||||||||
|
Interest rate swap — Series K MRPS |
$ |
150,000 |
2,769 |
— |
Derivative assets |
||||||||||||||
|
Interest rate swap — Series L MRPS |
$ |
150,000 |
2,781 |
— |
Derivative assets |
||||||||||||||
|
Total |
$ |
857,023 |
$ |
(870,923 |
) |
||||||||||||||
|
Description |
MRPS |
Notional Amount |
Fund Receives |
Fund Pays |
Maturity Date |
||||||||||||||||||
|
Interest rate swap |
Series H MRPS |
$ |
100,000 |
6.250 |
% |
SOFR +1.7420% |
June 7, 2027 |
||||||||||||||||
|
Interest rate swap |
Series I MRPS |
$ |
50,000 |
6.350 |
% |
SOFR +2.0865% |
June 7, 2029 |
||||||||||||||||
|
Interest rate swap |
Series J MRPS |
$ |
50,000 |
6.350 |
% |
SOFR +2.0895% |
July 3, 2029 |
||||||||||||||||
|
Interest rate swap |
Series K MRPS |
$ |
150,000 |
5.940 |
% |
SOFR +1.9950% |
January 15, 2030 |
||||||||||||||||
|
Interest rate swap |
Series L MRPS |
$ |
150,000 |
6.070 |
% |
SOFR +2.1530% |
April 14, 2032 |
||||||||||||||||
Semi Annual Report 2025
177
CION Ares Diversified Credit Fund
Notes to Consolidated Financial Statements (continued)
June 30, 2025 (Unaudited)
(in thousands, except per share data, percentages and as otherwise noted)
Net realized gains (losses) on derivative instruments recognized by the Fund for the six months ended June 30, 2025 are in the following locations in the consolidated statement of operations:
|
Derivative Instrument |
Statement Location |
For the Six Months Ended June 30, 2025 ($) |
|||||||||
|
Foreign currency forward contracts |
Net realized losses on derivative contracts |
(35,124 |
) |
||||||||
|
Interest rate swaps |
Net realized losses on derivative contracts |
(410 |
) |
||||||||
|
Written options |
Net realized losses on derivative contracts |
58 |
|||||||||
|
Credit default swaps |
Net realized losses on derivative contracts |
(131 |
) |
||||||||
|
Total |
(35,607 |
) |
|||||||||
Net unrealized gains (losses) on derivative instruments recognized by the Fund for the six months ended June 30, 2025 are in the following locations in the consolidated statement of operations:
|
Derivative Instrument |
Statement Location |
For the Six Months Ended June 30, 2025 ($) |
|||||||||
|
Foreign currency forward contracts |
Net unrealized losses on derivative contracts |
(46,279 |
) |
||||||||
|
Interest rate swaps |
Net unrealized gains on derivative contracts |
11,371 |
|||||||||
|
Written options |
Net unrealized losses on derivative contracts |
(24 |
) |
||||||||
|
Credit default swaps |
Net unrealized losses on derivative contracts |
188 |
|||||||||
|
Total |
(34,744 |
) |
|||||||||
Offsetting Arrangements
Although the Fund generally presents derivative and other financial instruments on a gross basis in the consolidated statement of assets and liabilities, certain derivative and other financial instruments are subject to enforceable master netting arrangements with certain counterparties which allow for the derivative and other financial instruments to be offset.
The following table presents the rights of offset and related arrangements associated with the Fund's derivative instruments as of June 30, 2025:
|
Gross Amounts Not Offset in Statement of Assets and Liabilities |
|||||||||||||||||||||||||||
|
Description |
Gross Amount of Recognized Assets (Liabilities) |
Gross Amount Offset in Assets (Liabilities) |
Net Amounts of Assets (Liabilities) Presented |
Financial Instrument |
Collateral (Received) Pledged |
Net Amount |
|||||||||||||||||||||
|
Assets: |
|||||||||||||||||||||||||||
|
Goldman Sachs International: |
|||||||||||||||||||||||||||
|
Foreign currency forward contracts |
$ |
28,008 |
$ |
(27,867 |
) |
$ |
141 |
$ |
— |
$ |
(141 |
) |
$ |
— |
|||||||||||||
|
Interest rate swaps |
10,223 |
— |
10,223 |
— |
(10,223 |
) |
— |
||||||||||||||||||||
|
Credit default swaps |
178 |
— |
178 |
— |
(178 |
) |
— |
||||||||||||||||||||
|
Equity options |
57 |
— |
57 |
— |
(57 |
) |
— |
||||||||||||||||||||
|
38,466 |
(27,867 |
) |
10,599 |
— |
(10,599 |
) |
— |
||||||||||||||||||||
|
Morgan Stanley Capital Services LLC: |
|||||||||||||||||||||||||||
|
Foreign currency forward contracts |
11,010 |
(10,718 |
) |
292 |
— |
(292 |
) |
— |
|||||||||||||||||||
|
Total assets |
$ |
49,476 |
$ |
(38,585 |
) |
$ |
10,891 |
$ |
— |
$ |
(10,891 |
) |
$ |
— |
|||||||||||||
Semi Annual Report 2025
178
CION Ares Diversified Credit Fund
Notes to Consolidated Financial Statements (continued)
June 30, 2025 (Unaudited)
(in thousands, except per share data, percentages and as otherwise noted)
|
Gross Amounts Not Offset in Statement of Assets and Liabilities |
|||||||||||||||||||||||||||
|
Description |
Gross Amount of Recognized Assets (Liabilities) |
Gross Amount Offset in Assets (Liabilities) |
Net Amounts of Assets (Liabilities) Presented |
Financial Instrument |
Collateral (Received) Pledged |
Net Amount |
|||||||||||||||||||||
|
Liabilities: |
|||||||||||||||||||||||||||
|
Goldman Sachs International: |
|||||||||||||||||||||||||||
|
Foreign currency forward contracts |
$ |
(376,484 |
) |
$ |
365,222 |
$ |
(11,262 |
) |
$ |
— |
$ |
11,262 |
$ |
— |
|||||||||||||
|
Credit default swaps |
(436 |
) |
— |
(436 |
) |
— |
436 |
— |
|||||||||||||||||||
|
Equity options |
(32 |
) |
— |
(32 |
) |
— |
32 |
— |
|||||||||||||||||||
|
(376,952 |
) |
365,222 |
(11,730 |
) |
— |
11,730 |
— |
||||||||||||||||||||
|
Morgan Stanley Capital Services LLC: |
|||||||||||||||||||||||||||
|
Foreign currency forward contracts |
(455,386 |
) |
442,325 |
(13,061 |
) |
— |
13,061 |
— |
|||||||||||||||||||
|
Total liabilities |
$ |
(832,338 |
) |
$ |
807,547 |
$ |
(24,791 |
) |
$ |
— |
$ |
24,791 |
$ |
— |
|||||||||||||
(10) Income Taxes
The Fund intends to distribute all or substantially all of its taxable income to shareholders and to comply with the other requirements of the Code, applicable to RICs. Accordingly, no provision for U.S. federal income taxes is required.
The Fund may elect to incur an excise tax if it is deemed prudent by its Board from a cash management perspective or in the best interest of shareholders due to other facts and circumstances. For the six months ended June 30, 2025, the Fund incurred U.S. federal excise taxes of $564.
As of December 31, 2024, which is the end of the Fund's most recent taxable year, the Fund had no uncertain tax positions that would require financial statement recognition, derecognition, or disclosure. The Fund files a U.S. federal income tax return annually after its fiscal year-end, which is subject to examination by the Internal Revenue Service for a period of three years from the date of filing.
(11) Segment Reporting
The Fund operates through a single operating and reporting segment with an investment objective to provide superior risk-adjusted returns across various market cycles by investing in a diversified portfolio of liquid and illiquid asset classes. The CODM is comprised of the Fund's portfolio managers and chief financial officer and the CODM assesses the performance and makes operating decisions of the Fund on a consolidated basis primarily based on the Fund's net increase in net assets resulting from operations ("net income"). In addition to numerous other factors and metrics, the CODM utilizes net income as a key metric in determining the amount of dividends to be distributed to the Fund's shareholders. As the Fund's operations comprise of a single reporting segment, the segment assets are reflected on the accompanying
consolidated statement of assets and liabilities as "total assets" and the significant segment expenses are listed on the accompanying consolidated statement of operations.
(12) Risk Factors
Short Sales Risk
A short sale is a transaction in which the Fund sells an instrument that it does not own in anticipation that the market price will decline. To deliver the securities to the buyer, the Fund arranges through a broker to borrow the securities and, in so doing, the Fund becomes obligated to replace the securities borrowed at their market price at the time of replacement. When selling short, the Fund intends to replace the securities at a lower price and therefore profit from the difference between the cost to replace the securities and the proceeds received from the sale of the securities. When the Fund makes a short sale, the proceeds it receives from the sale will be held on behalf of a broker until the Fund replaces the borrowed securities. The Fund may have to pay a premium to borrow the securities and must pay any dividends or interest payable on the securities until they are replaced. The Fund's obligation to replace the securities borrowed in connection with a short sale will be secured by collateral deposited with the broker that consists of cash and/or liquid securities. Short sales involve certain risks and special considerations. If the Fund incorrectly predicts that the price of the borrowed security will decline, the Fund will have to replace the securities with securities with a greater value than the amount received from the sale. As a result, losses from short sales differ from losses that could be incurred from a purchase of a security because losses from short sales may be unlimited, whereas losses from purchases can equal only the total amount invested.
Semi Annual Report 2025
179
CION Ares Diversified Credit Fund
Notes to Consolidated Financial Statements (continued)
June 30, 2025 (Unaudited)
(in thousands, except per share data, percentages and as otherwise noted)
Derivatives Risk
The Fund's use of derivatives involves investment risks and transaction costs to which the Fund would not be subject absent the use of these instruments and, accordingly, may result in losses greater than if they had not been used.
General Risks Associated with Derivatives. Although the Fund does not expect derivatives to represent a significant component of its portfolio, the Fund may use derivatives including, in particular, swaps (including interest rate swaps and credit default swaps), synthetic CLOs, reverse repurchase agreements and other similar transactions, in seeking to achieve its investment objective or for other reasons, such as cash management, financing activities or to hedge its positions. Accordingly, derivatives may be used in limited instances as a form of leverage or to seek to enhance returns, including speculation on changes in credit spreads, interest rates or other characteristics of the market, individual securities or groups of securities. If the Fund invests in a derivative, the Fund will be fully exposed to the risks of loss of that derivative, which may sometimes be greater than the derivative's cost. The use of derivatives may involve substantial leverage. The use of derivatives may subject the Fund to certain risks, including, but not limited to, credit risk, currency risk, leverage risk, liquidity risk, correlation risk, index risk, valuation risk and regulatory risk.
Rule 18f-4 under the Investment Company Act permits the Fund to enter into Derivatives Transactions (as defined below) and certain other transactions notwithstanding the restrictions on the issuance of "senior securities" under Section 18 of the Investment Company Act. Section 18 of the Investment Company Act, among other things, prohibits closed-end funds, including the Fund, from issuing or selling any "senior security" representing indebtedness (unless the fund maintains 300% "asset coverage") or any senior security representing stock (unless the fund maintains 200% "asset coverage").
Under Rule 18f-4, "Derivatives Transactions" include the following: (1) any swap, security-based swap (including a contract for differences), futures contract, forward contract, option (excluding purchased options), any combination of the foregoing, or any similar instrument, under which the Fund is or may be required to make any payment or delivery of cash or other assets during the life of the instrument or at maturity or early termination, whether as margin or settlement payment or otherwise; (2) any short sale borrowing; (3) reverse repurchase agreements and similar financing transactions (e.g., recourse and non-recourse tender option bonds, and borrowed bonds), if the Fund elects to treat these transactions as Derivatives Transactions under Rule 18f-4; and (4) when-issued or forward-settling securities (e.g., firm and standby
commitments, including to-be-announced commitments, and dollar rolls) and non-standard settlement cycle securities, unless the Fund intends to physically settle the transaction and the transaction will settle within 35 days of its trade date.
The Fund is currently relying on the Limited Derivatives User Exception (as defined below) from certain requirements of Rule 18f-4. Absent the availability of the Limited Derivatives User Exception, the Fund would be required to comply with Rule 18f-4 with respect to its Derivatives Transactions. Rule 18f-4, among other things, requires a fund to adopt and implement a comprehensive written derivatives risk management program ("DRMP") and comply with a relative or absolute limit on fund leverage risk calculated based on value-at-risk ("VaR"). The DRMP is required to be administered by a "derivatives risk manager," who is appointed by the fund's board, including a majority of the directors or trustees who are not "interested persons" of the fund (as defined in the Investment Company Act), and periodically reviews the DRMP and reports to the board.
Rule 18f-4 provides an exception from the DRMP, VaR limit and certain other requirements if the Fund's "derivatives exposure" is limited to 10% of its net assets (as calculated in accordance with Rule 18f-4) and the Fund adopts and implements written policies and procedures reasonably designed to manage its derivatives risks (the "Limited Derivatives User Exception").
Options and Futures Risk. The Fund may utilize options and futures contracts and so-called "synthetic" options or other derivatives written by broker-dealers or other permissible financial intermediaries. Options transactions may be effected on securities exchanges or in the over-the-counter ("OTC") market. When options are purchased OTC, the Fund's portfolio bears the risk that the counterparty that wrote the option will be unable or unwilling to perform its obligations under the option contract. Options may also be illiquid and, in such cases, the Fund may have difficulty closing out its position. OTC options also may include options on baskets of specific securities. The Fund may purchase call and put options on specific securities, and may write and sell covered or uncovered call and put options for hedging purposes in pursuing its investment objective. A put option gives the purchaser of the option the right to sell, and obligates the writer to buy, the underlying security at a stated exercise price, typically at any time prior to the expiration of the option. A call option gives the purchaser of the option the right to buy, and obligates the writer to sell, the underlying security at a stated exercise price, typically at any time prior to the expiration of the option. A covered call option is a call option with respect to which the seller of the option owns the underlying security. The sale of a call option exposes the seller during the term of the option to possible loss of opportunity to
Semi Annual Report 2025
180
CION Ares Diversified Credit Fund
Notes to Consolidated Financial Statements (continued)
June 30, 2025 (Unaudited)
(in thousands, except per share data, percentages and as otherwise noted)
realize appreciation in the market price of the underlying security or to possible continued holding of a security that might otherwise have been sold to protect against depreciation in the market price of the security. In the sale of a put, losses may be significant and, in the sale of a call, losses can be unlimited.
The Fund may close out a position when writing options by purchasing an option on the same security with the same exercise price and expiration date as the option that it has previously written on the security. In such a case, the Fund will realize a profit or loss if the amount paid to purchase an option is less or more than the amount received from the sale of the option.
Purchasing a futures contract creates an obligation to take delivery of the specific type of financial instrument at a specific future time at a specific price for contracts that require physical delivery, or net payment for cash-settled contracts. Engaging in transactions in futures contracts involves risk of loss to the Fund. No assurance can be given that a liquid market will exist for any particular futures contract at any particular time. All terms of futures contracts are set forth in the rules of the exchange on which the futures contracts are traded. Many futures exchanges and boards of trade limit the amount of fluctuation permitted in futures contract prices during a single trading day. Once the daily limit has been reached in a particular contract, no trades may be made that day at a price beyond that limit or trading may be suspended for specified periods during the trading day. Futures contract prices could move to the limit for several consecutive trading days with little or no trading, preventing prompt liquidation of futures positions and potentially subjecting the Fund to substantial losses. Successful use of futures also is subject to the Adviser's ability to predict correctly the direction of movements in the relevant market, and, to the extent the transaction is entered into for hedging purposes, to determine the appropriate correlation between the transaction being hedged and the price movements of the futures contract.
Swap Agreements Risk. The Fund may enter into swap agreements, including interest rate and index swap agreements, for hedging purposes, as a form of leverage or to seek to obtain a particular desired return at a lower cost to the Fund than if the Fund had invested directly in an instrument yielding the desired return. Swap agreements are often two party contracts entered into primarily by institutional investors for periods ranging from a few days to more than one year. In a typical "swap" transaction, two parties agree to exchange the returns (or differentials in rates of return) earned or realized on particular predetermined investments or instruments. Some swaps may be subject to central clearing and exchange trading.
Whether the Fund's use of swap agreements will be successful in furthering its investment objective will depend on the Adviser's ability to correctly predict whether certain types of investments are likely to produce greater returns than other investments. Because they are two party contracts and because they may have terms of greater than seven days, some swap agreements may be considered by the Fund to be illiquid. Moreover, the Fund bears the risk of loss of the amount expected to be received under a swap agreement in the event of the default or bankruptcy of a bi-lateral swap agreement counterparty. The Fund may seek to reduce this risk to some extent by entering into a transaction only if the counterparty meets the Adviser's current credit standards for OTC option counterparties. In the case of a cleared swap, the Fund bears the risk that the clearinghouse may default. Swap agreements also bear the risk that the Fund will not be able to meet its payment obligations to the counterparty. Restrictions imposed by the tax rules applicable to RICs may limit the Fund's ability to use swap agreements. It is possible that developments in the swap market, including further government regulation, could adversely affect the Fund's ability to enter into or terminate swap agreements or to realize amounts to be received under these agreements. Swap transactions may involve substantial leverage.
The Fund may enter into credit default swap agreements and similar agreements, and may also buy credit-linked securities. Credit default swaps are often structured with significant leverage and may be considered speculative. The credit default swap agreement or similar instrument may have as reference obligations one or more securities that are not currently held by the Fund. The protection "buyer" in a credit default contract may be obligated to pay the protection "seller" an upfront payment or a periodic stream of payments over the term of the contract provided generally that no credit event on a reference obligation has occurred. If a credit event occurs, the seller generally must pay the buyer the "par value" (full notional value) of the swap in exchange for an equal face amount of deliverable obligations of the reference entity described in the swap, or the seller may be required to deliver the related net cash amount, if the swap is cash settled. The Fund may be either the buyer or seller in the transaction. If the Fund is a buyer and no credit event occurs, the Fund recovers nothing if the swap is held through its termination date. However, if a credit event occurs, the Fund may elect to receive the full notional value of the swap in exchange for an equal face amount of deliverable obligations of the reference entity that may have little or no value. As a seller, the Fund generally receives an upfront payment or a fixed rate of income throughout the term of the swap, which typically is between six months and three years, provided that there is no credit event. If a credit event occurs, generally the seller must
Semi Annual Report 2025
181
CION Ares Diversified Credit Fund
Notes to Consolidated Financial Statements (continued)
June 30, 2025 (Unaudited)
(in thousands, except per share data, percentages and as otherwise noted)
pay the buyer the full notional value of the swap in exchange for an equal face amount of deliverable obligations of the reference entity that may have little or no value.
Swaptions Risk. The Fund, to the extent permitted under applicable law, may enter into "swaptions", which are options on swap agreements on either an asset-based or liability-based basis. A swaption is a contract that gives a counterparty the right (but not the obligation) to enter into a new swap agreement or to shorten, extend, cancel or otherwise modify an existing swap agreement, at some designated future time on specified terms. The Fund may write (sell) and purchase put and call swaptions. Depending on the terms of the particular option agreement, the Fund generally will incur a greater degree of risk when it writes a swaption than it will incur when it purchases a swaption. When the Fund purchases a swaption, it risks losing only the amount of the premium it has paid should it decide to let the option expire unexercised. When the Fund writes a swaption, upon exercise of the option, the Fund will become obligated according to the terms of the underlying agreement.
Credit-Linked Securities Risk. Among the income producing securities in which the Fund may invest are credit-linked securities, which generally are issued by a limited purpose trust or other vehicle that, in turn, invests in a derivative instrument or basket of derivative instruments, such as credit default swaps, interest rate swaps and other securities, in order to provide exposure to certain fixed income markets. For instance, the Fund may invest in credit-linked securities as a cash management tool in order to gain exposure to a certain market and/or to remain fully invested when more traditional income producing securities are not available.
Like an investment in a bond, investments in credit-linked securities generally represent the right to receive periodic income payments (in the form of dividends) and payment of principal at the end of the term of the security. However, these payments are conditioned on the issuer's receipt of payments from, and the issuer's potential obligations to, the counterparties to the derivative instruments and other securities in which the issuer invests. For instance, the issuer may sell one or more credit default swaps, under which the issuer would receive a stream of payments over the term of the swap agreements provided that no event of default has occurred with respect to the referenced debt obligation upon which the swap is based. If a default occurs, the stream of payments may stop and the issuer would be obligated to pay the counterparty the par (or other agreed upon value) of the referenced debt obligation. This, in turn, would reduce the amount of income and principal that the Fund would receive as an investor in the issuer. The Fund's investments in these instruments are indirectly subject to the risks associated with derivatives, including, among others, credit risk and leverage
risk. There may be no established trading market for these securities and they may constitute illiquid investments.
Repurchase Agreements and Reverse Repurchase Agreements Risk
Repurchase agreements carry certain risks not associated with direct investments in securities, including a possible decline in the market value of the underlying obligations. If their value becomes less than the repurchase price, plus any agreed-upon additional amount, the counterparty must provide additional collateral so that at all times the collateral is at least equal to the repurchase price plus any agreed-upon additional amount. The difference between the total amount to be received upon repurchase of the obligations and the price that was paid by the Fund upon acquisition is accrued as interest and included in its net investment income.
Repurchase agreements involving obligations other than U.S. Government securities (such as commercial paper and corporate bonds) may be subject to special risks and may not have the benefit of certain protections in the event of the counterparty's insolvency. In the event of the bankruptcy or other default of a seller of a repurchase agreement, the Fund could experience both delays in liquidating the underlying securities and losses, including (i) possible decline in the value of the underlying security during the period in which the Fund seeks to enforce its rights thereto; (ii) possible lack of access to income on the underlying security during this period; and (iii) expenses of enforcing its rights.
Reverse repurchase agreements involve the risk that the buyer of the securities sold by the Fund might be unable to deliver them when the Fund seeks to repurchase. In the event that the buyer of securities under a reverse repurchase agreement files for bankruptcy or becomes insolvent, the buyer, trustee or receiver may receive an extension of time to determine whether to enforce the Fund's obligation to repurchase the securities, and the Fund's use of the proceeds of the reverse repurchase agreement may effectively be restricted pending such decision. If the Fund enters in reverse repurchase agreements and similar financing transactions in reliance on the exemption in Rule 18f-4(d), the Fund may treat such transactions as "derivatives transactions" and comply with Rule 18f-4 with respect to such transactions.
Senior Loans Risk
Although senior loans ("Senior Loans") are senior and typically secured in a first lien (including "unitranche" loans, which are loans that combine both senior and subordinated debt, generally in a first lien position) or second lien position in contrast to other below investment grade fixed income instruments, which are often subordinated or unsecured, the risks associated with such Senior Loans are generally similar
Semi Annual Report 2025
182
CION Ares Diversified Credit Fund
Notes to Consolidated Financial Statements (continued)
June 30, 2025 (Unaudited)
(in thousands, except per share data, percentages and as otherwise noted)
to the risks of other below investment grade fixed income instruments. Investments in below investment grade Senior Loans are considered speculative because of the credit risk of the issuers of debt instruments (each, a "Borrower"). Such Borrowers are more likely than investment grade Borrowers to default on their payments of interest and principal owed to the Fund, and such defaults could reduce the net asset value of the Fund and income distributions. An economic downturn would generally lead to a higher non-payment rate, and a Senior Loan may lose significant market value before a default occurs. Moreover, any specific collateral used to secure a Senior Loan may decline in value or become illiquid, which could adversely affect the Senior Loan's value.
Senior Loans are subject to the risk of non-payment of scheduled interest or principal. Such non-payment would result in a reduction of income to the Fund, a reduction in the value of the investment and a potential decrease in the net asset value of the Fund. There can be no assurance that the liquidation of any collateral securing a Senior Loan would satisfy the Borrower's obligation in the event of nonpayment of scheduled interest or principal payments, whether when due or upon acceleration, or that the collateral could be liquidated, readily or otherwise. In the event of bankruptcy or insolvency of a Borrower, the Fund could experience delays or limitations with respect to its ability to realize the benefits of the collateral, if any, securing a Senior Loan. The collateral securing a Senior Loan, if any, may lose all or substantially all of its value in the event of the bankruptcy or insolvency of a Borrower. Some Senior Loans are subject to the risk that a court, pursuant to fraudulent conveyance or other similar laws, could subordinate such Senior Loans to presently existing or future indebtedness of the Borrower or take other action detrimental to the holders of Senior Loans including, in certain circumstances, invalidating such Senior Loans or causing interest previously paid to be refunded to the Borrower. Additionally, a Senior Loan may be "primed" in bankruptcy, which reduces the ability of the holders of the Senior Loan to recover on the collateral.
There may be less readily available information about most Senior Loans and the Borrowers thereunder than is the case for many other types of securities, including securities issued in transactions registered under the Securities Act of 1933, as amended (the "Securities Act"), or the Securities Exchange Act of 1934, as amended (the "Exchange Act"), and Borrowers subject to the periodic reporting requirements of Section 13 of the Exchange Act. Senior Loans may be issued by companies that are not subject to SEC reporting requirements and these companies, therefore, do not file reports with the SEC that must comply with SEC form requirements and, in addition, are subject to a less stringent liability disclosure regime than companies subject to SEC
reporting requirements. As a result, the Adviser will rely primarily on its own evaluation of a Borrower's credit quality rather than on any available independent sources. Consequently, the Fund will be particularly dependent on the analytical abilities of the Adviser. In certain circumstances, Senior Loans may not be deemed to be securities under certain federal securities laws, other than the Investment Company Act. Therefore, in the event of fraud or misrepresentation by a Borrower or an arranger, the Fund may not have the protection of the anti-fraud provisions of the federal securities laws as would otherwise be available for bonds or stocks. Instead, in such cases, parties generally would rely on the contractual provisions in the Senior Loan agreement itself and common law fraud protections under applicable state law.
The secondary trading market for Senior Loans may be less liquid than the secondary trading market for registered investment grade debt securities. No active trading market may exist for certain Senior Loans, which may make it difficult to value them. Illiquidity and adverse market conditions may mean that the Fund may not be able to sell Senior Loans quickly or at a fair price. To the extent that a secondary market does exist for certain Senior Loans, the market for them may be subject to irregular trading activity, wide bid/ask spreads and extended trade settlement periods.
Senior Loans are subject to legislative risk. If legislation or state or federal regulations impose additional requirements or restrictions on the ability of financial institutions to make loans, the availability of Senior Loans for investment by the Fund may be adversely affected. In addition, such requirements or restrictions could reduce or eliminate sources of financing for certain Borrowers. This would increase the risk of default. If legislation or federal or state regulations require financial institutions to increase their capital requirements this may cause financial institutions to dispose of Senior Loans that are considered highly levered transactions. If the Fund attempts to sell a Senior Loan at a time when a financial institution is engaging in such a sale, the price the Fund could receive for the Senior Loan may be adversely affected.
Subordinated Loans Risk
Although the Fund does not expect Subordinated Loans to be a significant component of its portfolio, it may invest in such instruments from time to time. Subordinated loans generally are subject to similar risks as those associated with investments in Senior Loans, except that such loans are subordinated in payment and/or lower in lien priority to first lien holders. In the event of default on a Subordinated Loan, the first priority lien holder has first claim to the underlying collateral of the loan to the extent such claim is secured. Additionally, an over secured creditor may be entitled to
Semi Annual Report 2025
183
CION Ares Diversified Credit Fund
Notes to Consolidated Financial Statements (continued)
June 30, 2025 (Unaudited)
(in thousands, except per share data, percentages and as otherwise noted)
additional interest and other charges in bankruptcy increasing the amount of their allowed claim. Subordinated Loans are subject to the additional risk that the cash flow of the Borrower and property securing the loan or debt, if any, may be insufficient to meet scheduled payments after giving effect to the senior obligations of the Borrower. This risk is generally higher for subordinated unsecured loans or debt, which are not backed by a security interest in any specific collateral. Subordinated Loans generally have greater price volatility than Senior Loans and may be less liquid.
Corporate Bonds Risk
The market value of a corporate bond generally may be expected to rise and fall inversely with interest rates. The market value of intermediate- and longer-term corporate bonds is generally more sensitive to changes in interest rates than is the market value of shorter-term corporate bonds. The market value of a corporate bond also may be affected by factors directly related to the Borrower, such as investors' perceptions of the creditworthiness of the Borrower, the Borrower's financial performance, perceptions of the Borrower in the marketplace, performance of management of the Borrower, the Borrower's capital structure and use of financial leverage and demand for the Borrower's goods and services. There is a risk that the Borrowers of corporate bonds may not be able to meet their obligations on interest or principal payments at the time called for by an instrument. High yield corporate bonds are often high risk and have speculative characteristics. High yield corporate bonds may be particularly susceptible to adverse Borrower-specific developments.
CLO Securities Risk
CLOs issue securities in tranches with different payment characteristics and different credit ratings. The rated tranches of securities issued by CLOs ("CLO Securities") are generally assigned credit ratings by one or more nationally recognized statistical rating organizations. The subordinated (or residual) tranches are the most junior tranches and do not receive ratings. Below investment grade tranches of CLO Securities typically experience a lower recovery, greater risk of loss or deferral or non-payment of interest than more senior tranches of the CLO.
The riskiest portion of the capital structure of a CLO is the subordinated (or residual) tranche, which bears the bulk of defaults from the loans in the CLO and serves to protect the other, more senior tranches from default in all but the most severe circumstances. Since it is partially protected from defaults, a senior tranche from a CLO typically has higher ratings and lower yields than the underlying securities, and can be rated investment grade. Despite the protection from the subordinated tranche, CLO tranches can experience
substantial losses due to actual defaults, increased sensitivity to defaults due to collateral default and disappearance of protecting tranches, market anticipation of defaults and aversion to CLO Securities as a class. The risks of an investment in a CLO depend largely on the collateral and the tranche of the CLO in which the Fund invests.
The CLOs in which the Fund invests may have issued and sold debt tranches that will rank senior to the tranches in which the Fund invests. By their terms, such more senior tranches may entitle the holders to receive payment of interest or principal on or before the dates on which the Fund is entitled to receive payments with respect to the tranches in which the Fund invests.
Also, in the event of insolvency, liquidation, dissolution, reorganization or bankruptcy of a CLO, holders of more senior tranches would typically be entitled to receive payment in full before the Fund receives any distribution. After repaying such senior creditors, such CLO may not have any remaining assets to use for repaying its obligation to the Fund. In the case of tranches ranking equally with the tranches in which the Fund invests, the Fund would have to share on an equal basis any distributions with other creditors holding such securities in the event of an insolvency, liquidation, dissolution, reorganization or bankruptcy of the relevant CLO. Therefore, the Fund may not receive back the full amount of its investment in a CLO.
The transaction documents relating to the issuance of CLO Securities may impose eligibility criteria on the assets of the CLO, restrict the ability of the CLO's investment manager to trade investments and impose certain portfolio-wide asset quality requirements. These criteria, restrictions and requirements may limit the ability of the CLO's investment manager to maximize returns on the CLO Securities. In addition, other parties involved in CLOs, such as third-party credit enhancers and investors in the rated tranches, may impose requirements that have an adverse effect on the returns of the various tranches of CLO Securities. Furthermore, CLO Securities issuance transaction documents generally contain provisions that, in the event that certain tests are not met (generally interest coverage and over-collateralization tests at varying levels in the capital structure), proceeds that would otherwise be distributed to holders of a junior tranche must be diverted to pay down the senior tranches until such tests are satisfied. Failure (or increased likelihood of failure) of a CLO to make timely payments on a particular tranche will have an adverse effect on the liquidity and market value of such tranche.
Payments to holders of CLO Securities may be subject to deferral. If cash flows generated by the underlying assets are insufficient to make all current and, if applicable, deferred payments on CLO Securities, no other assets will be available
Semi Annual Report 2025
184
CION Ares Diversified Credit Fund
Notes to Consolidated Financial Statements (continued)
June 30, 2025 (Unaudited)
(in thousands, except per share data, percentages and as otherwise noted)
for payment of the deficiency and, following realization of the underlying assets, the obligations of the Borrower of the related CLO Securities to pay such deficiency will be extinguished.
The market value of CLO Securities may be affected by, among other things, changes in the market value of the underlying assets held by the CLO, changes in the distributions on the underlying assets, defaults and recoveries on the underlying assets, capital gains and losses on the underlying assets, prepayments on underlying assets and the availability, prices and interest rate of underlying assets. Furthermore, the leveraged nature of each subordinated class may magnify the adverse impact on such class of changes in the value of the assets, changes in the distributions on the assets, defaults and recoveries on the assets, capital gains and losses on the assets, prepayment on assets and availability, price and interest rates of assets. Finally, CLO Securities are limited recourse and may not be paid in full and may be subject to up to 100% loss.
Asset-Backed Securities Risk
Asset-backed securities often involve risks that are different from or more acute than risks associated with other types of debt instruments. For instance, asset-backed securities may be particularly sensitive to changes in prevailing interest rates. In addition, the underlying assets are subject to prepayments that shorten the securities' weighted average maturity and may lower their return. Asset-backed securities are also subject to risks associated with their structure and the nature of the assets underlying the security and the servicing of those assets. Payment of interest and repayment of principal on asset-backed securities is largely dependent upon the cash flows generated by the assets backing the securities and, in certain cases, supported by letters of credit, surety bonds or other credit enhancements. The values of asset-backed securities may be substantially dependent on the servicing of the underlying asset pools, and are therefore subject to risks associated with the negligence by, or defalcation of, their servicers. Furthermore, debtors may be entitled to the protection of a number of state and federal consumer credit laws with respect to the assets underlying these securities, which may give the debtor the right to avoid or reduce payment. In addition, due to their often complicated structures, various asset-backed securities may be difficult to value and may constitute illiquid investments. The liquidity of asset-backed securities (particularly below investment grade asset-backed securities) may change over time. During periods of deteriorating economic conditions, such as recessions, or periods of rising unemployment, delinquencies and losses generally increase, sometimes dramatically, with respect to
securitizations involving loans, sales contracts, receivables and other obligations underlying asset-backed securities. If many Borrowers on the underlying loans default, losses could exceed the credit enhancement level and result in losses to investors in asset-backed securities.
"Covenant-Lite" Loans Risk
Some of the loans in which the Fund may invest directly or indirectly through its investments in collateralized debt obligations, CLOs or other types of structured securities may be "covenant-lite" loans, which means the loans contain fewer maintenance covenants than other loans (in some cases, none) and do not include terms which allow the lender to monitor the performance of the borrower and declare a default if certain criteria are breached. An investment by the Fund in a covenant-lite loan may potentially hinder the ability to reprice credit risk associated with the issuer and reduce the ability to restructure a problematic loan and mitigate potential loss. The Fund may also experience delays in enforcing its rights on its holdings of covenant-lite loans. As a result of these risks, the Fund's exposure to losses may be increased, which could result in an adverse impact on the Fund's net income and net asset value.
Investment and Market Risk
An investment in the common shares of the Fund is subject to investment risk, including the possible loss of the entire principal amount invested. An investment in the common shares of the Fund represents an indirect investment in the portfolio of Senior Loans, Corporate Bonds, CLO Securities and other securities and loans owned by the Fund, and the value of these securities and loans may fluctuate, sometimes rapidly and unpredictably. For instance, during periods of global economic downturn, the secondary markets for Senior Loans and investments with similar economic characteristics (such as second lien loans and unsecured loans) and Corporate Bonds may experience sudden and sharp price swings, which can be exacerbated by large or sustained sales by major investors in these markets, a high-profile default by a major Borrower, movements in indices tied to these markets or related securities or investments, or a change in the market's perception of Senior Loans and investments with similar economic characteristics (such as second lien loans and unsecured loans) and Corporate Bonds. At any point in time, an investment in the common shares of the Fund may be worth less than the original amount invested, even after taking into account distributions paid by the Fund, if any, and the ability of common shareholders to reinvest dividends. The Fund intends to continue to utilize leverage, which will magnify the Fund's risks and, in turn, the risks to the common shareholders.
Semi Annual Report 2025
185
CION Ares Diversified Credit Fund
Notes to Consolidated Financial Statements (continued)
June 30, 2025 (Unaudited)
(in thousands, except per share data, percentages and as otherwise noted)
Market Disruption and Geopolitical Risk
U.S. and global markets recently have experienced increased volatility, which could be harmful to the Fund and issuers in which it invests. Such volatility may result in, amongst other things, write-offs, the re-pricing of credit risk or worsening general economic conditions, any of which could materially and adversely impact the broader financial and credit markets and reduce the availability of debt and equity capital for the market as a whole and financial services firms in particular. Continued market volatility and uncertainty and/or a downturn in market and economic and financial conditions, as a result of developments in the banking industry or otherwise (including as a result of delayed access to cash or credit facilities), could have an adverse impact on the Fund and issuers in which it invests.
Various social and political circumstances in the U.S. and around the world (including wars and other forms of conflict, terrorist acts, security operations and catastrophic events such as fires, floods, earthquakes, tornadoes, hurricanes and global health epidemics or outbreaks of infectious diseases), may also contribute to increased market volatility and economic uncertainties or deterioration in the U.S. and worldwide. Such events, including trade tensions between the United States and other countries, other uncertainties regarding actual and potential shifts in U.S. and foreign, trade, economic and other policies with other countries (including with respect to treaties and tariffs), the ongoing war between Russia and Ukraine and conflicts in the Middle East and health epidemics and pandemics, could adversely affect the Fund's business, financial condition or results of operations. Additionally, as a result of the 2024 U.S. election, the Republican Party currently controls both the executive and legislative branches of government, which increases the likelihood that legislation may be adopted that could significantly affect the regulation of U.S. financial markets. Regulatory changes could result in greater competition from banks and other lenders with which we compete for lending and other investment opportunities. The United States may also potentially withdraw from or renegotiate various trade agreements and take other actions that would change current trade policies of the United States. These market and economic disruptions could negatively impact the operating results of the Fund's portfolio companies. This could in turn materially reduce the Fund's net asset value and distributions and adversely affect the Fund's financial prospects and condition.
Tariff Risk
The United States has recently enacted and proposed to enact significant new tariffs. Additionally, the current presidential administration has directed various federal agencies to further evaluate key aspects of U.S. trade policy and there has been
ongoing discussion and commentary regarding potential significant changes to U.S. trade policies, treaties and tariffs. There continues to exist significant uncertainty about the future relationship between the U.S. and other countries with respect to such trade policies, treaties and tariffs. These developments, or the perception that any of them could occur, may have a material adverse effect on global economic conditions and the stability of global financial markets, and may significantly reduce global trade and, in particular, trade between the impacted nations and the U.S. Any of these factors could depress economic activity and restrict the Fund's portfolio companies' access to suppliers or customers and have a material adverse effect on their business, financial condition and results of operations, which in turn would negatively impact the Fund.
Interest Rate Risk
General interest rate fluctuations may have a negative impact on the Fund's investments and investment returns and, accordingly, may have a material adverse effect on the Fund's investment objective and net investment income. Because the Fund borrows money and may issue preferred stock to make investments, the Fund's net investment income is dependent upon the difference between the rate at which it borrows funds or pays dividends on such preferred stock and the rate at which it invests these funds.
The U.S. Federal Reserve decreased the federal funds rate multiple times in 2024 after a sustained period of historically high rates. Interest rate risk is the risk that prices of bonds and other fixed-income securities will increase as interest rates fall and decrease as rates rise. In periods of declining interest rates, the Fund may earn less interest income from investments and its cost of funds will also decrease, to a lesser extent, given certain of the Fund's currently outstanding indebtedness bears interest at fixed rates, resulting in lower net investment income. Conversely, in periods of rising interest rates, the Fund's interest income will increase as the majority of its portfolio bears interest at variable rates while the Fund's cost of funds will also increase, to a lesser extent, with the net impact being an increase to its net investment income. The magnitude of these fluctuations in the market price of bonds and other fixed-income securities is generally greater for those securities with longer maturities. Because Senior Loans with floating or variable rates reset their interest rates only periodically, changes in prevailing interest rates (and particularly sudden and significant changes) can be expected to cause some fluctuations in the net asset value of the Fund's common shares. In addition, Senior Loans or similar loans or securities may allow the Borrower to opt between SOFR-based interest rates and interest rates based on bank prime rates, which may have an effect on the net asset value of the Fund's common shares.
Semi Annual Report 2025
186
CION Ares Diversified Credit Fund
Notes to Consolidated Financial Statements (continued)
June 30, 2025 (Unaudited)
(in thousands, except per share data, percentages and as otherwise noted)
If general interest rates rise, there is a risk that the portfolio companies in which the Fund holds floating rate securities will be unable to pay escalating interest amounts, which could adversely impact their financial performance and result in a default under their loan documents. Rising interest rates could also cause portfolio companies to shift cash from other productive uses to the payment of interest, which may have a material adverse effect on their business and operations and could, over time, lead to increased defaults. In addition, rising interest rates may increase pressure on the Fund to provide fixed rate loans to the Fund's portfolio companies, which could adversely affect the Fund's net investment income, as increases in the cost of borrowed funds would not be accompanied by increased interest income from such fixed-rate investments.
Liquidity Risk
The Fund may not be able to readily dispose of illiquid securities or loans at prices that approximate those at which the Fund could sell the securities or loans if they were more widely traded and, as a result of that illiquidity, the Fund may have to sell other investments or engage in borrowing transactions if necessary to raise cash to meet its obligations. Limited liquidity can also affect the market price of securities, thereby adversely affecting the net asset value of the common shares and ability to make dividend distributions. The Fund's investments may not be readily marketable and may be subject to restrictions on resale. Generally, the Fund's investments are not listed on any national securities exchange and no active trading market may exist. When a secondary market exists, the market may be subject to irregular trading activity, wide bid/ask spreads and extended trade settlement periods. Further, the lack of an established secondary market for illiquid securities may make it more difficult to value such securities, which may negatively affect the price the Fund would receive upon disposition of such securities.
Duration and Maturity Risk
The Fund has no fixed policy regarding portfolio maturity or duration. Holding long duration and long maturity investments will expose the Fund to certain additional risks.
When interest rates rise, certain obligations will be paid off by the Borrower more slowly than anticipated, causing the value of these obligations to fall. Rising interest rates tend to extend the duration of securities, making them more sensitive to changes in interest rates. The value of longer-term securities generally changes more in response to changes in interest rates than shorter-term securities. As a result, in a period of rising interest rates, securities may exhibit additional volatility and may lose value.
When interest rates fall, certain obligations will be paid off by the Borrower more quickly than originally anticipated, and the
Fund may have to invest the proceeds in securities with lower yields. In periods of falling interest rates, the rate of prepayments tends to increase (as does price fluctuation) as Borrowers are motivated to pay off debt and refinance at new lower rates. During such periods, reinvestment of the prepayment proceeds by the Adviser will generally be at lower rates of return than the return on the assets that were prepaid. Prepayment reduces the yield to maturity and the average life of the security.
Special Situations and Stressed Investments Risk
Although investments in debt and equity securities and other obligations of companies that may be involved in significant financial or business distress, including companies involved in, or that have recently completed, bankruptcy or other reorganization and liquidation proceedings ("Stressed Issuers") (such investments, "Special Situation Investments") may result in significant returns for the Fund, they are speculative and involve a substantial degree of risk. The level of analytical sophistication, both financial and legal, necessary for successful investment in distressed assets is unusually high. Therefore, the Fund will be particularly dependent on the analytical abilities of the Adviser. In any reorganization or liquidation proceeding relating to a company in which the Fund invests, the Fund may lose its entire investment, may be required to accept cash or securities with a value less than the Fund's original investment and/or may be required to accept payment over an extended period of time. Among the risks inherent in investments in a troubled company is that it may be difficult to obtain information as to the true financial condition of such company. Troubled company investments and other distressed asset-based investments require active monitoring.
The Fund may make investments in Stressed Issuers when the Adviser believes it is reasonably likely that the Stressed Issuer will make an exchange offer or will be the subject to a plan of reorganization pursuant to which the Fund will receive new securities in return for a Special Situation Investment. There can be no assurance, however, that such an exchange offer will be made or that such a plan of reorganization will be adopted. In addition, a significant period of time may pass between the time at which the Fund makes its investment in the Special Situation Investment and the time that any such exchange offer or plan of reorganization is completed, if at all. During this period, it is unlikely that the Fund would receive any interest payments on the Special Situation Investment, the Fund would be subject to significant uncertainty whether the exchange offer or plan of reorganization will be completed and the Fund may be required to bear certain extraordinary expenses to protect and recover its investment. Therefore, to the extent the Fund seeks capital appreciation through investment in Special Situation Investments, the Fund's ability
Semi Annual Report 2025
187
CION Ares Diversified Credit Fund
Notes to Consolidated Financial Statements (continued)
June 30, 2025 (Unaudited)
(in thousands, except per share data, percentages and as otherwise noted)
to achieve current income for its shareholders may be diminished. The Fund also will be subject to significant uncertainty as to when, in what manner and for what value the obligations evidenced by Special Situation Investments will eventually be satisfied (e.g., through a liquidation of the obligor's assets, an exchange offer or plan of reorganization involving the Special Situation Investments or a payment of some amount in satisfaction of the obligation). Even if an exchange offer is made or plan of reorganization is adopted with respect to Special Situation Investments held by the Fund, there can be no assurance that the securities or other assets received by the Fund in connection with such exchange offer or plan of reorganization will not have a lower value or income potential than may have been anticipated when the investment was made or even no value. Moreover, any securities received by the Fund upon completion of an exchange offer or plan of reorganization may be restricted as to resale. Similarly, if the Fund participates in negotiations with respect to any exchange offer or plan of reorganization with respect to an issuer of Special Situation Investments, the Fund may be restricted from disposing of such securities. To the extent that the Fund becomes involved in such proceedings, the Fund may have a more active participation in the affairs of the issuer than that assumed generally by an investor.
To the extent that the Fund holds interests in a Stressed Issuer that are different (or more senior or junior) than those held by other funds and/or accounts managed by the Adviser or its affiliates ("Other Accounts"), the Adviser is likely to be presented with decisions involving circumstances where the interests of such Other Accounts may be in conflict with the Fund's interests. Furthermore, it is possible that the Fund's interest may be subordinated or otherwise adversely affected by virtue of such Other Accounts' involvement and actions relating to their investment. In addition, when the Fund and Other Accounts hold investments in the same Stressed Issuer (including in the same level of the capital structure), the Fund may be prohibited by applicable law from participating in restructurings, work-outs, renegotiations or other activities related to its investment in the Stressed Issuer absent an exemption due to the fact that Other Accounts hold investments in the same Stressed Issuer. As a result, the Fund may not be permitted by law to make the same investment decisions as Other Accounts in the same or similar situations even if the Adviser believes it would be in the Fund's best economic interests to do so. Also, the Fund may be prohibited by applicable law from investing in a Stressed Issuer (or an affiliate) that Other Accounts are also investing in or currently invest in even if the Adviser believes it would be in the best economic interests of the Fund to do so. Furthermore, entering into certain transactions that are not deemed prohibited by law
when made may potentially lead to a condition that raises regulatory or legal concerns in the future. This may be the case, for example, with Stressed Issuers who are near default and more likely to enter into restructuring or work-out transactions with their existing debt holders, which may include the Fund and its affiliates. In some cases, to avoid the potential of future prohibited transactions, the Adviser may not recommend allocating an investment opportunity to the Fund that it would otherwise recommend, subject to the Adviser's then-current allocation policy and any applicable exemptions.
The Fund may also invest in companies in expectation of a specific event or catalyst, which may be external (e.g., a macroeconomic event impacting relevant markets) or an event that is specific to the company (e.g., a Chapter 11 filing). Such event-driven investing requires the Fund to make judgments concerning (i) the likelihood that an event will occur; and (ii) the impact such event will have on the value of the Fund's investment in the relevant company. If the event fails to occur or it does not have the effect foreseen, significant losses can result.
Below Investment Grade Rating Risk
Debt instruments that are rated below investment grade are often referred to as "high yield" securities or "junk bonds." Below investment grade instruments are rated "Bal" or lower by Moody's, "BB+" or lower by S&P or "BB+" or lower by Fitch or, if unrated, are judged by the Adviser to be of comparable credit quality. While generally providing greater income and opportunity for gain, below investment grade debt instruments may be subject to greater risks than securities or instruments that have higher credit ratings, including a higher risk of default. The credit rating of an instrument that is rated below investment grade does not necessarily address its market value risk, and ratings may from time to time change, positively or negatively, to reflect developments regarding the Borrower's financial condition. Below investment grade instruments often are considered to be speculative with respect to the capacity of the Borrower to timely repay principal and pay interest or dividends in accordance with the terms of the obligation and may have more credit risk than higher rated securities. Lower grade securities and similar debt instruments may be particularly susceptible to economic downturns. It is likely that a prolonged or deepening economic recession could adversely affect the ability of some Borrowers issuing such debt instruments to repay principal and pay interest on the instrument, increase the incidence of default and severely disrupt the market value of the securities and similar debt instruments.
The secondary market for below investment grade instruments may be less liquid than that for higher rated instruments.
Semi Annual Report 2025
188
CION Ares Diversified Credit Fund
Notes to Consolidated Financial Statements (continued)
June 30, 2025 (Unaudited)
(in thousands, except per share data, percentages and as otherwise noted)
Because unrated securities may not have an active trading market or may be difficult to value, the Fund might have difficulty selling them promptly at an acceptable price. To the extent that the Fund invests in unrated securities, the Fund's ability to achieve its investment objective will be more dependent on the Adviser's credit analysis than would be the case when the Fund invests in rated securities.
Under normal market conditions, the Fund will invest in debt instruments rated in the lower rating categories ("Caal" or lower by Moody's, "CCC+" or lower by S&P or "CCC+" or lower by Fitch) or unrated and of comparable quality. For these securities, the risks associated with below investment grade instruments are more pronounced. The Fund may incur additional expenses to the extent it is required to seek recovery upon a default in the payment of principal or interest on its portfolio holdings. In any reorganization or liquidation proceeding relating to an investment, the Fund may lose its entire investment or may be required to accept cash or securities with a value substantially less than its original investment.
European Risk
The Fund may invest a portion of its capital in debt securities issued by issuers domiciled in Europe, including issuers domiciled in the United Kingdom. Concerns regarding the sovereign debt of various Eurozone countries, including the potential for investors to incur substantial write-downs, reductions in the face value of sovereign debt and/or sovereign defaults, as well as the possibility that one or more countries might leave the European Union (the "EU") or the Eurozone create risks that could materially and adversely affect the Fund's investments. Sovereign debt defaults and EU and/or Eurozone exits could have material adverse effects on the Fund's investments in European companies, including, but not limited to, the availability of credit to support such companies' financing needs, uncertainty and disruption in relation to financing, increased currency risk in relation to contracts denominated in Euros and wider economic disruption in markets served by those companies, while austerity and/or other measures introduced to limit or contain these issues may themselves lead to economic contraction and resulting adverse effects for the Fund. Legal uncertainty about the funding of Euro denominated obligations following any breakup or exits from the Eurozone, particularly in the case of investments in companies in affected countries, could also have material adverse effects on the Fund. In connection with investments in non-U.S. issuers, the Fund may engage in foreign currency exchange transactions but is not required to hedge its currency exposure. As such, the Fund makes investments that are denominated in British pound sterling or Euros. The Fund's assets are valued in U.S. dollars and the depreciation of the British pound sterling and/or the Euro in
relation to the U.S. dollar could adversely affect the Fund's investments denominated in British pound sterling or Euros that are not fully hedged regardless of the performance of the underlying issuer.
Litigation Risk
The Fund as well as the Adviser, the Sub-Adviser and its affiliates participate in a highly regulated industry and are each subject to regulatory examinations in the ordinary course of business. There can be no assurance that the Fund, its executive officers, trustees, and the Adviser, the Sub-Adviser, their affiliates and/or any of their respective principals and employees will avoid regulatory investigation and possible enforcement actions stemming therefrom. The Adviser and the Sub-Adviser are each registered investment advisers and, as such, subject to the provisions of the Advisers Act. The Fund the Adviser and the Sub-Adviser may each be, from time to time, subject to formal and informal examinations, investigations, inquiries, audits and reviews from numerous regulatory authorities both in response to issues and questions raised in such examinations or investigations and in connection with the changing priorities of the applicable regulatory authorities across the market in general.
The Fund, its executive officers, trustees, and the Adviser, the Sub-Adviser and their affiliates and/or any of their respective principals and employees could also be named as defendants in, or otherwise become involved in, litigation. Litigation and regulatory actions can be time-consuming and expensive and can lead to unexpected losses, which expenses and losses are often subject to indemnification by us. Legal proceedings could continue without resolution for long periods of time and their outcomes, which could materially and adversely affect the value of us or the ability of the Adviser or the Sub-Adviser to manage the Fund, are often impossible to anticipate. The Adviser or the Sub-Adviser would likely be required to expend significant resources responding to any litigation or regulatory action related to it, and these actions could be a distraction to the activities of the Adviser or the Sub-Adviser, as applicable.
The Fund's investment activities are subject to the normal risks of becoming involved in litigation by third parties. The expense of defending against claims by third parties and paying any amounts pursuant to settlements or judgments would, absent willful misfeasance, bad faith, gross negligence, or reckless disregard of the duties involved by the Adviser, Sub-Adviser, administrator, or any of the Fund's officers, be borne by the Fund and would reduce the Fund's net assets. The Adviser, the Sub-Adviser and others are indemnified by the Fund in connection with such litigation, subject to certain conditions.
Semi Annual Report 2025
189
CION Ares Diversified Credit Fund
Notes to Consolidated Financial Statements (continued)
June 30, 2025 (Unaudited)
(in thousands, except per share data, percentages and as otherwise noted)
(13) Subsequent Events
The Adviser has evaluated subsequent events through the date of issuance of the consolidated financial statements included herein. There have been no subsequent events that occurred during such period that would require disclosure or would be required to be recognized in the consolidated financial statements as of and for the six months ended June 30, 2025, except as discussed below:
The following common share distributions were declared for July and August 2025.
|
Class A |
Class C |
Class I |
Class L |
Class U |
Class U-2 |
Class W |
|||||||||||||||||||||||||
|
July 2025 |
|||||||||||||||||||||||||||||||
|
Record Date |
Daily |
Daily |
Daily |
Daily |
Daily |
Daily |
Daily |
||||||||||||||||||||||||
|
Payable Date |
July 31, 2025 |
July 31, 2025 |
July 31, 2025 |
July 31, 2025 |
July 31, 2025 |
July 31, 2025 |
July 31, 2025 |
||||||||||||||||||||||||
|
Monthly Per Share Amount |
$0.17229800 | $0.15418160 | $0.18054400 | $0.16967540 | $0.16367380 | $0.16347850 | $0.17062710 | ||||||||||||||||||||||||
|
August 2025 |
|||||||||||||||||||||||||||||||
|
Record Date |
Daily |
Daily |
Daily |
Daily |
Daily |
Daily |
Daily |
||||||||||||||||||||||||
|
Payable Date |
August 31, 2025 |
August 31, 2025 |
August 31, 2025 |
August 31, 2025 |
August 31, 2025 |
August 31, 2025 |
August 31, 2025 |
||||||||||||||||||||||||
|
Monthly Per Share Amount |
$0.17229800 | $0.15418160 | $0.18054400 | $0.16967540 | $0.16367380 | $0.16347850 | $0.17062710 | ||||||||||||||||||||||||
Semi Annual Report 2025
190
CION Ares Diversified Credit Fund
Additional Information
June 30, 2025 (Unaudited)
The policies and procedures used to determine how to vote proxies relating to securities held by CION Ares Diversified Credit Fund (the "Fund") are available (1) without charge, upon request, by calling 1-877-855-3434, (2) on the Fund's website at https://cioninvestments.com/resources/sec-filings/, and (3) on the SEC's website at https://www.sec.gov. Information regarding how the Fund voted proxies relating to portfolio securities during the most recent twelve-month period ended June 30 will be available on Form N-PX by August 31 of each year (1) without charge, upon request, by calling 1-877-855-3434, (2) on the Fund's website at https://cioninvestments.com/resources/sec-filings/ and (3) on the SEC's website at https://www.sec.gov.
Portfolio Information
The Fund files its complete schedule of portfolio holdings for the first quarter and the third quarter of each fiscal year on SEC Form N-PORT. The Fund's Form N-PORT reports are available (1) without charge, upon request, by calling 1-877-855-3434; or (2) on the SEC's website at http://www.sec.gov.
Semi Annual Report 2025
191
CION Ares Diversified Credit Fund
Additional Information (continued)
June 30, 2025 (Unaudited)
The Fund operates under a dividend reinvestment plan, (the "DRIP") administered by SS&C GIDS, Inc. ("SS&C GIDS"). Pursuant to the plan, the Fund's distributions, net of any applicable U.S. withholding tax, are reinvested in the same class of shares of the Fund.
Shareholders automatically participate in the DRIP, unless and until an election is made to withdraw from the plan on behalf of such participating shareholder. A shareholder who does not wish to have distributions automatically reinvested may terminate participation in the DRIP at any time by written instructions to that effect to SS&C GIDS. Shareholders who elect not to participate in the DRIP will receive all distributions in cash paid to the shareholder of record (or, if the shares are held in street or other nominee name, then to such nominee). Such written instructions must be received by the SS&C GIDS 30 days prior to the record date of the distribution or the shareholder will receive such distribution in shares through the DRIP. Under the DRIP, the Fund's distributions to shareholders are automatically reinvested in full and fractional shares as described below.
When the Fund declares a distribution, SS&C GIDS, on the shareholder's behalf, will receive additional authorized shares from the Fund either newly issued or repurchased from shareholders by the Fund and held as treasury stock. The number of shares to be received when distributions are reinvested will be determined by dividing the amount of the distribution by the Fund's net asset value per share.
SS&C GIDS will maintain all shareholder accounts and furnish written confirmations of all transactions in the accounts, including information needed by shareholders for personal and tax records. SS&C GIDS will hold shares in the account of the shareholders in non-certificated form in the name of the participant, and each shareholder's proxy, if any, will include those shares purchased pursuant to the DRIP. Each participant, nevertheless, has the right to request certificates for whole and fractional shares owned. The Fund will issue certificates in its sole discretion. SS&C GIDS will distribute all proxy solicitation materials, if any, to participating shareholders.
In the case of shareholders, such as banks, brokers or nominees, that hold shares for others who are beneficial owners participating under the DRIP, SS&C GIDS will administer the DRIP on the basis of the number of shares certified from time to time by the record shareholder as representing the total amount of shares registered in the shareholder's name and held for the account of beneficial owners participating under the DRIP.
Neither SS&C GIDS nor the Fund shall have any responsibility or liability beyond the exercise of ordinary care for any action taken or omitted pursuant to the DRIP, nor shall they have any duties, responsibilities or liabilities except such as expressly set forth herein. Neither shall they be liable hereunder for any act done in good faith or for any good faith omissions to act, including, without limitation, failure to terminate a participant's account prior to receipt of written notice of his or her death or with respect to prices at which shares are purchased or sold for the participants account and the terms on which such purchases and sales are made, subject to applicable provisions of the federal securities laws.
The automatic reinvestment of dividends will not relieve participants of any federal, state or local income tax that may be payable (or required to be withheld) on such dividends. The Fund reserves the right to amend or terminate the DRIP. There is no direct service charge to participants with regard to purchases under the DRIP; however, the Fund reserves the right to amend the DRIP to include a service charge payable by the participants.
All correspondence concerning the DRIP should be directed to SS&C GIDS at CION Ares Diversified Credit Fund c/o SS&C GIDS, Inc., P.O. Box 219422, Kansas City, MO 64121-9422. Certain transactions can be performed by calling the toll free number 888-729-4266.
Semi Annual Report 2025
192
CION Ares Diversified Credit Fund
Additional Information (continued)
June 30, 2025 (Unaudited)
Plan of Distribution
ALPS Distributors, Inc. located at 1290 Broadway, Suite 1000, Denver, CO 80203, serves as the Fund's principal underwriter and acts as the Distributor of the Fund's shares on a best efforts basis, subject to various conditions. The Fund's shares are offered for sale through the Distributor at net asset value plus the applicable sales load. The Distributor also may enter into agreements with financial intermediaries for the sale and servicing of the Fund's shares. In reliance on Rule 415 of the Securities Act, the Fund intends to offer to sell an unlimited number of common shares, on a continual basis, through the Distributor. No arrangement has been made to place funds received in an escrow, trust or similar account. The Distributor is not required to sell any specific number or dollar amount of the Fund's shares, but will use its best efforts to solicit orders for the purchase of the shares. Shares of the Fund will not be listed on any national securities exchange and the Distributor will not act as a market marker in Fund shares.
The Distributor has entered into a wholesale marketing agreement with CION Securities, a registered broker-dealer and an affiliate of CION. Pursuant to the terms of the wholesale marketing agreement, CION Securities will seek to market and otherwise promote the Fund through various wholesale distribution channels, including regional and independent retail broker-dealers and registered investment advisers.
CION Securities has also entered into a dealer manager agreement with the Fund pursuant to which CION Securities has agreed to provide certain marketing and wholesale services in consideration of its receipt of the dealer manager fee.
CION Ares Management LLC (the "Adviser") or its affiliates, in the Adviser's discretion and from their own resources, may pay additional compensation to financial intermediaries in connection with the sale of the Fund's shares. In return for the additional compensation, the Fund may receive certain marketing advantages including access to a financial intermediaries' registered representatives, placement on a list of investment options offered by a financial intermediary, or the ability to assist in training and educating the financial intermediaries. The additional compensation may differ among financial intermediaries in amount or in the manner of calculation: payments of additional compensation may be fixed dollar amounts, or based on the aggregate value of outstanding shares held by shareholders introduced by the financial intermediary, or determined in some other manner. The receipt of additional compensation by a selling financial intermediary may create potential conflicts of interest between an investor and its financial intermediary who is recommending the Fund over other potential investments. Additionally, the Fund pays a servicing fee to the financial intermediaries or financial institution for providing ongoing services in respect of clients holding shares of the Fund. Such services may include electronic processing of client orders, electronic fund transfers between clients and the Fund, account reconciliations with the Fund's transfer agent, facilitation of electronic delivery to clients of Fund documentation, monitoring client accounts for back-up withholding and any other special tax reporting obligations, maintenance of books and records with respect to the foregoing, and such other information and ongoing liaison services as the Fund or the Adviser may reasonably request.
The Fund and the Adviser have agreed to indemnify the Distributor against certain liabilities, including liabilities under the Securities Act, or to contribute to payments the Distributor may be required to make because of any of those liabilities. Such agreement does not include indemnification of the Distributor against liability resulting from willful misfeasance, bad faith or negligence on the part of the Distributor in the performance of its duties or from reckless disregard by the Distributor of its obligations and duties under the Distribution Agreement.
Semi Annual Report 2025
193
CION Ares Diversified Credit Fund
Additional Information (continued)
June 30, 2025 (Unaudited)
CION Ares Management, LLC
100 Park Avenue, 25th Floor
New York, NY 10017
Administrator
ALPS Fund Services, Inc. and SS&C Technologies, Inc.
1290 Broadway, Suite 1000
Denver, CO 80203
Custodian
State Street Bank and Trust Company
One Congress Street
Boston, MA 02114
Transfer Agent and DRIP Administrator
SS&C GIDS, Inc.
333 W 11th Street
Kansas City, MO 64105
Distributor
ALPS Distributors, Inc.
1290 Broadway, Suite 1000
Denver, CO 80203
Independent Registered Public Accounting Firm
Ernst & Young LLP
725 S. Figueroa Street
Los Angeles, CA 90017
Fund Counsel
Willkie Farr & Gallagher LLP
787 Seventh Avenue
New York, NY 10019
Semi Annual Report 2025
194
CION Ares Diversified Credit Fund
Additional Information (continued)
June 30, 2025 (Unaudited)
We are committed to maintaining the privacy of our shareholders and to safeguarding their nonpublic personal information. The following information is provided to help you understand what personal information we collect, how we protect that information and why, in certain cases, we may share information with select other parties.
Generally, we will not receive any non-public personal information about shareholders of the common shares of the Fund, although certain of our shareholders' non-public information may become available to us. The non-public personal information that we may receive falls into the following categories:
• Information we receive from shareholders, whether we receive it orally, in writing or electronically. This includes shareholders' communications to us concerning their investment;
• Information about shareholders' transactions and history with us; or
• Other general information that we may obtain about shareholders, such as demographic and contact information such as address.
• We do not disclose any non-public personal information about shareholders, except:
• to our affiliates (such as our investment adviser) and their employees that have a legitimate business need for the information;
• to our service providers (such as our administrator, accountants, attorneys, custodians, transfer agent, underwriter and proxy solicitors) and their employees as is necessary to service shareholder accounts or otherwise provide the applicable service;
• to comply with court orders, subpoenas, lawful discovery requests, or other legal or regulatory requirements; or
• as allowed or required by applicable law or regulation.
When the Fund shares non-public shareholder personal information referred to above, the information is made available for limited business purposes and under controlled circumstances designed to protect our shareholders' privacy. The Fund does not permit use of shareholder information for any non-business or marketing purpose, nor does the Fund permit third parties to rent, sell, trade or otherwise release or disclose information to any other party.
The Fund's service providers, such as their adviser, administrator, and transfer agent, are required to maintain physical, electronic, and procedural safeguards to protect shareholder nonpublic personal information; to prevent unauthorized access or use; and to dispose of such information when it is no longer required.
Personnel of affiliates may access shareholder information only for business purposes. The degree of access is based on the sensitivity of the information and on personnel need for the information to service a shareholder's account or comply with legal requirements.
If a shareholder ceases to be a shareholder, we will adhere to the privacy policies and practices as described above. We may choose to modify our privacy policies at any time. Before we do so, we will notify shareholders and provide a description of our privacy policy.
In the event of a corporate change in control resulting from, for example, a sale to, or merger with, another entity, or in the event of a sale of assets, we reserve the right to transfer your non-public personal information to the new party in control or the party acquiring assets.
Semi Annual Report 2025
195
CION Ares Diversified Credit Fund
Additional Information (continued)
June 30, 2025 (Unaudited)
Board of Trustees and Executive Officers
Trustees
Information regarding the members of the Board is set forth below. The Trustees have been divided into two groups — Interested Trustees and Independent Trustees. As set forth in the Fund's declaration of trust, each Trustee's term of office shall continue until his or her death, resignation or removal.
|
Name, Address(1) and Year of Birth |
Position(s) Held with the Trust |
Term of Office and Length of Time Served |
Principal Occupation(s) During Past 5 Years |
Number of Portfolios in Fund Complex Overseen by Trustee (including the Fund)(2) |
Other Directorships Held by Trustee |
||||||||||||||||||
|
Interested Trustees(3) |
|||||||||||||||||||||||
|
Mark Gatto 1972 |
Trustee |
2016 |
Co-Chief Executive Officer and Co-President, CION Investment Group, LLC and Co-Chief Executive Officer, CION Investment Corporation; Director, CION Ares Management, LLC |
1 |
CION Investment Corporation; CION Grosvenor Infrastructure Fund, CION Grosvenor Infrastructure Master Fund, LLC, CION Grosvenor Management, LLC |
||||||||||||||||||
|
Mitch Goldstein 1967 |
Trustee |
2016 |
Partner of Ares Management Corporation; Co-Chairperson, Ares Capital Corporation; Co-Chief Executive Officer, Ares Strategic Income Fund |
3 |
Ares Capital Corporation; Ares Strategic Income Fund |
||||||||||||||||||
|
Michael A. Reisner 1970 |
Trustee |
2016 |
Co-Chief Executive Officer and Co-President, CION Investment Group, LLC and Co-Chief Executive Officer, CION Investment Corporation; Director, CION Ares Management, LLC |
1 |
CION Investment Corporation |
||||||||||||||||||
|
David A. Sachs 1959 |
Trustee and Chairperson of the Board |
2016 |
Partner of Ares Management Corporation |
3 |
Terex Corporation (Capital Goods); Ares Dynamic Credit Allocation Fund, Inc.; Ares Private Markets Fund |
||||||||||||||||||
Semi Annual Report 2025
196
CION Ares Diversified Credit Fund
Additional Information (continued)
June 30, 2025 (Unaudited)
Trustees
|
Name, Address(1) and Year of Birth |
Position(s) Held with the Trust |
Term of Office and Length of Time Served |
Principal Occupation(s) During Past 5 Years |
Number of Portfolios in Fund Complex Overseen by Trustee (including the Fund)(2) |
Other Directorships Held by Trustee |
||||||||||||||||||
|
Independent Trustees |
|||||||||||||||||||||||
|
Karin Kissane 1970 |
Trustee |
2025 |
Serves on board of Zellerbach Family Foundation |
1 |
None |
||||||||||||||||||
|
Elaine Orr 1966 |
Trustee |
2022 |
Serves on various fund and pension boards |
2 |
Ares Dynamic Credit Allocation Fund, Inc. |
||||||||||||||||||
|
Jeffrey Perlowitz 1956 |
Trustee |
2020 |
Independent Consultant |
2 |
PennyMac Financial Services, Inc.; Ares Dynamic Credit Allocation Fund, Inc. |
||||||||||||||||||
|
John Joseph Shaw 1951 |
Trustee |
2016 |
Independent Consultant |
2 |
Ares Dynamic Credit Allocation Fund, Inc. |
||||||||||||||||||
|
Mark R. Yosowitz 1968 |
Trustee |
2016 |
From 2019 to present, senior executive and General Counsel, LeagueApps Inc.; from 2014 to present, Adjunct Professor, Brooklyn Law School; from 2014 to 2020, President, Mentored Inc. |
1 |
None |
||||||||||||||||||
(1) The address of each Trustee is care of the Corporate Secretary of the Fund at 1800 Avenue of the Stars, Suite 1400, Los Angeles, CA 90067.
(2) The term "Fund Complex" means two or more registered investment companies that share the same investment adviser or have an investment adviser that is an affiliated person of the investment adviser of any of the other registered investment companies or hold themselves out to investors as related companies for the purpose of investment and investor services.
(3) "Interested person," as defined in the Investment Company Act, of the Fund. Mark Gatto, Mitch Goldstein, Michael Reisner and David Sachs are interested persons of the Fund due to their affiliation with the Adviser.
Semi Annual Report 2025
197
CION Ares Diversified Credit Fund
Additional Information (continued)
June 30, 2025 (Unaudited)
Executive Officers
|
Name, Address(1) and Year of Birth |
Position(s) Held with the Trust |
Term of Office and Length of Time Served |
Principal Occupation(s) During Past 5 Years |
||||||||||||
|
John Atherton 1981 |
Vice President and Assistant Secretary |
2018 |
John Atherton is a Partner and General Counsel, Europe in the Ares Legal and Compliance Group. John Atherton joined Ares in 2018. |
||||||||||||
|
Joshua Bloomstein 1973 |
Vice President and Assistant Secretary |
2016 |
Joshua Bloomstein serves as a Partner and General Counsel (Credit) and Deputy General Counsel (Corporate) of Ares Management Corporation. Joshua Bloomstein is General Counsel, Vice President and Secretary of Ares Capital Corporation ("ARCC"), General Counsel and Secretary of Ares Strategic Income Fund ("ASIF") and Vice President and Assistant Secretary of Ares Dynamic Credit Allocation Fund, Inc. ("ARDC"). Joshua Bloomstein joined Ares in 2006. |
||||||||||||
|
Paul Cho 1982 |
Vice President |
2024 |
Paul Cho is a Managing Director and Chief Accounting Officer in the Ares Finance and Accounting Department. Paul Cho additionally serves as Chief Accounting Officer of ARCC and ASIF, and as a Vice President of ARDC. Paul Cho joined Ares in 2008. |
||||||||||||
|
Michael Dennis 1976 |
Vice President |
2017 |
Michael Dennis is a Partner and Co-Head of European Credit in the Ares Credit Group. Michael Dennis serves on the Ares Operating Committee. Additionally, Michael Dennis serves as a member of the Ares Credit Group's European Direct Lending and European Liquid Credit Investment Committees, and the Ares Asia Direct Lending (Australia) Investment Committee. Michael Dennis joined Ares in 2007. |
||||||||||||
|
Kevin Early 1971 |
Vice President |
2017 |
Kevin Early is a Partner and Chief Financial Officer, International & Global Direct Lending Private Funds in the Ares Finance and Accounting Department. Kevin Early joined Ares in 2012. |
||||||||||||
|
Anton Feingold 1980 |
Vice President and Assistant Secretary |
2016 |
Anton Feingold is a Partner and Associate General Counsel in the Ares Legal and Compliance Group and Assistant Secretary of Ares Management Corporation. Anton Feingold also serves as General Counsel, Vice President and Secretary of Ares Commercial Real Estate Corporation. Anton Feingold joined Ares in 2014. |
||||||||||||
|
Ian Fitzgerald 1975 |
General Counsel and Corporate Secretary |
2019 |
Ian Fitzgerald is a Managing Director and Deputy General Counsel (Credit) in the Ares Legal and Compliance Group. Additionally, Ian Fitzgerald serves as General Counsel and Corporate Secretary of ARDC. Ian Fitzgerald also serves as Vice President and Assistant Secretary of Ivy Hill Asset Management, L.P. ("IHAM") and Vice President and Assistant Secretary of Ivy Hill Asset Management GP, LLC, IHAM's General Partner ("IHAM GP"). Ian Fitzgerald joined Ares in 2010. |
||||||||||||
|
Mark Gatto 1972 |
Co-President and Co-Chief Executive Officer |
2016 |
Mark Gatto is Co-Chief Executive Officer and Co-President of CION Investment Group, LLC as well as Co-Chief Executive Officer of CION Investment Corp. ("CIC"). Mark Gatto serves on the investment committee of CIC. In addition, Mark Gatto is a Director of CION Ares Management, LLC. Mark Gatto joined CION in 1999. |
||||||||||||
|
Mitch Goldstein 1967 |
Vice President |
2016 |
Mitch Goldstein is a Partner and Co-Head of the Ares Credit Group. Mitch Goldstein serves on the Ares Operating Committee. Additionally, Mitch Goldstein serves as Director and Co-Chairperson of ARCC and an interested trustee and Co-Chief Executive Officer of ASIF. Mitch Goldstein also serves on the Board of Managers of IHAM GP. Mitch Goldstein is a member of the Ares Credit Group's U.S. Direct Lending, Commercial Finance, Pathfinder and the Ivy Hill Asset Management Investment Committees, the Ares Infrastructure Debt Investment Committee and the Ares Asia Direct Lending (Australia) Investment Committee. Mitch Goldstein joined Ares Management in 2005. |
||||||||||||
Semi Annual Report 2025
198
CION Ares Diversified Credit Fund
Additional Information (continued)
June 30, 2025 (Unaudited)
Executive Officers
|
Name, Address(1) and Year of Birth |
Position(s) Held with the Trust |
Term of Office and Length of Time Served |
Principal Occupation(s) During Past 5 Years |
||||||||||||
|
Blair Jacobson 1972 |
Vice President |
2017 |
Blair Jacobson is a Partner and Co-President of Ares Management Corporation. Blair Jacobson also serves on the boards of Ares Management Limited and Ares Management UK Limited. Additionally, Blair Jacobson serves on the Ares Credit Group's European Direct Lending and European Liquid Credit Investment Committees, the Ares Secondaries Group's Credit Investment Committee and the Ares Sports, Media and Entertainment Investment Committee. Previously, Blair Jacobson served as Co-Head of European Credit in the Ares Credit Group until 2025. Blair Jacobson joined Ares in 2012. |
||||||||||||
|
Keith Kooper 1975 |
Vice President and Assistant Secretary |
2016 |
Keith Kooper is a Partner and Co-General Counsel (Real Estate) in the Ares Legal and Compliance Group. Keith Kooper also serves as Vice President and Assistant Secretary of Ares Commercial Real Estate Corporation. Keith Kooper joined Ares in 2013. |
||||||||||||
|
Angela Lee 1986 |
Vice President |
2024 |
Angela Lee is a Managing Director in the Ares Finance and Accounting Department. Angela Lee additionally serves as Vice President and Assistant Treasurer of ARCC and ASIF, and as a Vice President of ARDC. Angela Lee joined Ares in 2010. |
||||||||||||
|
Scott Lem 1977 |
Chief Financial Officer Treasurer |
2019 2024 |
Scott Lem is a Partner and Chief Financial Officer of the Public Credit Funds in the Ares Finance and Accounting Department. Scott Lem additionally serves as Chief Financial Officer and Treasurer of ARCC, ASIF and ARDC. Scott Lem joined Ares in 2003. |
||||||||||||
|
Greg Margolies 1966 |
Vice President |
2016 |
Greg Margolies is a Partner in the Ares Credit Group. Additionally, Greg Margolies serves as a member of the Ares Credit Group's Opportunistic Credit Investment Committees and is on the Board of Directors of the Ares Charitable Foundation. Greg Margolies joined Ares in 2009. |
||||||||||||
|
Lisa Morgan 1976 |
Chief Compliance Officer |
2021 |
Lisa Morgan is a Partner and Chief Compliance Officer, Registered Products in the Ares Legal and Compliance Group. Lisa Morgan also serves as the Chief Compliance Officer of ARCC, Ares Private Markets Fund ("APMF"), ASIF, ARDC and Ares Core Infrastructure Fund ("ACI"). Lisa Morgan joined Ares in 2017. |
||||||||||||
|
Michael Reisner 1970 |
Co-President and Co-Chief Executive Officer |
2016 |
Michael Reisner is Co-Chief Executive Officer and Co-President of CION Investment Group, LLC as well as Co-Chief Executive Officer of CIC. Michael Reisner serves on the investment committee of CIC. In addition, Michael Reisner is a Director of CION Ares Management, LLC. Michael Reisner joined CION in 2001. |
||||||||||||
|
Naseem Sagati Aghili 1981 |
Vice President and Assistant Secretary |
2019 |
Naseem Sagati Aghili is a Partner, General Counsel and Corporate Secretary of Ares Management. Additionally, Naseem Sagati Aghili serves on the Ares Operating and Enterprise Risk Committees. Naseem Sagati Aghili also serves as Chief Legal Officer, Vice President and Assistant Secretary of APMF and as a Vice President of ARCC, ASIF, ARDC and ACI. Prior to being named the firm's General Counsel in 2020, Naseem Sagati Aghili served in a variety of roles at Ares Management, including most recently as Co-General Counsel, Deputy General Counsel and General Counsel of Private Equity. Naseem Sagati Aghili joined Ares in 2009. |
||||||||||||
|
Gregg Schill 1981 |
Vice President |
2016 |
Gregg Schill is Senior Managing Director of CION Investment Group, LLC. Prior to this, Gregg Schill served as Managing Director since 2012. Gregg Schill joined CION in 2001. |
||||||||||||
Semi Annual Report 2025
199
CION Ares Diversified Credit Fund
Additional Information (continued)
June 30, 2025 (Unaudited)
Executive Officers
|
Name, Address(1) and Year of Birth |
Position(s) Held with the Trust |
Term of Office and Length of Time Served |
Principal Occupation(s) During Past 5 Years |
||||||||||||
|
Michael Smith 1971 |
Vice President |
2024 |
Michael Smith is a Partner and Co-Head of the Ares Credit Group and a member of the Ares Operating Committee. Michael Smith additionally serves as Director and Co-Chairperson of ARCC and as an interested trustee and Co-Chief Executive Officer of ASIF. Michael Smith is a member of the Ares Credit Group's U.S. Direct Lending, Opportunistic Credit and Commercial Finance Investment Committees, the Ivy Hill Asset Management Investment Committee, the Ares Secondaries Group's Private Equity Investment Committee, and the Ares Infrastructure Group's Infrastructure Opportunities, Climate Infrastructure Partners and Infrastructure Debt Investment Committees. Michael Smith joined Ares in 2004. |
||||||||||||
(1) The address of each officer is care of the Corporate Secretary of the Fund at 1800 Avenue of the Stars, Suite 1400, Los Angeles, CA 90067.
The Statement of Additional Information (SAI) includes additional information about the board members and is available, without charge, upon request. Shareholders may call 888-729-4266 to request the SAI.
Semi Annual Report 2025
200
CION Ares Diversified Credit Fund
Additional Information (continued)
June 30, 2025 (Unaudited)
Approval of Investment Advisory Agreement and Investment Sub-Advisory Agreement
The Board of Trustees (the "Board") of CION Ares Diversified Credit Fund (the "Fund"), a majority of whom are not "interested persons" (as defined in the Investment Company Act of 1940, as amended (the "1940 Act")) of the Fund (the "Independent Trustees"), renewed the Third Amended and Restated Investment Advisory Agreement between the Fund and CION Ares Management LLC (the "Adviser") and the Investment Sub-Advisory Agreement by and among the Adviser, Ares Capital Management II LLC (the "Sub-Adviser") and the Fund (the "Agreements") at a meeting held on May 7, 2025 (the "Meeting").
The Fund's Board has the responsibility under the 1940 Act to consider the renewal of the Fund's Agreements on an annual basis called for the purpose of voting on such renewal. In addition, the Fund's Board generally receives, reviews and evaluates information concerning the services and personnel of the Adviser and the Sub-Adviser (together the "Advisers") and their affiliates at quarterly meetings of the Board. While particular emphasis might be placed on information concerning the Fund's investment performance, comparability of fees, total expenses and profitability at any meeting at which a renewal of the Agreements is considered, the process of evaluating the Advisers' and the Fund's investment advisory and administrative arrangements is an ongoing one.
In connection with the renewal of the Agreements, the Independent Trustees met with their independent counsel in executive session. Counsel to the Independent Trustees reviewed with the Independent Trustees a memorandum outlining the legal duties of the Board under the 1940 Act and applicable state law and discussed the factors outlined by the federal courts as relevant to a board's consideration of the approval of an investment advisory agreement.
In considering whether to renew the Agreements, the Fund's Board reviewed certain information provided to the Board by the Advisers in advance of the Meeting, and supplemented orally at the Meeting, including, among other things, information concerning the services rendered to the Fund by the Advisers, comparative fee, expense and performance information, and other reports of and presentations by representatives of the Sub-Adviser concerning the Fund's and Advisers' operations, compliance programs and risk management. The Board also reviewed a report prepared by Broadridge, an independent third-party data provider, that included comparative fee and performance information showing the Fund's performance for various periods ended March 31, 2025 and expenses as compared to the performance and expenses of a group of leveraged, closed-end interval funds ("Peer Group") as selected by Broadridge.
In determining whether to renew the Agreements, the Board considered all factors that it believed to be relevant, including those discussed below. The Board did not identify any one factor as dispositive, and each Trustee may have attributed different weights to the factors considered.
(a) The nature, extent and quality of services to be provided by the Advisers — With respect to the nature, extent and quality of services to be provided by the Advisers, the Board reviewed the information regarding the types of services to be provided under the Agreements and information describing the Advisers' organization and business, including the quality of the investment research capabilities of the Advisers and the other resources dedicated to performing services for the Fund. The Board noted the professional experience and qualifications of the Fund's portfolio management team and other senior personnel of the Advisers involved with the Fund, including the portfolio management team's expertise in managing securities in which the Fund invests, the integrated platforms of the Advisers and their affiliates and the benefits, resources and opportunities of the platforms that the Advisers are able to access. Fund management discussed the size and experience of the Advisers' staff, the experience of their key personnel in providing investment management services, including the members of the Sub-Adviser's allocation committee, the systems used by the Advisers' personnel and the ability of the Advisers to attract and retain capable personnel. The quality of administrative and other services, including the Adviser's role in coordinating the activities of the Fund's other service providers, was also considered. The Board also noted the reputation and track record of the Advisers' organizations as leading managers of credit assets.
(b) Investment performance of the Fund and the Advisers — With respect to investment performance of the Fund and the Advisers, the Board reviewed statistical information concerning the Fund's investment performance in relation to its stated objective, as well as comparative data with respect to the performance of the Fund's Peer Group. Representatives of the Advisers reviewed with the Board the Fund's performance. In connection with its review, the Board discussed the results of the performance comparisons with the Peer Group. The Board noted that the Fund's total return performance,
Semi Annual Report 2025
201
CION Ares Diversified Credit Fund
Additional Information (continued)
June 30, 2025 (Unaudited)
on a net asset value basis, had underperformed the median return of the Peer Group for the 1-year and year-to-date periods ended March 31, 2025, but it also noted that the Fund's performance had outperformed the median return of the Peer Group in each of the 3-and 5-year periods, as well as the period since inception ended March 31, 2025.
(c) Cost of the services to be provided and profits to be realized by the Advisers from the relationship with the Fund — The Board considered information about the profitability of the Fund to the Advisers, as well as the costs of services provided by the Advisers to the Fund. The Board received and reviewed information relating to the financial condition of the Advisers and their affiliates. Representatives of the Advisers reviewed the expenses allocated and profit received by the Advisers and their affiliates and the resulting profitability percentage for managing the Fund and the method used to determine the expenses and profit.
The Board also considered that the Adviser pays the Sub-Adviser a portion of its advisory fee as compensation for the sub-advisory services.
(d) Economies of scale and whether fee levels reflect these economies of scale — The Board considered the extent to which economies of scale are expected to be realized and whether fee levels reflect these economies of scale. The Trustees noted that the direct origination strategies used by the Fund have limited scalability and require additional resources as assets grow due to the need to originate new loans in which to invest. The Trustees noted the possibility of economies of scale related to non-advisory services that may inure to the benefit of the Fund.
(e) Comparison of services to be rendered and fees to be paid to those under other investment advisory contracts, such as contracts of the same and other investment adviser or other clients — In evaluating the Management Fee and expenses, the Board considered the Fund's management fees and the Fund's expense ratios in absolute terms and as compared with the fees and expenses of the Peer Group. Based upon the comparative fee information provided, the Board noted that the Fund's contractual management fees were generally in line with the median of the Peer Group, although the Fund's total expenses exceeded the Peer Group median. The Board considered that the Agreements provide that the Advisers may earn an incentive fee and, to the extent the fee is earned and paid, would result in a higher rate of total compensation from the Fund to the Advisers than the base-management fee rate stated in the Agreements. In addition, the Board also noted the reputation and track record of the Advisers' organization as leading managers of credit assets.
In discussing the Fund's management fees and expenses, representatives of the Advisers noted, among other things, that the Advisers believe the management fees and expenses are reasonable when compared to, and are consistent with, other similar funds and portfolios, particularly in light of the Fund's performance. Representatives of the Advisers also noted that the Fund's investment strategy of investing in a portfolio of directly originated loans, secured floating and fixed rate syndicated loans, corporate bonds, asset-backed securities, commercial real estate loans and other types of credit instruments requires additional expertise and expense related to trade support, pricing and valuation, marketing, investor education and regulatory monitoring.
(f) Benefits derived or to be derived by the Advisers from their relationship with the Fund — The Board also considered the extent to which benefits other than the fees and reimbursement amounts might accrue to the Advisers and their affiliates from their relationships with the Fund. The Board noted in this regard that, while certain funds and accounts managed by the Advisers may engage from time to time in cross trade and co-investment transactions with the Fund as permitted by the 1940 Act, neither the Adviser or its affiliate execute portfolio transactions on behalf of the Fund, and that the Sub-Adviser had confirmed that the Fund does not obtain research (or "Soft Dollars") from trades made on behalf of the Fund. However, the Board recognized that the Advisers might derive reputational and other benefits from their association with the Fund, including access to a different investor base than historically serviced by the Sub-Advisor and its affiliates.
Conclusion
At the conclusion of these discussions, the Board agreed that it had been furnished with information sufficiently responsive to allow it to make an informed business decision with respect to the renewal of the Agreements. Based on the discussions and considerations at the Meeting, and in reliance on information received on a routine and regular basis through the year relating to the operations of the Fund and the investment management and other services provided under the Agreements, the Board, including the Independent Trustees, supported the approval of the renewal of the Agreements for an additional one-year period ending May 22, 2026.
Semi Annual Report 2025
202
(This page intentionally left blank.)
Semi Annual Report 2025
203
(This page intentionally left blank.)
Semi Annual Report 2025
204

(b) Not applicable.
Item 2. Code of Ethics.
Not applicable for this filing.
Item 3. Audit Committee Financial Expert.
Not applicable for this filing.
Item 4. Principal Accountant Fees and Services.
Not applicable for this filing.
Item 5. Audit Committee of Listed Registrants.
Not applicable for this filing.
Item 6. Investments.
(a) Schedule of Investments is included as part of Item 1 of this Form N-CSR.
(b) Not applicable.
Item 7. Financial Statements and Financial Highlights for Open-End Management Investment Companies.
Not applicable.
Item 8. Changes in and Disagreements with Accountants for Open-End Management Investment Companies.
Not applicable.
Item 9. Proxy Disclosures for Open-End Management Investment Companies.
Not applicable.
Item 10. Remuneration Paid to Directors, Officers, and Others of Open-End Management Investment Companies.
Not applicable.
Item 11. Statement Regarding Basis for Approval of Investment Advisory Contract.
A statement regarding the basis for approval of the Fund’s investment advisory and sub-advisory contracts is included as part of the Report to Stockholders filed under Item 1 of this report.
Item 12. Disclosure of Proxy Voting Policies and Procedures for Closed-End Investment Companies.
Not applicable for this filing.
Item 13. Portfolio Managers of Closed-End Management Investment Companies.
(a)(1) Not applicable for this filing.
(a)(2) Not applicable for this filing.
(a)(3) Not applicable for this filing.
(a)(4) Not applicable for this filing.
(b) There have been no changes, as of the date of this filing, to the portfolio managers identified in the most recently filed annual report on Form N-CSR (811-23165) for CION Ares Diversified Credit Fund (the “Fund”).
Item 14. Purchases of Equity Securities by Closed-End Management Investment Company and Affiliated Purchasers.
None during the period covered by this Form N-CSR filing pursuant to a plan or program.
Item 15. Submission of Matters to a Vote of Security Holders.
There have been no material changes to the procedures by which shareholders may recommend nominees to the Fund’s Board of Trustees during the period covered by this Form N-CSR filing.
Item 16. Controls and Procedures.
| (a) | The Fund’s principal executive and principal financial officers have concluded that the Fund’s disclosure controls and procedures (as defined in Rule 30a-3(c) under the 1940 Act) (17 CFR 270.30a-3(c)) are effective, as of a date within 90 days of the filing date of this Form N-CSR based on their evaluation of these controls and procedures required by Rule 30a-3(b) under the 1940 Act (17 CFR 270.30a-3(b)) and Rules 13a-15(b) or 15d-15(b) under the 1934 Act, as amended (17 CFR 240.13a-15(b) or 240.15d-15(b)). |
| (b) | There were no changes in the Fund’s internal control over financial reporting (as defined in Rule 30a-3(d) under the 1940 Act (17 CFR 270.30a-3(d))) that occurred during the period covered by this report that has materially affected, or is reasonably likely to materially affect, the Fund’s internal control over financial reporting. |
Item 17. Disclosure of Securities Lending Activities for Closed-End Management Investment Companies.
| (a) | Not applicable. |
| (b) | Not applicable. |
Item 18. Recovery of Erroneously Awarded Compensation.
(a) Not applicable.
(b) Not applicable.
Item 19. Exhibits.
| (a)(1) | Not applicable for this filing. |
| (a)(2) | Not applicable for this filing. |
| (a)(3) | The certifications required by Rule 30a-2(a) under the 1940 Act (17 CFR 270.30a-2(a)) are attached hereto. |
| (a)(4) | Not applicable. |
| (a)(5) | Not applicable. |
| (b) | The certifications required by Rule 30a-2(b) under the 1940 Act (17 CFR 270.30a-2(b)) and Section 906 of the Sarbanes-Oxley Act of 2002 are attached hereto. |
SIGNATURES
Pursuant to the requirements of the Securities Exchange Act of 1934 and the Investment Company Act of 1940, the Fund has duly caused this report to be signed on its behalf by the undersigned, thereunto duly authorized.
CION ARES DIVERSIFIED CREDIT FUND
| By: | /s/ Michael A. Reisner | |
| Michael A. Reisner | ||
| Co-President and Co-Chief Executive Officer | ||
| Date: | September 5, 2025 |
| By: | /s/ Mark Gatto | |
| Mark Gatto | ||
| Co-President and Co-Chief Executive Officer | ||
| Date: | September 5, 2025 |
Pursuant to the requirements of the Securities Exchange Act of 1934 and the Investment Company Act of 1940, this report has been signed below by the following persons on behalf of the Fund and in the capacities and on the dates indicated.
| By: | /s/ Michael A. Reisner | |
| Michael A. Reisner | ||
| Co-President and Co-Chief Executive Officer | ||
| Date: | September 5, 2025 |
| By: | /s/ Mark Gatto | |
| Mark Gatto | ||
| Co-President and Co-Chief Executive Officer | ||
| Date: | September 5, 2025 |
| By: | /s/ Scott C. Lem | |
| Scott C. Lem | ||
| Chief Financial Officer | ||
| Date: | September 5, 2025 |