
Delivering A New Generation Of Integrin Medicines March 2024
This presentation contains “forward-looking” statements within the meaning of the “safe harbor” provisions of the Private Securities Litigation Reform Act of 1995, including, but not limited to statements regarding the timing and success of Morphic’s ongoing clinical trials and related data, updates and results from Morphic’s clinical trials and the potential therapeutic benefits of MORF-057. Certain data in this presentation are based on cross-study comparisons and are not based on any head-to-head clinical trials. Cross-study comparisons are inherently limited and may suggest misleading similarities and differences. The values shown in the cross-study comparisons are directional and may not be directly comparable. Statements including words such as “believe,” “plan,” “continue,” “expect,” “will,” “develop,” “signal,” “potential,” or “ongoing” and statements in the future tense are forward-looking statements. These forward-looking statements involve risks and uncertainties, as well as assumptions, which, if they do not fully materialize or prove incorrect, could cause our results to differ materially from those expressed or implied by such forward-looking statements. Forward-looking statements are subject to risks and uncertainties that may cause Morphic’s actual activities or results to differ significantly from those expressed in or implied by any forward-looking statement, including risks and uncertainties related to the forward-looking statements in this presentation and other risks set forth in our filings with the Securities and Exchange Commission (SEC), including the Annual Report on Form 10-K for the fiscal year ended December 31, 2023 filed with the SEC on February 22, 2024, and the Quarterly Report on Form 10-Q for the fiscal quarter ended September 30, 2023 filed with the SEC on November 3, 2023. These forward-looking statements speak only as of the date hereof and Morphic specifically disclaims any obligation to update these forward-looking statements or reasons why actual results might differ, whether as a result of new information, future events or otherwise, except as required by law. Note regarding trademarks: all third-party trademarks, including names, logos and brands, referenced by in this presentation are the property of their respective owners. All references to third-party trademarks are for identification purposes only and shall be considered nominative fair use under trademark law. 2 Forward-Looking Statements
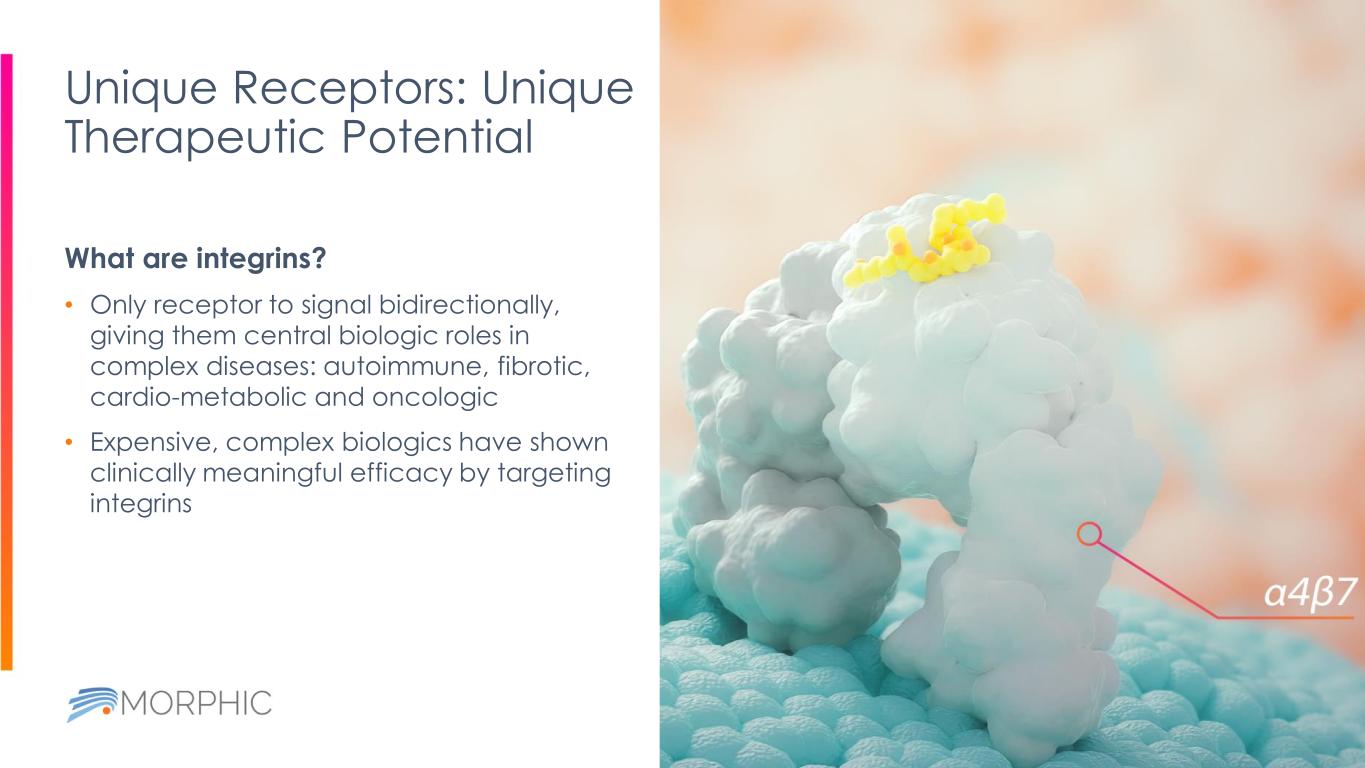
Unique Receptors: Unique Therapeutic Potential 3 What are integrins? • Only receptor to signal bidirectionally, giving them central biologic roles in complex diseases: autoimmune, fibrotic, cardio-metabolic and oncologic • Expensive, complex biologics have shown clinically meaningful efficacy by targeting integrins Solid tumors Fibrotic diseases Inflammatory bowel disease Now Morphic has built the platform to deliver the advantages of oral small molecule drugs to integrin targeting, with an initial focus on three major areas.
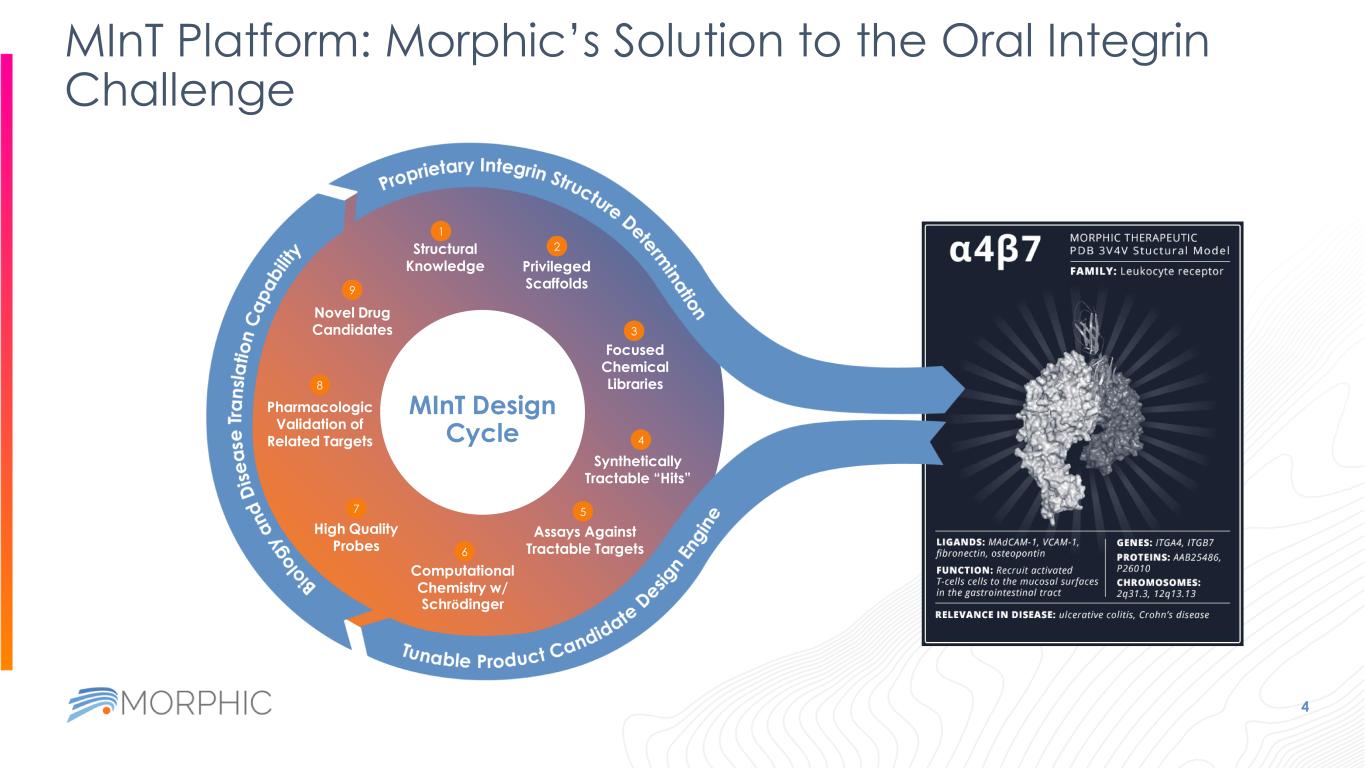
MInT Platform: Morphic’s Solution to the Oral Integrin Challenge 4 Structural Knowledge Privileged Scaffolds Focused Chemical Libraries Assays Against Tractable Targets Synthetically Tractable “Hits” Computational Chemistry w/ Schrödinger High Quality Probes Pharmacologic Validation of Related Targets Novel Drug Candidates 1 2 3 4 5 6 7 8 9 MInT Design Cycle
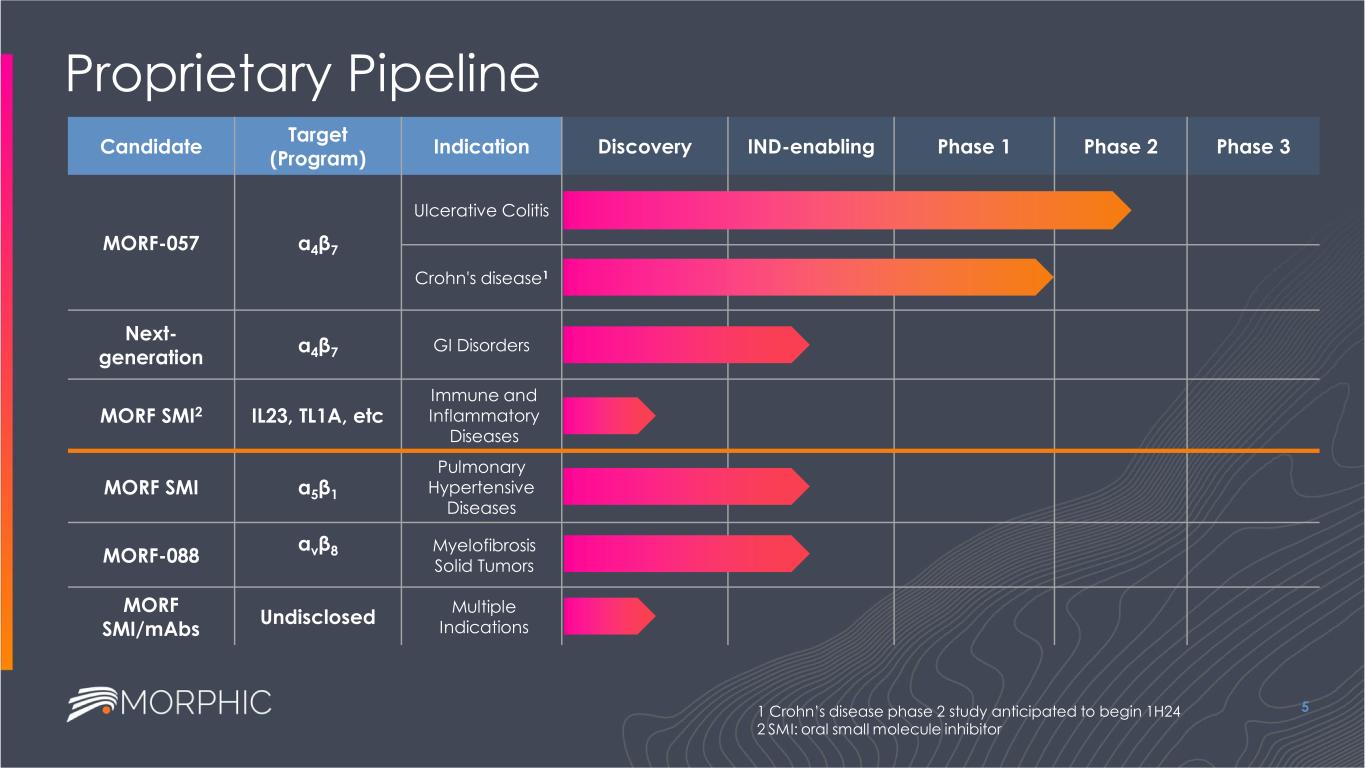
Proprietary Pipeline 5 Candidate Target (Program) Indication Discovery IND-enabling Phase 1 Phase 2 Phase 3 MORF-057 α4β7 Ulcerative Colitis Crohn's disease1 Next- generation α4β7 GI Disorders MORF SMI2 IL23, TL1A, etc Immune and Inflammatory Diseases MORF SMI α5β1 Pulmonary Hypertensive Diseases MORF-088 αvβ8 Myelofibrosis Solid Tumors MORF SMI/mAbs Undisclosed Multiple Indications 1 Crohn’s disease phase 2 study anticipated to begin 1H24 2 SMI: oral small molecule inhibitor
MORF-057 Small molecule inhibitor of α4β7: a well-validated mechanism to treat IBD EMERALD-2 Phase 2b study ongoing
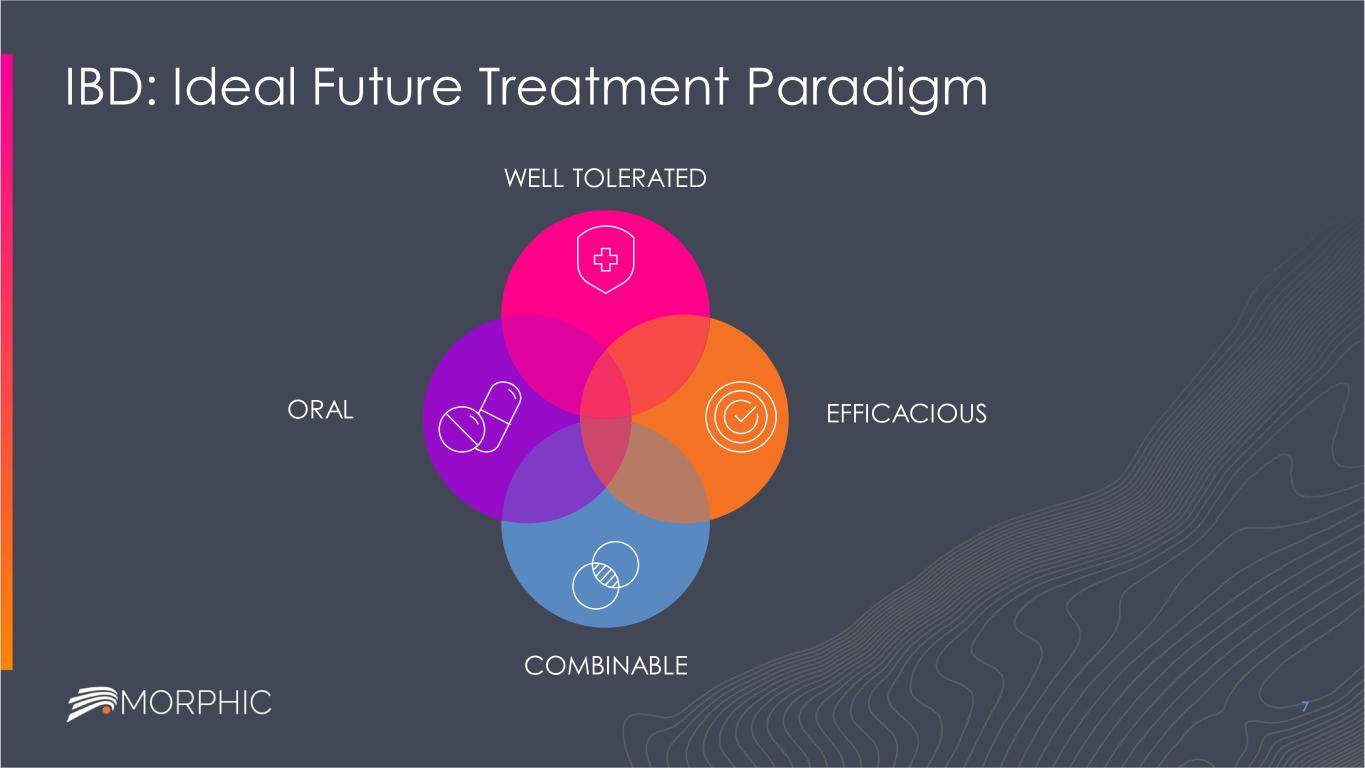
IBD: Ideal Future Treatment Paradigm 7 COMBINABLE ORAL WELL TOLERATED EFFICACIOUS
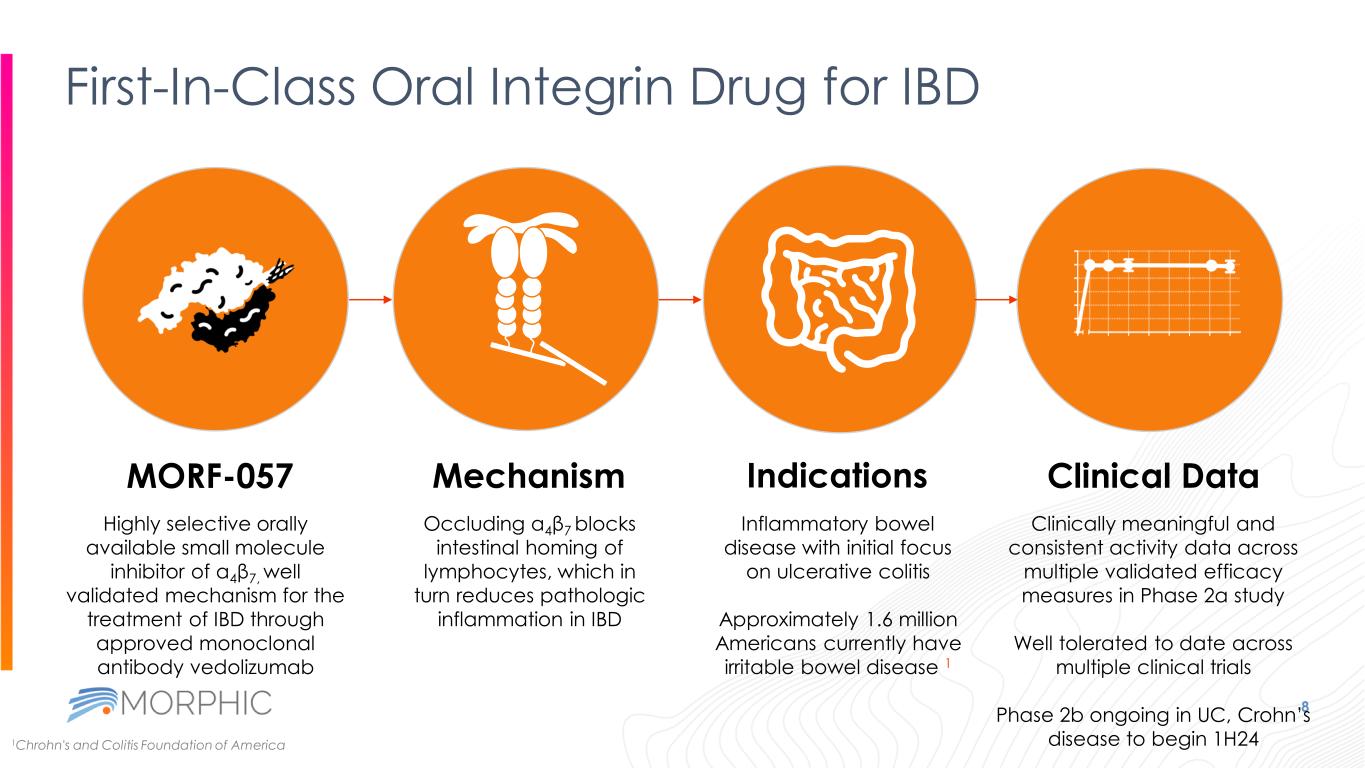
Indications First-In-Class Oral Integrin Drug for IBD 8 Highly selective orally available small molecule inhibitor of α4β7, well validated mechanism for the treatment of IBD through approved monoclonal antibody vedolizumab MORF-057 Occluding α4β7 blocks intestinal homing of lymphocytes, which in turn reduces pathologic inflammation in IBD Inflammatory bowel disease with initial focus on ulcerative colitis Approximately 1.6 million Americans currently have irritable bowel disease 1 Mechanism Clinical Data Clinically meaningful and consistent activity data across multiple validated efficacy measures in Phase 2a study Well tolerated to date across multiple clinical trials Phase 2b ongoing in UC, Crohn’s disease to begin 1H241Chrohn's and Colitis Foundation of America
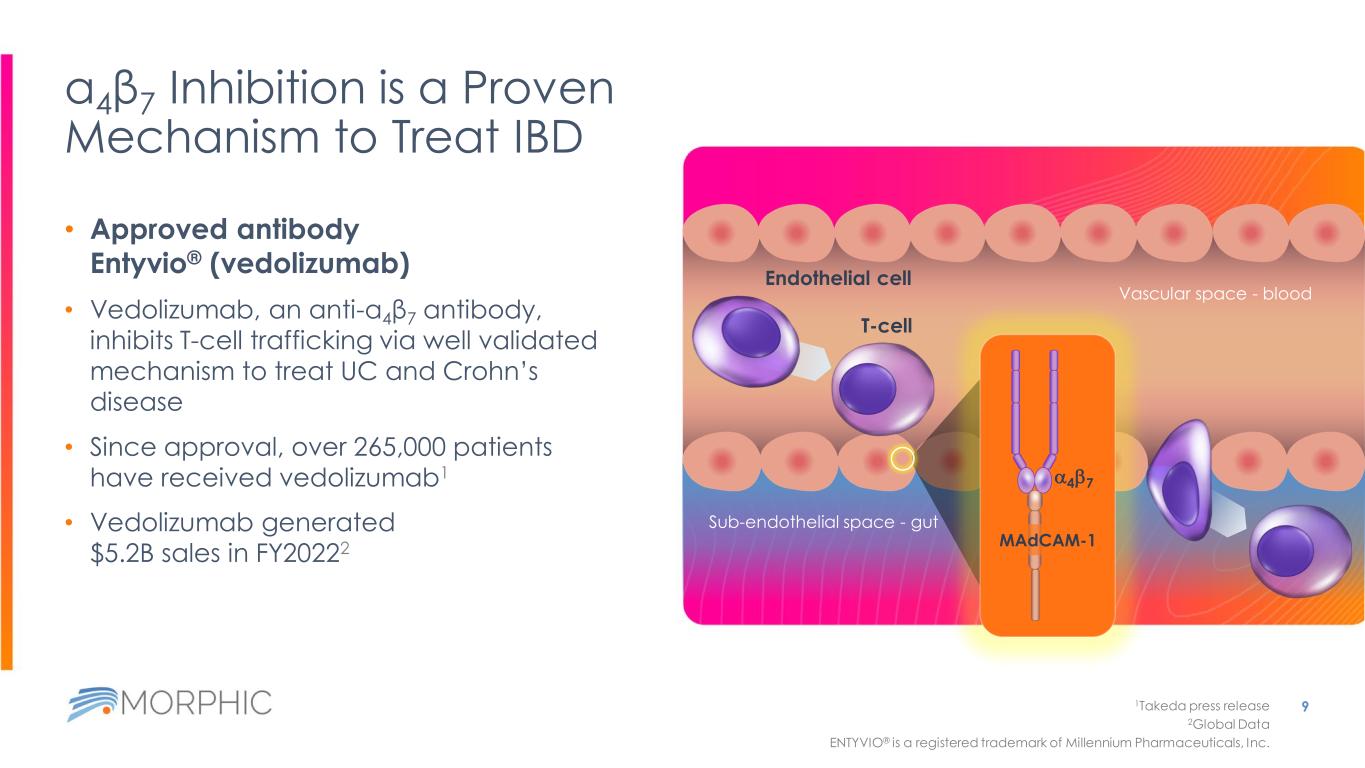
α4β7 Inhibition is a Proven Mechanism to Treat IBD • Approved antibody Entyvio® (vedolizumab) • Vedolizumab, an anti-α4β7 antibody, inhibits T-cell trafficking via well validated mechanism to treat UC and Crohn’s disease • Since approval, over 265,000 patients have received vedolizumab1 • Vedolizumab generated $5.2B sales in FY20222 9 Sub-endothelial space - gut Vascular space - blood T-cell 1Takeda press release 2Global Data ENTYVIO® is a registered trademark of Millennium Pharmaceuticals, Inc. Endothelial cell a4b7 MAdCAM-1
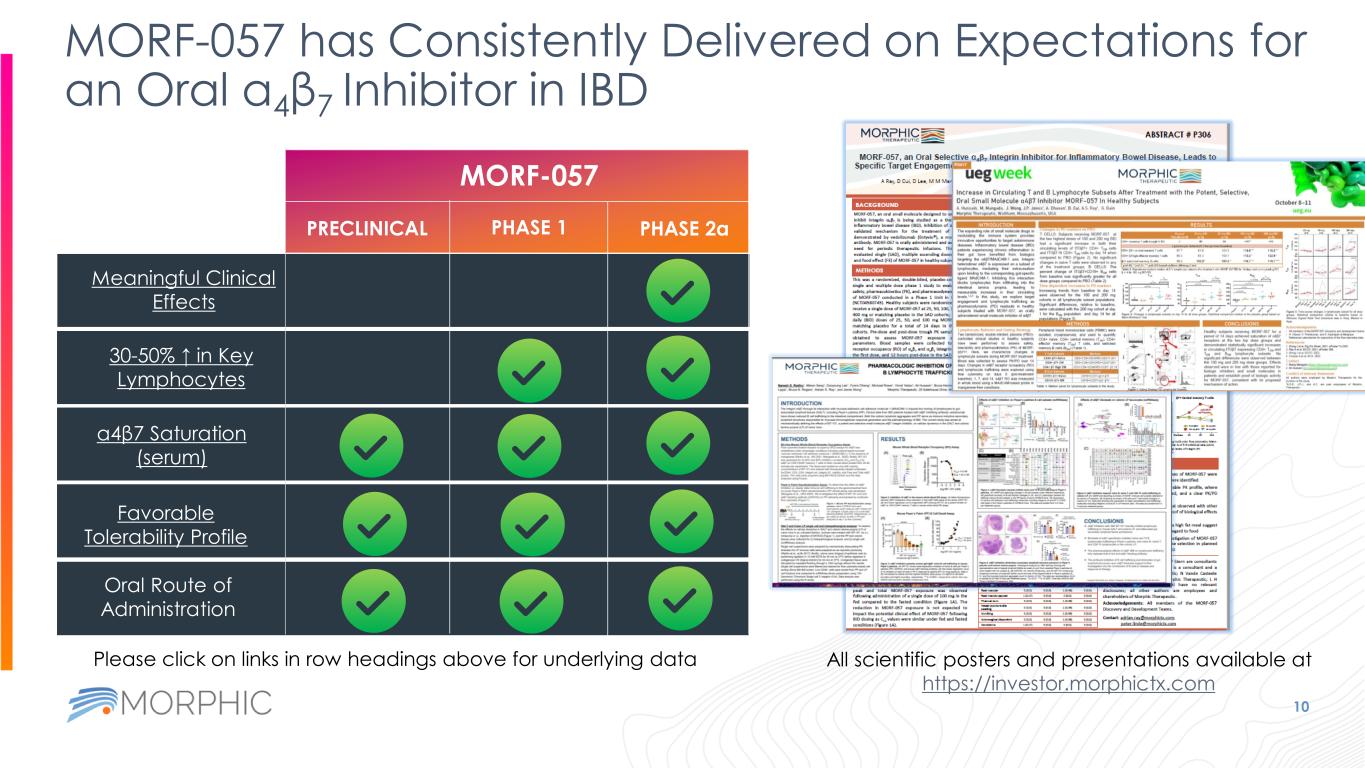
MORF-057 has Consistently Delivered on Expectations for an Oral α4β7 Inhibitor in IBD 10 MORF-057 PRECLINICAL PHASE 1 PHASE 2a Oral Route of Administration Favorable Tolerability Profile α4β7 Saturation (serum) 30-50% ↑ in Key Lymphocytes Meaningful Clinical Effects All scientific posters and presentations available at https://investor.morphictx.com Please click on links in row headings above for underlying data

EMERALD-1 Phase 2a Study of MORF-057
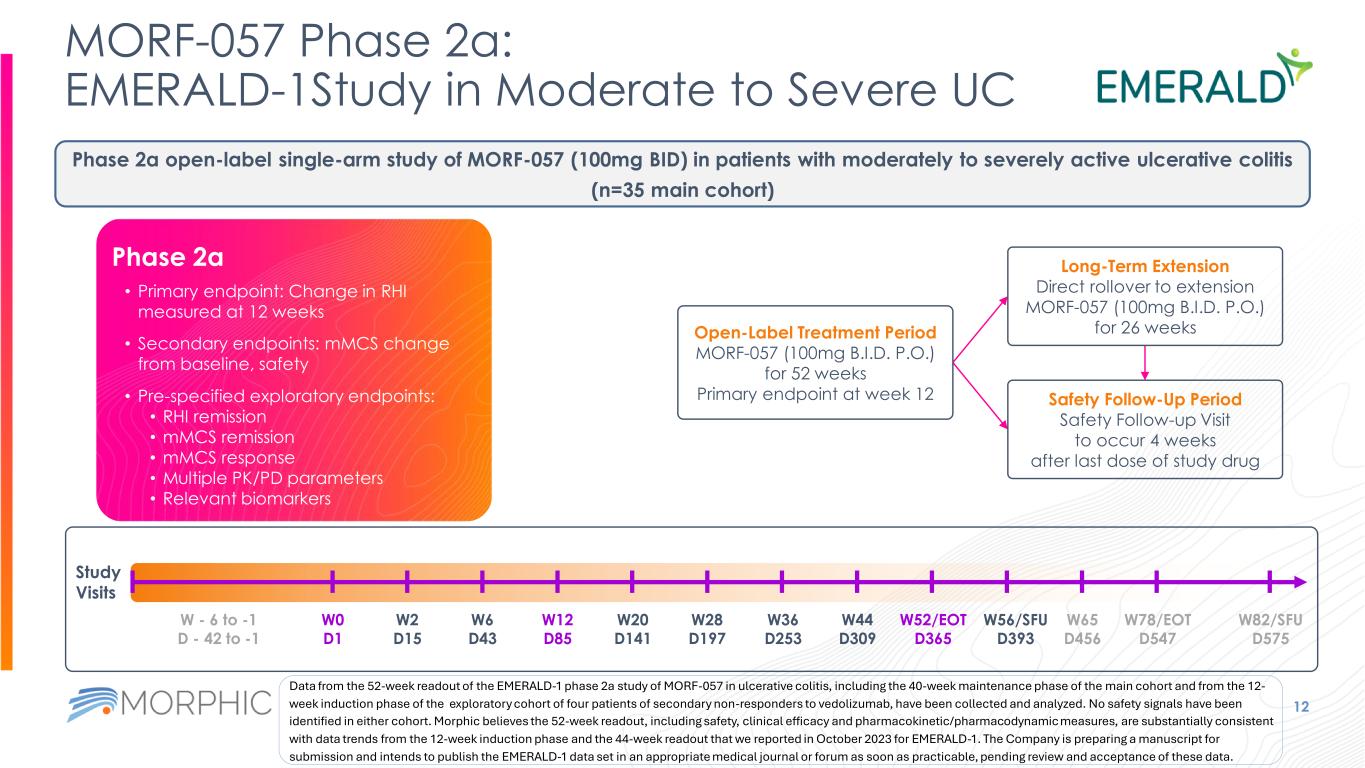
MORF-057 Phase 2a: EMERALD-1Study in Moderate to Severe UC 12 Study Visits W0 D1 W2 D15 W6 D43 W12 D85 W20 D141 W28 D197 W36 D253 W44 D309 W52/EOT D365 W82/SFU D575 W56/SFU D393 W65 D456 W78/EOT D547 W - 6 to -1 D - 42 to -1 Phase 2a open-label single-arm study of MORF-057 (100mg BID) in patients with moderately to severely active ulcerative colitis (n=35 main cohort) Open-Label Treatment Period MORF-057 (100mg B.I.D. P.O.) for 52 weeks Primary endpoint at week 12 Long-Term Extension Direct rollover to extension MORF-057 (100mg B.I.D. P.O.) for 26 weeks Safety Follow-Up Period Safety Follow-up Visit to occur 4 weeks after last dose of study drug • Primary endpoint: Change in RHI measured at 12 weeks • Secondary endpoints: mMCS change from baseline, safety • Pre-specified exploratory endpoints: • RHI remission • mMCS remission • mMCS response • Multiple PK/PD parameters • Relevant biomarkers Phase 2a Data from the 52-week readout of the EMERALD-1 phase 2a study of MORF-057 in ulcerative colitis, including the 40-week maintenance phase of the main cohort and from the 12- week induction phase of the exploratory cohort of four patients of secondary non-responders to vedolizumab, have been collected and analyzed. No safety signals have been identified in either cohort. Morphic believes the 52-week readout, including safety, clinical efficacy and pharmacokinetic/pharmacodynamic measures, are substantially consistent with data trends from the 12-week induction phase and the 44-week readout that we reported in October 2023 for EMERALD-1. The Company is preparing a manuscript for submission and intends to publish the EMERALD-1 data set in an appropriate medical journal or forum as soon as practicable, pending review and acceptance of these data.
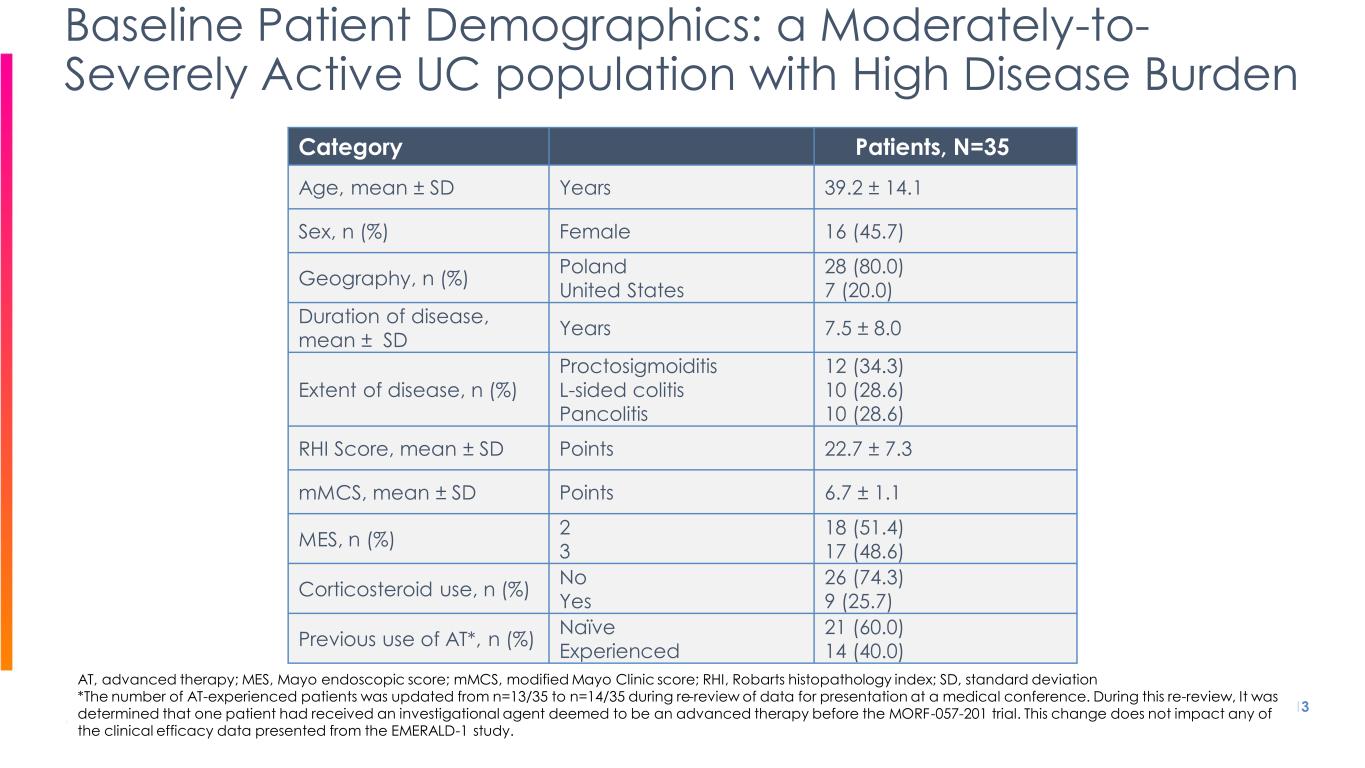
Category Patients, N=35 Age, mean ± SD Years 39.2 ± 14.1 Sex, n (%) Female 16 (45.7) Geography, n (%) Poland United States 28 (80.0) 7 (20.0) Duration of disease, mean ± SD Years 7.5 ± 8.0 Extent of disease, n (%) Proctosigmoiditis L-sided colitis Pancolitis 12 (34.3) 10 (28.6) 10 (28.6) RHI Score, mean ± SD Points 22.7 ± 7.3 mMCS, mean ± SD Points 6.7 ± 1.1 MES, n (%) 2 3 18 (51.4) 17 (48.6) Corticosteroid use, n (%) No Yes 26 (74.3) 9 (25.7) Previous use of AT*, n (%) Naïve Experienced 21 (60.0) 14 (40.0) 13 Baseline Patient Demographics: a Moderately-to- Severely Active UC population with High Disease Burden AT, advanced therapy; MES, Mayo endoscopic score; mMCS, modified Mayo Clinic score; RHI, Robarts histopathology index; SD, standard deviation *The number of AT-experienced patients was updated from n=13/35 to n=14/35 during re-review of data for presentation at a medical conference. During this re-review, It was determined that one patient had received an investigational agent deemed to be an advanced therapy before the MORF-057-201 trial. This change does not impact any of the clinical efficacy data presented from the EMERALD-1 study.

EMERALD-1 12-week Induction Phase Data as of 4/25/23
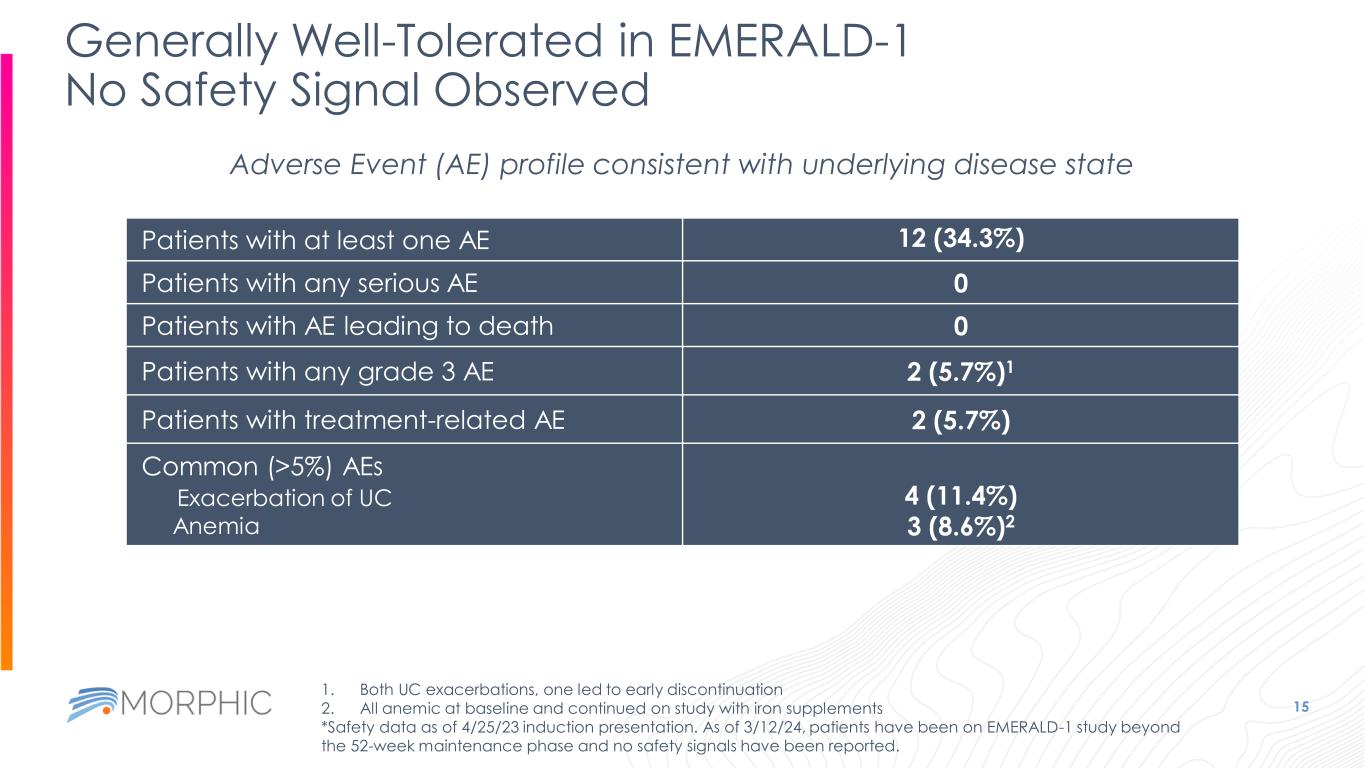
Generally Well-Tolerated in EMERALD-1 No Safety Signal Observed 15 Adverse Event (AE) profile consistent with underlying disease state Patients with at least one AE 12 (34.3%) Patients with any serious AE 0 Patients with AE leading to death 0 Patients with any grade 3 AE 2 (5.7%)1 Patients with treatment-related AE 2 (5.7%) Common (>5%) AEs Exacerbation of UC Anemia 4 (11.4%) 3 (8.6%)2 1. Both UC exacerbations, one led to early discontinuation 2. All anemic at baseline and continued on study with iron supplements *Safety data as of 4/25/23 induction presentation. As of 3/12/24, patients have been on EMERALD-1 study beyond the 52-week maintenance phase and no safety signals have been reported.
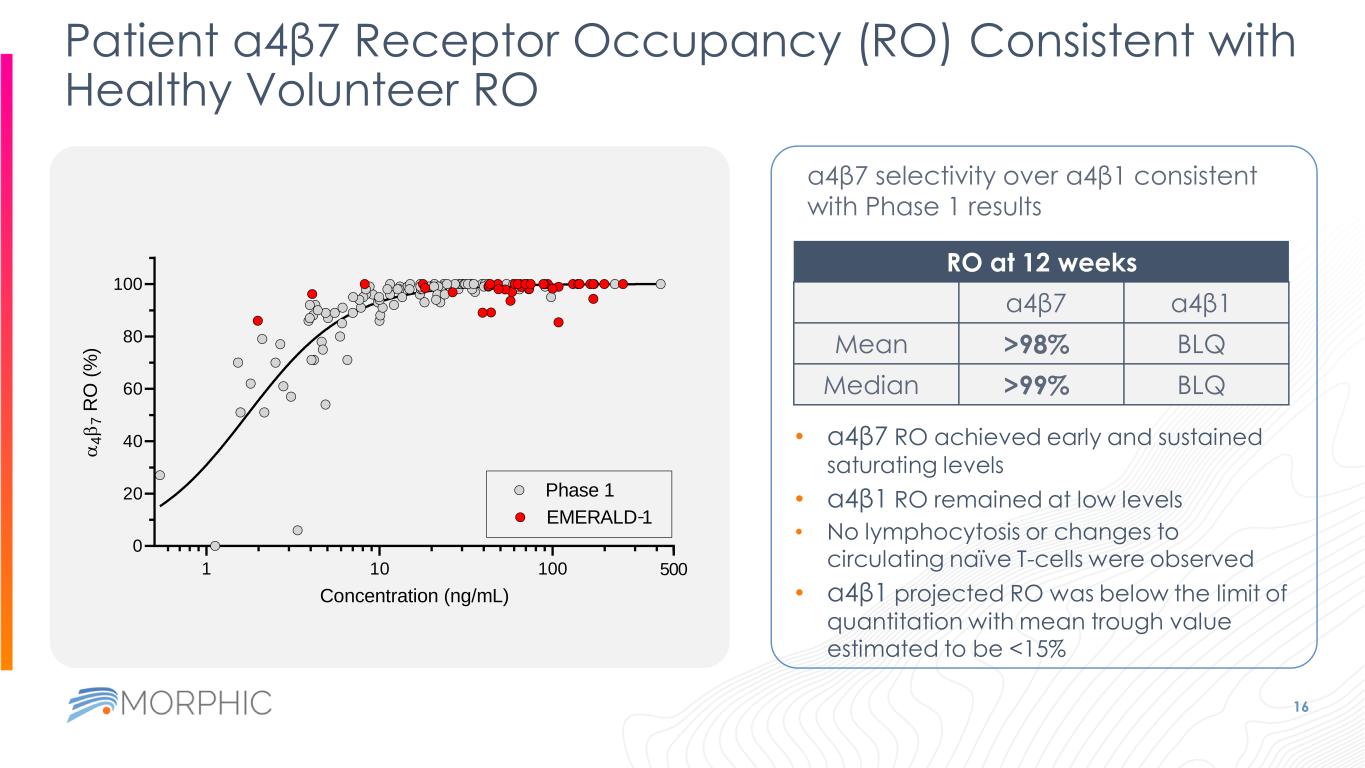
Patient a4β7 Receptor Occupancy (RO) Consistent with Healthy Volunteer RO 16 a4β7 selectivity over a4β1 consistent with Phase 1 results RO at 12 weeks a4β7 a4β1 Mean >98% BLQ Median >99% BLQ • a4β7 RO achieved early and sustained saturating levels • a4β1 RO remained at low levels • No lymphocytosis or changes to circulating naïve T-cells were observed • a4β1 projected RO was below the limit of quantitation with mean trough value estimated to be <15% 1 10 100 0 20 40 60 80 100 500 Concentration (ng/mL) a 4 b 7 R O ( % ) Phase 1 EMERALD 1-
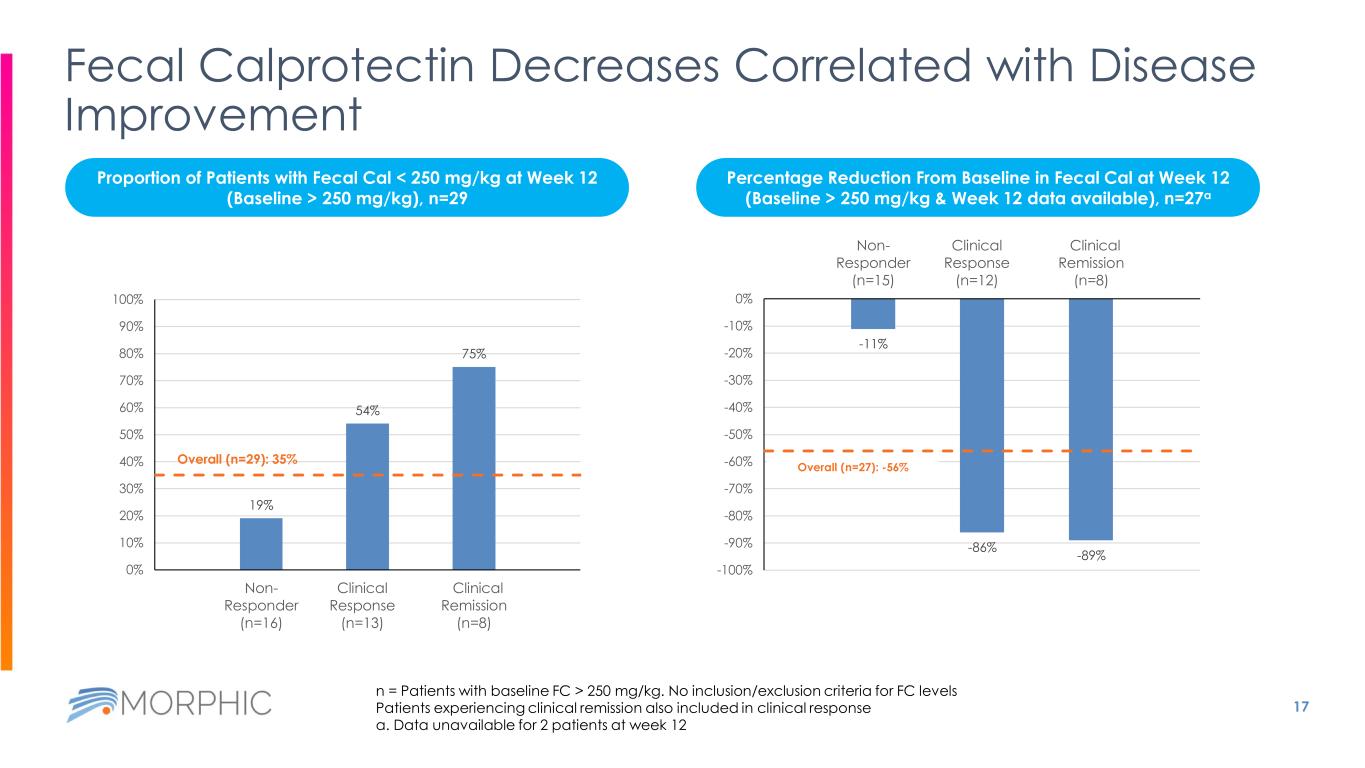
17 Fecal Calprotectin Decreases Correlated with Disease Improvement 19% 54% 75% Overall (n=29): 35% 0% 10% 20% 30% 40% 50% 60% 70% 80% 90% 100% Non- Responder (n=16) Clinical Response (n=13) Clinical Remission (n=8) -11% -86% -89% Overall (n=27): -56% -100% -90% -80% -70% -60% -50% -40% -30% -20% -10% 0% Non- Responder (n=15) Clinical Response (n=12) Clinical Remission (n=8) n = Patients with baseline FC > 250 mg/kg. No inclusion/exclusion criteria for FC levels Patients experiencing clinical remission also included in clinical response a. Data unavailable for 2 patients at week 12 Proportion of Patients with Fecal Cal < 250 mg/kg at Week 12 (Baseline > 250 mg/kg), n=29 Percentage Reduction From Baseline in Fecal Cal at Week 12 (Baseline > 250 mg/kg & Week 12 data available), n=27a
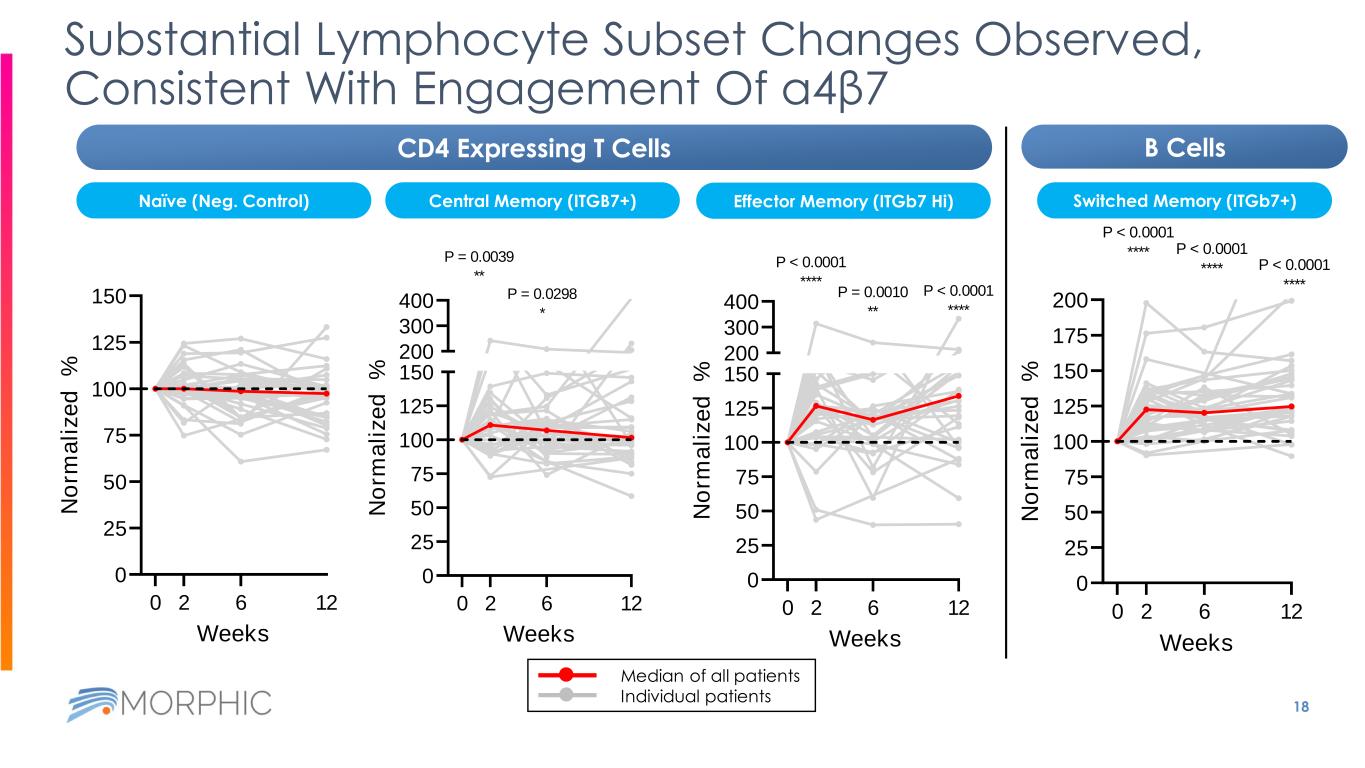
18 Substantial Lymphocyte Subset Changes Observed, Consistent With Engagement Of α4β7 0 25 50 75 100 125 150 Weeks N o rm a li z e d % 0 2 6 12 0 25 50 75 100 125 150 200 300 400 Weeks N o rm a li z e d % P = 0.0039 ** 0 2 6 12 P = 0.0298 * 0 25 50 75 100 125 150 200 300 400 Weeks N o rm a li z e d % 0 2 6 12 P < 0.0001 **** P = 0.0010 ** P < 0.0001 **** Median of all patients Individual patients 0 25 50 75 100 125 150 175 200 Weeks N o rm a li z e d % P < 0.0001 **** 0 2 6 12 P < 0.0001 **** P < 0.0001 **** CD4 Expressing T Cells B Cells Naïve (Neg. Control) Switched Memory (ITGb7+)Central Memory (ITGB7+) Effector Memory (ITGb7 Hi)
EMERALD-1 Induction Phase Clinical Efficacy Results
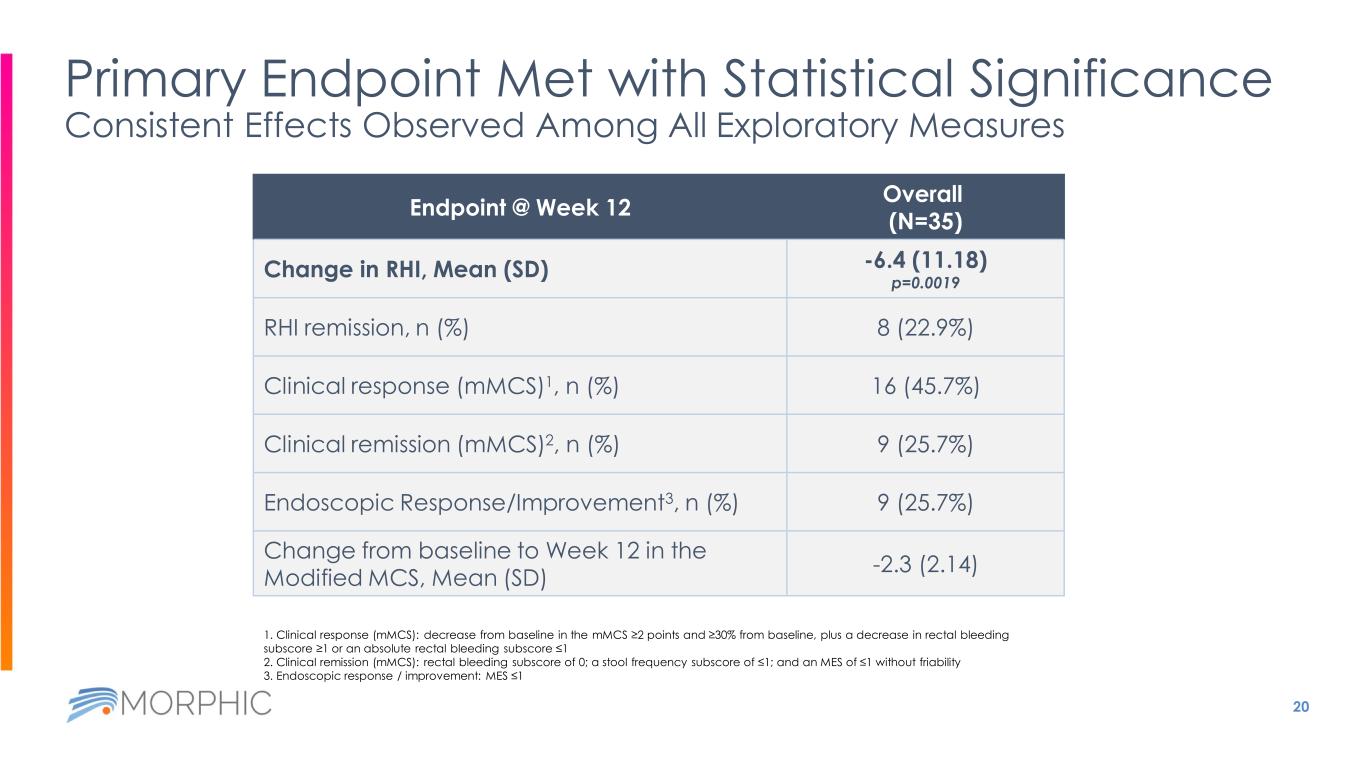
20 Endpoint @ Week 12 Overall (N=35) Change in RHI, Mean (SD) -6.4 (11.18) p=0.0019 RHI remission, n (%) 8 (22.9%) Clinical response (mMCS)1, n (%) 16 (45.7%) Clinical remission (mMCS)2, n (%) 9 (25.7%) Endoscopic Response/Improvement3, n (%) 9 (25.7%) Change from baseline to Week 12 in the Modified MCS, Mean (SD) -2.3 (2.14) Primary Endpoint Met with Statistical Significance Consistent Effects Observed Among All Exploratory Measures 1. Clinical response (mMCS): decrease from baseline in the mMCS ≥2 points and ≥30% from baseline, plus a decrease in rectal bleeding subscore ≥1 or an absolute rectal bleeding subscore ≤1 2. Clinical remission (mMCS): rectal bleeding subscore of 0; a stool frequency subscore of ≤1; and an MES of ≤1 without friability 3. Endoscopic response / improvement: MES ≤1
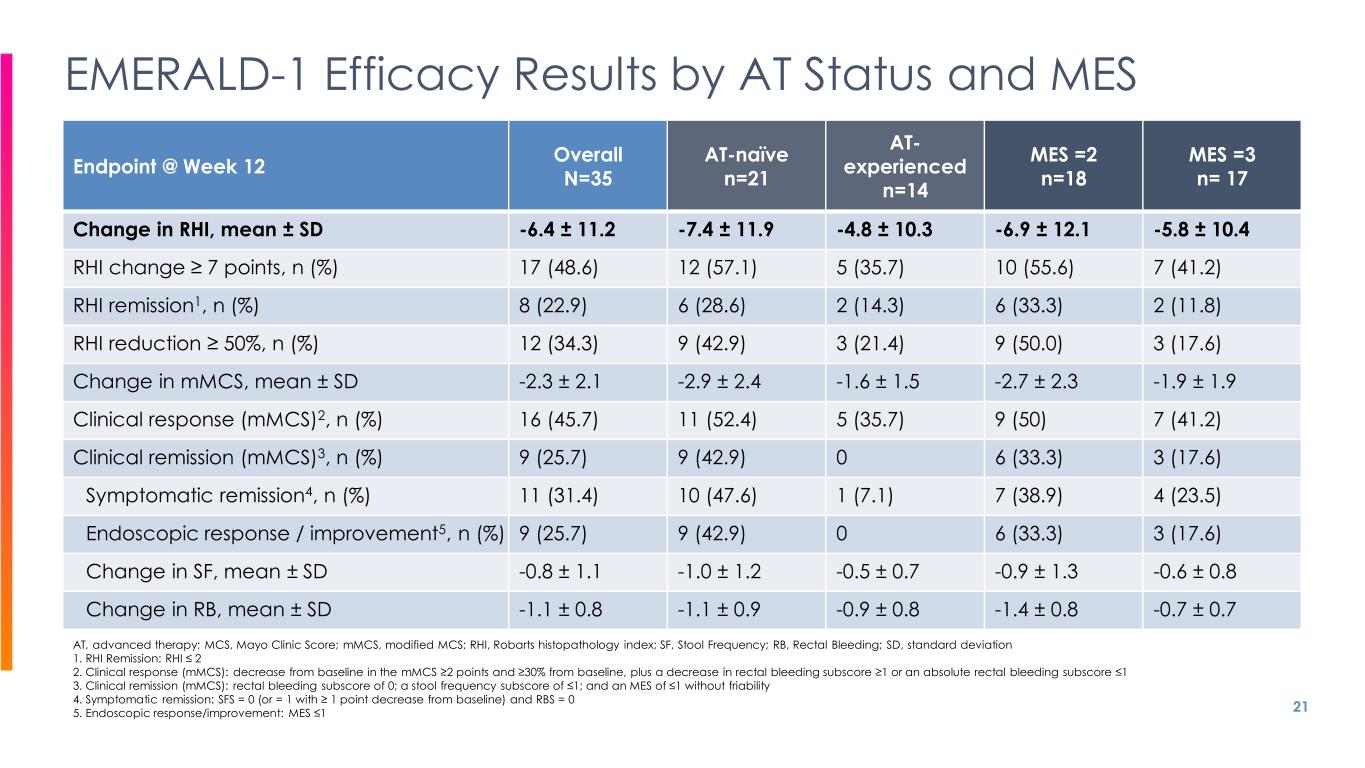
21 EMERALD-1 Efficacy Results by AT Status and MES Endpoint @ Week 12 Overall N=35 AT-naïve n=21 AT- experienced n=14 MES =2 n=18 MES =3 n= 17 Change in RHI, mean ± SD -6.4 ± 11.2 -7.4 ± 11.9 -4.8 ± 10.3 -6.9 ± 12.1 -5.8 ± 10.4 RHI change ≥ 7 points, n (%) 17 (48.6) 12 (57.1) 5 (35.7) 10 (55.6) 7 (41.2) RHI remission1, n (%) 8 (22.9) 6 (28.6) 2 (14.3) 6 (33.3) 2 (11.8) RHI reduction ≥ 50%, n (%) 12 (34.3) 9 (42.9) 3 (21.4) 9 (50.0) 3 (17.6) Change in mMCS, mean ± SD -2.3 ± 2.1 -2.9 ± 2.4 -1.6 ± 1.5 -2.7 ± 2.3 -1.9 ± 1.9 Clinical response (mMCS)2, n (%) 16 (45.7) 11 (52.4) 5 (35.7) 9 (50) 7 (41.2) Clinical remission (mMCS)3, n (%) 9 (25.7) 9 (42.9) 0 6 (33.3) 3 (17.6) Symptomatic remission4, n (%) 11 (31.4) 10 (47.6) 1 (7.1) 7 (38.9) 4 (23.5) Endoscopic response / improvement5, n (%) 9 (25.7) 9 (42.9) 0 6 (33.3) 3 (17.6) Change in SF, mean ± SD -0.8 ± 1.1 -1.0 ± 1.2 -0.5 ± 0.7 -0.9 ± 1.3 -0.6 ± 0.8 Change in RB, mean ± SD -1.1 ± 0.8 -1.1 ± 0.9 -0.9 ± 0.8 -1.4 ± 0.8 -0.7 ± 0.7 AT, advanced therapy; MCS, Mayo Clinic Score; mMCS, modified MCS; RHI, Robarts histopathology index; SF, Stool Frequency; RB, Rectal Bleeding; SD, standard deviation 1. RHI Remission: RHI ≤ 2 2. Clinical response (mMCS): decrease from baseline in the mMCS ≥2 points and ≥30% from baseline, plus a decrease in rectal bleeding subscore ≥1 or an absolute rectal bleeding subscore ≤1 3. Clinical remission (mMCS): rectal bleeding subscore of 0; a stool frequency subscore of ≤1; and an MES of ≤1 without friability 4. Symptomatic remission: SFS = 0 (or = 1 with ≥ 1 point decrease from baseline) and RBS = 0 5. Endoscopic response/improvement: MES ≤1
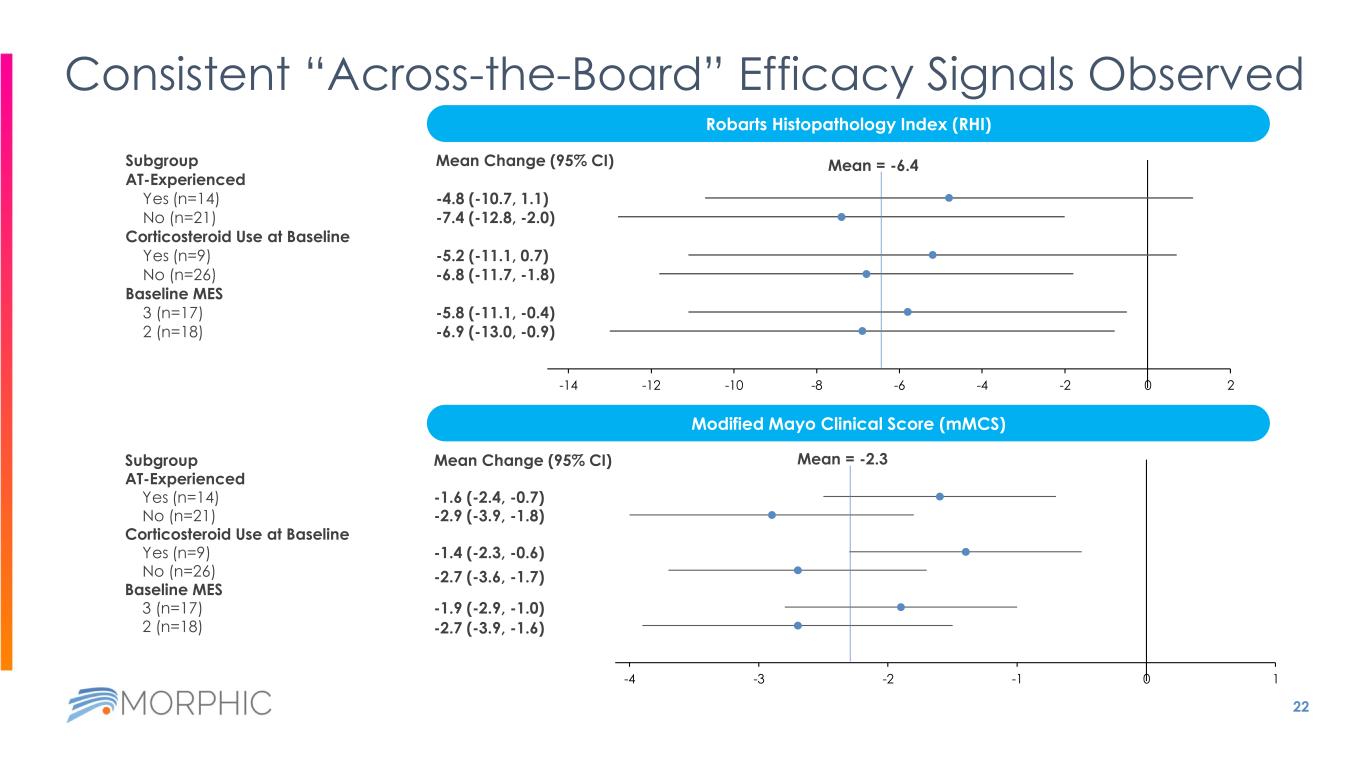
22 Consistent “Across-the-Board” Efficacy Signals Observed Subgroup AT-Experienced Yes (n=14) No (n=21) Corticosteroid Use at Baseline Yes (n=9) No (n=26) Baseline MES 3 (n=17) 2 (n=18) Mean Change (95% CI) -4.8 (-10.7, 1.1) -7.4 (-12.8, -2.0) -5.2 (-11.1, 0.7) -6.8 (-11.7, -1.8) -5.8 (-11.1, -0.4) -6.9 (-13.0, -0.9) -26 -24 -22 -20 -18 -16 -14 -12 -10 -8 -6 -4 -2 0 2 Robarts Histopathology Index (RHI) Modified Mayo Clinical Score (mMCS) Subgroup AT-Experienced Yes (n=14) No (n=21) Corticosteroid Use at Baseline Yes (n=9) No (n=26) Baseline MES 3 (n=17) 2 (n=18) Mean Change (95% CI) -1.6 (-2.4, -0.7) -2.9 (-3.9, -1.8) -1.4 (-2.3, -0.6) -2.7 (-3.6, -1.7) -1.9 (-2.9, -1.0) -2.7 (-3.9, -1.6) -8 -7 -6 -5 -4 -3 -2 -1 0 1 Mean = -6.4 Mean = -2.3
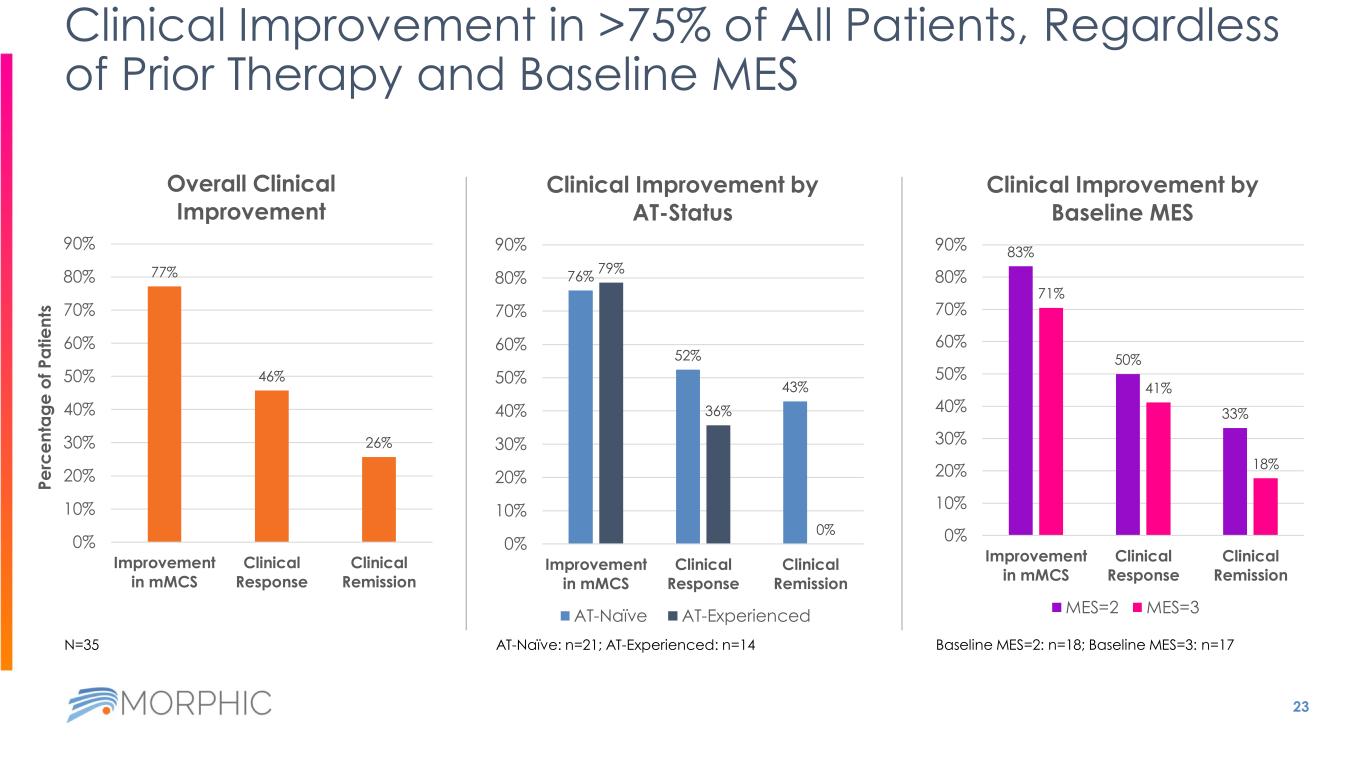
23 Clinical Improvement in >75% of All Patients, Regardless of Prior Therapy and Baseline MES 77% 46% 26% 0% 10% 20% 30% 40% 50% 60% 70% 80% 90% Improvement in mMCS Clinical Response Clinical Remission Overall Clinical Improvement AT-Naïve: n=21; AT-Experienced: n=14 76% 52% 43% 79% 36% 0% 0% 10% 20% 30% 40% 50% 60% 70% 80% 90% Improvement in mMCS Clinical Response Clinical Remission Clinical Improvement by AT-Status AT-Naïve AT-Experienced 83% 50% 33% 71% 41% 18% 0% 10% 20% 30% 40% 50% 60% 70% 80% 90% Improvement in mMCS Clinical Response Clinical Remission Clinical Improvement by Baseline MES MES=2 MES=3 Baseline MES=2: n=18; Baseline MES=3: n=17N=35 P e rc e n ta g e o f P a ti e n ts
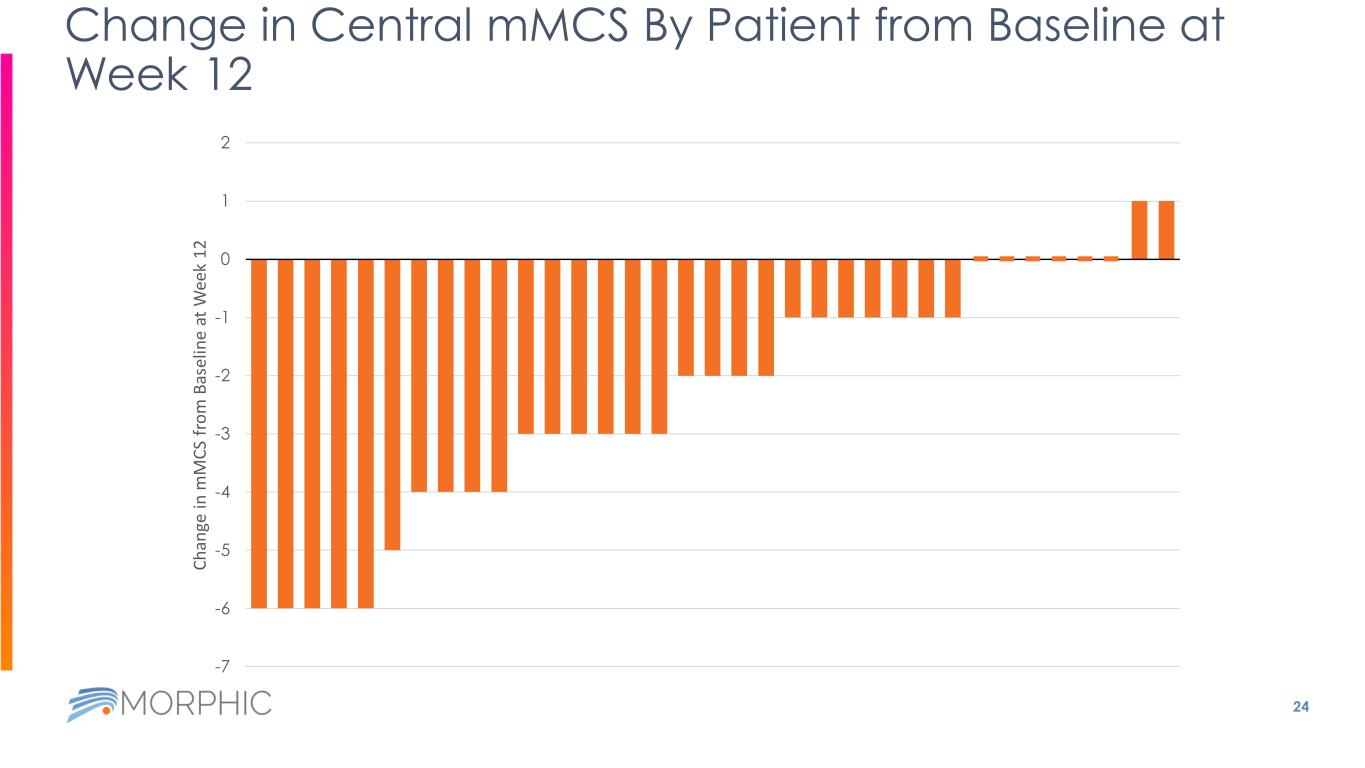
24 Change in Central mMCS By Patient from Baseline at Week 12 -7 -6 -5 -4 -3 -2 -1 0 1 2 C h an ge in m M C S fr o m B as el in e at W ee k 1 2

EMERALD-1 Data Beyond 12 Weeks
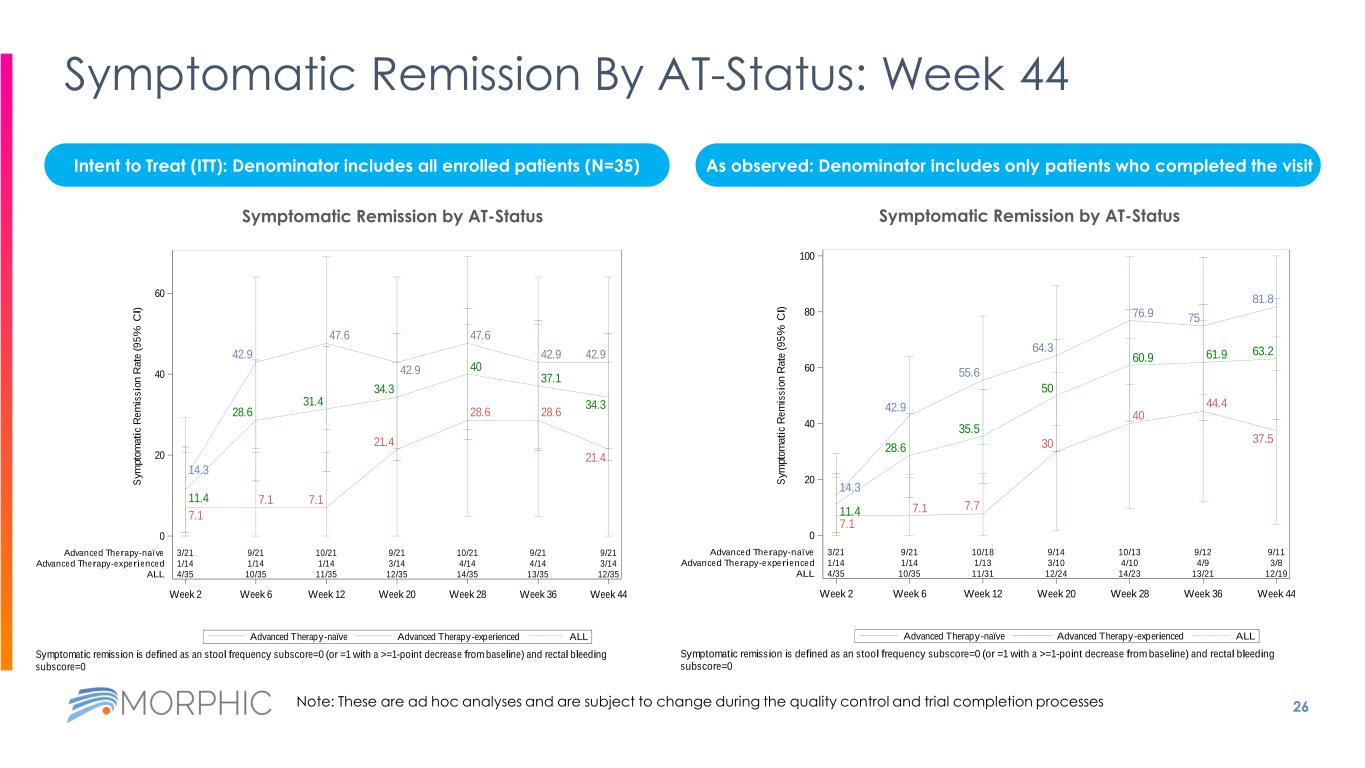
26 Symptomatic Remission By AT-Status: Week 44 Intent to Treat (ITT): Denominator includes all enrolled patients (N=35) As observed: Denominator includes only patients who completed the visit 14.3 7.1 11.4 42.9 7.1 28.6 47.6 7.1 31.4 42.9 21.4 34.3 47.6 28.6 40 42.9 28.6 37.1 42.9 21.4 34.3 3/21 9/21 10/21 9/21 10/21 9/21 9/21 1/14 1/14 1/14 3/14 4/14 4/14 3/14 4/35 10/35 11/35 12/35 14/35 13/35 12/35 Week 2 Week 6 Week 12 Week 20 Week 28 Week 36 Week 44 0 20 40 60 S y m p to m a ti c R e m is s io n R a te ( 9 5 % C I) Advanced Therapy-naïve Advanced Therapy-experienced ALL ALLAdvanced Therapy-experiencedAdvanced Therapy-naïve Symptomatic Remission by Advanced Therapy (AT) Status Symptomatic remission is defined as an stool frequency subscore=0 (or =1 with a >=1-point decrease from baseline) and rectal bleeding subscore=0 Data Cutoff Date: 02OCT2023 14.3 7.1 11.4 42.9 7.1 28.6 55.6 7.7 35.5 64.3 30 50 76.9 40 60.9 75 44.4 61.9 81.8 37.5 63.2 3/21 9/21 10/18 9/14 10/13 9/12 9/11 1/14 1/14 1/13 3/10 4/10 4/9 3/8 4/35 10/35 11/31 12/24 14/23 13/21 12/19 Week 2 Week 6 Week 12 Week 20 Week 28 Week 36 Week 44 0 20 40 60 80 100 S y m p to m a ti c R e m is s io n R a te ( 9 5 % C I) Advanced Therapy-naïve Advanced Therapy-experienced ALL ALLAdvanced Therapy-experiencedAdvanced Therapy-naïve Symptomatic Remission by Advanced Therapy (AT) Status Symptomatic remission is defined as an stool frequency subscore=0 (or =1 with a >=1-point decrease from baseline) and rectal bleeding subscore=0 Data Cutoff Date: 02OCT2023 Symptomatic Remission by AT-StatusSymptomatic Remission by AT-Status Note: These are ad hoc analyses and are subject to change during the quality control and trial completion processes
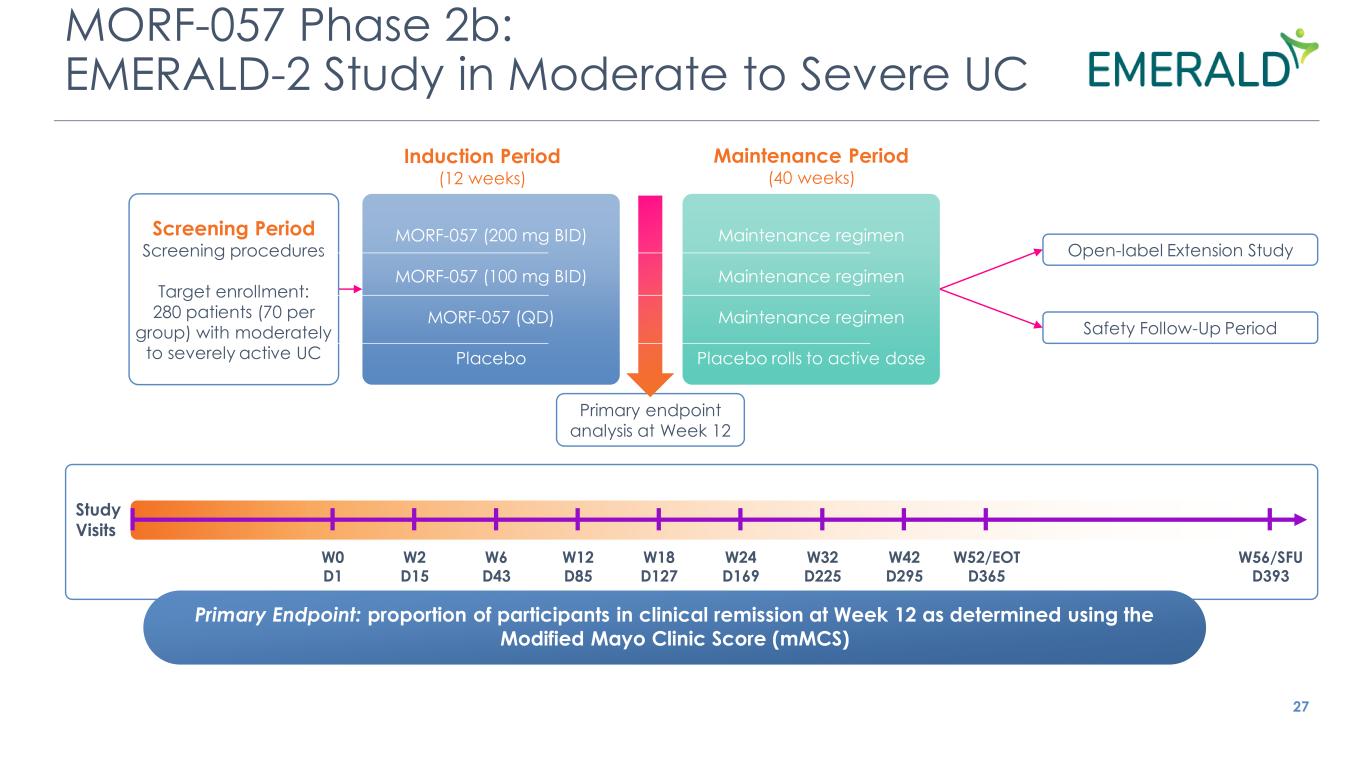
MORF-057 Phase 2b: EMERALD-2 Study in Moderate to Severe UC 27 Induction Period (12 weeks) Maintenance Period (40 weeks) Primary Endpoint: proportion of participants in clinical remission at Week 12 as determined using the Modified Mayo Clinic Score (mMCS) W0 D1 W2 D15 W6 D43 W12 D85 W18 D127 W24 D169 W32 D225 W42 D295 W52/EOT D365 W56/SFU D393 Study Visits Open-label Extension Study Safety Follow-Up Period Screening Period Screening procedures Target enrollment: 280 patients (70 per group) with moderately to severely active UC Primary endpoint analysis at Week 12 MORF-057 (200 mg BID) MORF-057 (100 mg BID) MORF-057 (QD) Placebo Maintenance regimen Maintenance regimen Maintenance regimen Placebo rolls to active dose
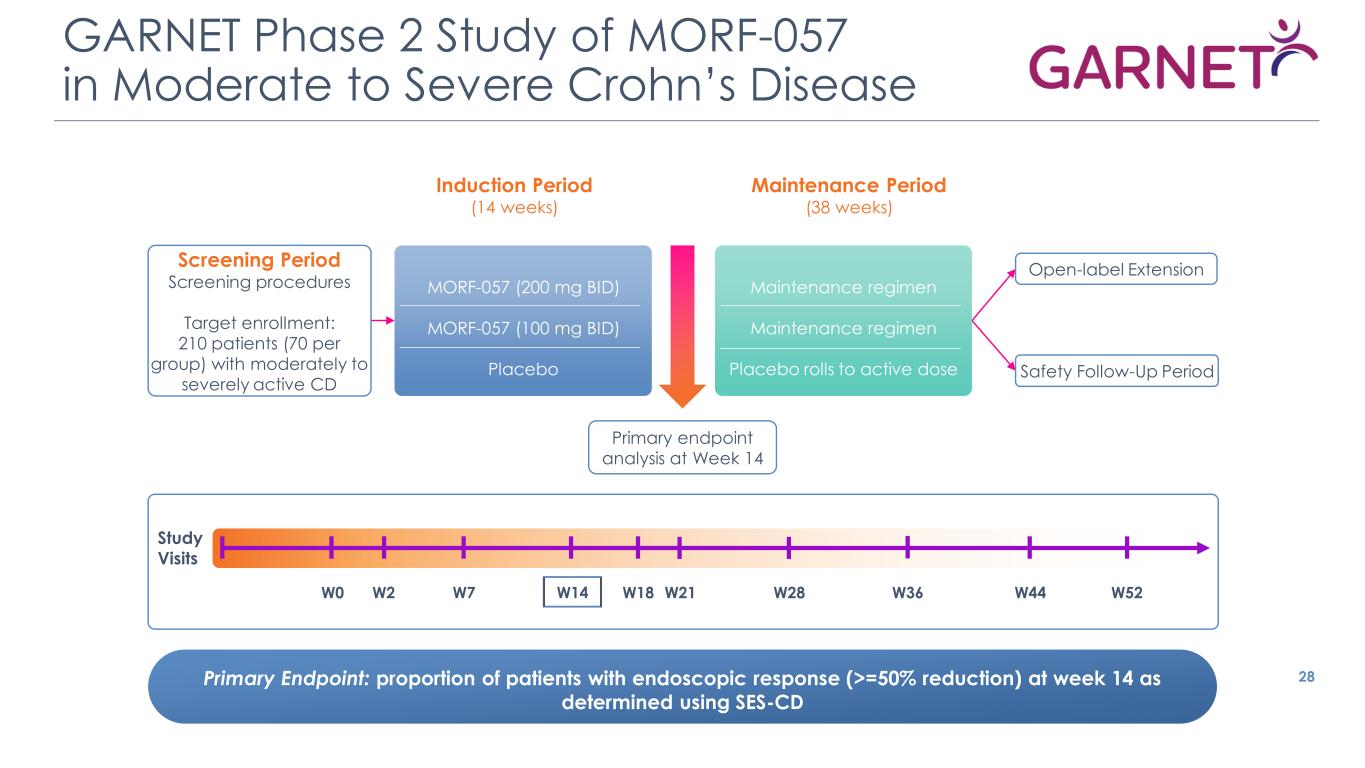
GARNET Phase 2 Study of MORF-057 in Moderate to Severe Crohn’s Disease 28 Induction Period (14 weeks) Maintenance Period (38 weeks) Primary Endpoint: proportion of patients with endoscopic response (>=50% reduction) at week 14 as determined using SES-CD Open-label Extension Safety Follow-Up Period Screening Period Screening procedures Target enrollment: 210 patients (70 per group) with moderately to severely active CD Primary endpoint analysis at Week 14 MORF-057 (200 mg BID) MORF-057 (100 mg BID) Placebo Maintenance regimen Maintenance regimen Placebo rolls to active dose W0 W2 W7 W14 W18 W21 W28 W36 W52 Study Visits W44

EMERGING PIPELINE Creating the next generation of proprietary integrin inhibitor candidates
a5β1: Small Molecule Integrin Inhibitor for Pulmonary Hypertensive Diseases 30 Small molecule inhibitors of fibronectin integrins in preclinical development Program Fibronectin integrin inhibition suppresses pulmonary arterial smooth muscle cell proliferation Indications Multiple pulmonary hypertensive diseases Mechanism Data Preclinical data demonstrating improved cardiac output and reversal of vascular remodeling
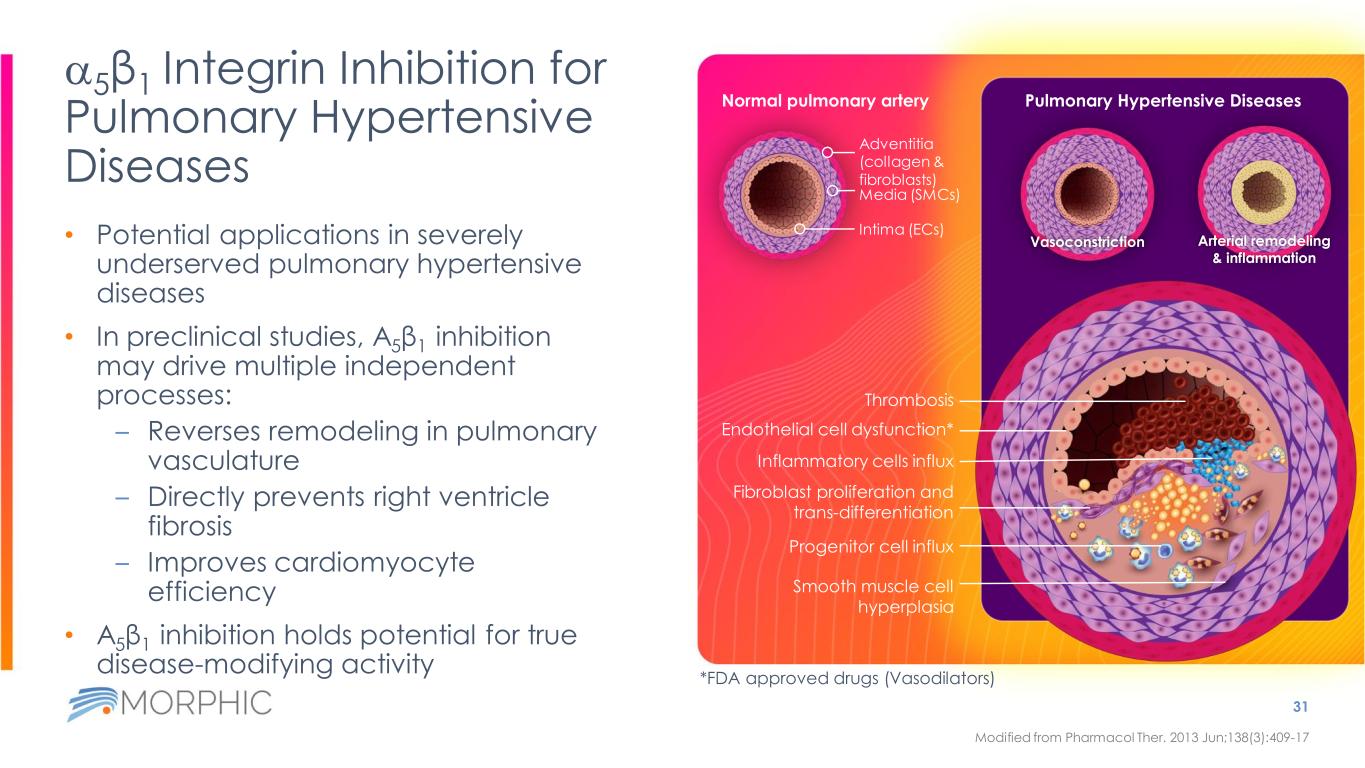
Vasoconstriction Arterial remodeling & inflammation Pulmonary Hypertensive Diseases a5β1 Integrin Inhibition for Pulmonary Hypertensive Diseases • Potential applications in severely underserved pulmonary hypertensive diseases • In preclinical studies, Α5β1 inhibition may drive multiple independent processes: – Reverses remodeling in pulmonary vasculature – Directly prevents right ventricle fibrosis – Improves cardiomyocyte efficiency • Α5β1 inhibition holds potential for true disease-modifying activity 31 Modified from Pharmacol Ther. 2013 Jun;138(3):409-17 Normal pulmonary artery Adventitia (collagen & fibroblasts) Media (SMCs) Intima (ECs) Thrombosis Inflammatory cells influx Endothelial cell dysfunction* Smooth muscle cell hyperplasia Fibroblast proliferation and trans-differentiation Progenitor cell influx *FDA approved drugs (Vasodilators)
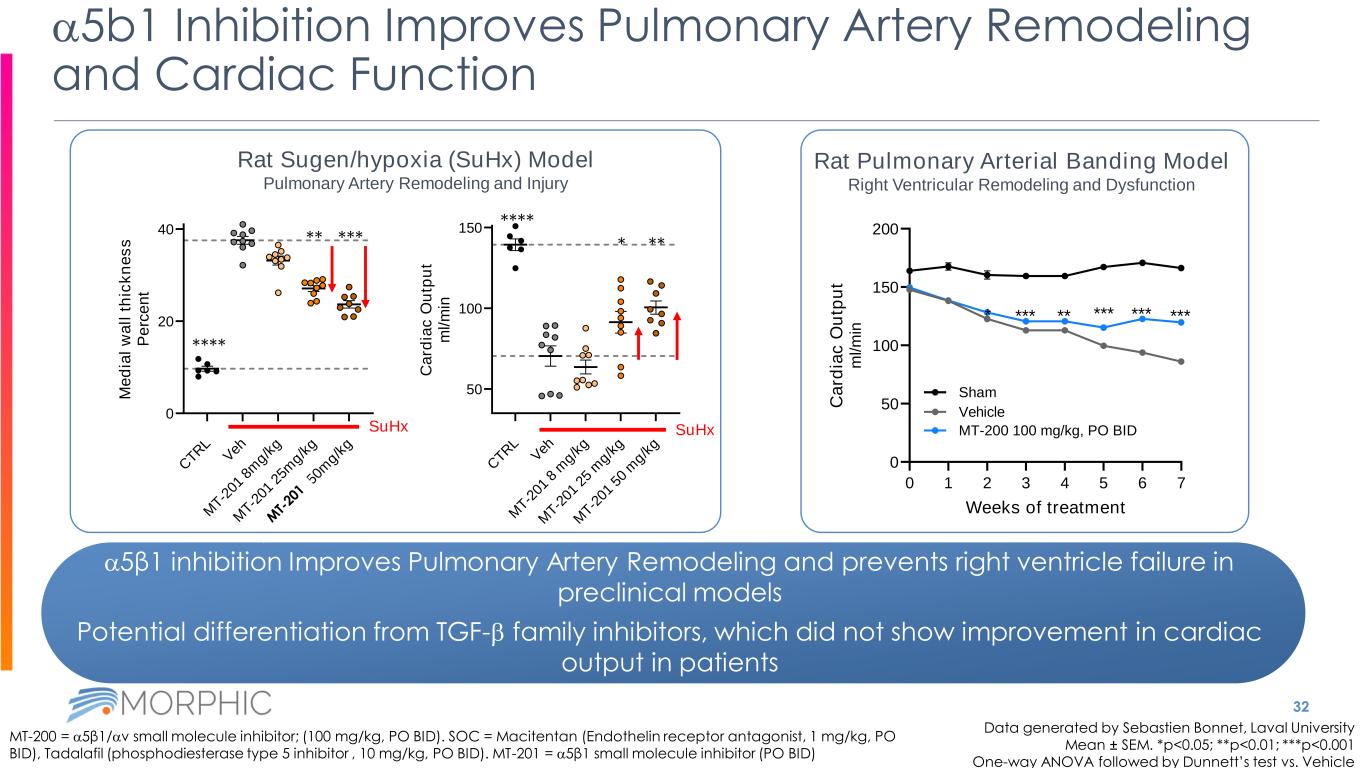
32 a5b1 Inhibition Improves Pulmonary Artery Remodeling and Cardiac Function Data generated by Sebastien Bonnet, Laval University Mean ± SEM. *p<0.05; **p<0.01; ***p<0.001 One-way ANOVA followed by Dunnett’s test vs. Vehicle MT-200 = a5β1/av small molecule inhibitor; (100 mg/kg, PO BID). SOC = Macitentan (Endothelin receptor antagonist, 1 mg/kg, PO BID), Tadalafil (phosphodiesterase type 5 inhibitor , 10 mg/kg, PO BID). MT-201 = a5β1 small molecule inhibitor (PO BID) a5β1 inhibition Improves Pulmonary Artery Remodeling and prevents right ventricle failure in preclinical models Potential differentiation from TGF-b family inhibitors, which did not show improvement in cardiac output in patients 0 1 2 3 4 5 6 7 0 50 100 150 200 Weeks of treatment C a rd ia c O u tp u t m l/ m in * *** ** *** *** *** Sham Vehicle MT-200 100 mg/kg, PO BID Rat Pulmonary Arterial Banding Model Right Ventricular Remodeling and Dysfunction Rat Sugen/hypoxia (SuHx) Model Pulmonary Artery Remodeling and Injury C TR L V eh M T-2 01 8 m g/k g M T-2 01 2 5 m g/k g M T-2 01 5 0 m g/k g 50 100 150 C a rd ia c O u tp u t m l/ m in SuHx C TR L V eh M T-2 01 8 m g/k g M T-2 01 2 5m g/k g M T-2 10 5 0m g/k g 0 20 40 M e d ia l w a ll t h ic k n e s s P e rc e n t SuHx **** ***** **** ***
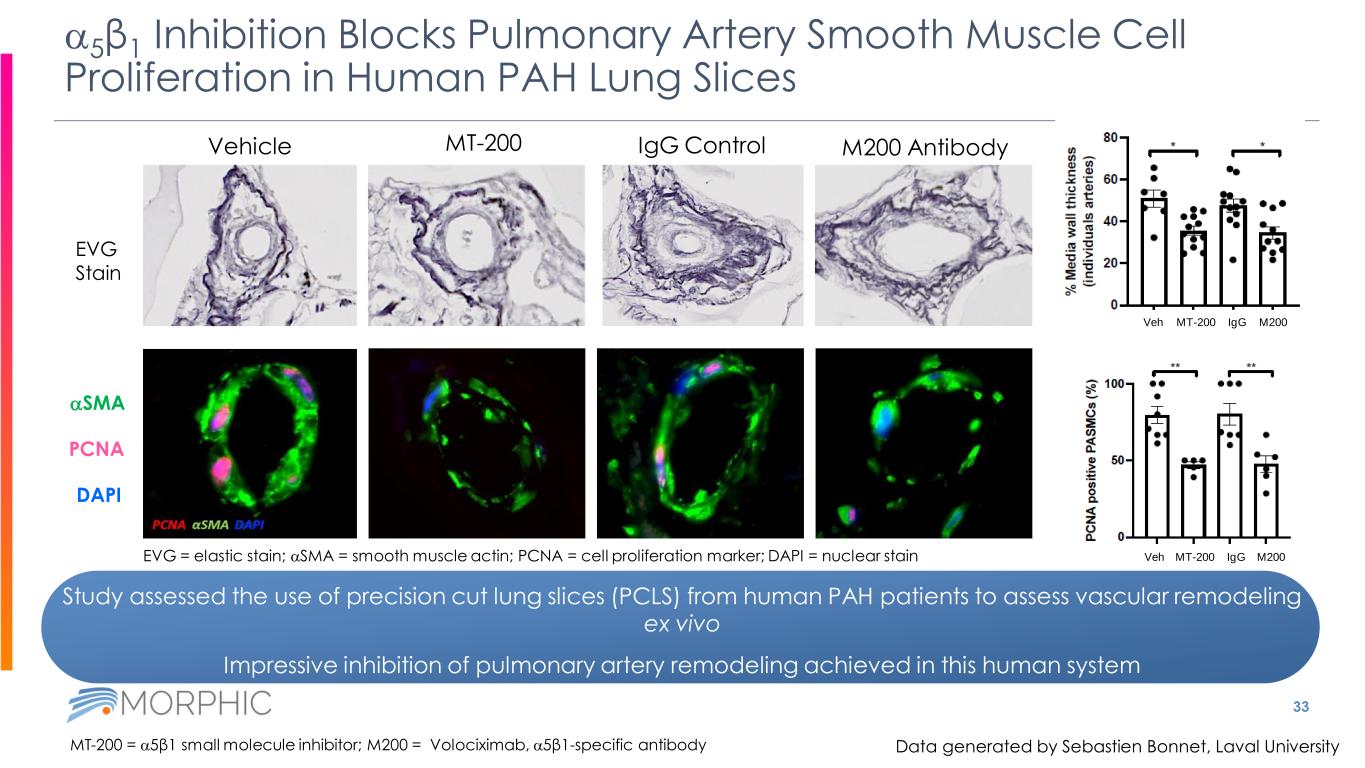
Study assessed the use of precision cut lung slices (PCLS) from human PAH patients to assess vascular remodeling ex vivo Impressive inhibition of pulmonary artery remodeling achieved in this human system 33 a5β1 Inhibition Blocks Pulmonary Artery Smooth Muscle Cell Proliferation in Human PAH Lung Slices Vehicle MT-200 IgG Control M200 Antibody MT-200 = a5β1 small molecule inhibitor; M200 = Volociximab, a5β1-specific antibody aSMA PCNA DAPI EVG Stain EVG = elastic stain; aSMA = smooth muscle actin; PCNA = cell proliferation marker; DAPI = nuclear stain MT-200 IgG M200Veh MT-200 IgG M200Veh Data generated by Sebastien Bonnet, Laval University
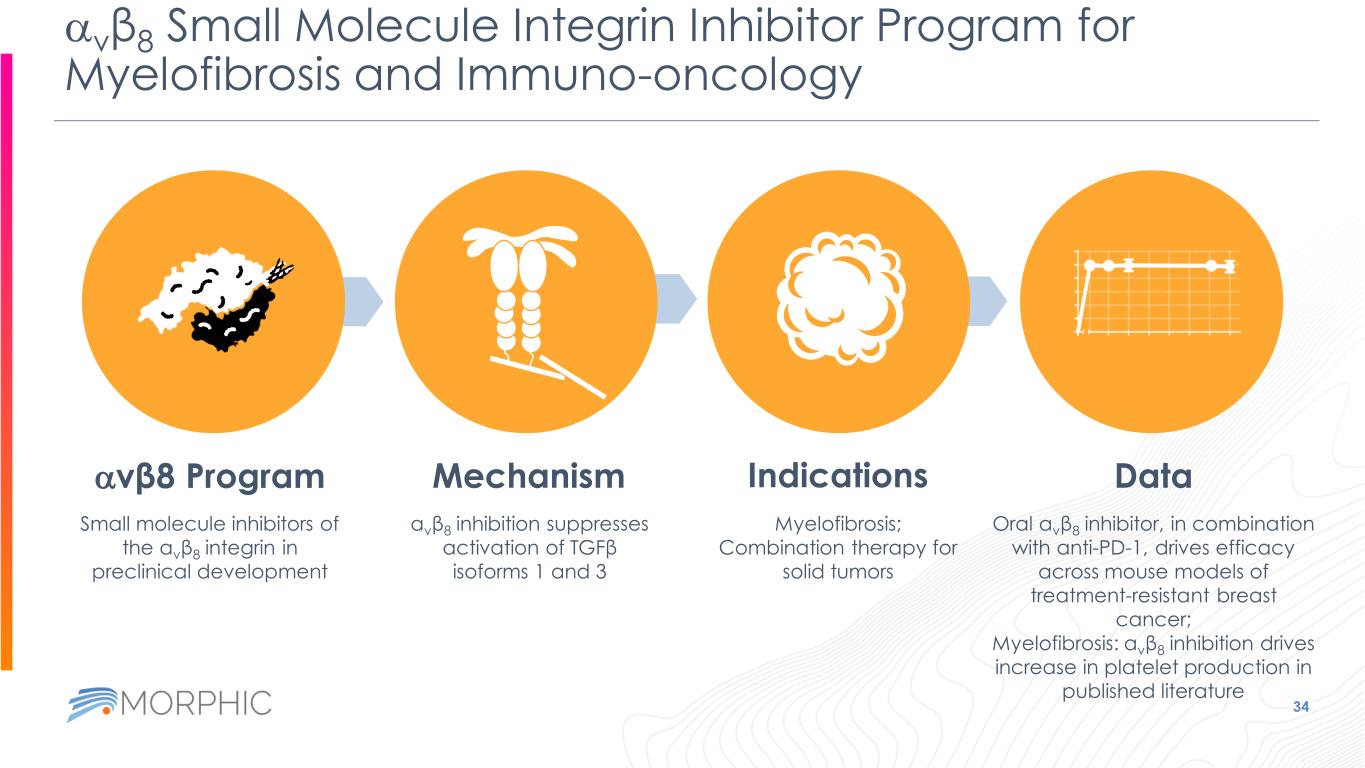
avβ8 Small Molecule Integrin Inhibitor Program for Myelofibrosis and Immuno-oncology 34 Small molecule inhibitors of the αvβ8 integrin in preclinical development avβ8 Program αvβ8 inhibition suppresses activation of TGFβ isoforms 1 and 3 Indications Myelofibrosis; Combination therapy for solid tumors Mechanism Data Oral αvβ8 inhibitor, in combination with anti-PD-1, drives efficacy across mouse models of treatment-resistant breast cancer; Myelofibrosis: αvβ8 inhibition drives increase in platelet production in published literature
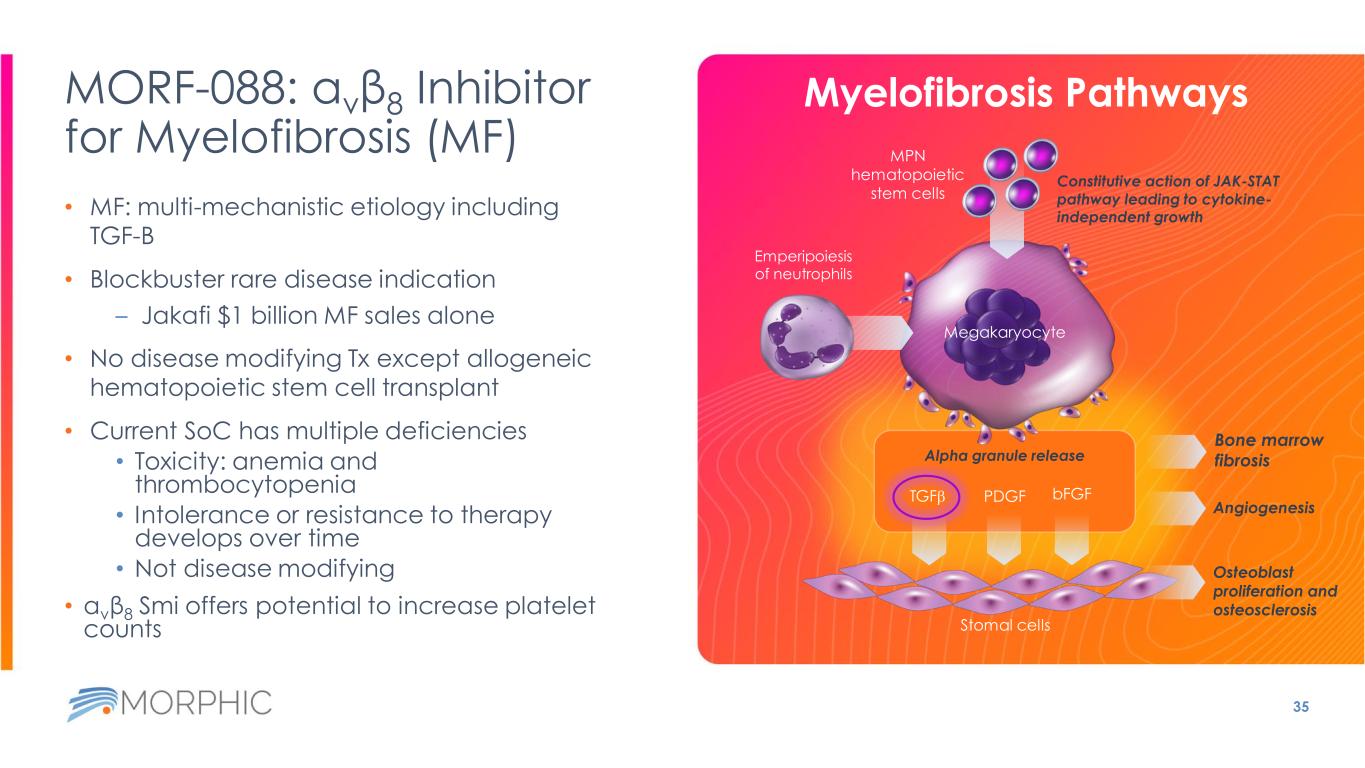
MORF-088: αvβ8 Inhibitor for Myelofibrosis (MF) • MF: multi-mechanistic etiology including TGF-B • Blockbuster rare disease indication – Jakafi $1 billion MF sales alone • No disease modifying Tx except allogeneic hematopoietic stem cell transplant • Current SoC has multiple deficiencies • Toxicity: anemia and thrombocytopenia • Intolerance or resistance to therapy develops over time • Not disease modifying • αvβ8 Smi offers potential to increase platelet counts 35 Myelofibrosis Pathways Emperipoiesis of neutrophils Bone marrow fibrosis Osteoblast proliferation and osteosclerosis Megakaryocyte Angiogenesis MPN hematopoietic stem cells Alpha granule release Constitutive action of JAK-STAT pathway leading to cytokine- independent growth Stomal cells TGFb PDGF bFGF
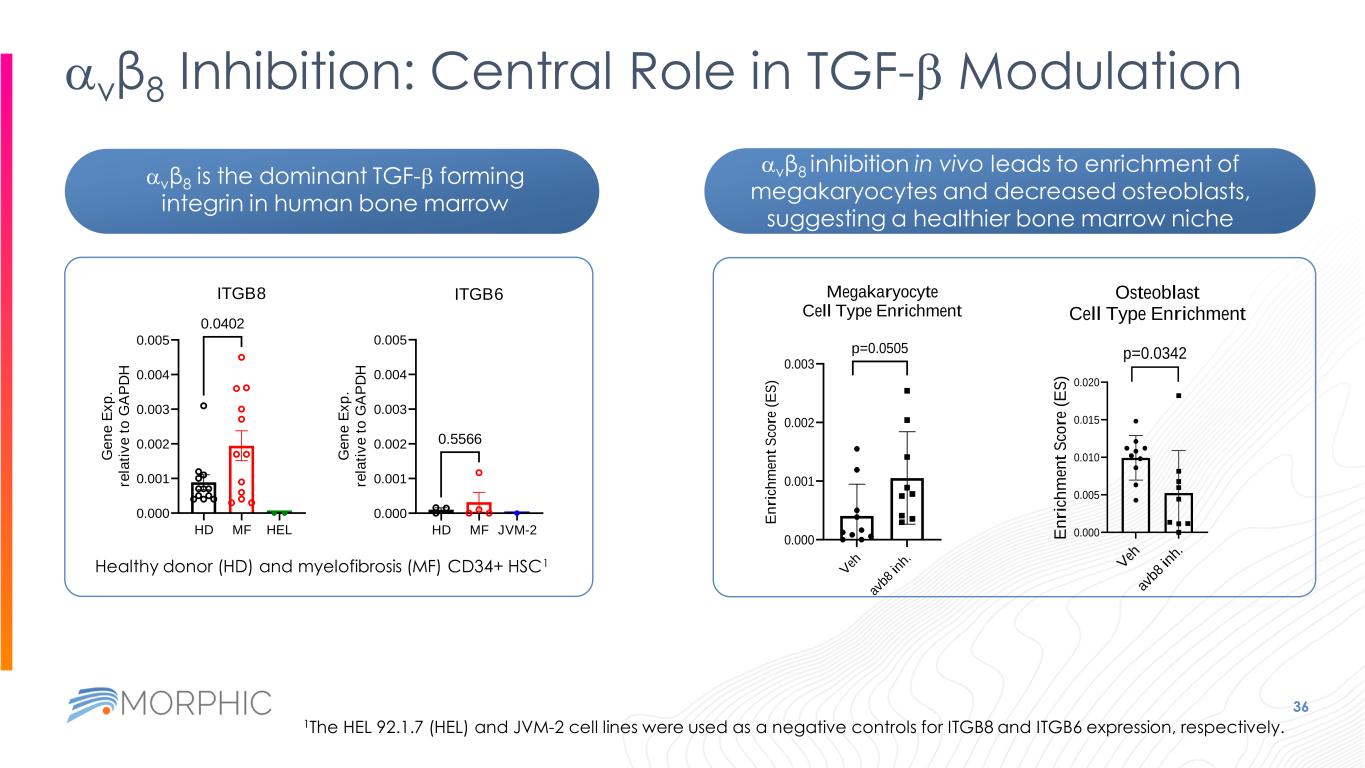
36 avβ8 Inhibition: Central Role in TGF-b Modulation HD MF HEL 0.000 0.001 0.002 0.003 0.004 0.005 ITGB8 G e n e E x p . re la ti v e t o G A P D H 0.0402 HD MF JVM-2 0.000 0.001 0.002 0.003 0.004 0.005 ITGB6 G e n e E x p . re la ti v e t o G A P D H 0.5566 Healthy donor (HD) and myelofibrosis (MF) CD34+ HSC1 1The HEL 92.1.7 (HEL) and JVM-2 cell lines were used as a negative controls for ITGB8 and ITGB6 expression, respectively. V eh av b8 in h. 0.000 0.001 0.002 0.003 Megakaryocyte Cell Type Enrichment E n ri ch m en t S co re ( E S ) p=0.0505 avβ8 is the dominant TGF-b forming integrin in human bone marrow avβ8 inhibition in vivo leads to enrichment of megakaryocytes and decreased osteoblasts, suggesting a healthier bone marrow niche V eh av b8 in h. 0.000 0.005 0.010 0.015 0.020 Osteoblast Cell Type Enrichment E n ri ch m en t S co re ( E S ) p=0.0342

Deep Specialist Expertise Across Management, and Board of Directors Gustav Christensen, MBA Chairman Morphic Board, former CEO, Dyax Timothy Springer, PhD Founder, Morphic Therapeutic, Member of Morphic Scientific Advisory Board; Latham Family Professor, Professor of Biological Chemistry and Molecular Pharmacology; Professor of Medicine, Harvard Medical School Norbert Bischofberger, PhD President & CEO, Kronos; EVP R&D, CSO, Gilead Martin Edwards, MD Former Chairman, Kalvista; Senior Partner, Novo Holdings 37 Praveen Tipirneni, MD Chief Executive Officer Bruce Rogers, PhD President Marc Schegerin, MD Chief Financial Officer Chief Operating Officer William DeVaul General Counsel and Secretary Blaise Lippa, PhD Chief Scientific Officer Nisha Nanda, PhD Group VP, External Innovations at Eli Lilly and Company Amir Nashat, PhD Managing Partner, Polaris Partners Susannah Gray, PhD Former CFO, Royalty Pharma Joseph P. Slattery, CPA Former CFO, Transenterix, Baxano, Digene Praveen Tipirneni, MD CEO Morphic Therapeutic Executive Team Board of Directors

THANK YOU